Recessions, Recoveries, Booms, Bubbles & Adjustments (Sometimes Crashes)
by Patrick Carlisle, Compass chief market analyst, SF Bay Area
Below is a look at the past 30+ years of San Francisco Bay Area real estate boom and bust cycles. Financial-market cycles have been around for hundreds of years, from the Dutch tulip mania of the 1600’s through today’s speculative frenzy in digital-currencies. While future cycles will vary in their details, the causes, effects and trend lines are often quite similar. Looking at cycles gives us more context to how the market works over time and where it may be going — much more than dwelling in the immediacy of the present with excitable pronouncements of “The market’s crashing and won’t recover in our lifetimes!” or “The market’s crazy hot and the only place it can go is up!”
Note: Most of these charts generally apply to higher-priced Bay Area housing markets, such as those found in much of San Francisco, Marin, Central Contra Costa (Lamorinda & Diablo Valley) and San Mateo Counties. (Different market price segments had bubbles, crashes – or adjustments – and recoveries of differing magnitudes in the last cycle, which is addressed at the end of this report.)
Regardless of how recent cycles have played out, it is vital to understand how extremely difficult it is to predict when different parts of a cycle will begin or end. Case in point: In 2012, a Nobel-Prize-winning economist stated that home prices might not recover “in our lifetimes,” when in fact, the recovery had already (just) begun. In late 2015, when financial markets entered into a period of nasty volatility, IPO activity stopped in its tracks, and high-tech hiring slowed, a well-respected Berkeley economist prophesied there would soon be “blood in the streets” of San Francisco – however the market recovered and grew significantly more heated through mid-2018. Boom times can go on much longer than expected, or get second winds. Even when the financial markets enter a period of “irrational exuberance,” that period can go on much longer than seems possible, with huge jumps in home and/or stock values.
On the other hand, negative shocks can appear with startling suddenness, triggered by unexpected economic, political or even ecological events that hammer confidence, quickly spinning optimism into fear. (The world has become staggeringly complex and interconnected, with a huge number of spinning plates at any given time.) This can lead to other market dominoes falling, the reversal of positive trends in growth, investment and employment, which may then balloon into a period of decline, recession, stagnation. These negative adjustments can be of varying scale. They can be in the nature of an extended but temporary period of high financial-market volatility and investor caution, such as caused by the Chinese stock market drop/oil price crash/Brexit vote in mid-2015 through mid-2016. It can be a definitive, era-defining financial-market crash or speculative bubble bursting, such as in 2008. Or the down cycle can occur gradually, like a slow leak in an over-pumped football.
As of early March, it is not yet known which category the coronavirus – a true “black swan” event – will fall into, whether a dramatic, but relatively temporary period high volatility, or the trigger for a plunge into an extended market recession in stock and housing values.
Going back thousands or even tens of thousands of years, human beings have tried to predict the future, and whether using priests, oracles, astrologers, pundits, economists, analysts or “experts” of every stripe – and currently having their “authoritative” forecasts headlined every day in the media – we show no aptitude as a species for having the ability to do so with any accuracy. We can’t even remember the mistakes of the recent past – which is one reason why we don’t seem to be able to escape cycles – much less foretell what’s going to happen tomorrow.
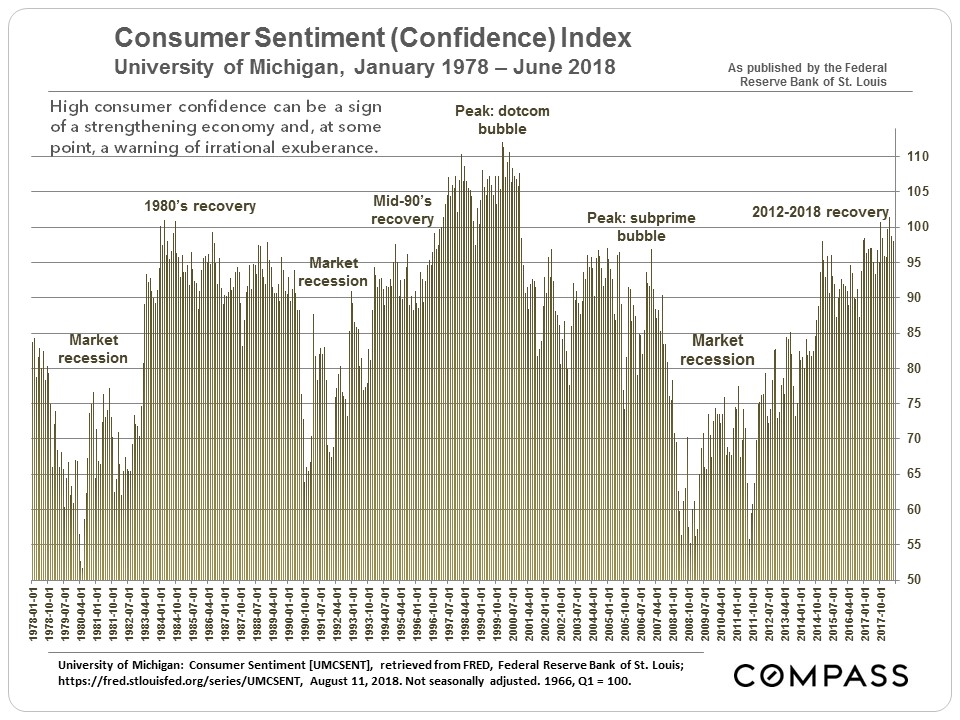
Confidence plays an enormous role in financial and real estate markets, and in every period of irrational exuberance, there are many who vociferously argue that the exuberance is NOT irrational. Unfortunately, it can be very challenging to determine the point at which rational confidence shifts into irrational exuberance, but when irrational exuberance abruptly shifts into fear, a stampede for the exits can follow – as an old English saying puts it: “They run all away, and cry, ‘the devil take the hindmost’.” In retrospect, the duration of periods of irrational exuberance, when market gains often accelerate into the stratosphere, seems utterly incomprehensible. Such are the pleasures of hindsight.
All the major recessions in the Bay Area in recent decades have been tied to national or international economic crises, which can take a wide variety of forms. Absent an enormous natural disaster, it is unlikely that a major, negative market adjustment (or “crash”) would occur due simply to local issues. However, local issues can certainly lead to less dramatic market adjustments, or exacerbate a downturn caused by a macro-economic event. The SF earthquake of 1989 intensified the national recession that began at that time; our greater exposure to dotcom start-ups did the same with the national dotcom-bubble/Nasdaq crash.
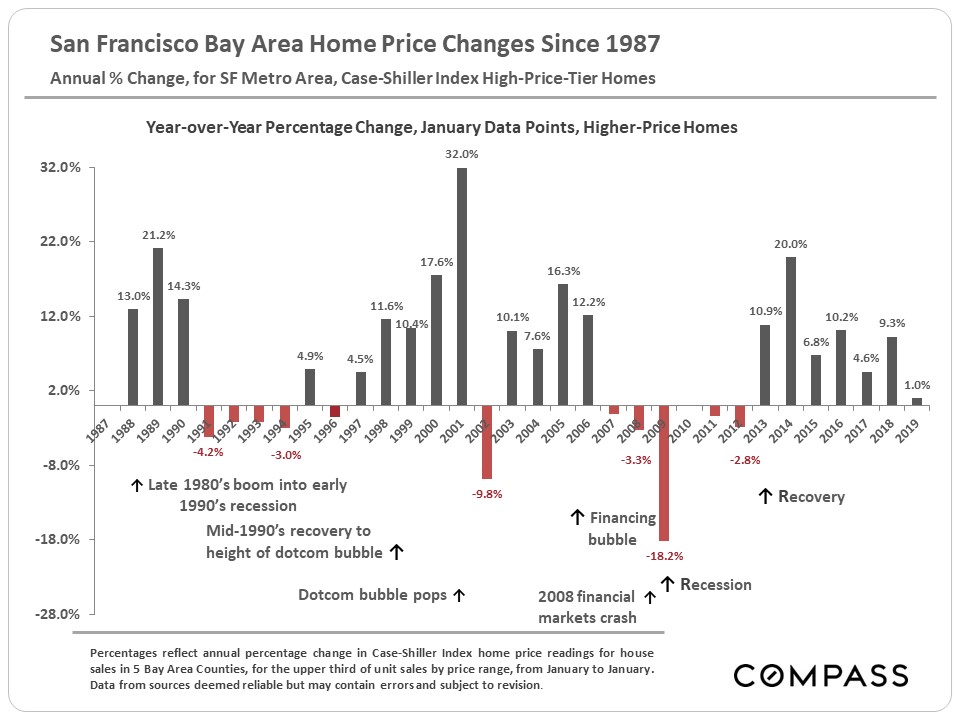
The chart below graphs ups and downs by percentage changes in home prices at each turning point.
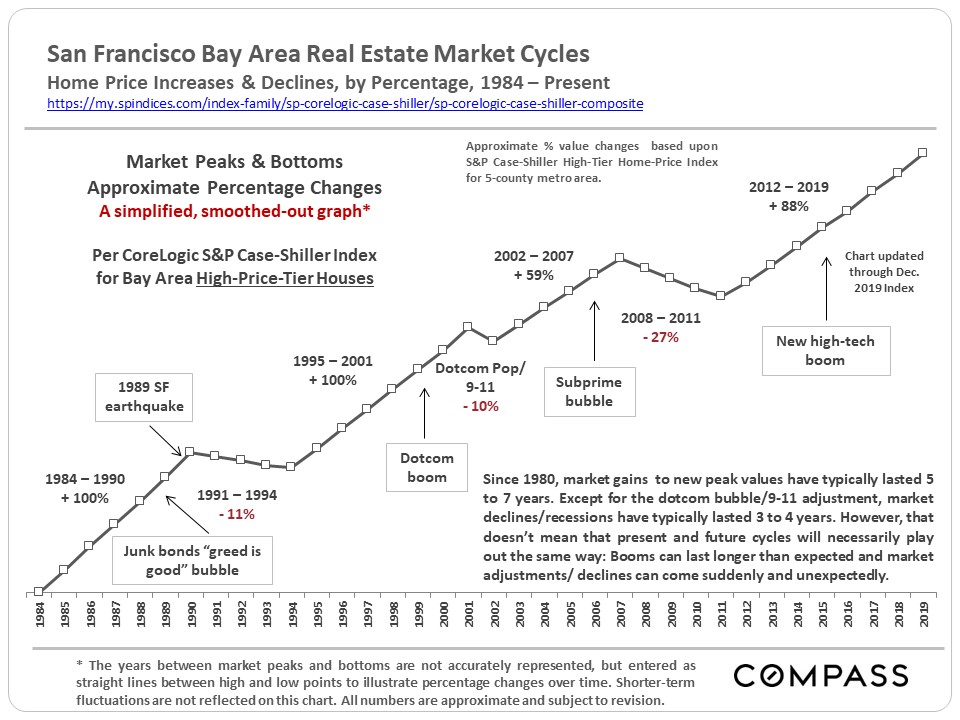
Smoothing out the bumps – temporary periods of volatility with their ups and downs – delivers the simplified overview above for the past 30 years.
Whatever the phase of the cycle, up or down, while it is going on people think it will last forever.Going up, “The world isdifferent now, the rules havechanged, and there’s no reason why the up-cycle can’t continue indefinitely.” Well, it turns out that the rules do indeed still apply and up-cycles always end. And then when the market turns and goes down: “Homeownership has always been aterribleinvestment and the market probably won’t recover for decades” (or even “in our lifetimes” as the Nobel-Prize-winning economist said in 2012). But the economy mends, the population grows, people start families, inflation builds up over the years, and repressed demand of those who want to own their own homes builds up. In the early eighties, mid-nineties and in 2012, after about 4 years of a recessionary housing market, this repressed demand jumped back in (or “explodes” might be a good description) and prices started to rise again. (The dotcom bubble adjustment caused a hiccup, but no lasting recession in home values.)
The nature of cycles is to keep turning.
All bubbles are ultimately based on irrational exuberance, runaway greed, criminal behavior or, not uncommonly, all three mashed together.Whether exemplified by junk bonds, stock market hysteria, gorging on untenable levels of debt, a corporate ponzi-scheme mentality, an abandonment of reasonable risk assessment, and/or incomprehensible or dishonest financial engineering, the bubble is relentlessly pumped bigger and tighter – awaiting the trigger event that will play the role of pin. And since human beings appear utterly unable or unwilling to learn the lessons of past cycles, it is kind of like the movie “Groundhog Day,” except that in the movie at least, Bill Murray actually grew wiser over time.
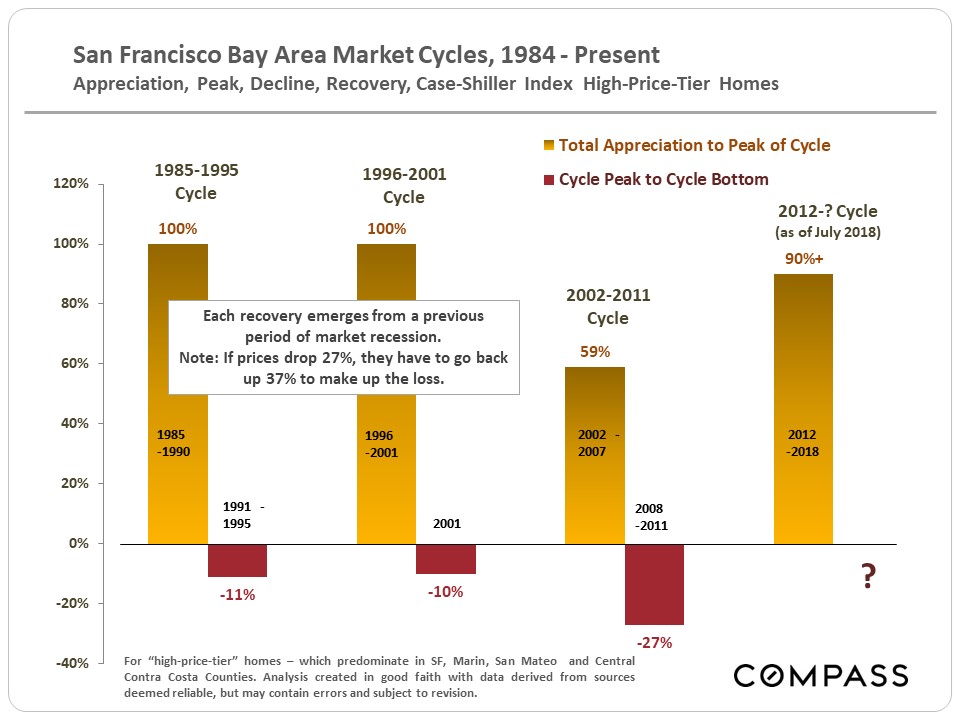
The 2008 crash was truly abnormal in its scale, and much greater than other downturns going back to the Great Depression. The 2005-2007 bubble was fueled by home buying and refinancing with unaffordable amounts of debt on astaggeringlevel, promoted by predatory lending practices, promises of endless appreciation, and an abysmal decline in underwriting standards – and then eagerly facilitated by smug, rapacious, Wall Street flimflammery and self-abasing credit ratings agencies. Millions came to own homes they could never afford to pay for and the rot was distributed throughout the financial system. The market adjustments of the early 1990’s and early-2000’s saw declines in Bay Area home values in the range of 10% to 11%, which were bad enough, but nothing compared to the terrible 2008 – 2011 declines of 20% to 60%.
This is important context when contemplating the next adjustment: It doesn’t have to be a devastating crash. It can be more like some air being let out of an over-pressurized tire instead of a blowout on the highway at high speed. It depends on many different factors.
This does not mean that these recently recurring time periods necessarily reflect some natural law in housing market cycles, or that they can be relied upon to predict the future. Real estate markets can be affected by a bewildering number of local, national and international economic, political and even natural-event factors that are exceedingly difficult or even impossible to predict with any accuracy.
As long as one doesn’t have to sell during a down cycle, Bay Area homeownership has almost always been a good or even spectacular investment (though admittedly if one does have to sell at the bottom of the market, the results can be very painful). This is due to the ability to finance one’s purchase (and refinance when rates drop), tax benefits, the gradual pay-off of the mortgage (the “forced savings” effect), inflation and long-term appreciation trends. The best way to overcome cycles is to buy a home for the longer term, one whose monthly cost is readily affordable for you, ideally using a long-term, fixed-rate loan.
1996 to Present
(After Recession) Boom, Bubble, Crash, Doldrums, Recovery
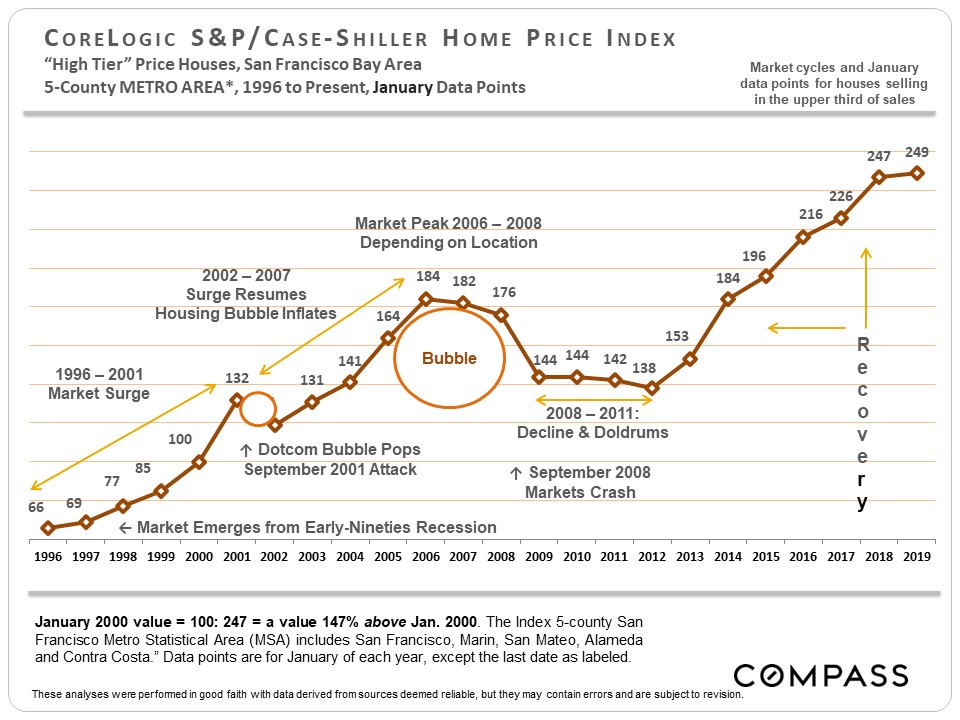
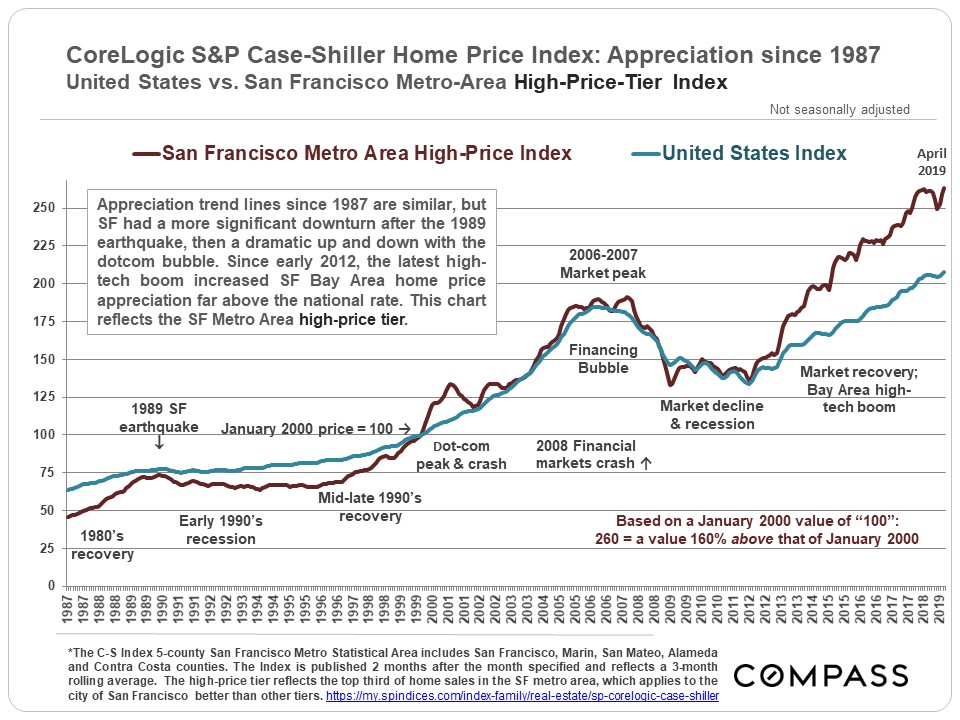
The Recovery since 2012 (per Case-Shiller)
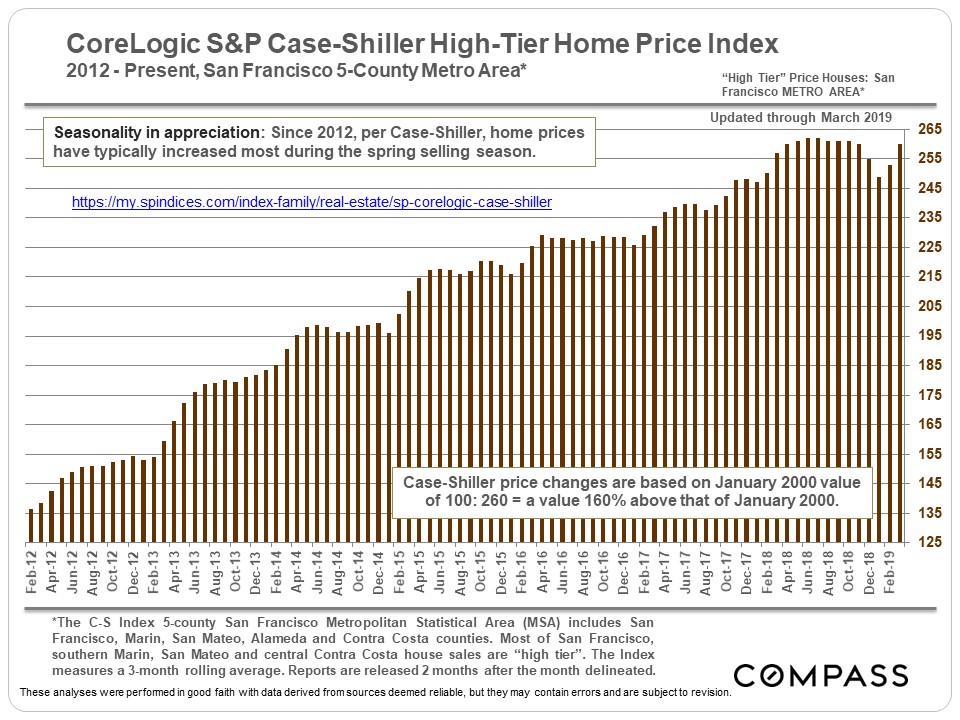
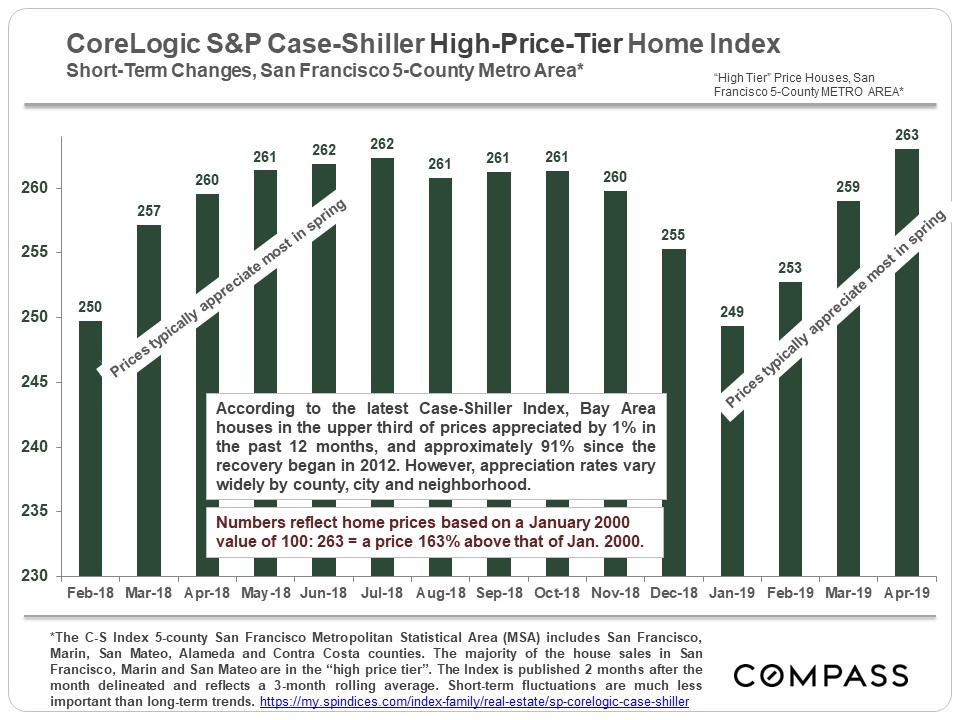
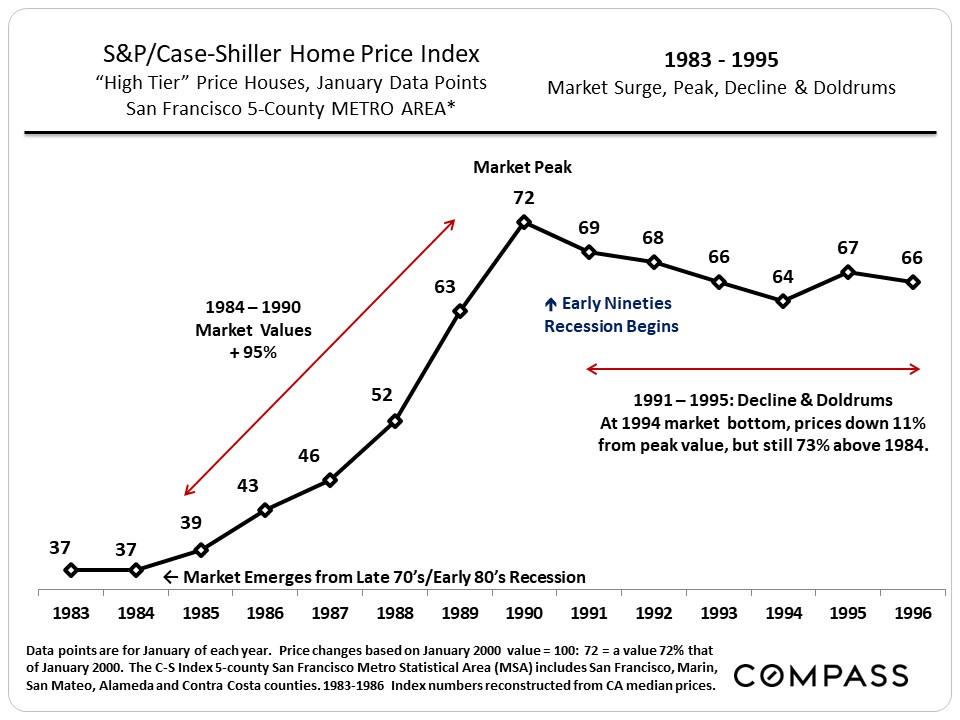
S&P Case-Shiller Index, 5-County SF Metro Area
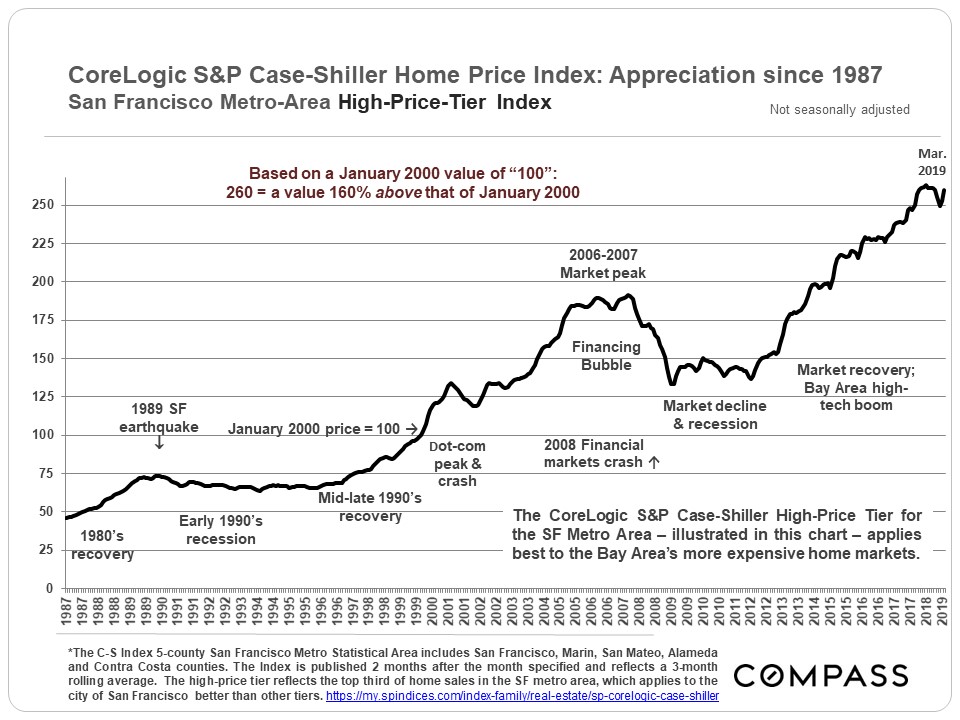
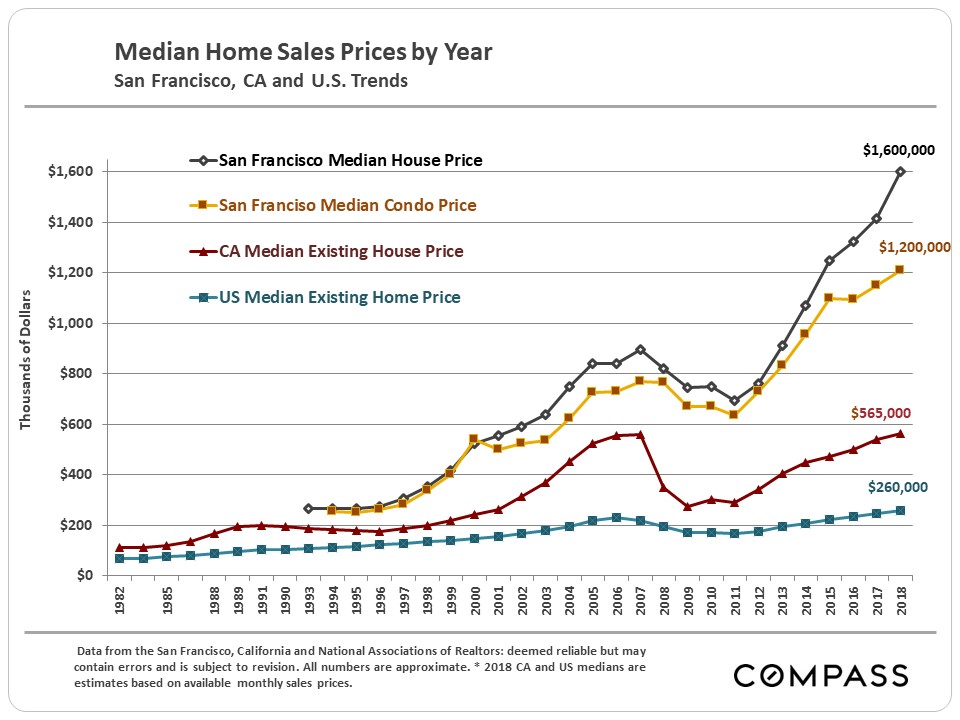
Home Price Appreciation Trends since 1987
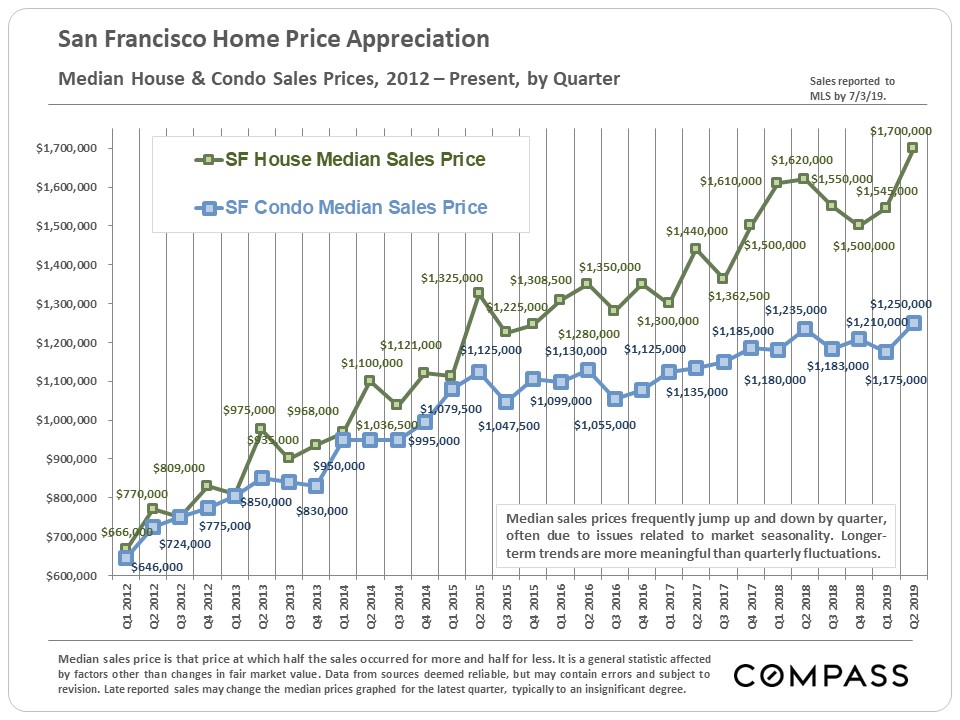
San Francisco Median Sales Price Appreciation
The charts below look at median sales price movements in San Francisco County itself over the shorter and longer terms. These do not correlate exactly with Case-Shiller – firstly because C-S tracks a “metro area” of 5 Bay Area counties, and secondly, because C-S uses its own proprietary algorithm and not median sales prices. Median sales prices are often affected by other factors besides changes in fair market value (such as significant changes in the distressed, luxury and new-construction market segments; seasonality; buyer profile; and so on).
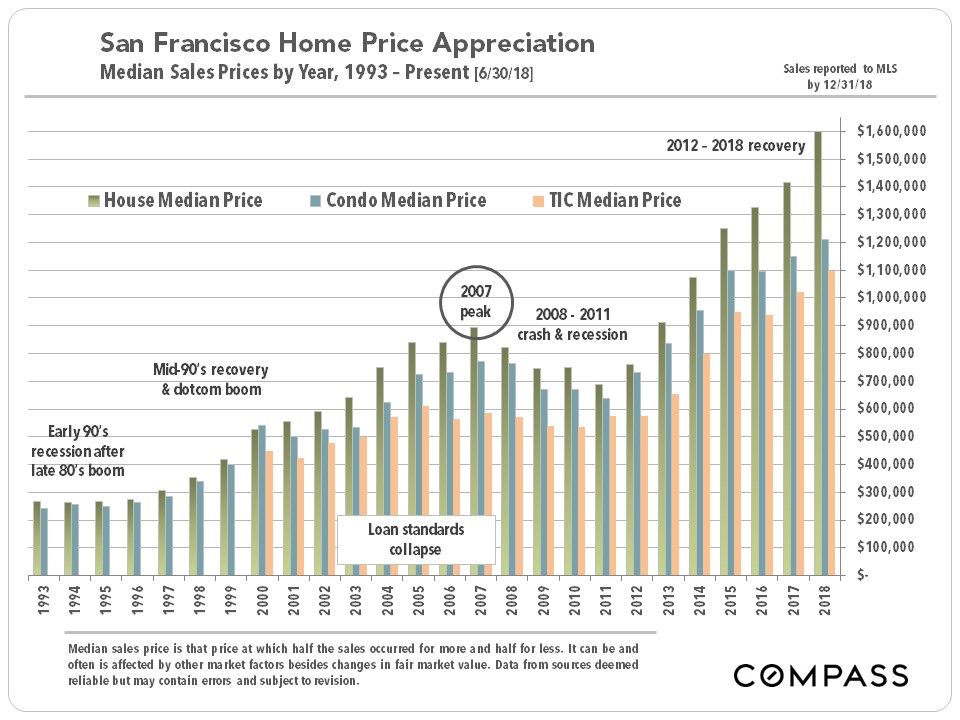
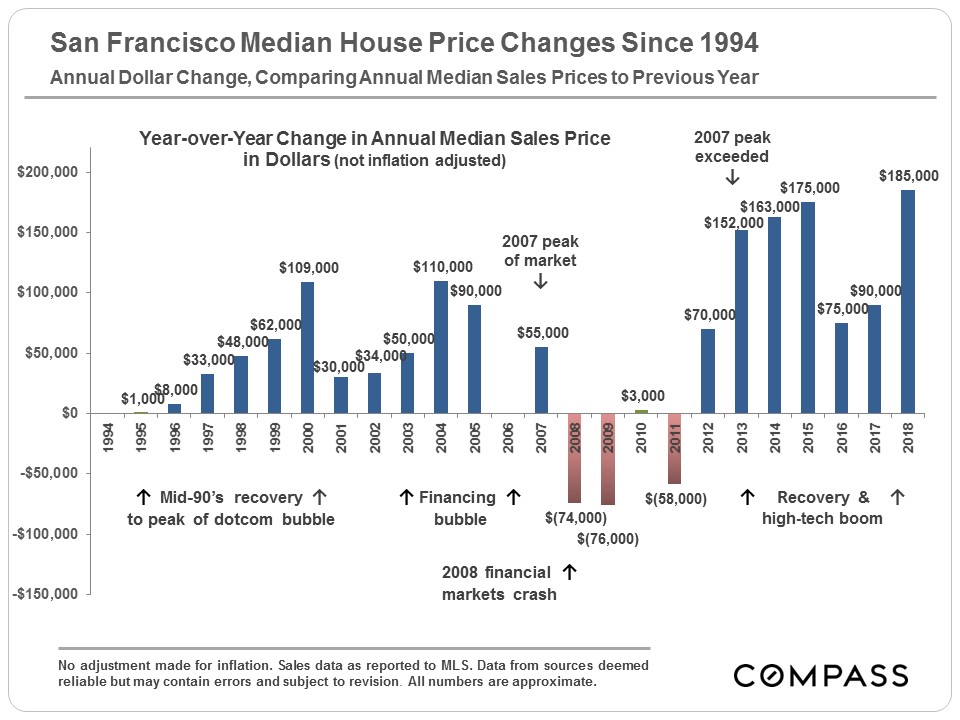
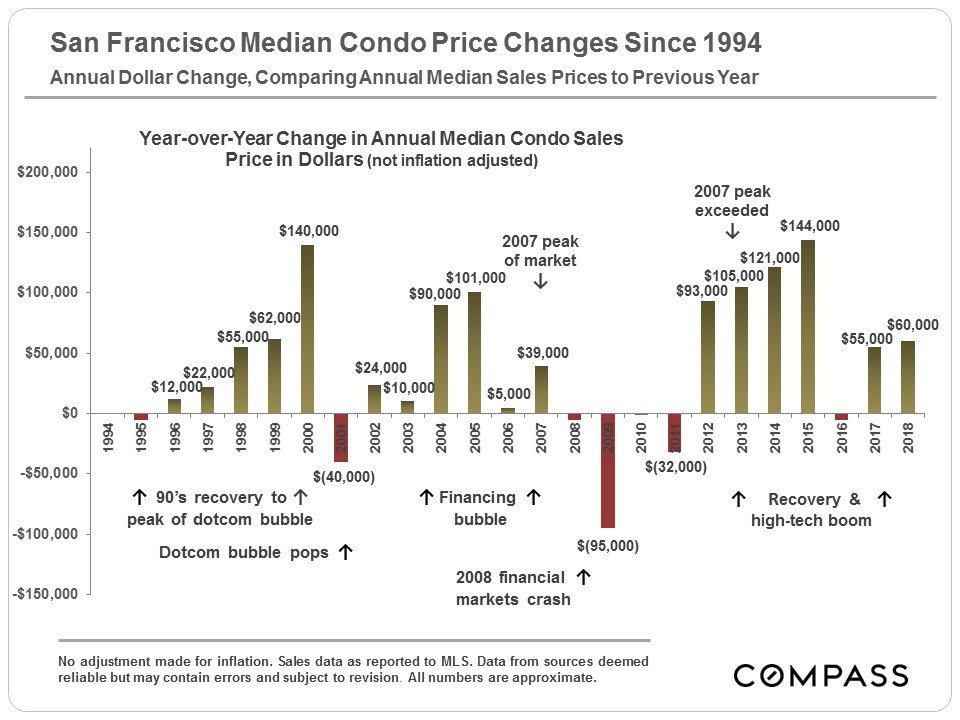
Median Price Appreciation
San Francisco Rents
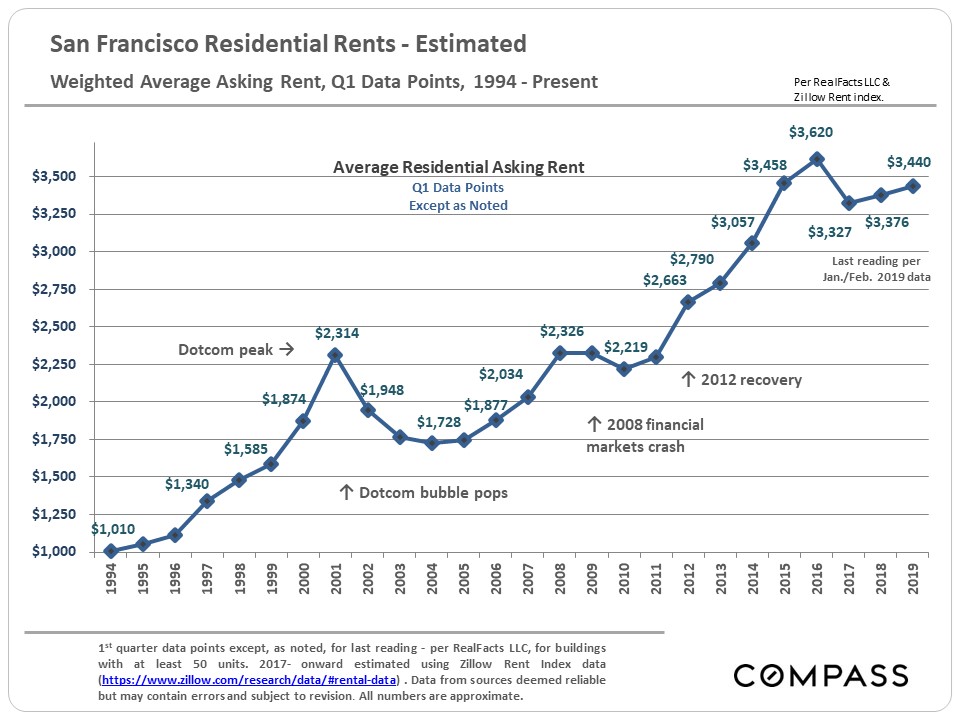
After peaking in 2015, the SF rental market definitely cooled in 2016, with supply increasing significantly with new construction, demand softening (as the high-tech boom temporarily cooled), and rents beginning to decline, especially at the high end. SF asking rents dropped around 8 – 10% from their peaks in 2015. In 2018, some signs of recovery showed up.
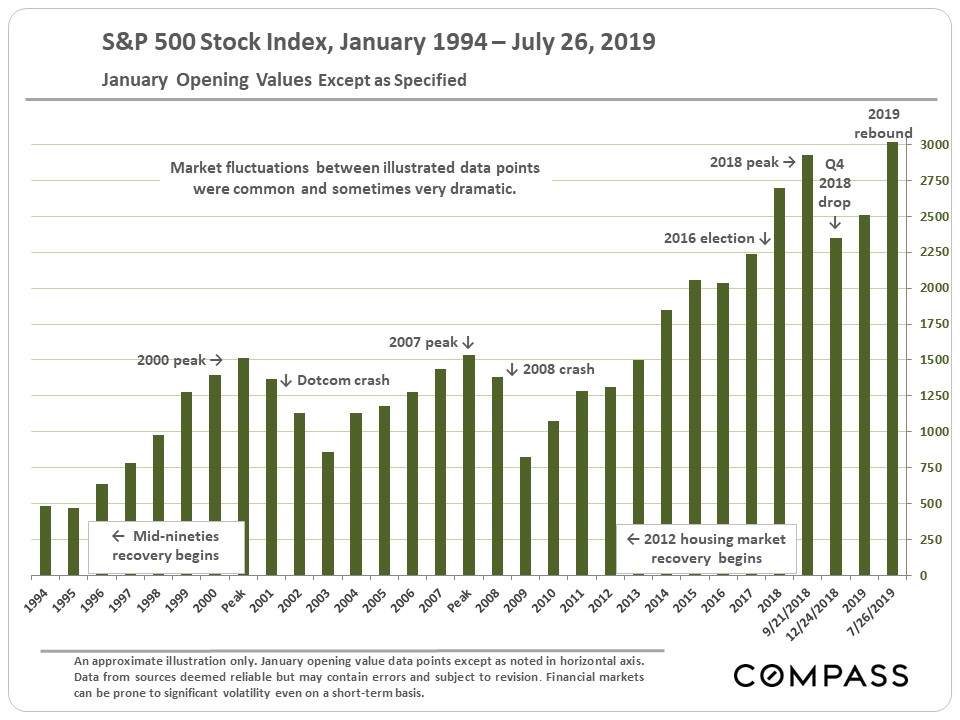
Stock Market (S&P 500 Index)
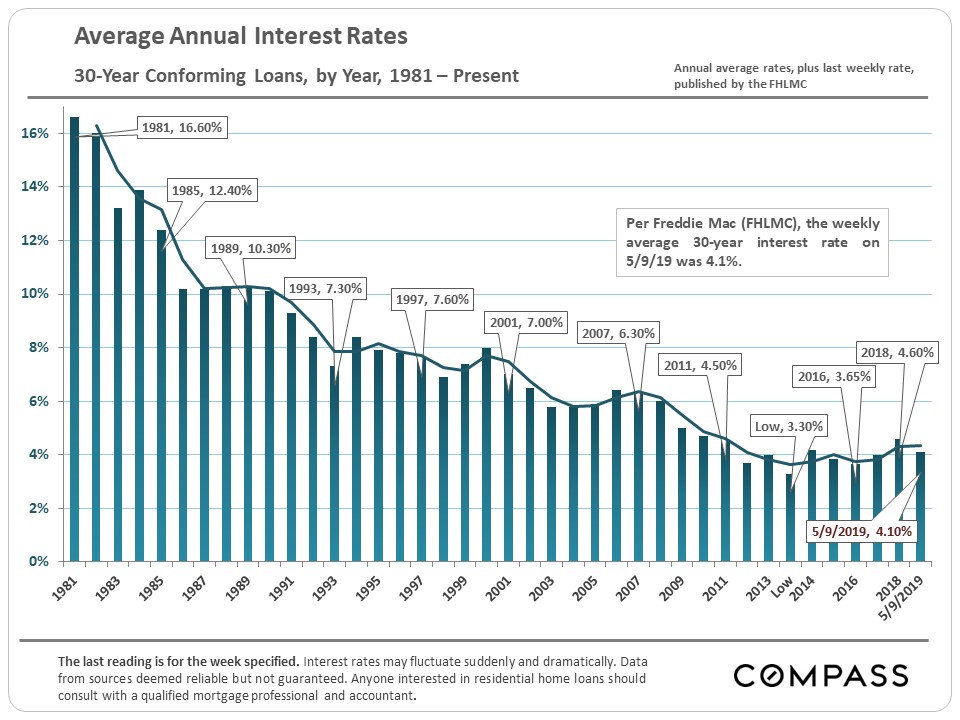
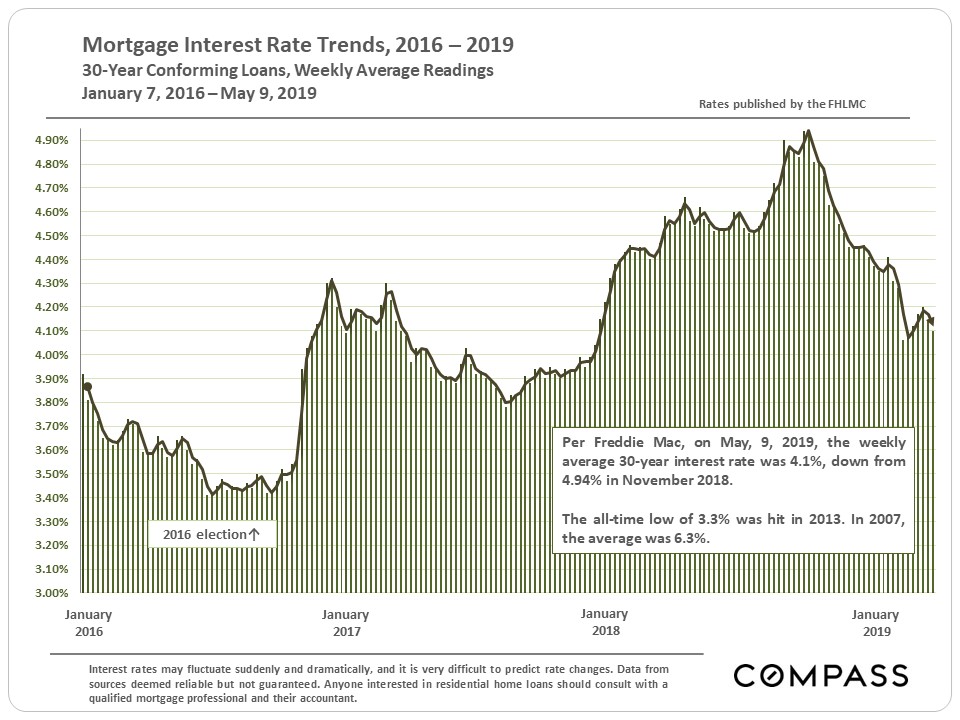
Mortgage Interest Rates since 1981
It’s much harder to decipher any cycles in 30-year mortgage rates. Rates remain very low by any historical measure, but have risen since the 2016 election. Interest rates play a huge role in the ongoing cost of homeownership (affordability) and the real estate market. The substantial decline in interest rates since 2007 has in effect subsidized much of the price increases that have occurred since 2011.
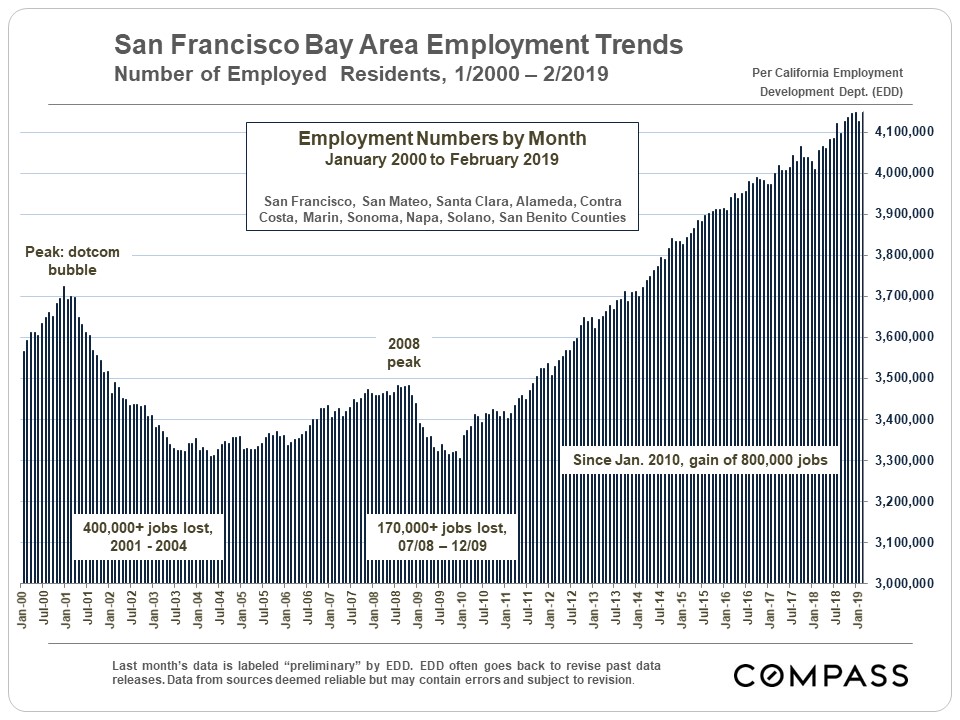
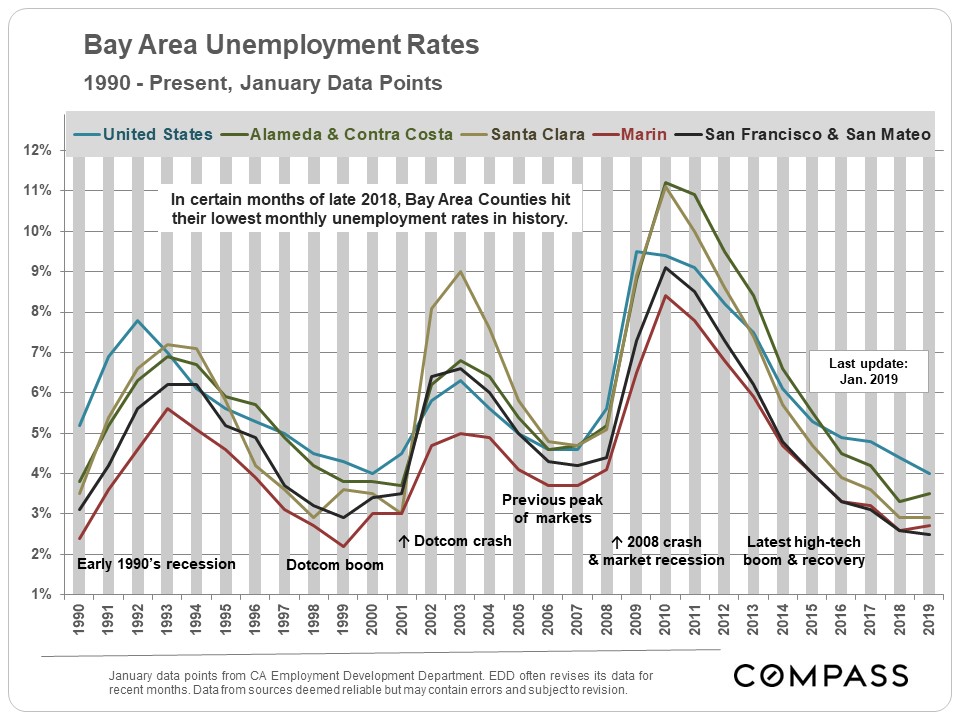
Employment Trends
******************************
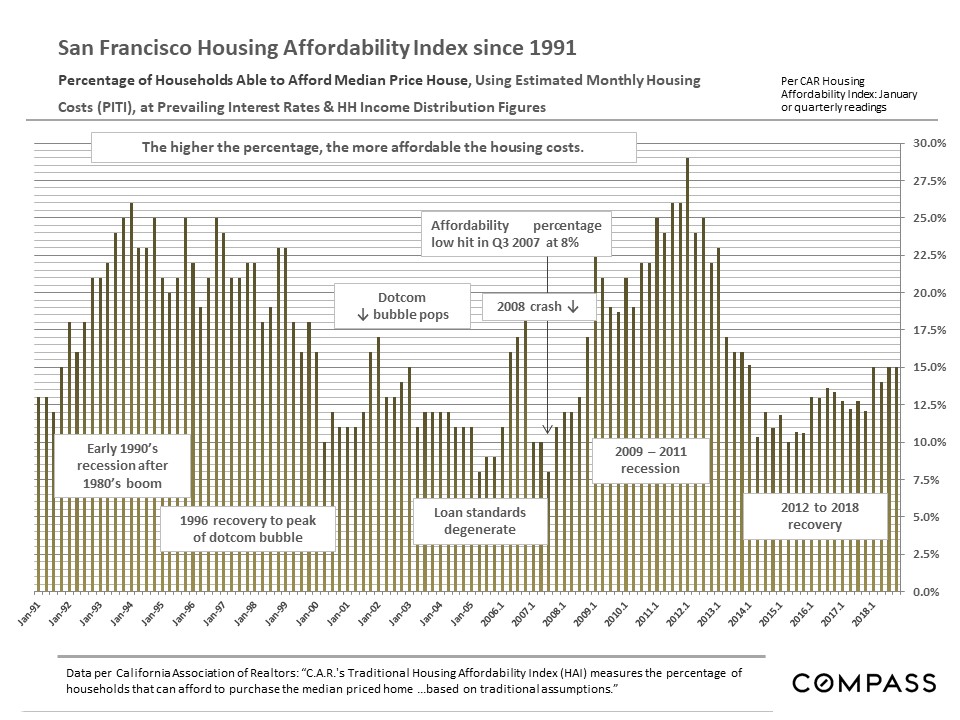
Housing Affordability Index (HAI) Cycles, 1991 – Present
for San Francisco & Bay Area, per CA Association of Realtors
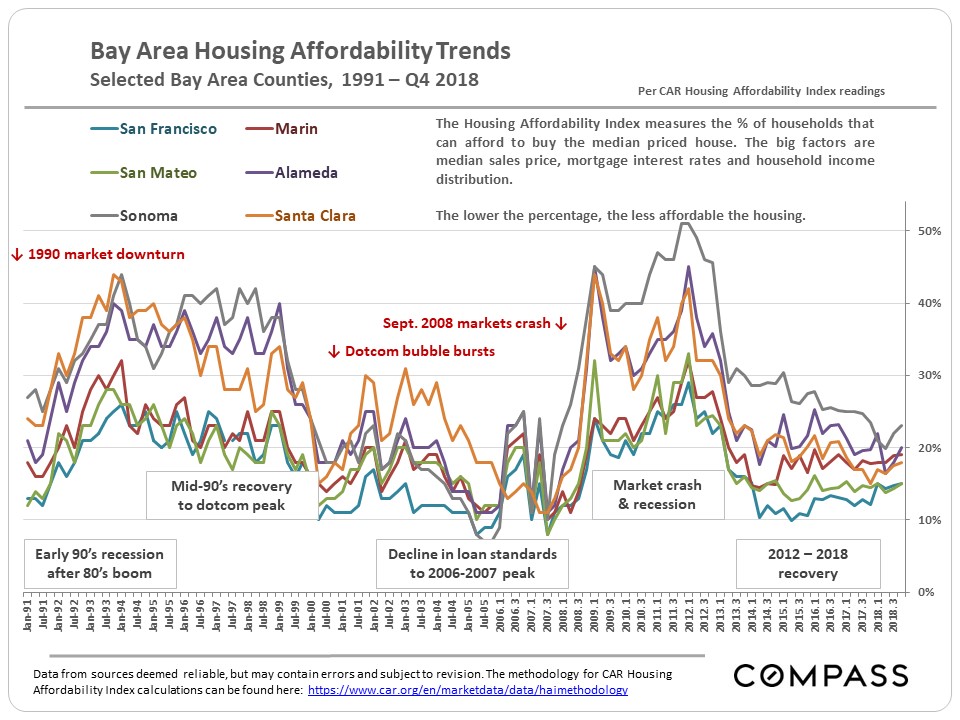
Still, dwindling affordability is certainly a symptom of overheating, of a market being pushed perhaps too high. Looking at the charts above, it is interesting to note that the markets of all Bay Area counties hit similar and historic lows at previous market peaks in 2006-2007, i.e. the pressure that began in the San Francisco market spread out to pressurize surrounding markets until all the areas bottomed out in affordability. This suggests that one factor or symptom of a correction, is not just a feverish San Francisco market, but that buyers cannot find affordable options anywhere in the area. We are certainly seeing that radiating pressure on home prices occurring now, starting in San Francisco and San Mateo (Silicon Valley) and surging out to all points of the compass.
Significant increases in mortgage interest rates – as happened in the second half of 2018 (before then subsiding again in 2019) – affect affordability quickly and dramatically, as interest rates along with, of course, housing prices and household incomes, play the dominant roles in this calculation.
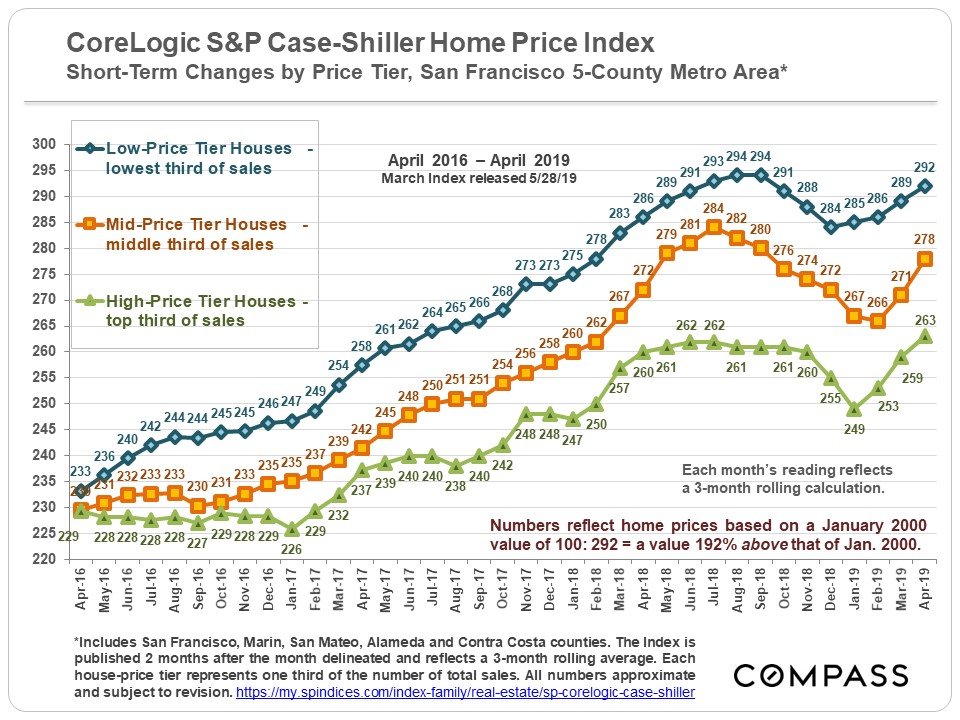
Different Bay Area Market Segments:
Different Bubbles, Crashes & Recoveries
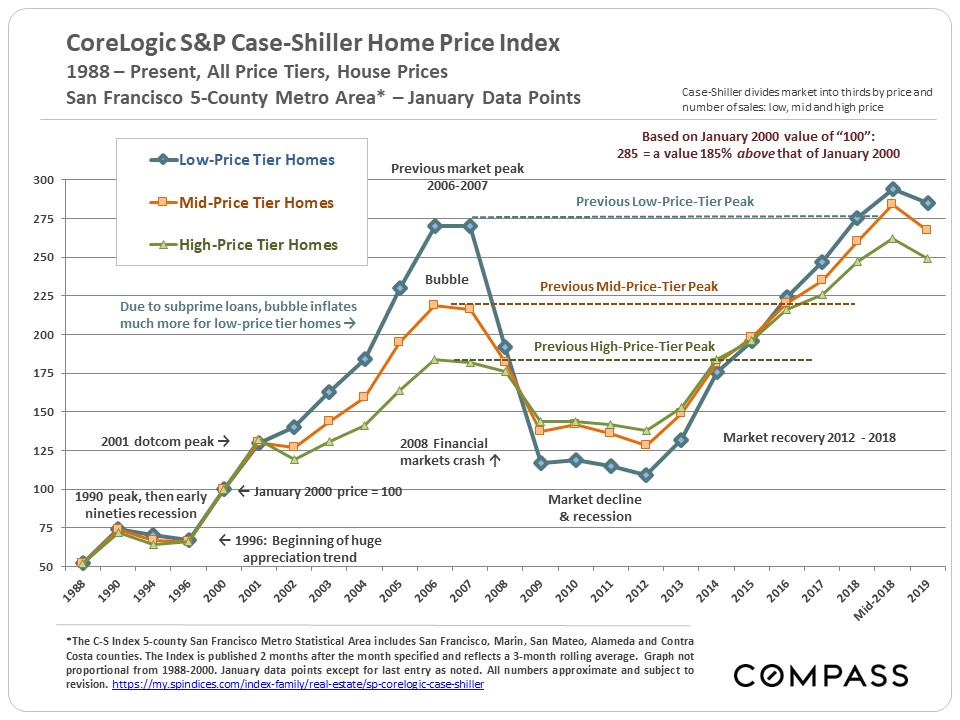
Since mid-2016, the low-price tier has begun taking the lead in home price appreciation.
Low-Price Tier Homes
Huge subprime bubble (170% appreciation, 2000 – 2006) & huge crash
(60% decline, 2008 – 2011). Strong recovery, now slightly above previous peak.

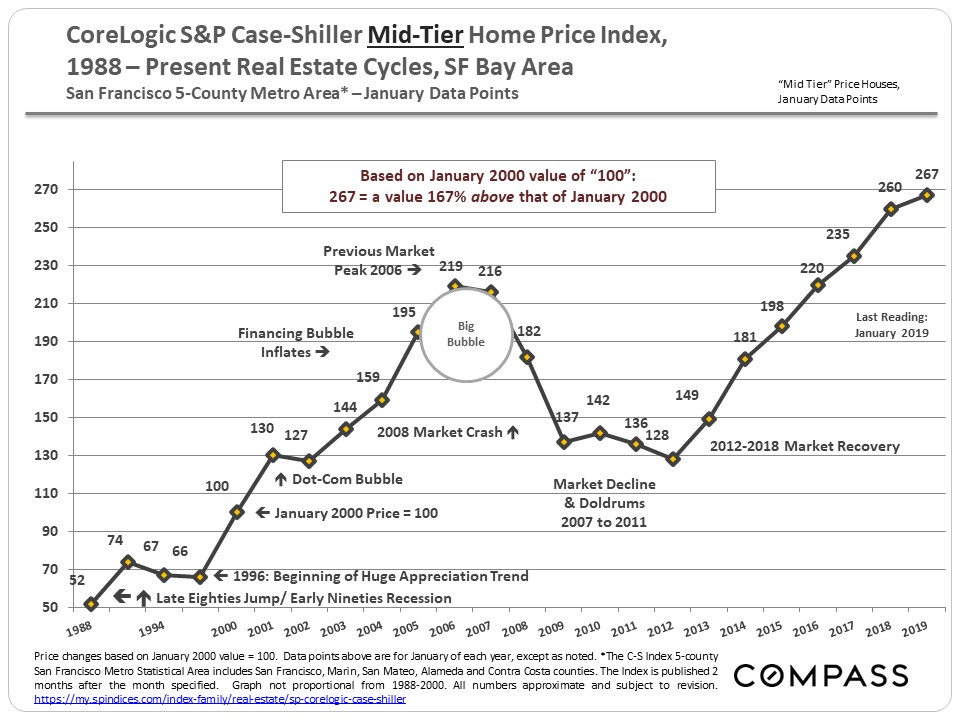
Smaller bubble (119% appreciation, 2000 – 2006) and crash (42% decline)
than low-price tier. Strong recovery has put it significantly over its 2006 peak.
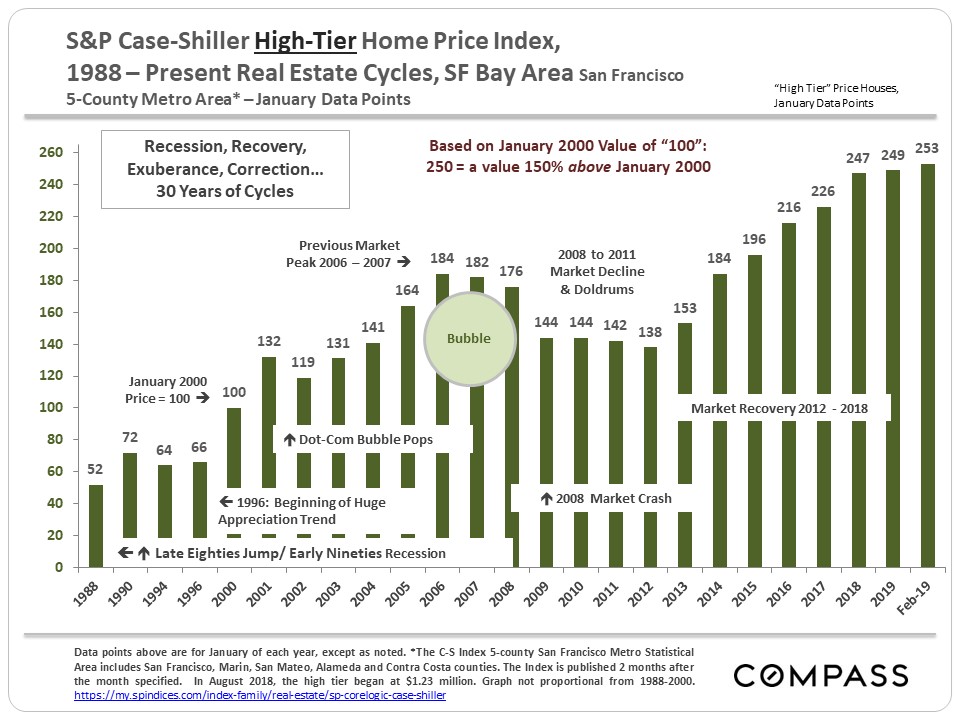
84% appreciation, 2000 – 2007, and 25% decline, peak to bottom.
Now far above previous 2007 peak values.
Source: Compass
It is impossible to know how median and average value statistics apply to any particular home without a specific comparative market analysis. These analyses were made in good faith with data from sources deemed reliable, but may contain errors and are subject to revision. It is not our intent to convince you of a particular position, but to attempt to provide straightforward data and analysis, so you can make your own informed decisions. Median and average statistics are enormous generalities: There are hundreds of different markets in San Francisco and the Bay Area, each with its own unique dynamics. Median prices and average dollar per square foot values can be and often are affected by other factors besides changes in fair market value. Longer term trends are much more meaningful than short-term.
Compass is a real estate broker licensed by the State of California, DRE 01527235. Equal Housing Opportunity. This report has been prepared solely for information purposes. The information herein is based on or derived from information generally available to the public and/or from sources believed to be reliable. No representation or warranty can be given with respect to the accuracy or completeness of the information. Compass disclaims any and all liability relating to this report, including without limitation any express or implied representations or warranties for statements contained in, and omissions from, the report. Nothing contained herein is intended to be or should be read as any regulatory, legal, tax, accounting or other advice and Compass does not provide such advice. All opinions are subject to change without notice. Compass makes no representation regarding the accuracy of any statements regarding any references to the laws, statutes or regulations of any state are those of the author(s). Past performance is no guarantee of future results.
