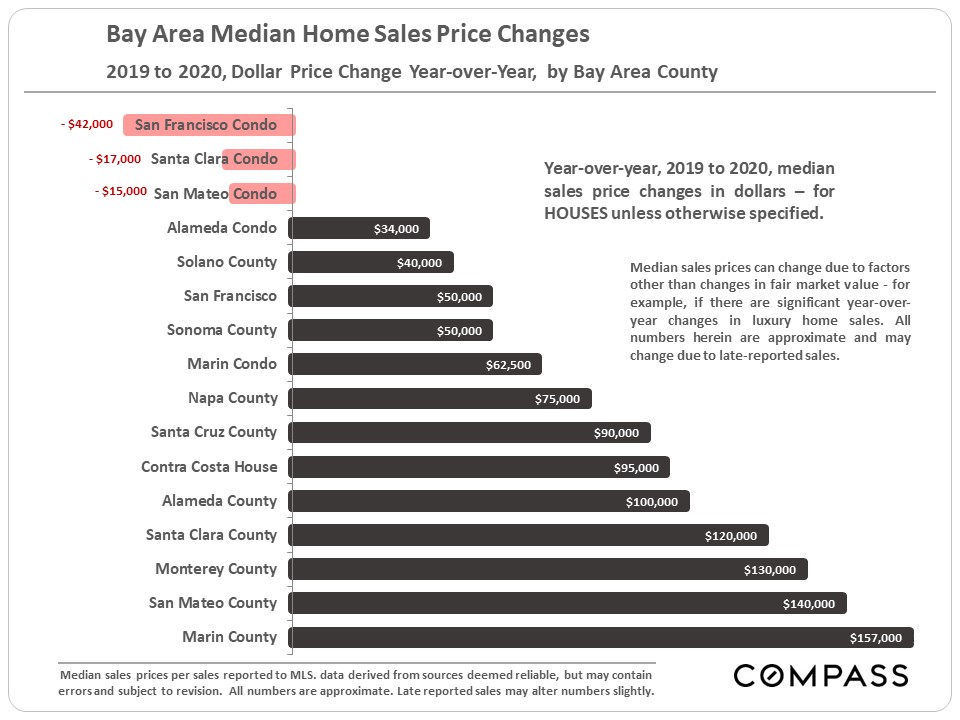
From Napa & Sonoma Counties in the north to Monterey County in the south
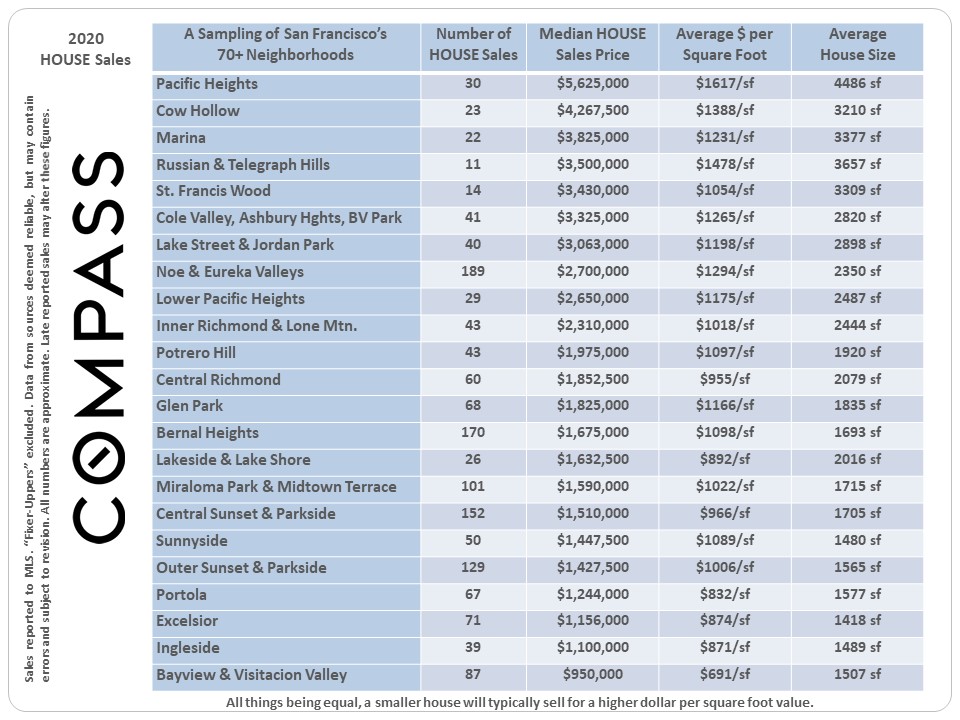
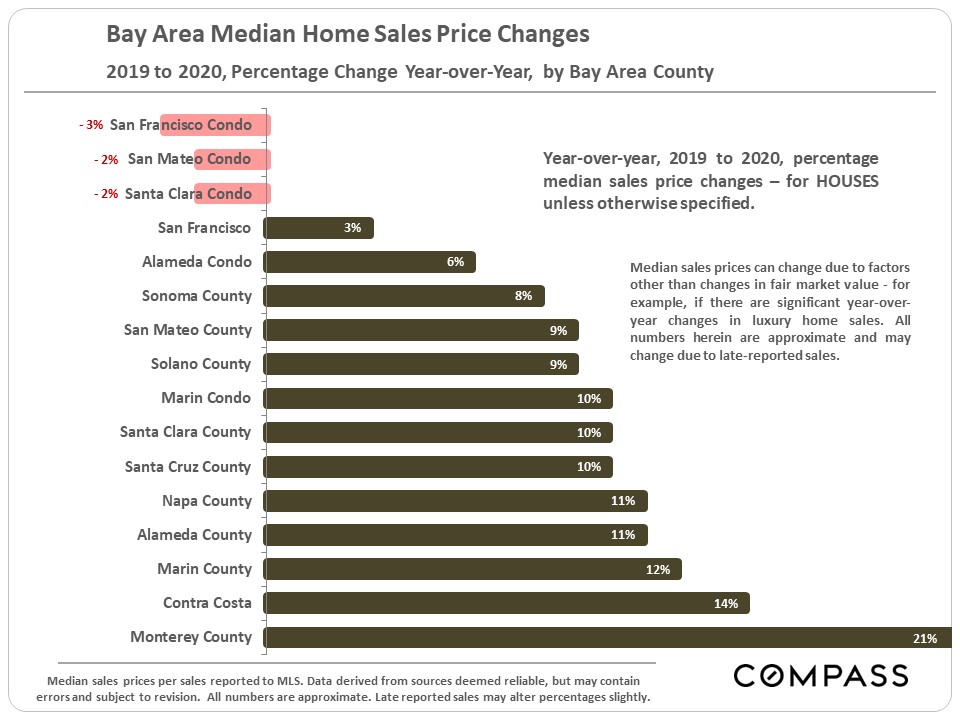
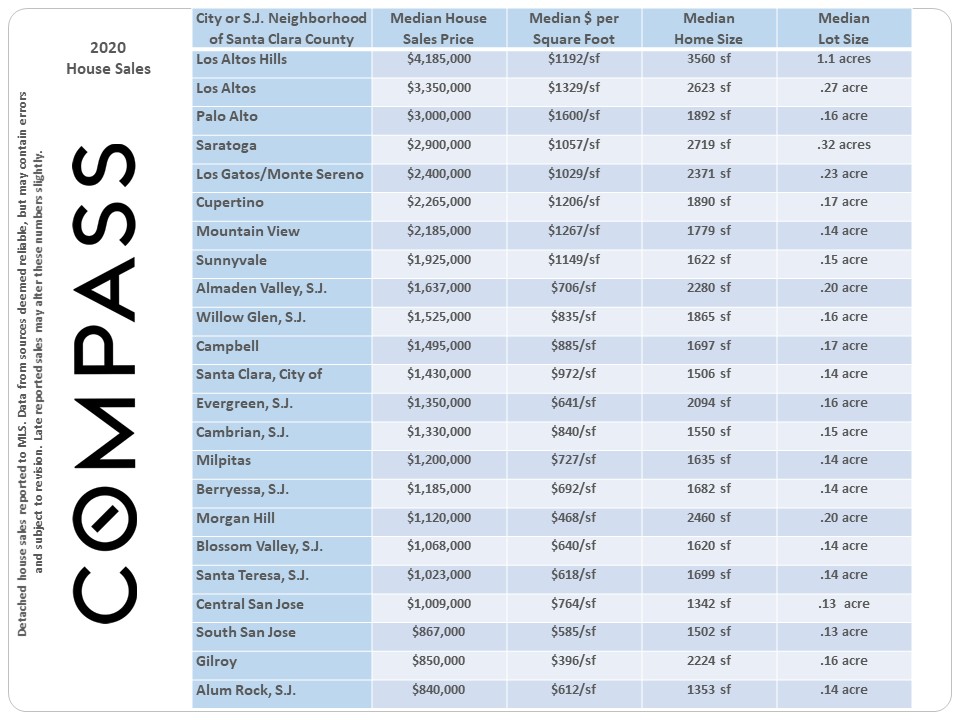
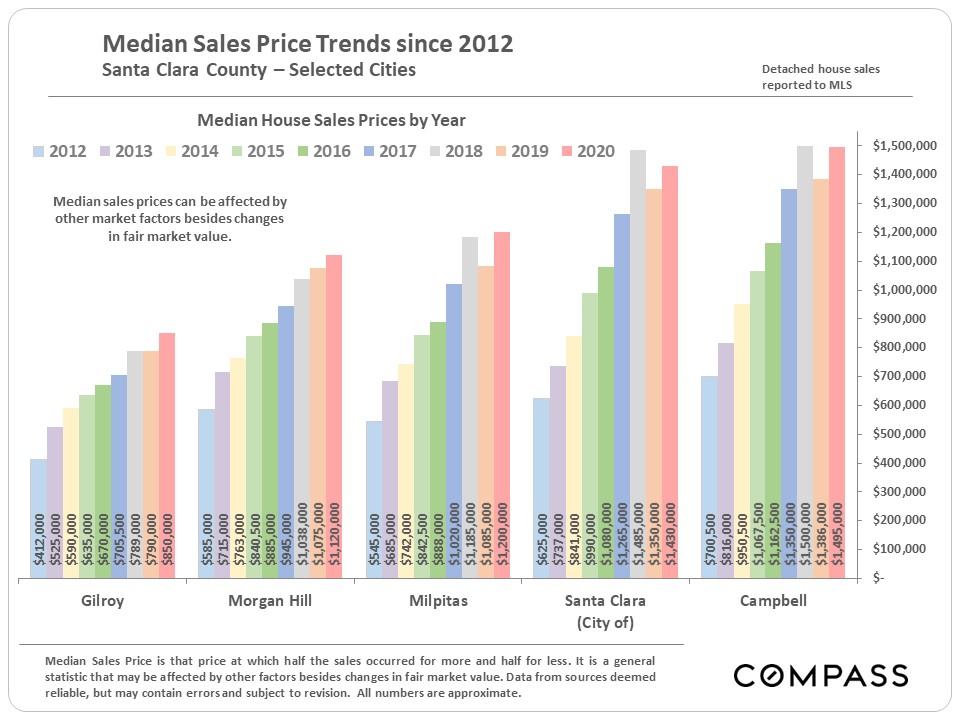
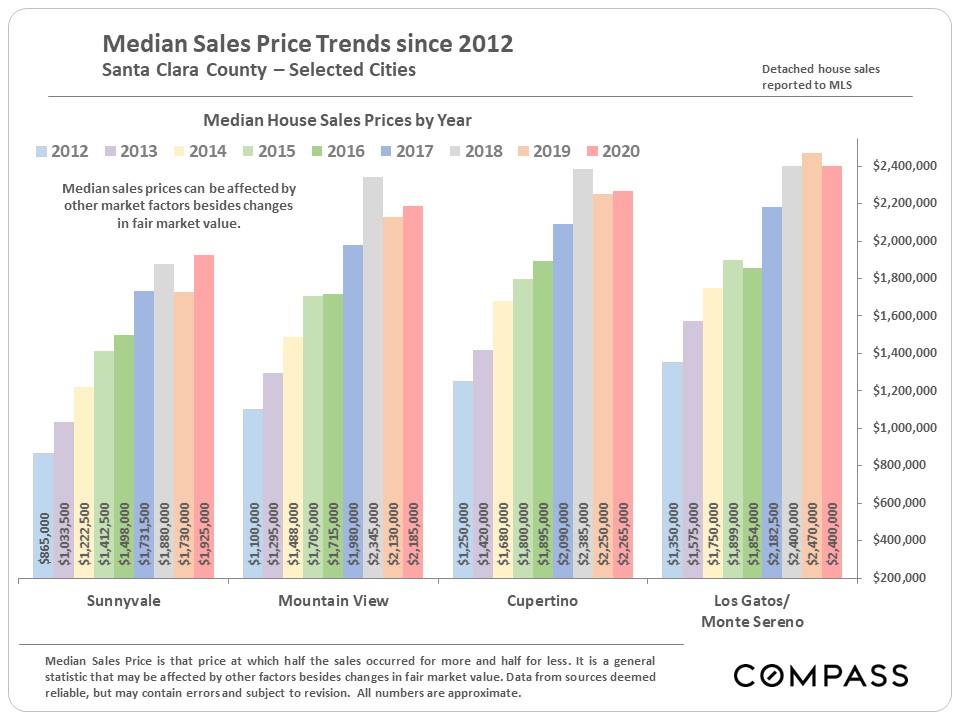
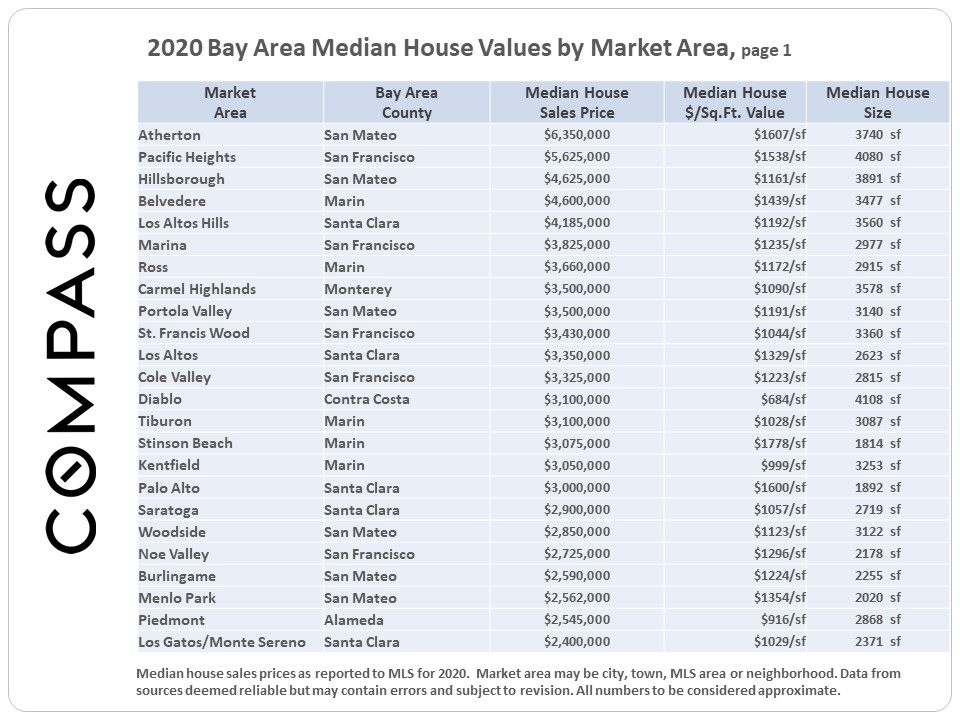
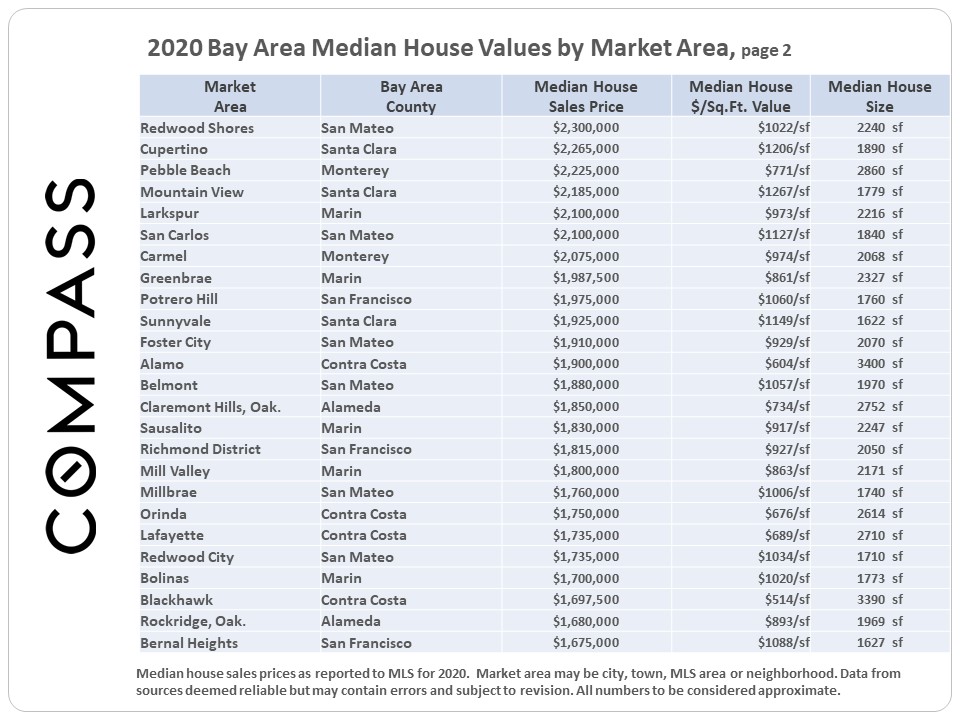
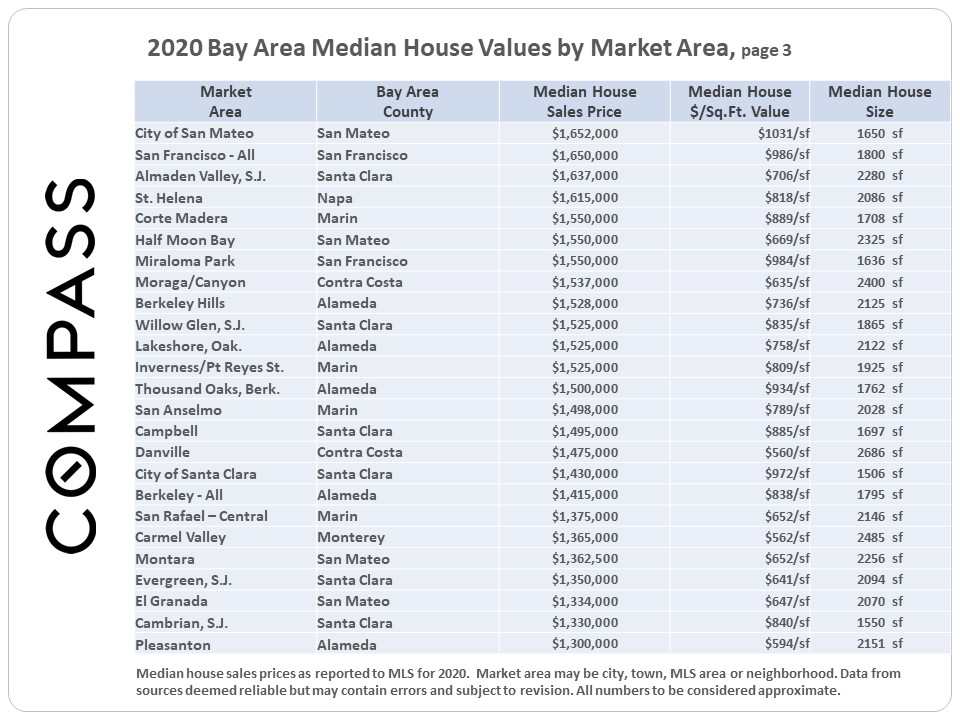
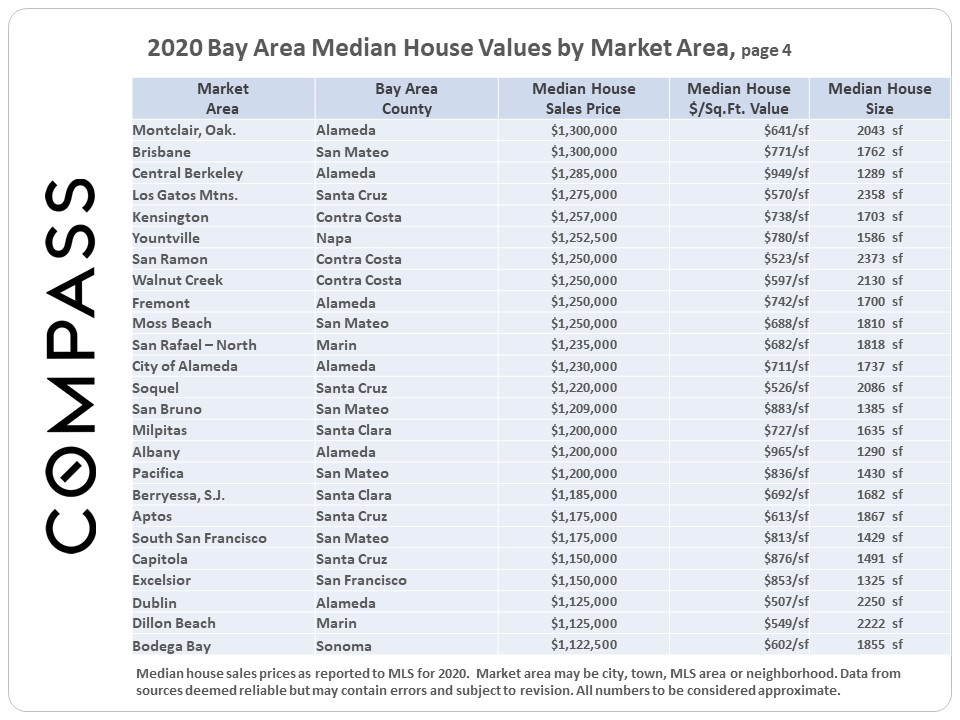
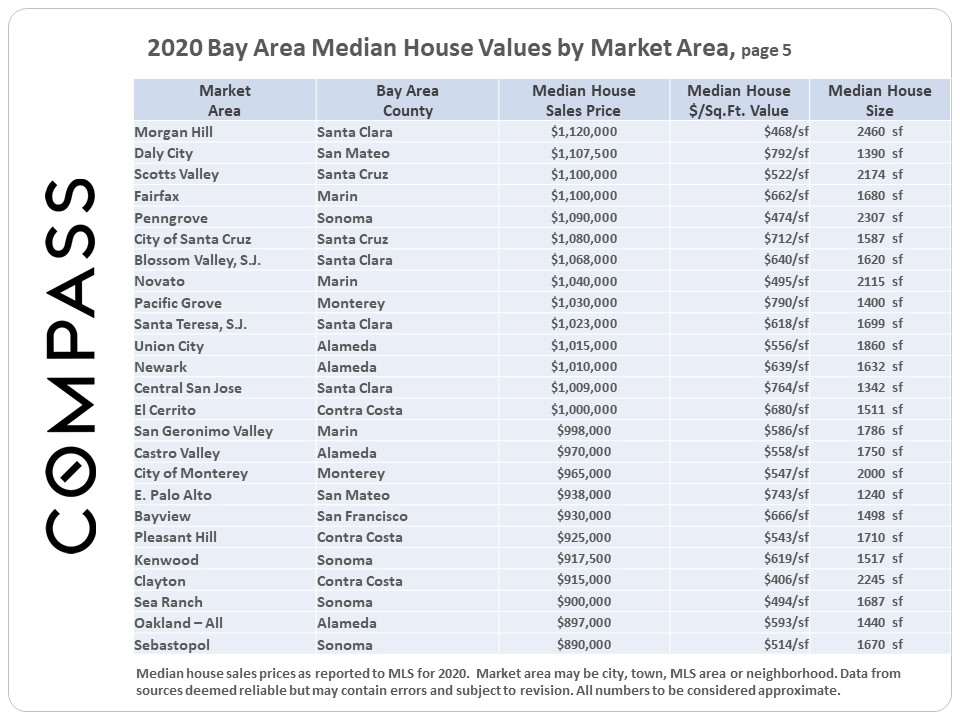
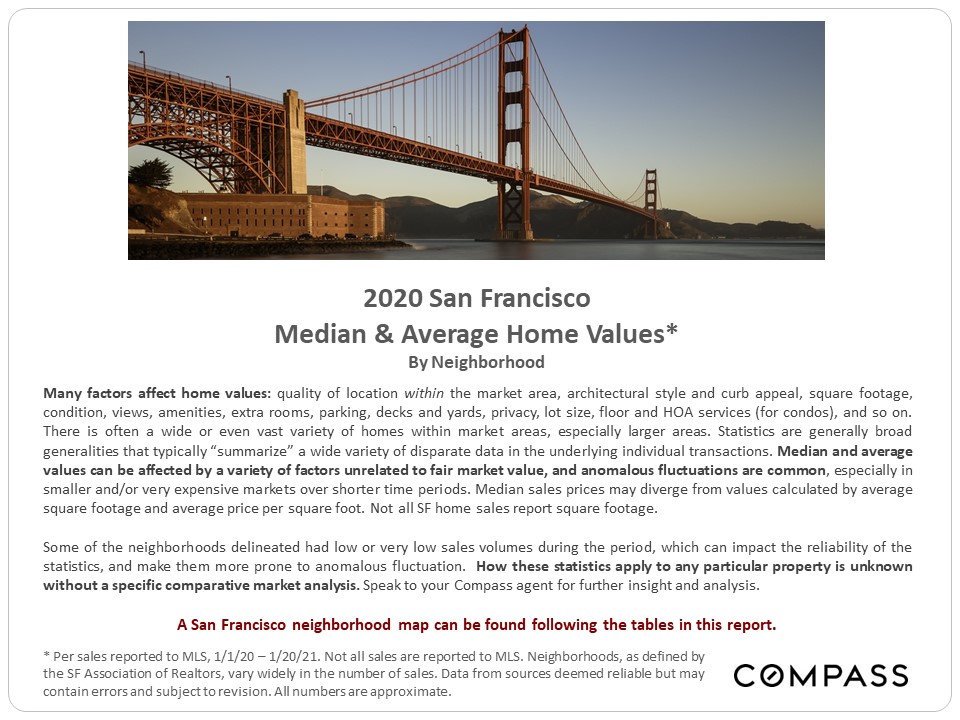
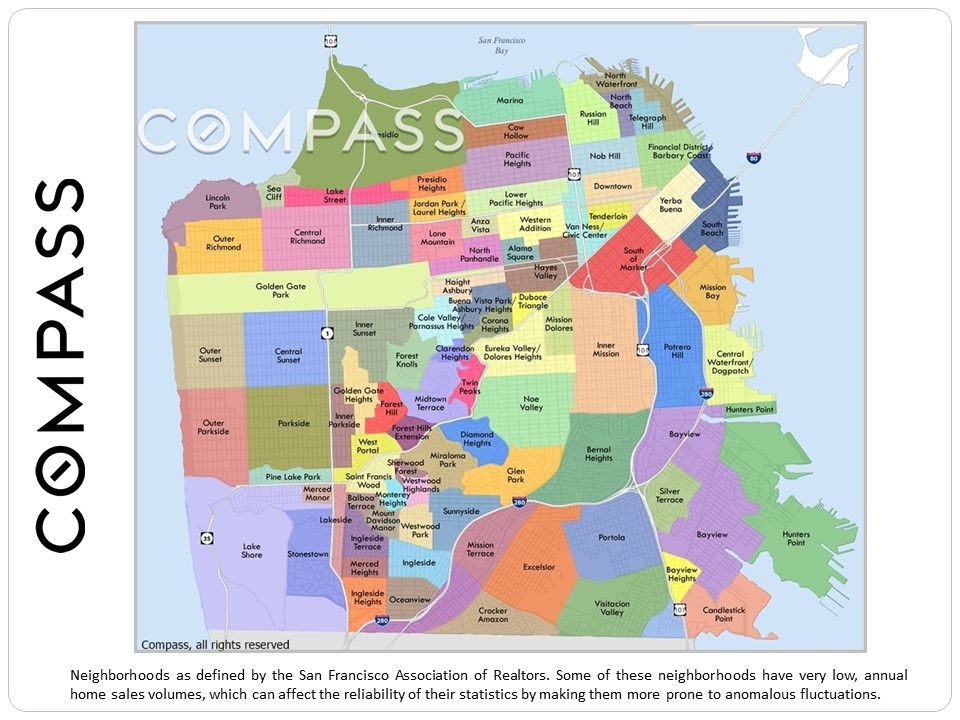
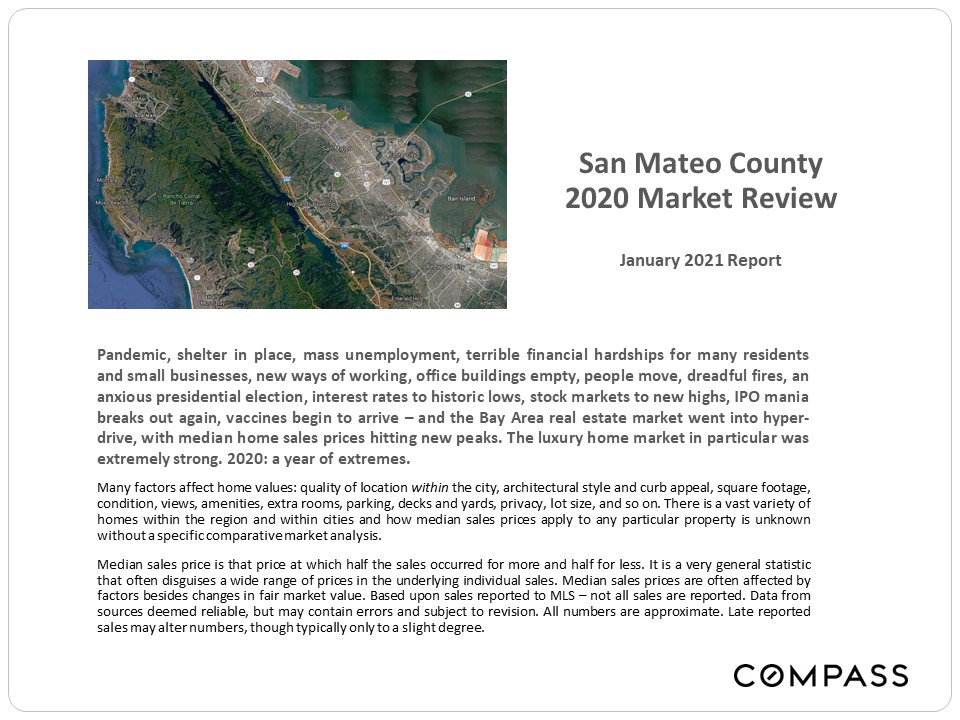
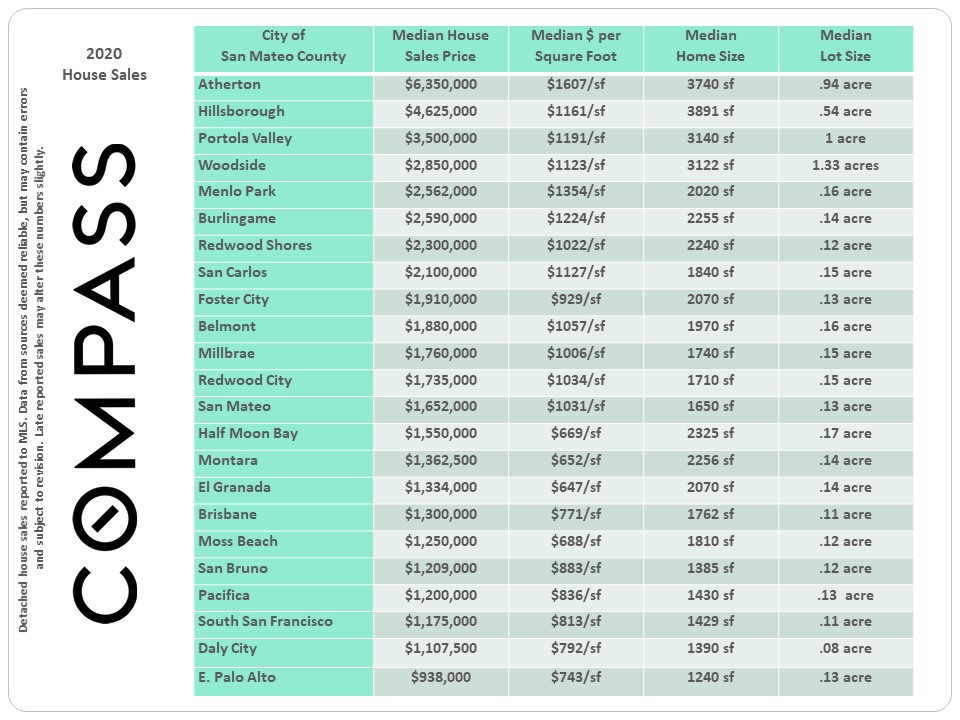
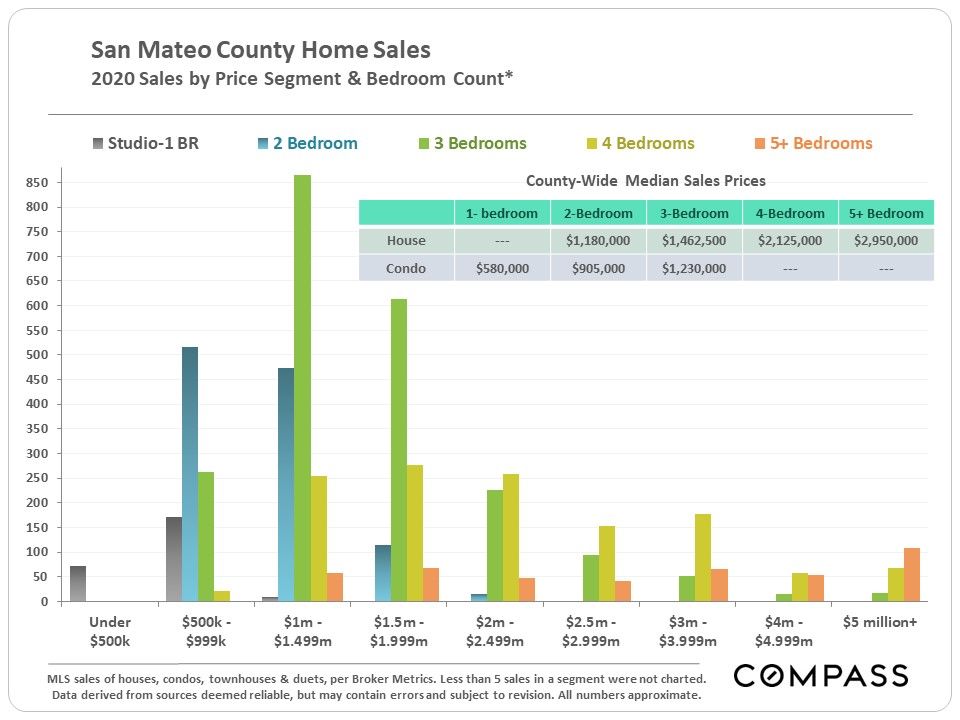
Many factors affect home values: quality of location within the market area, architectural style and curb appeal, square footage, condition, views, amenities, extra rooms, parking, decks and yards, privacy, lot size, demographics, environmental factors, and so on. There is usually a wide or even vast variety of homes within market areas, especially larger ones.
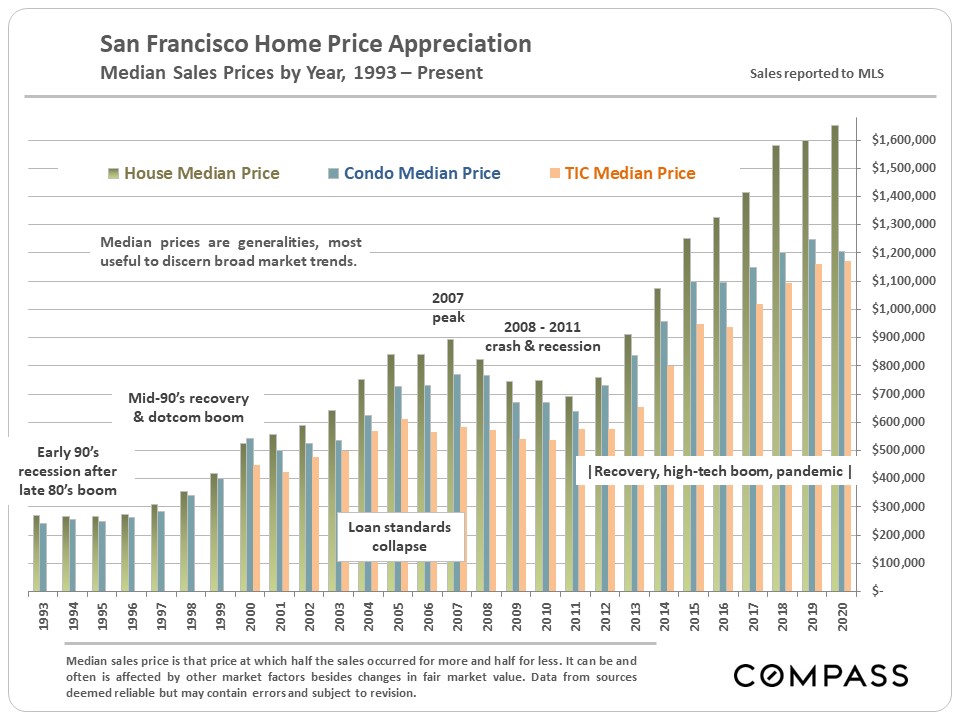
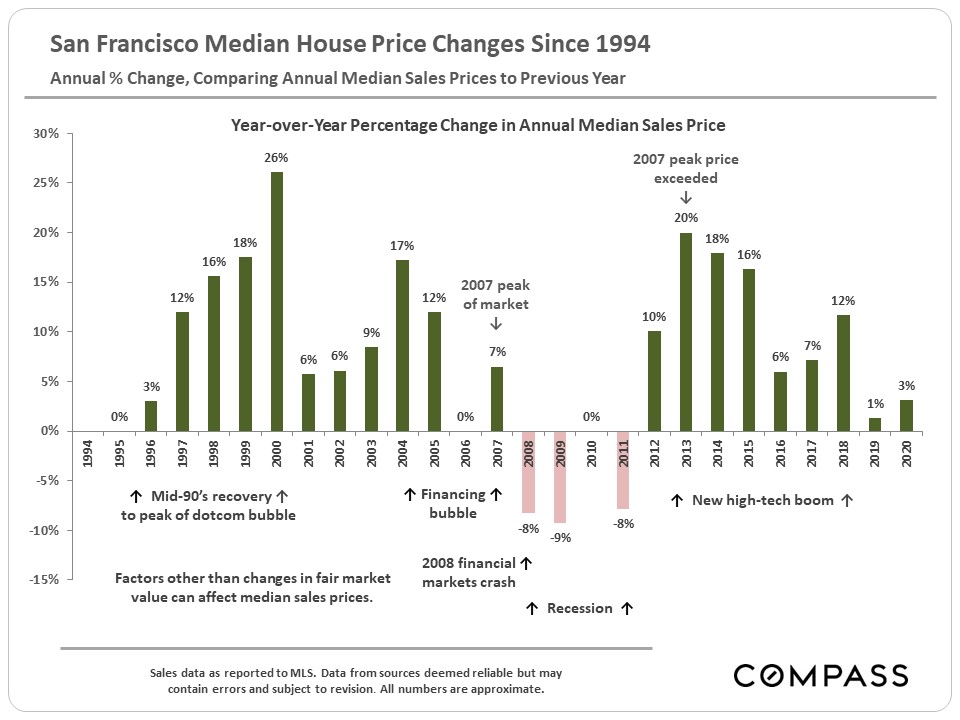
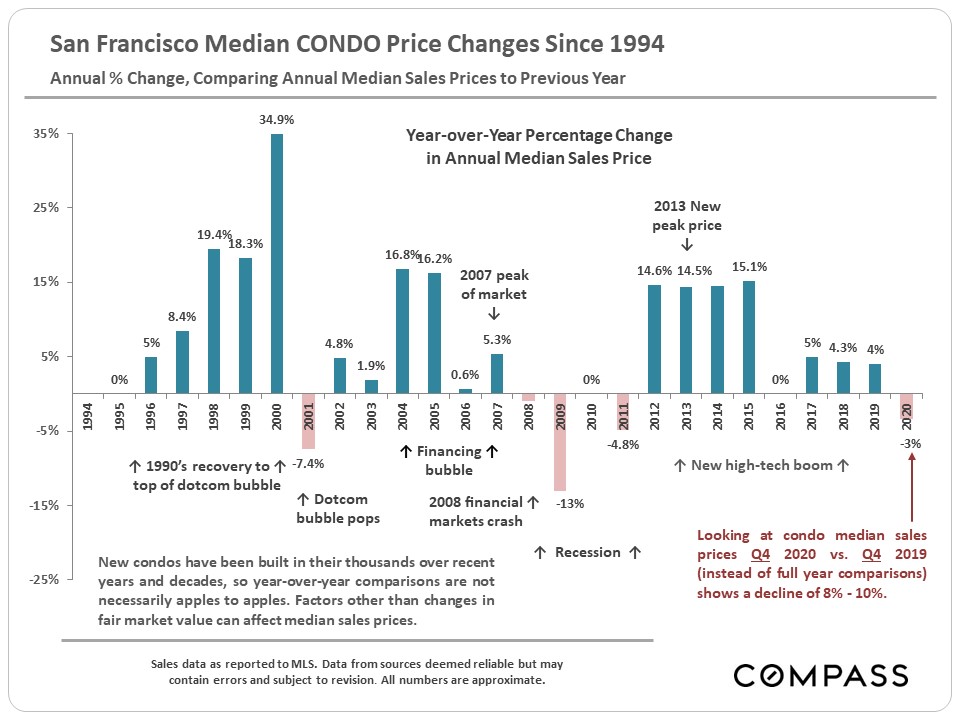
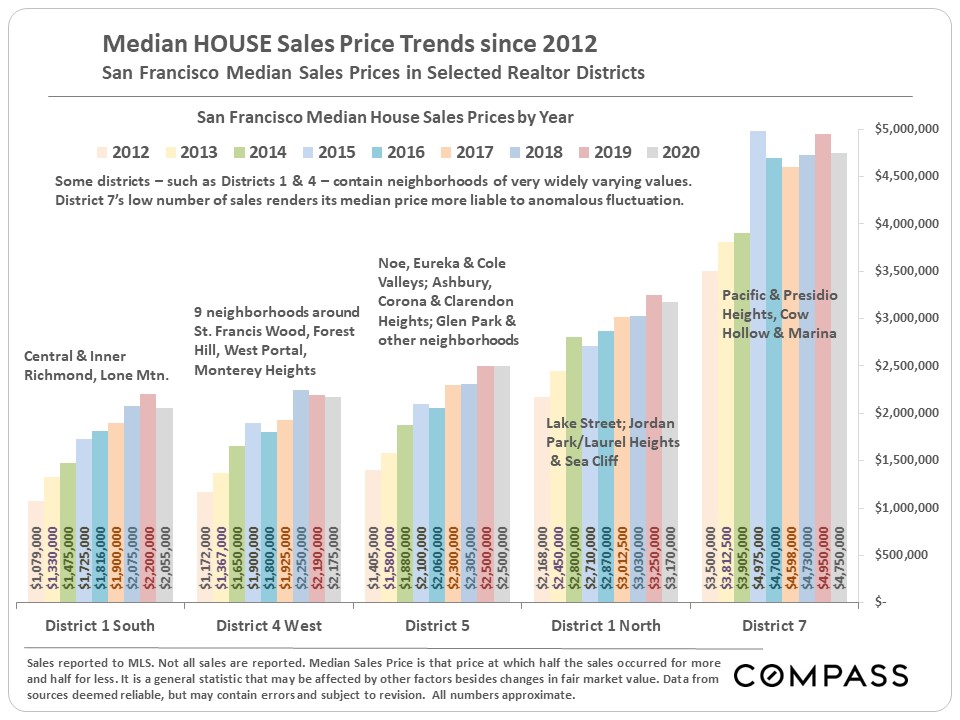
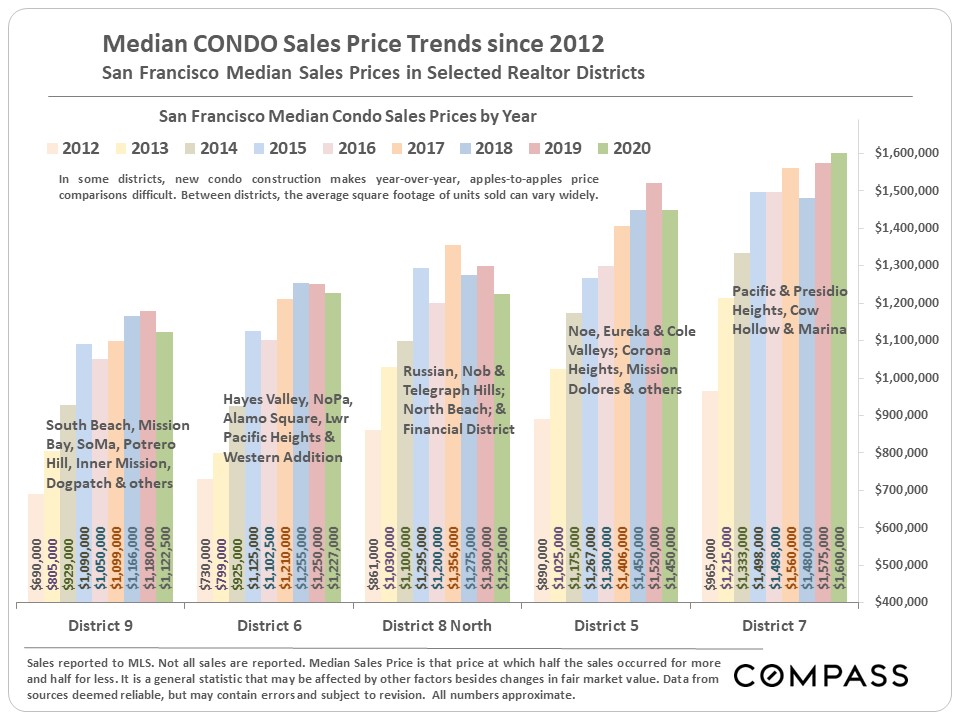
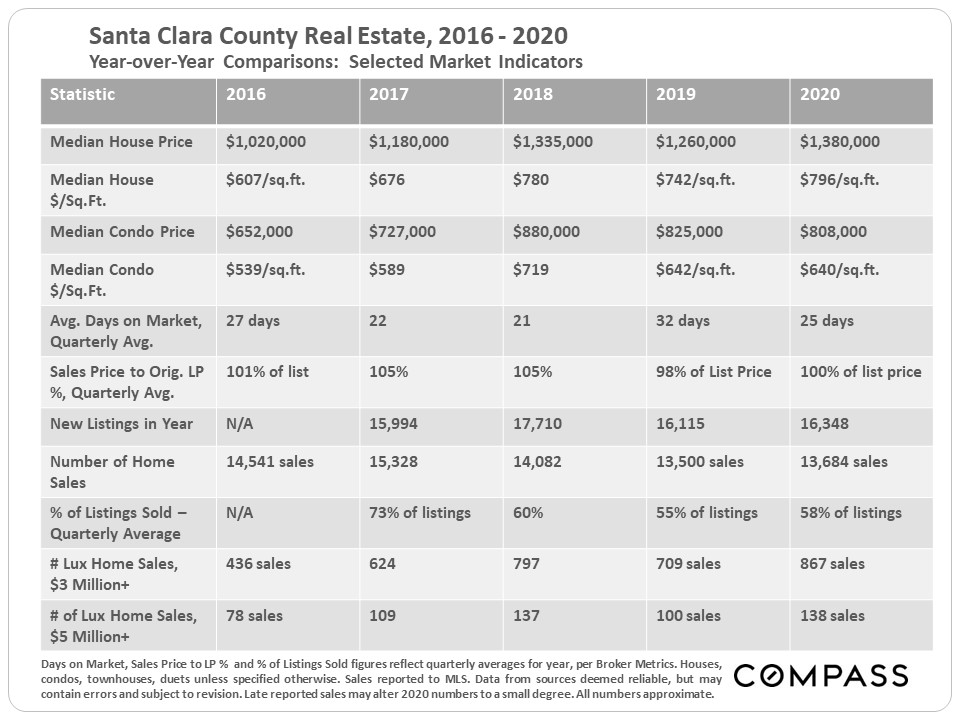
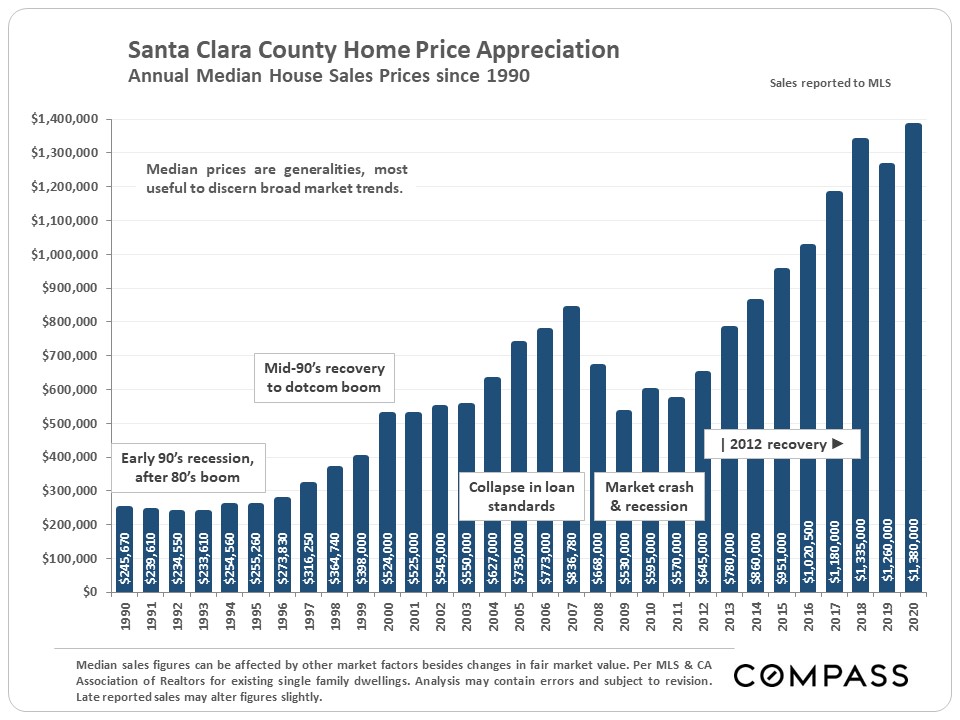
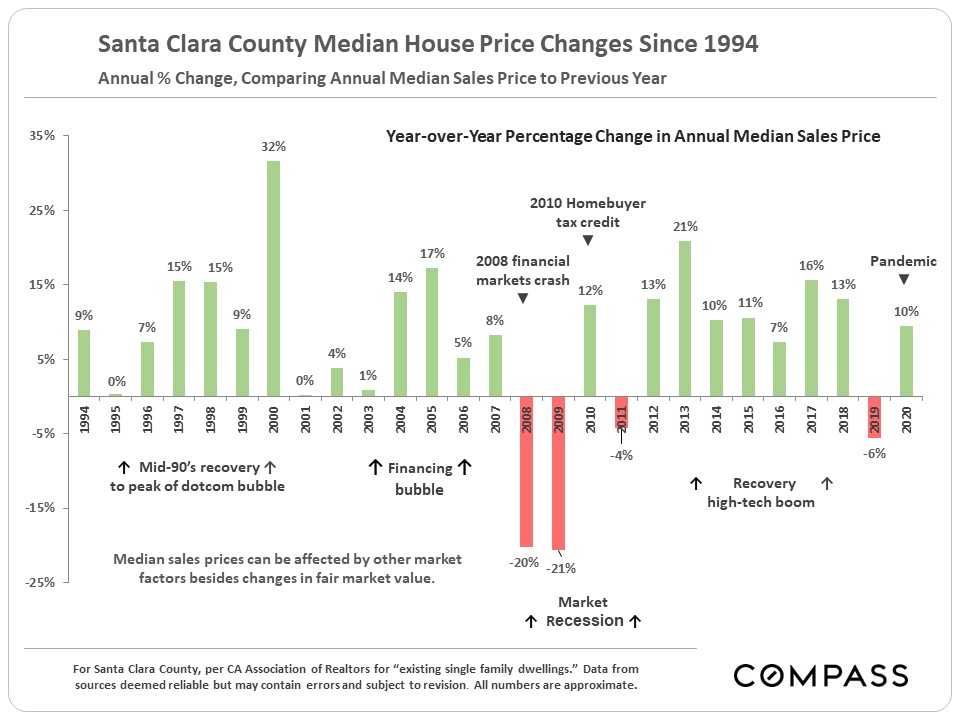
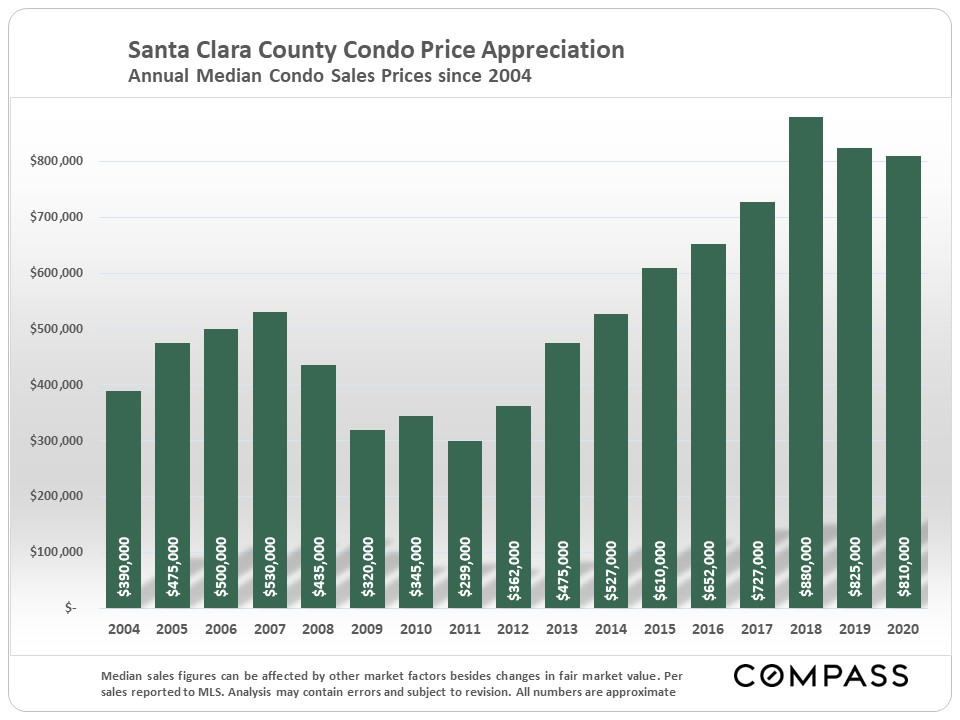
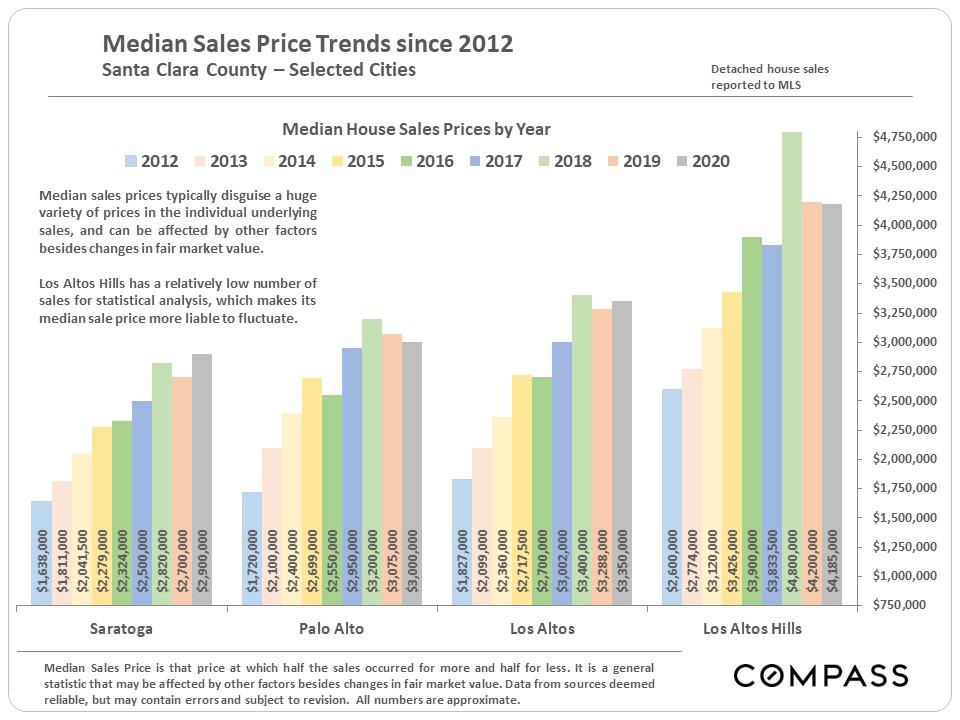
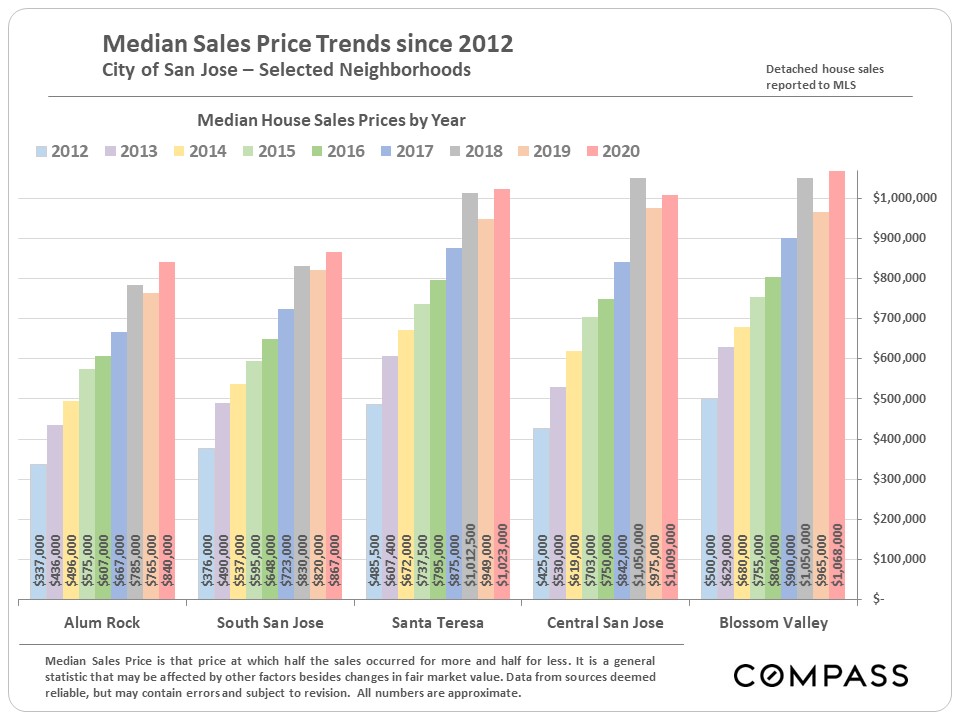
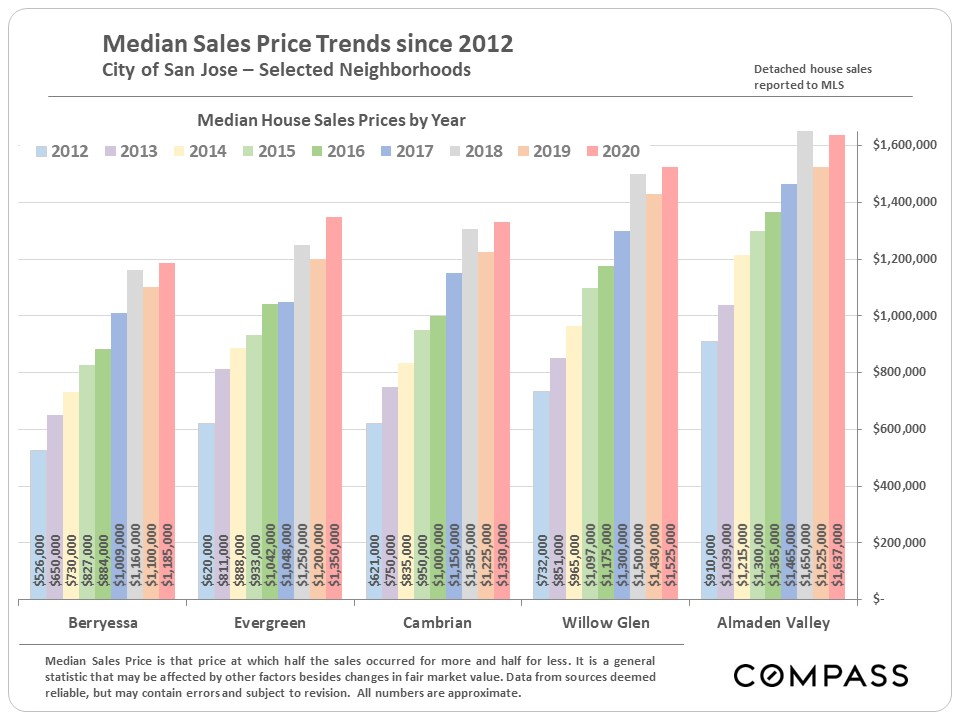
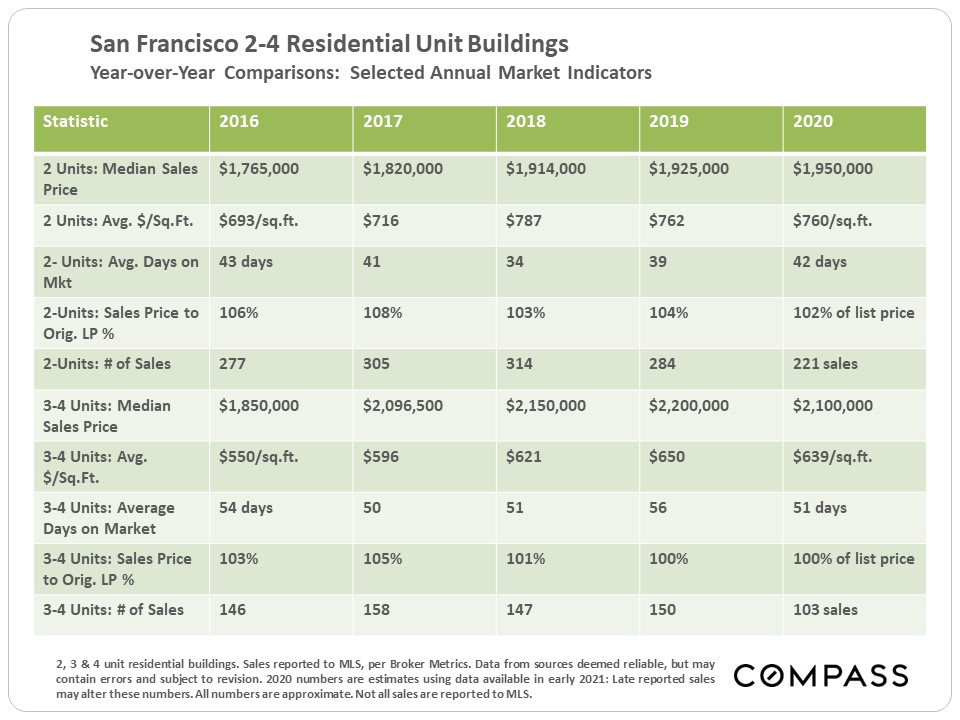
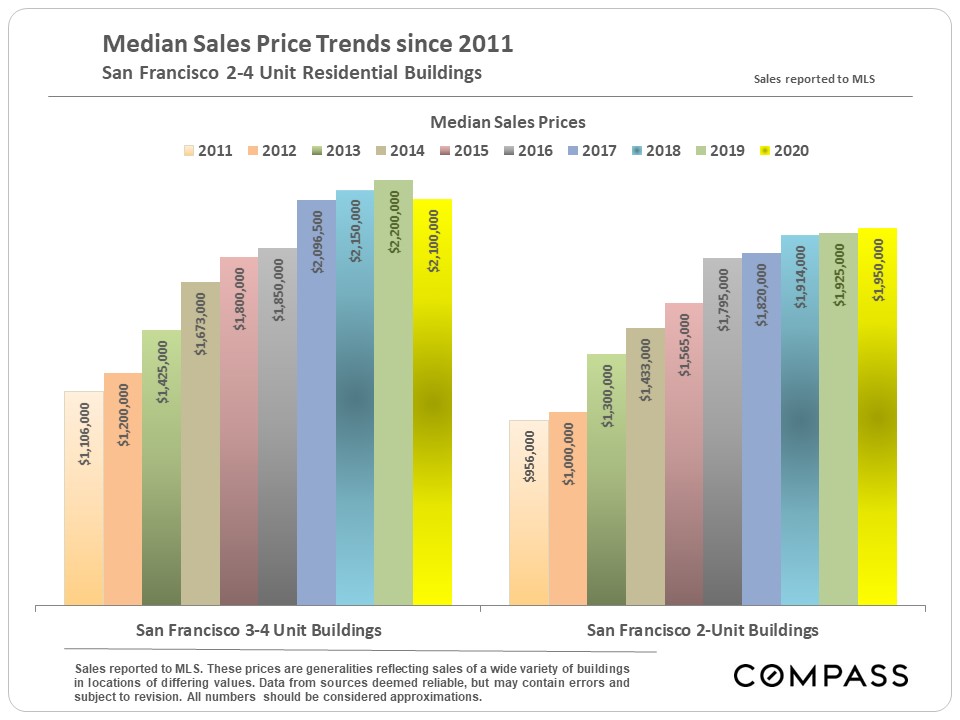
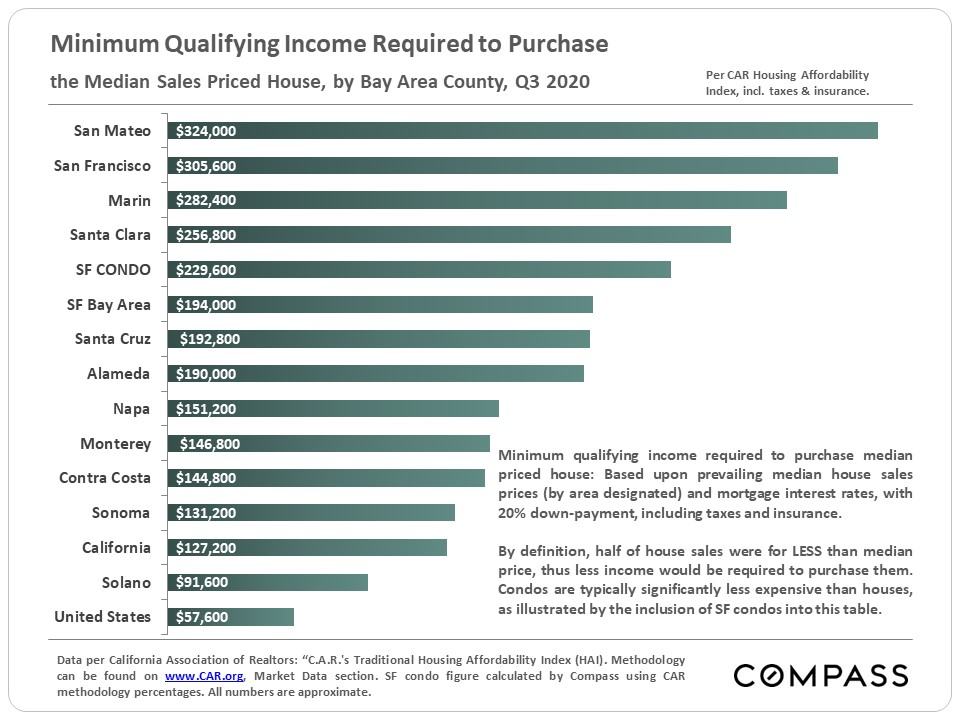
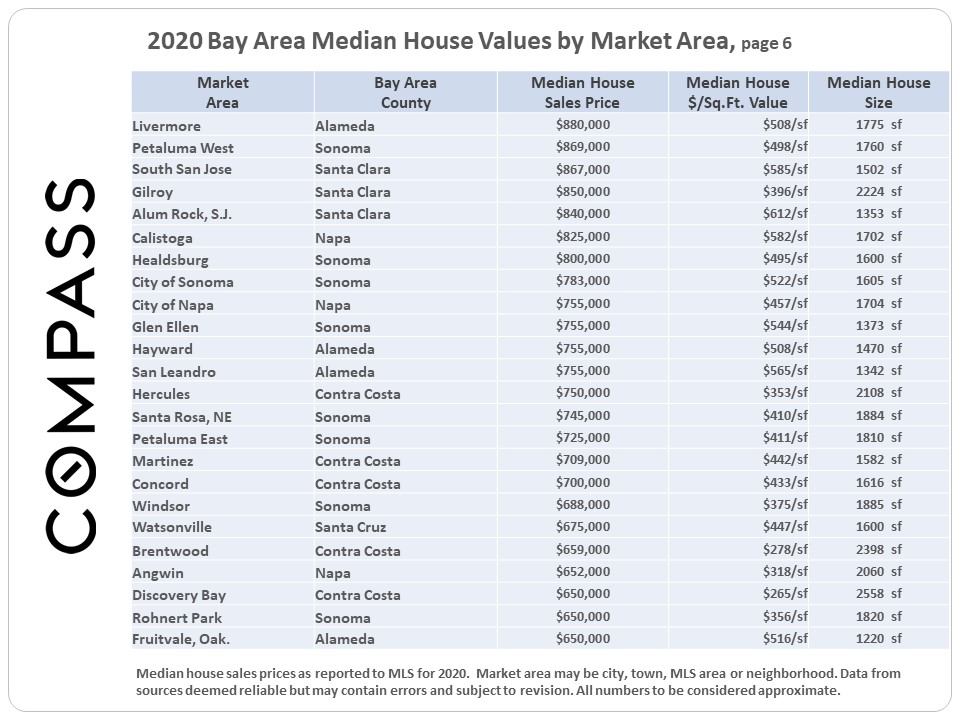
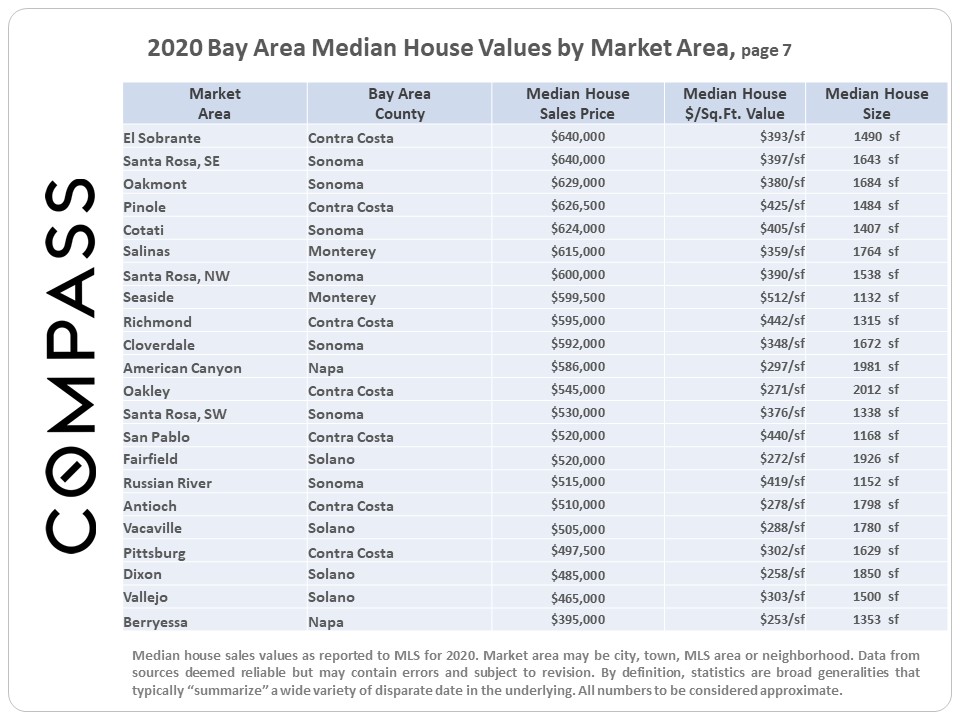
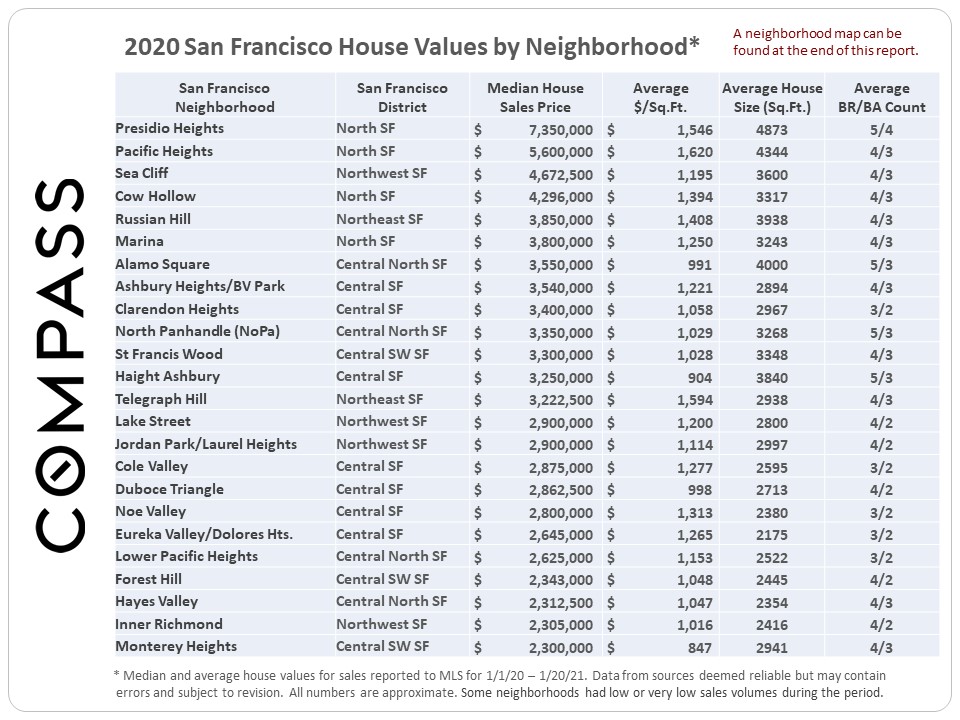
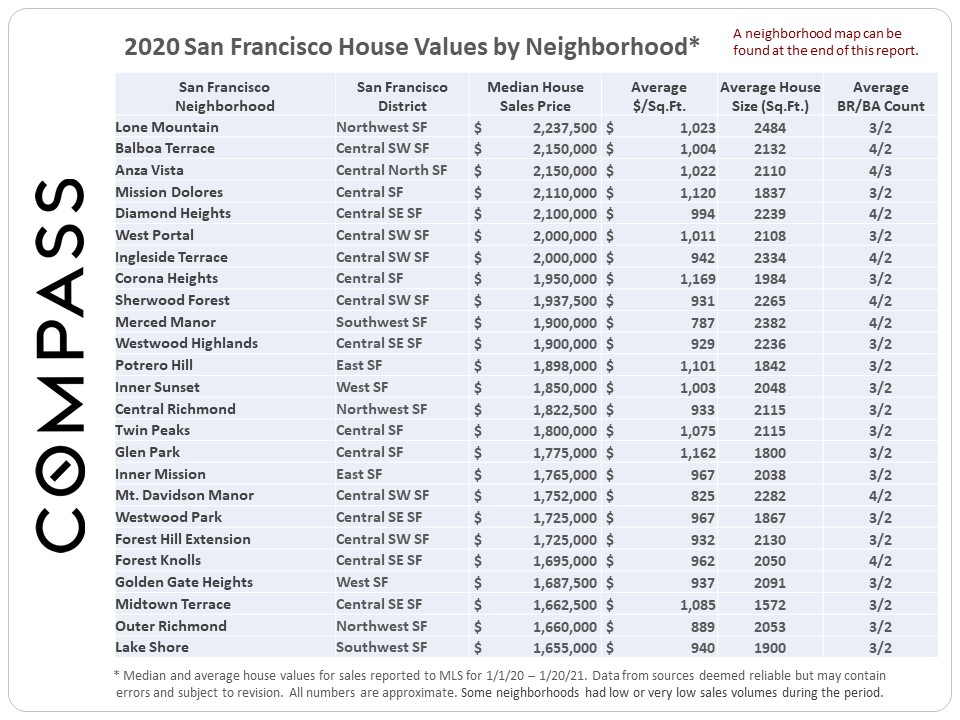
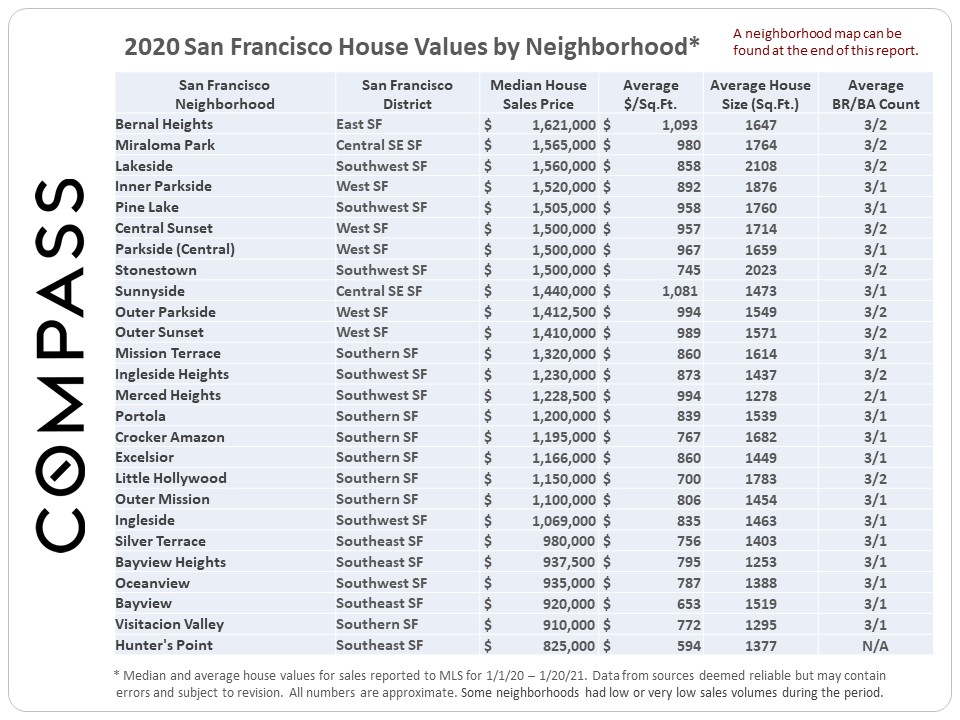
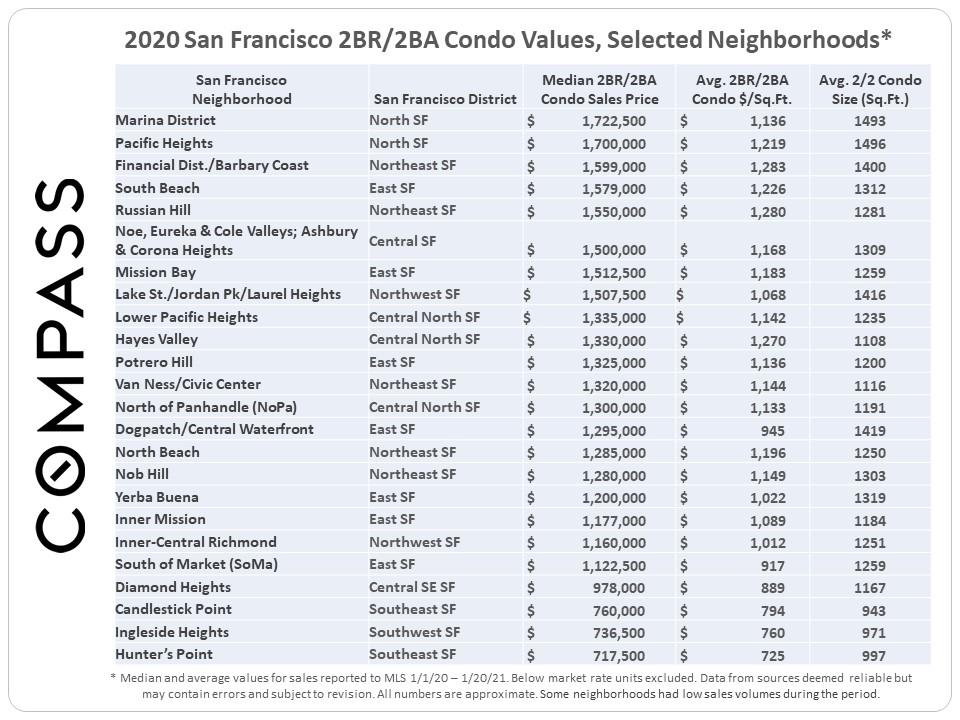
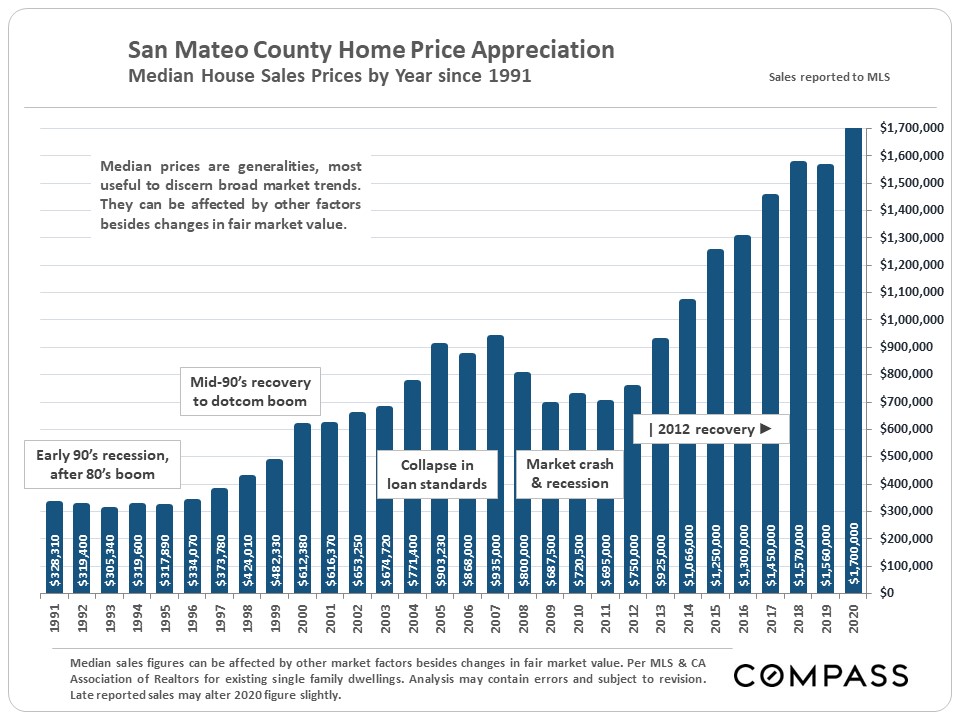
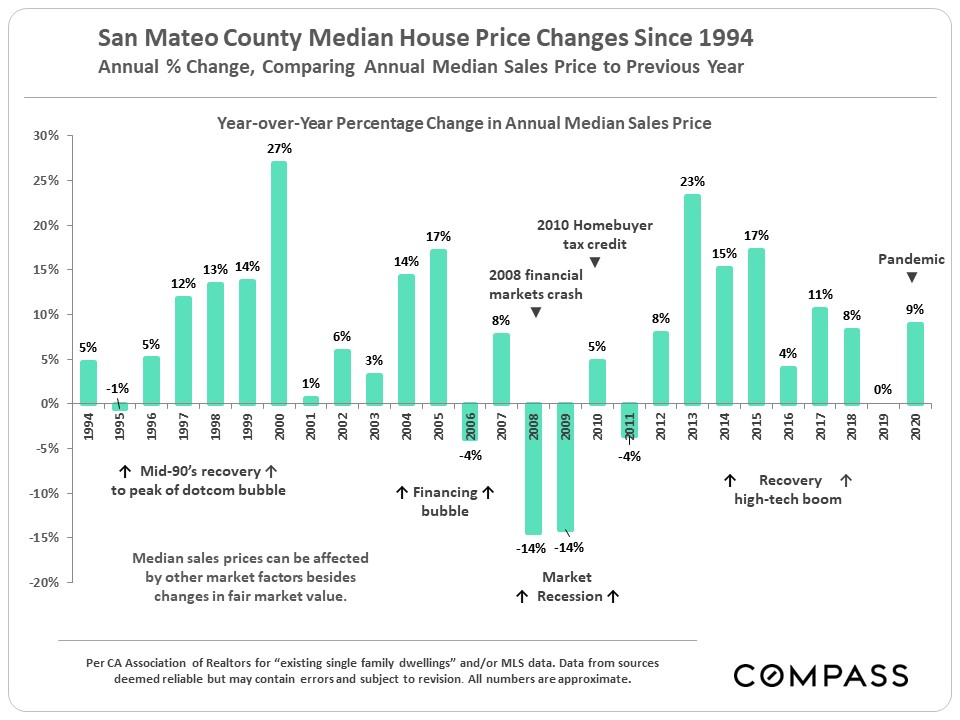
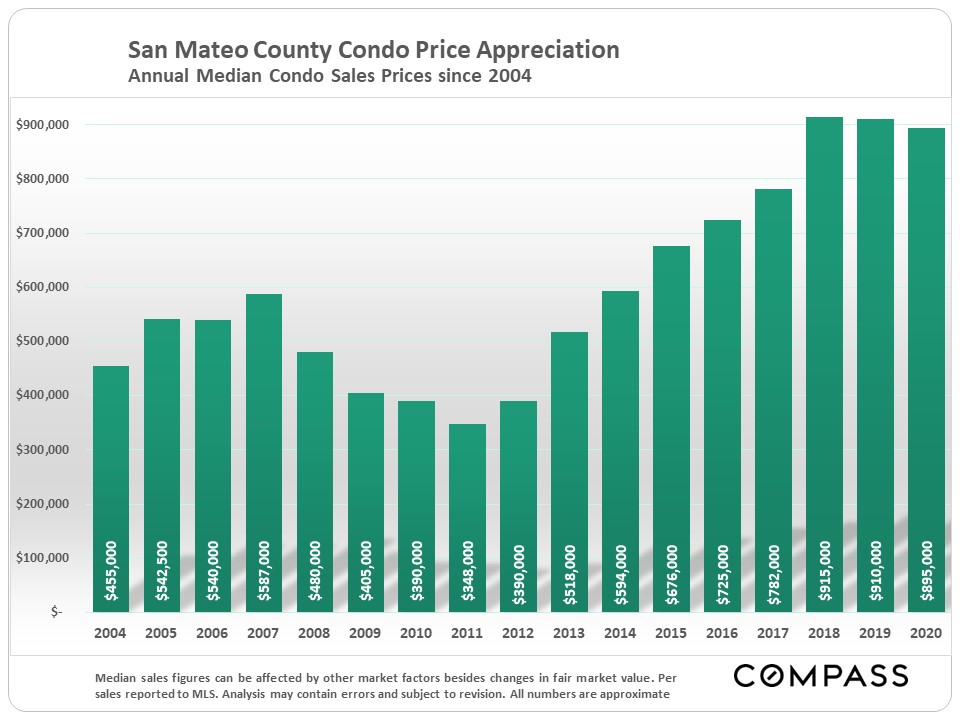
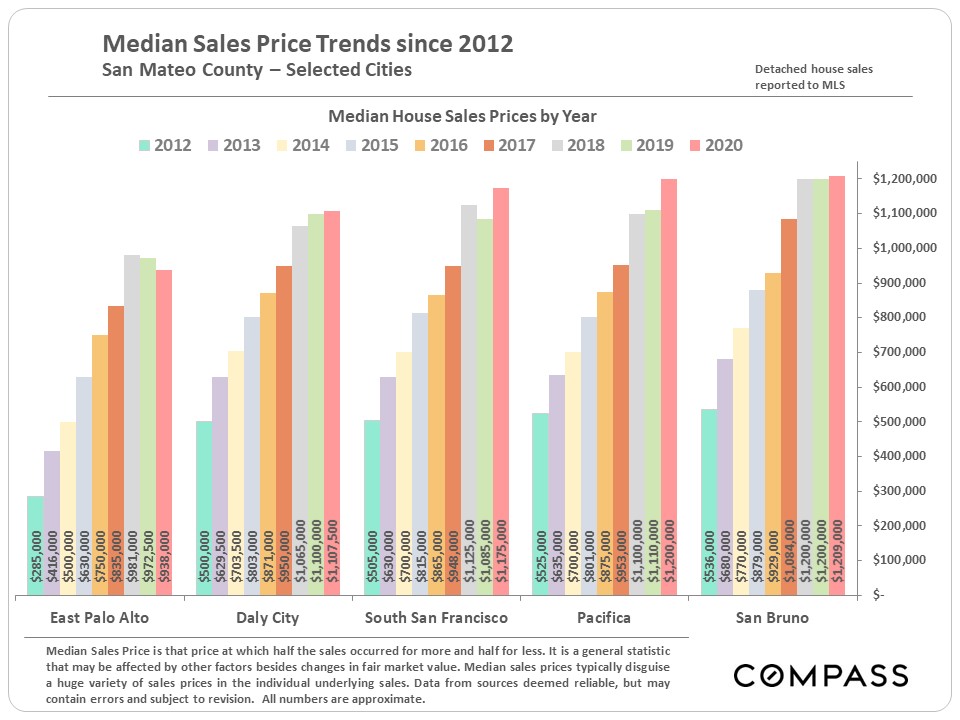
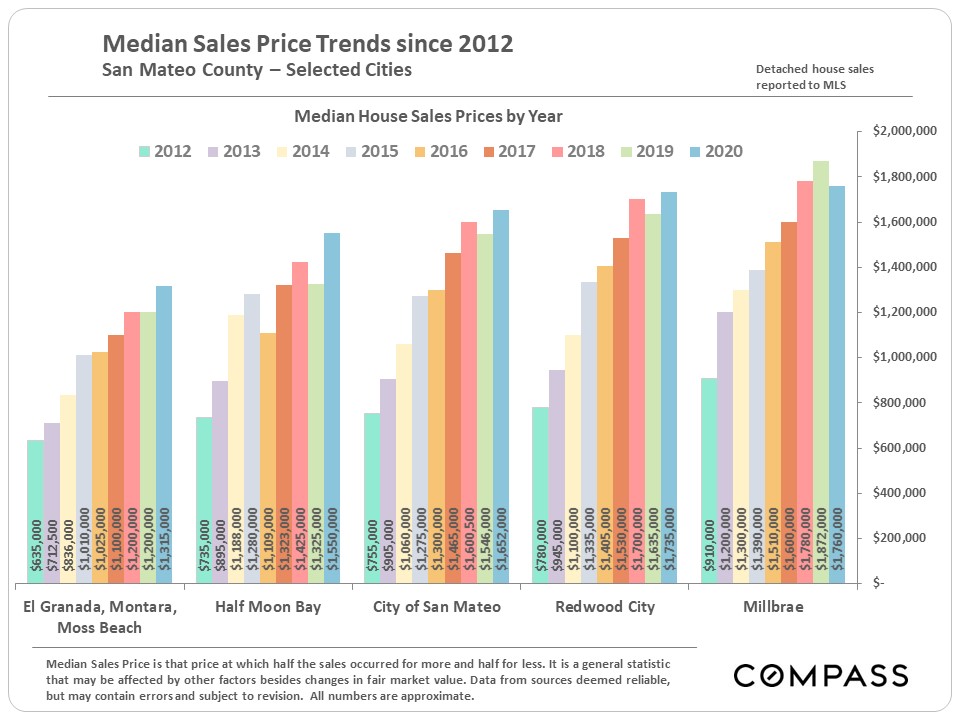
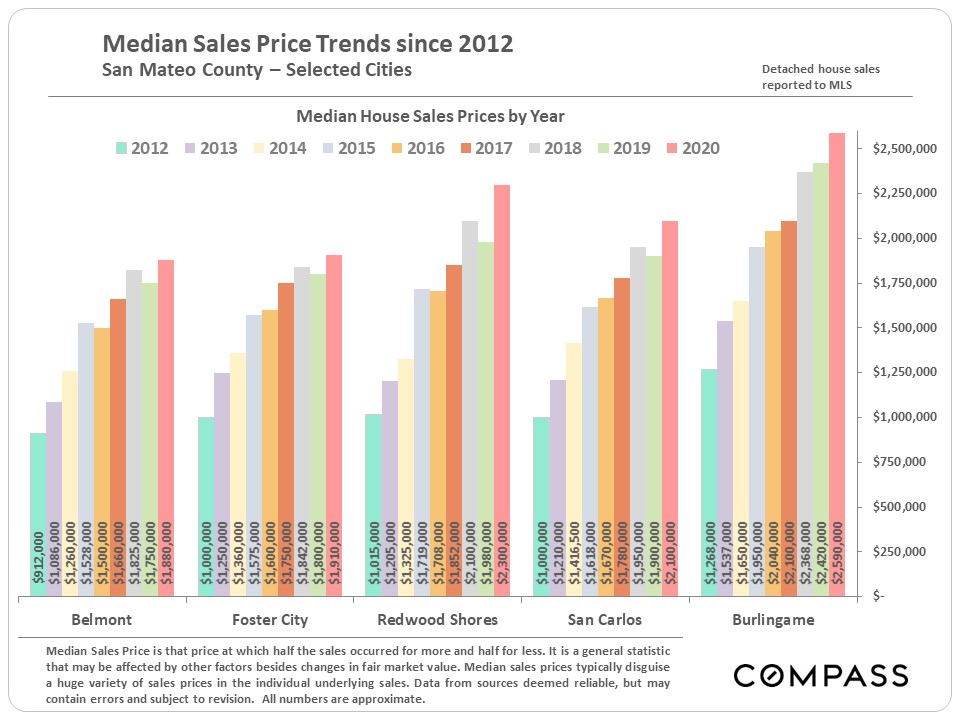
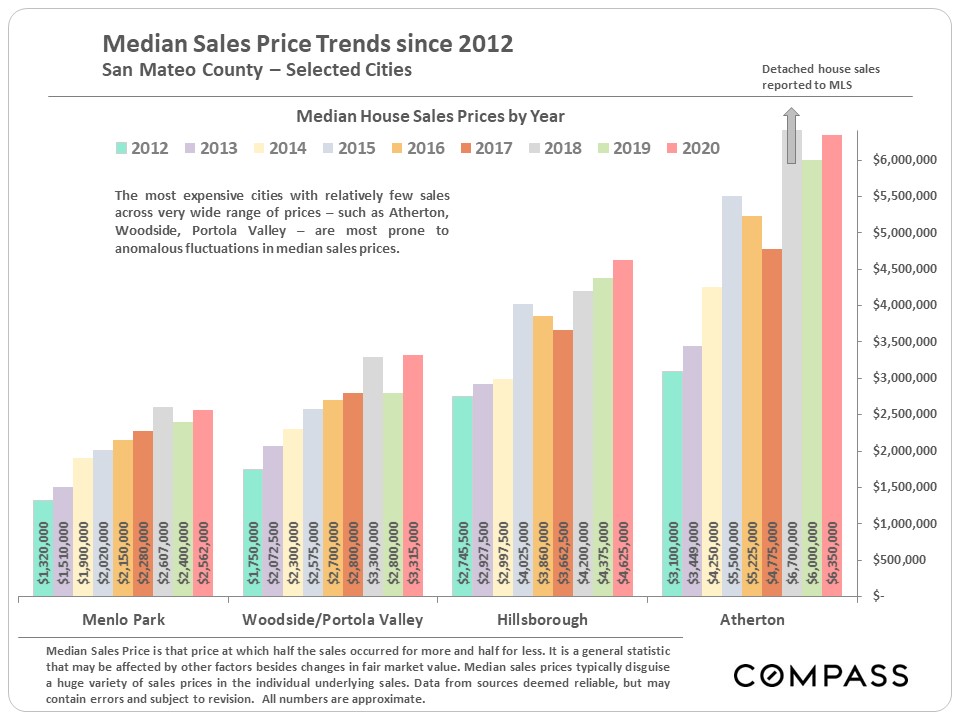
Median values are those at which half the sales occurred for more and half for less. By definition, statistics are broad generalities that typically “summarize” a wide variety of disparate date in the underlying individual transactions. Median values can be affected by a variety of factors unrelated to fair market value, and anomalous fluctuations are common, especially in smaller and/or very expensive markets over shorter time periods. How these statistics apply to any particular property is unknown without a specific comparative market analysis. Median house sales values for Napa and Sonoma Counties in this analysis were limited to homes on lots of 2 acres or less. Not every town or city within the Bay Area is included in this list.
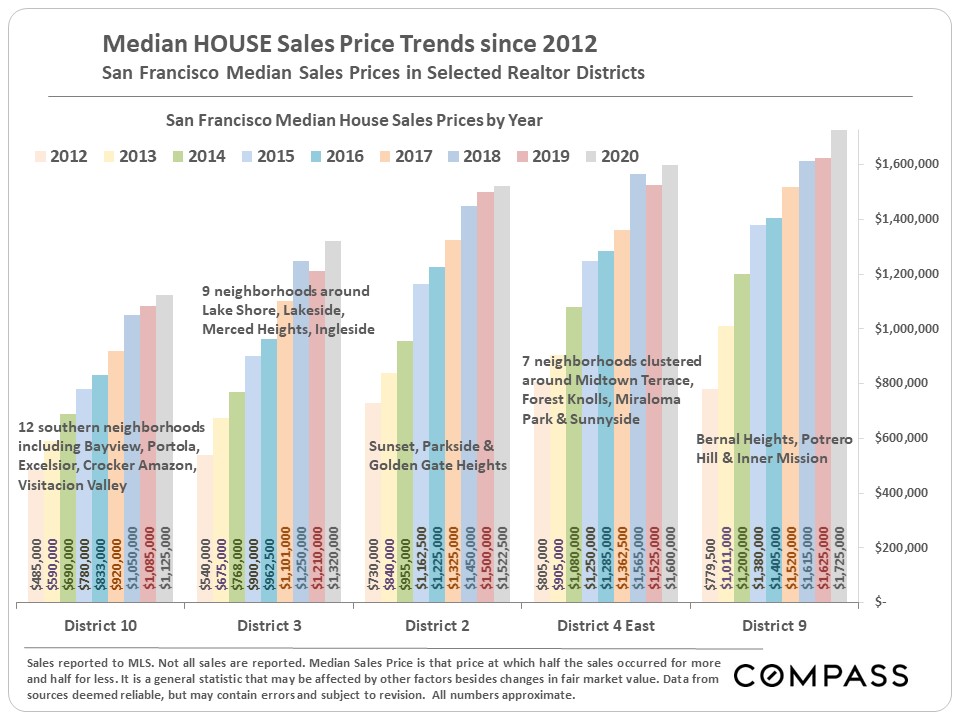
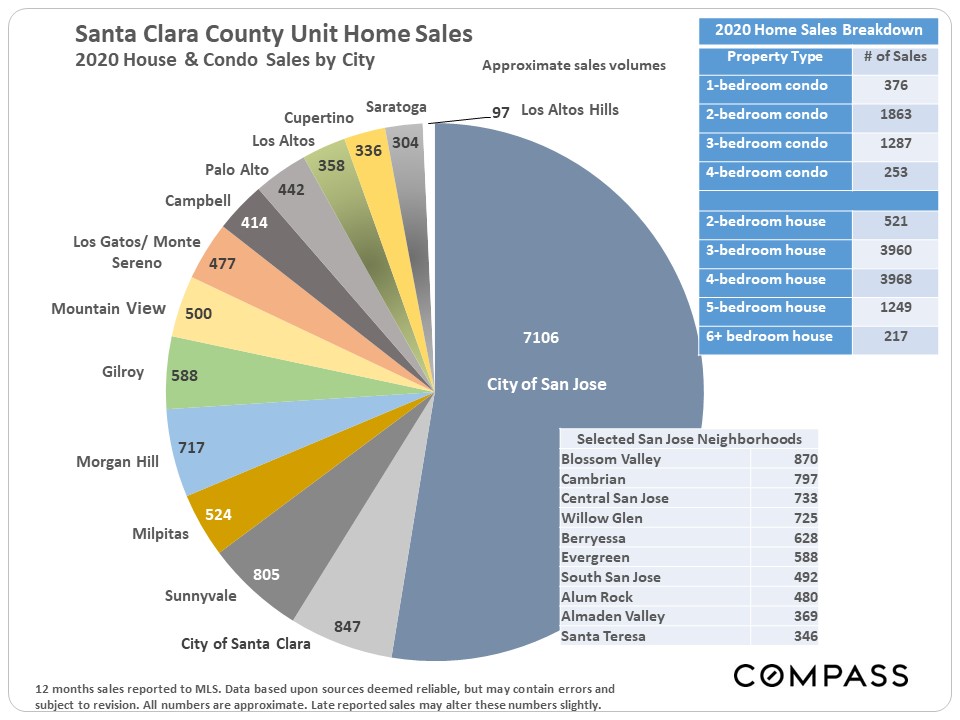
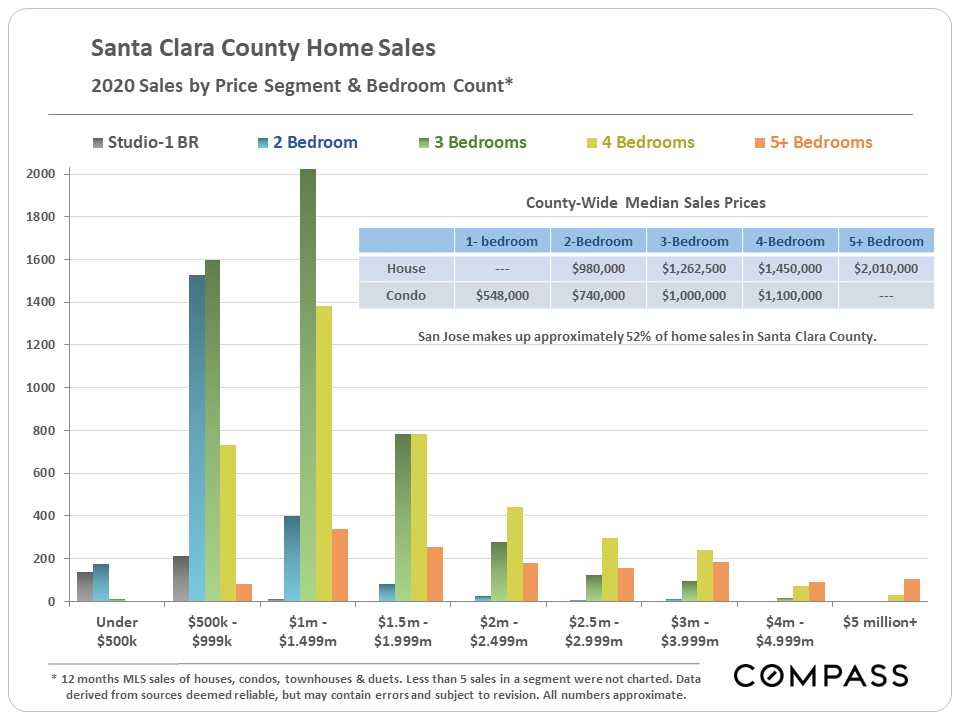
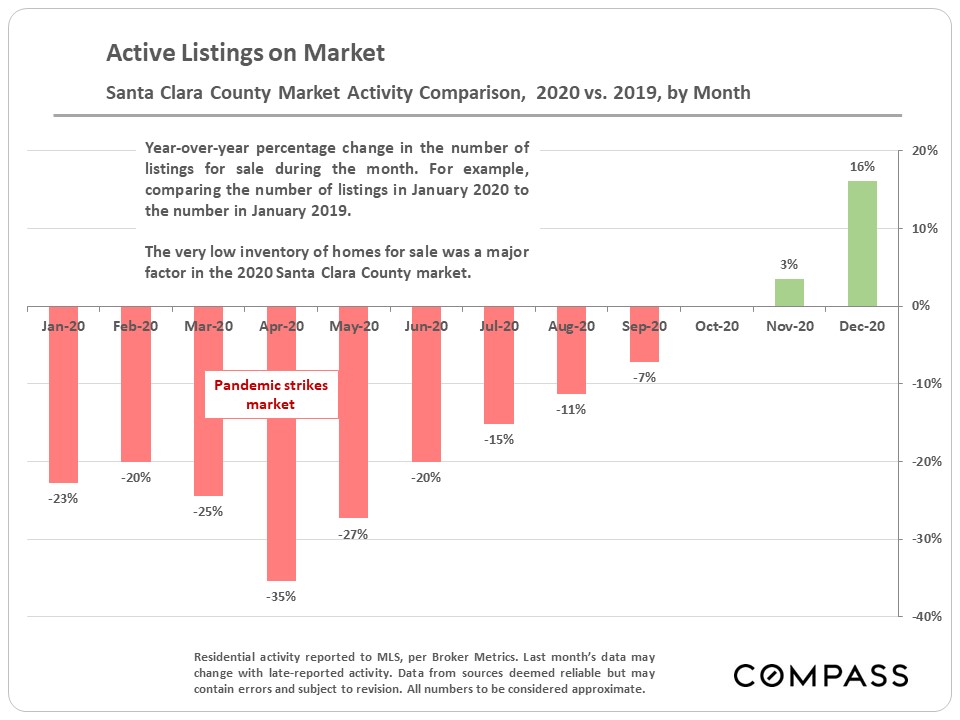
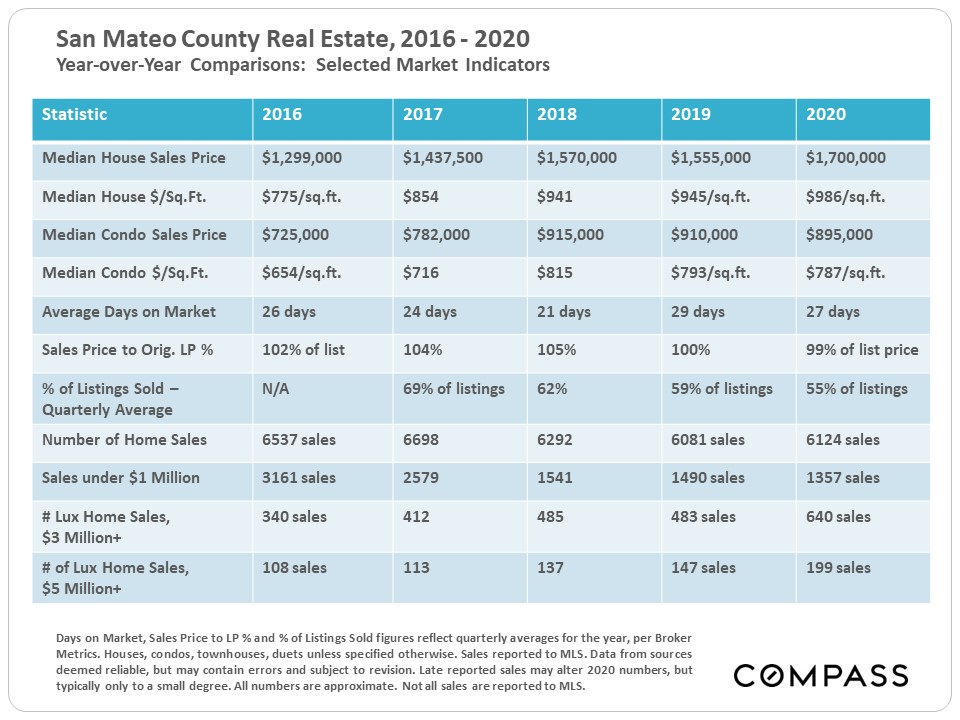
Median house sales values as reported to MLS for 2020. Not all sales are reported to MLS. “Market area” in this report may be a city, town, MLS area or neighborhood, which vary widely in size. Data from sources deemed reliable but may contain errors and subject to revision. All numbers are approximate.
Source: Compass
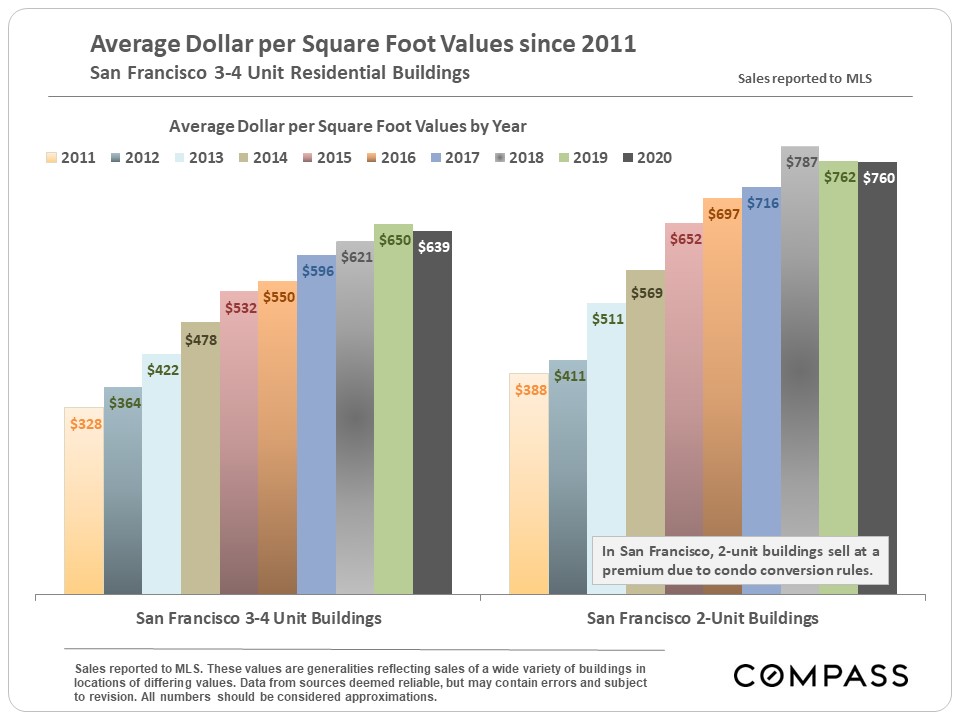
It is impossible to know how median and average value statistics apply to any particular home without a specific comparative market analysis. These analyses were made in good faith with data from sources deemed reliable, but may contain errors and are subject to revision. It is not our intent to convince you of a particular position, but to attempt to provide straightforward data and analysis, so you can make your own informed decisions. Median and average statistics are enormous generalities: There are hundreds of different markets in San Francisco and the Bay Area, each with its own unique dynamics. Median prices and average dollar per square foot values can be and often are affected by other factors besides changes in fair market value. Longer term trends are much more meaningful than short-term.
Compass is a real estate broker licensed by the State of California, DRE 01527235. Equal Housing Opportunity. This report has been prepared solely for information purposes. The information herein is based on or derived from information generally available to the public and/or from sources believed to be reliable. No representation or warranty can be given with respect to the accuracy or completeness of the information. Compass disclaims any and all liability relating to this report, including without limitation any express or implied representations or warranties for statements contained in, and omissions from, the report. Nothing contained herein is intended to be or should be read as any regulatory, legal, tax, accounting or other advice and Compass does not provide such advice. All opinions are subject to change without notice. Compass makes no representation regarding the accuracy of any statements regarding any references to the laws, statutes or regulations of any state are those of the author(s). Past performance is no guarantee of future results.
|