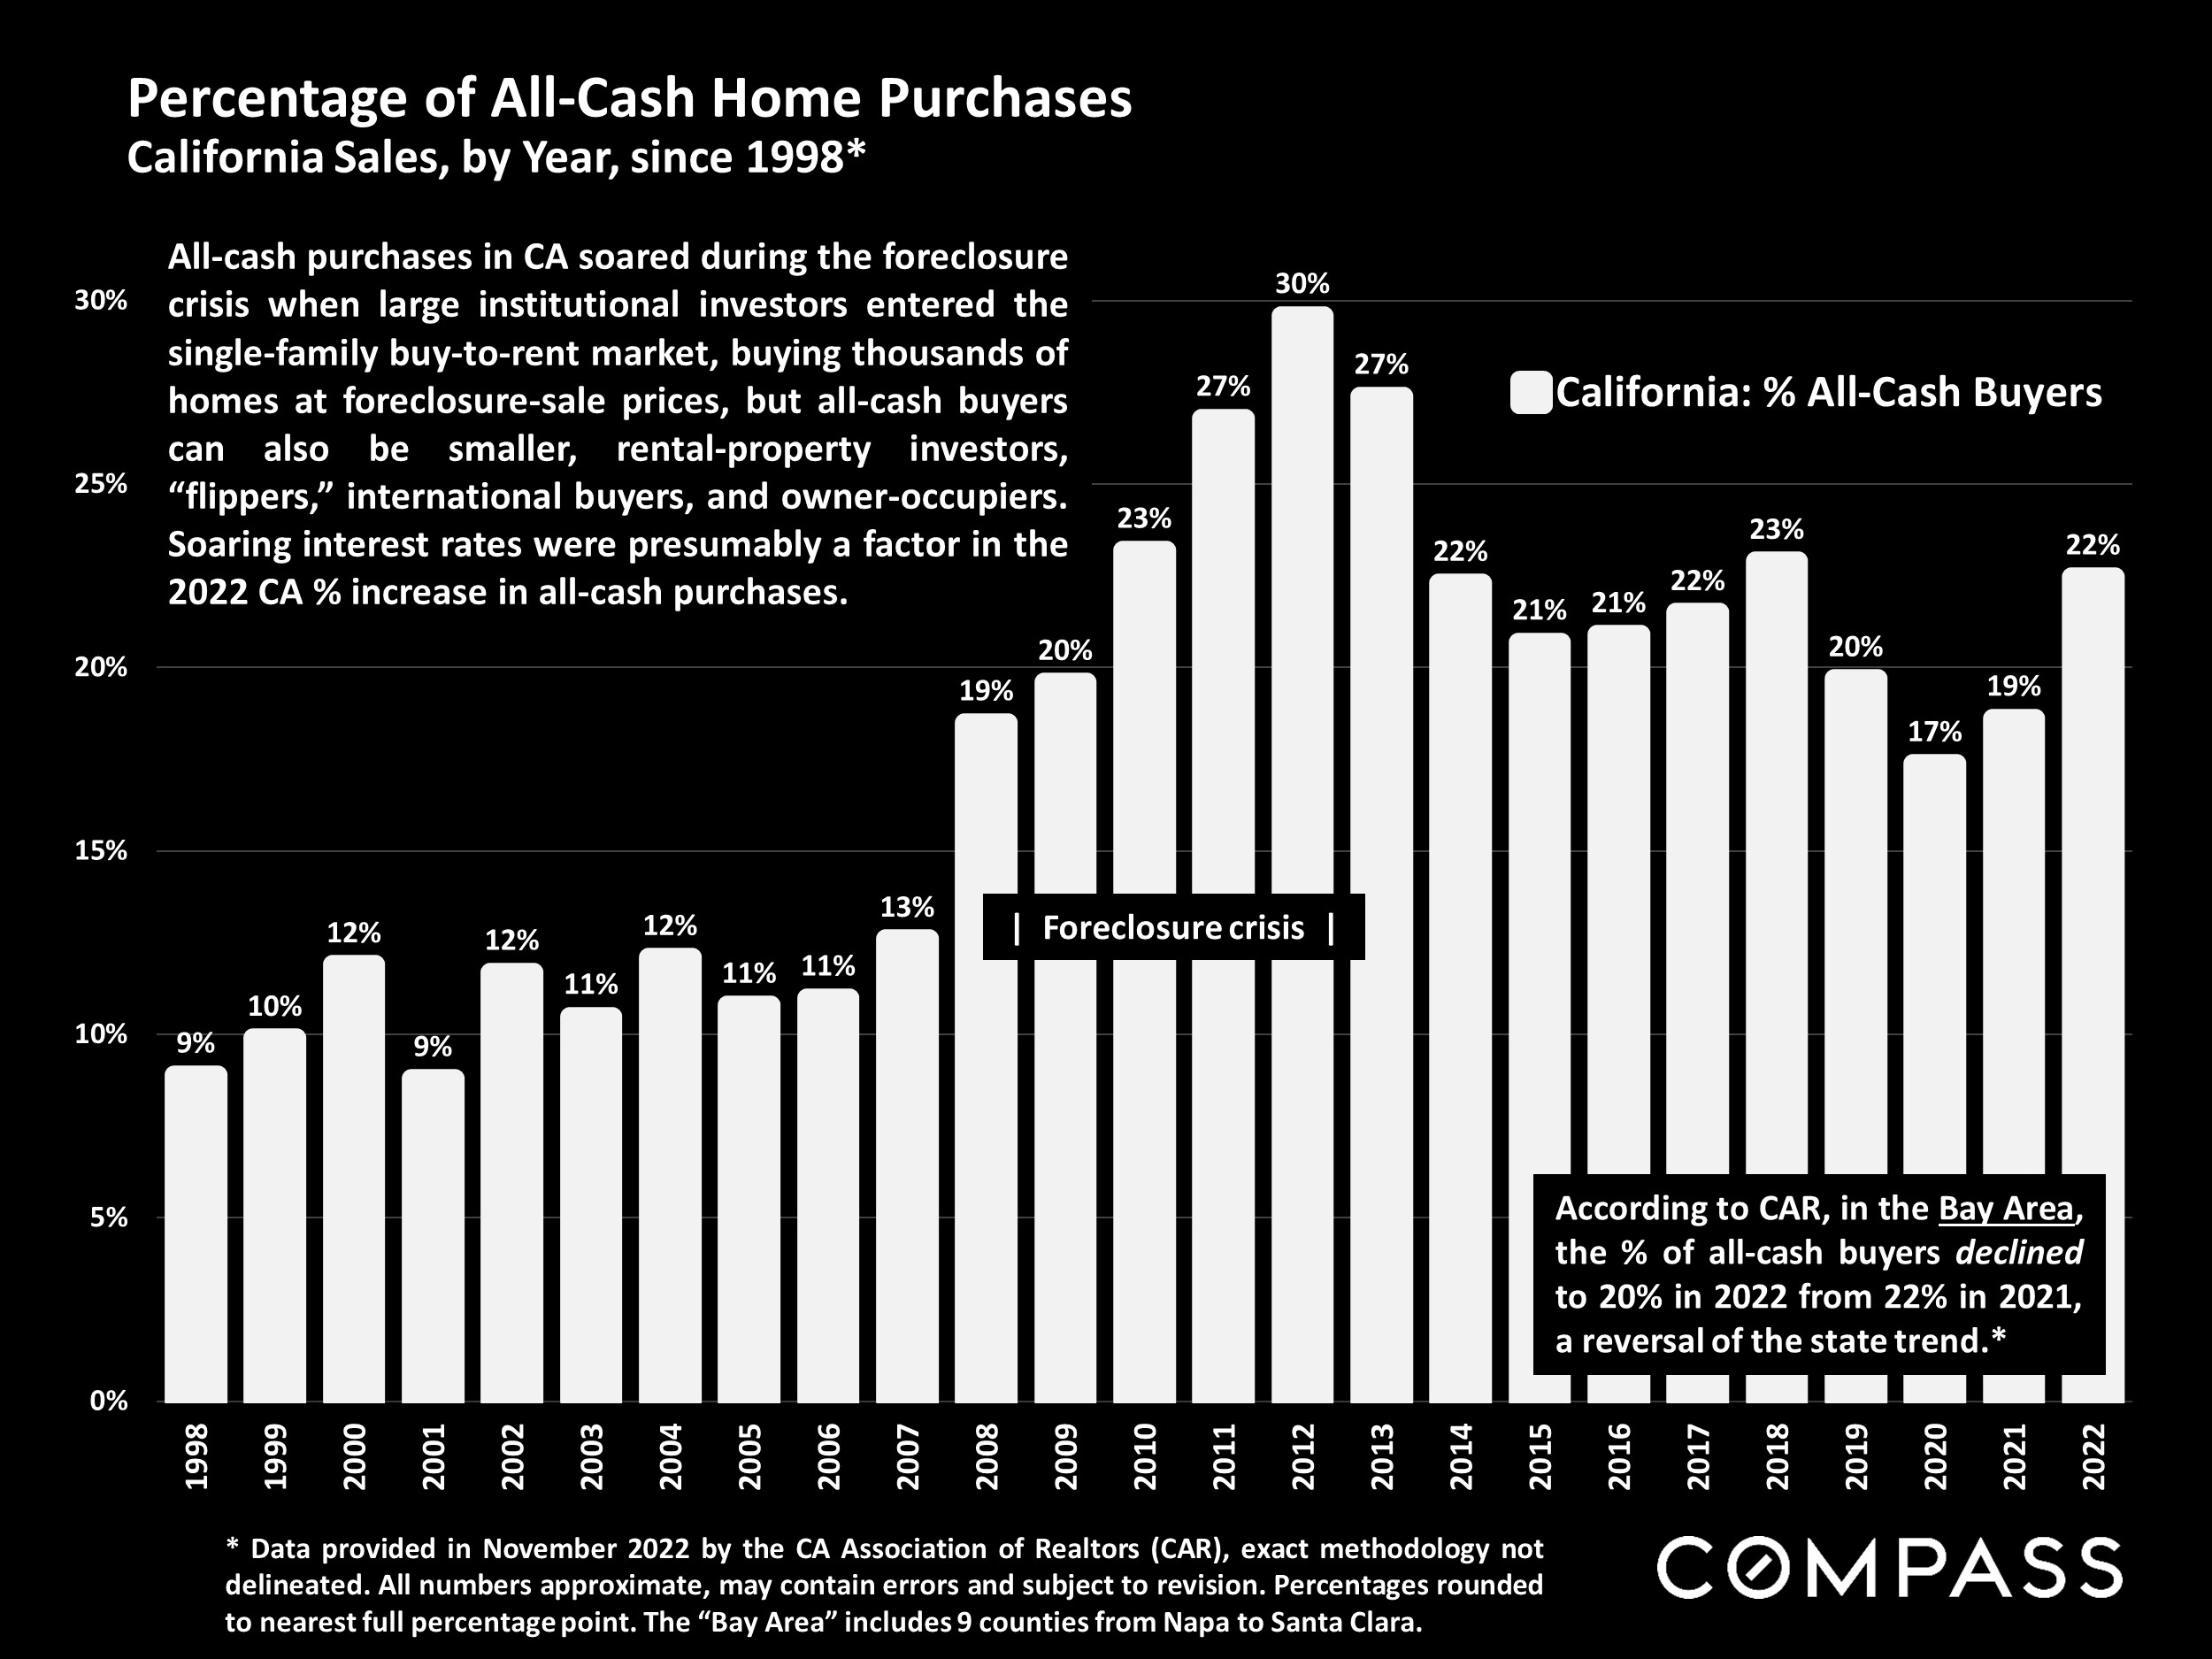
Recapping the Spring 2023 Market
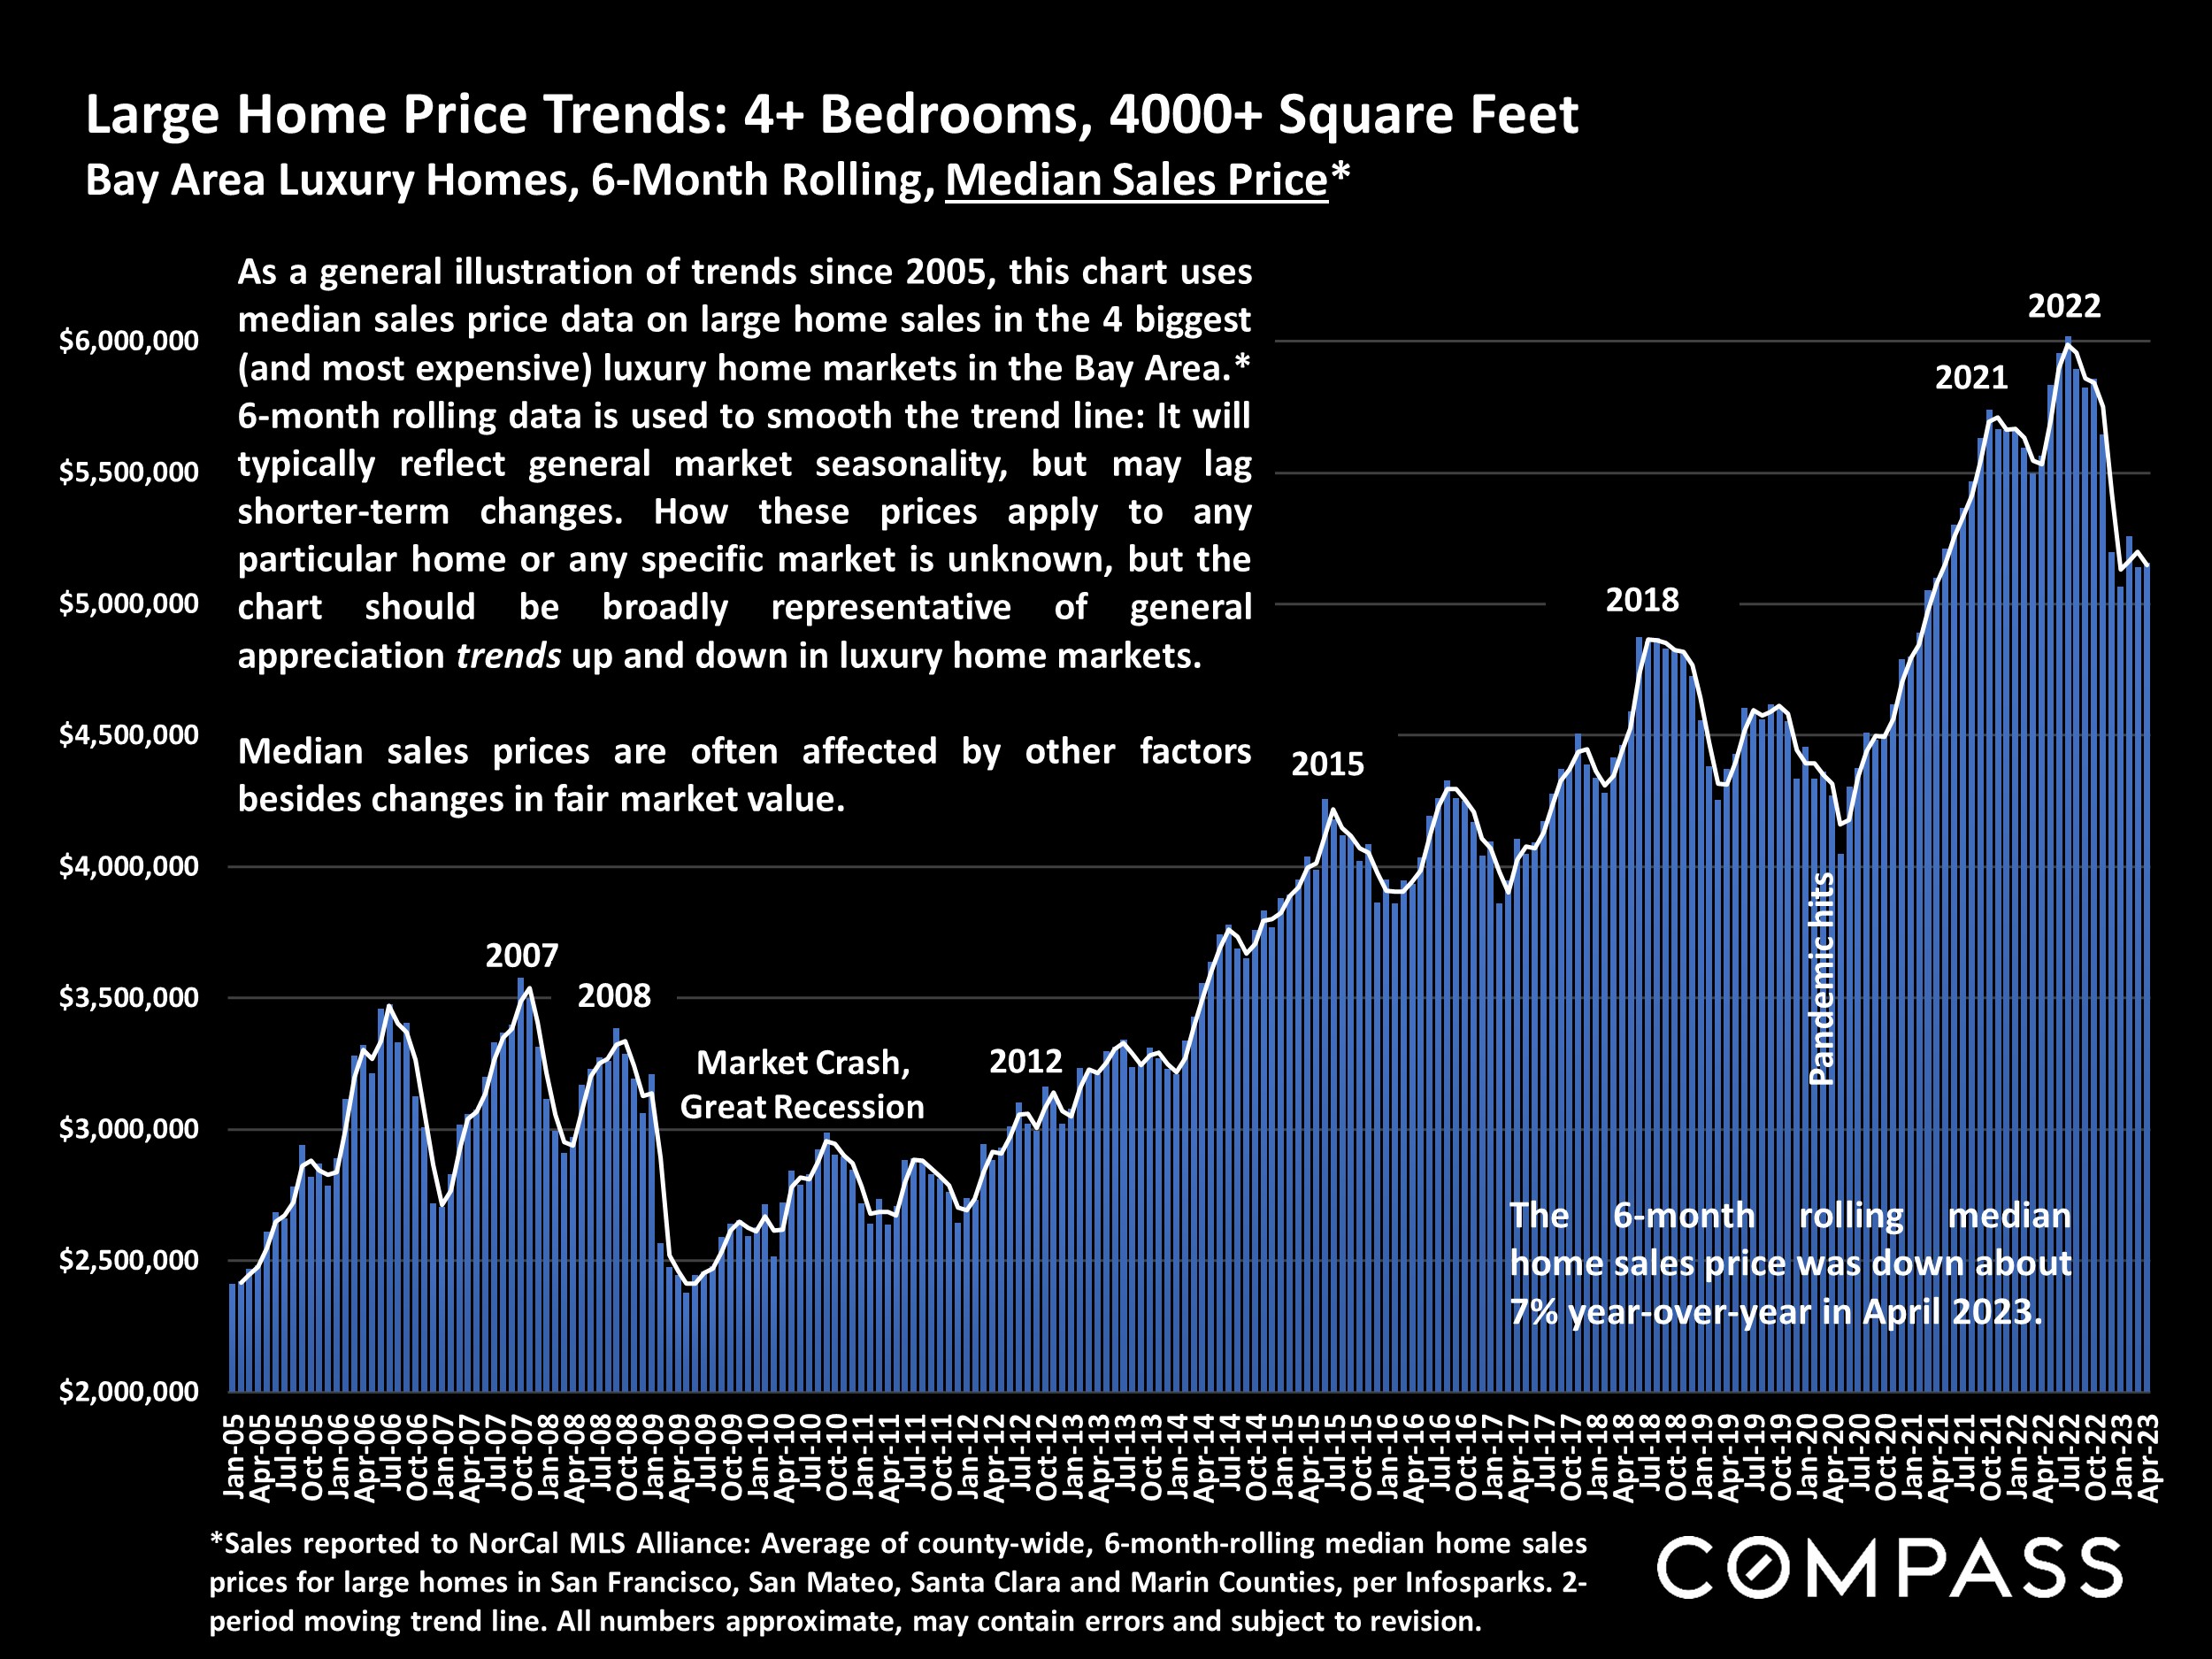
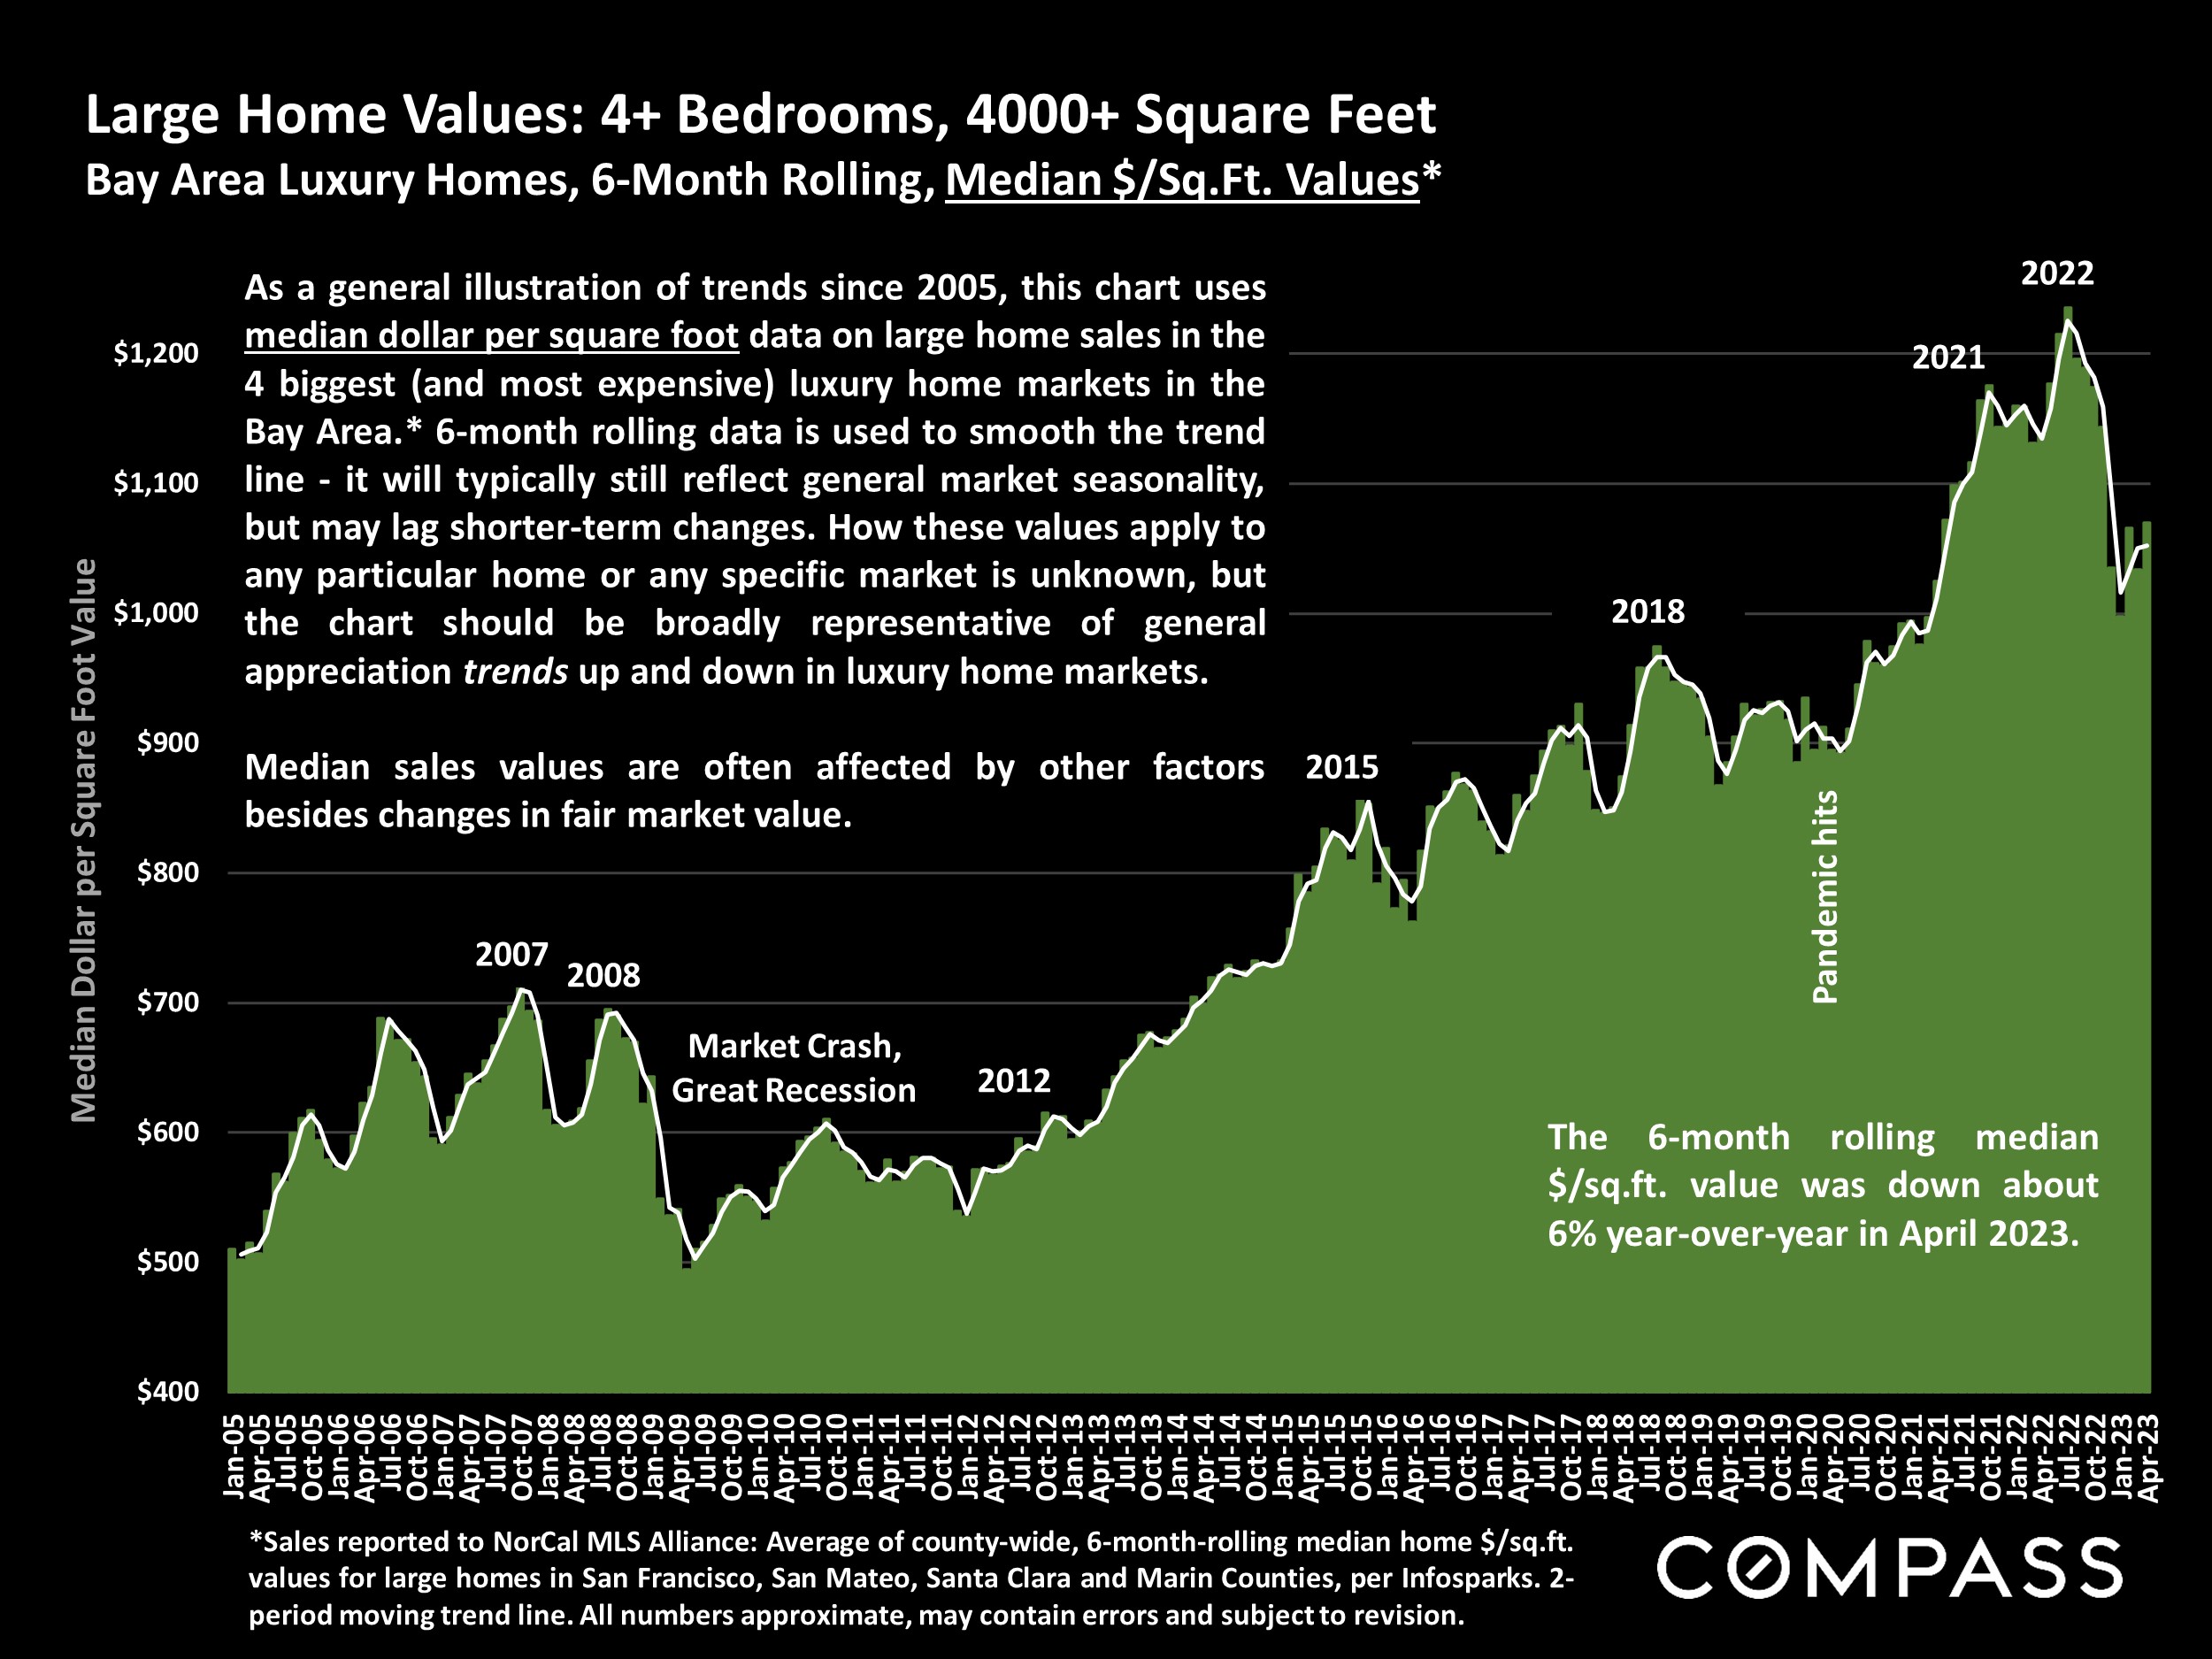
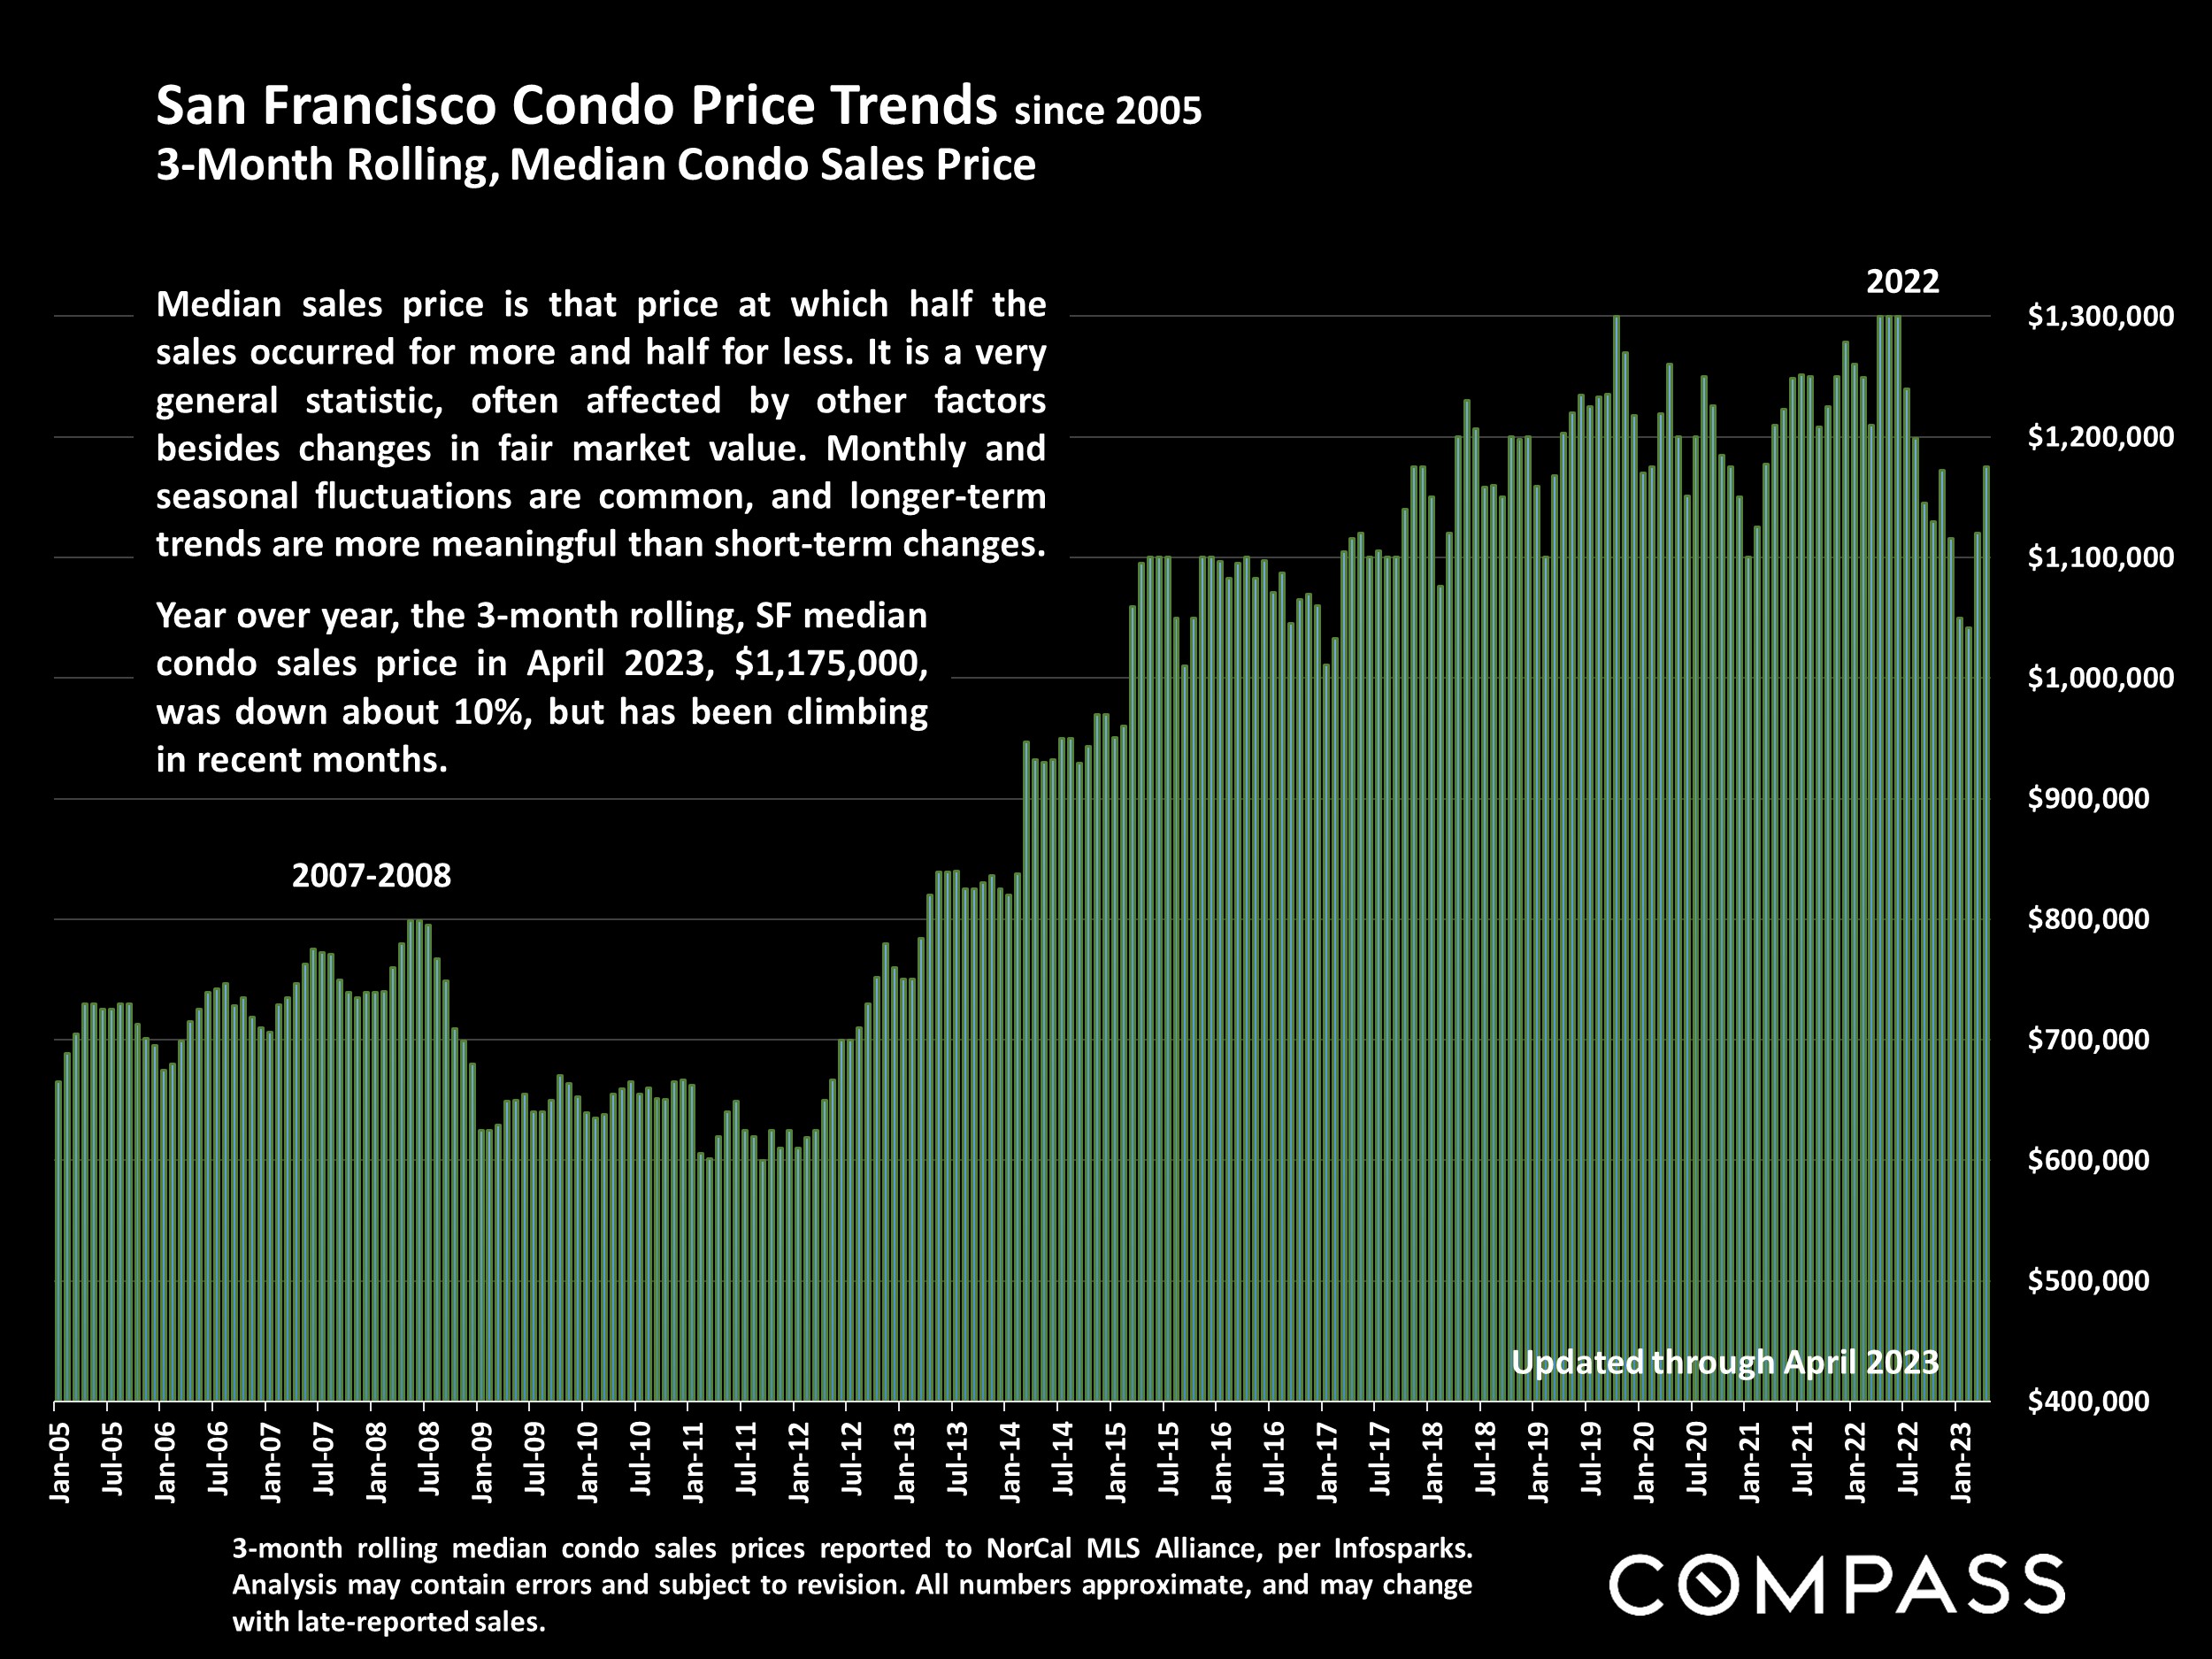
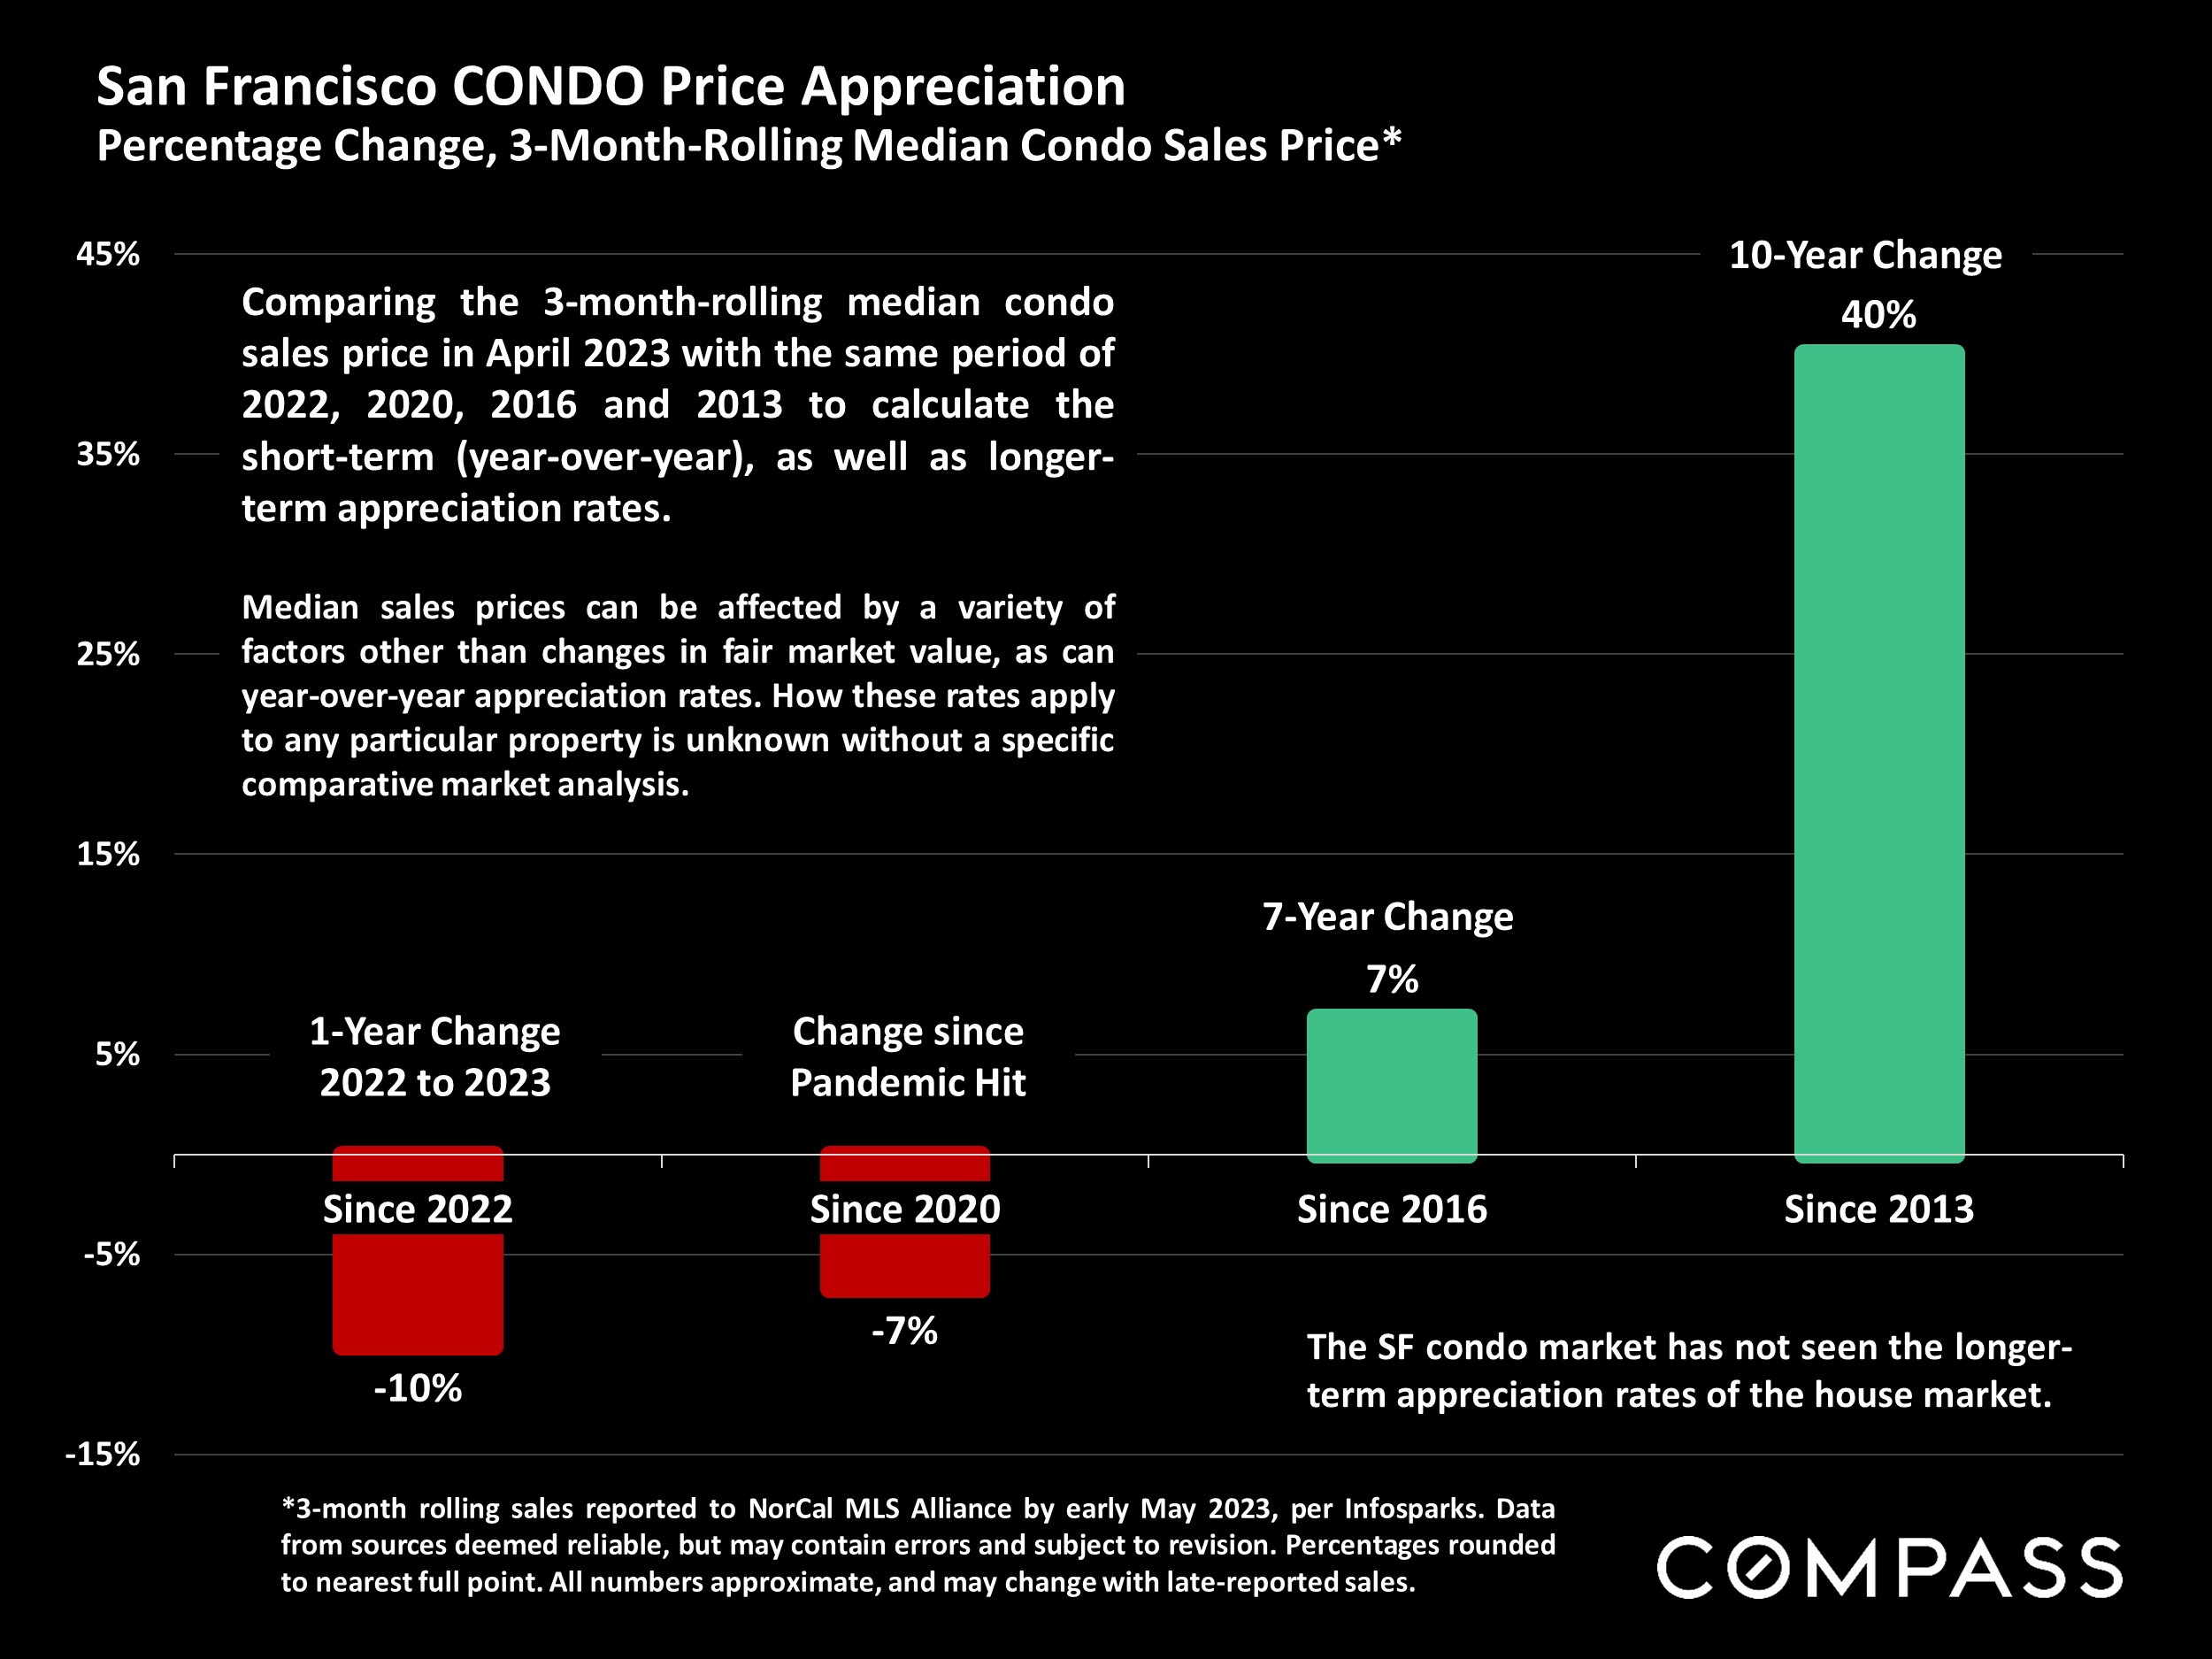
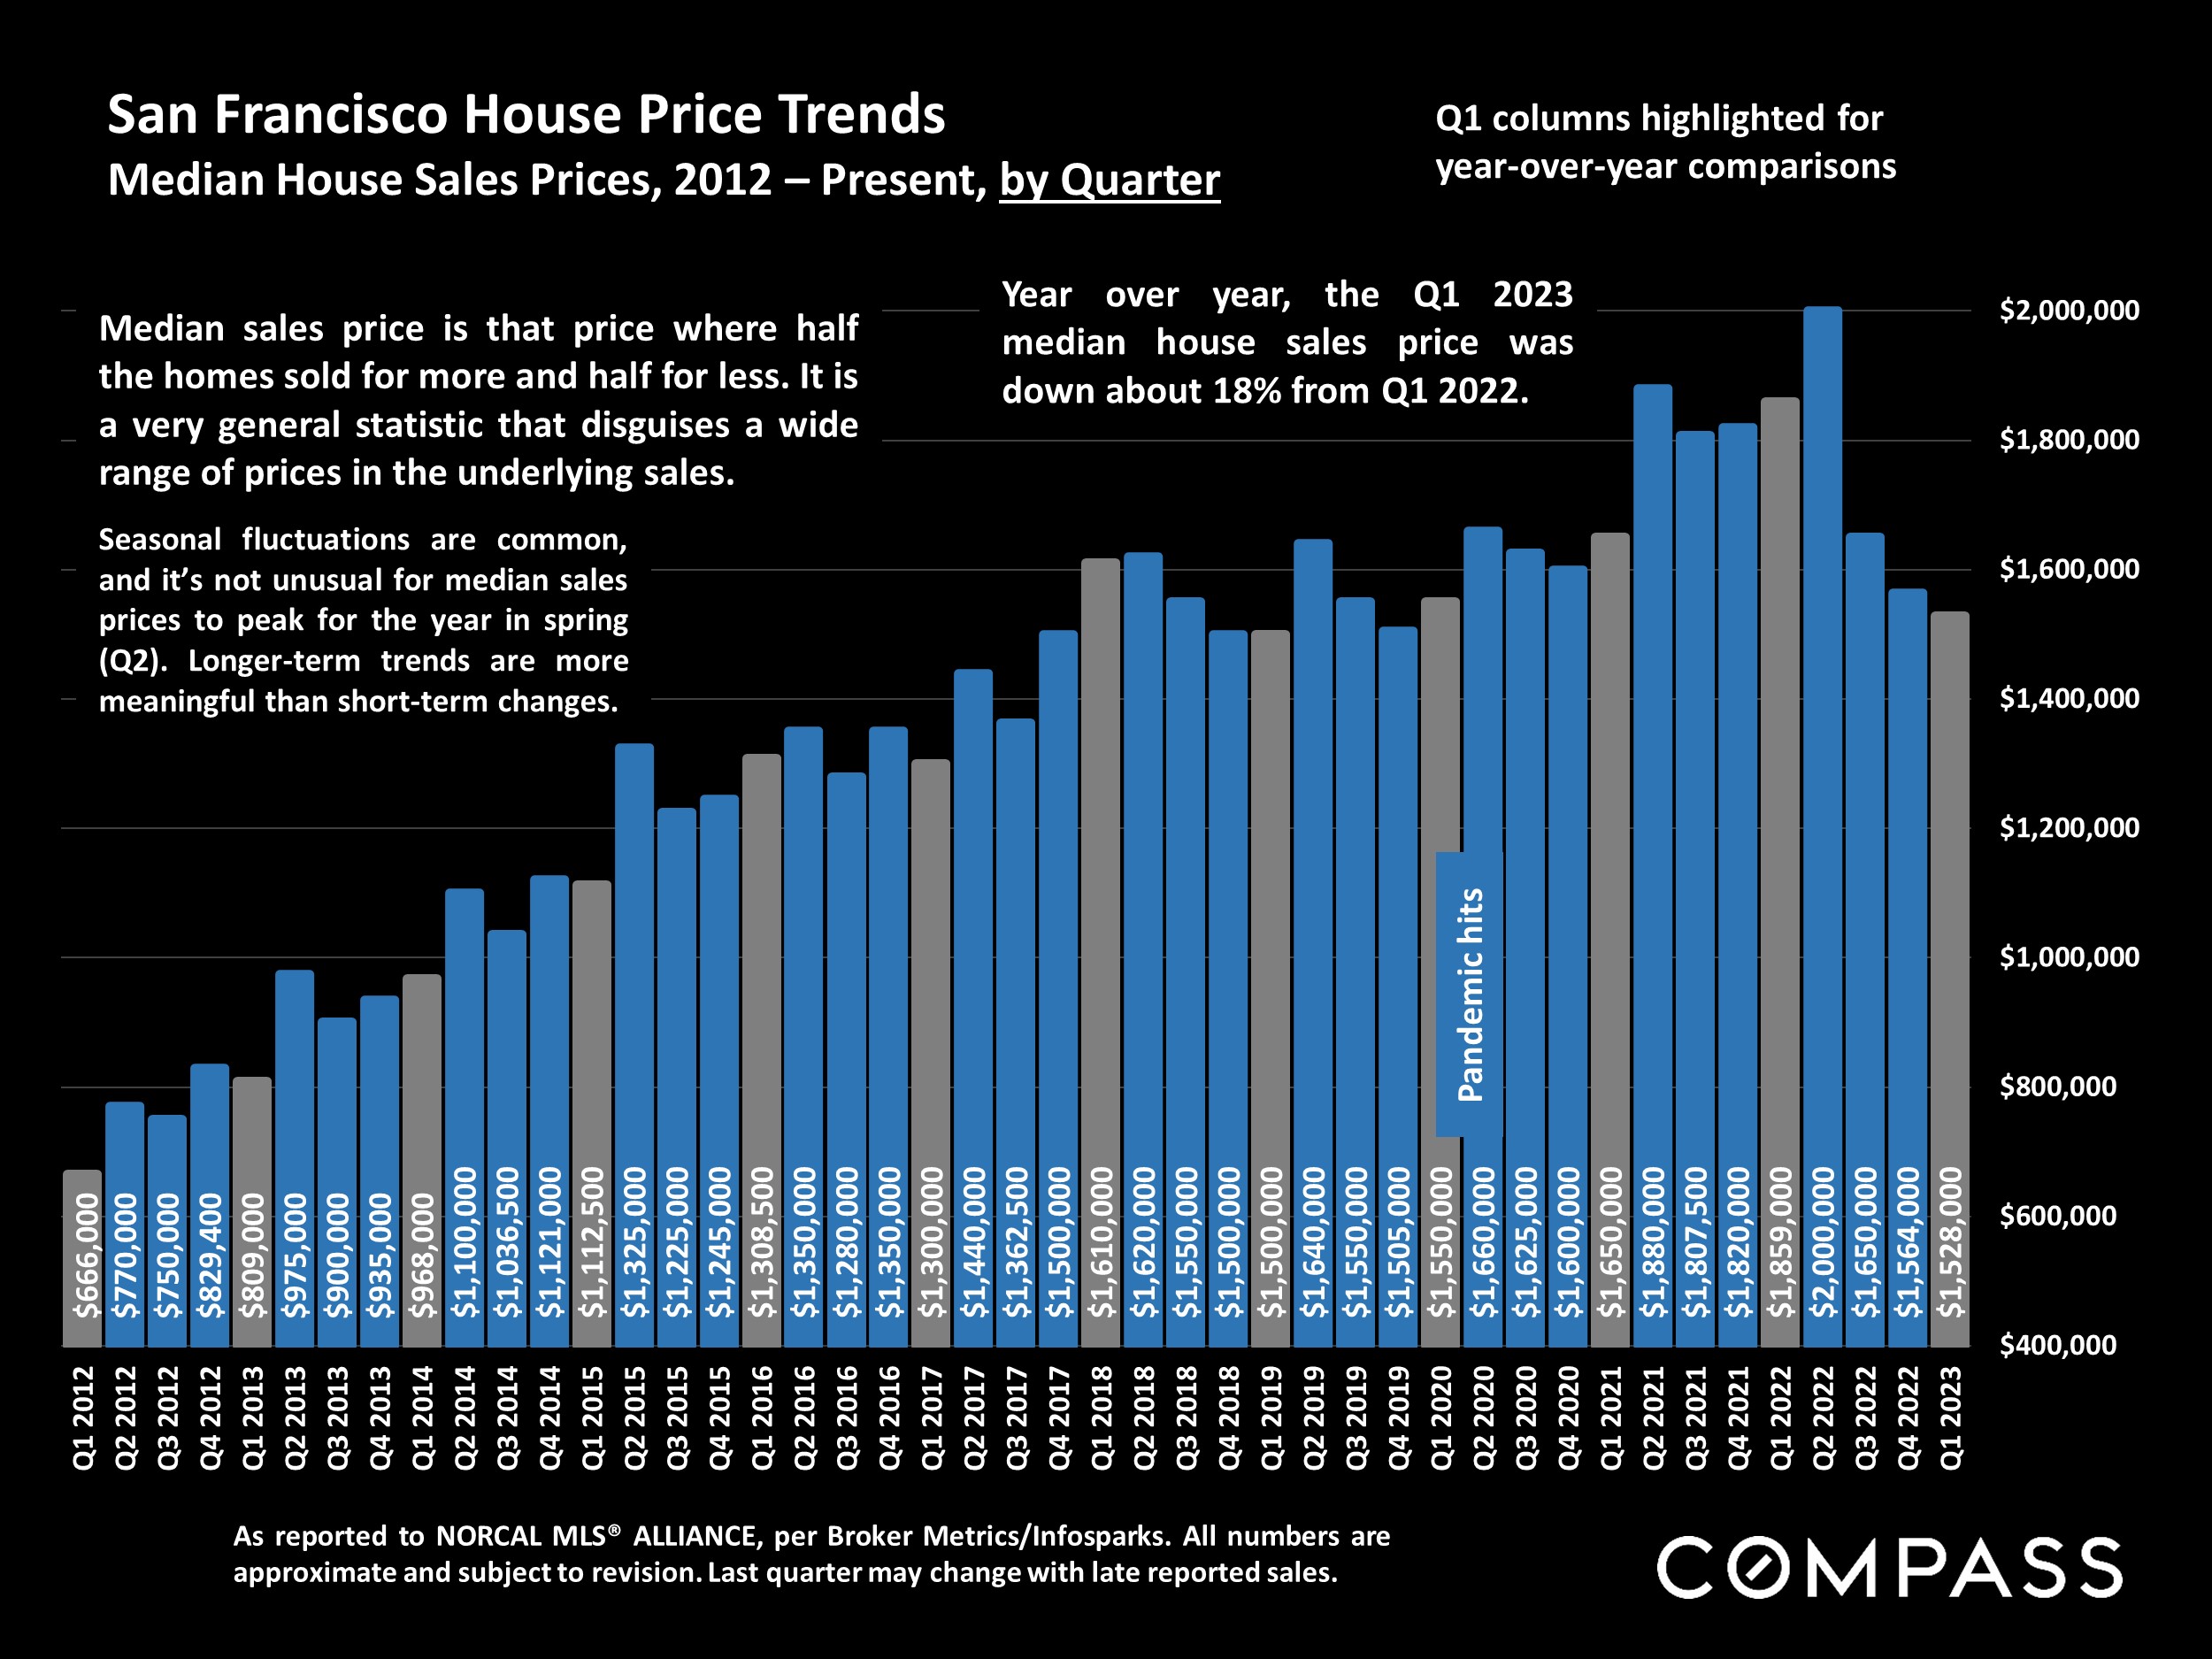
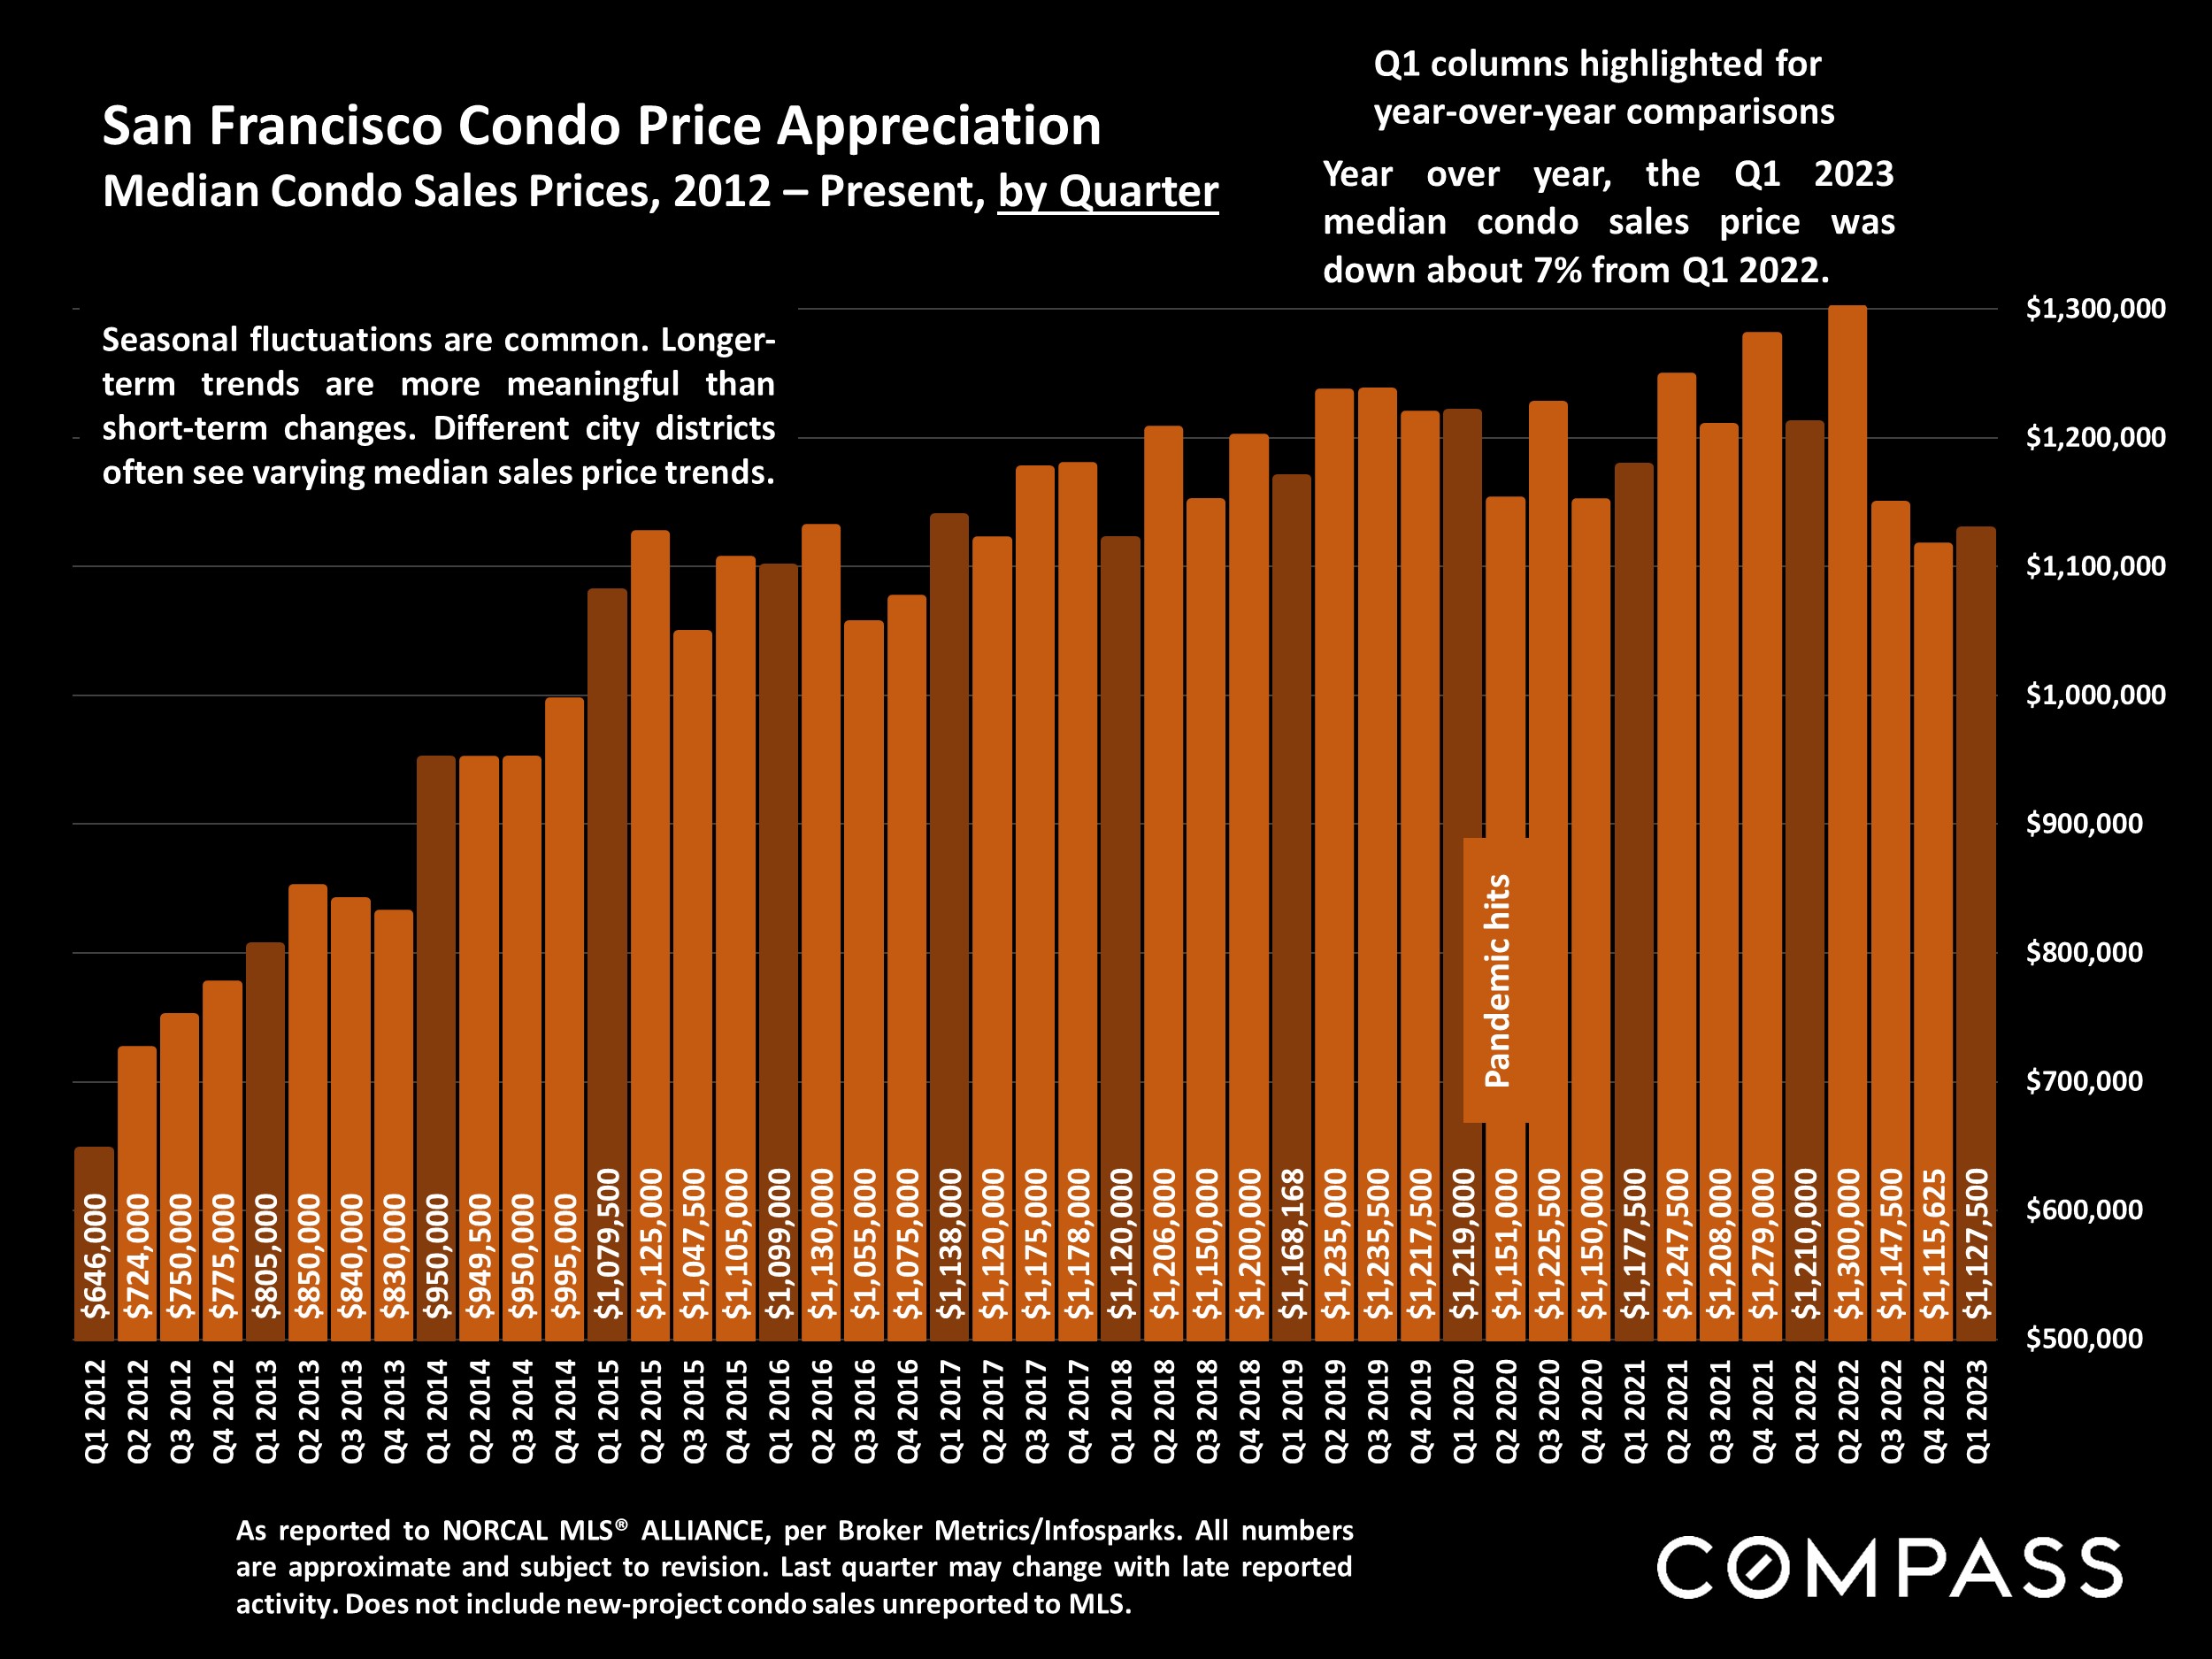
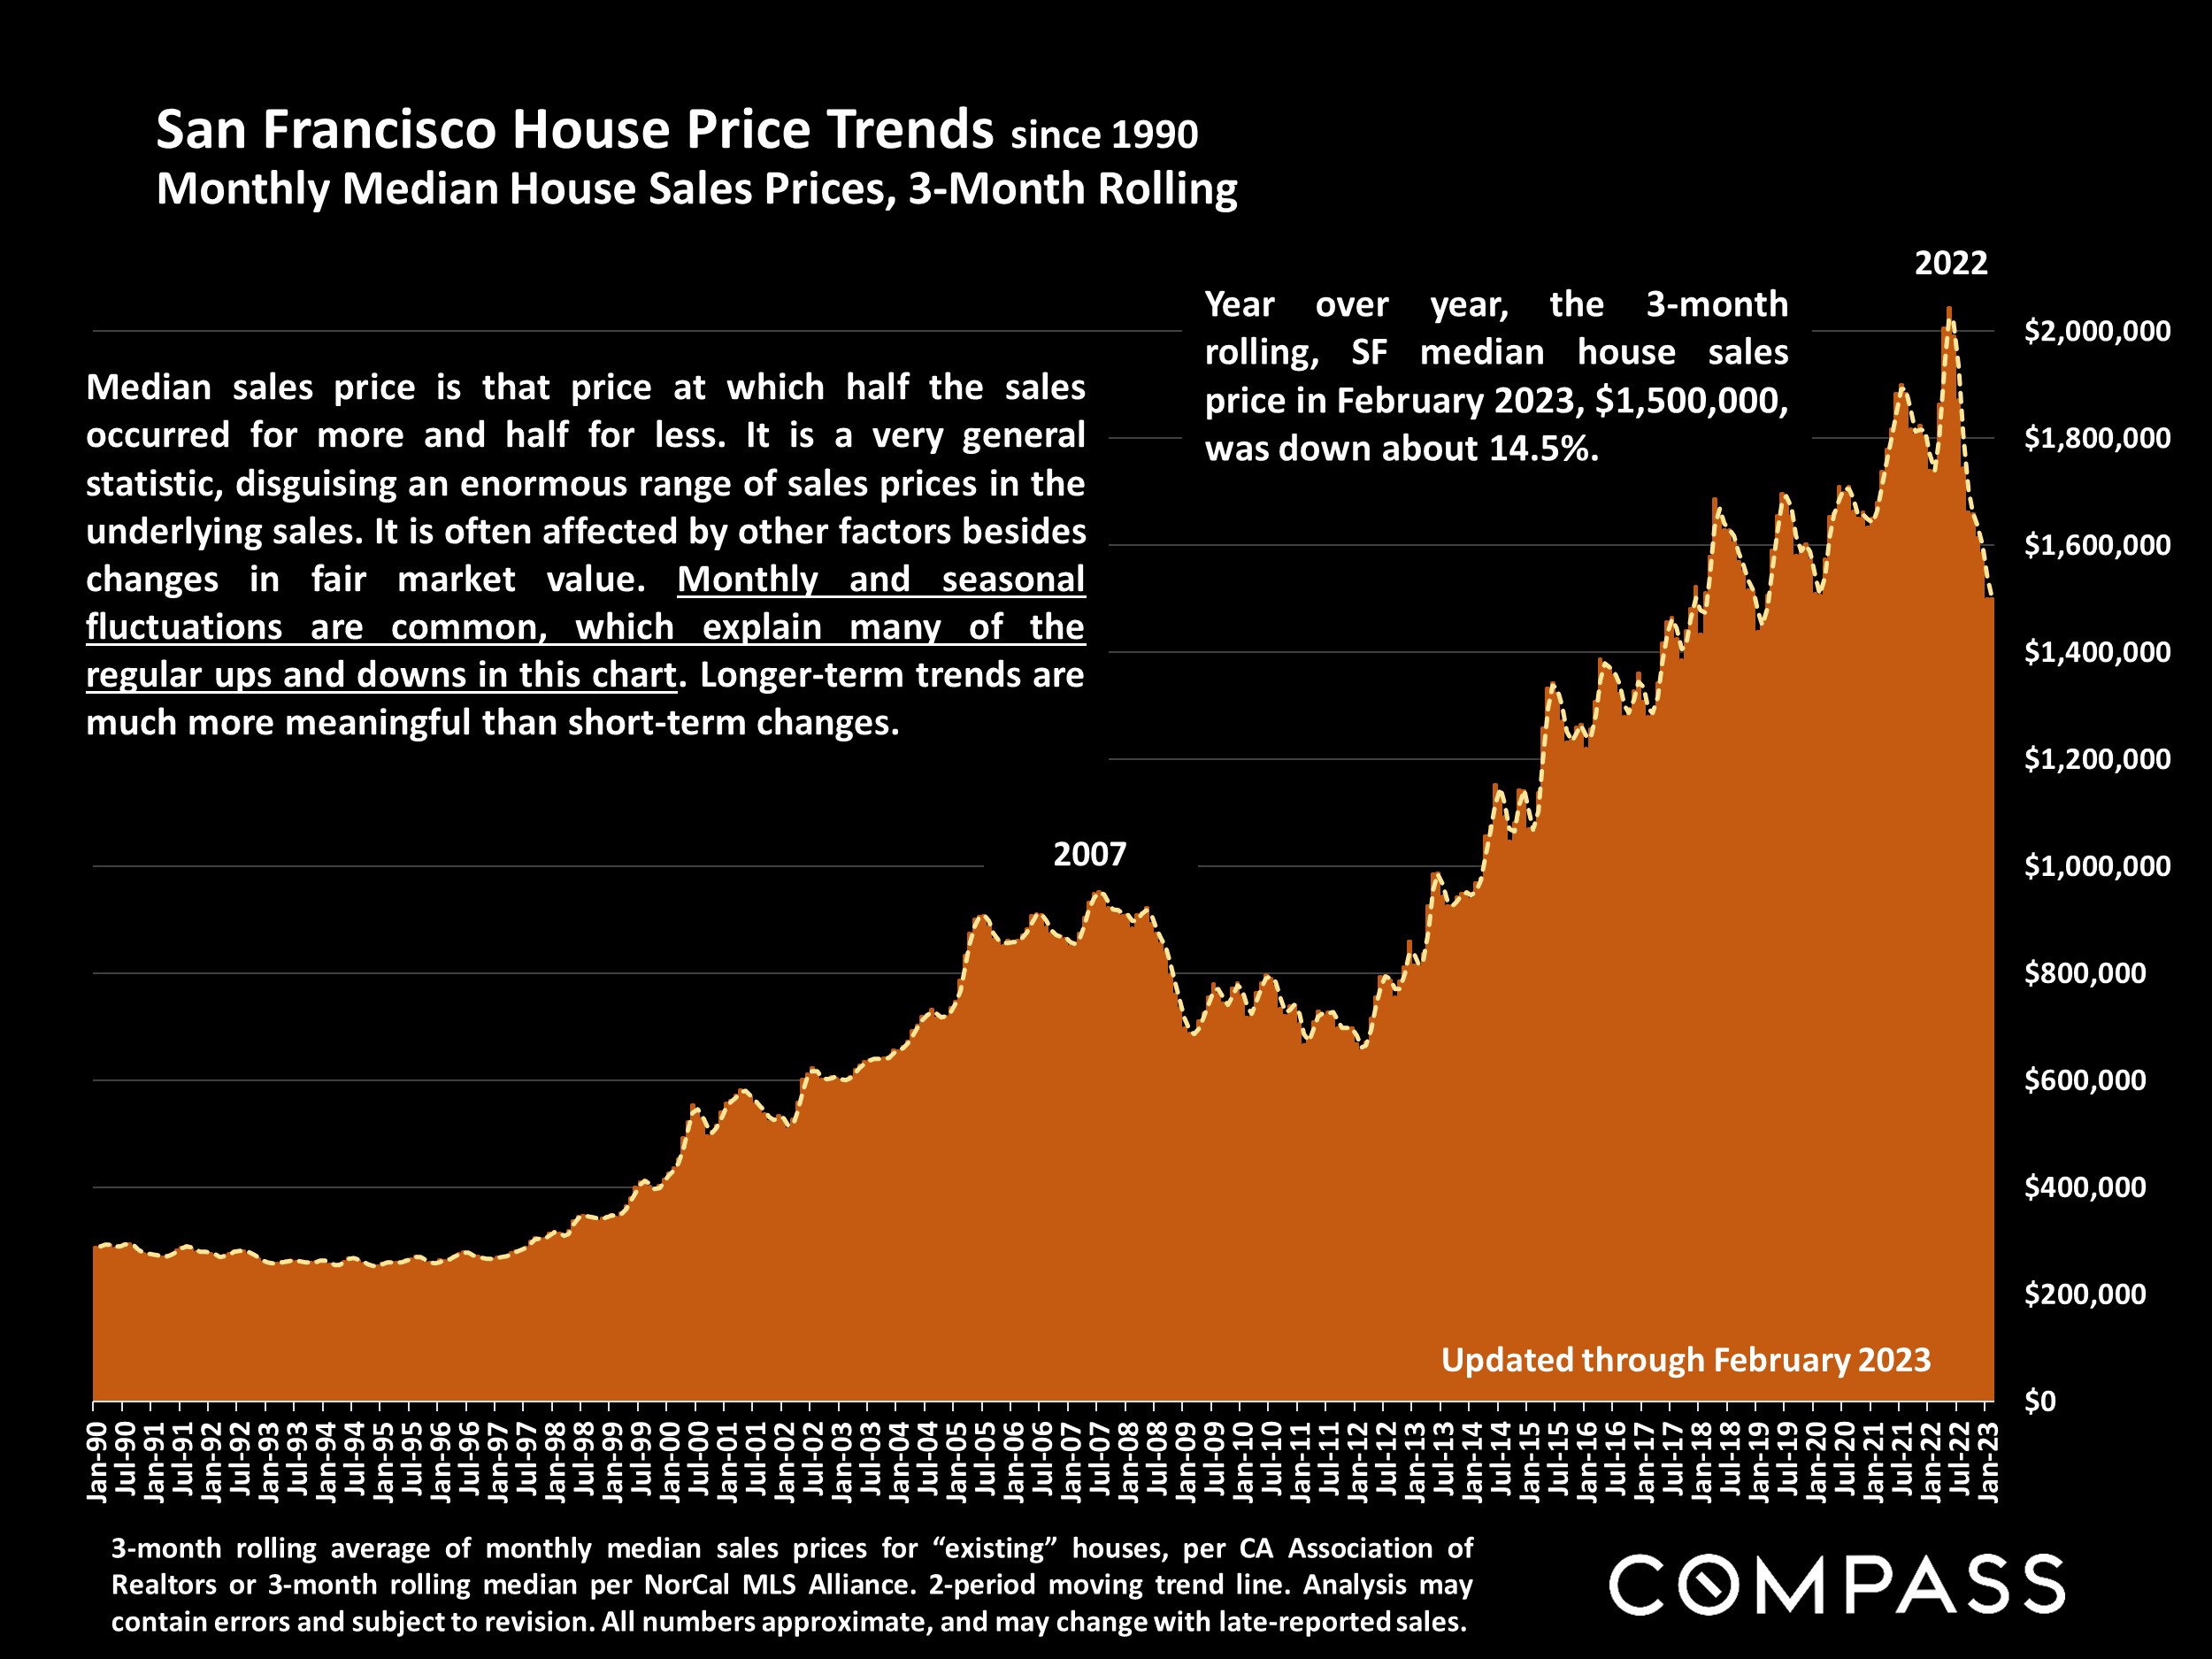
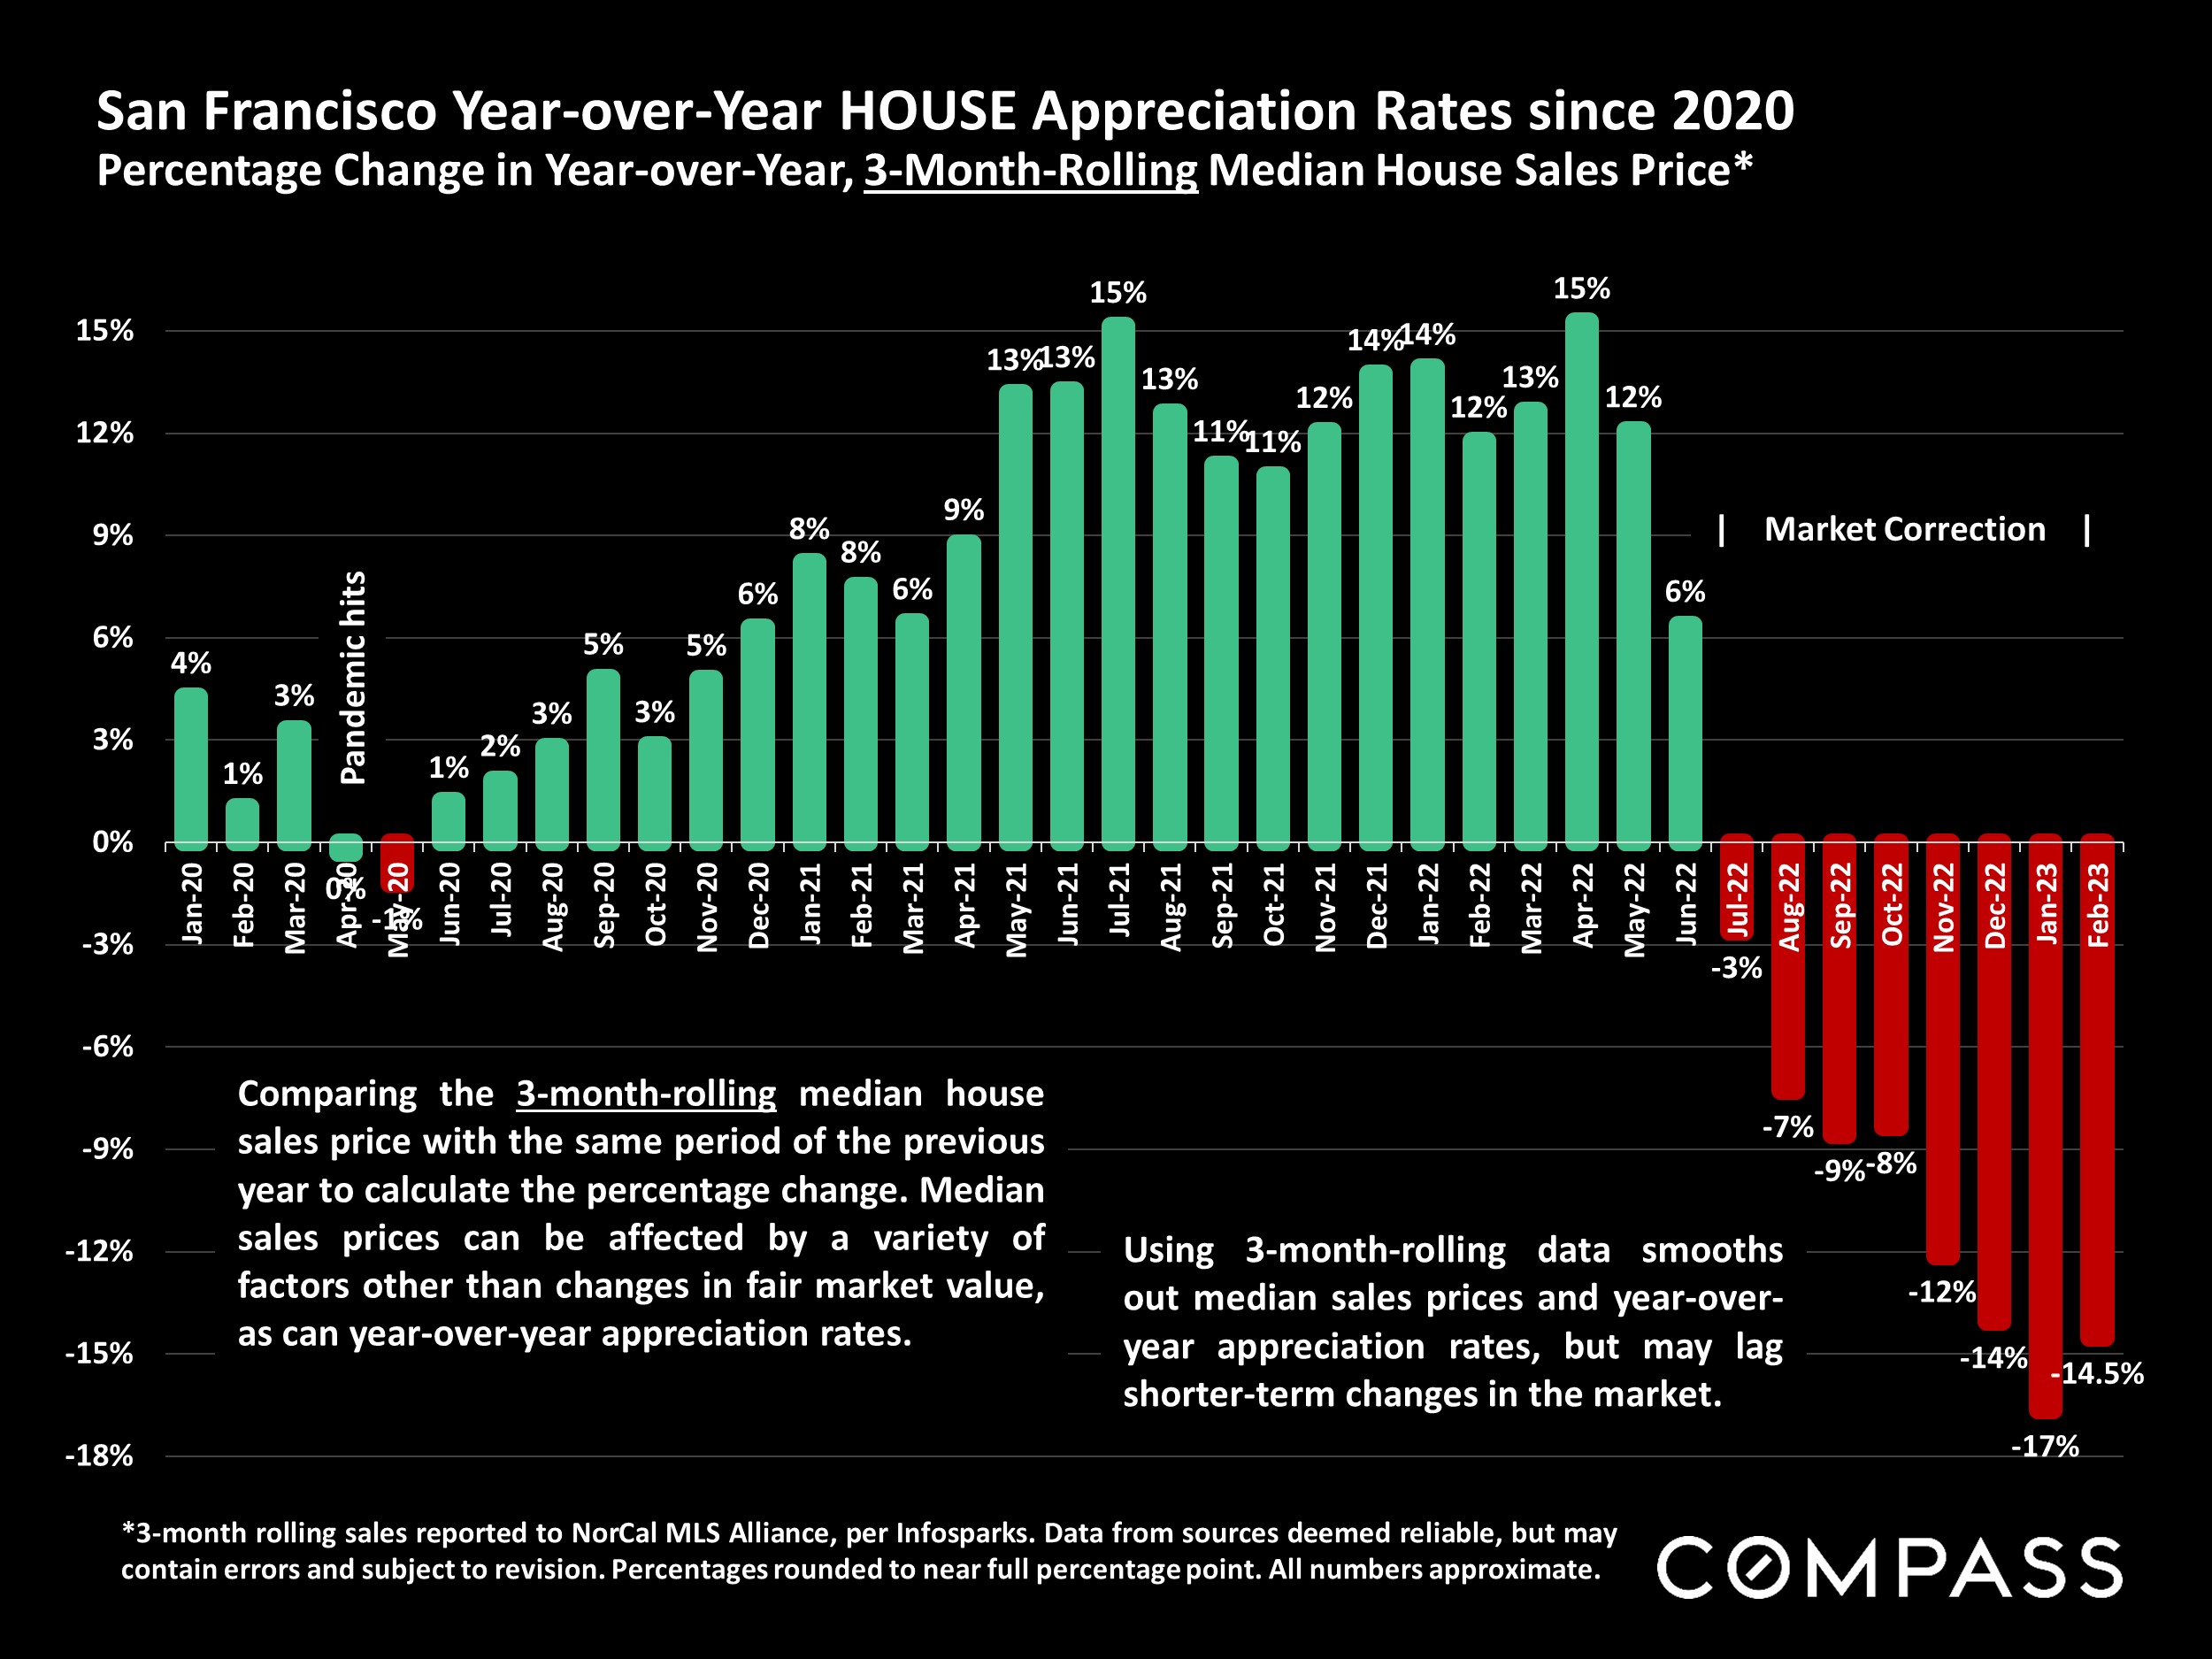
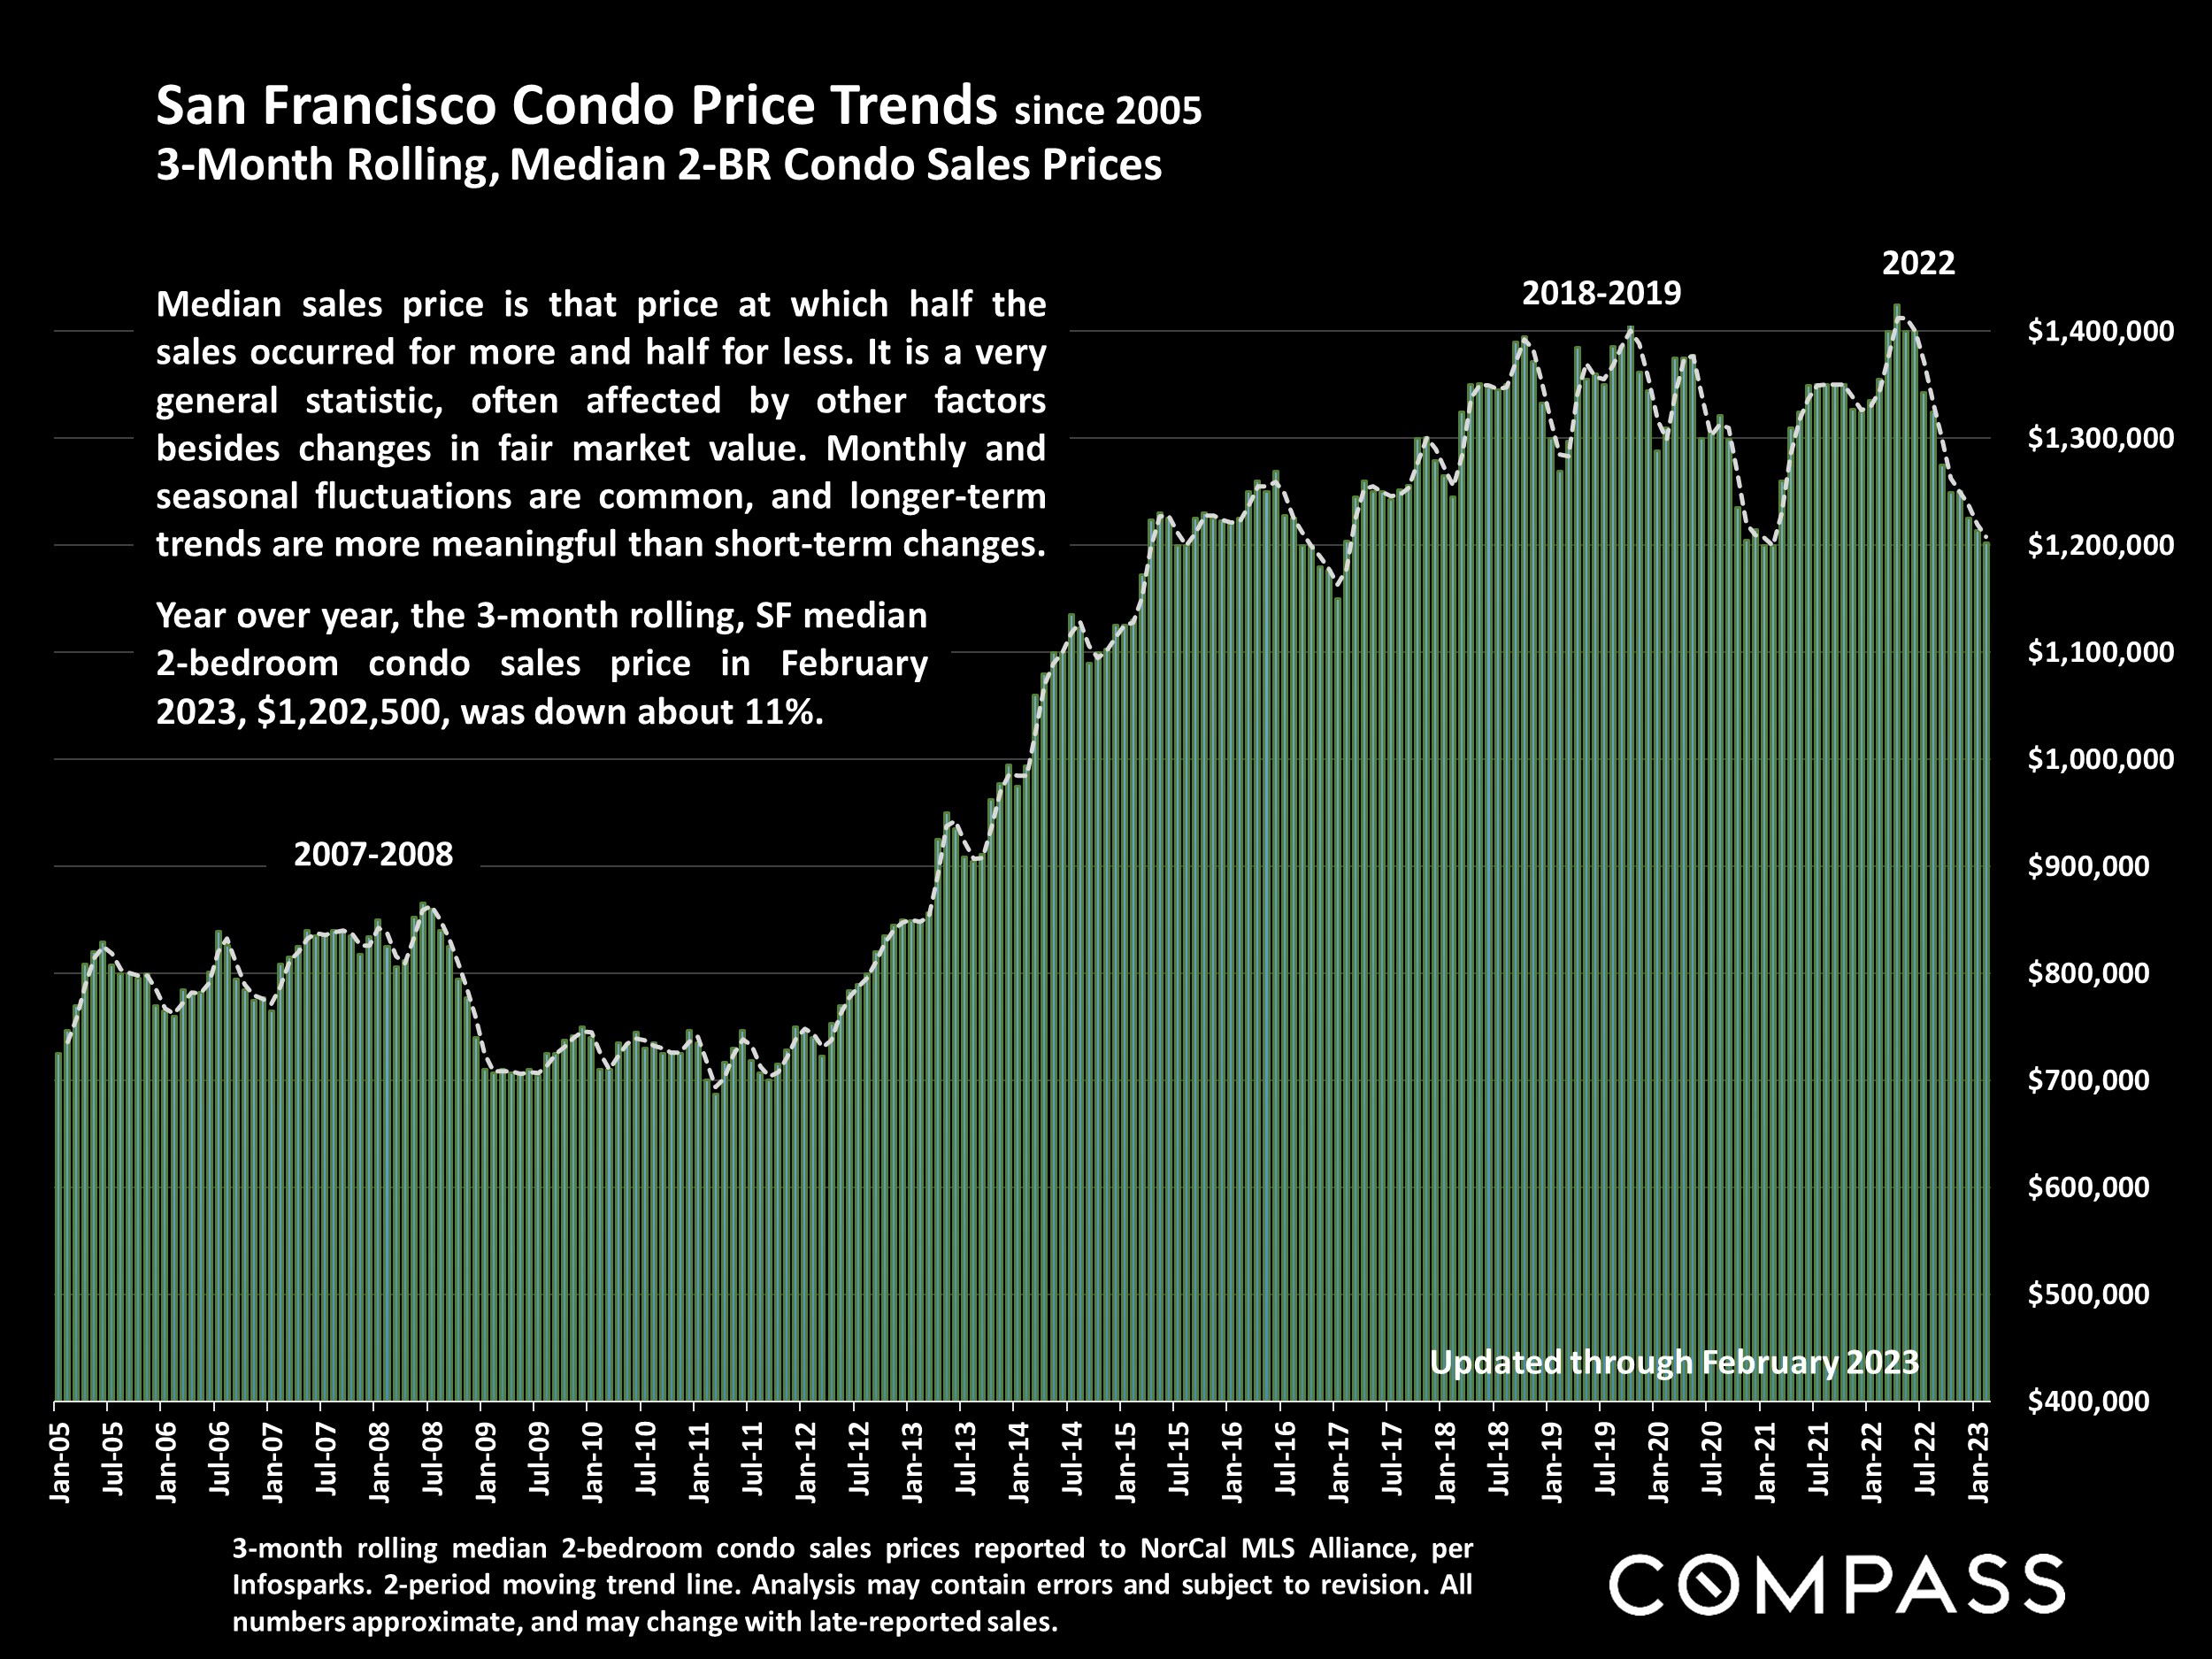
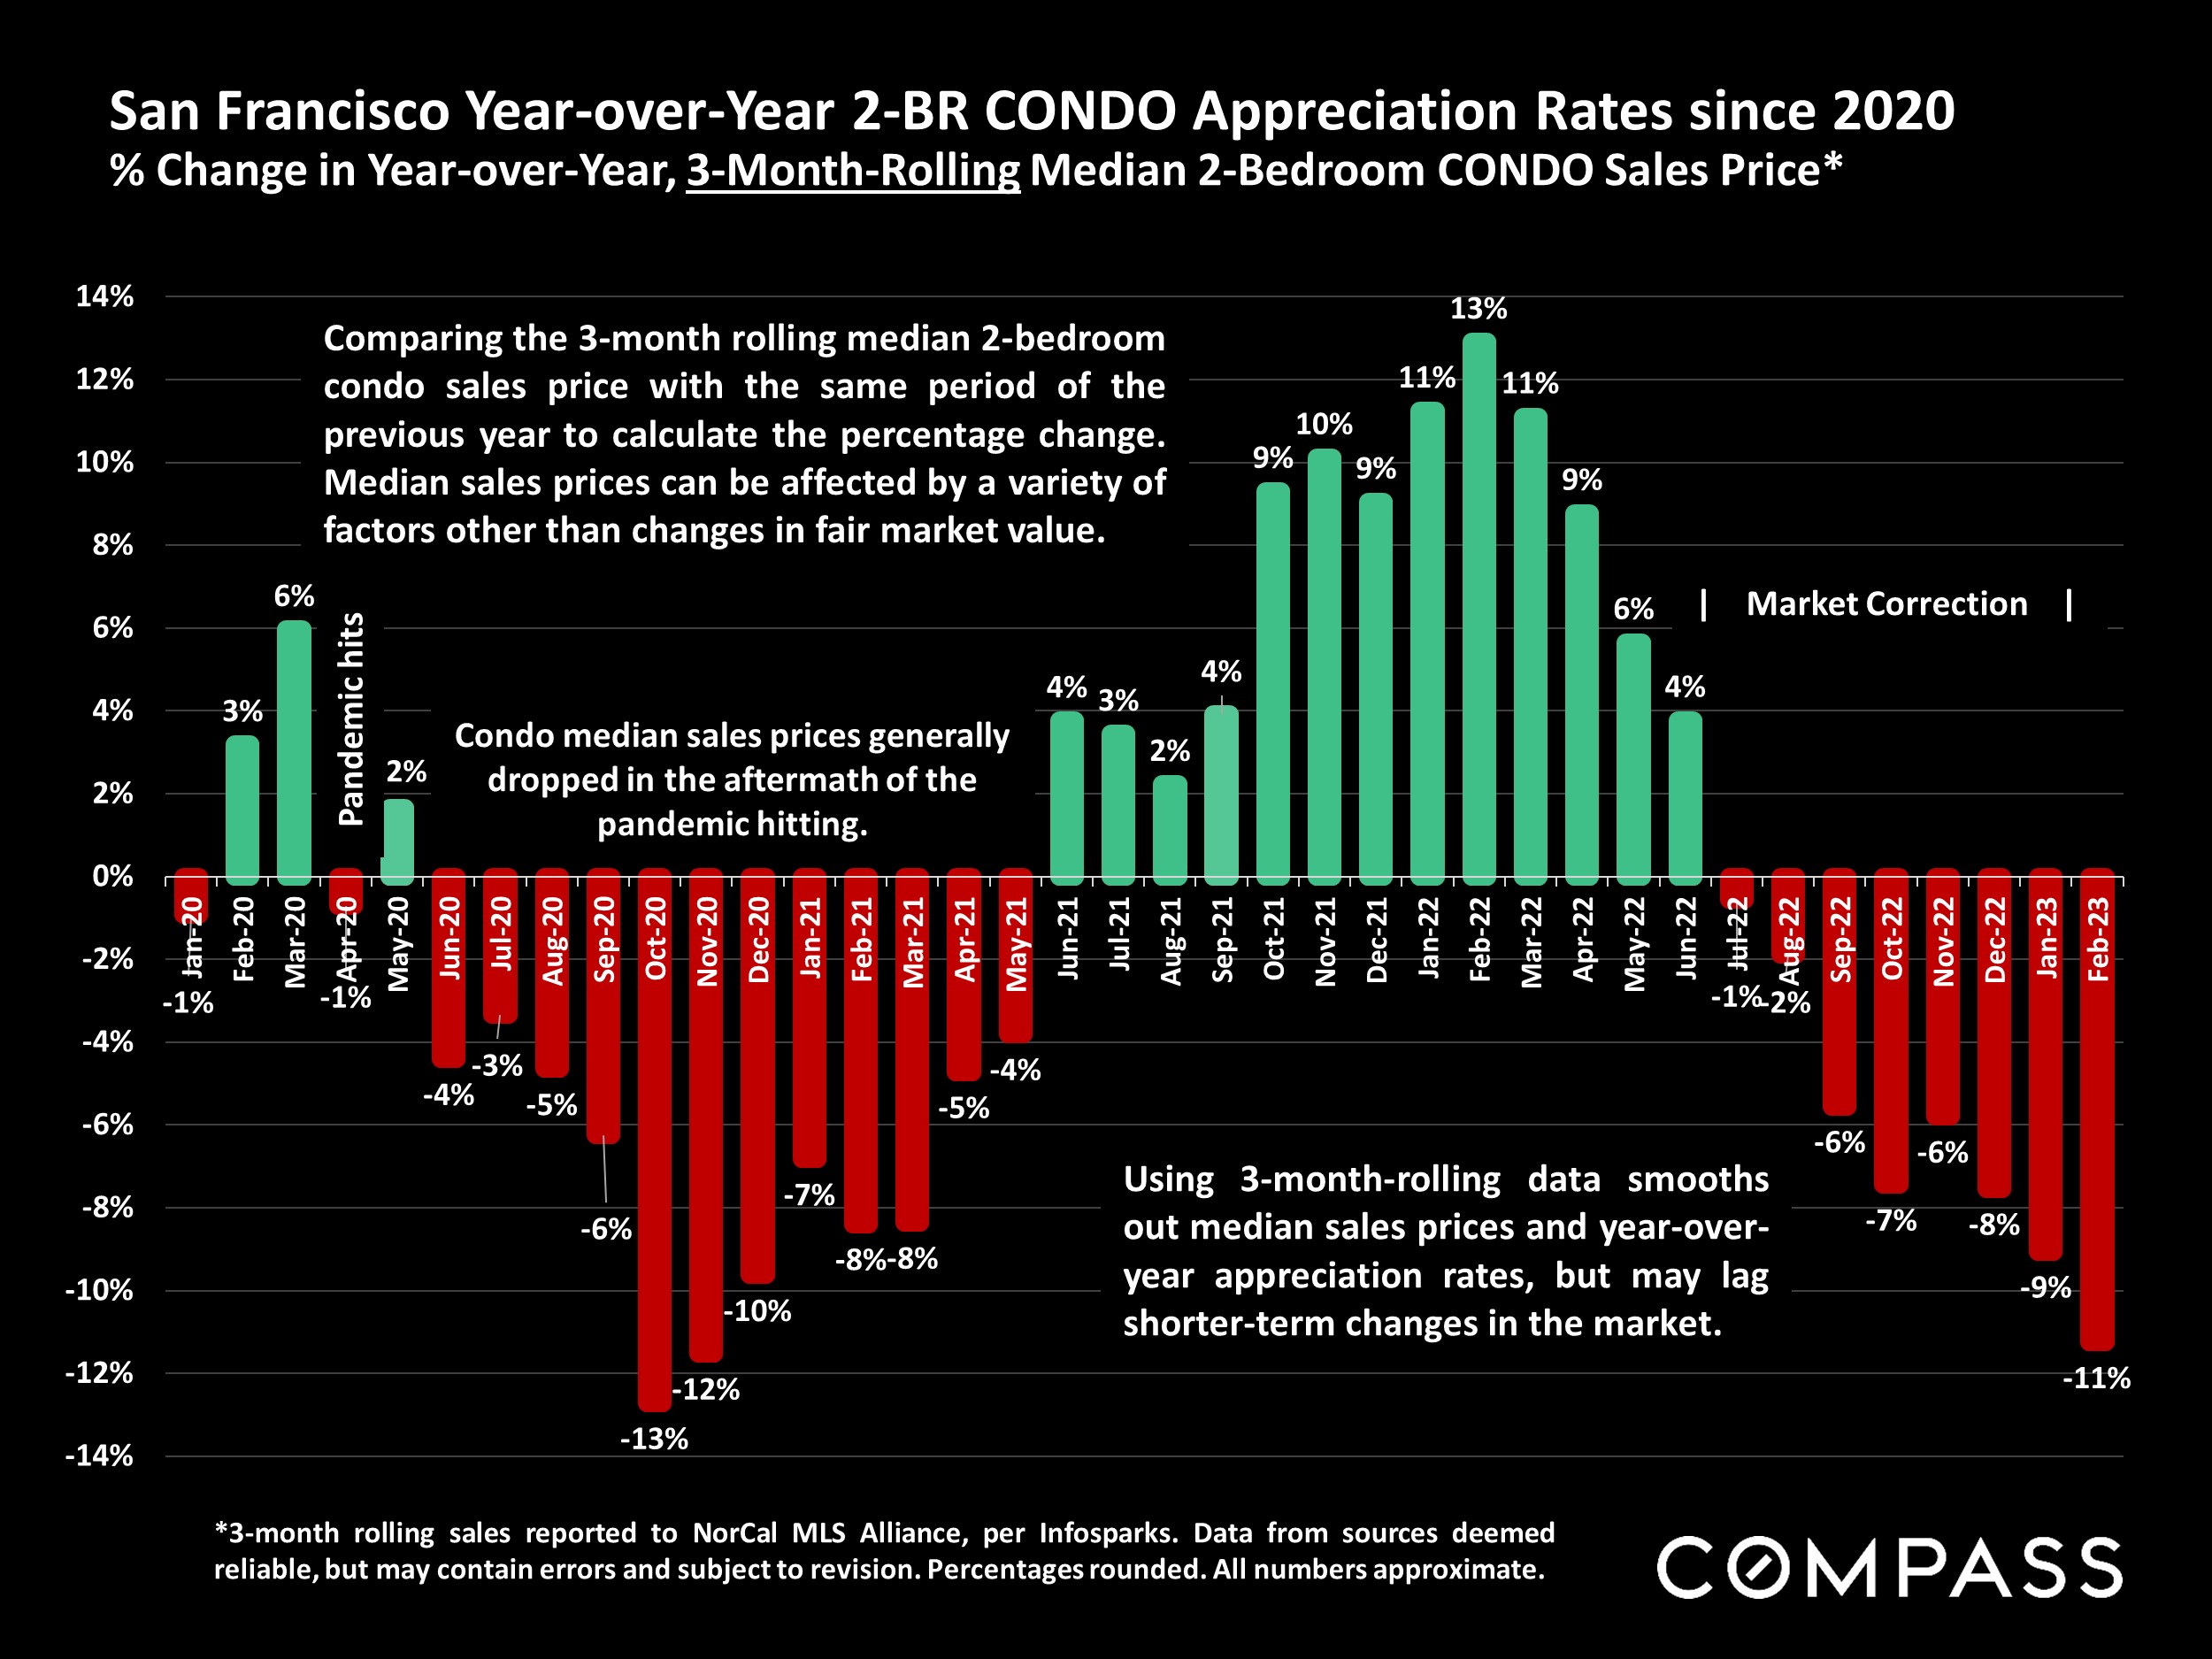
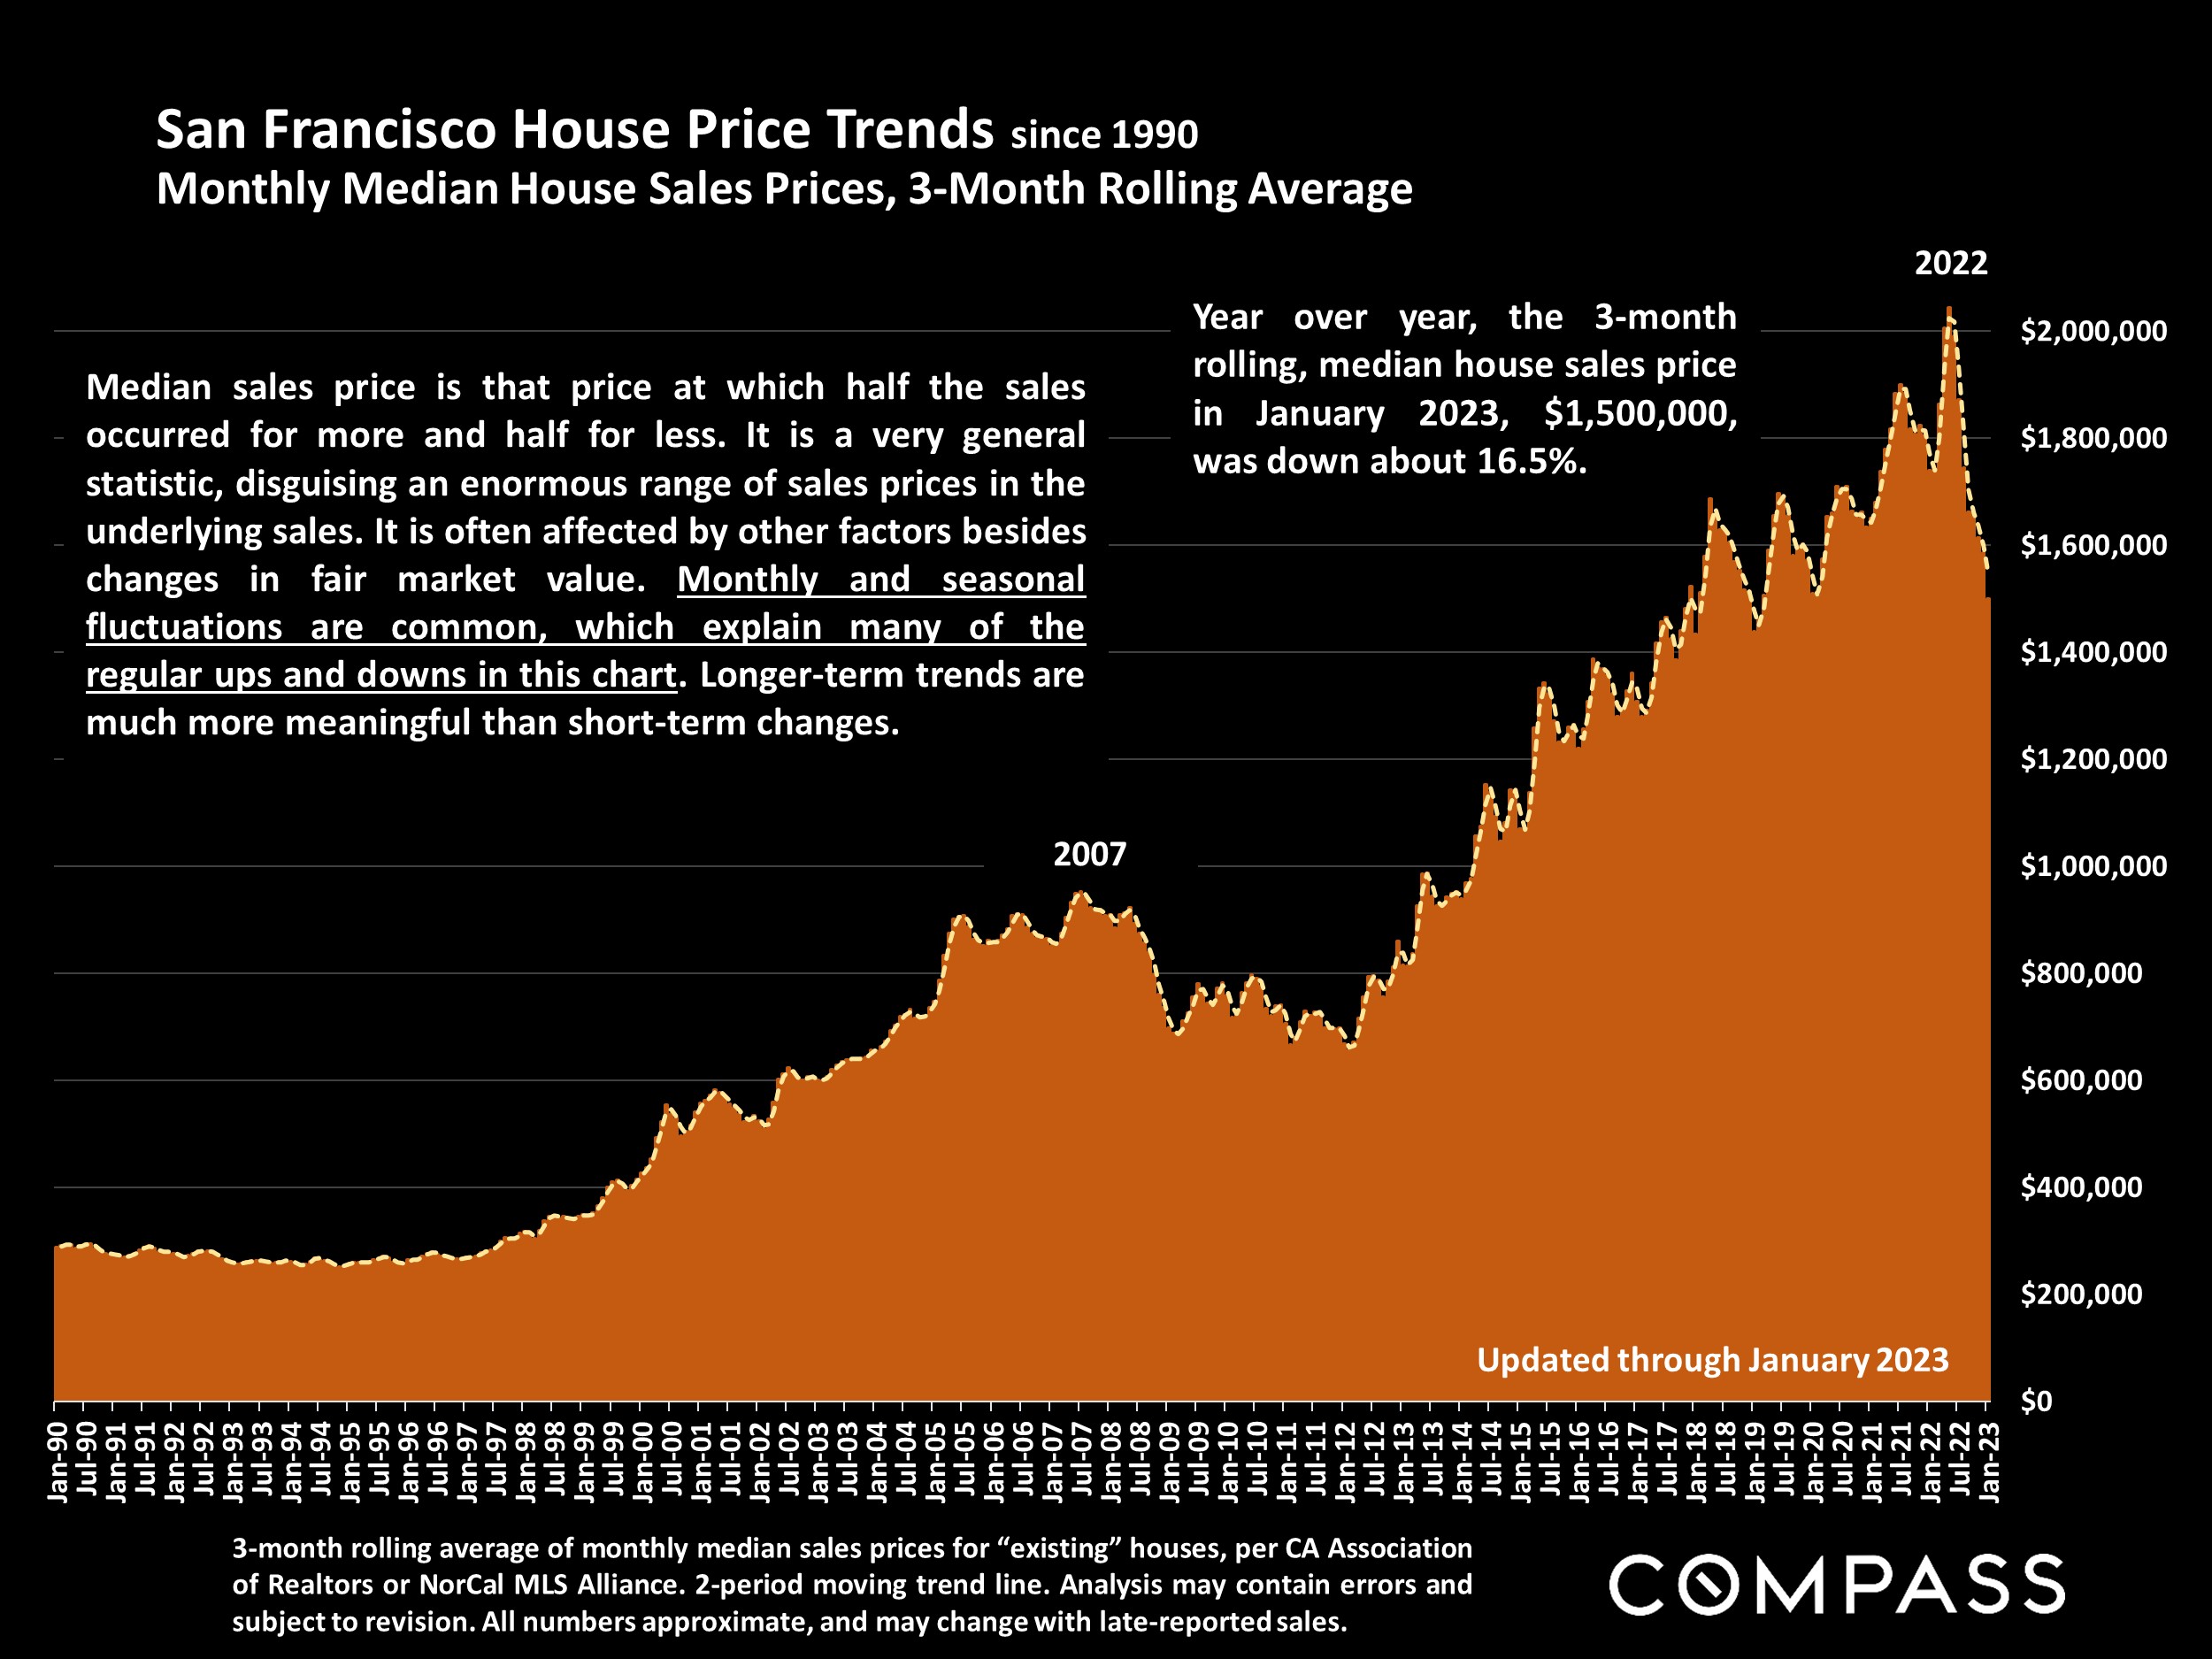
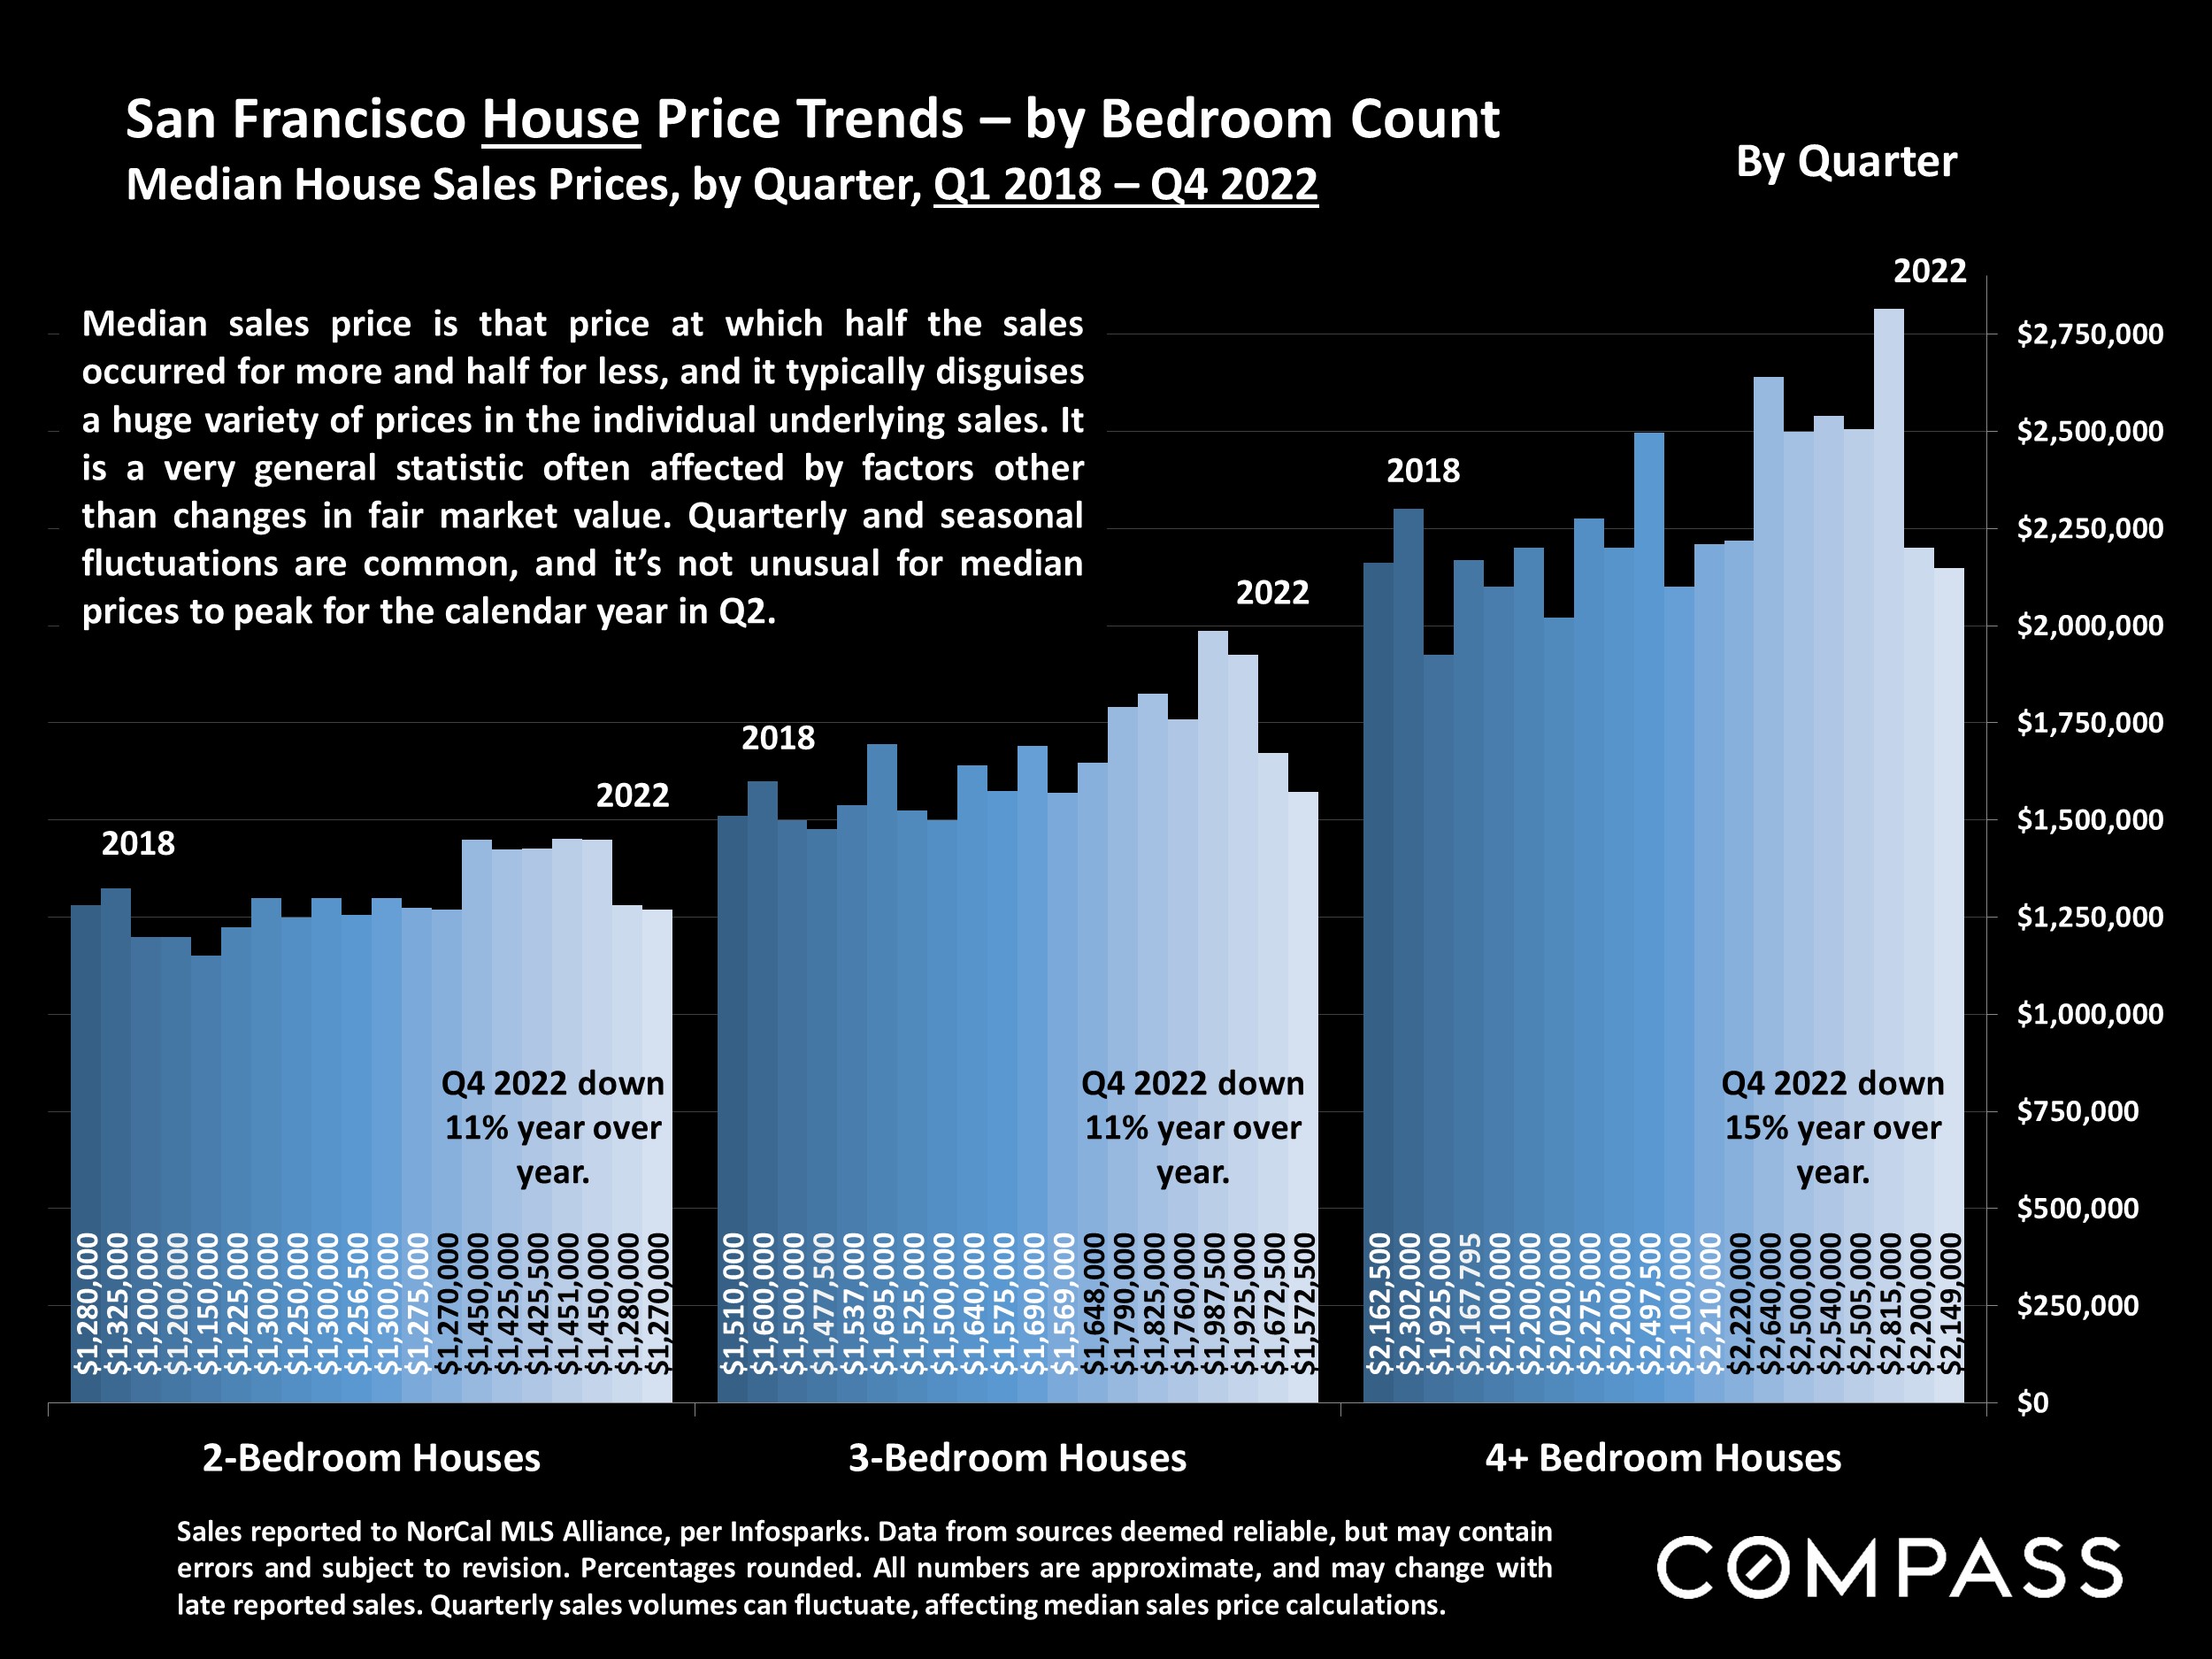
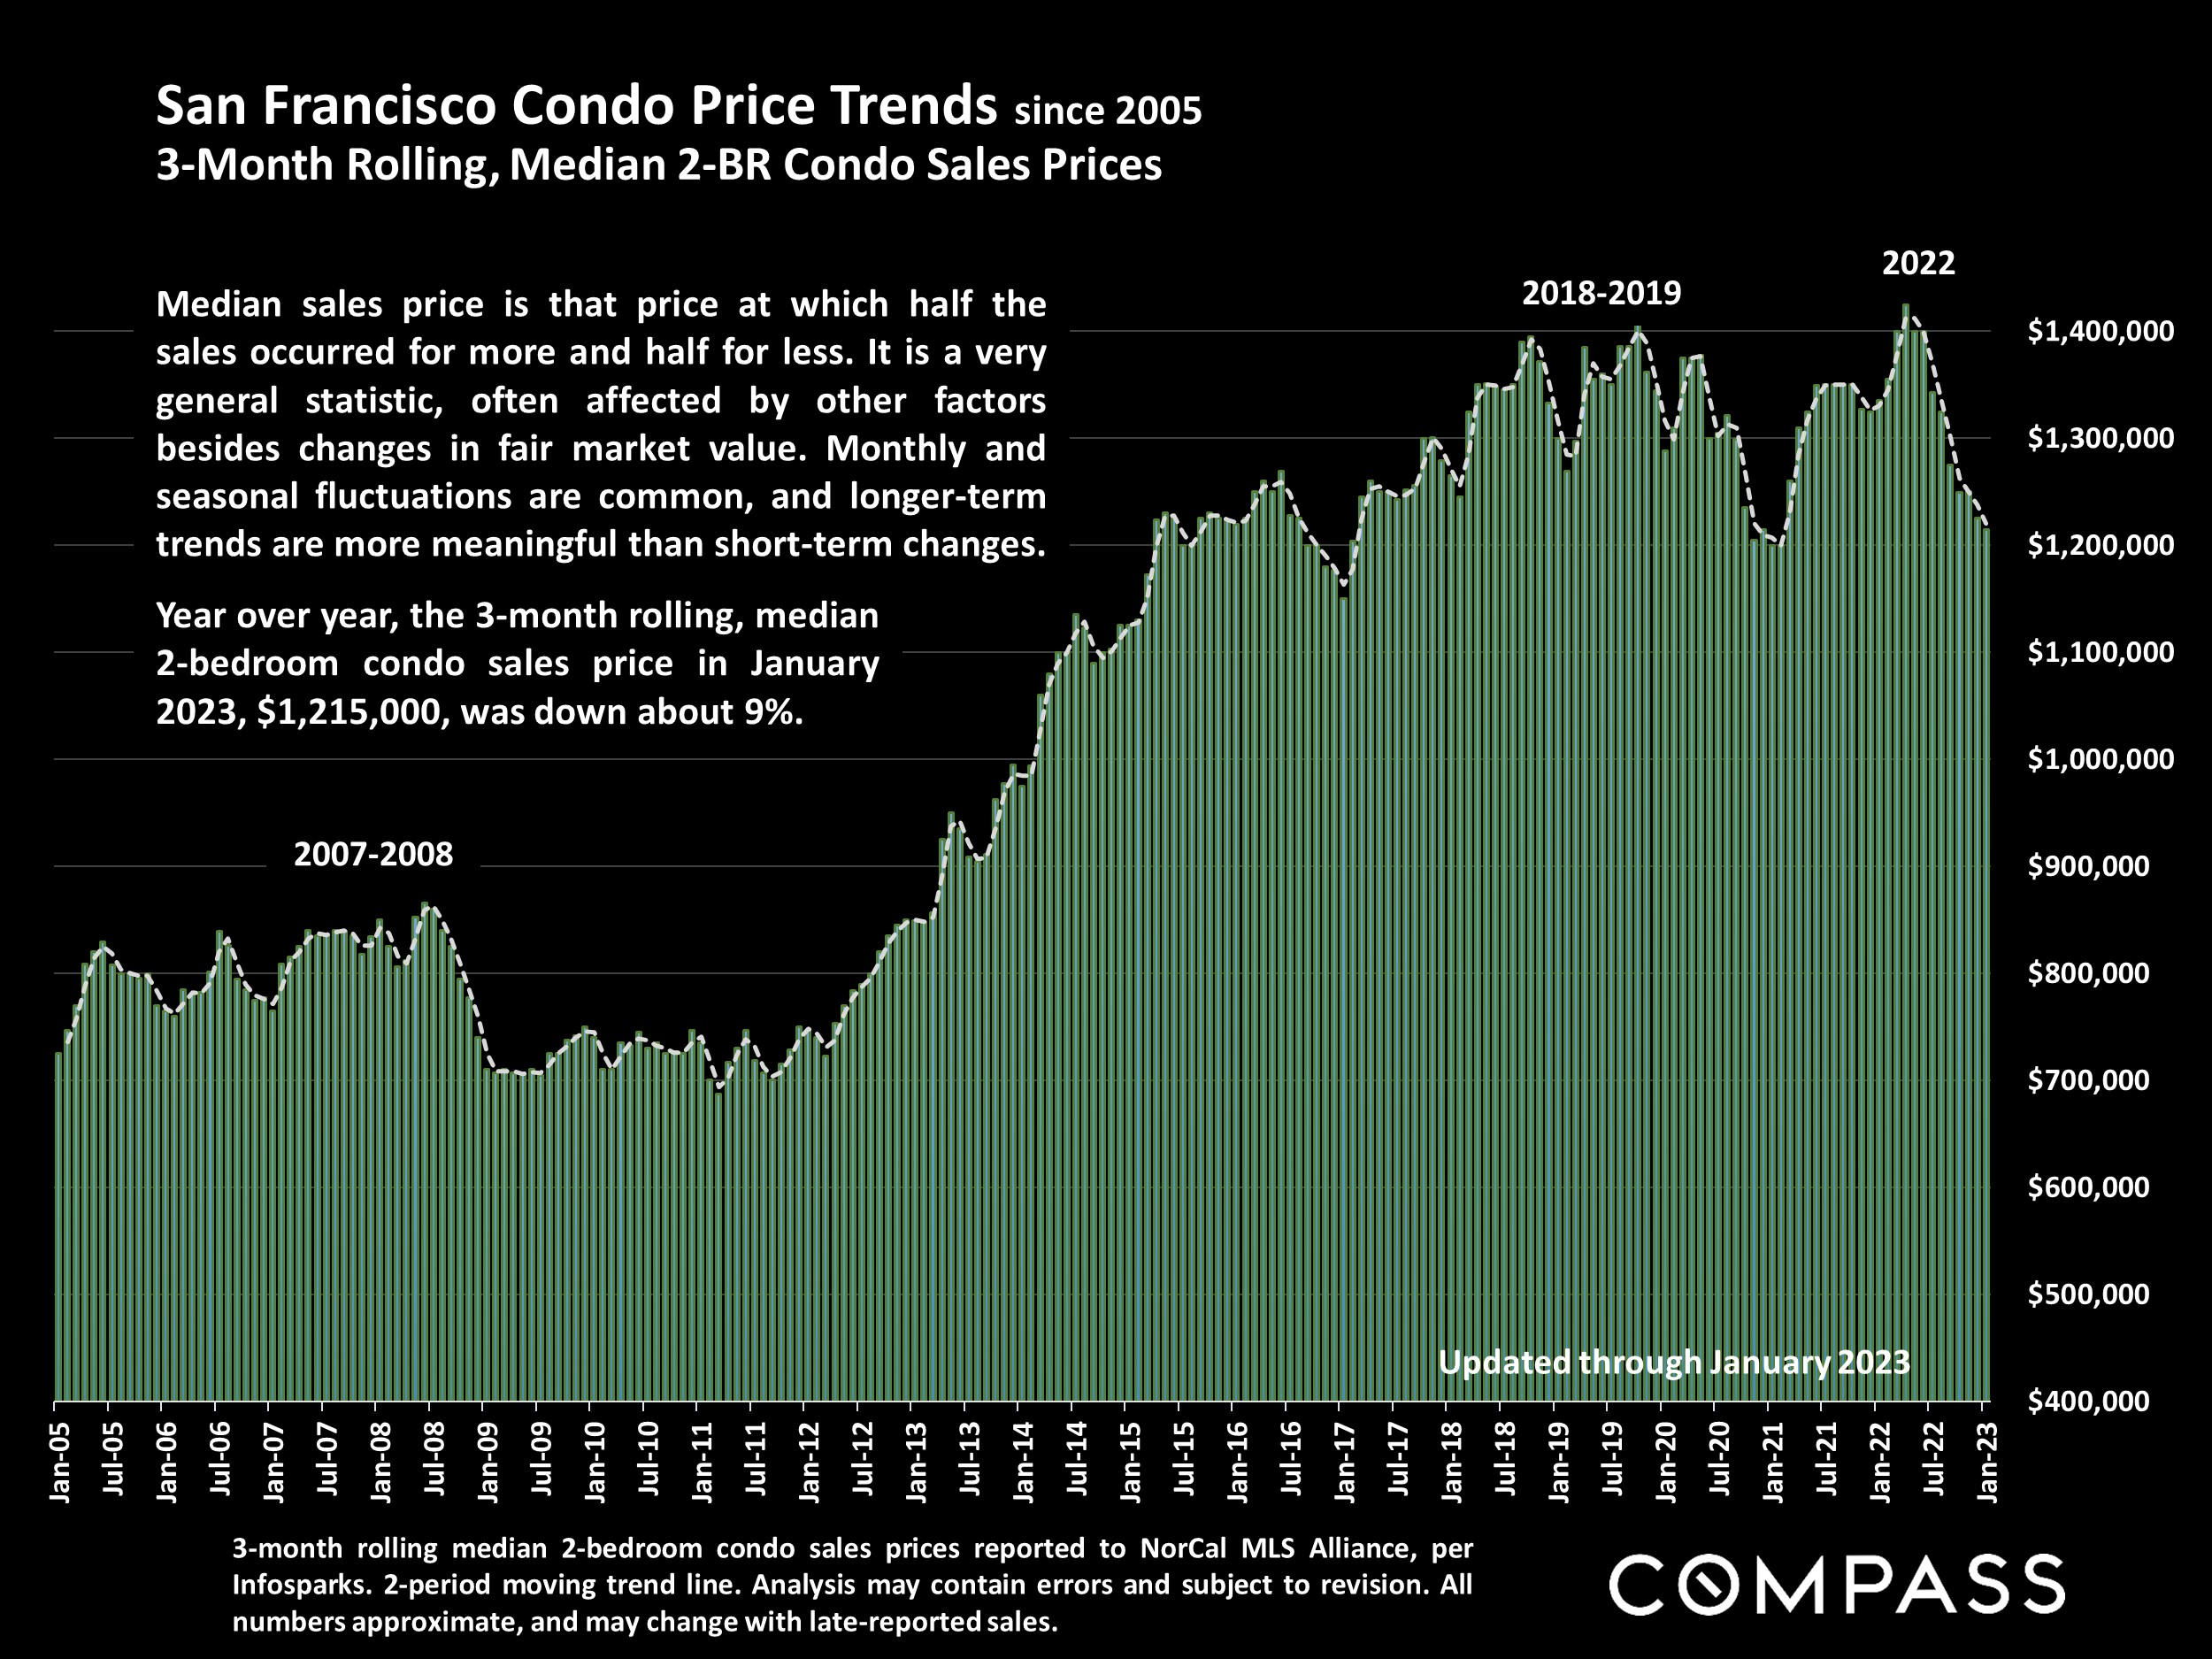
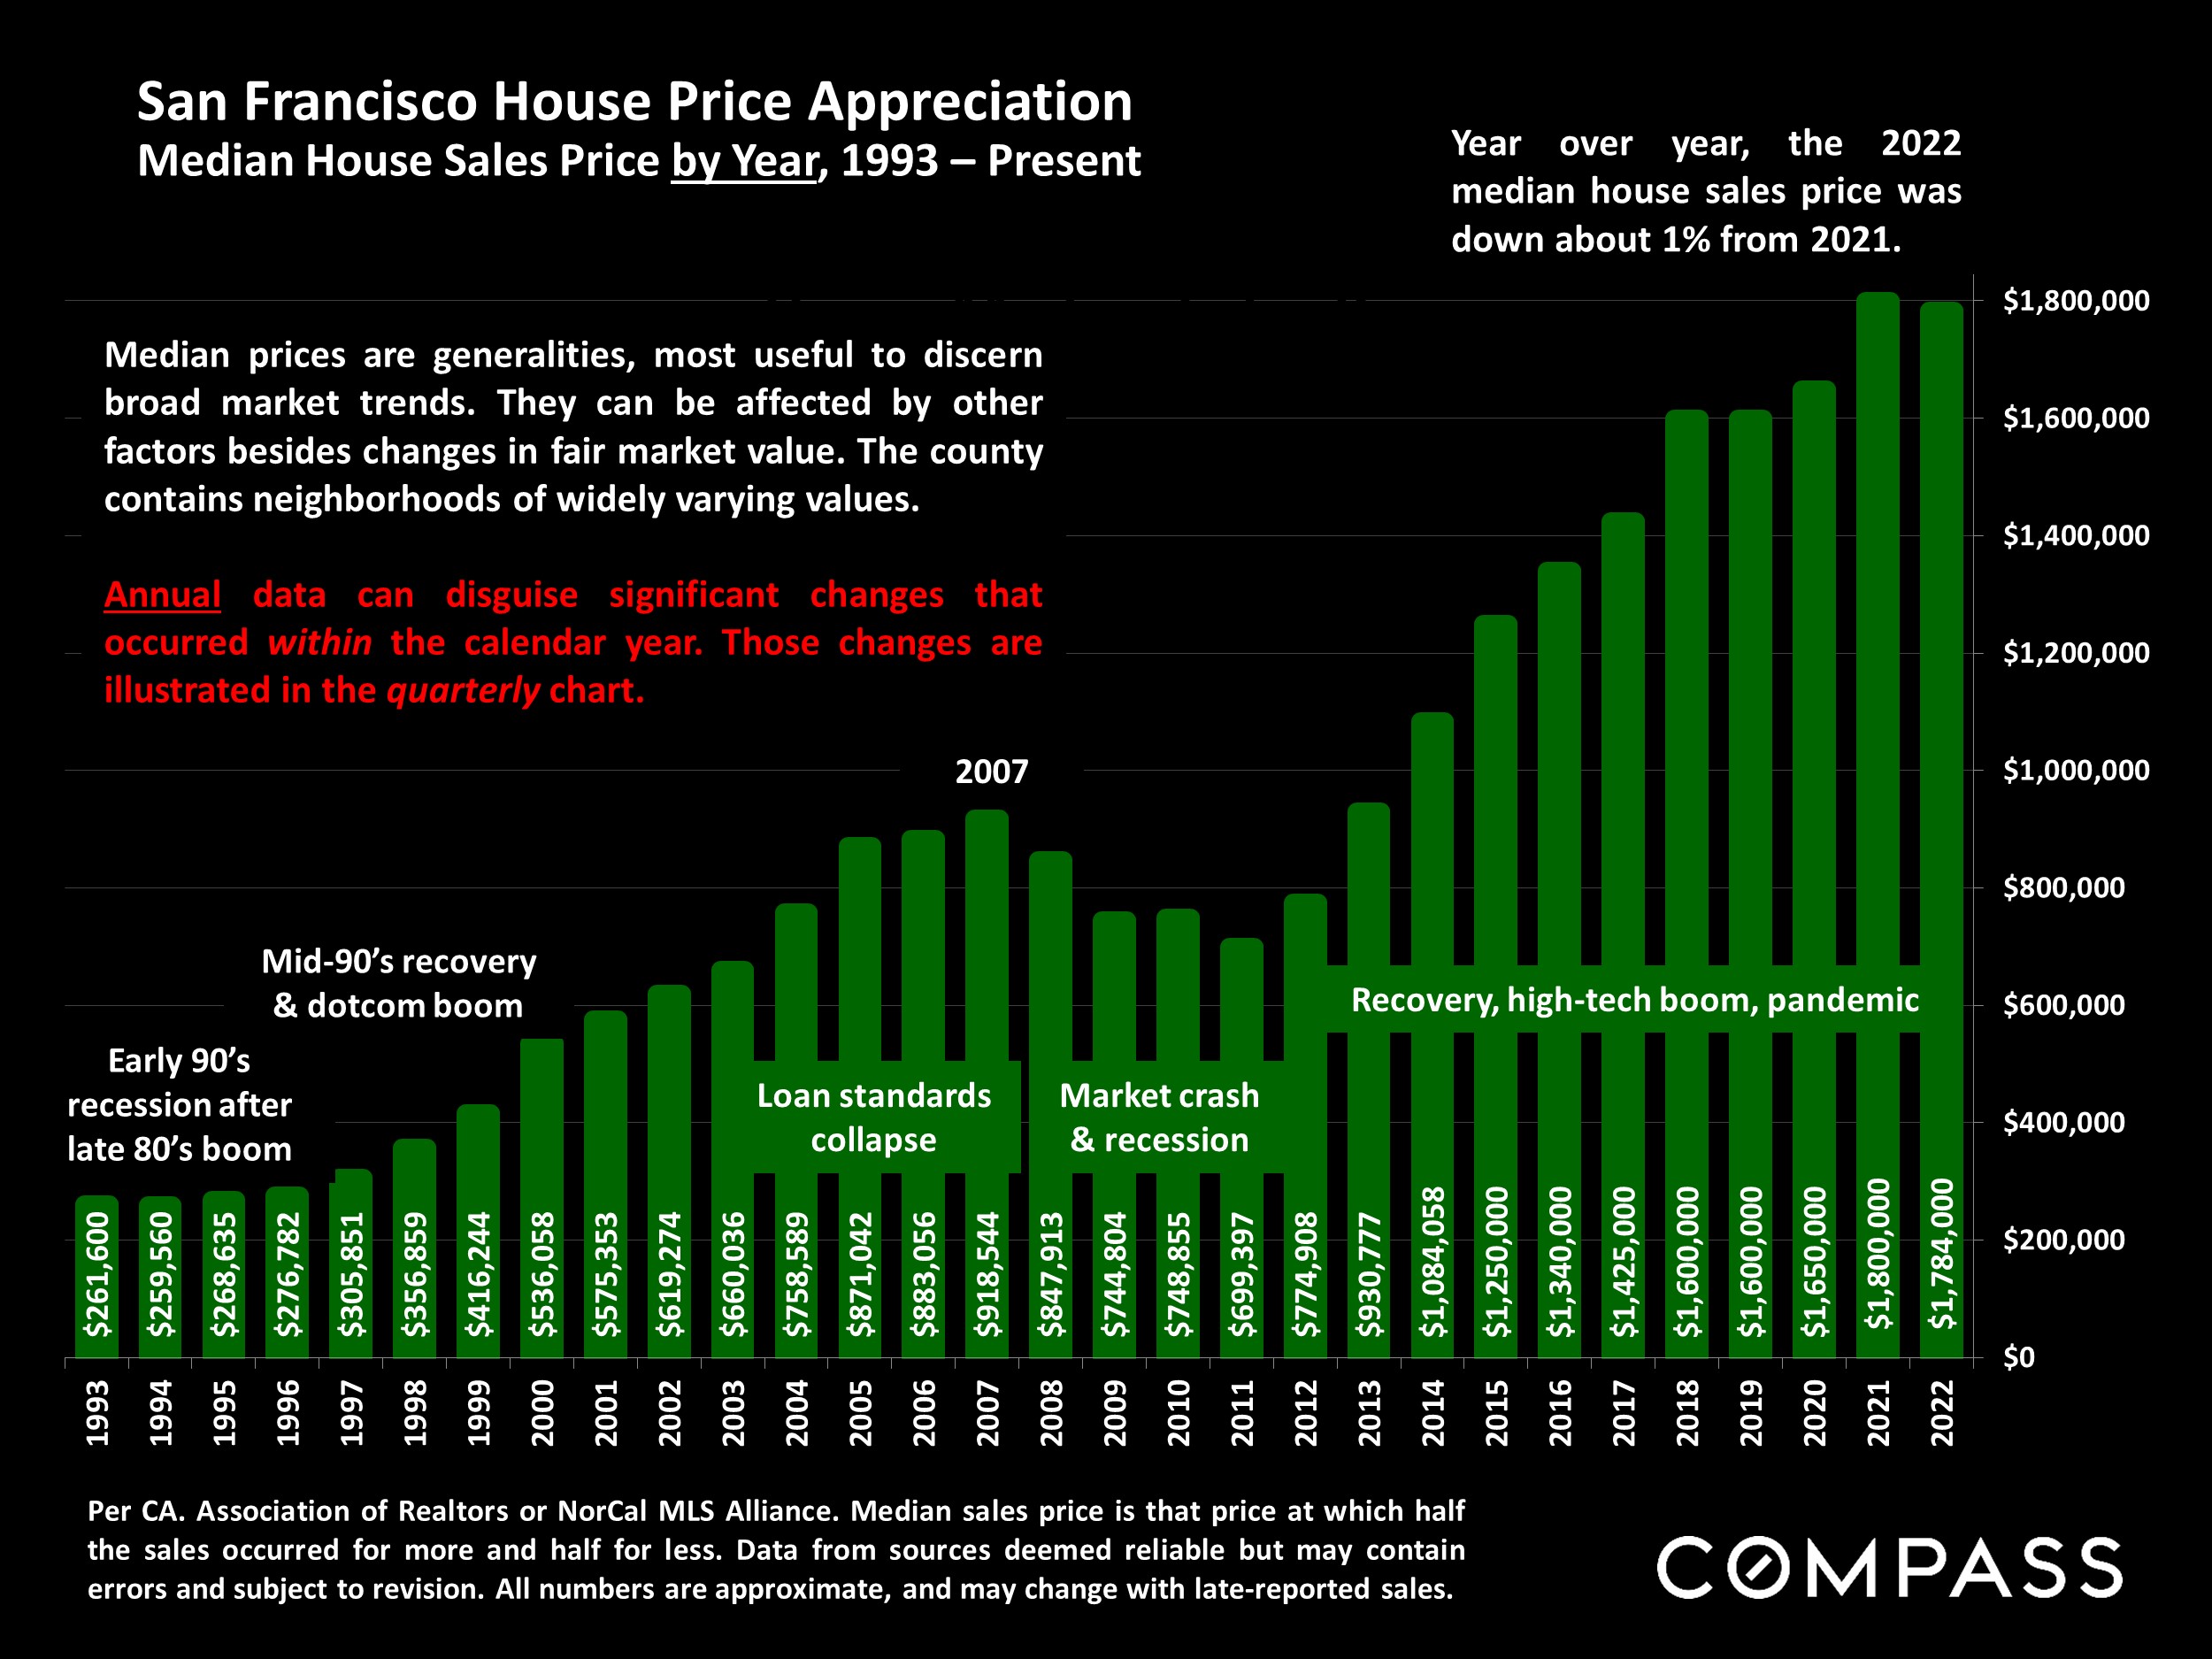
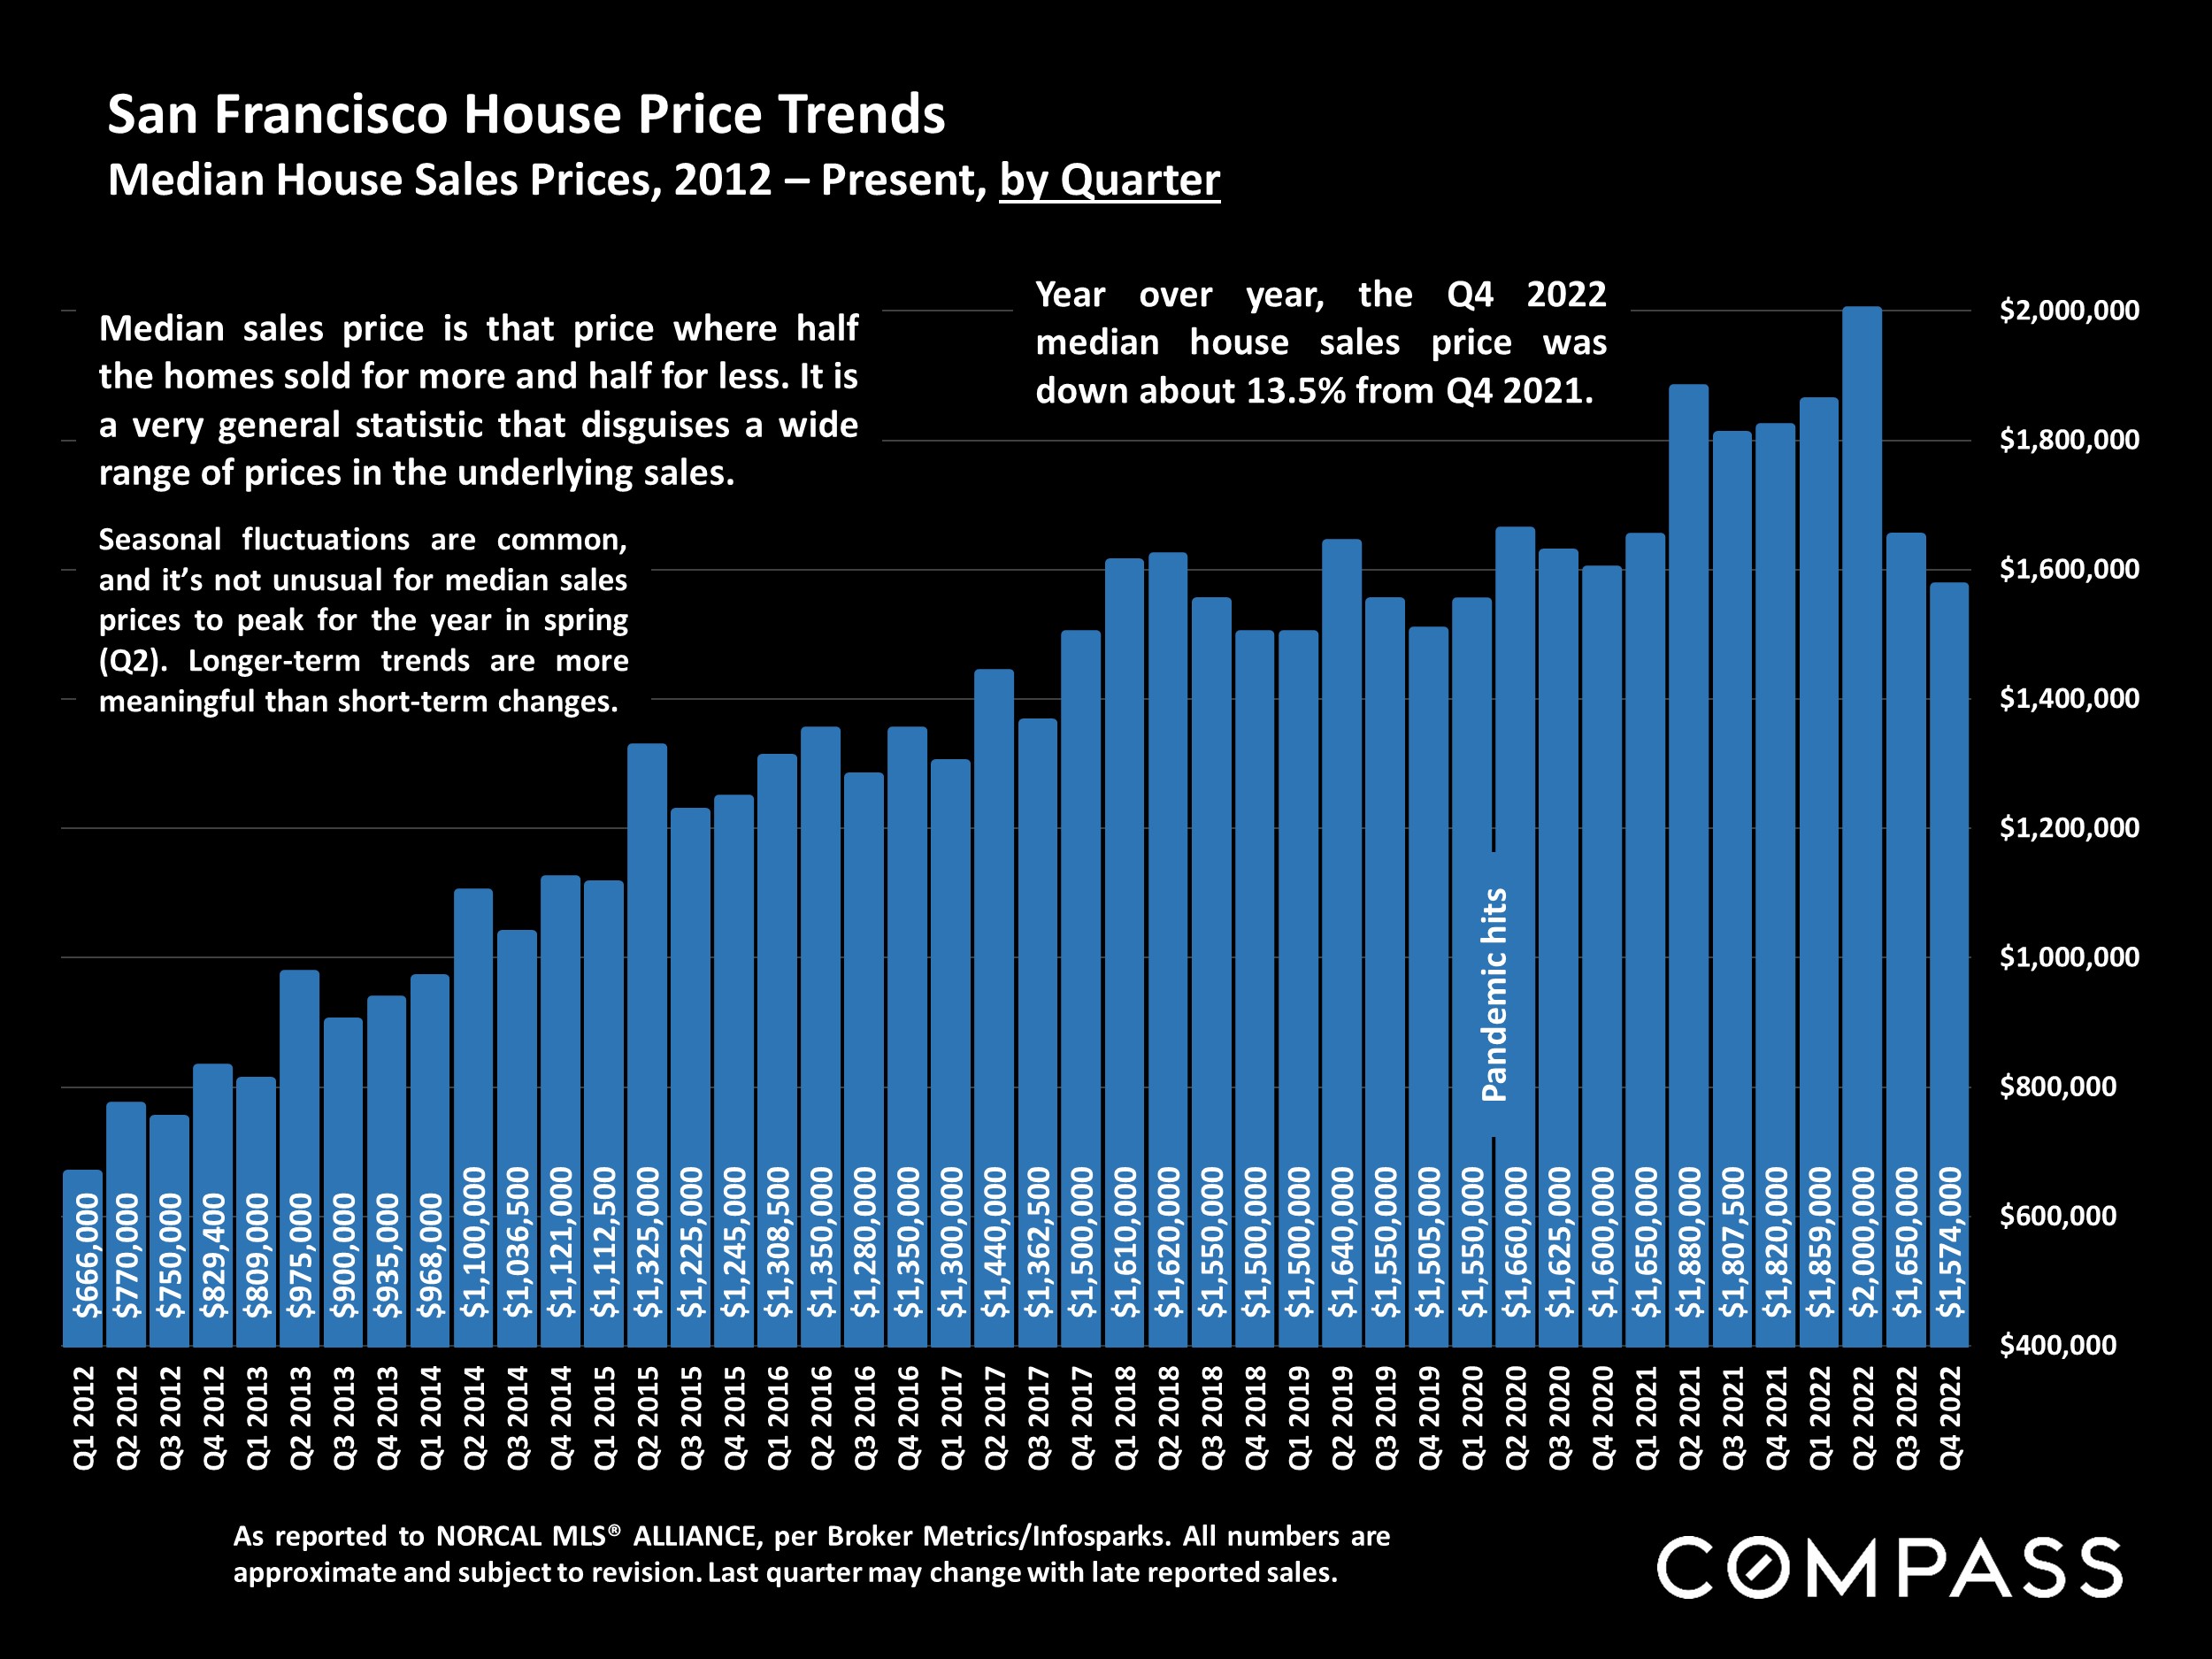
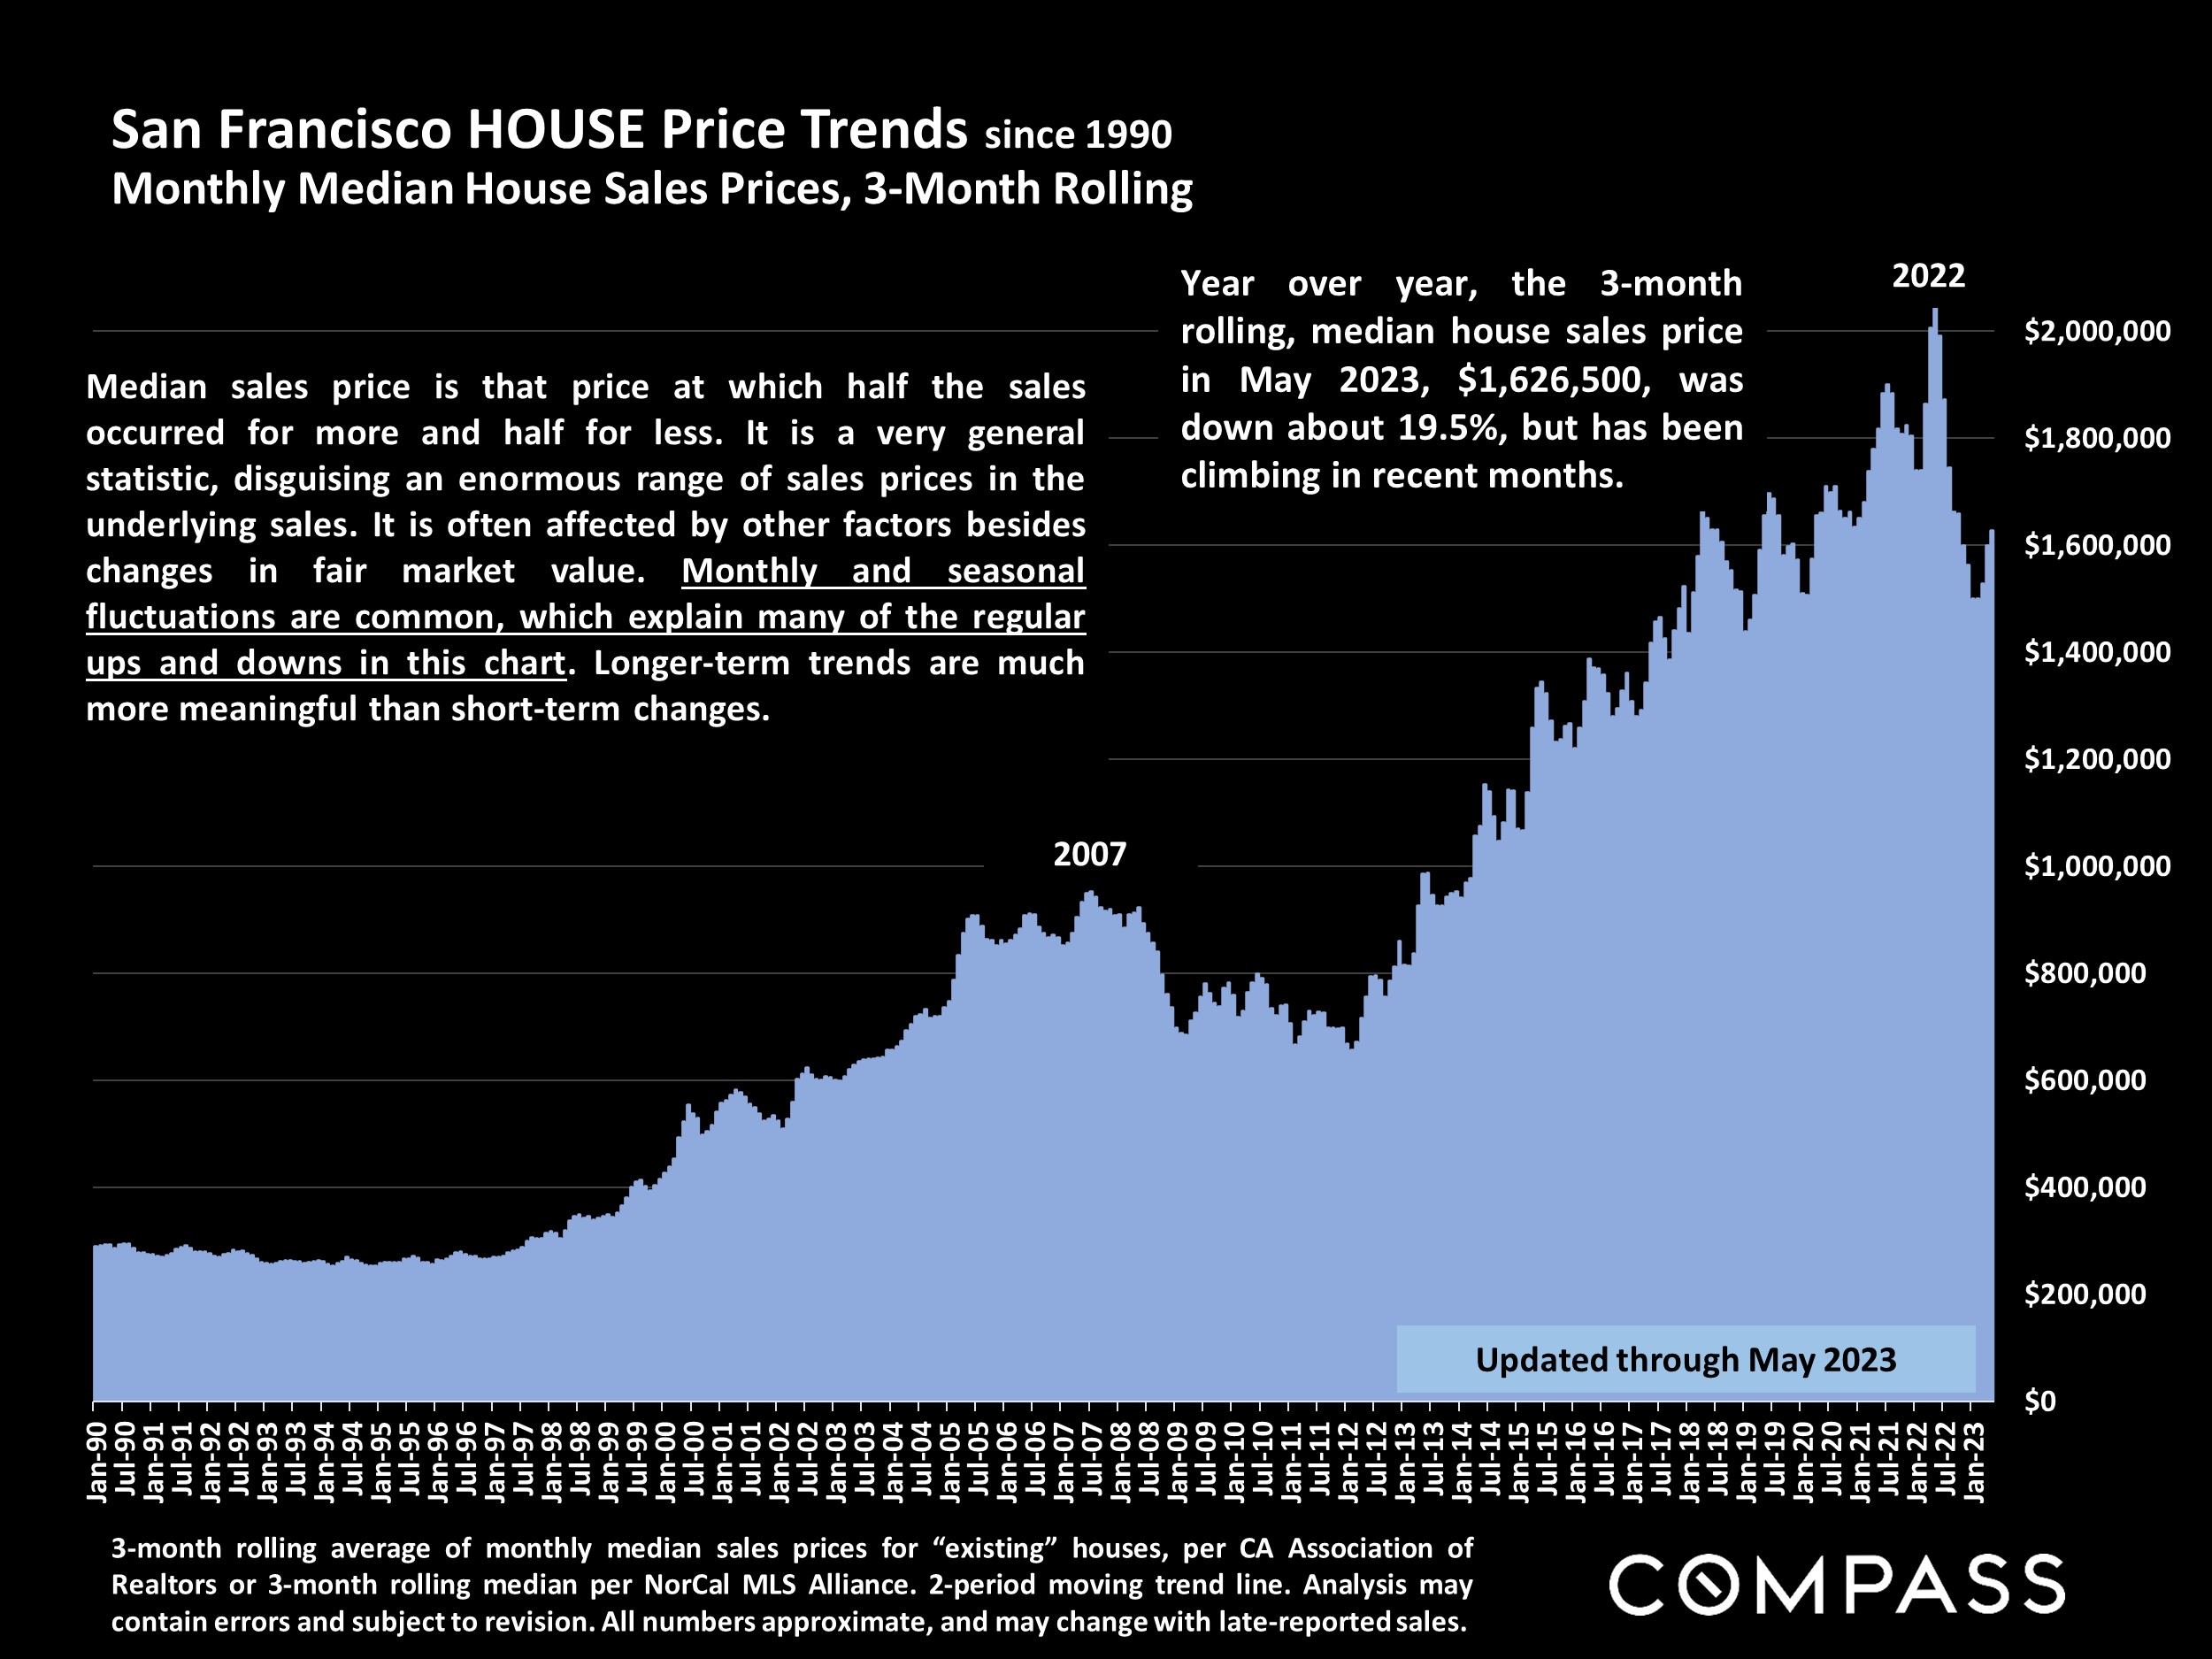
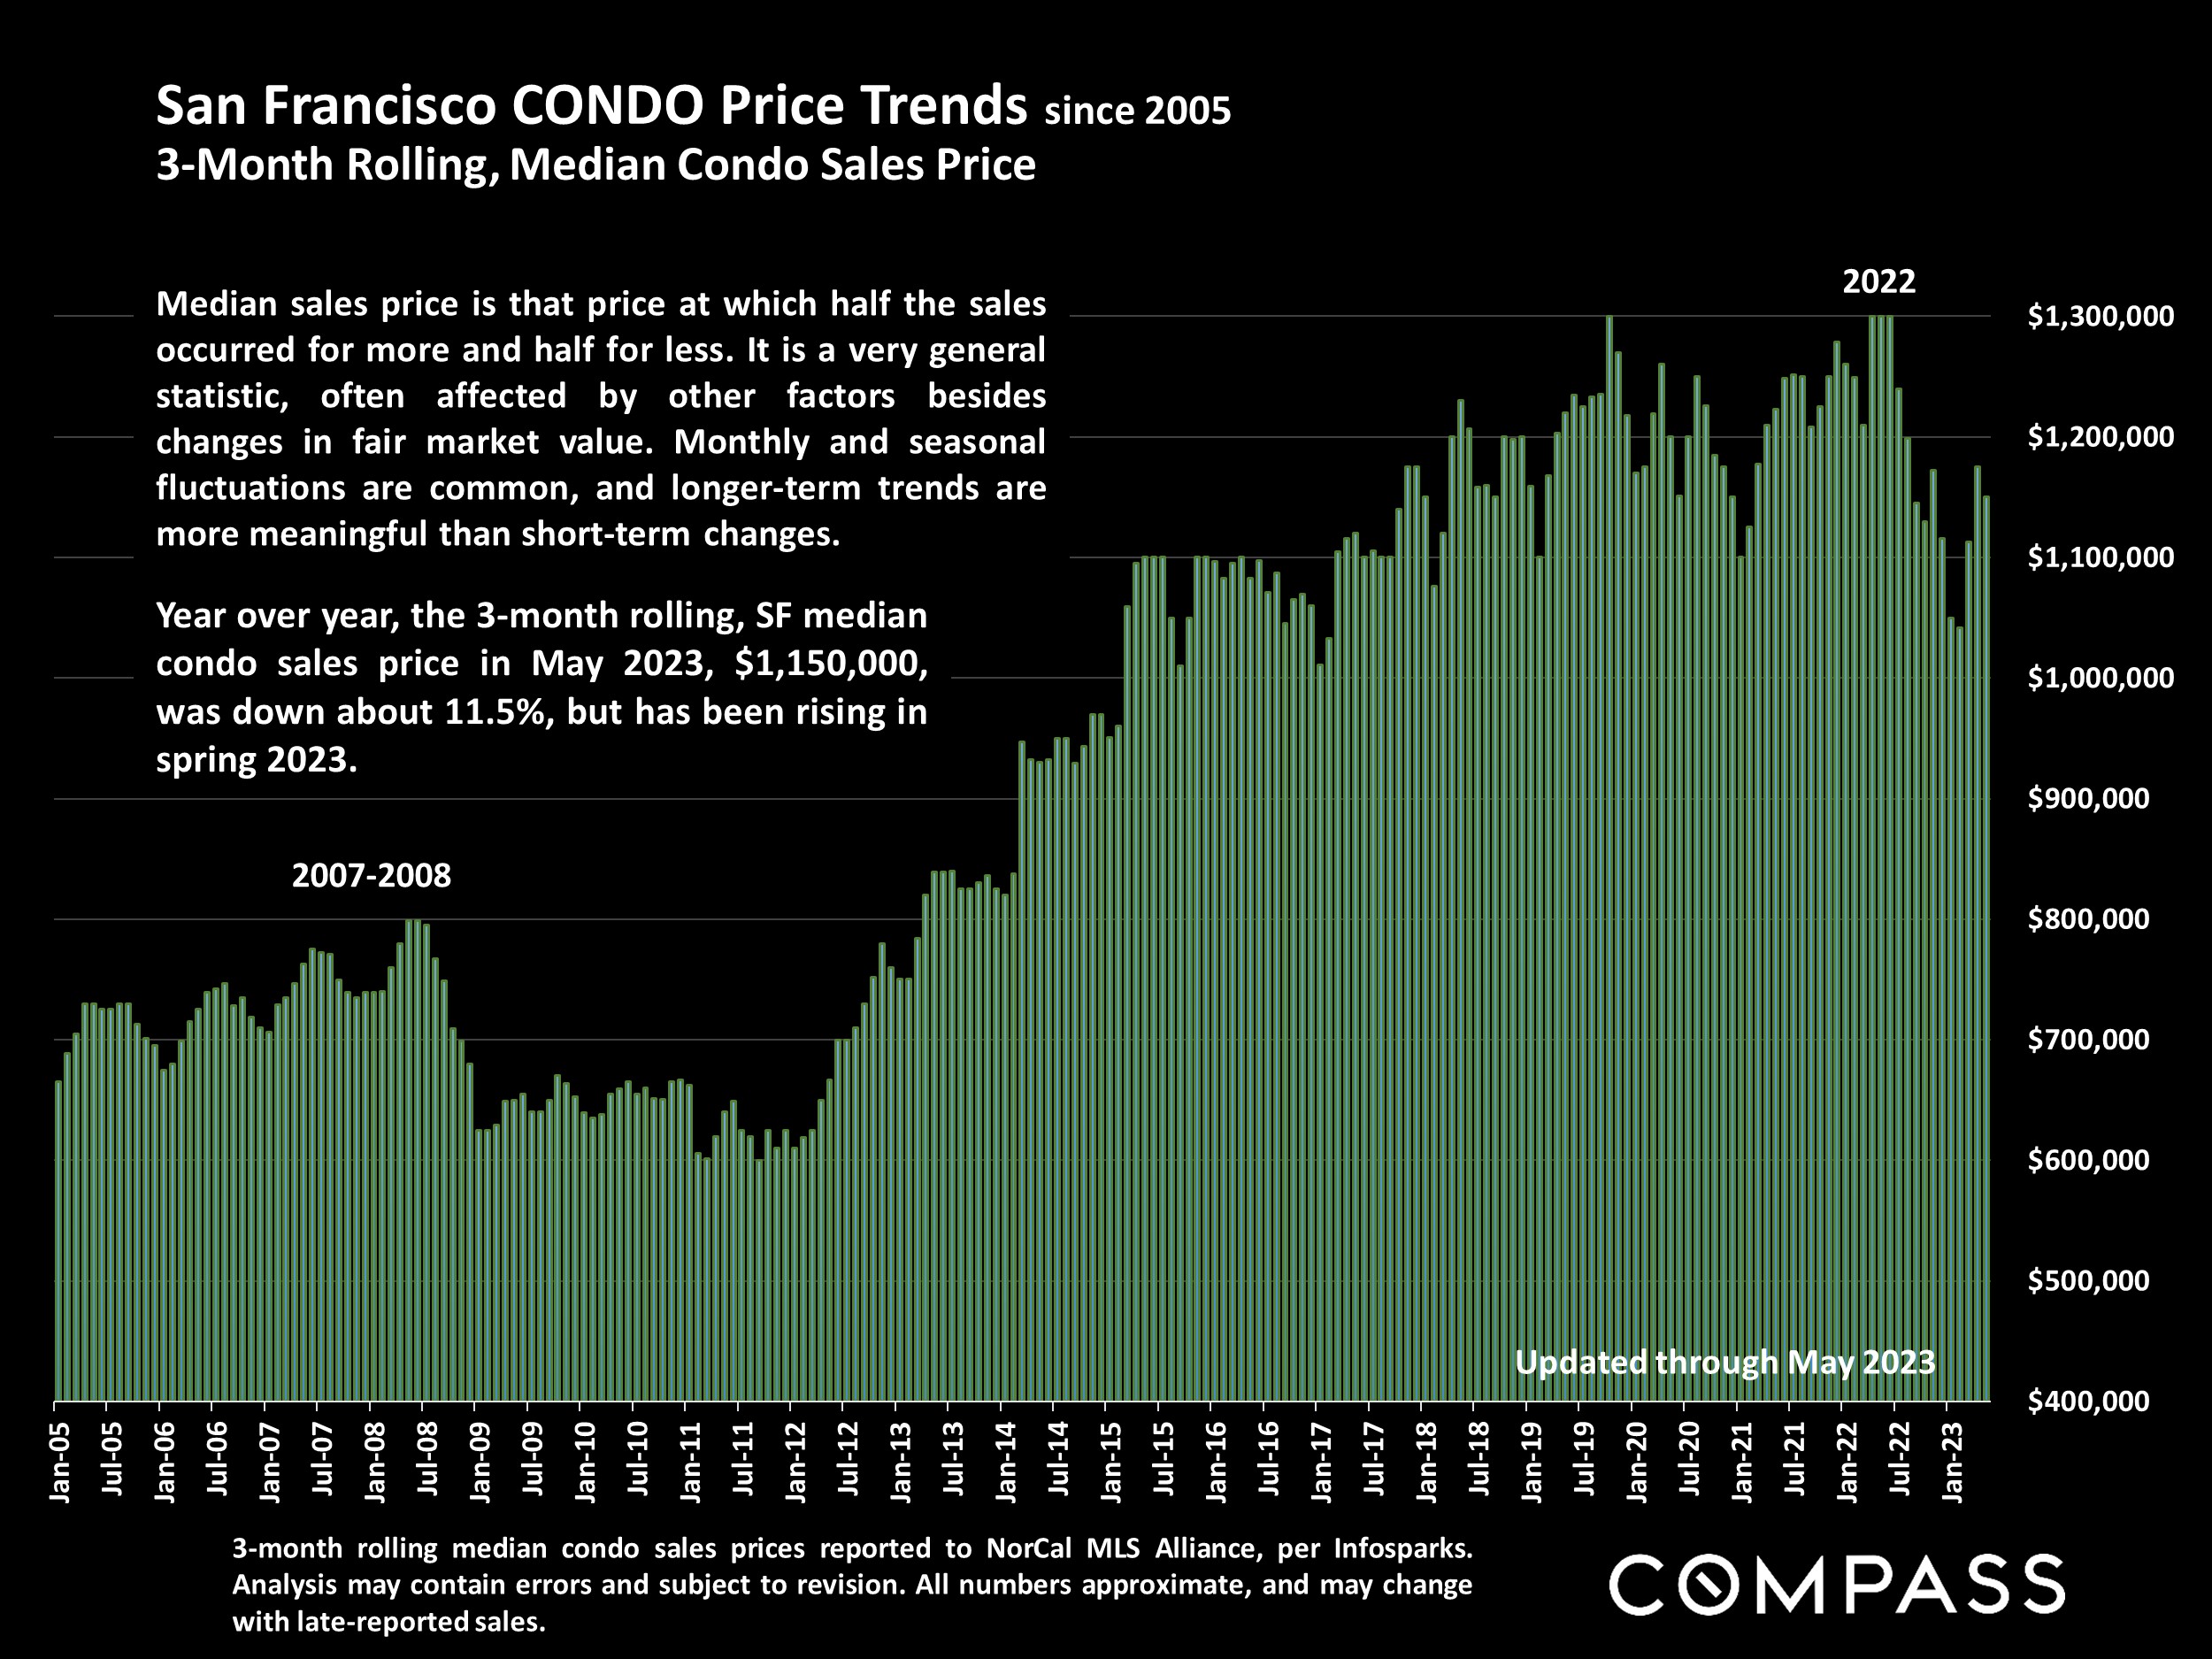
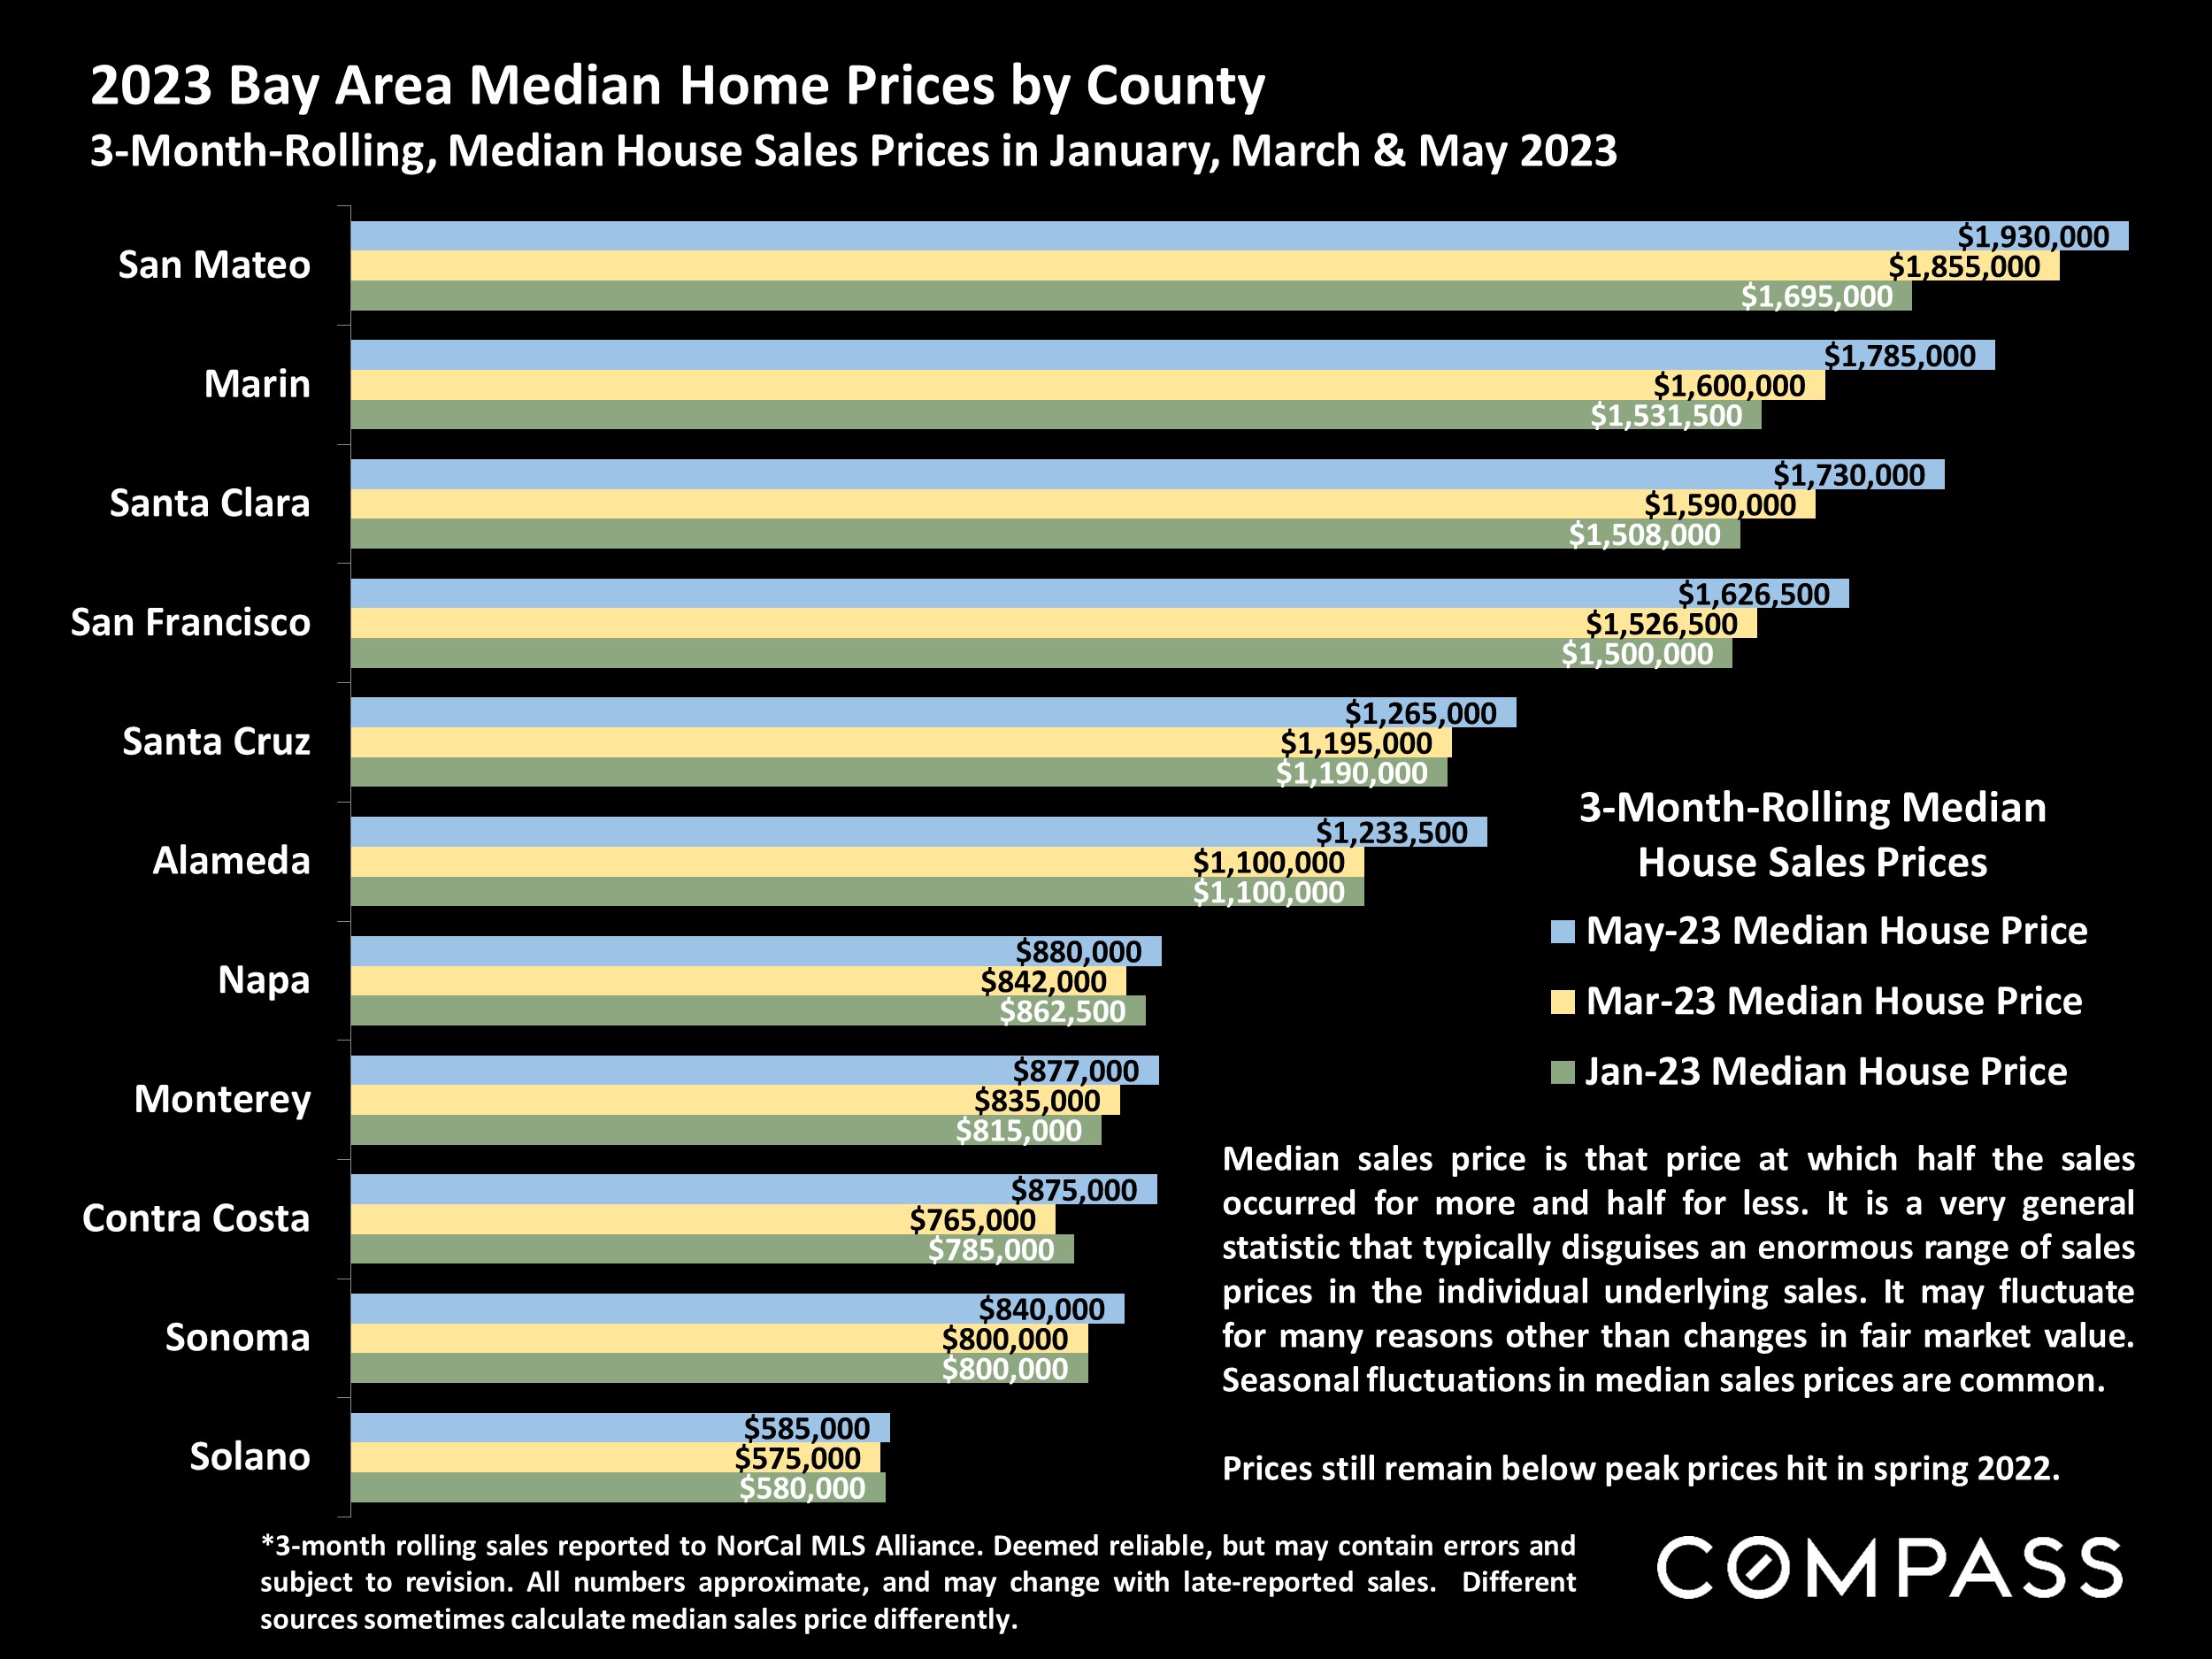
Median home sales prices have begun to recover from mid-winter lows, though remaining far below peak prices hit in spring 2022.
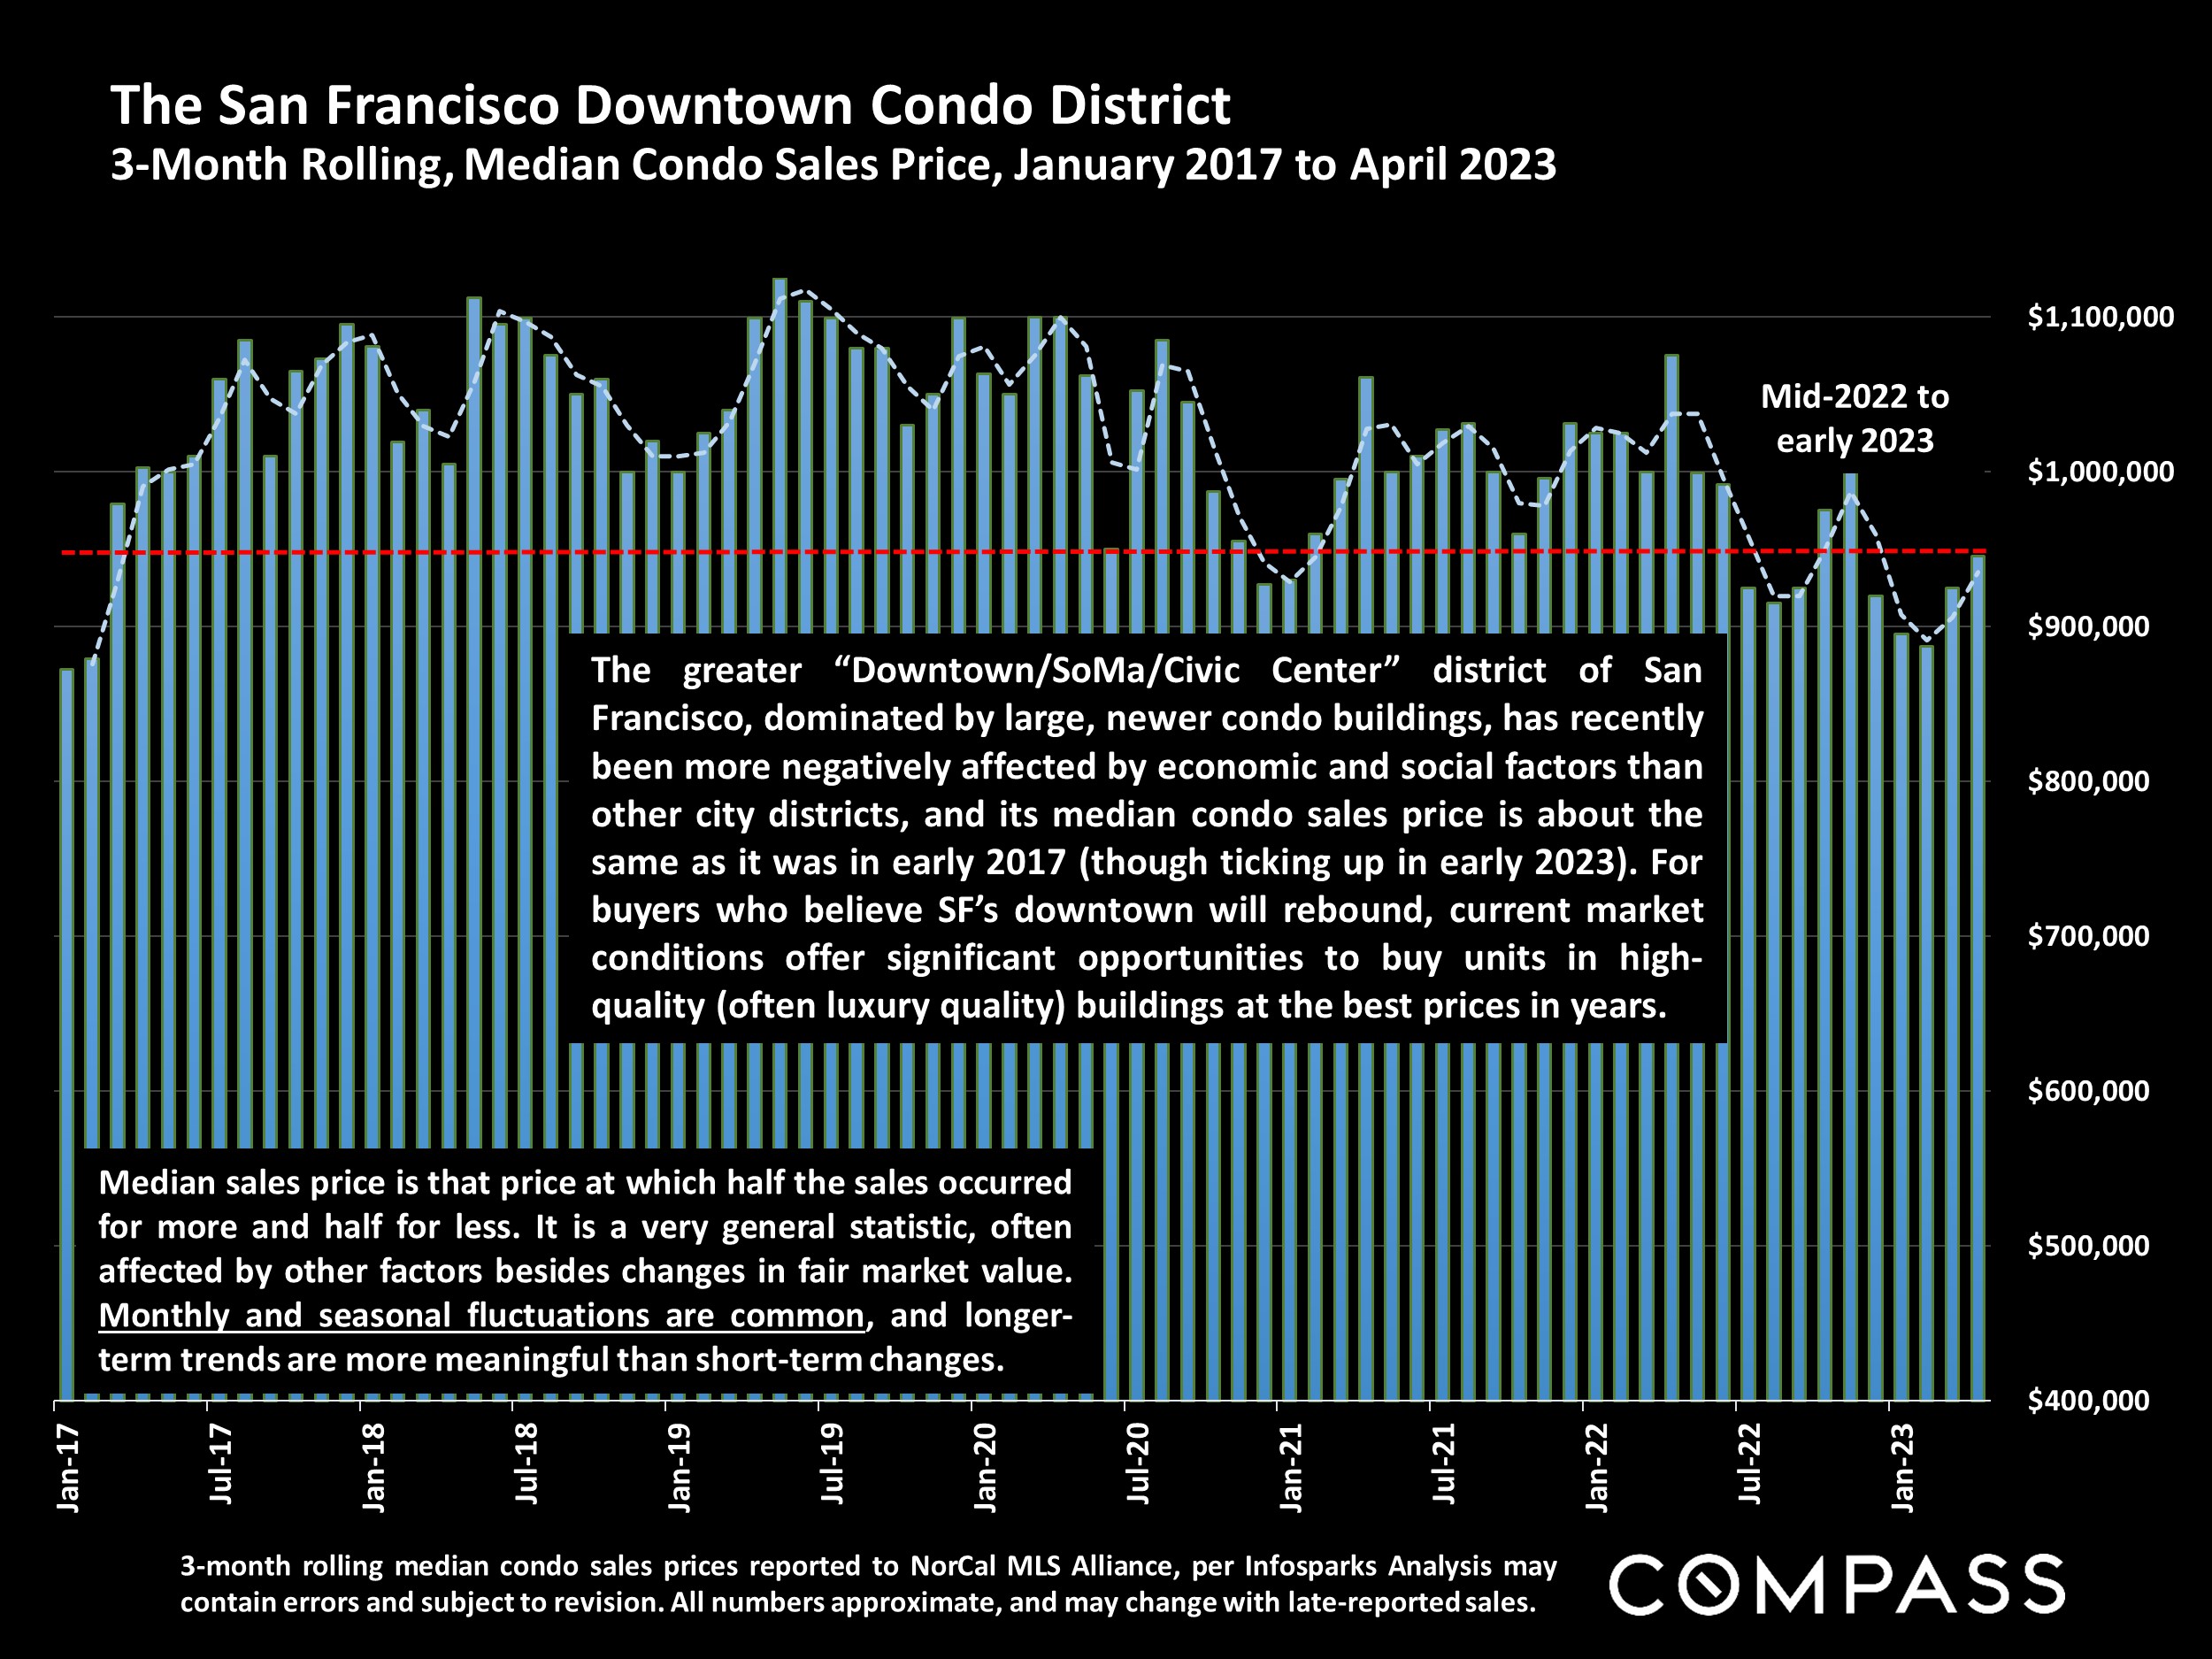
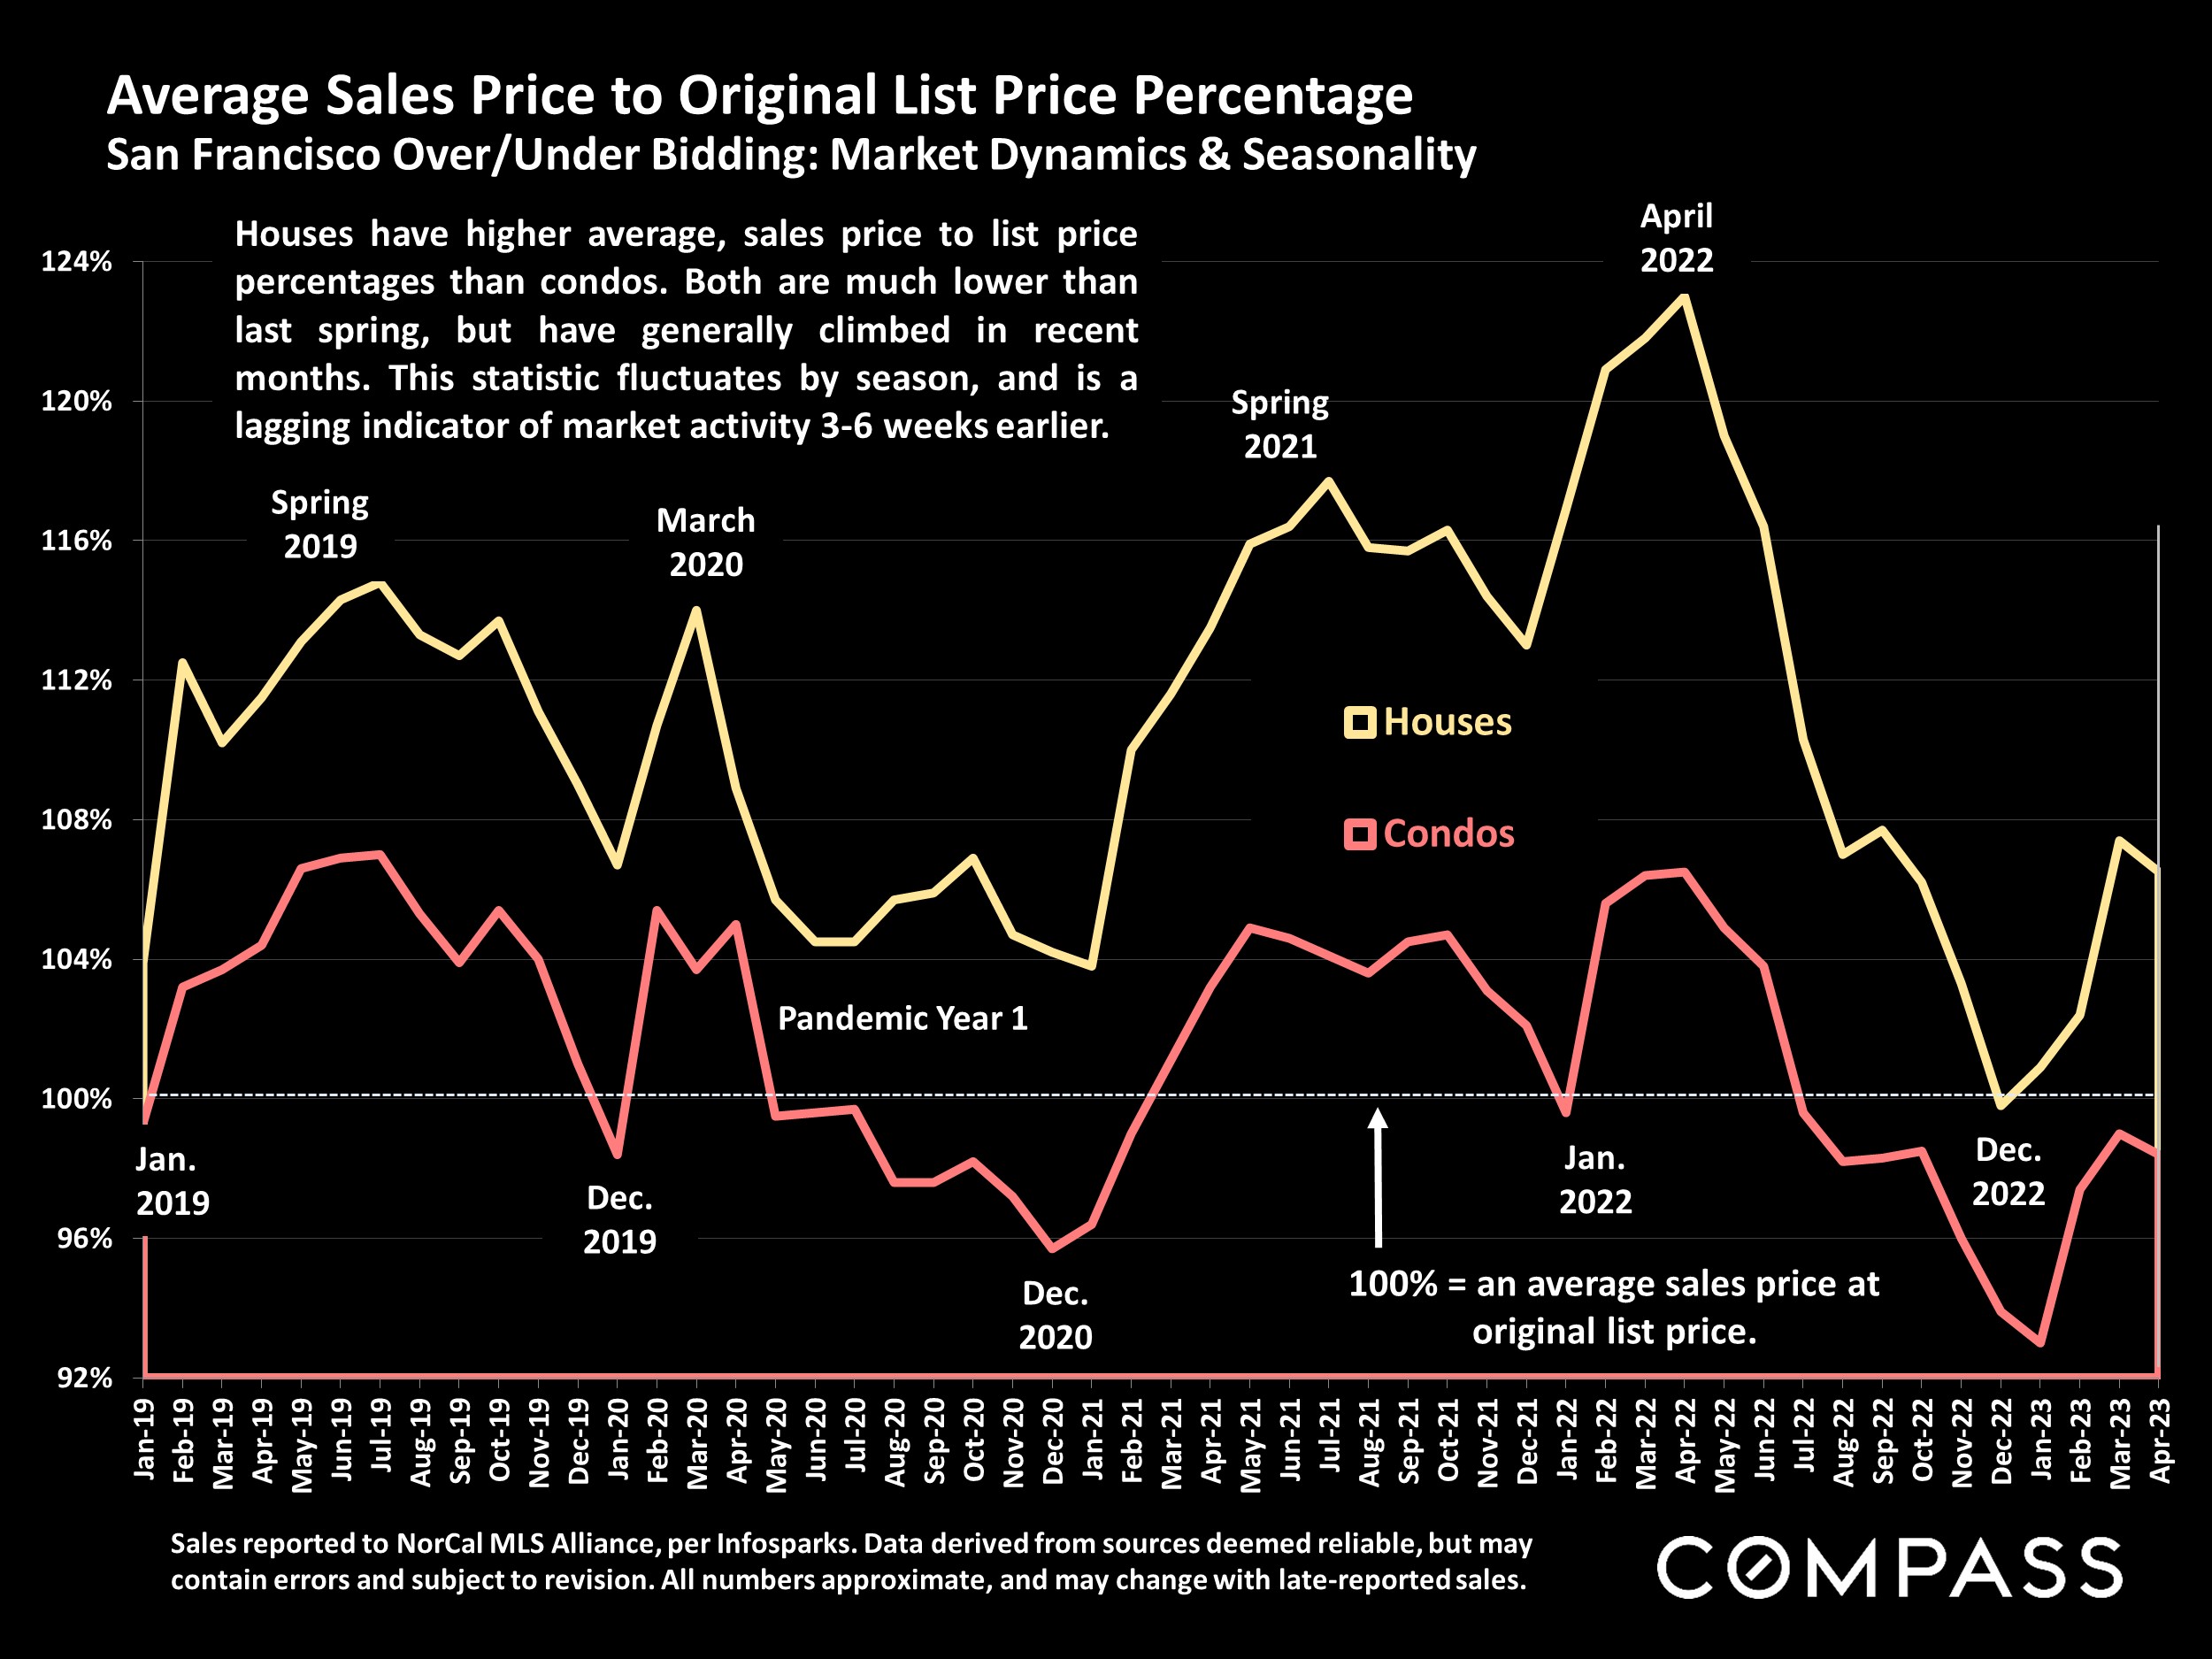
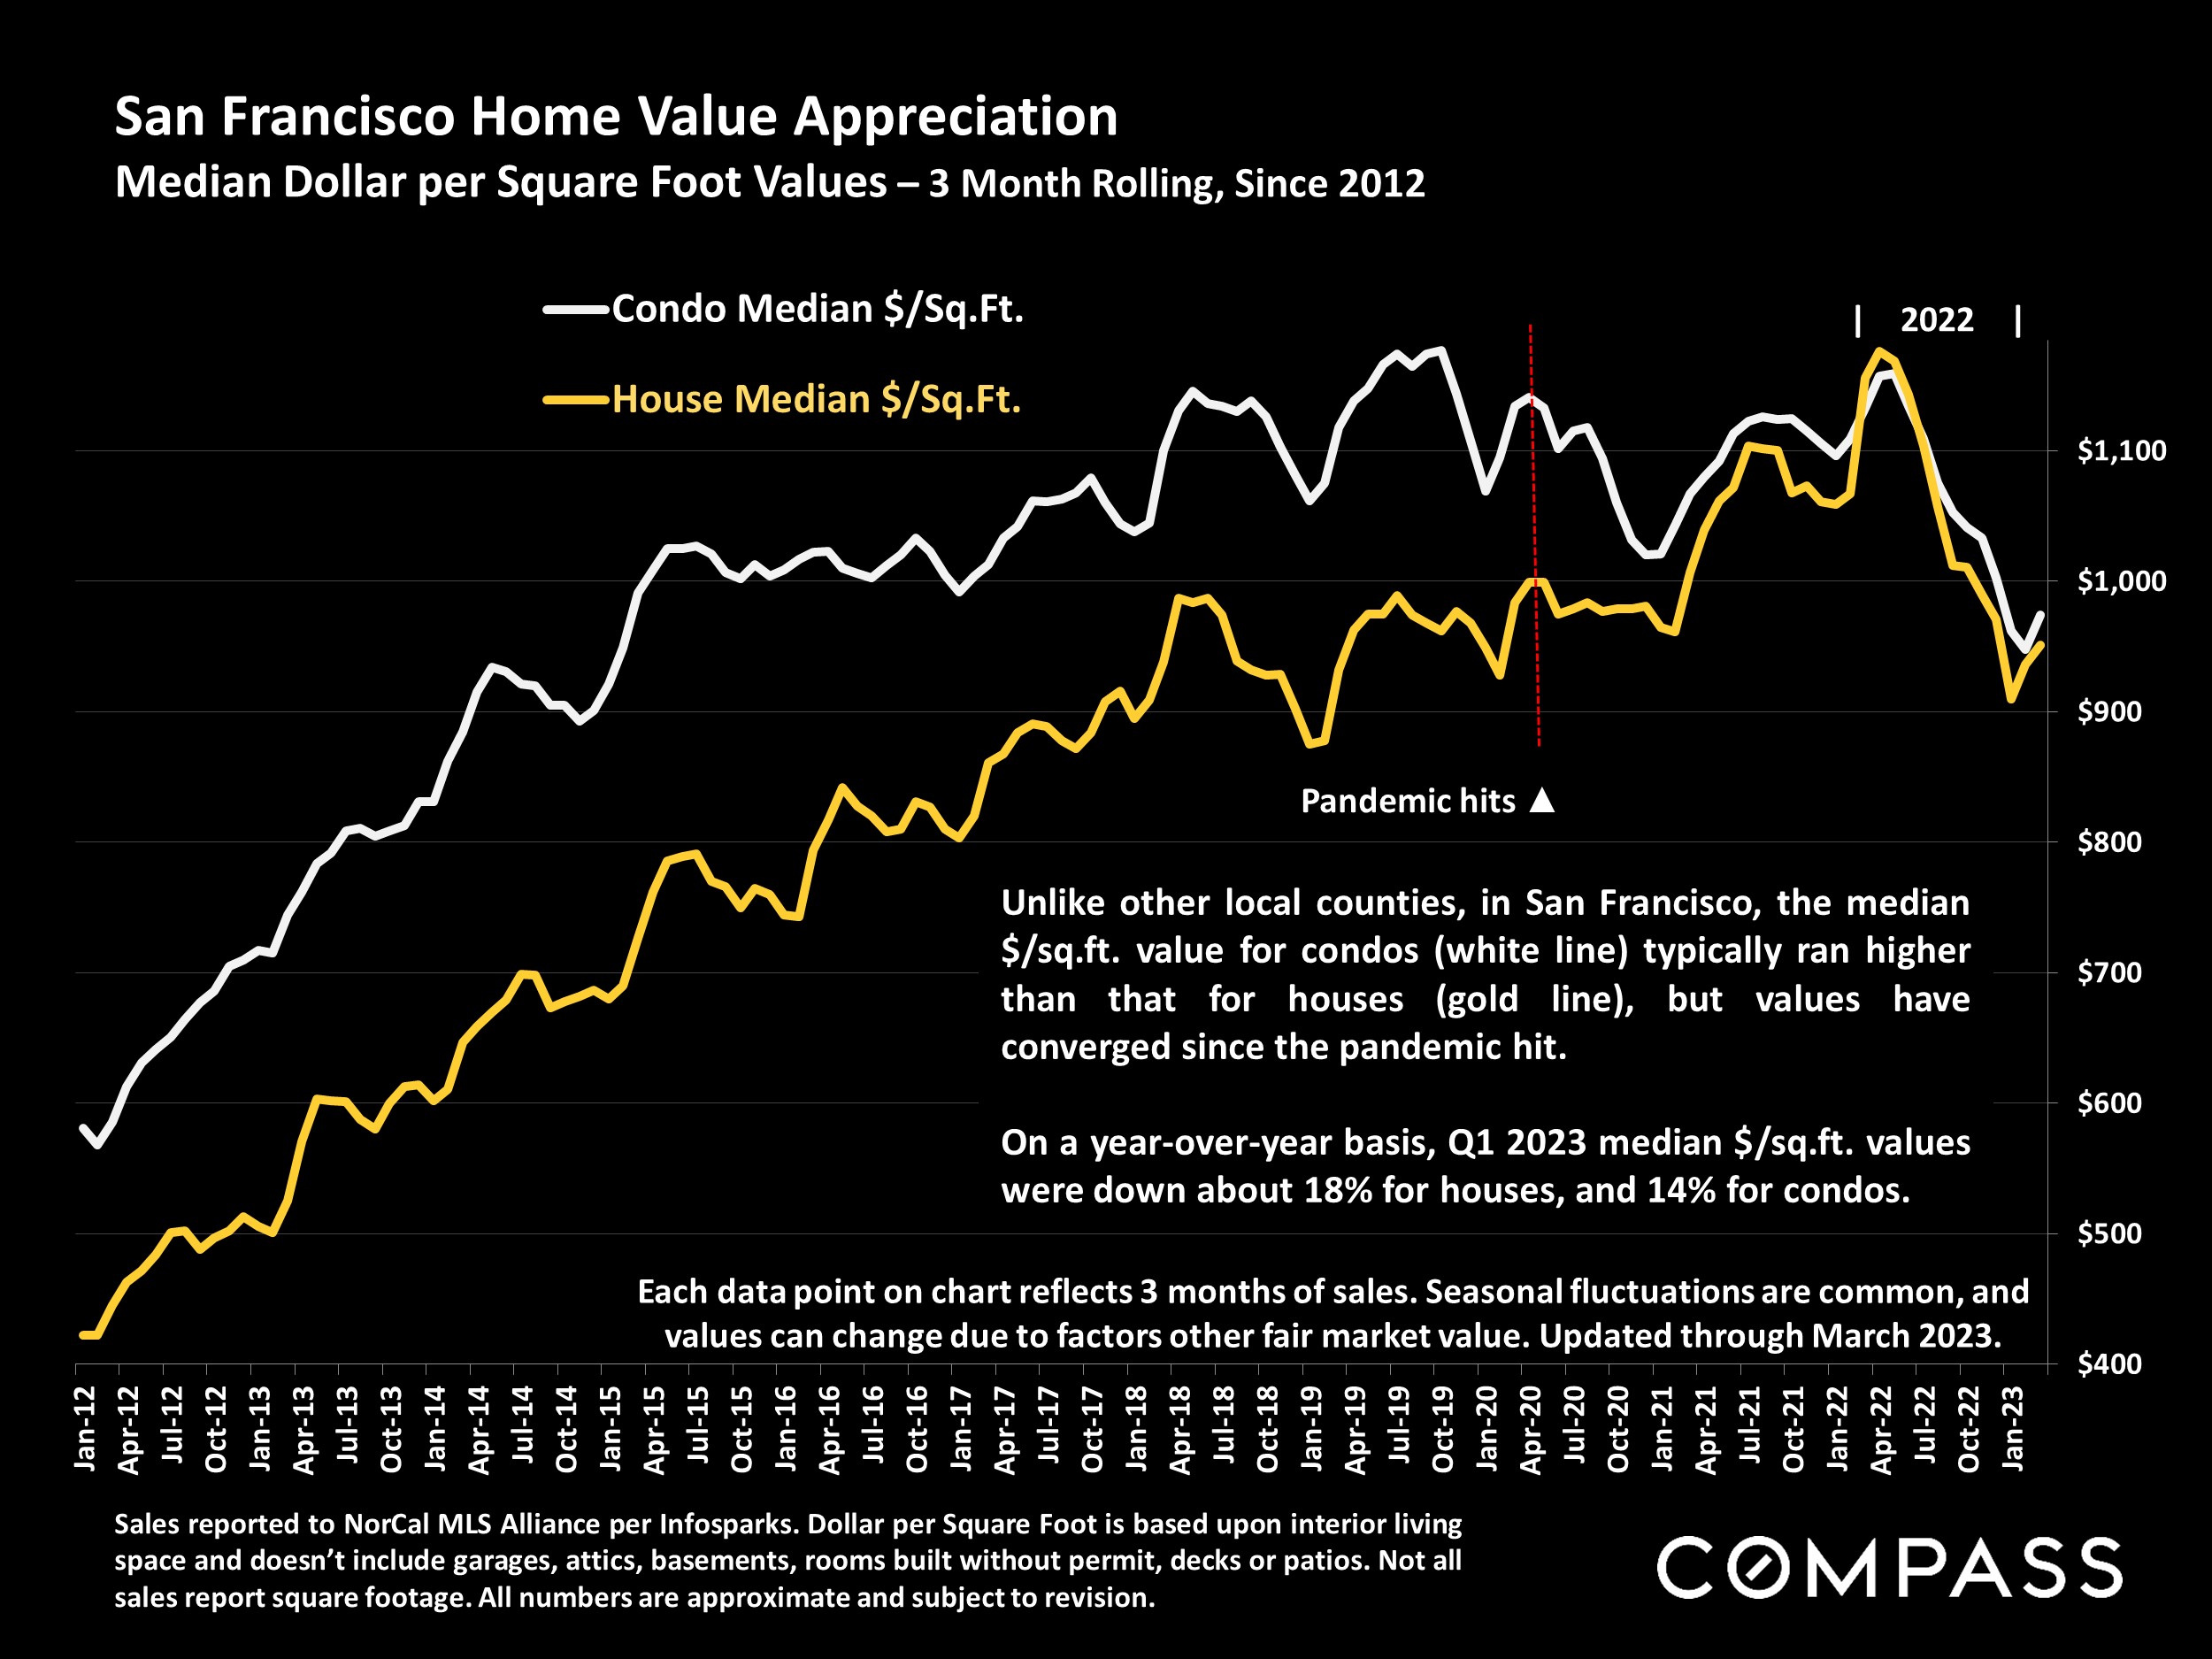
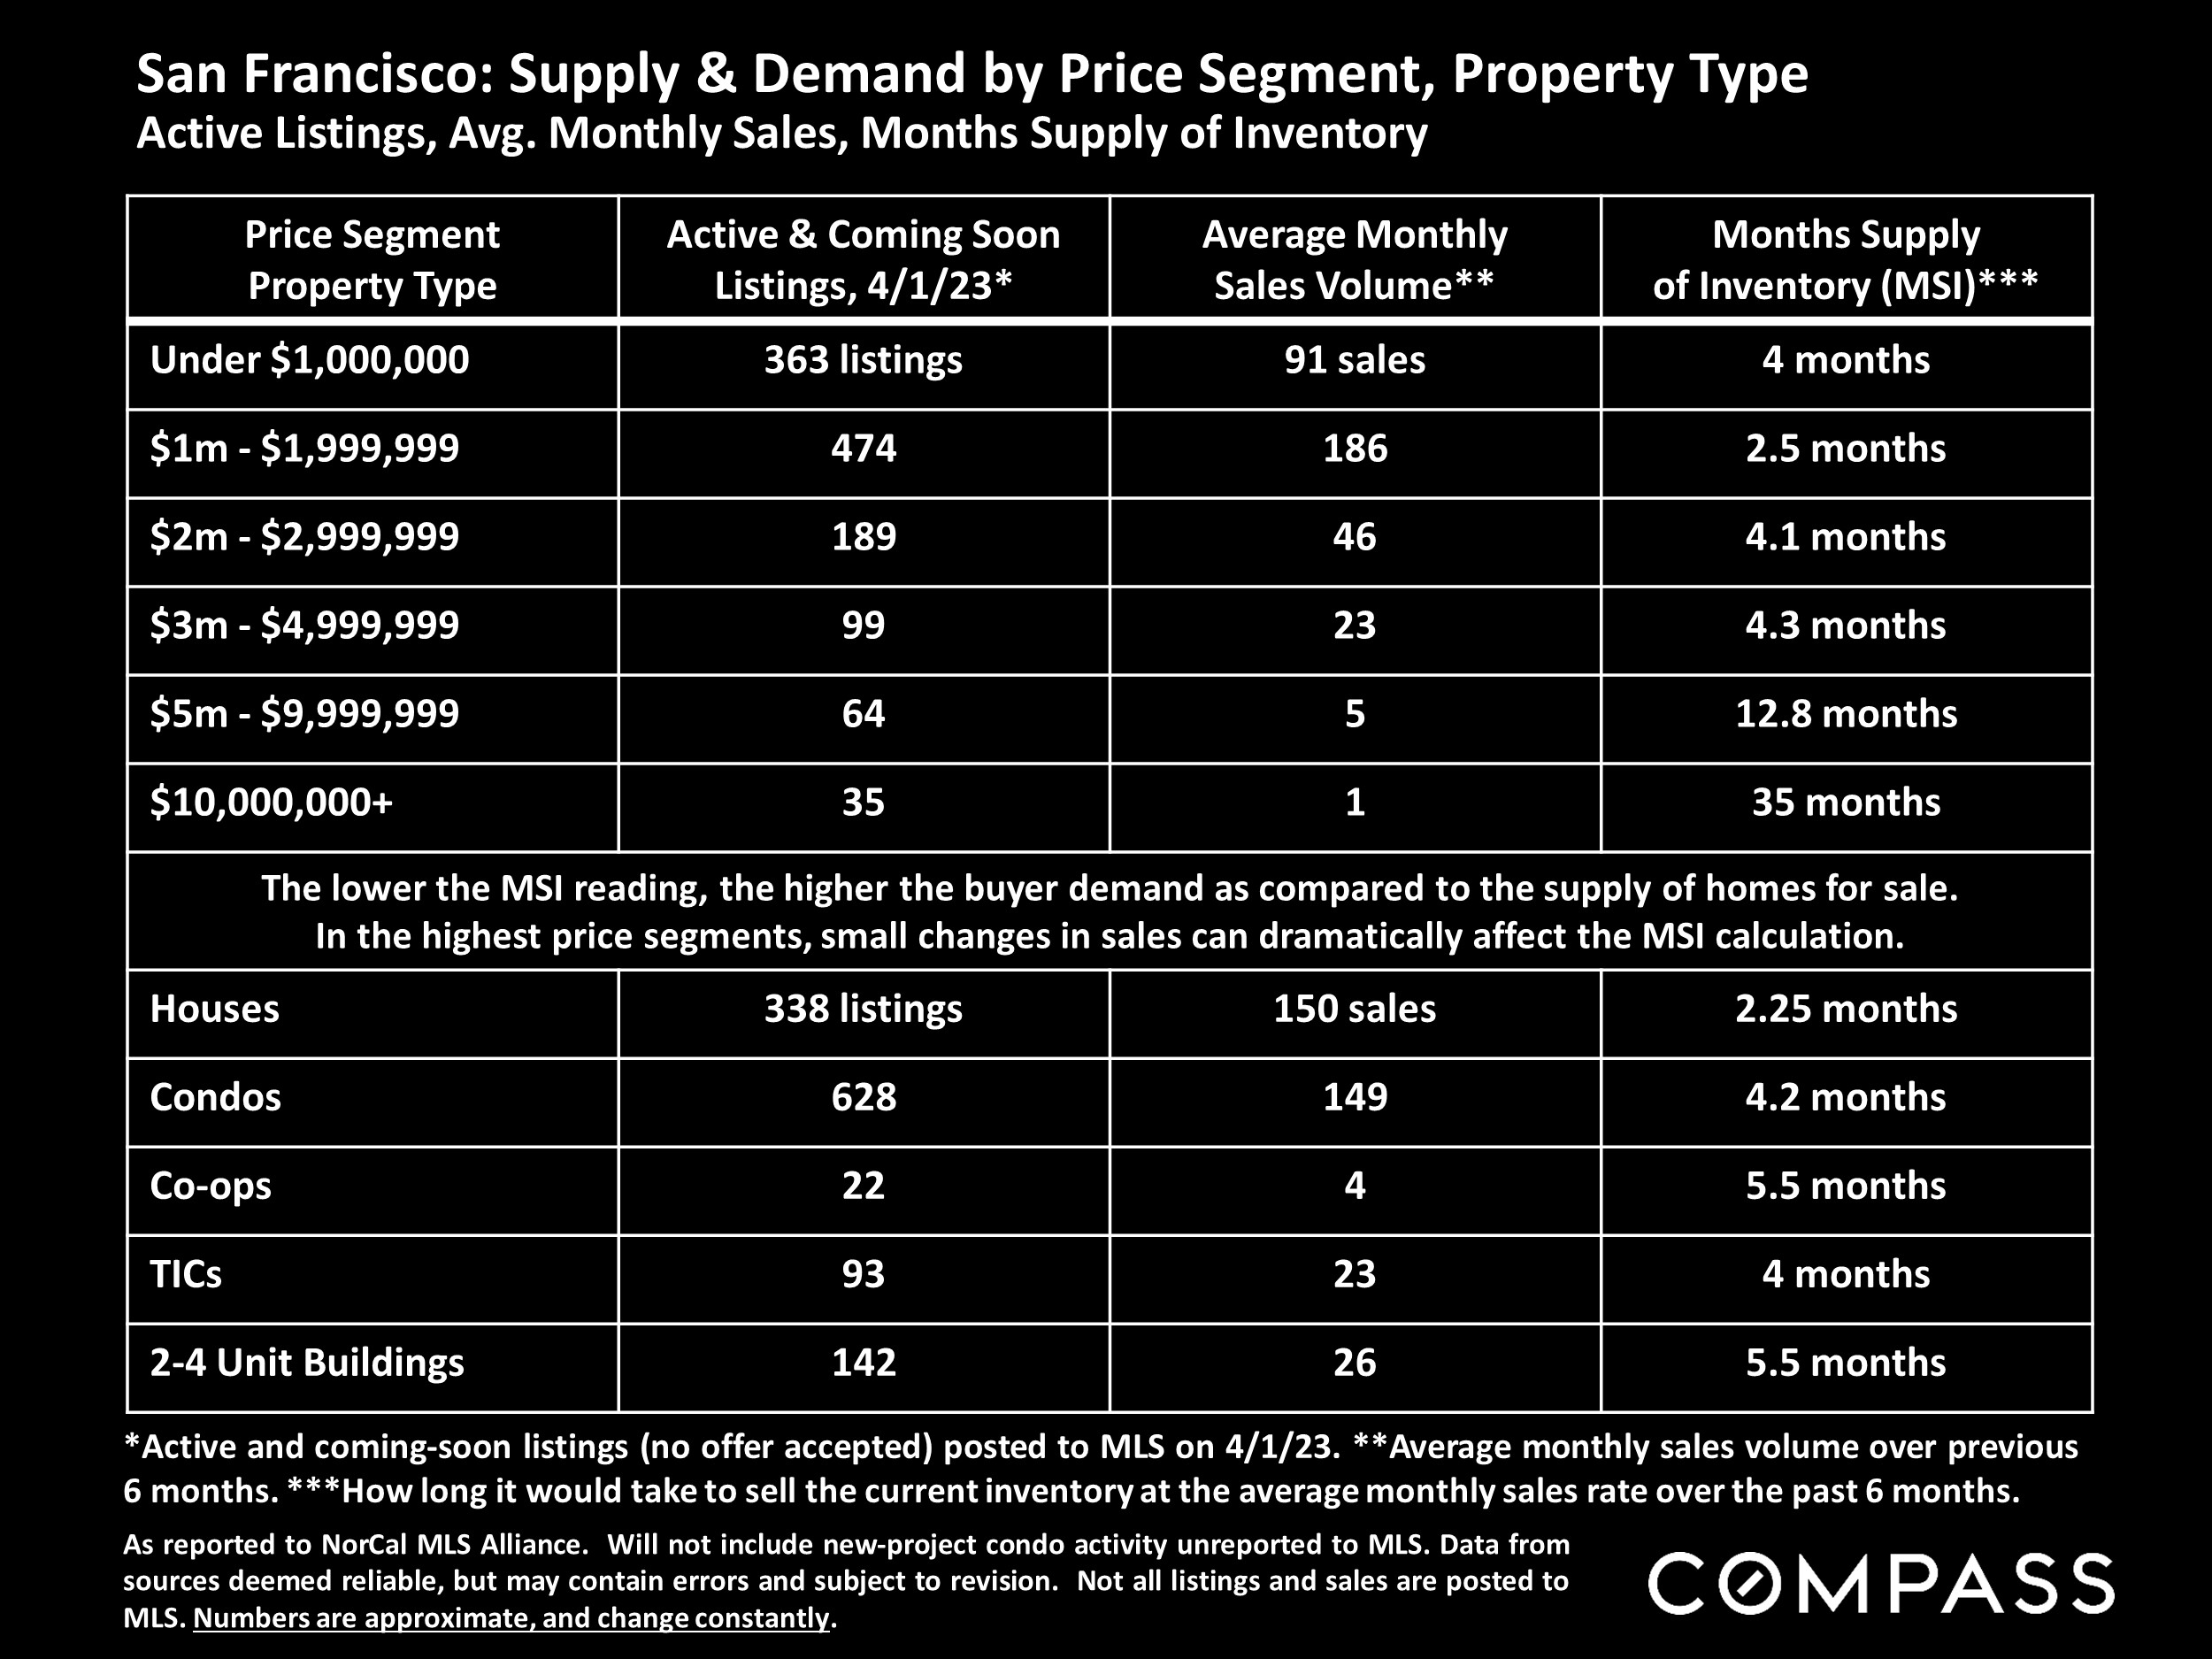
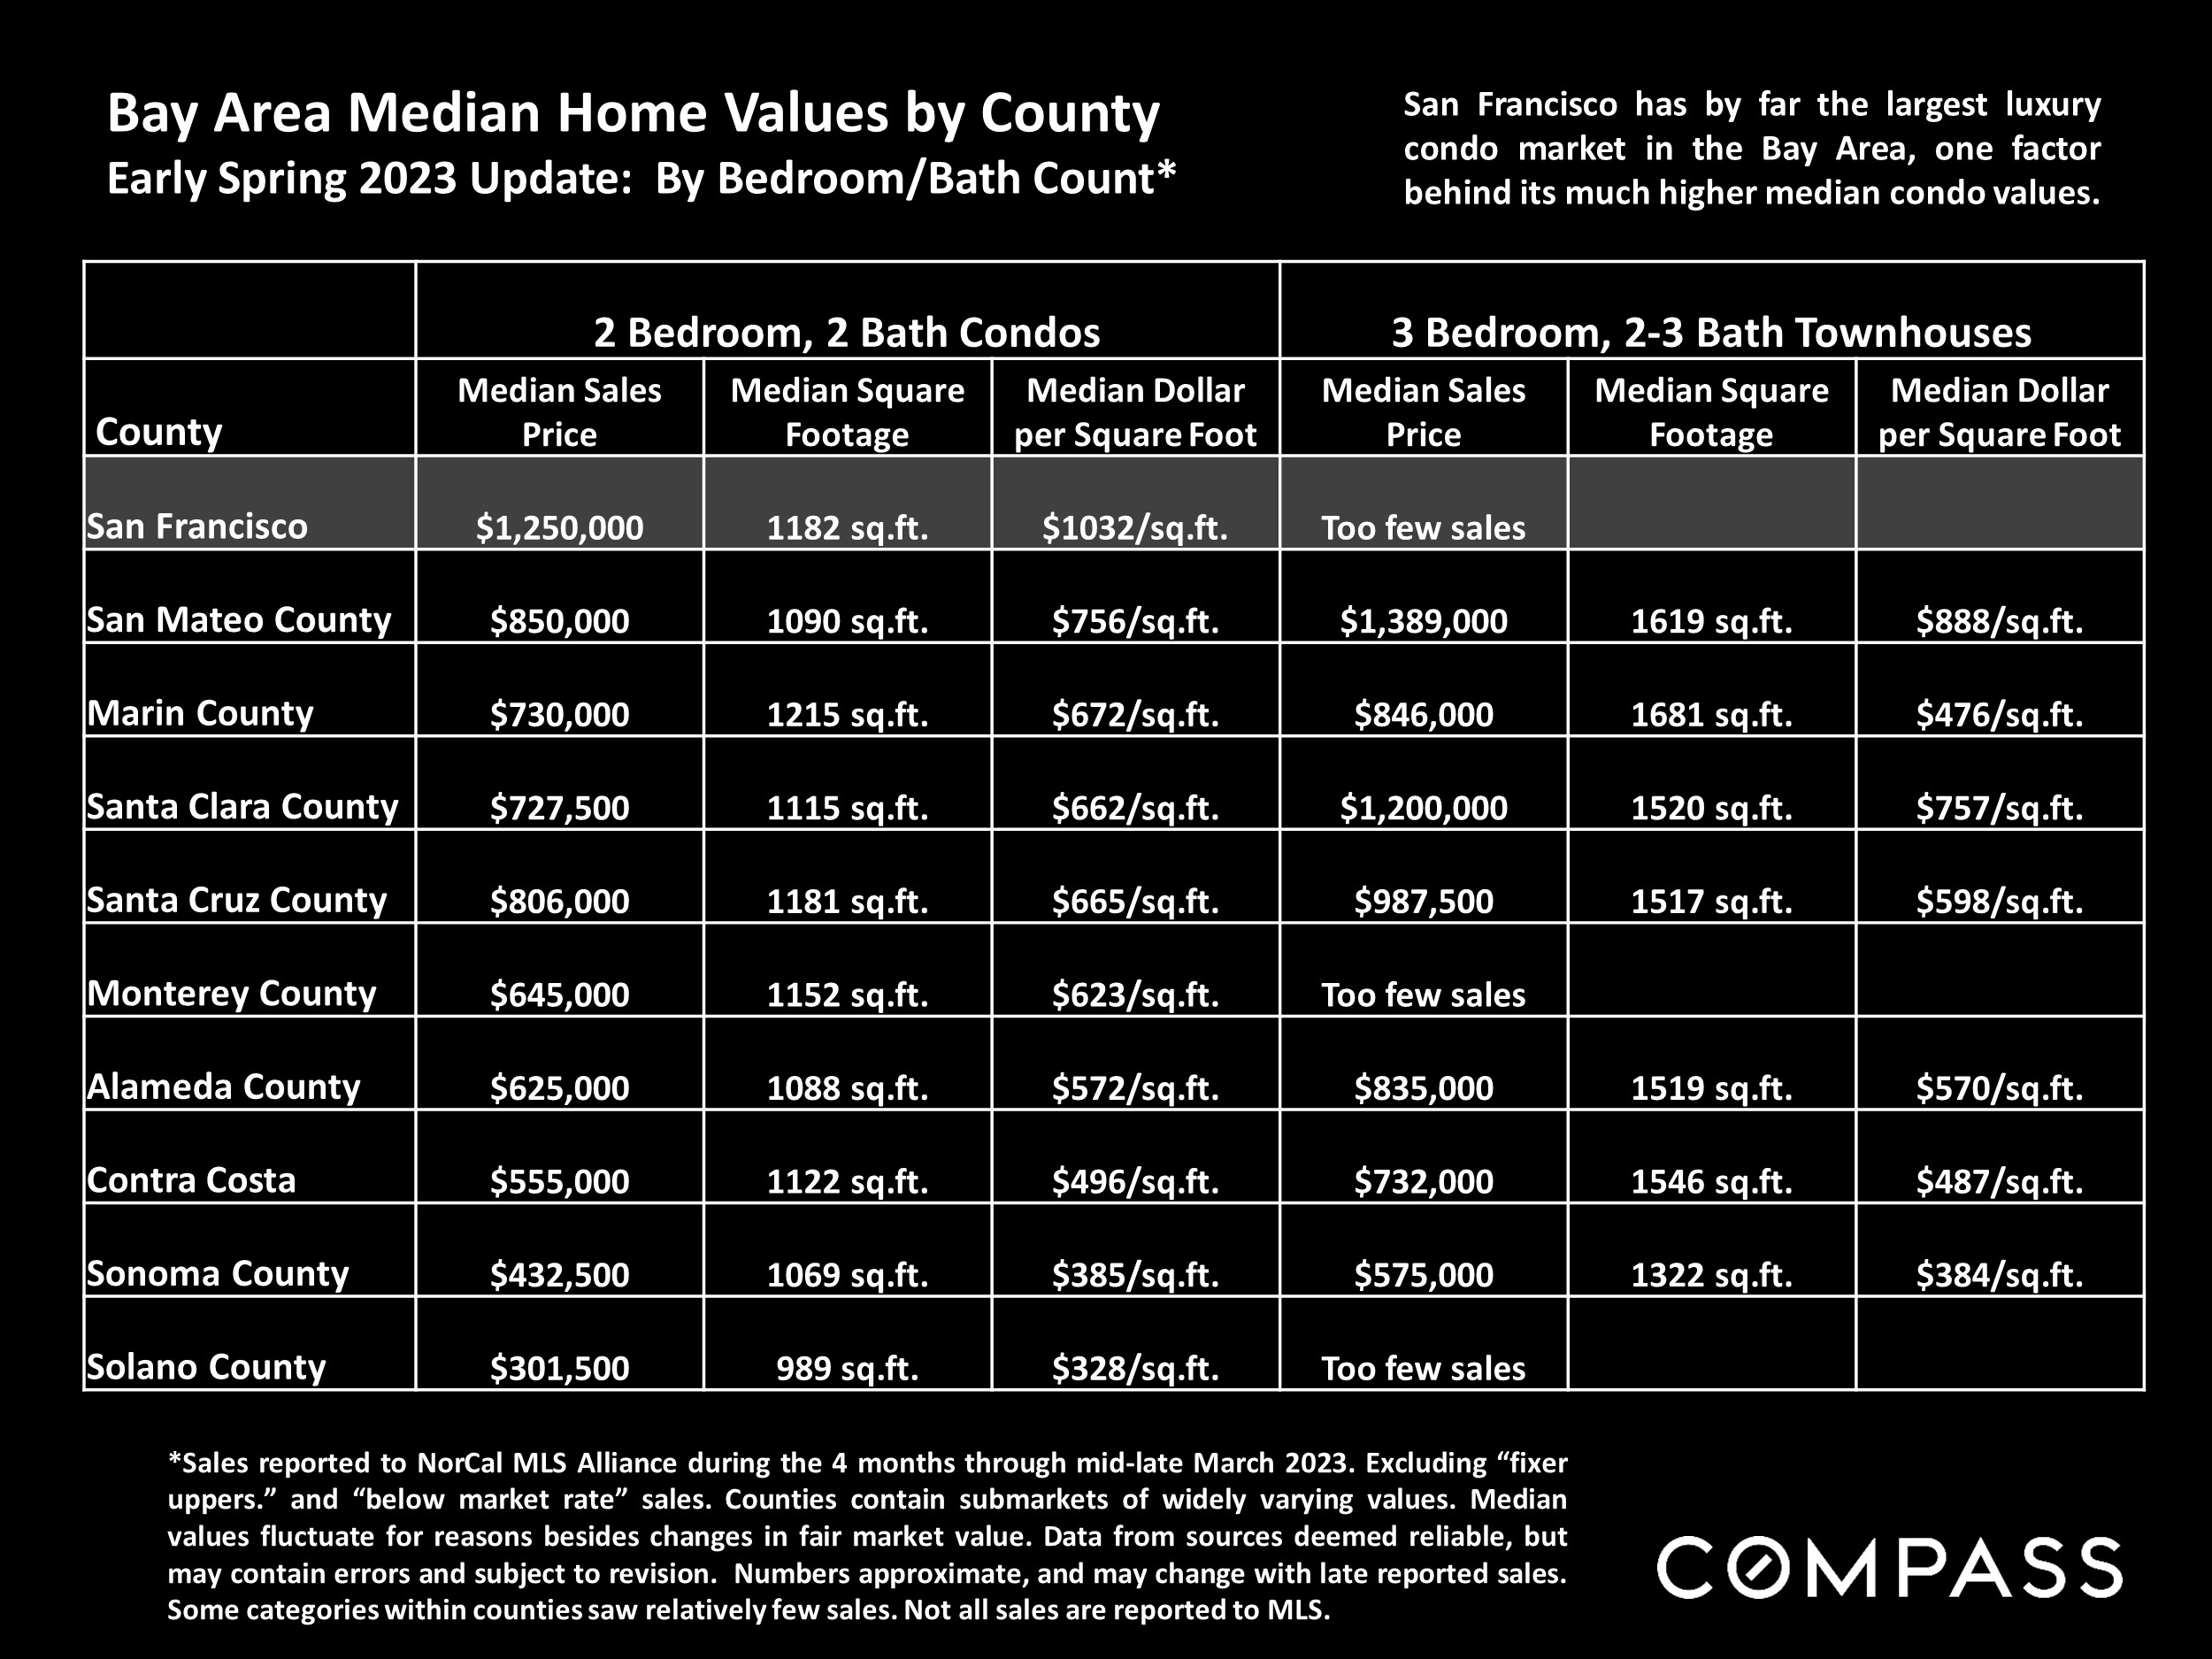
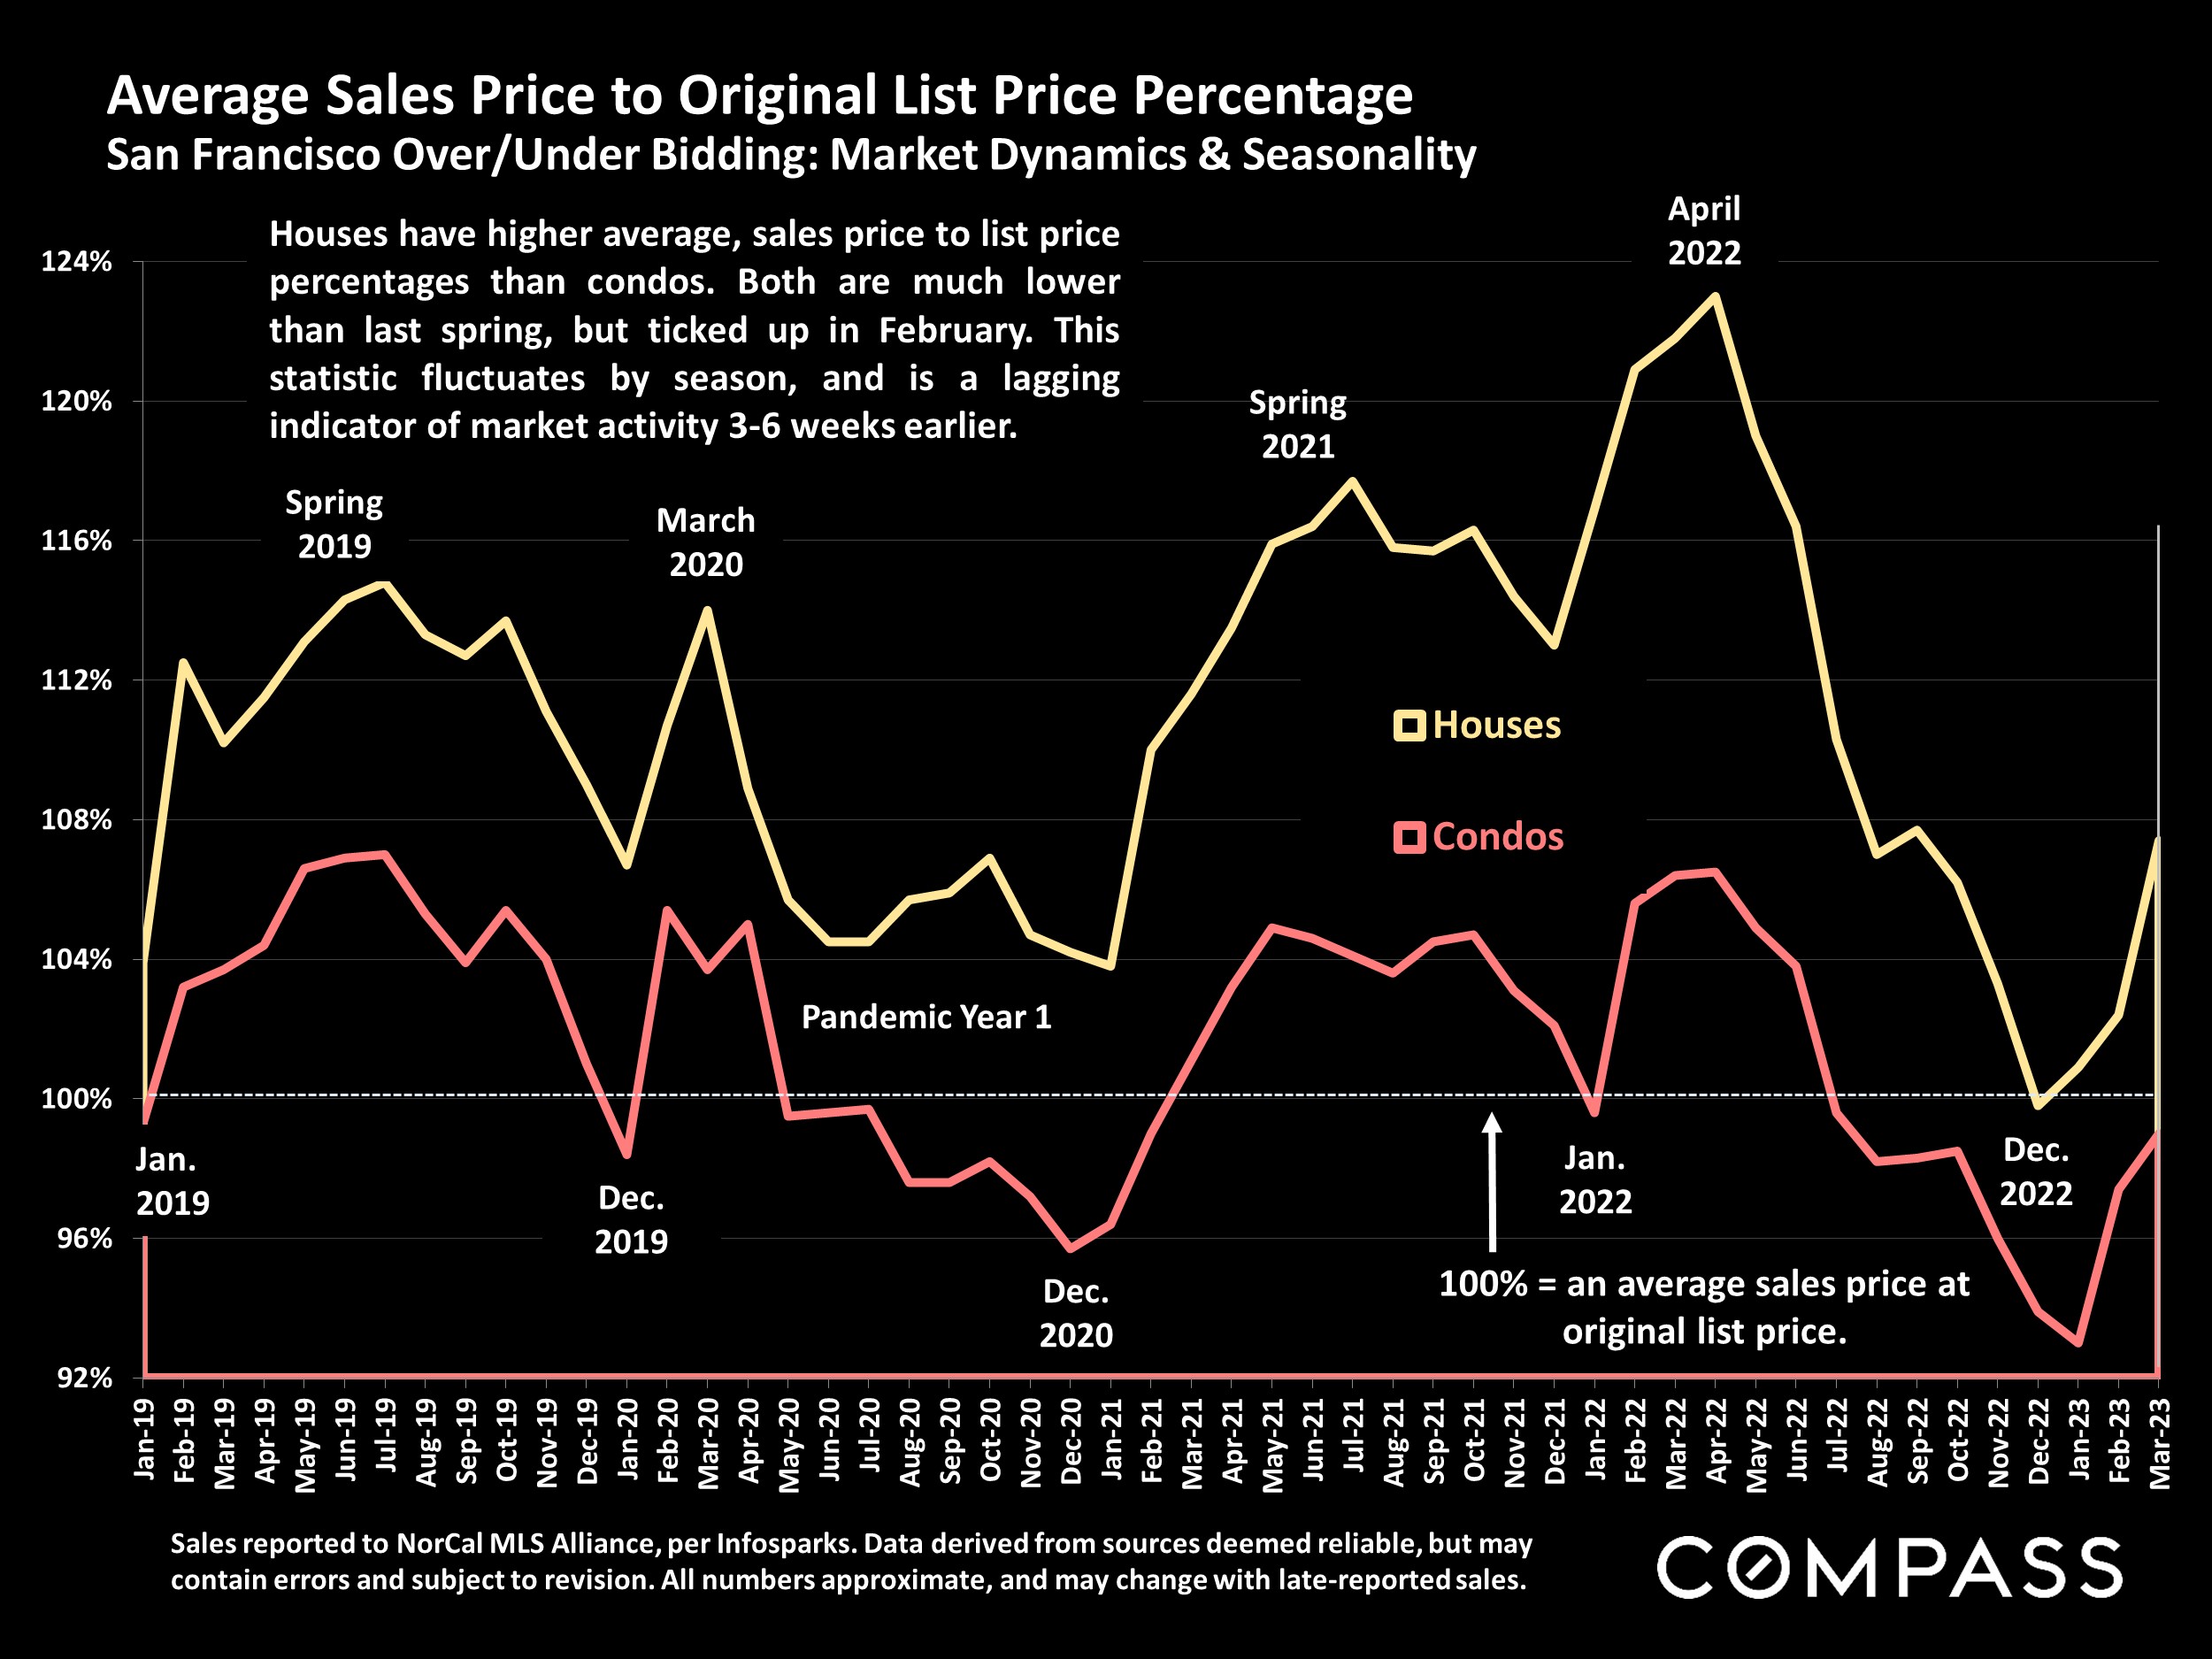
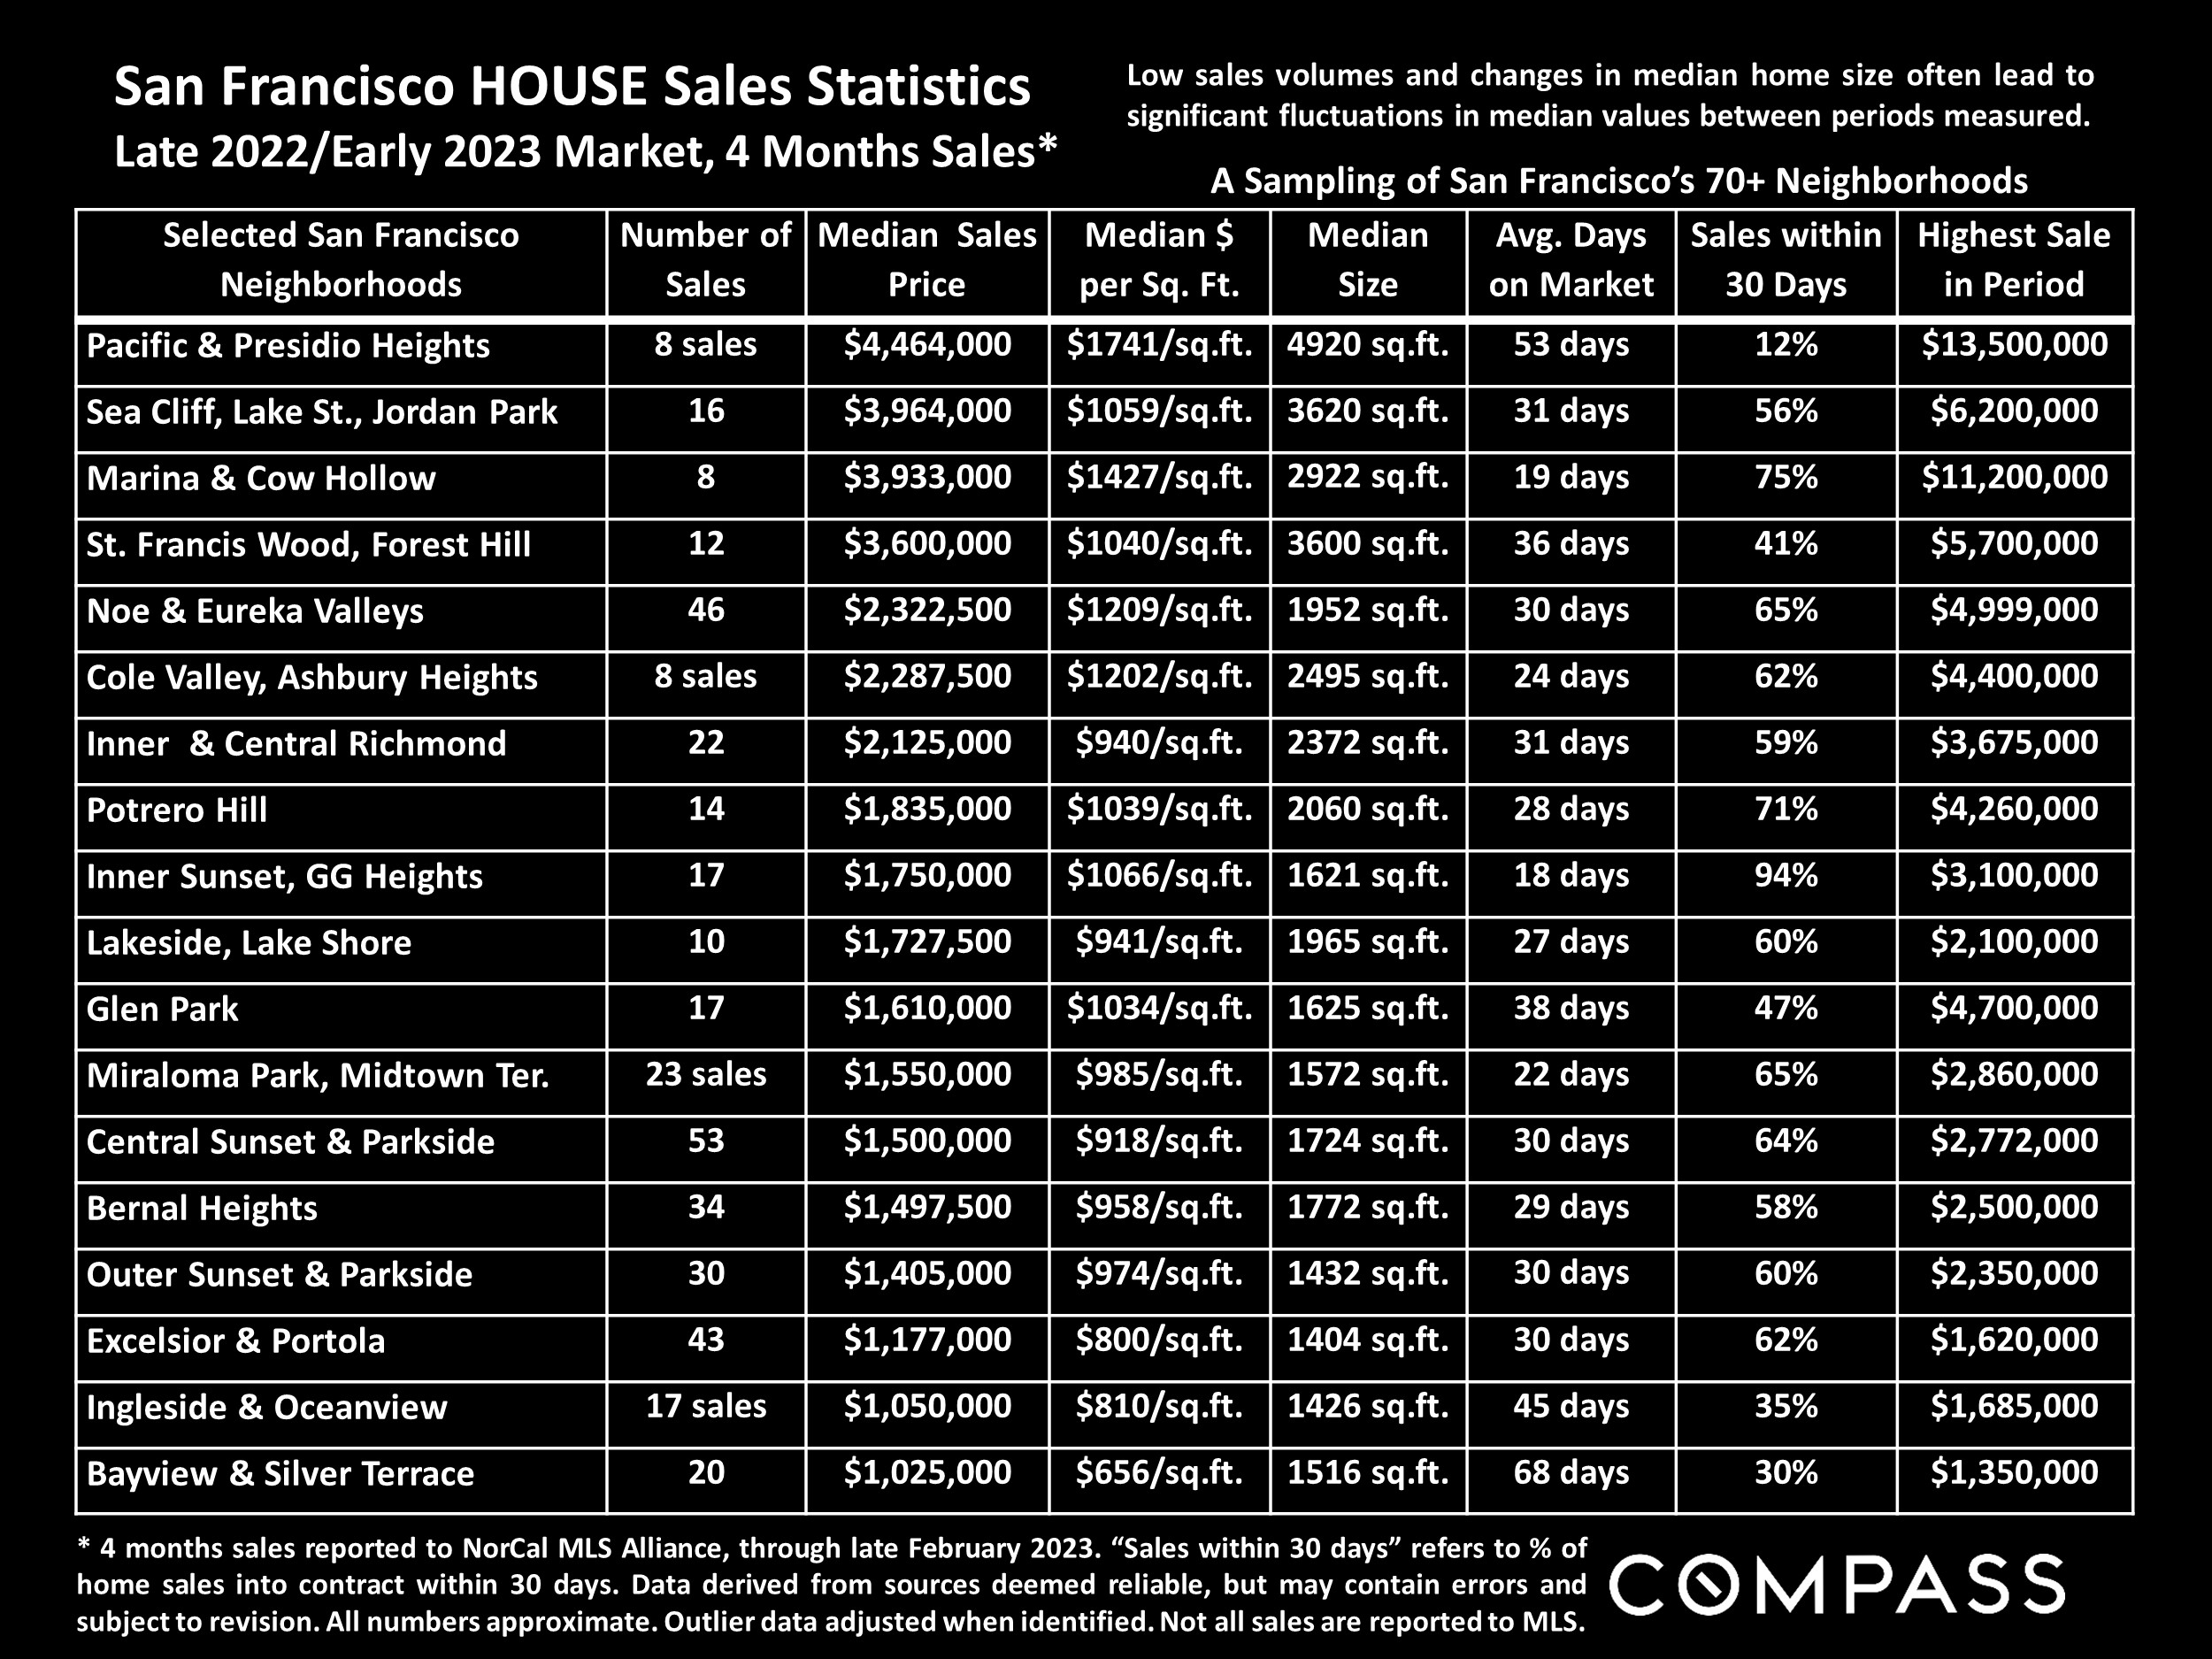
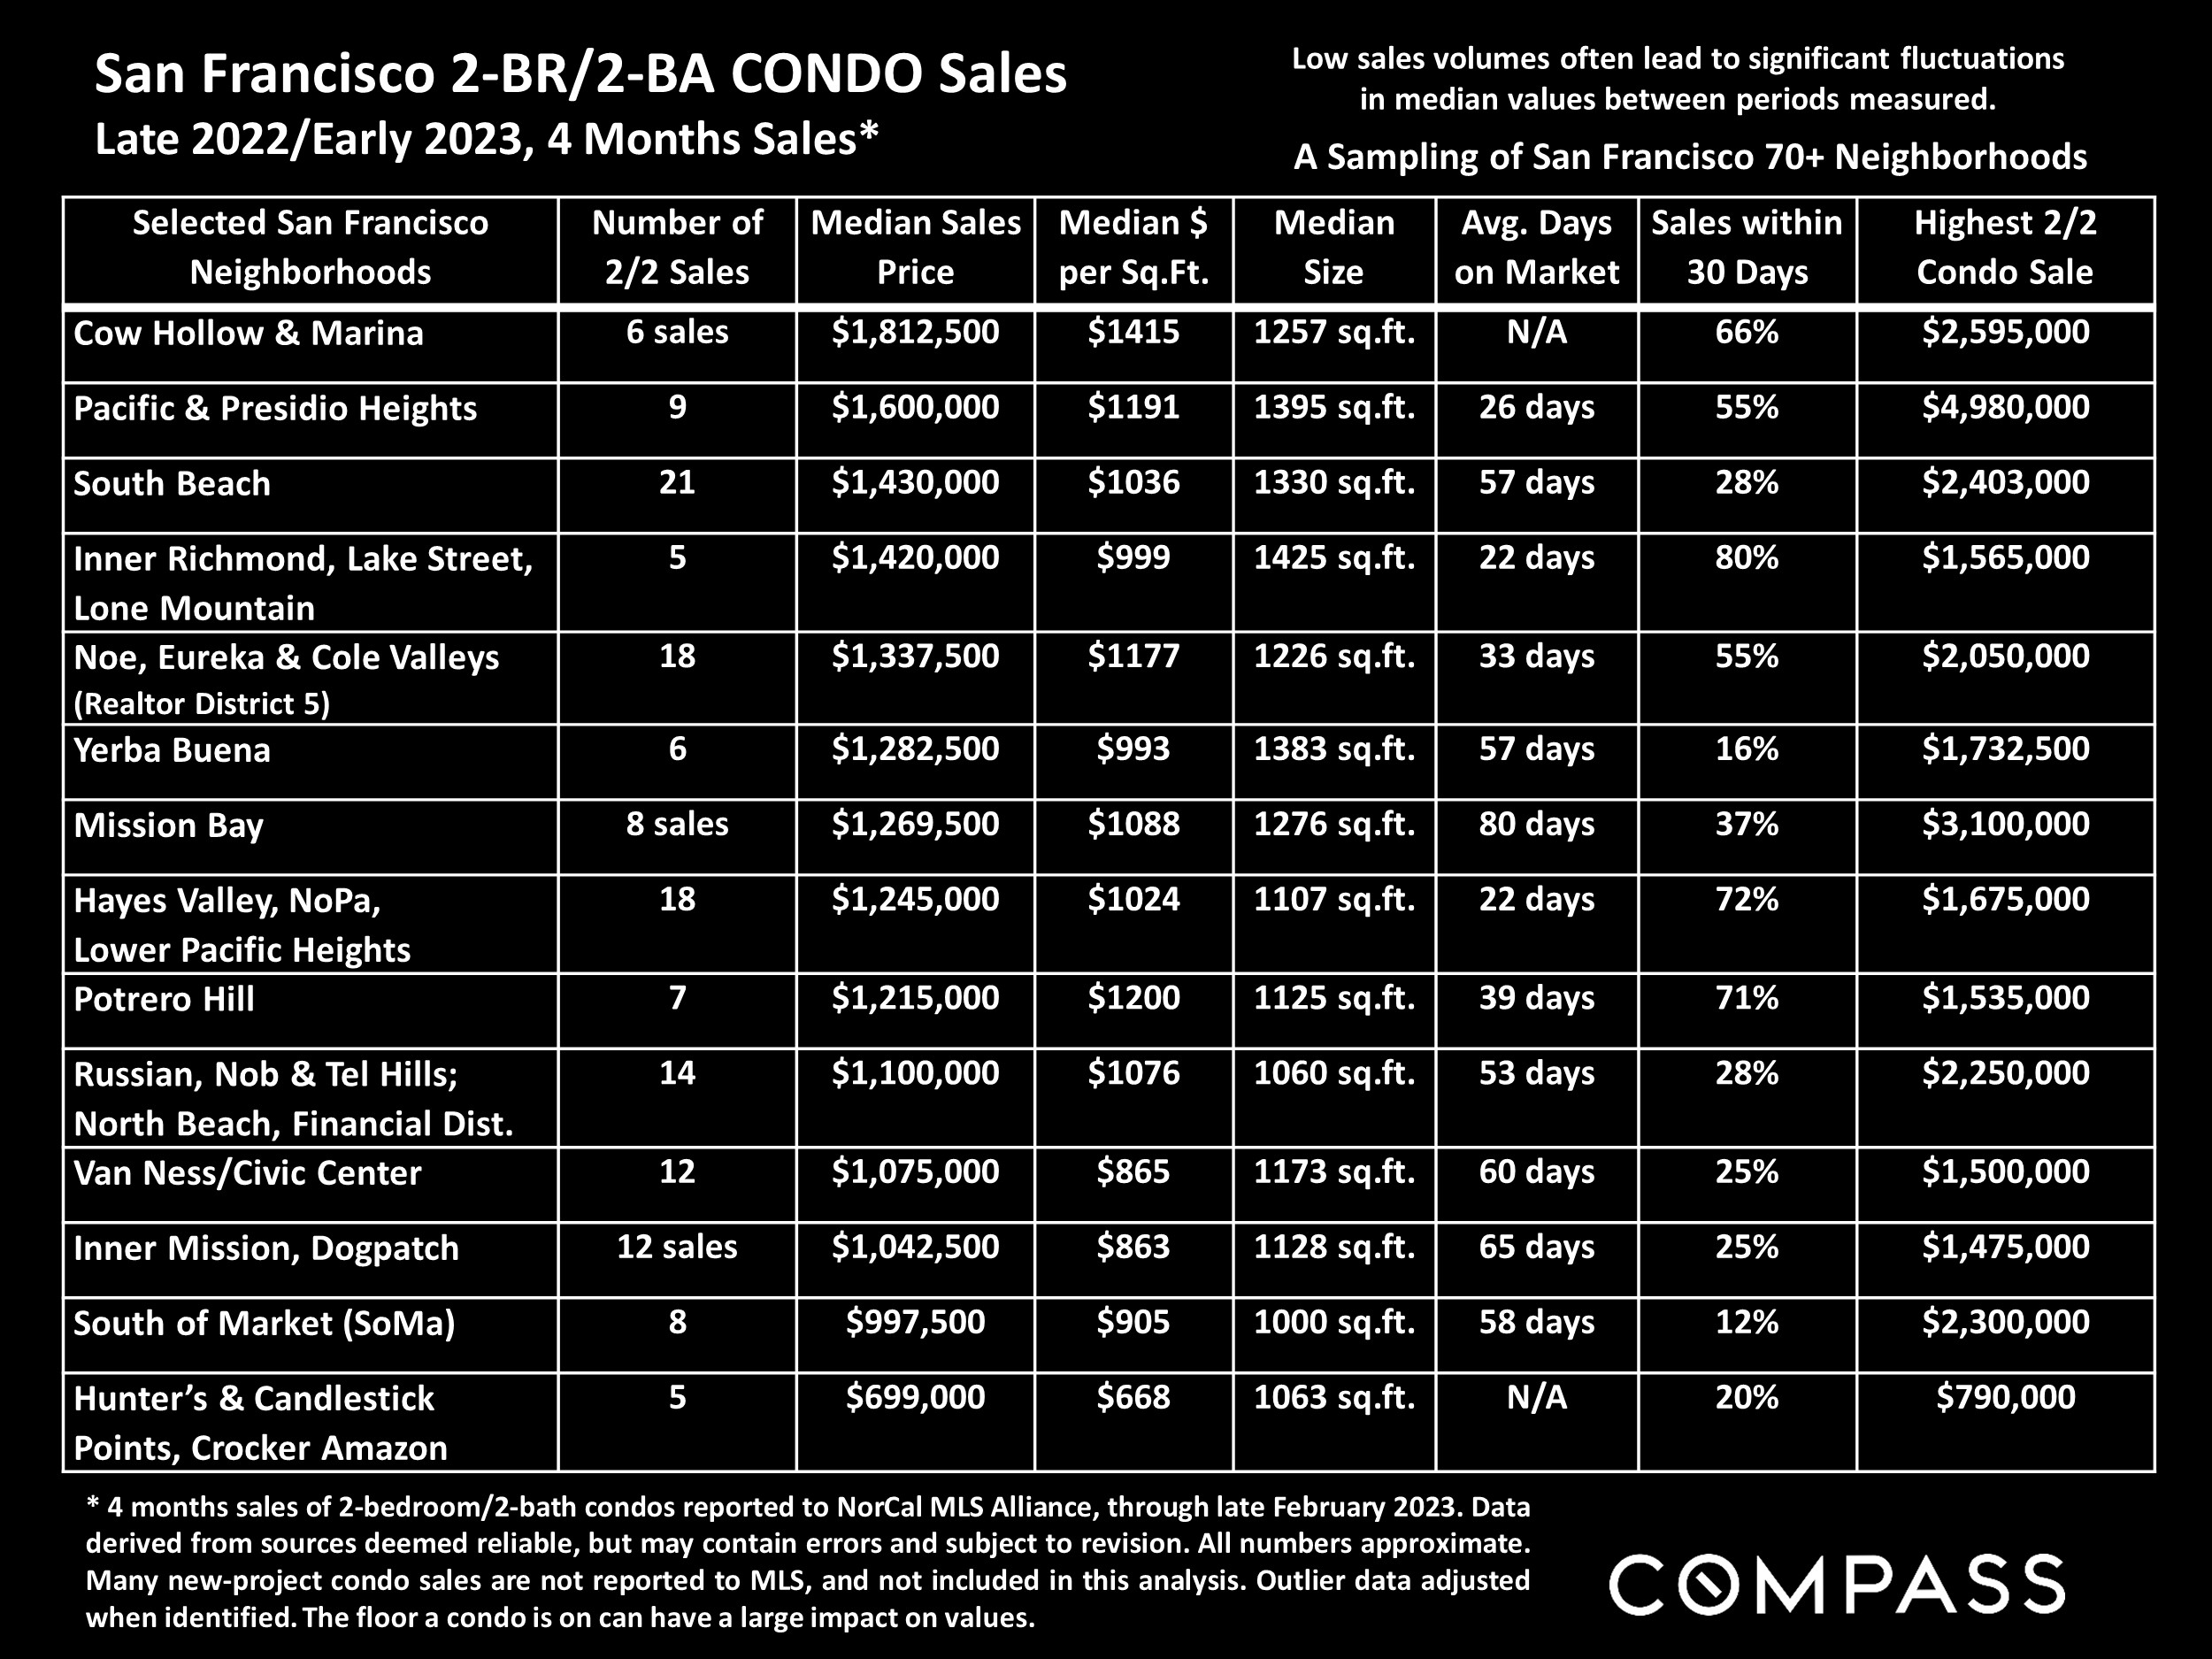
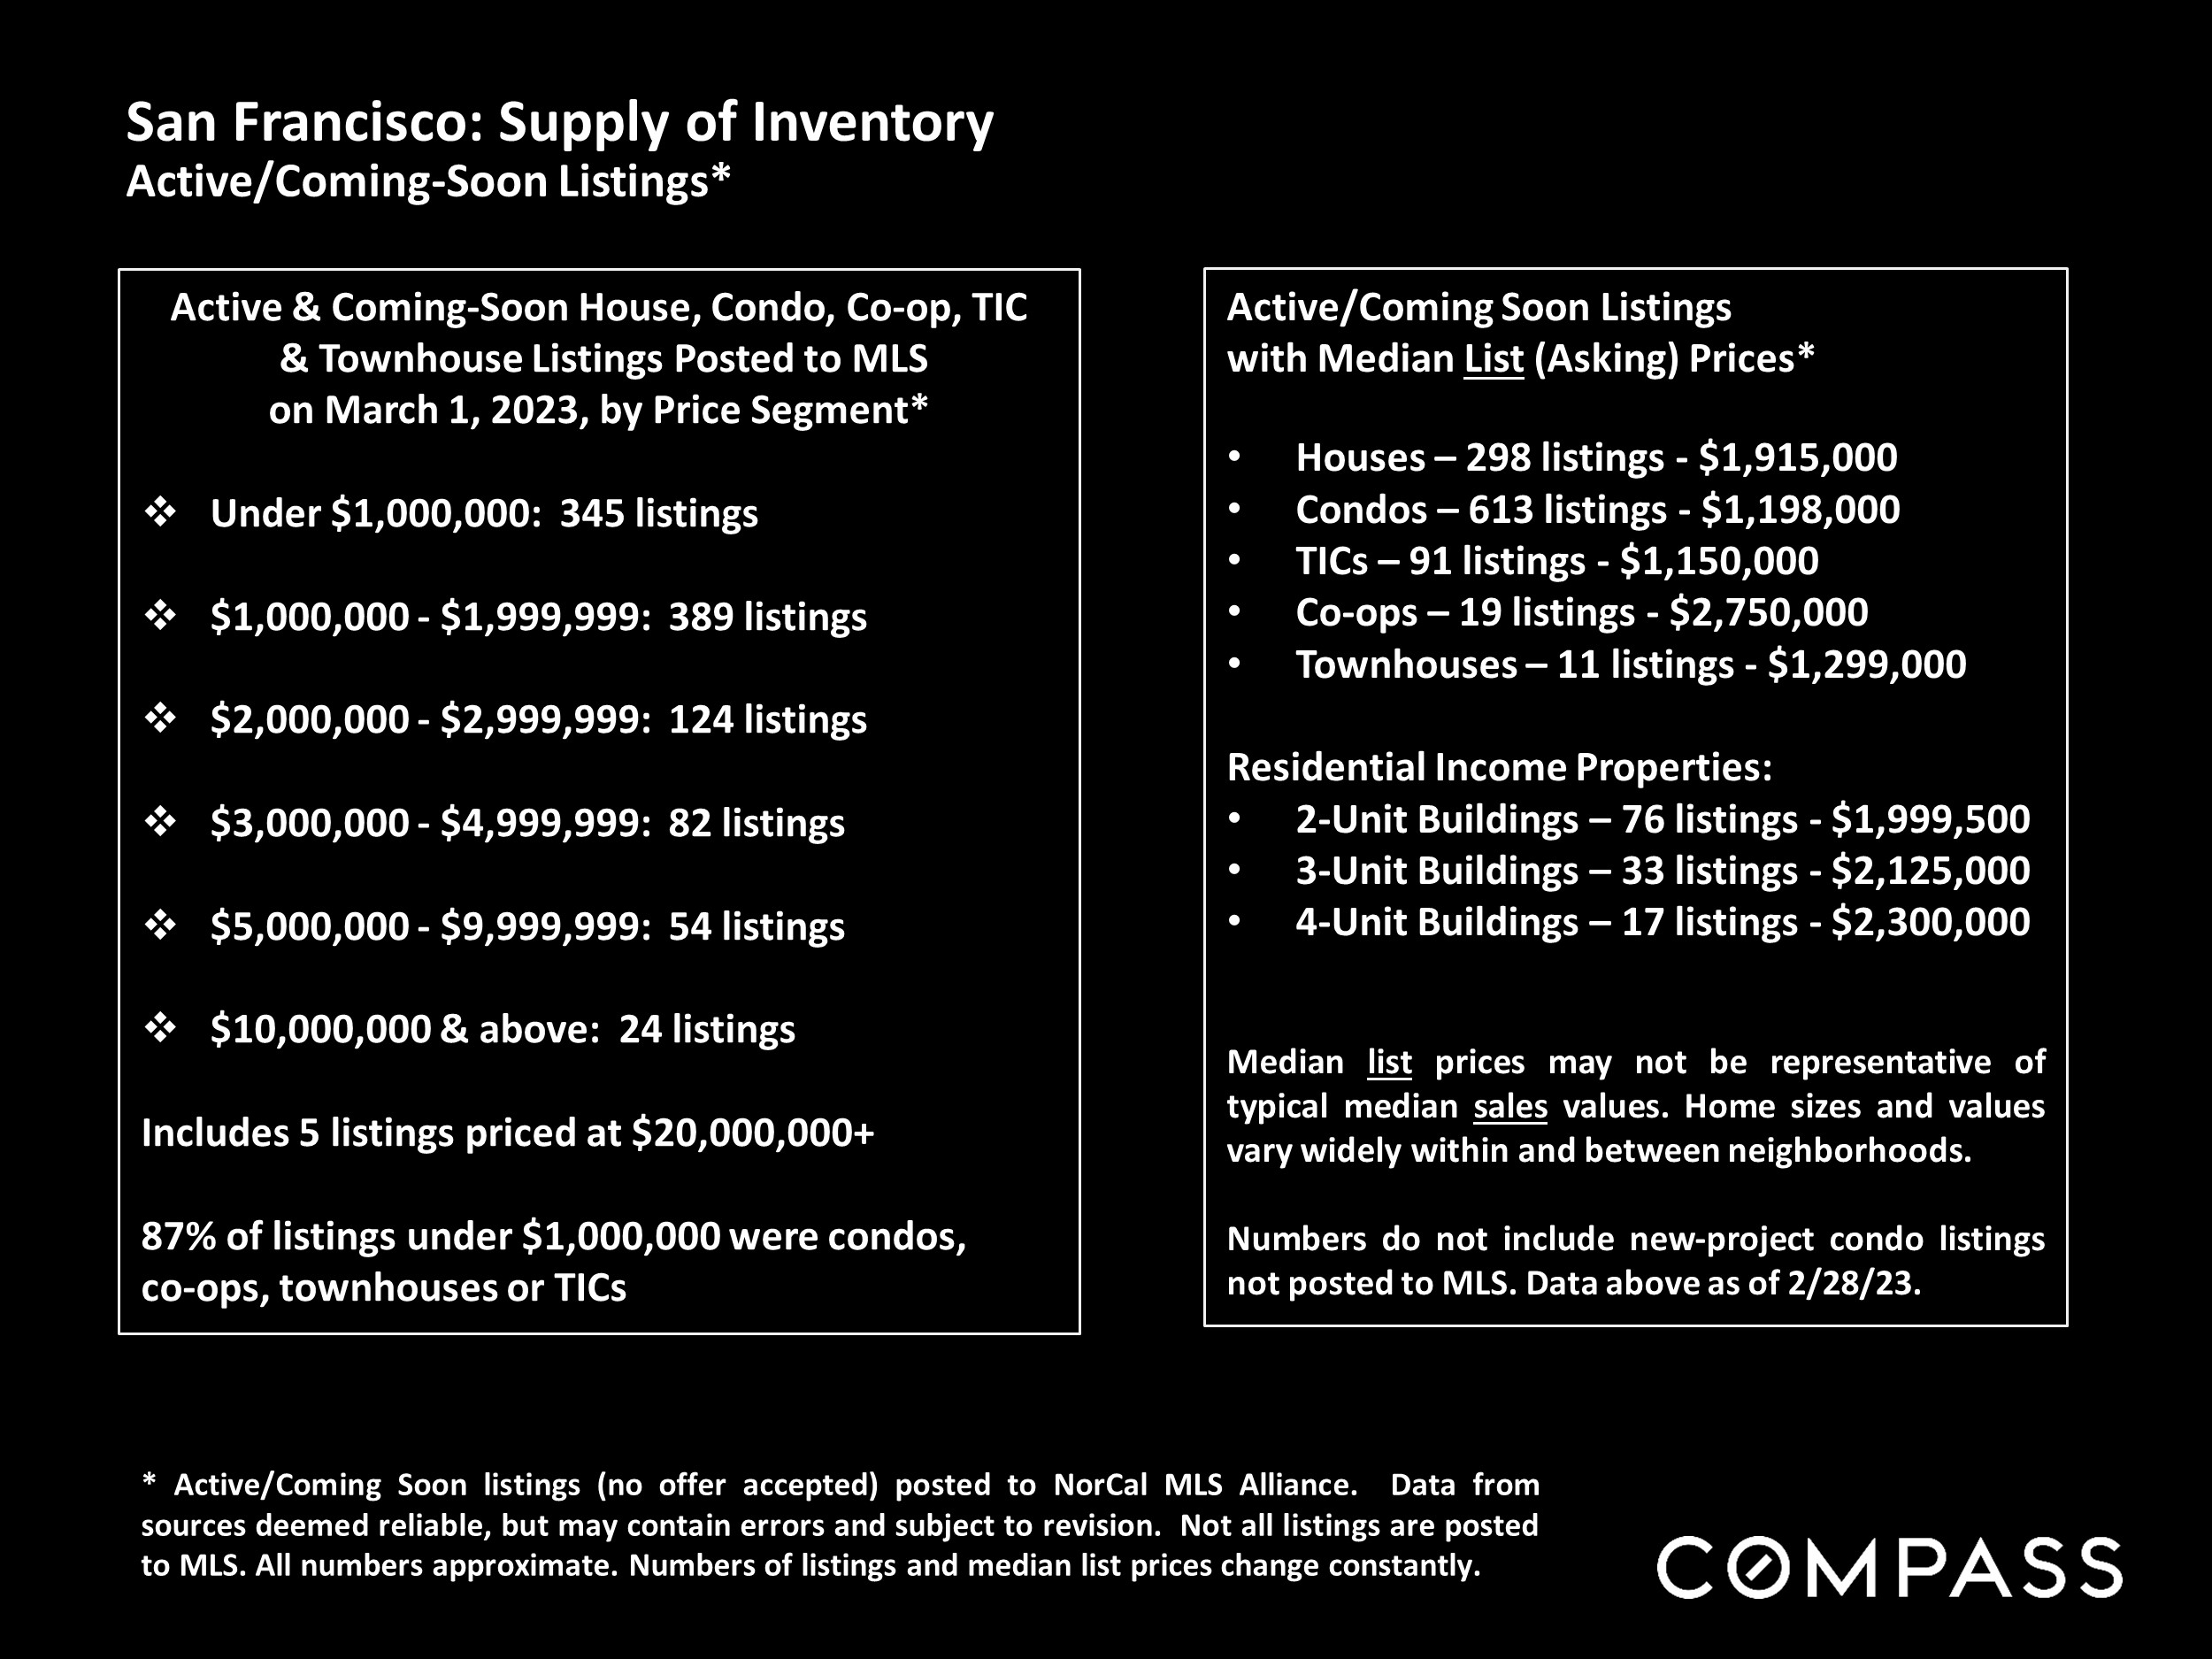
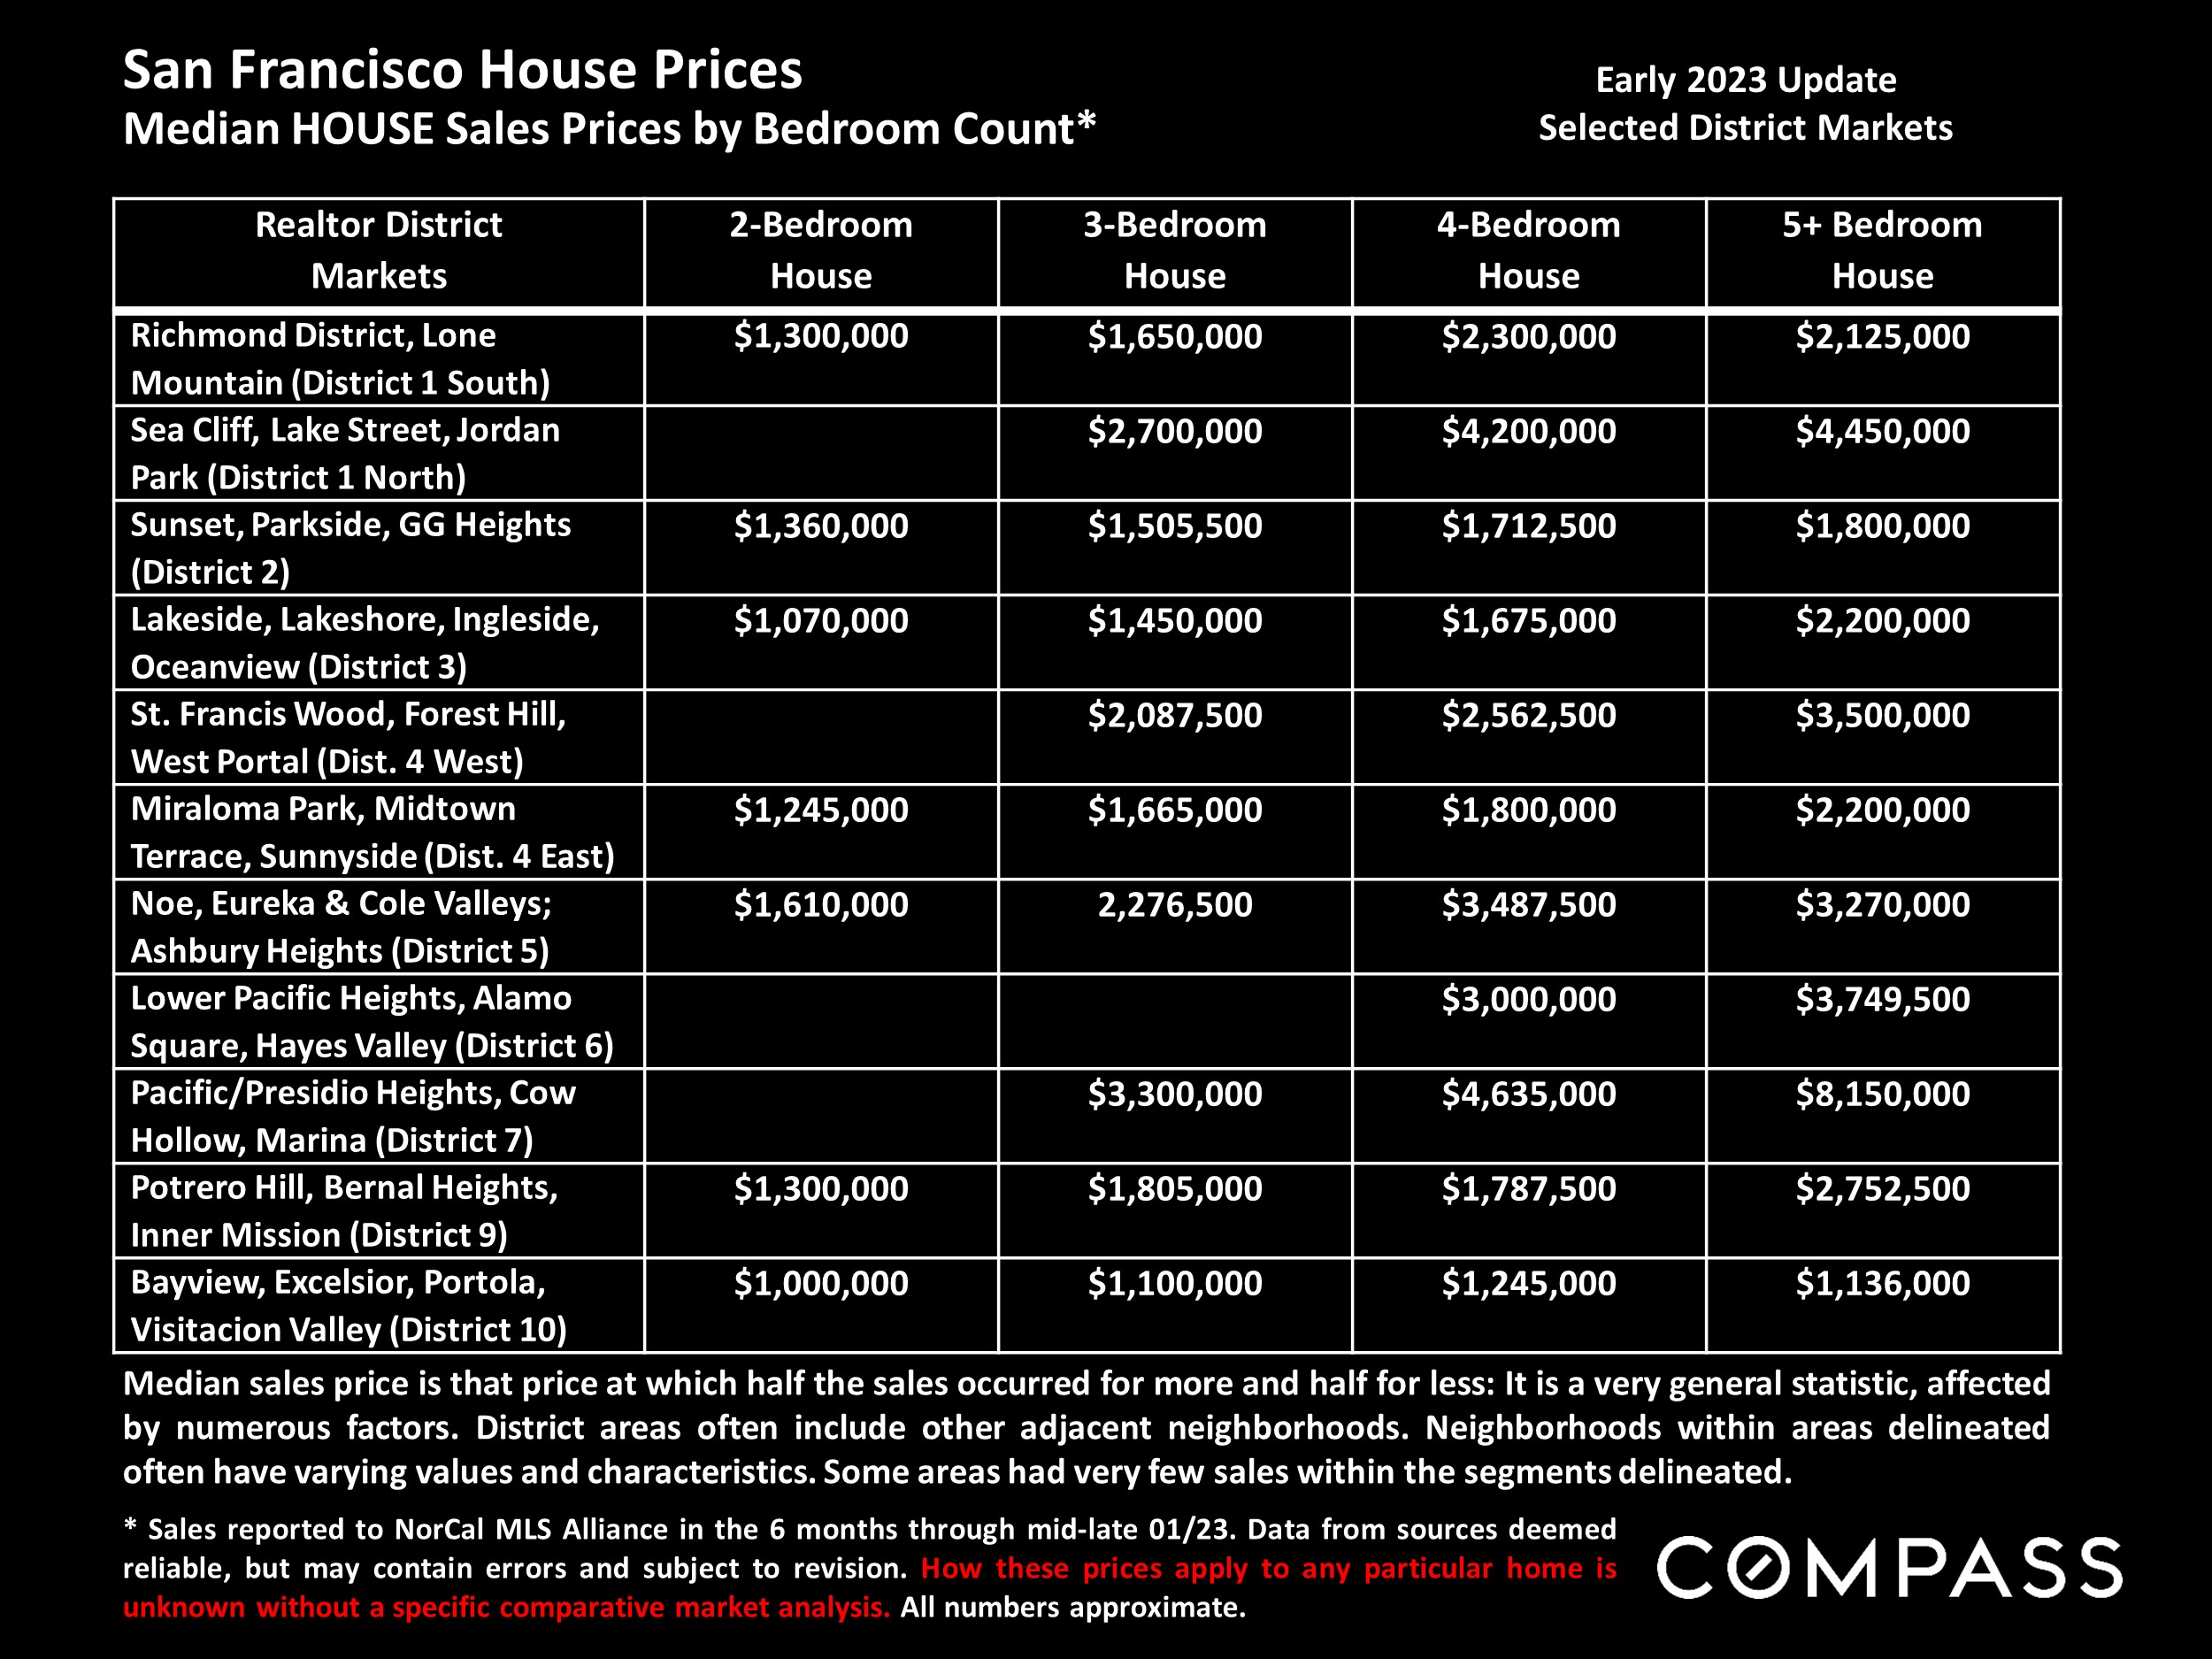
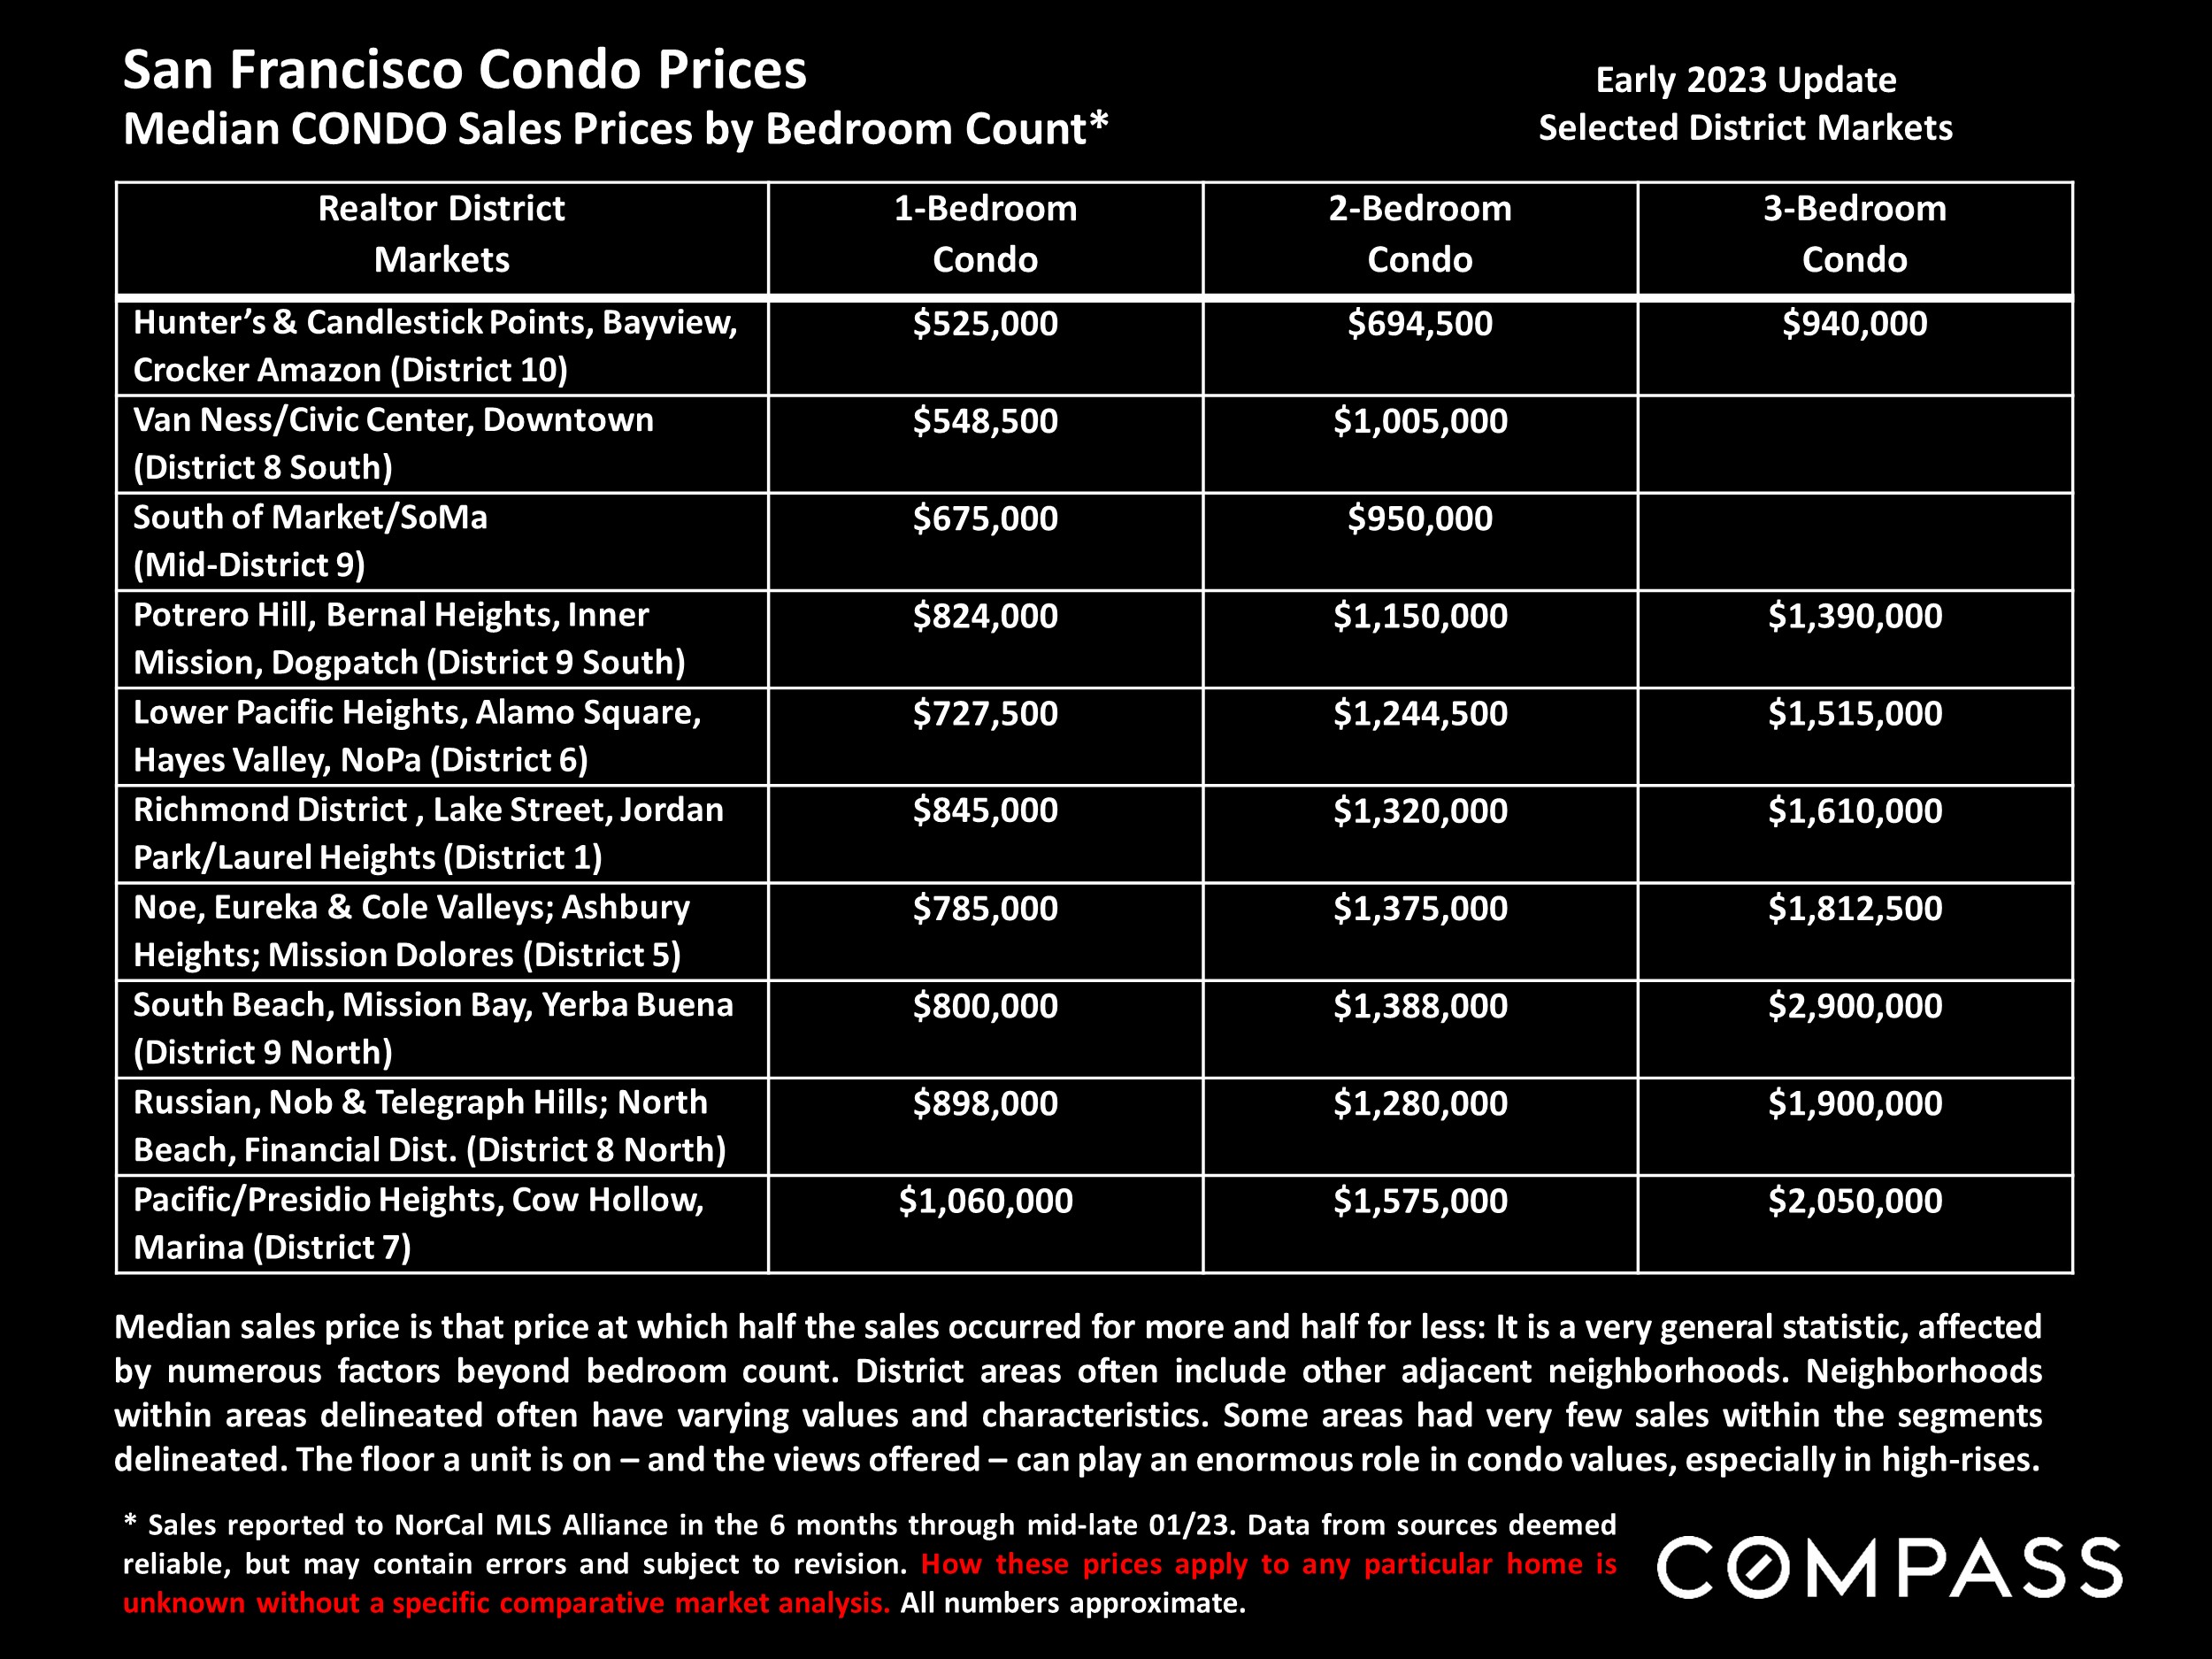
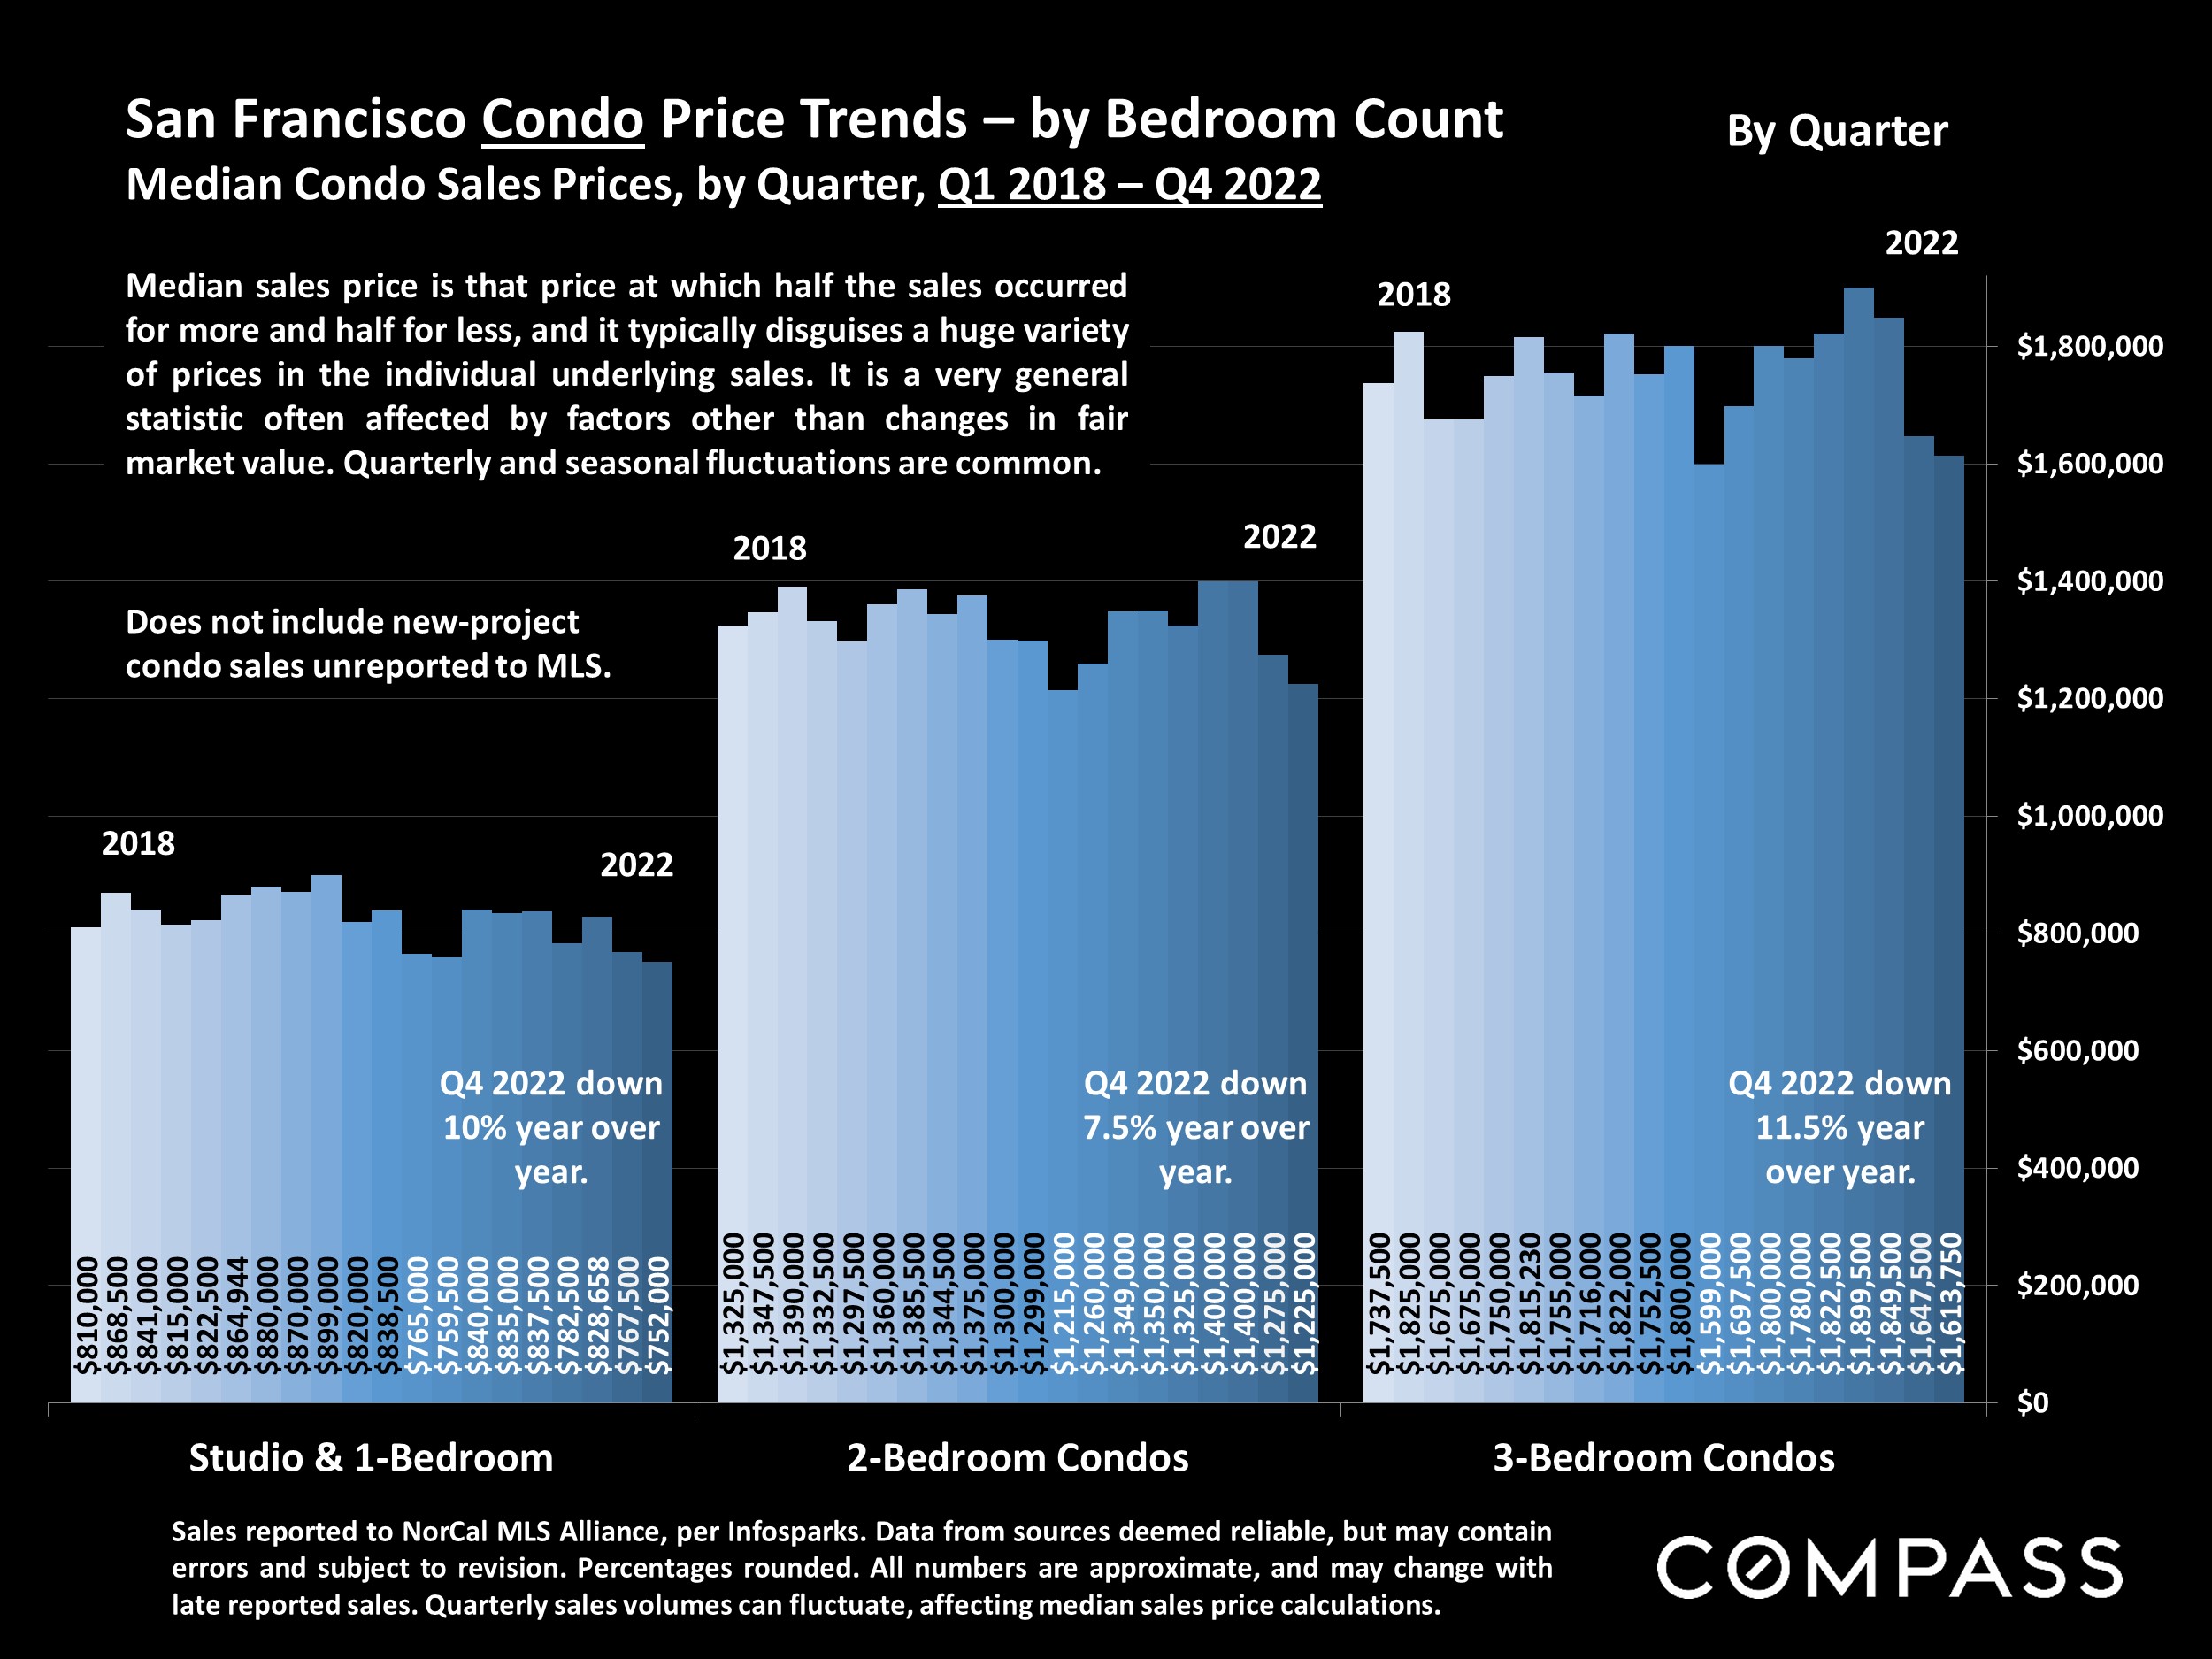
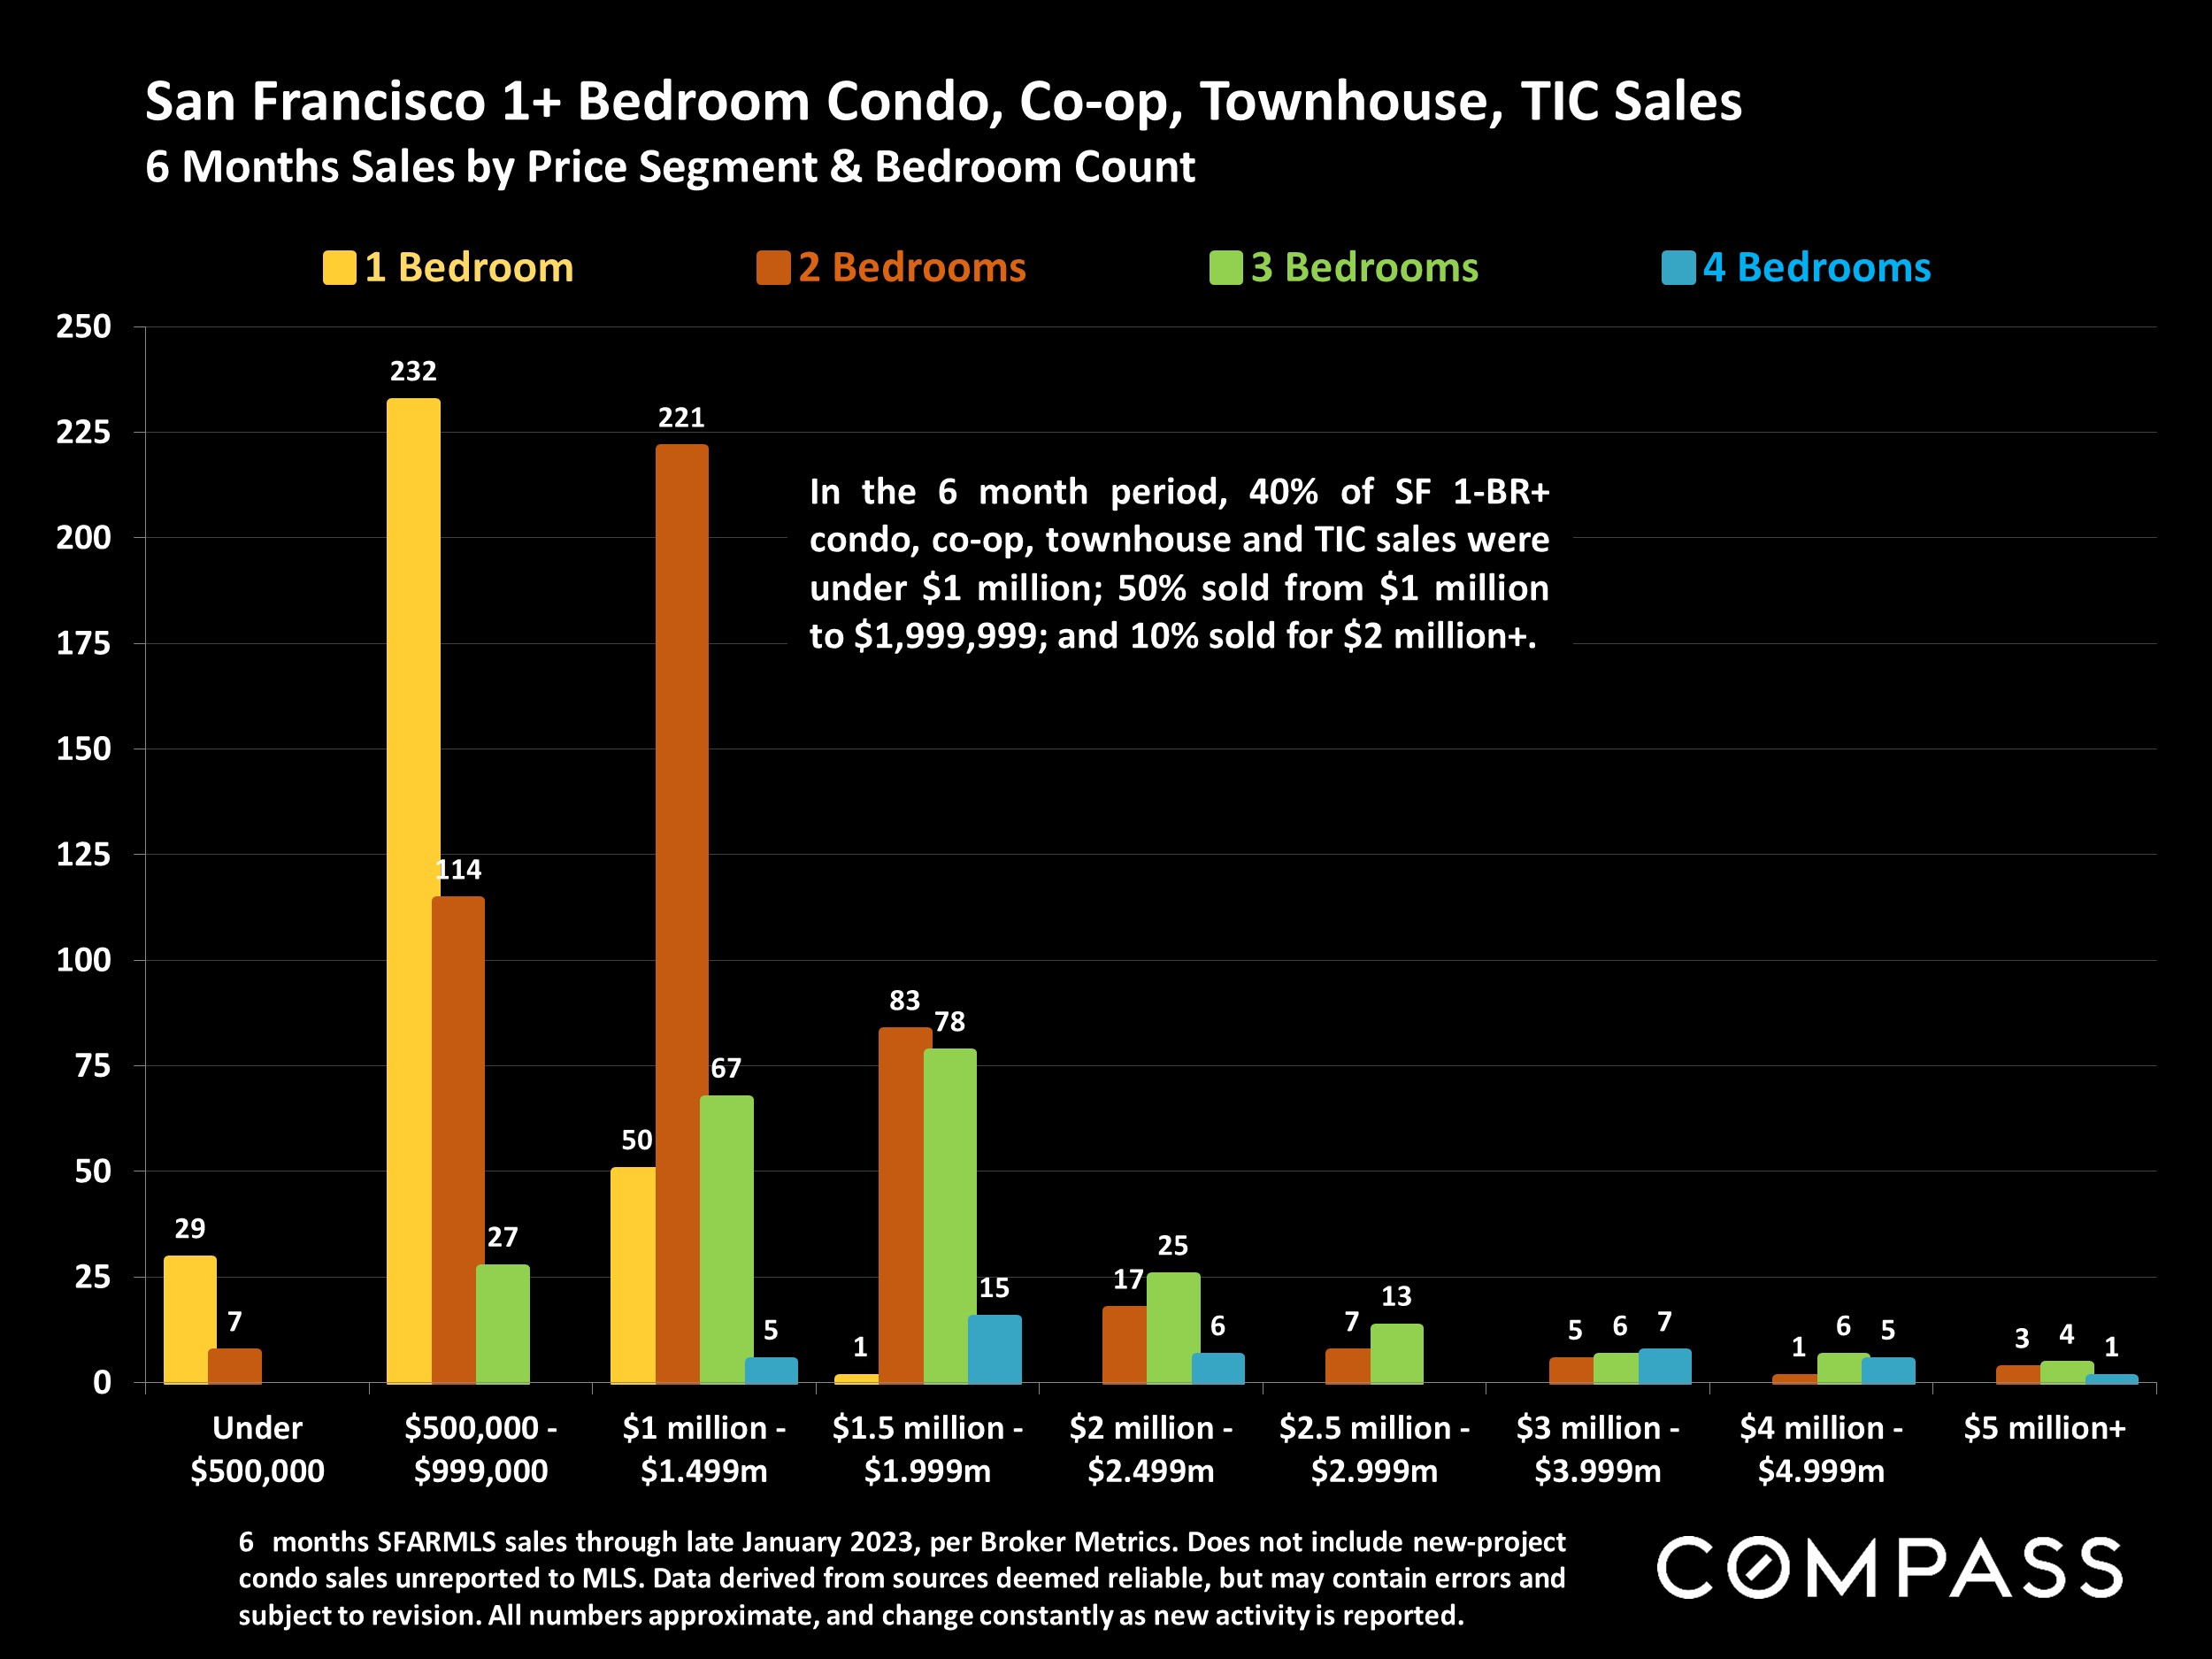
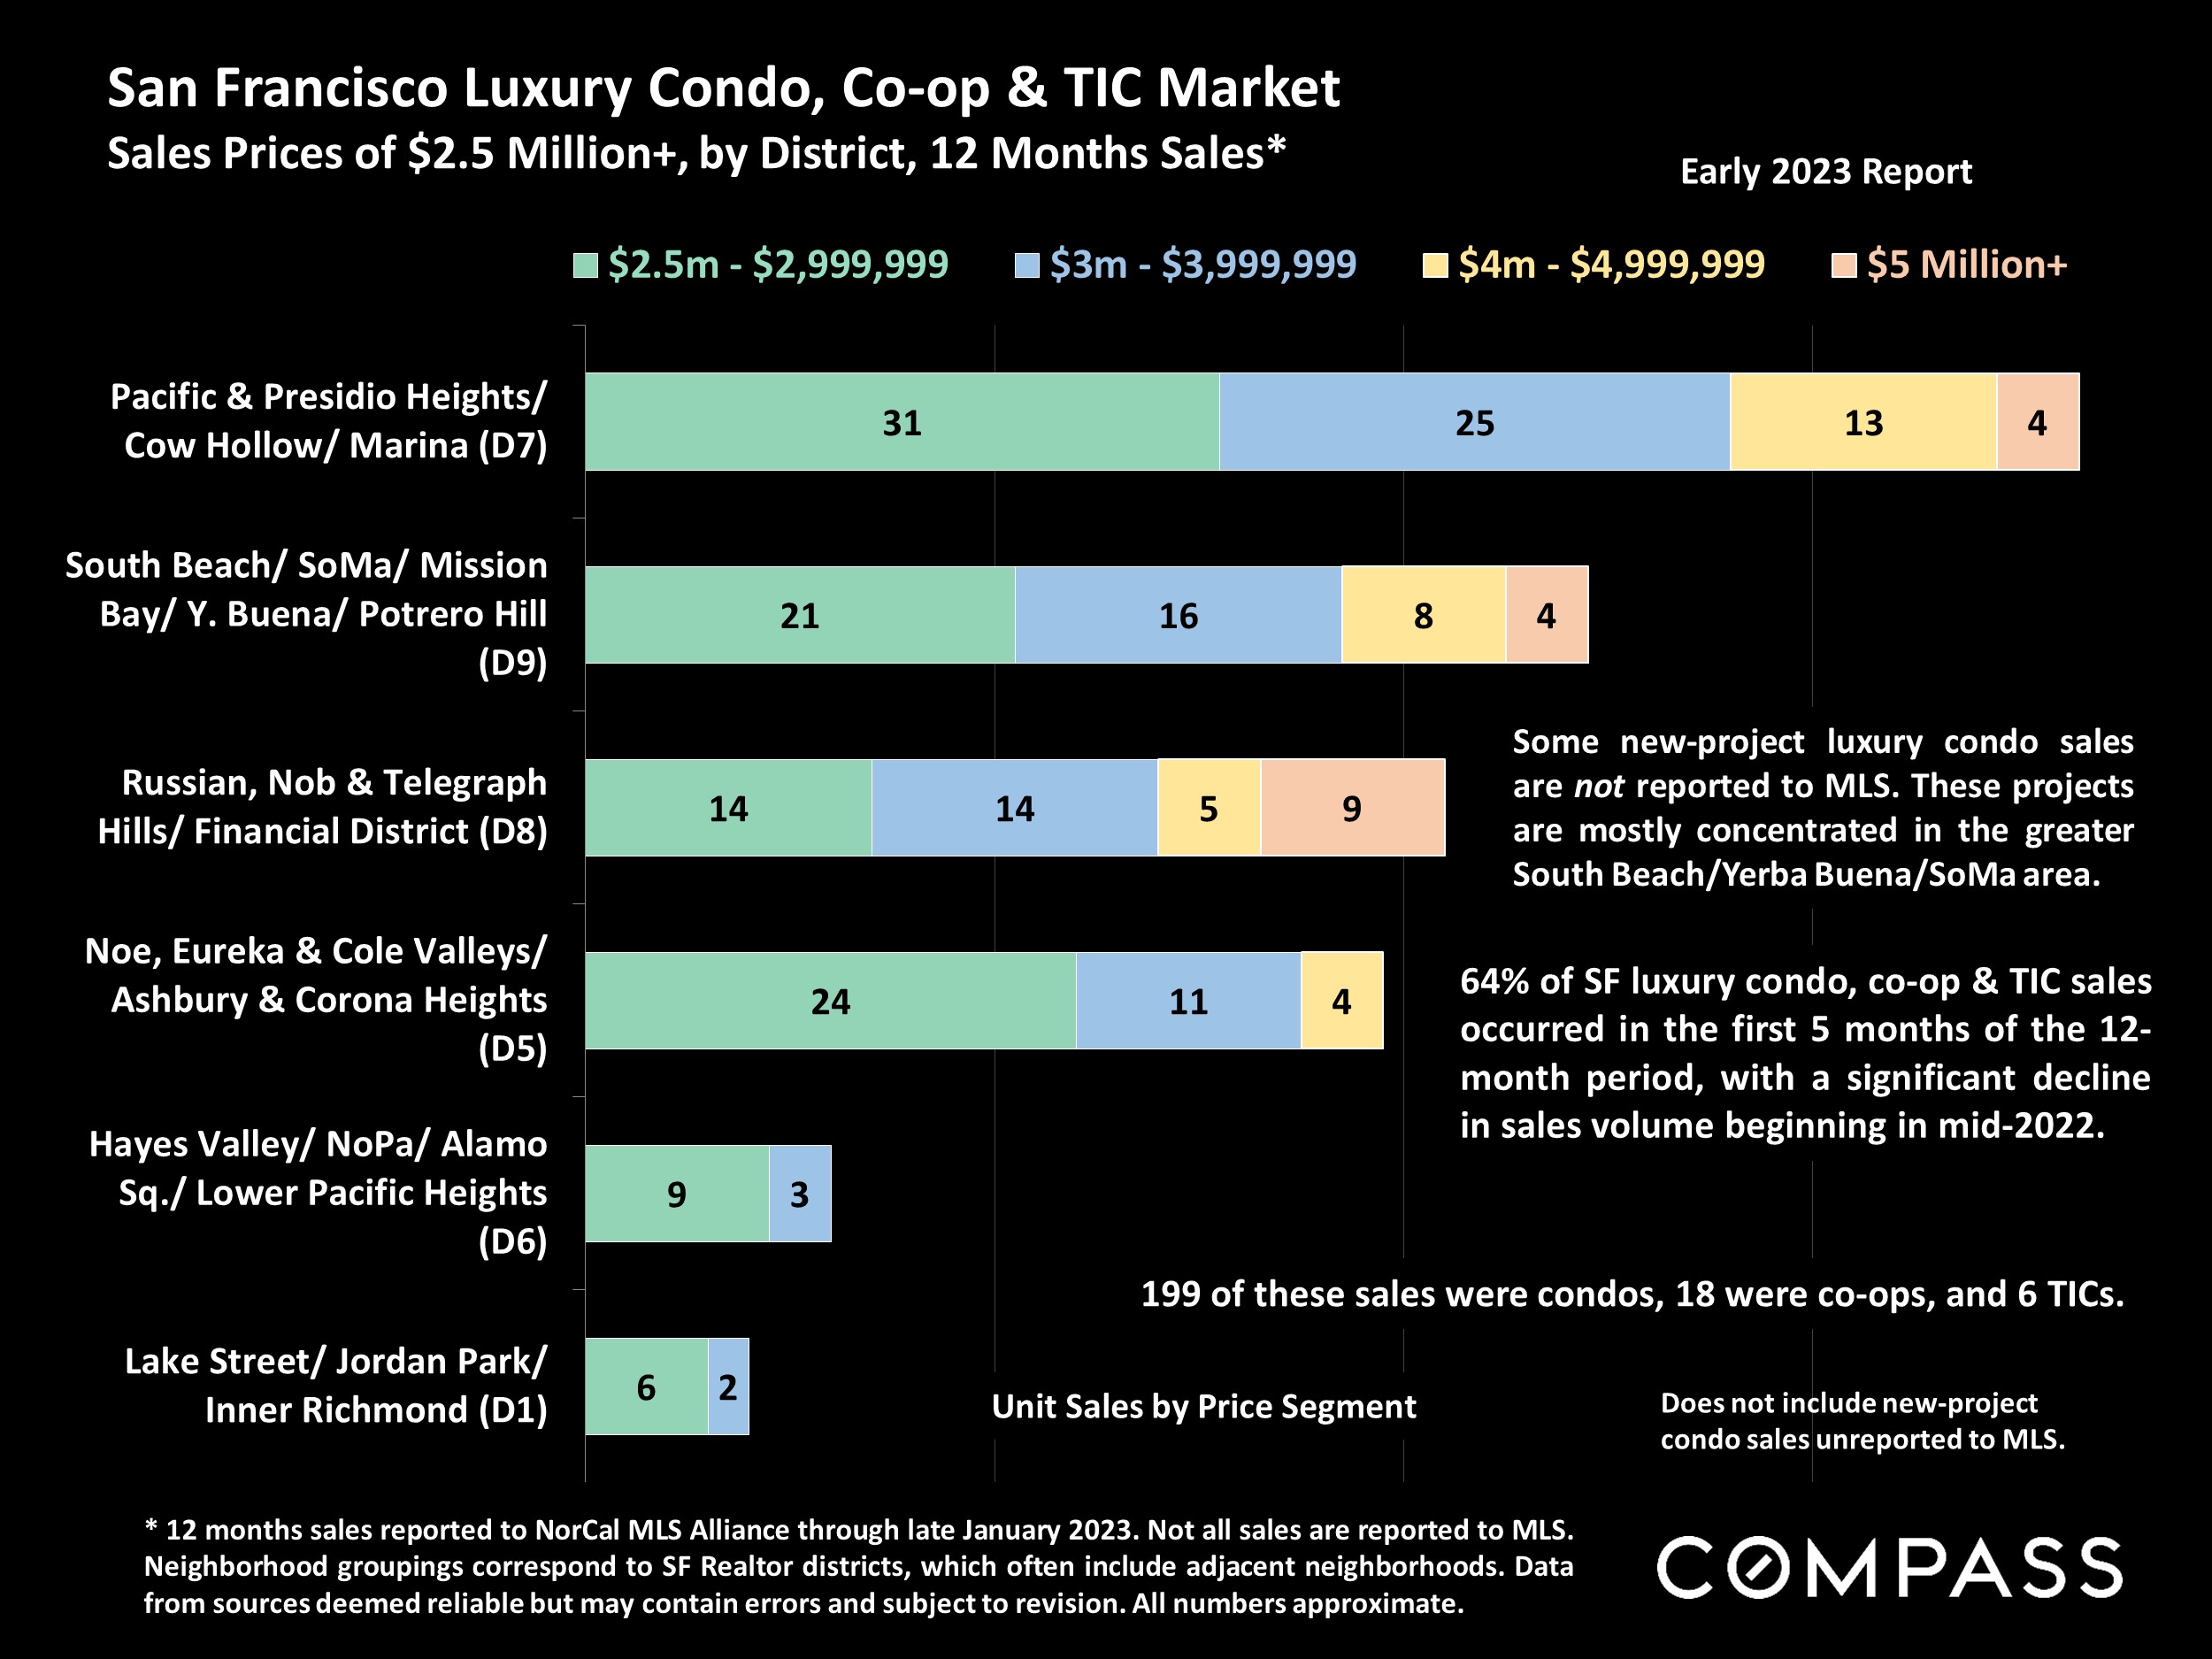
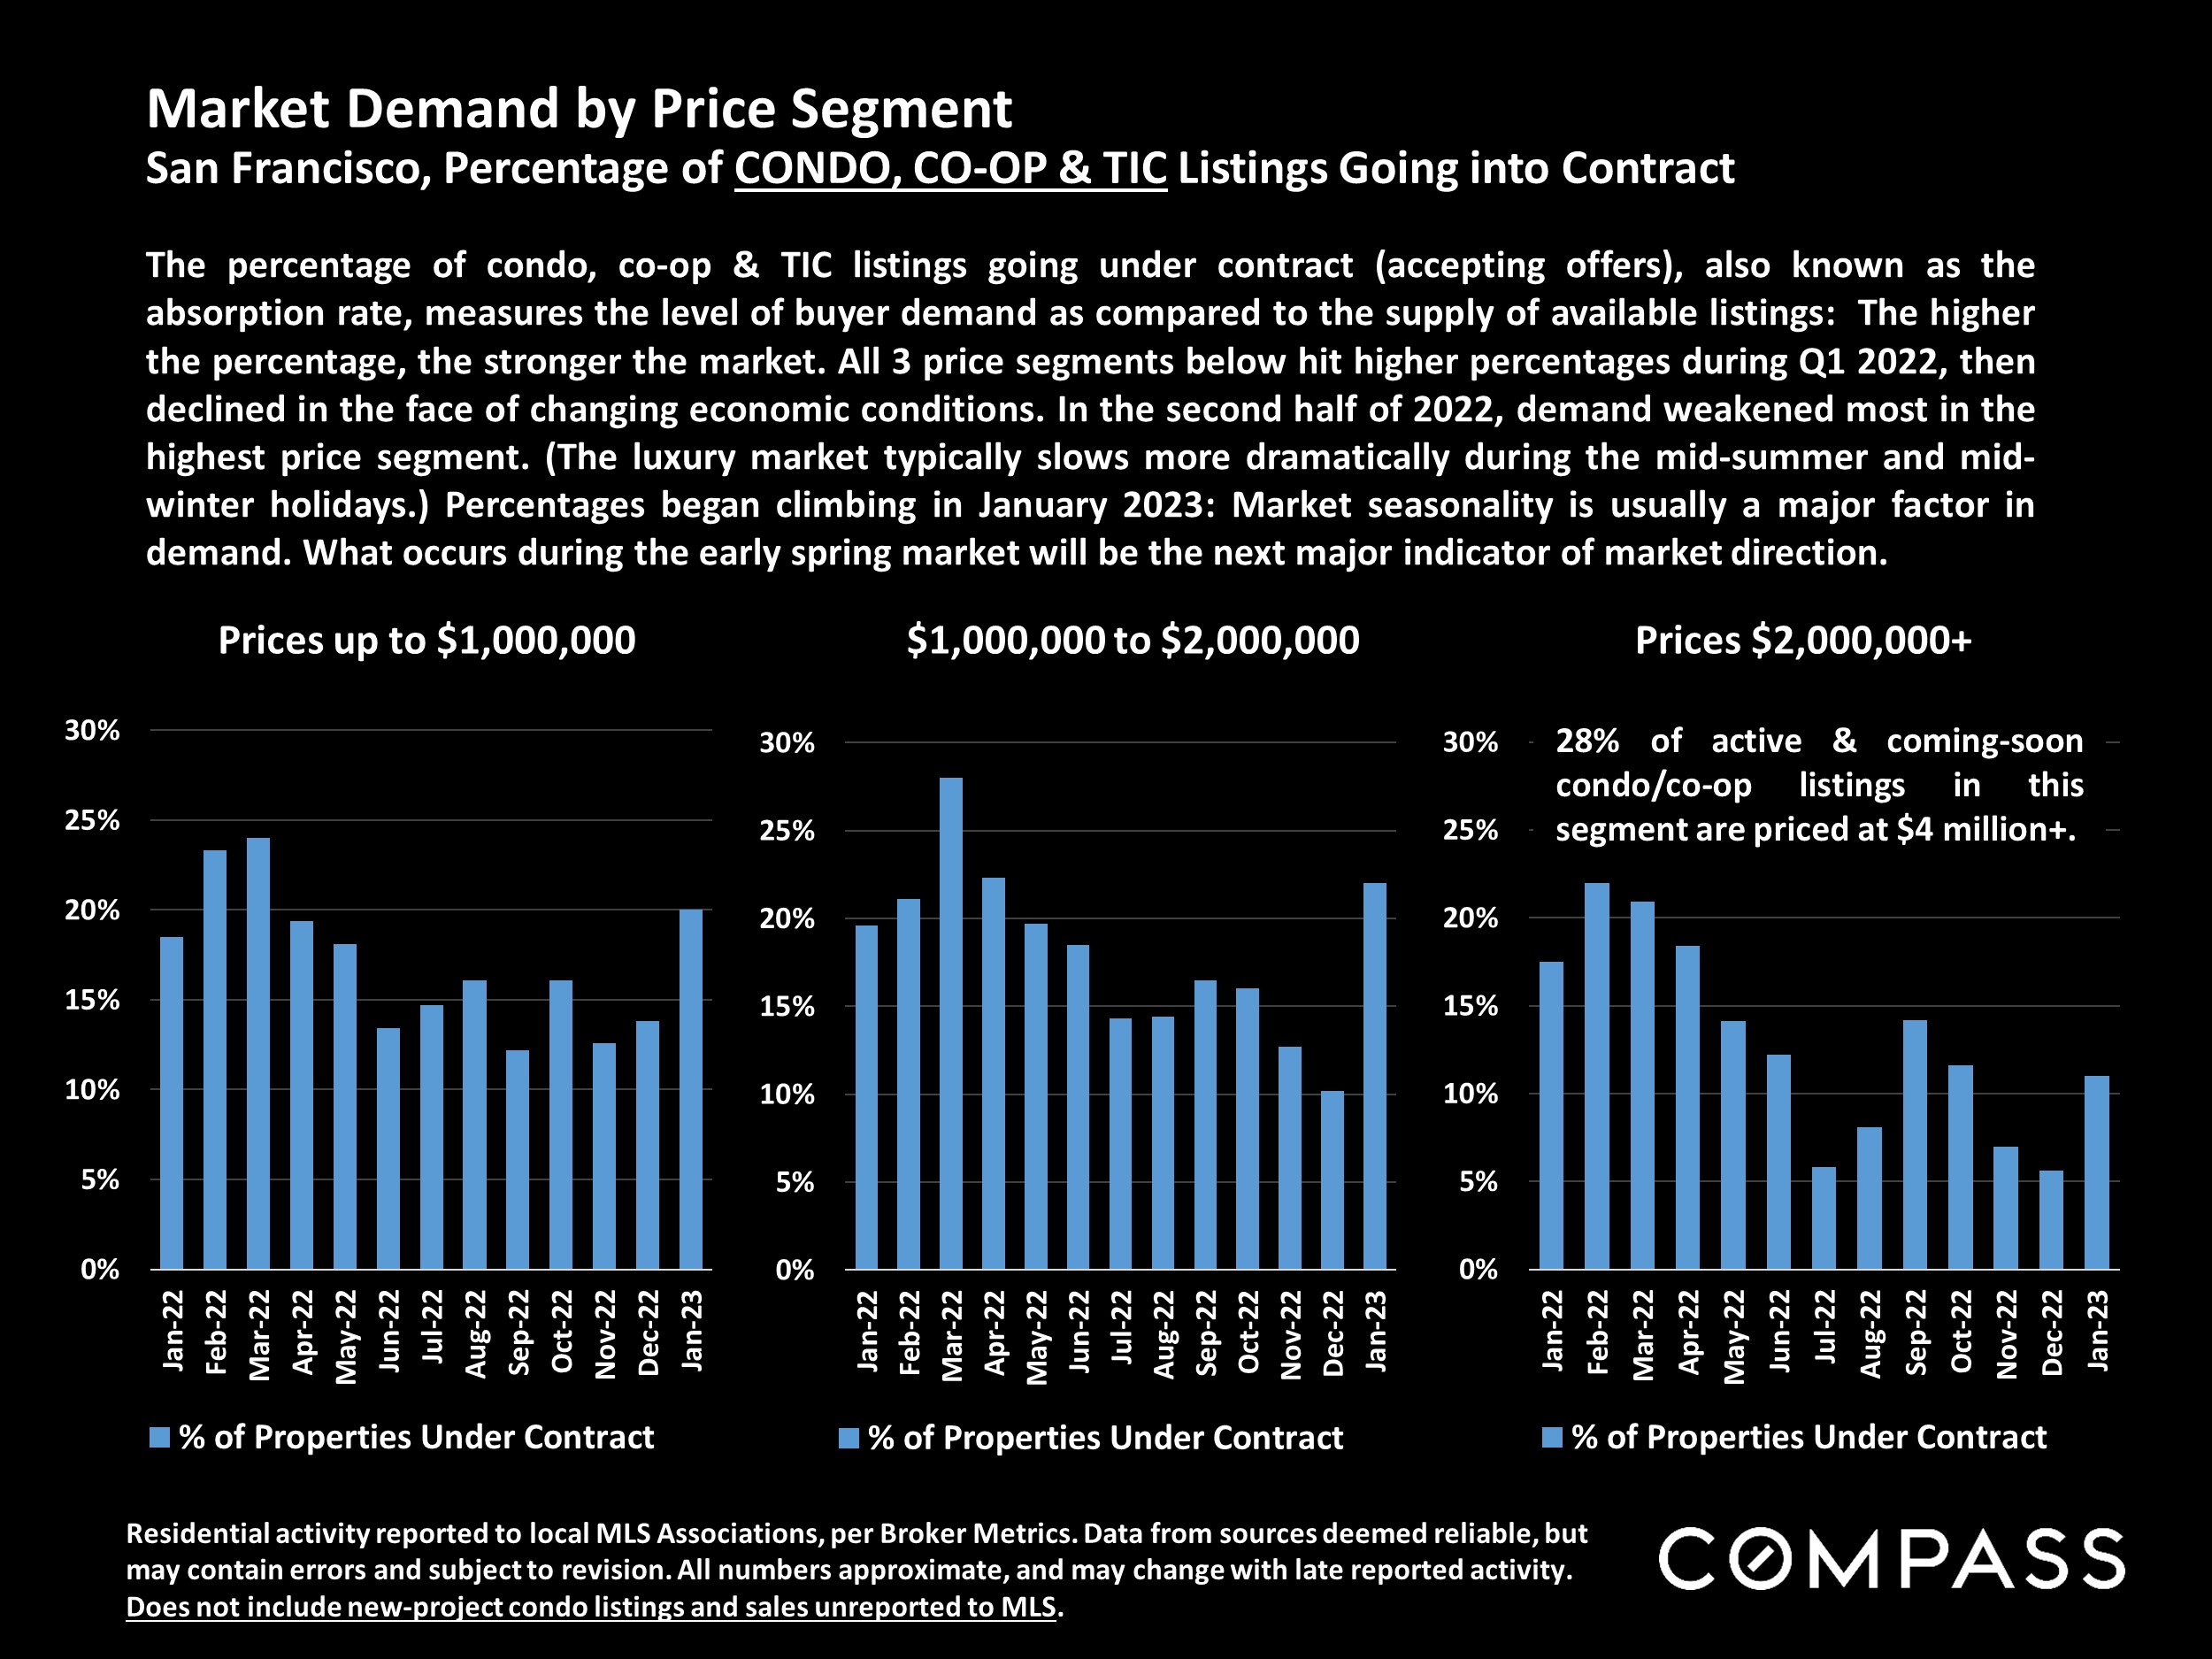
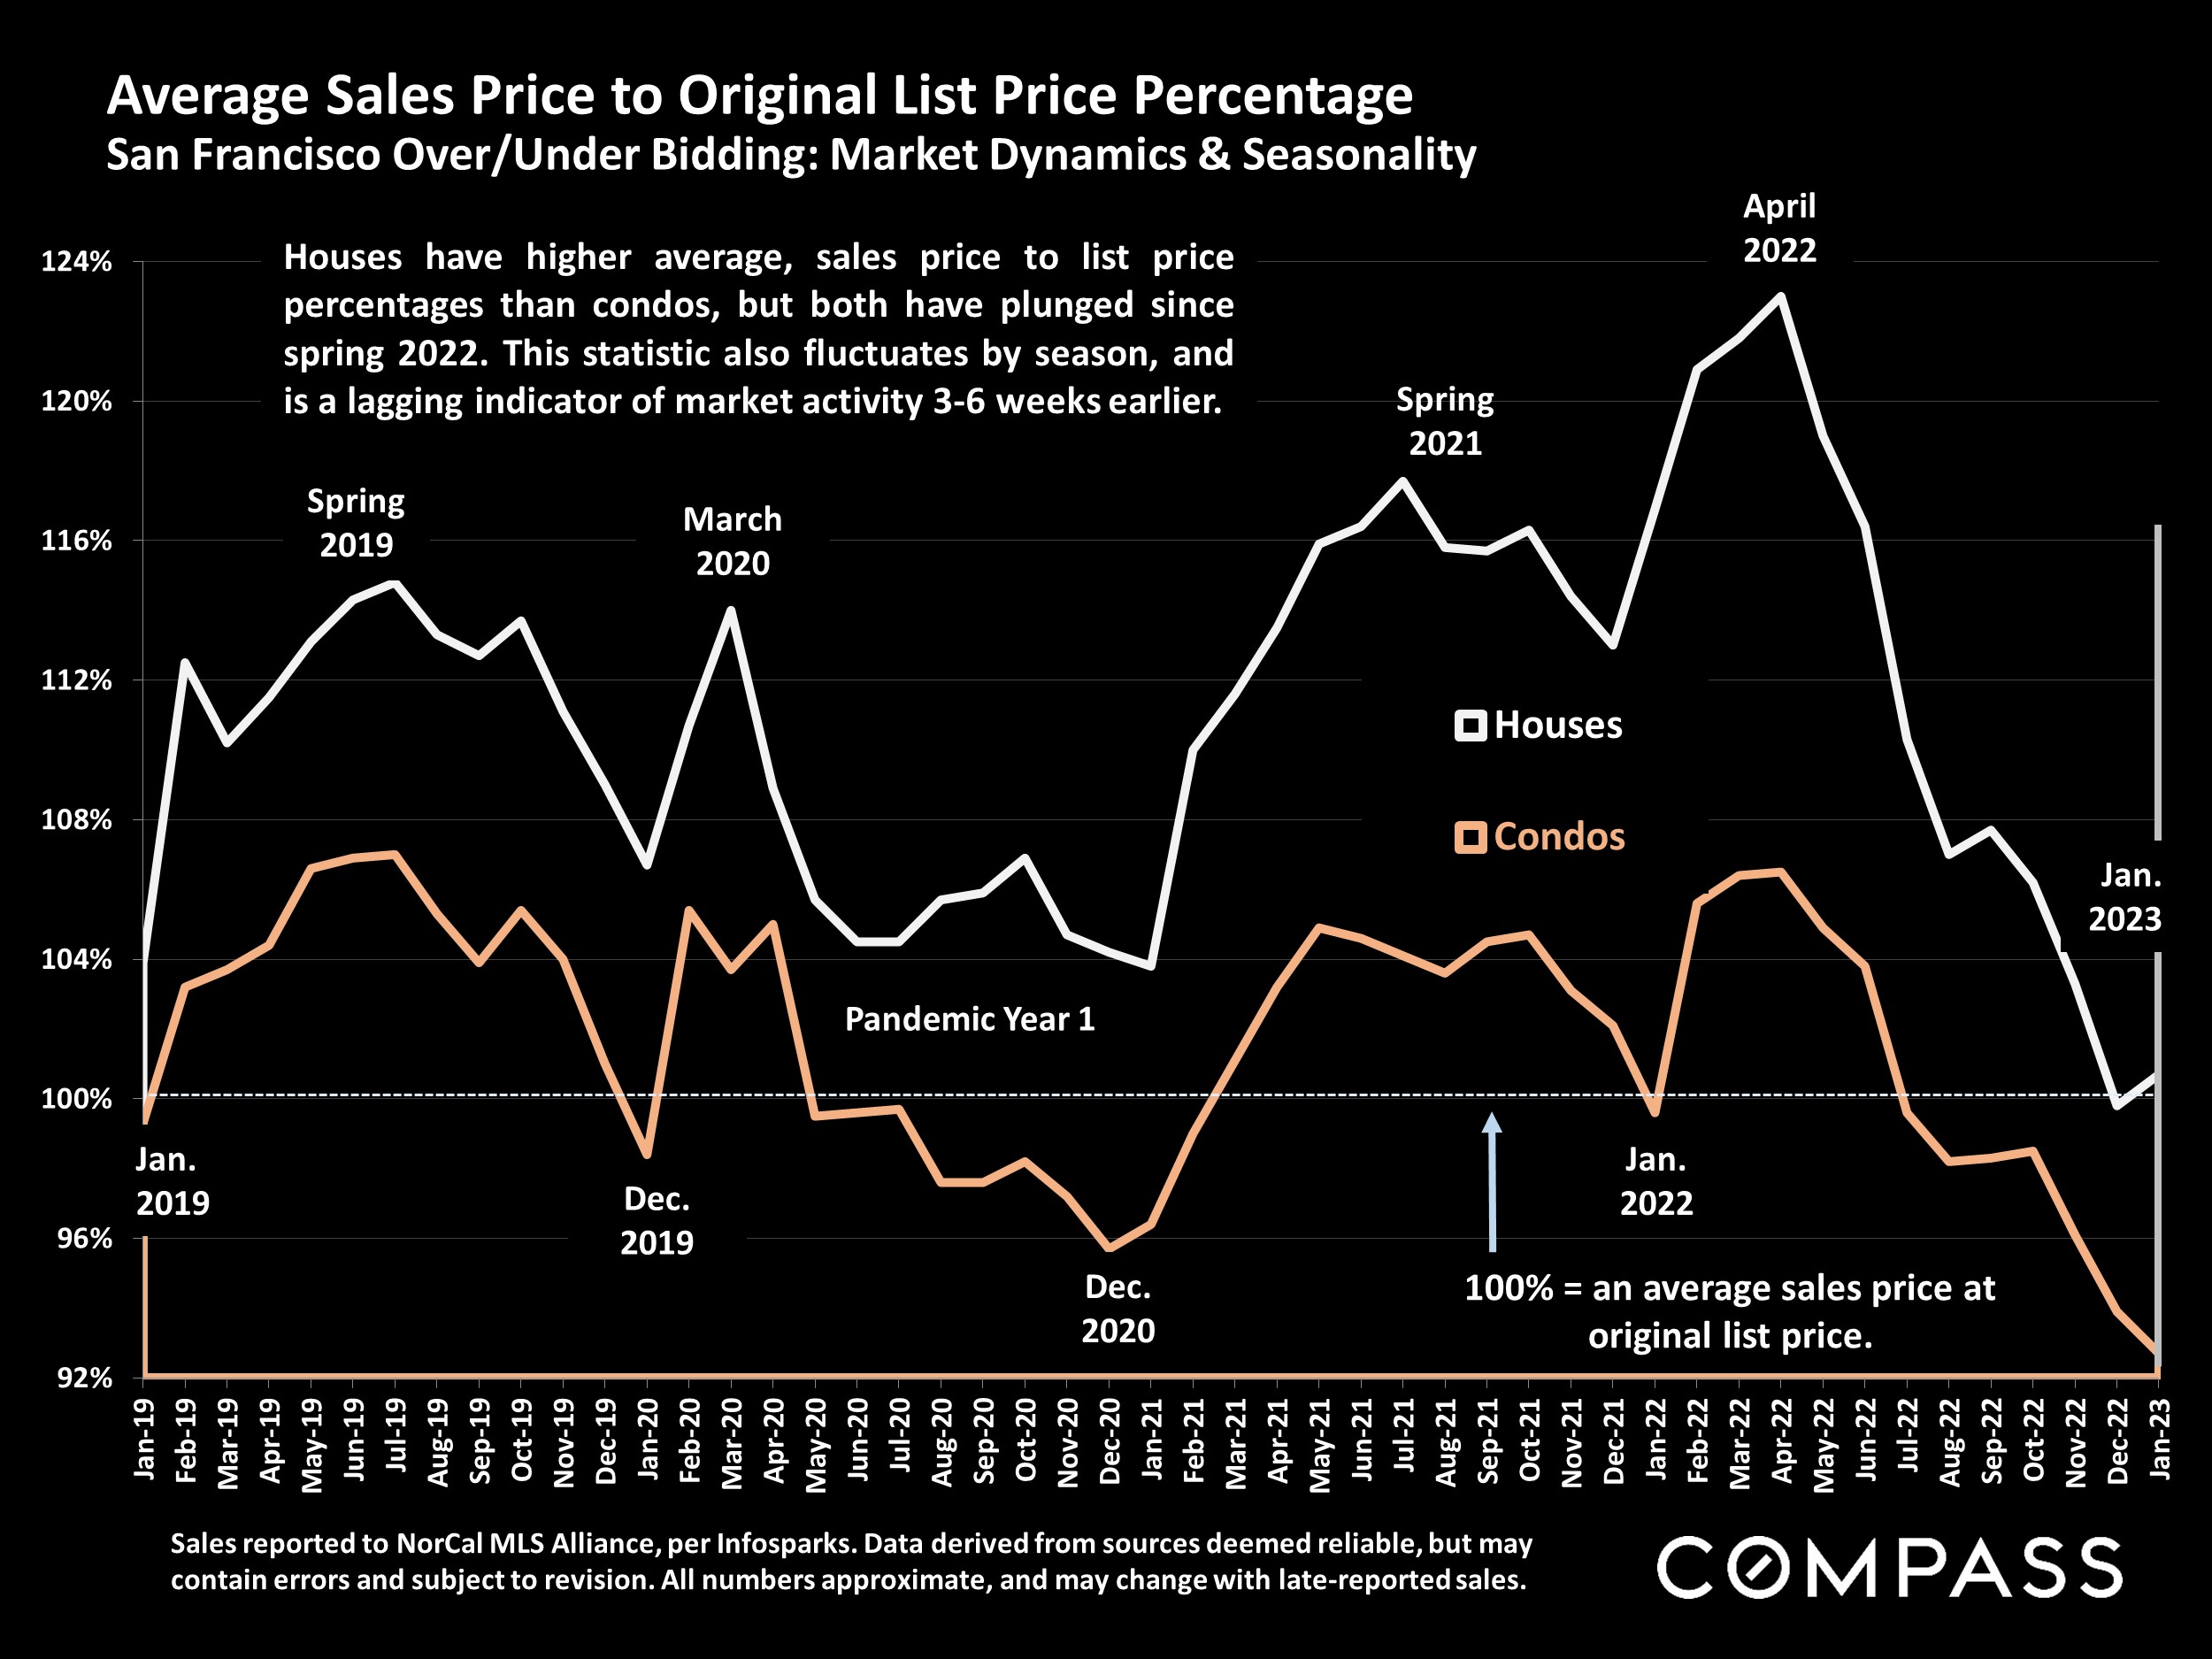
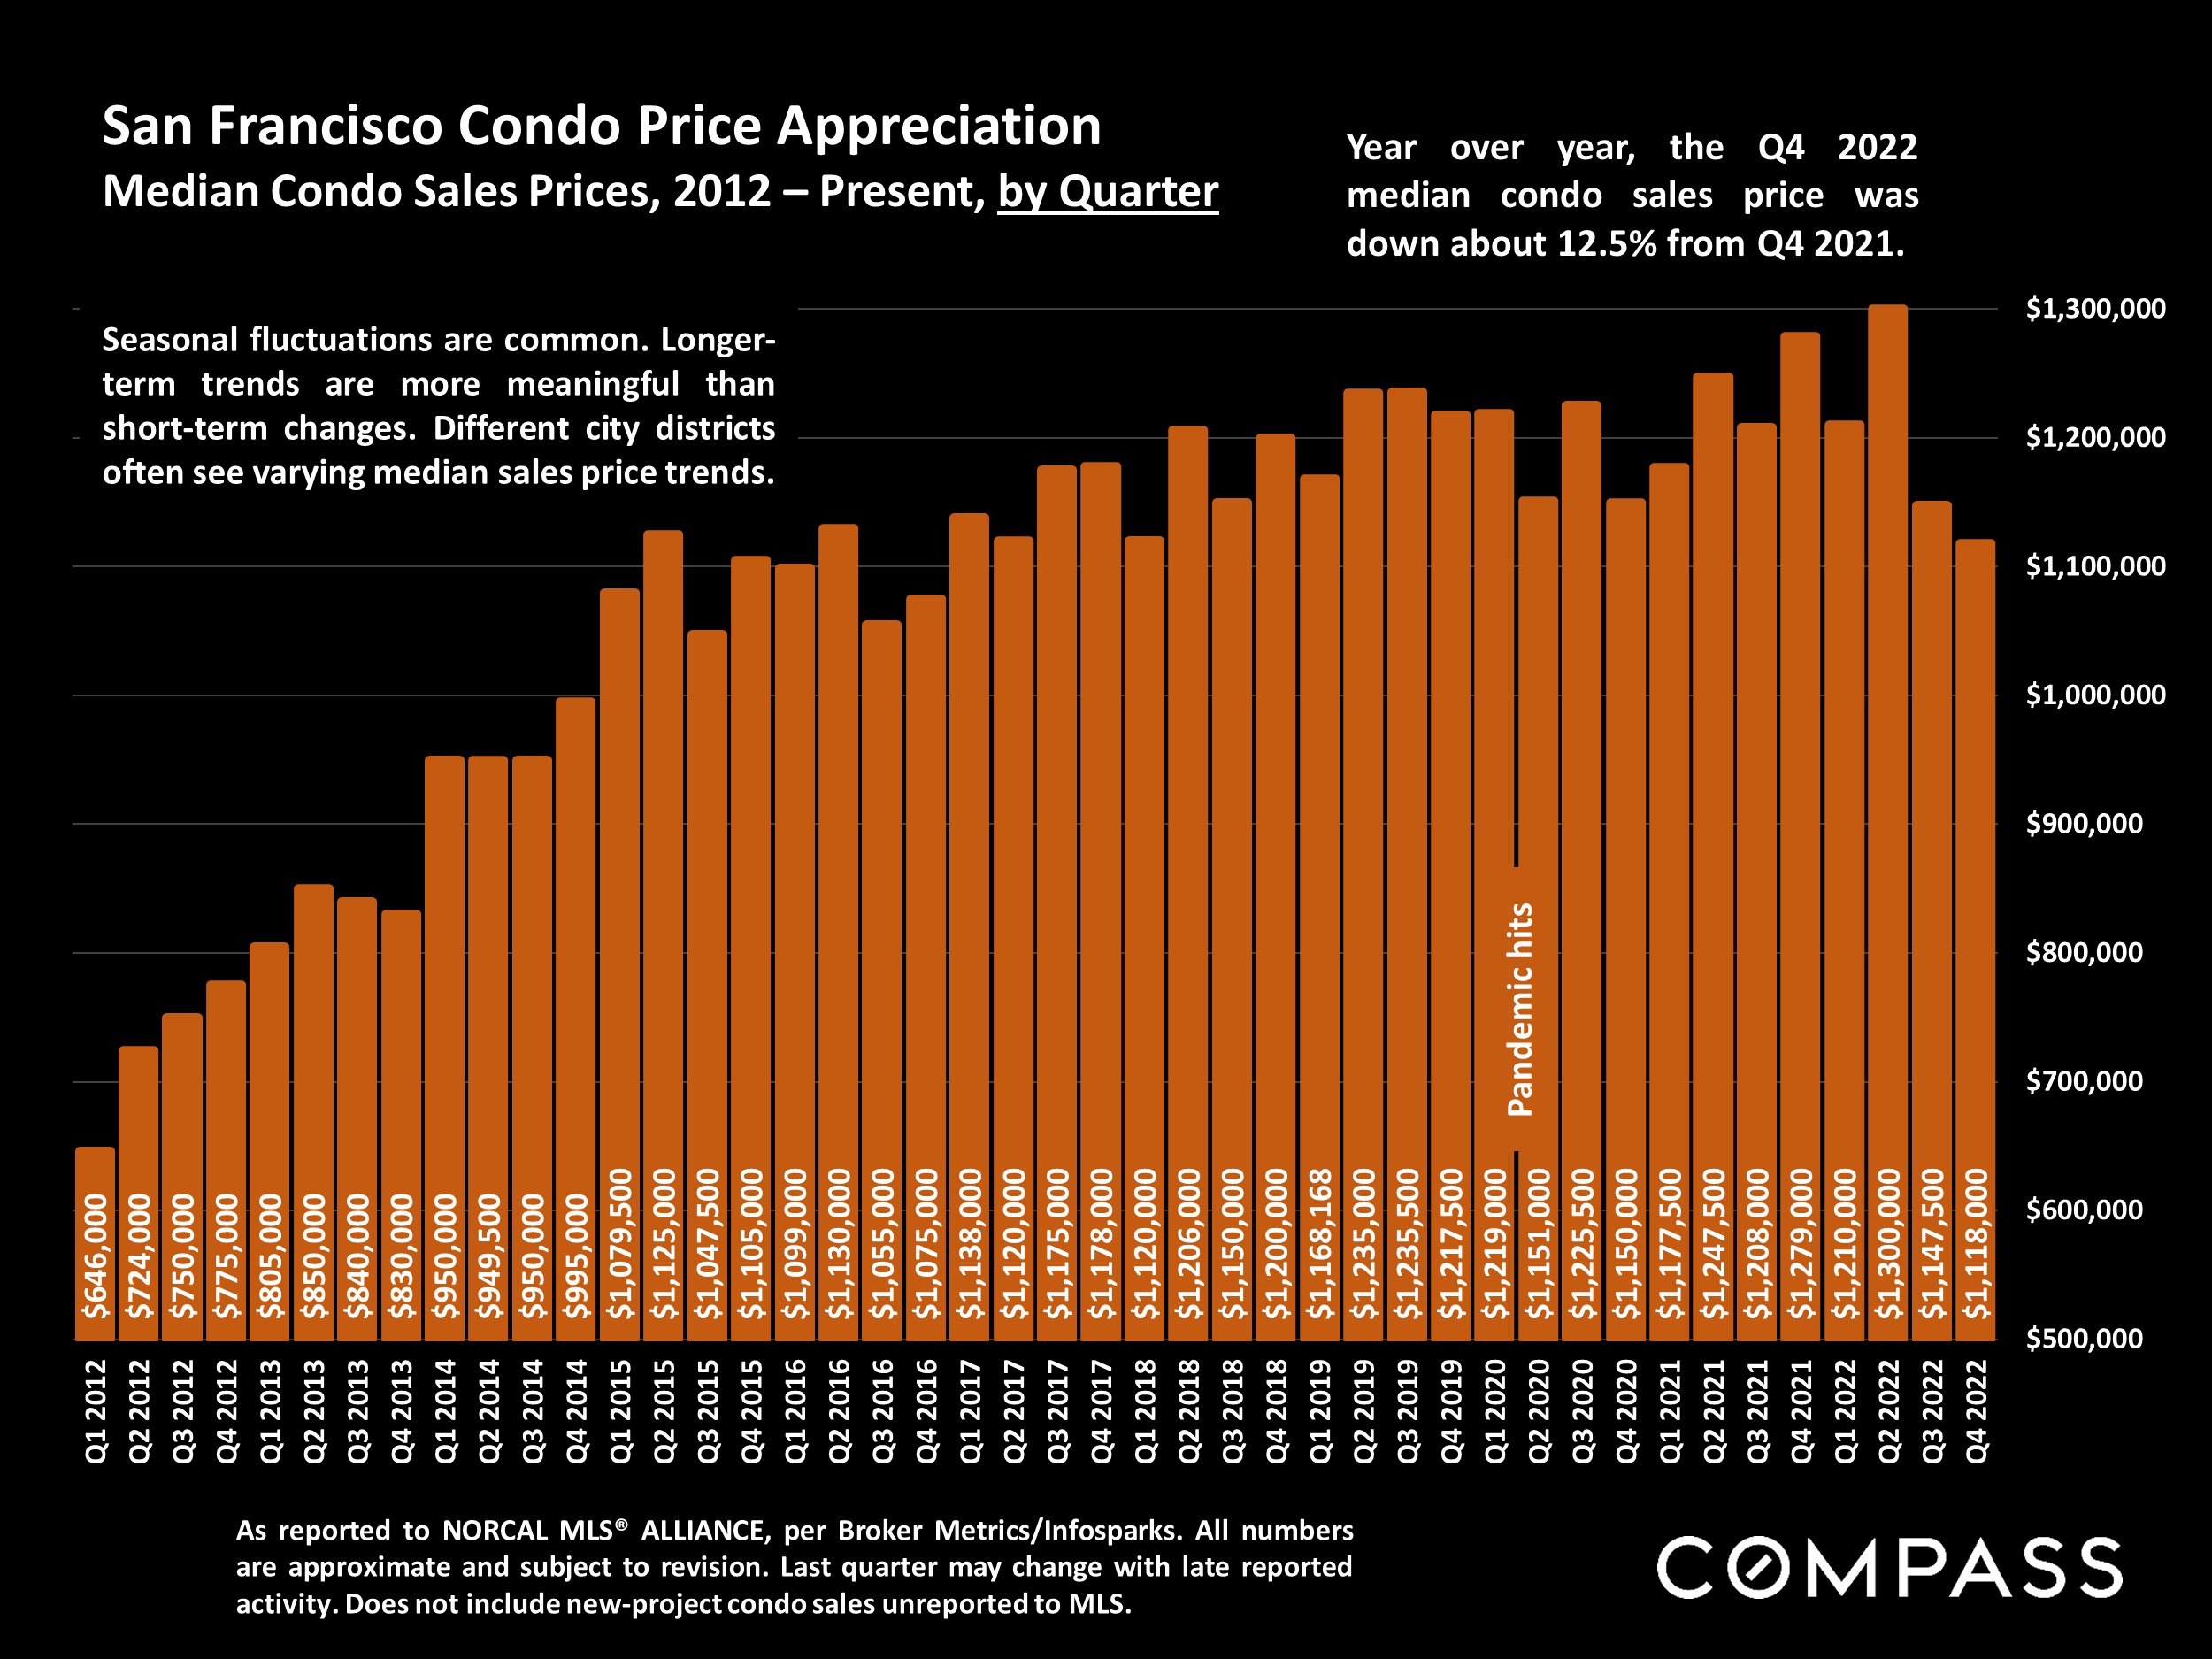
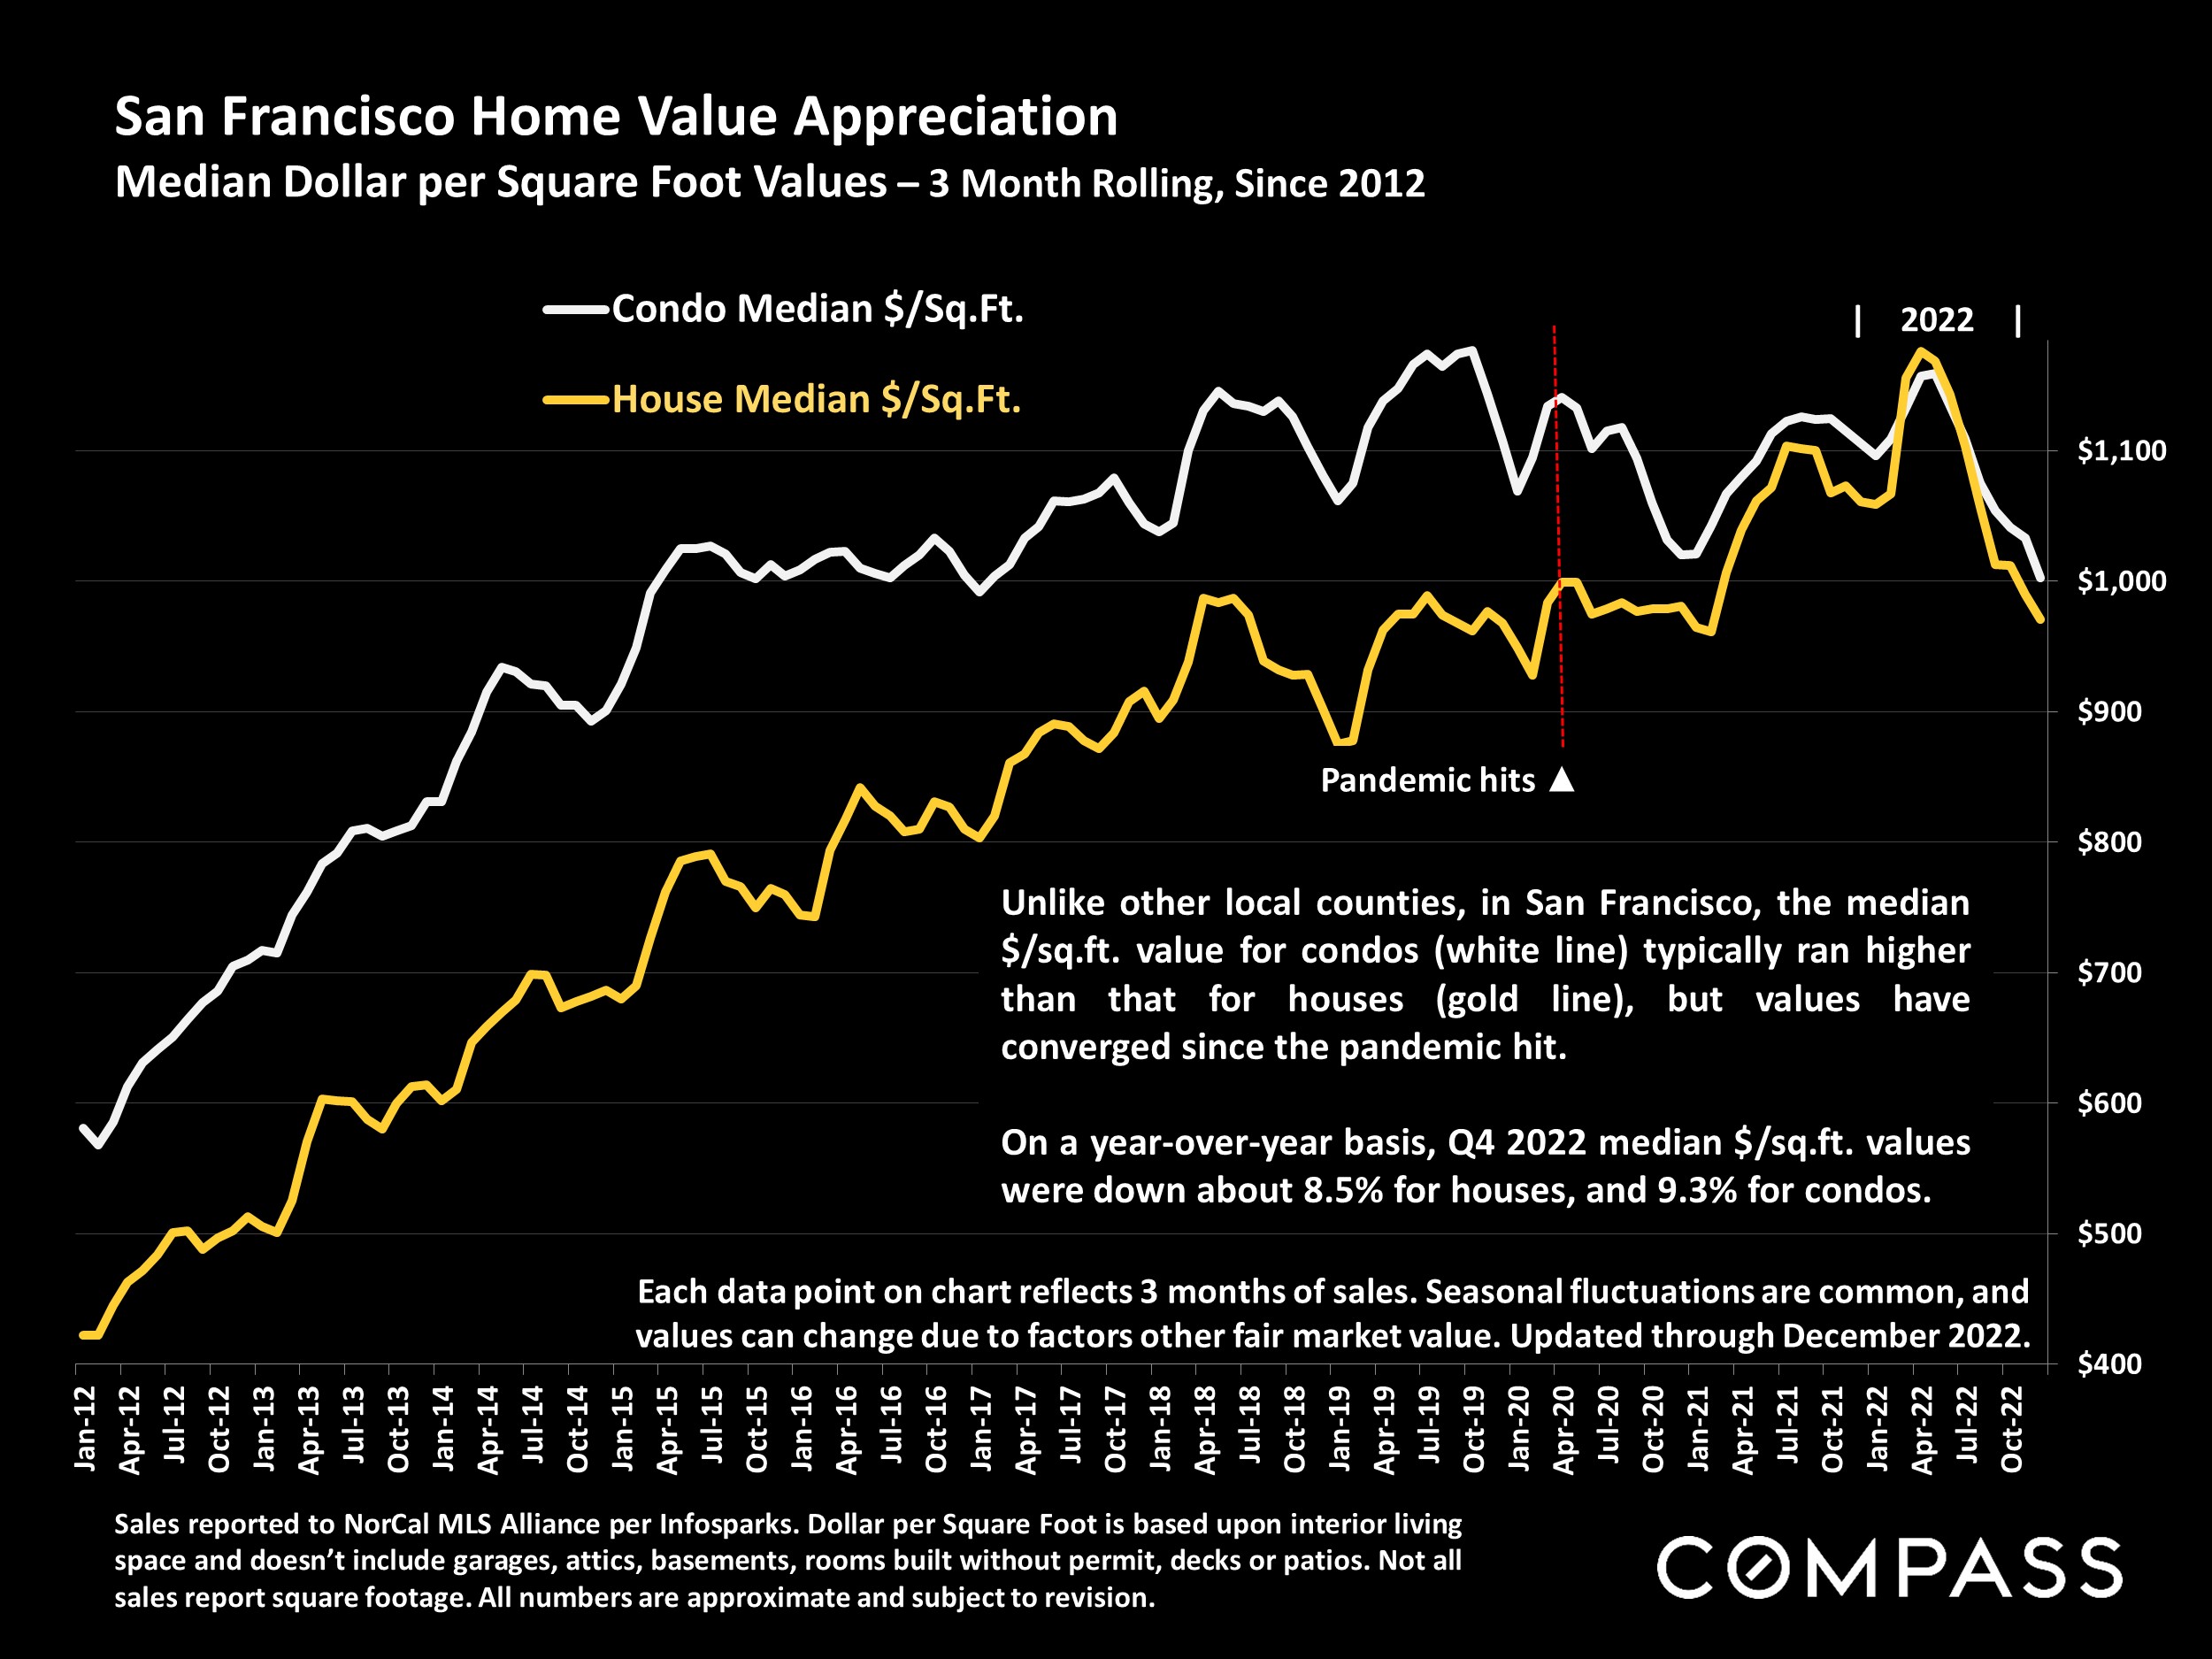
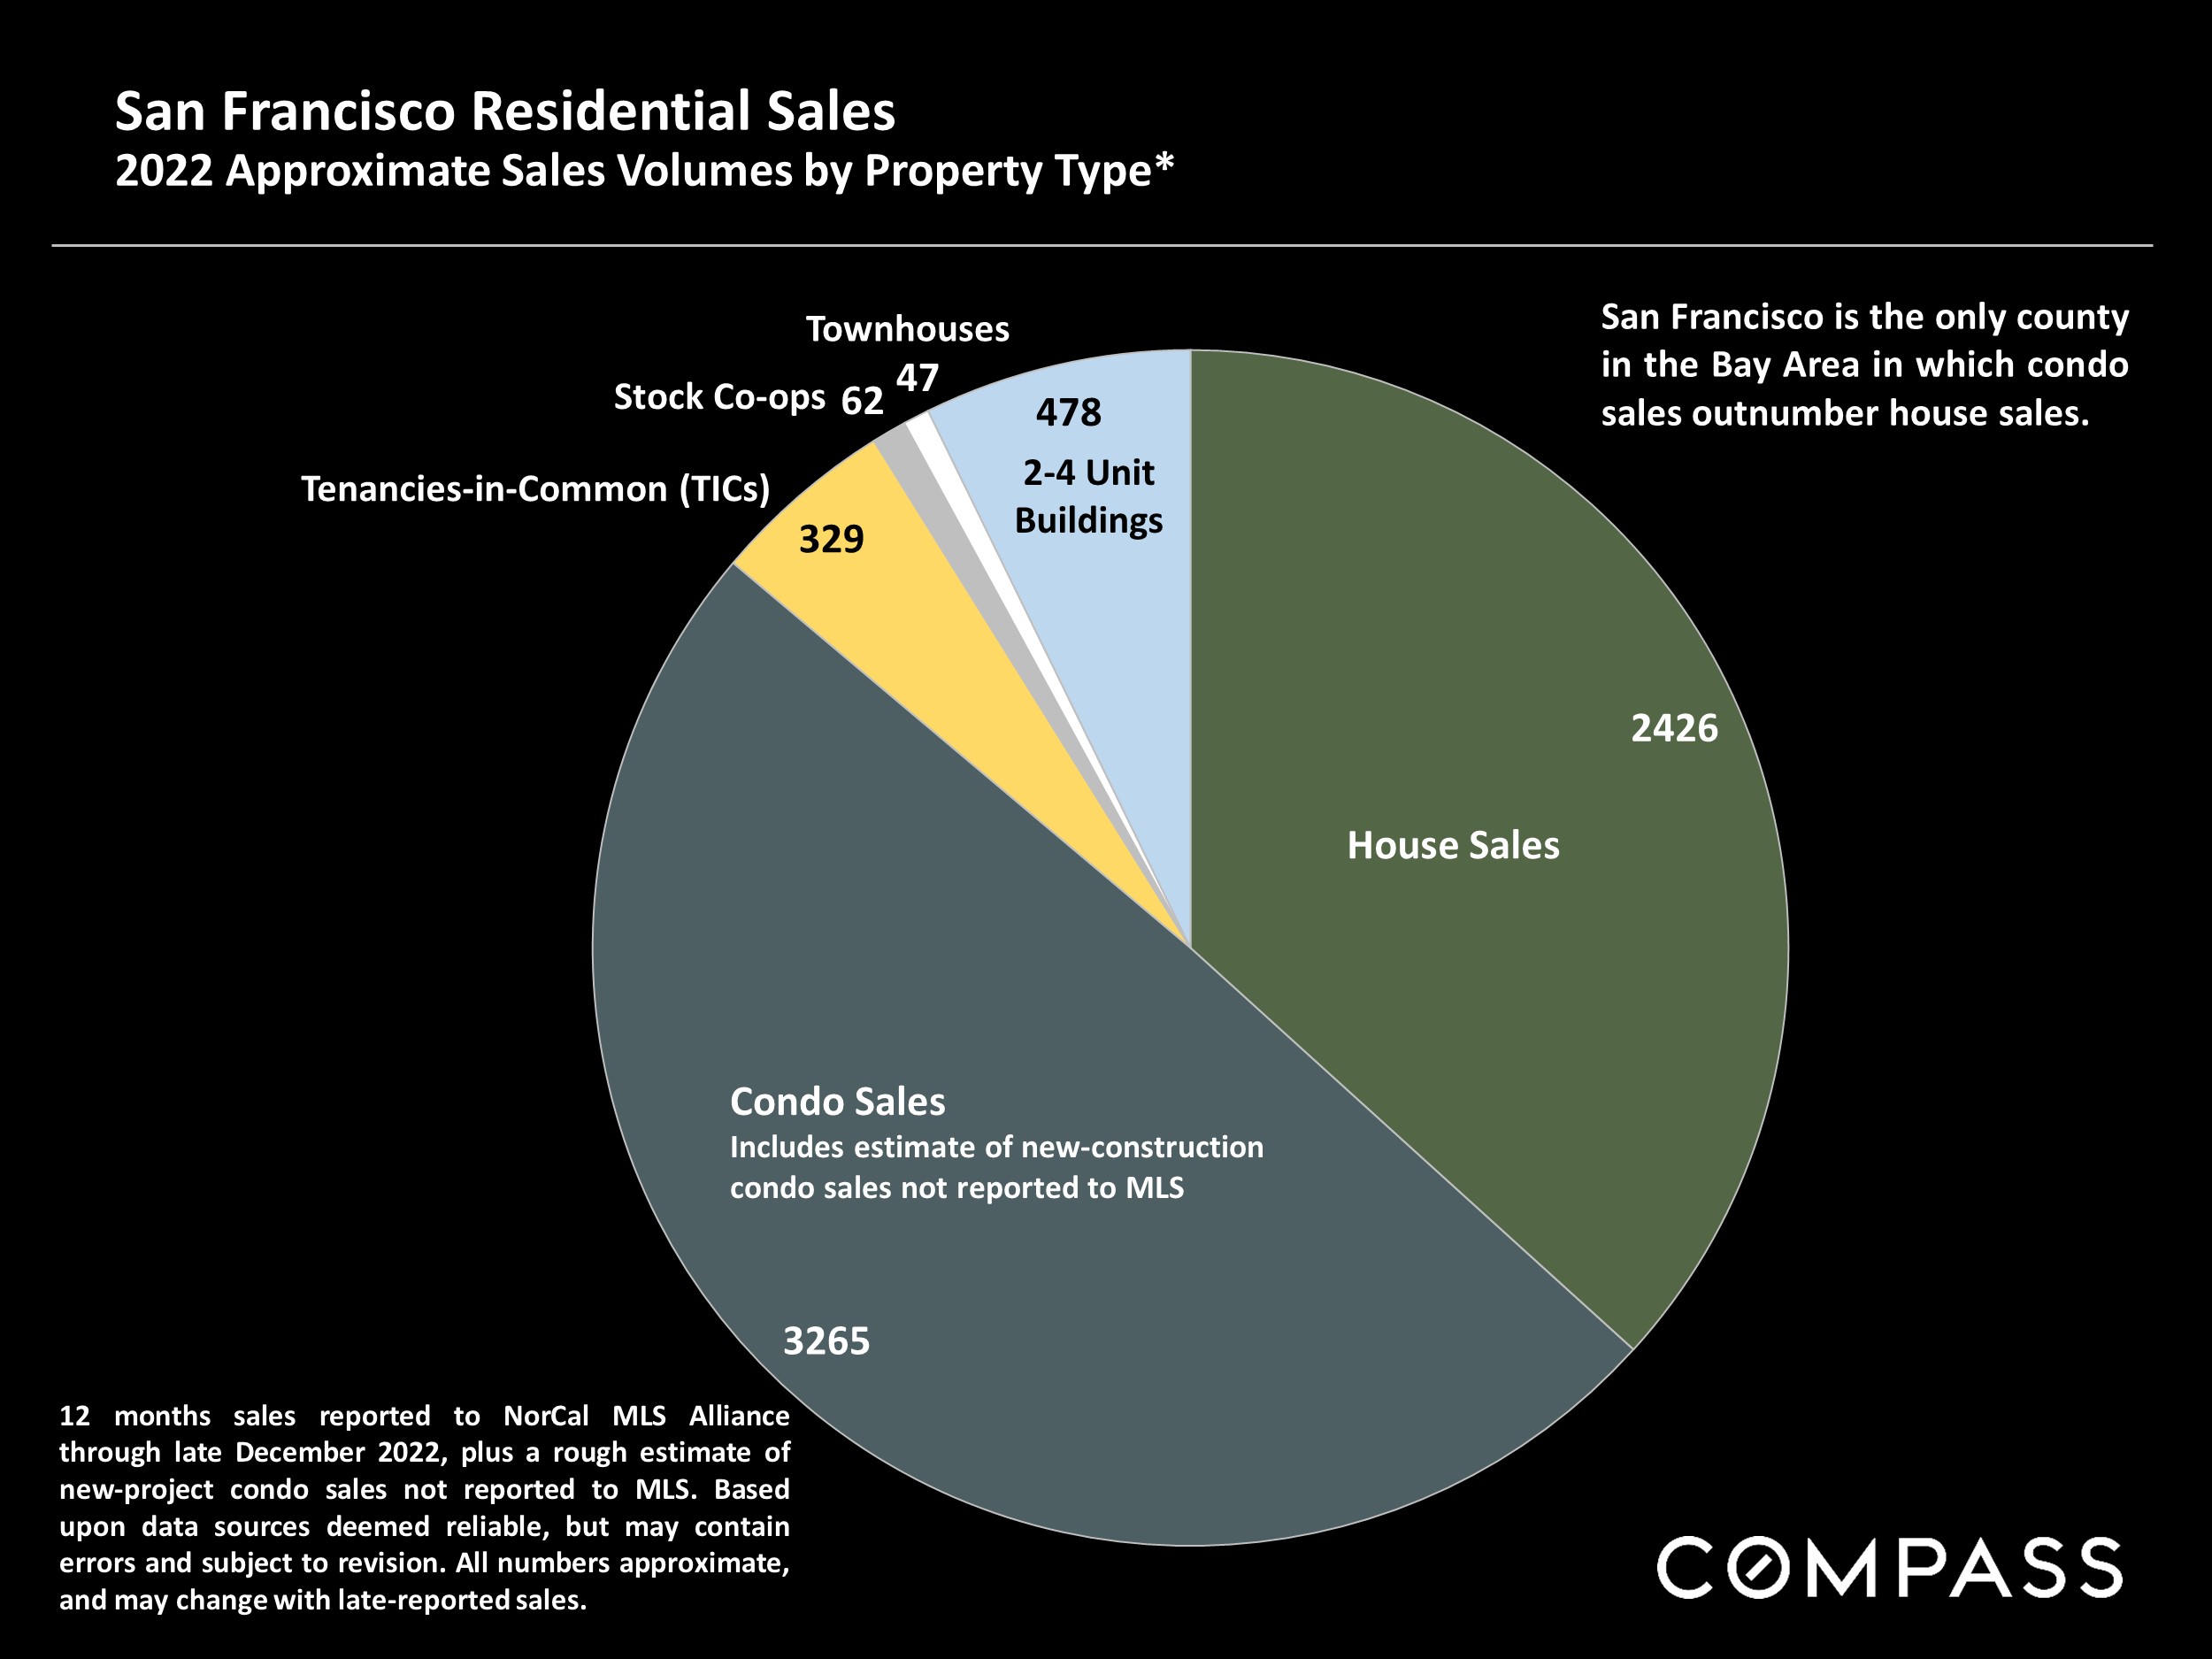
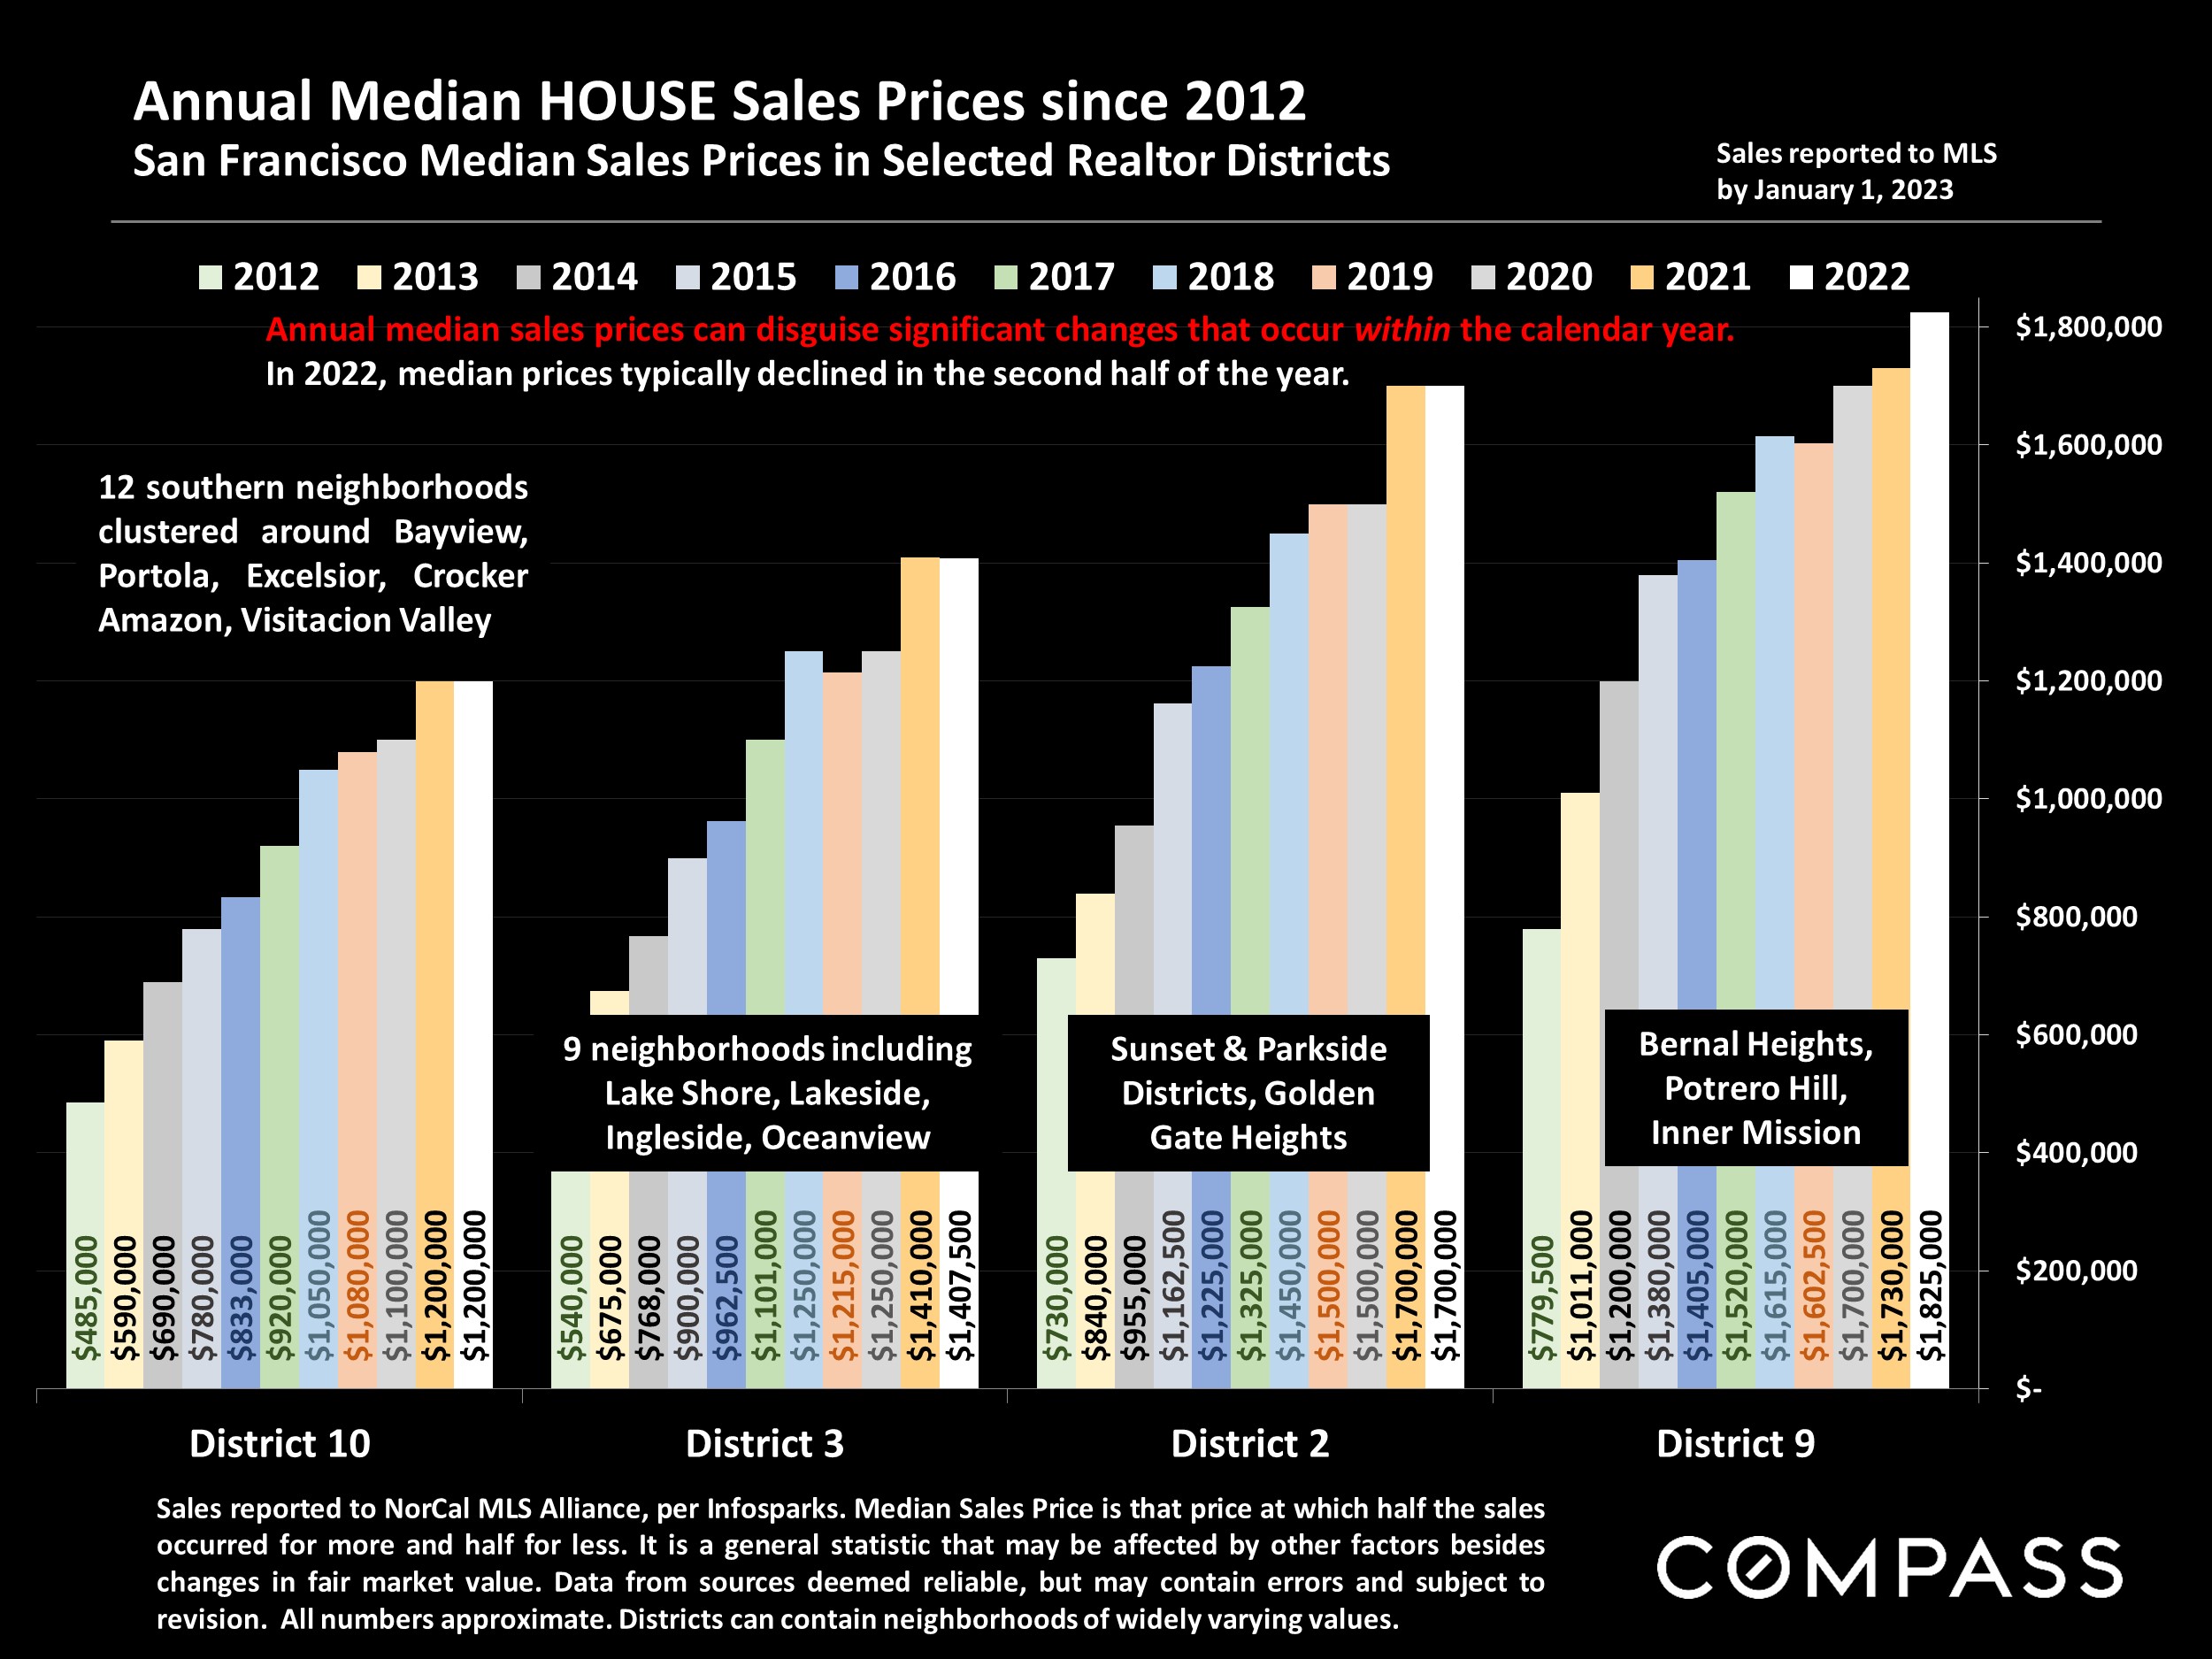
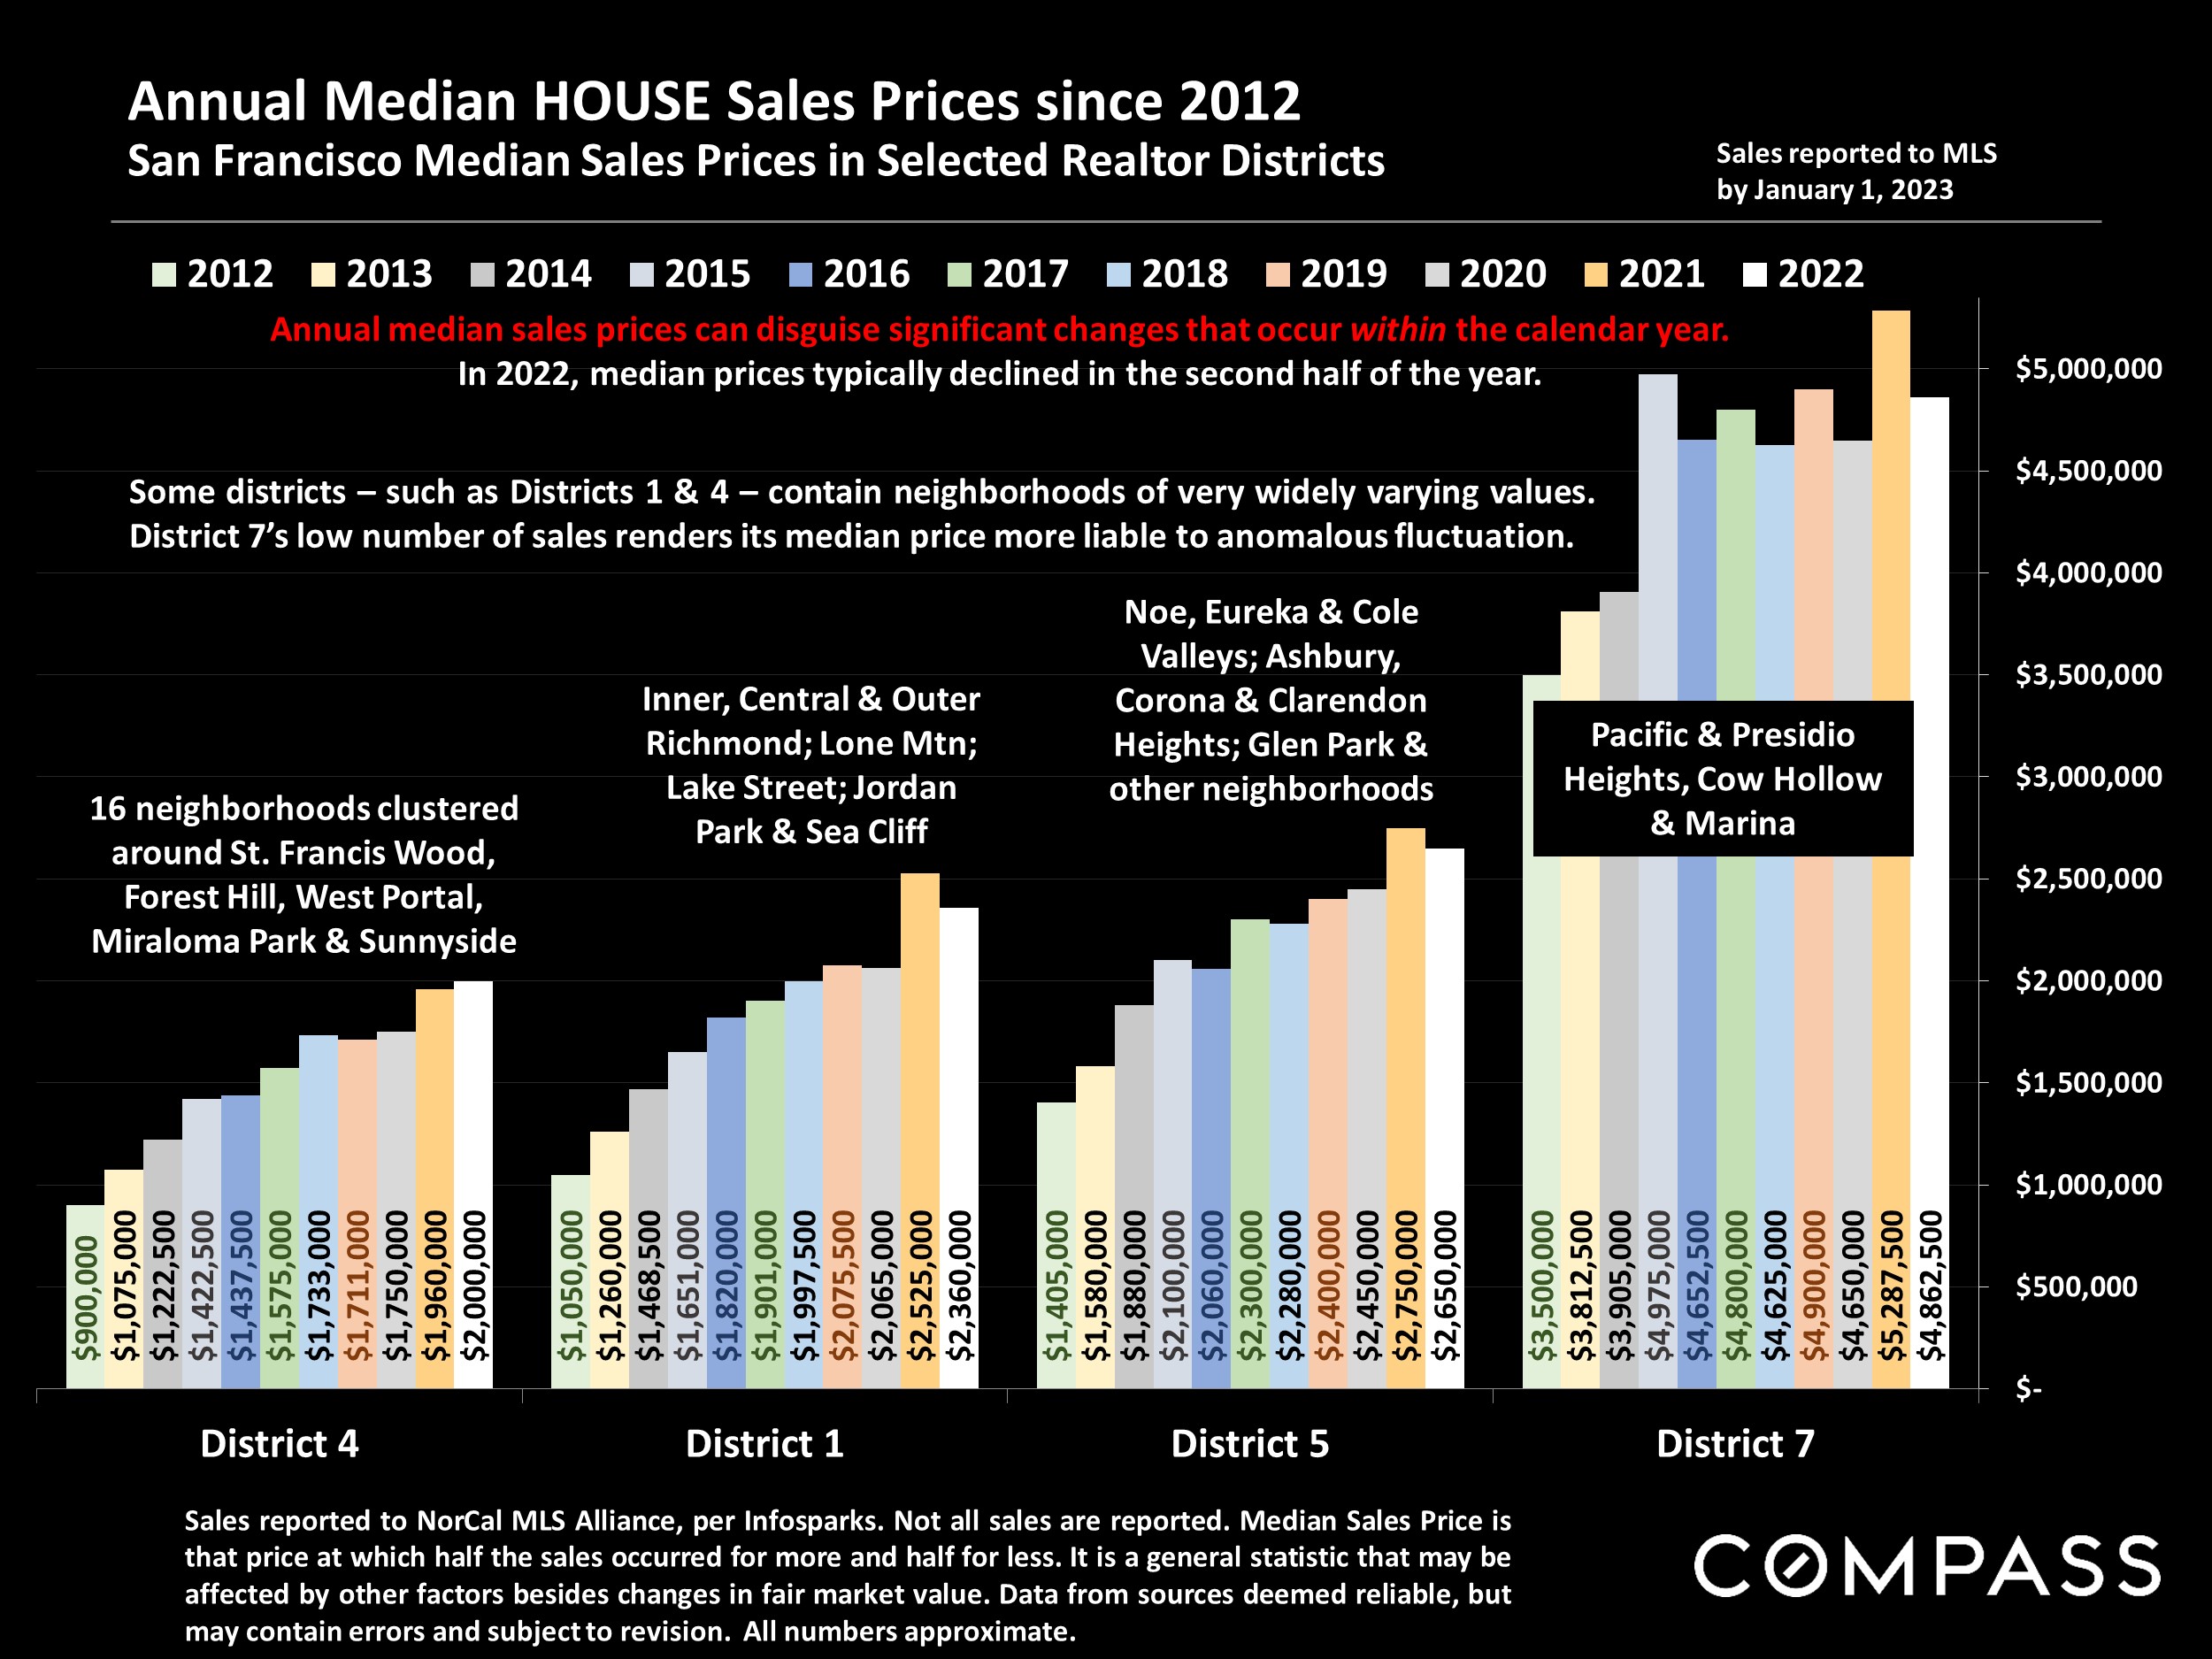
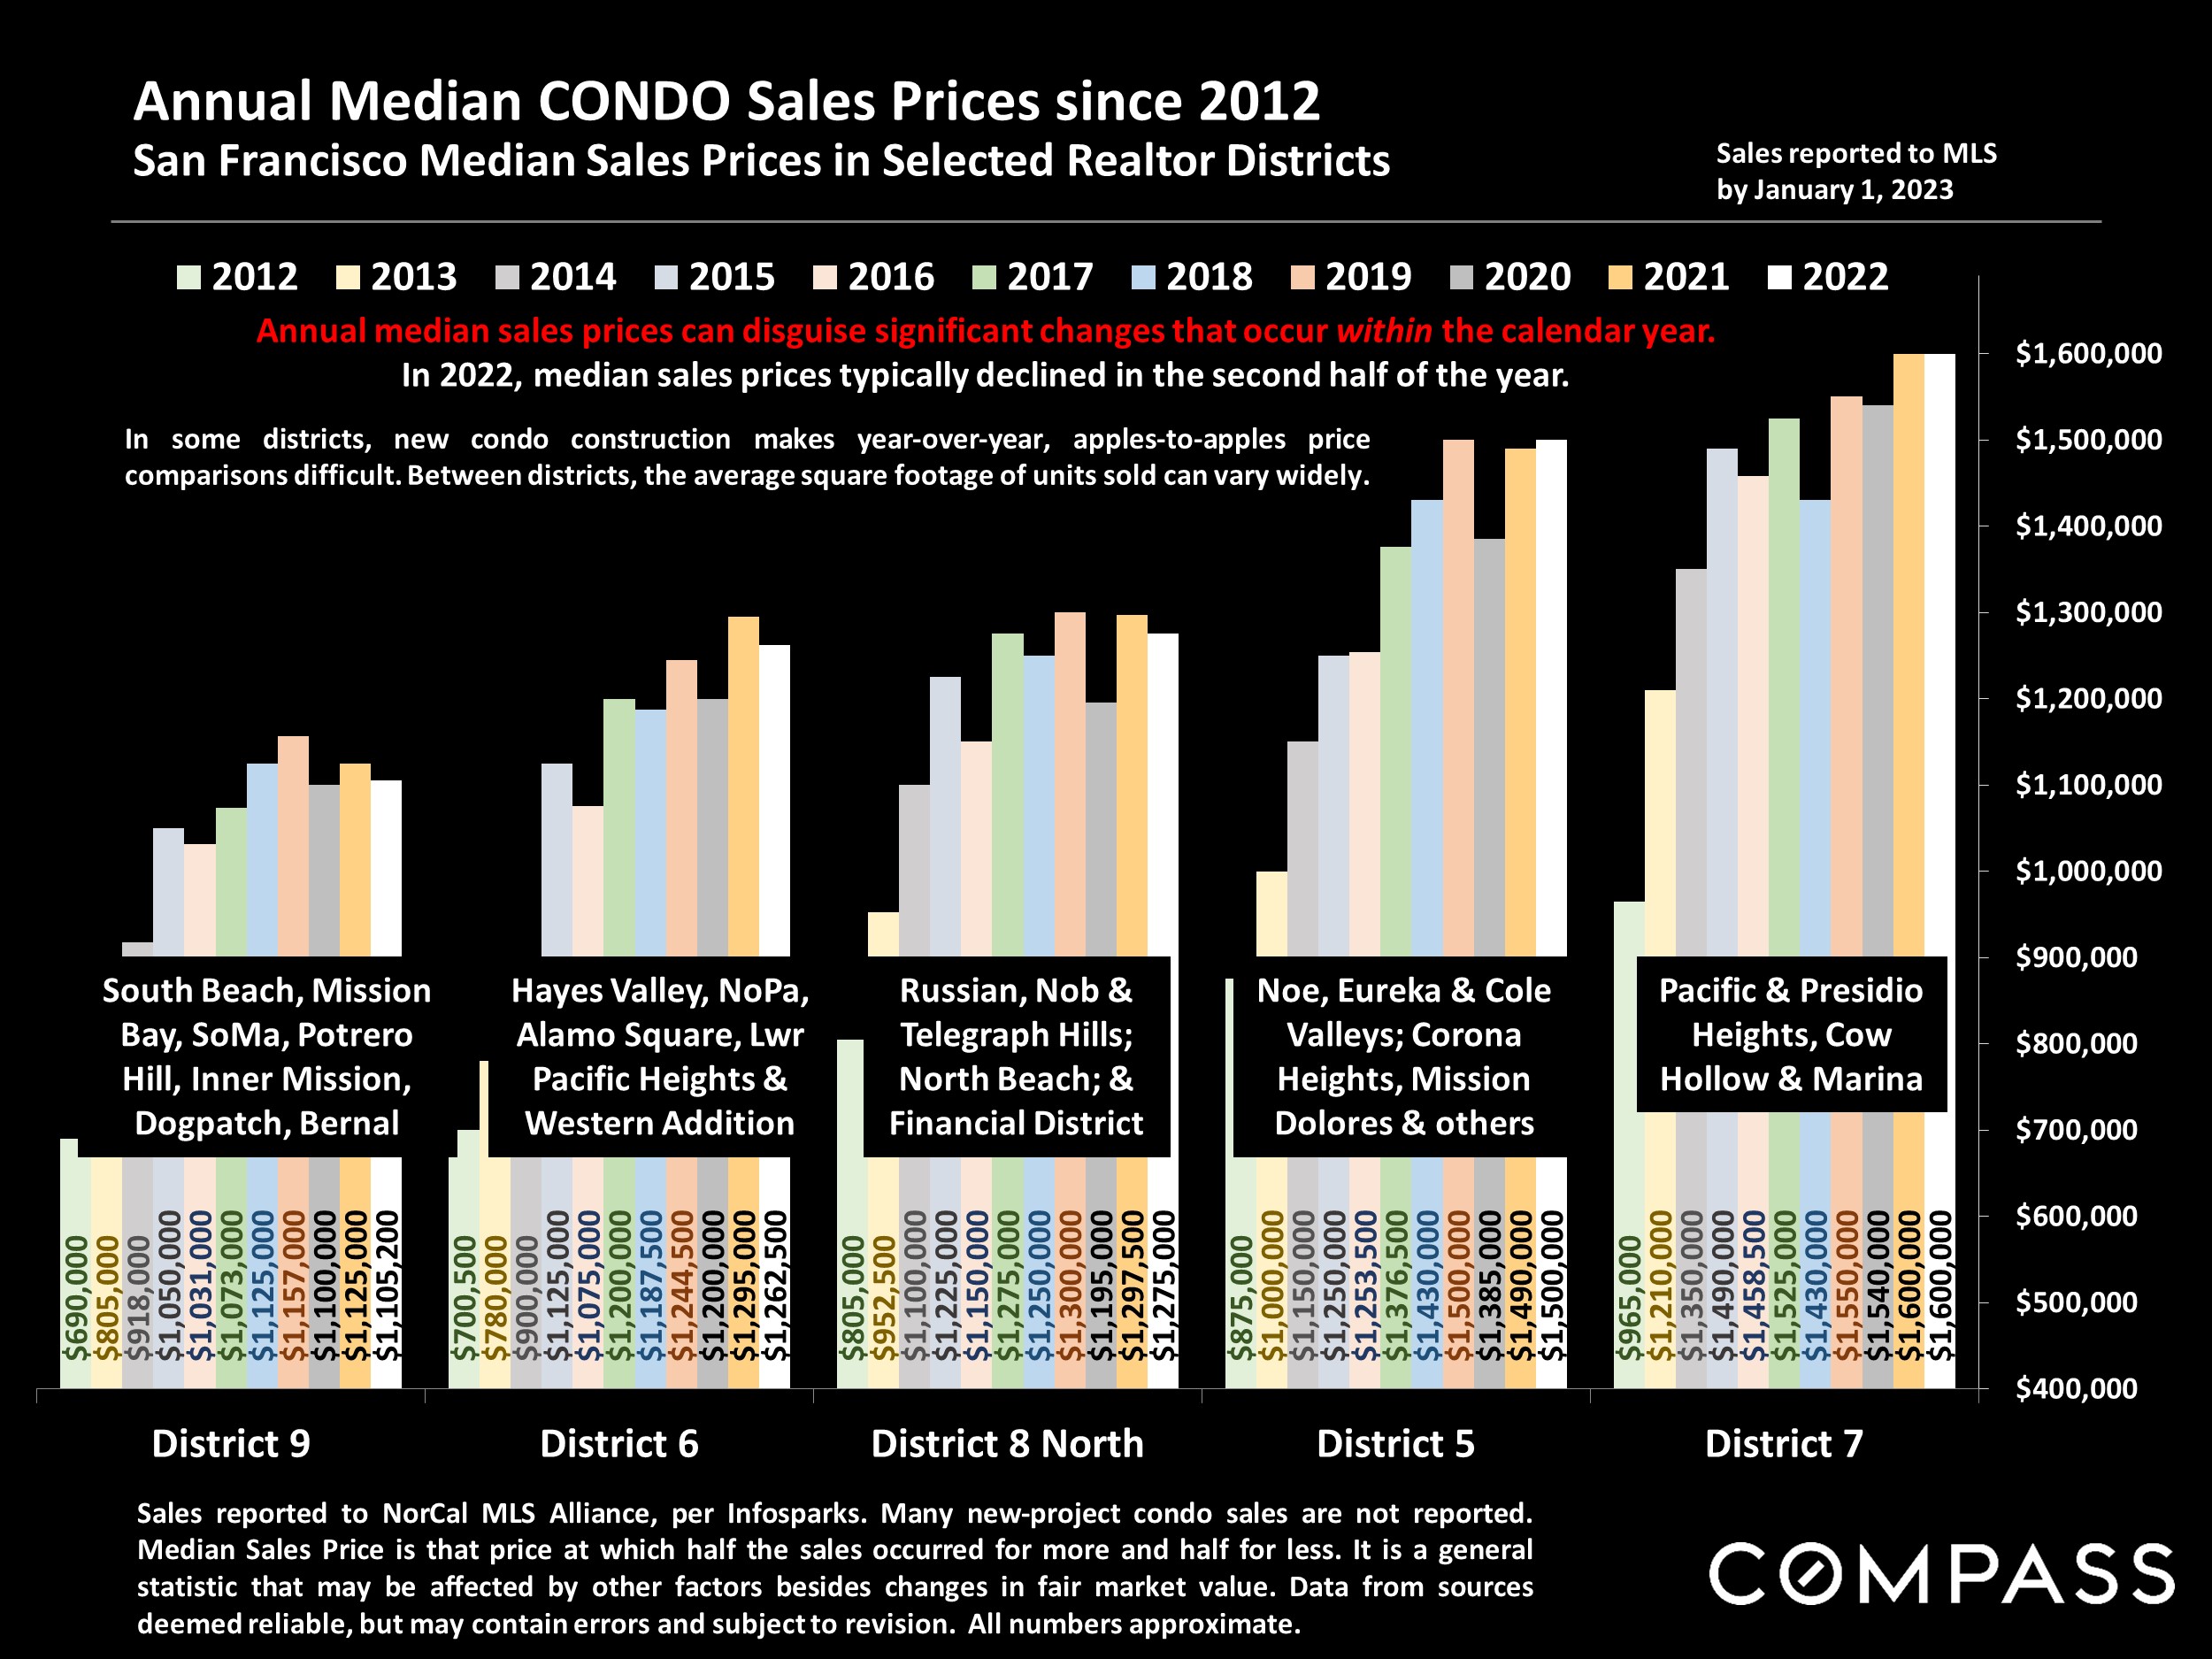
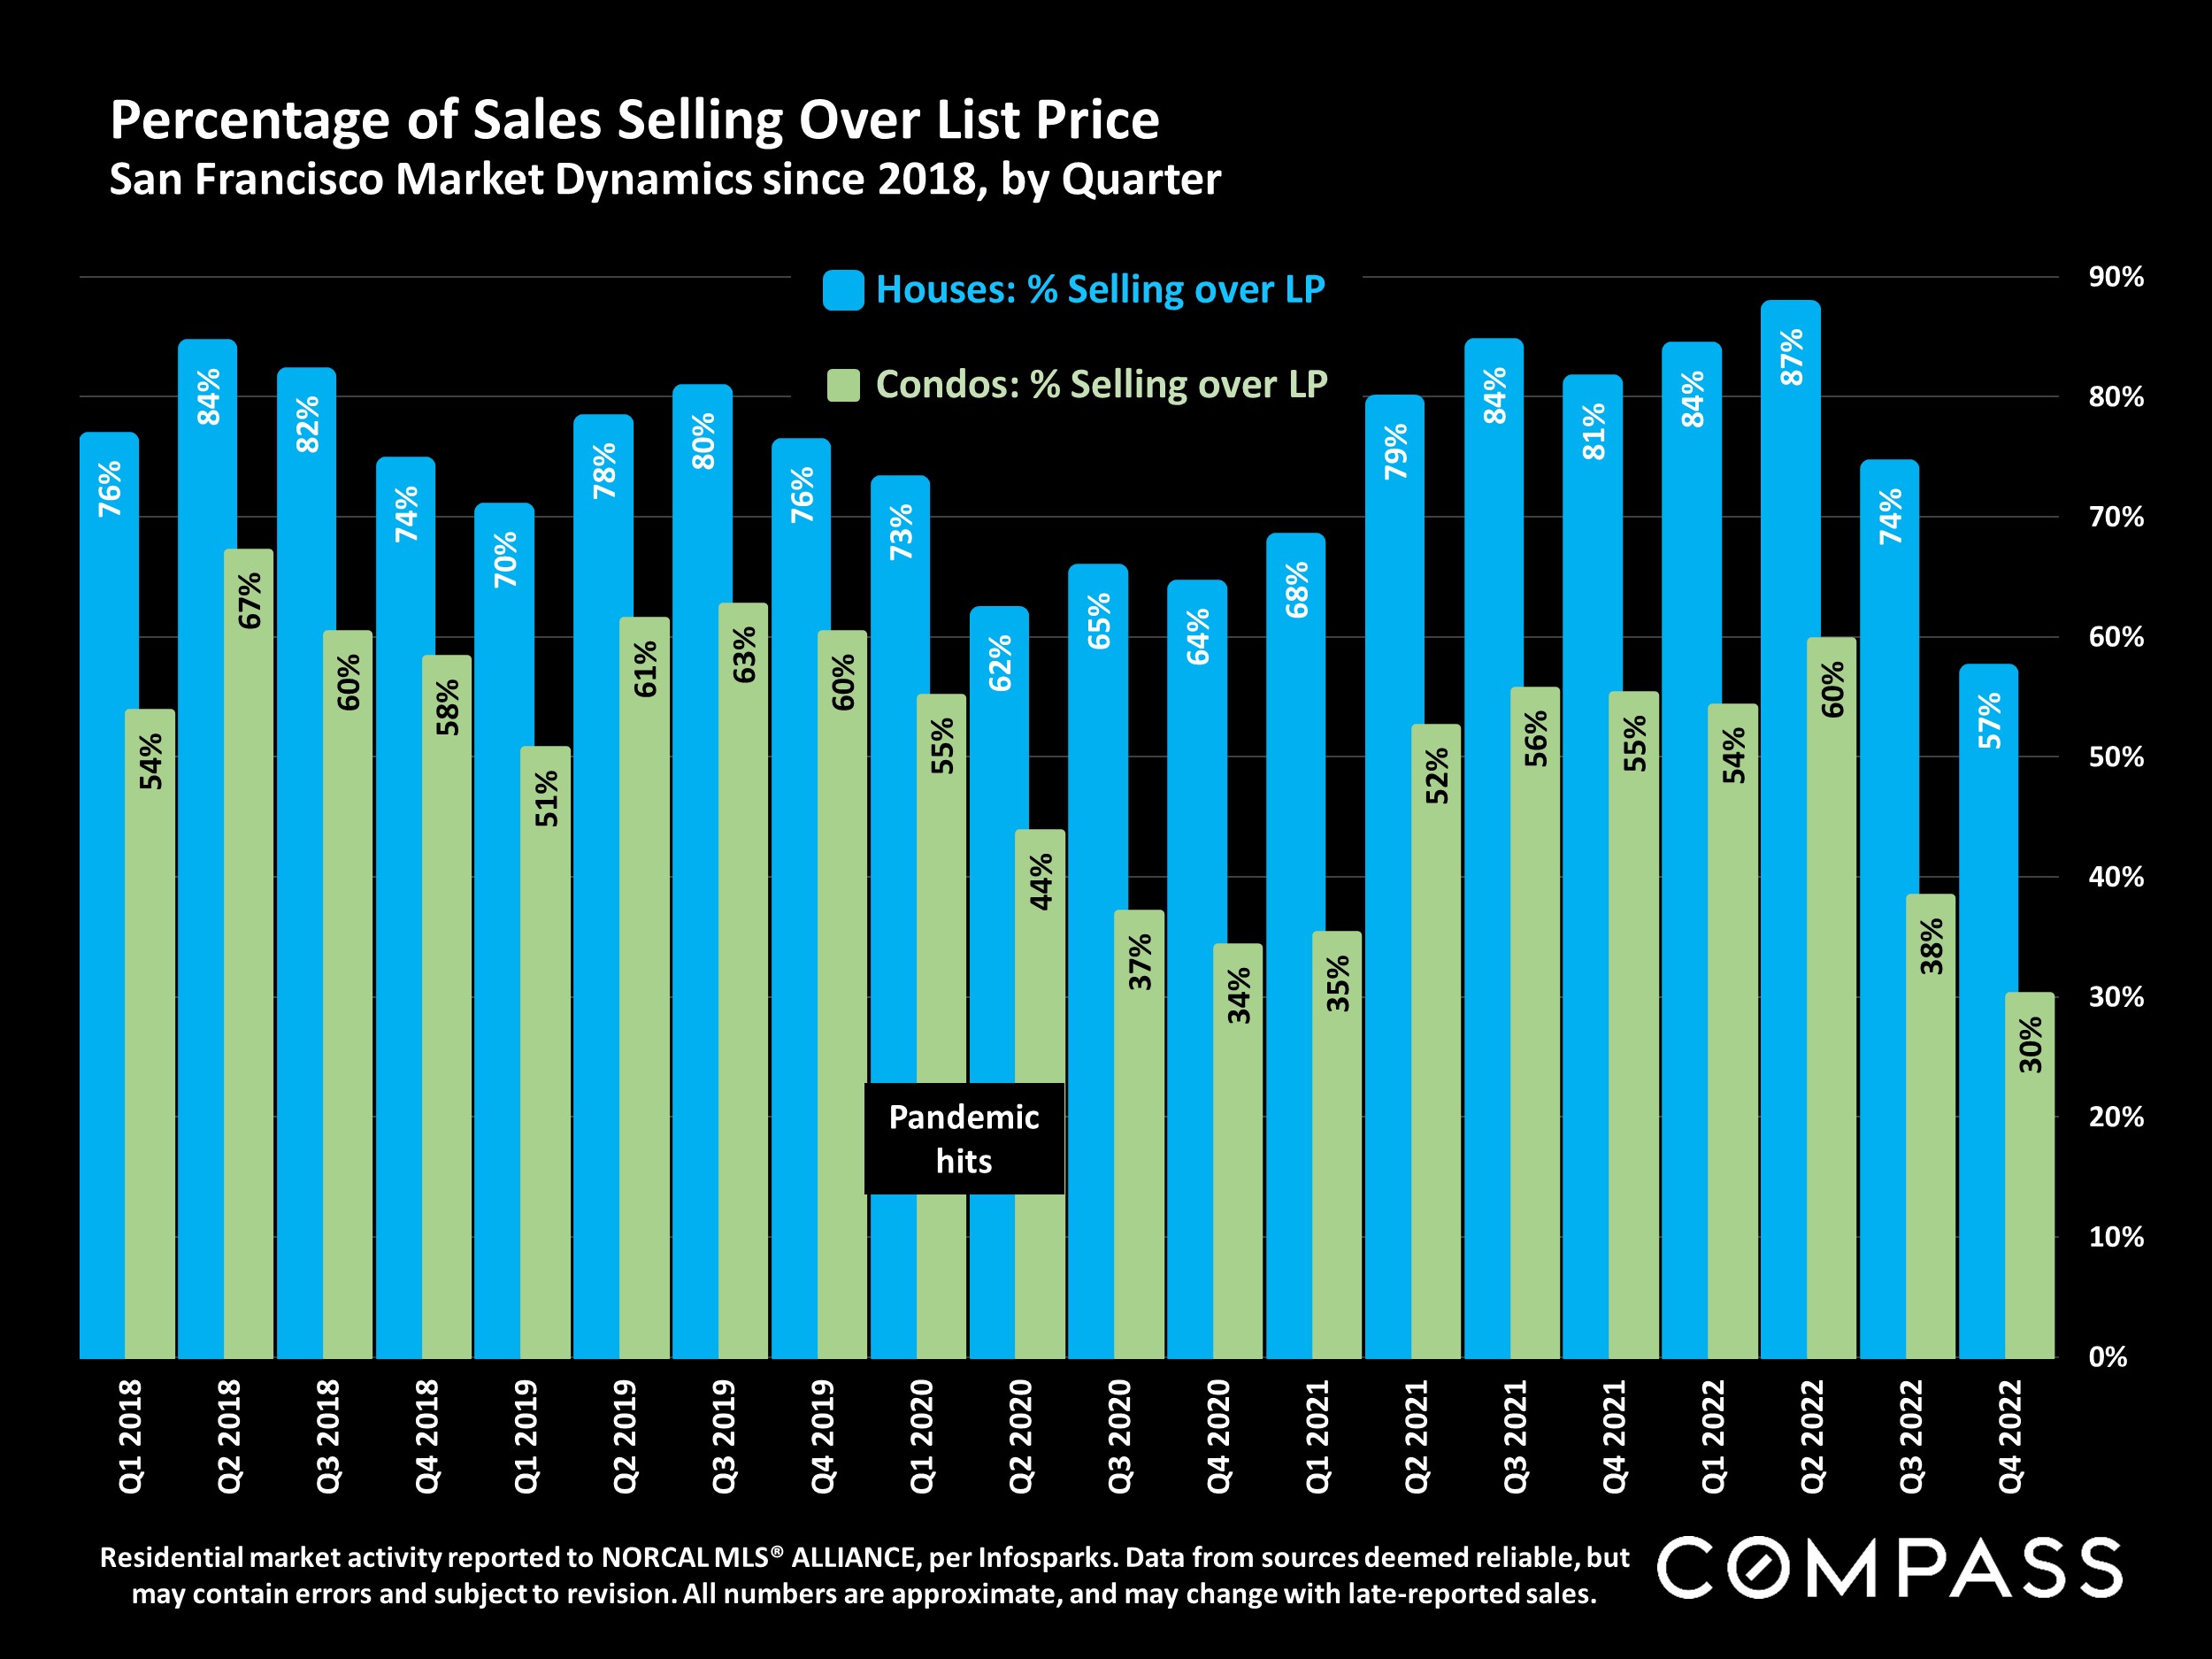
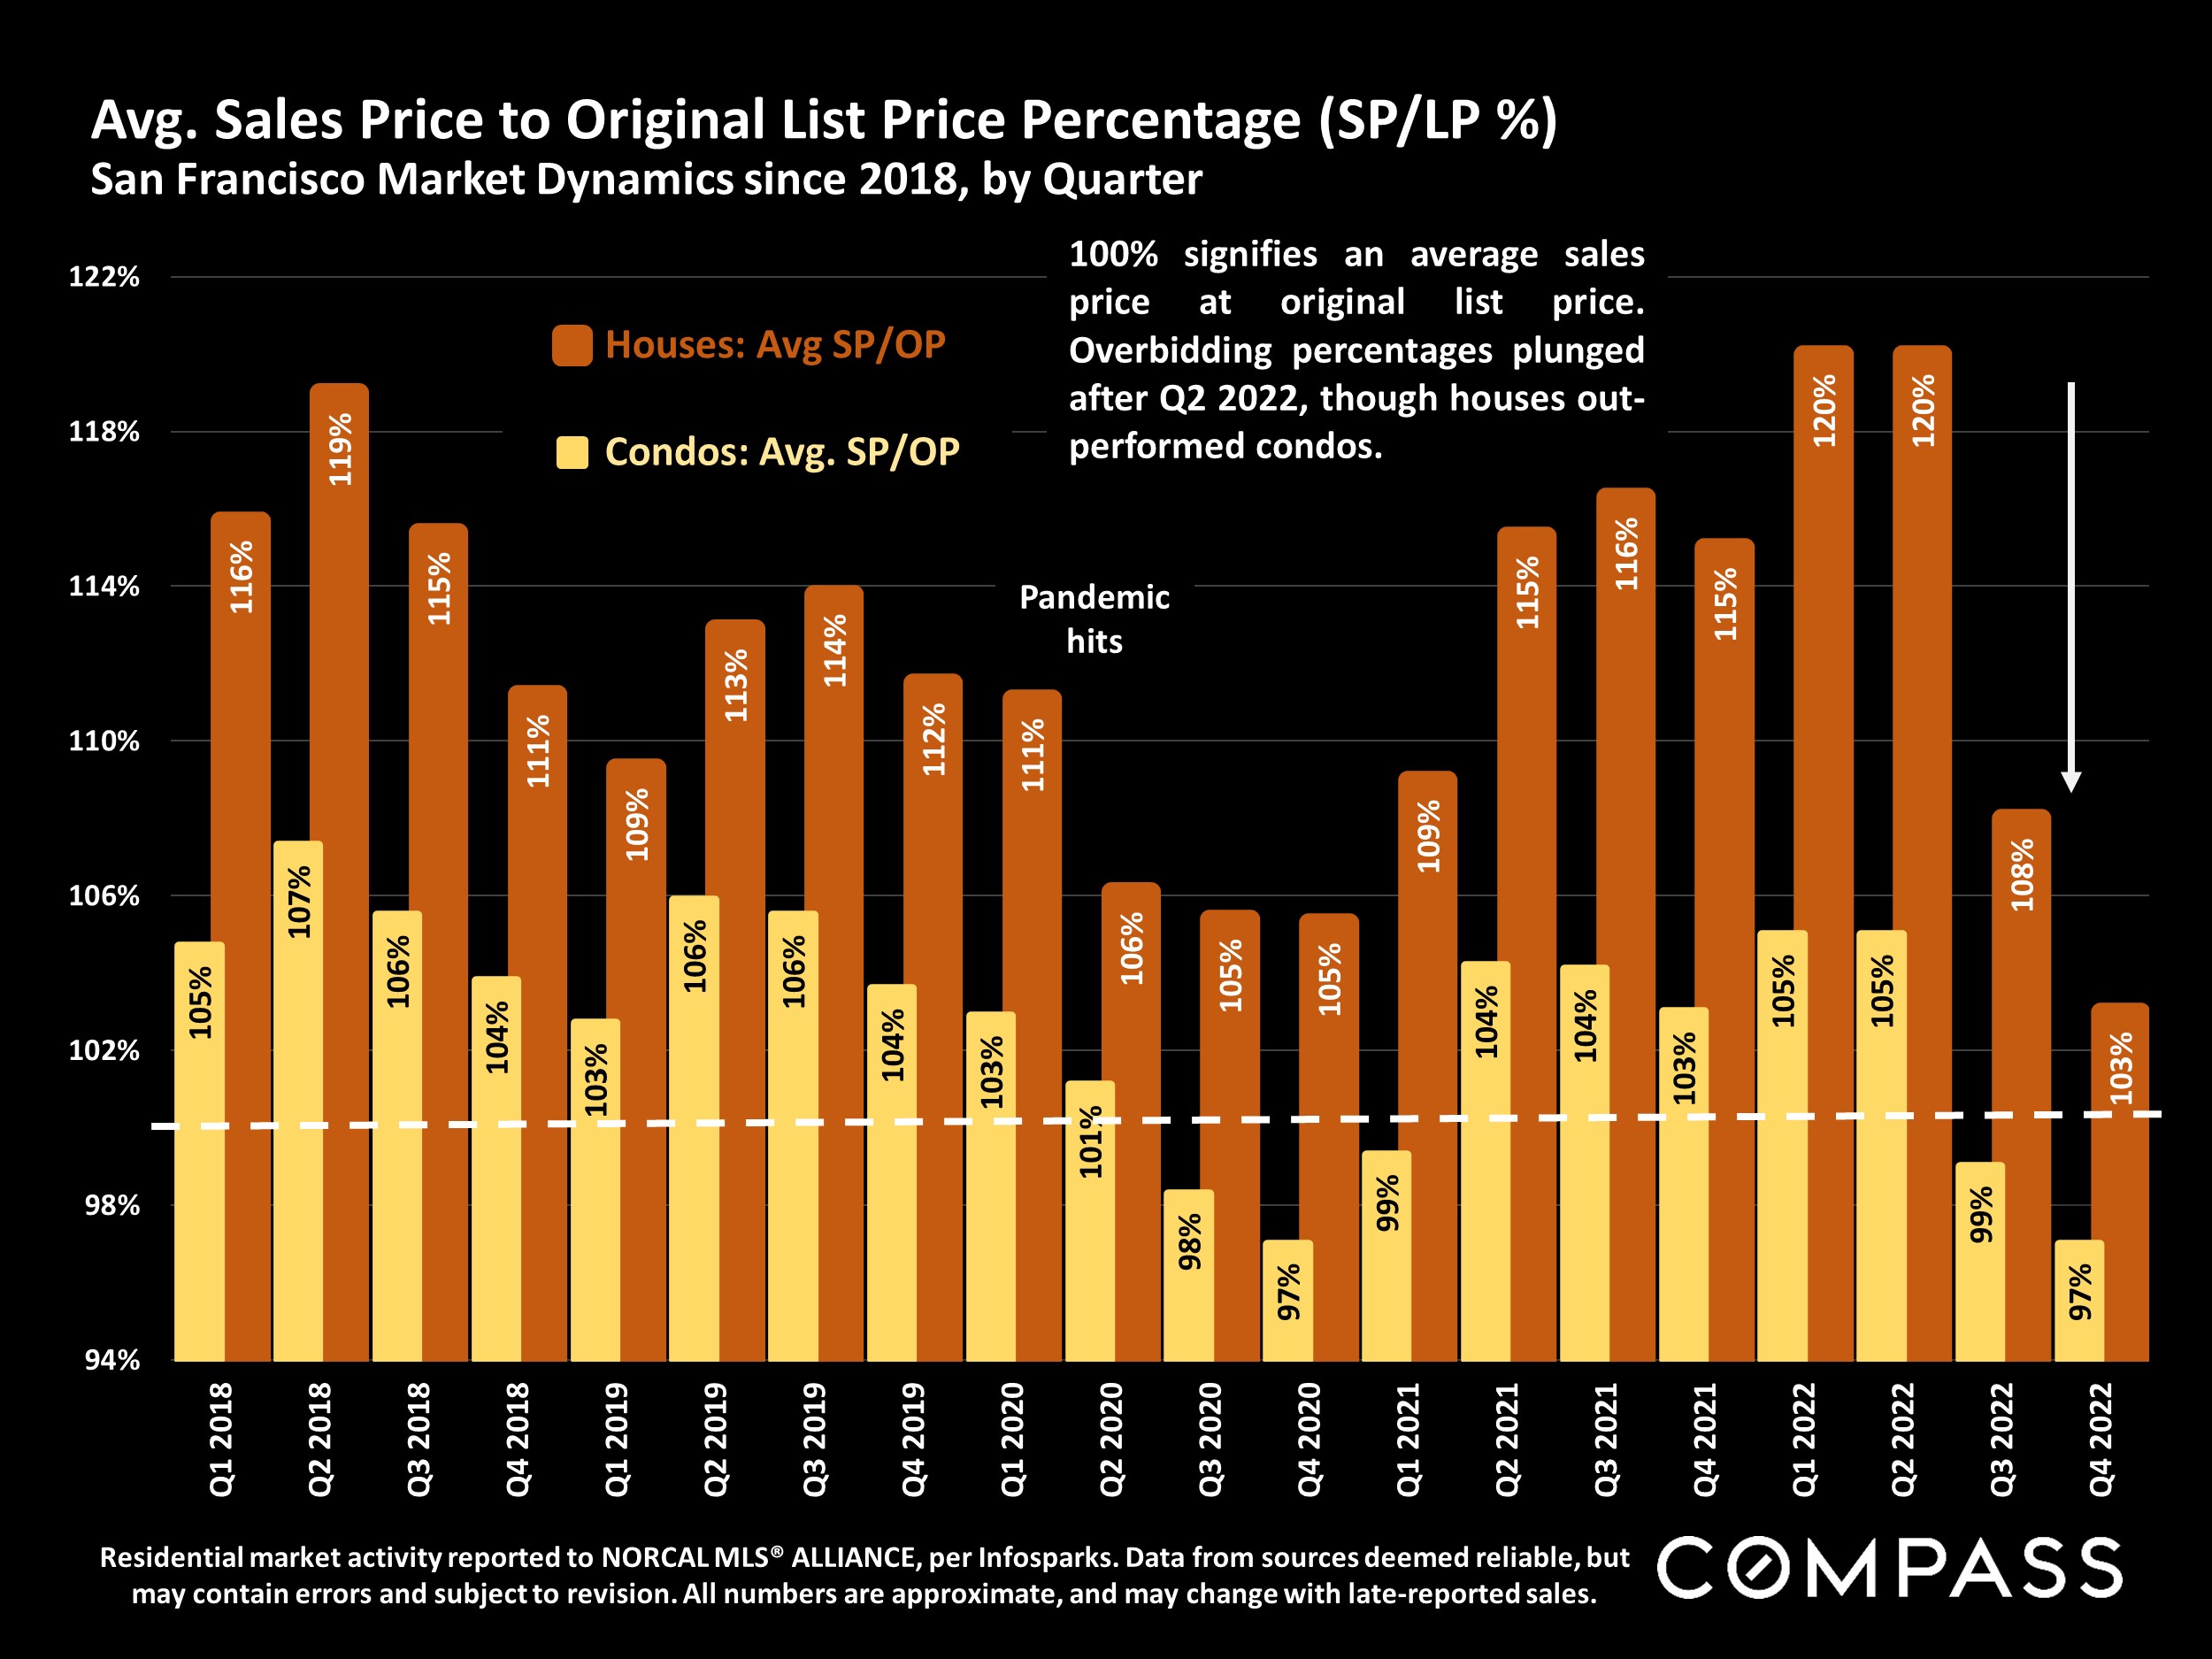
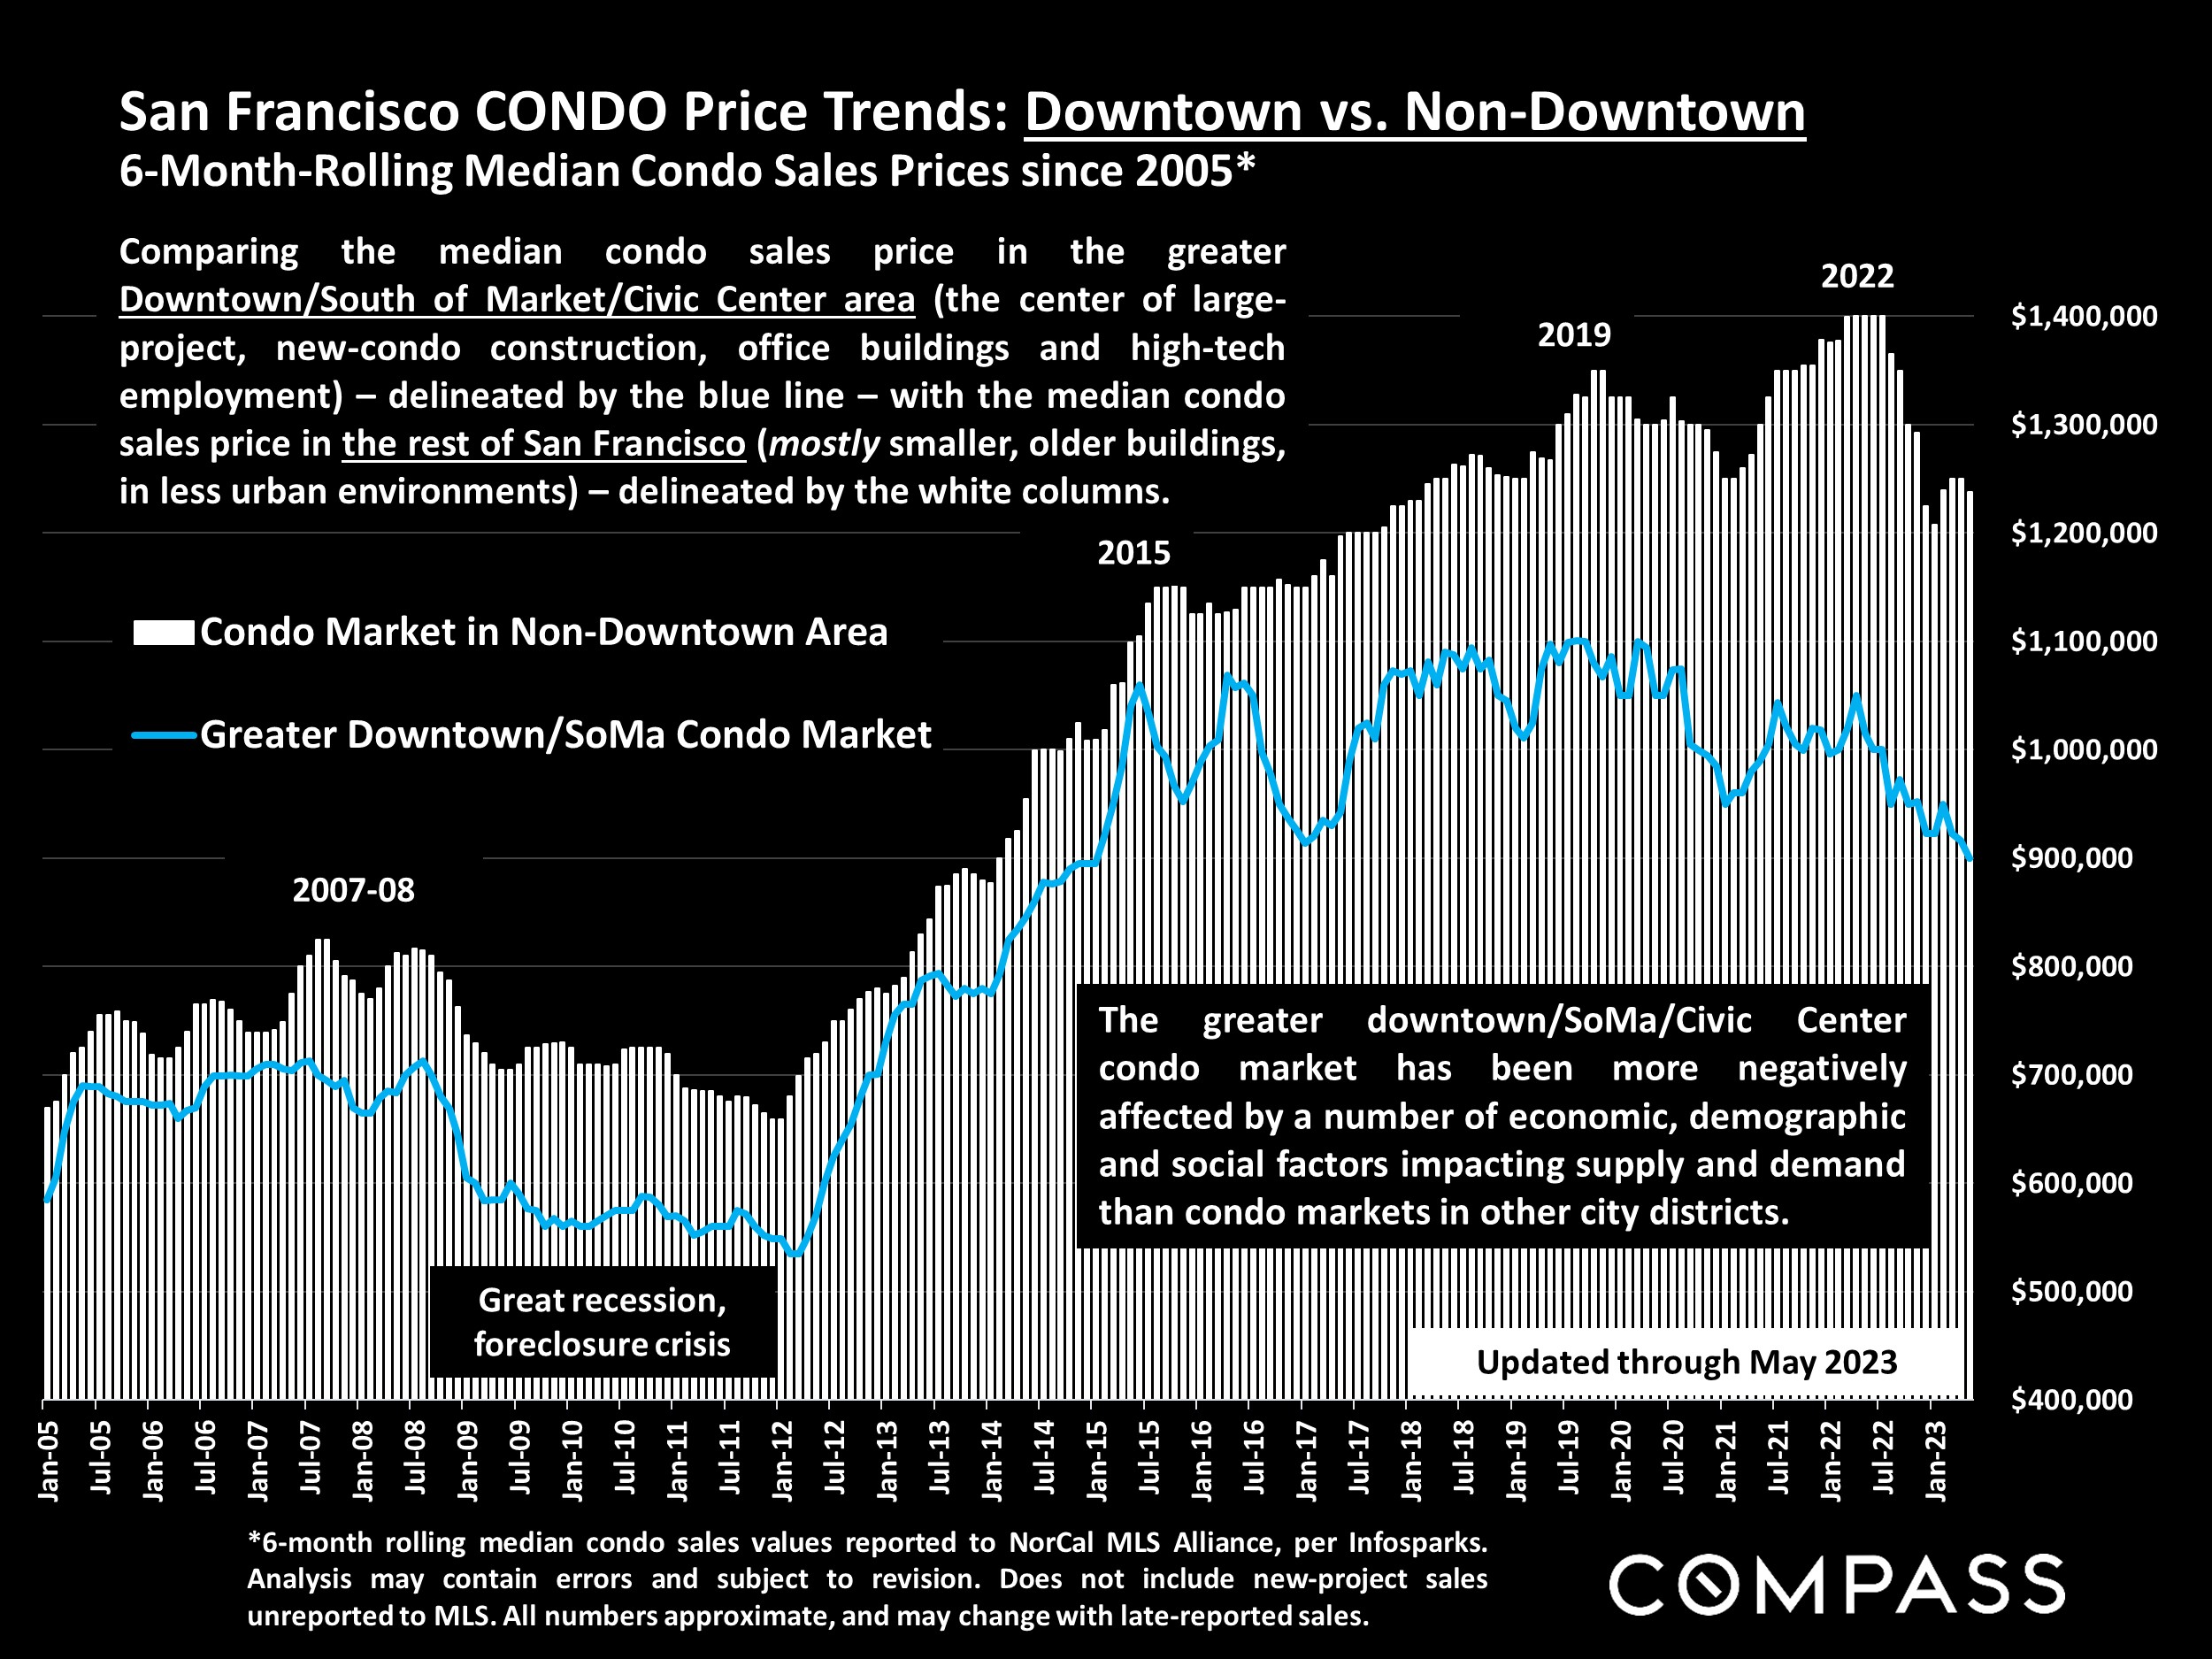
The SF house market continues to be substantially stronger than the condo market, and the condo market in the downtown/South of Market/Civic Center area – affected by a number of economic and social factors – is considerably weaker than condo markets in the rest of the city.
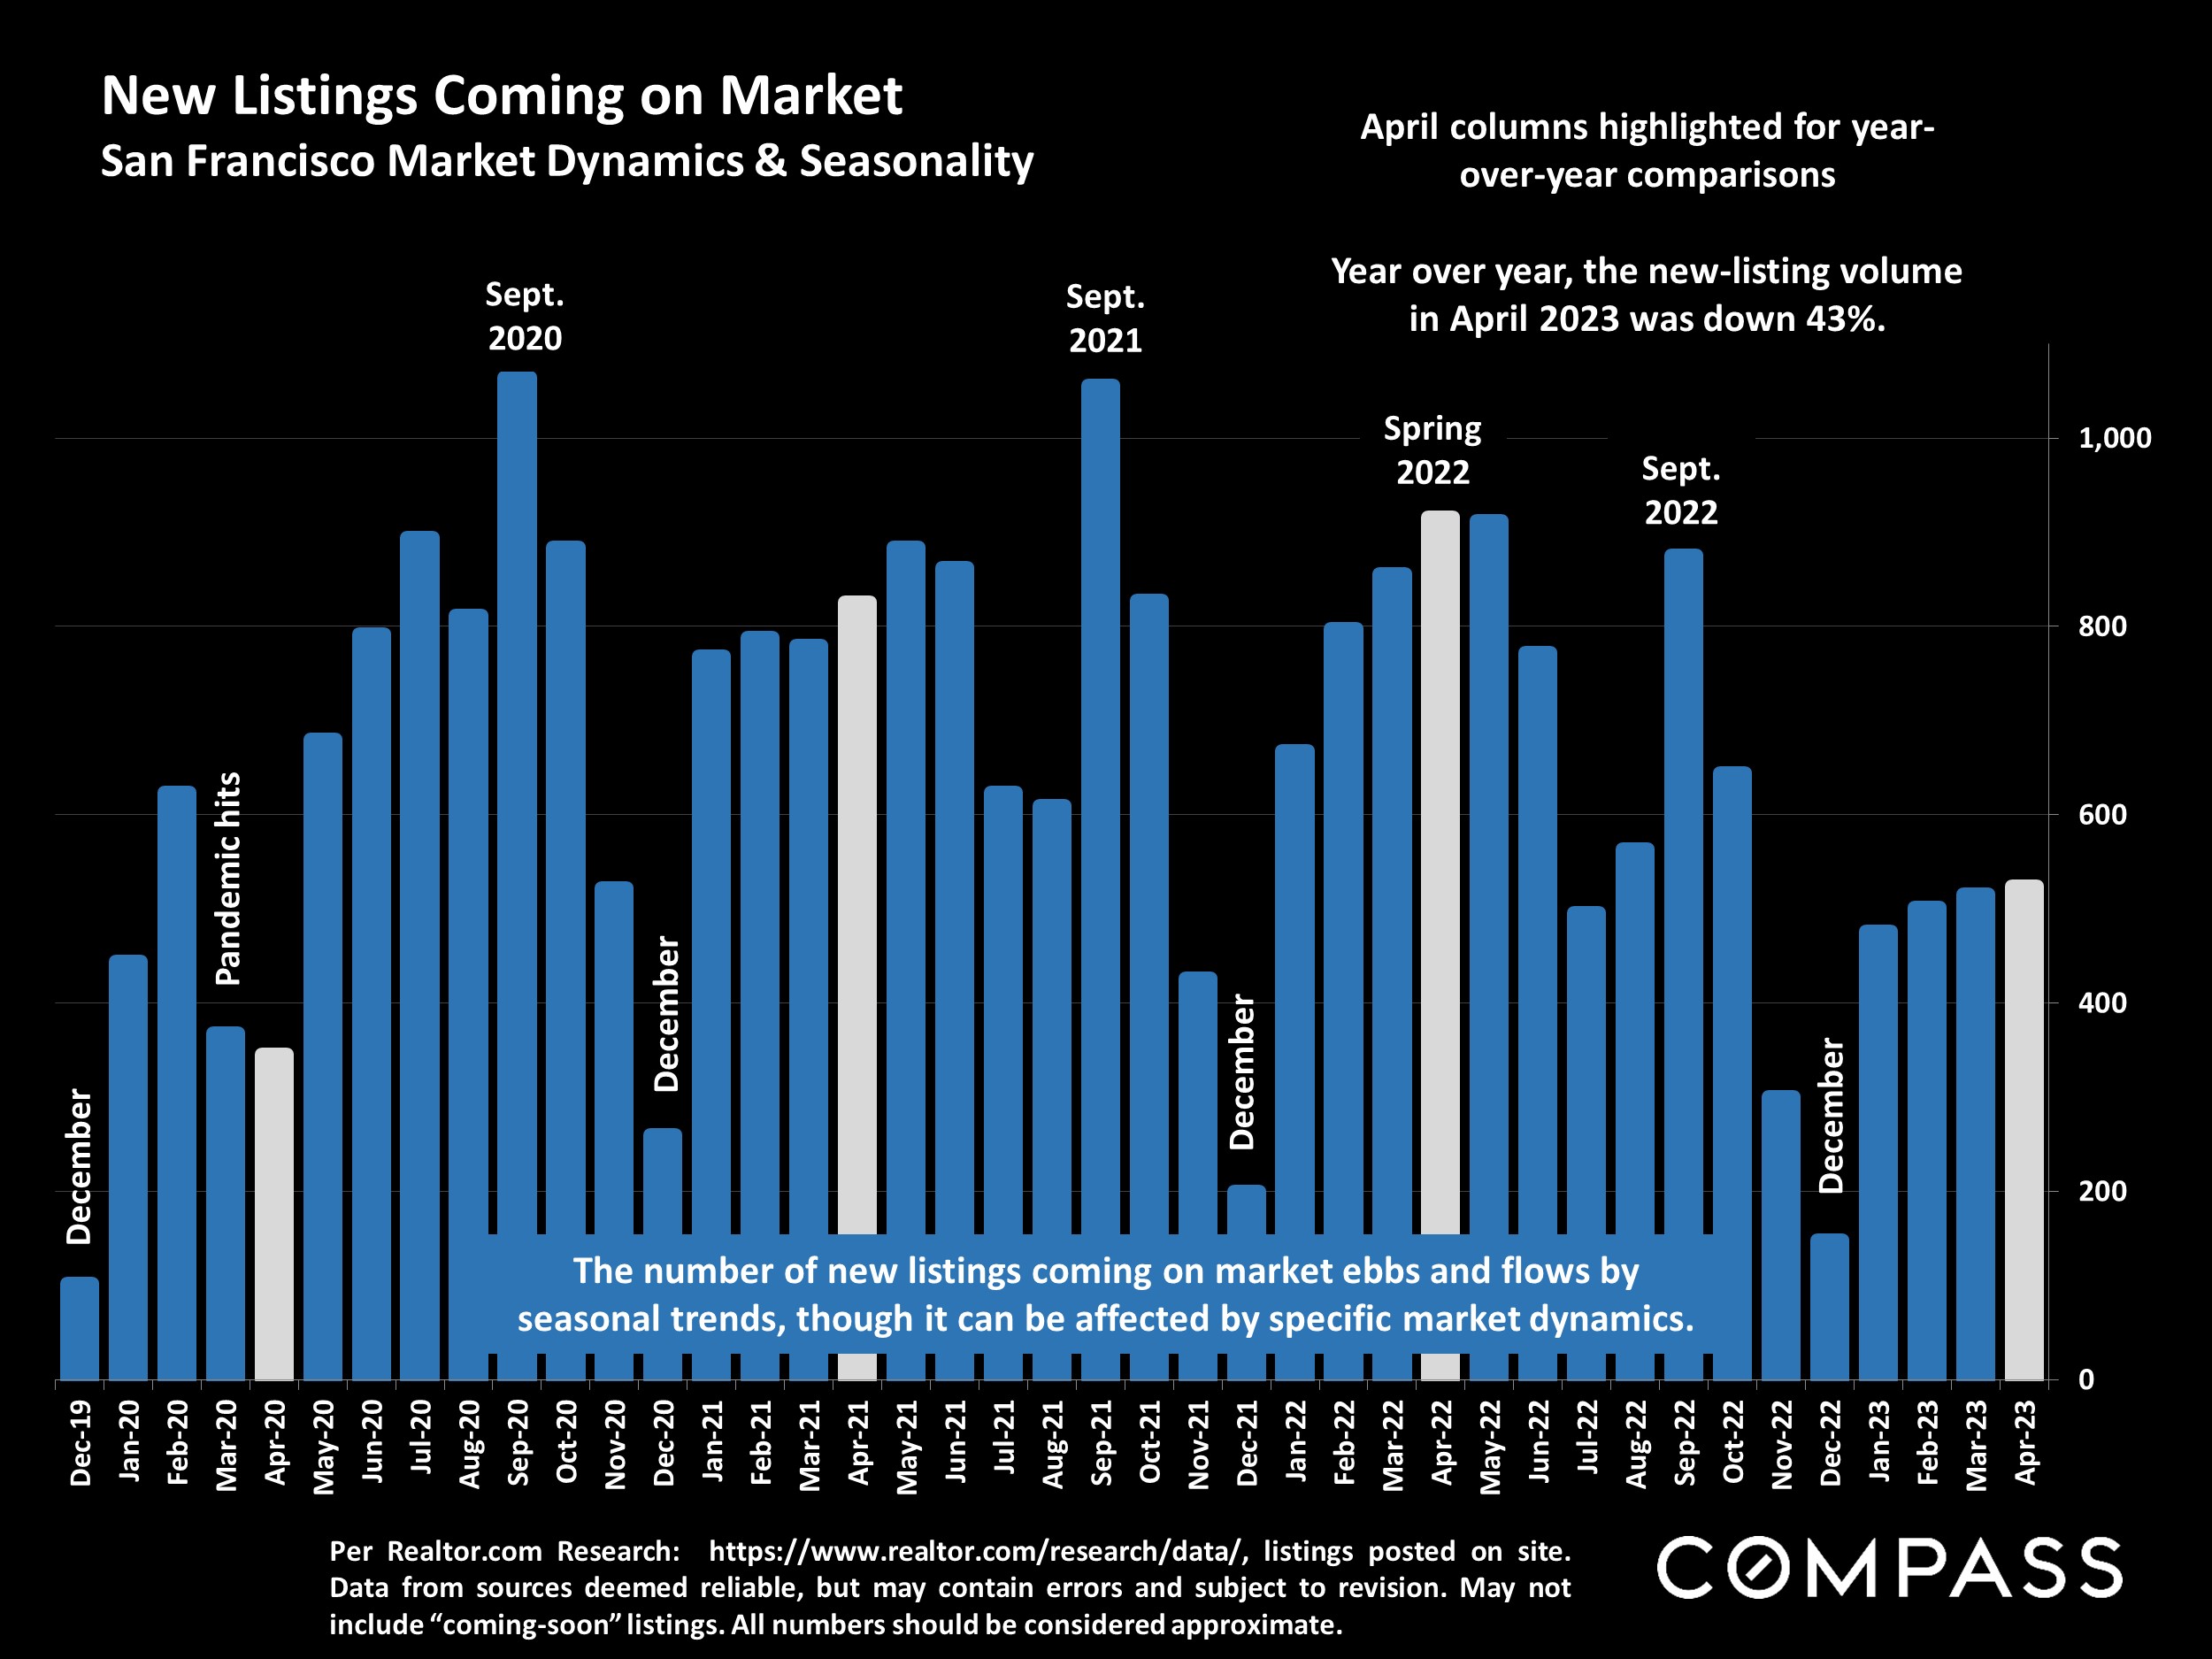
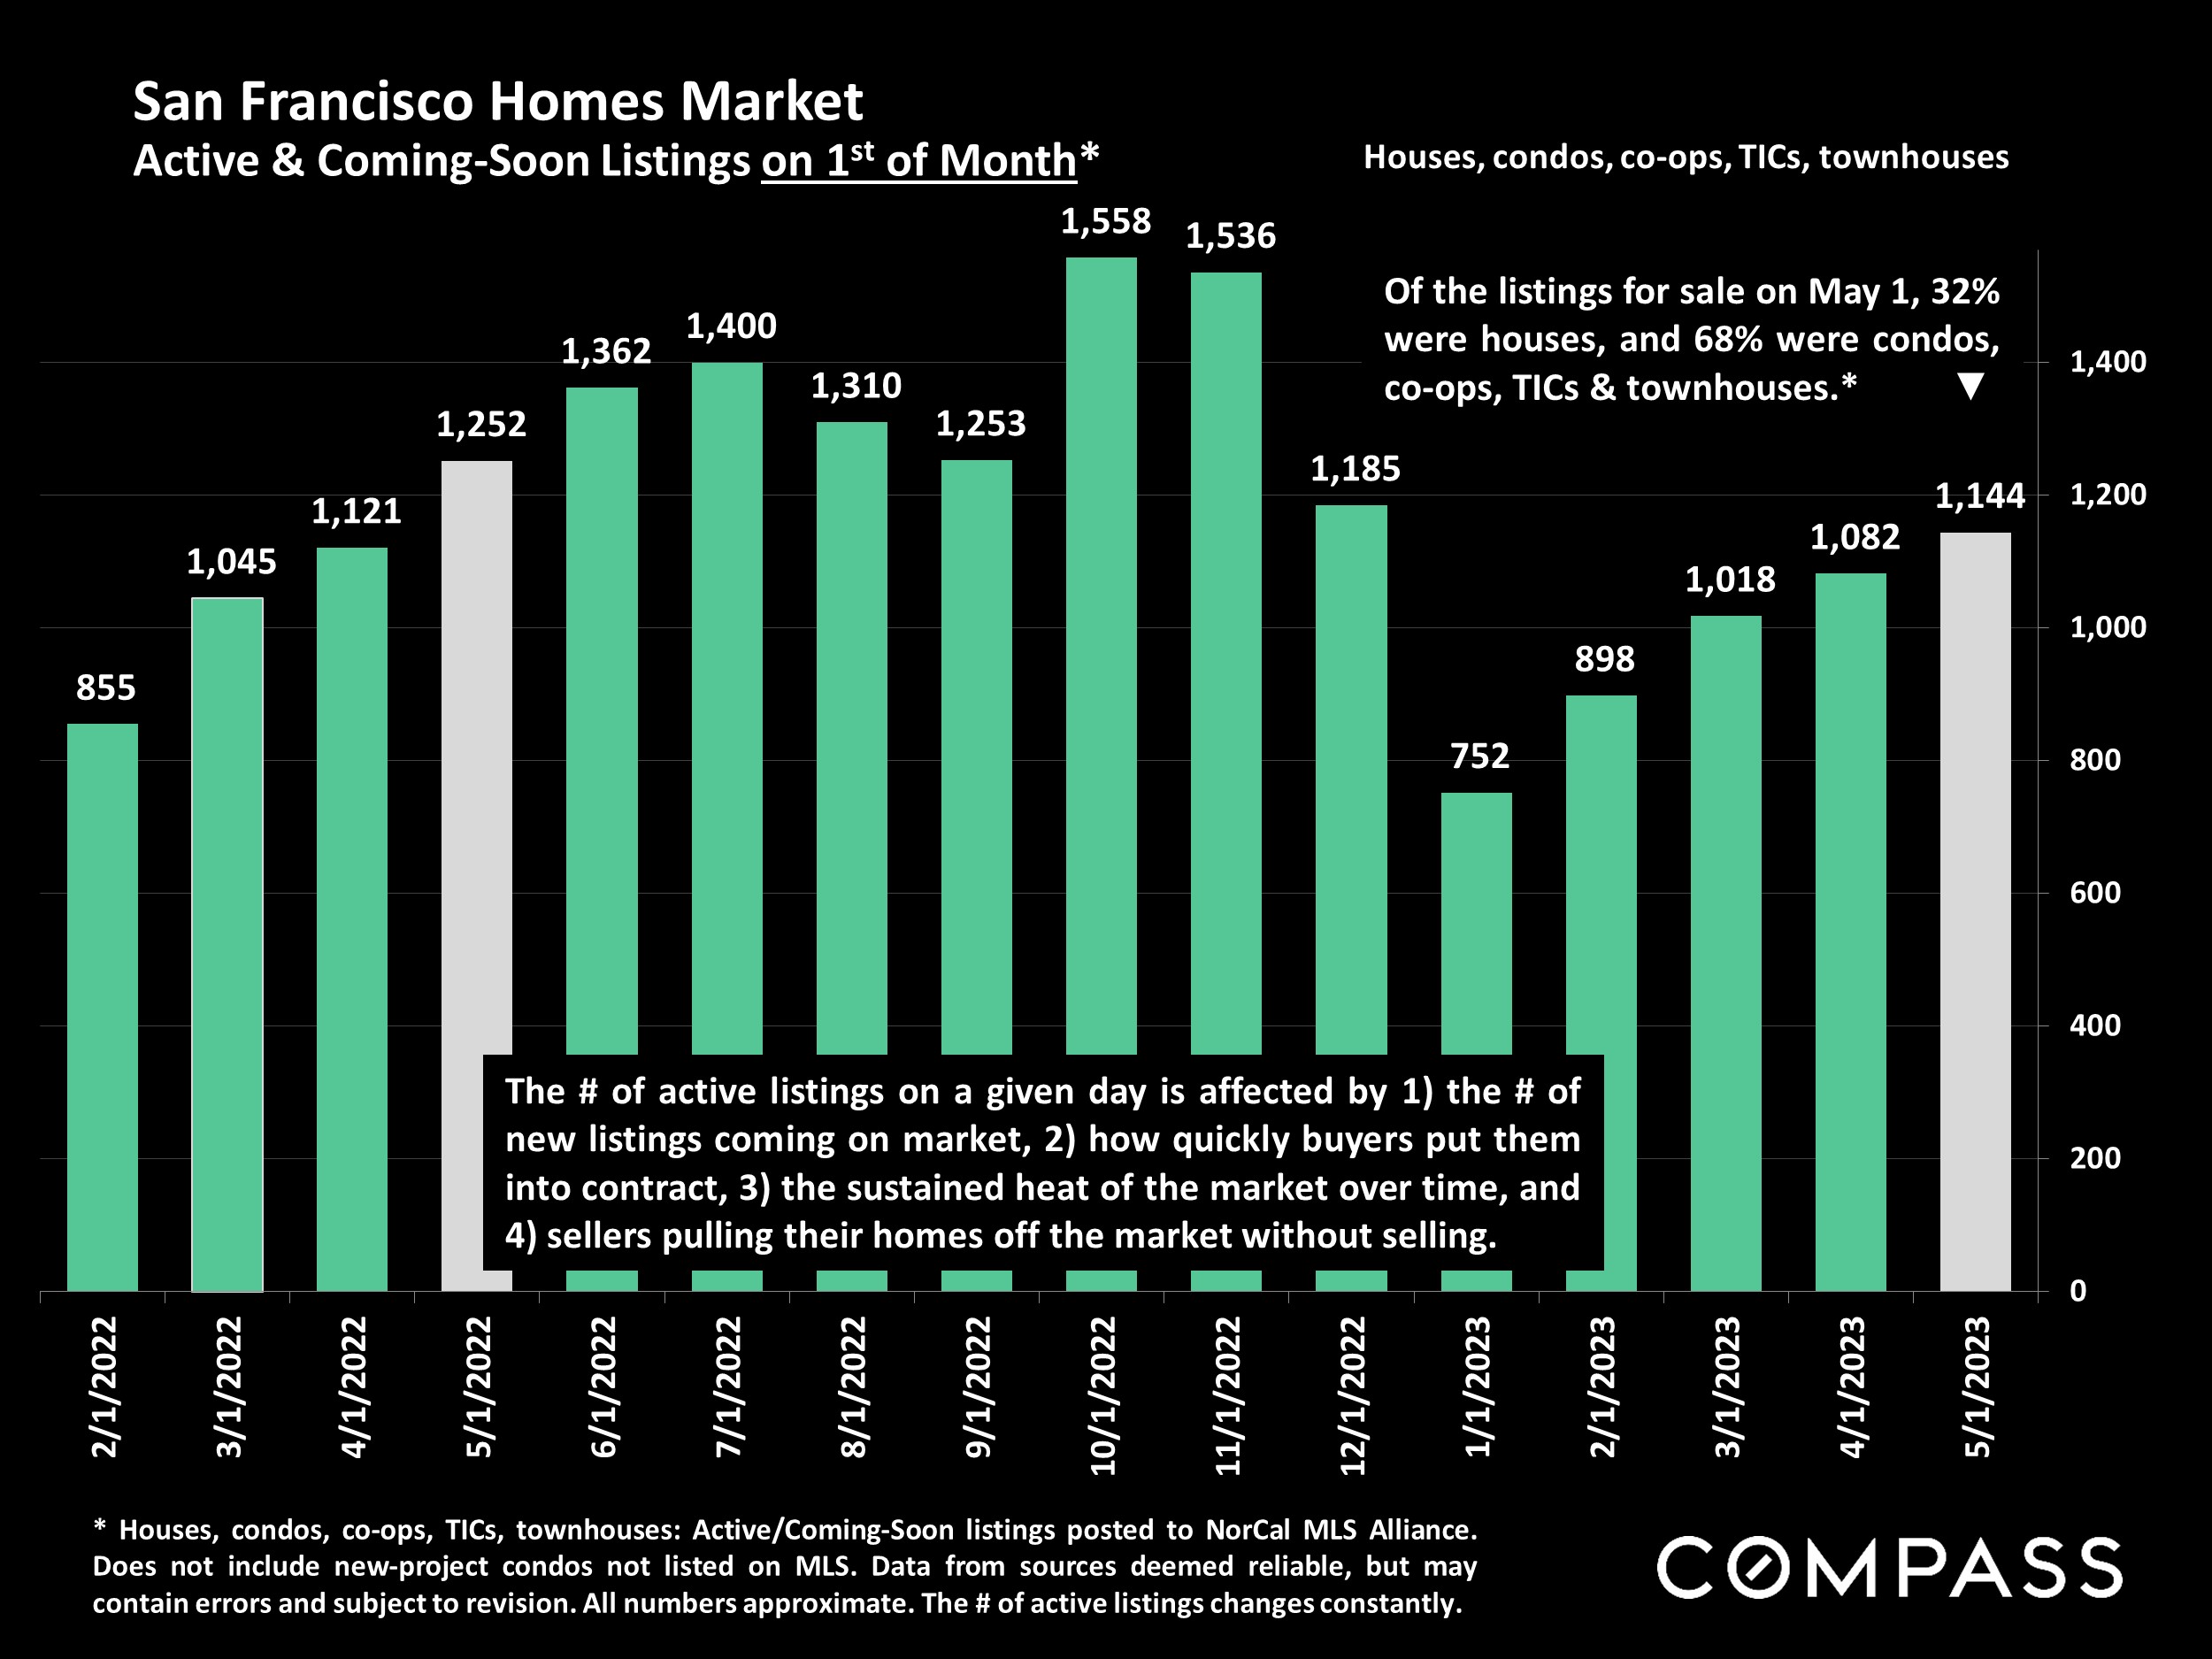
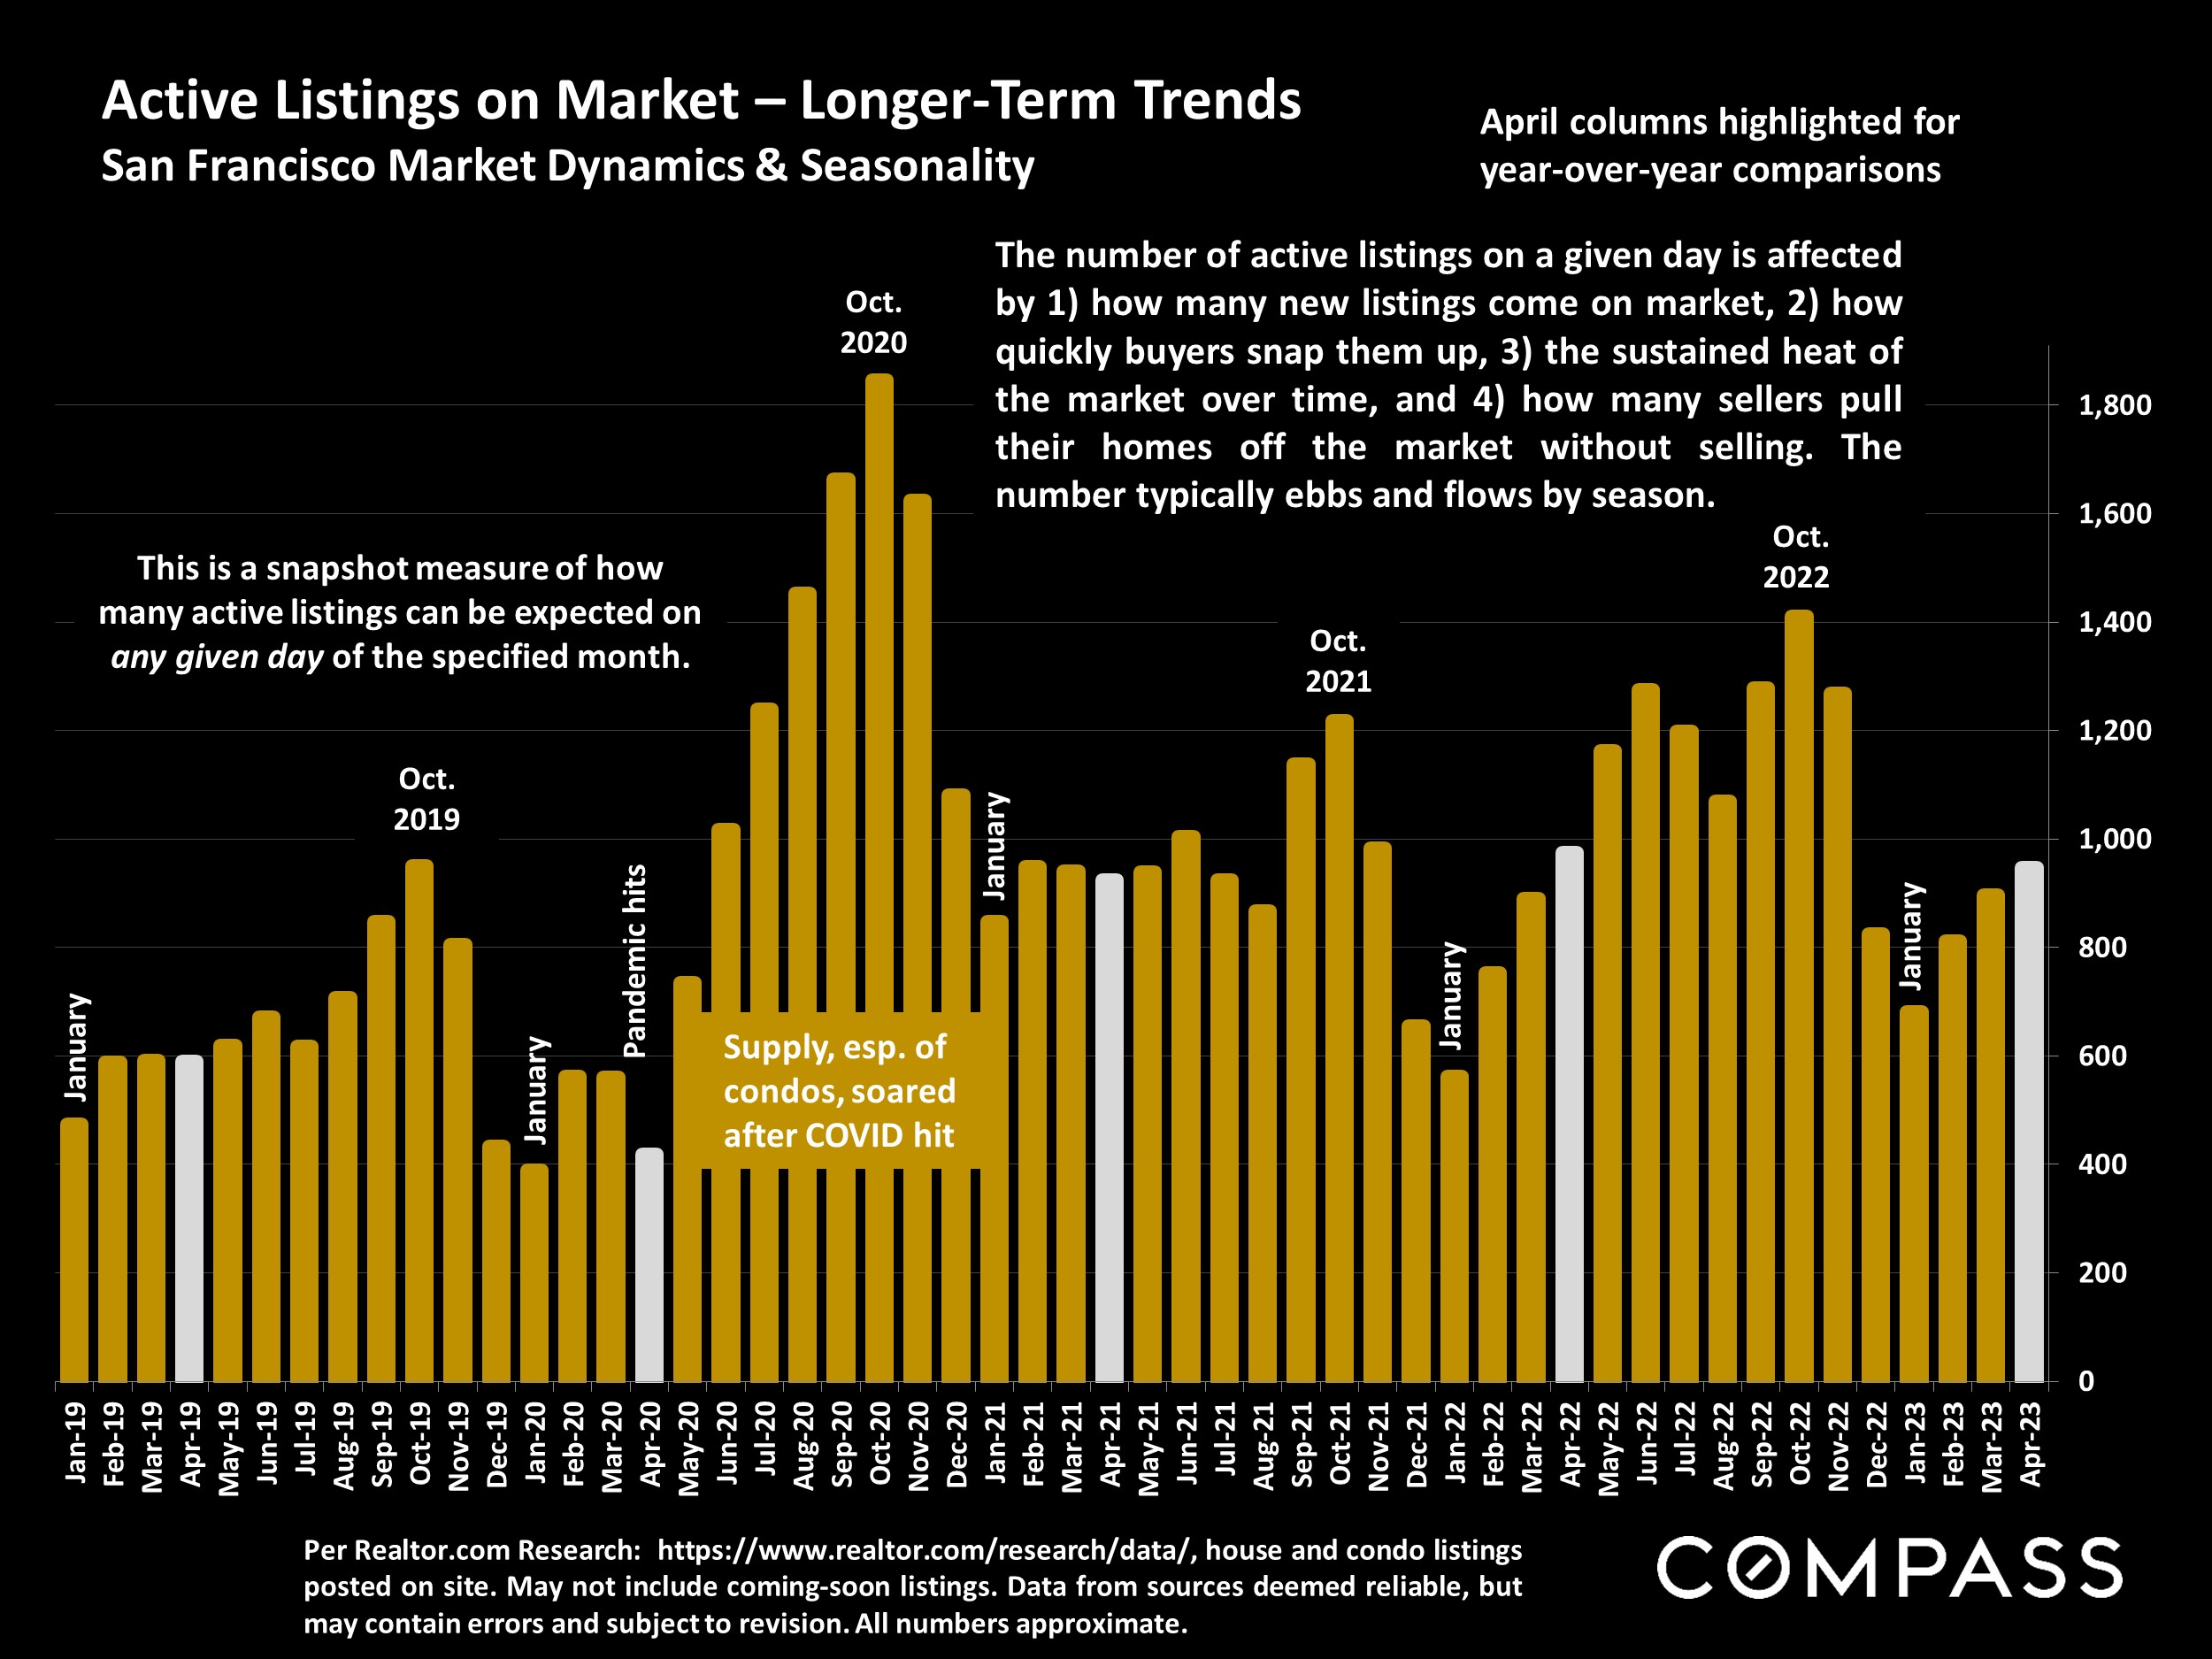
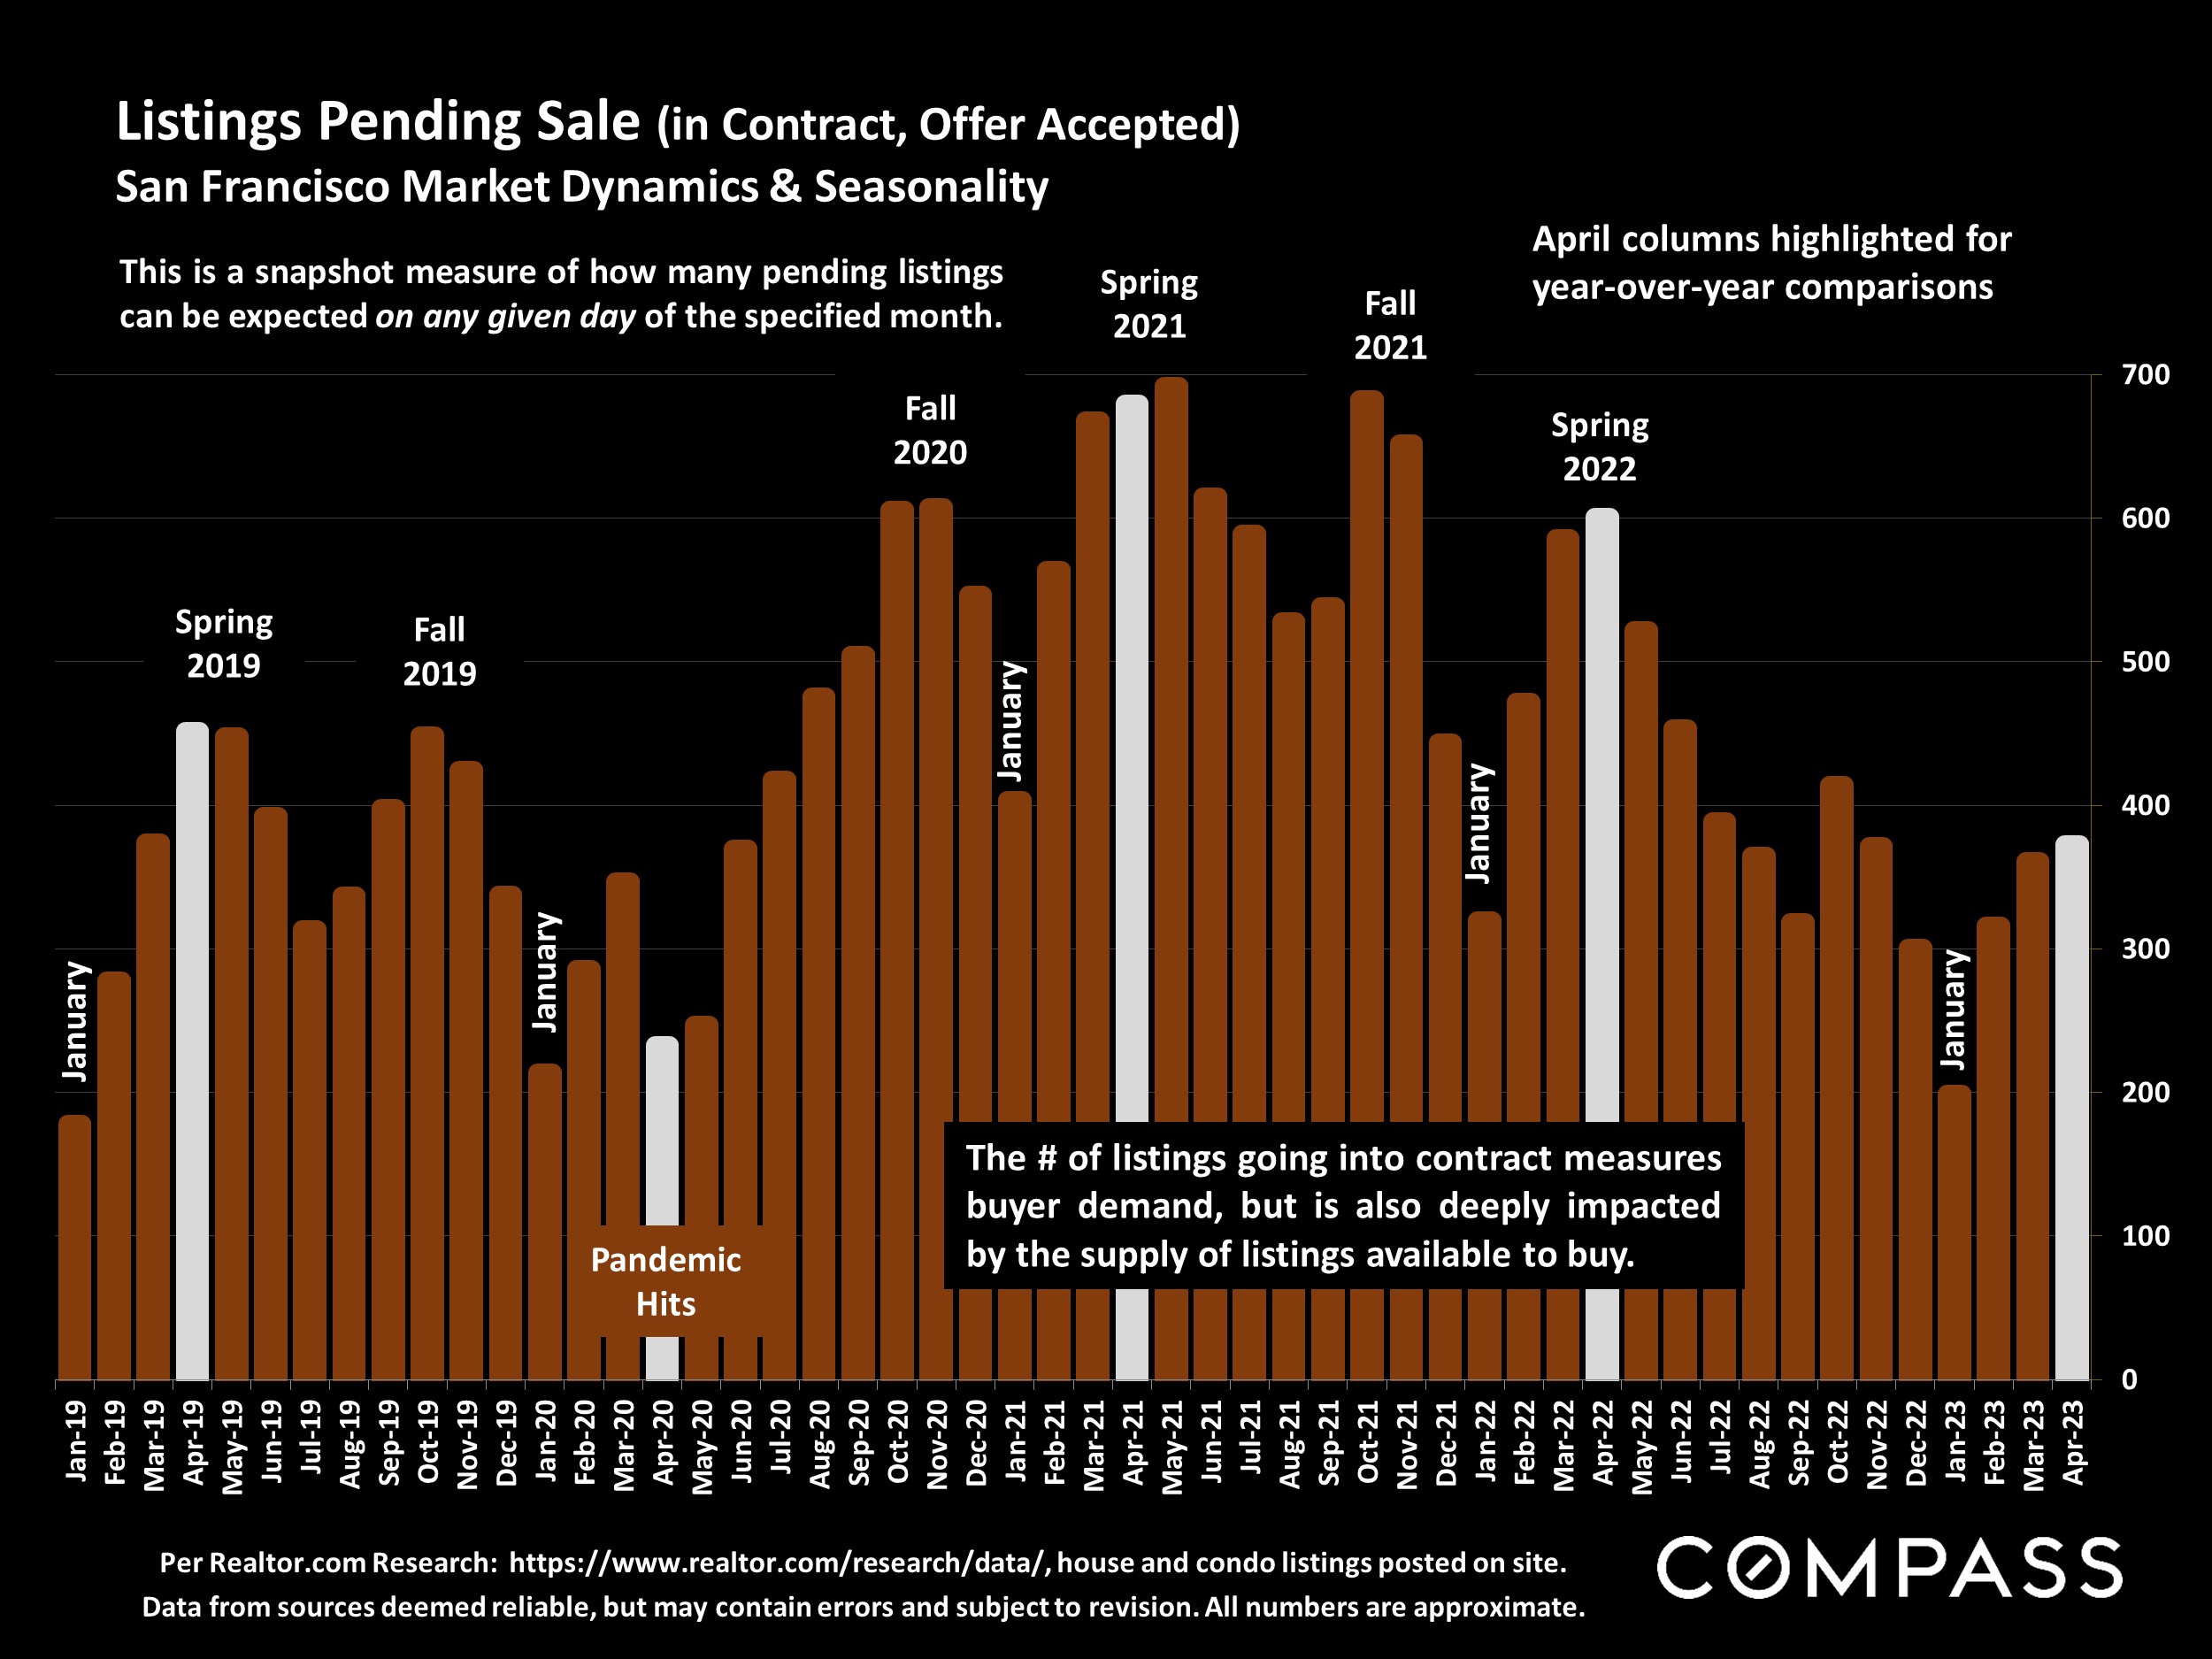
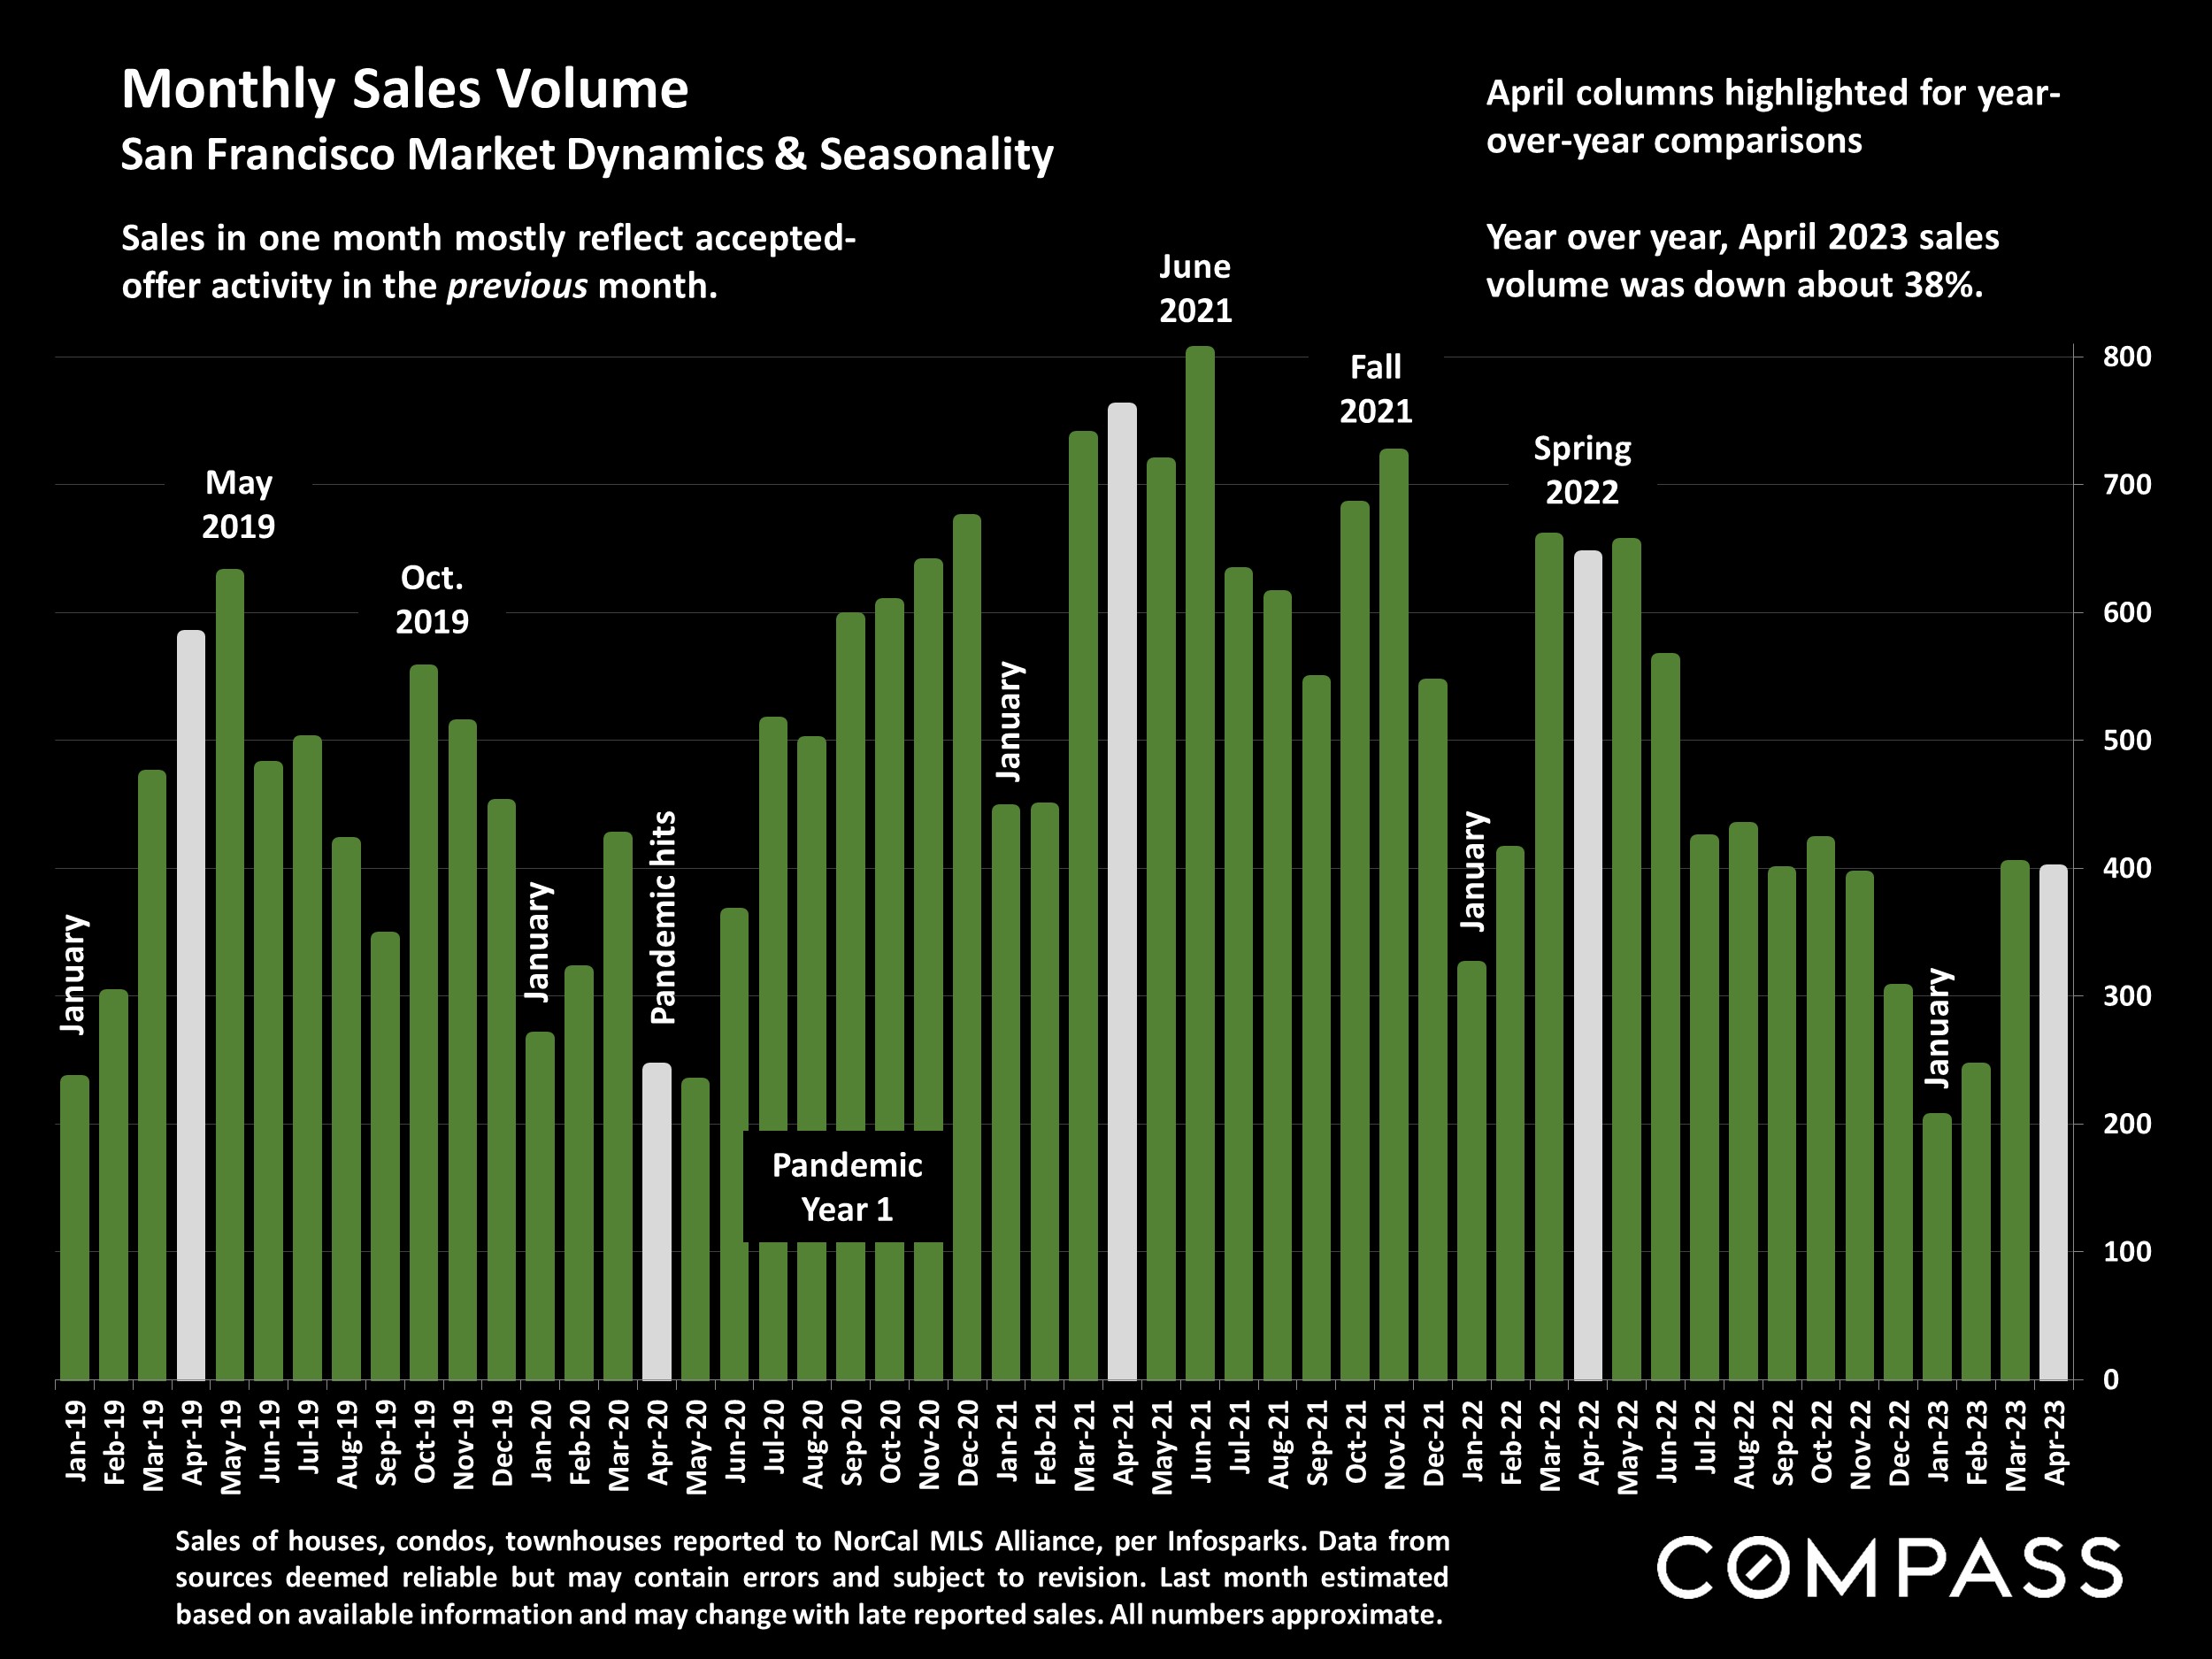
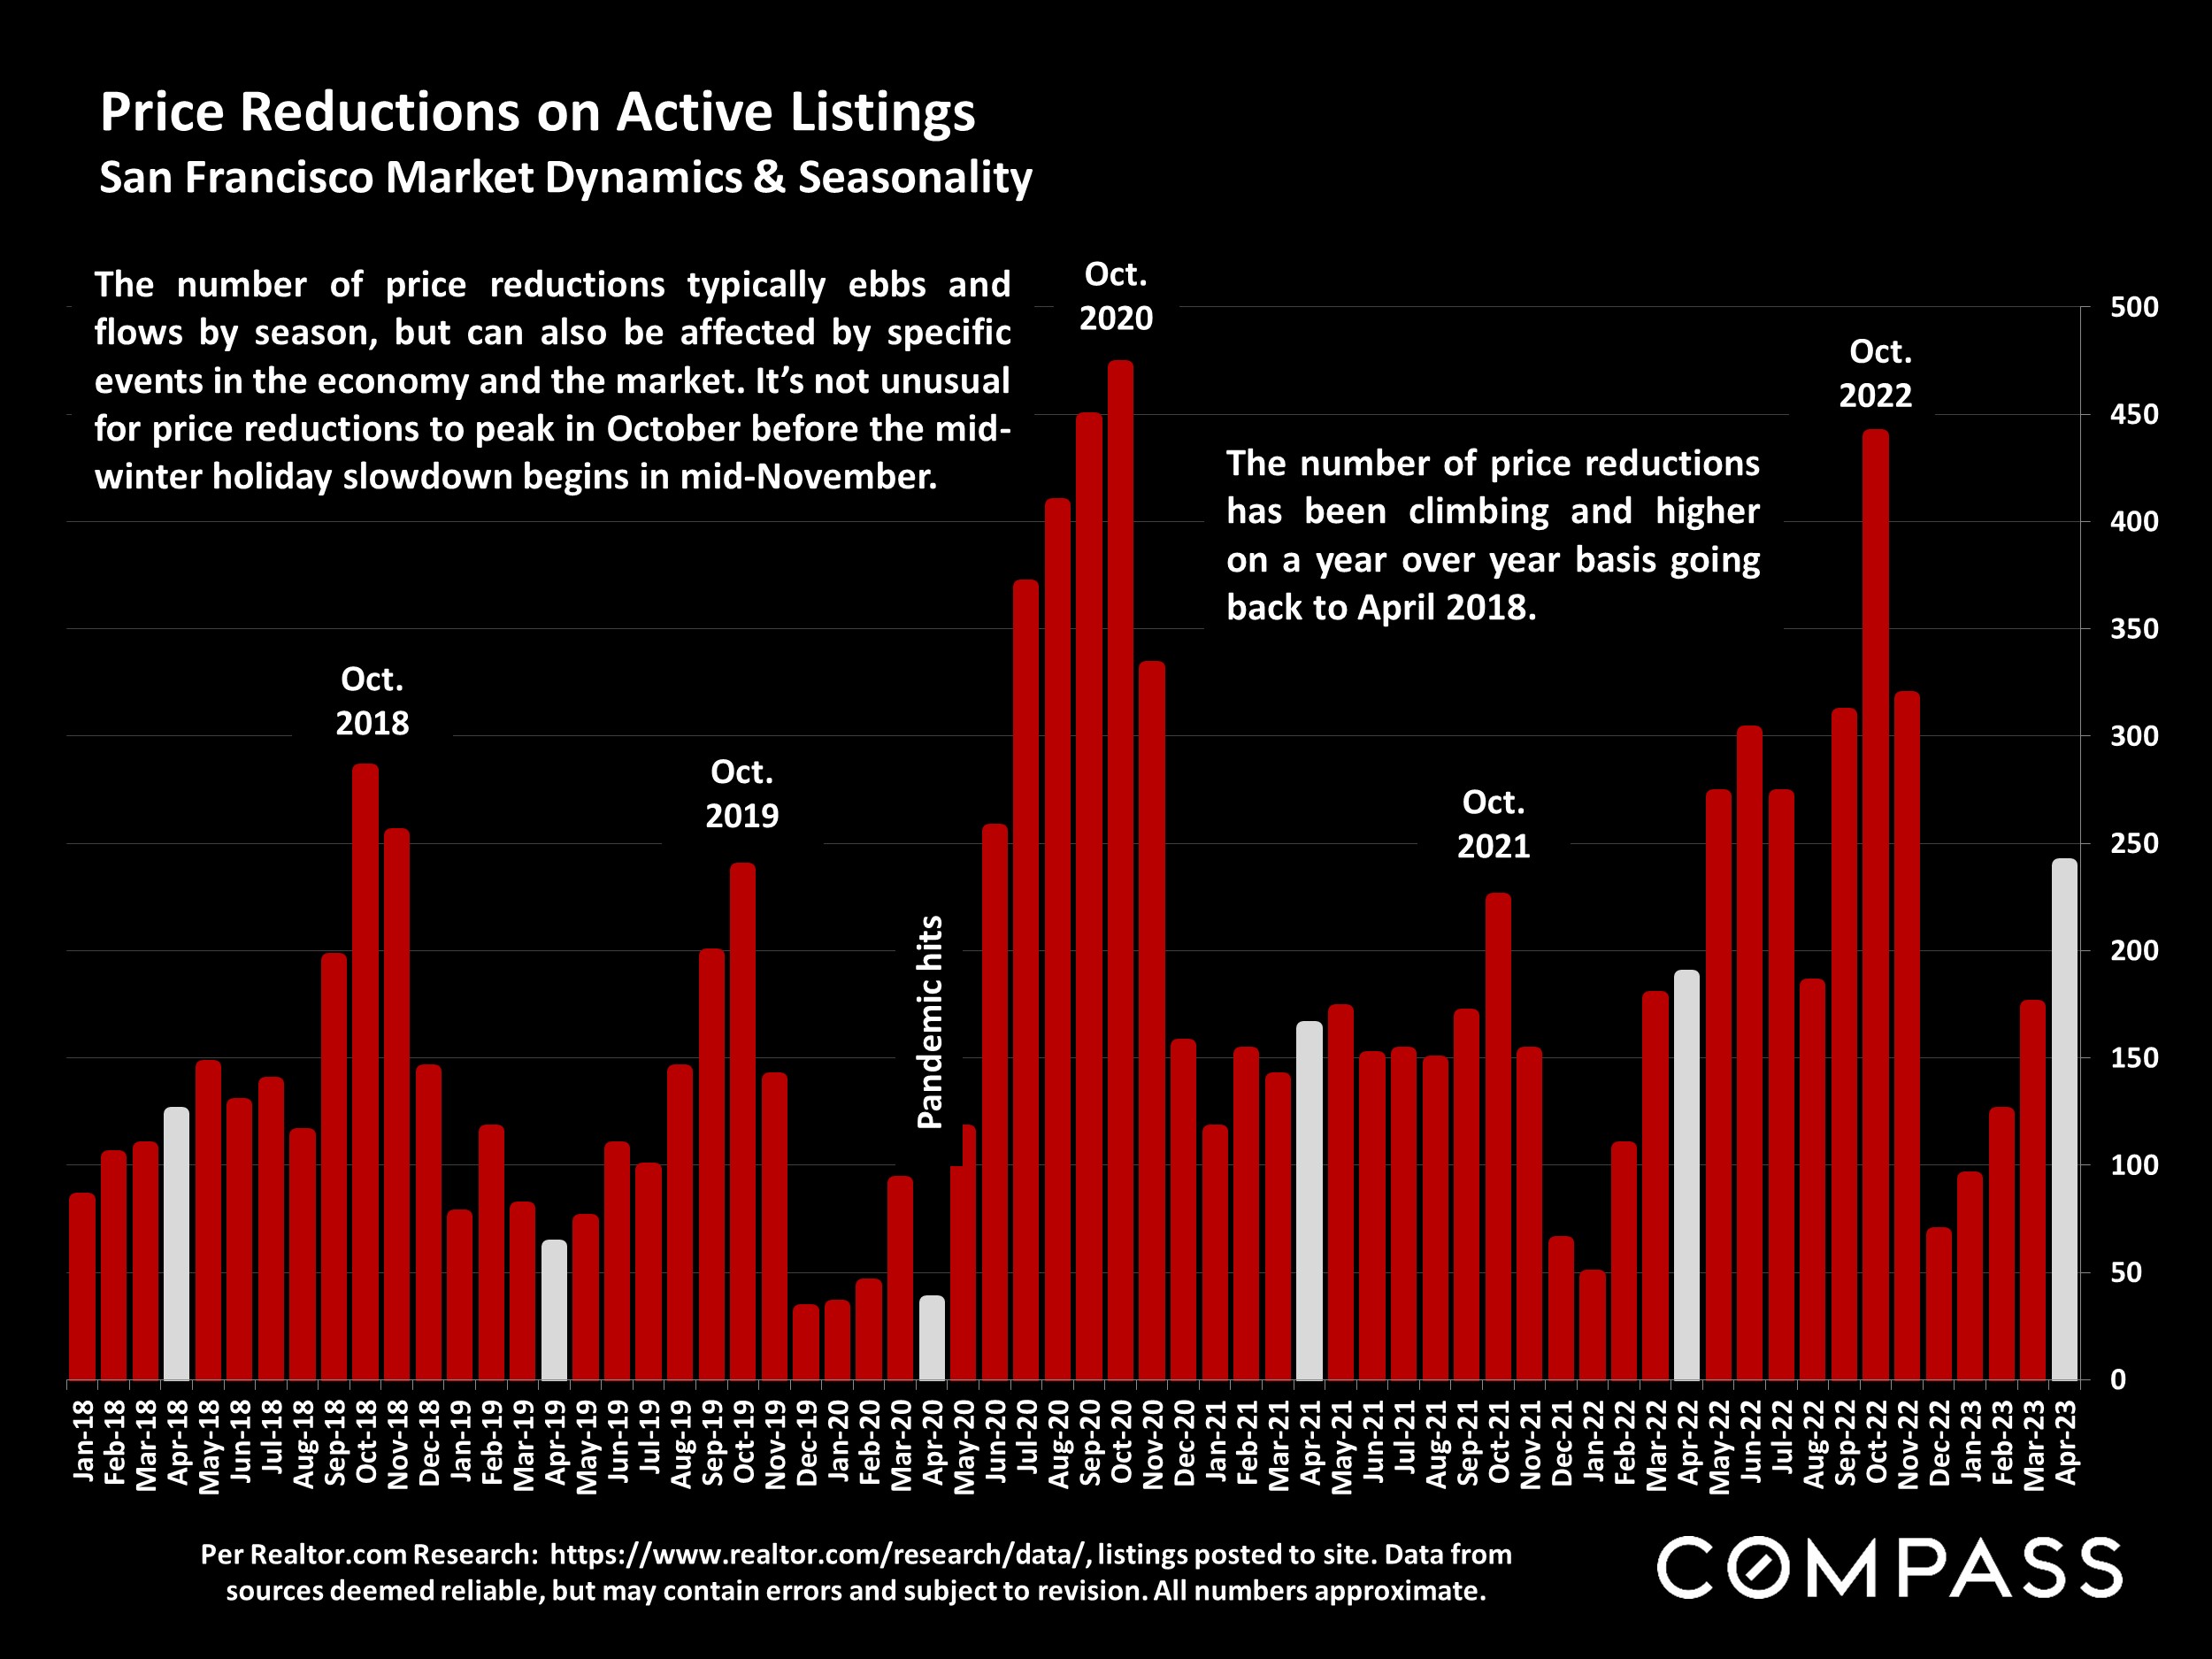
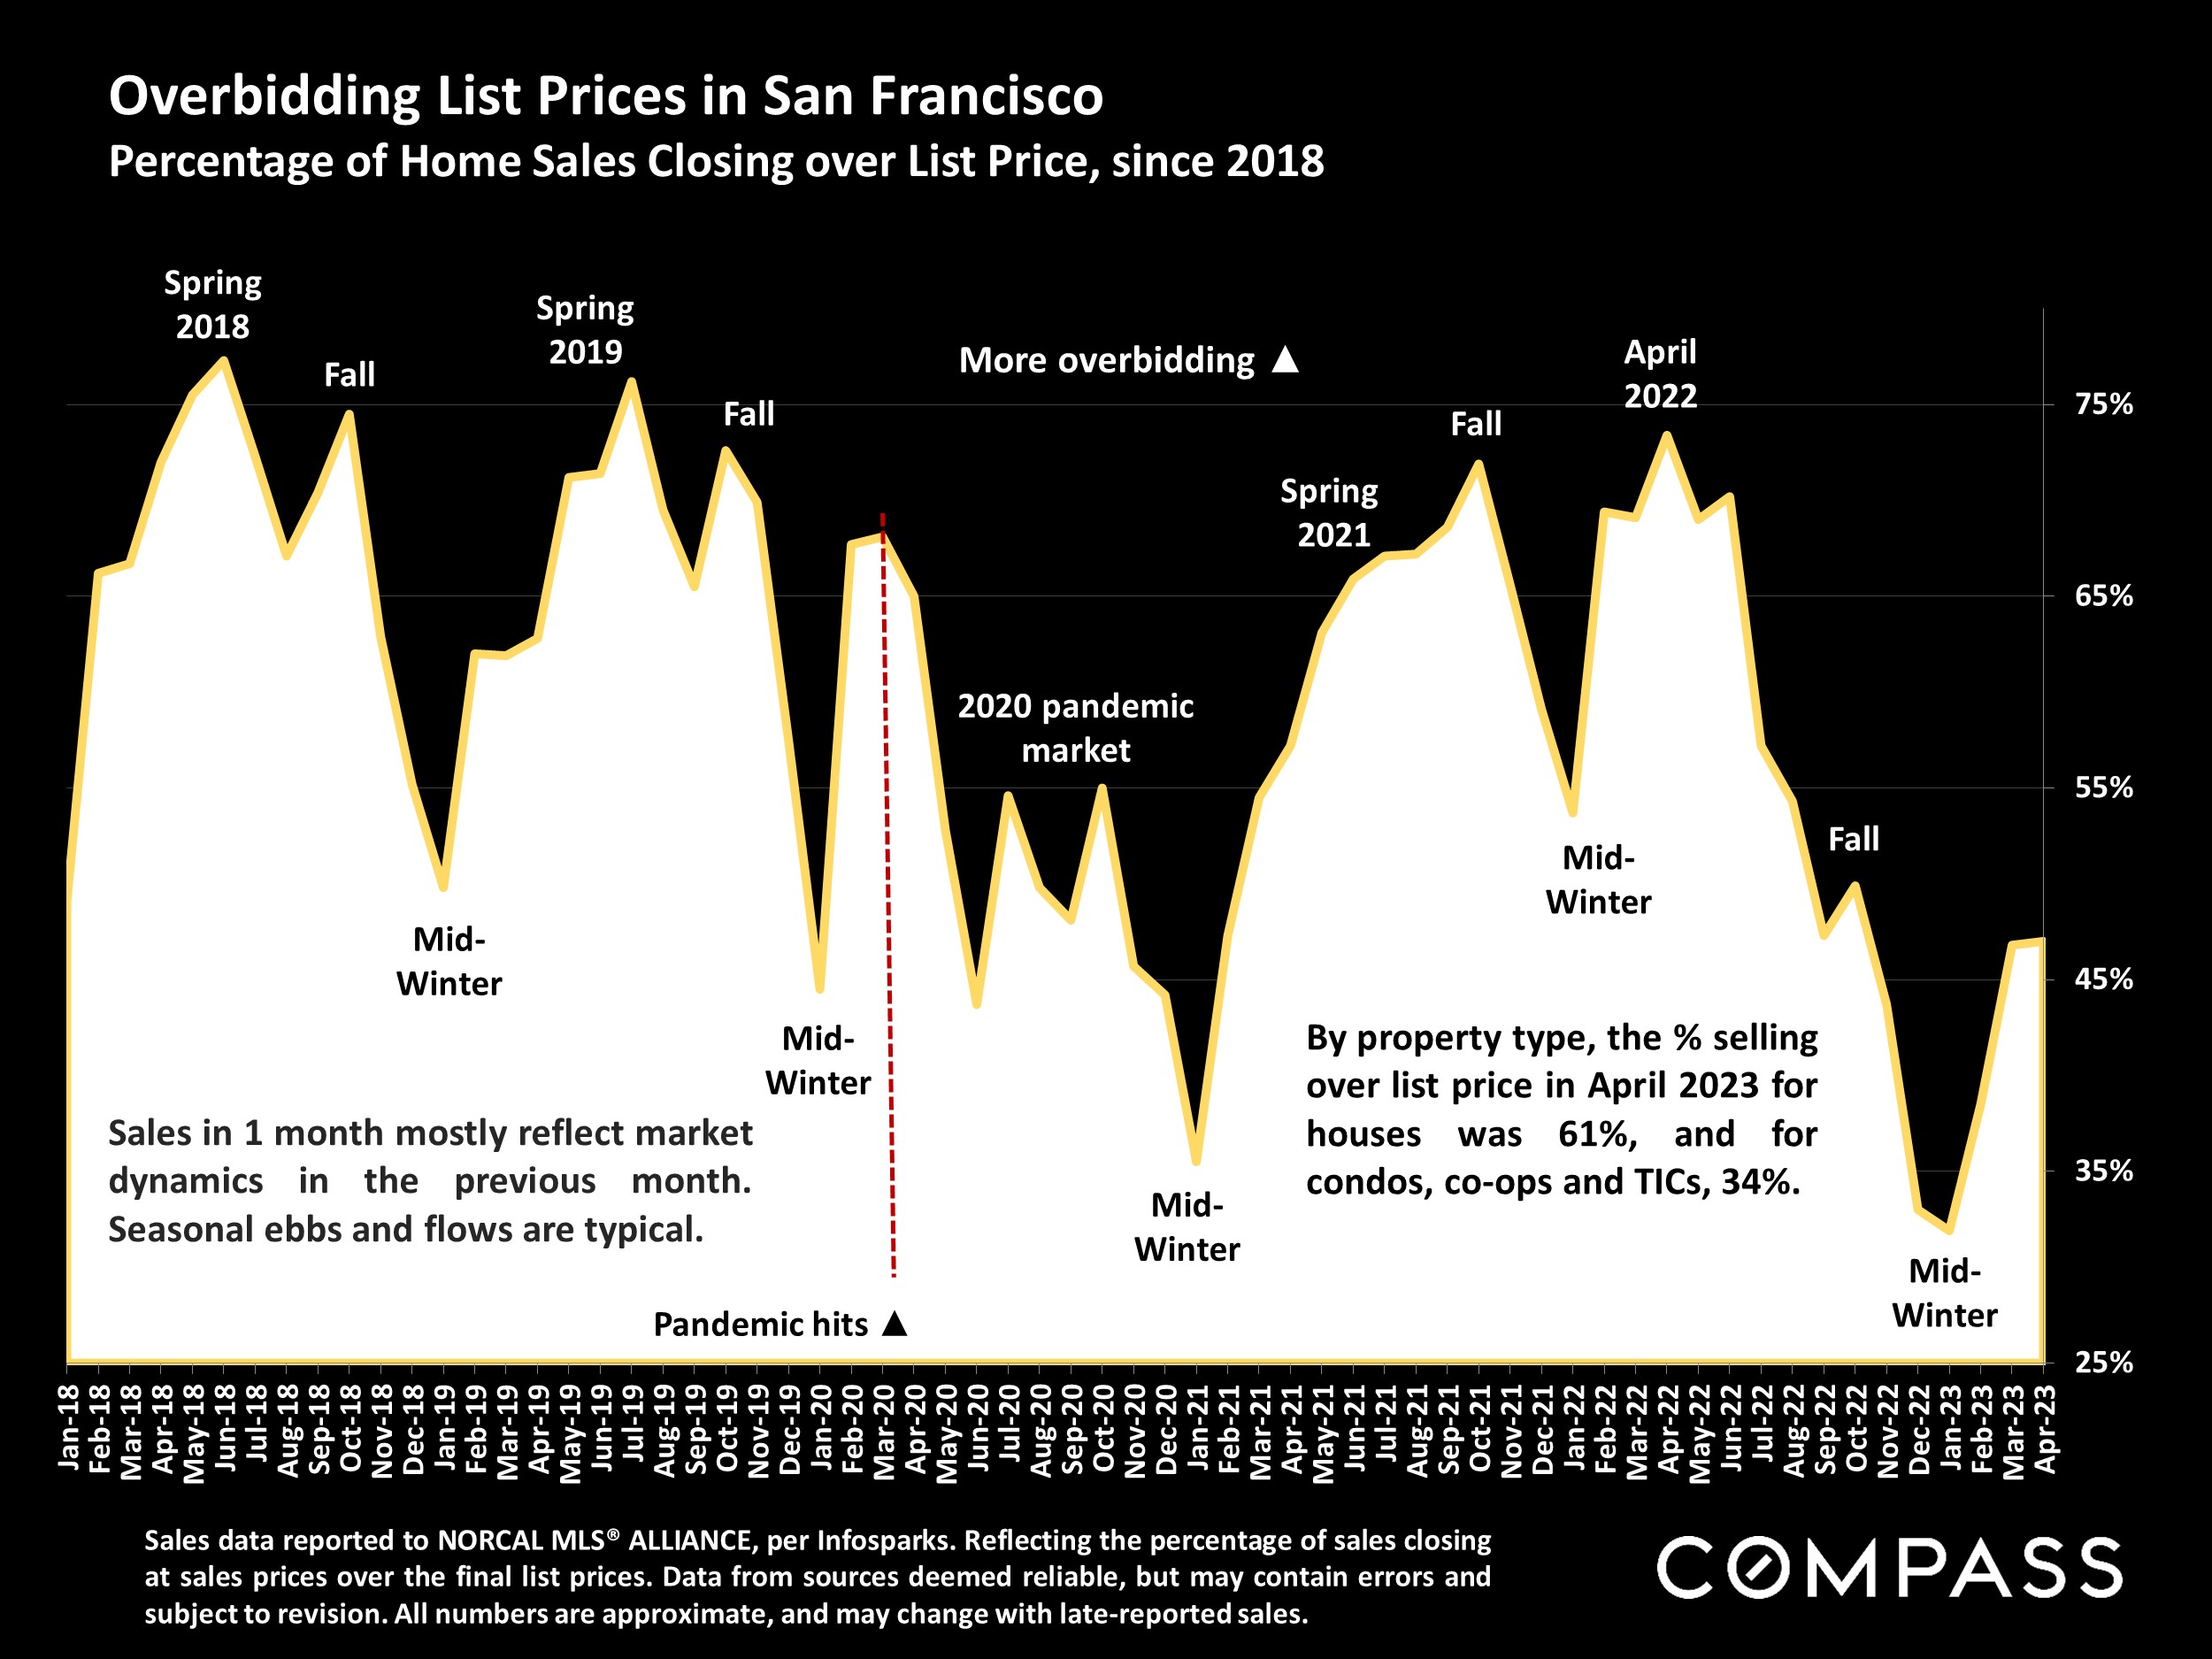
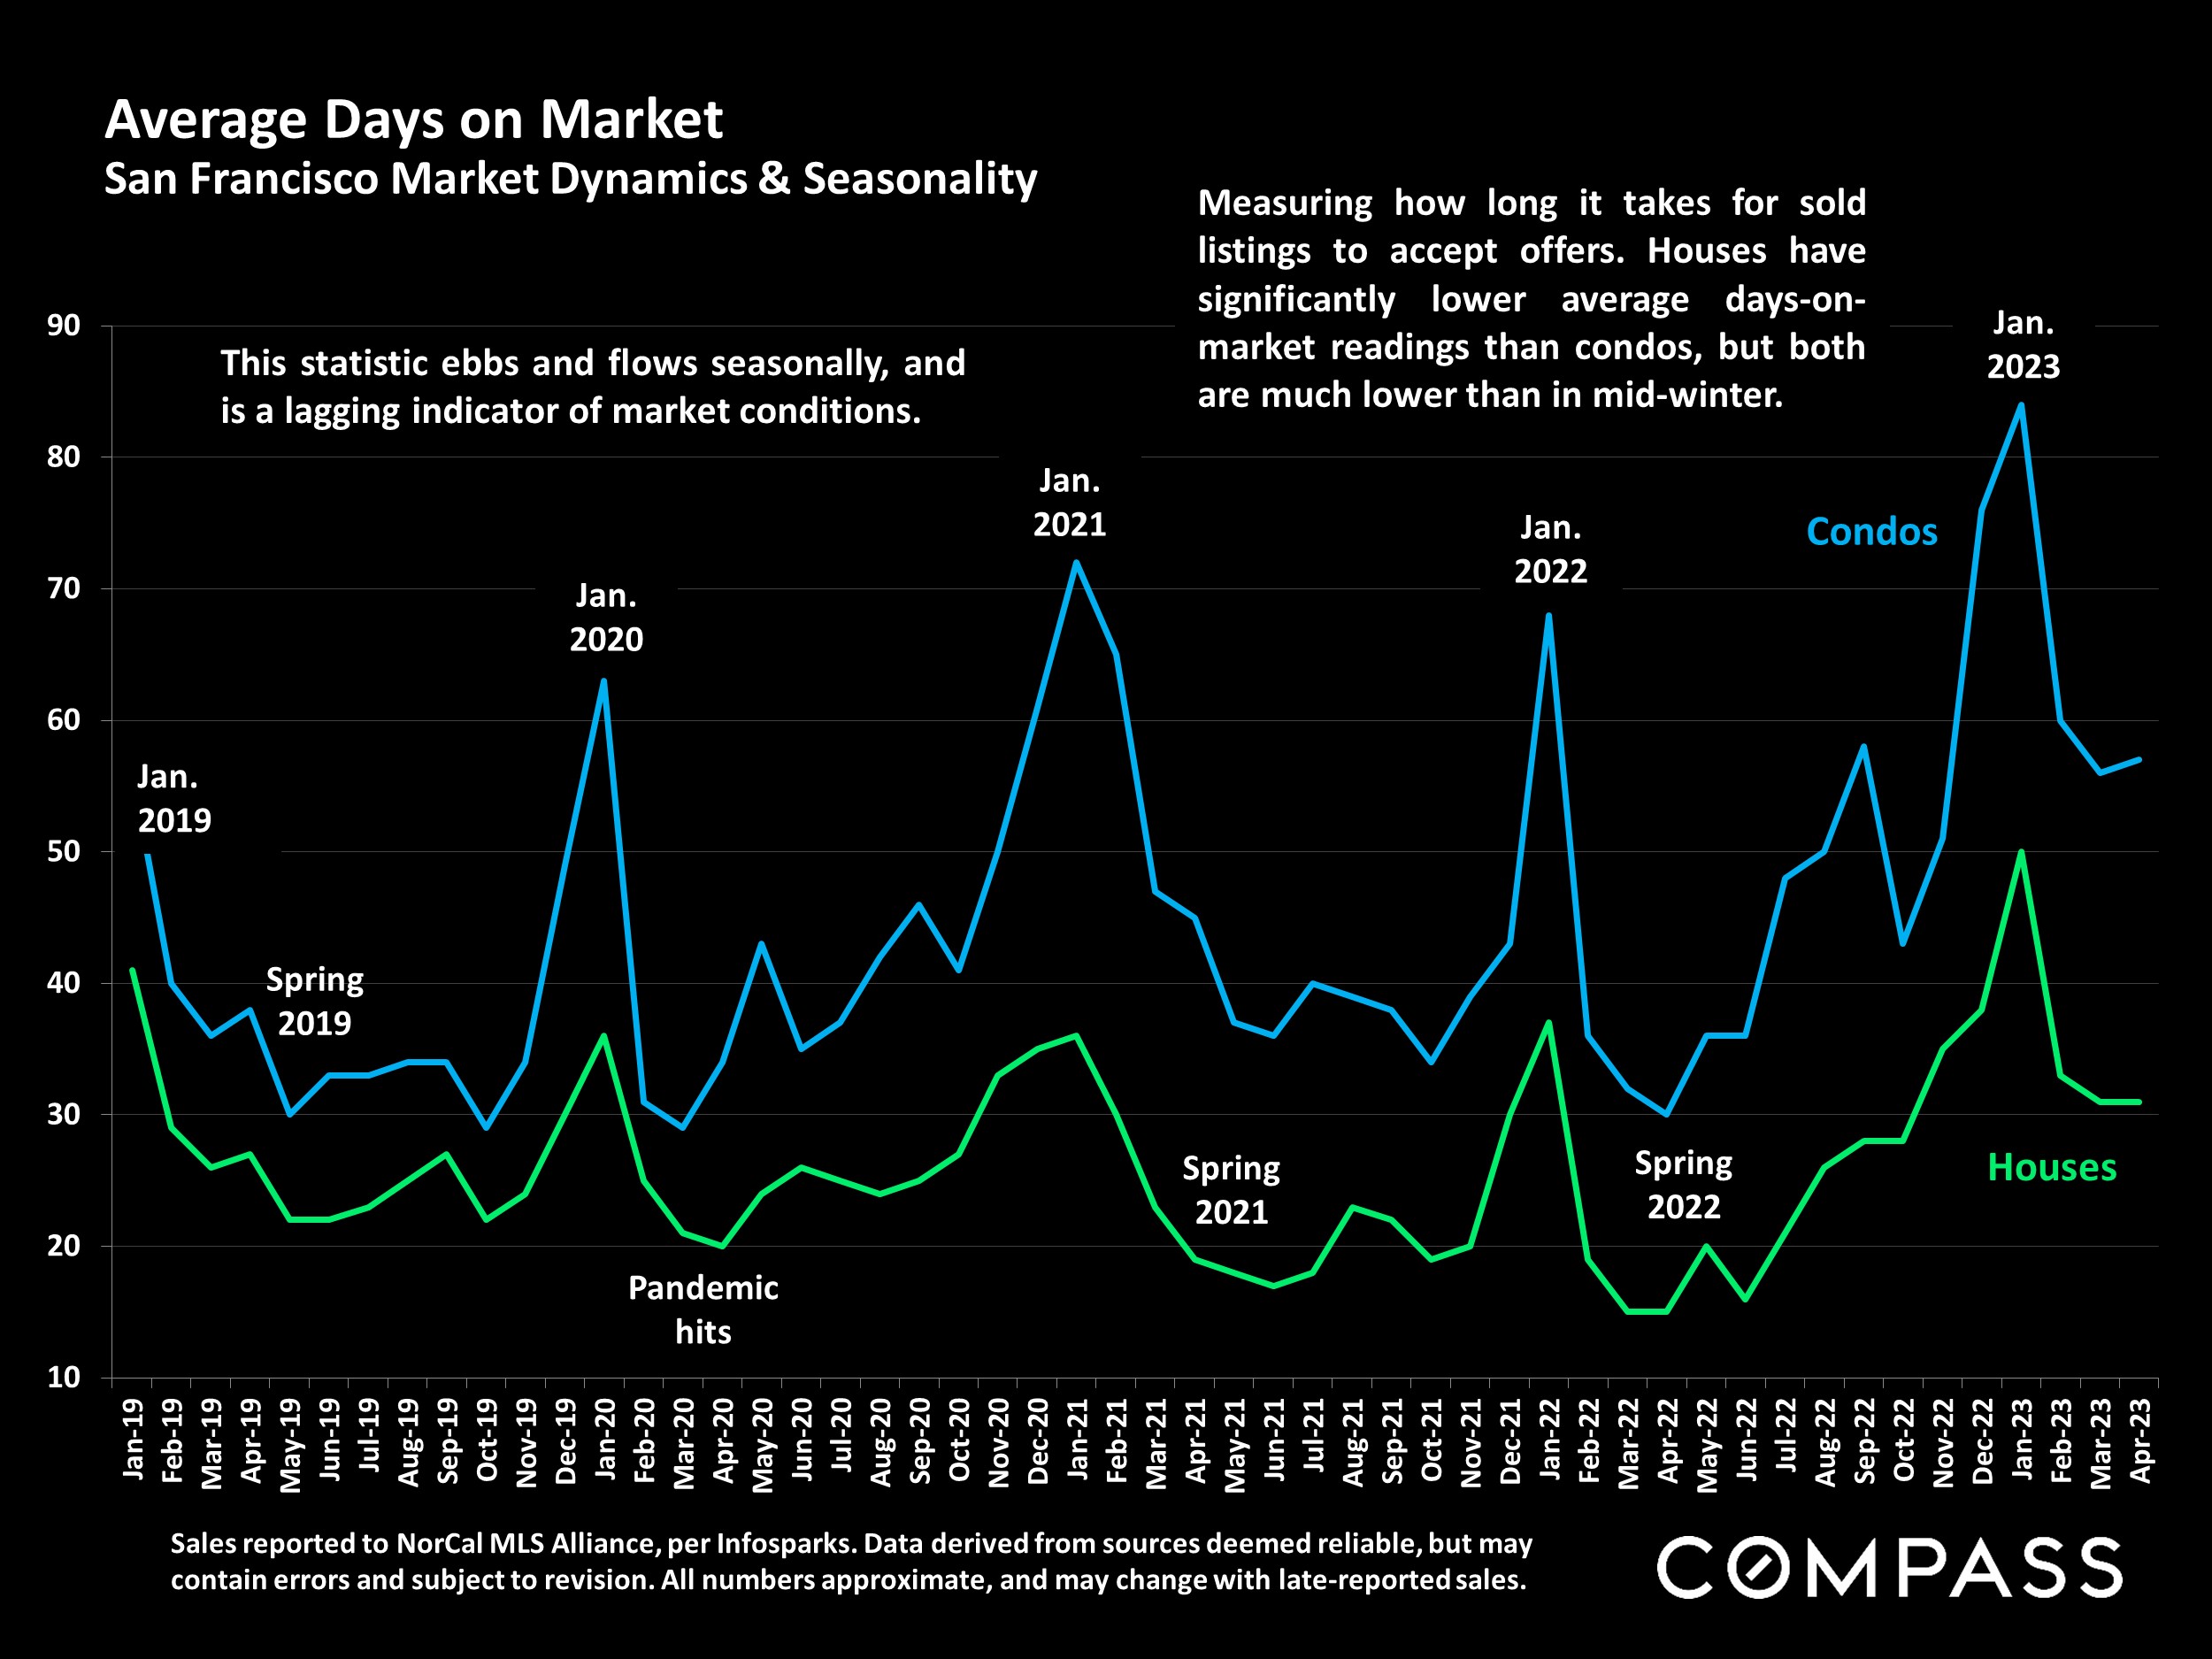
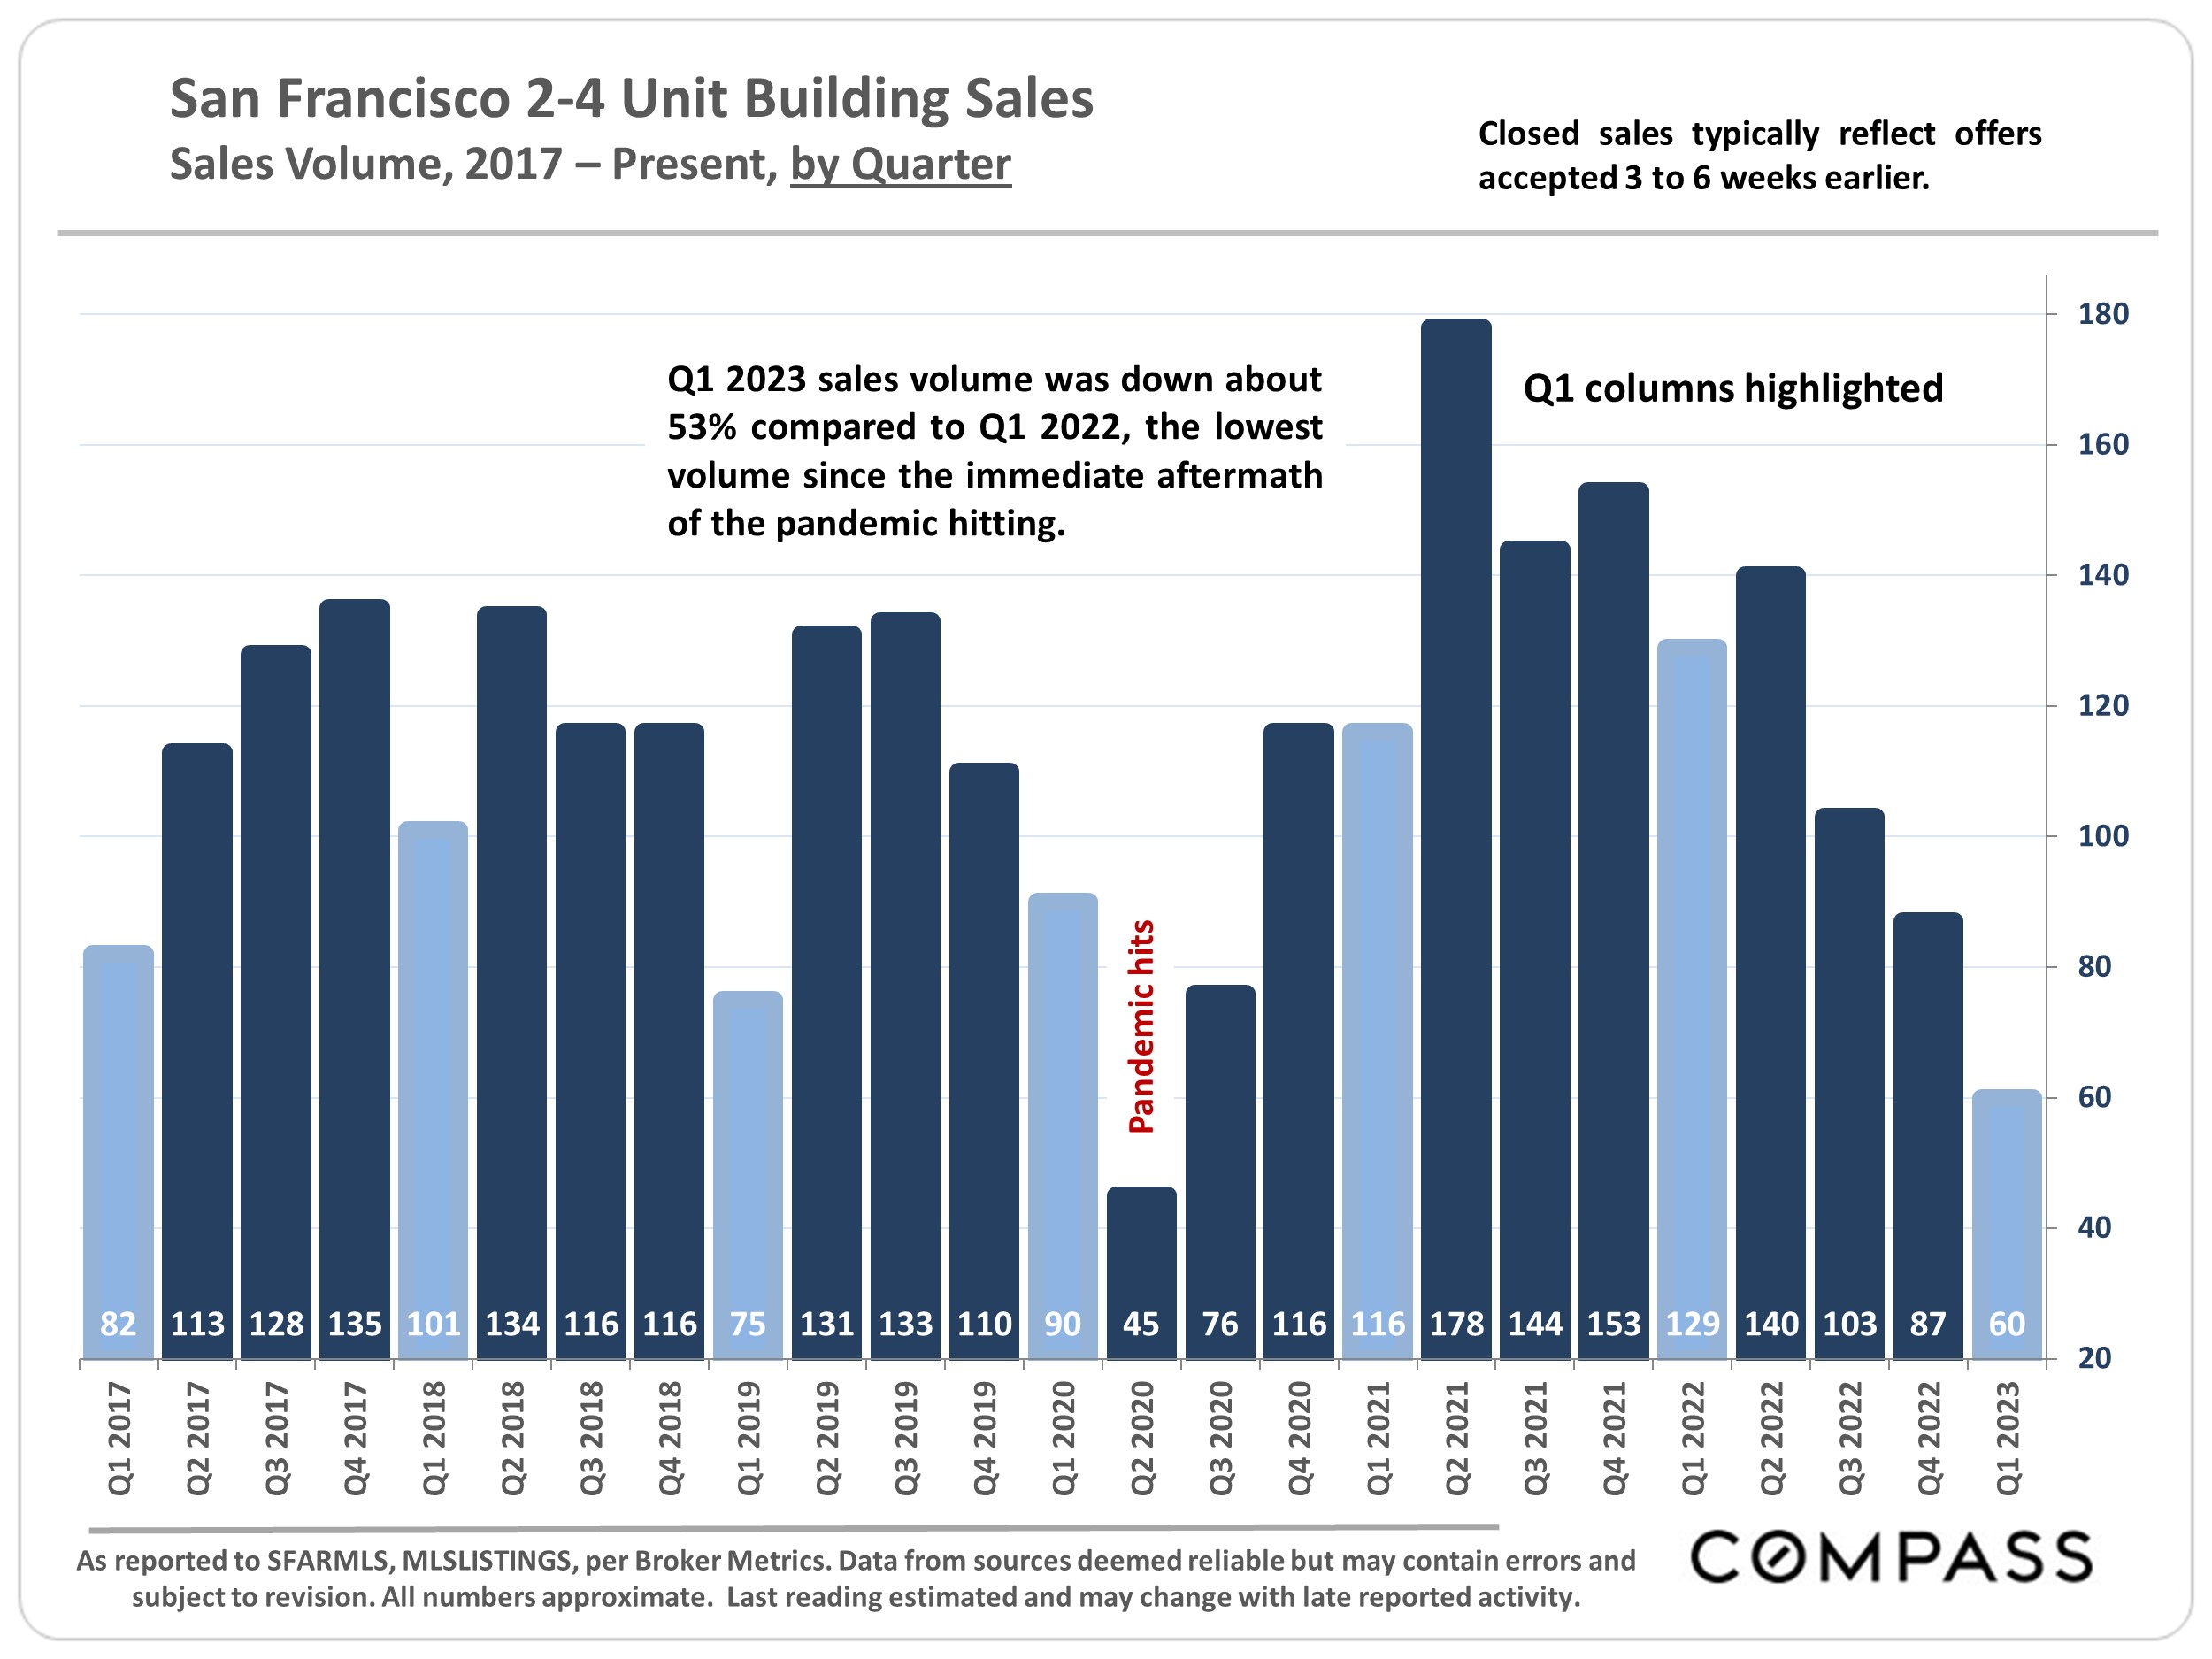
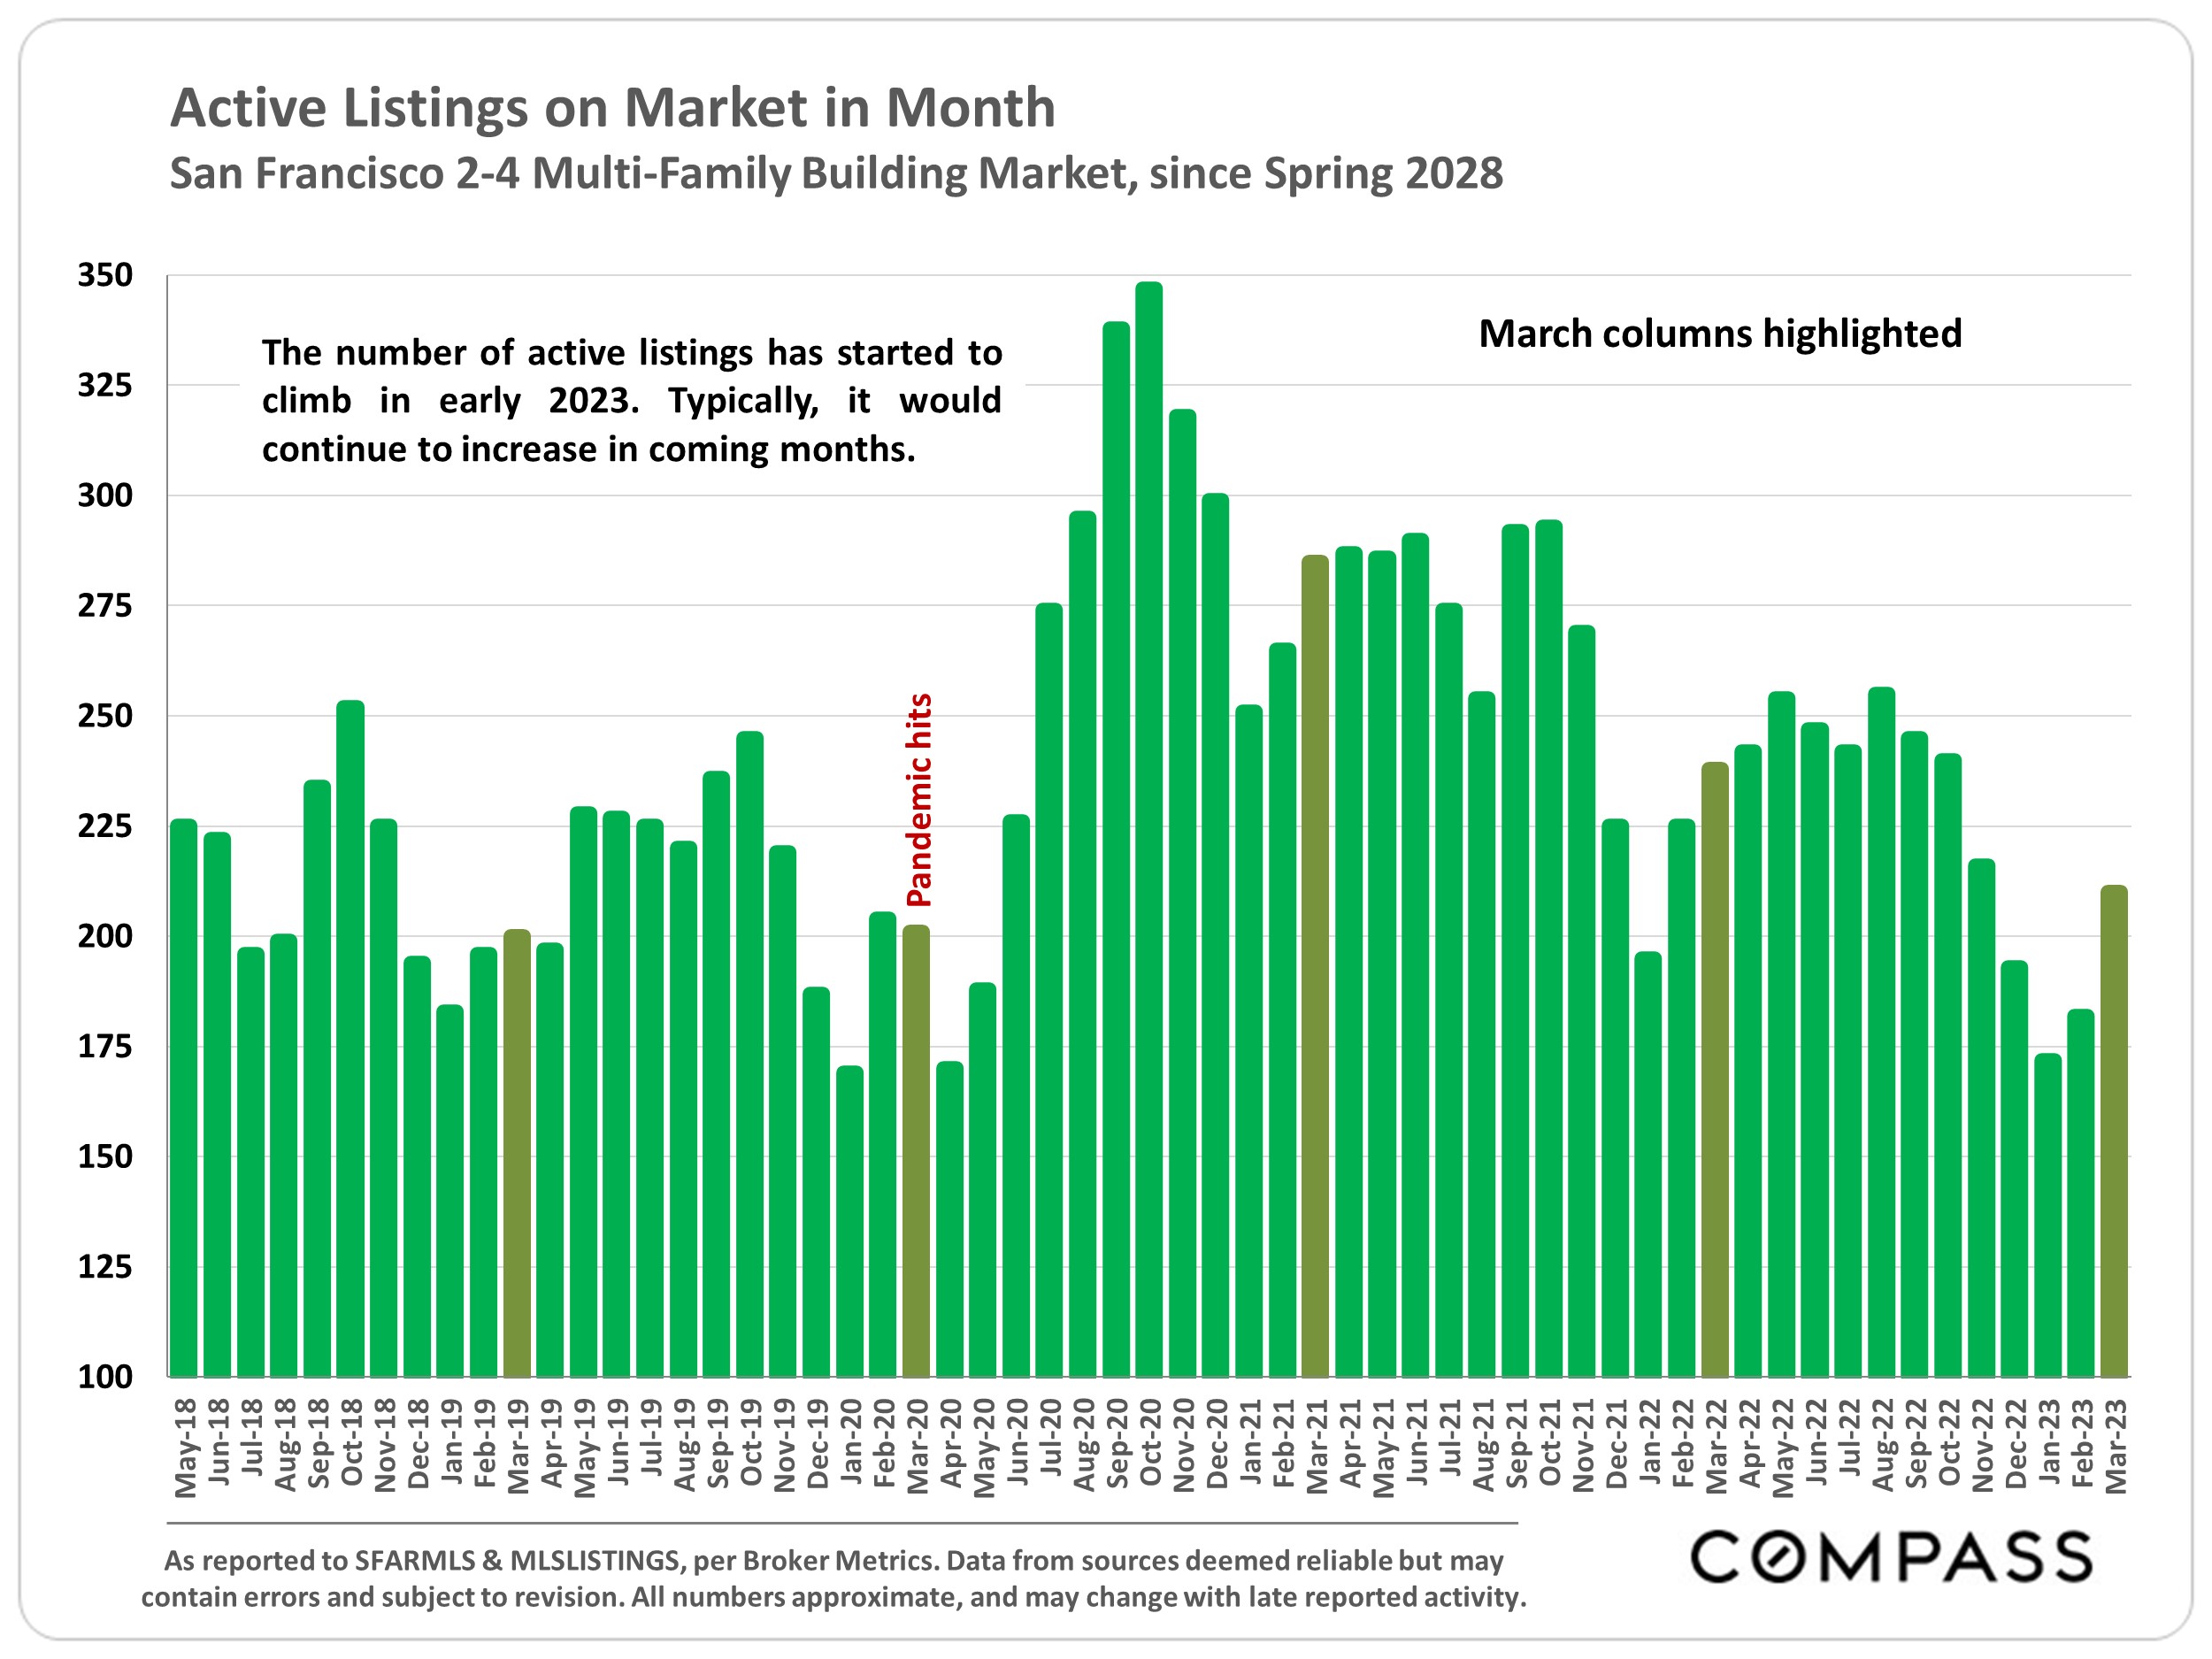
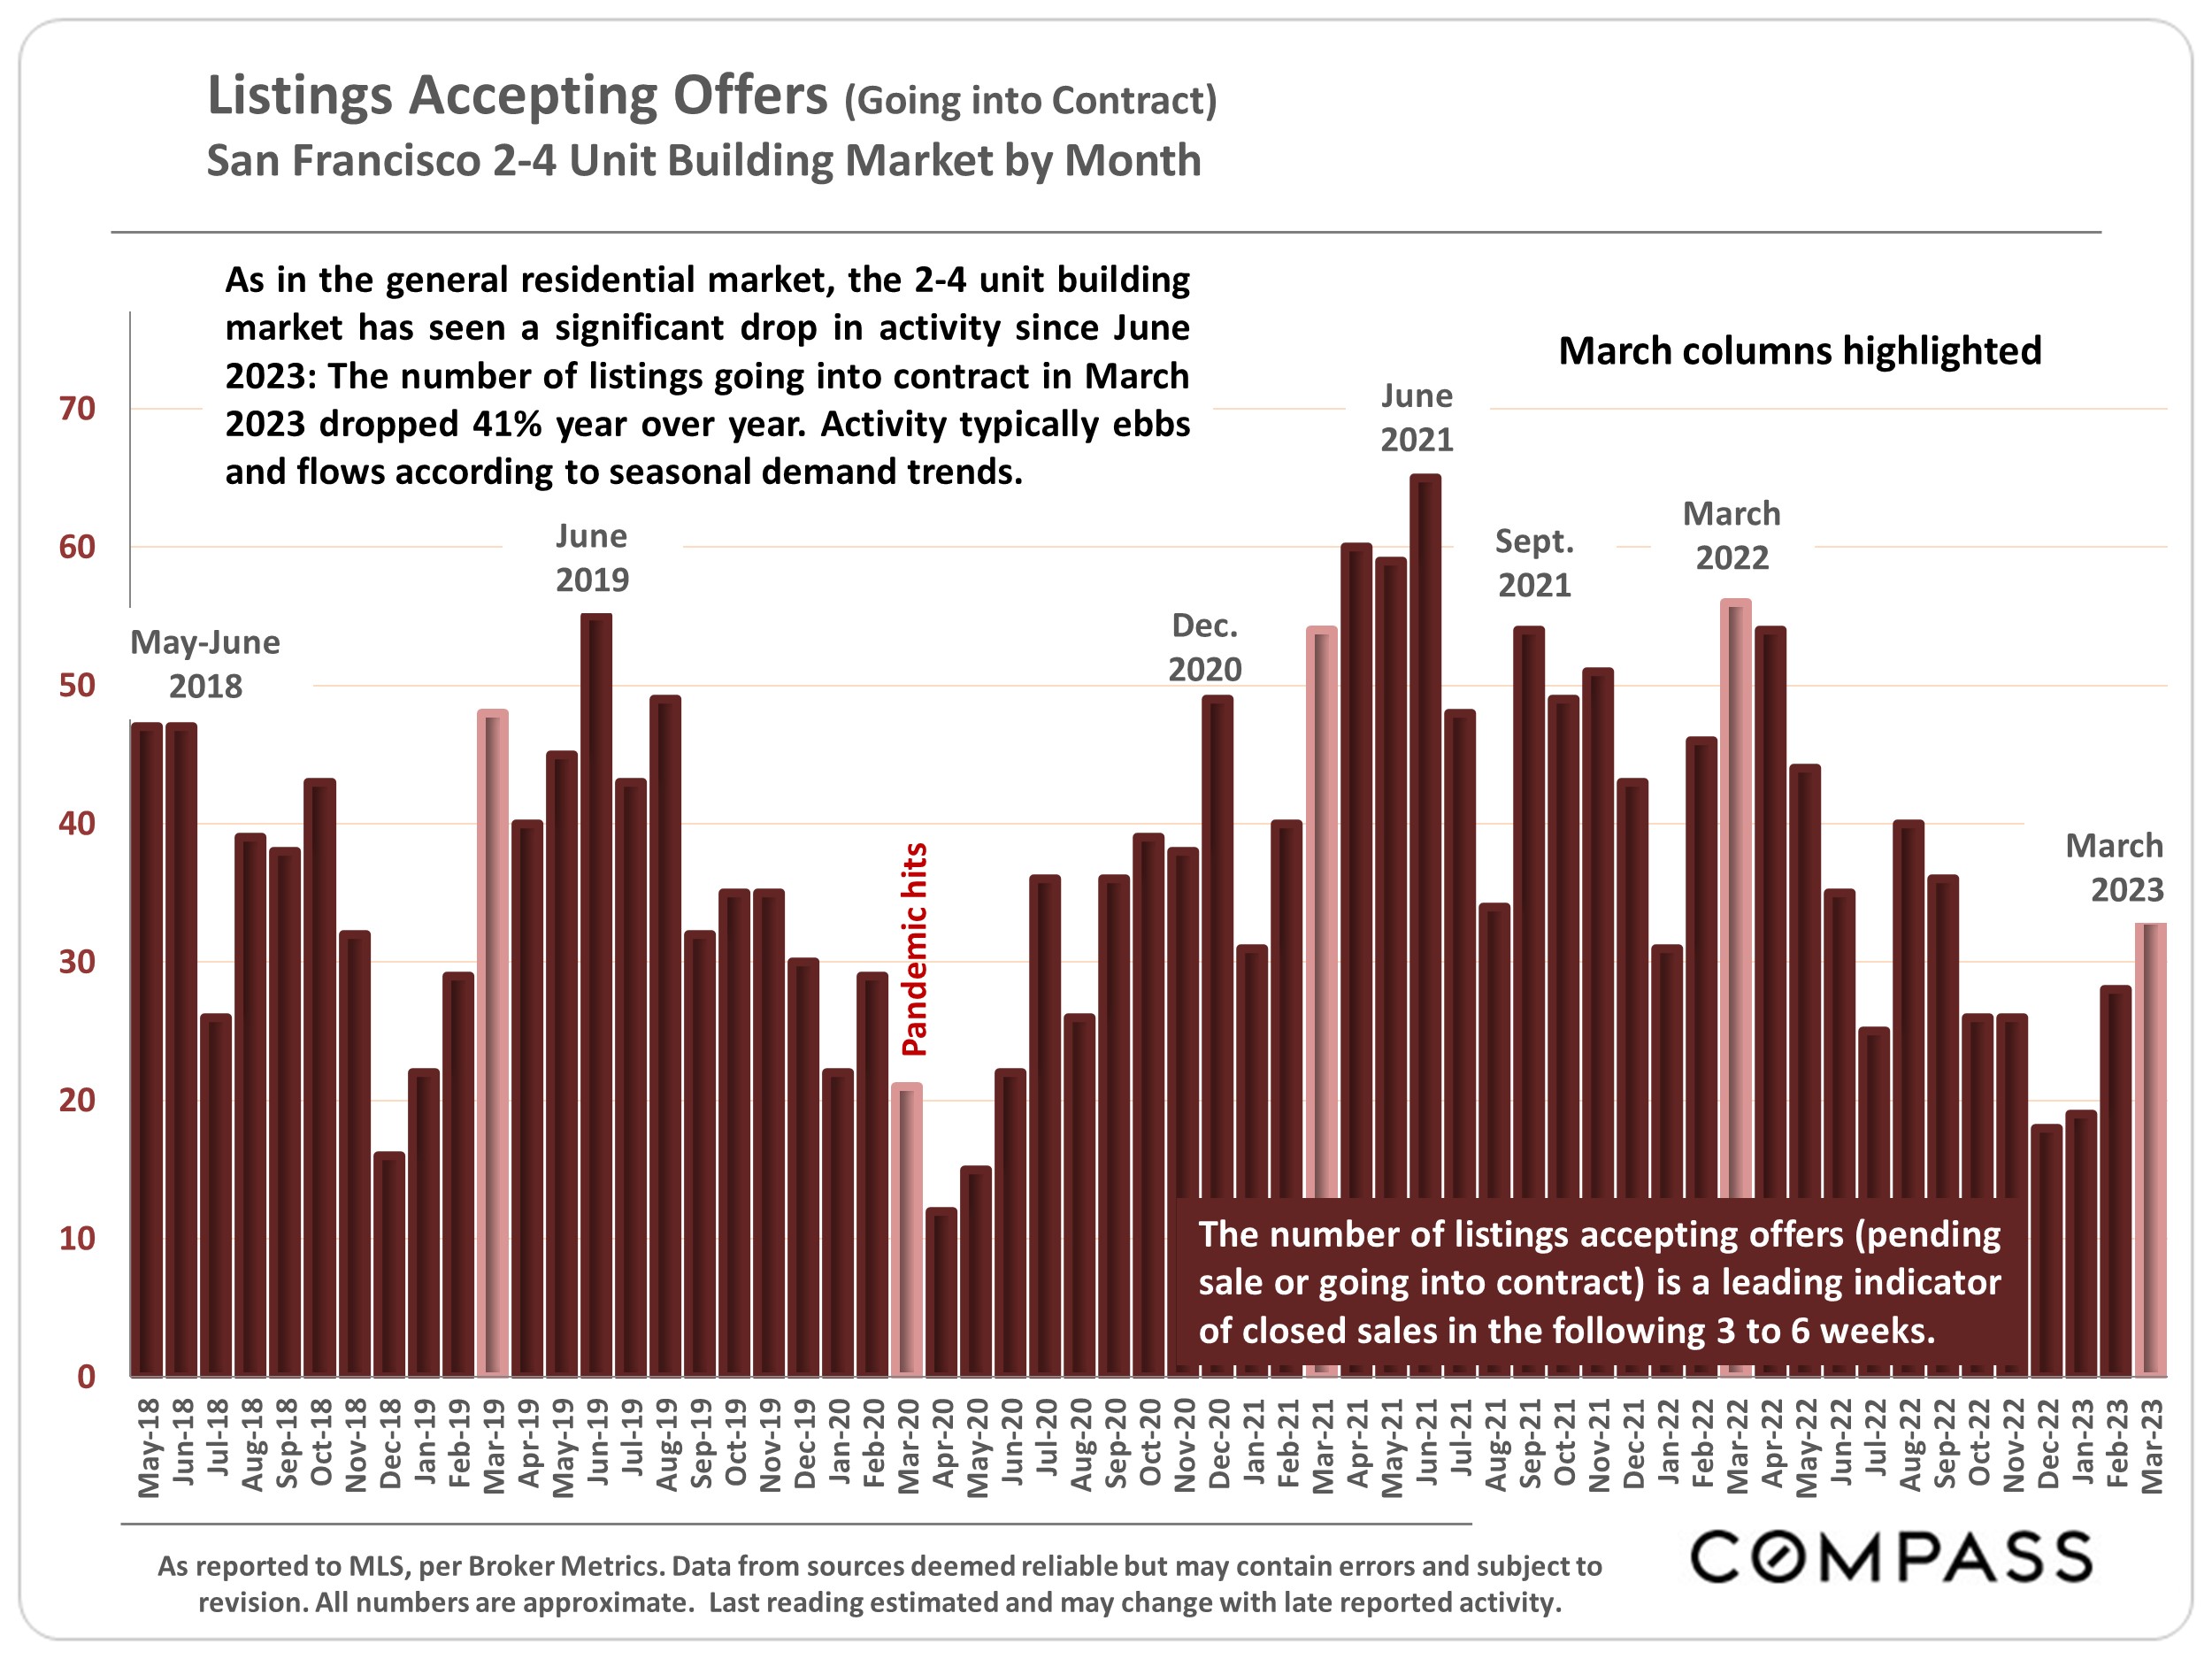
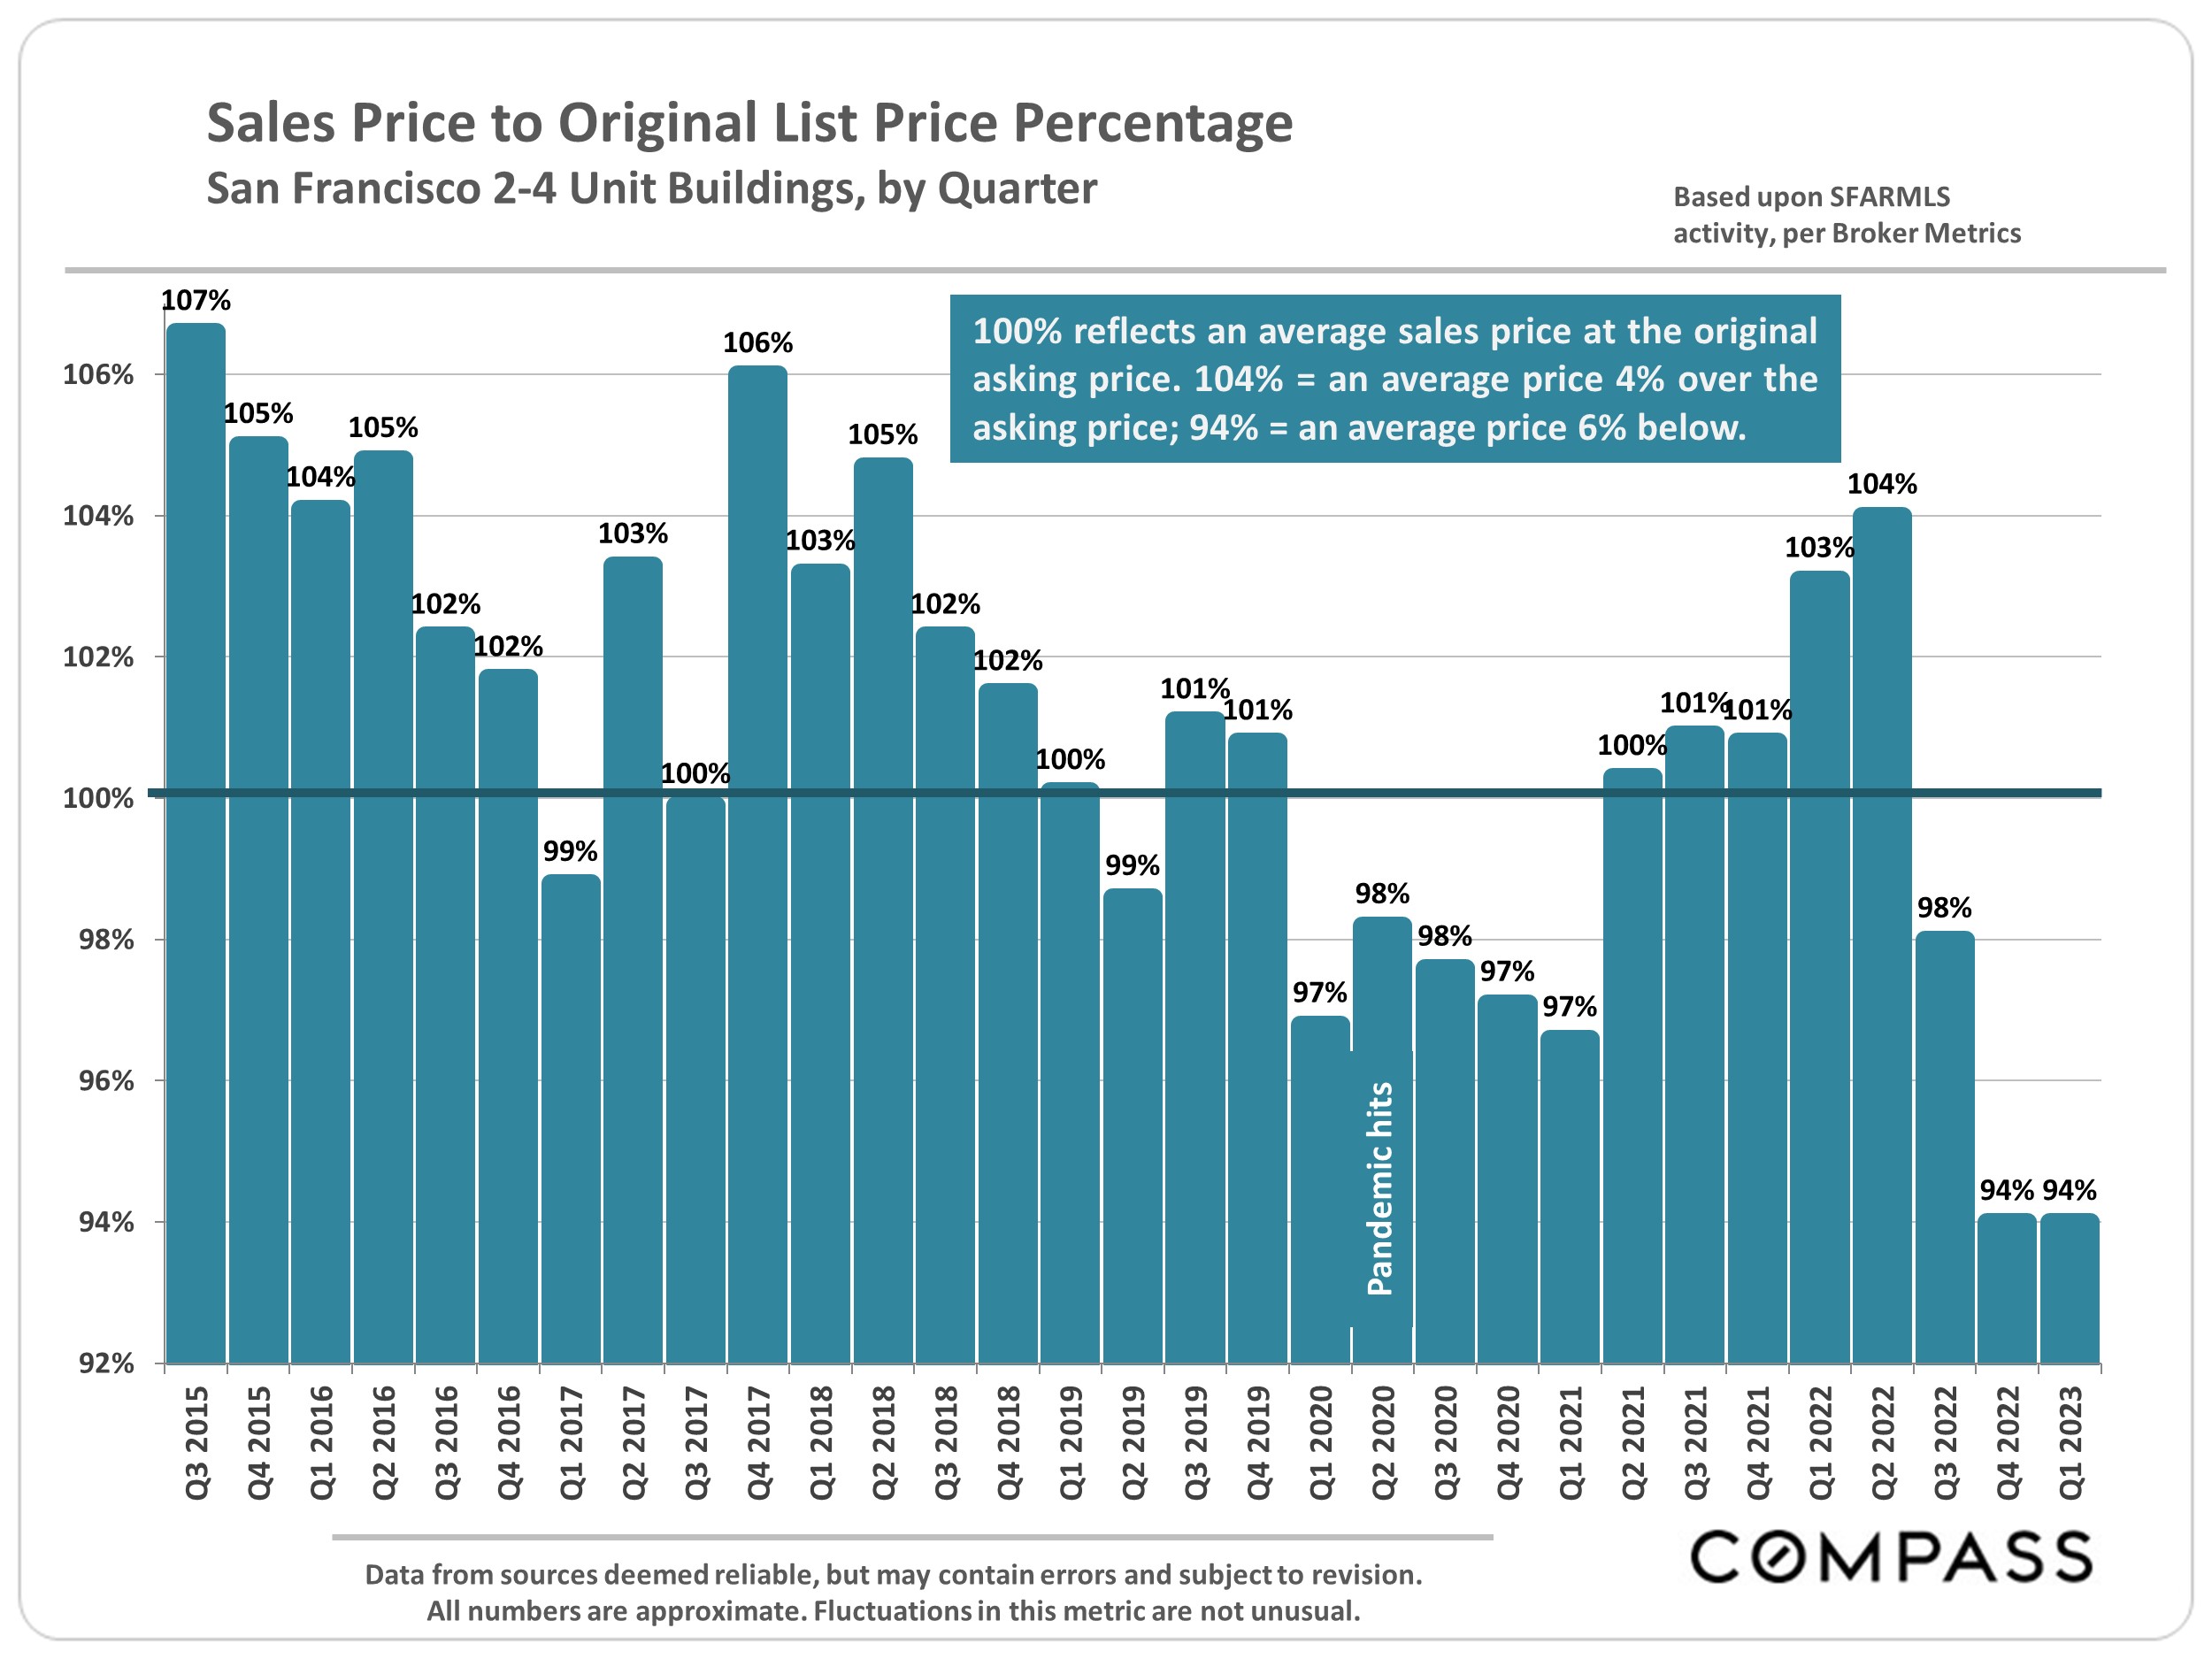
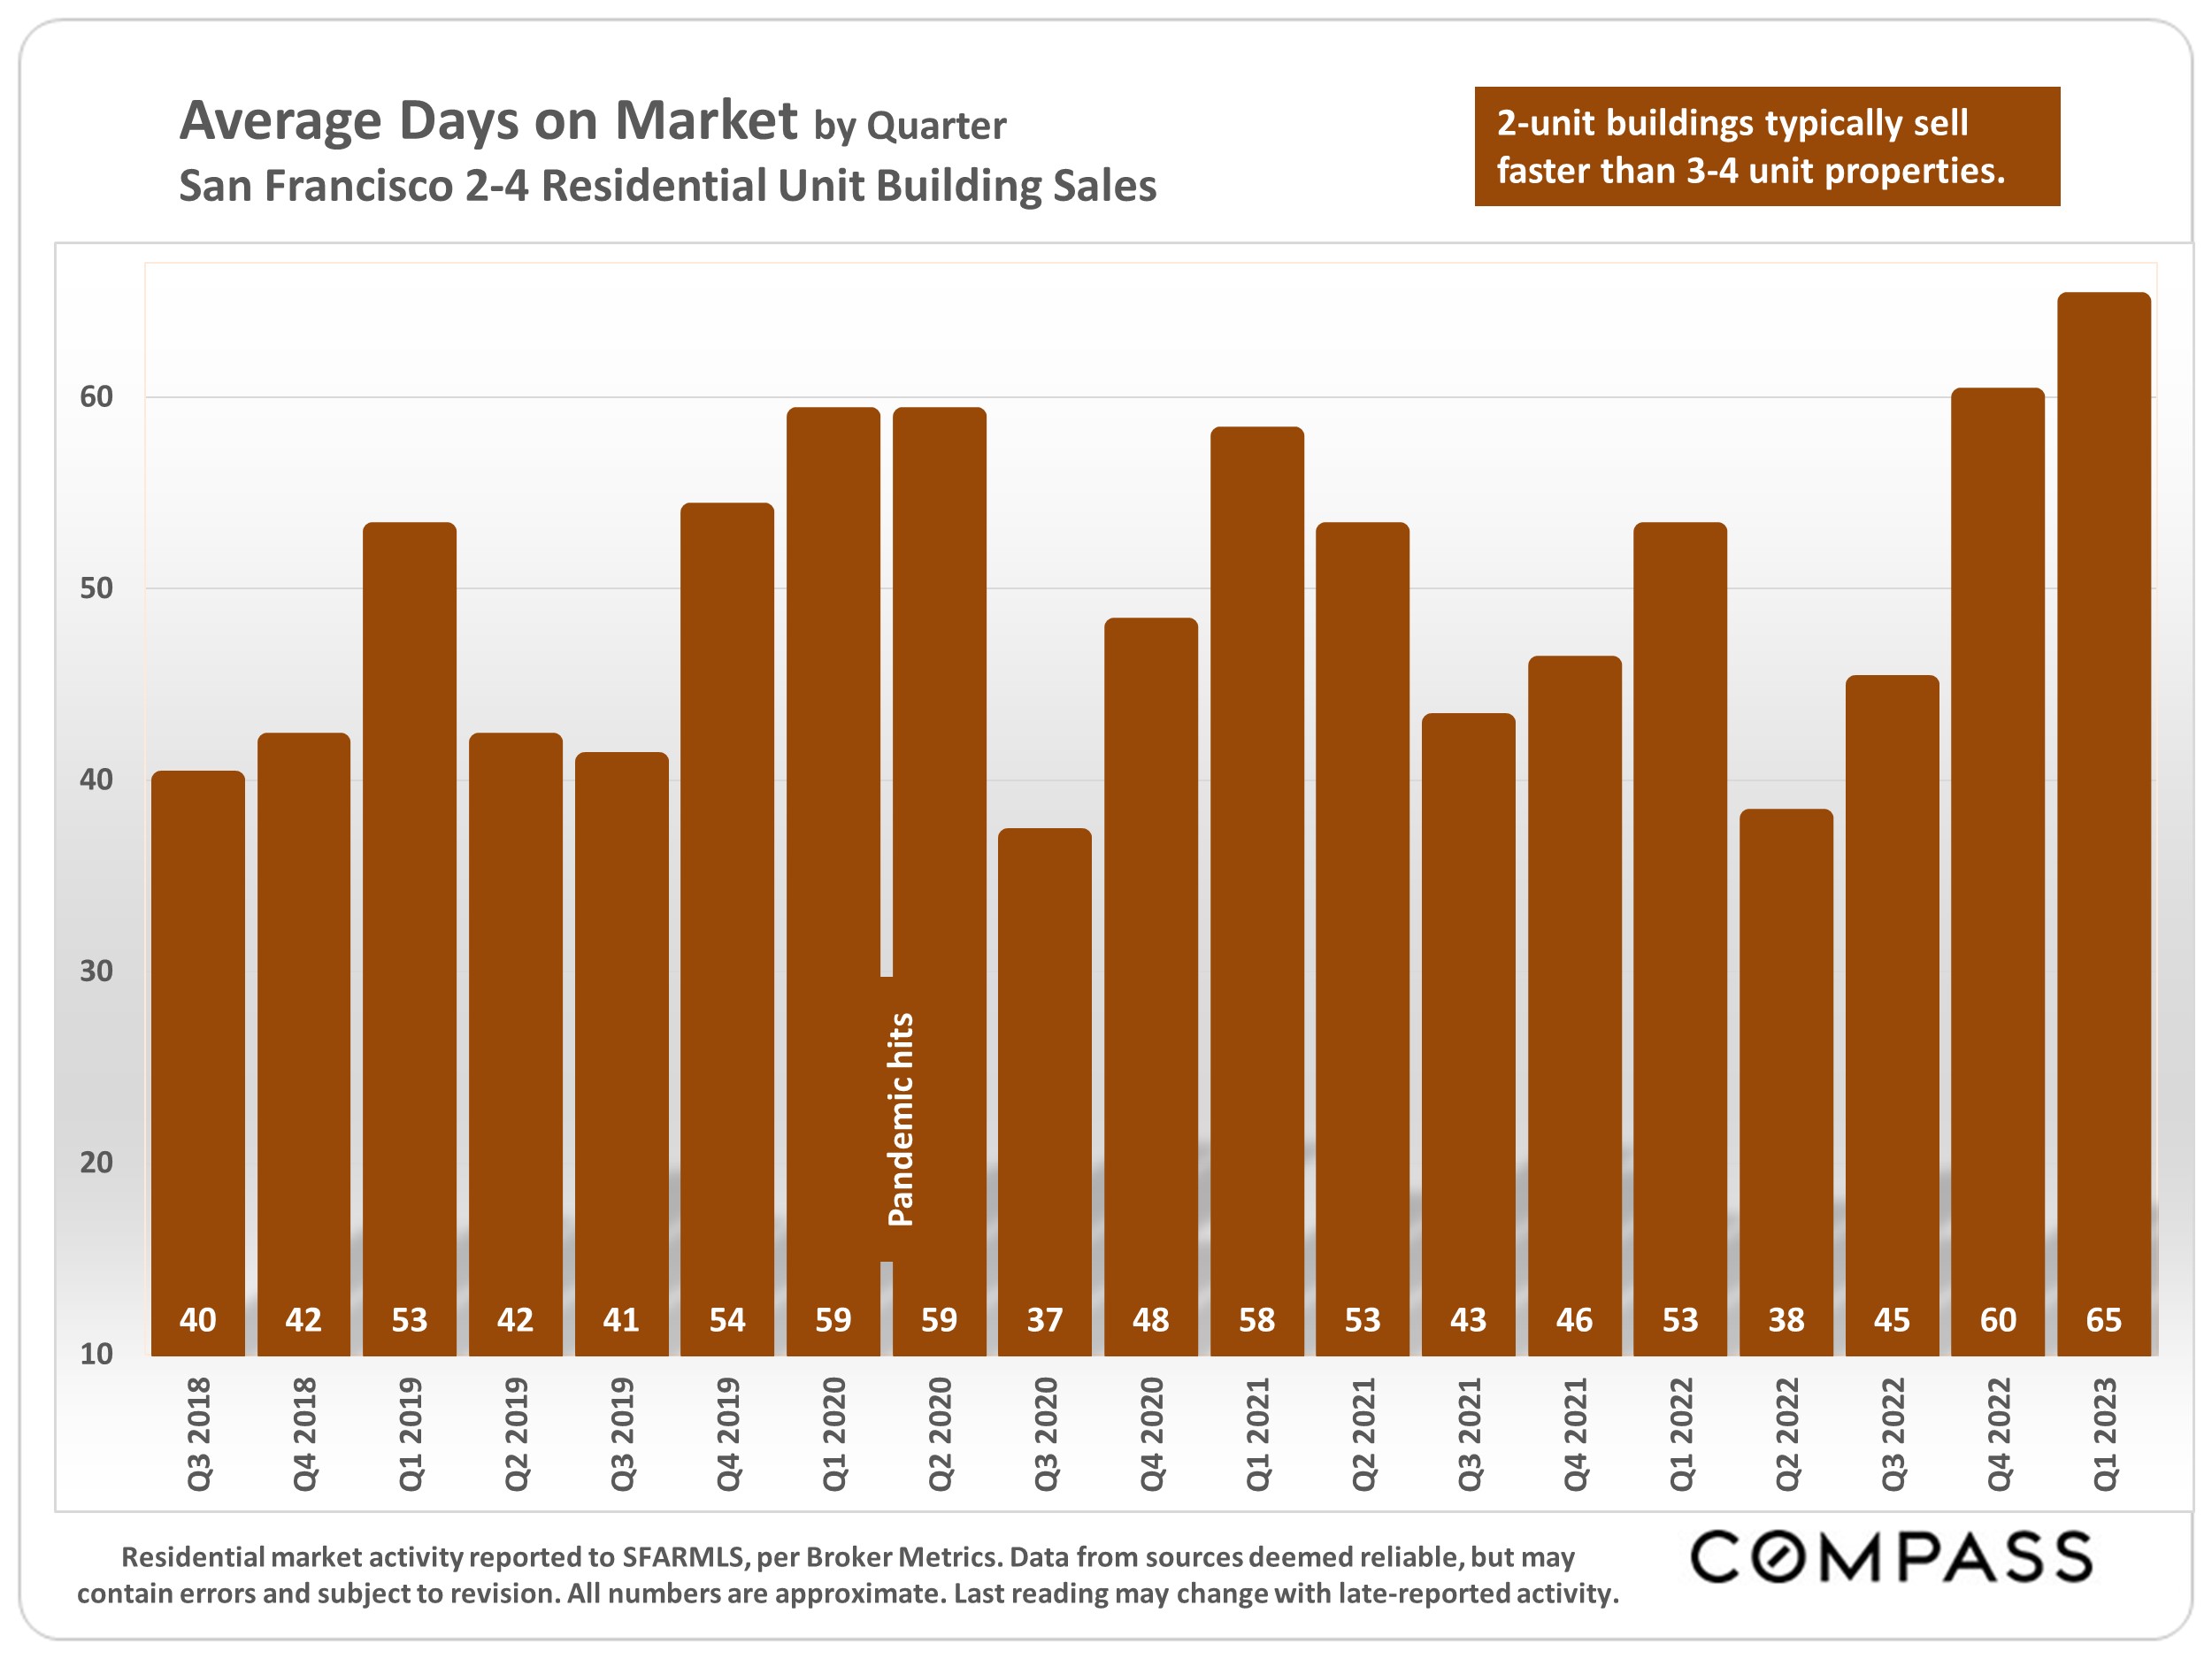
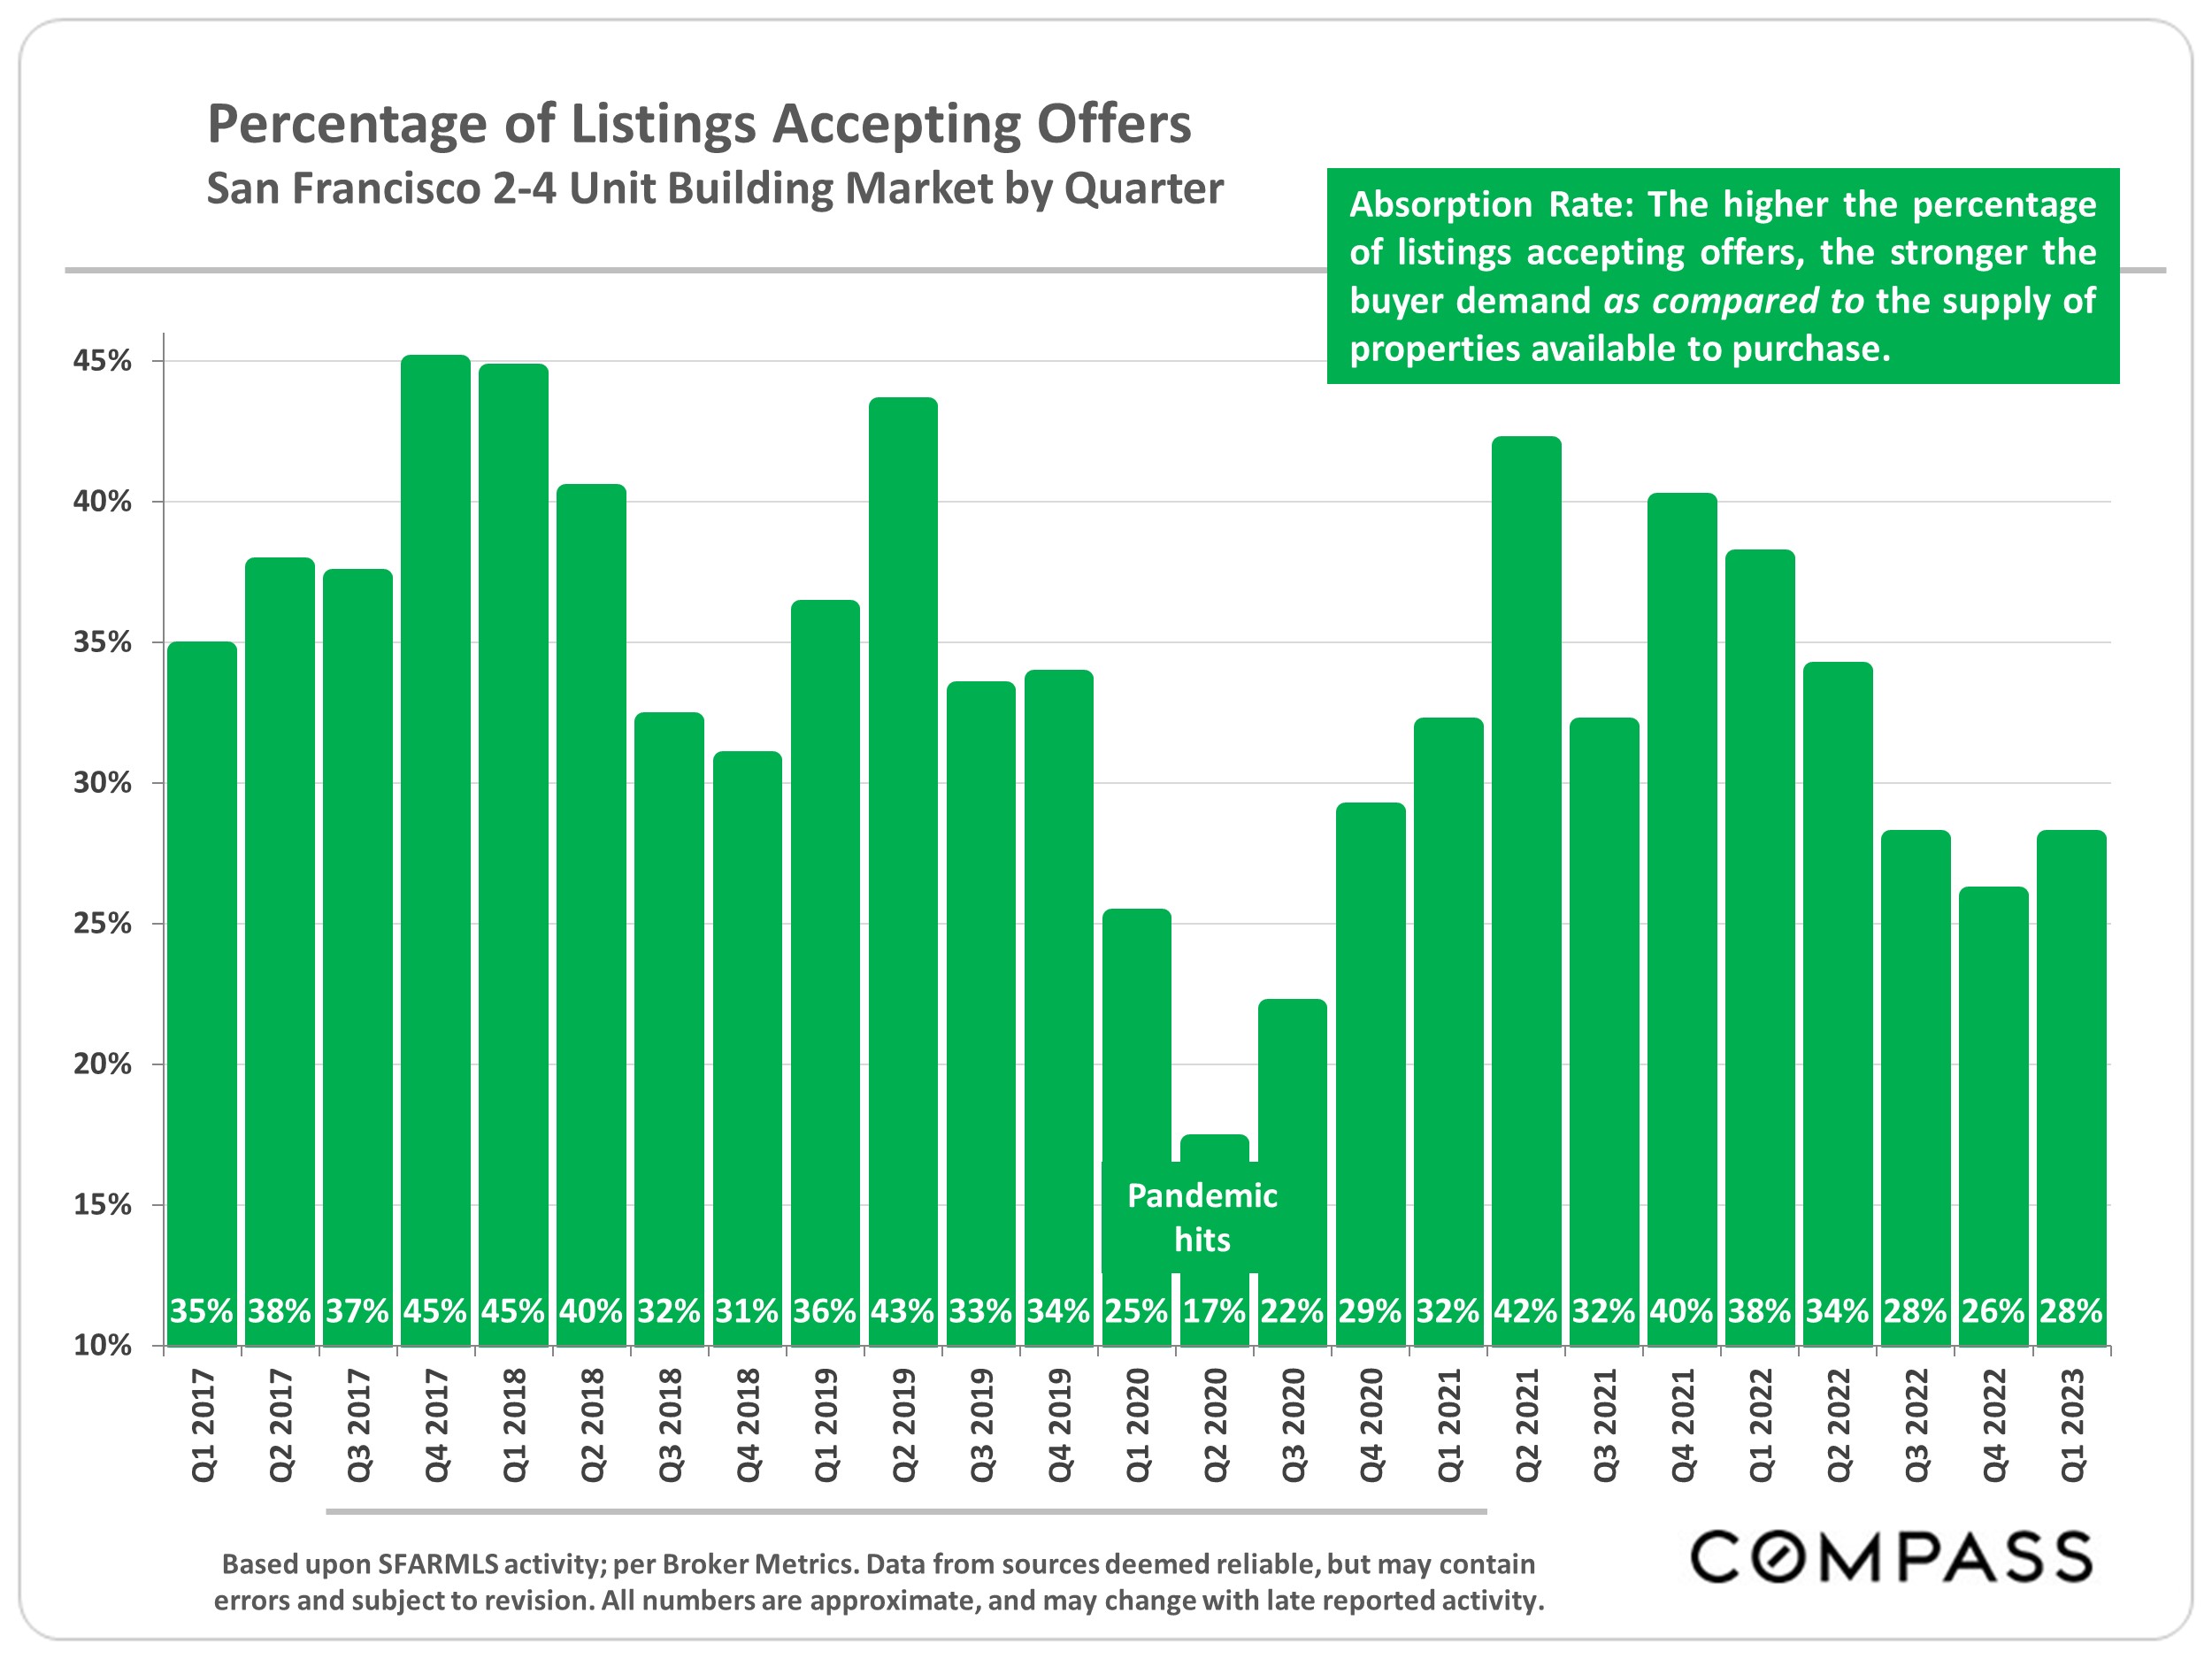
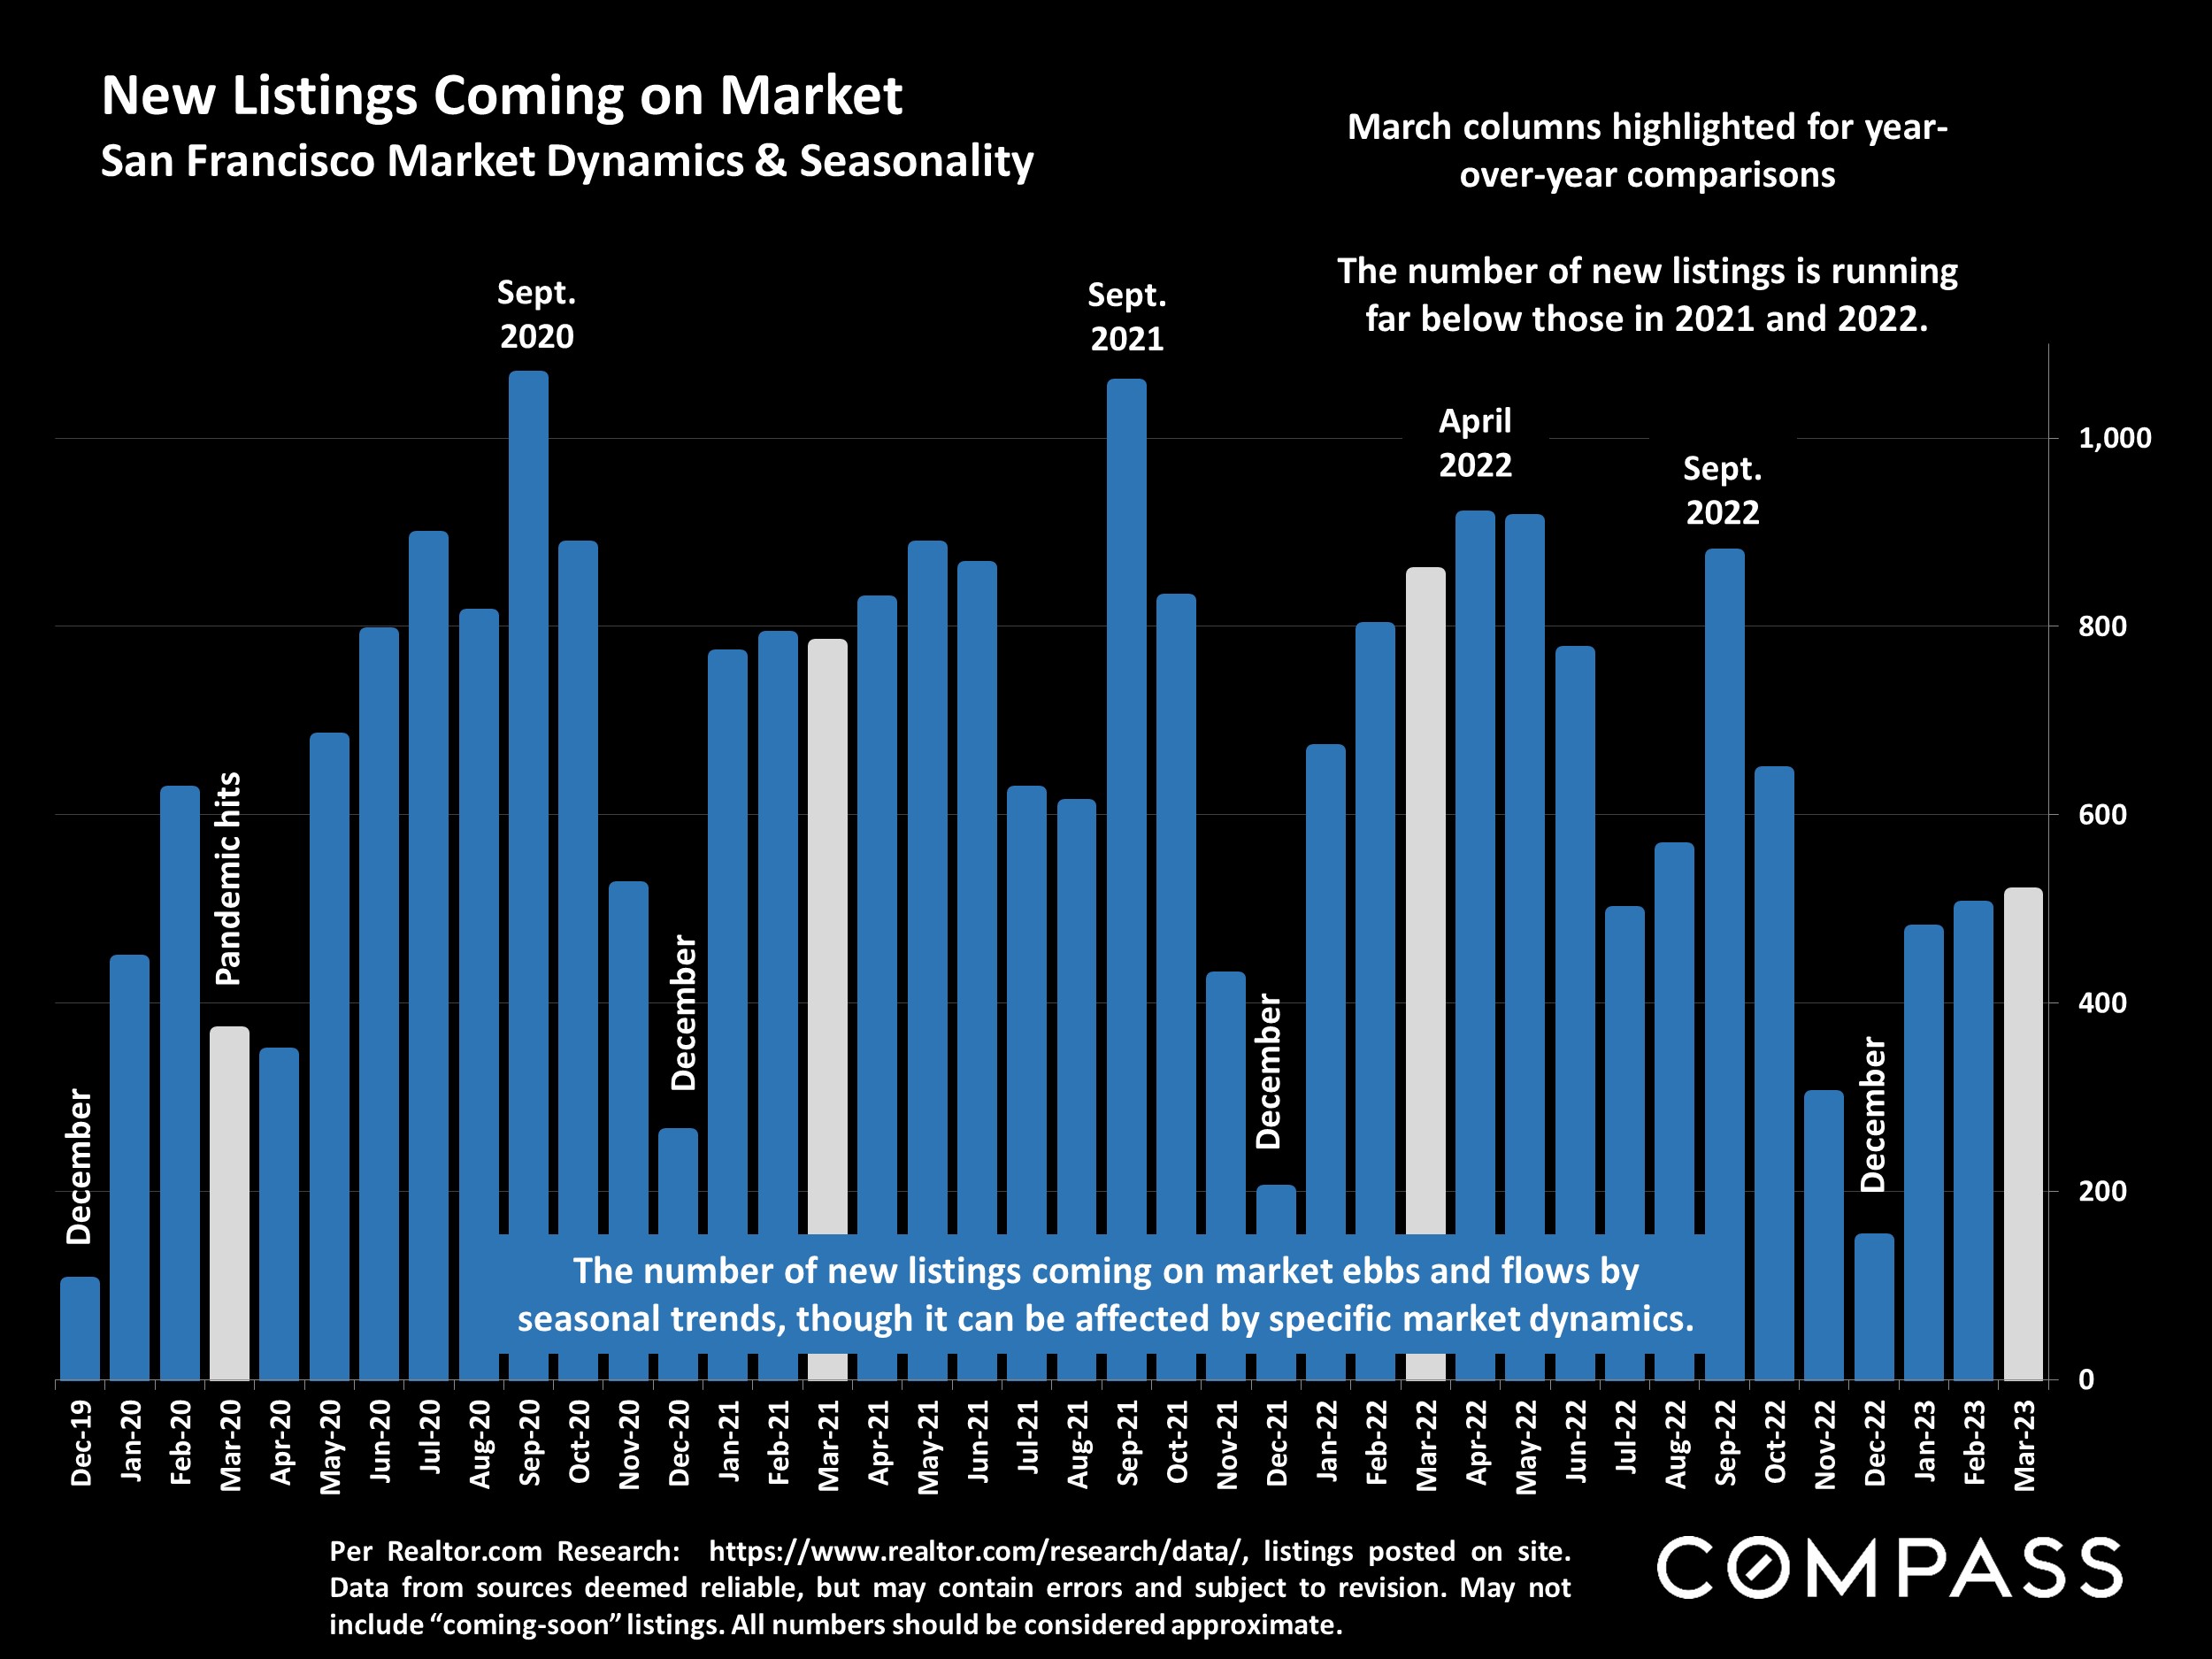
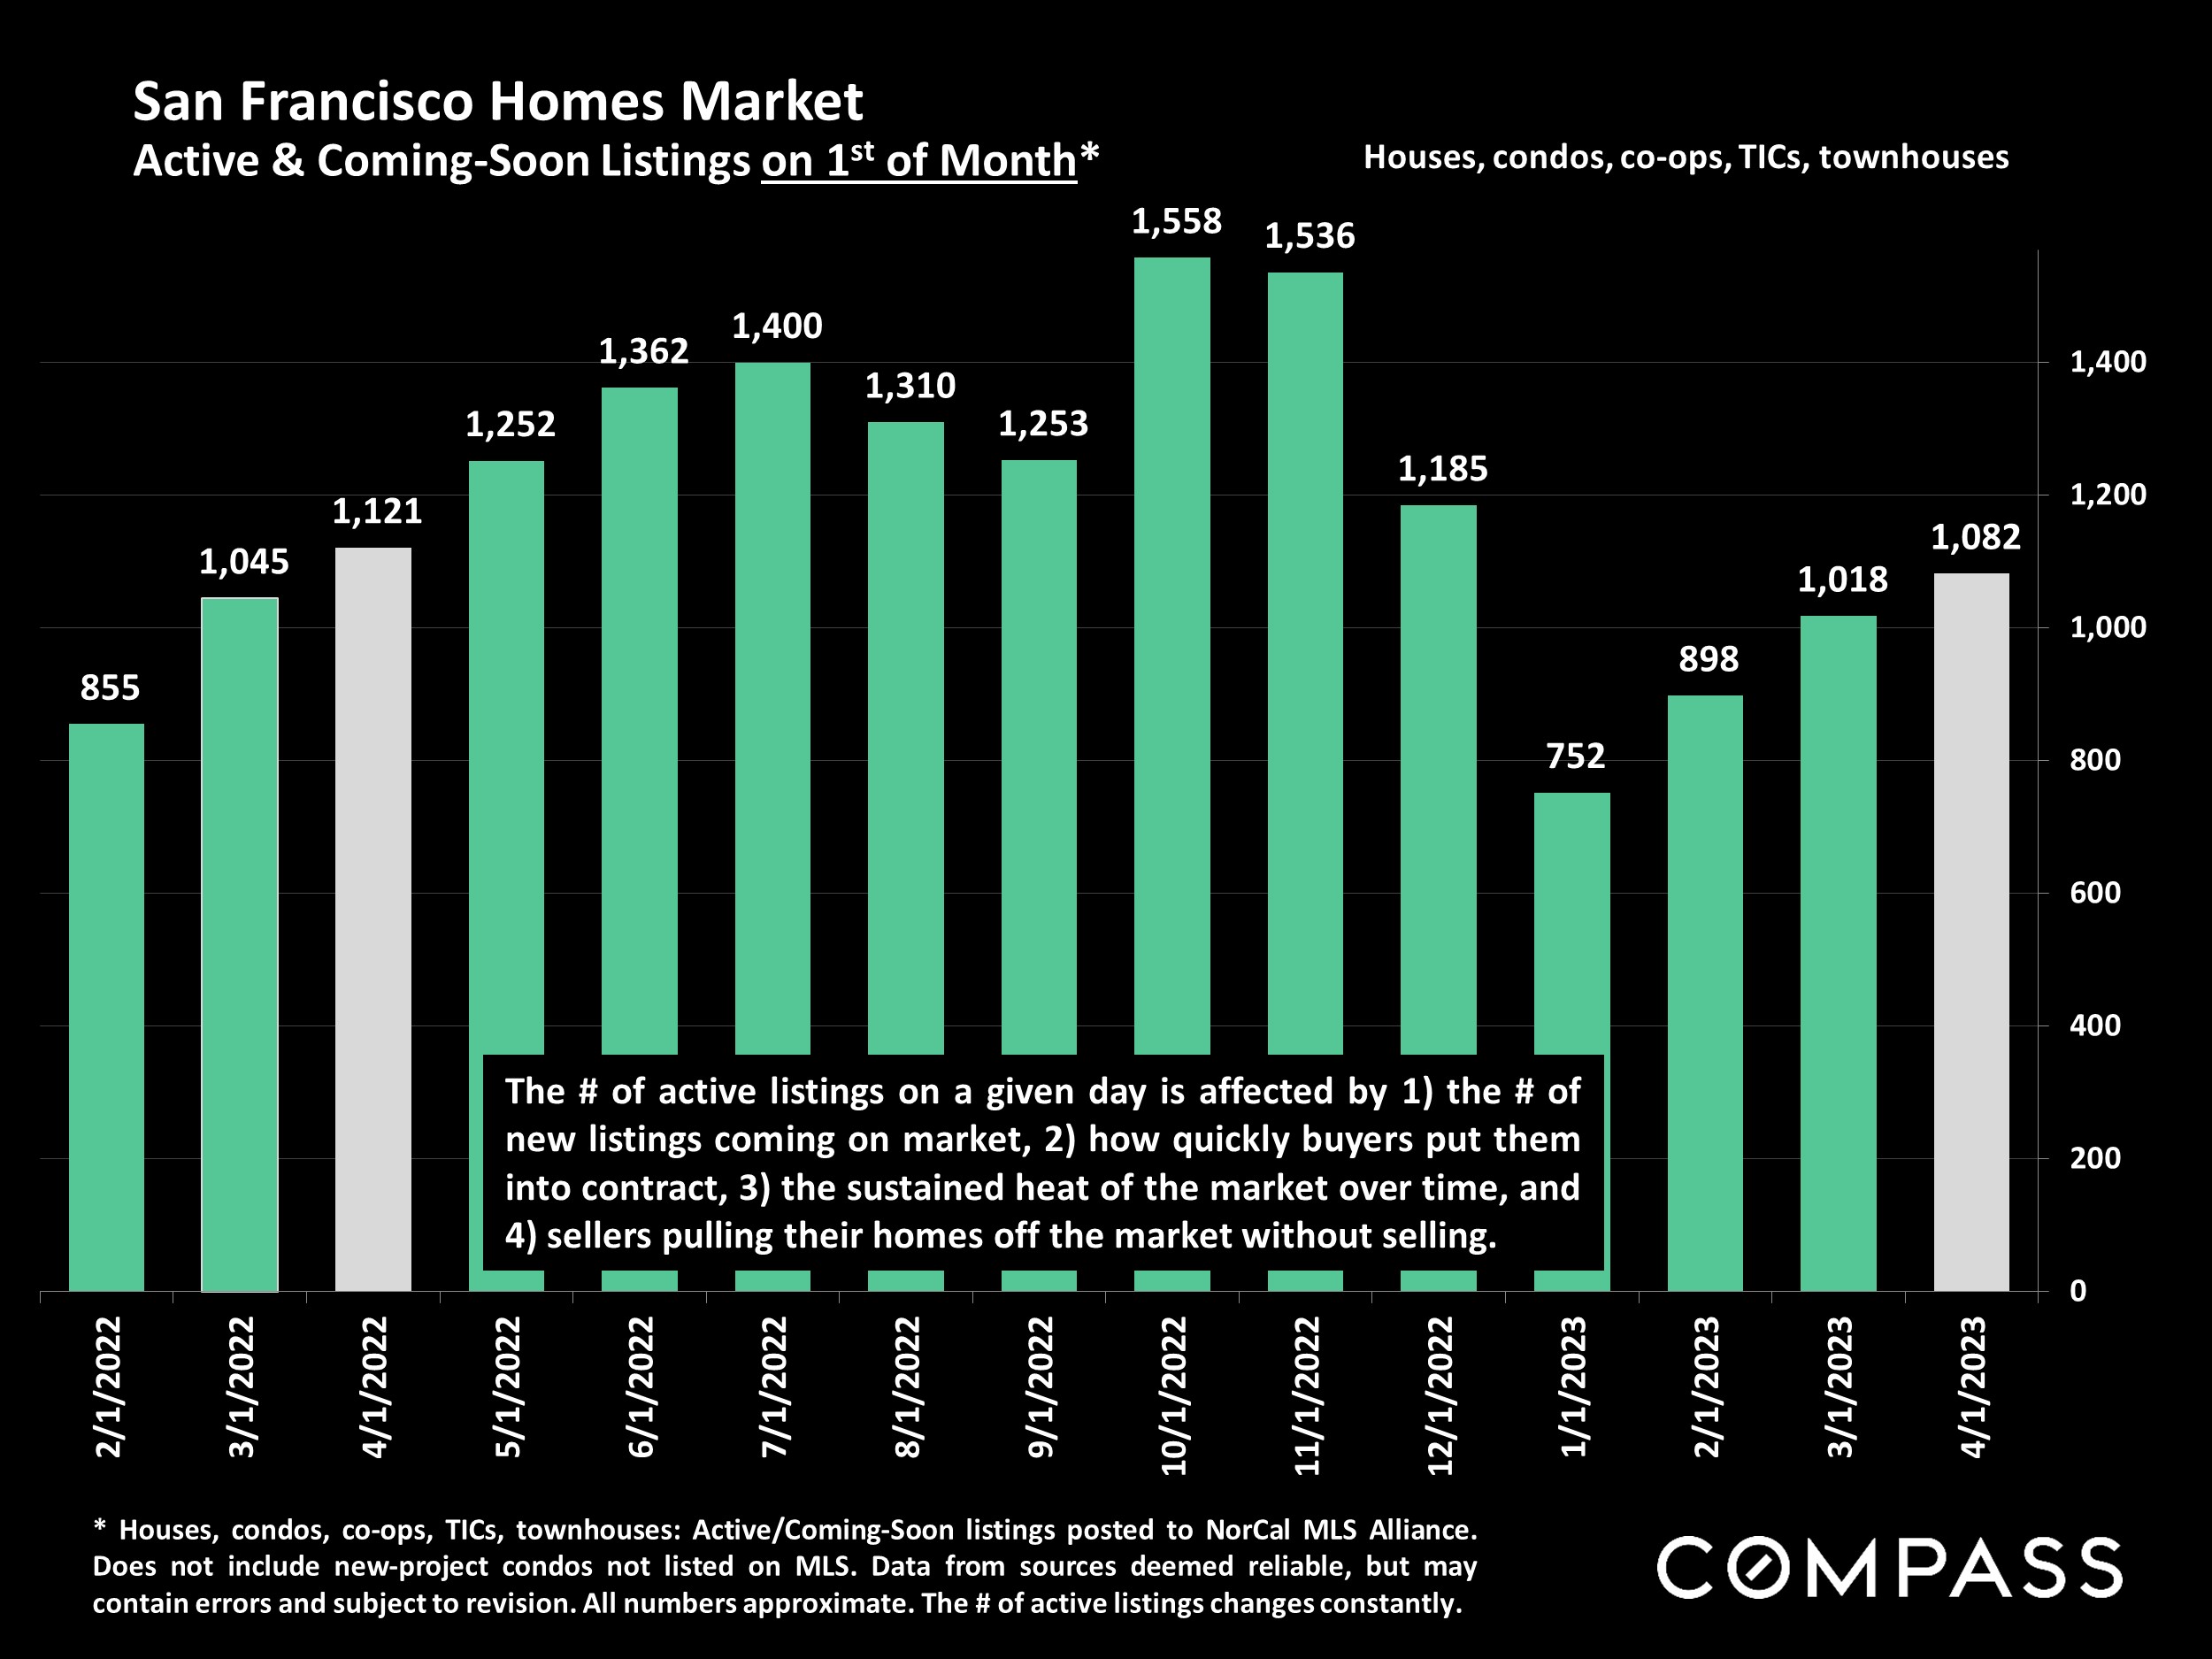
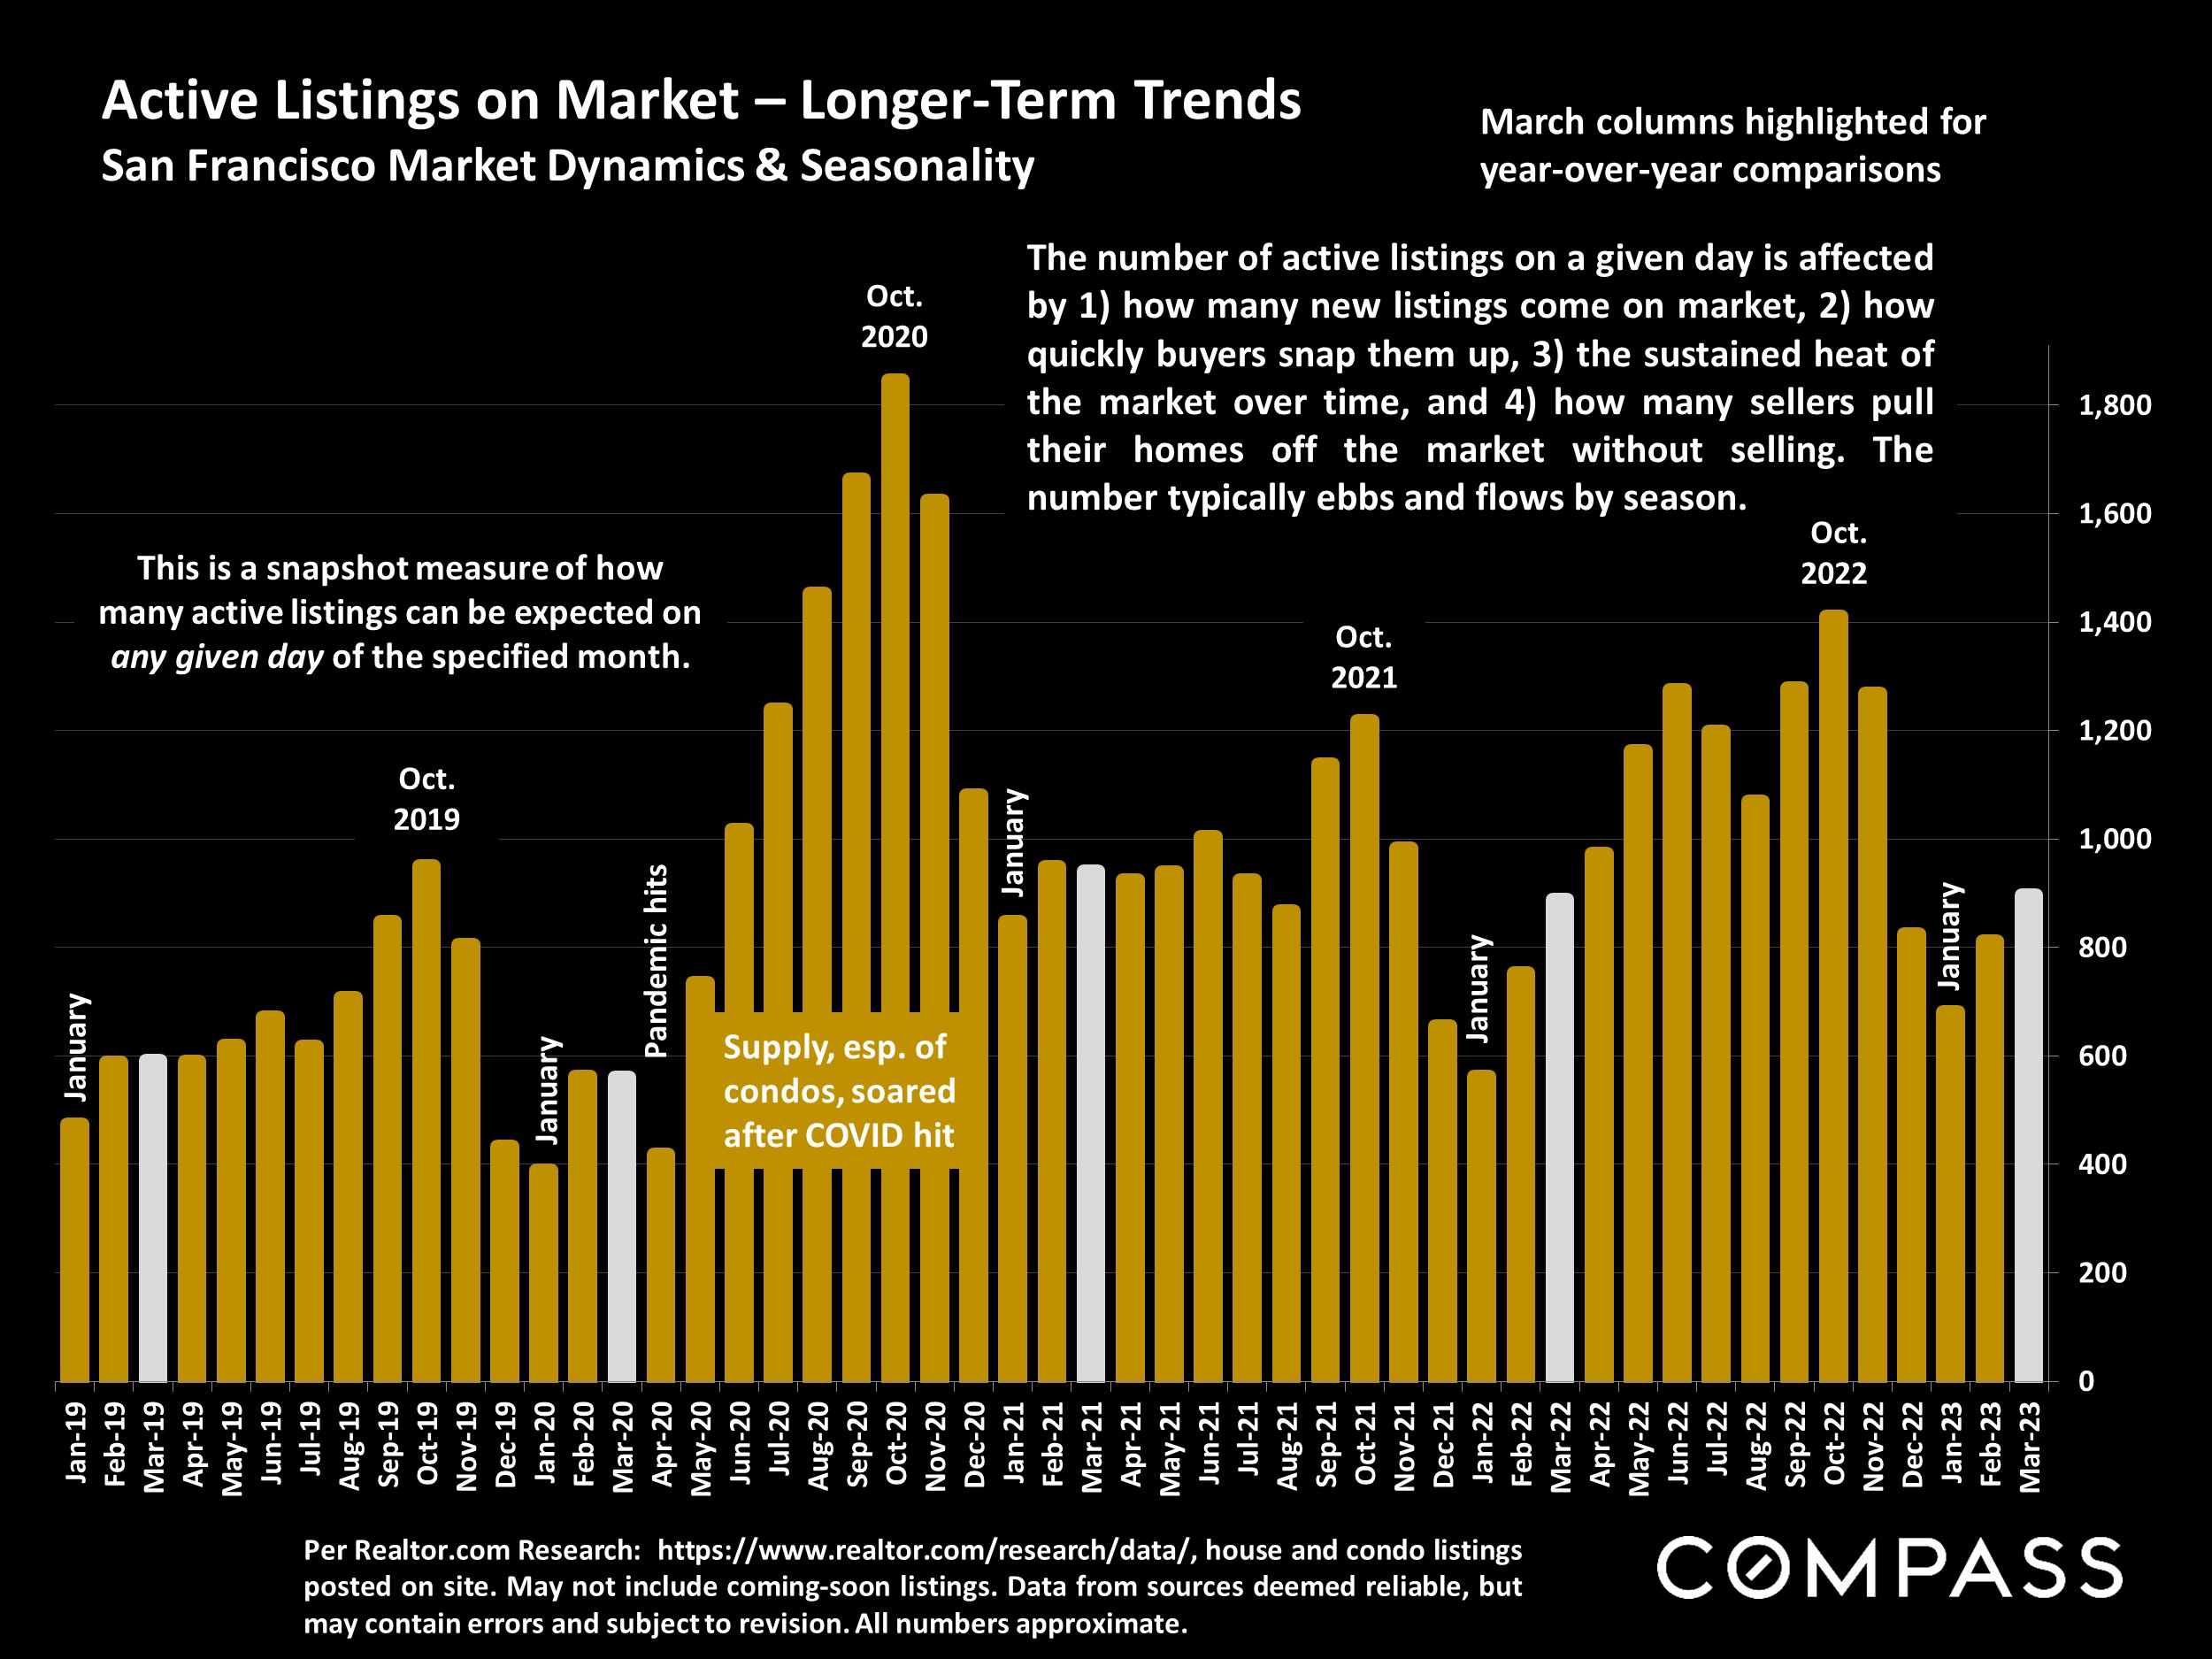
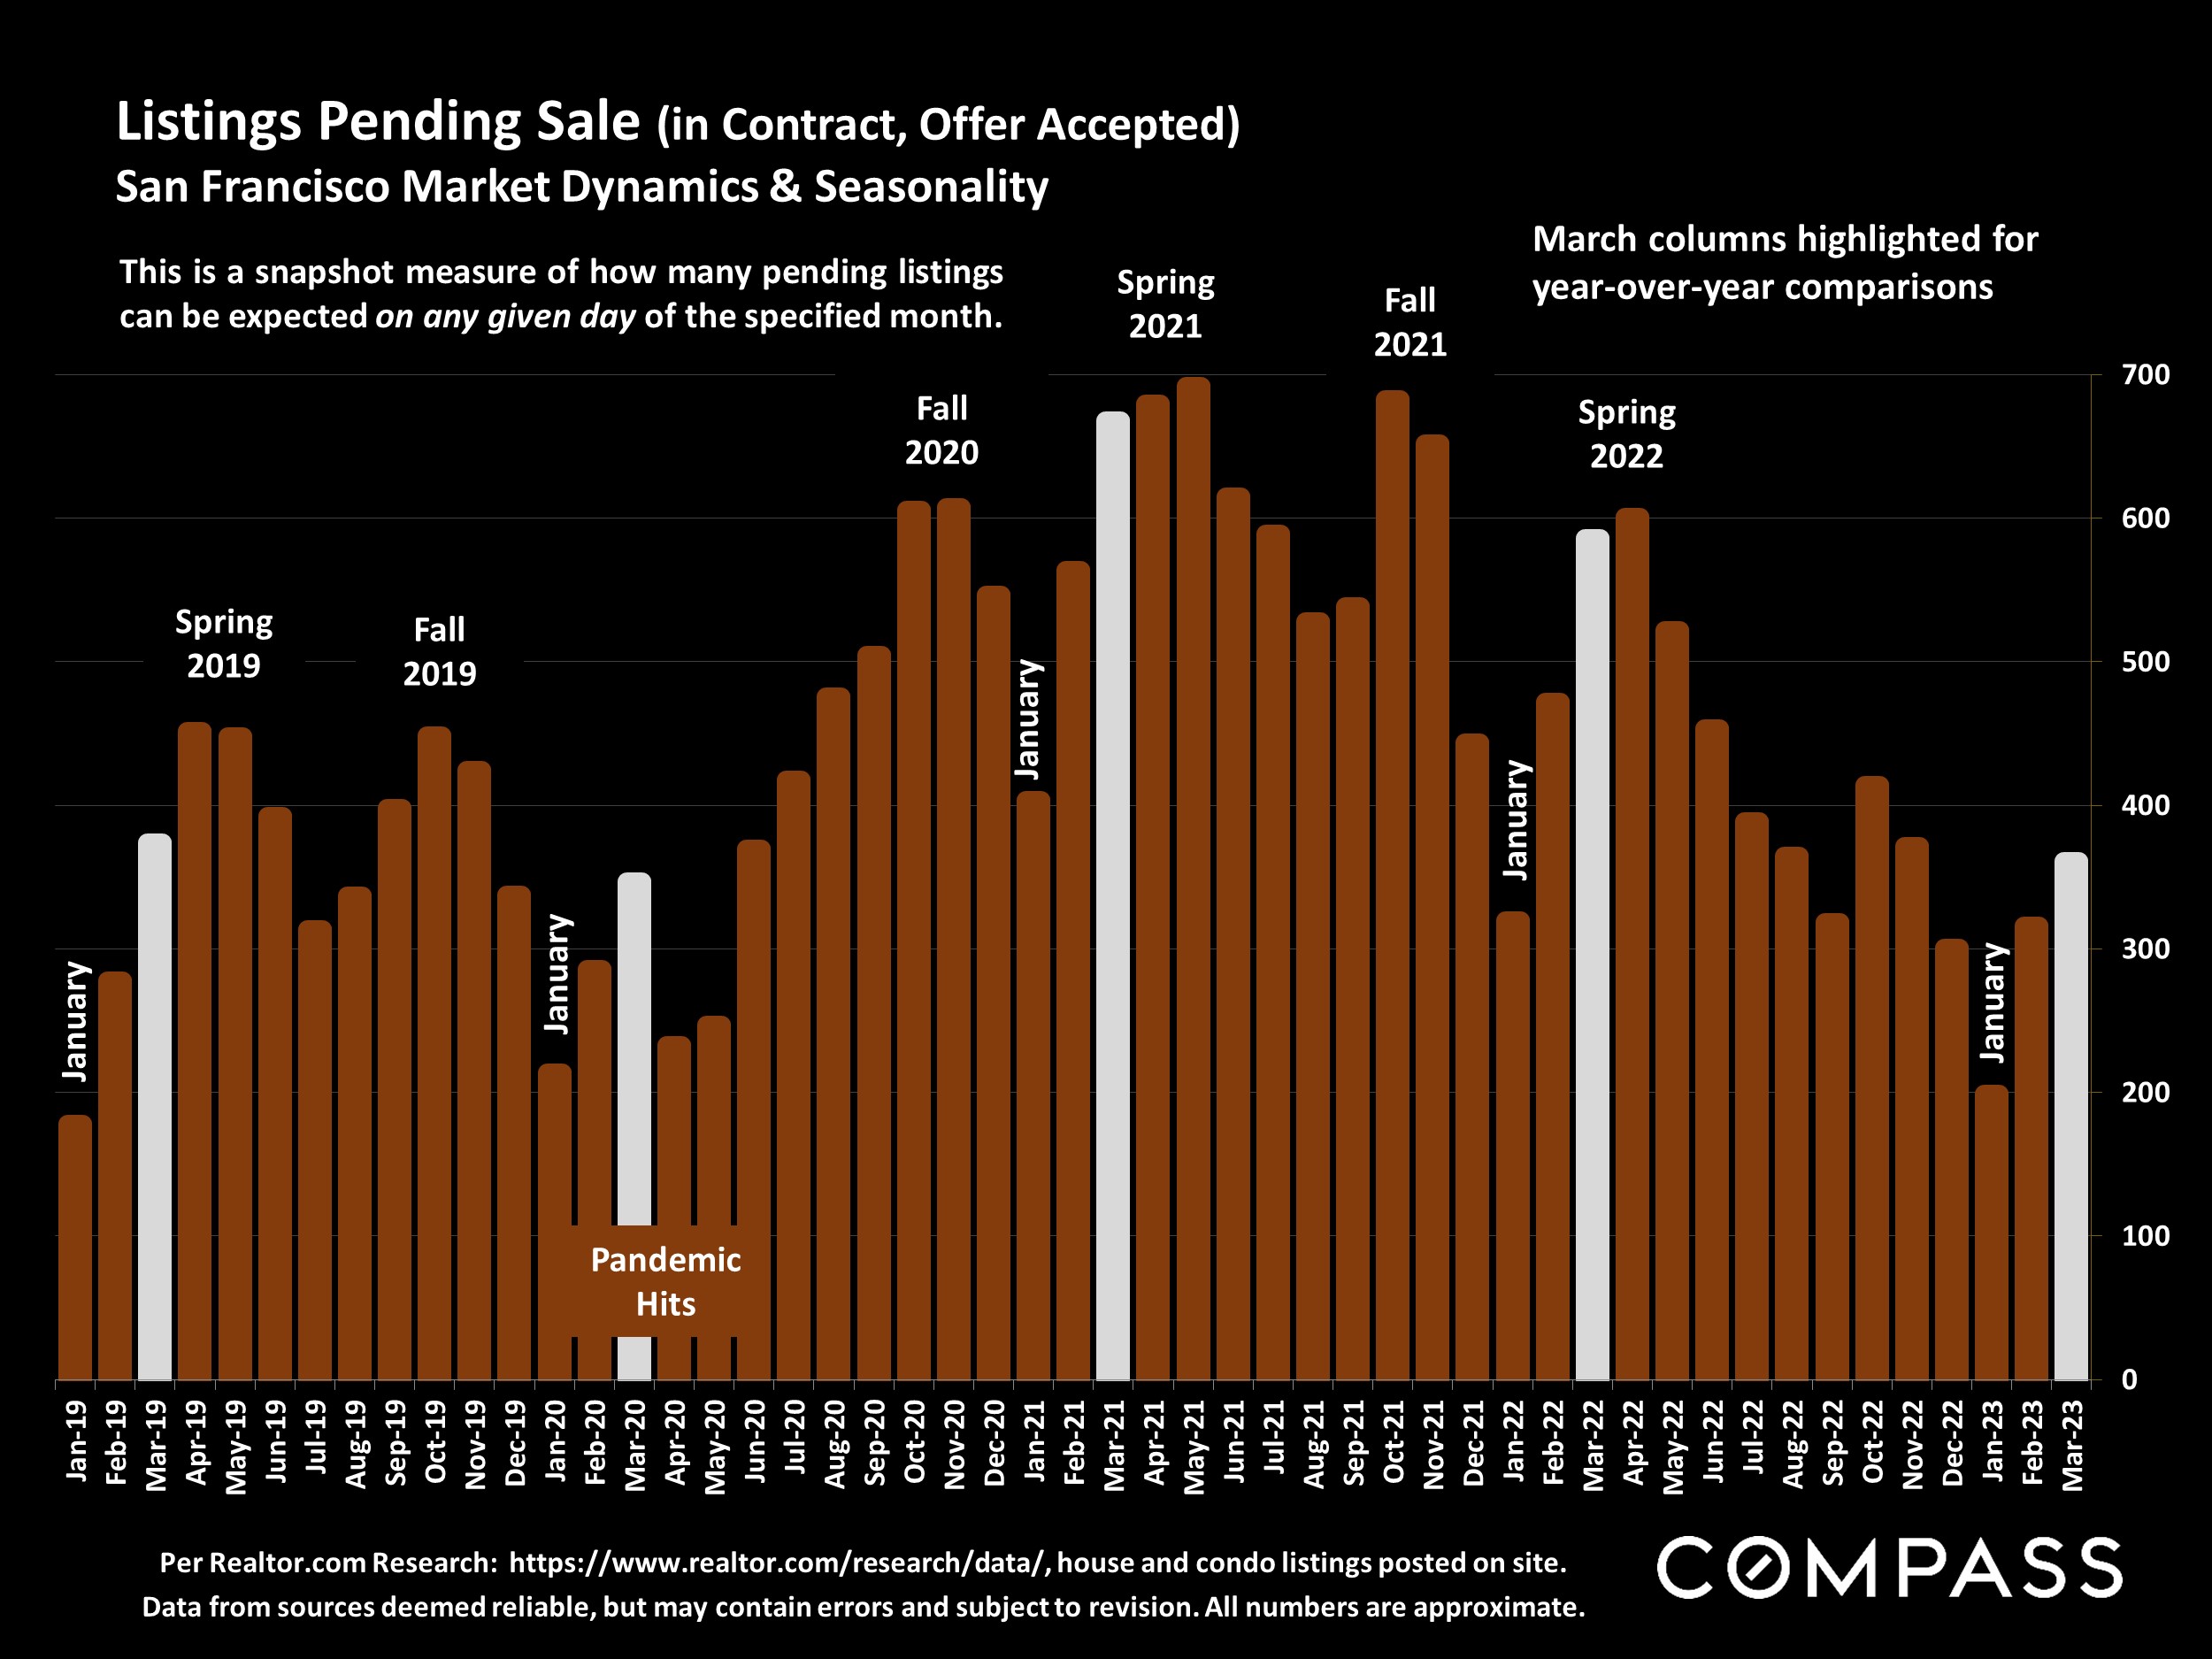
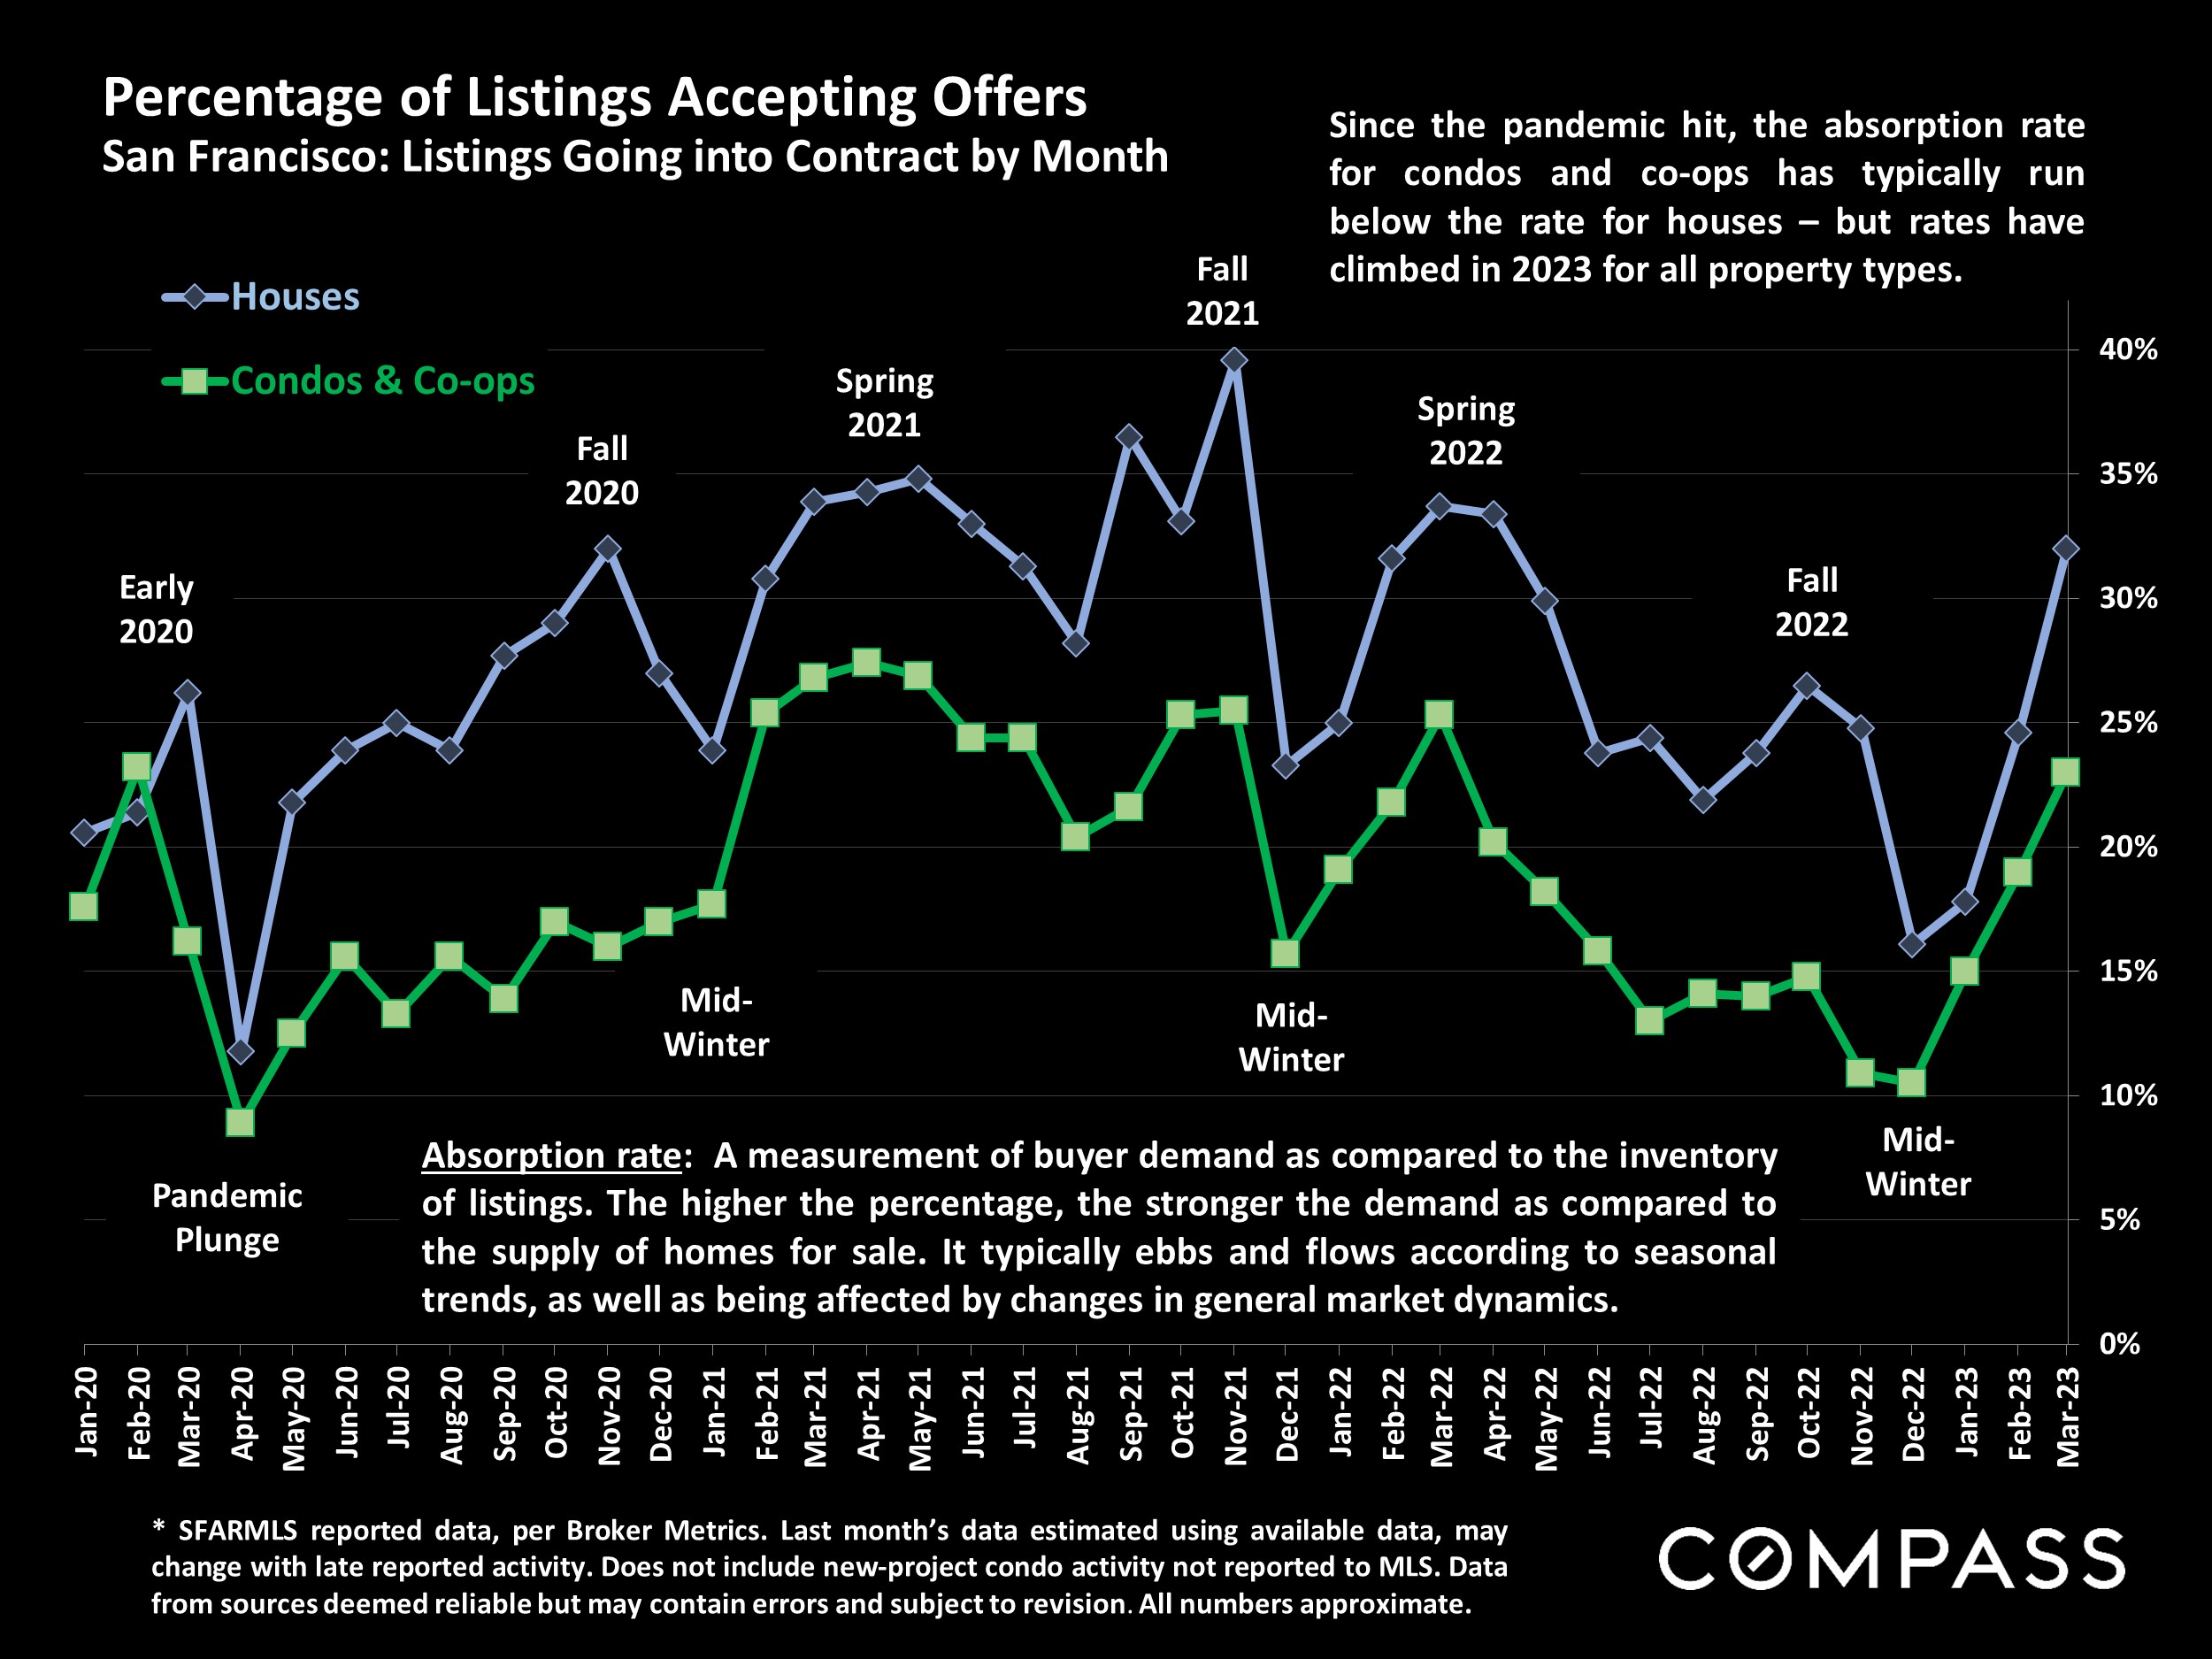
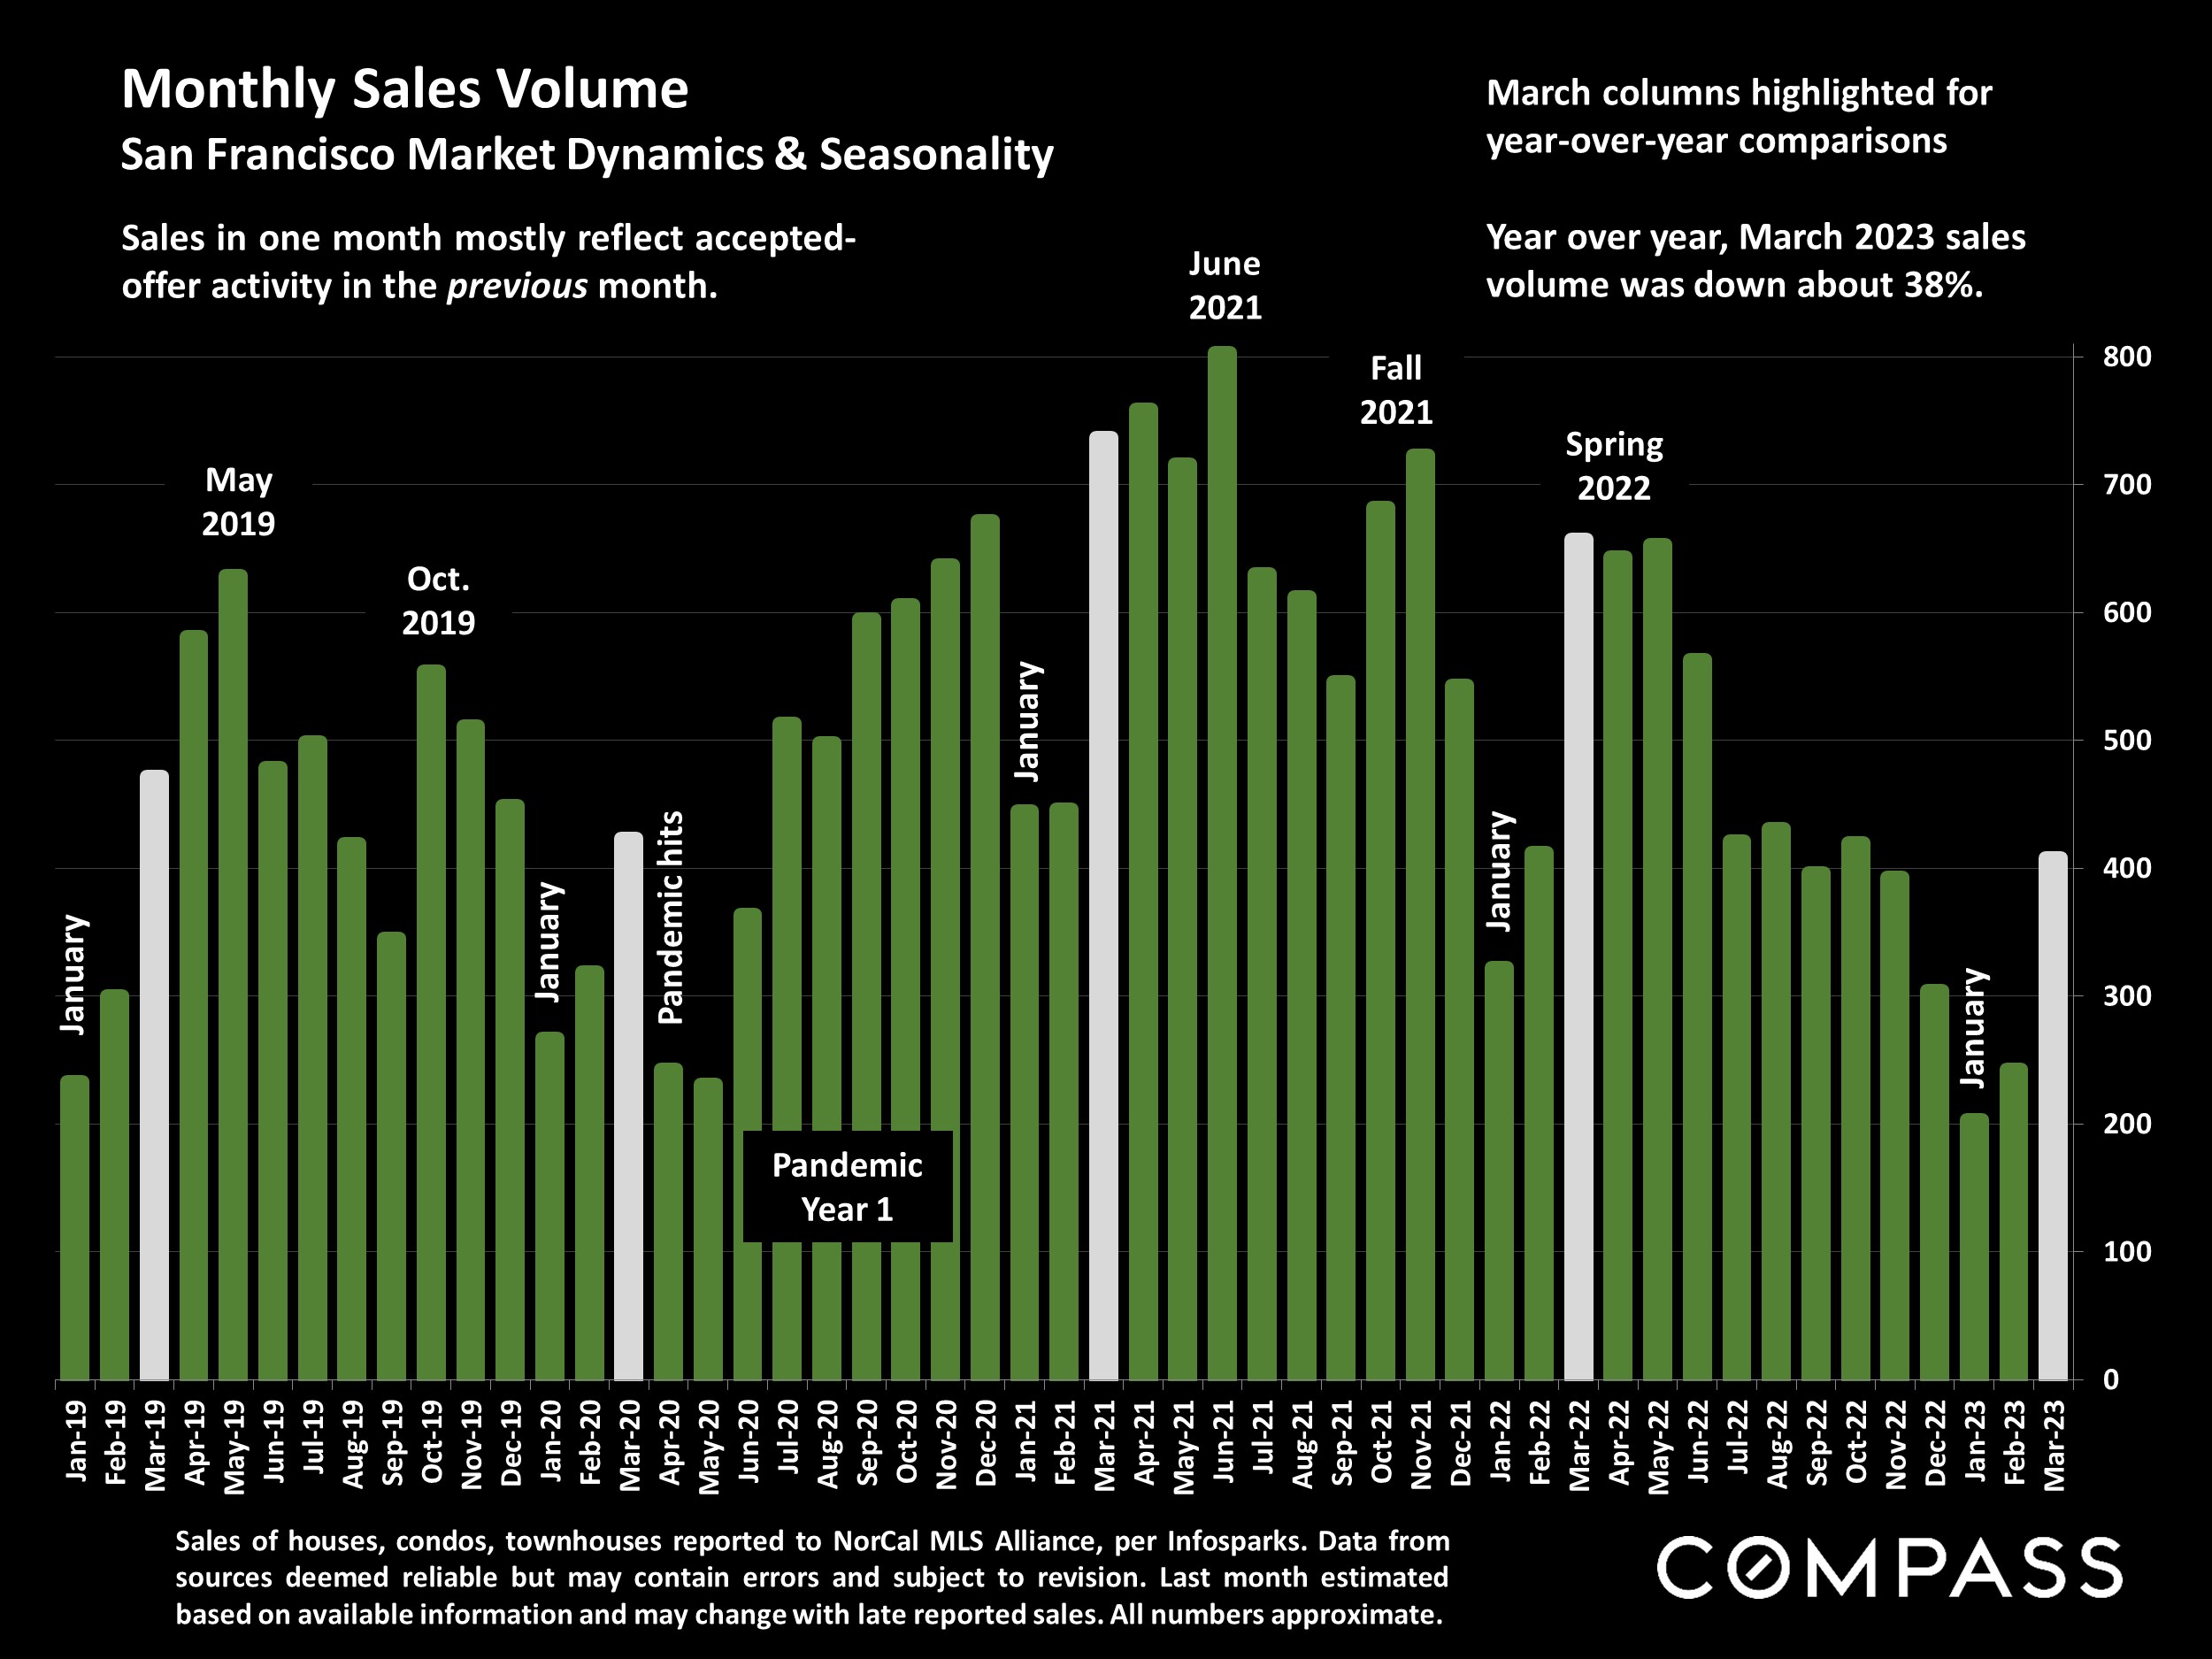
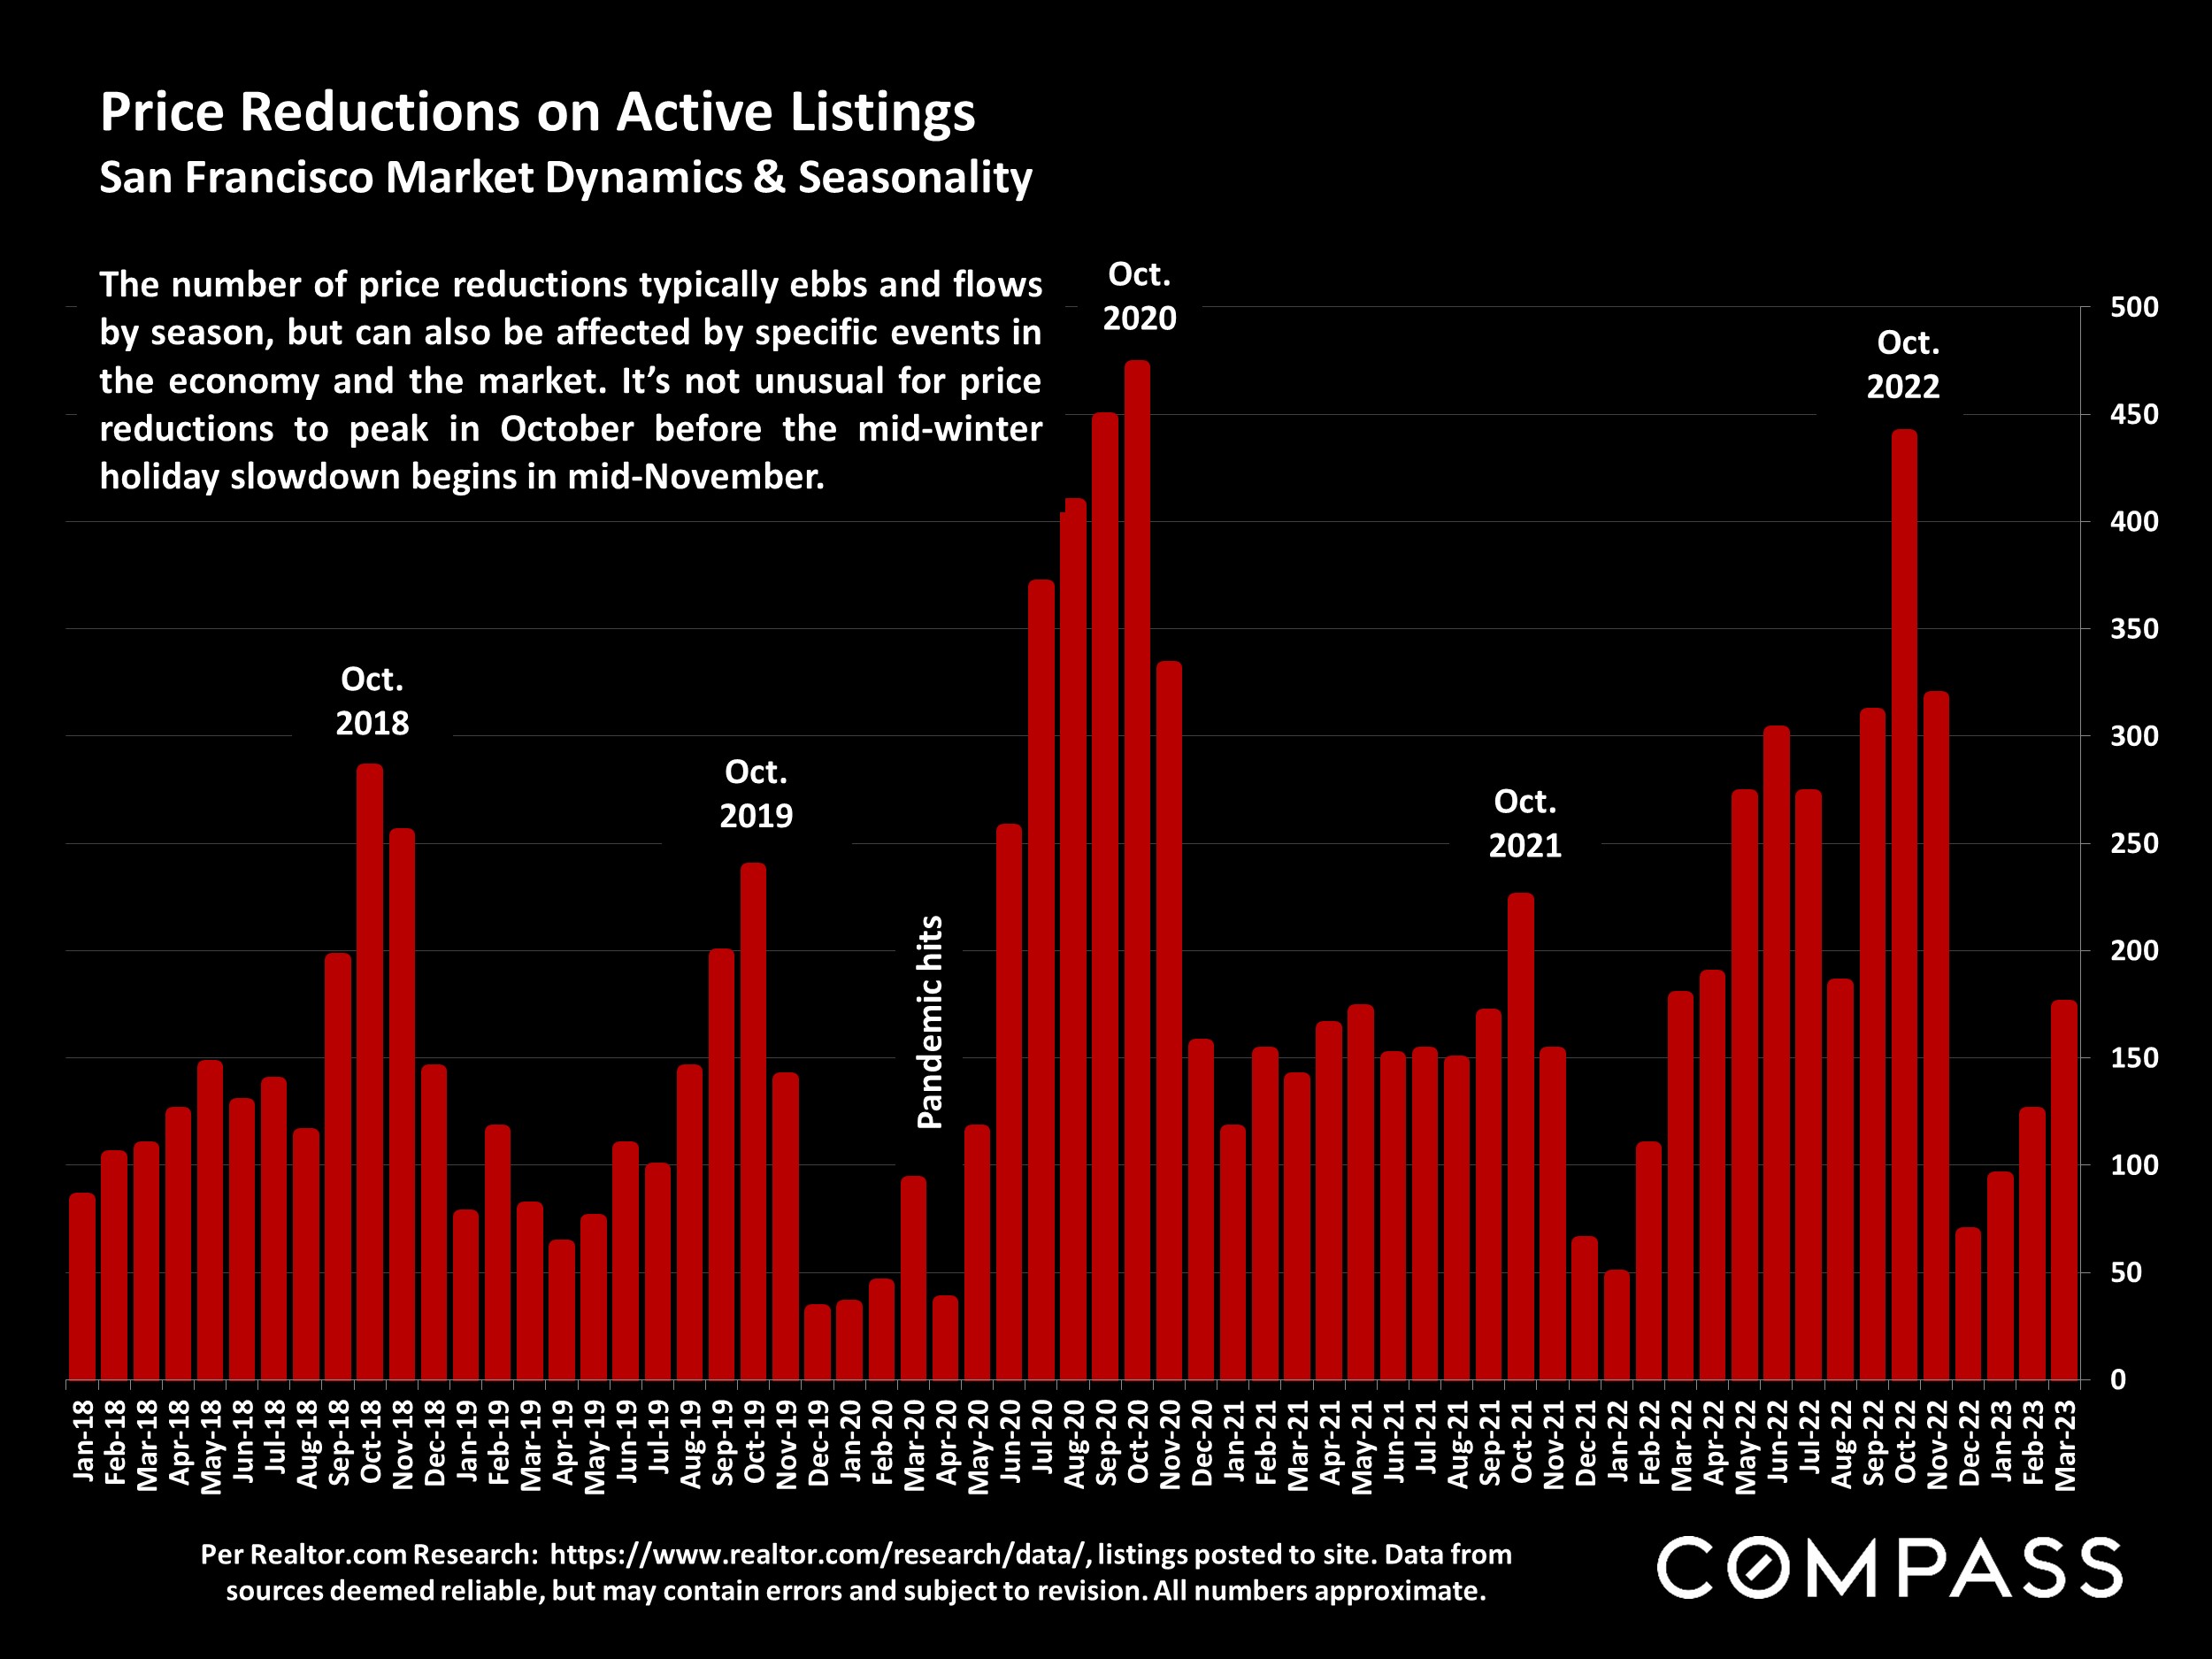
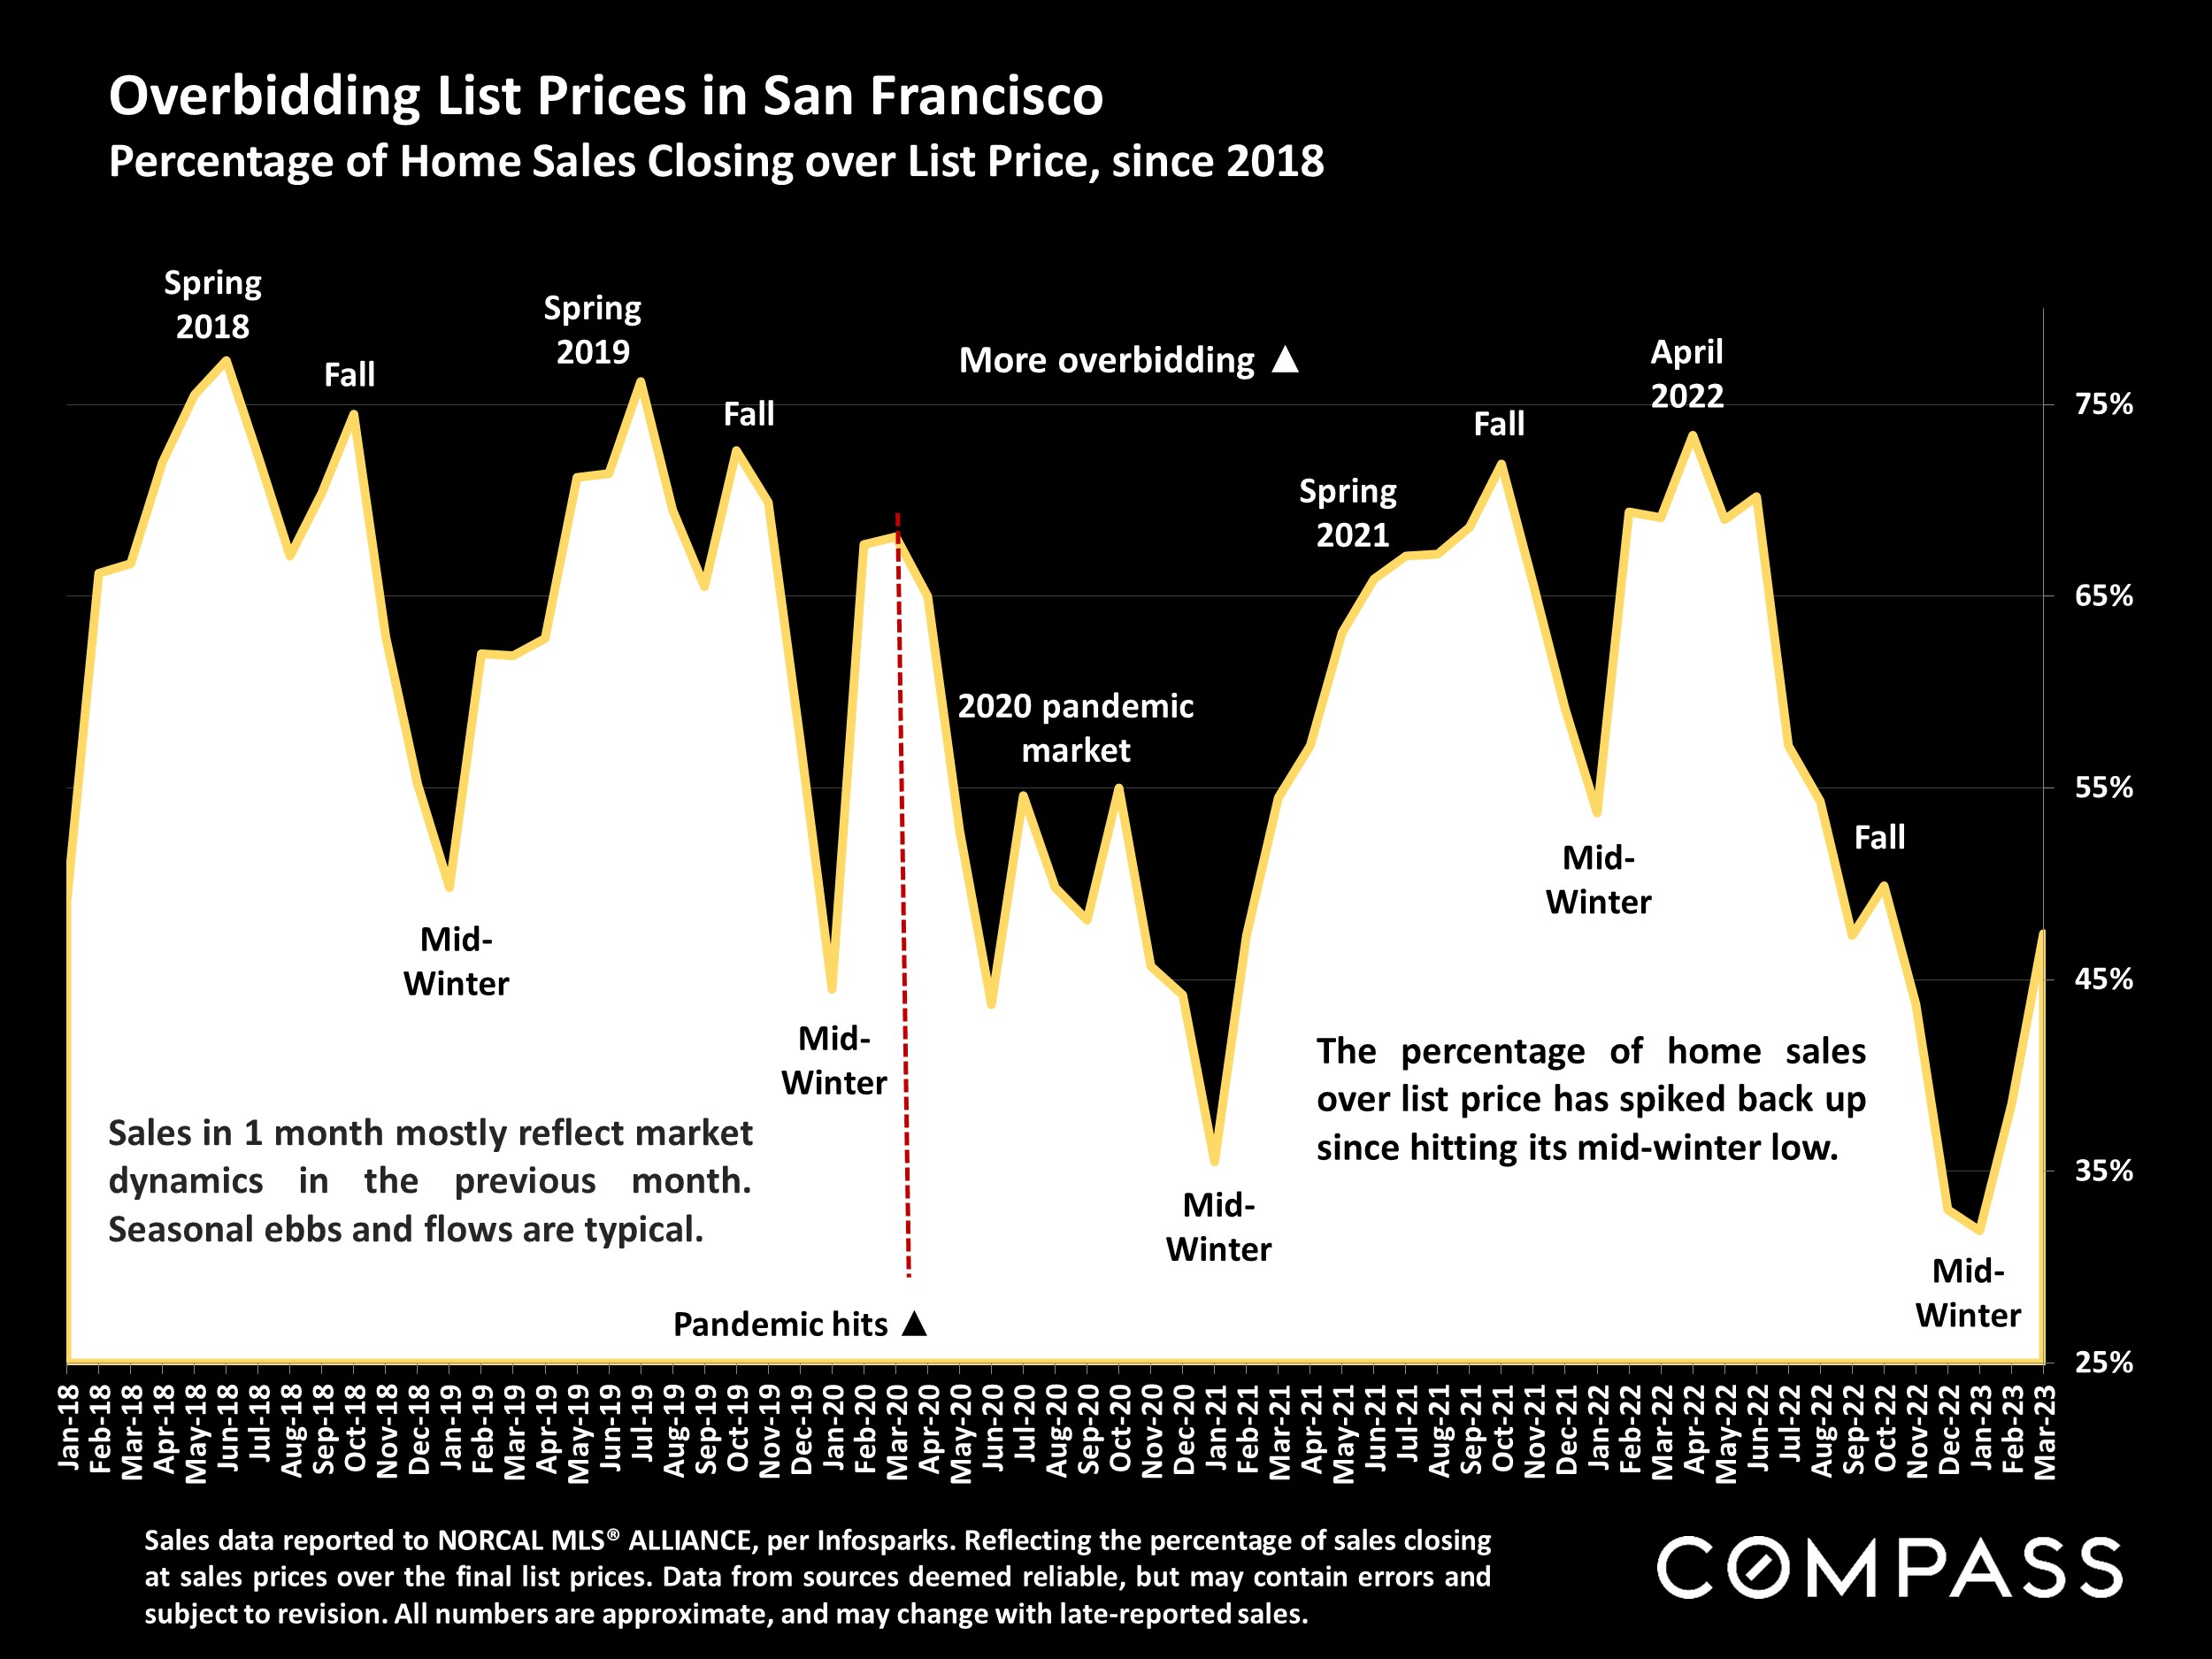
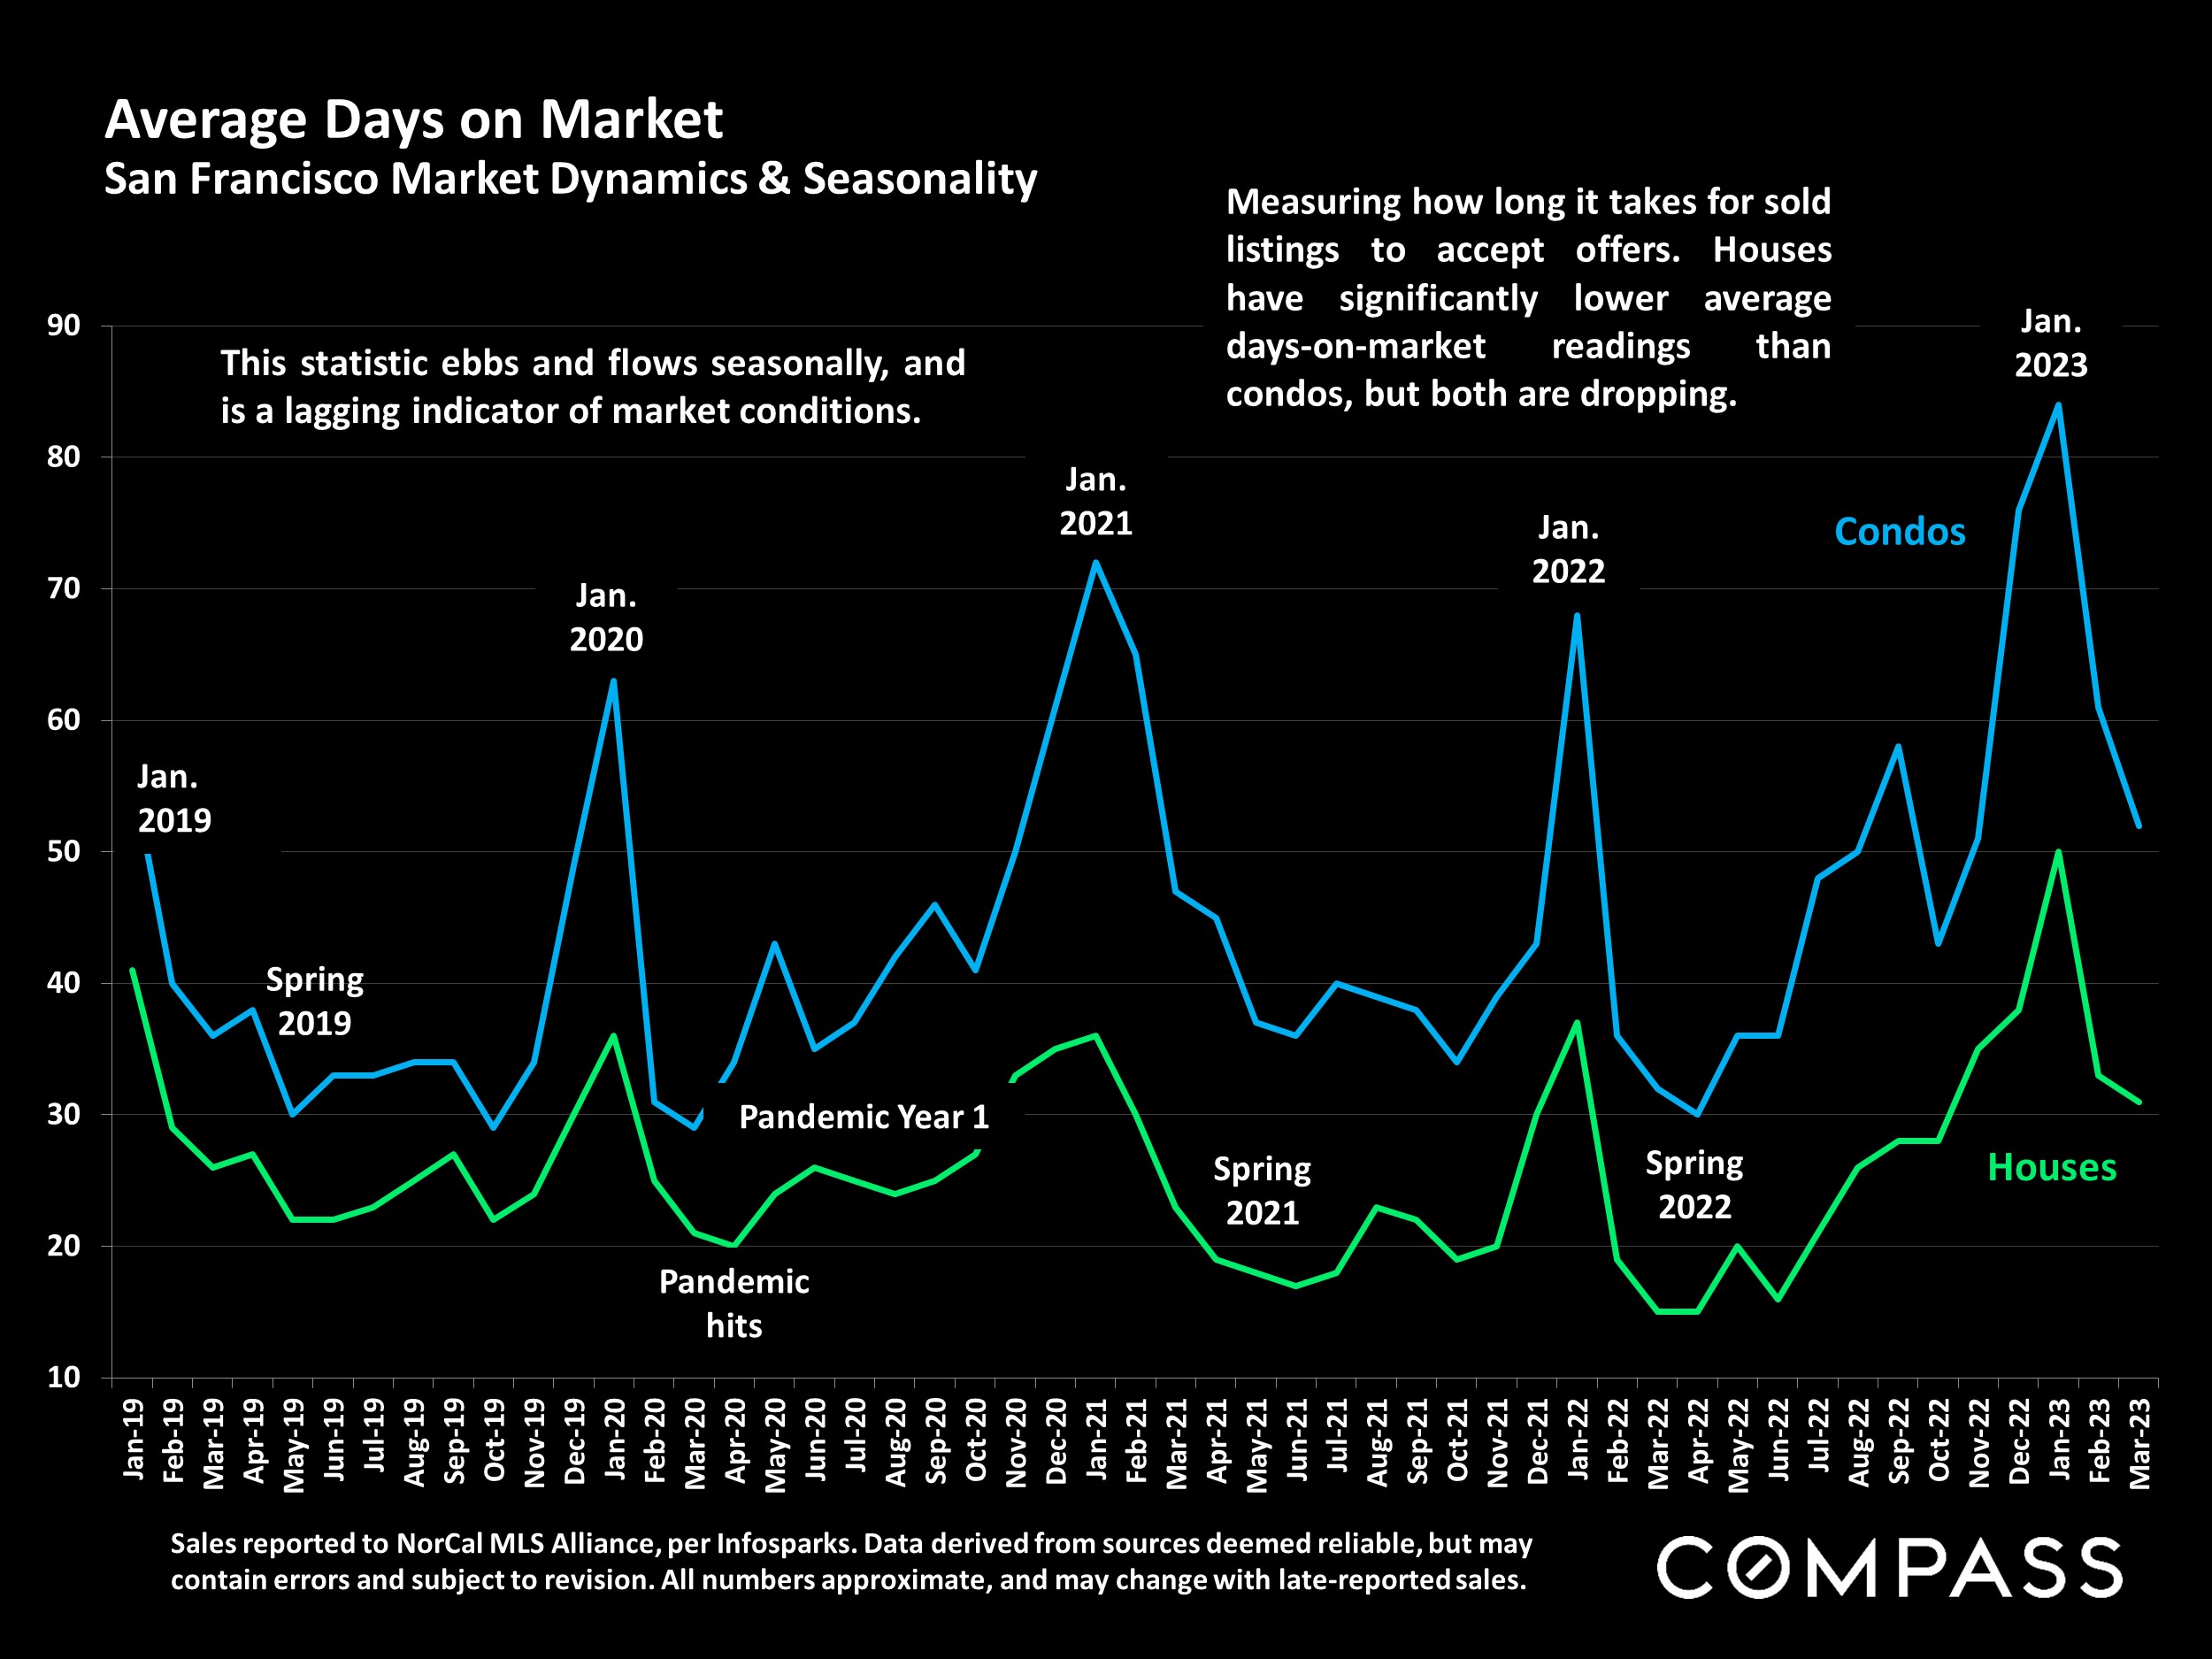
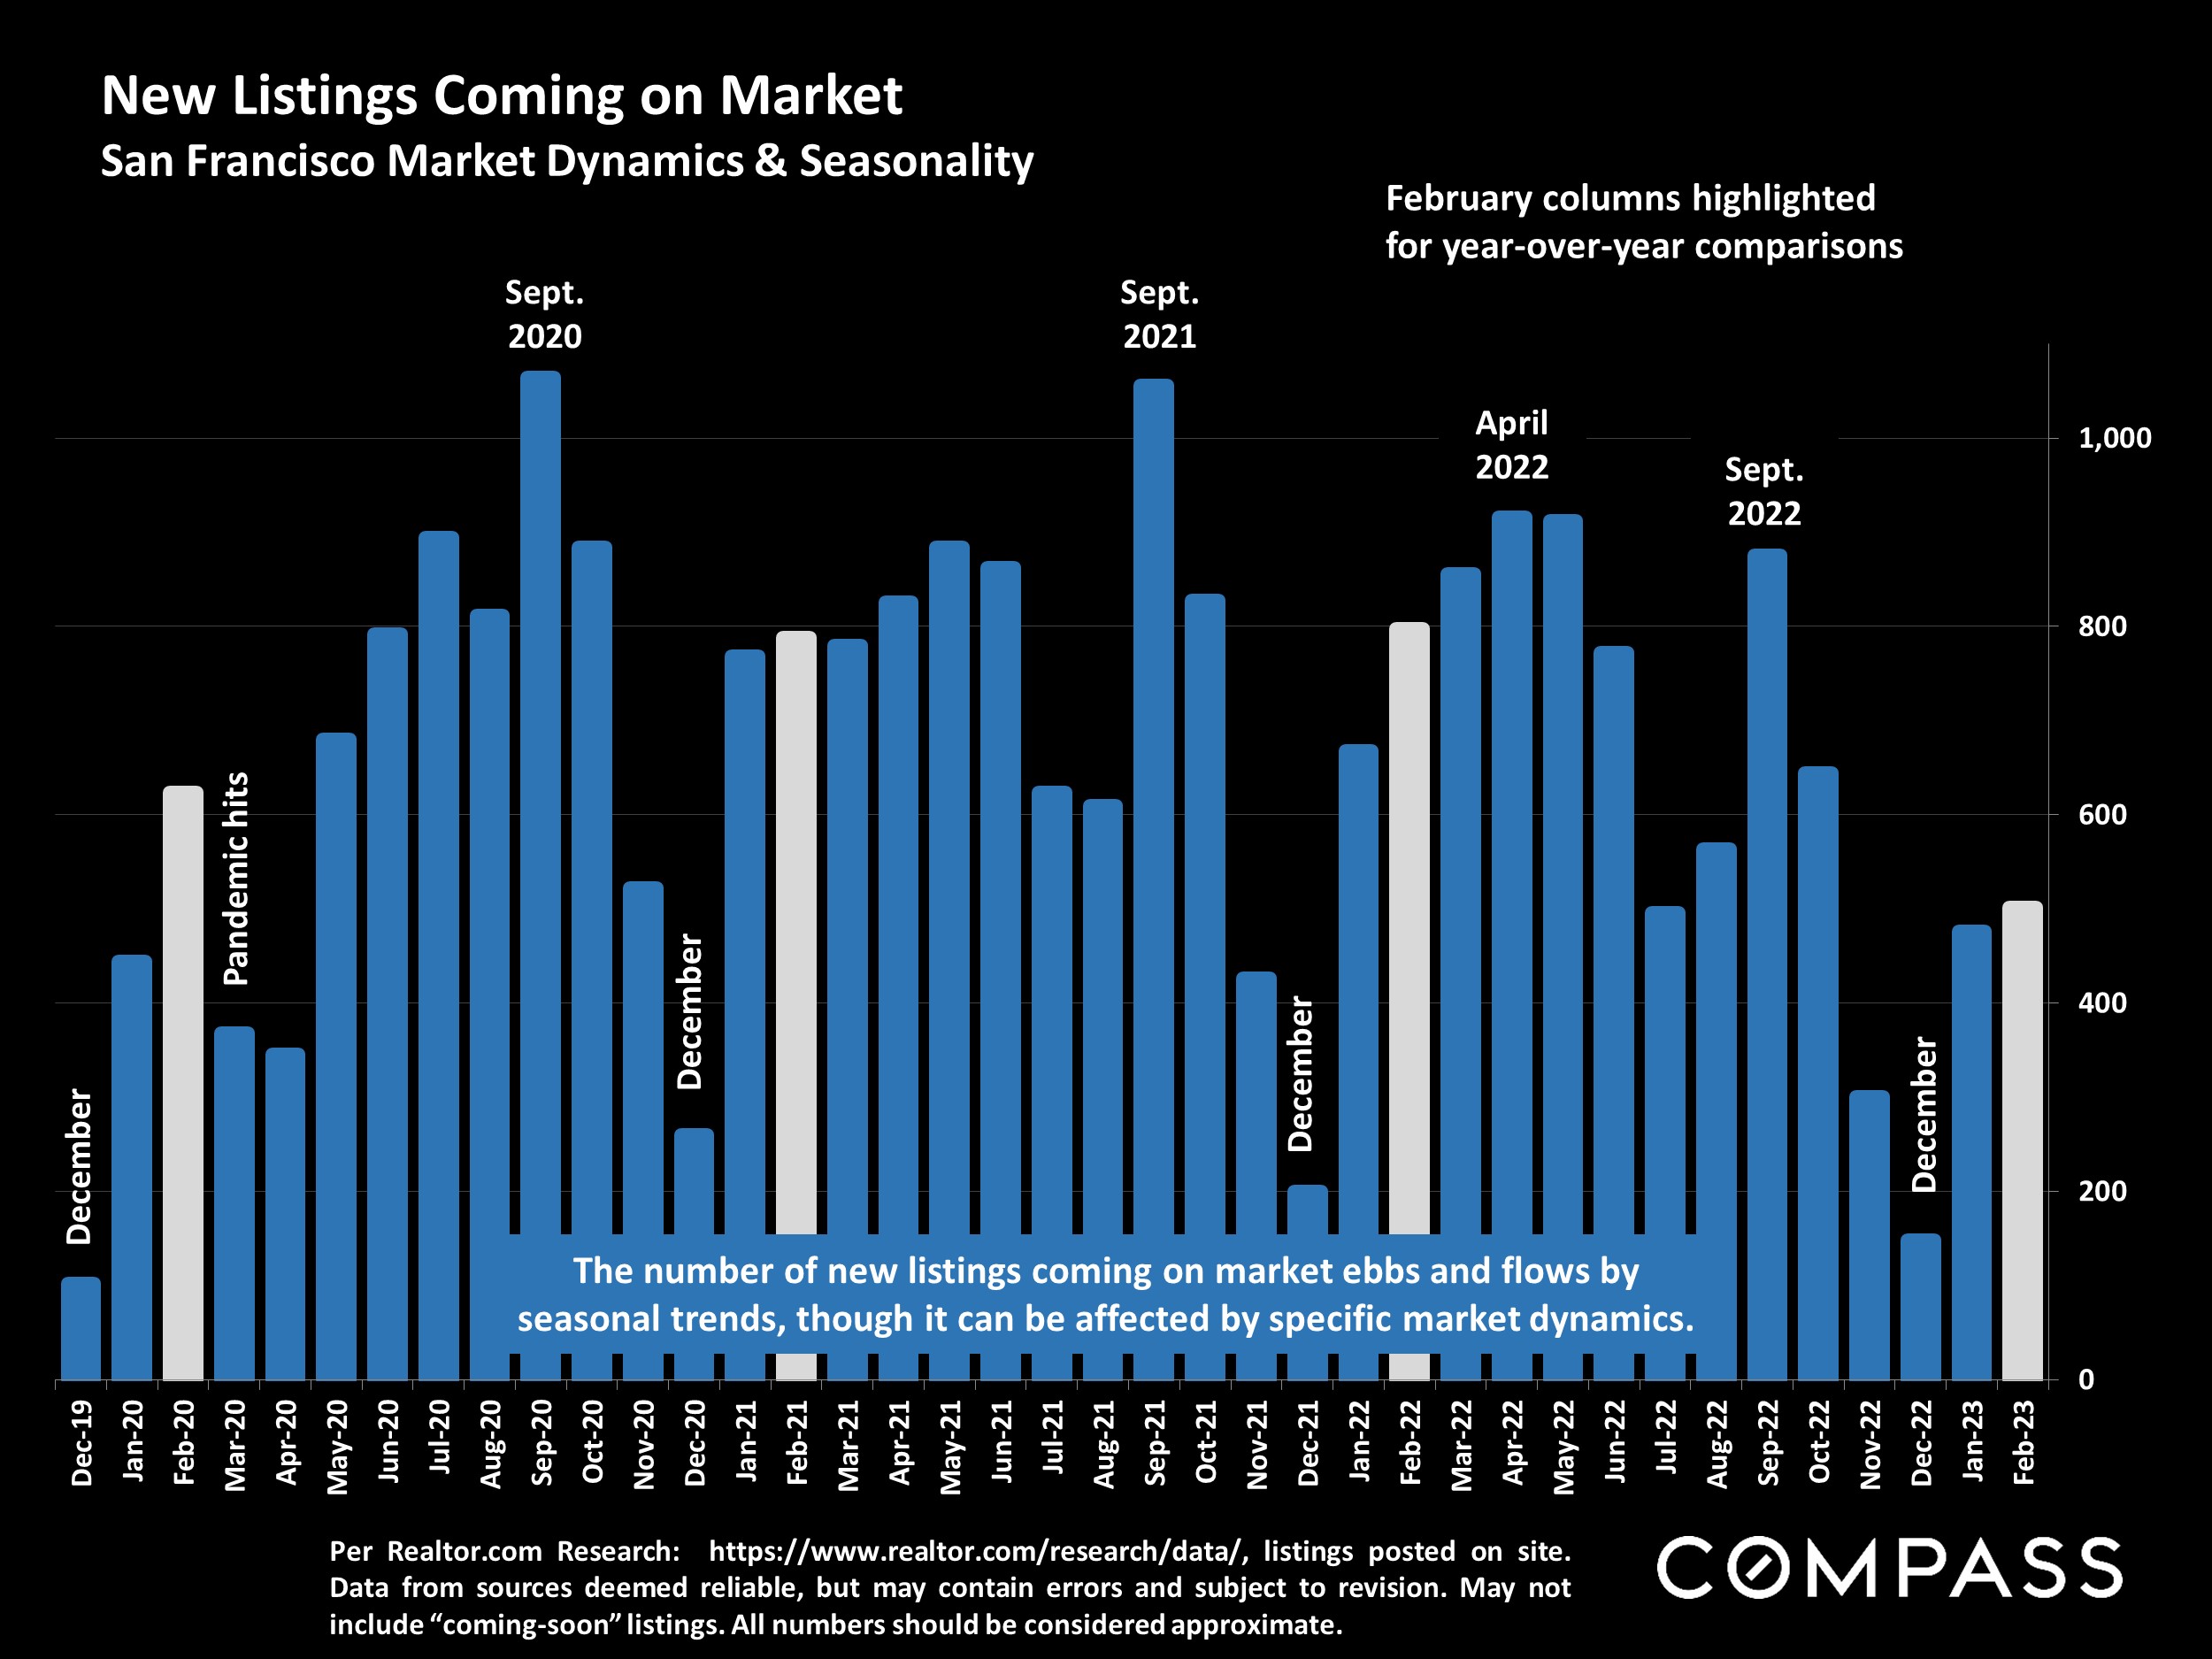
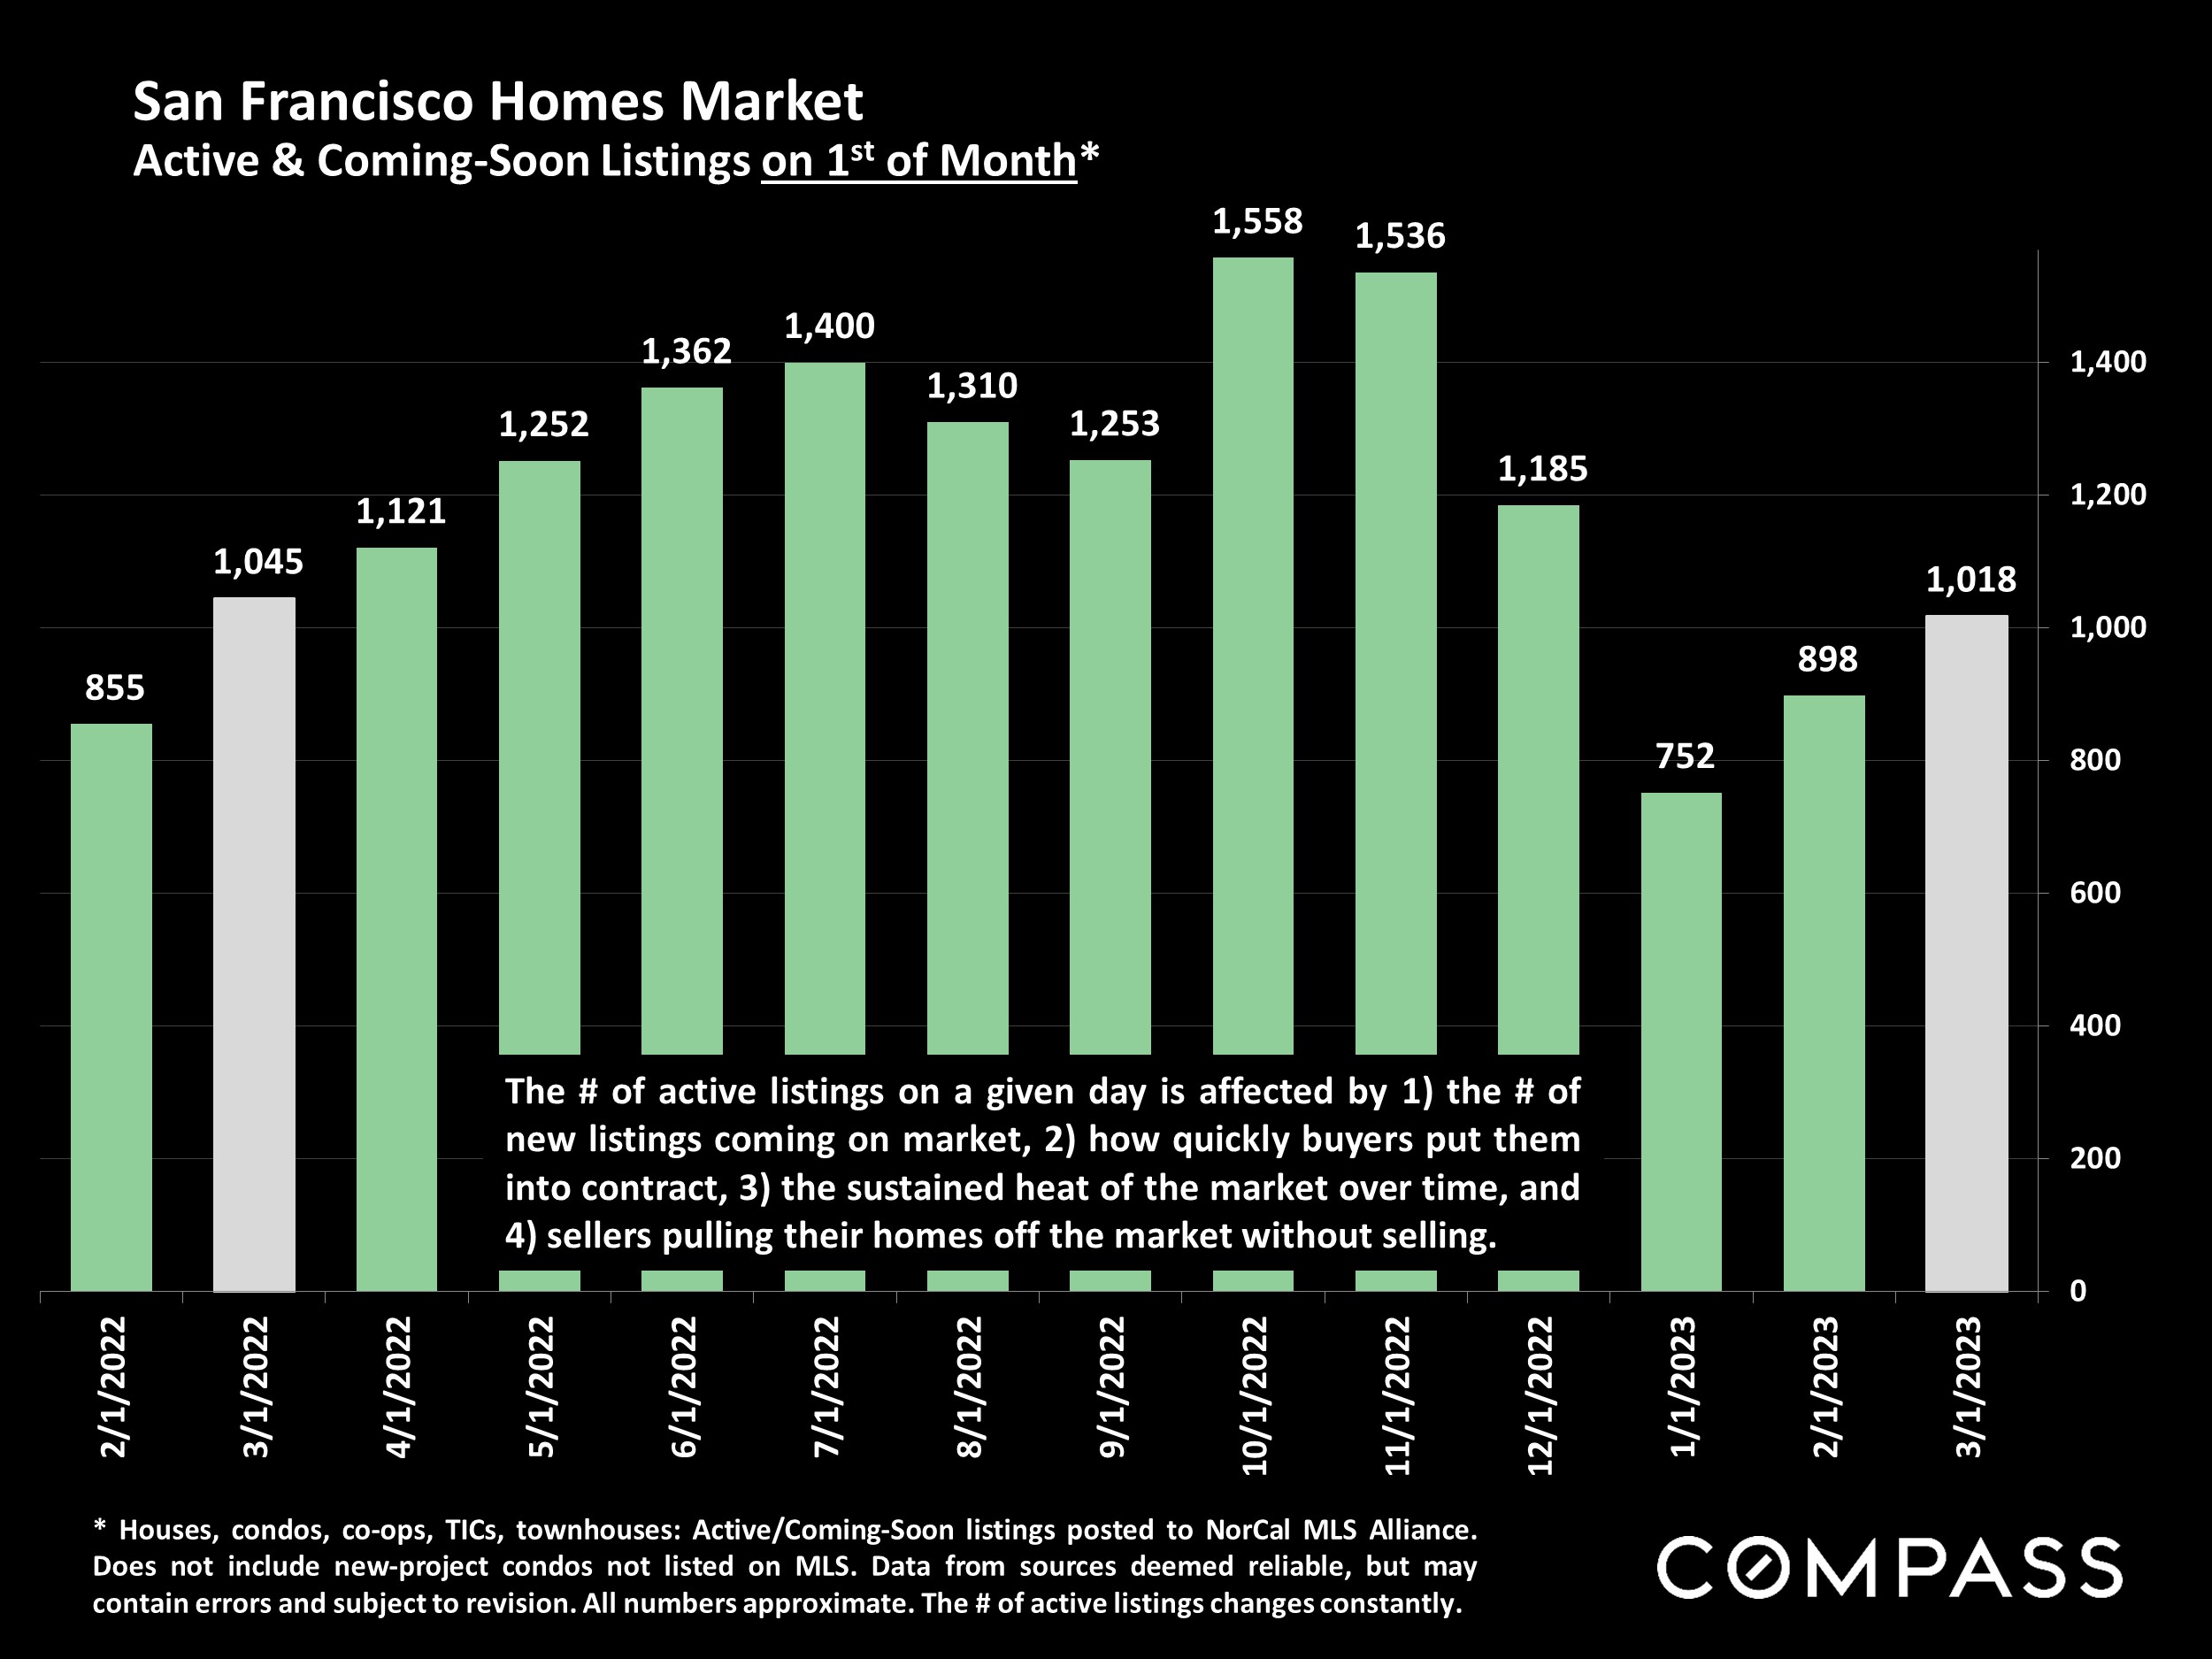
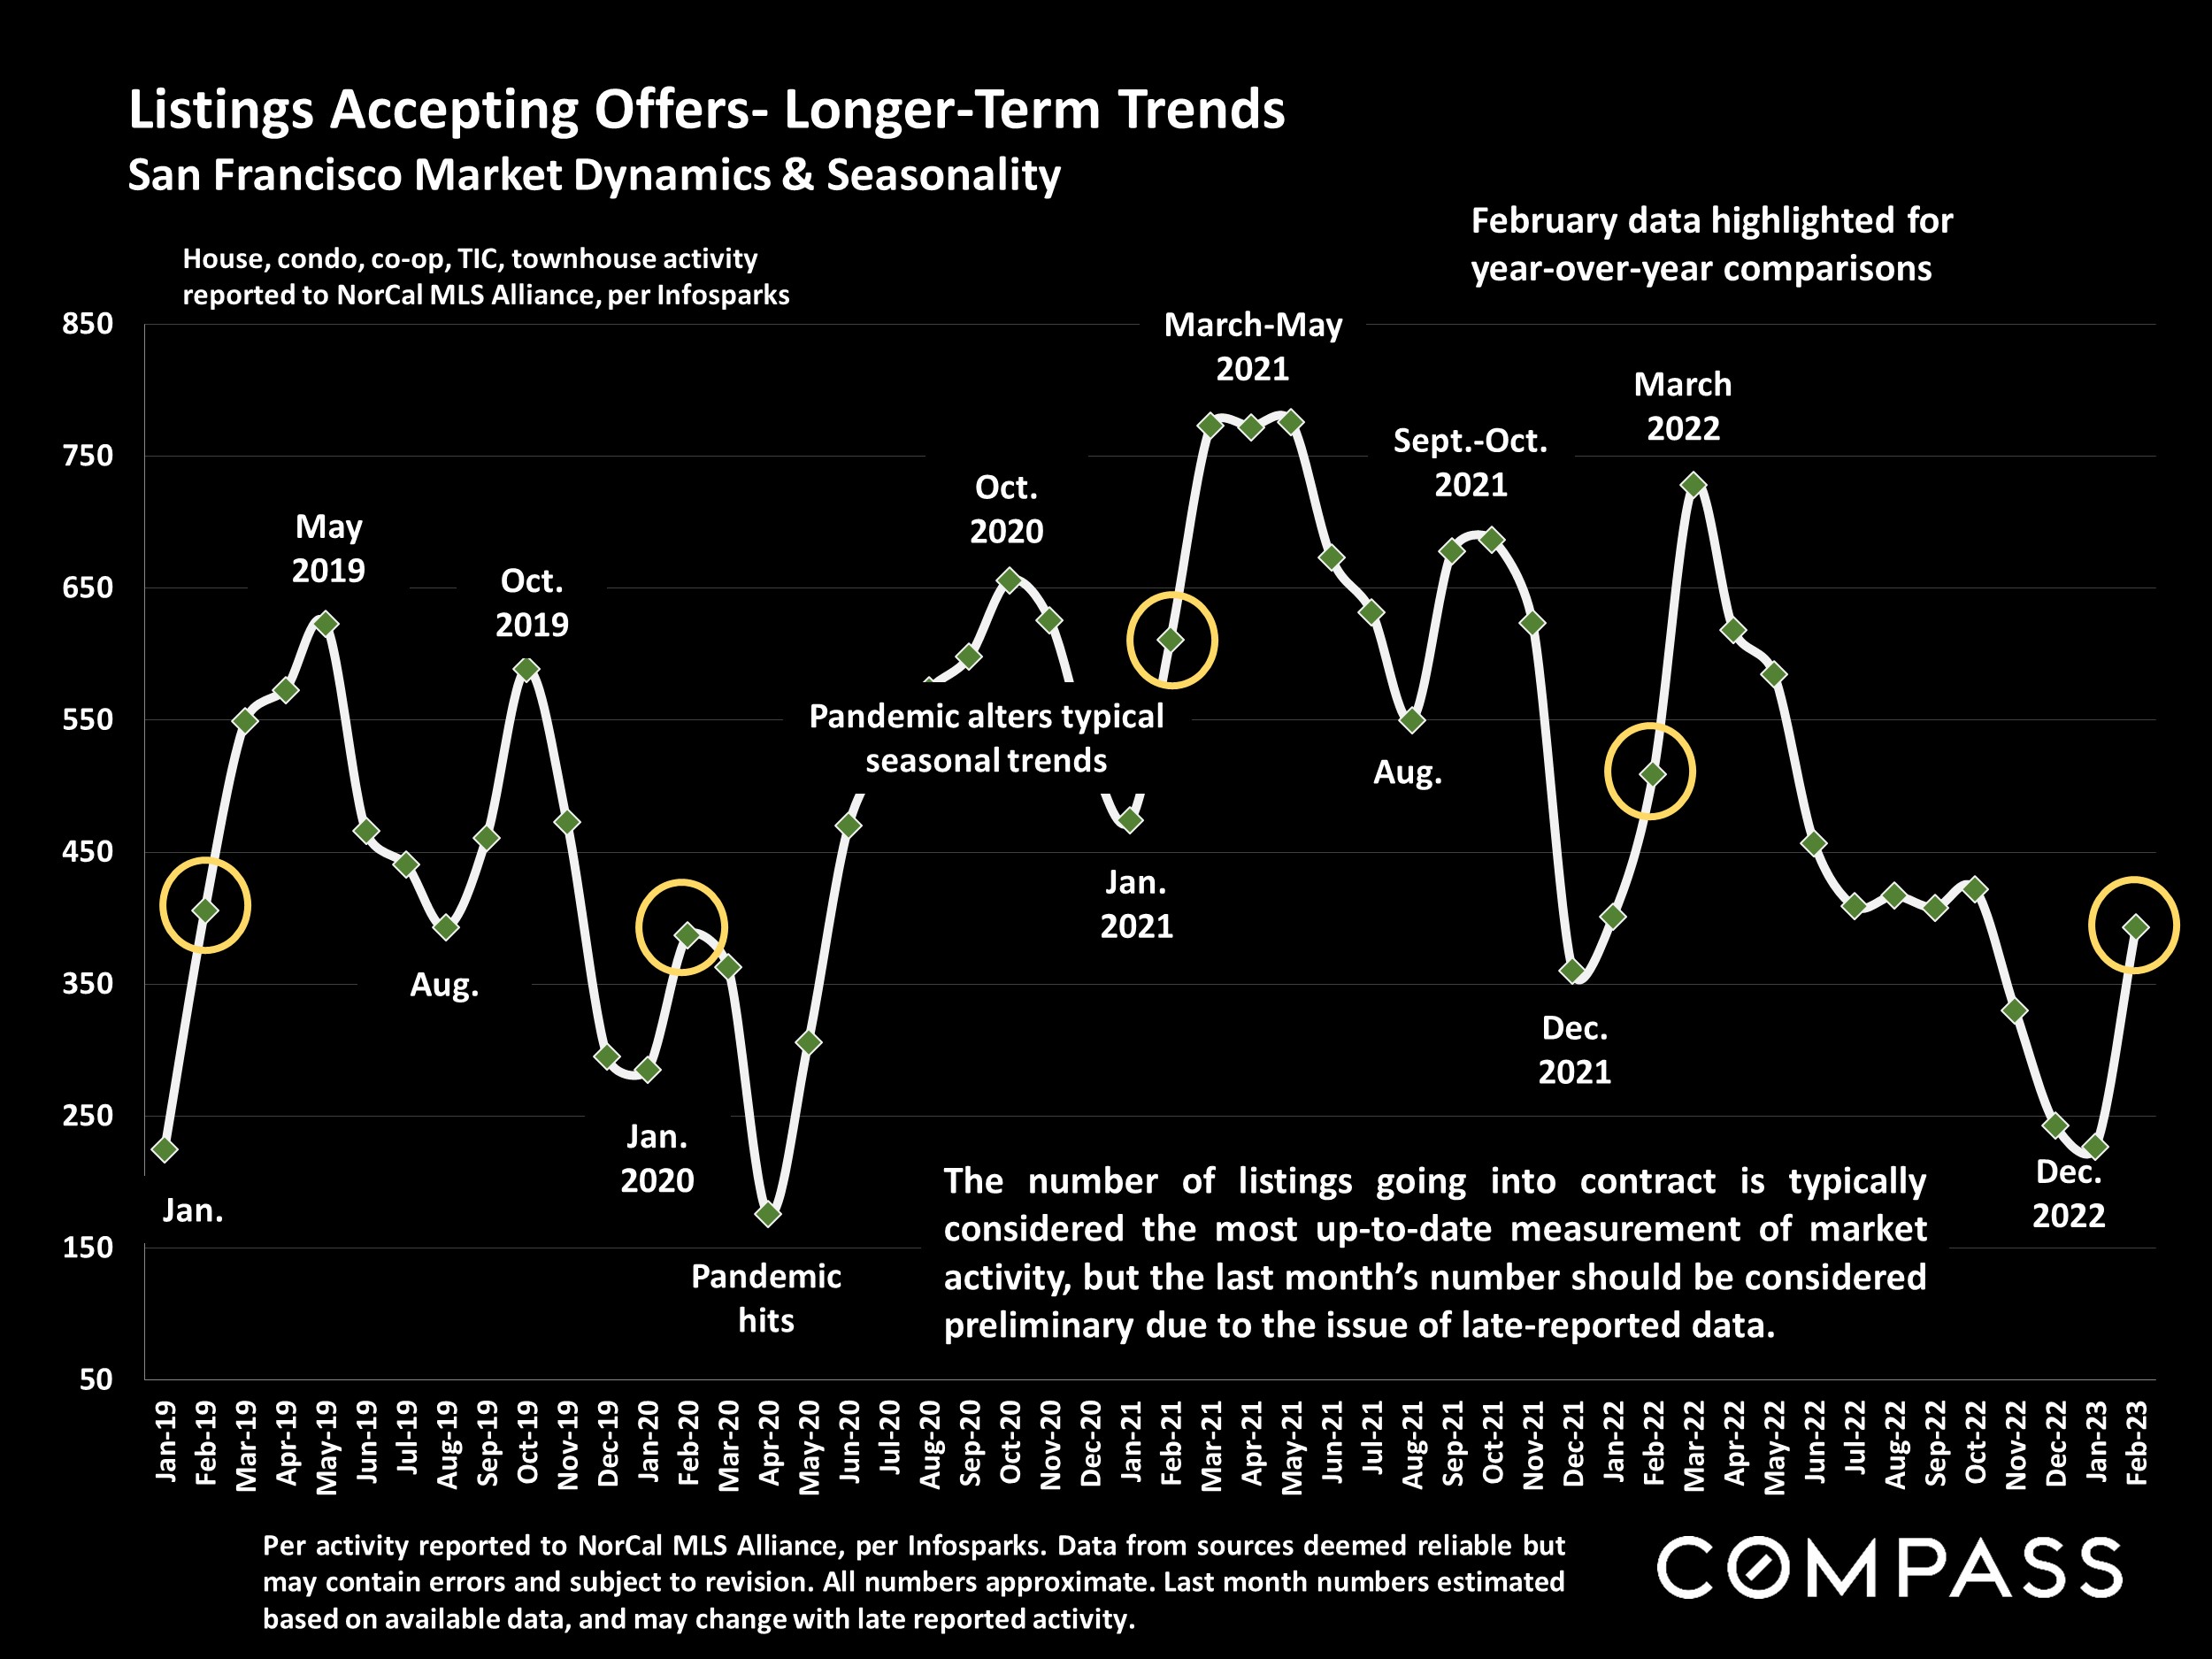
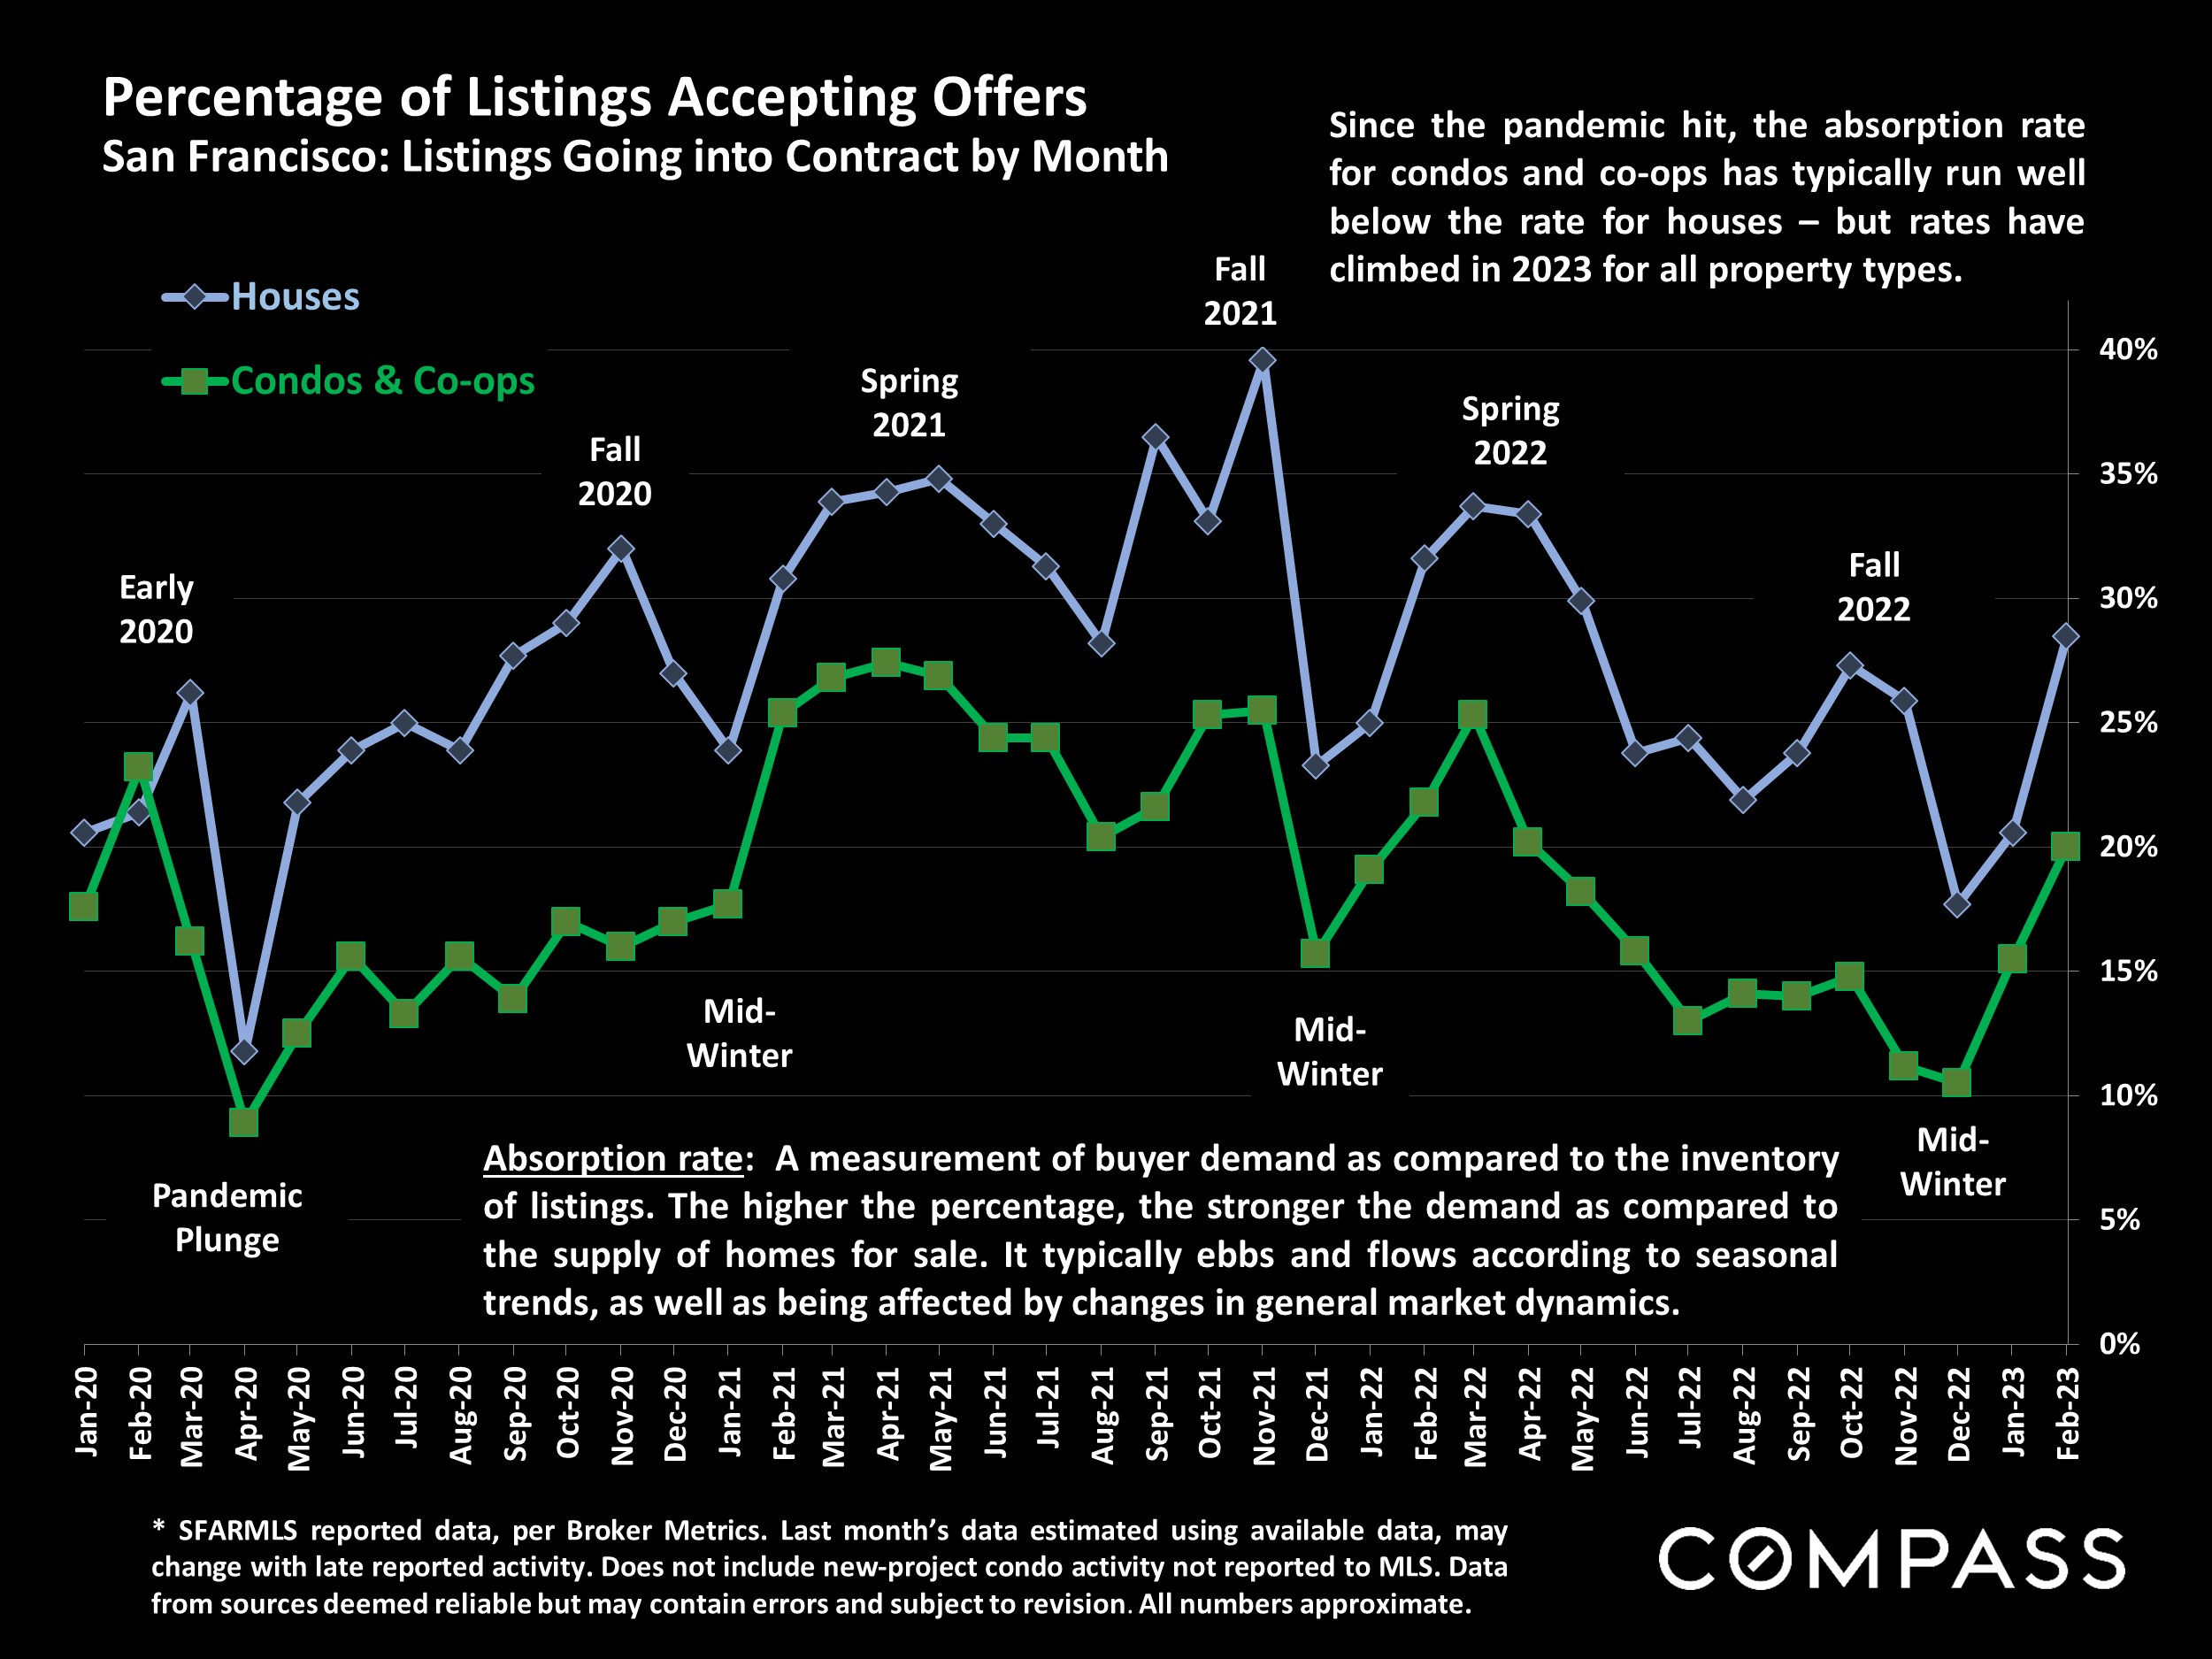
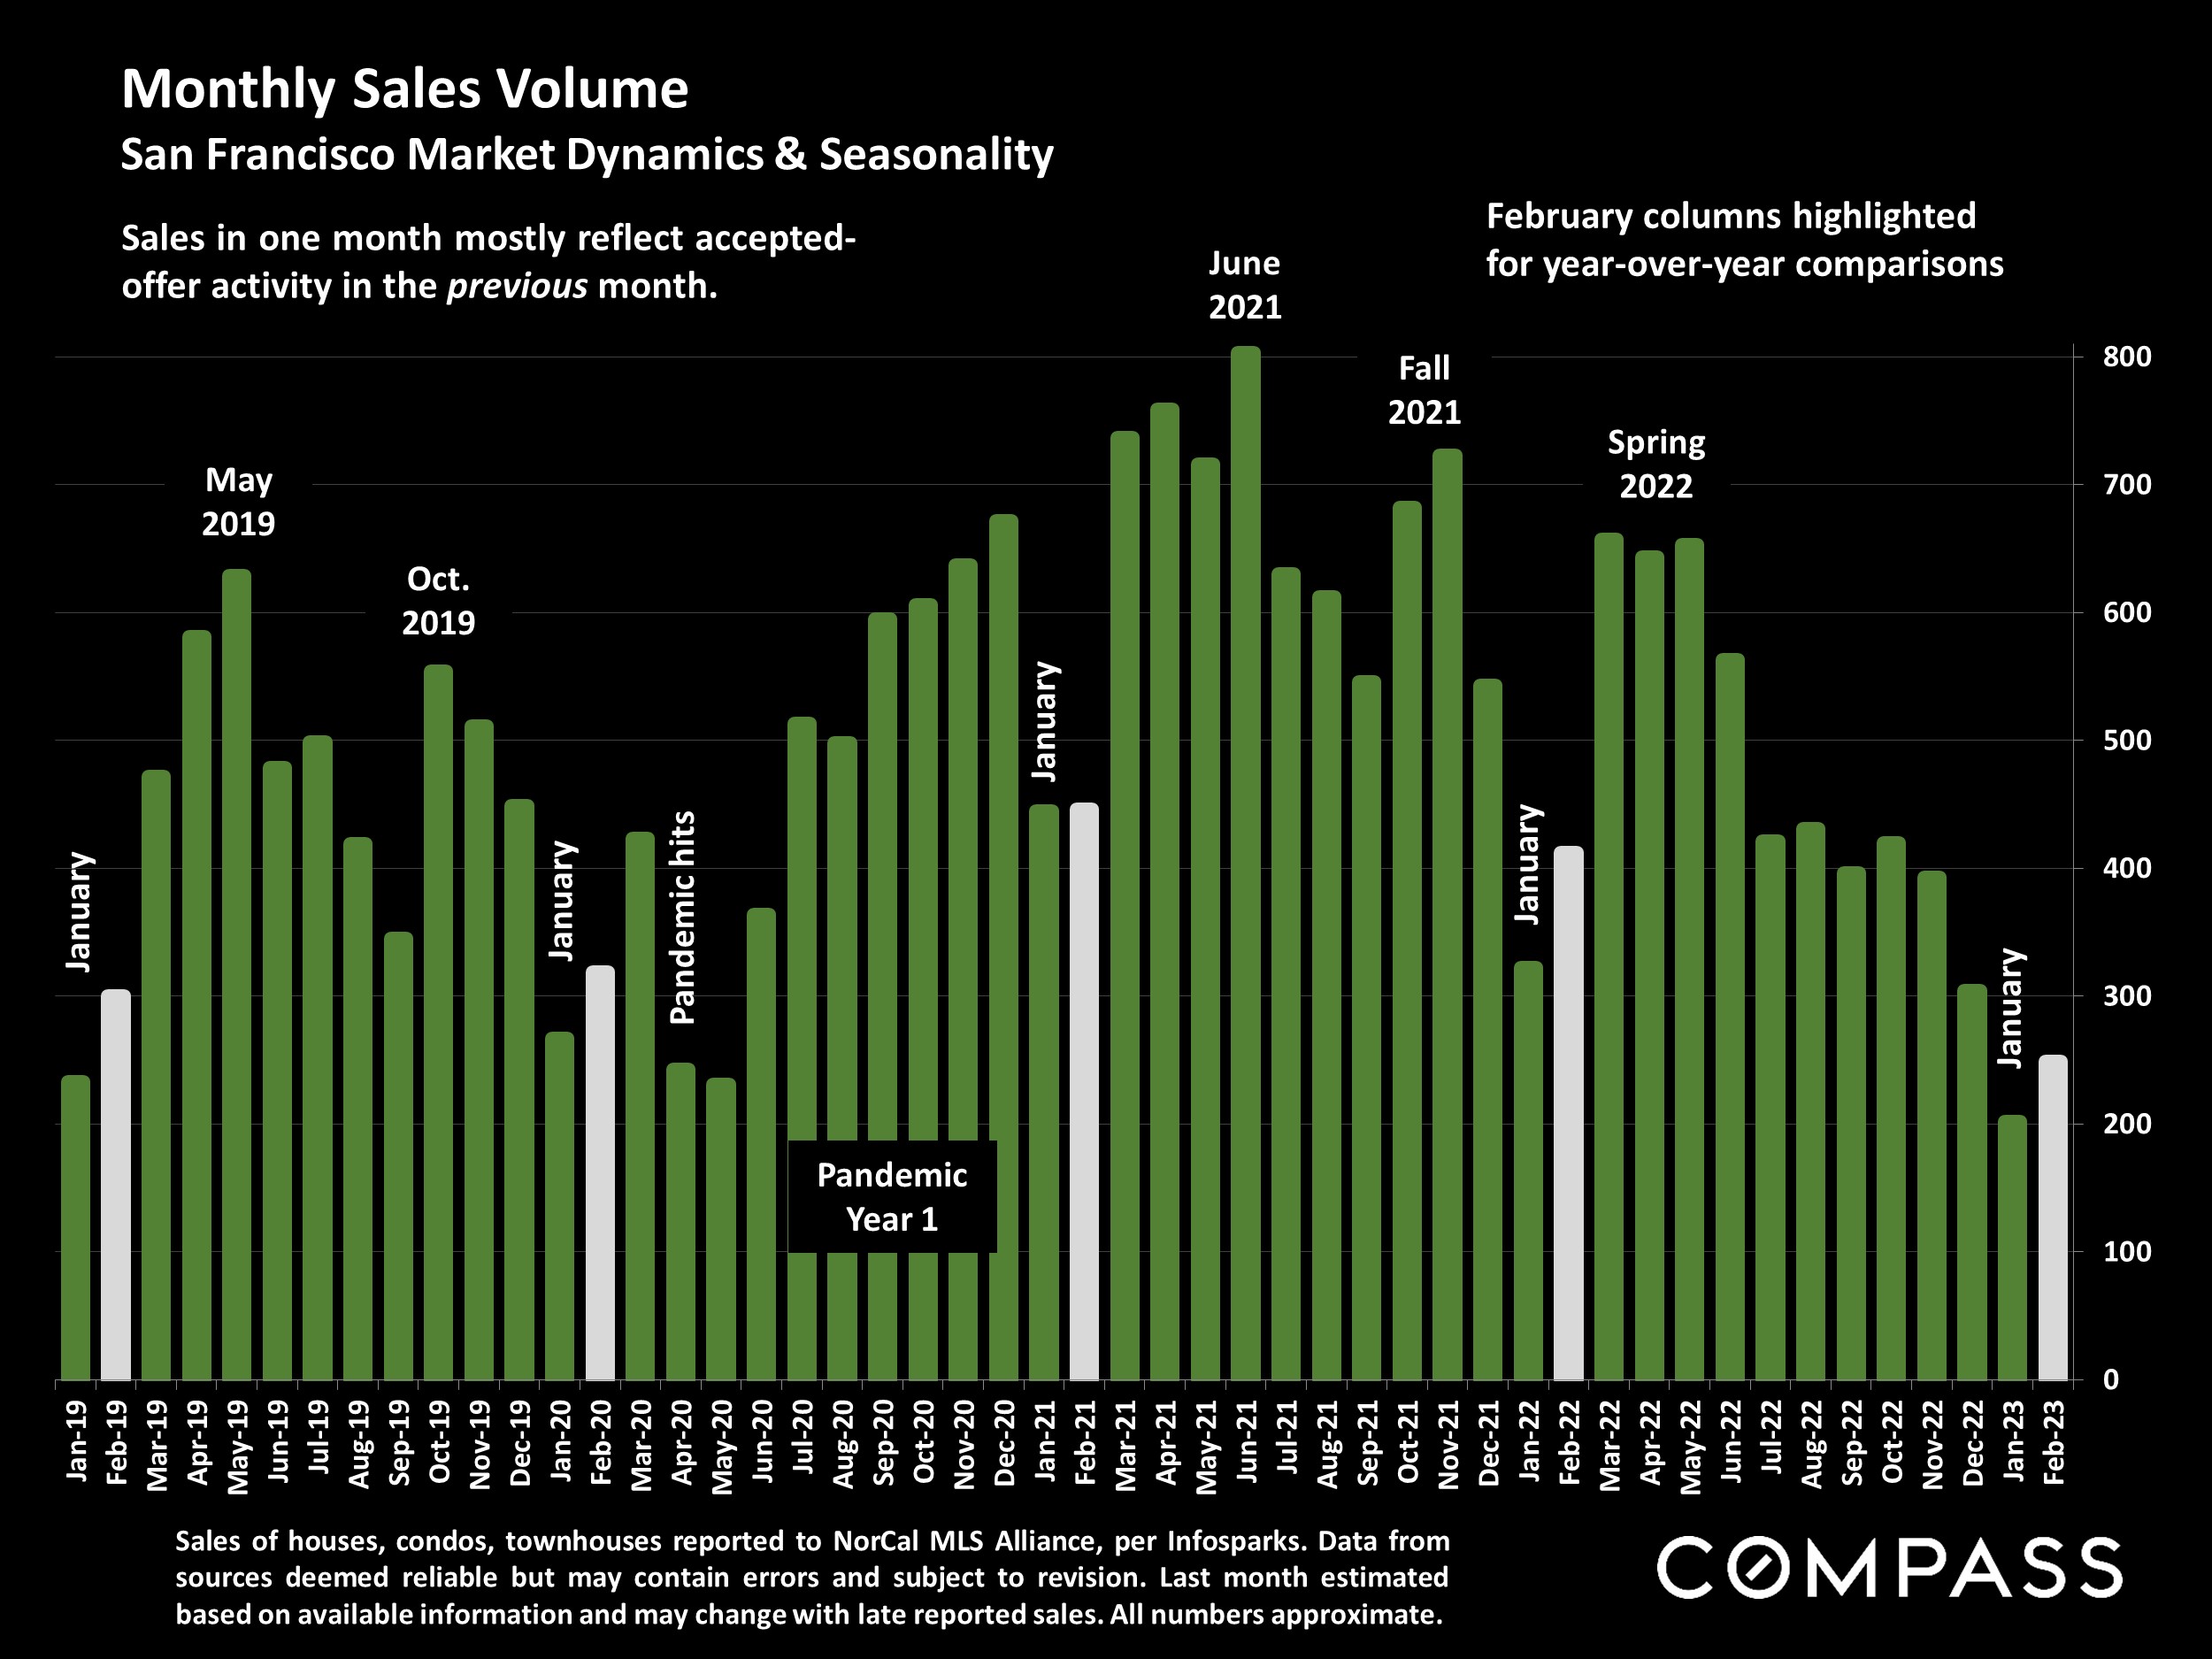
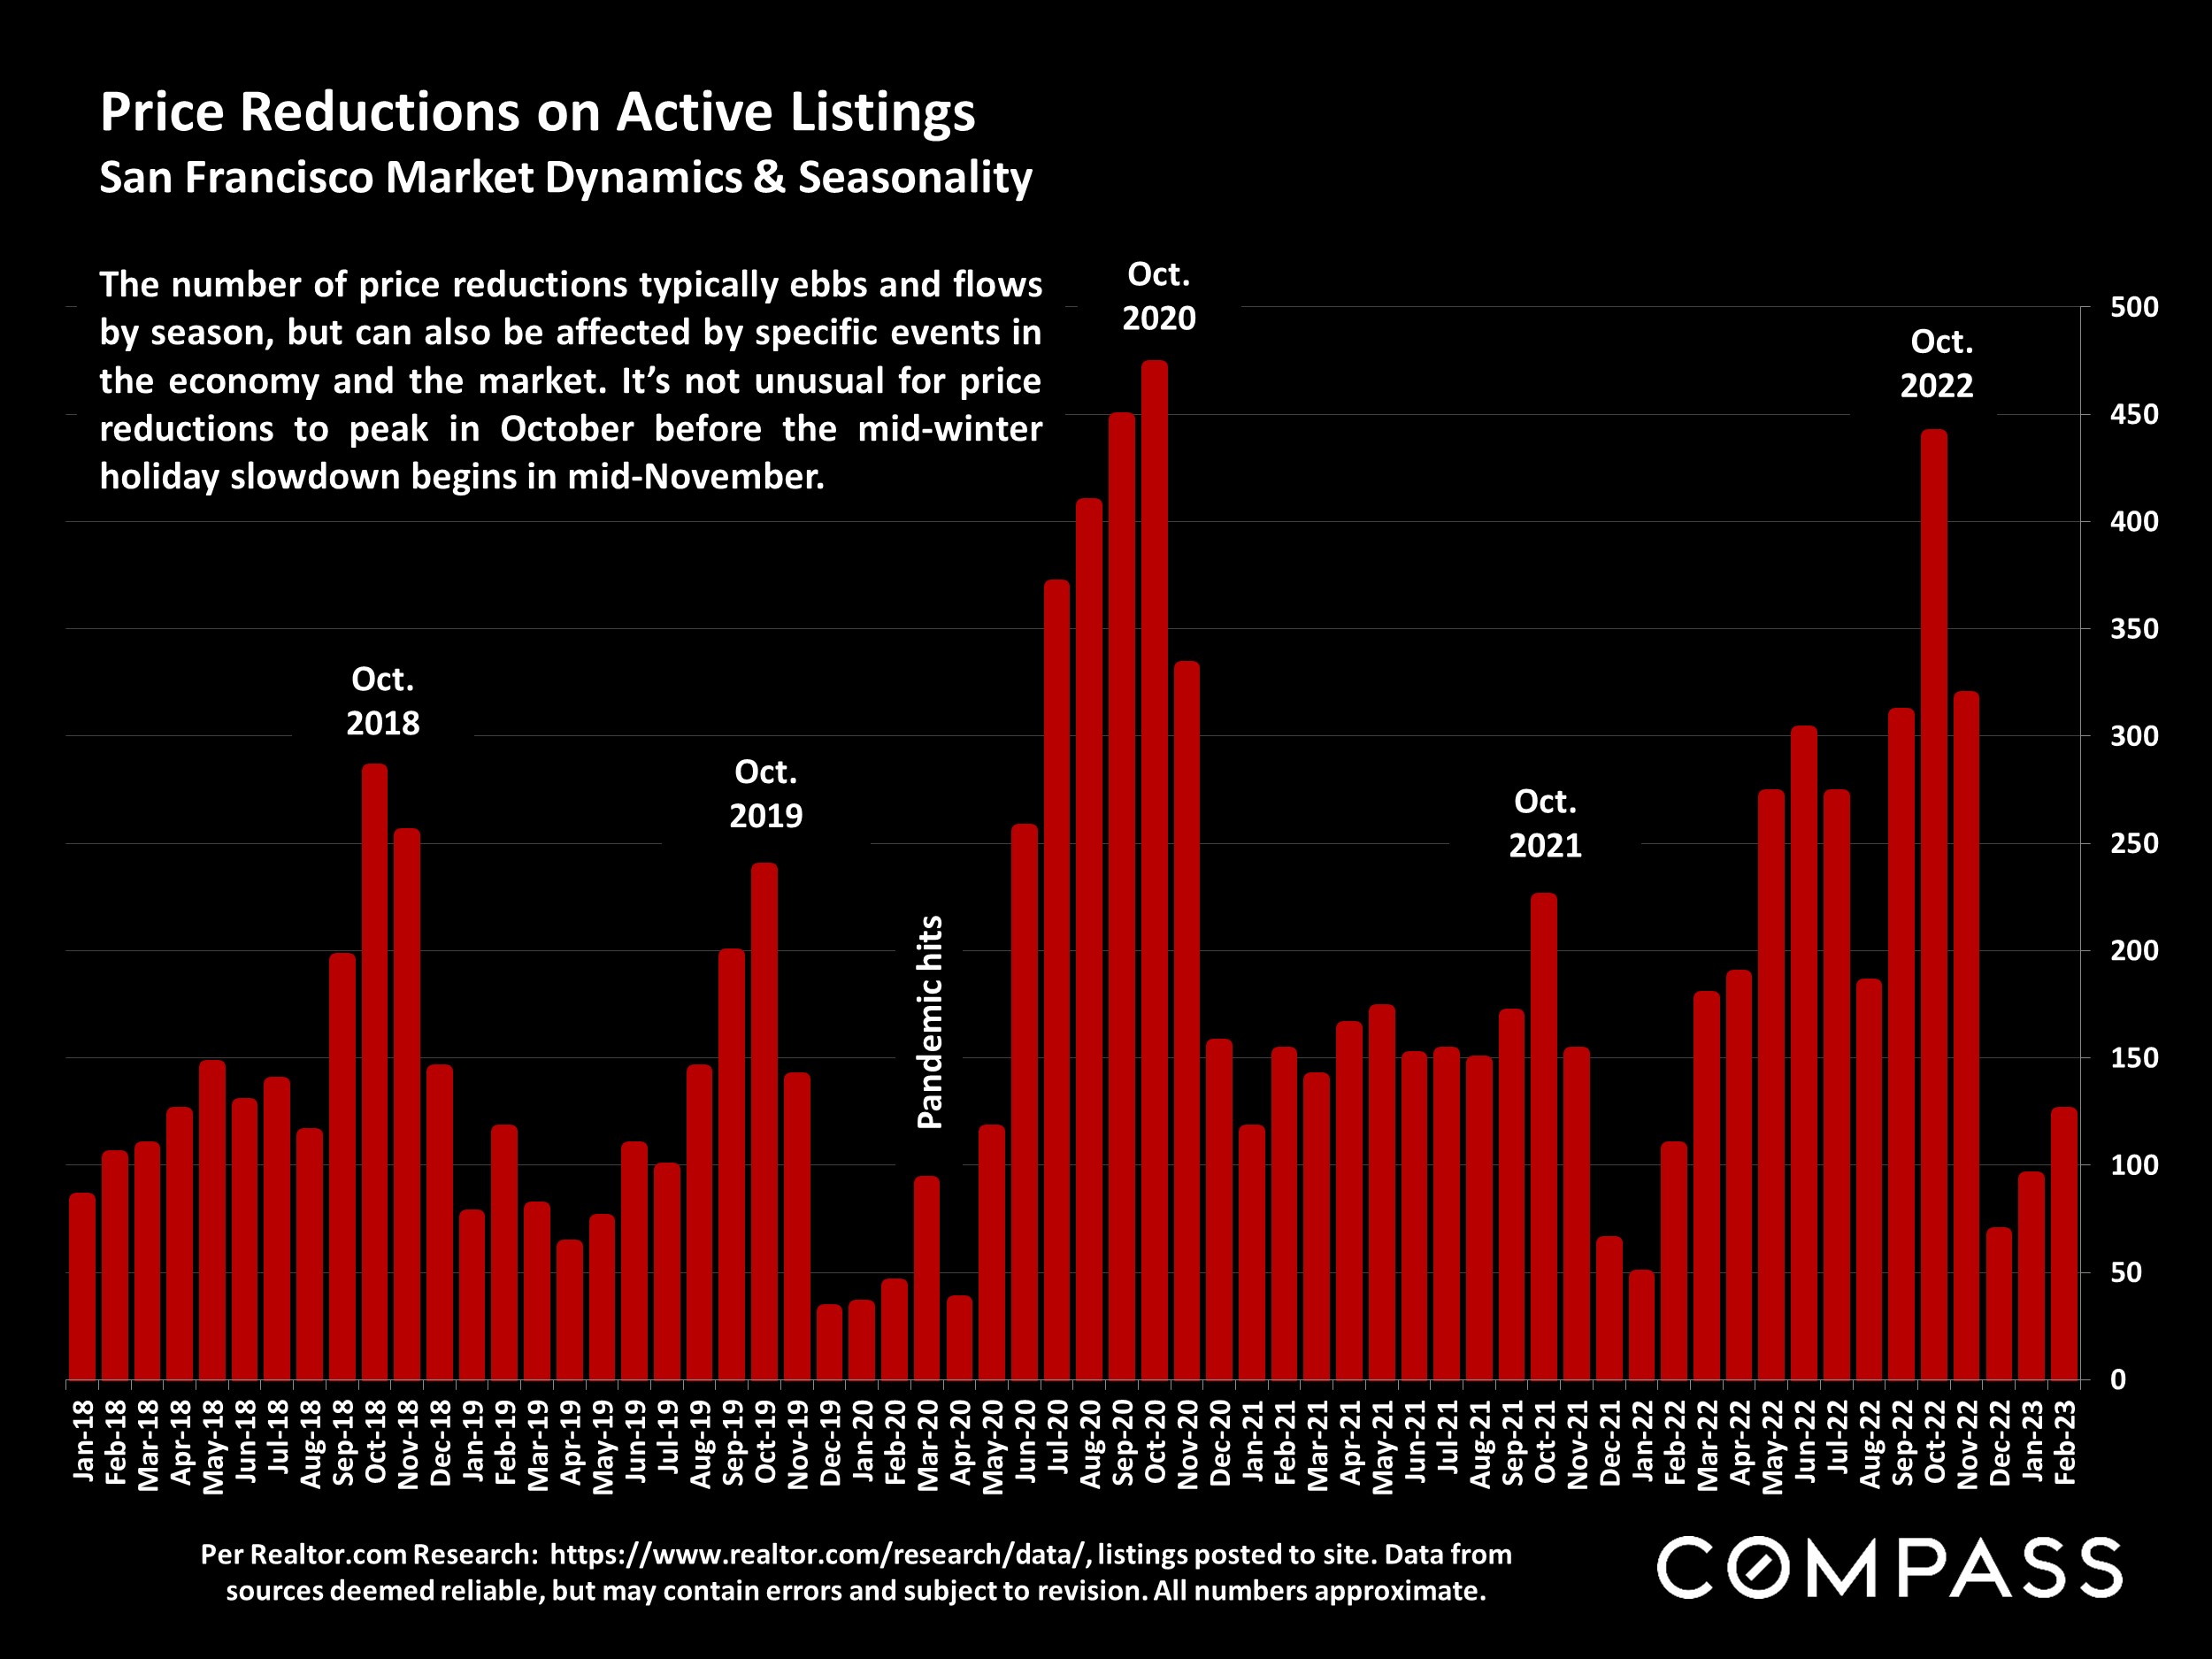
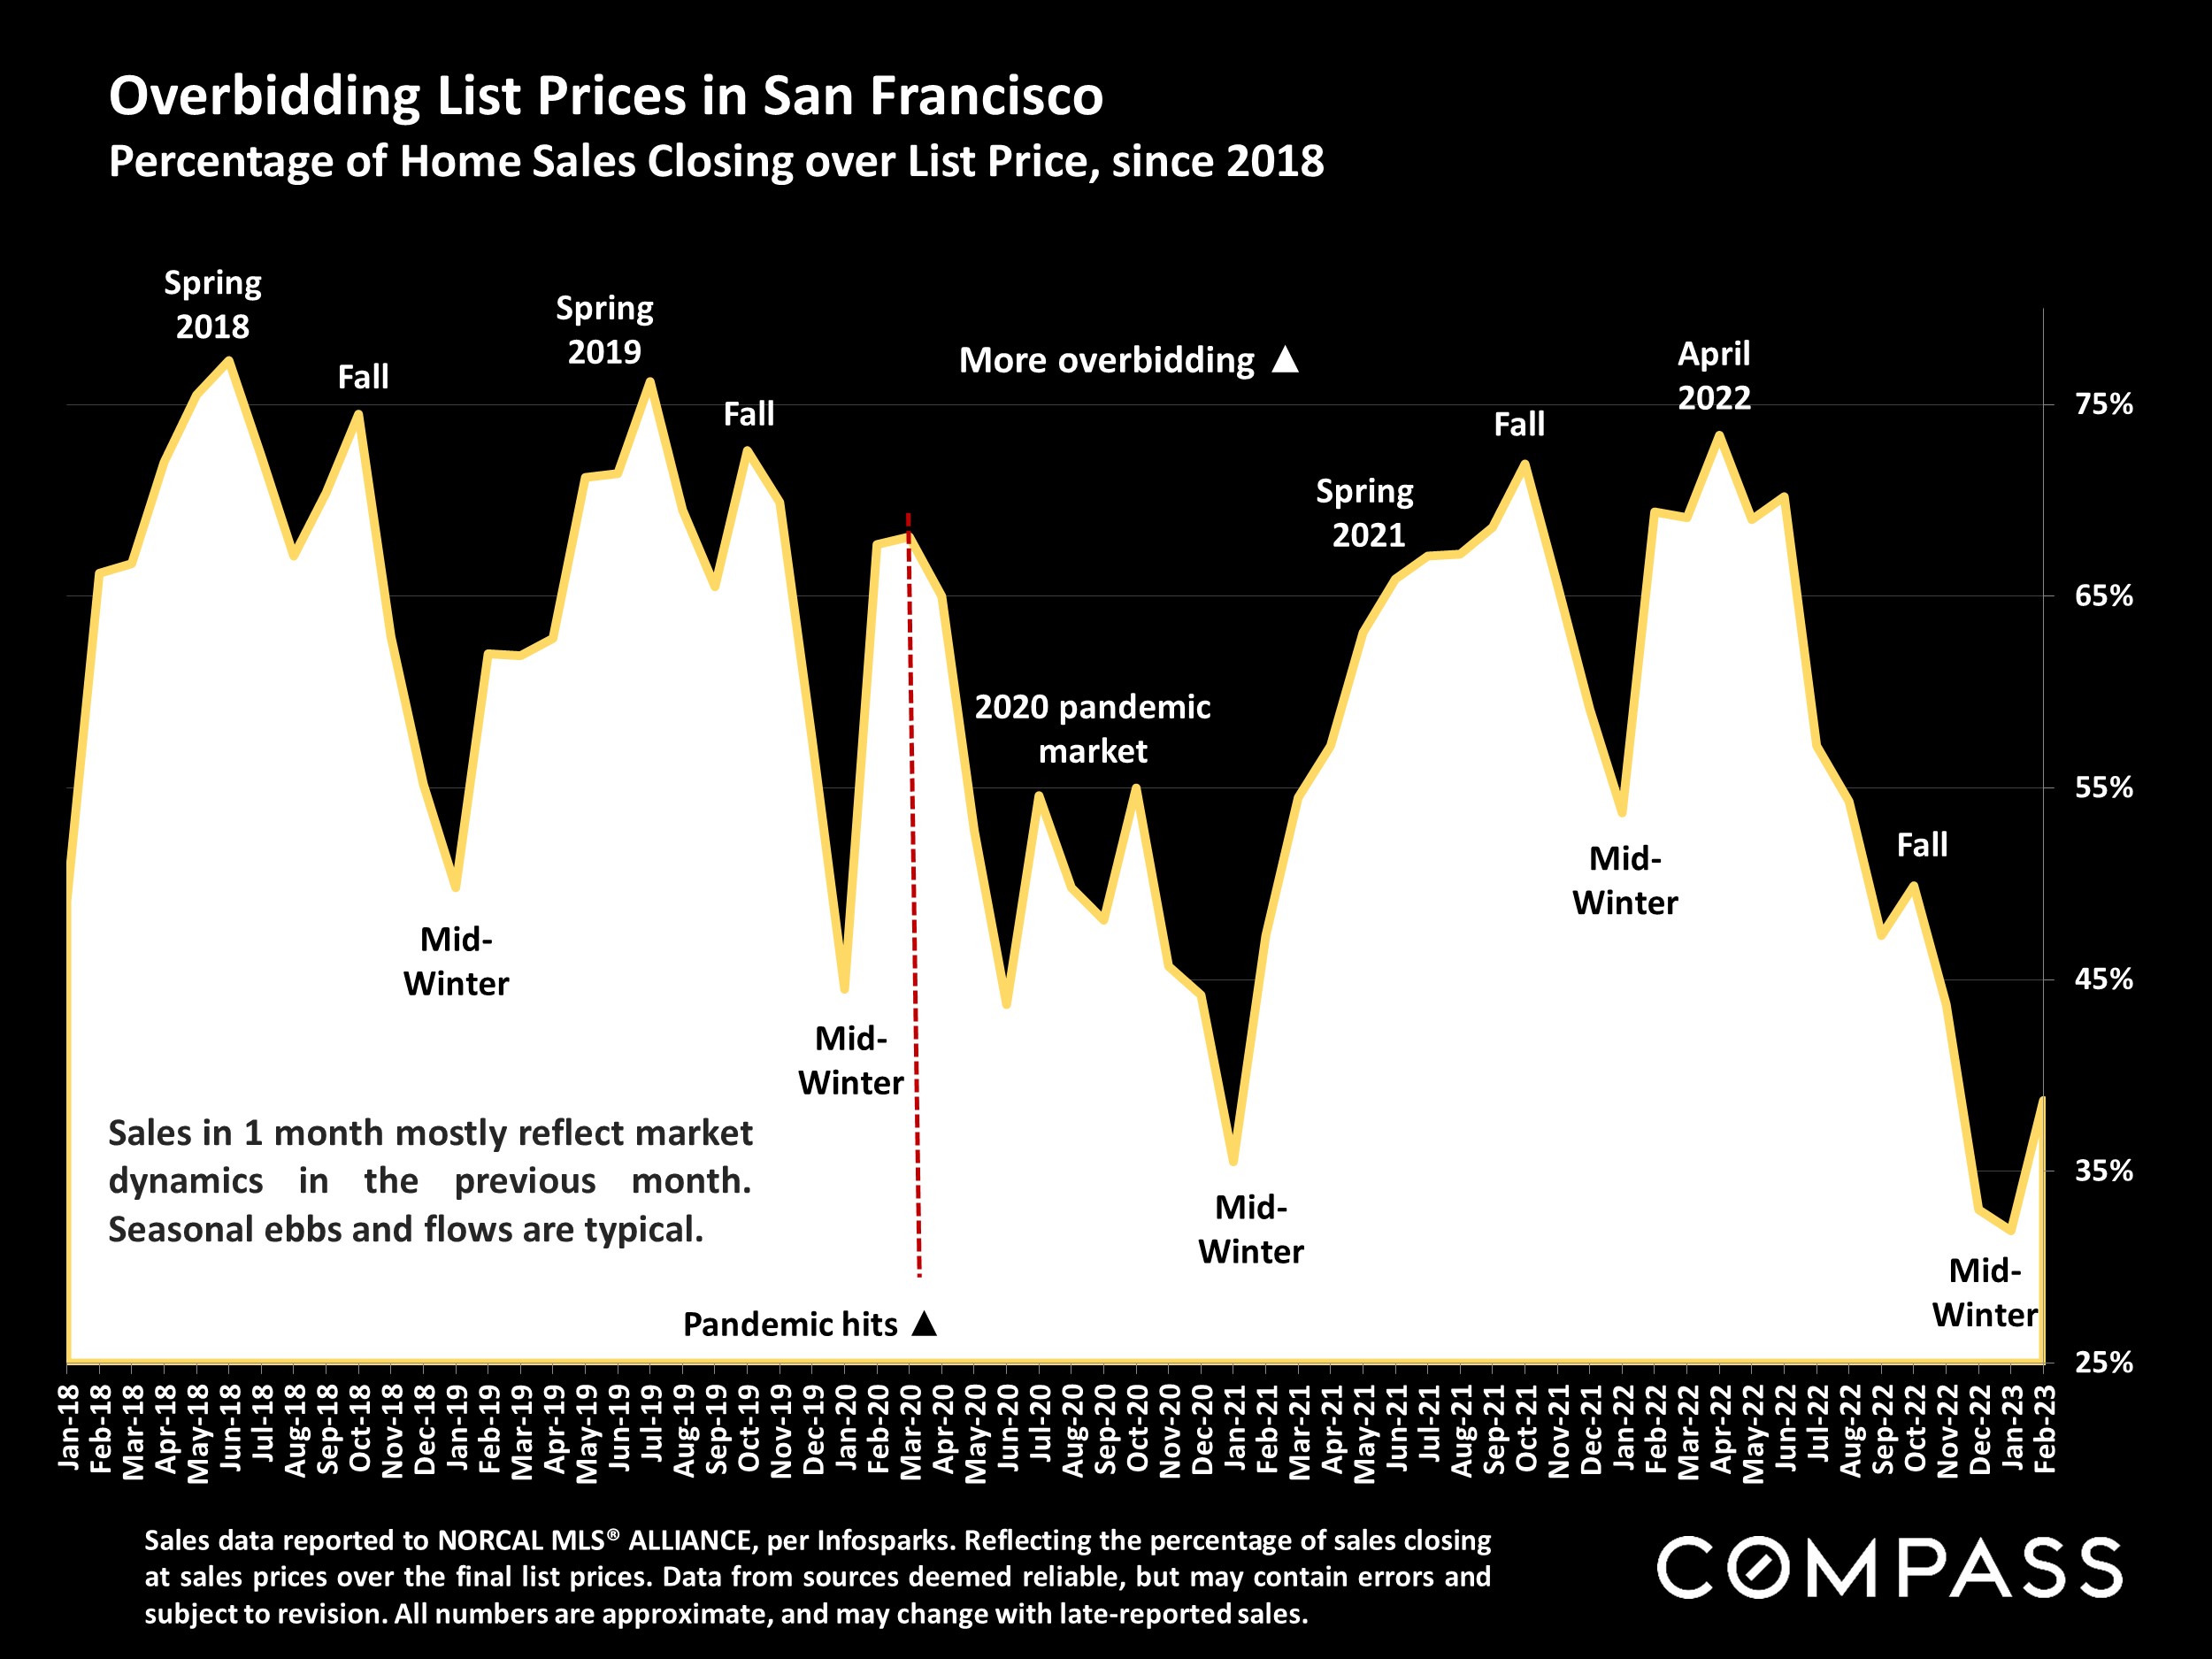
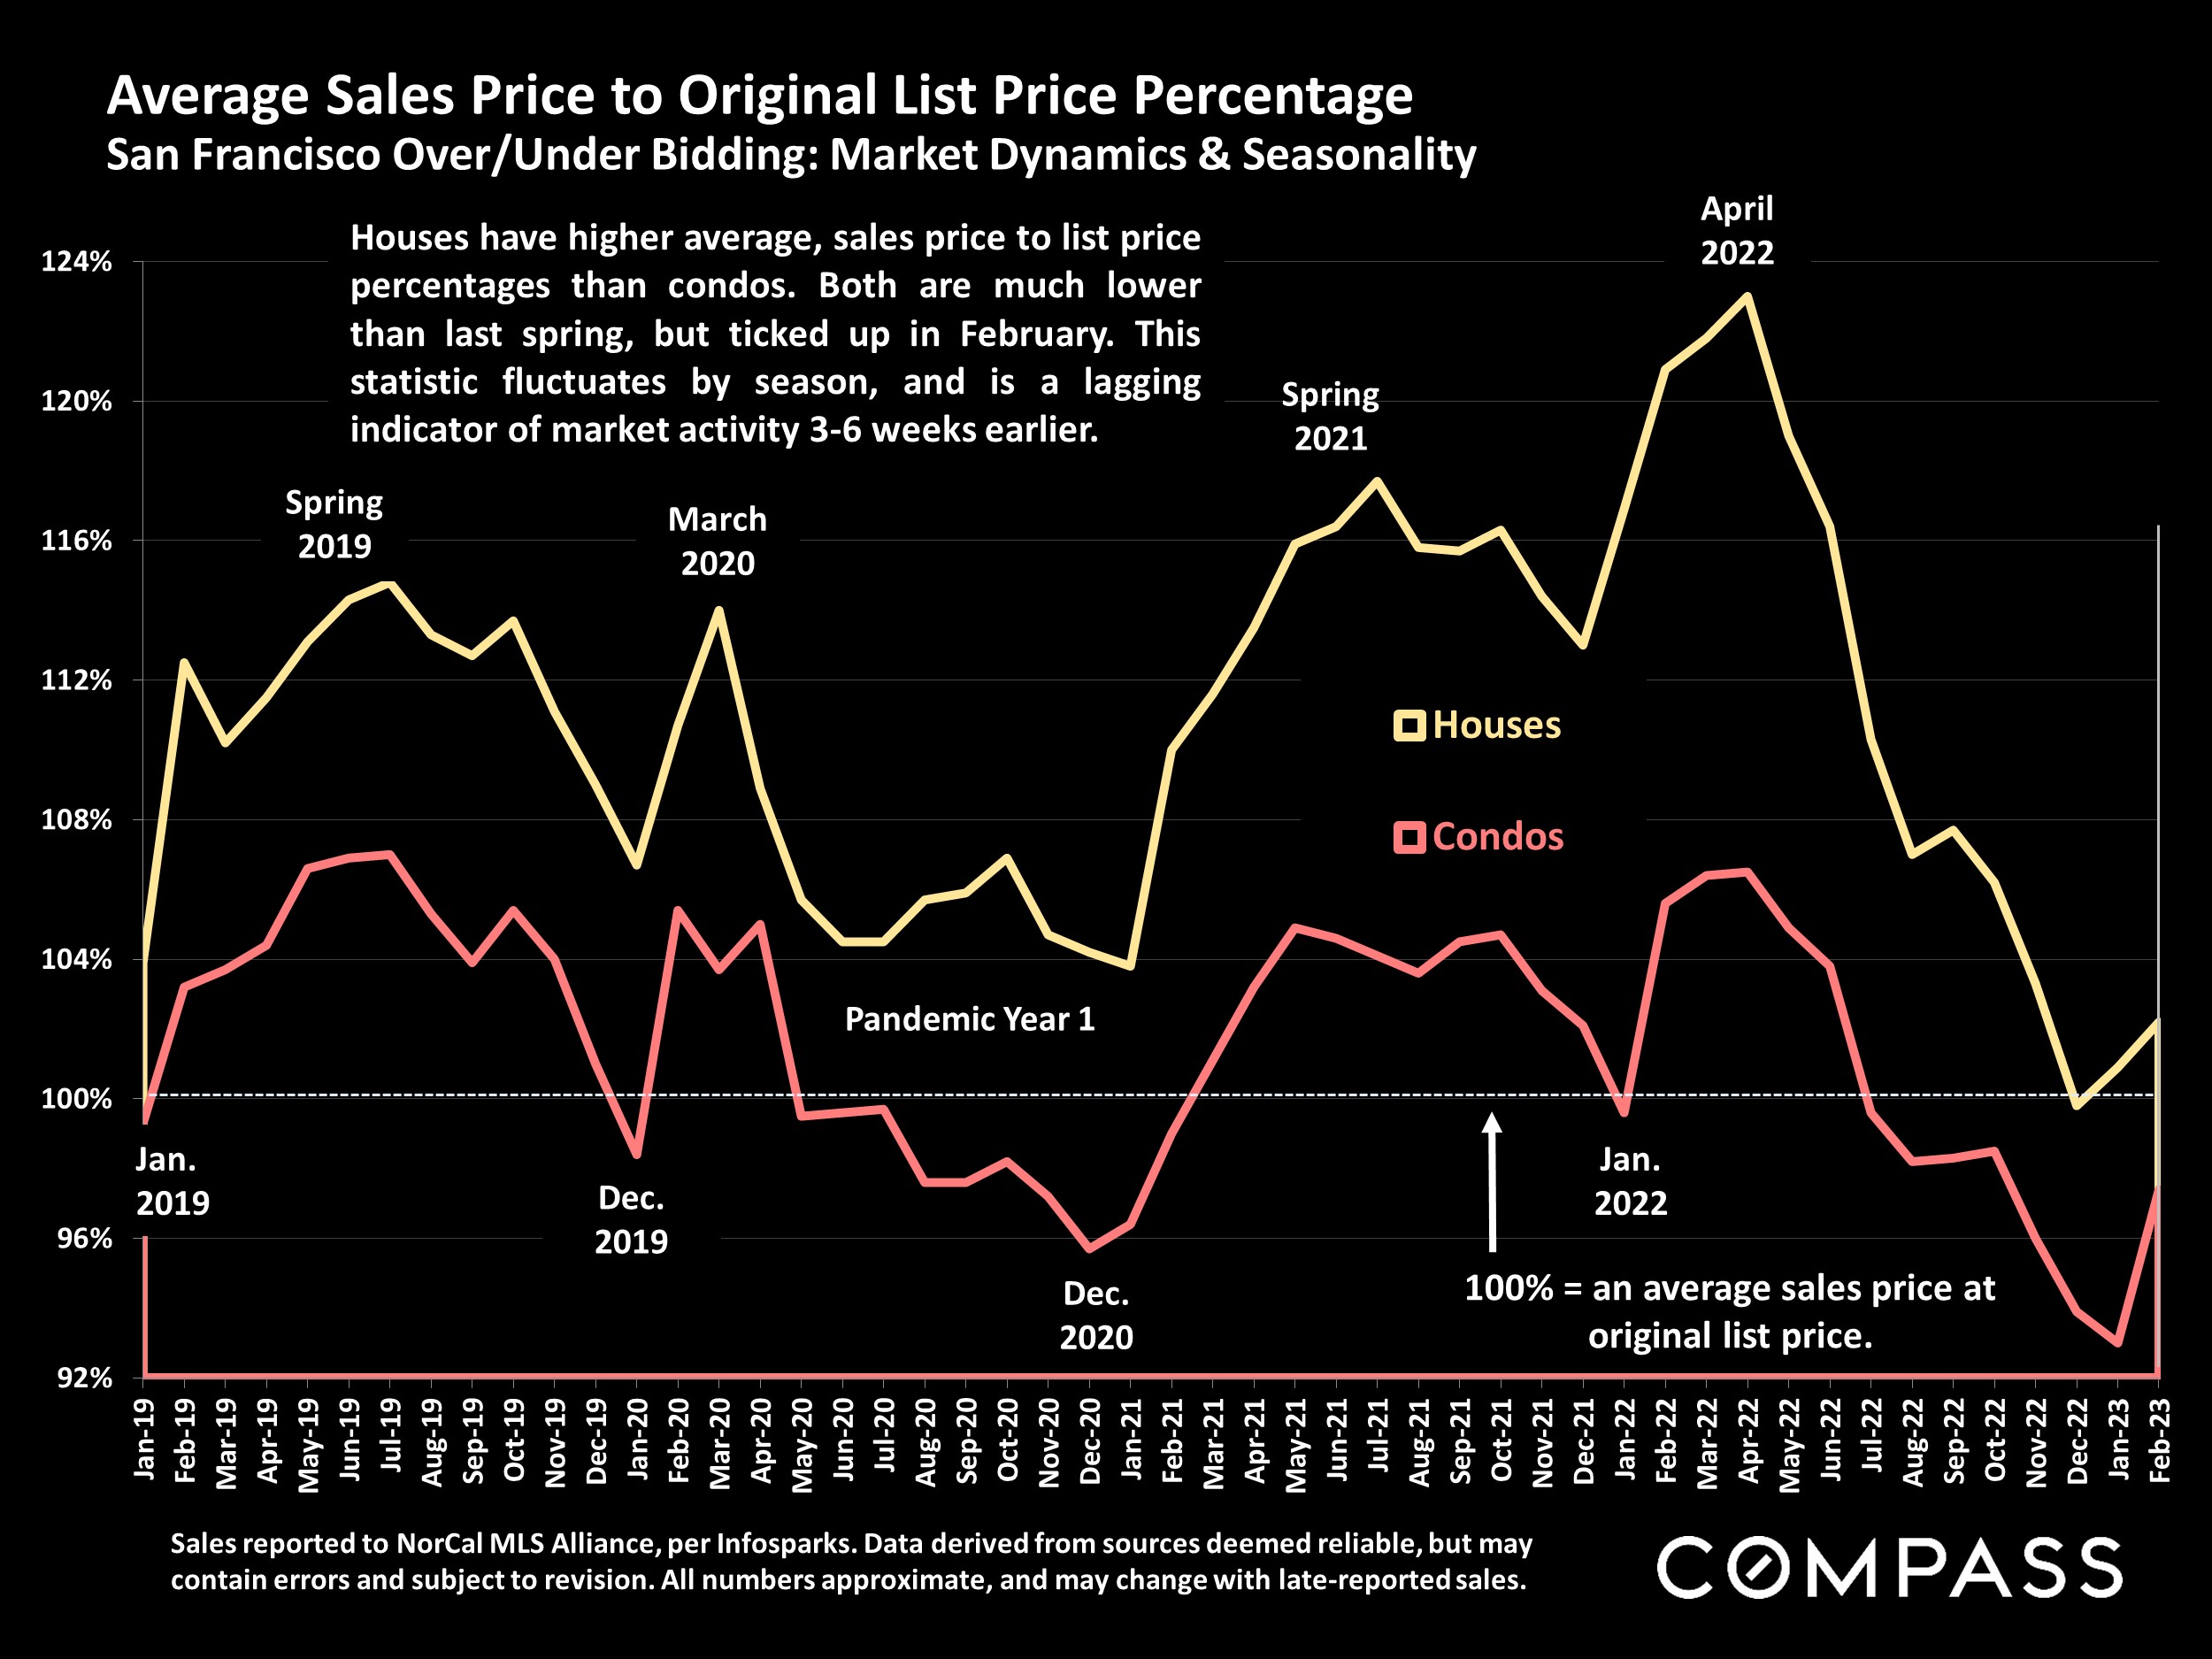
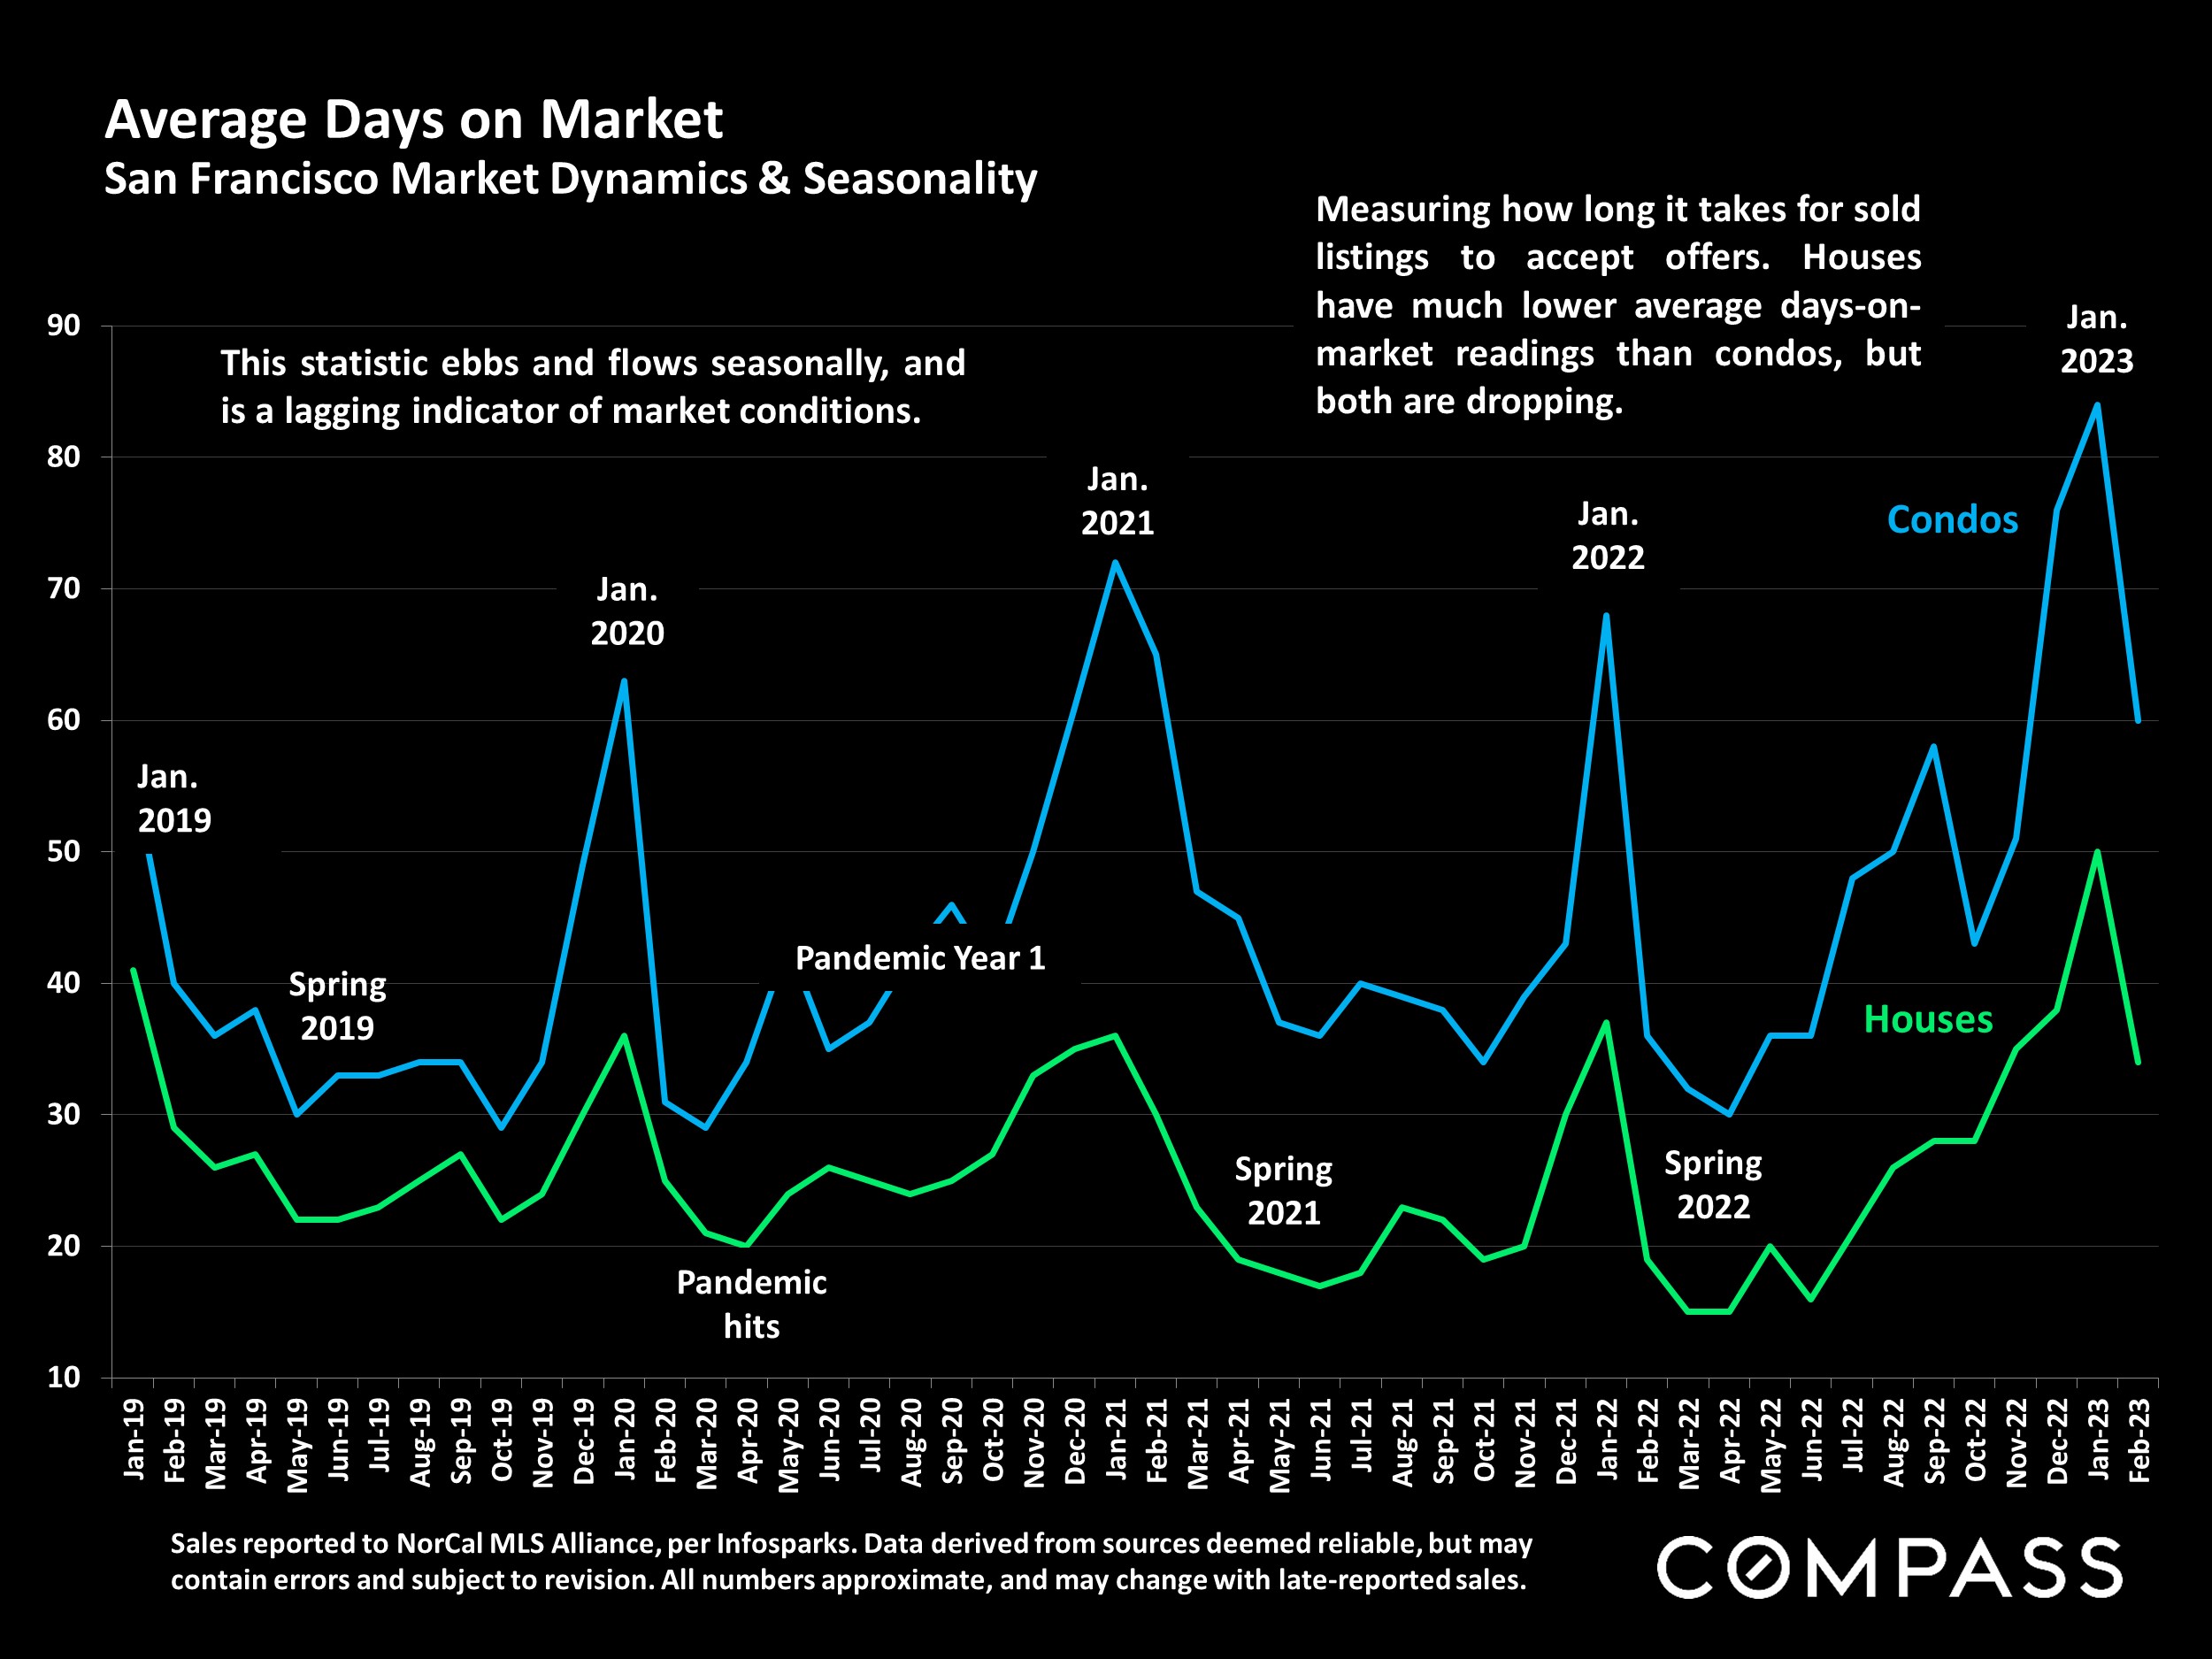
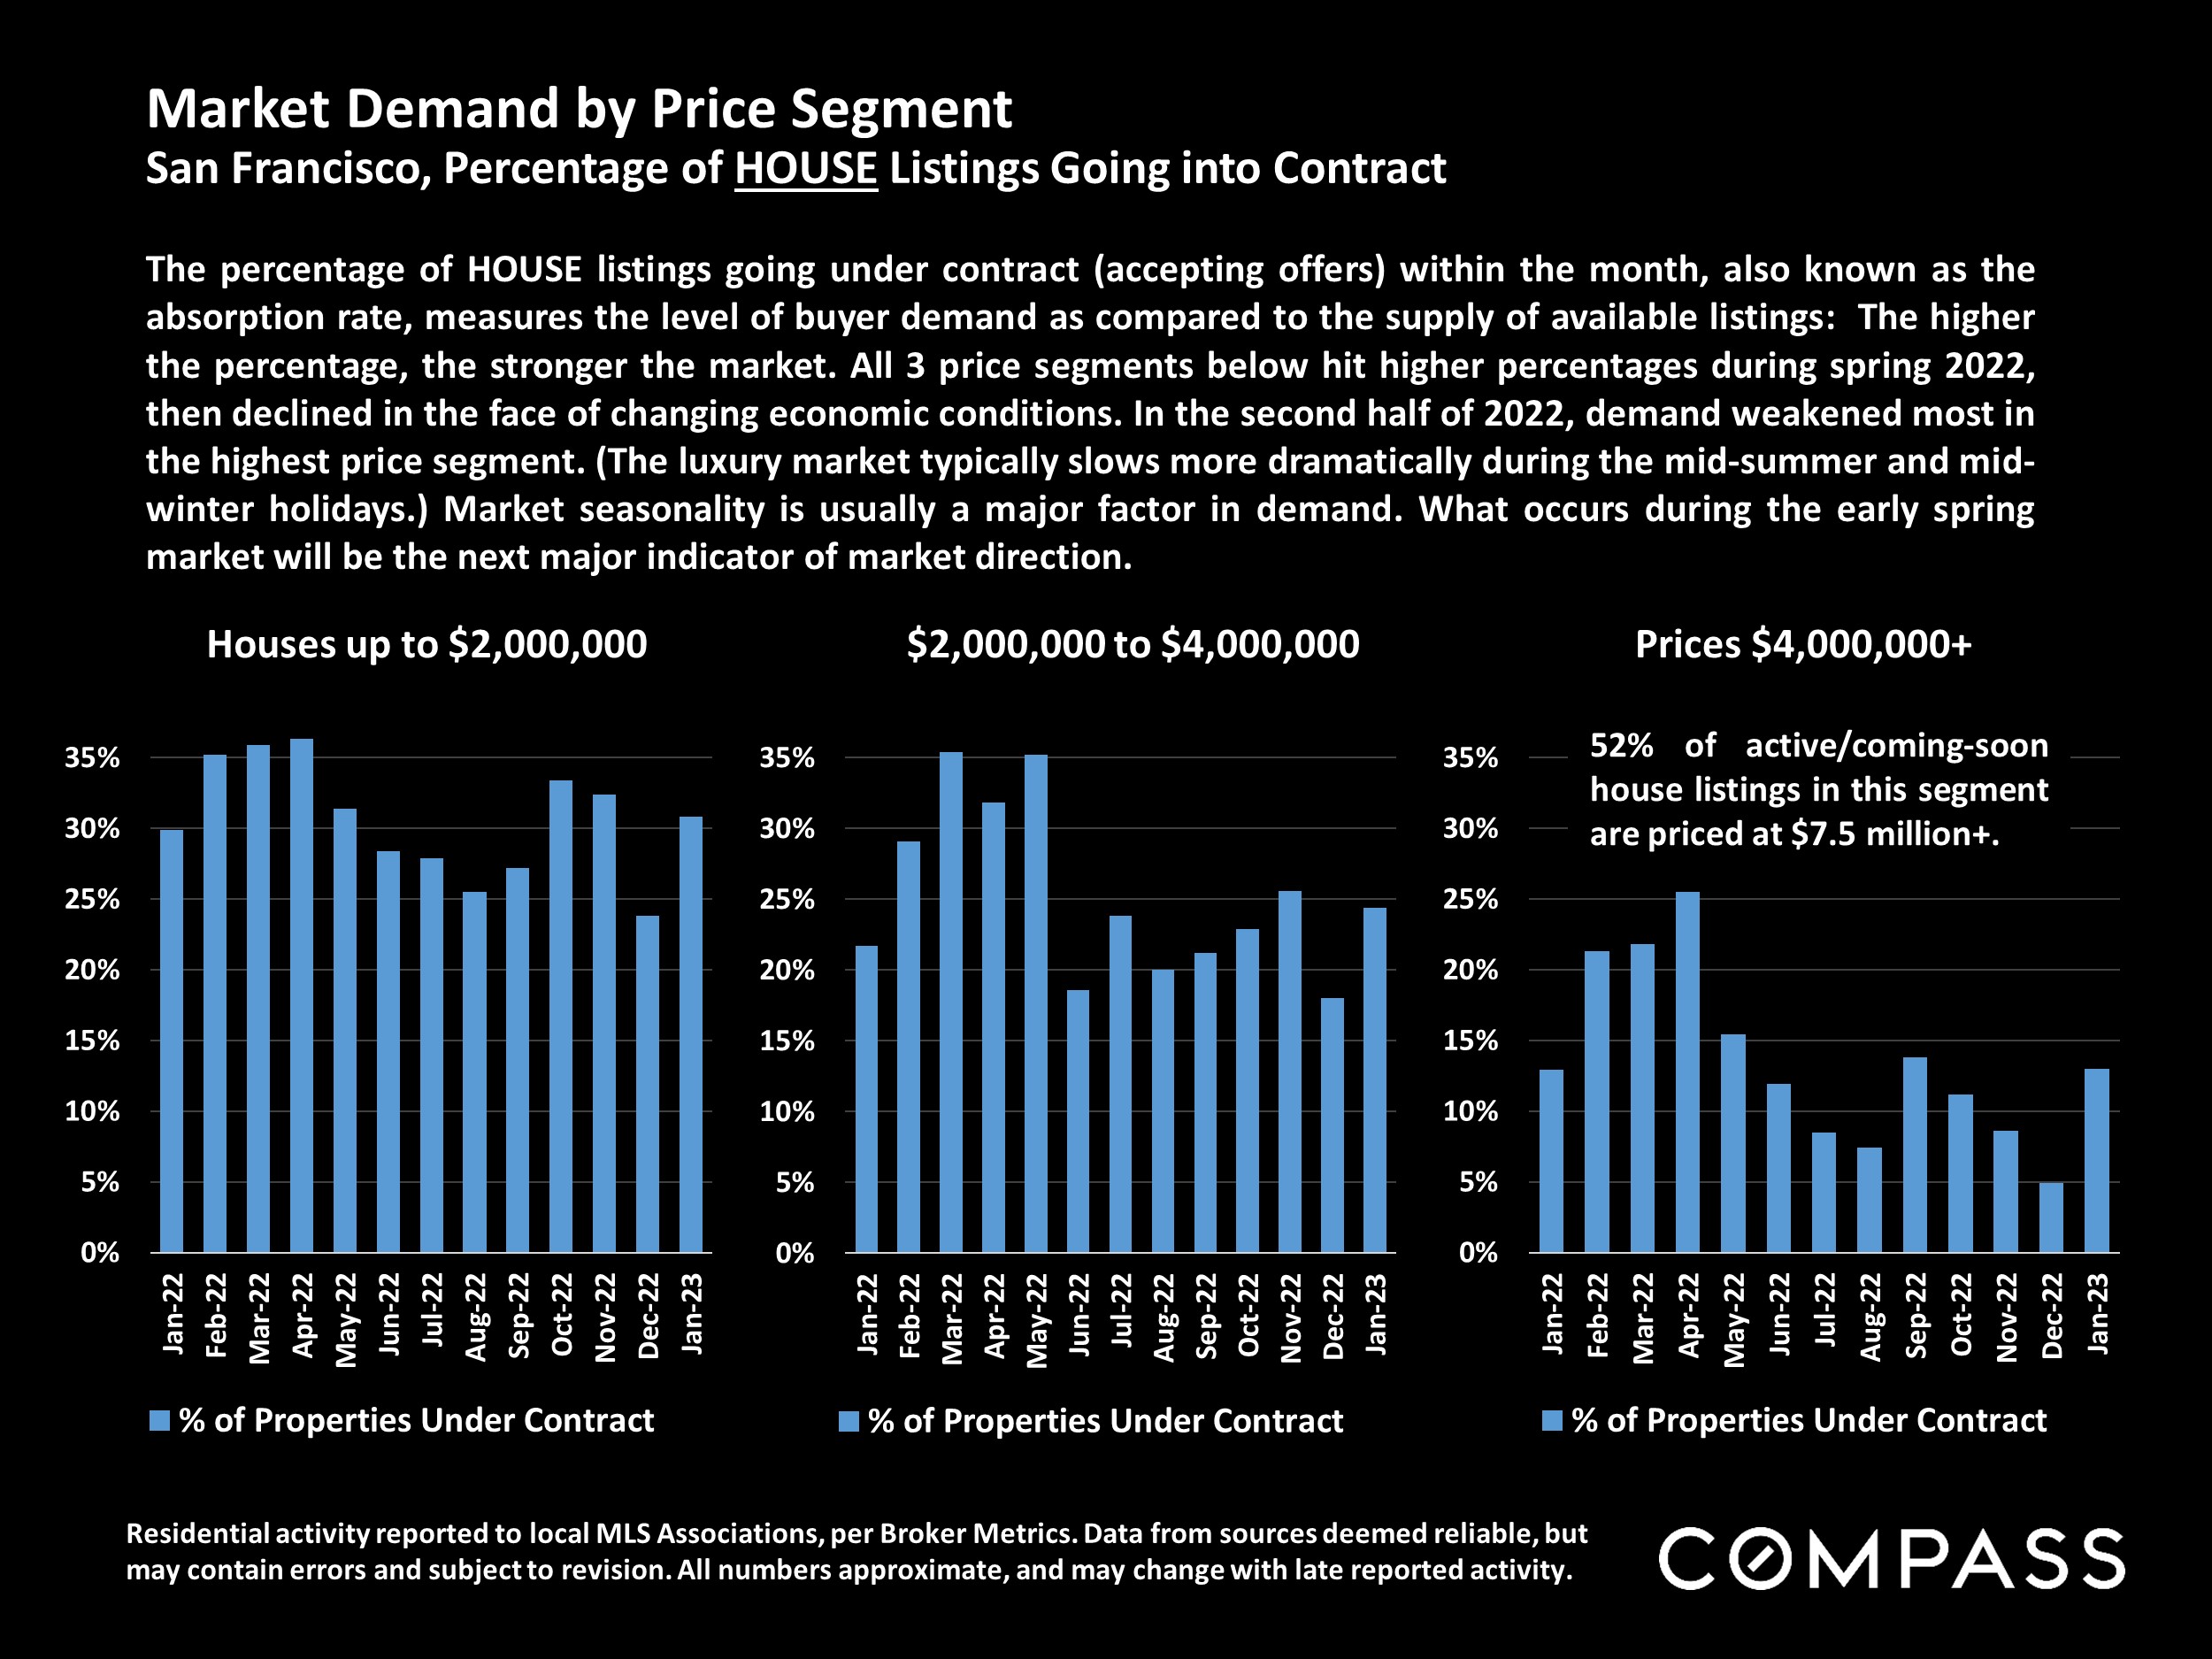
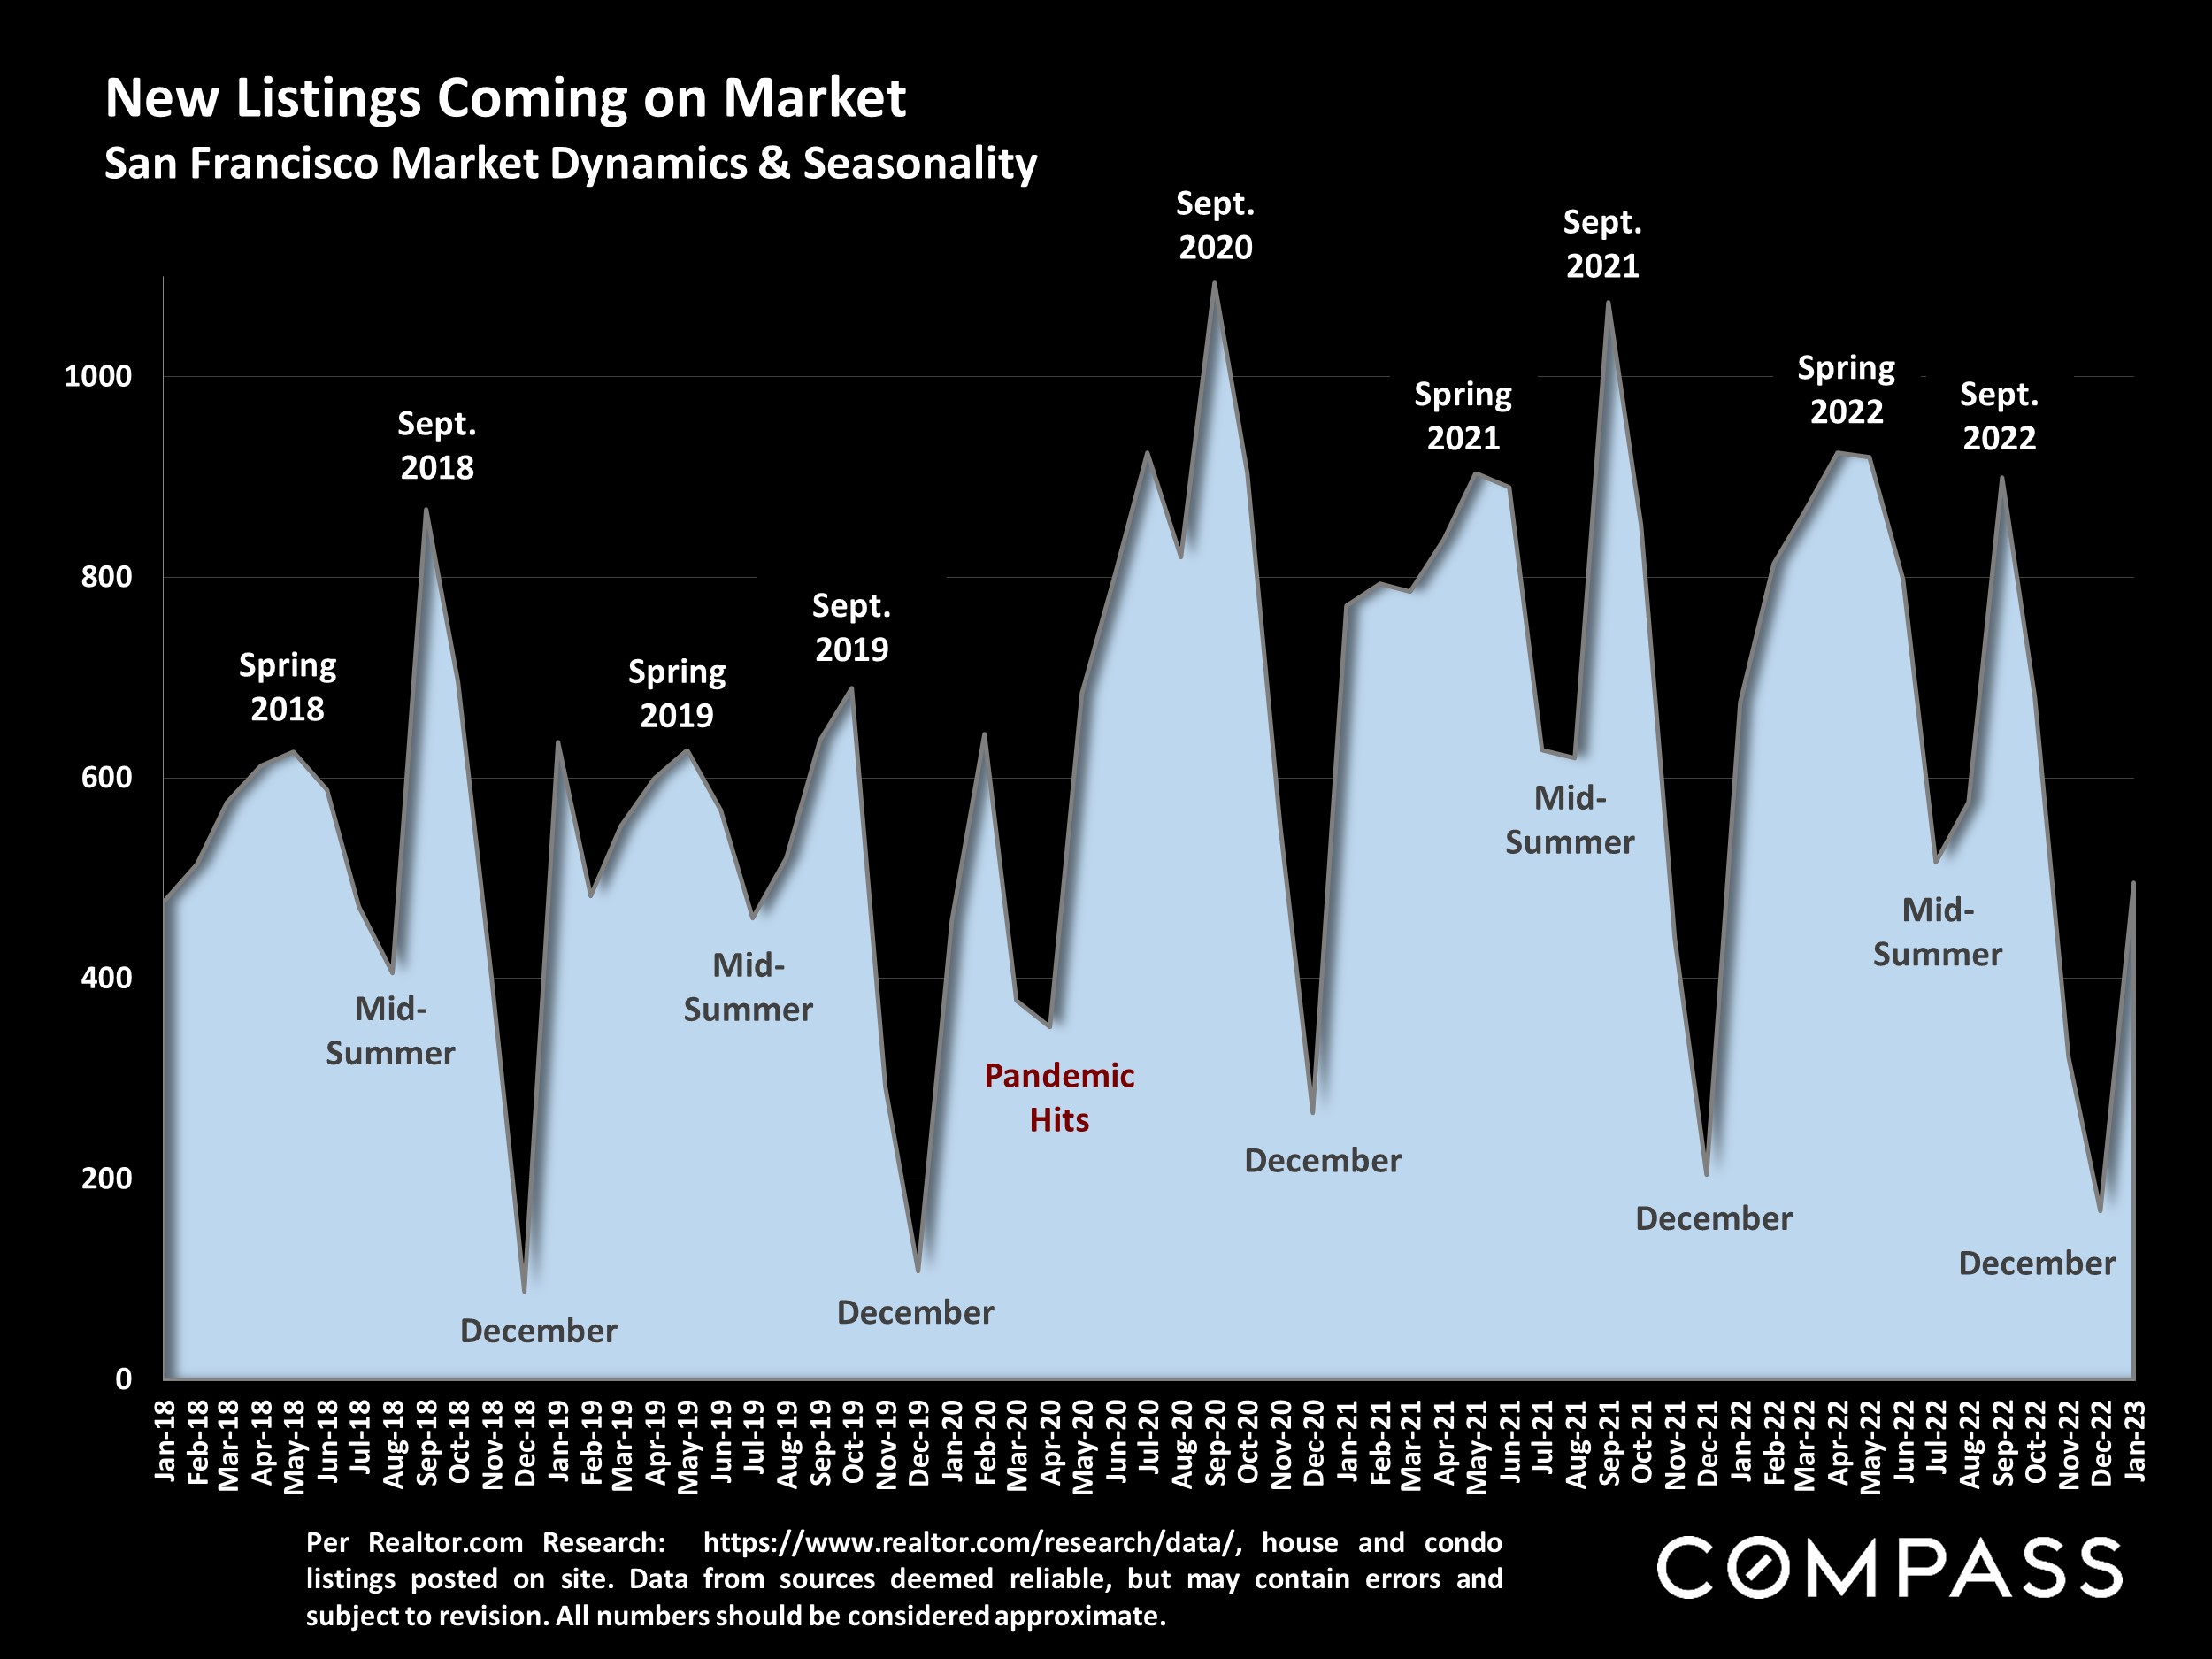
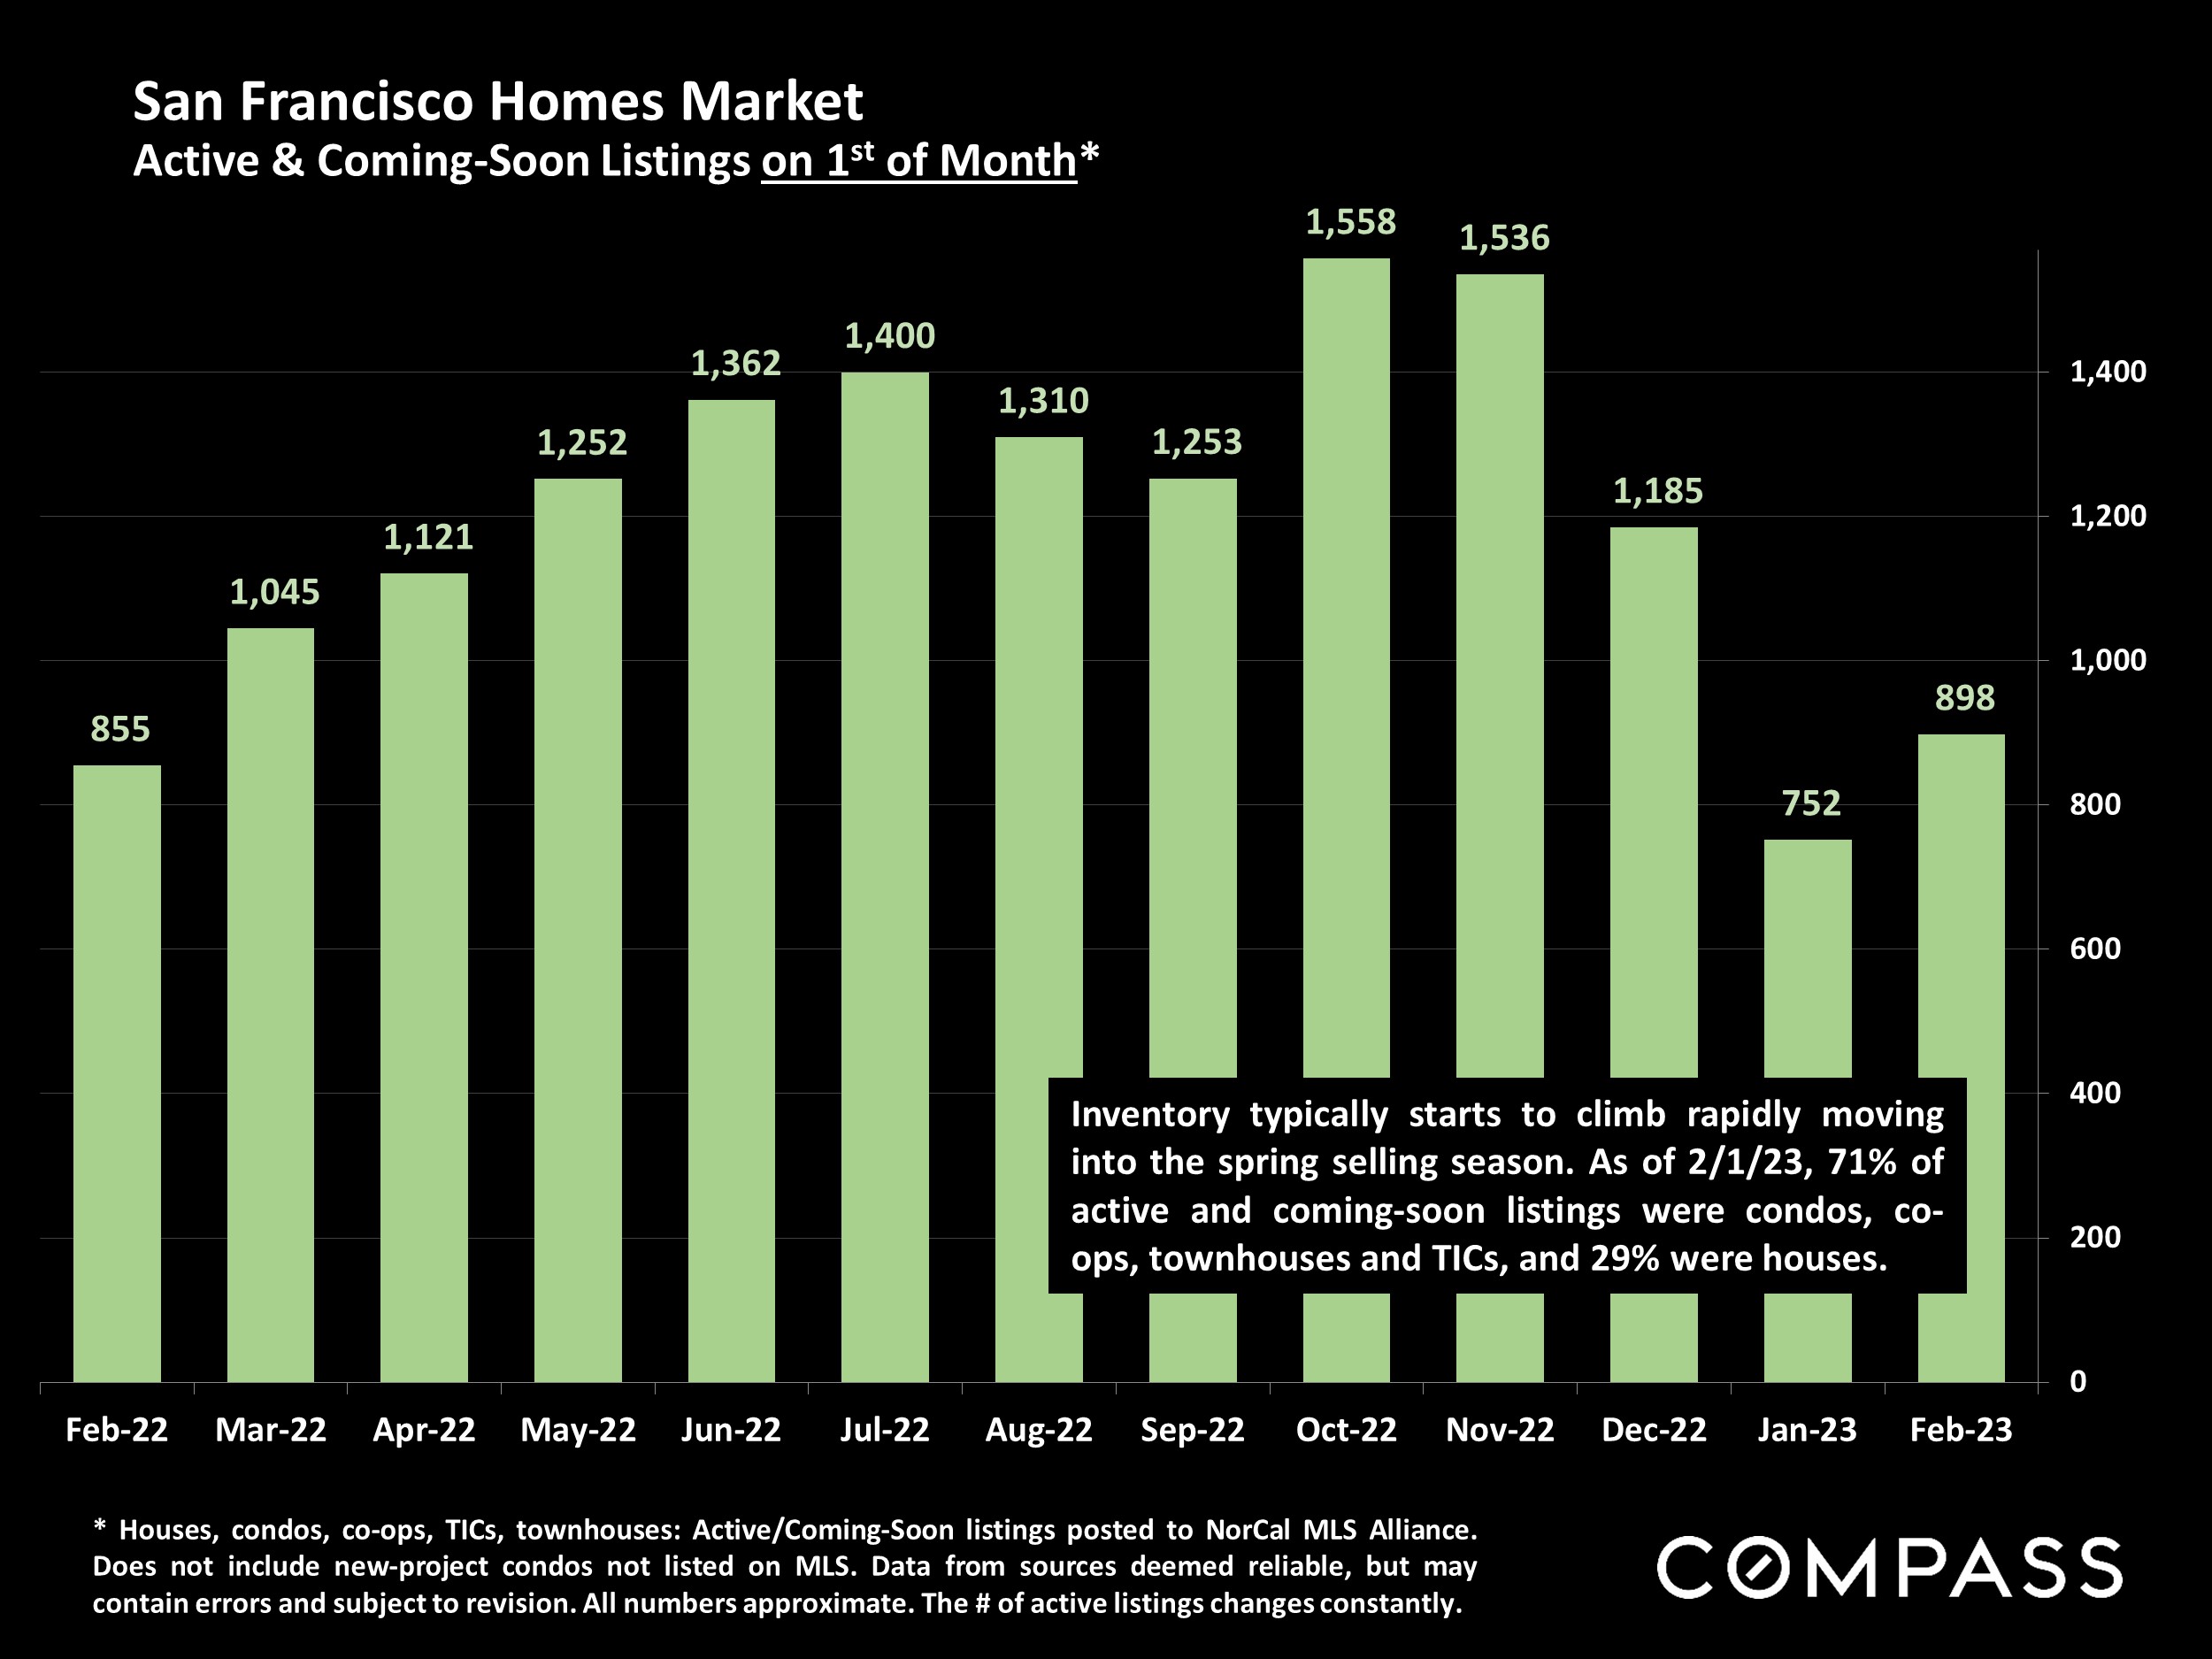
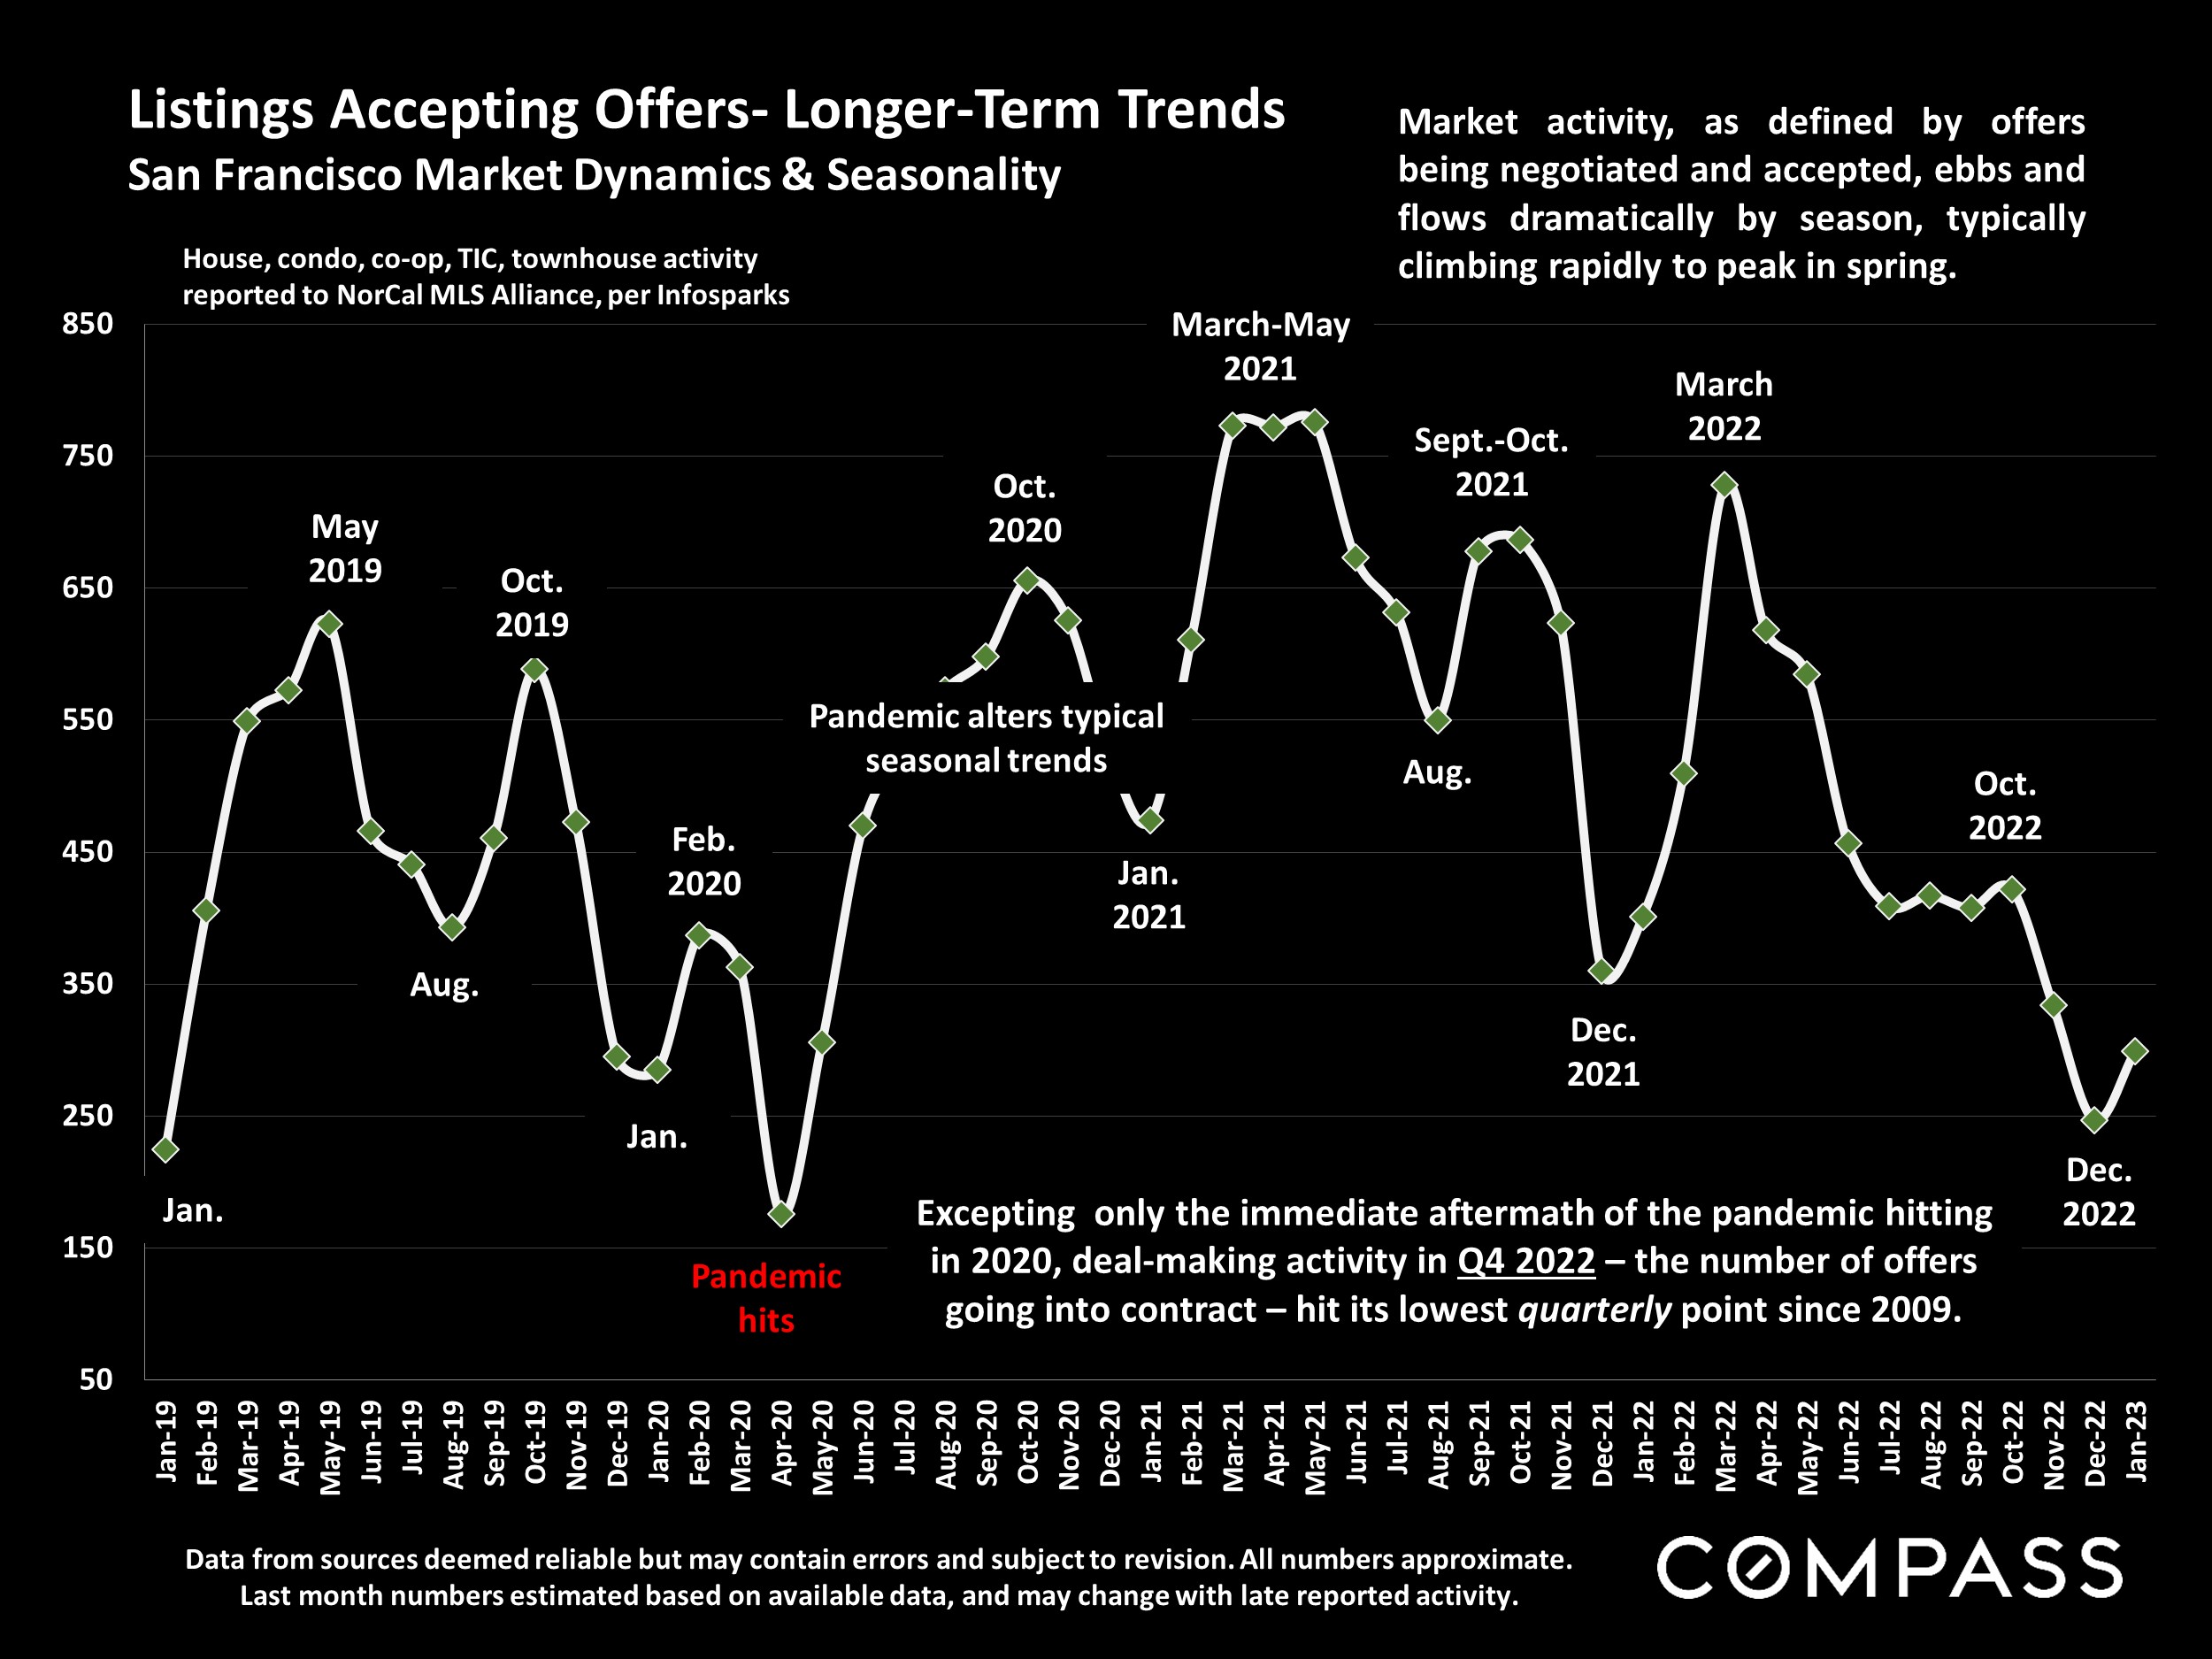
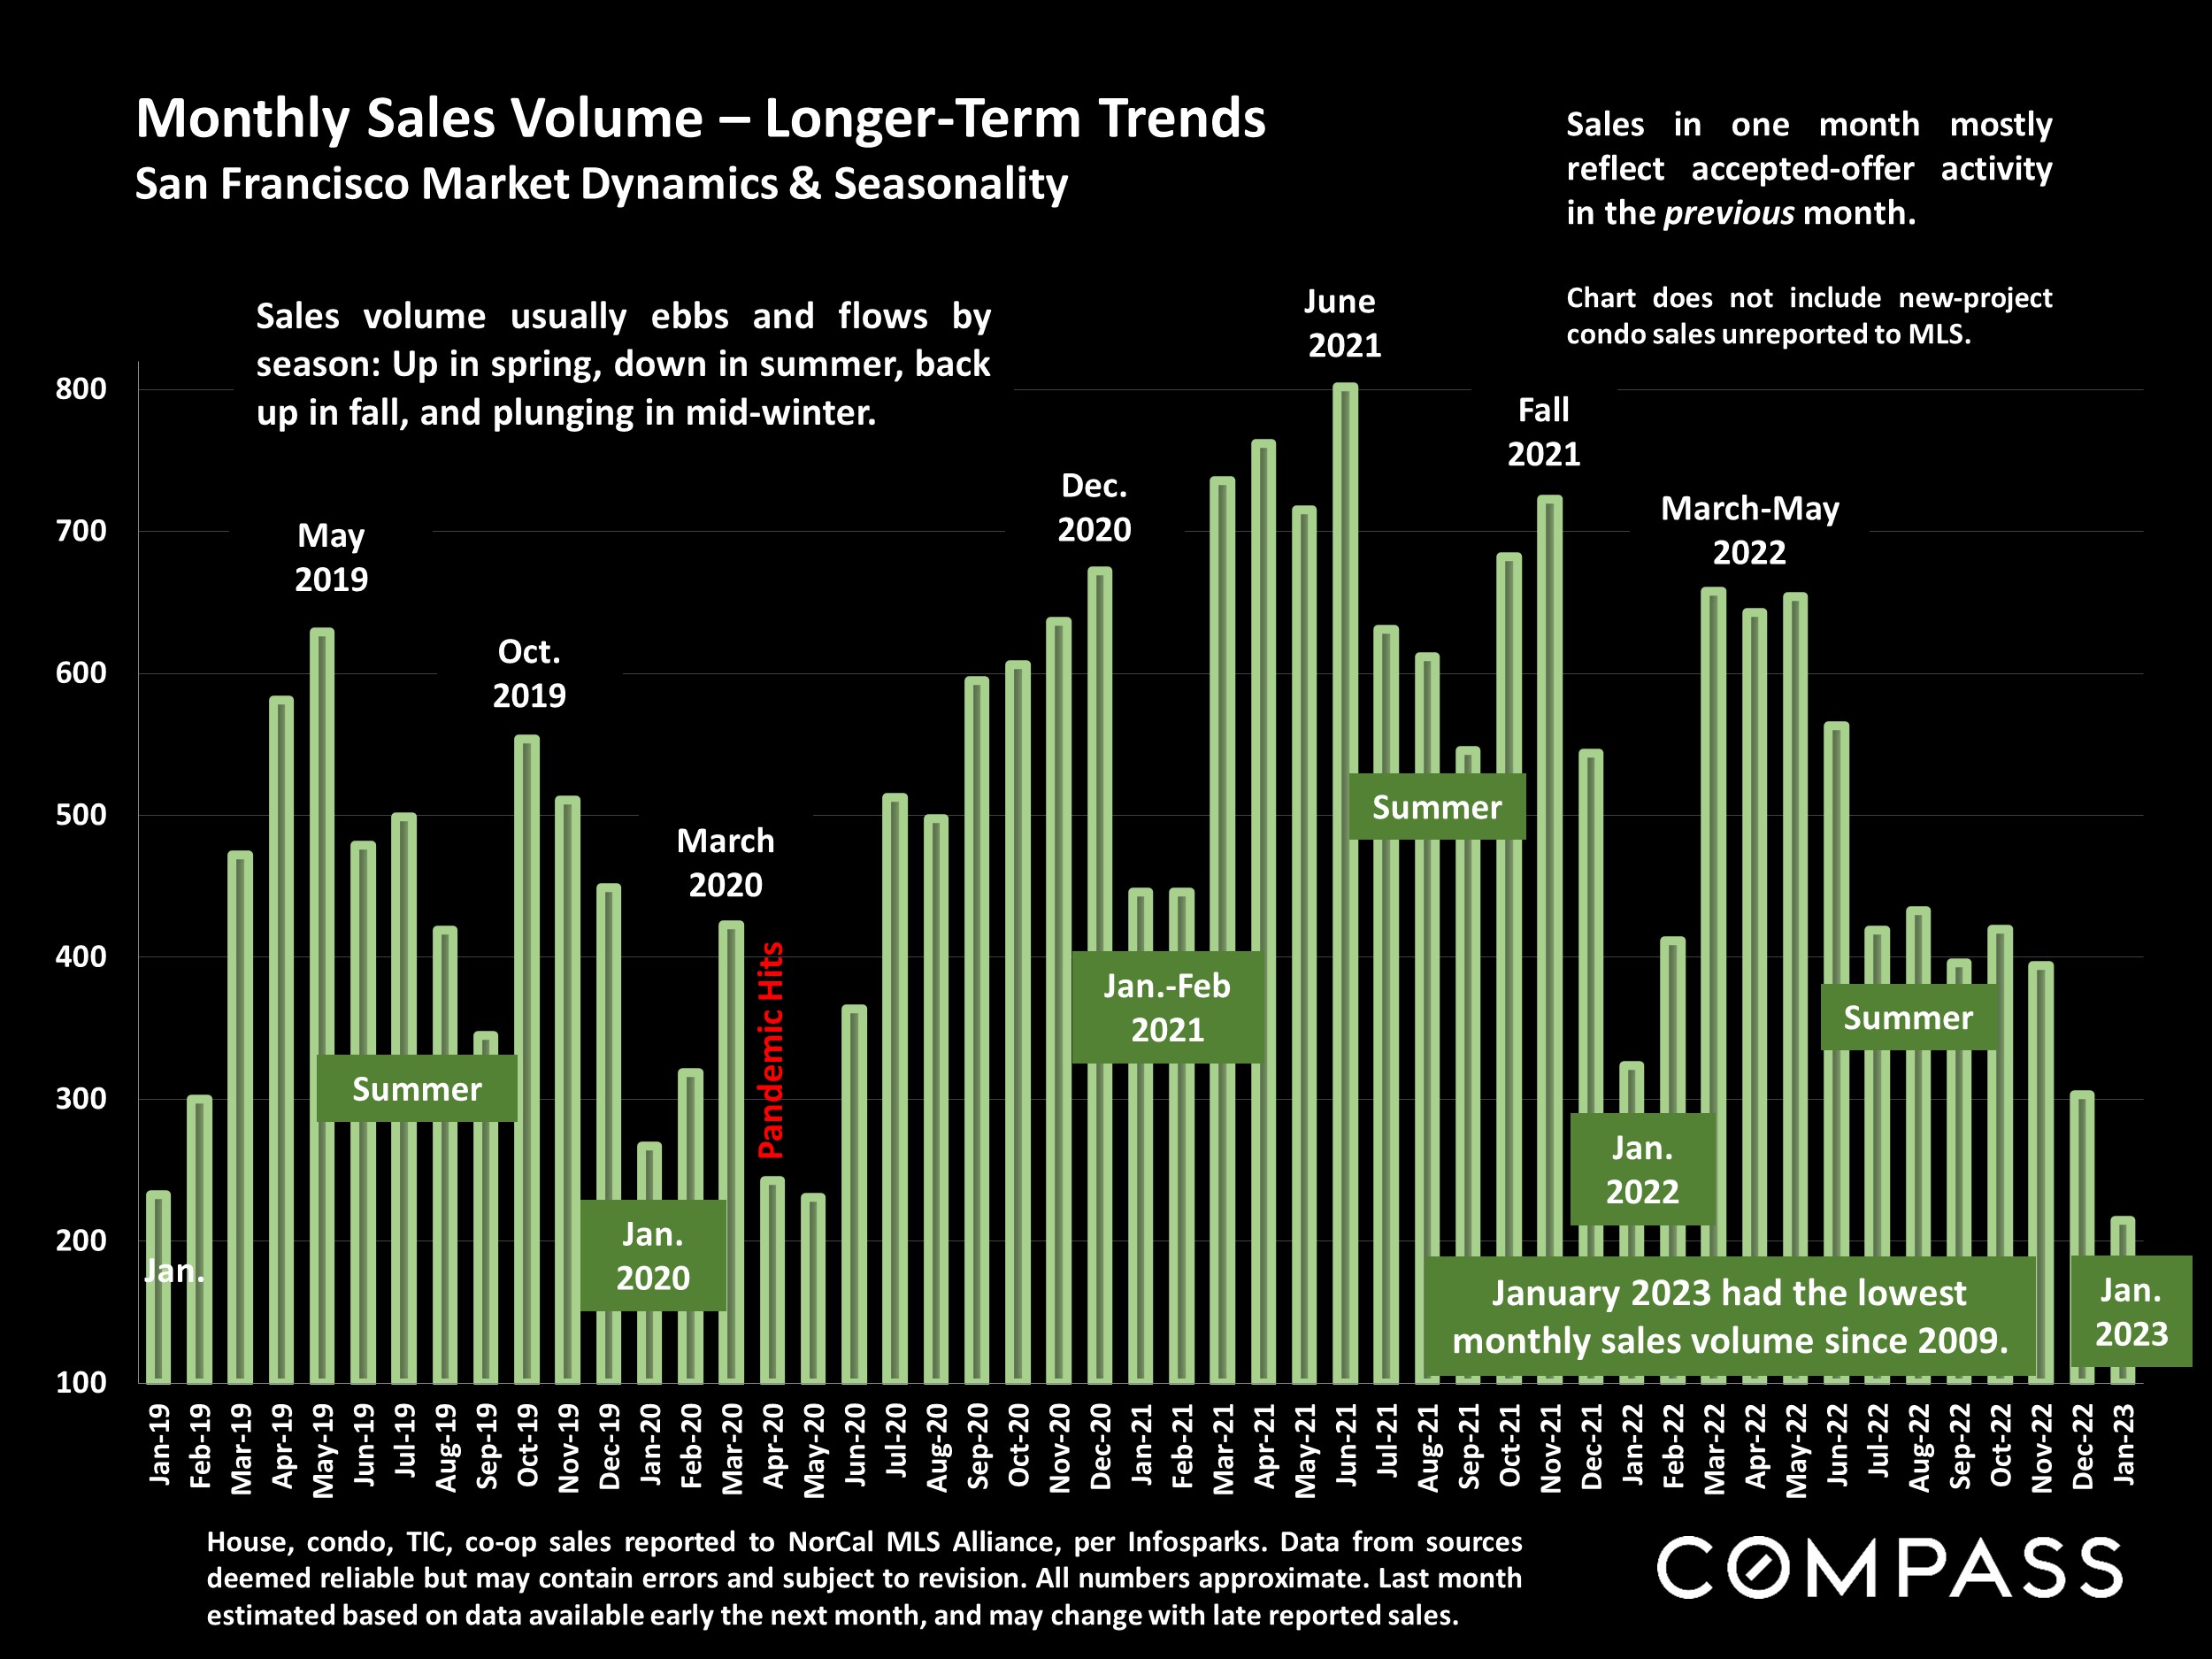
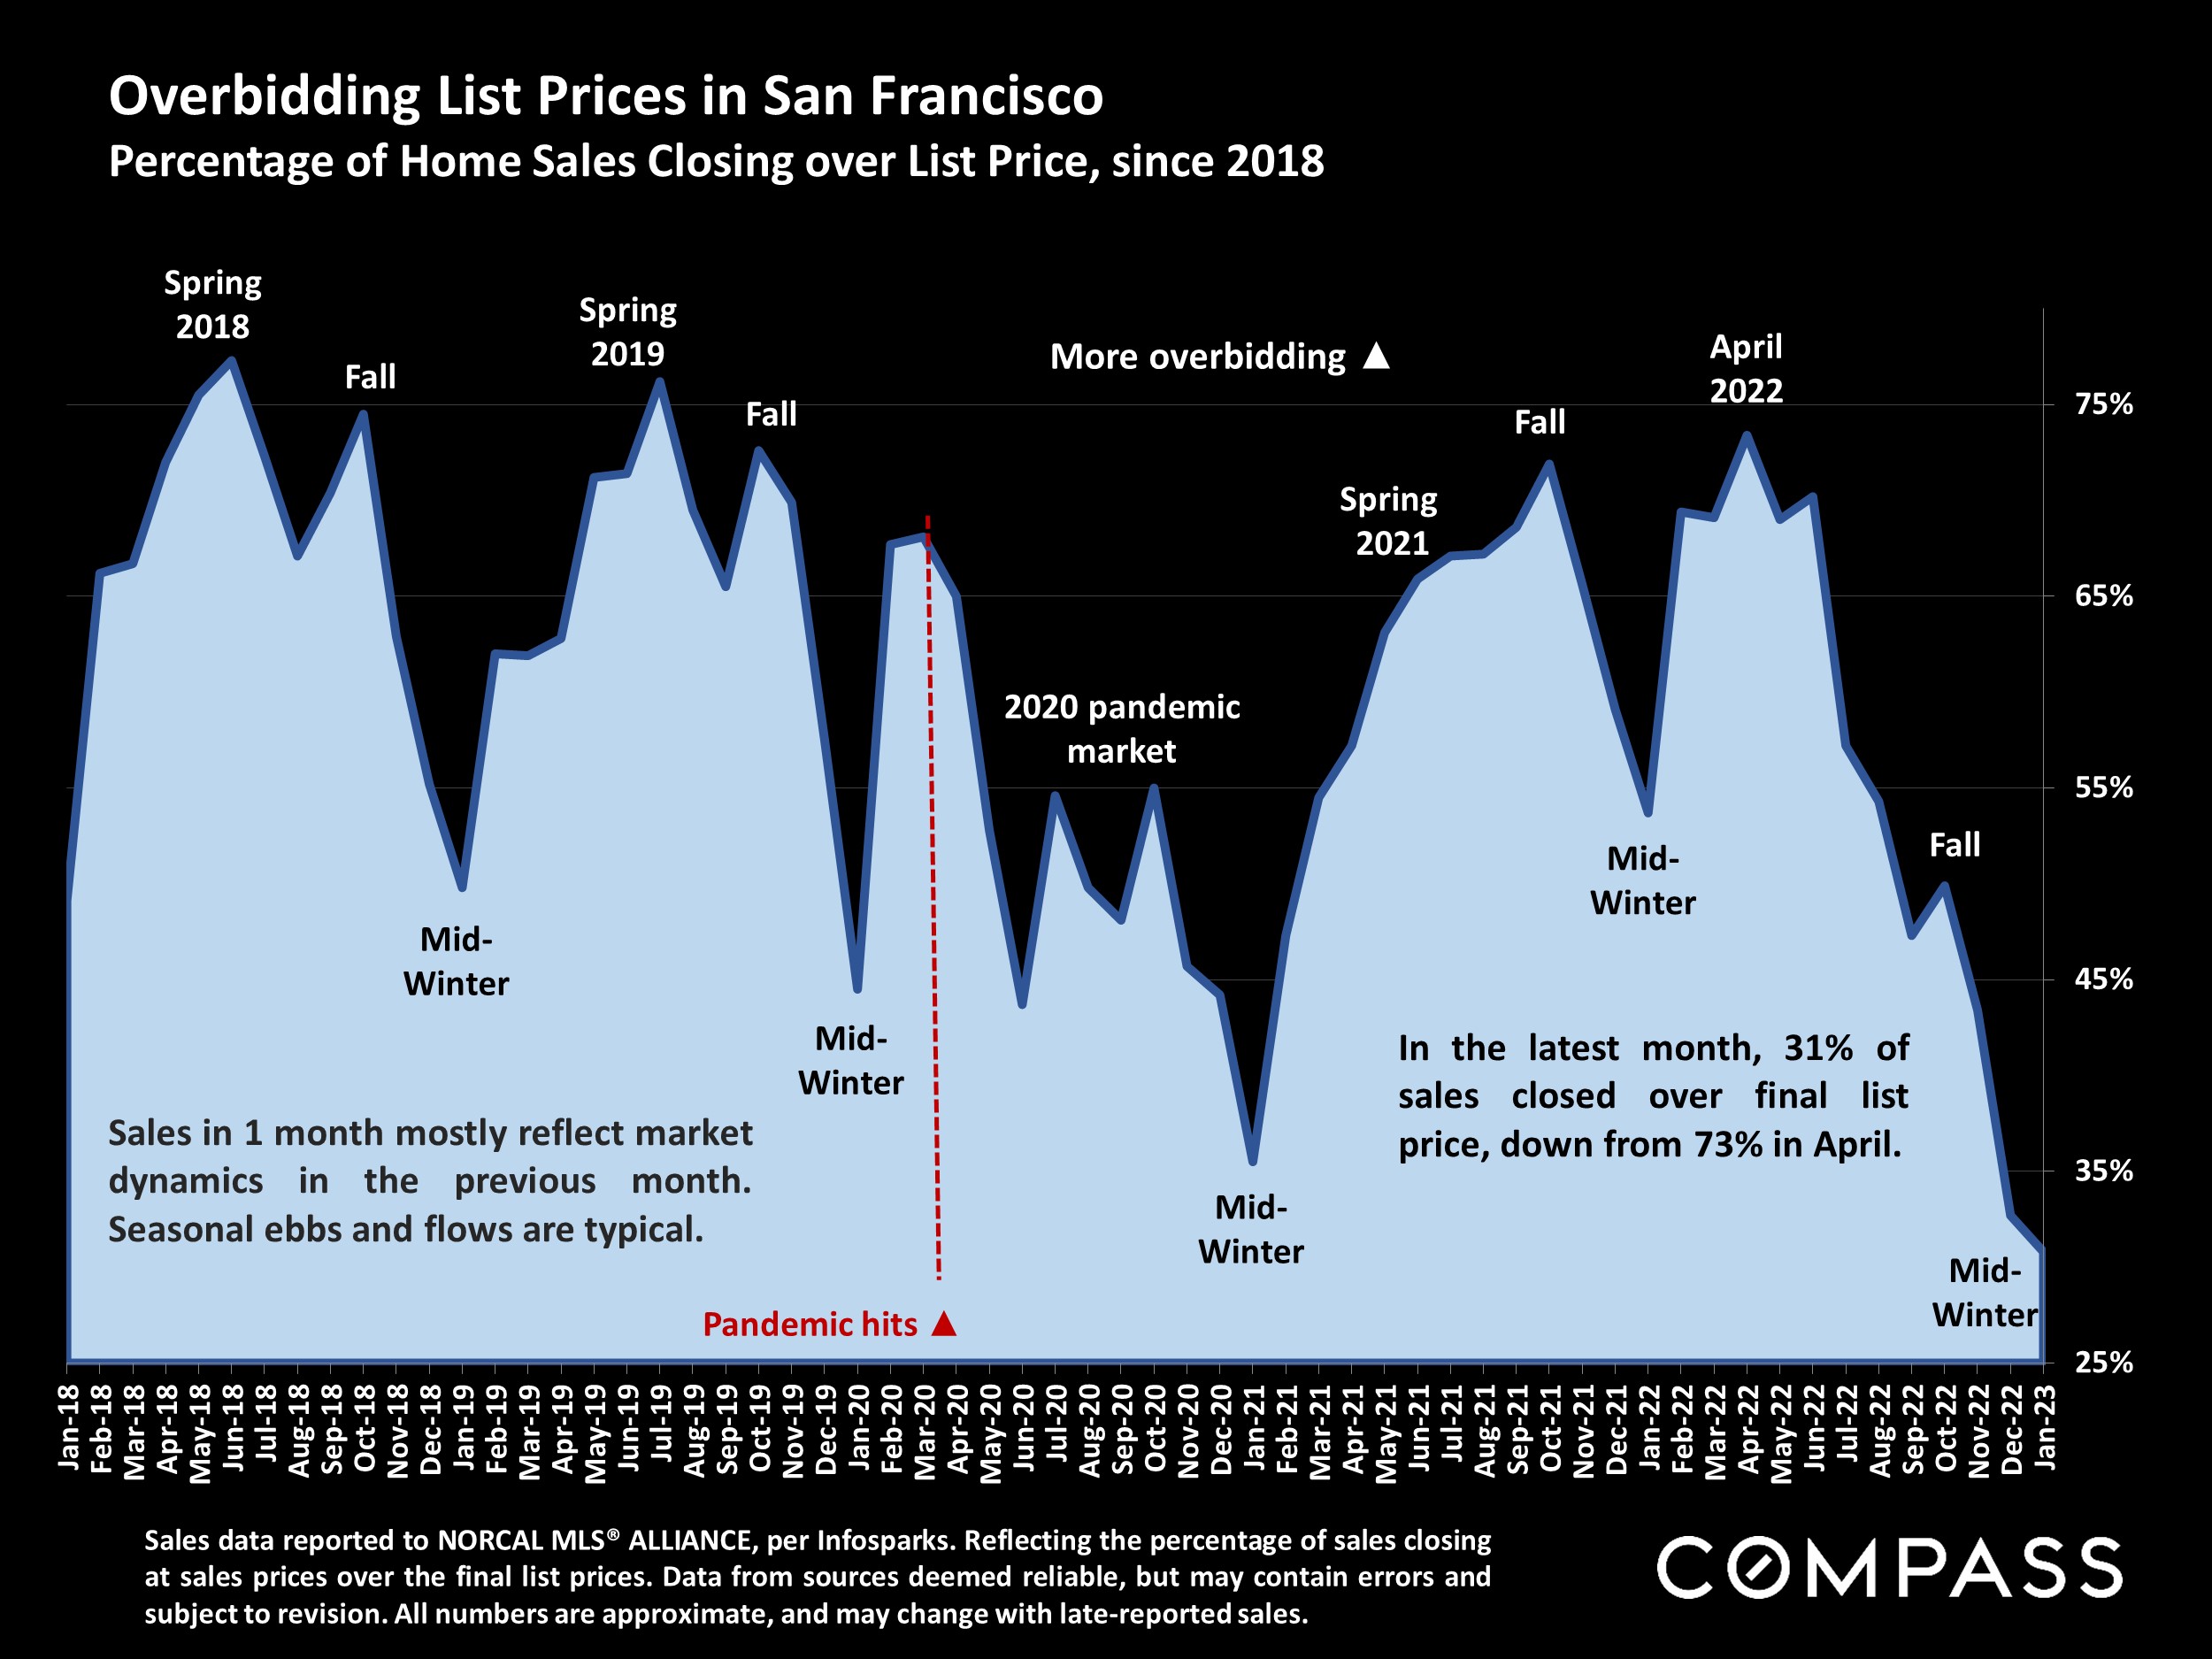
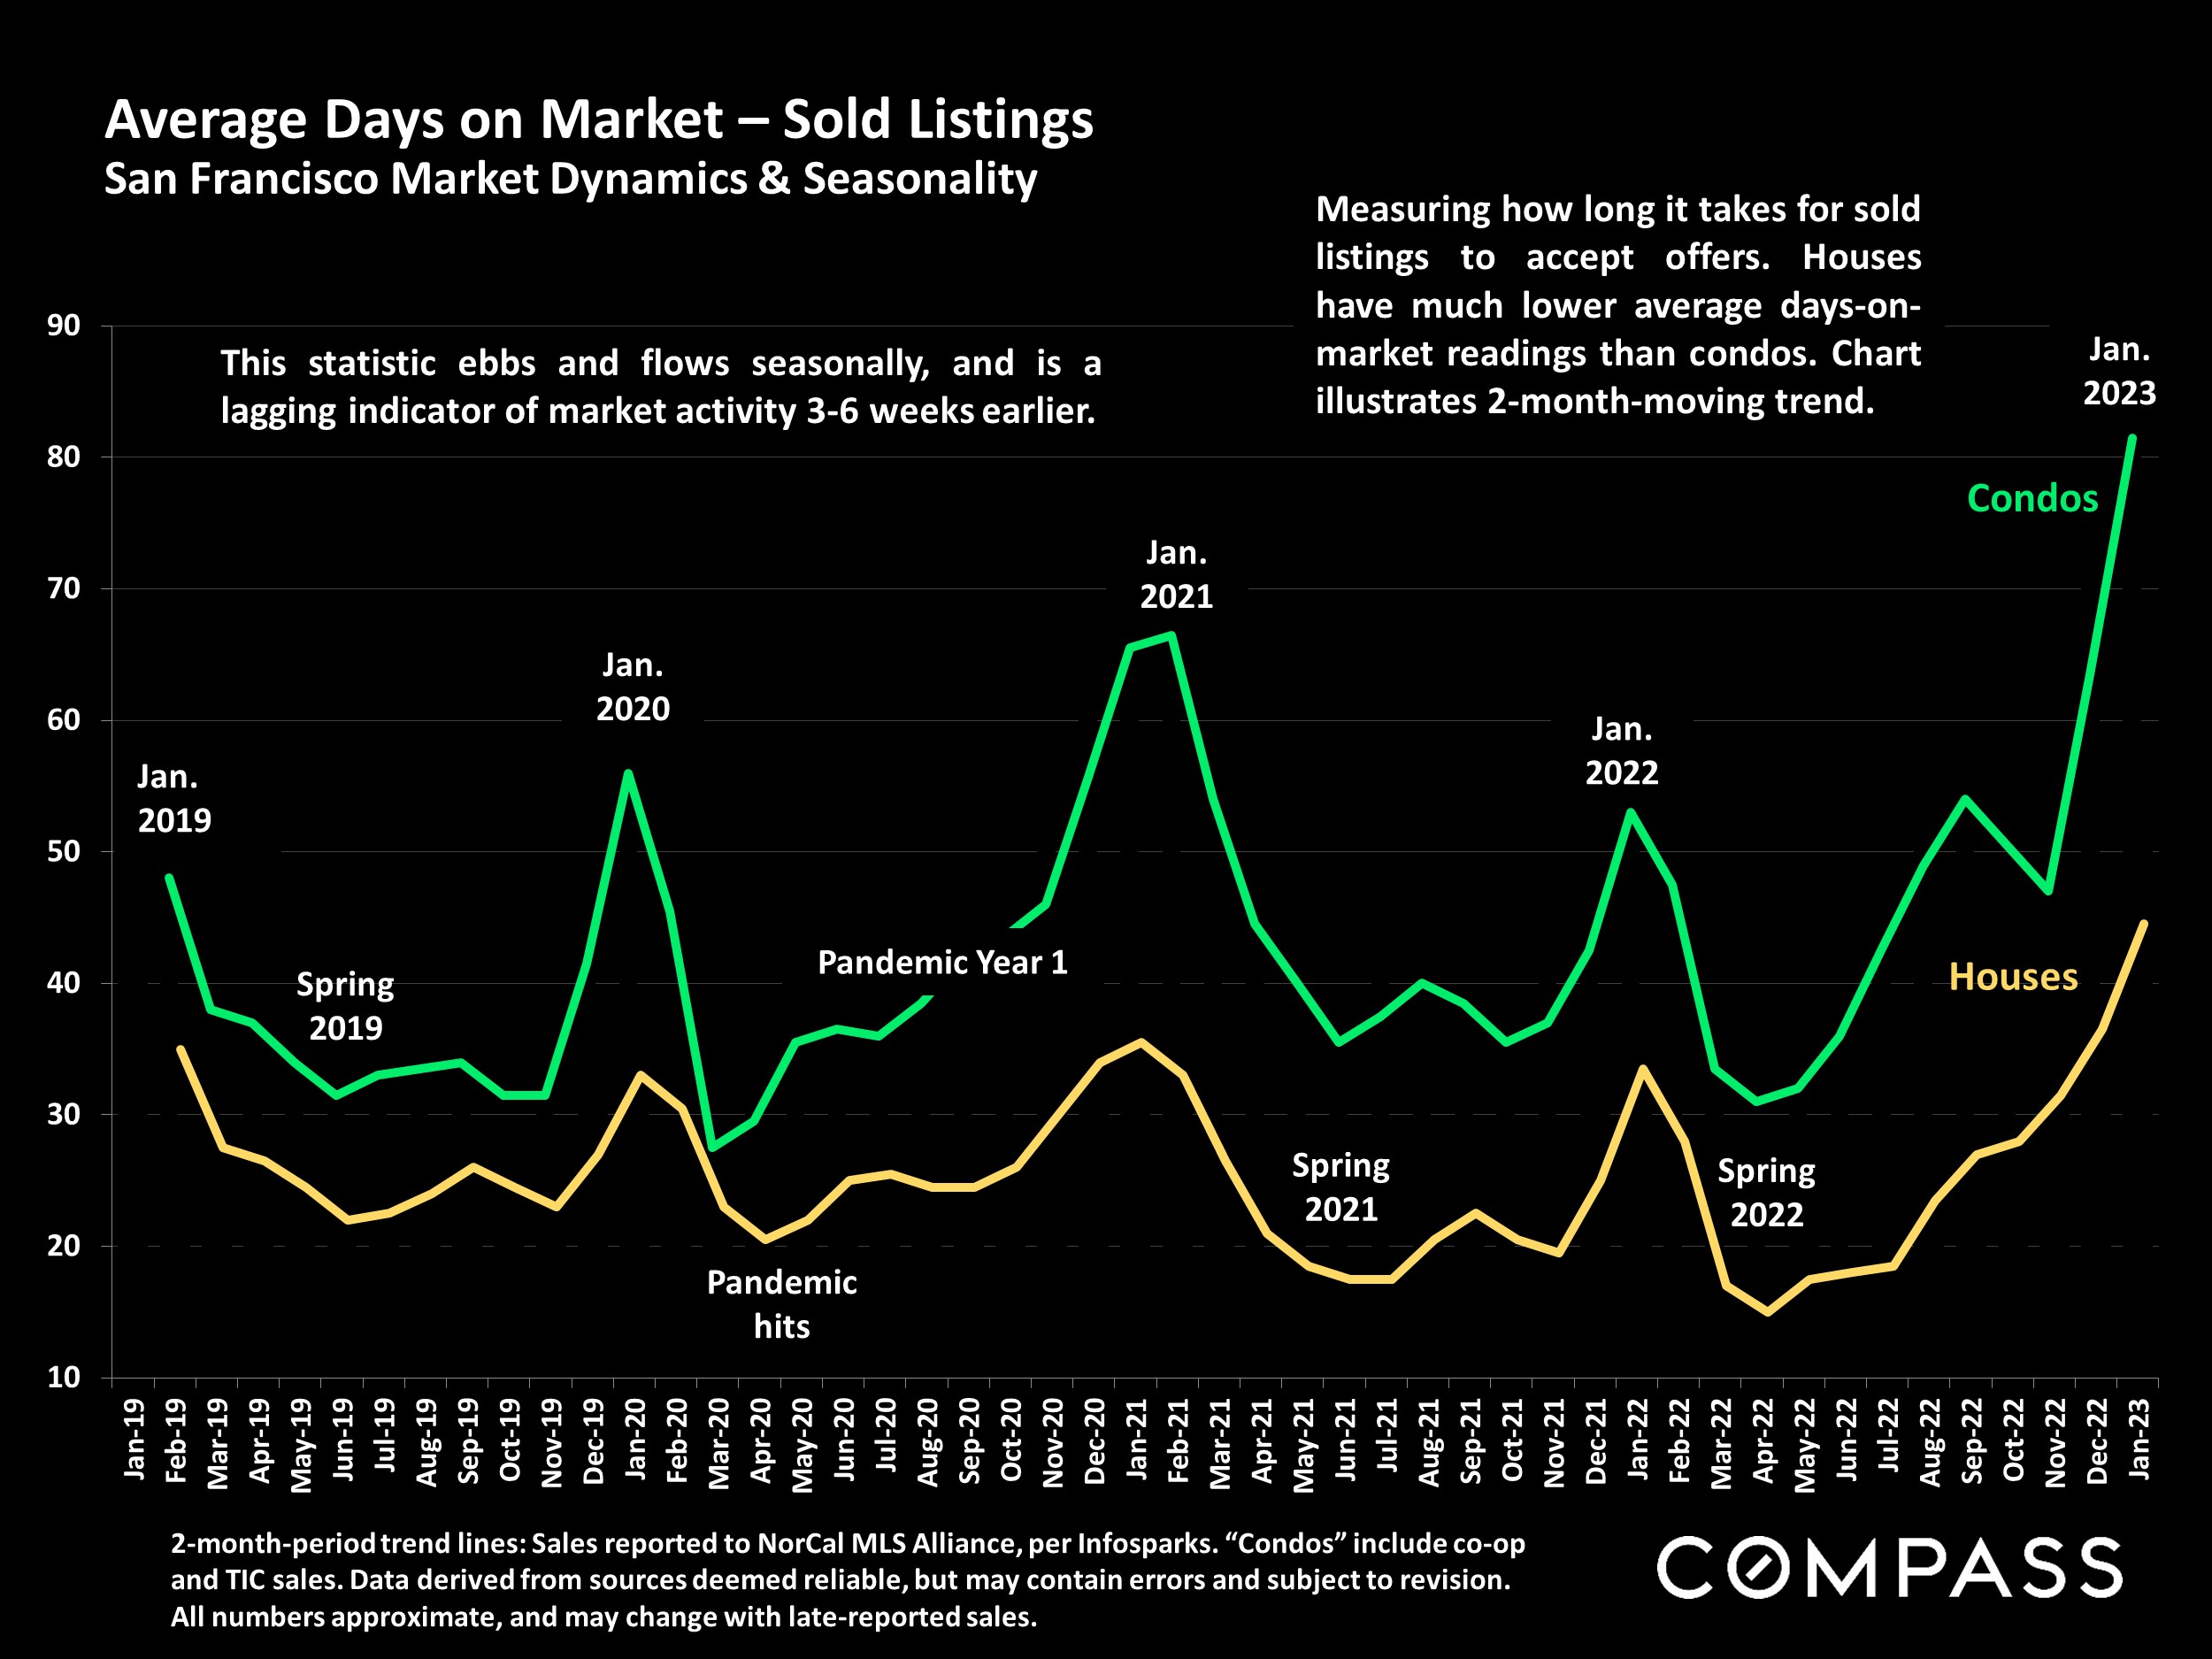
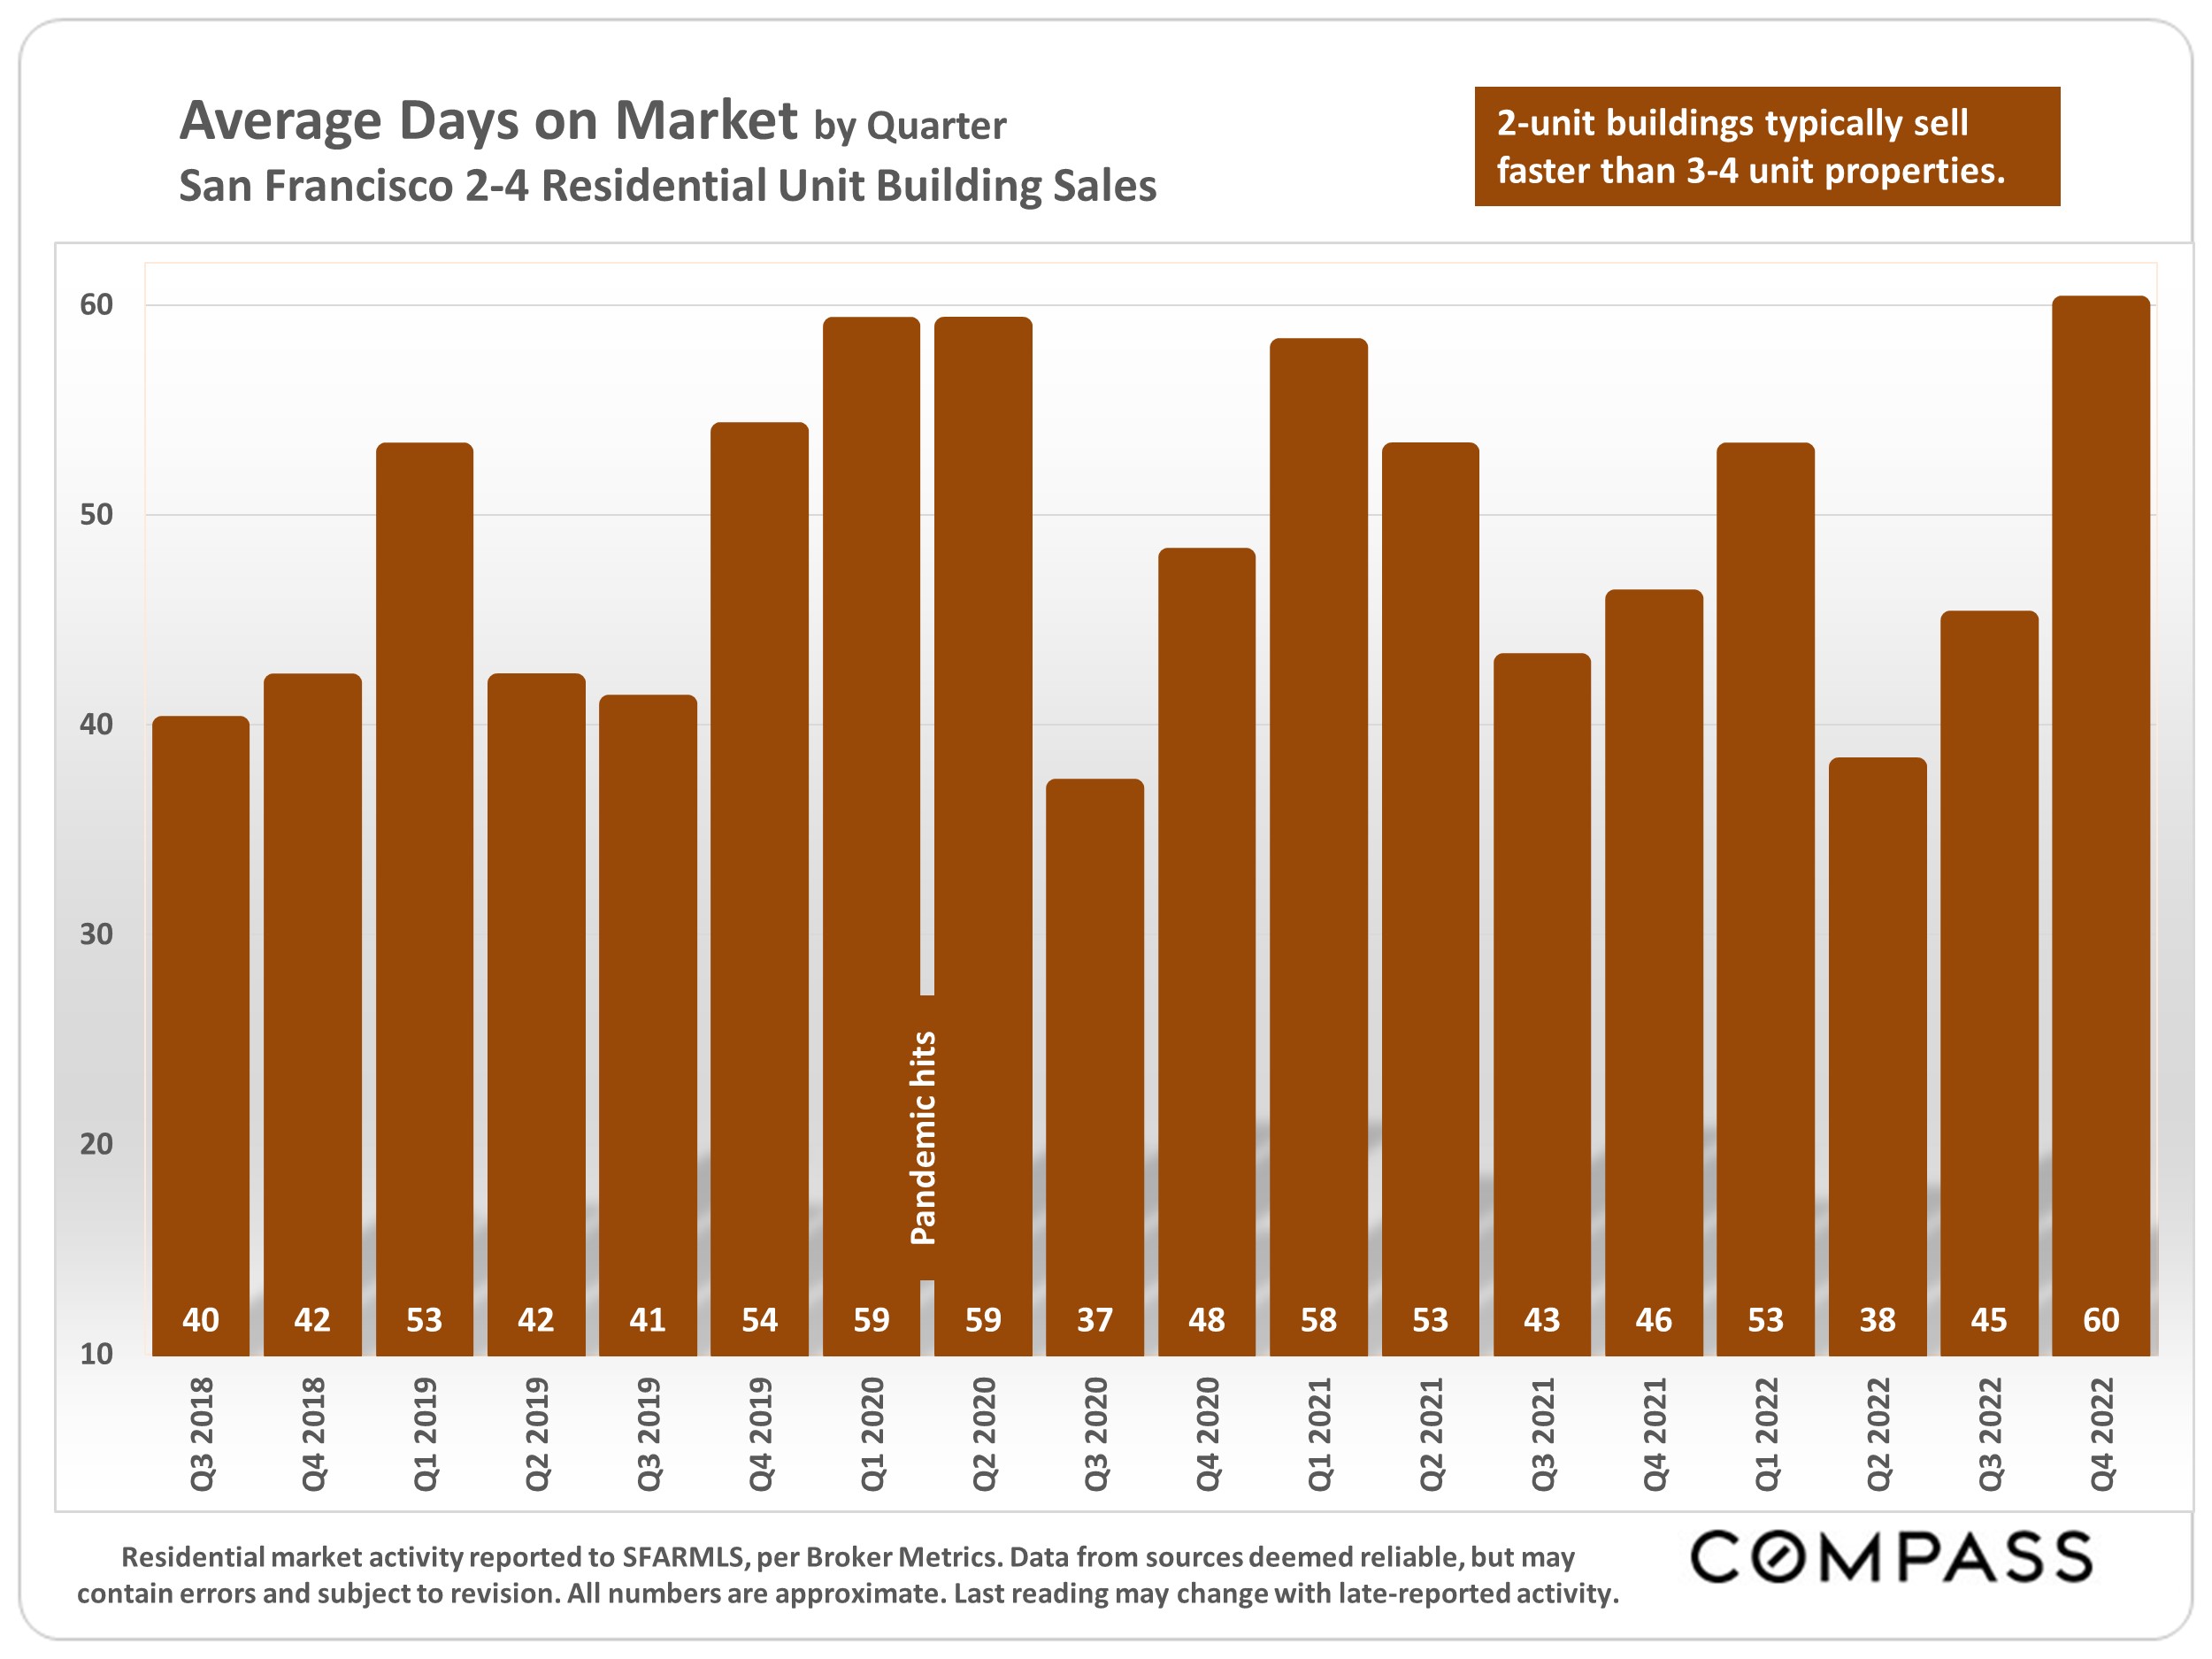
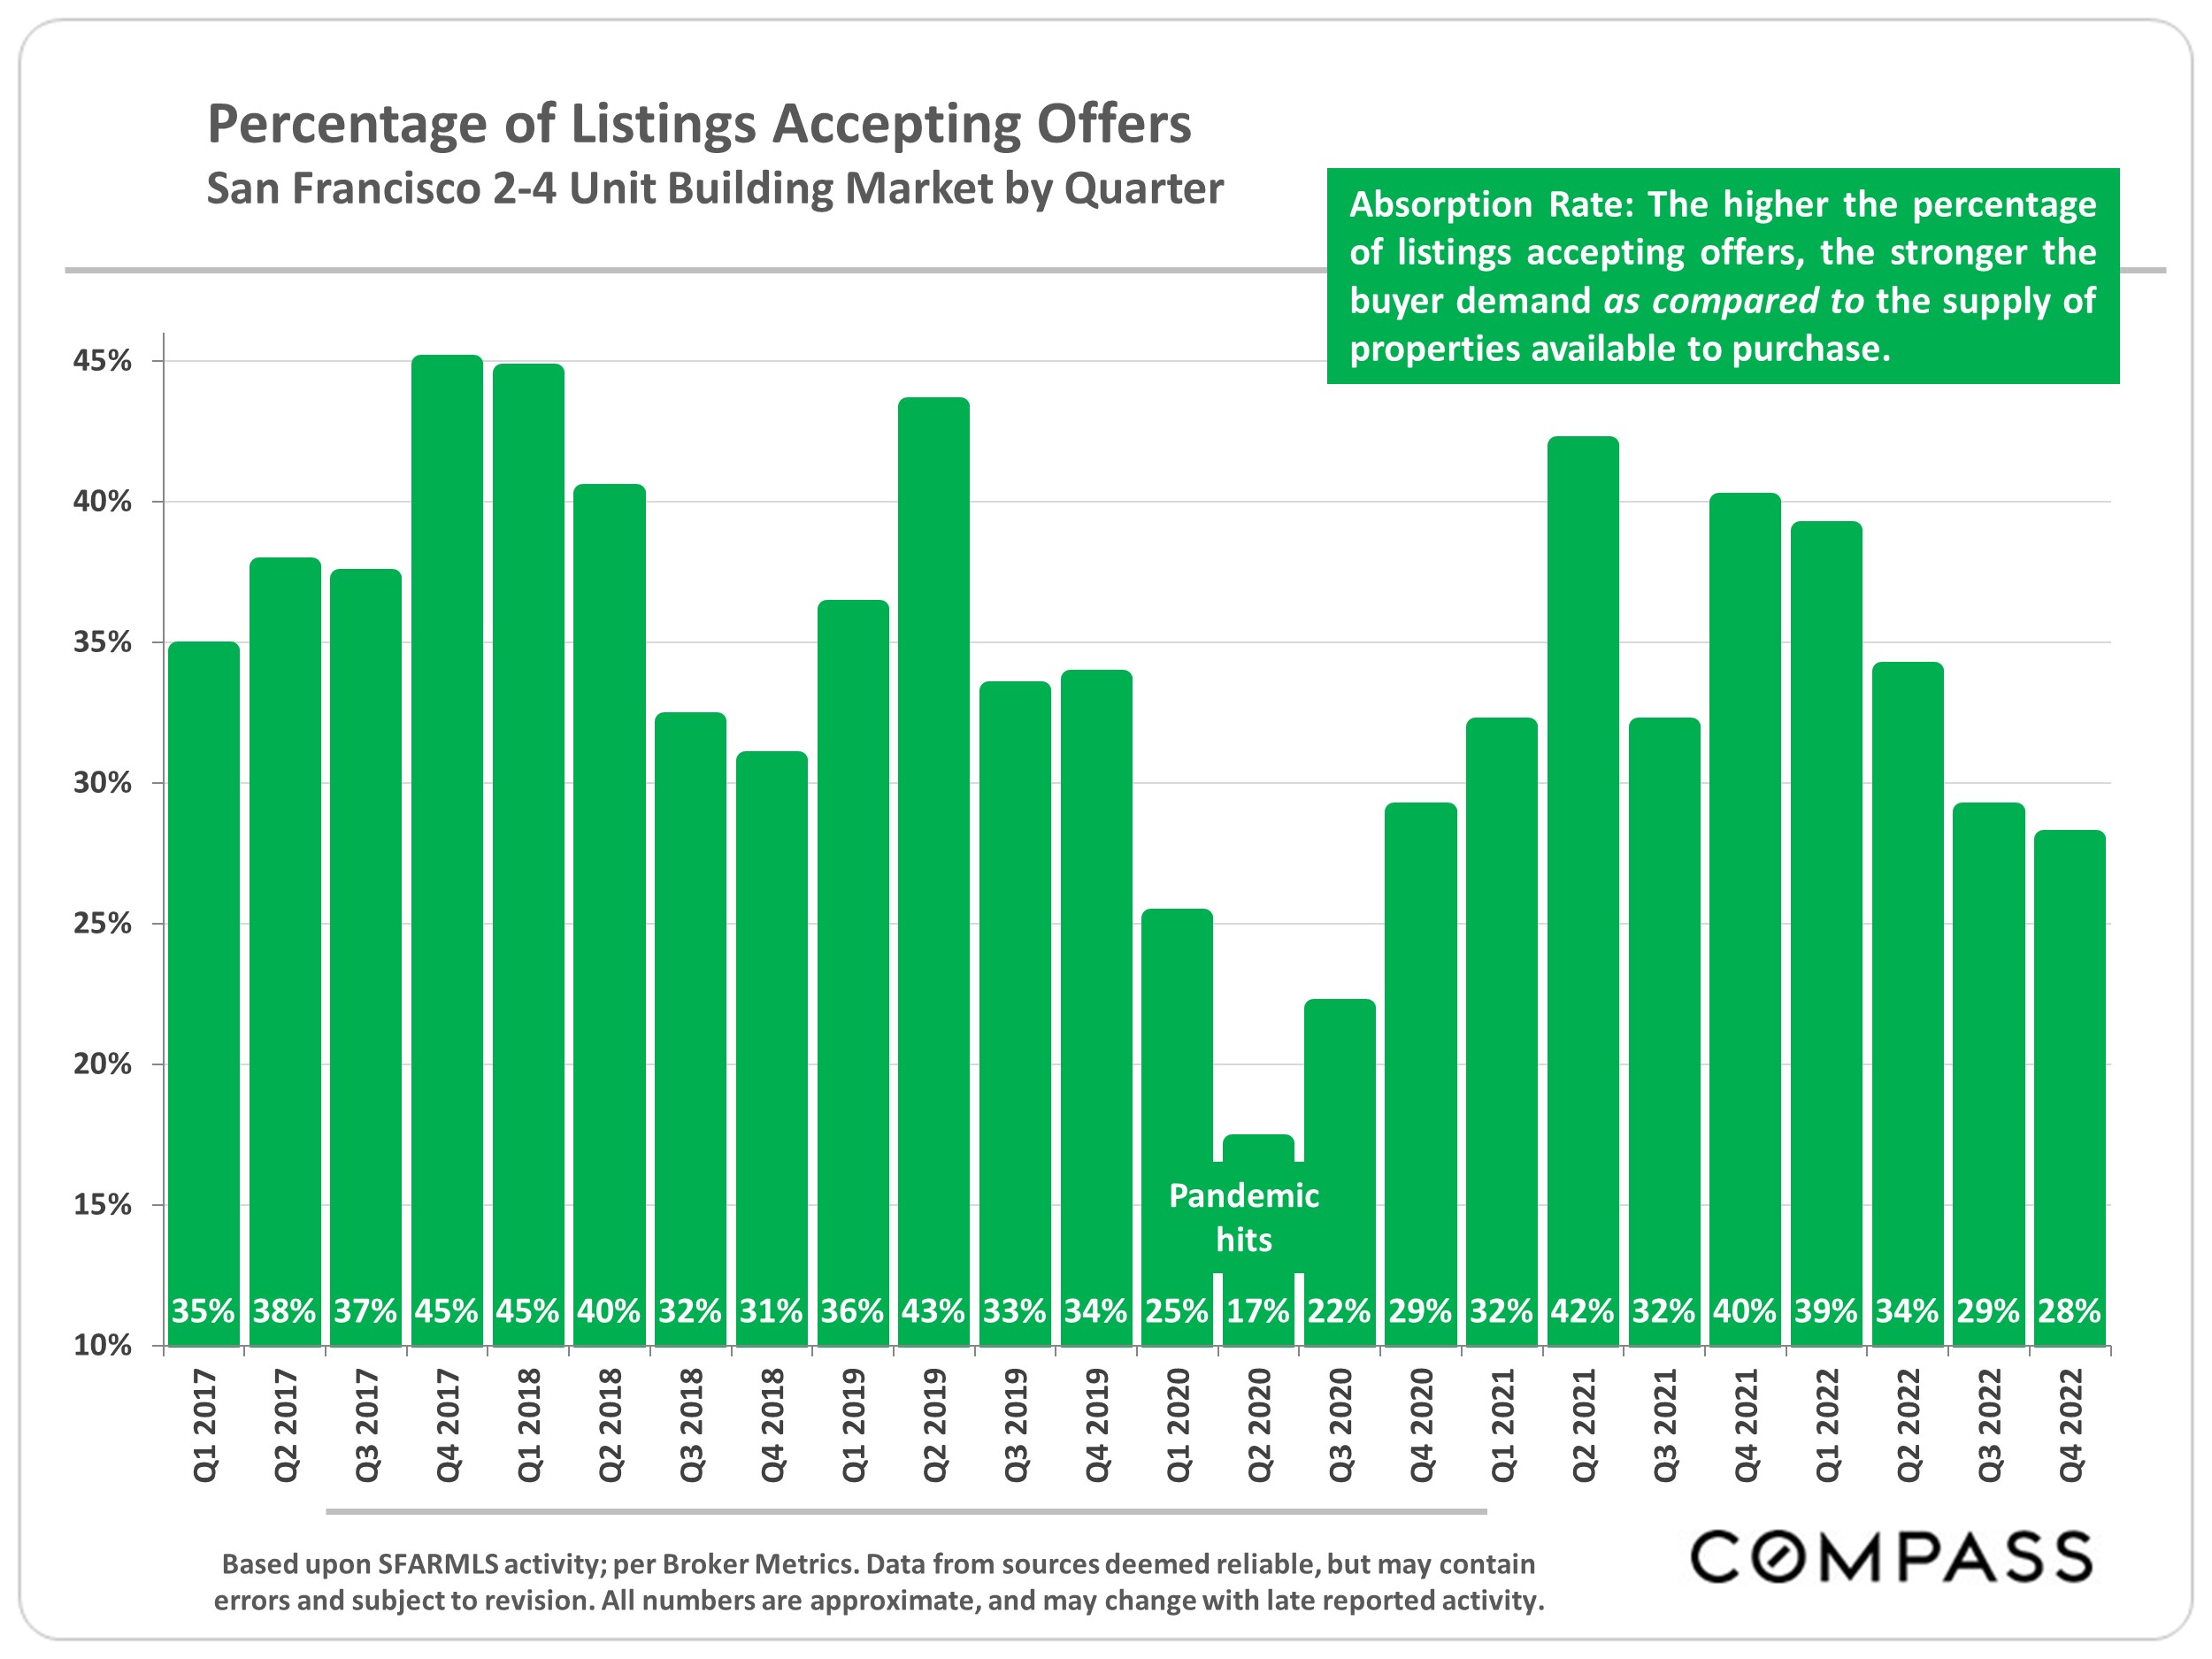
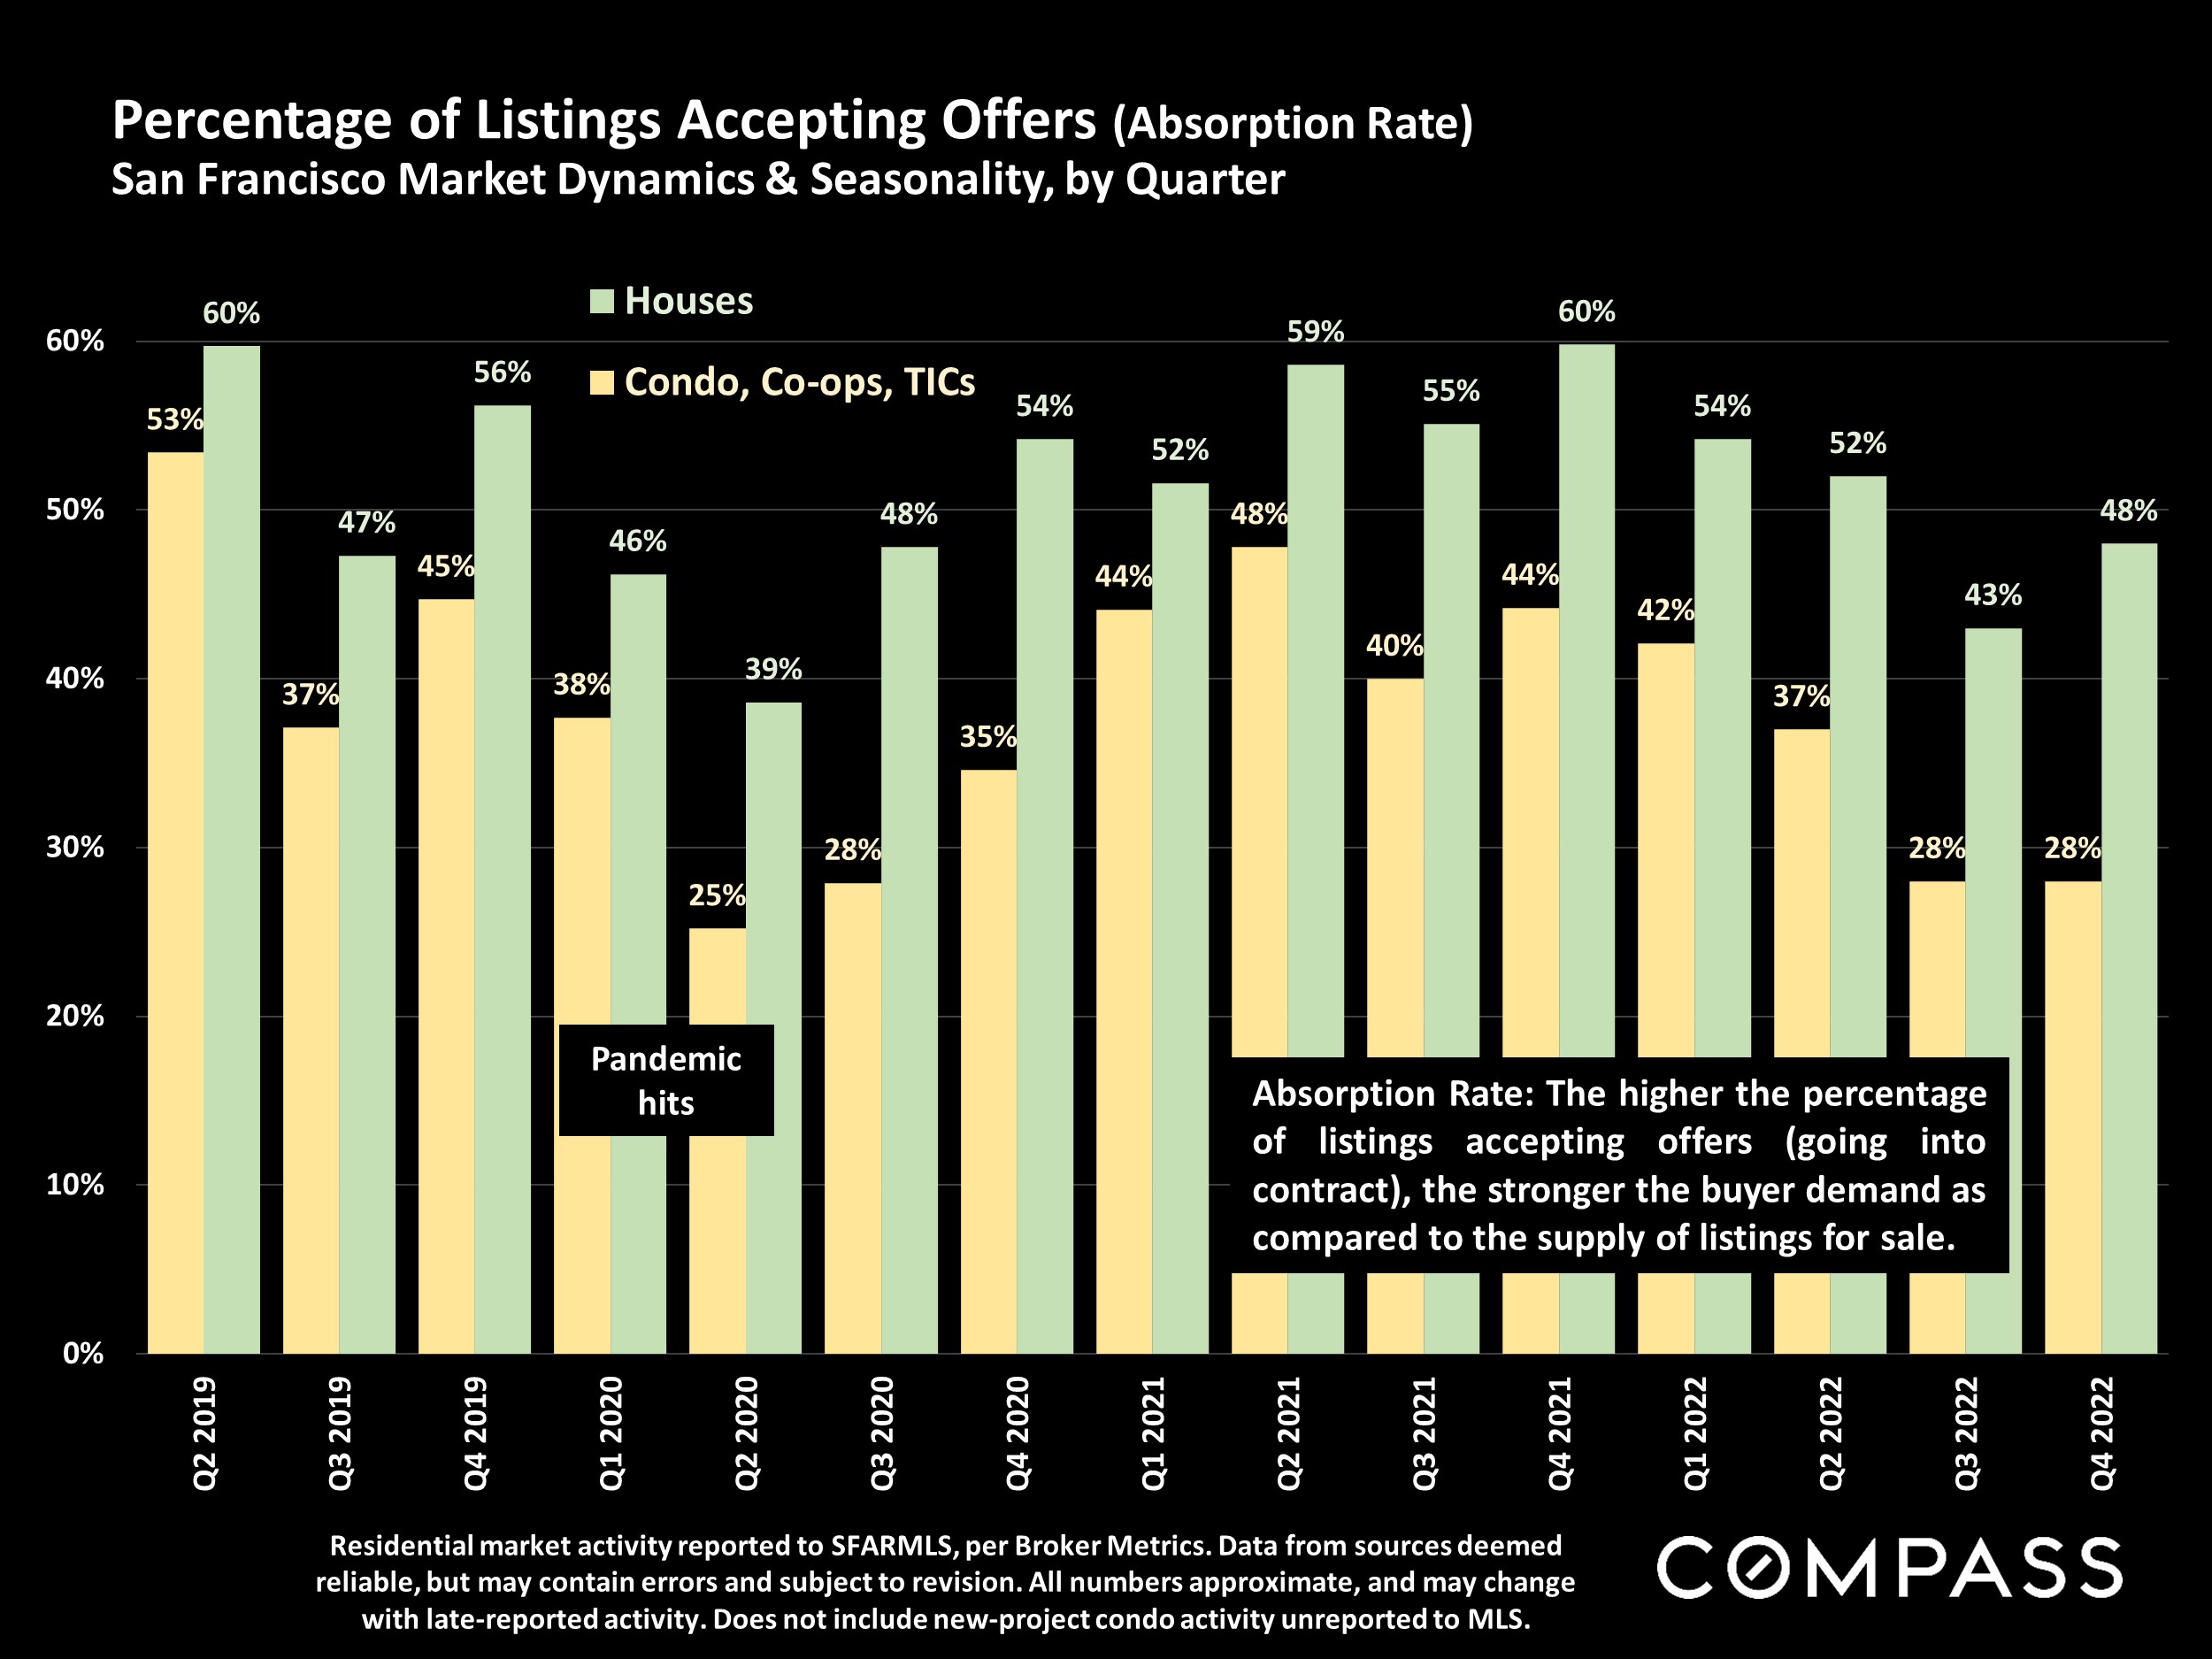
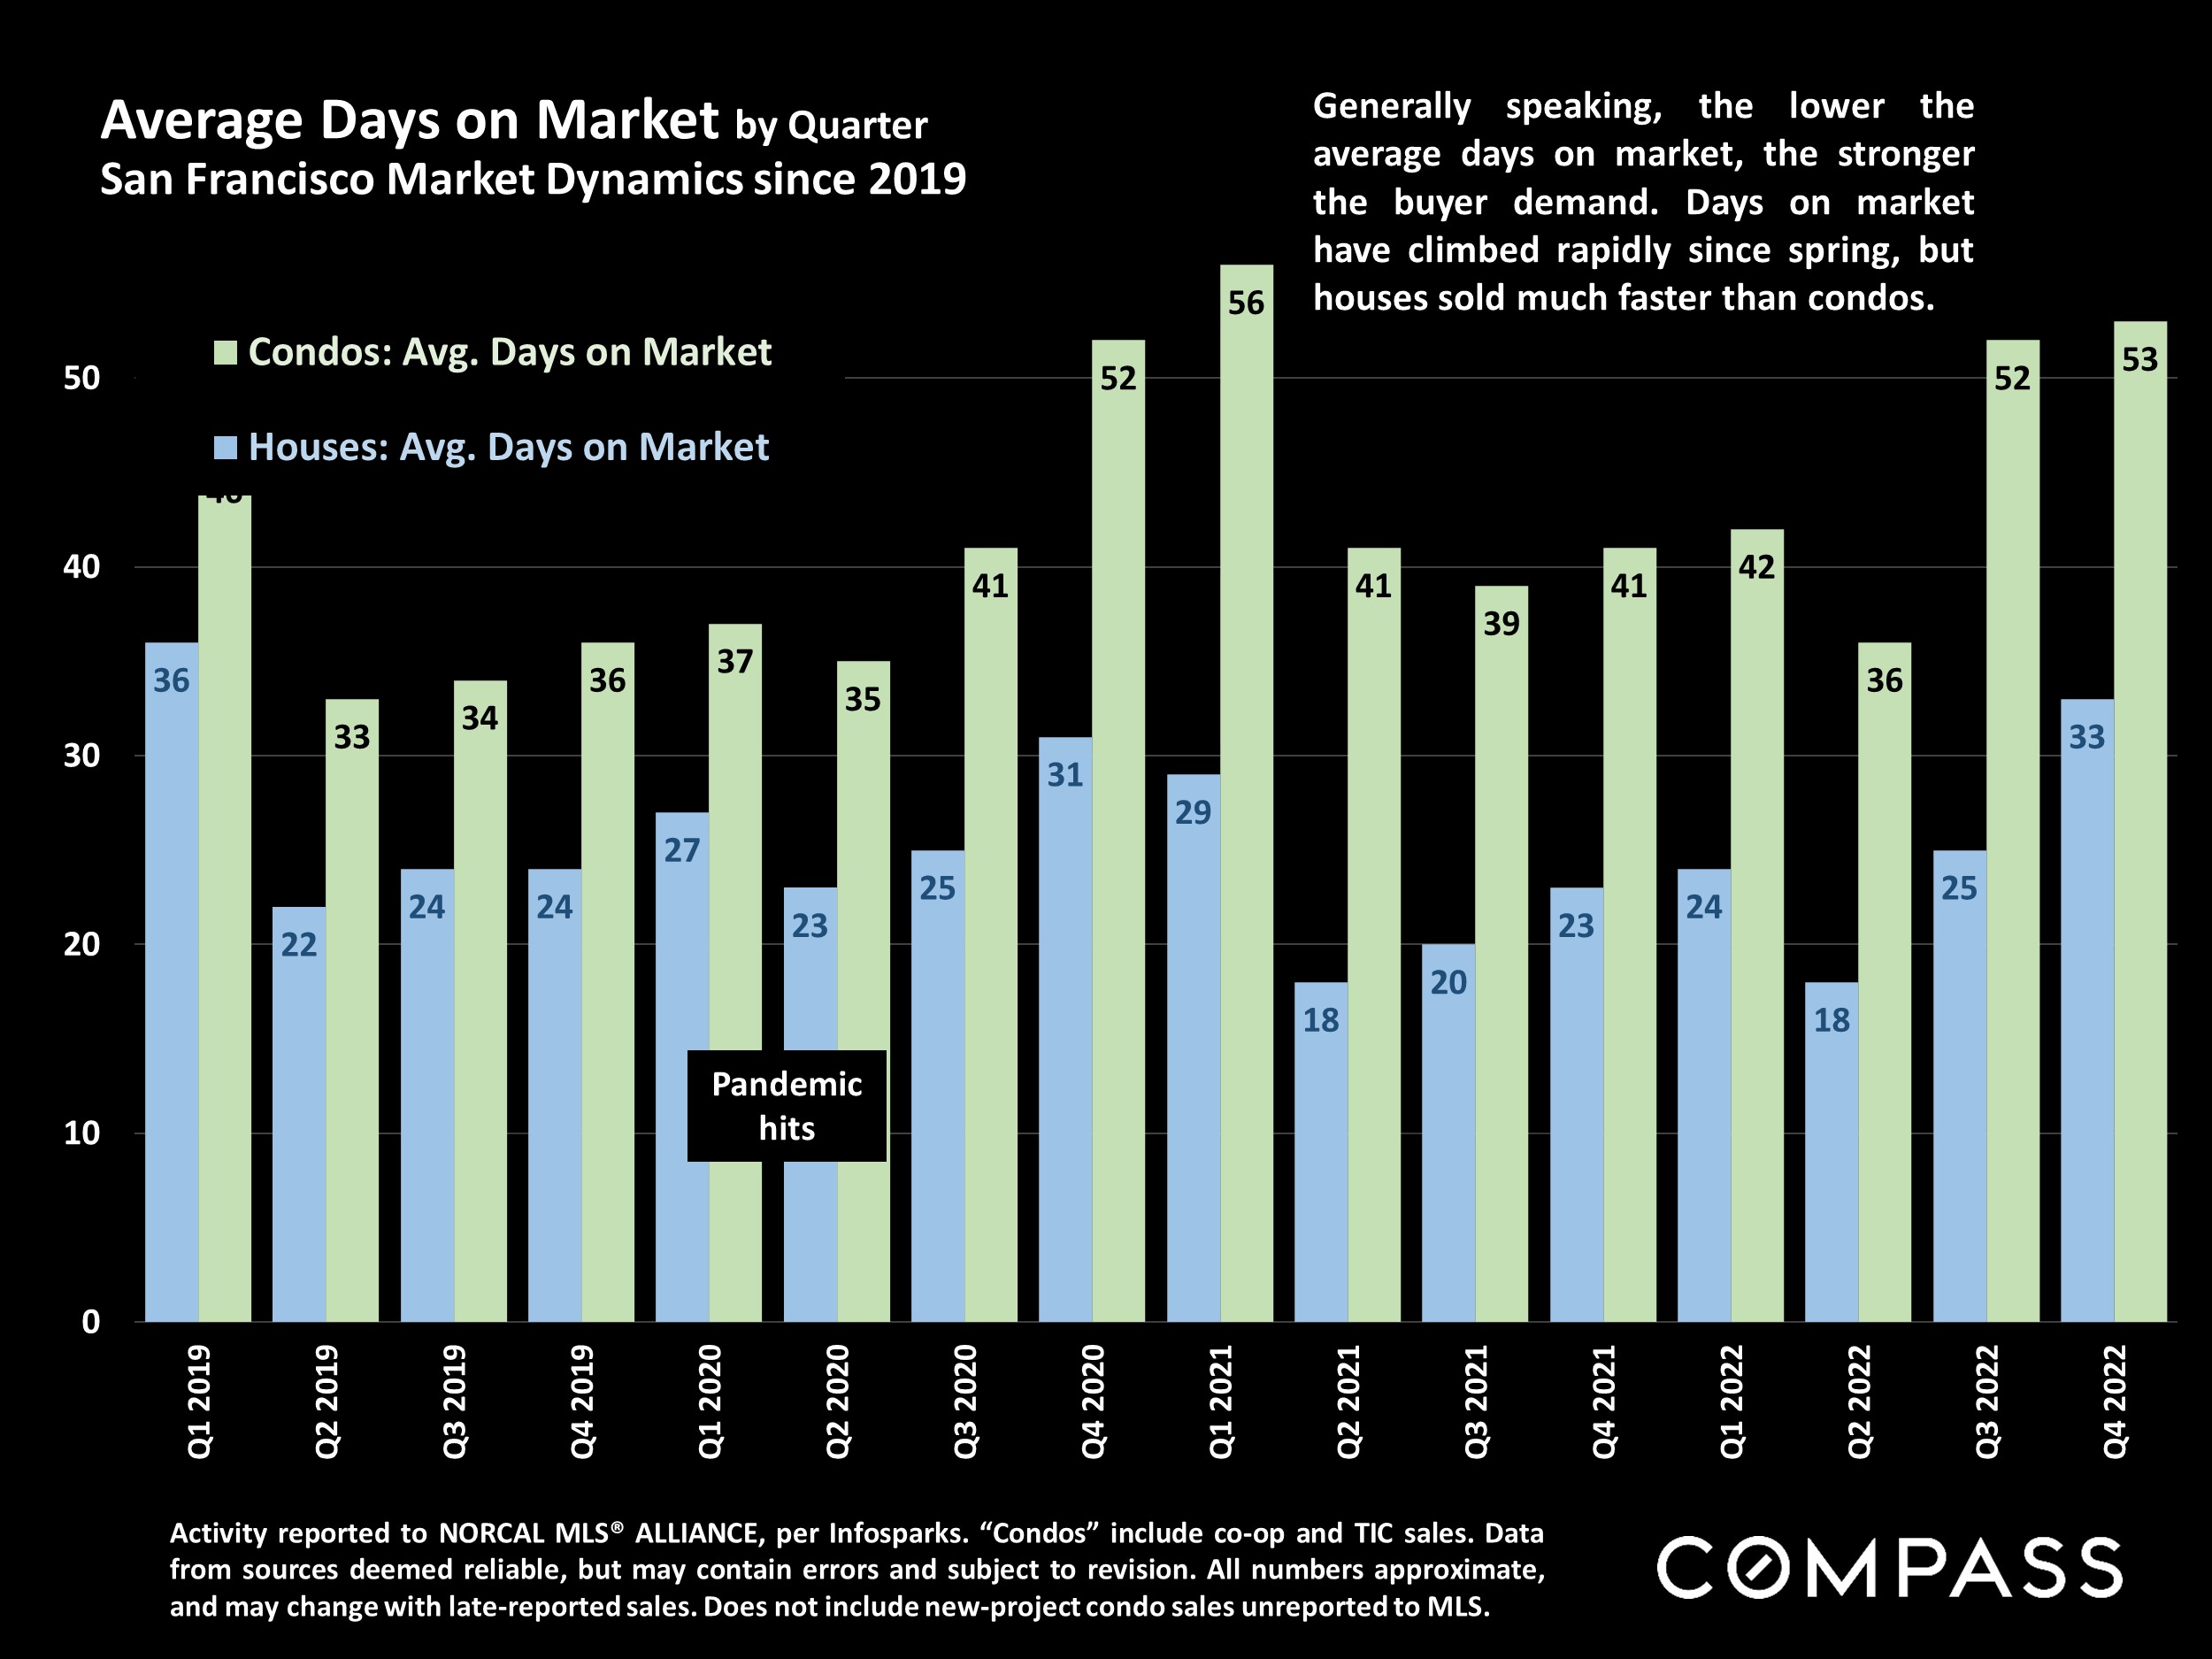
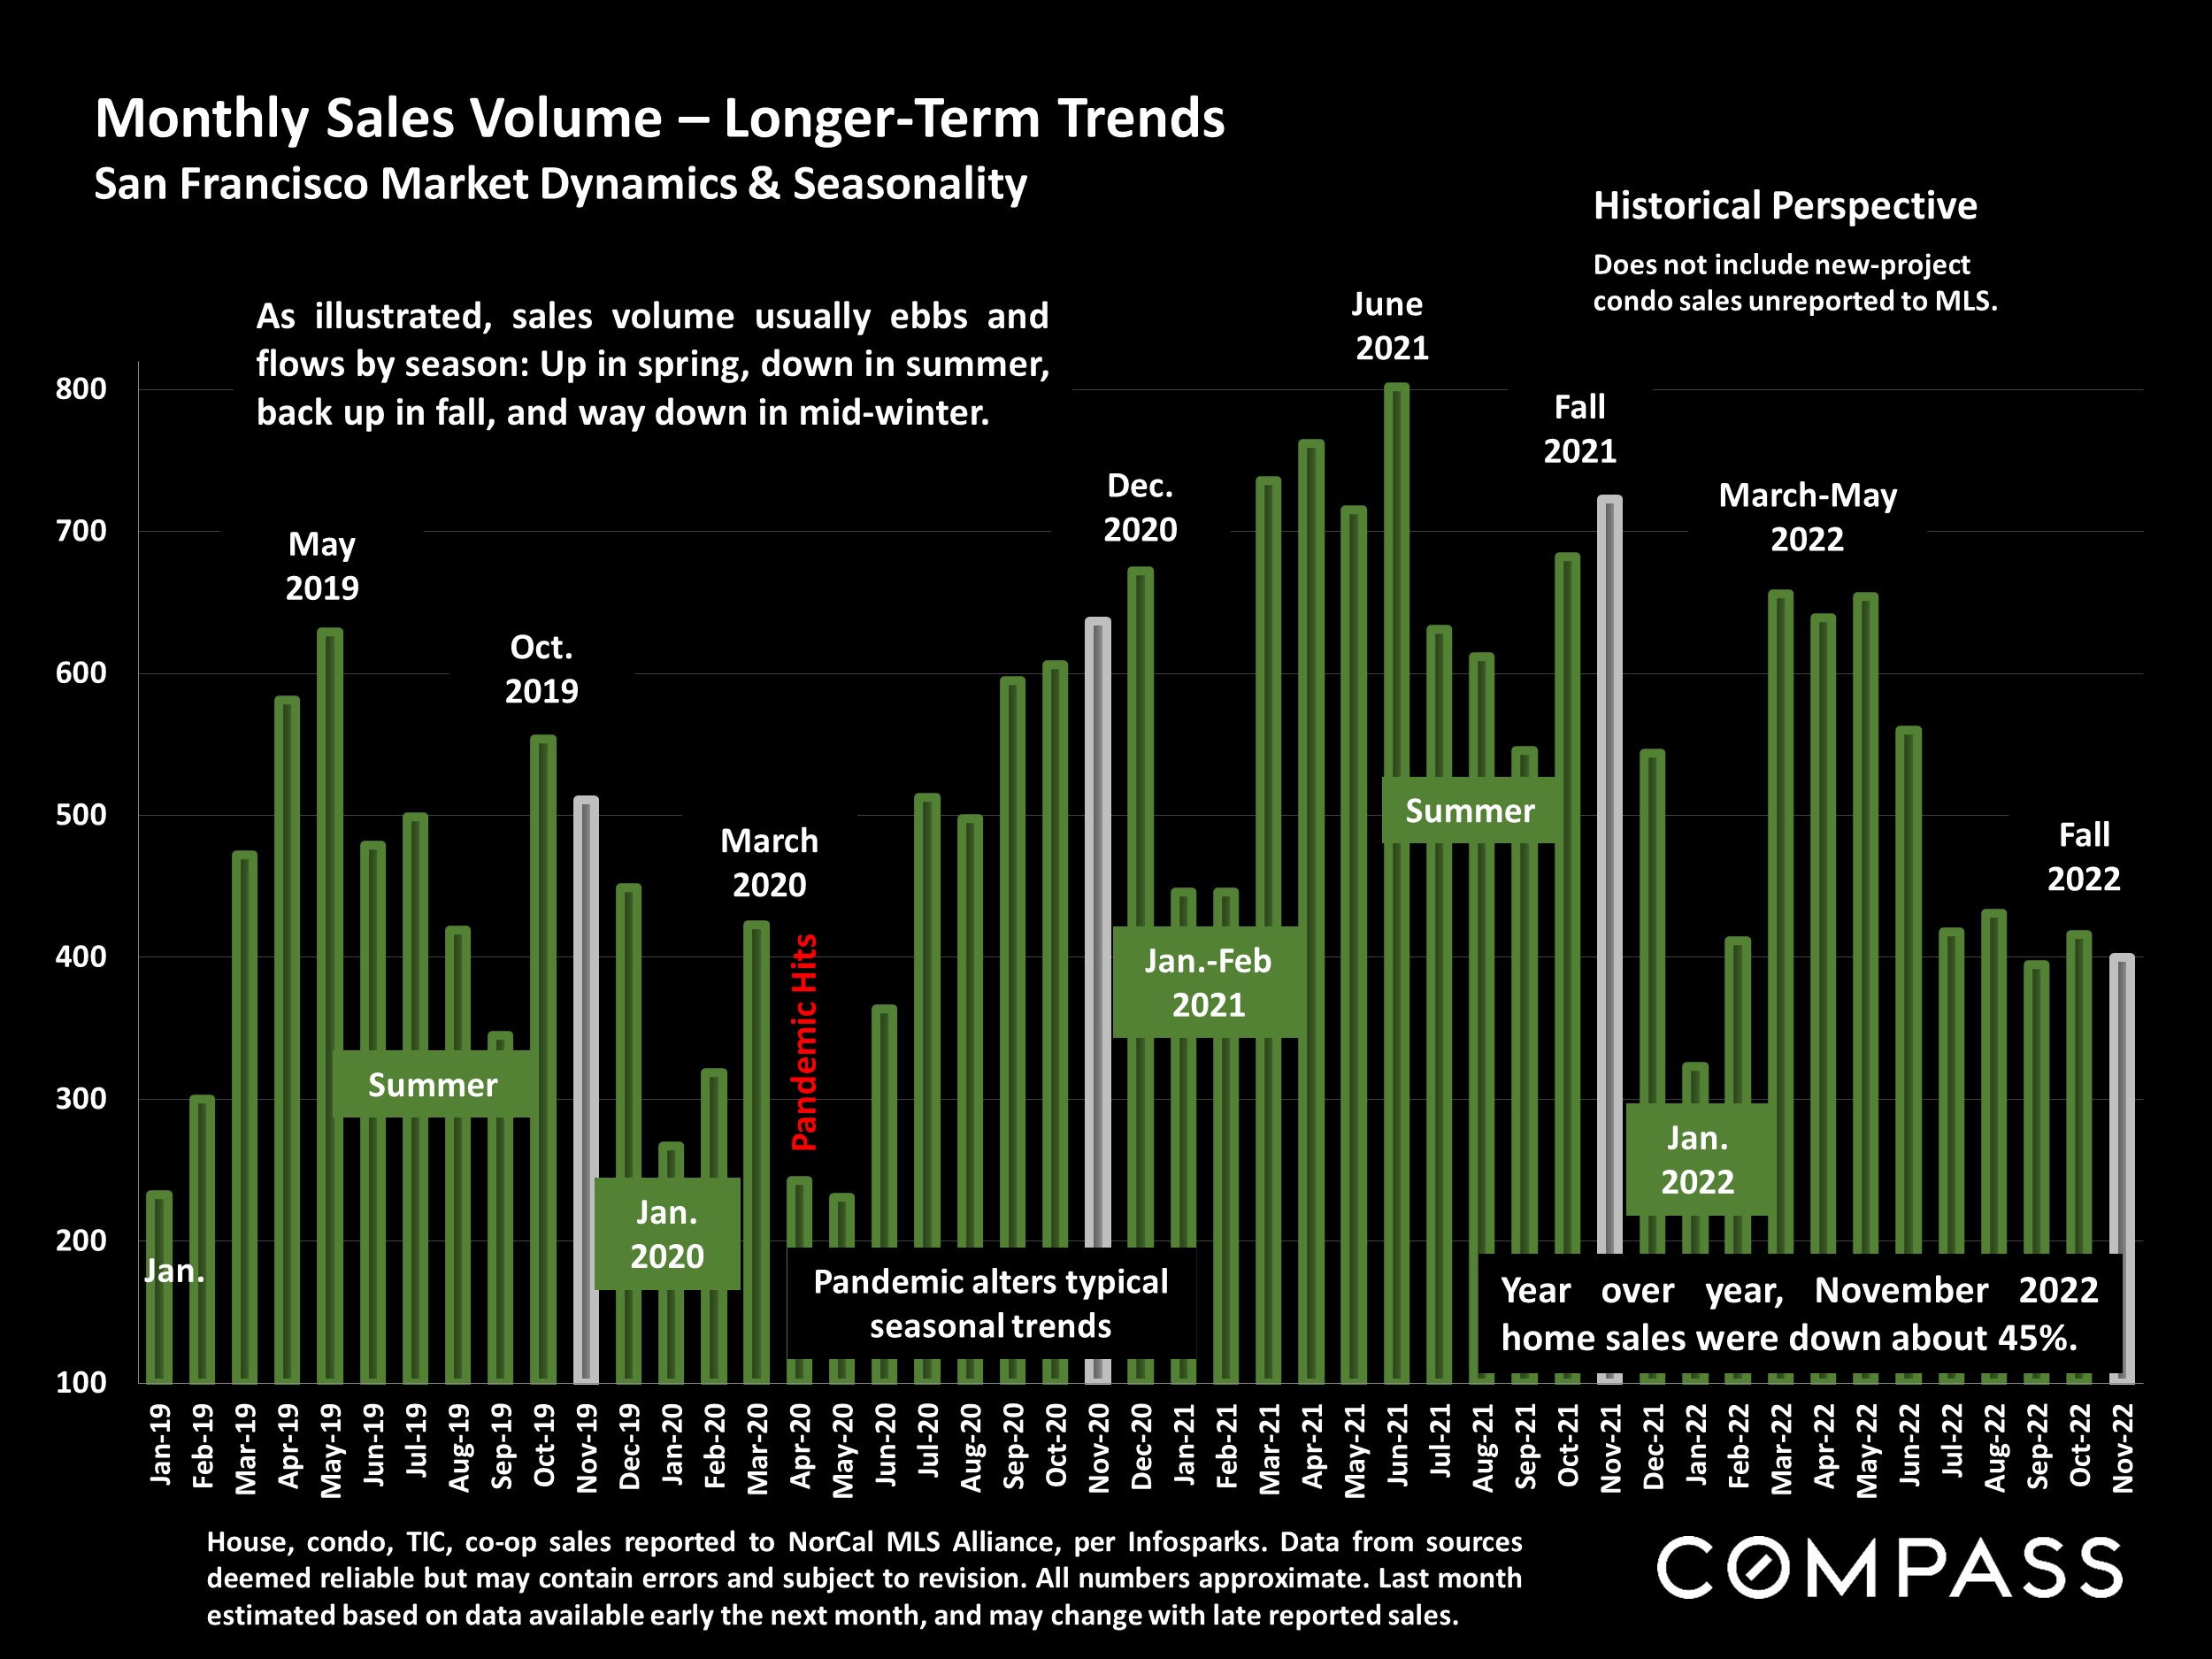
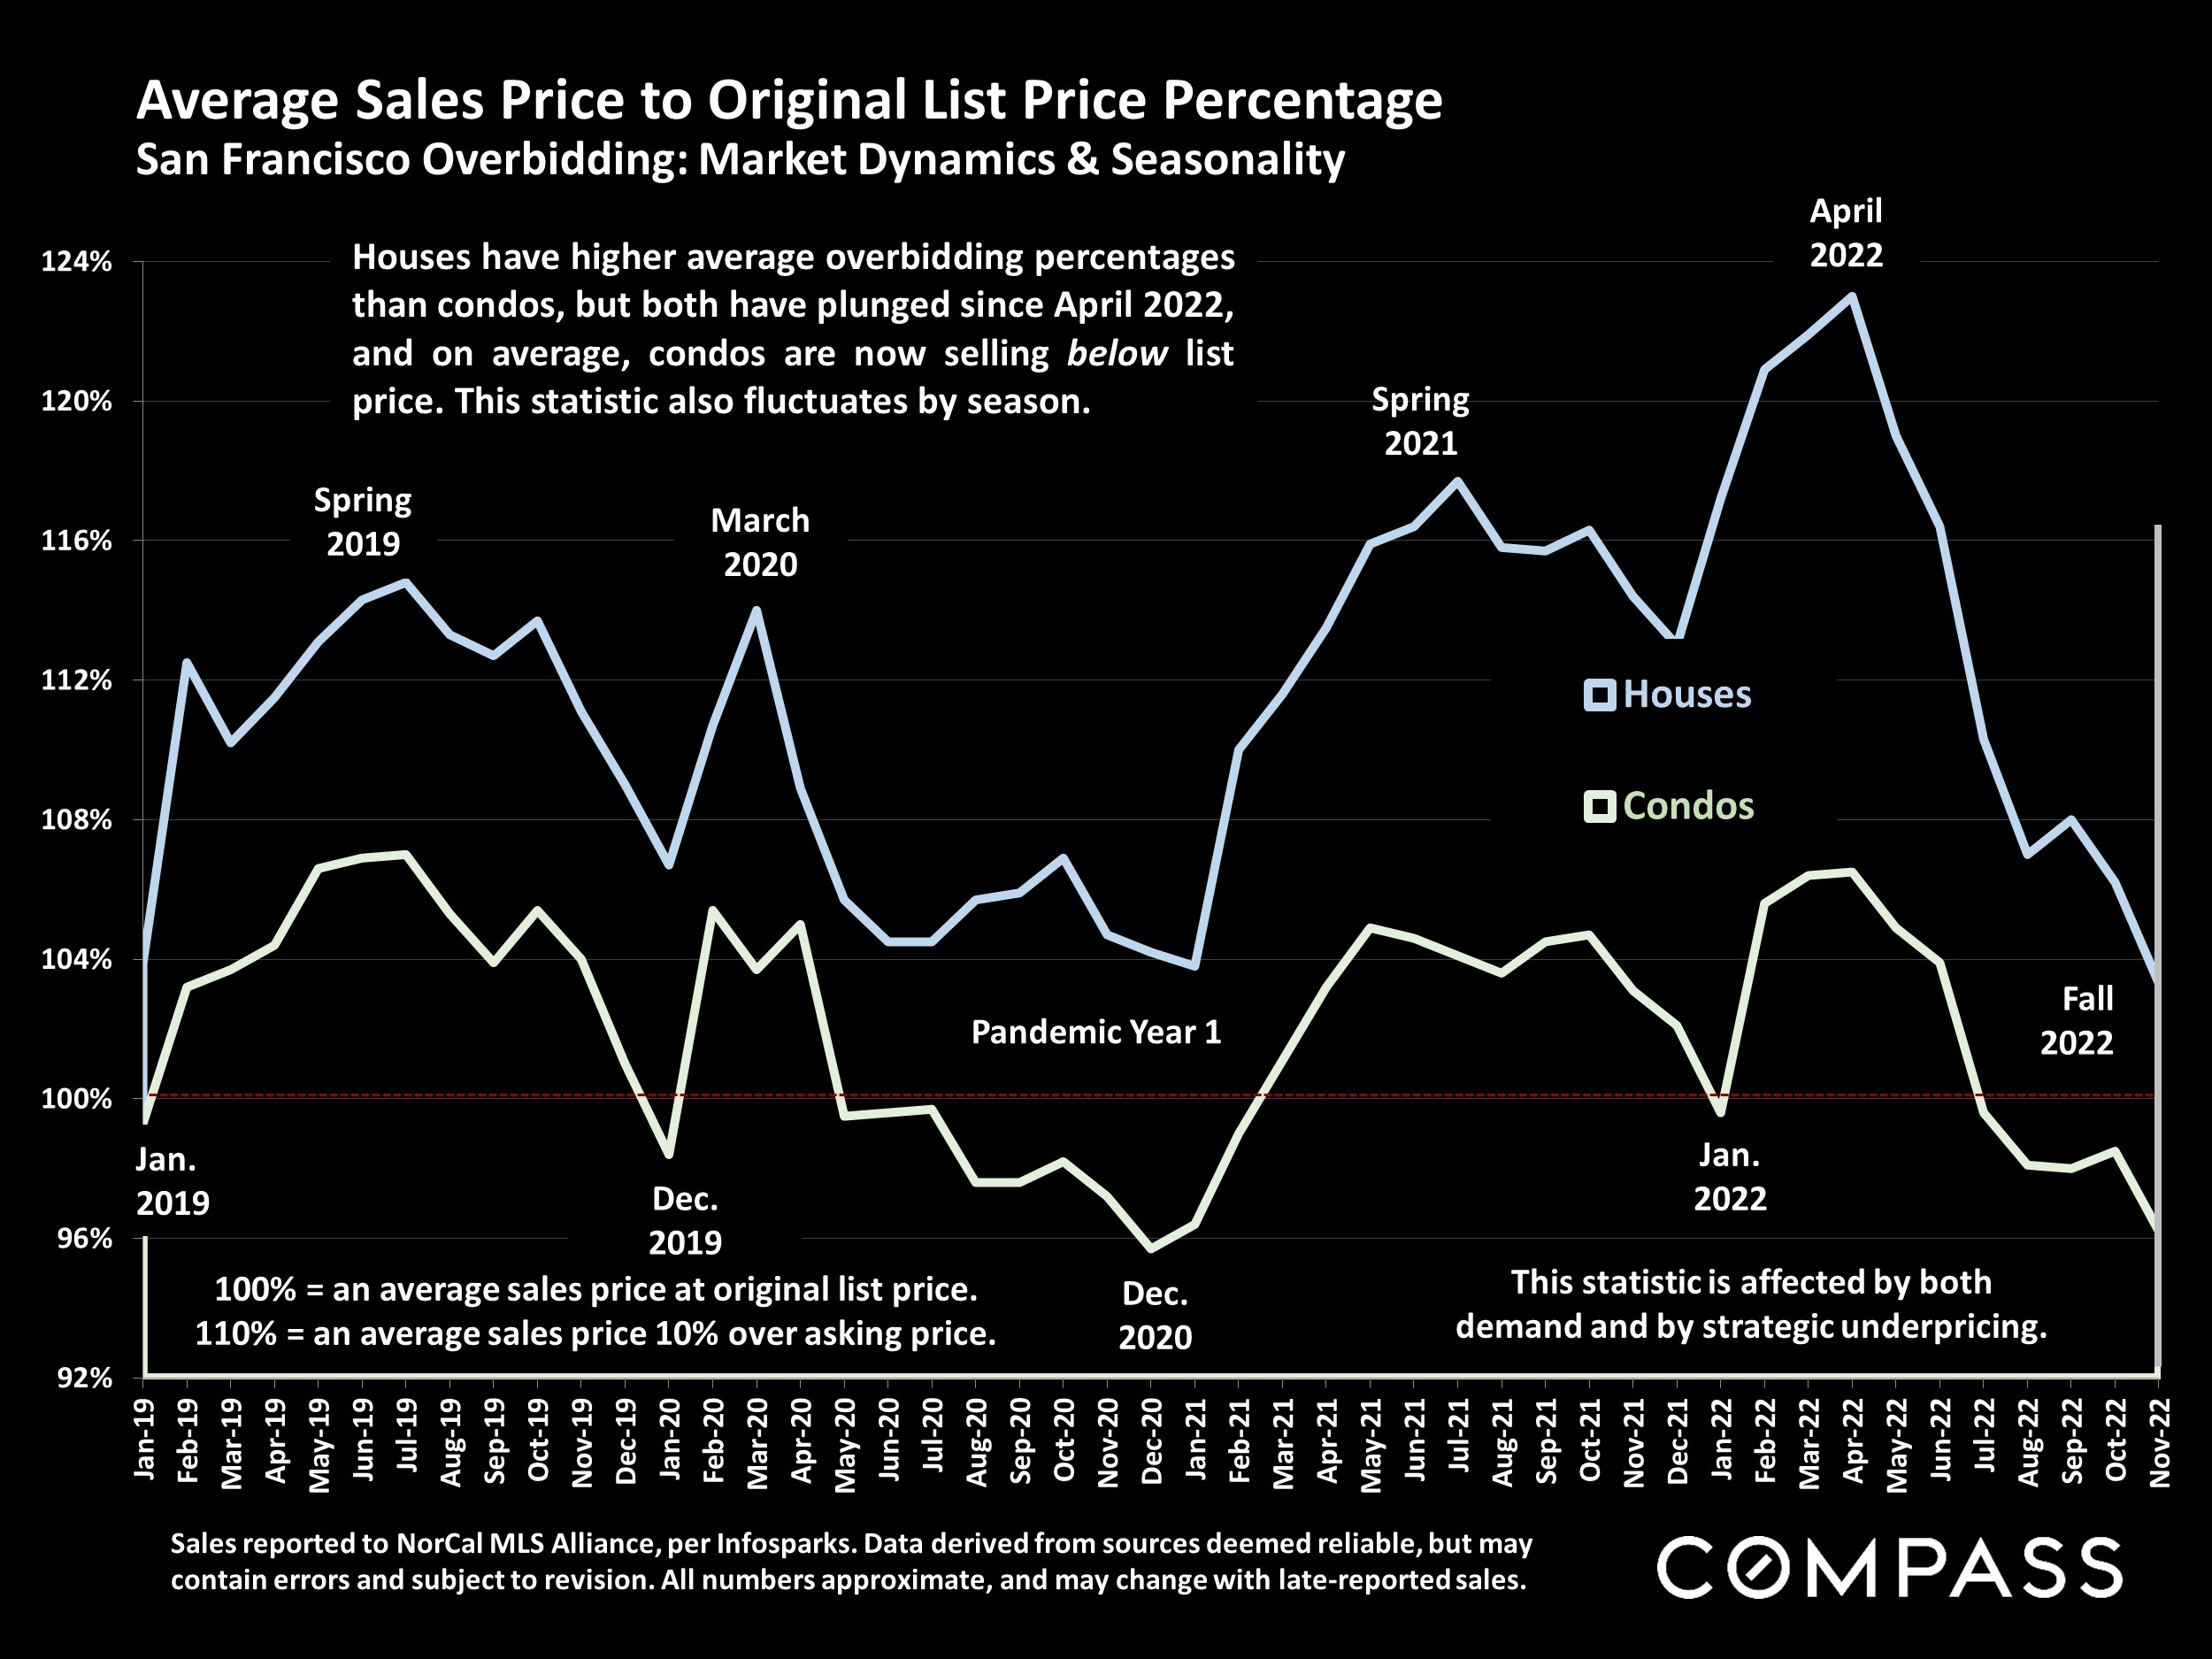
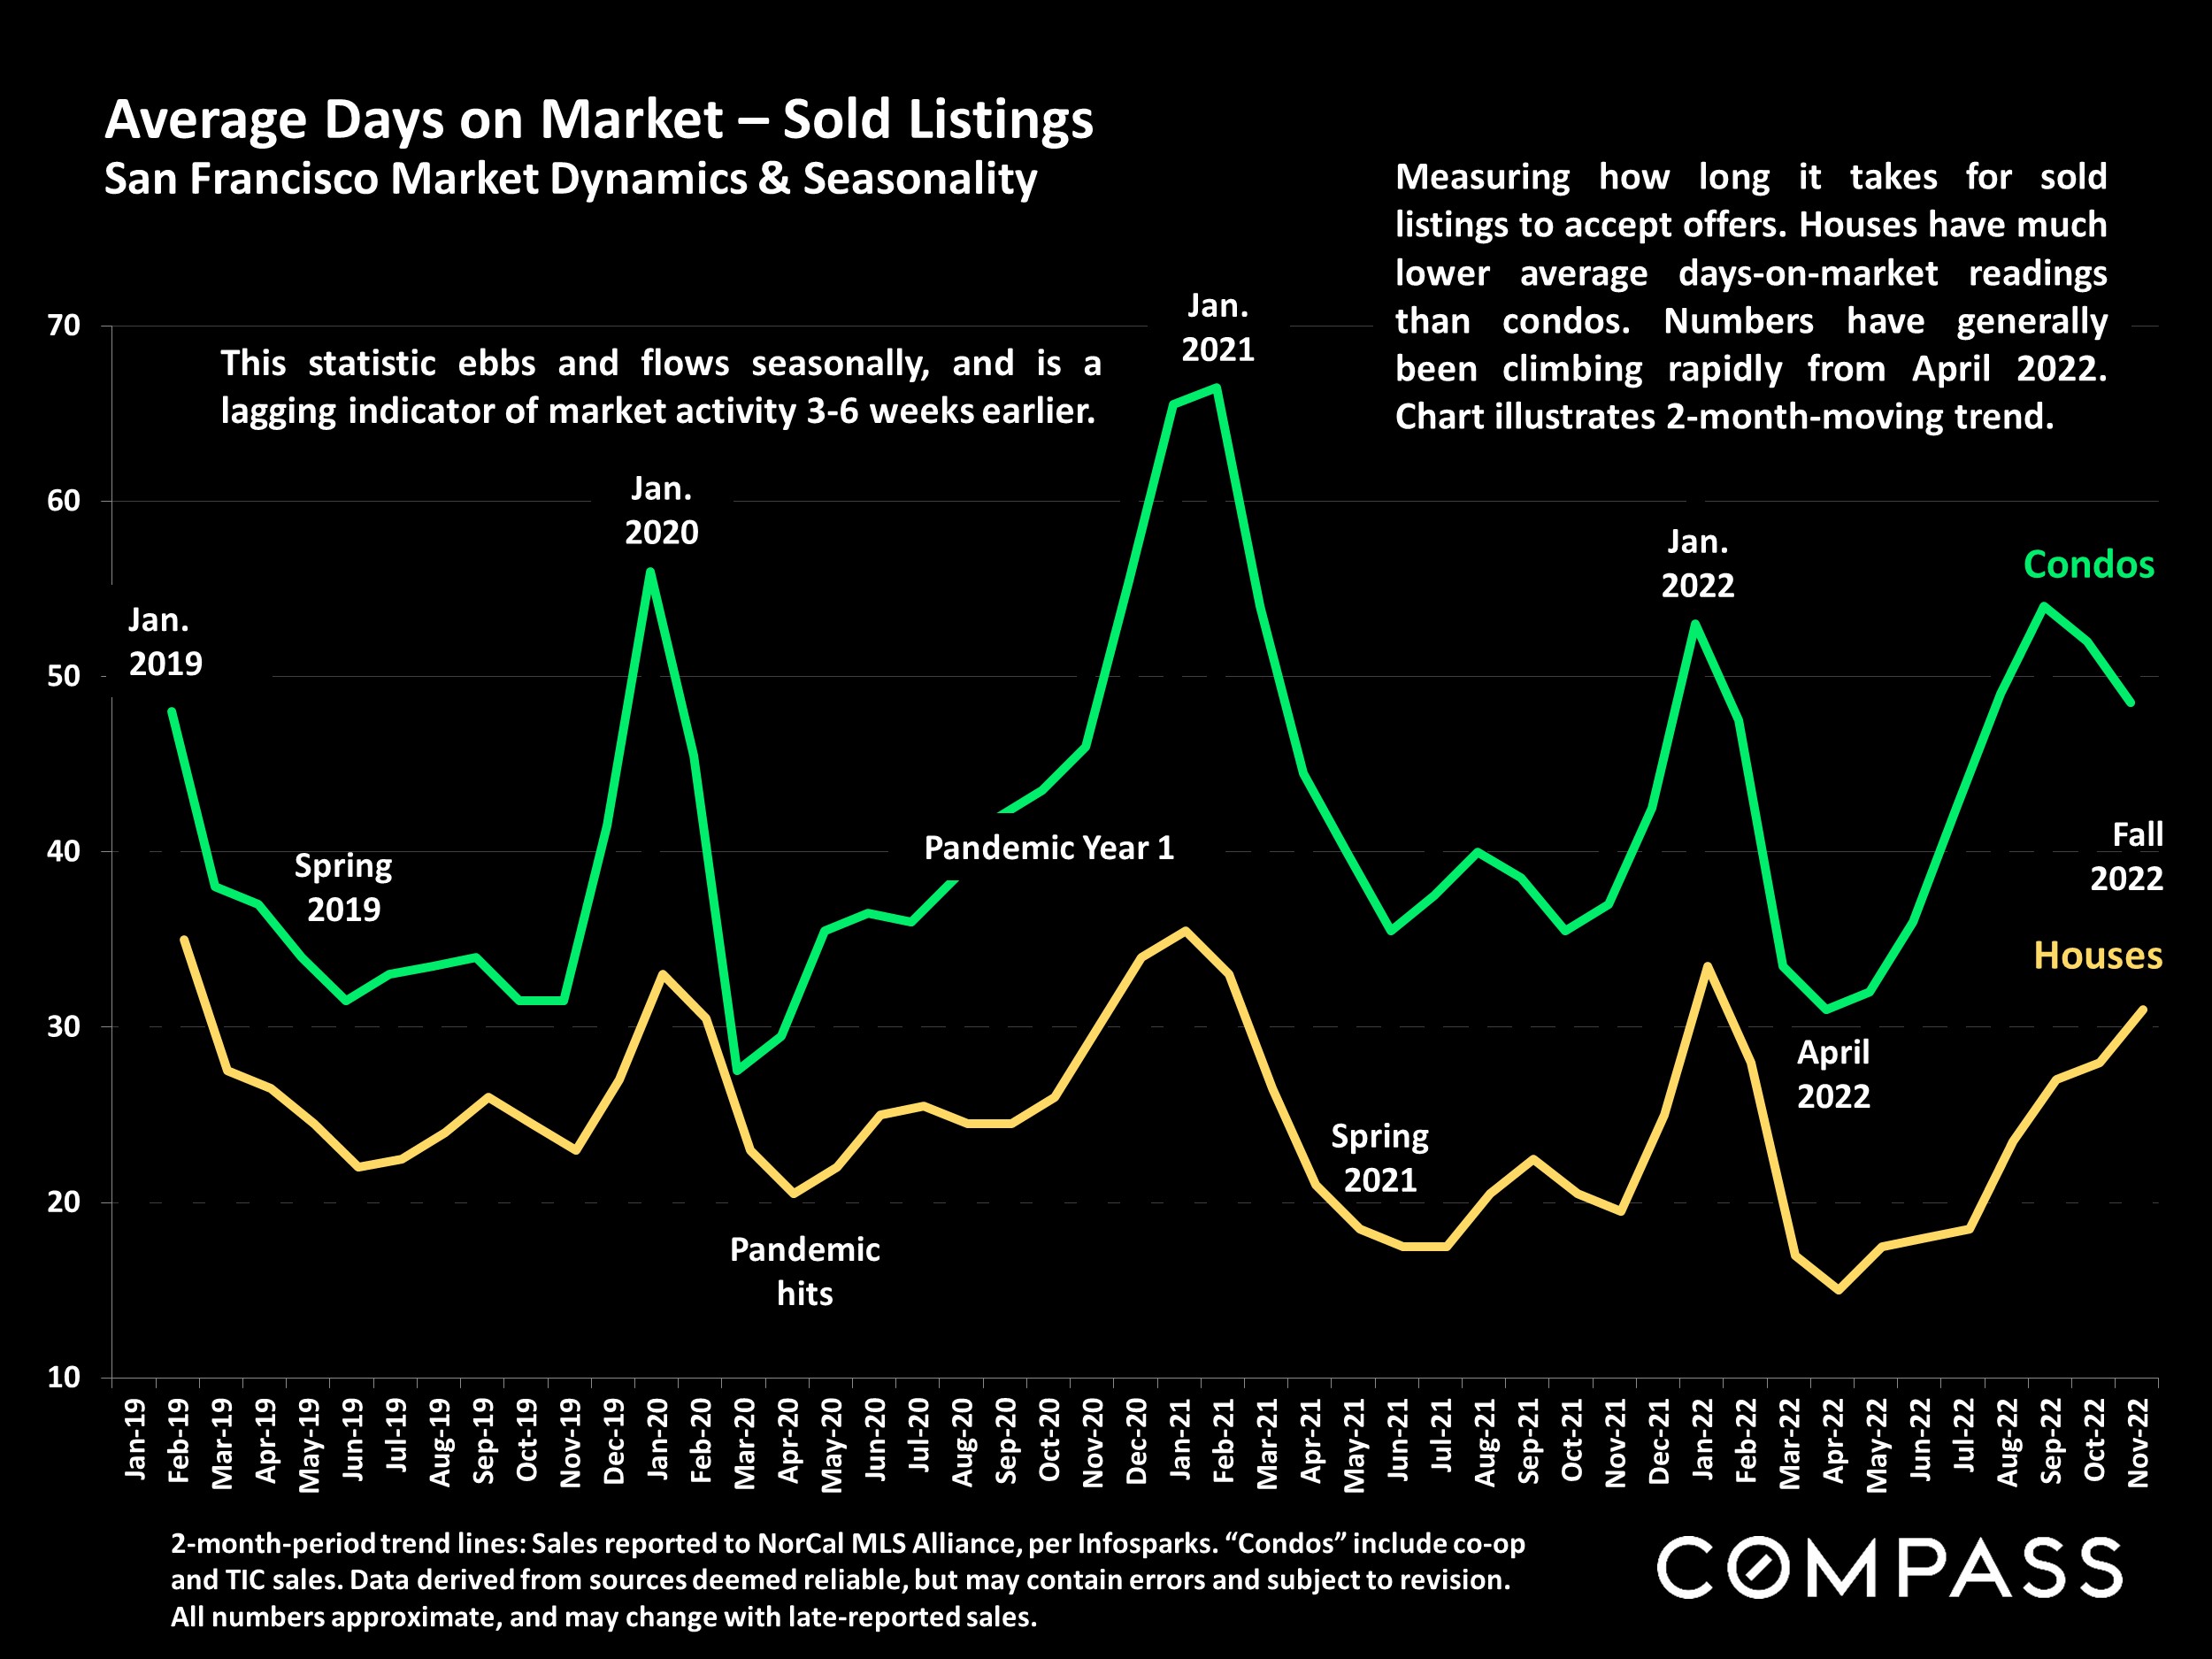
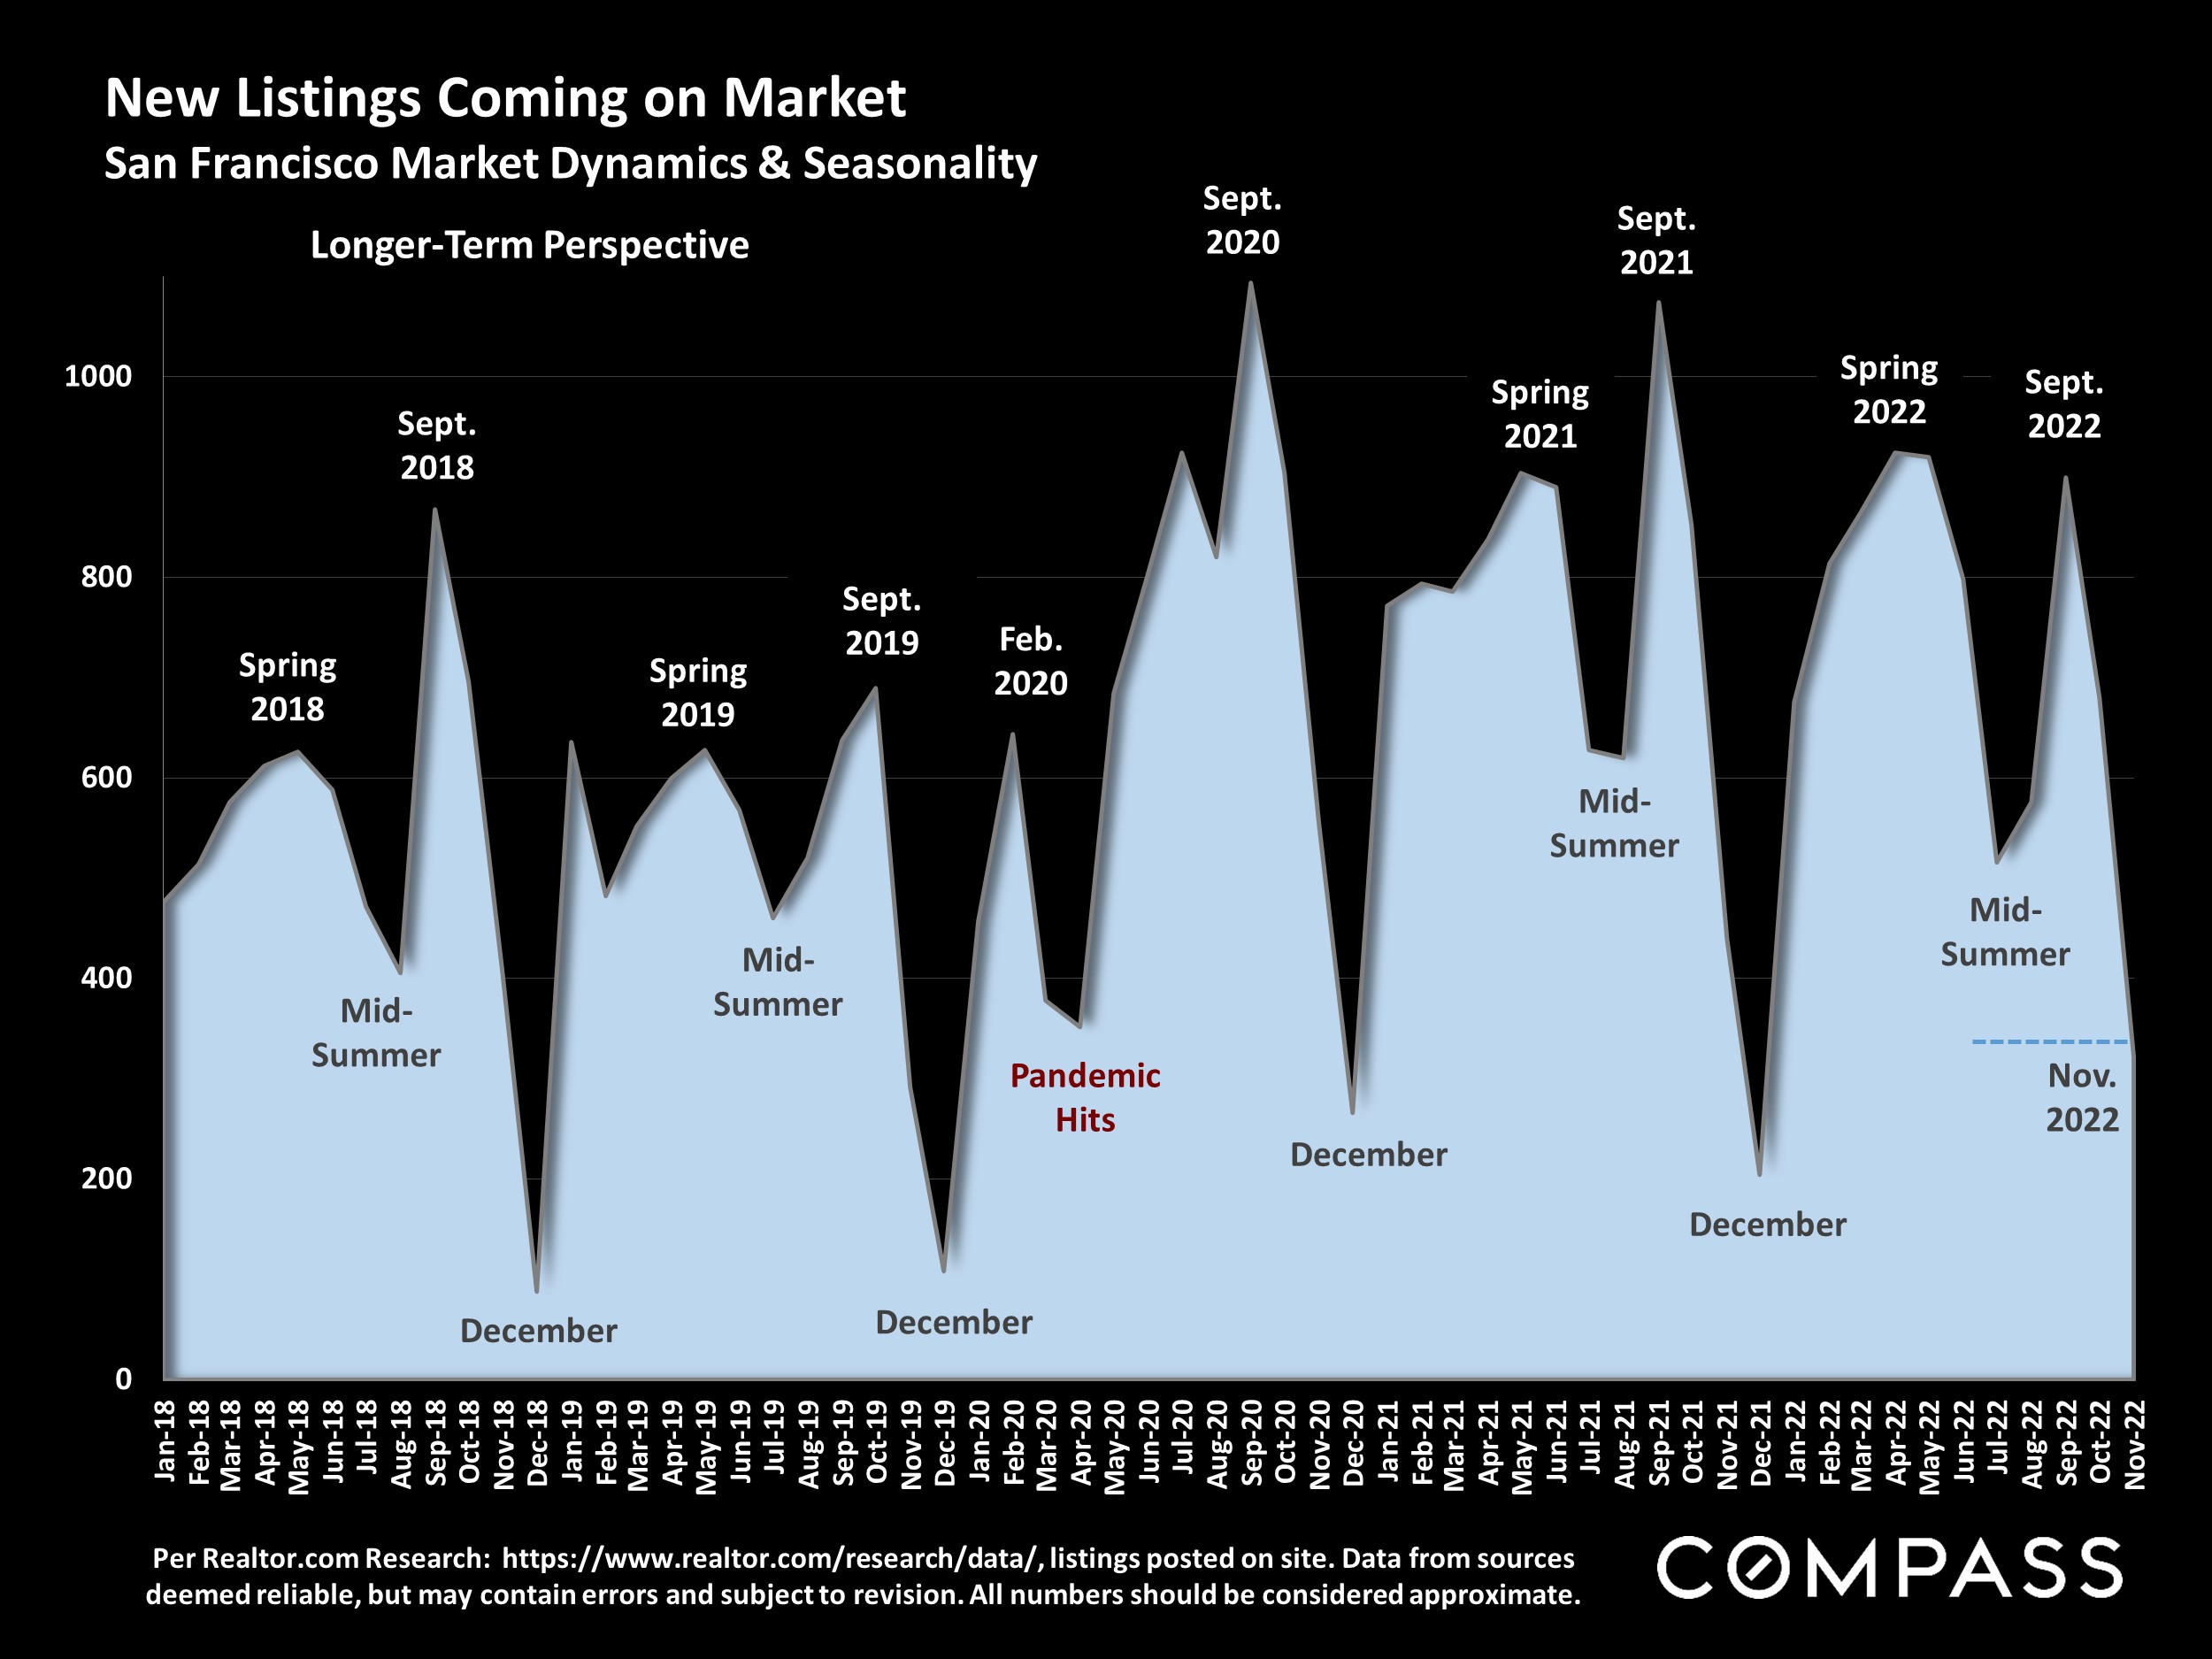
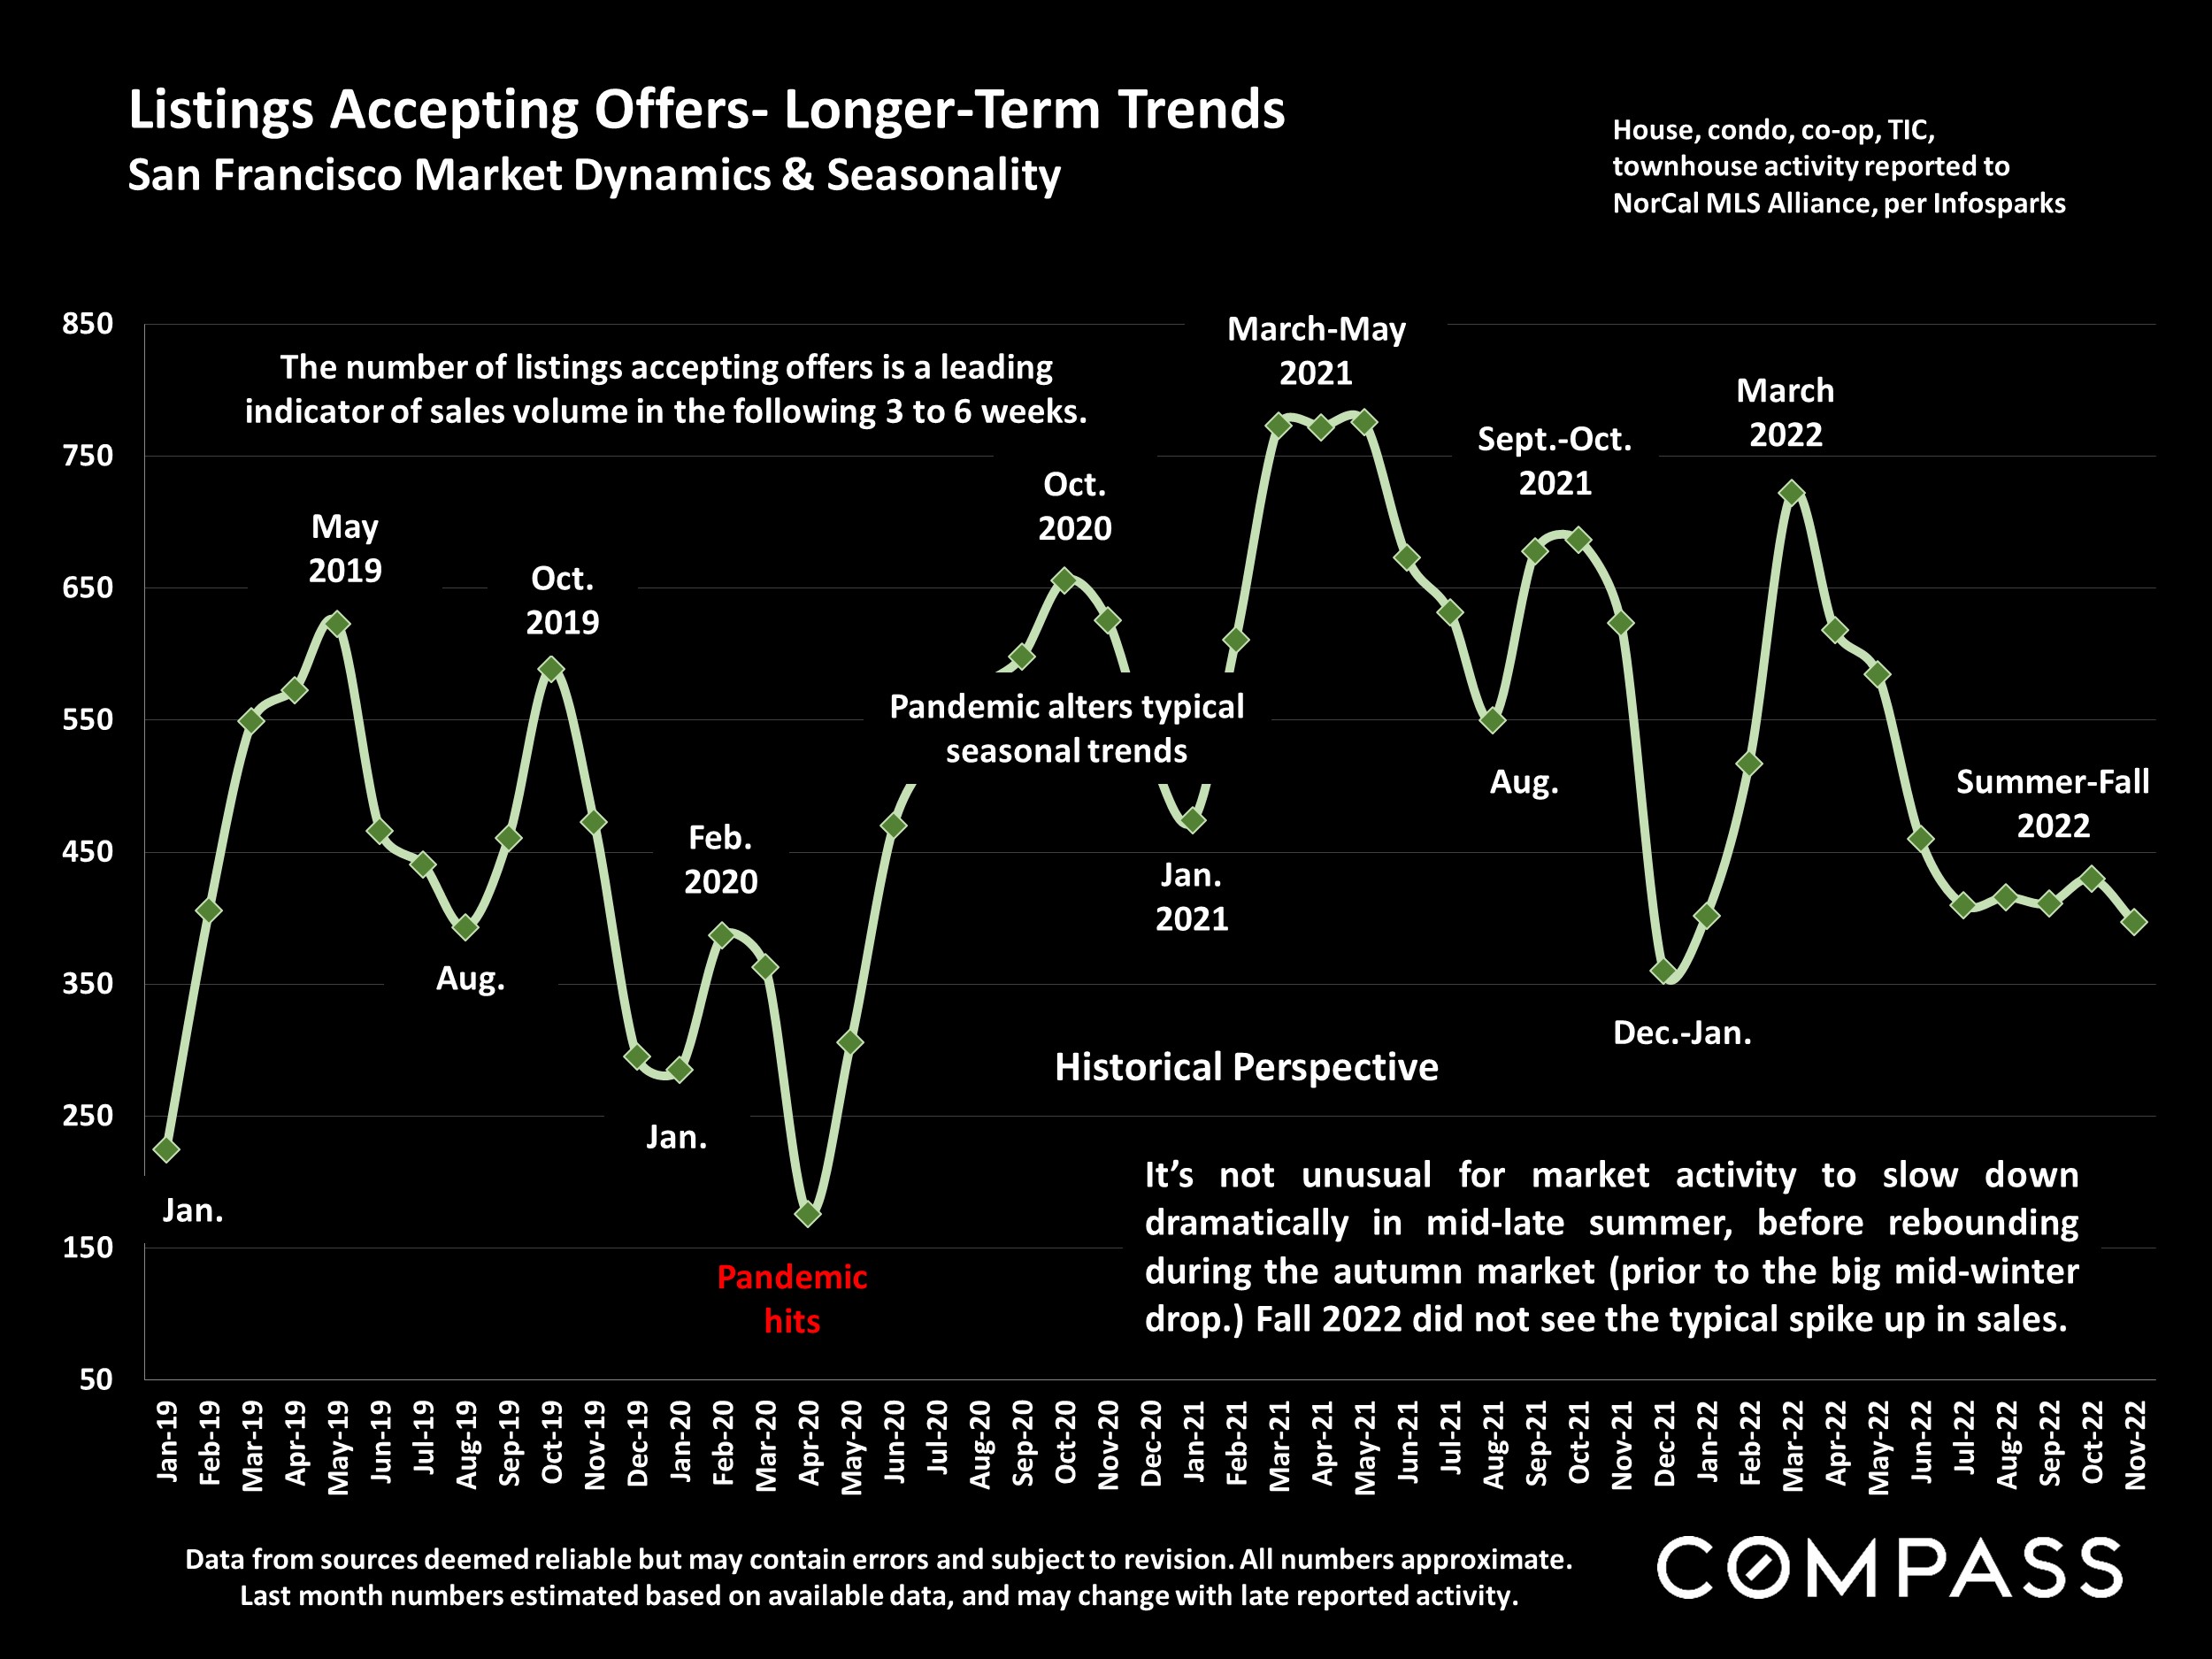
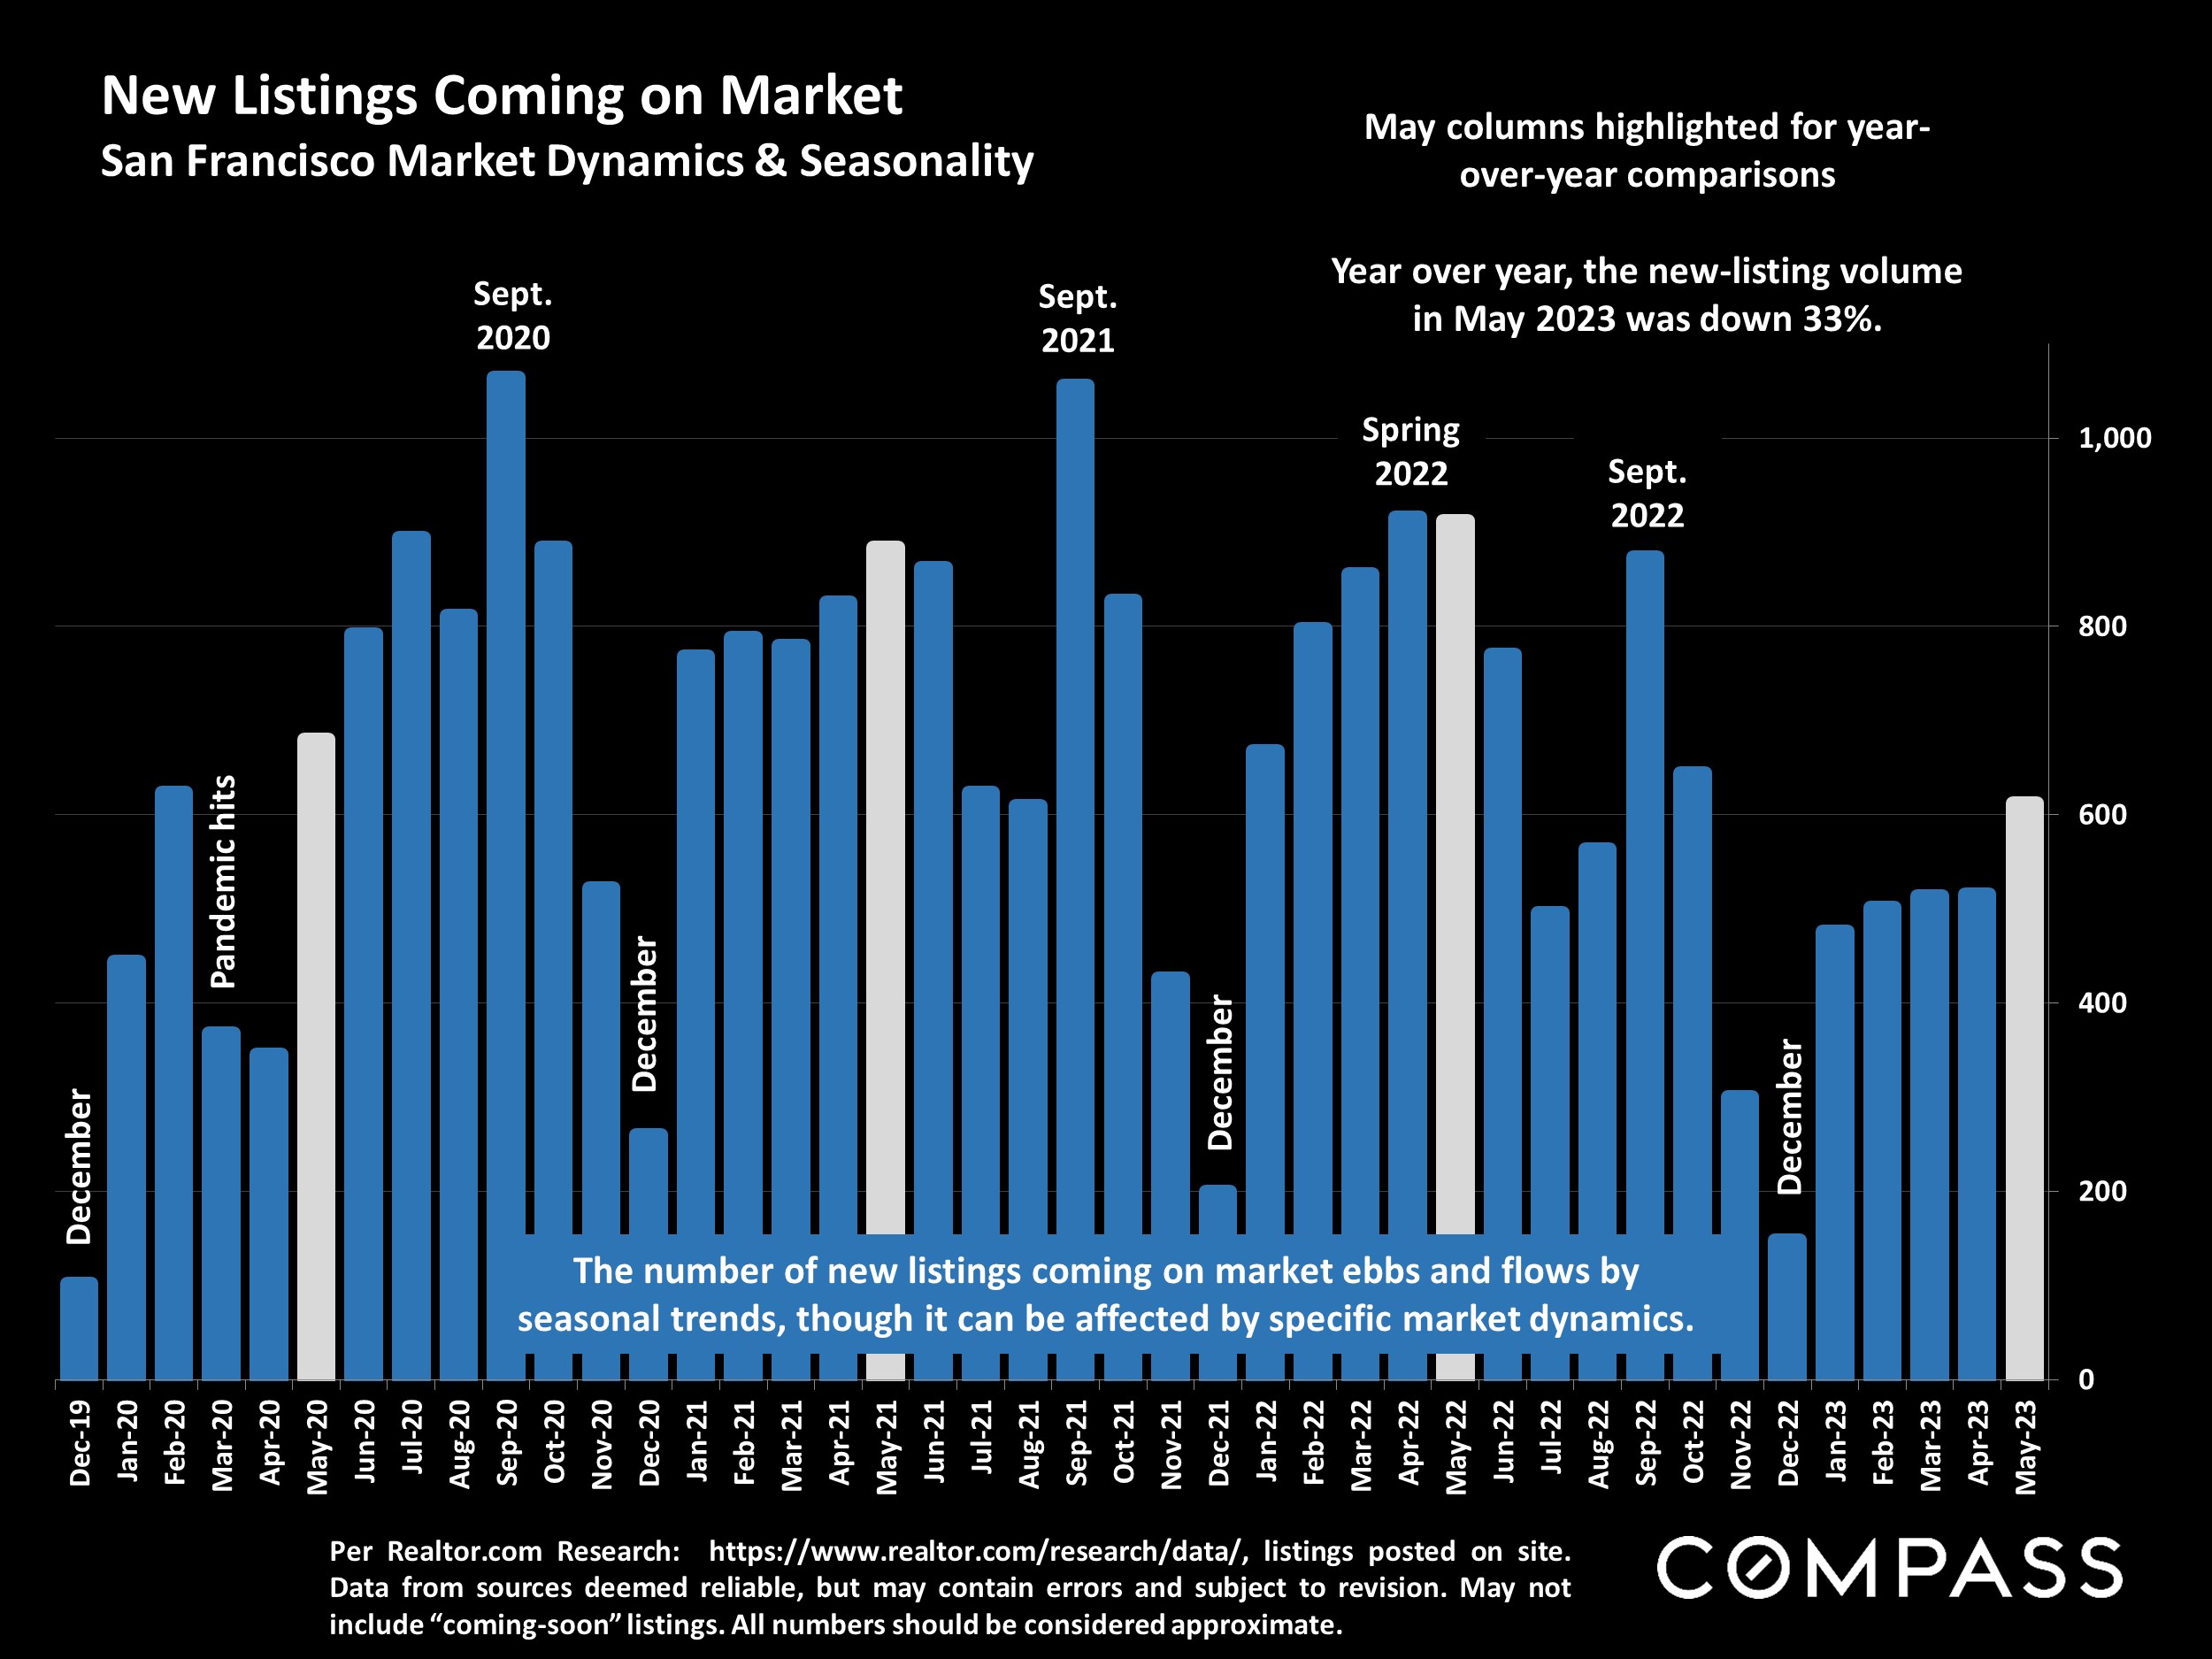
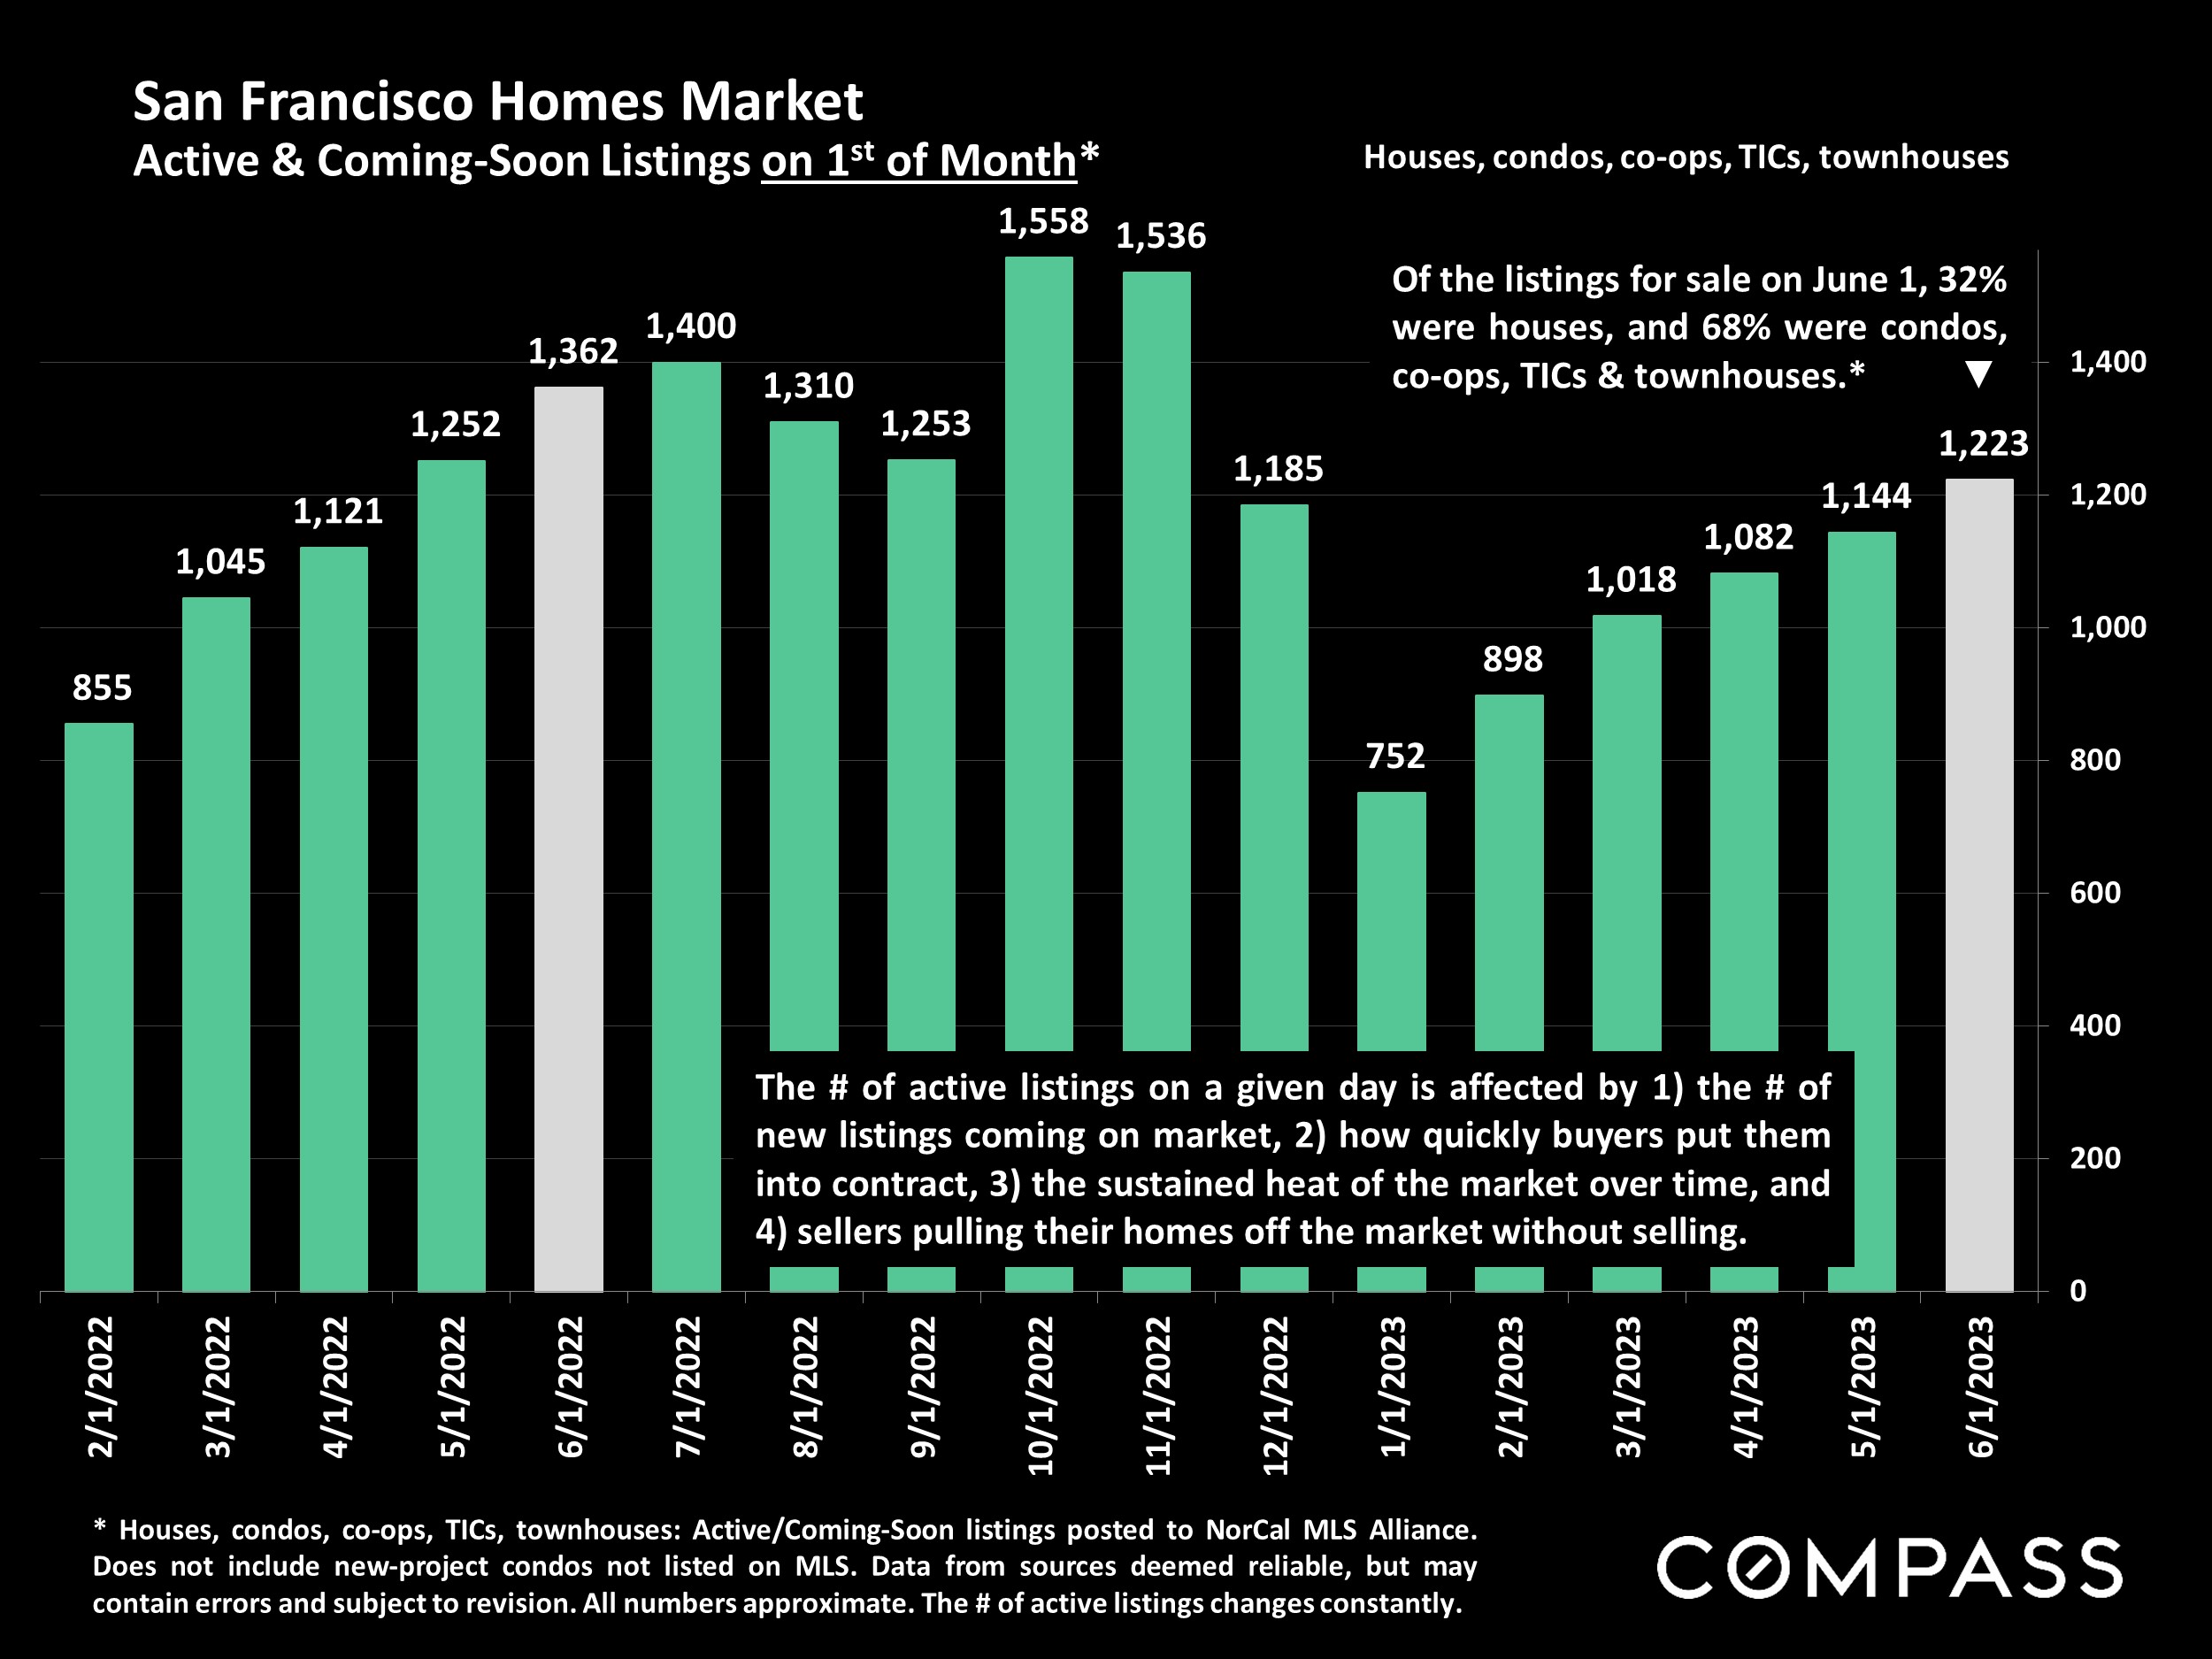
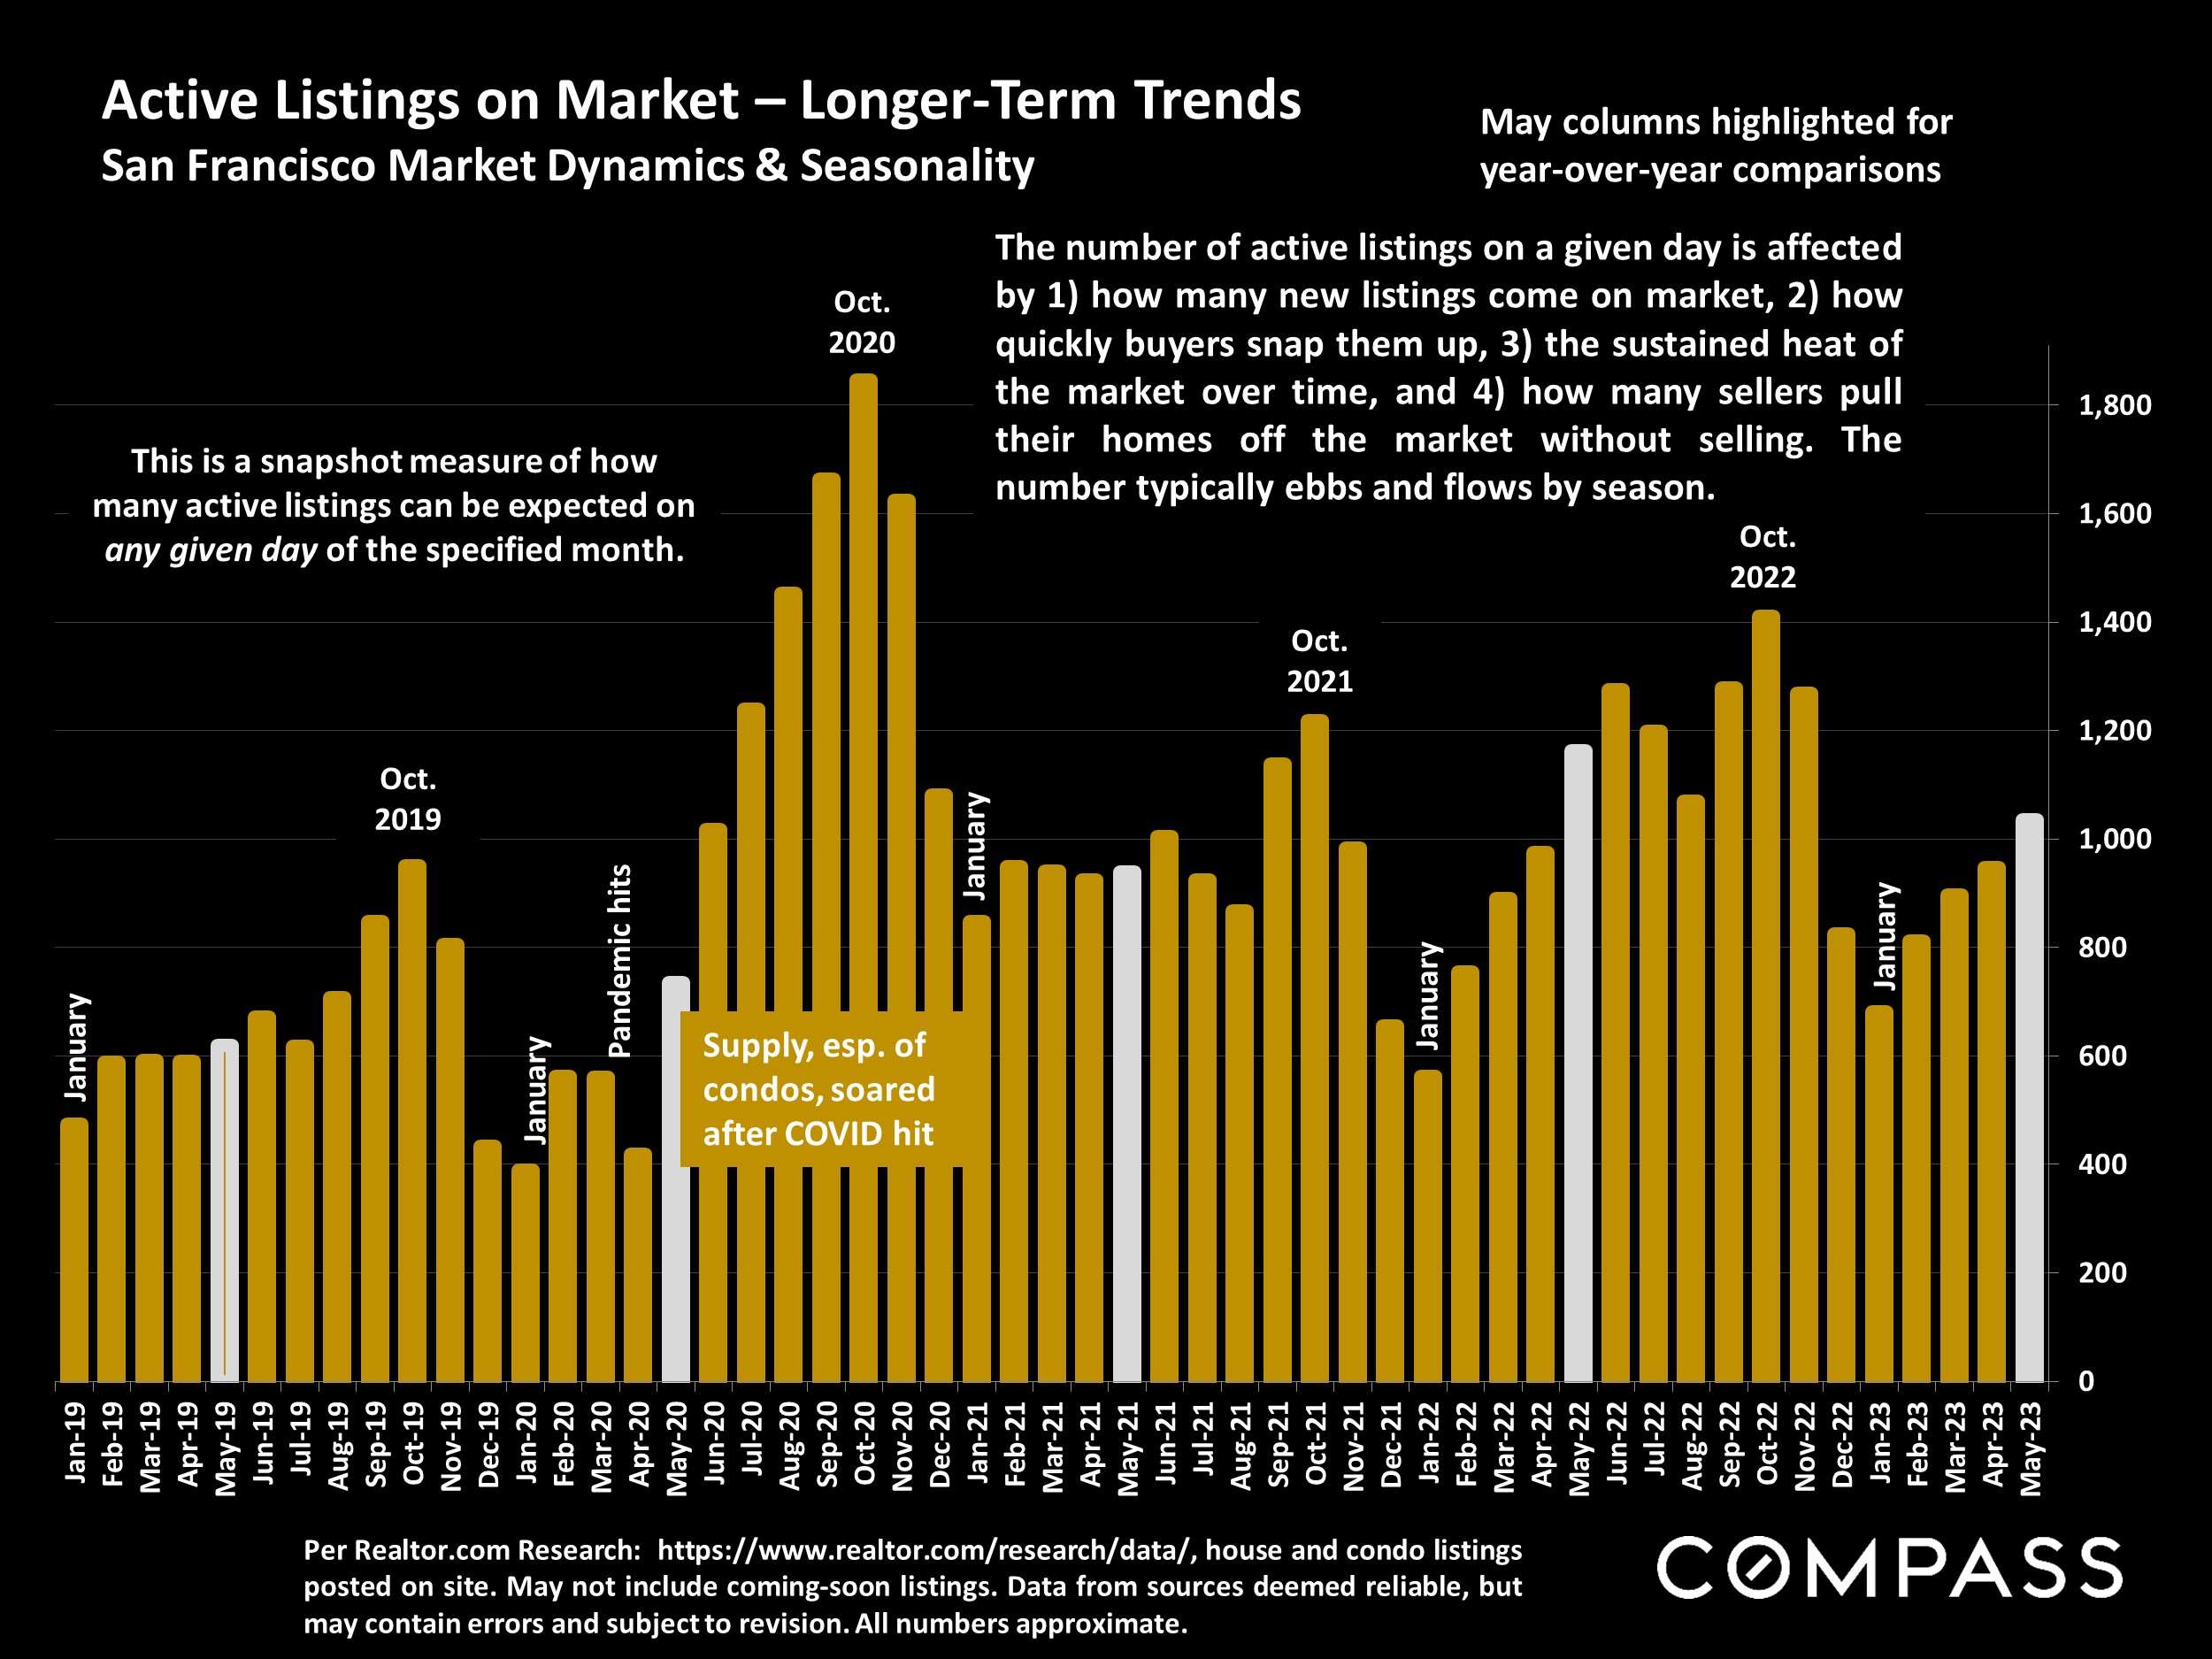
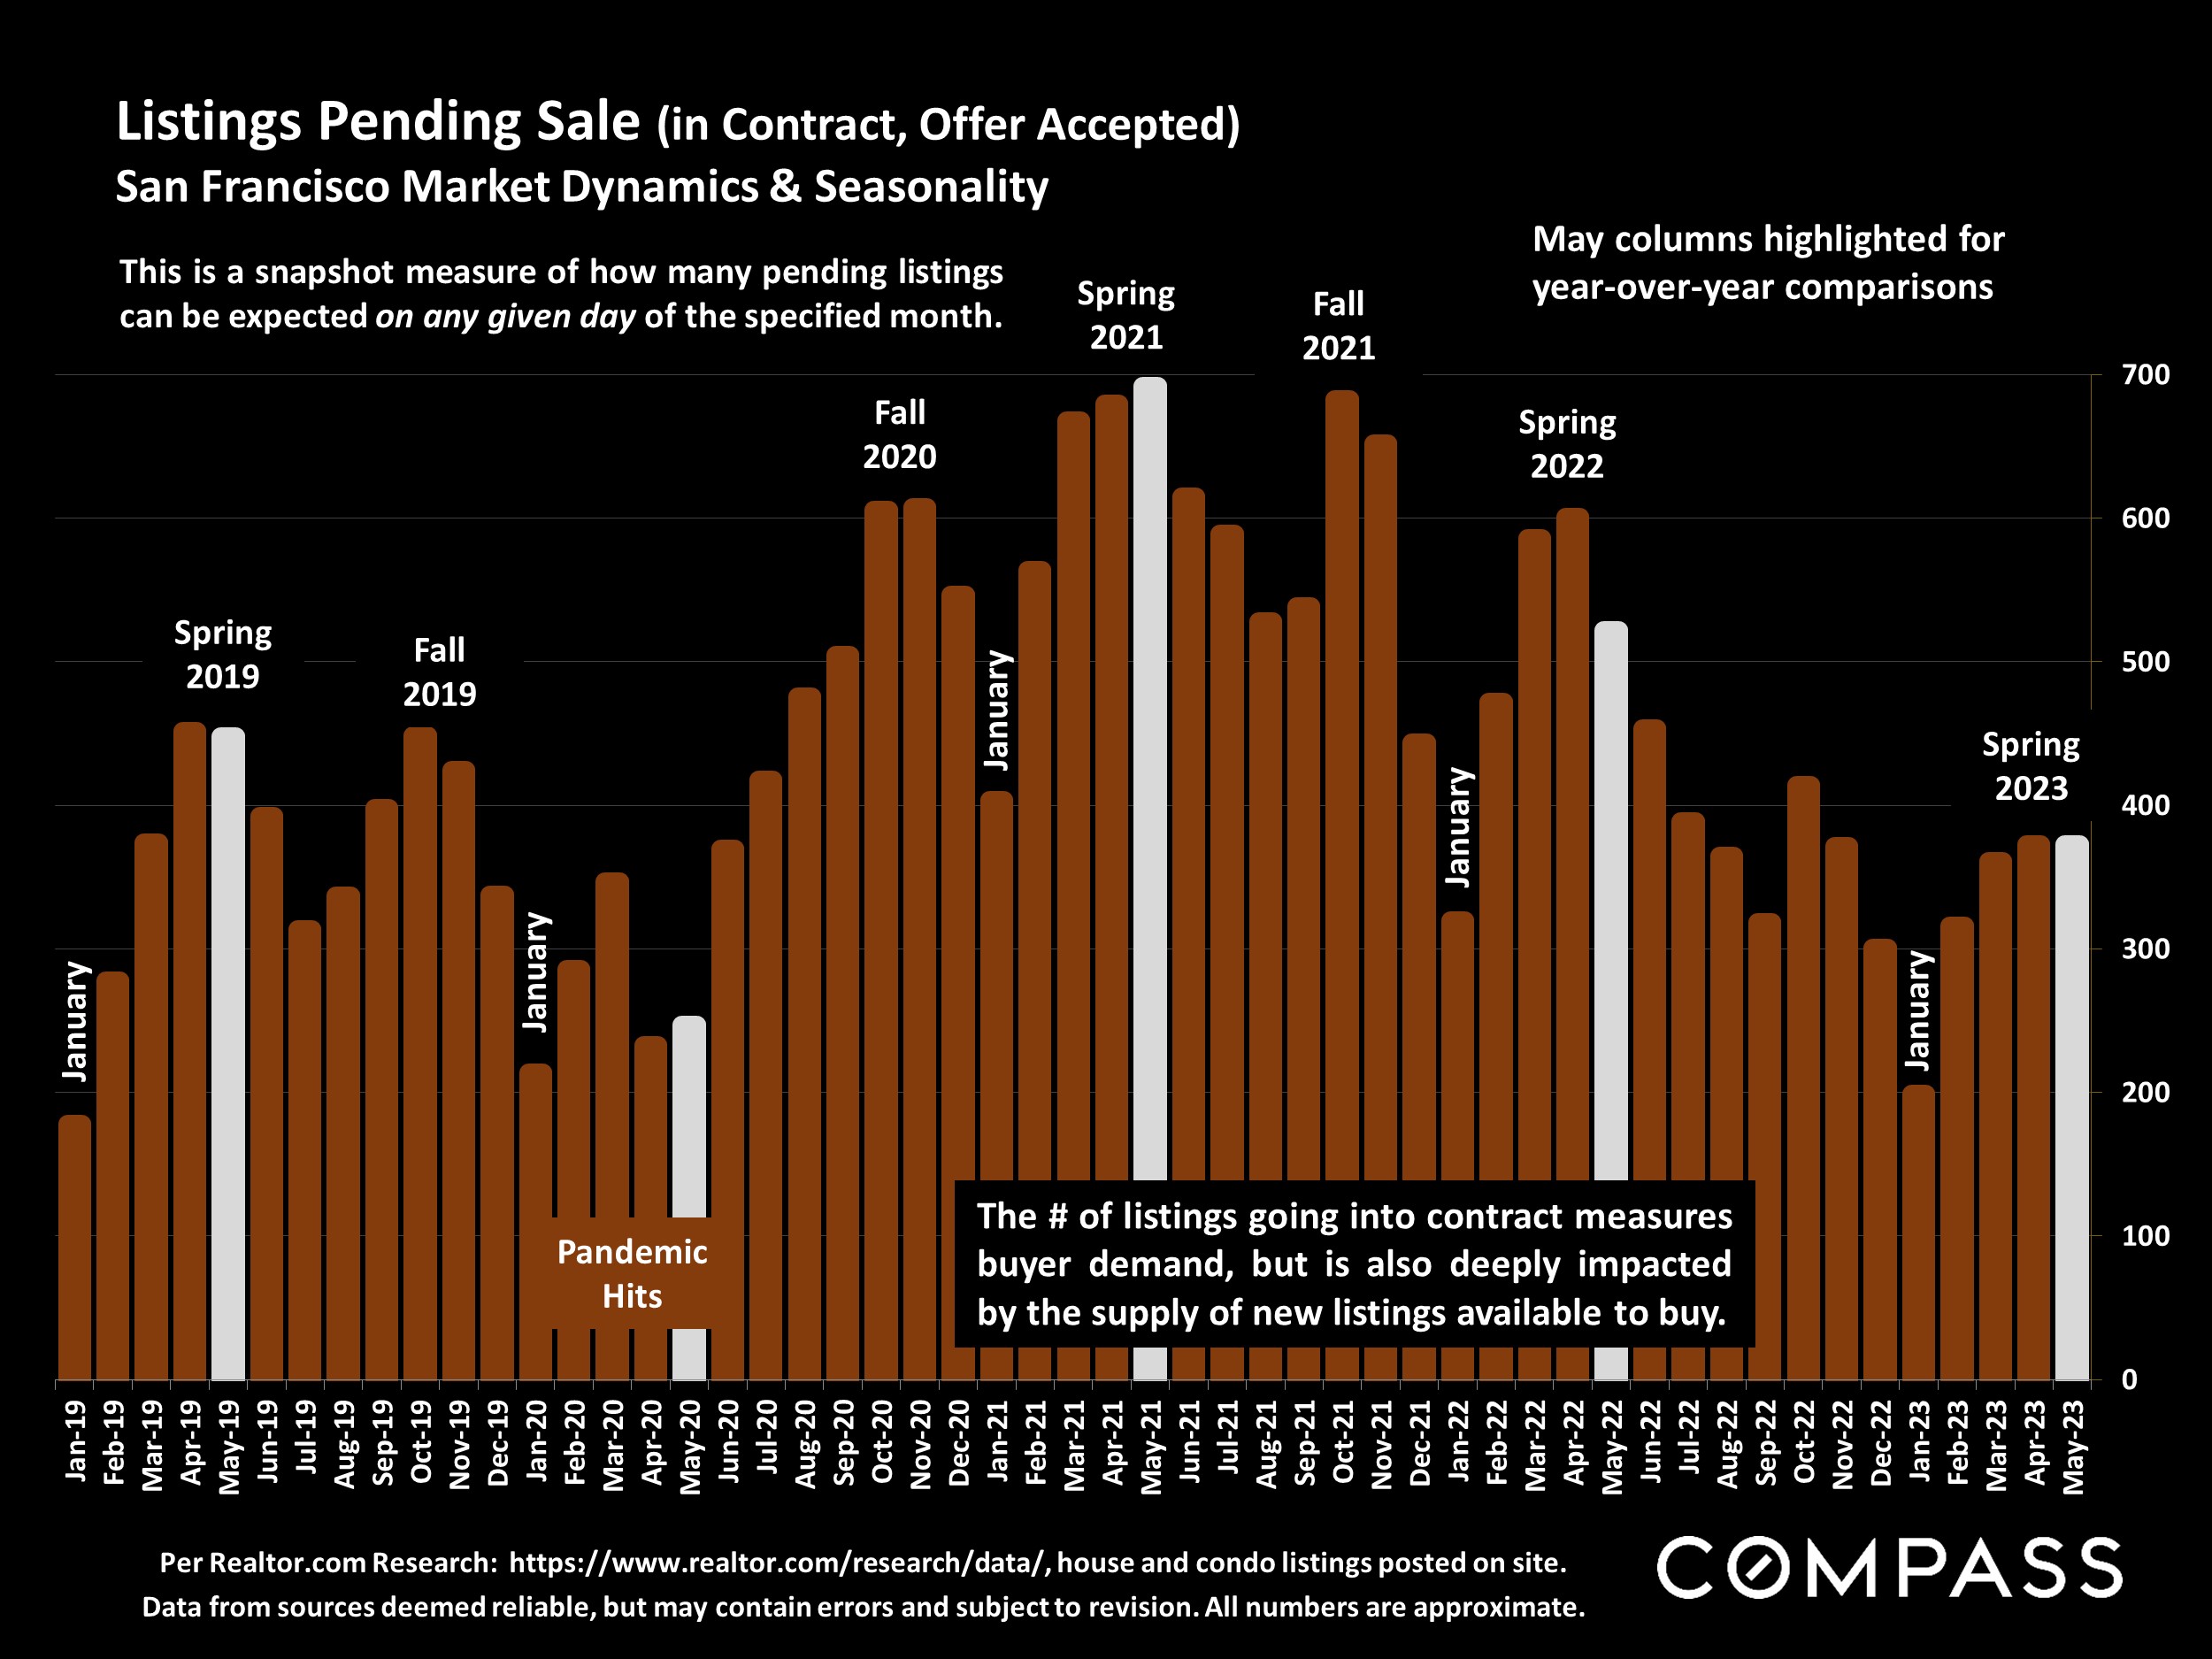
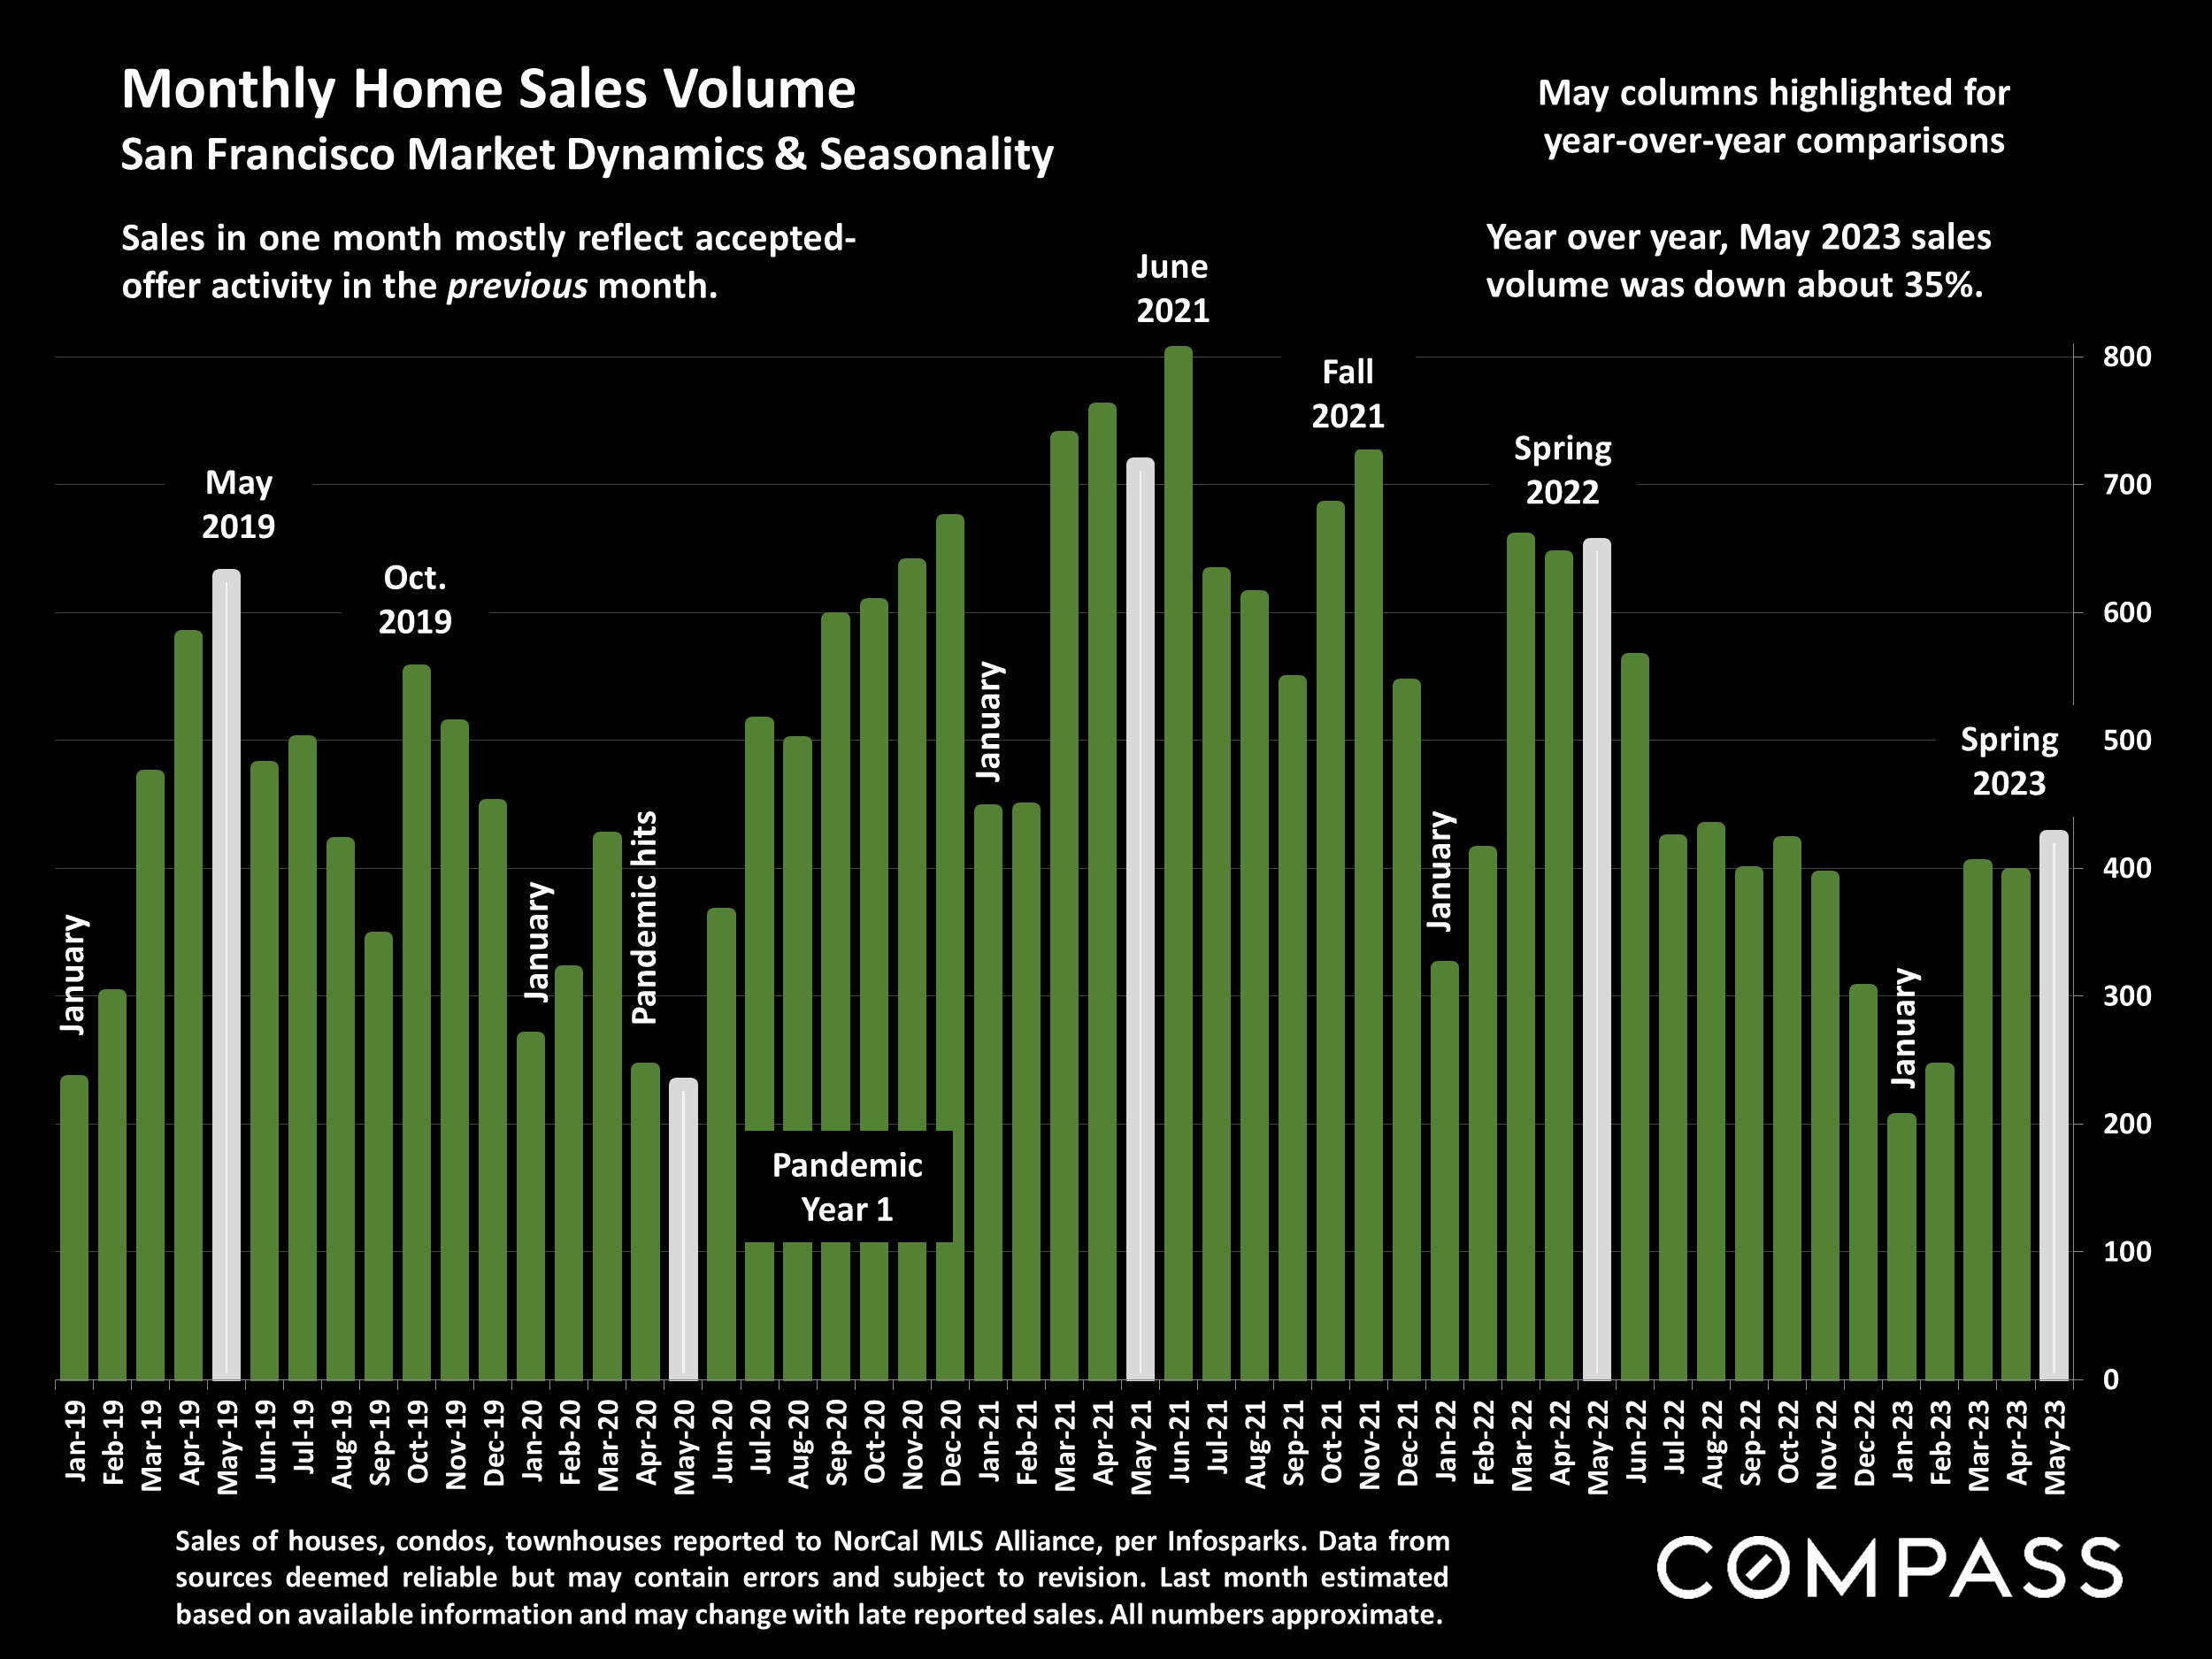
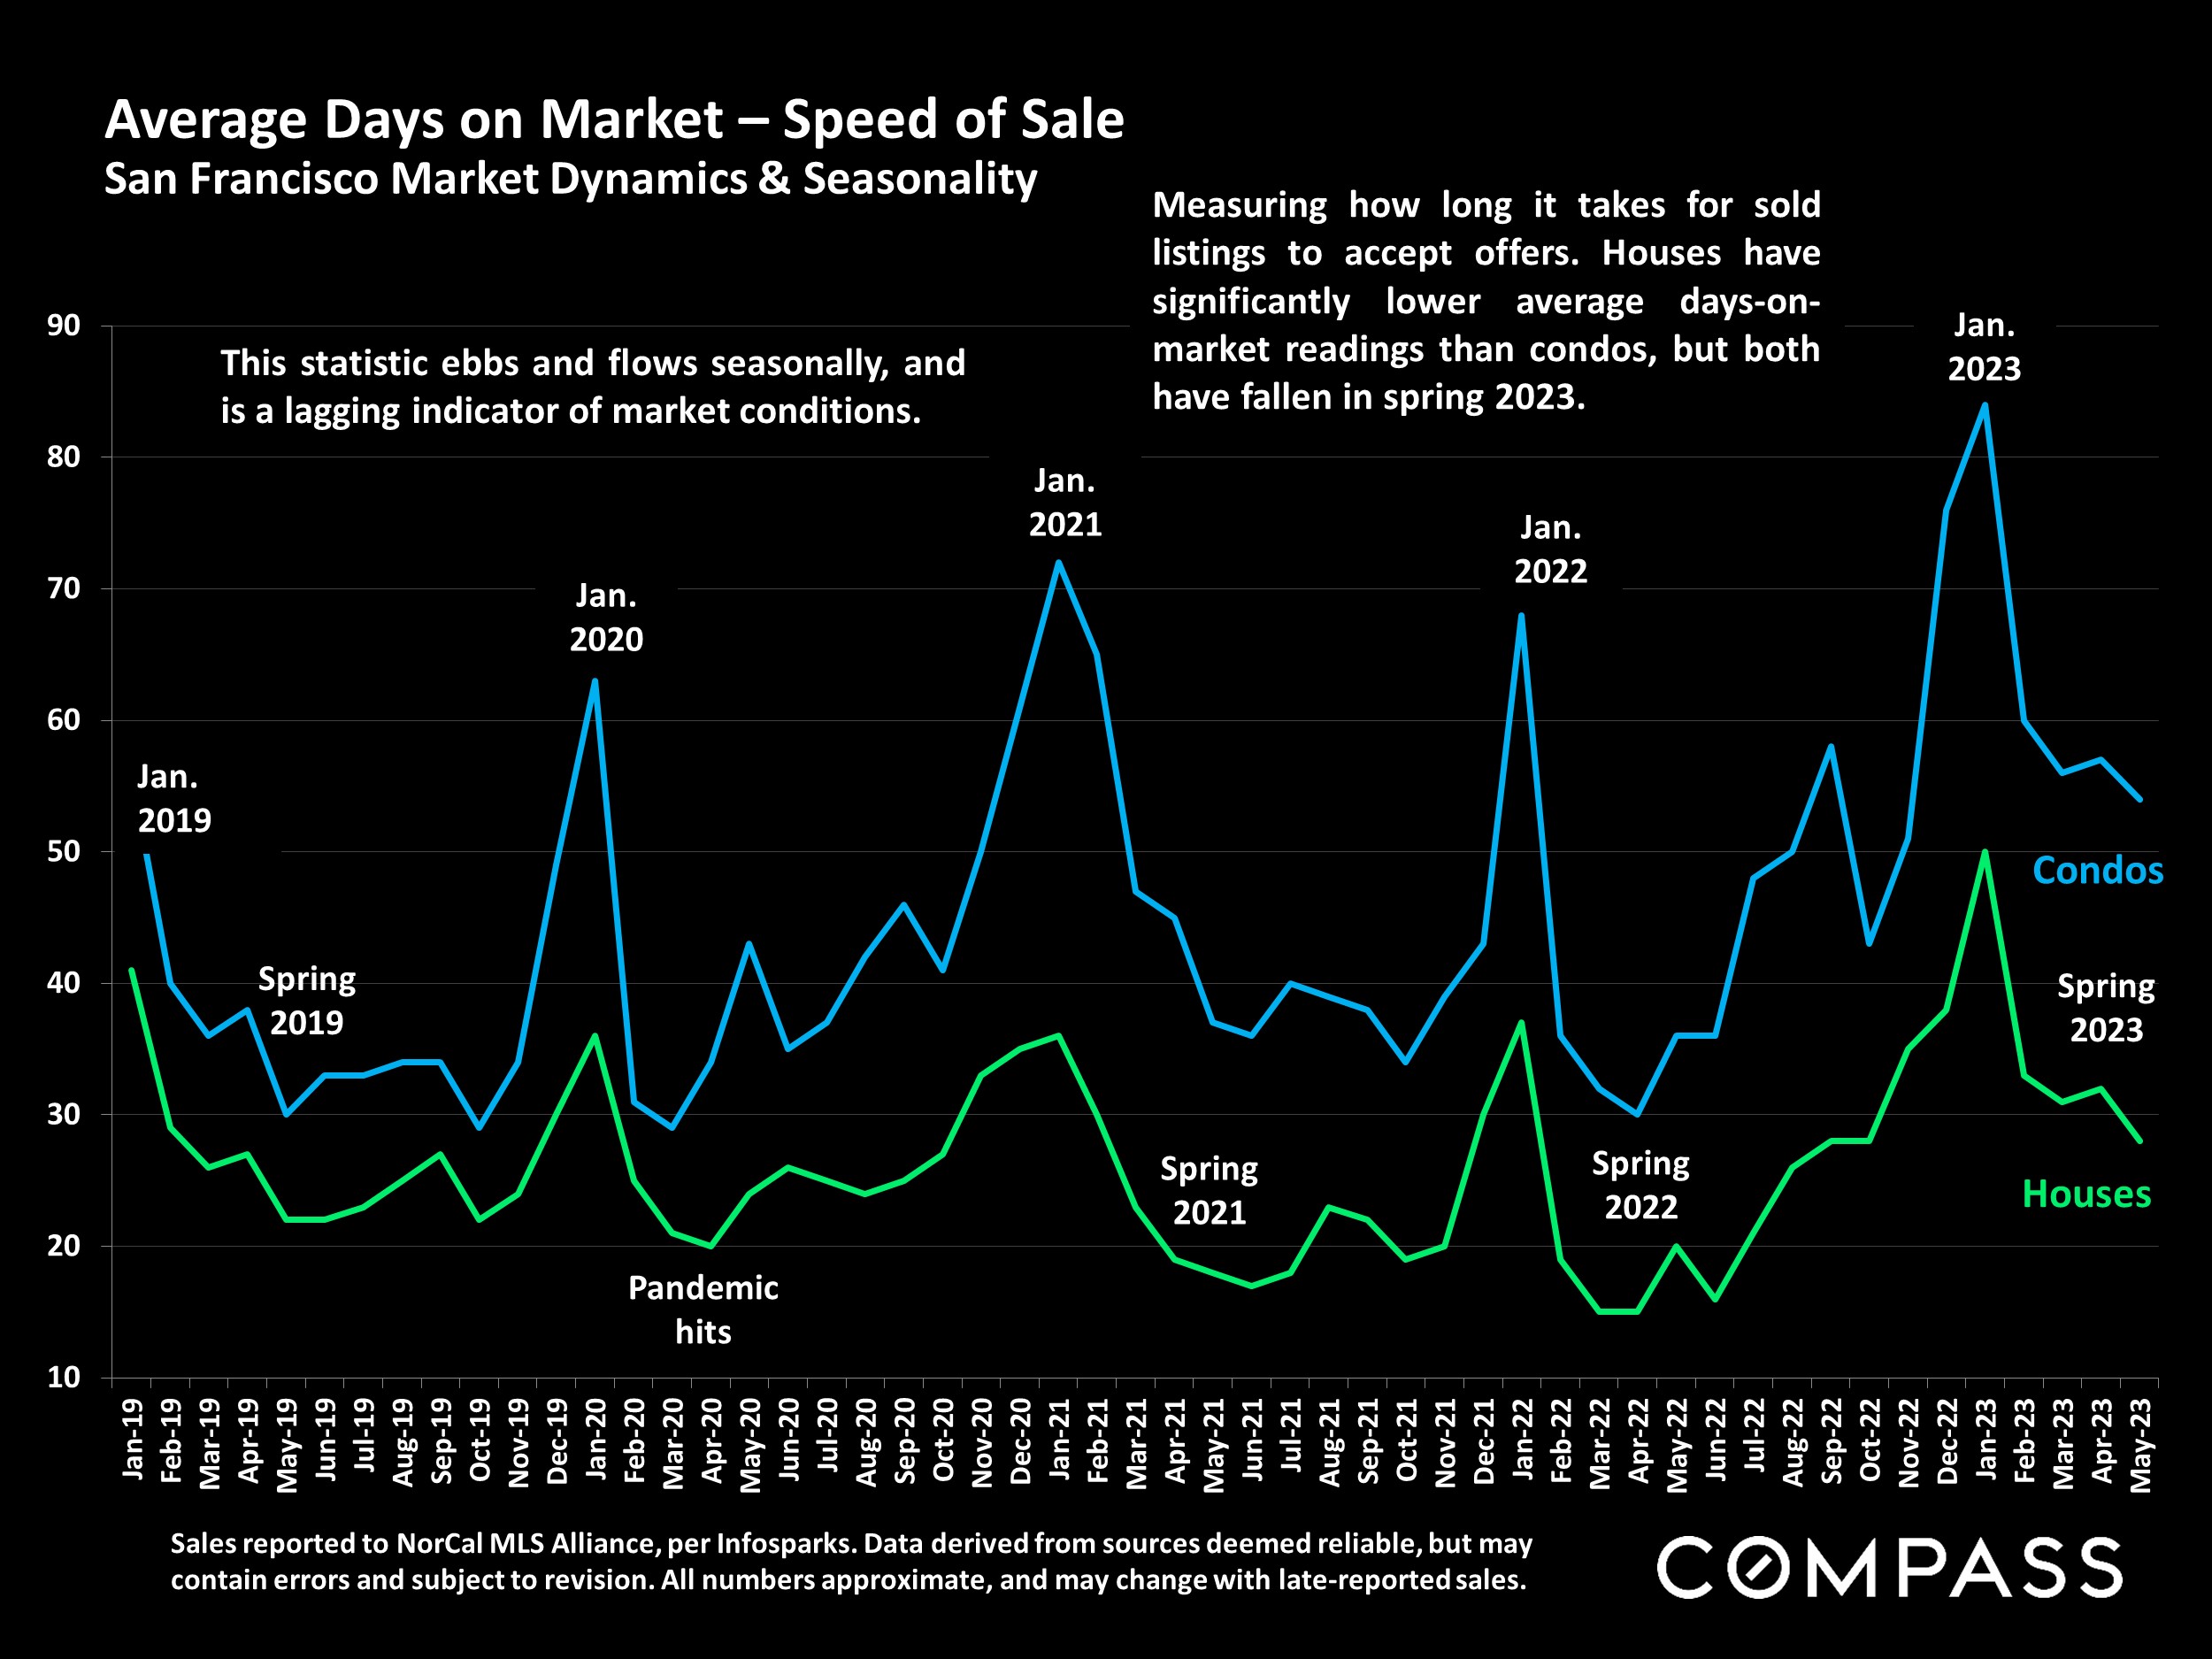
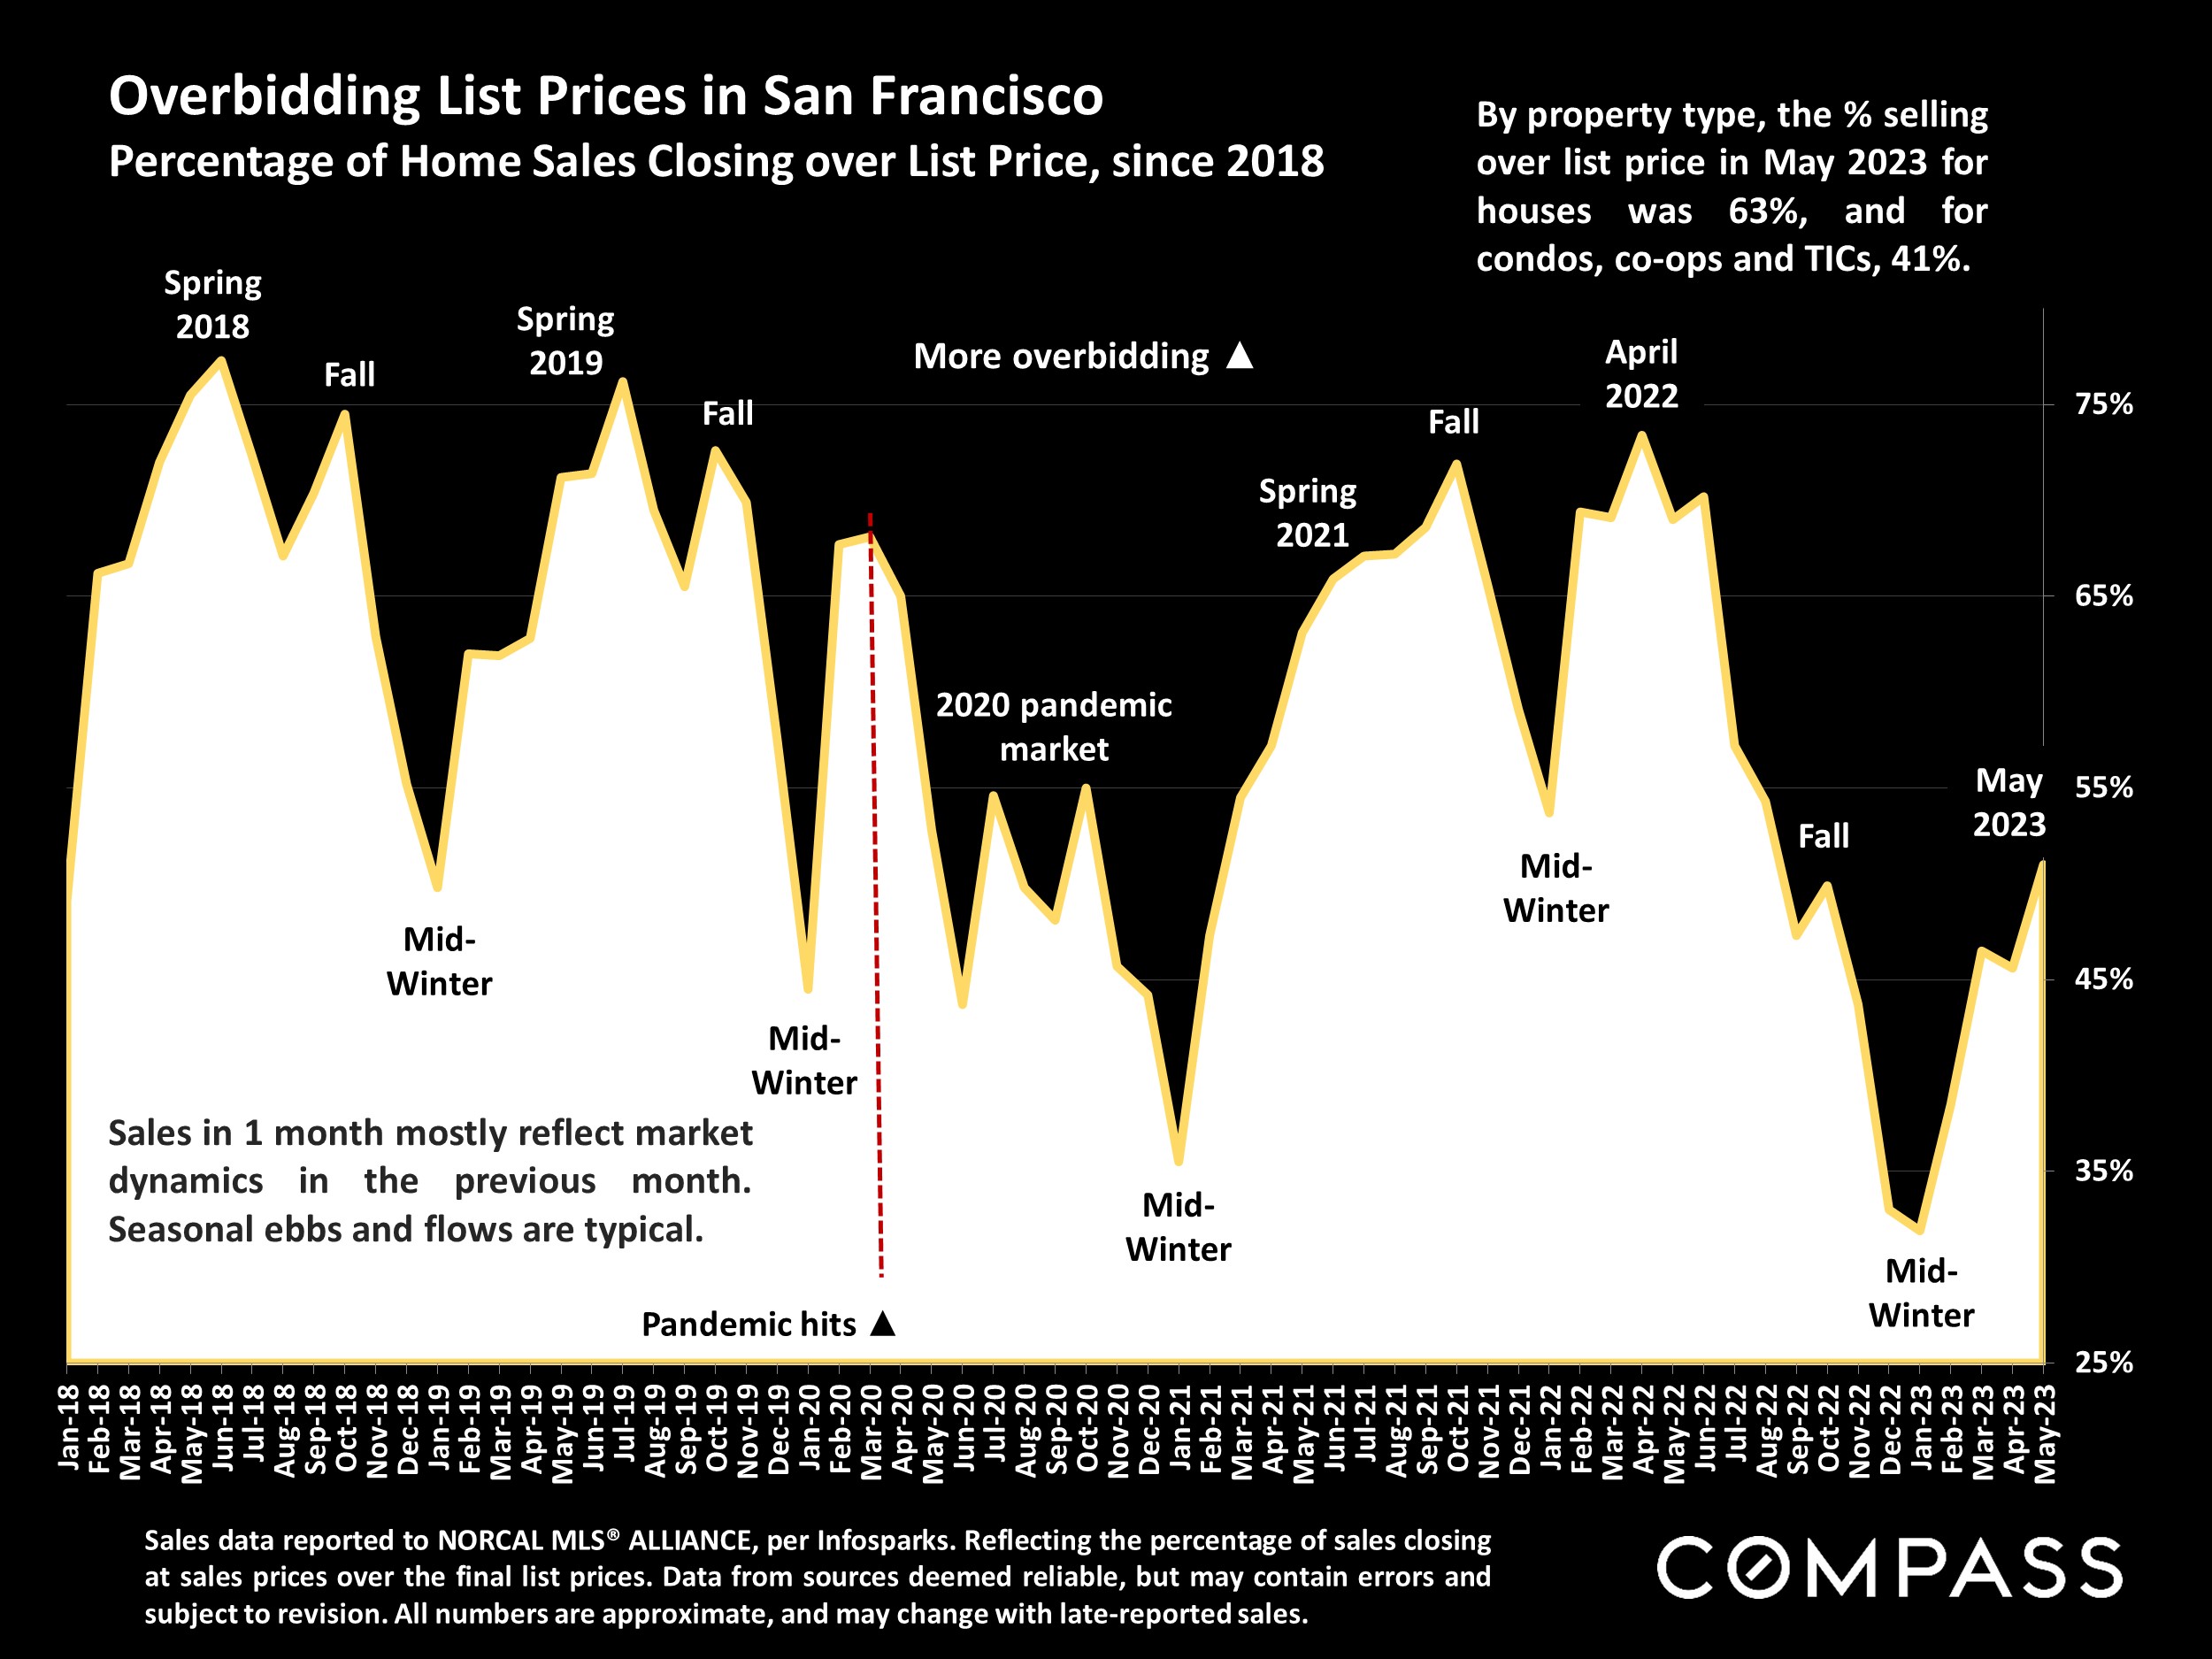
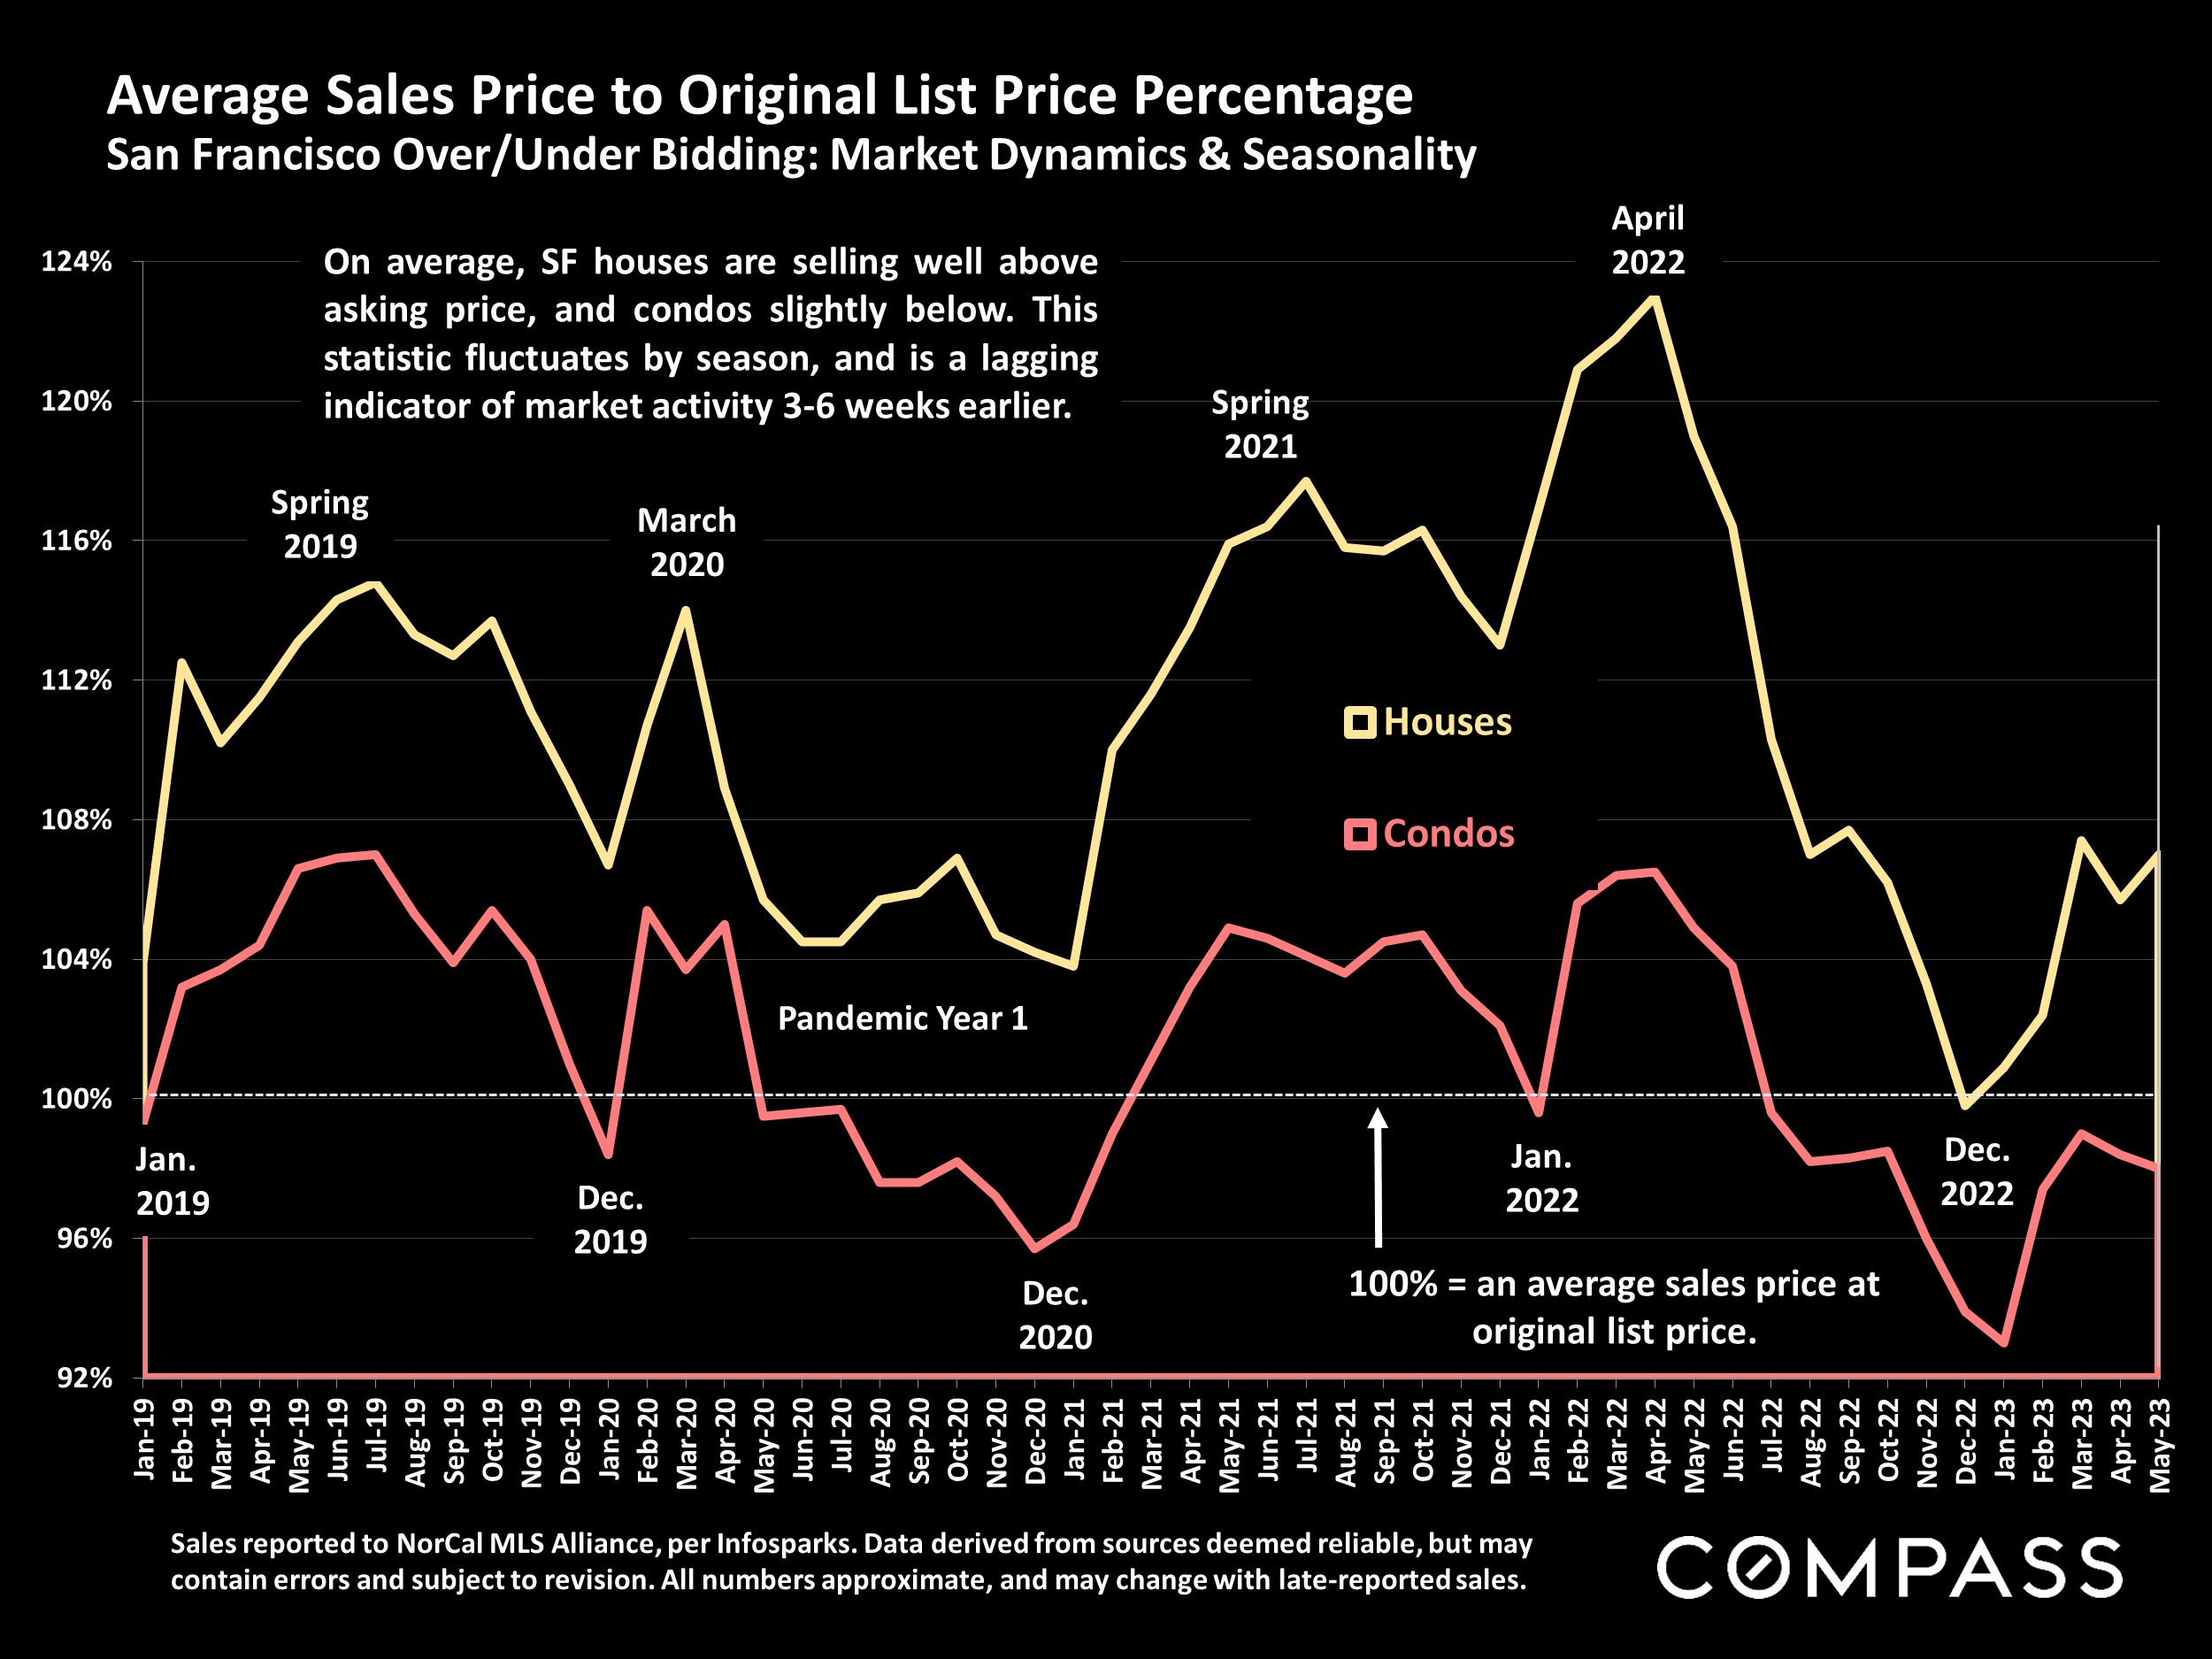
The number of new listings coming on market and the number of home sales over the past 12 months were the lowest since both plunged after the pandemic first struck. New listing and sales volumes have risen from their nadirs in mid-winter, but remain historically low. Average days on market dropped considerably in 2023 as buyer demand recovered, and the percentage of home sales closing over asking price increased. The average house sale is now, once again, selling well above its original asking price. The average condo sale is selling slightly below list price.
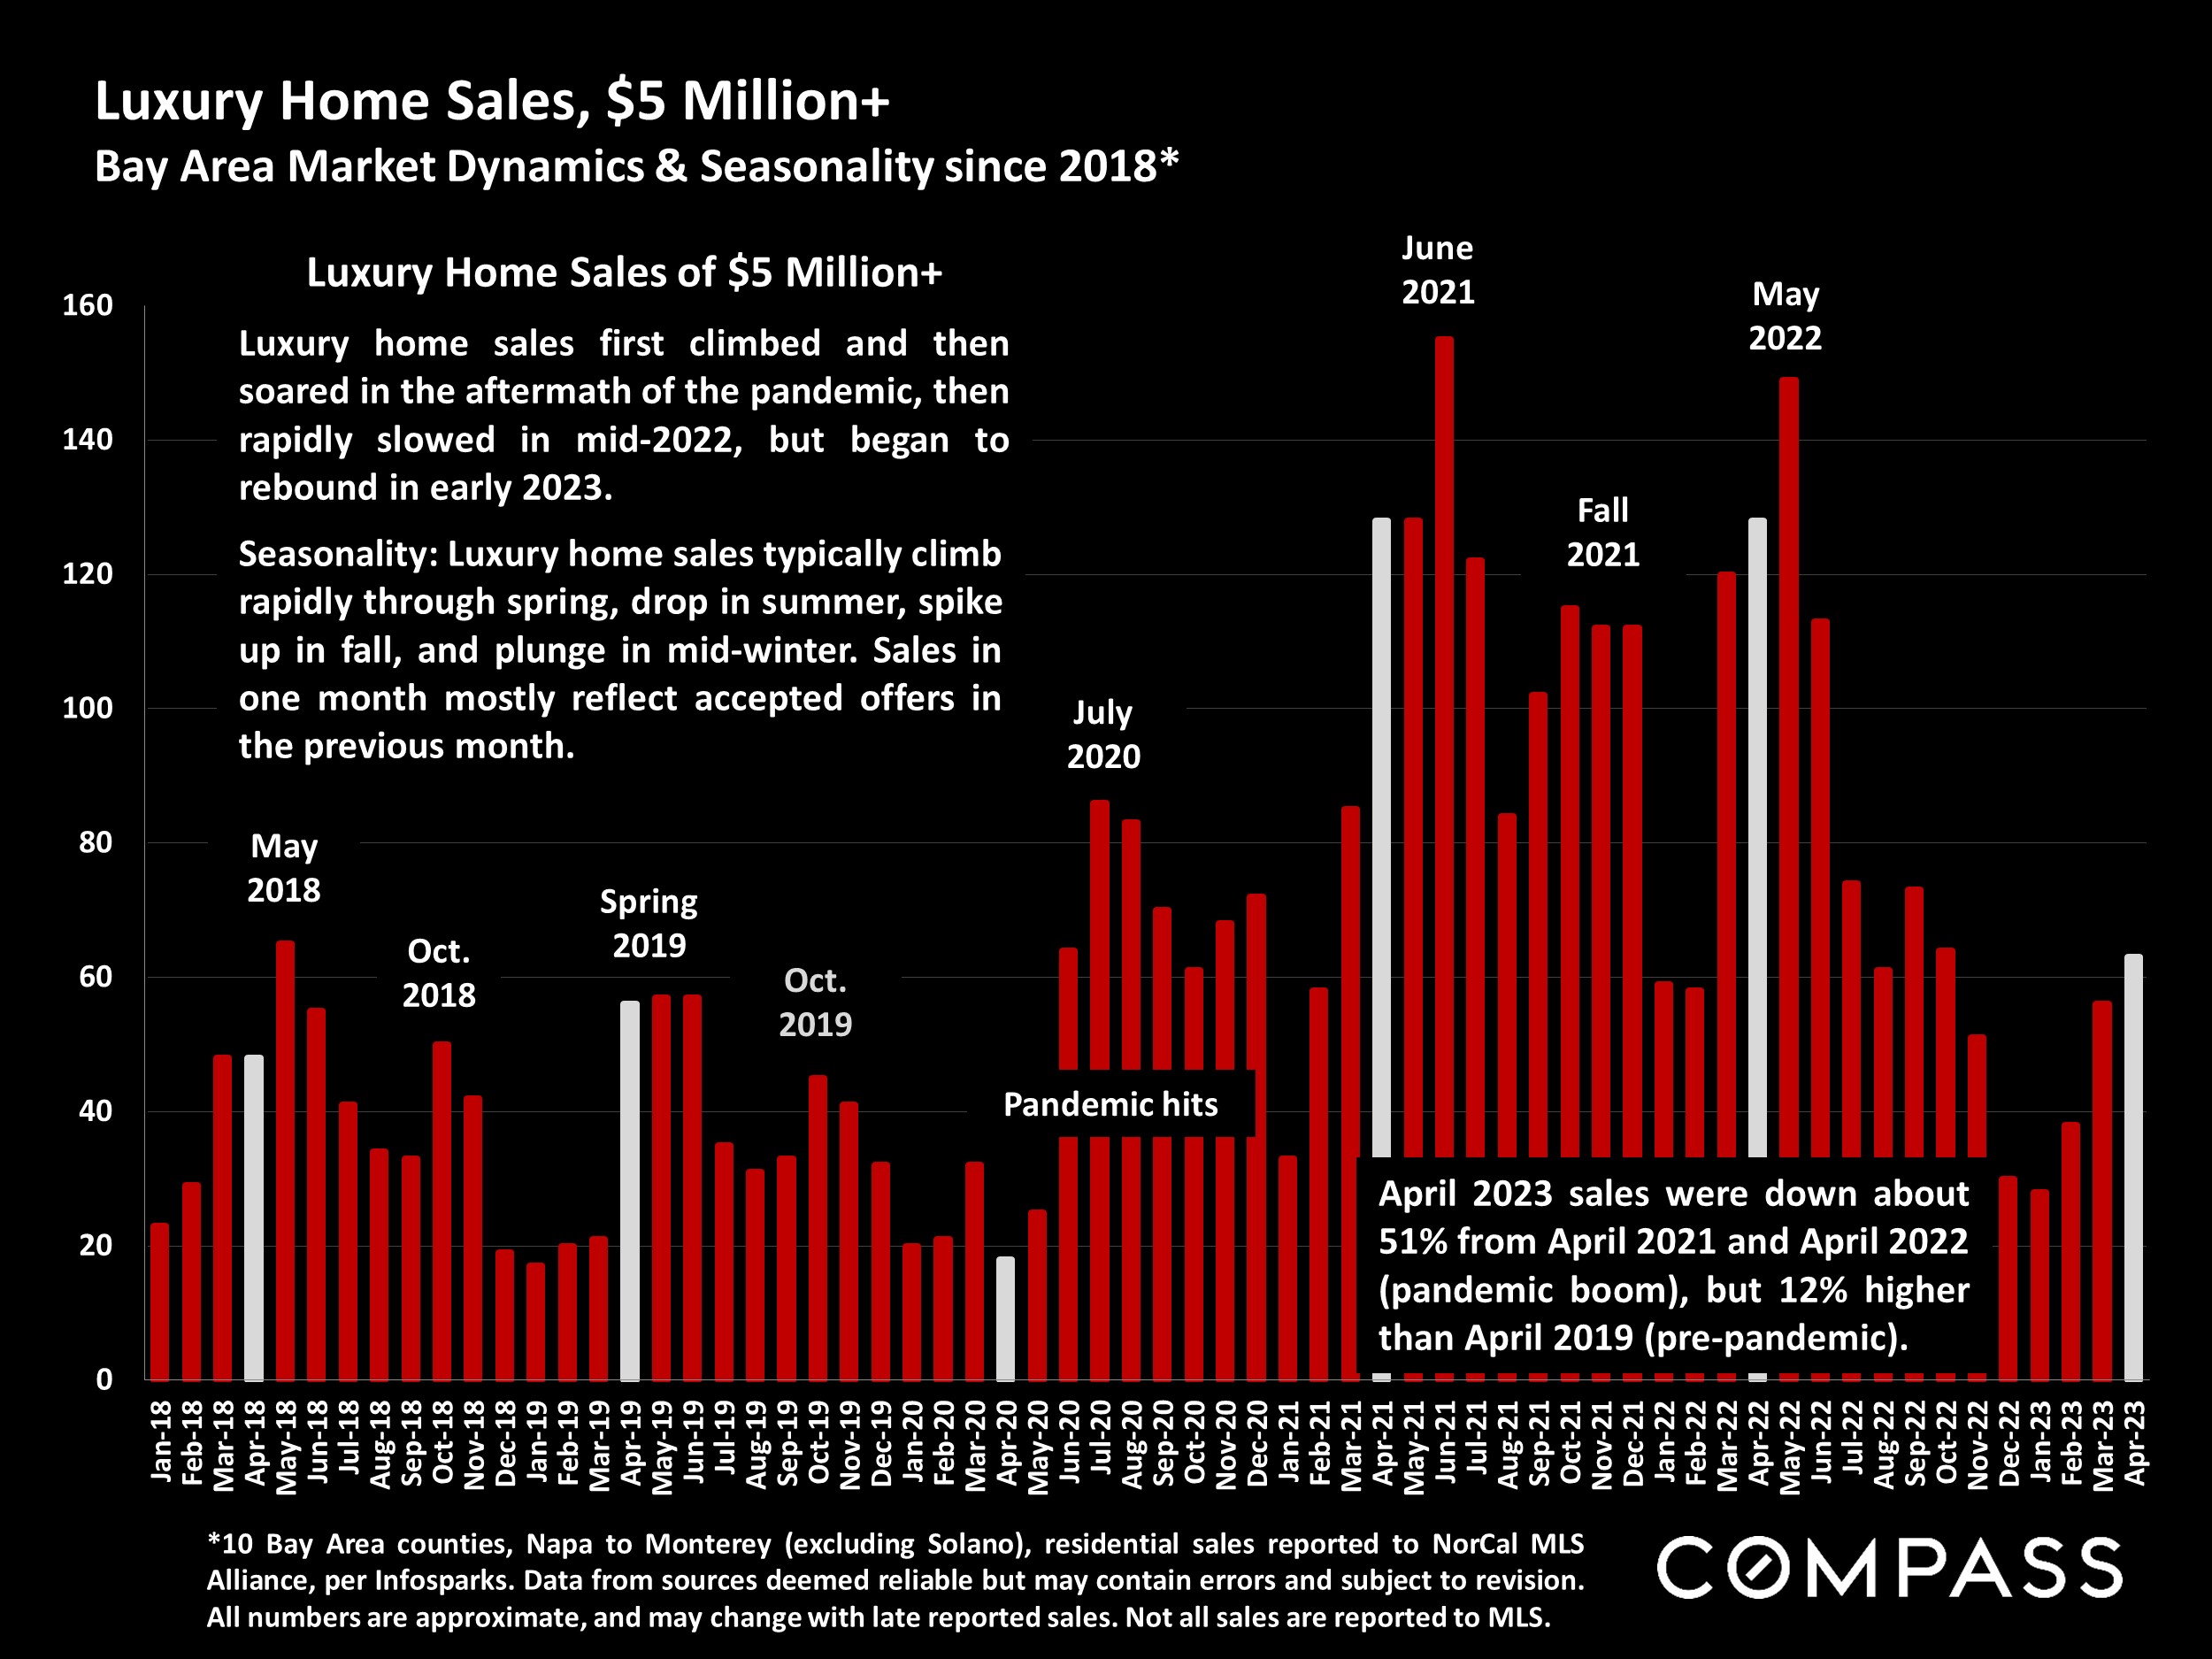
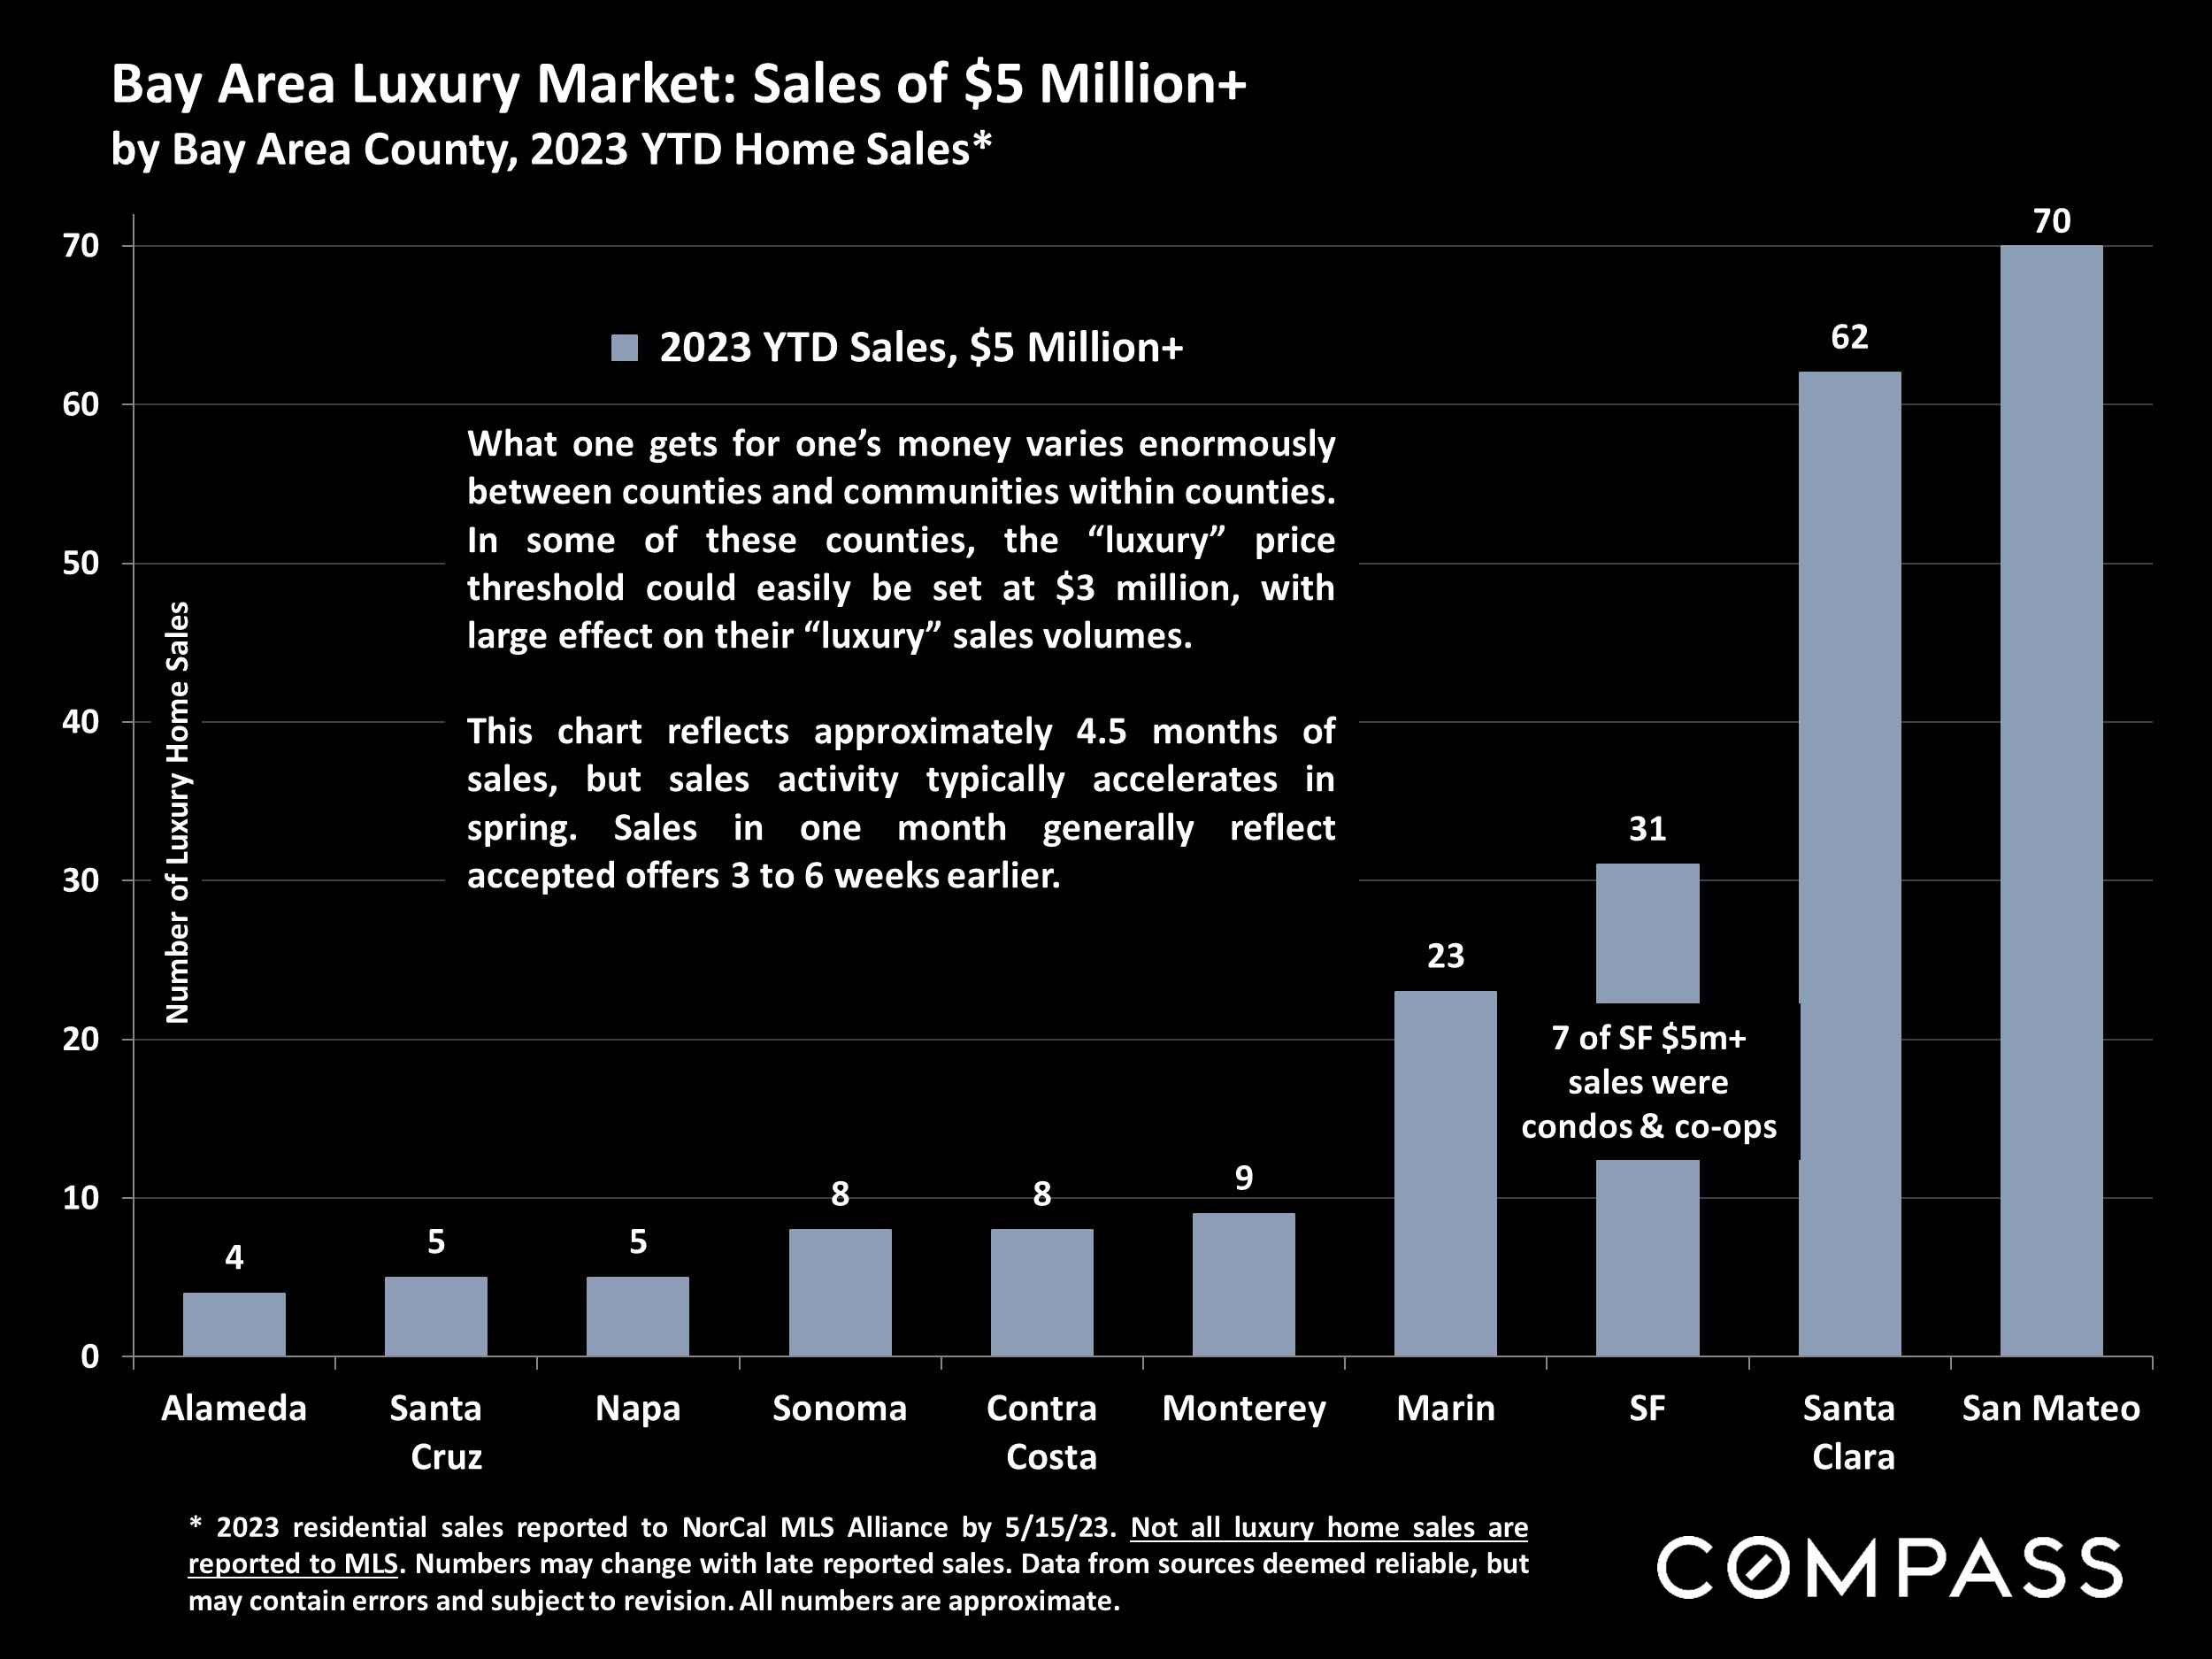
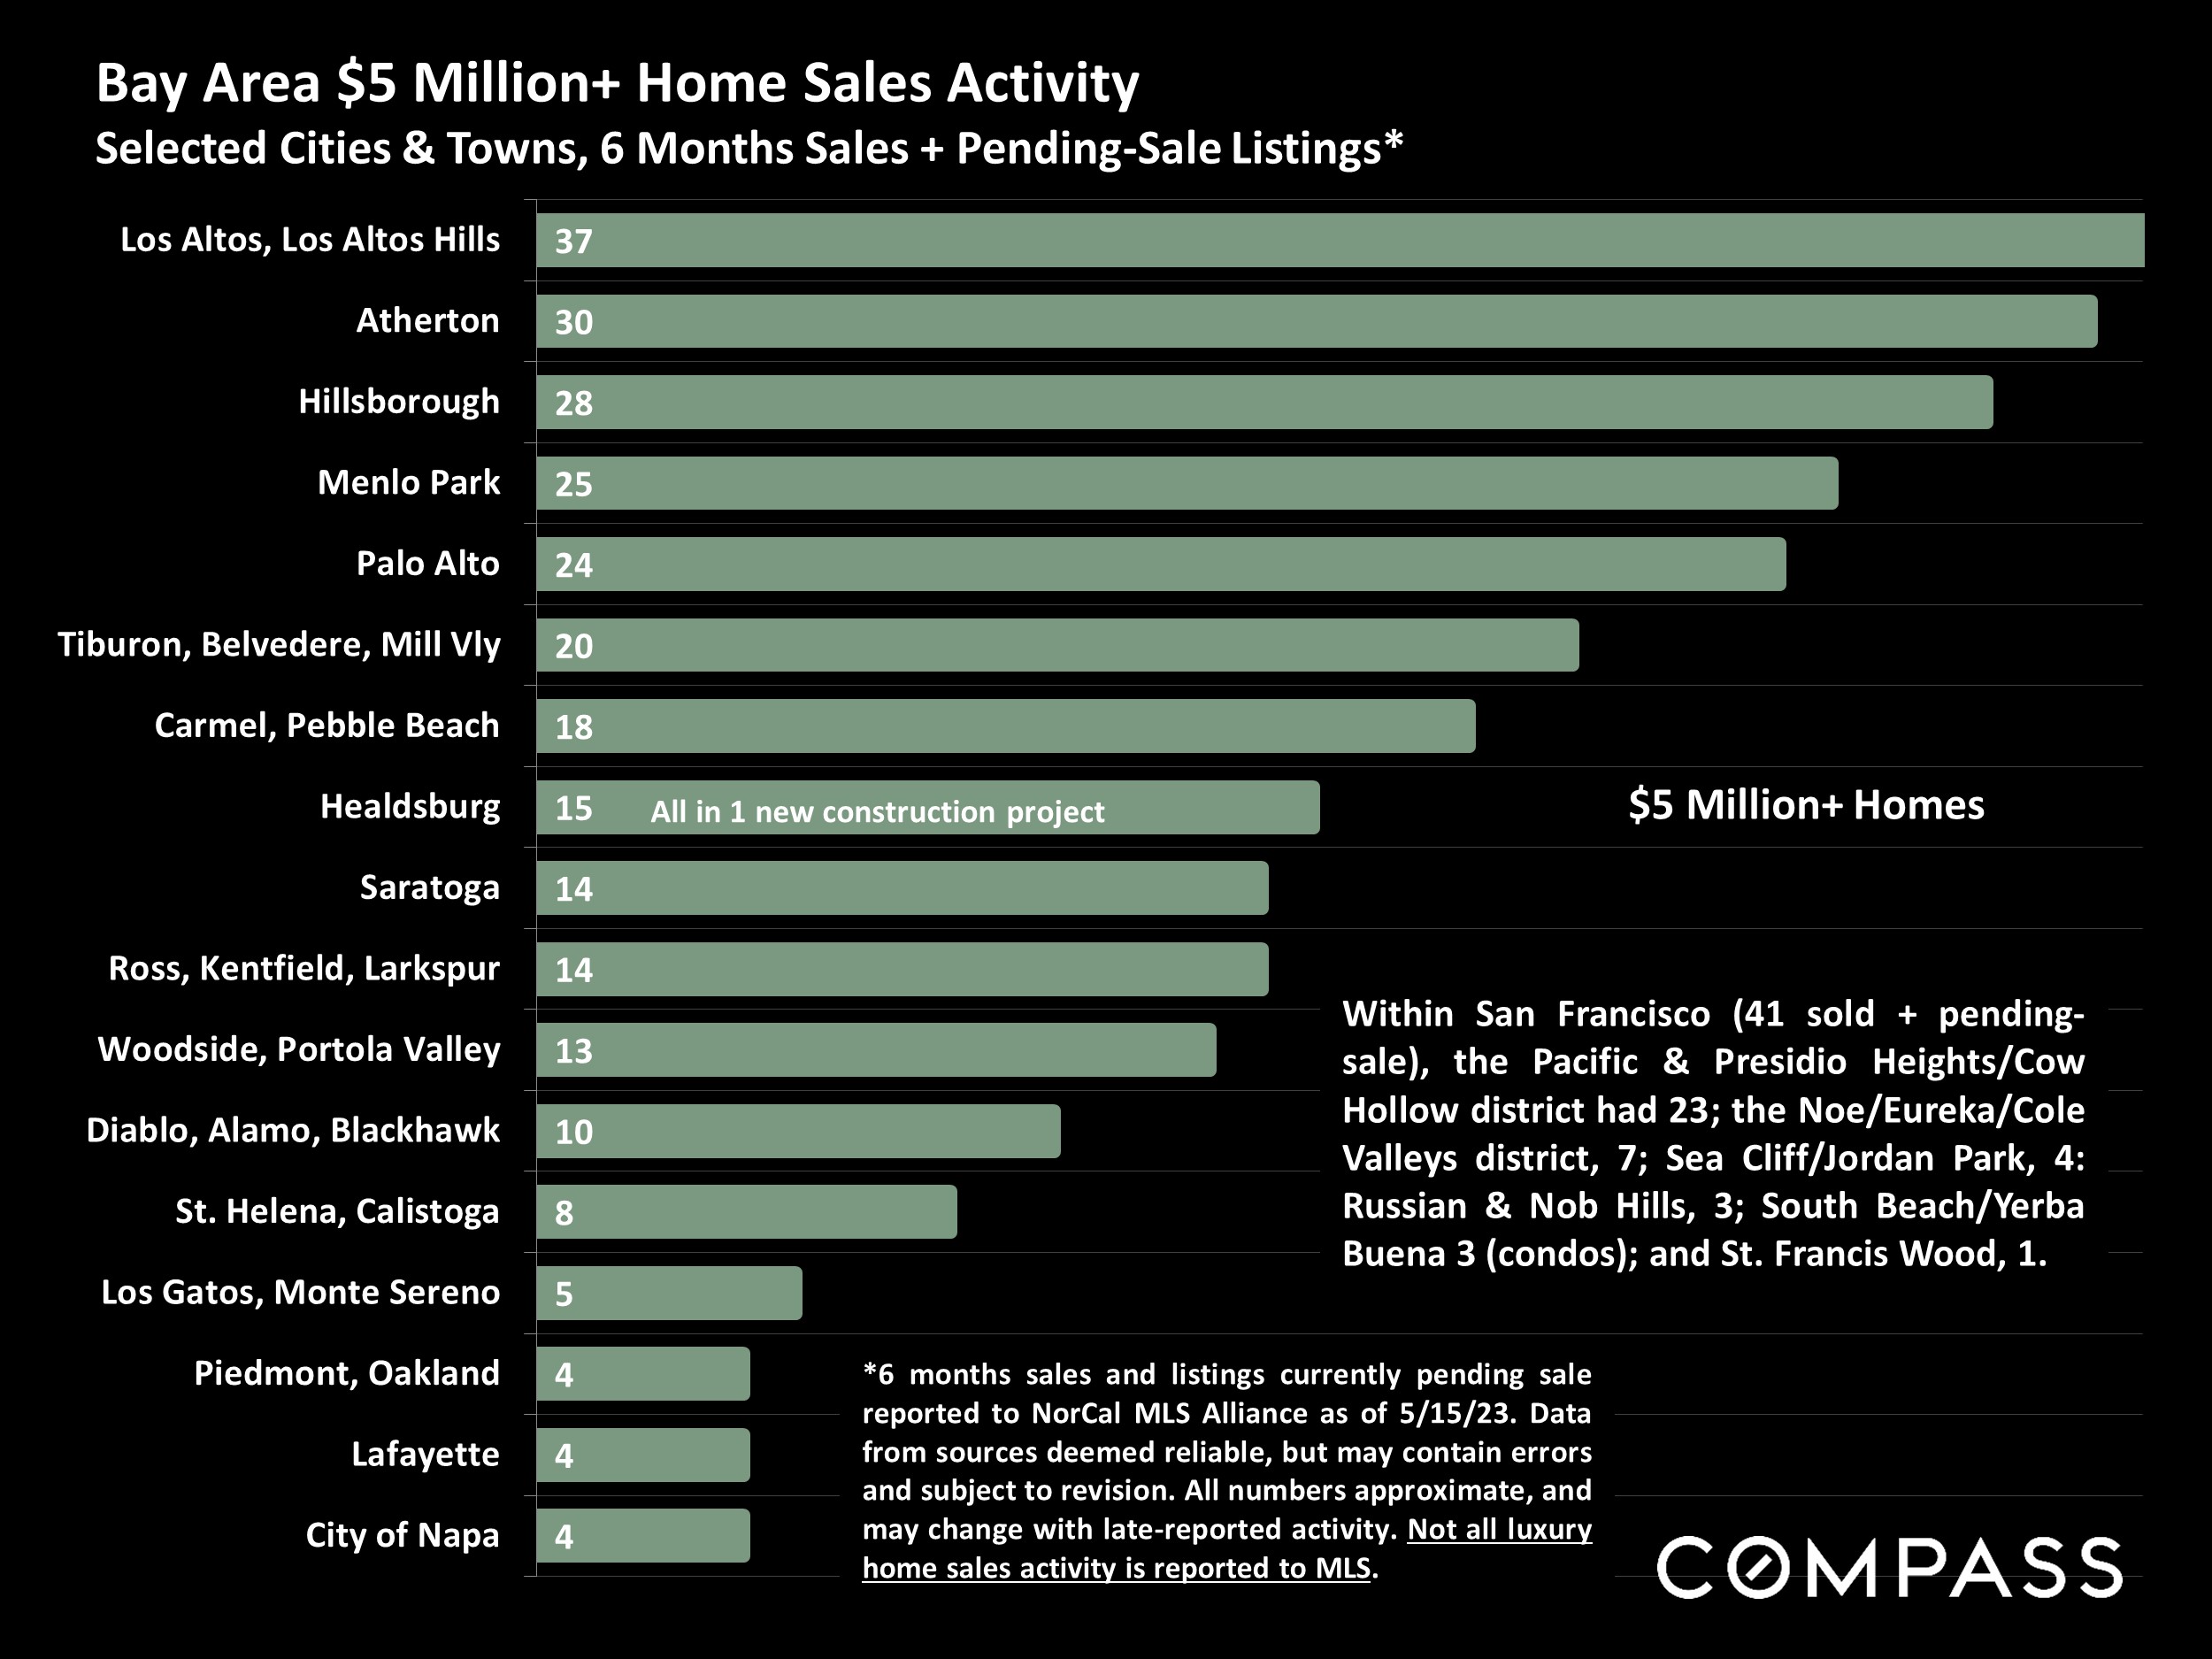
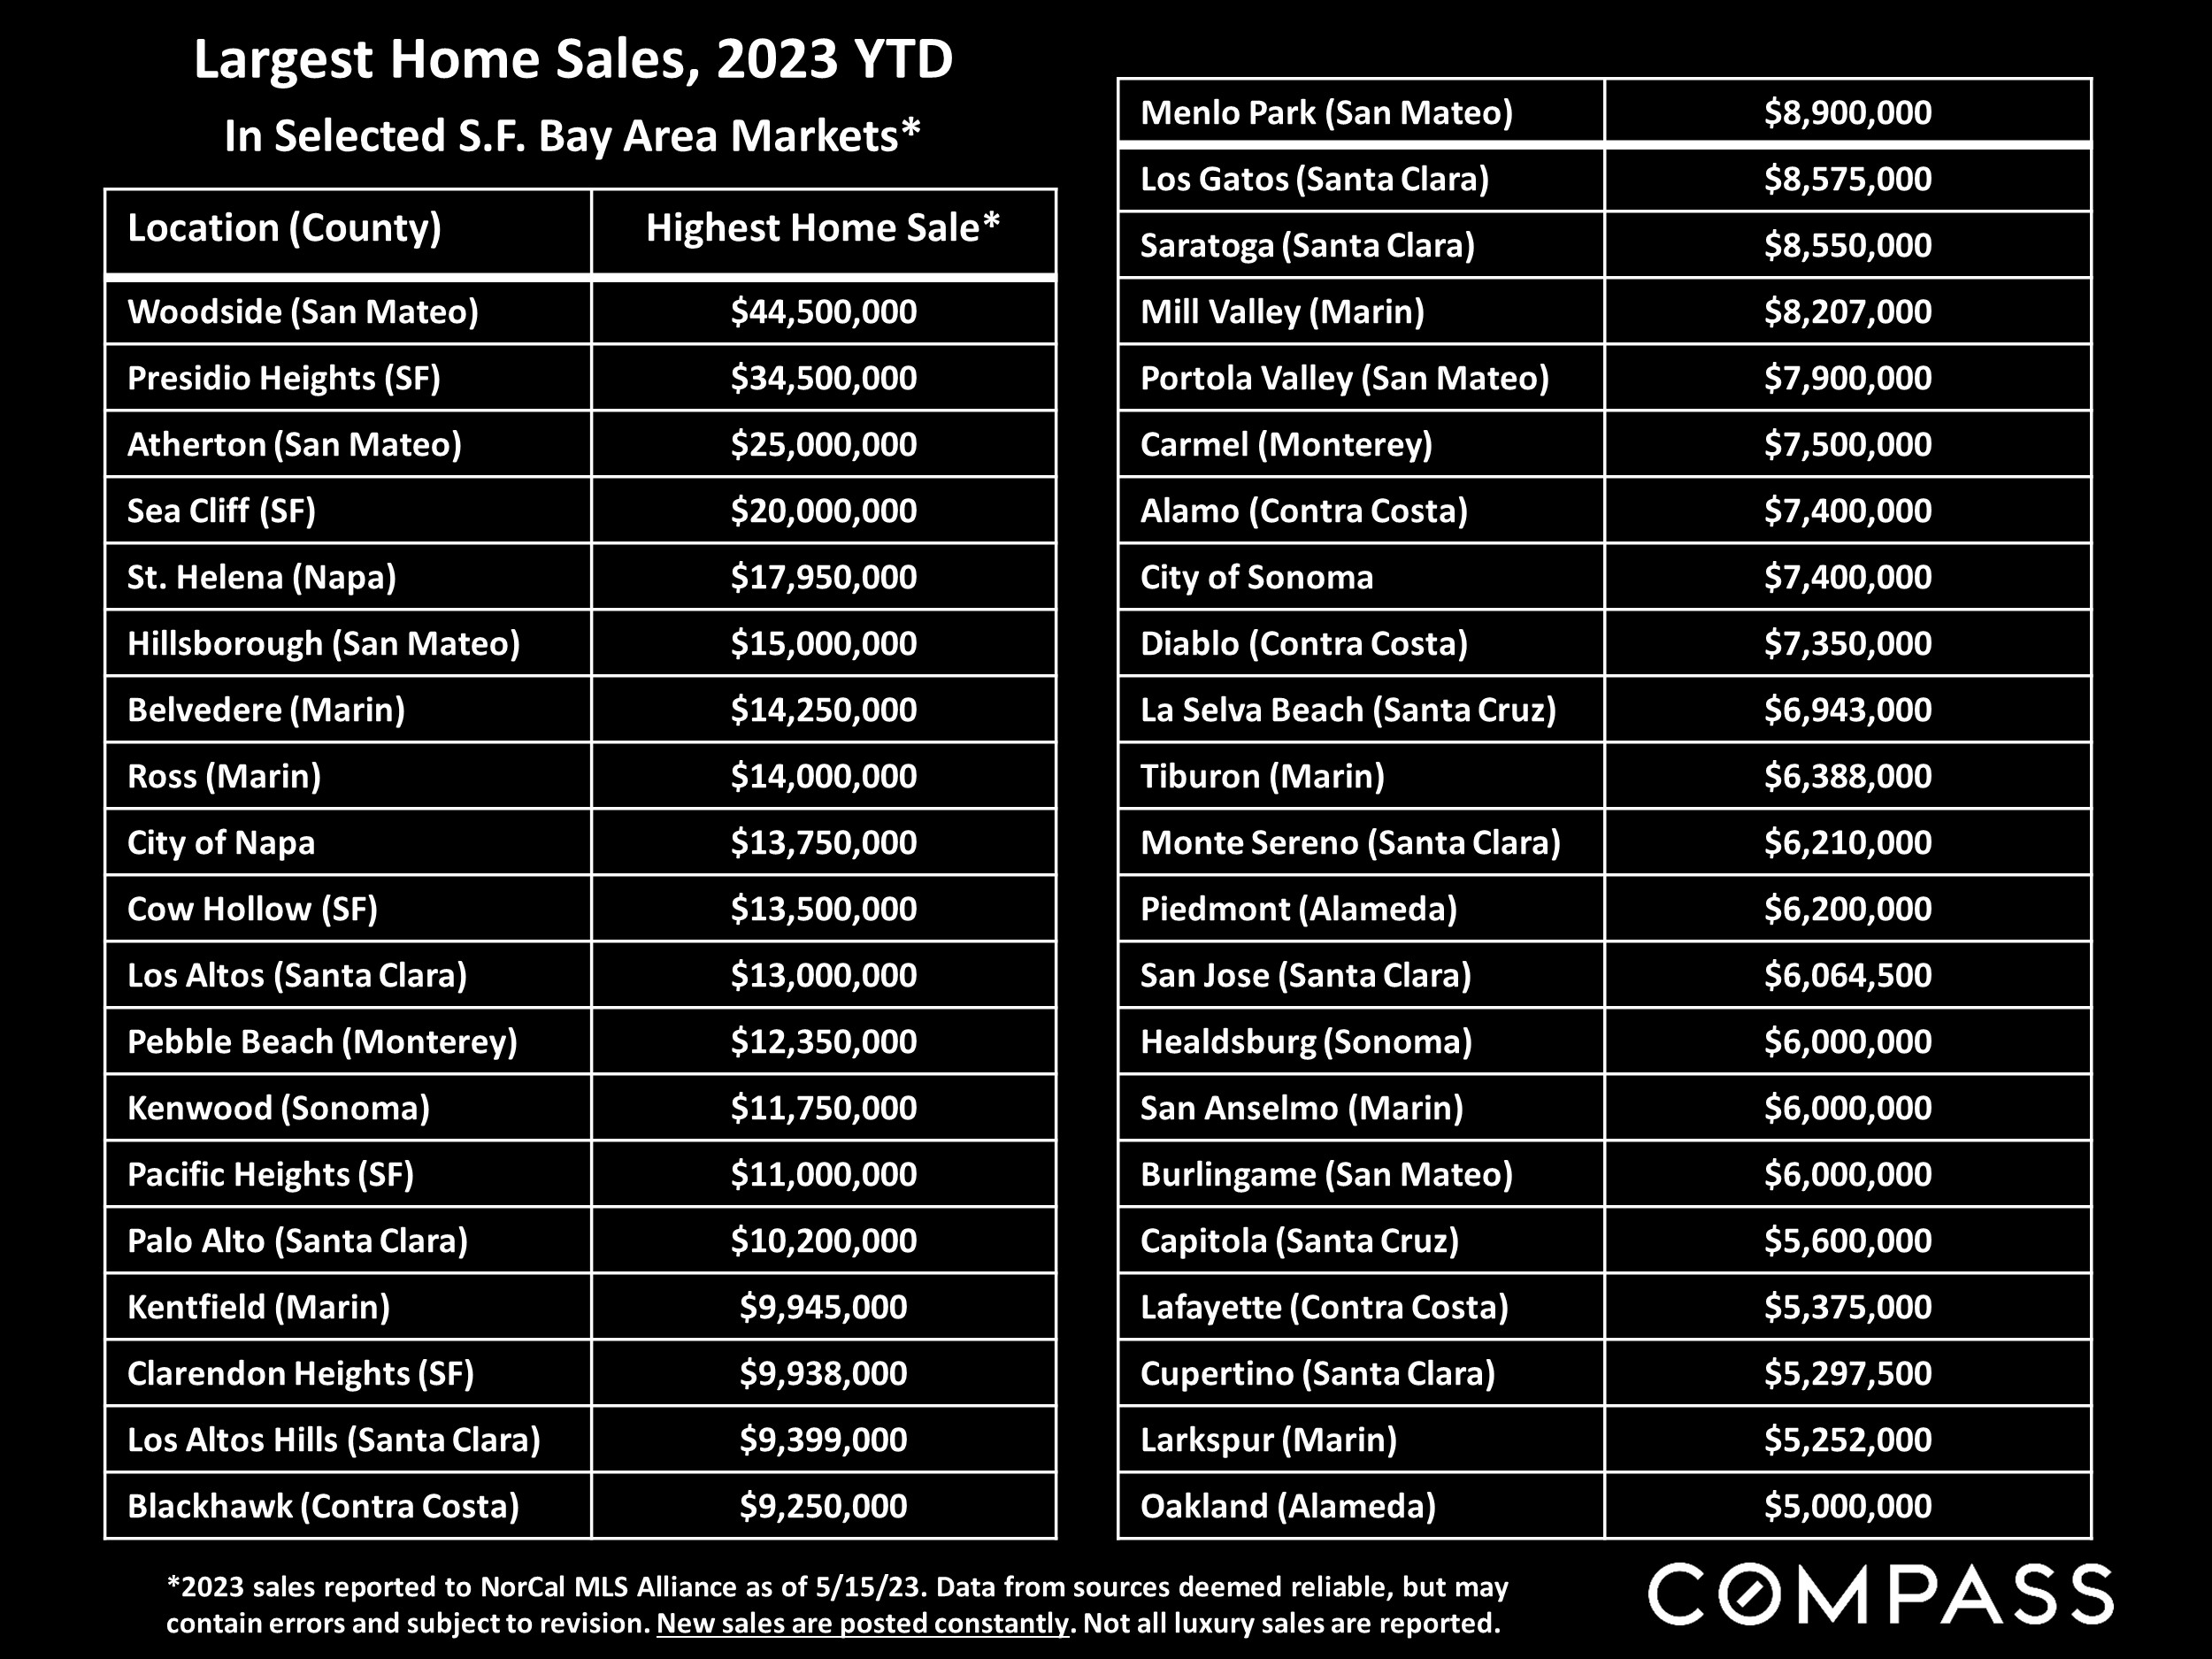
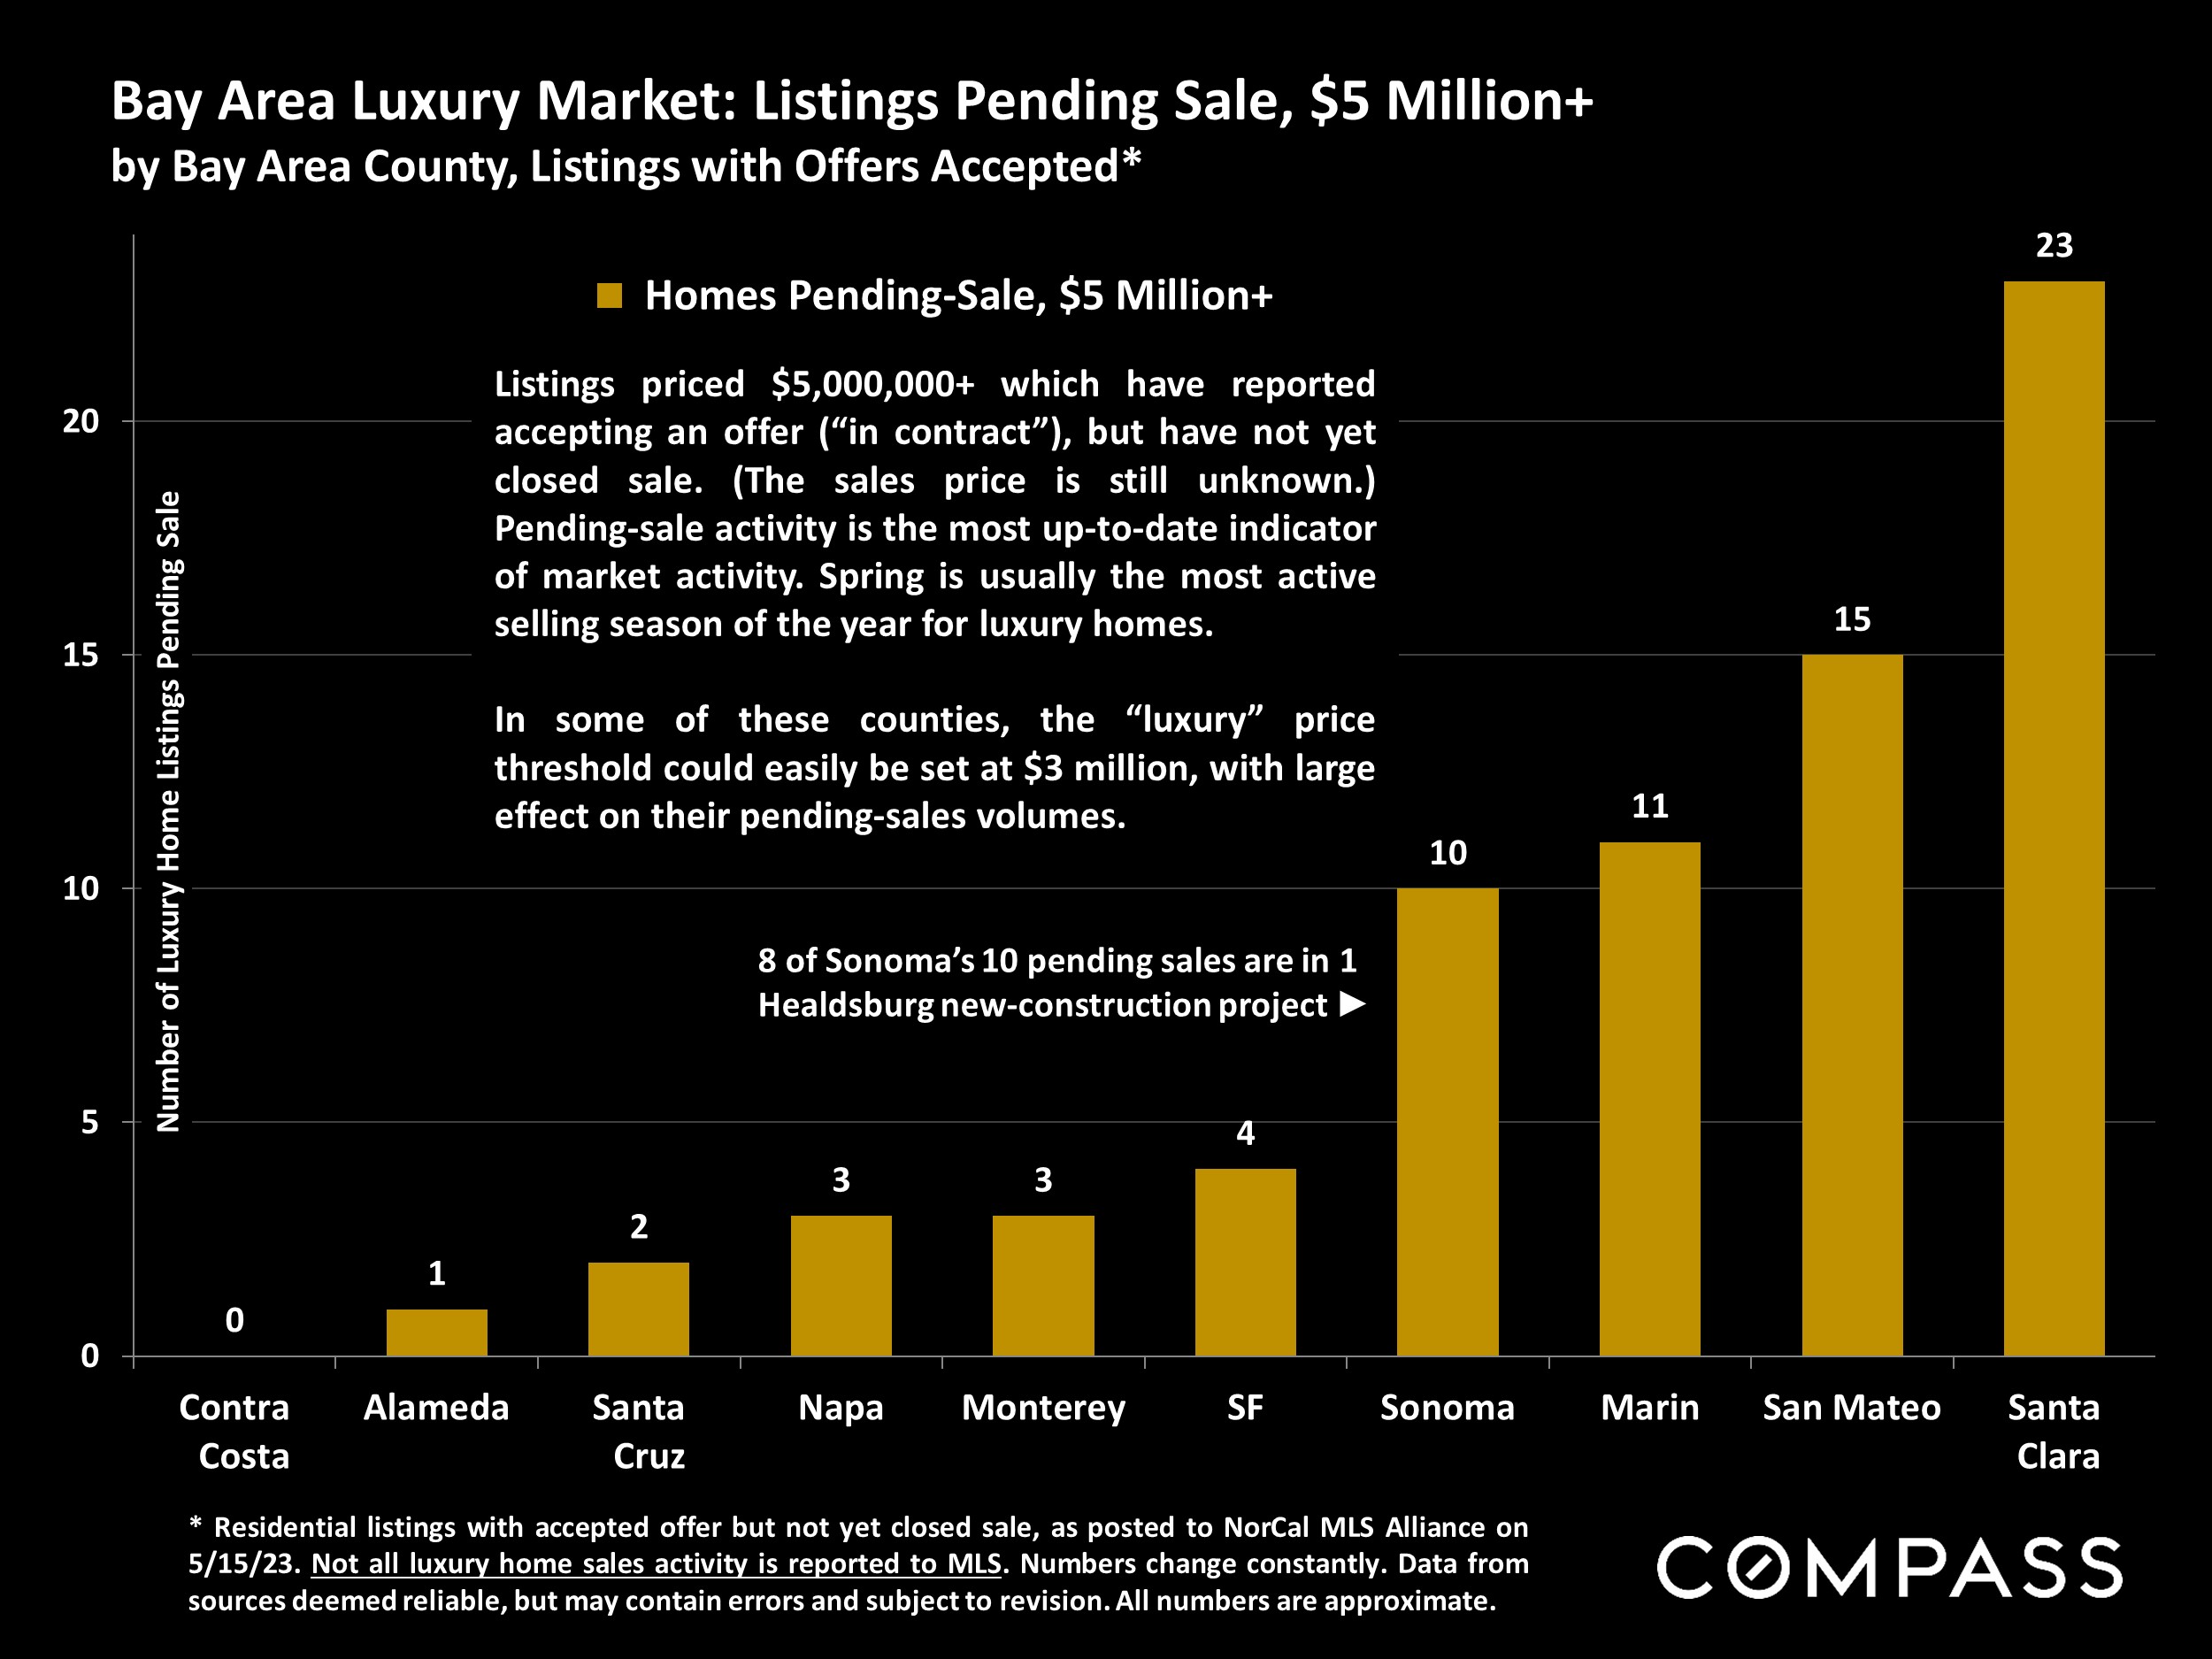
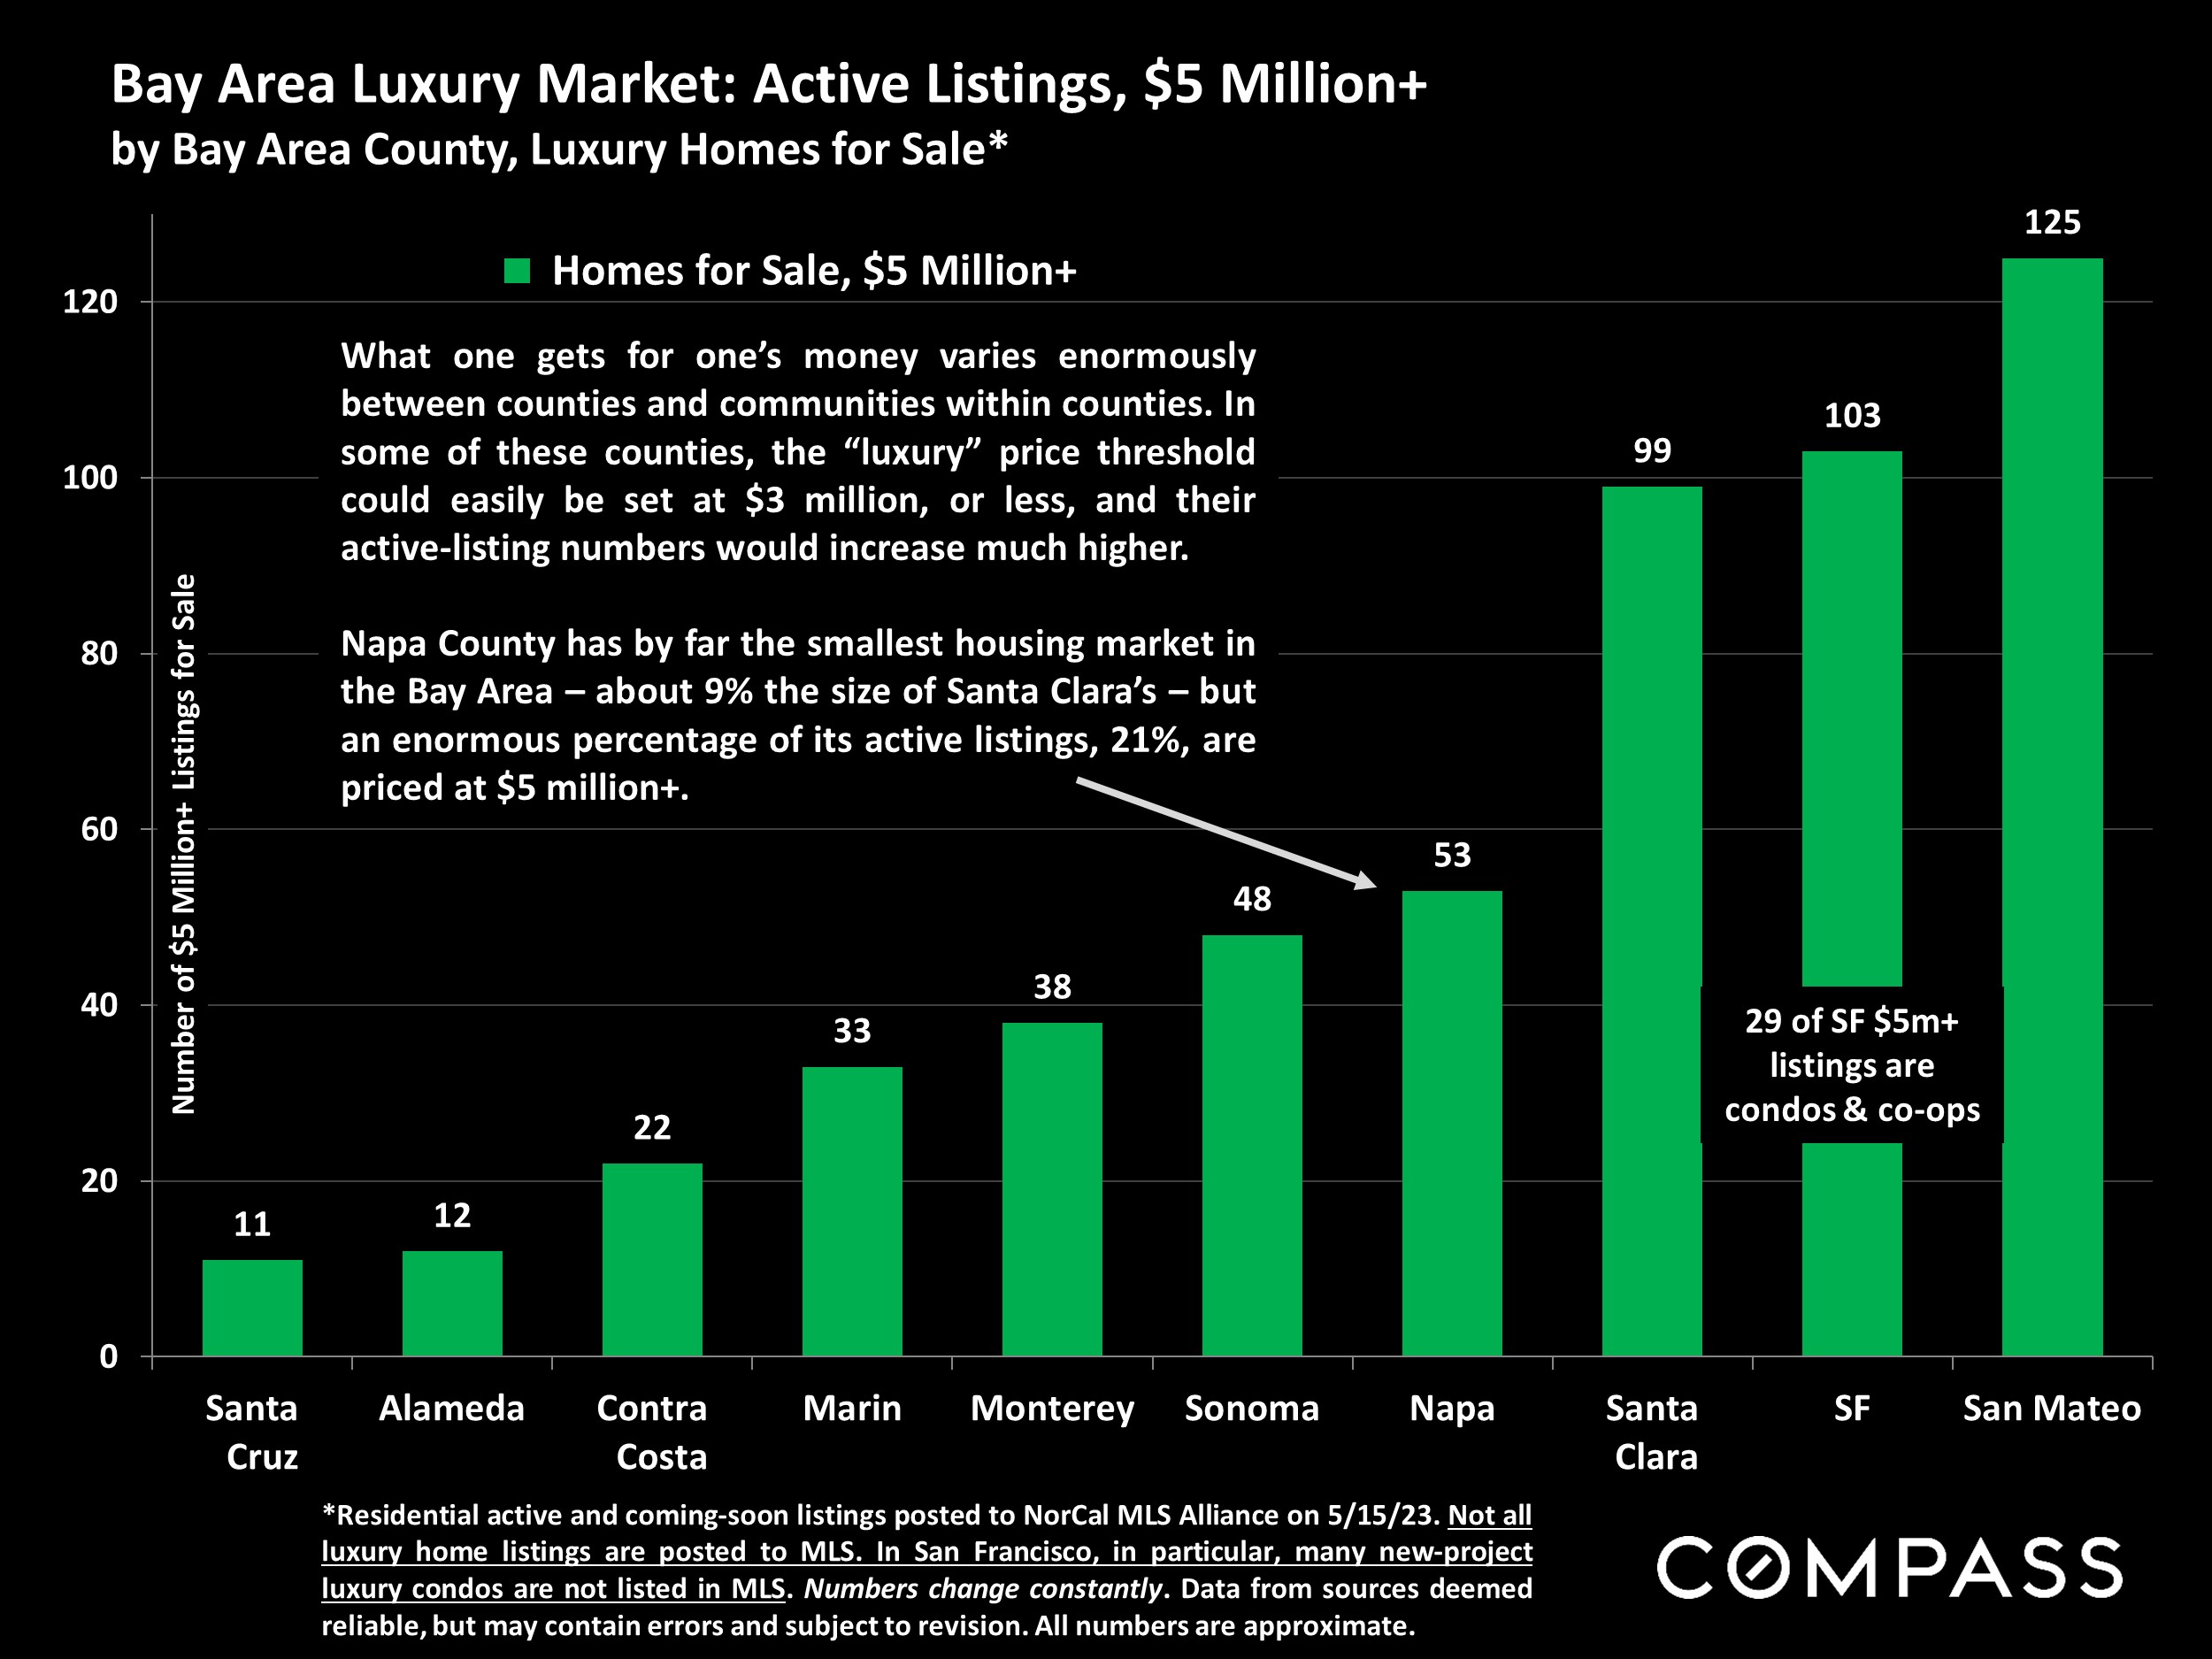
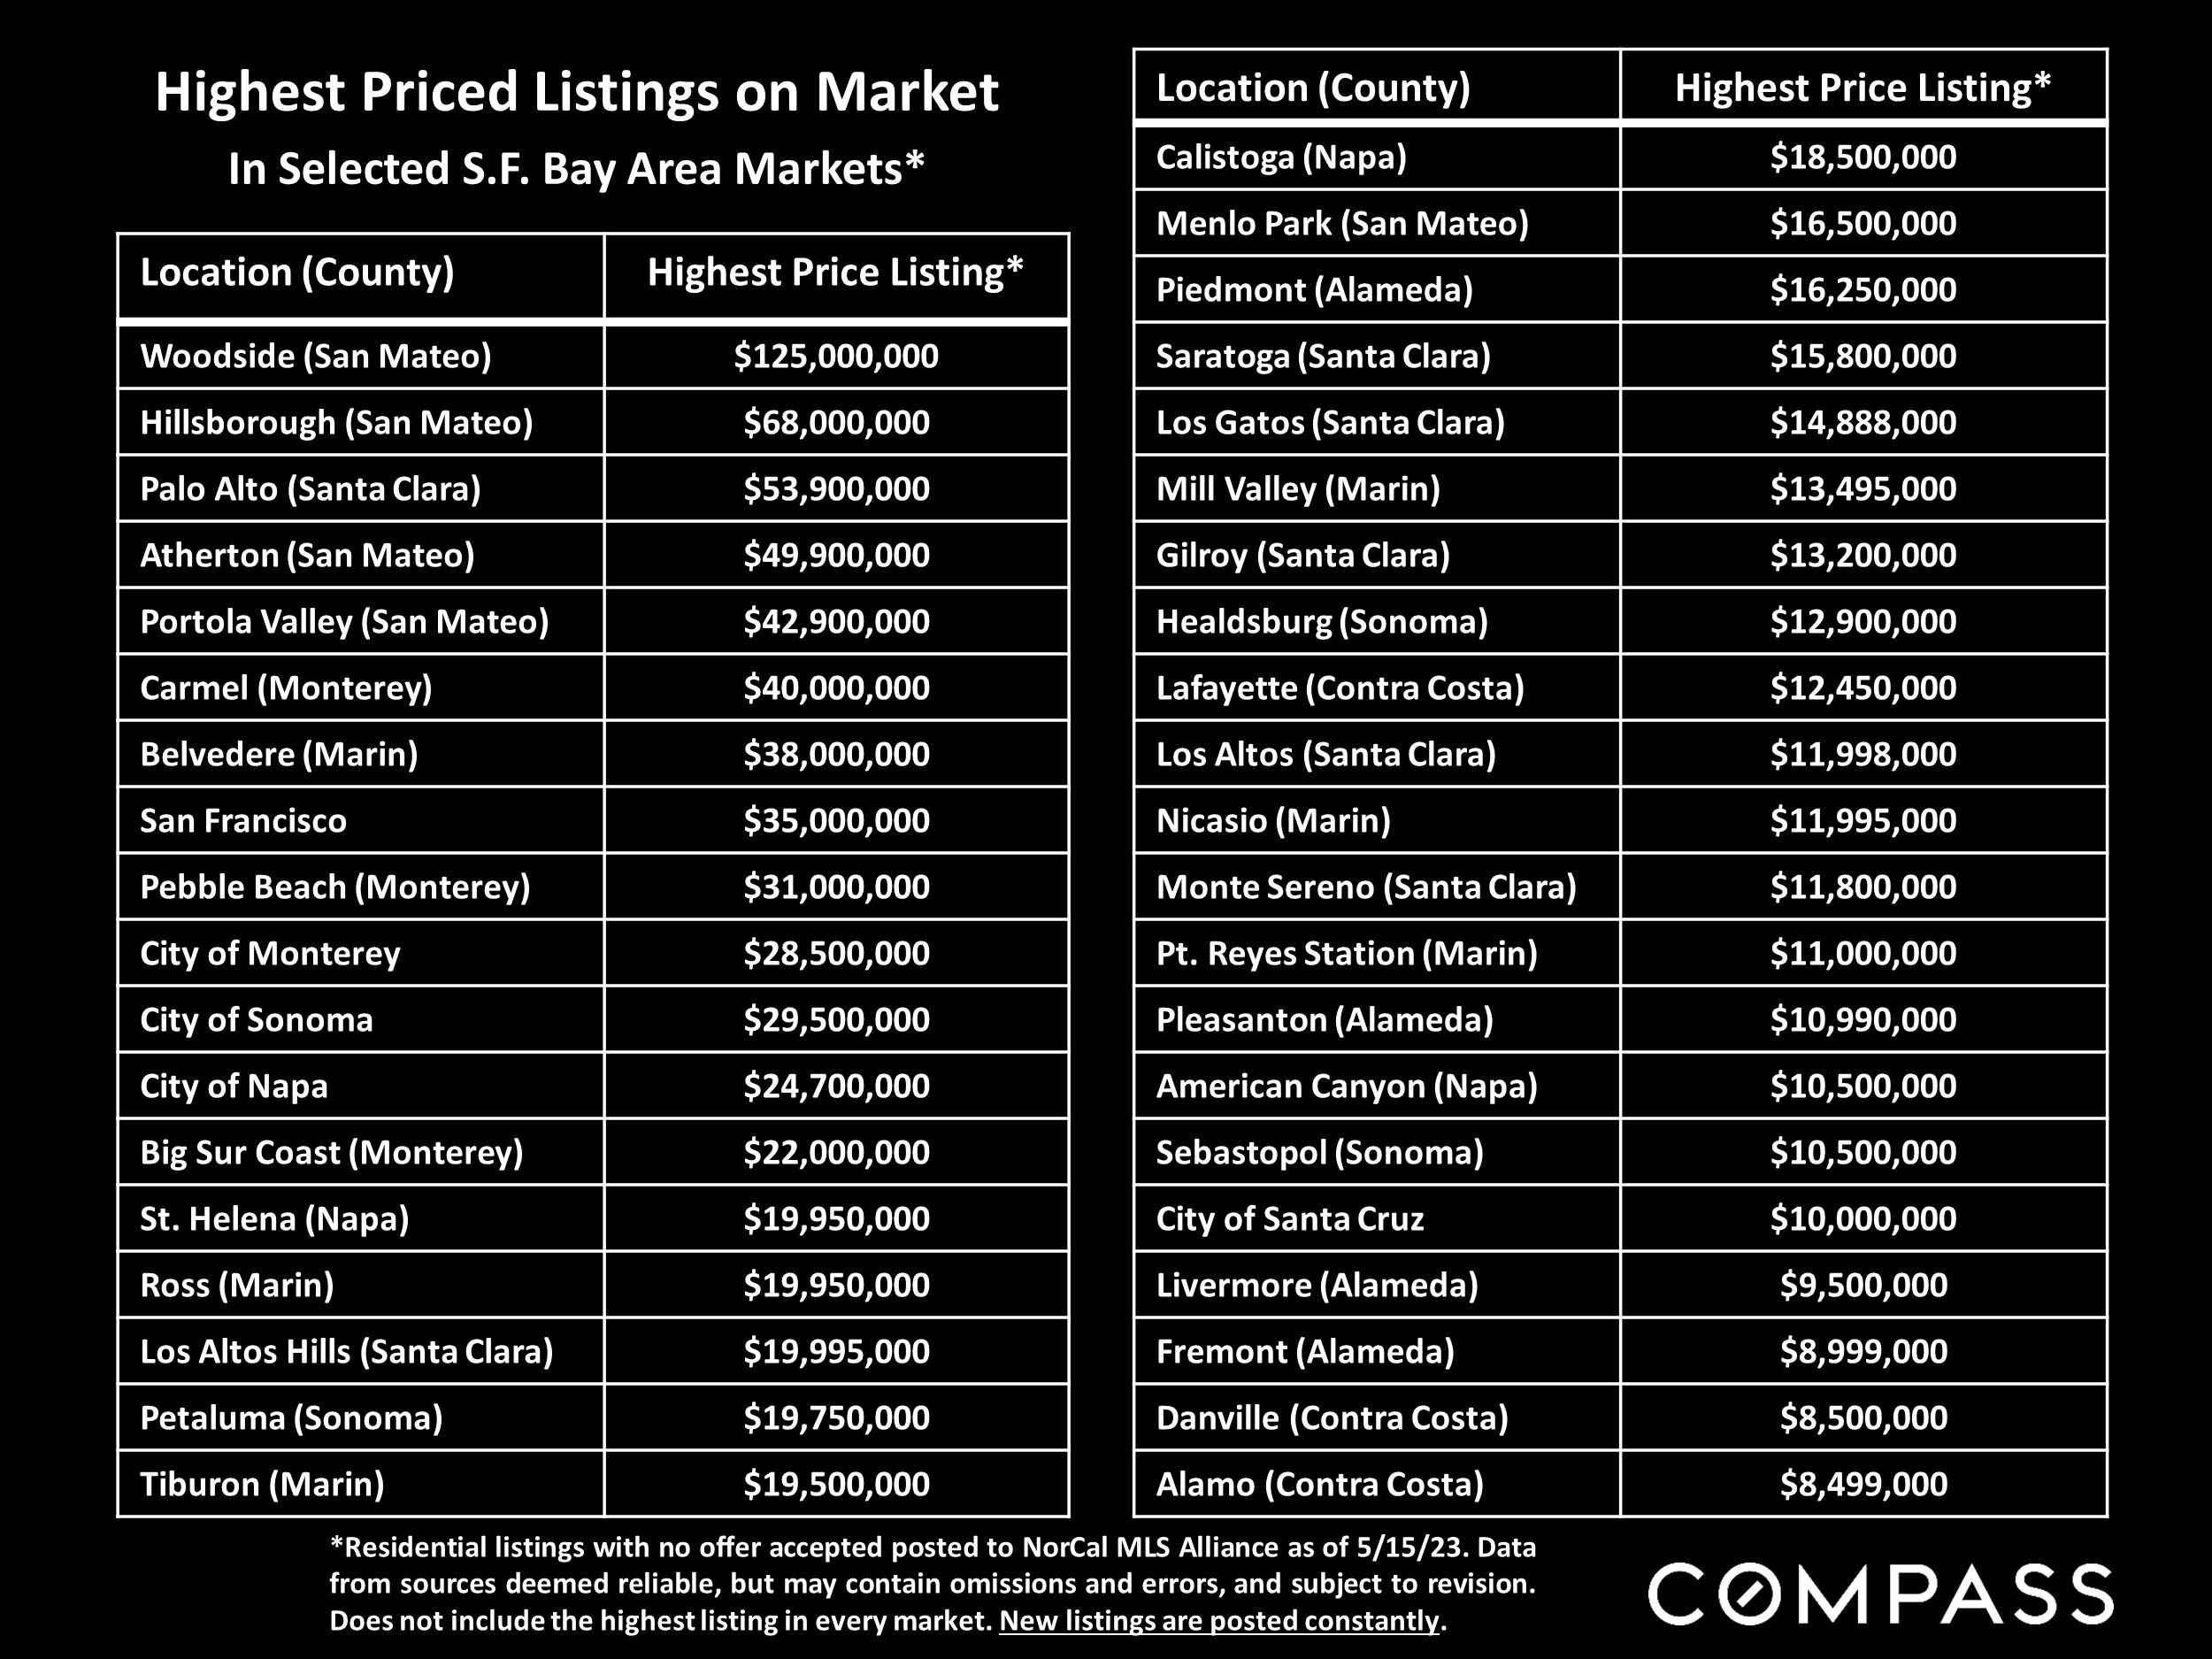
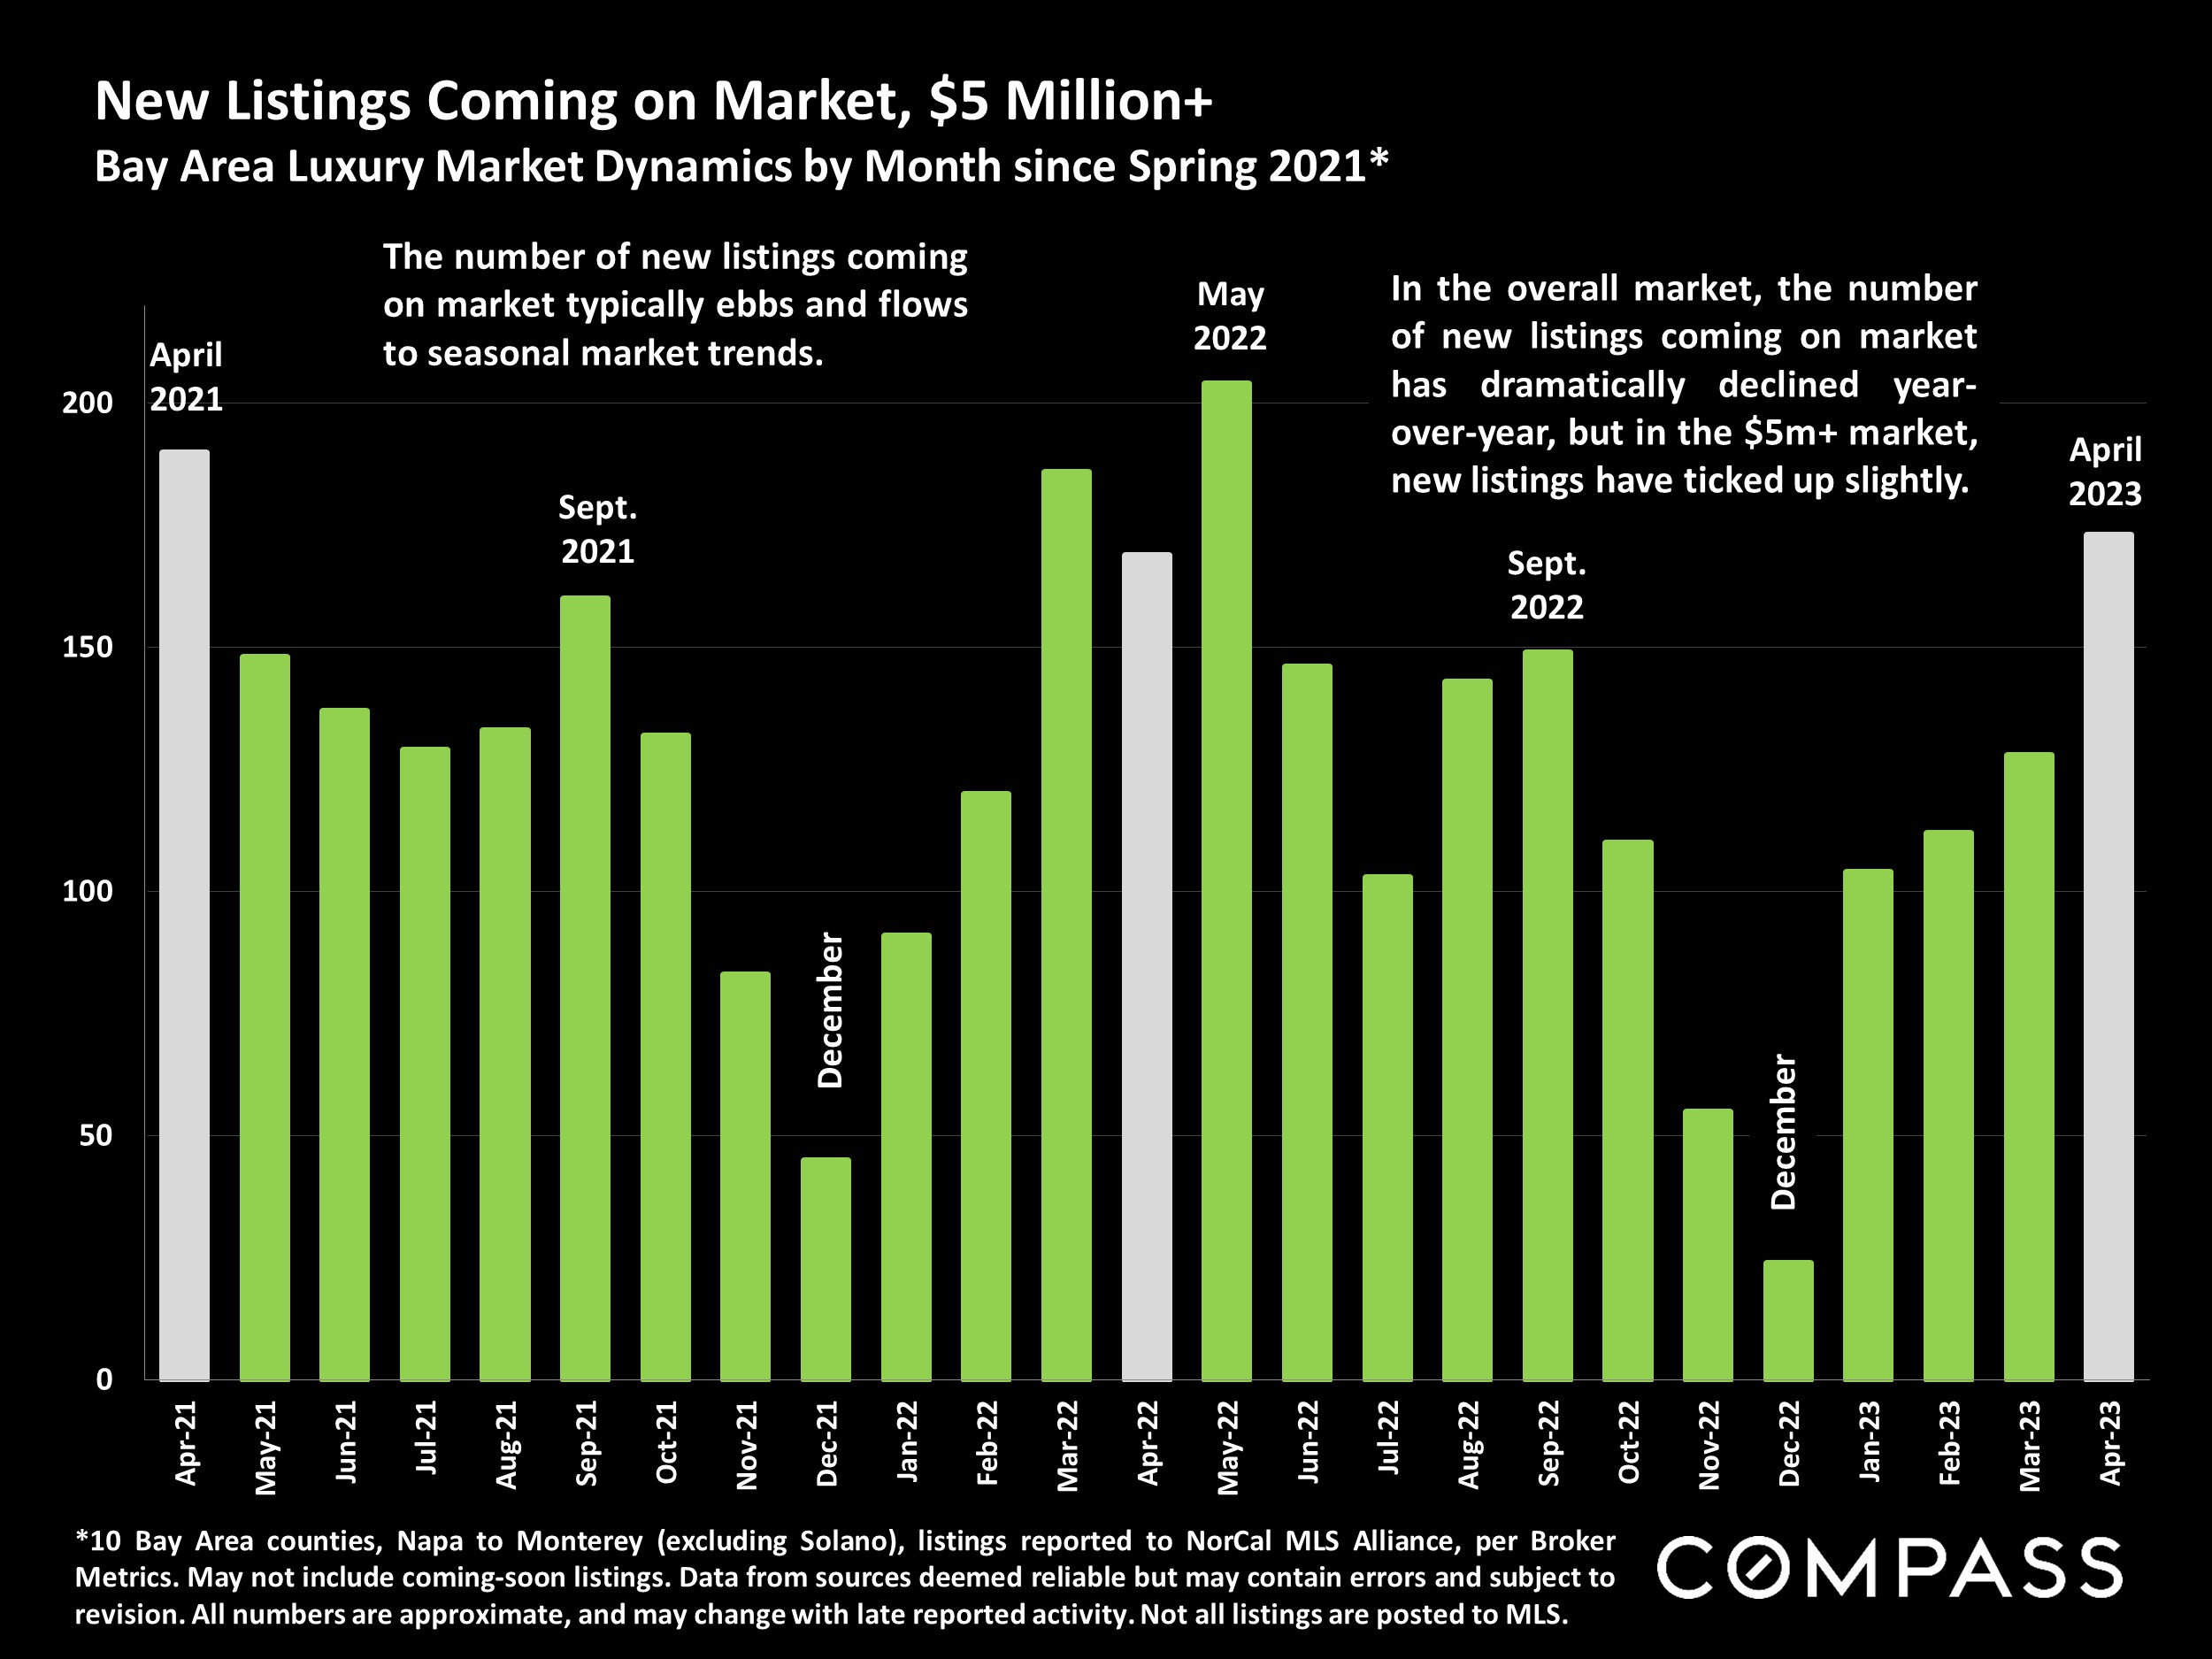
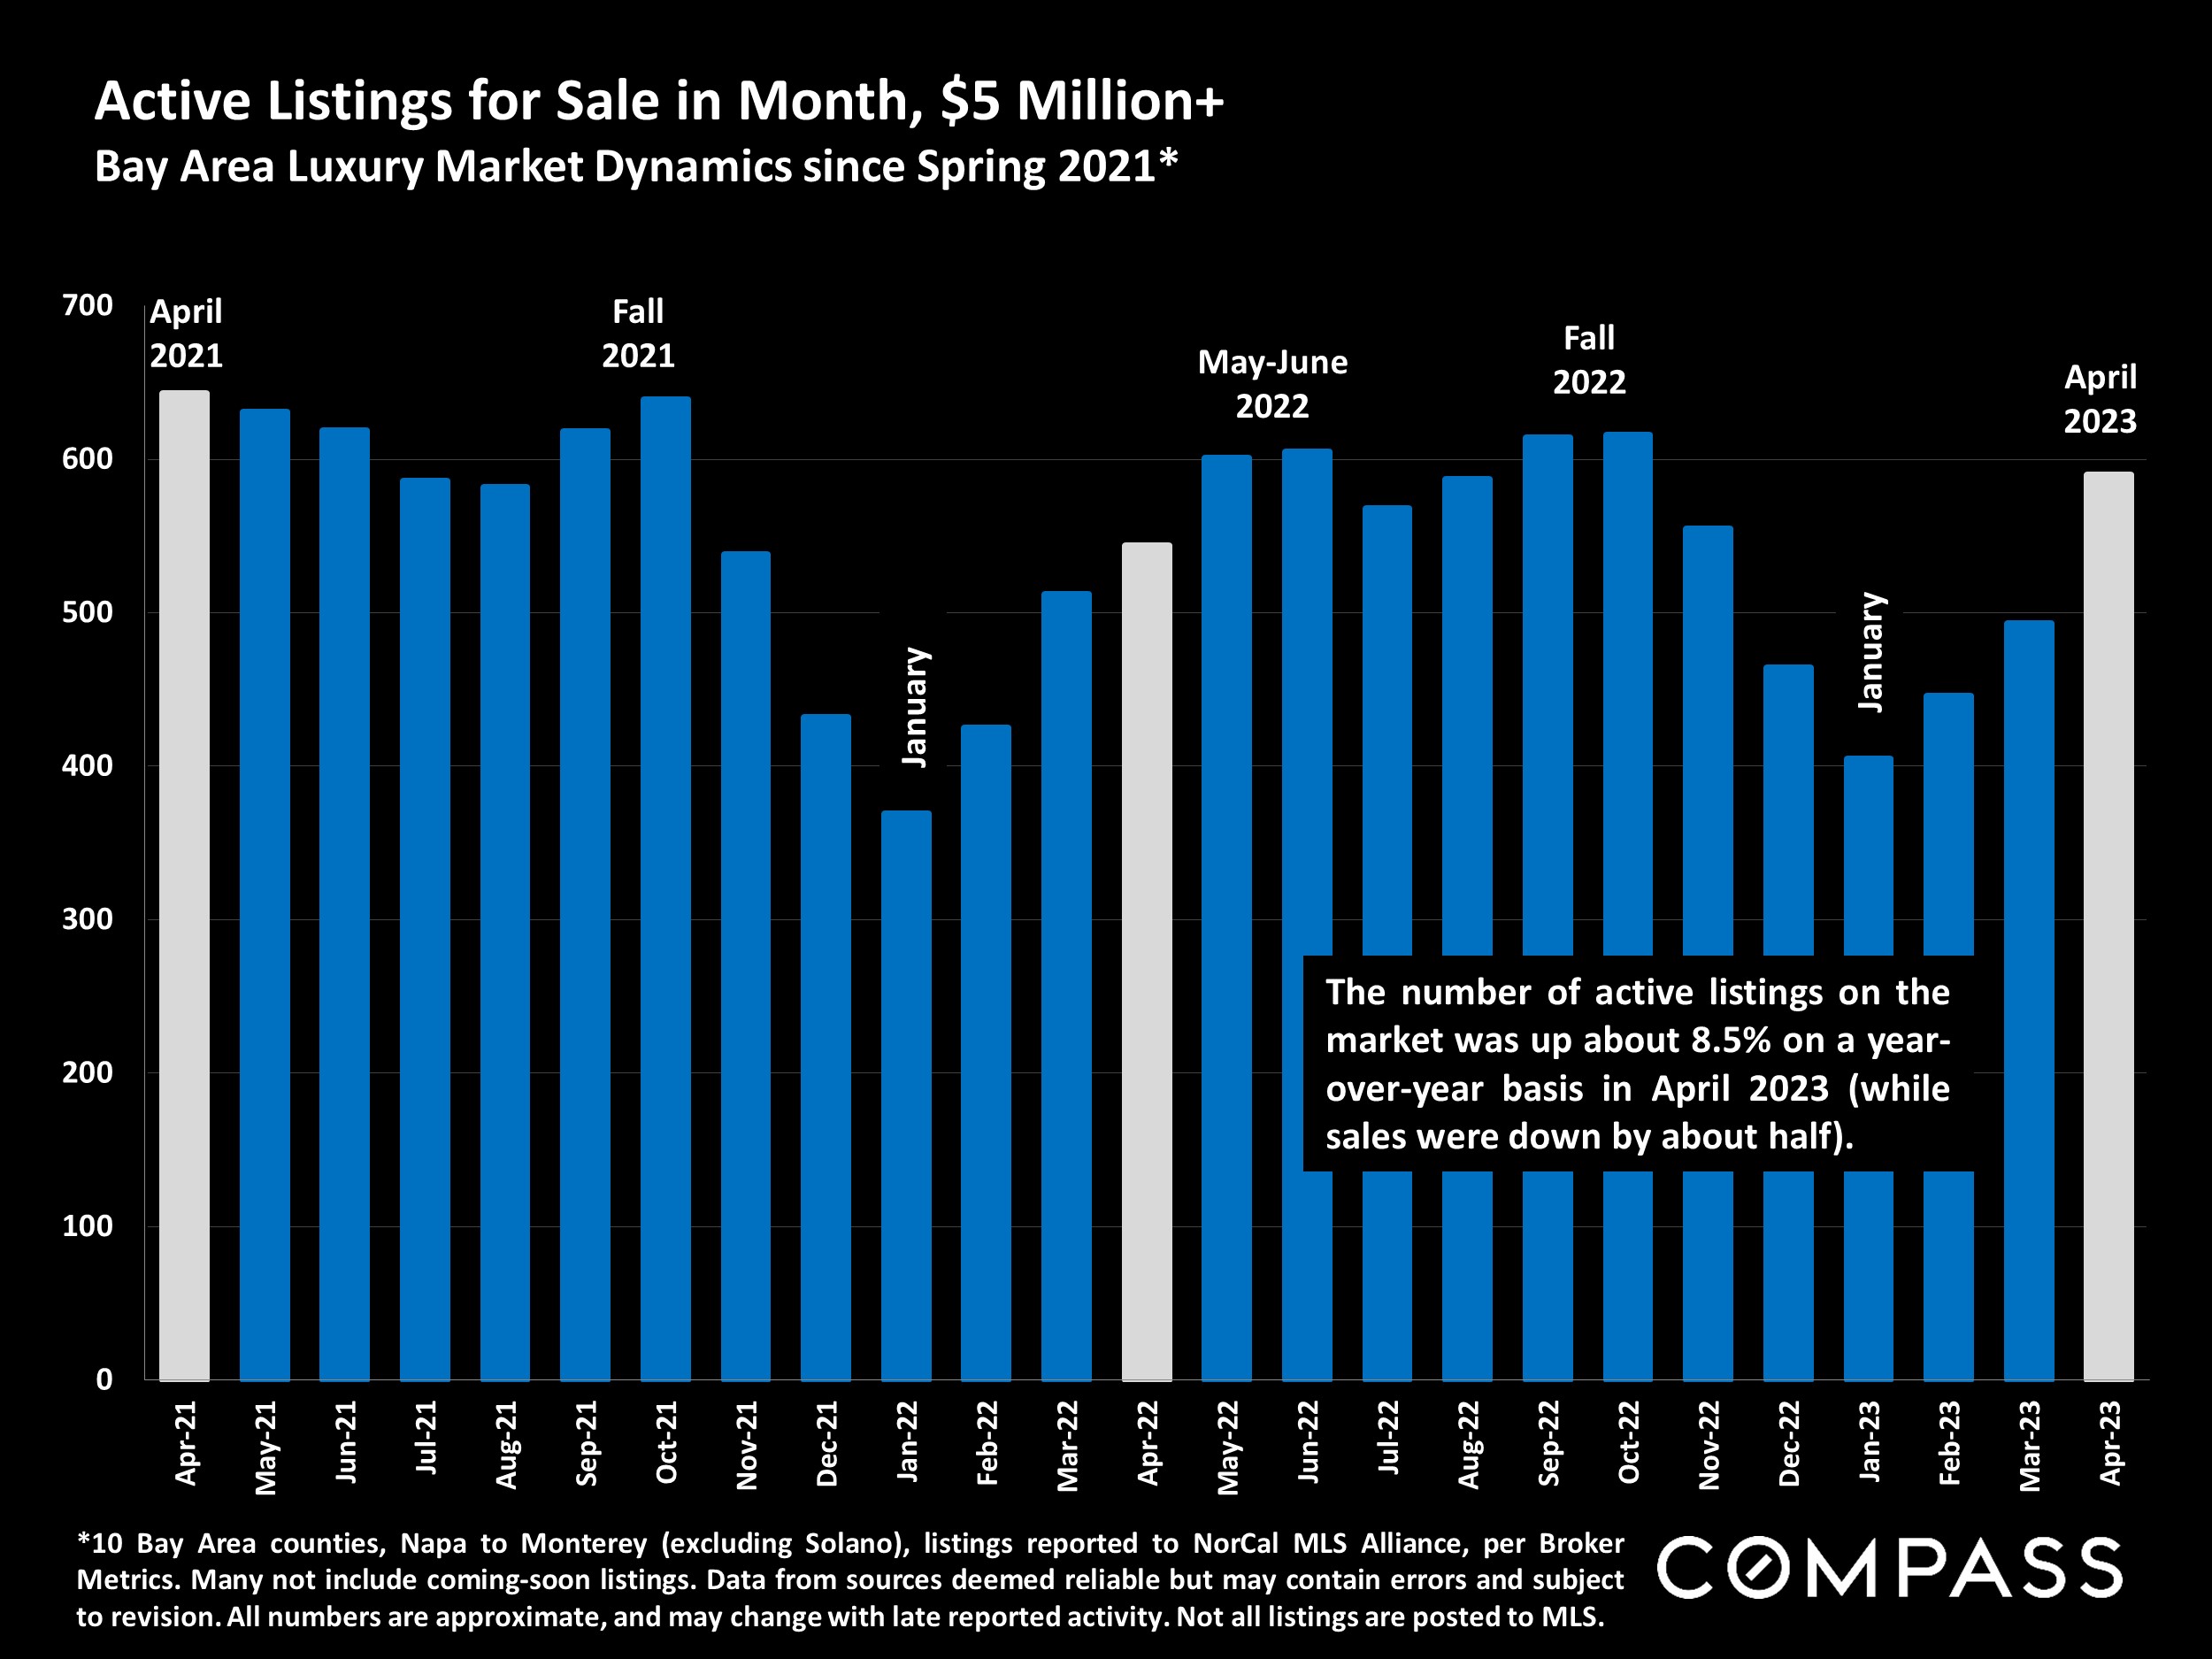
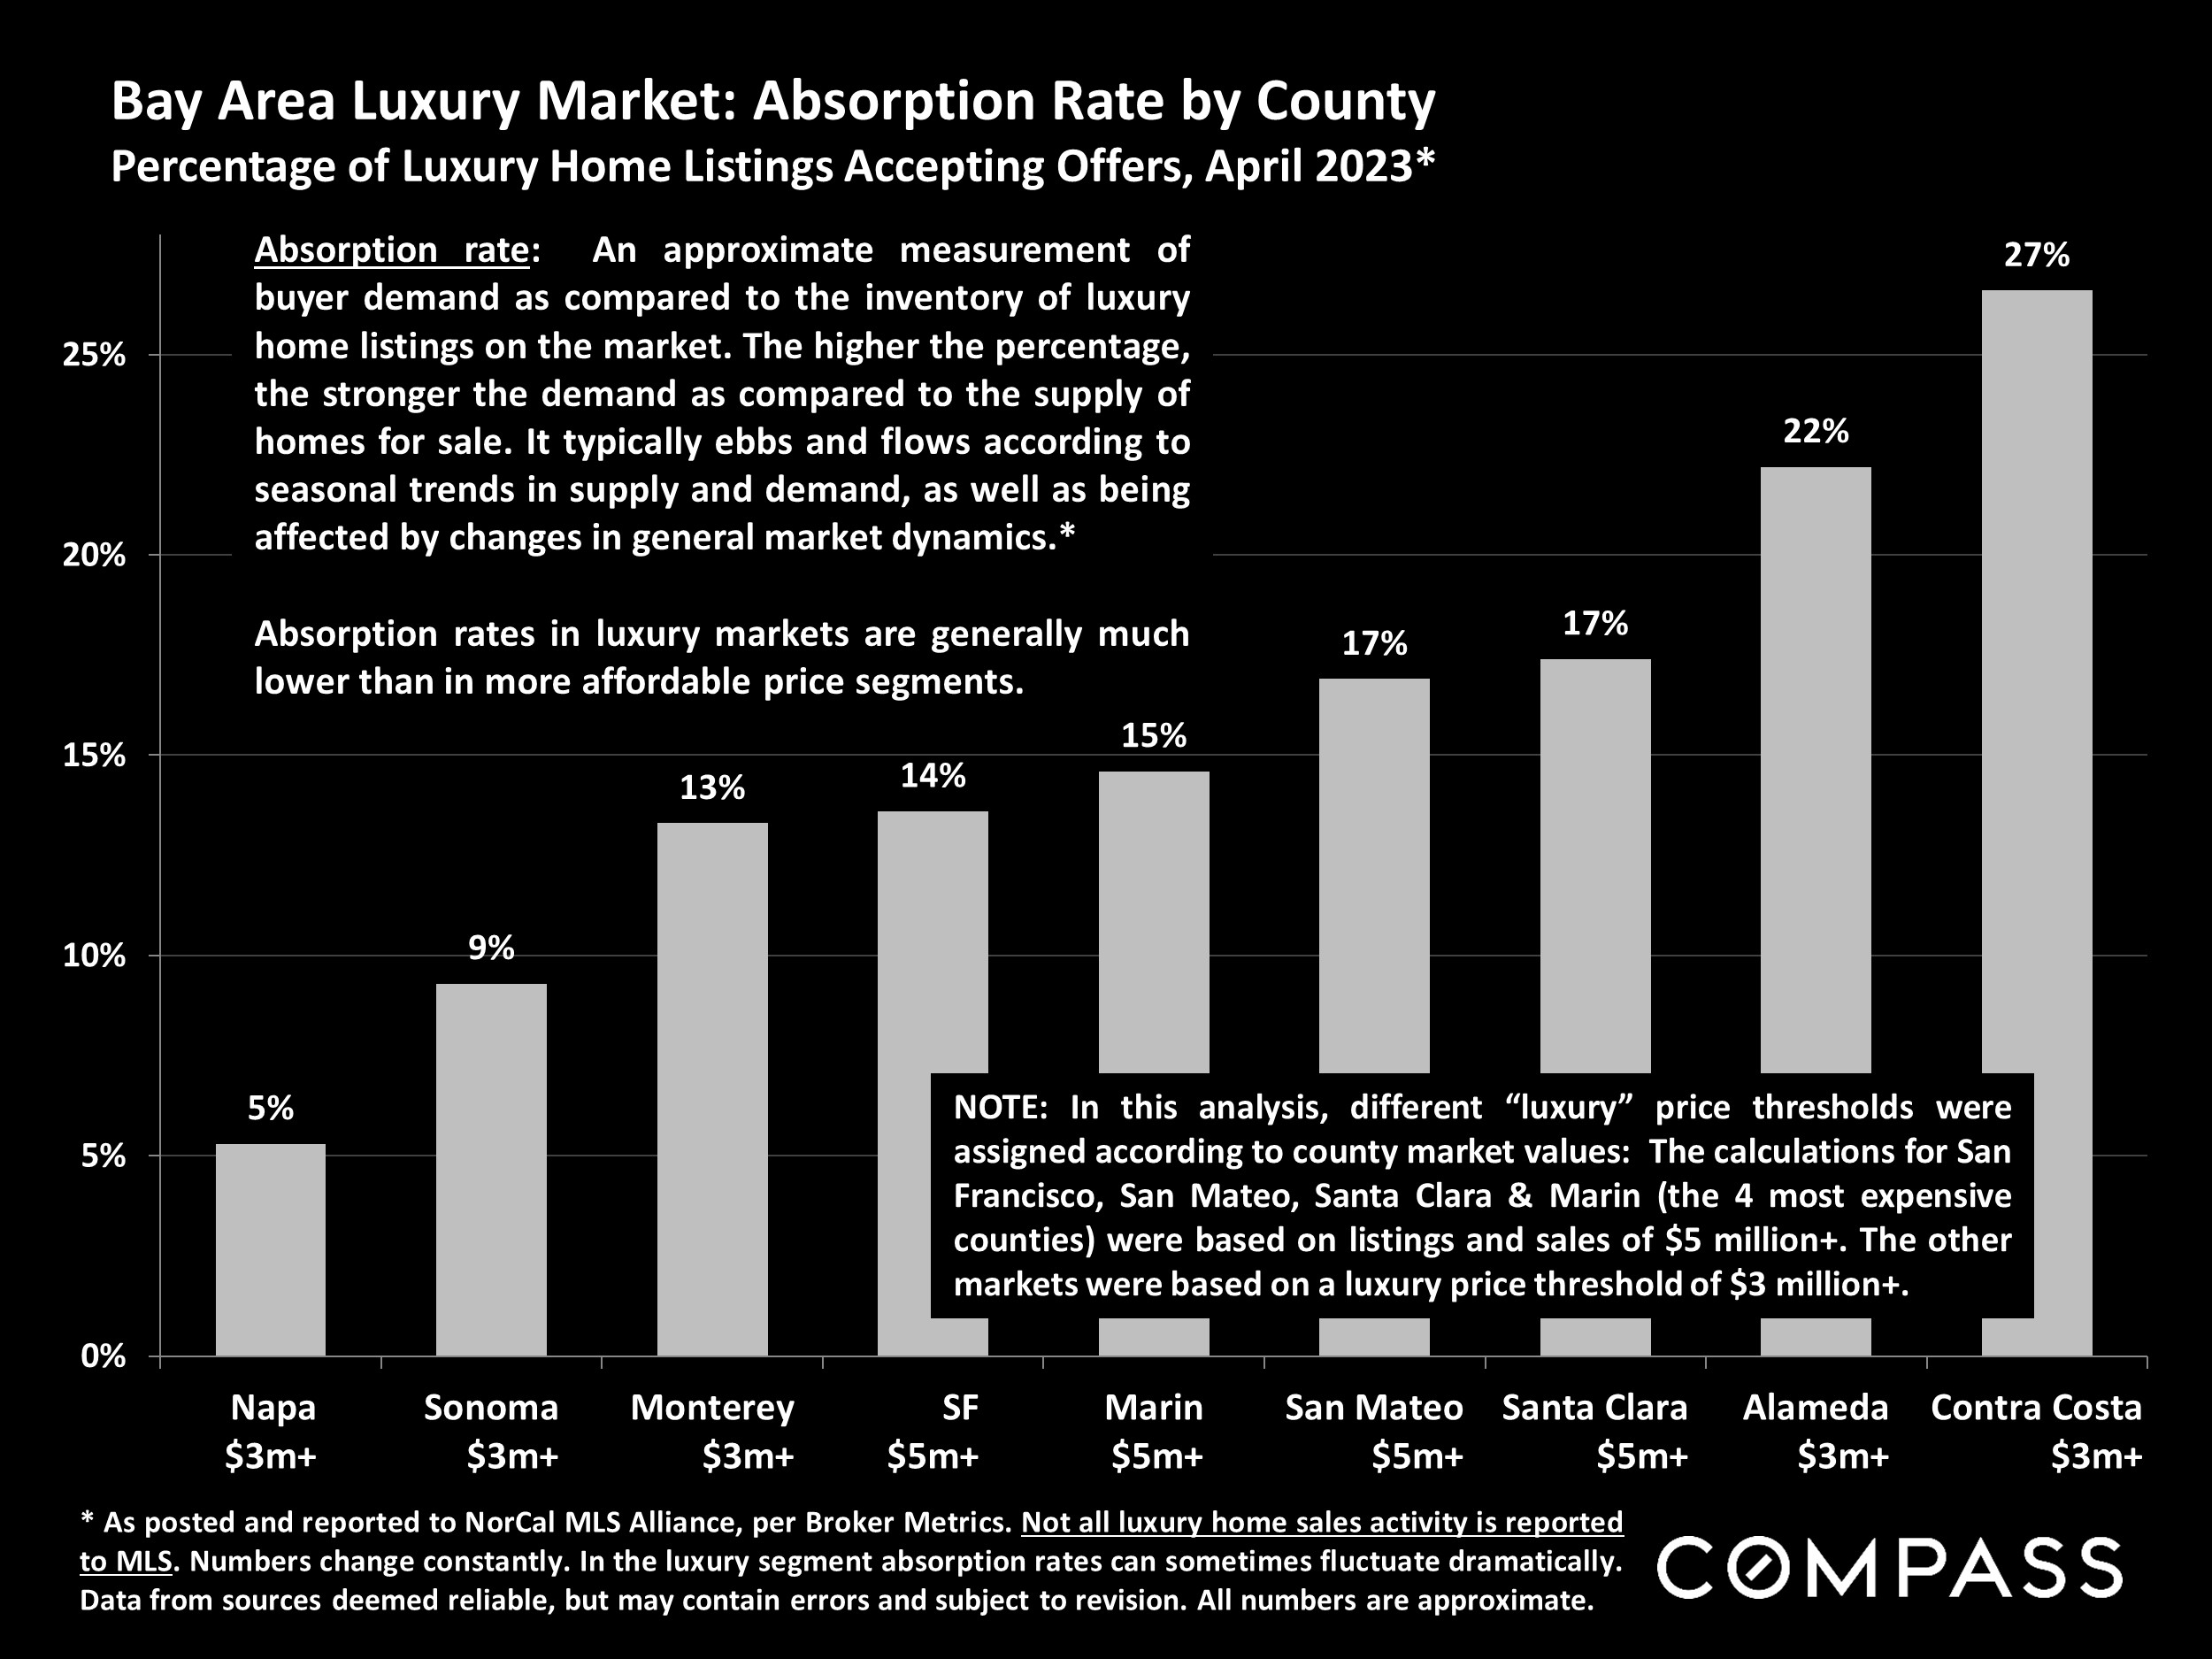
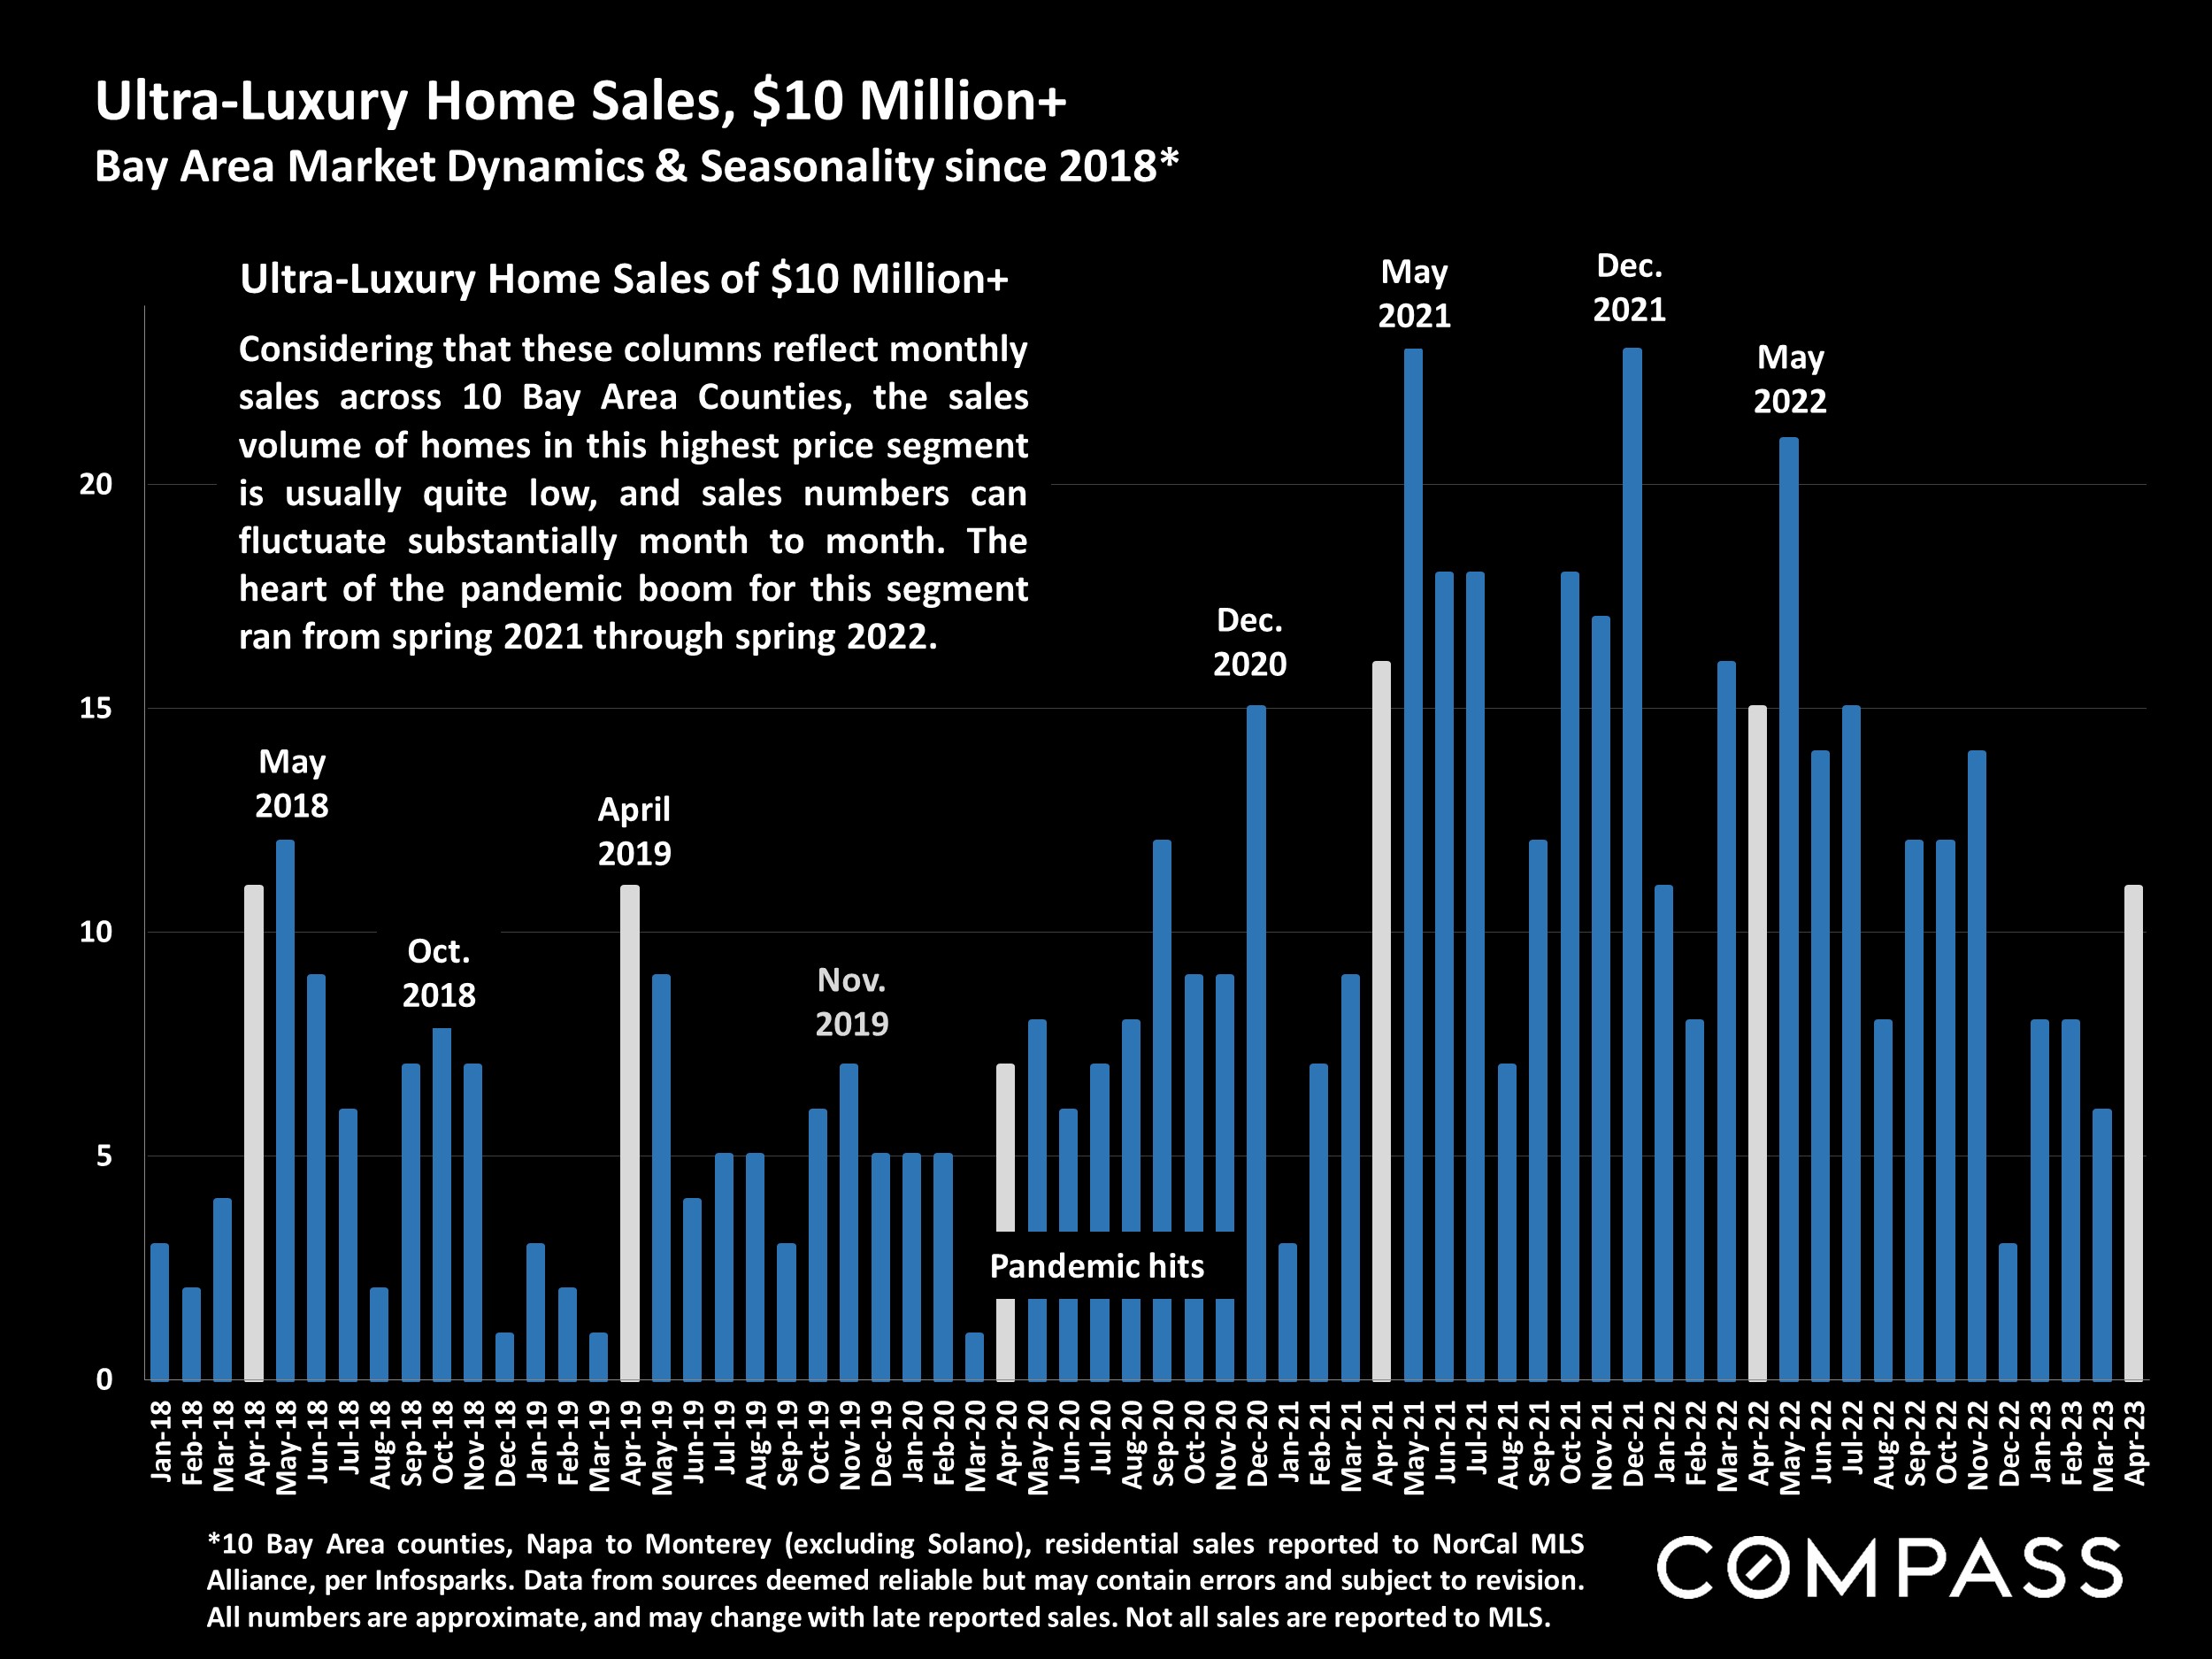
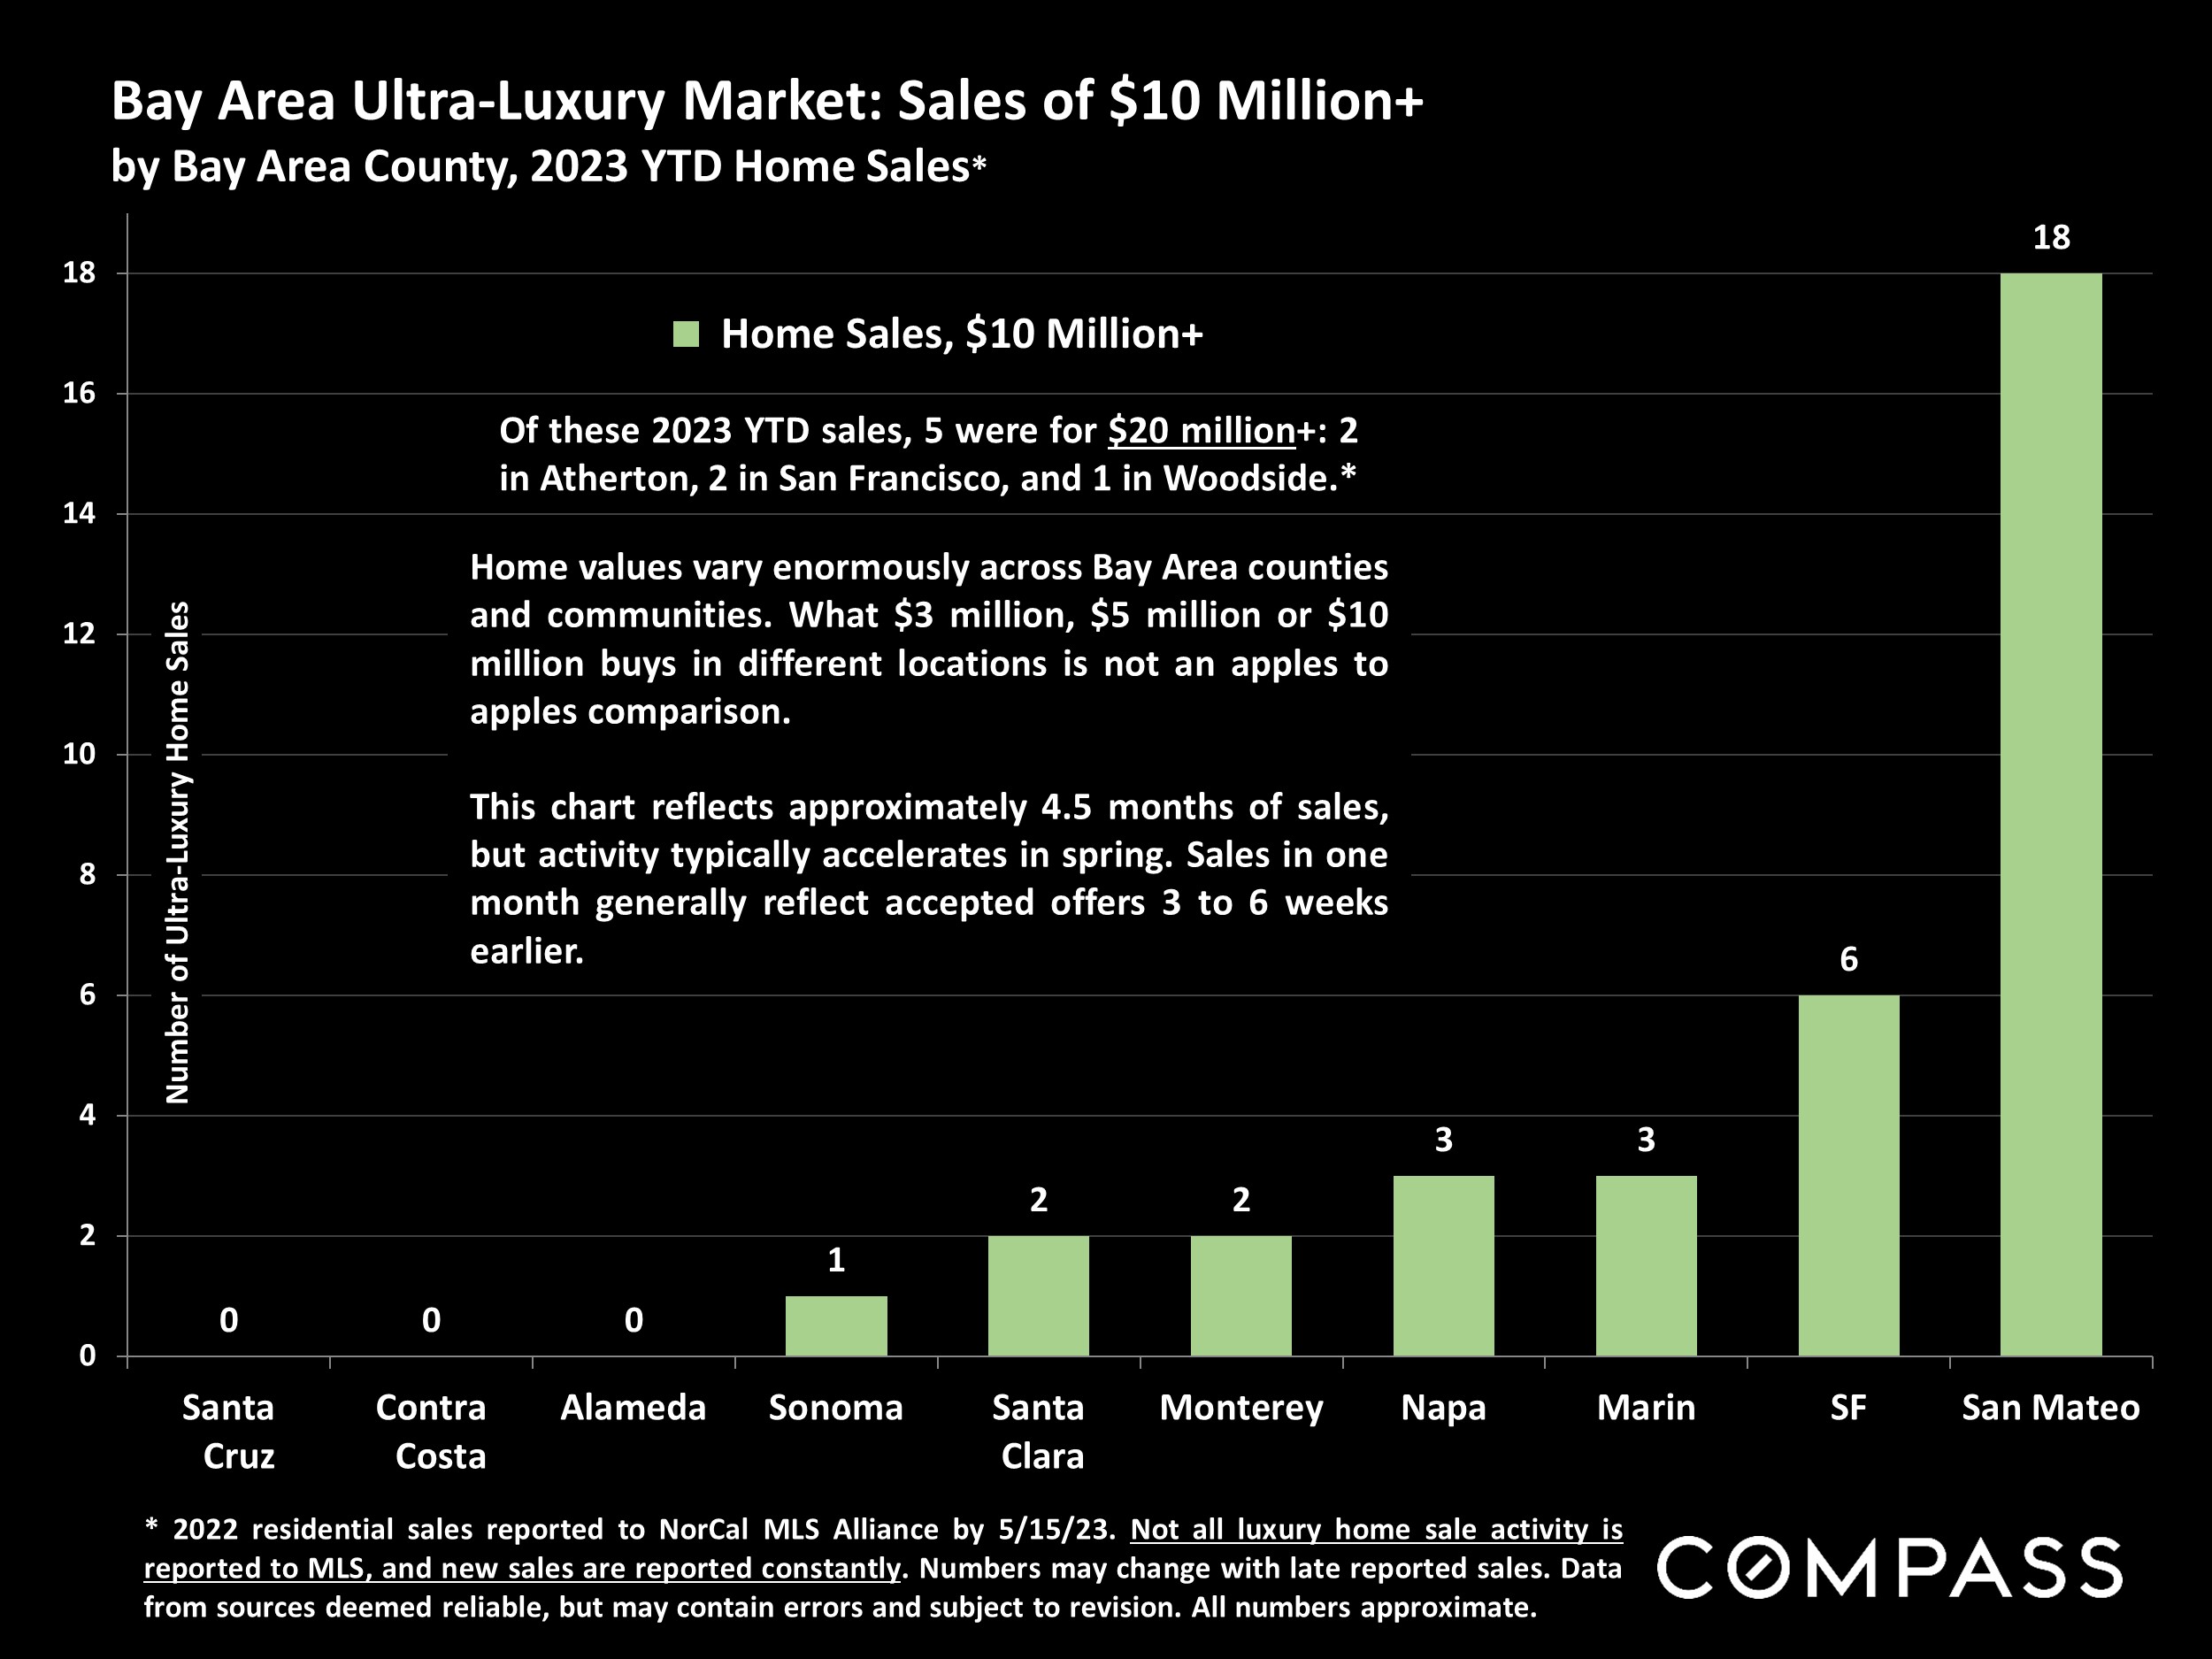
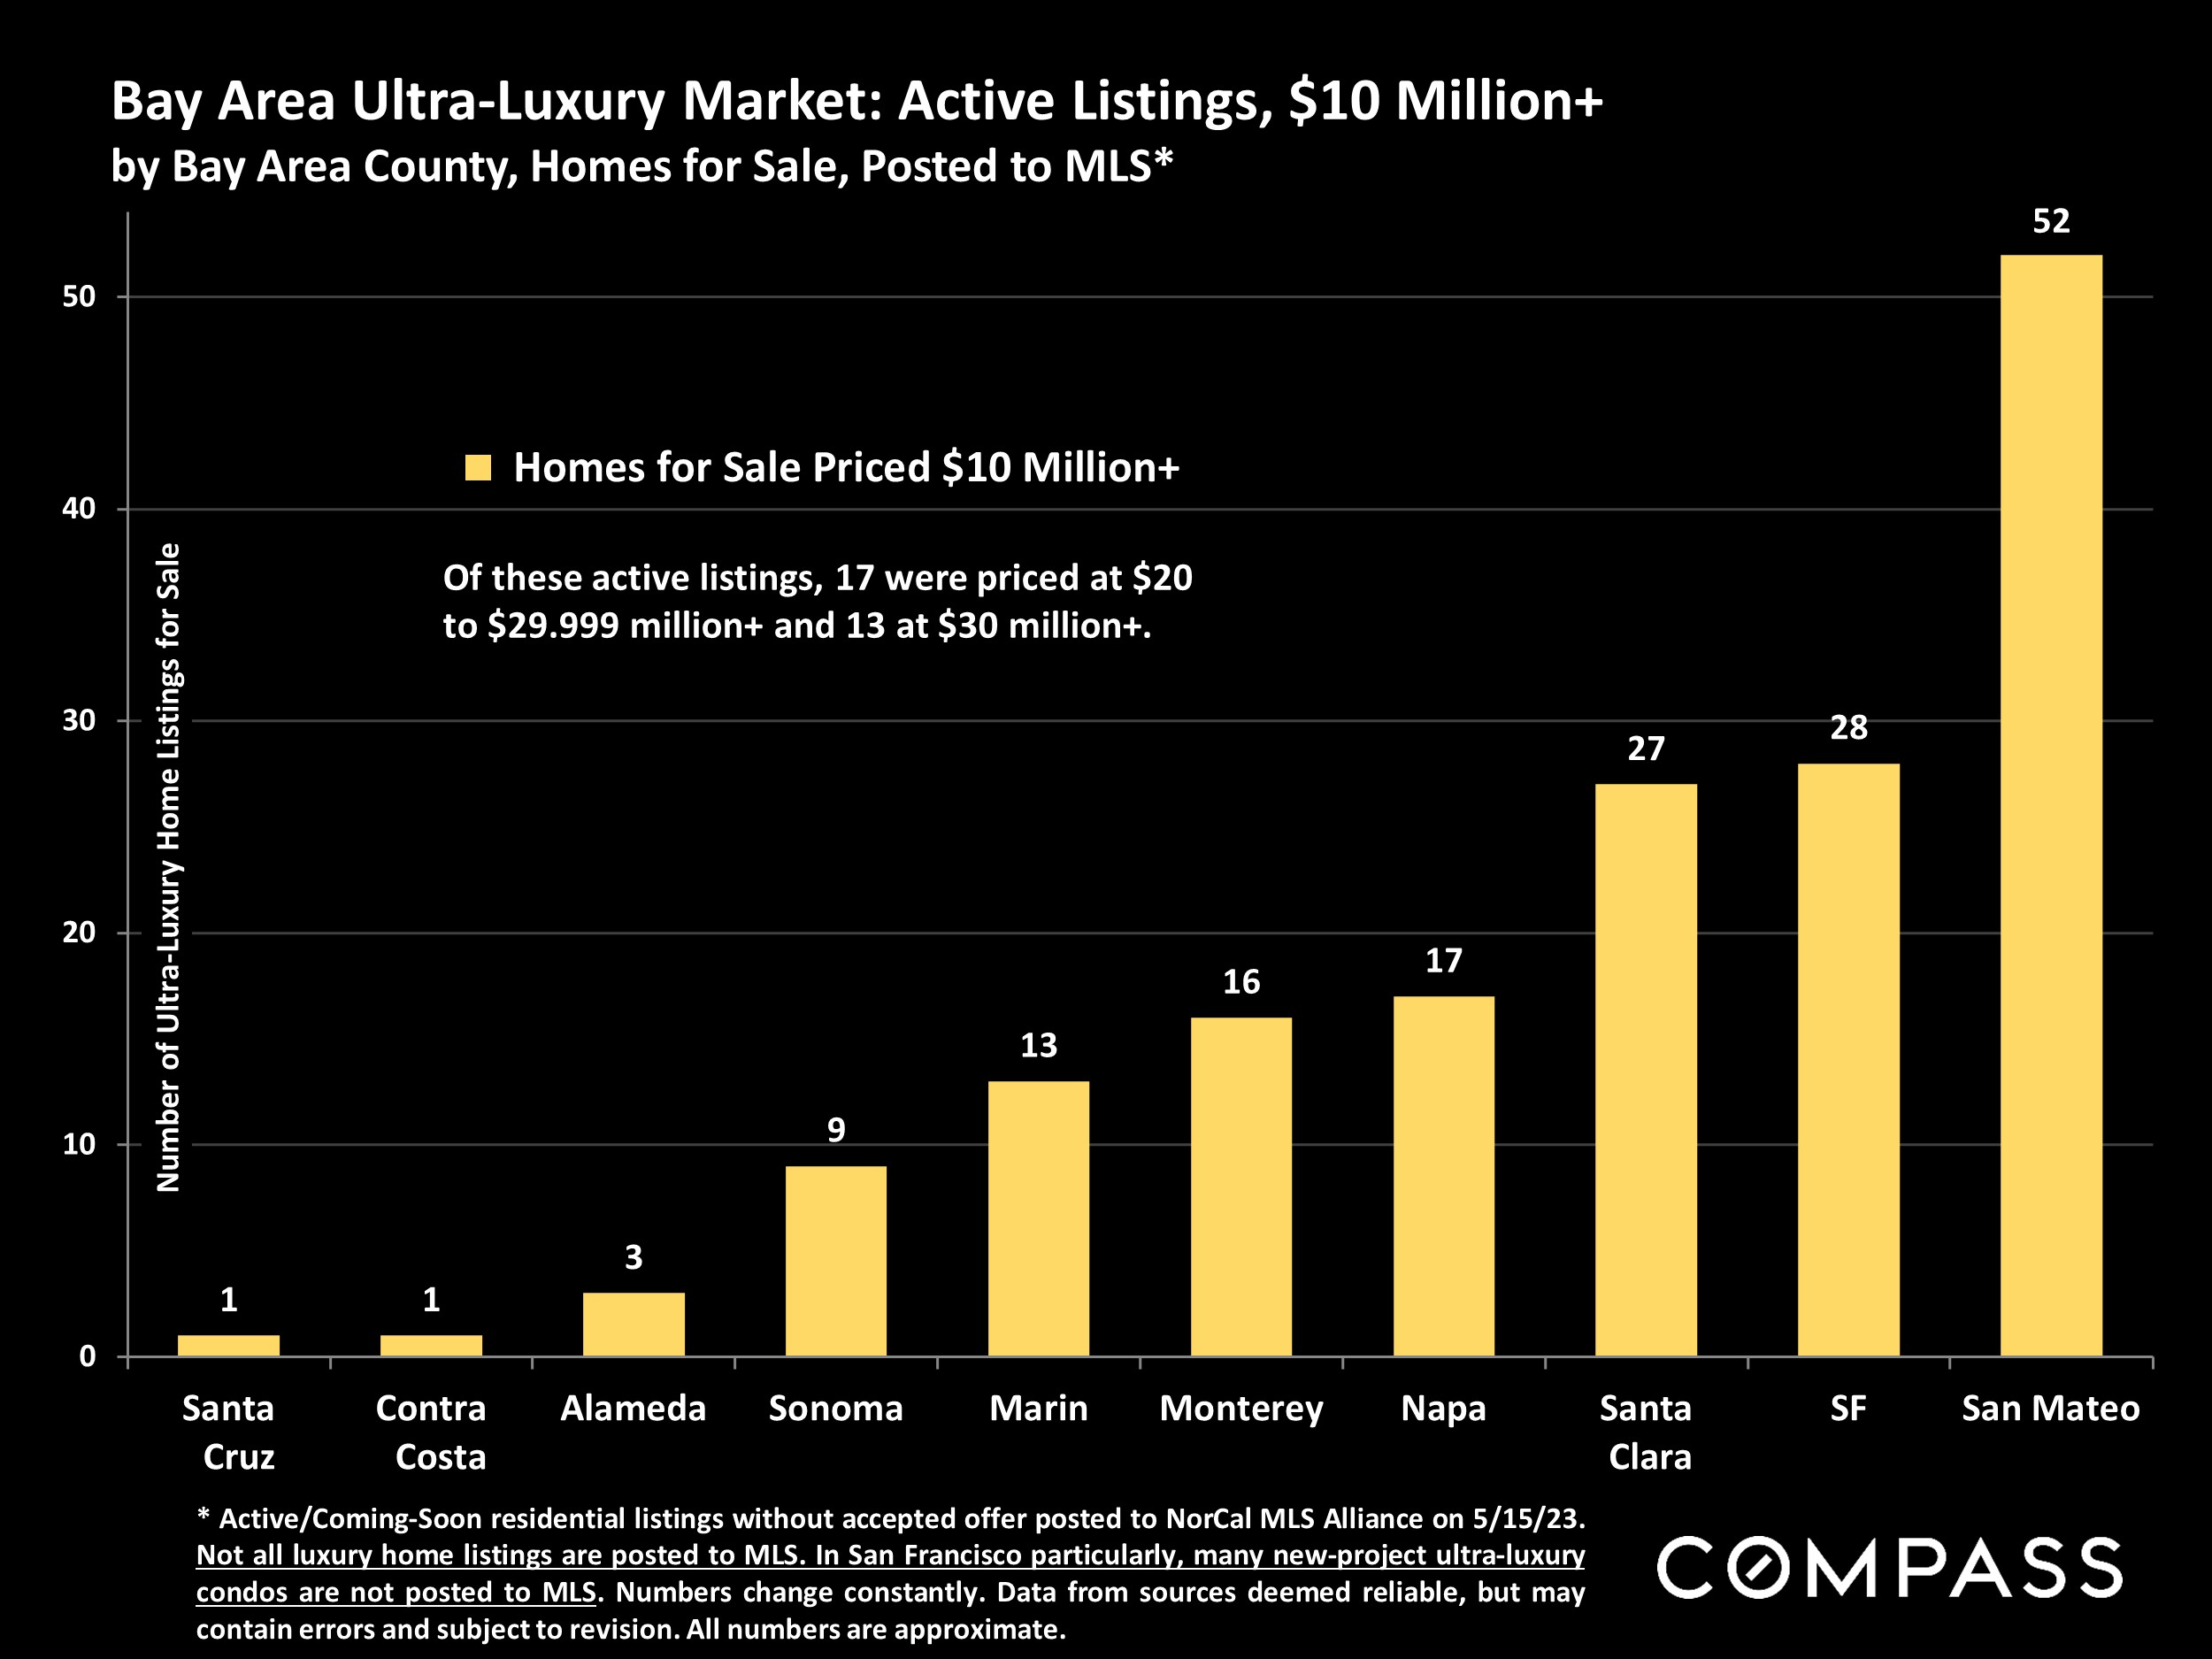
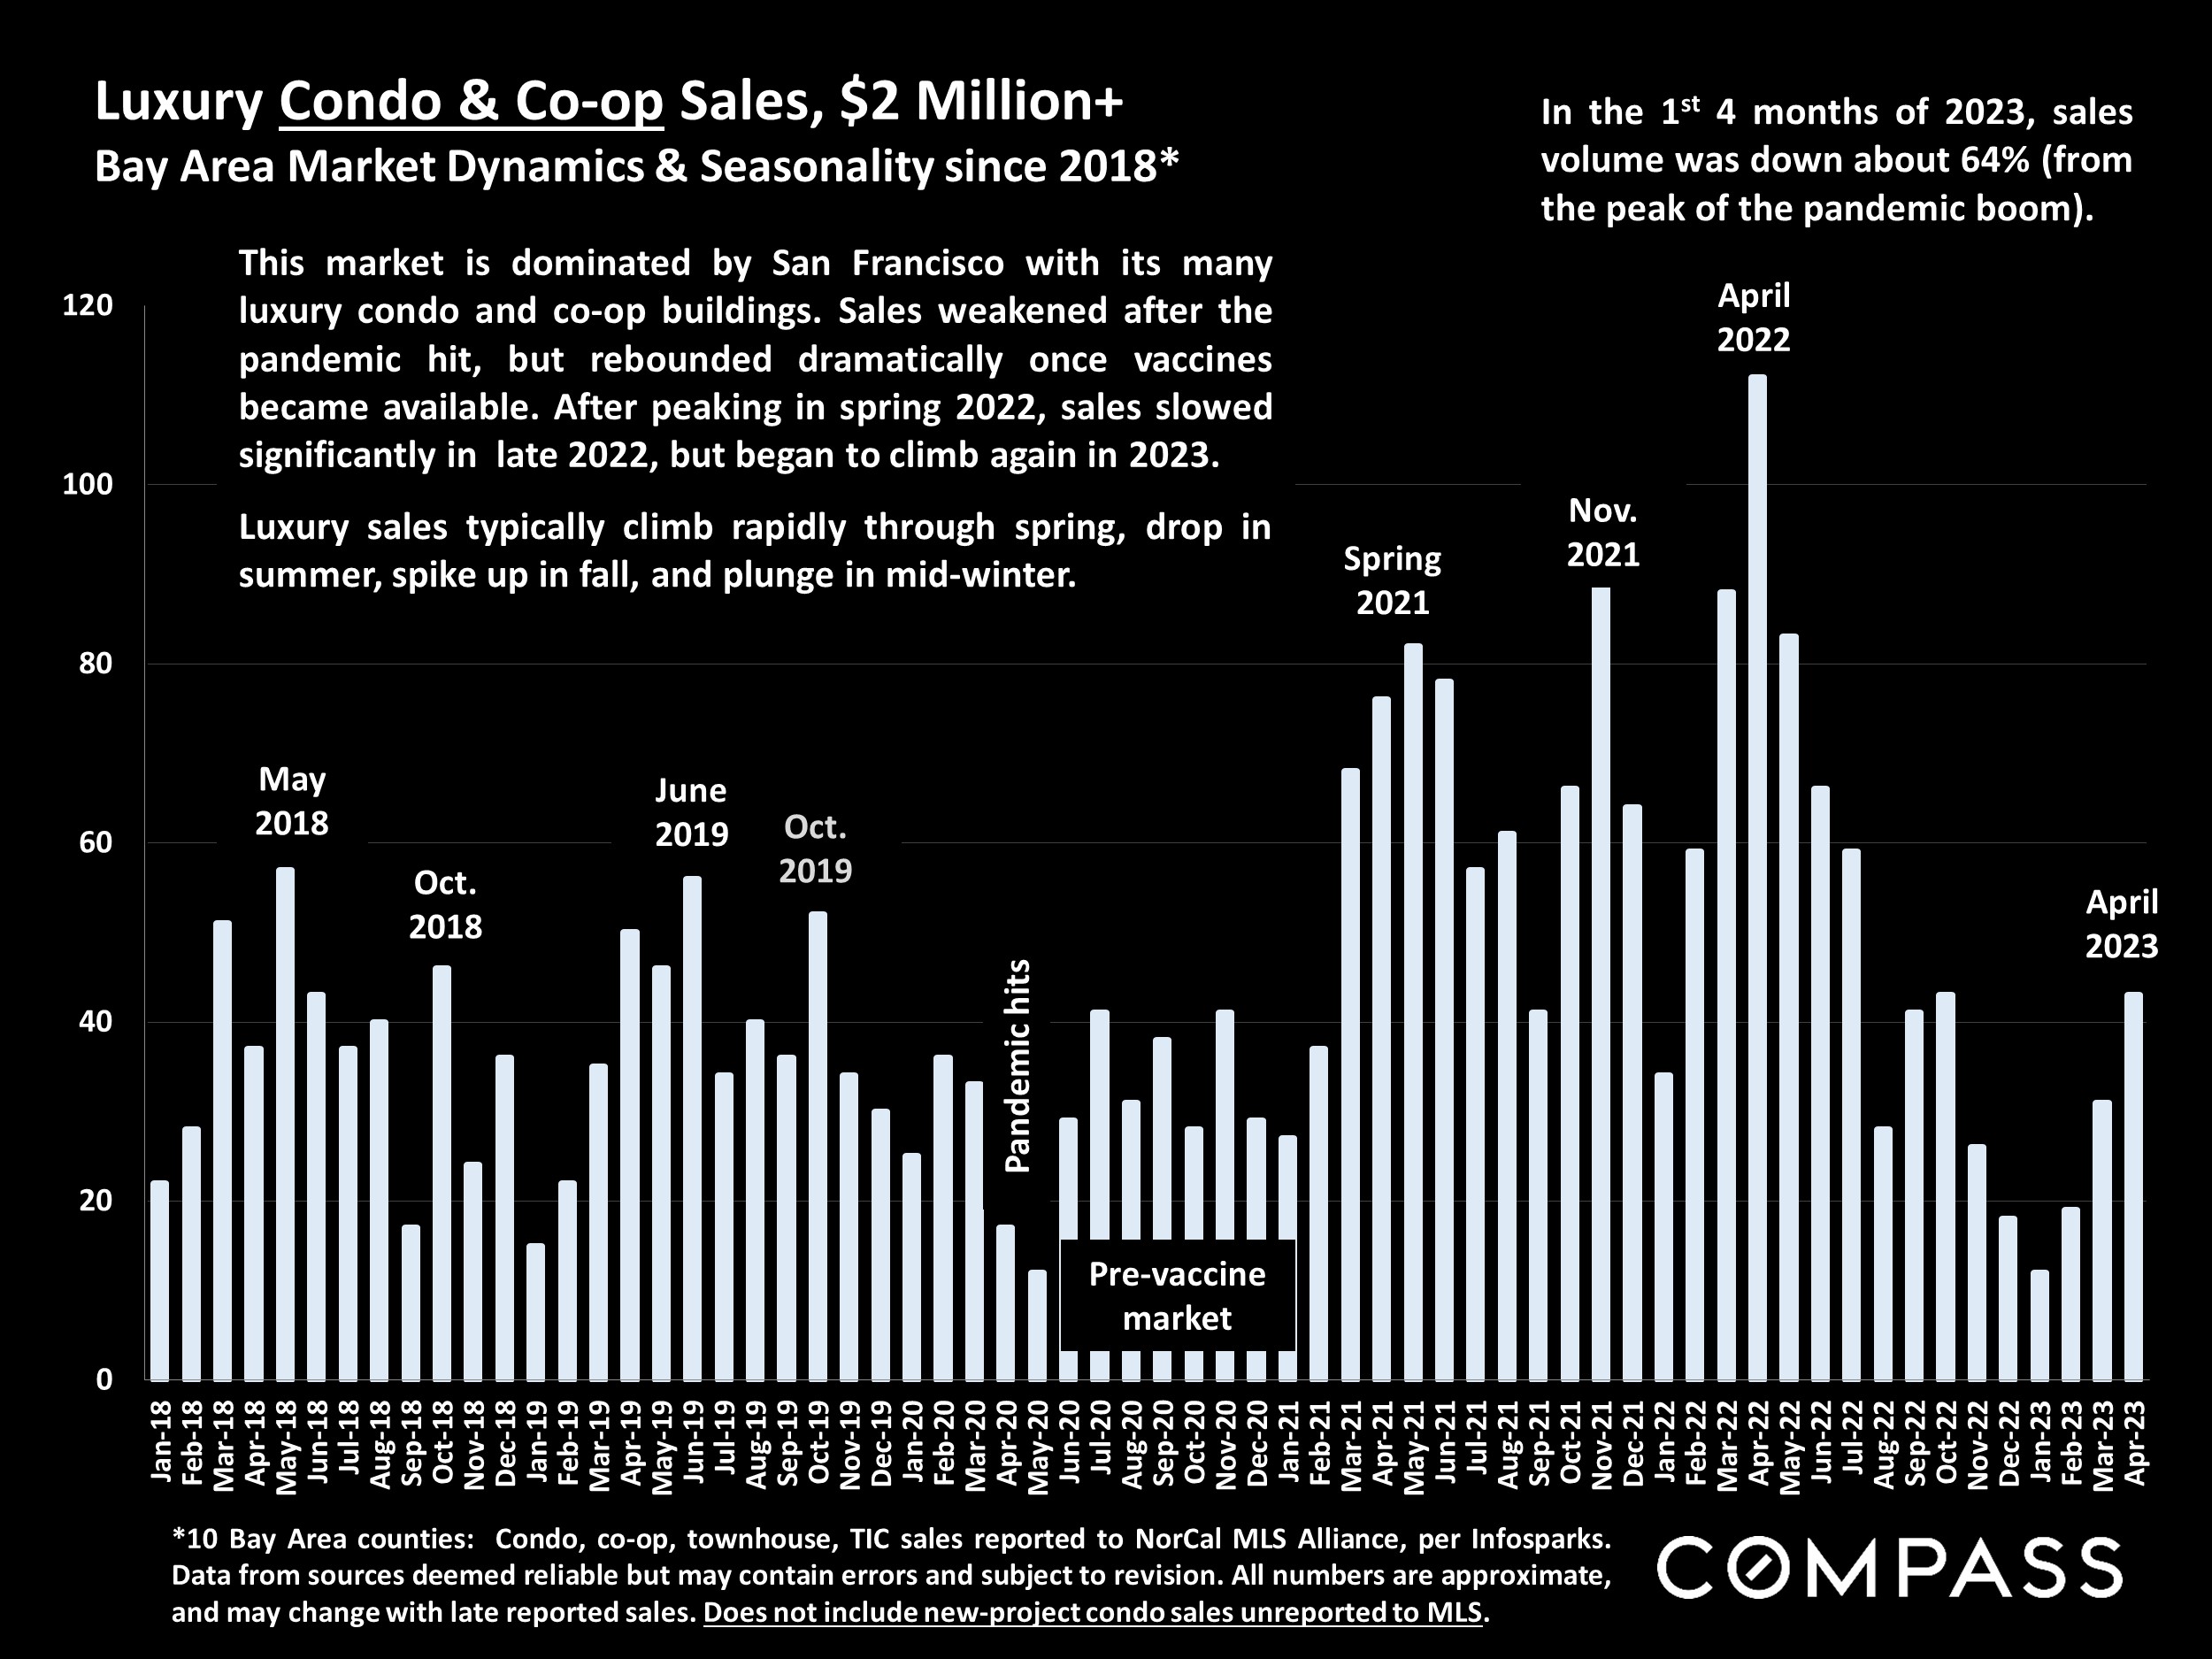
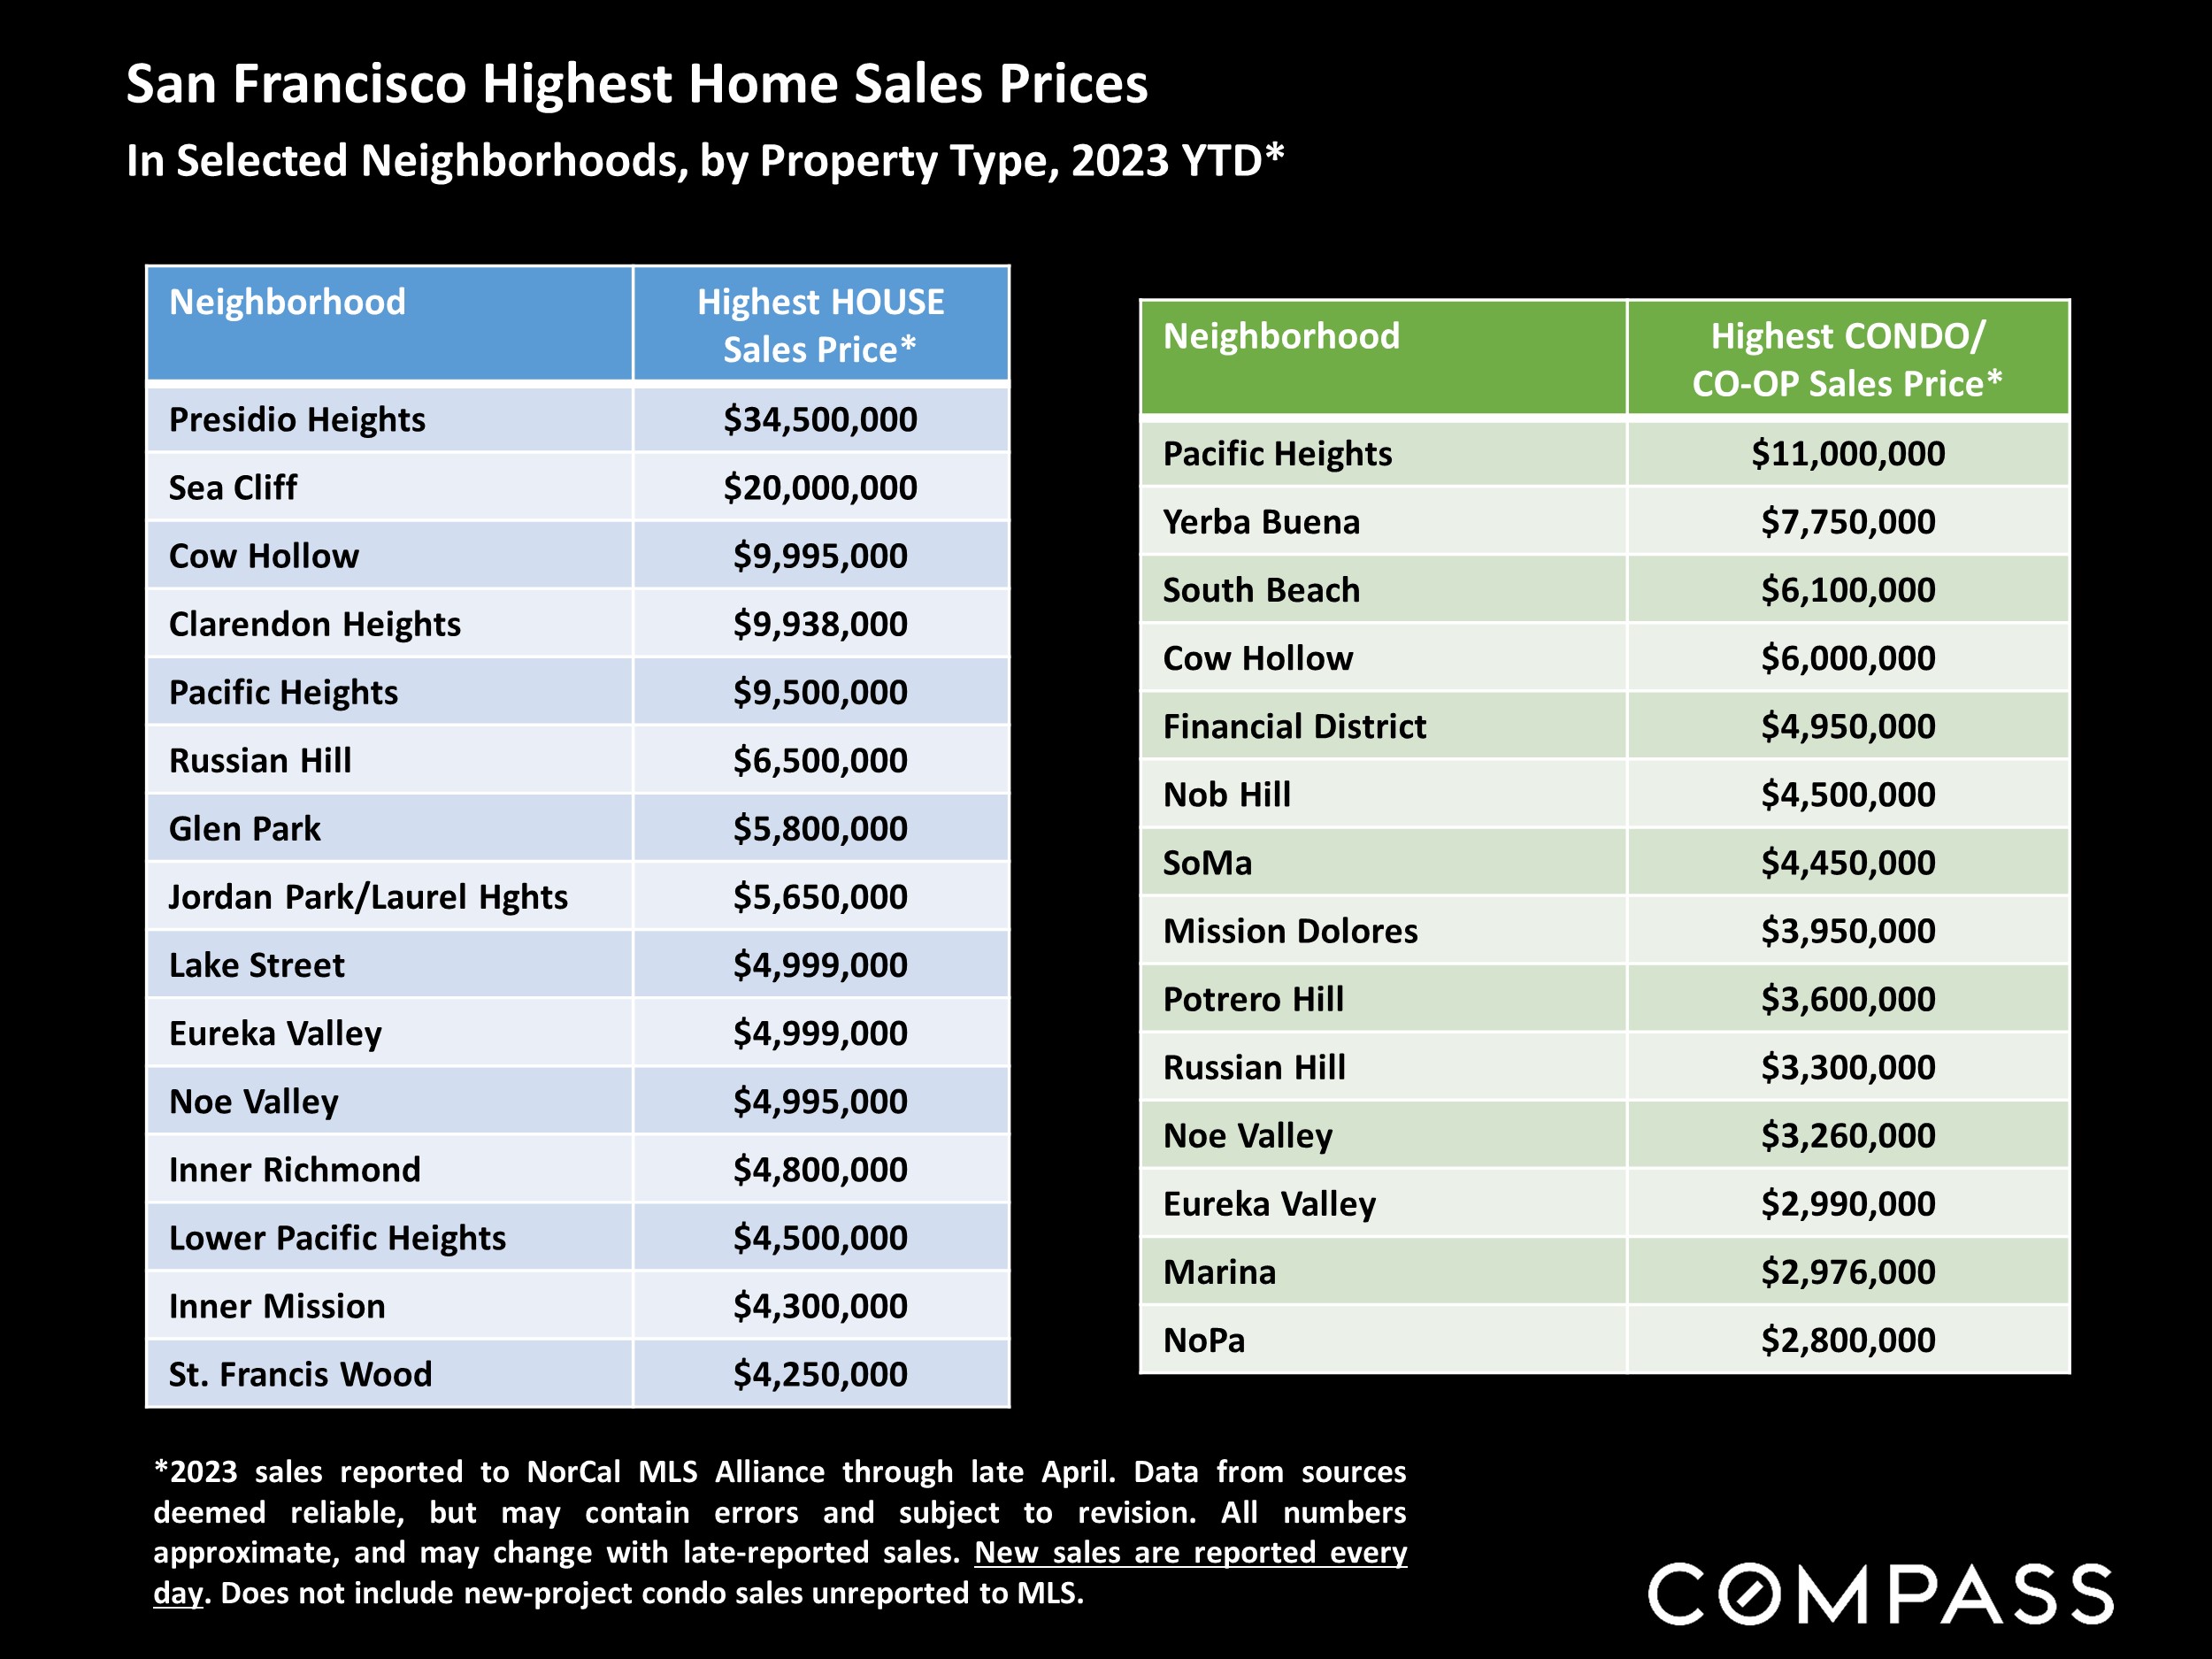
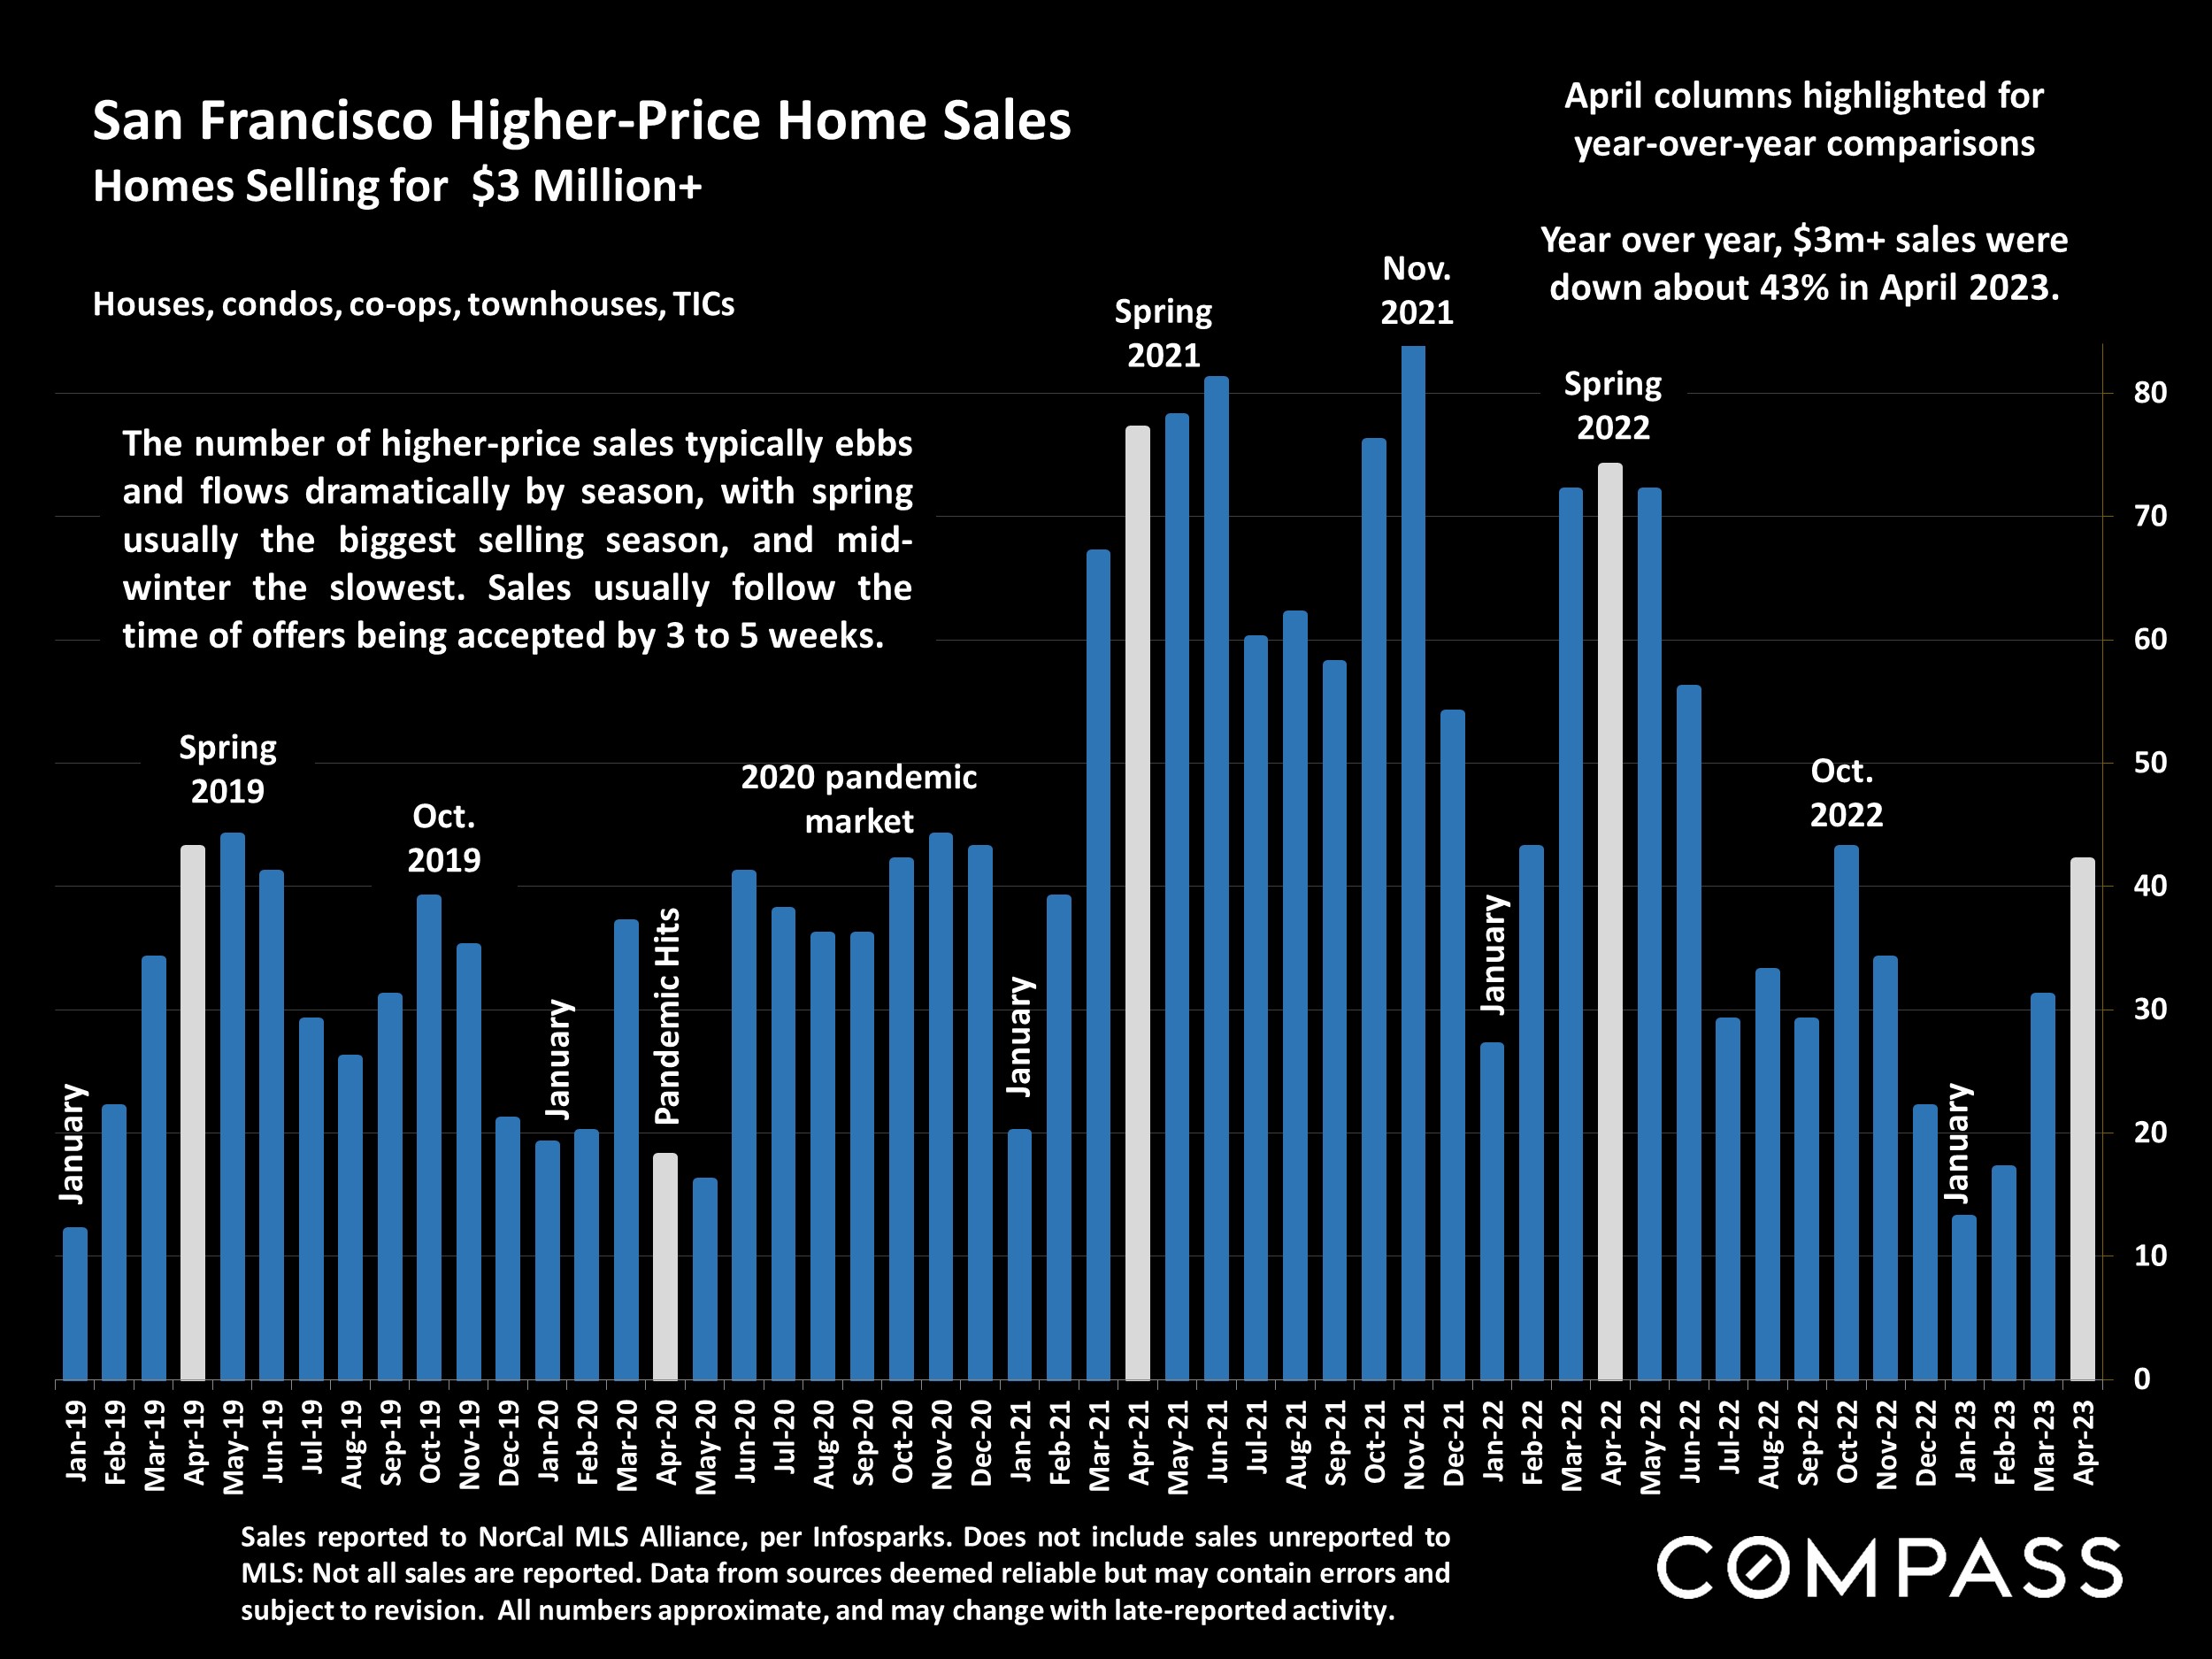
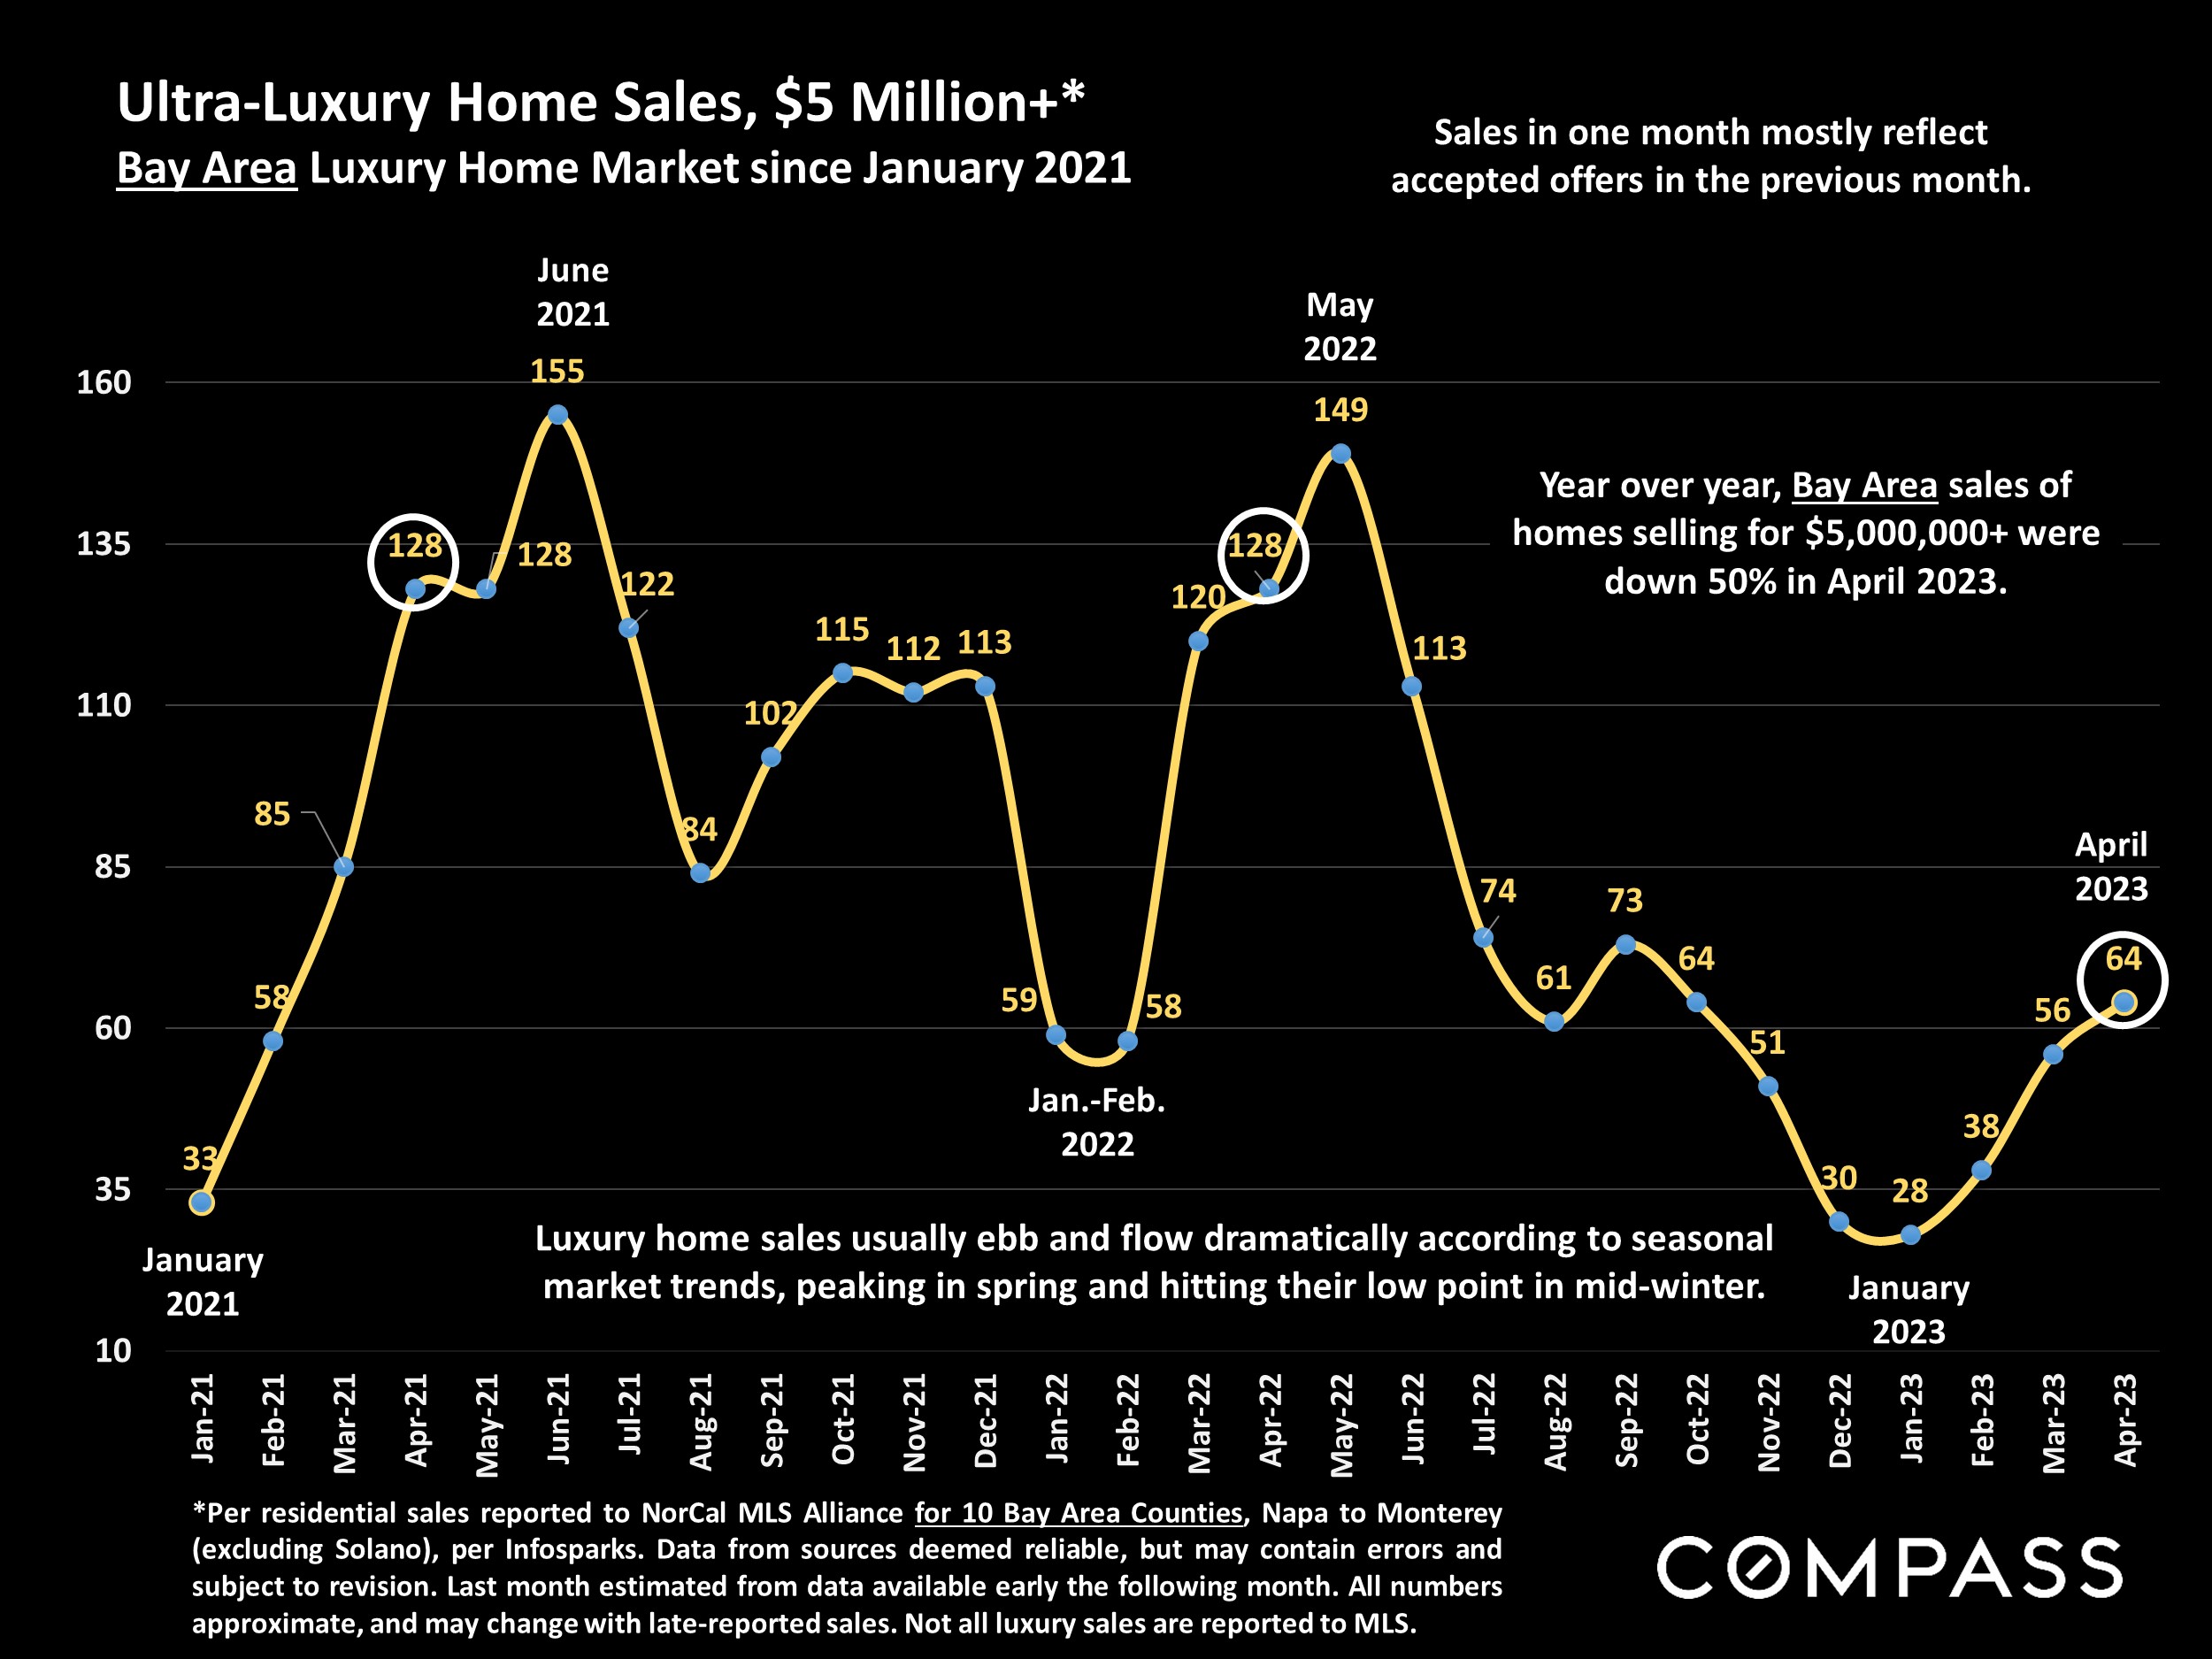
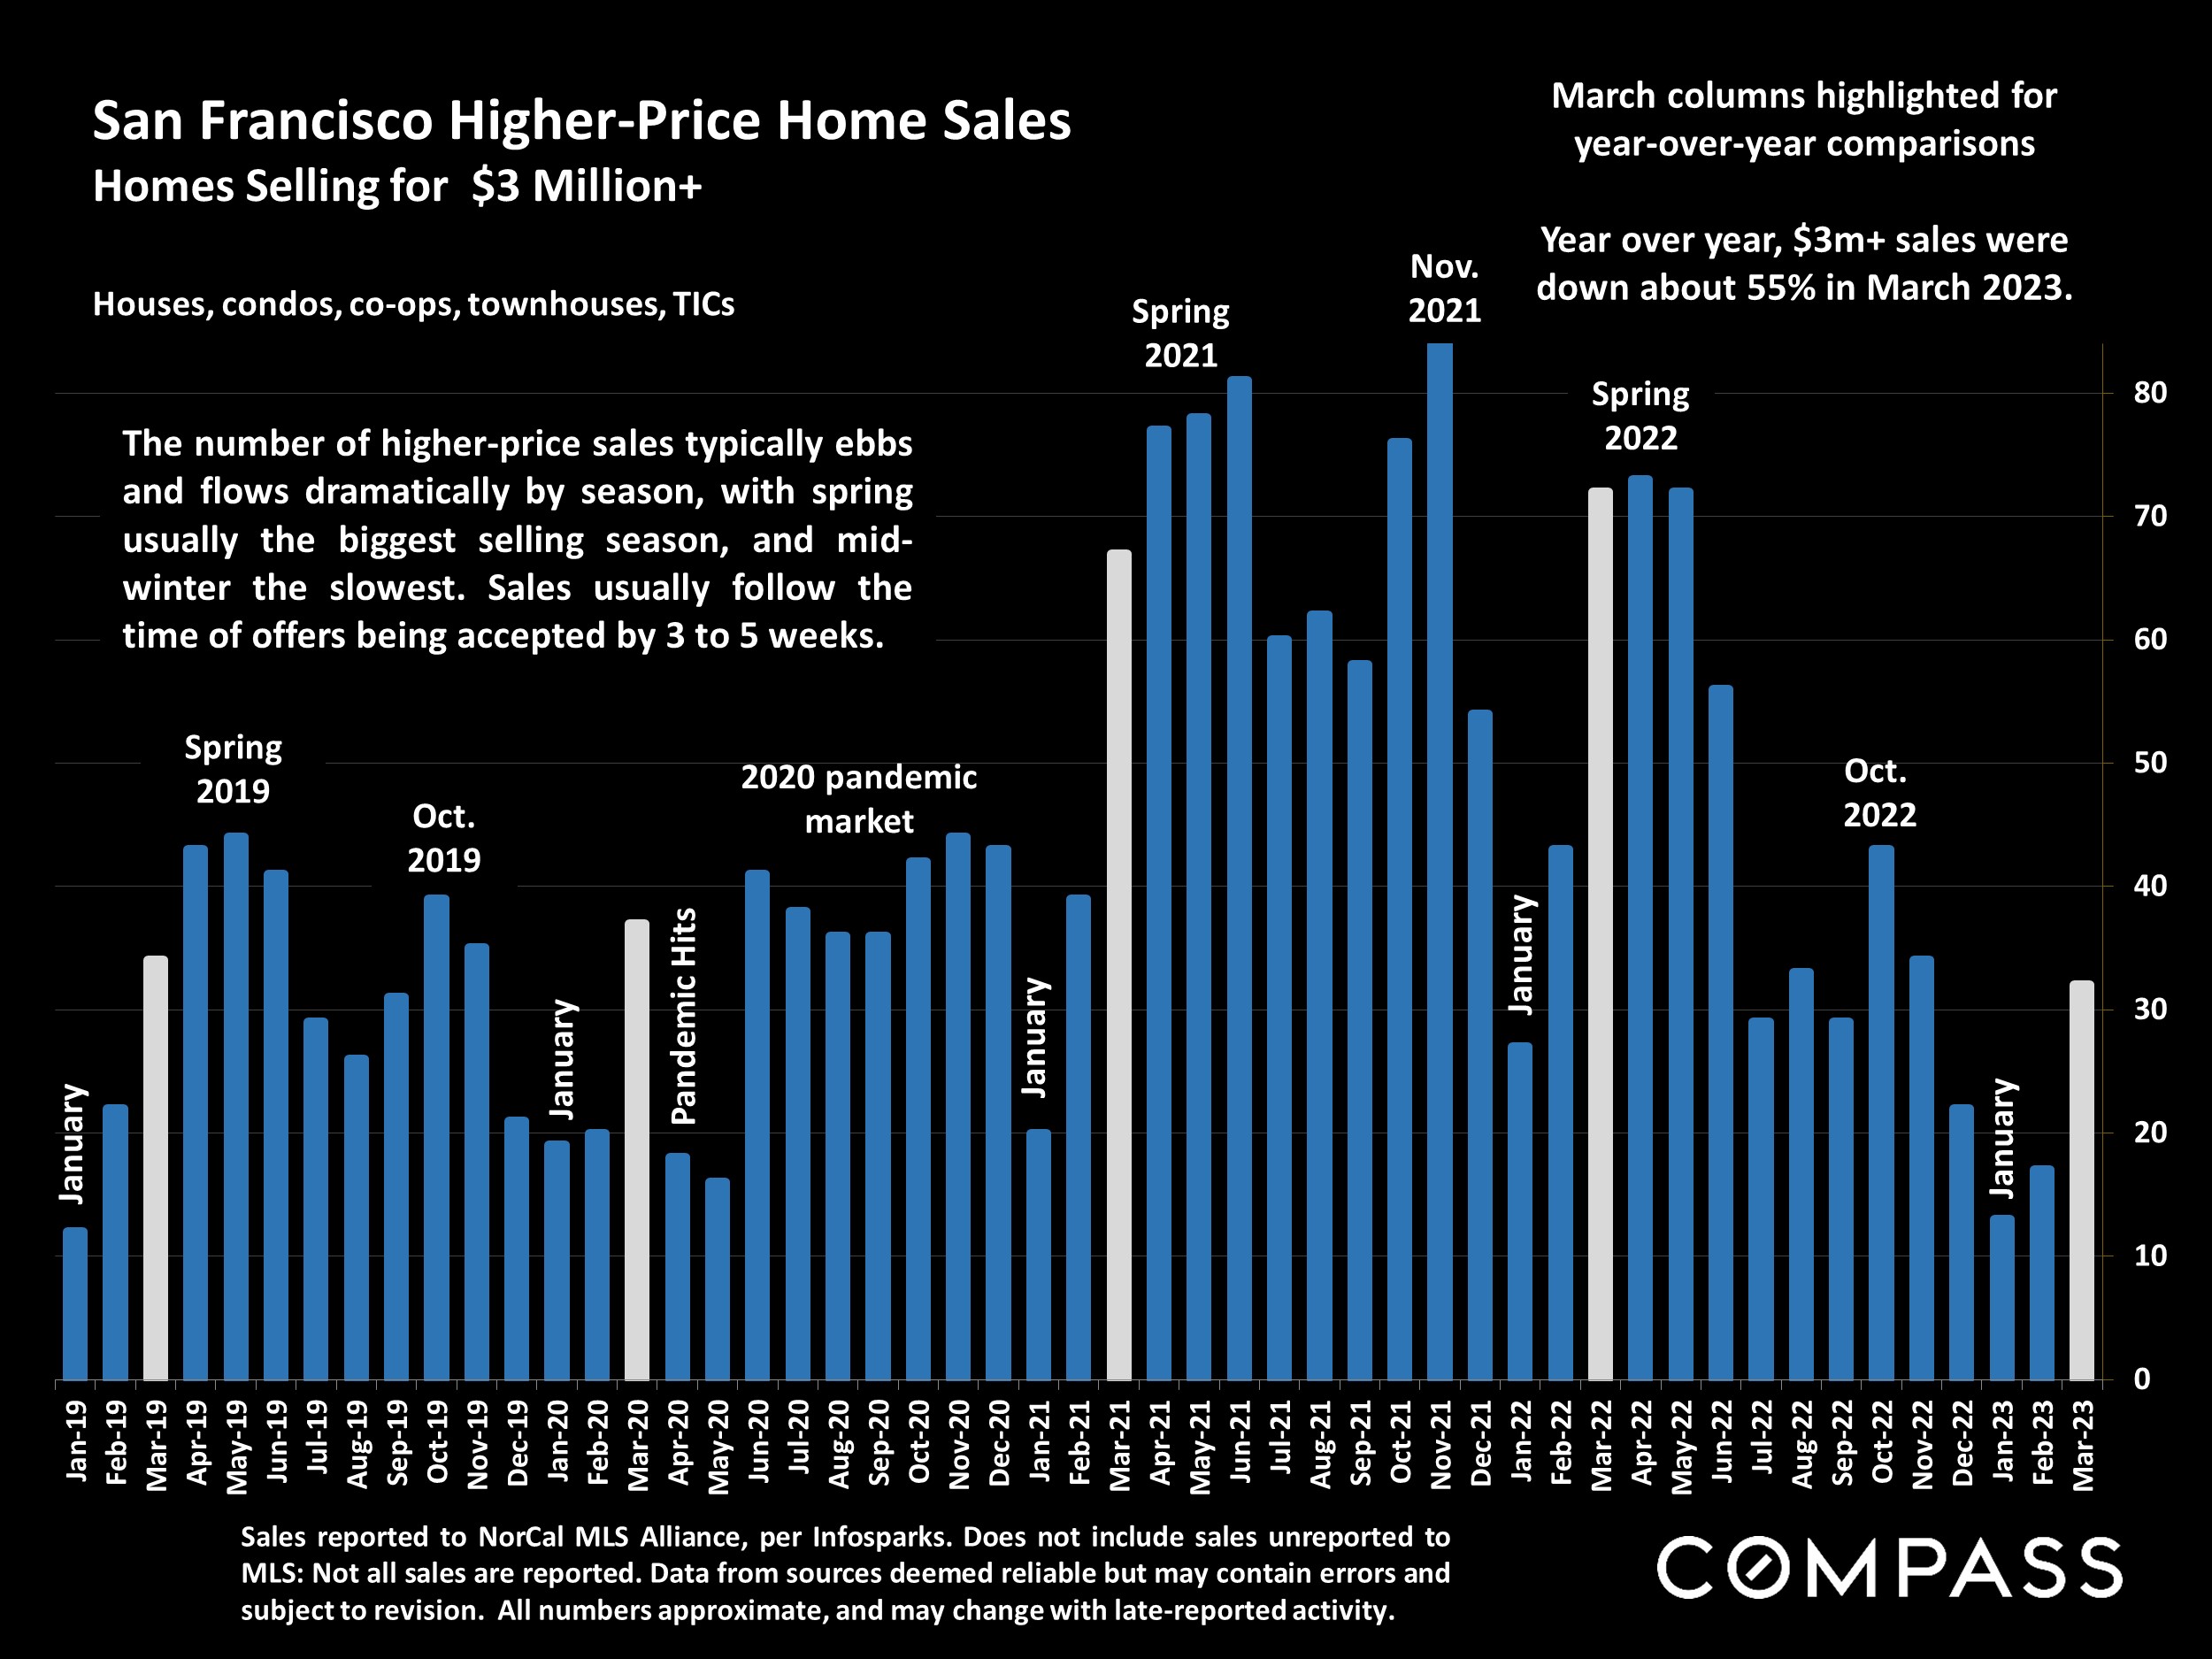
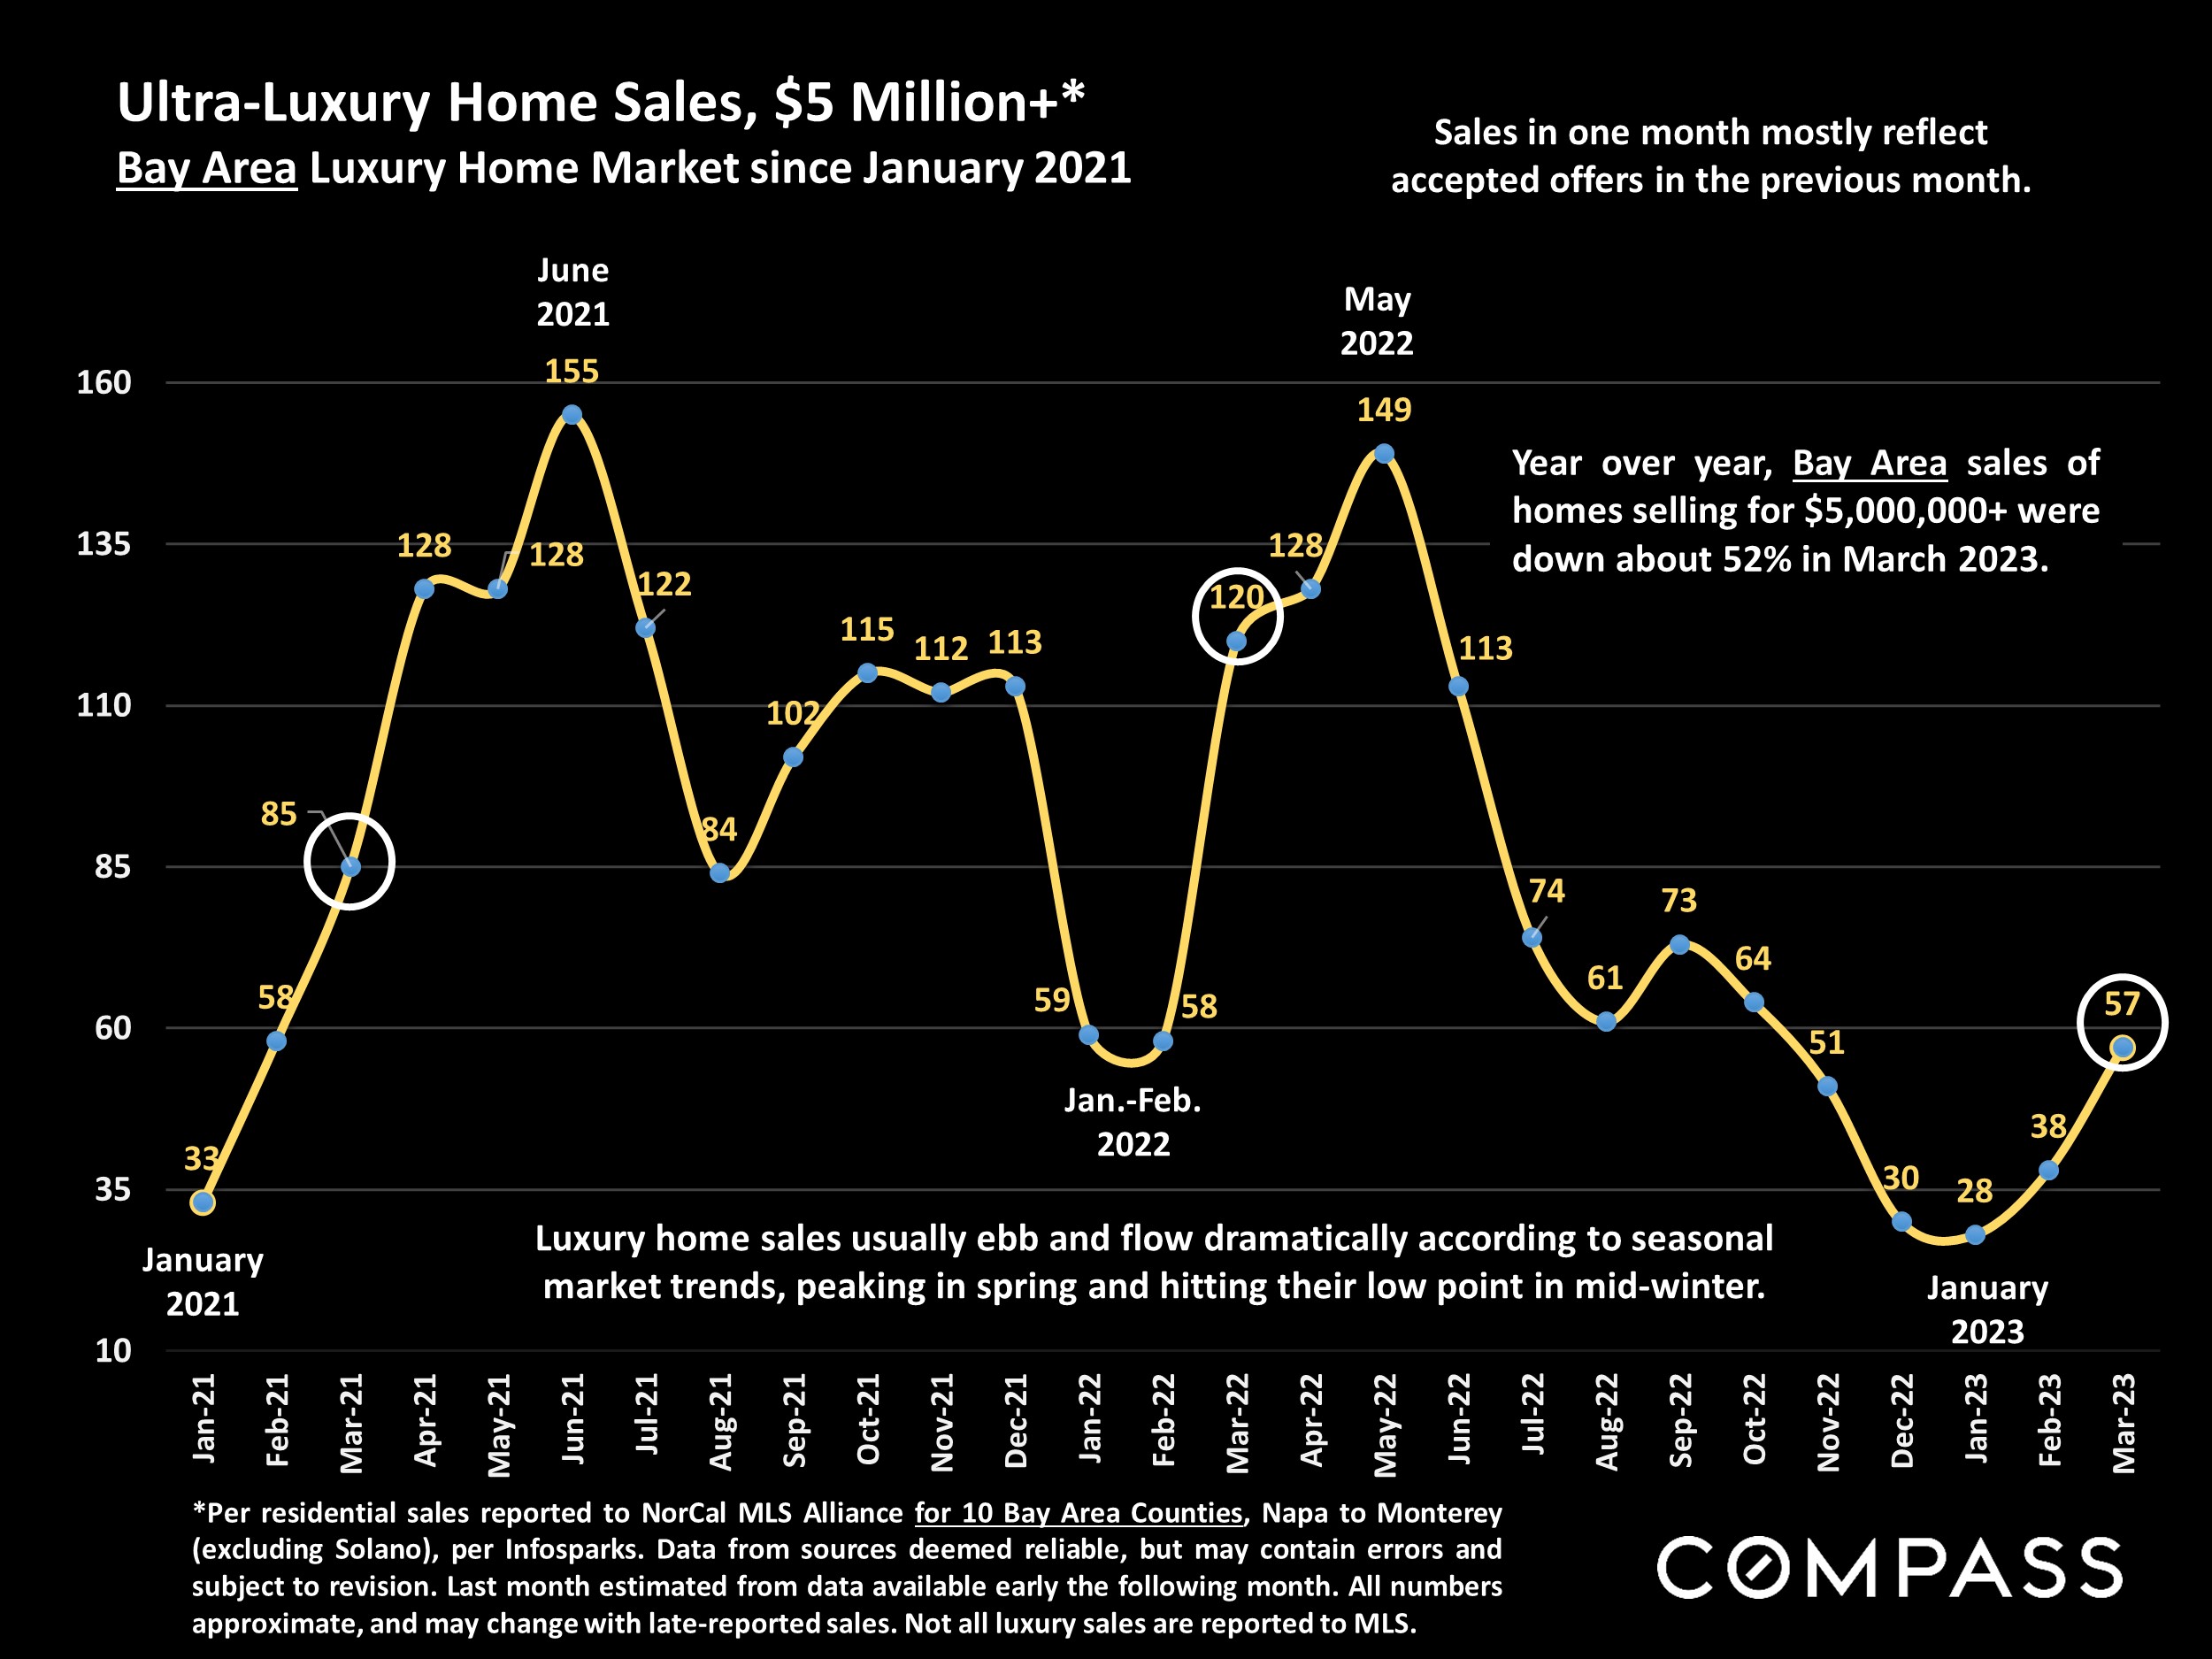
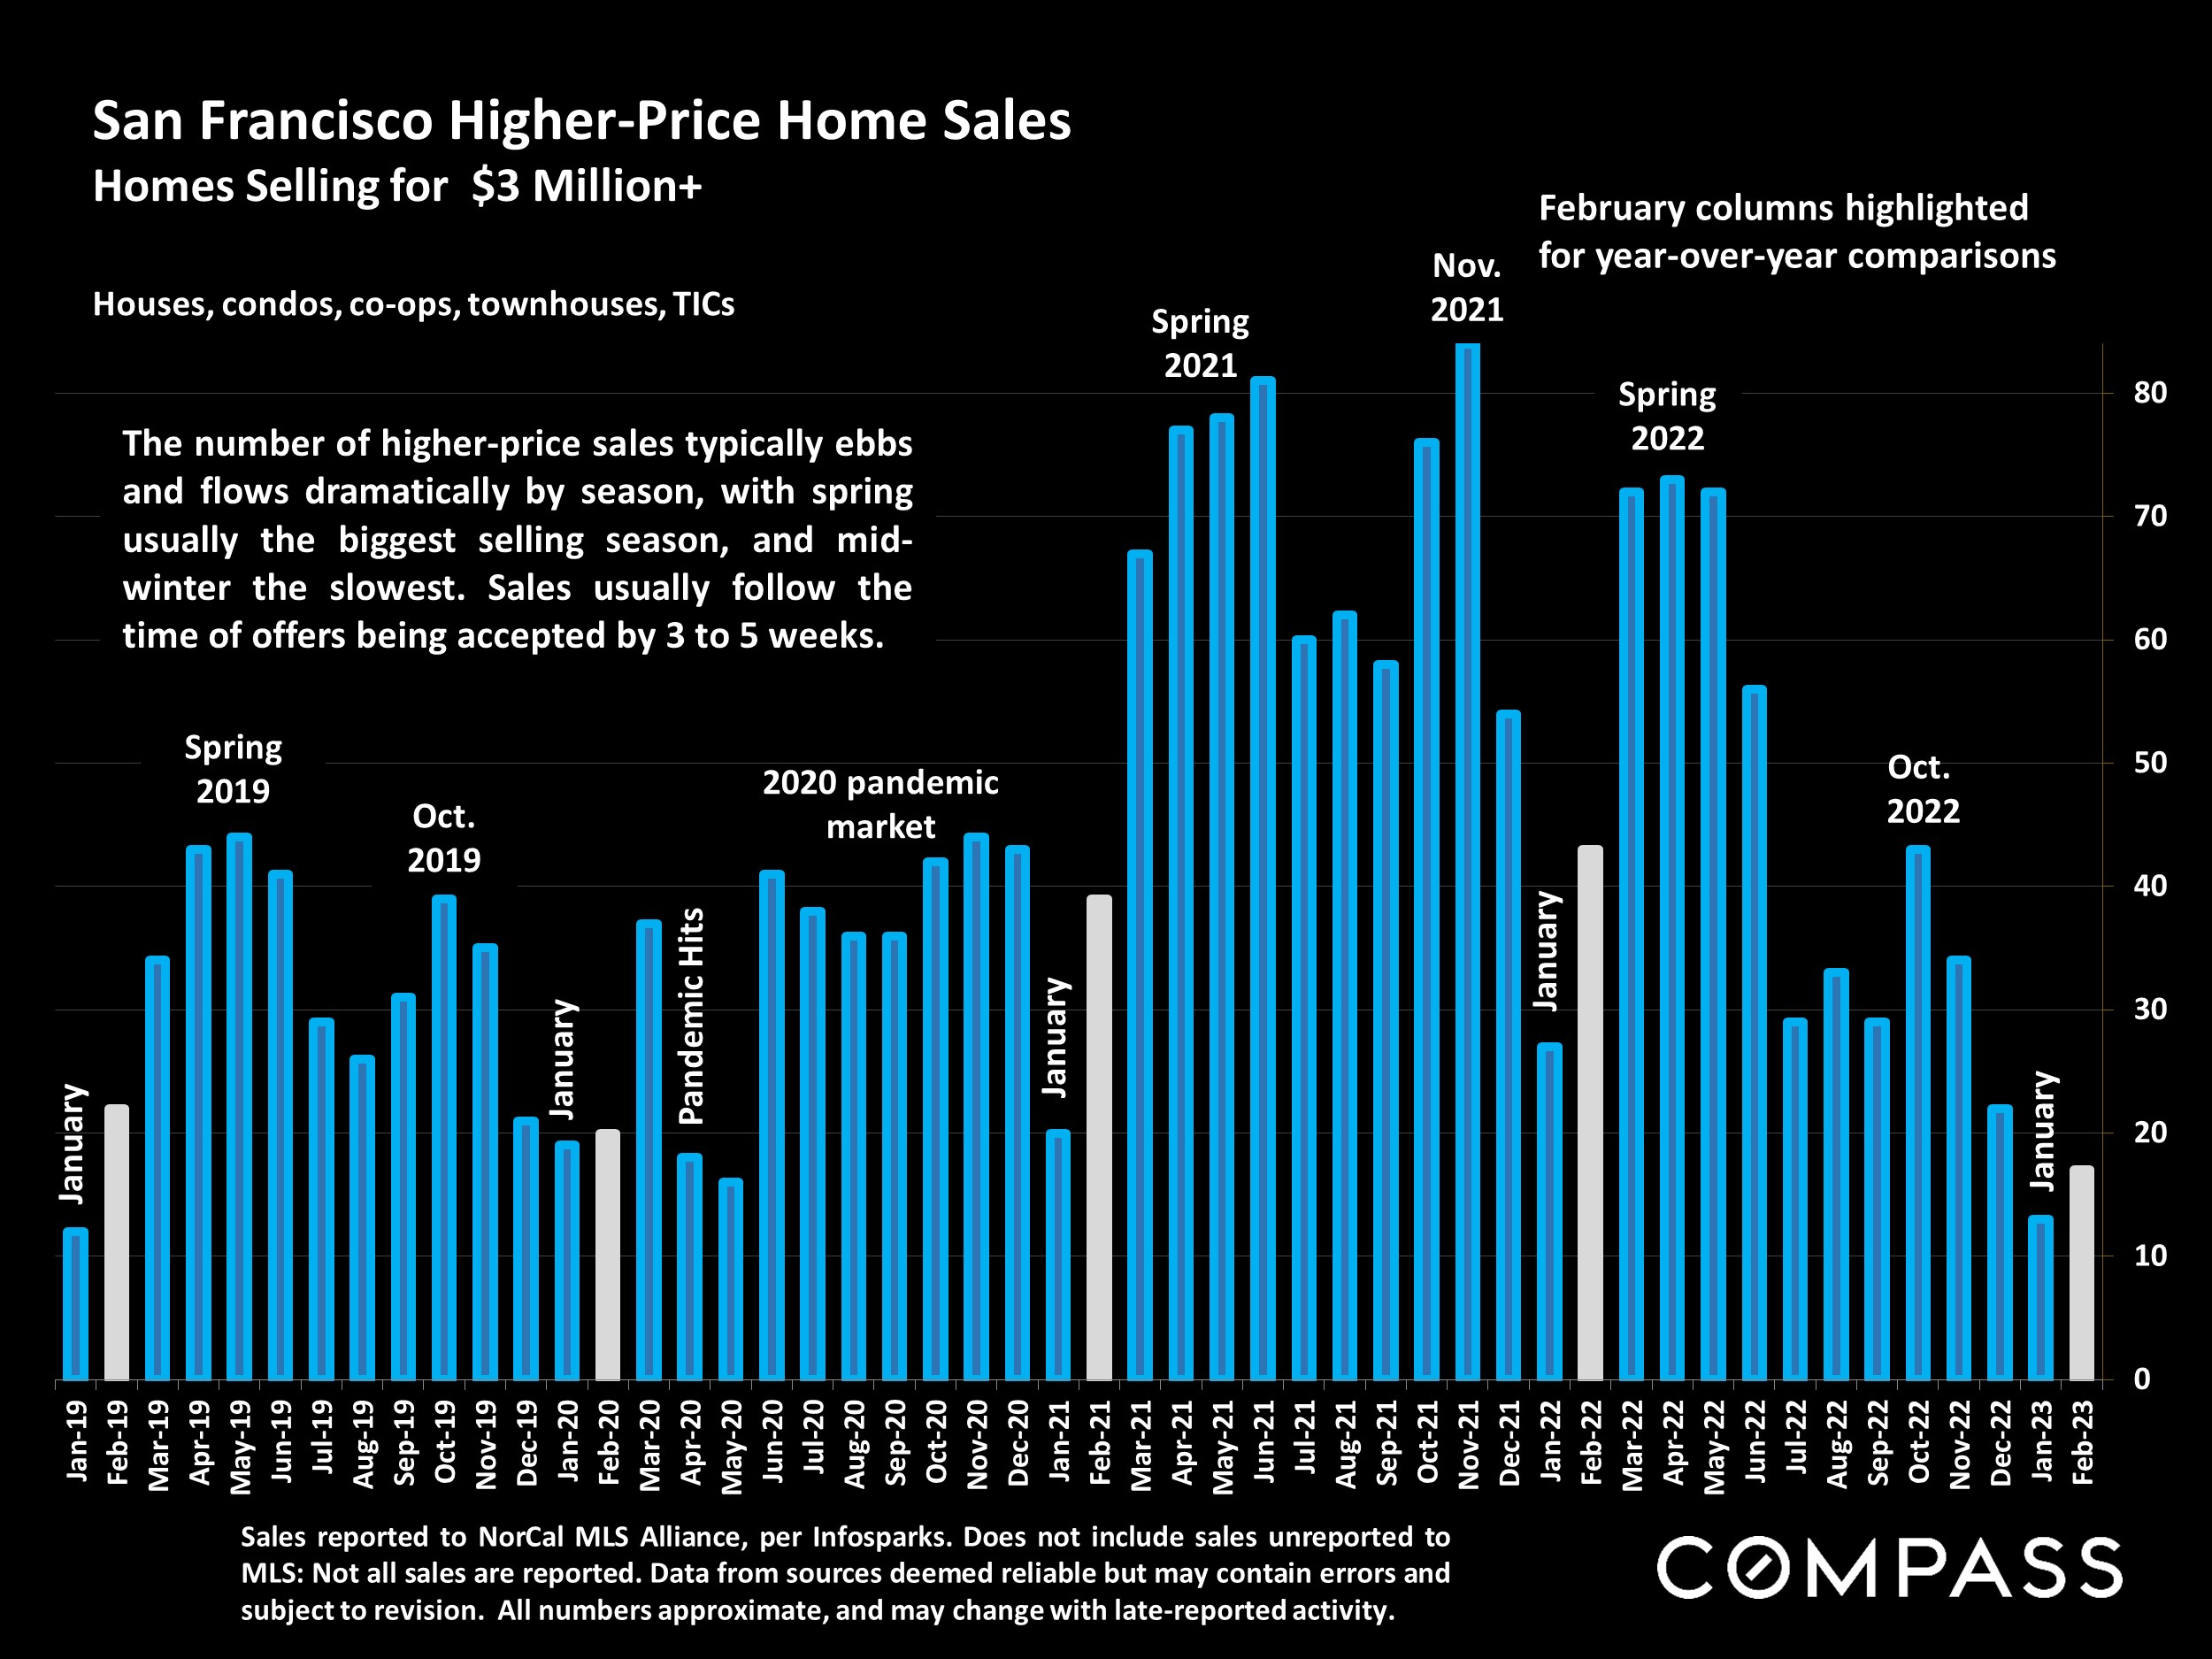
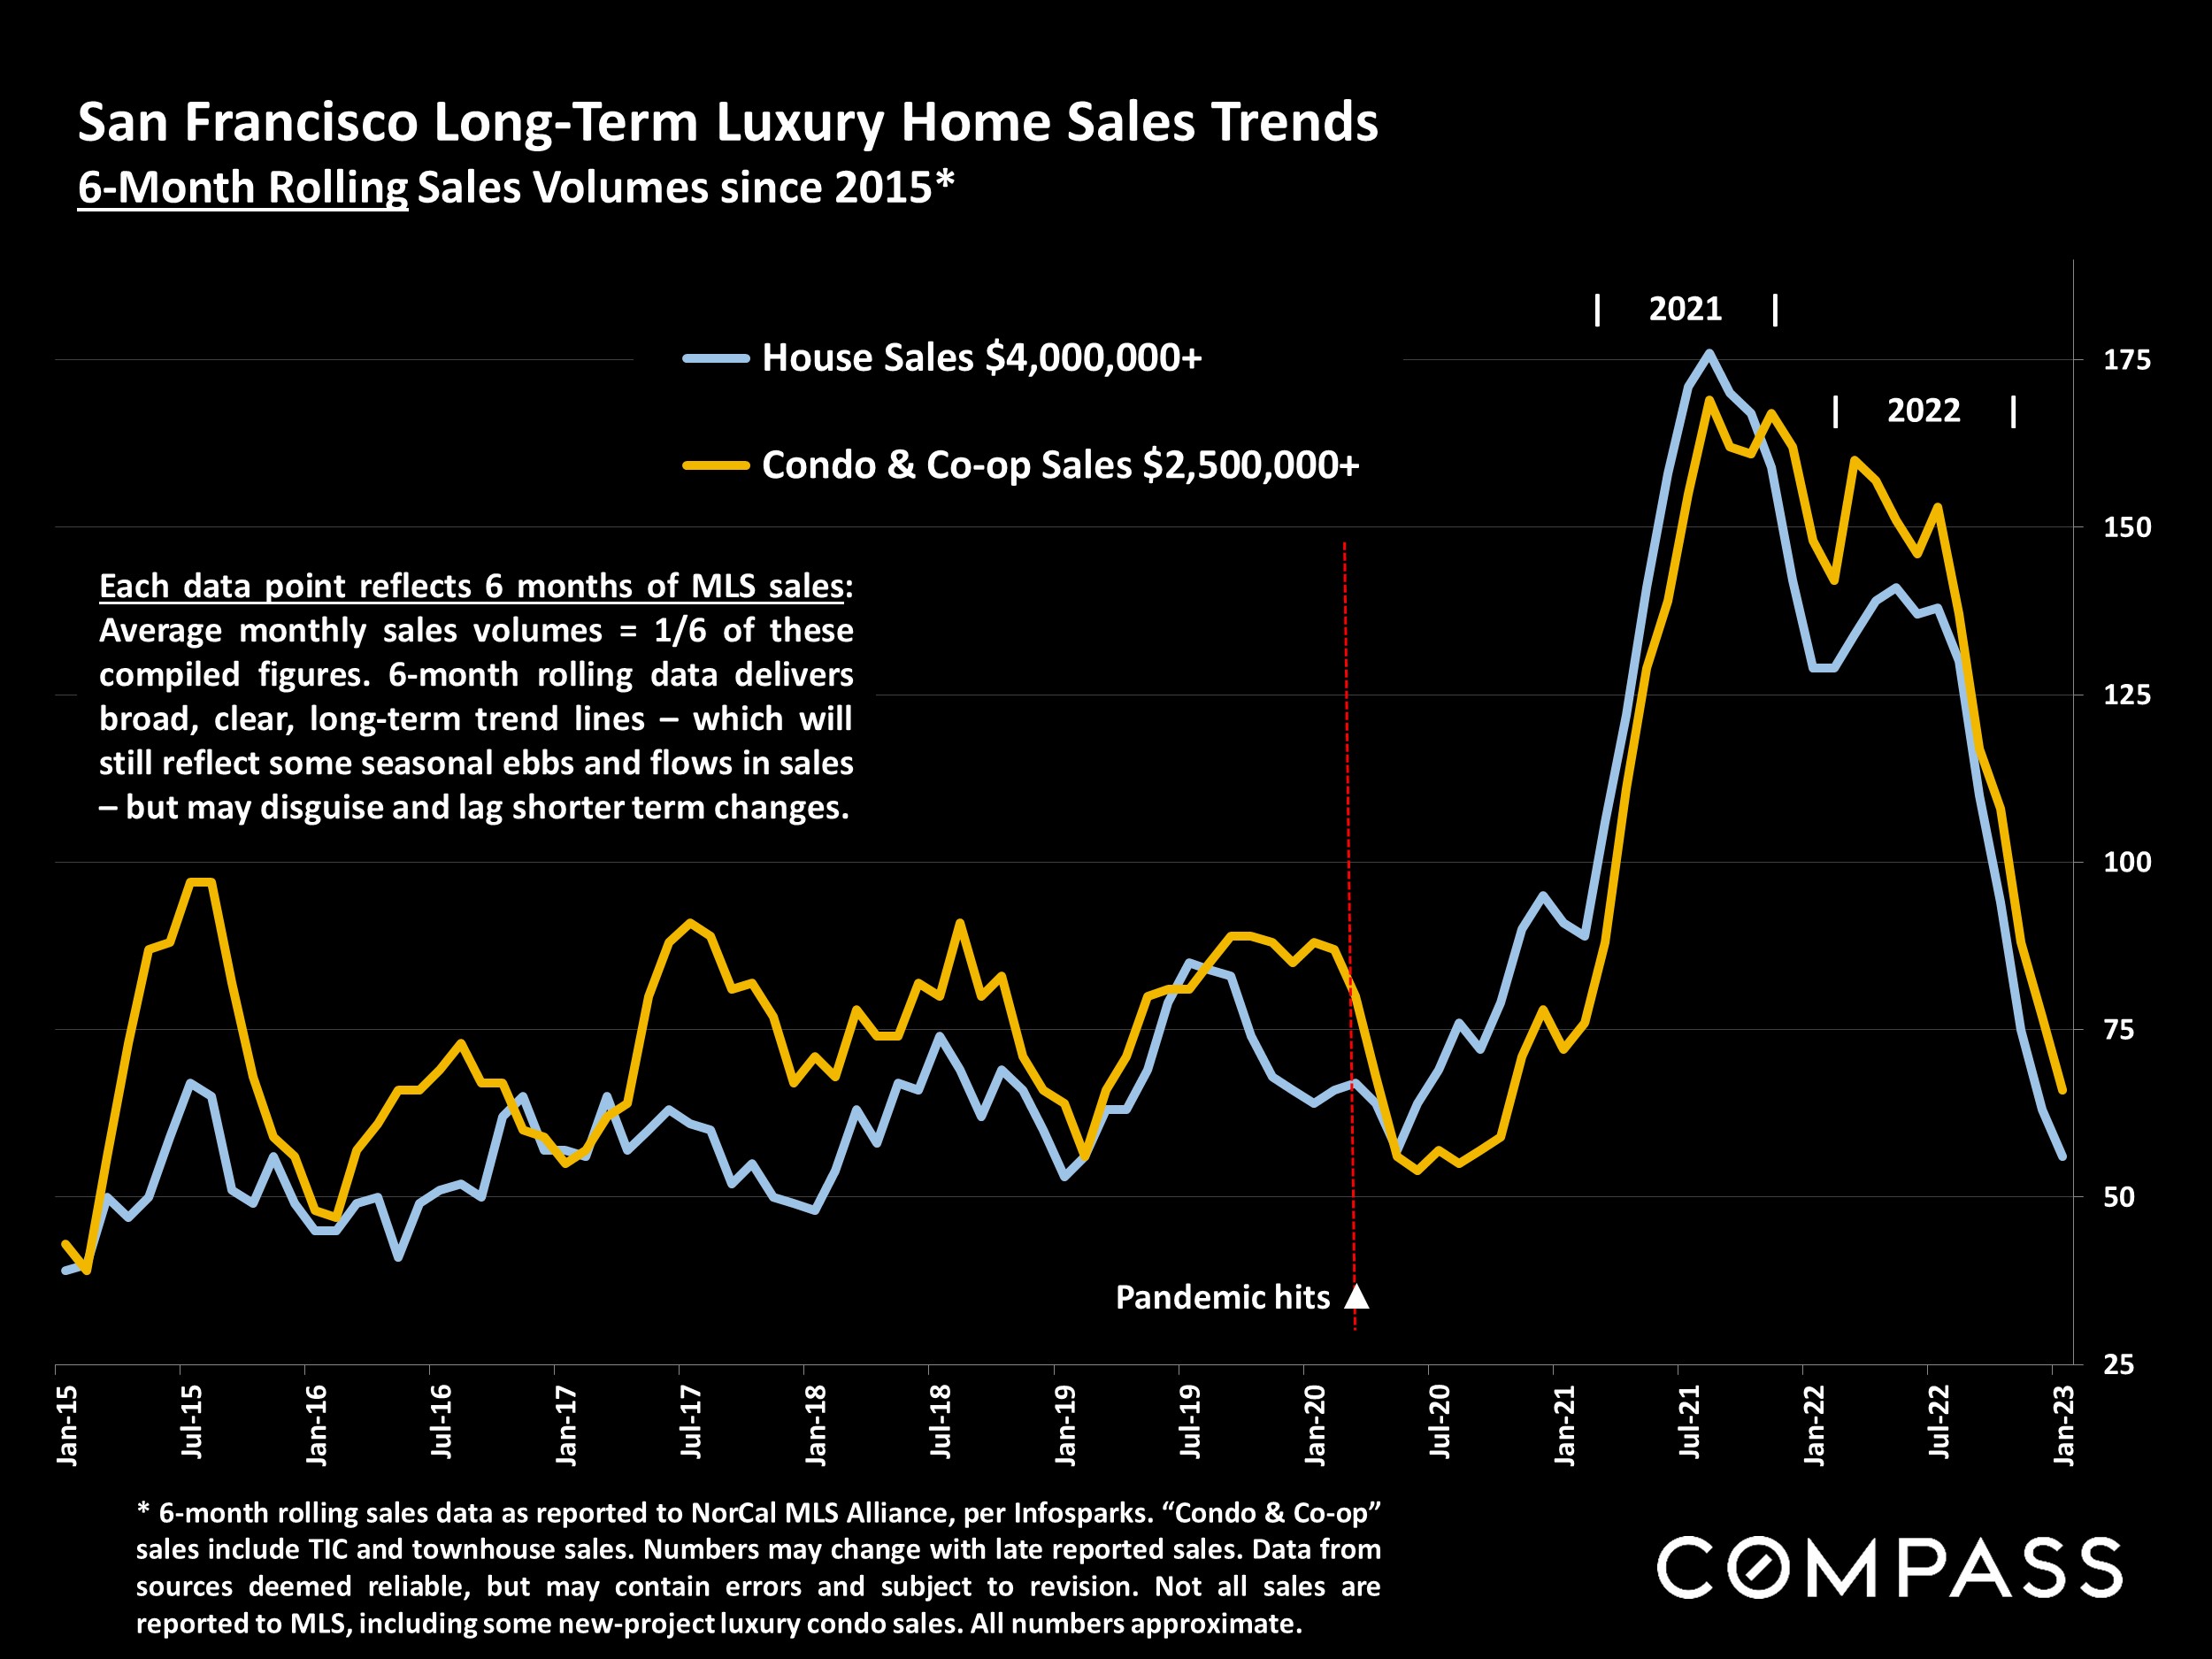
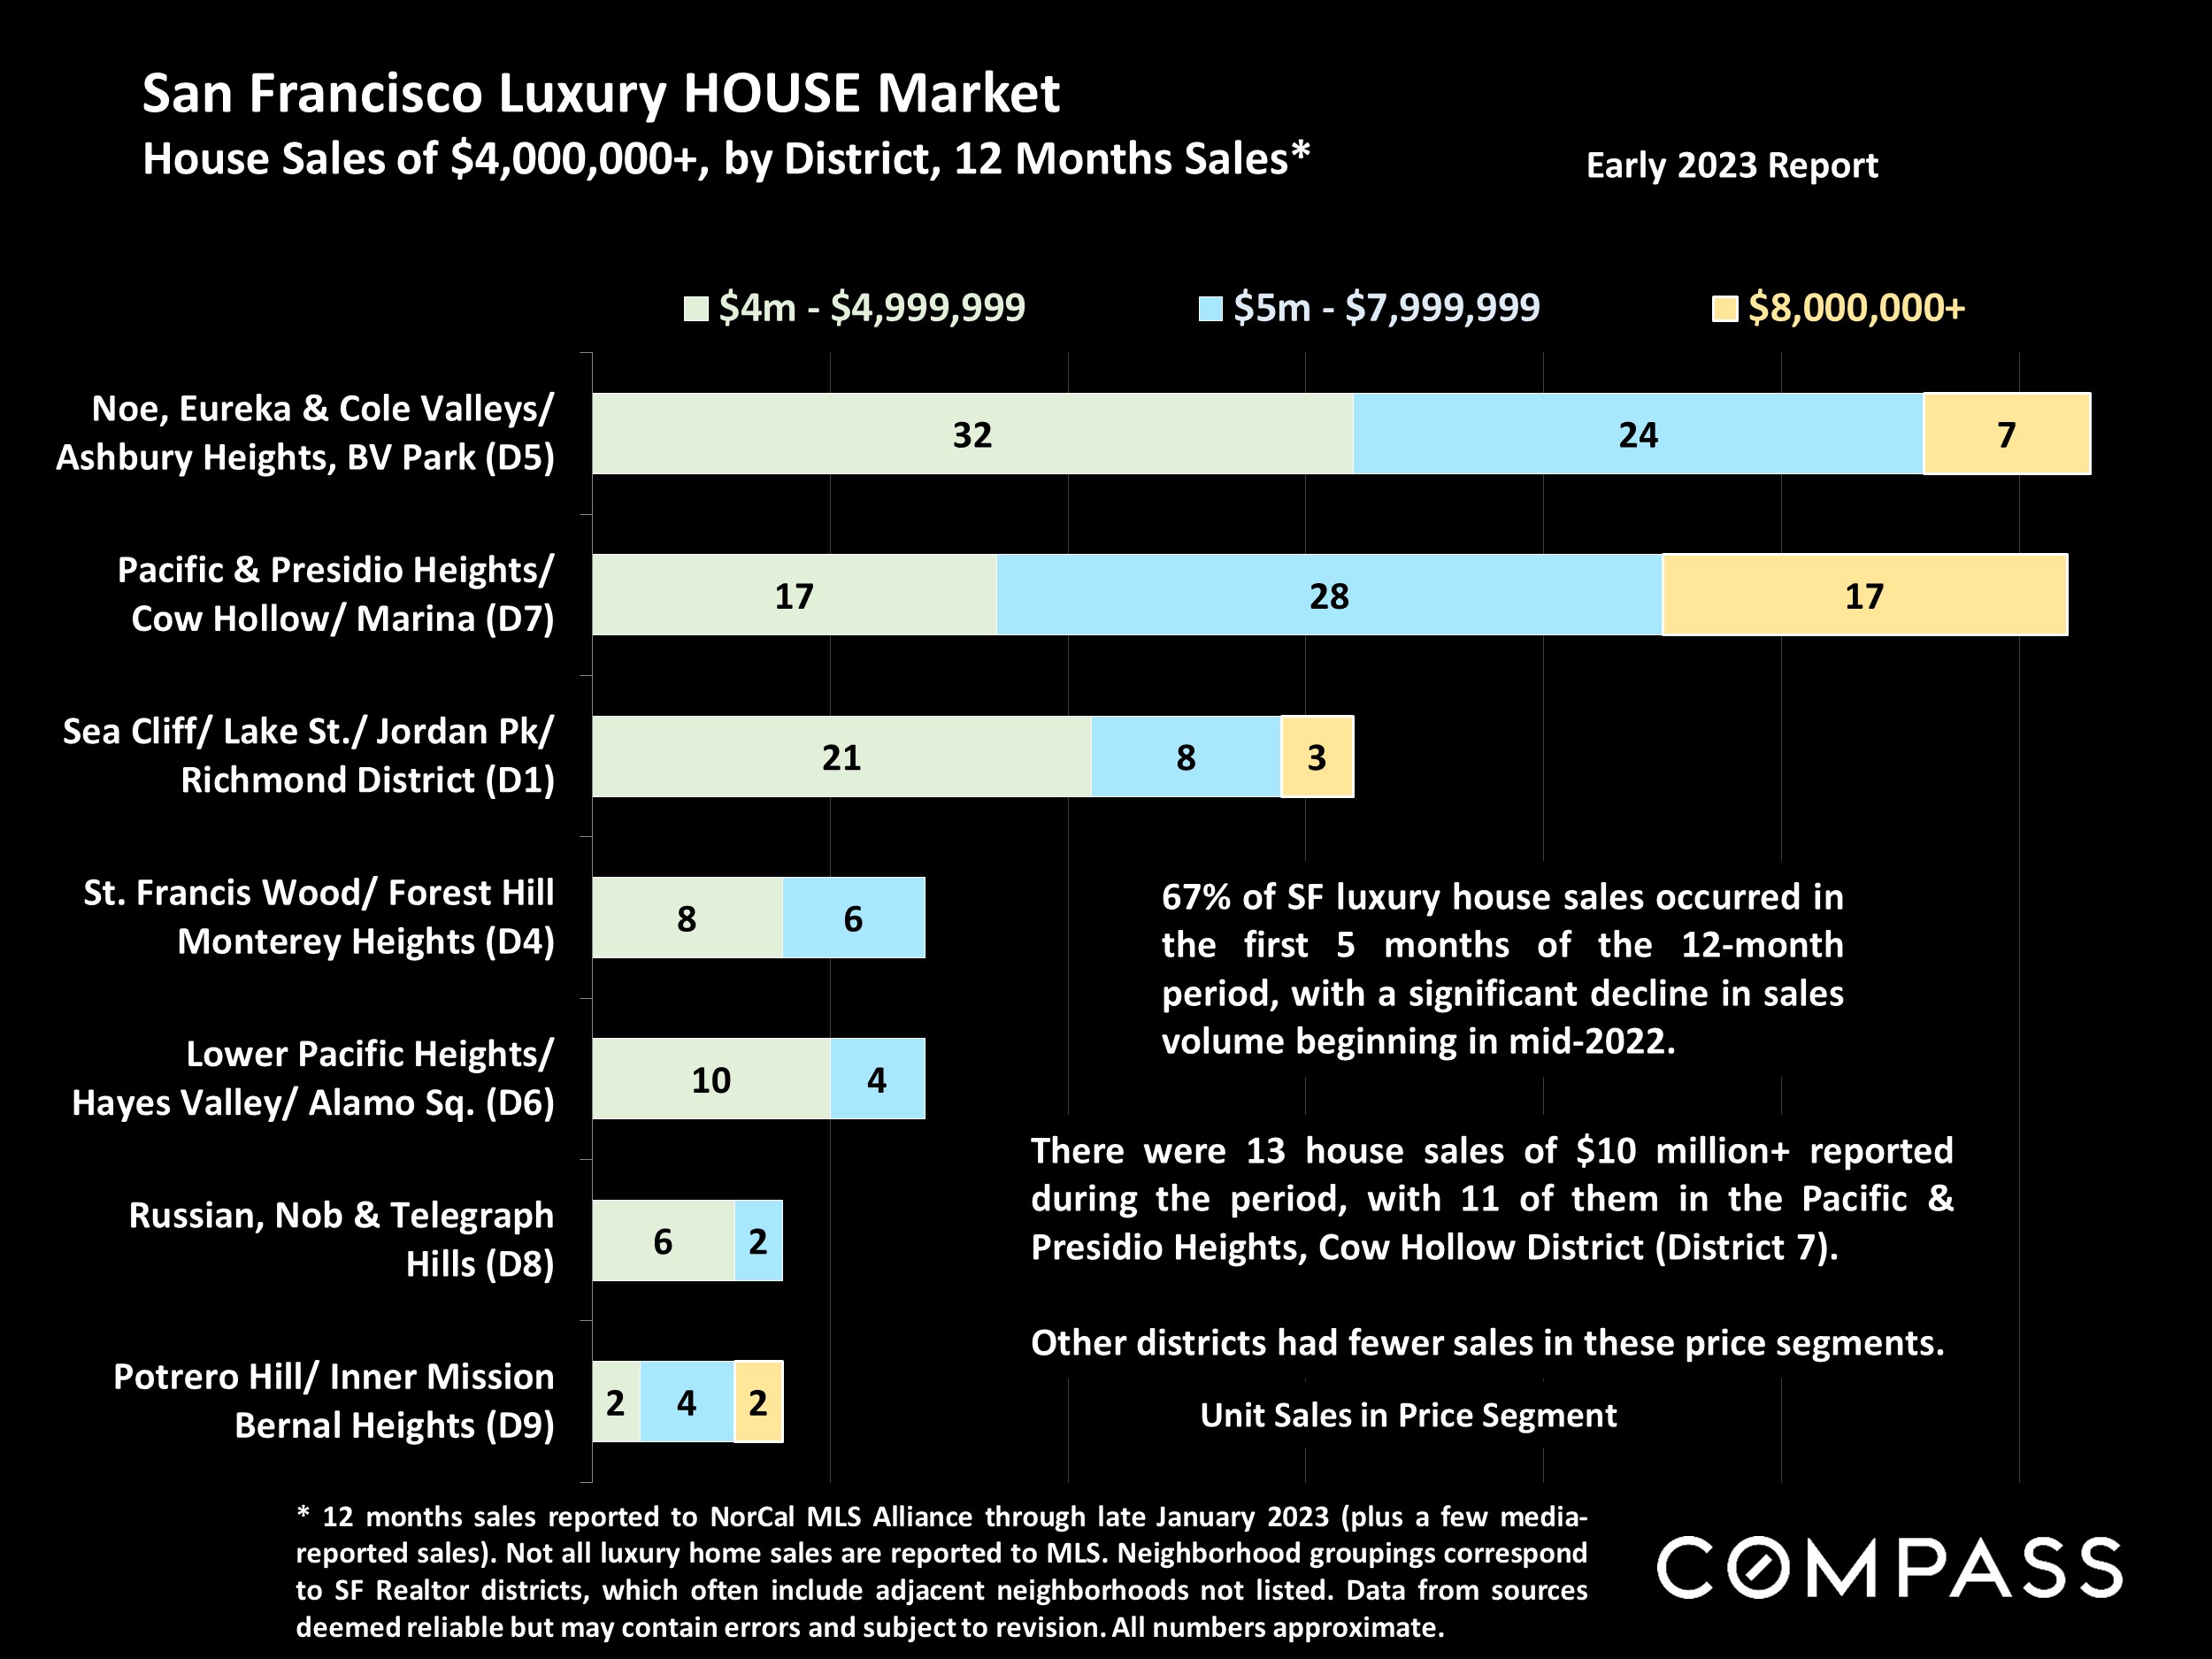
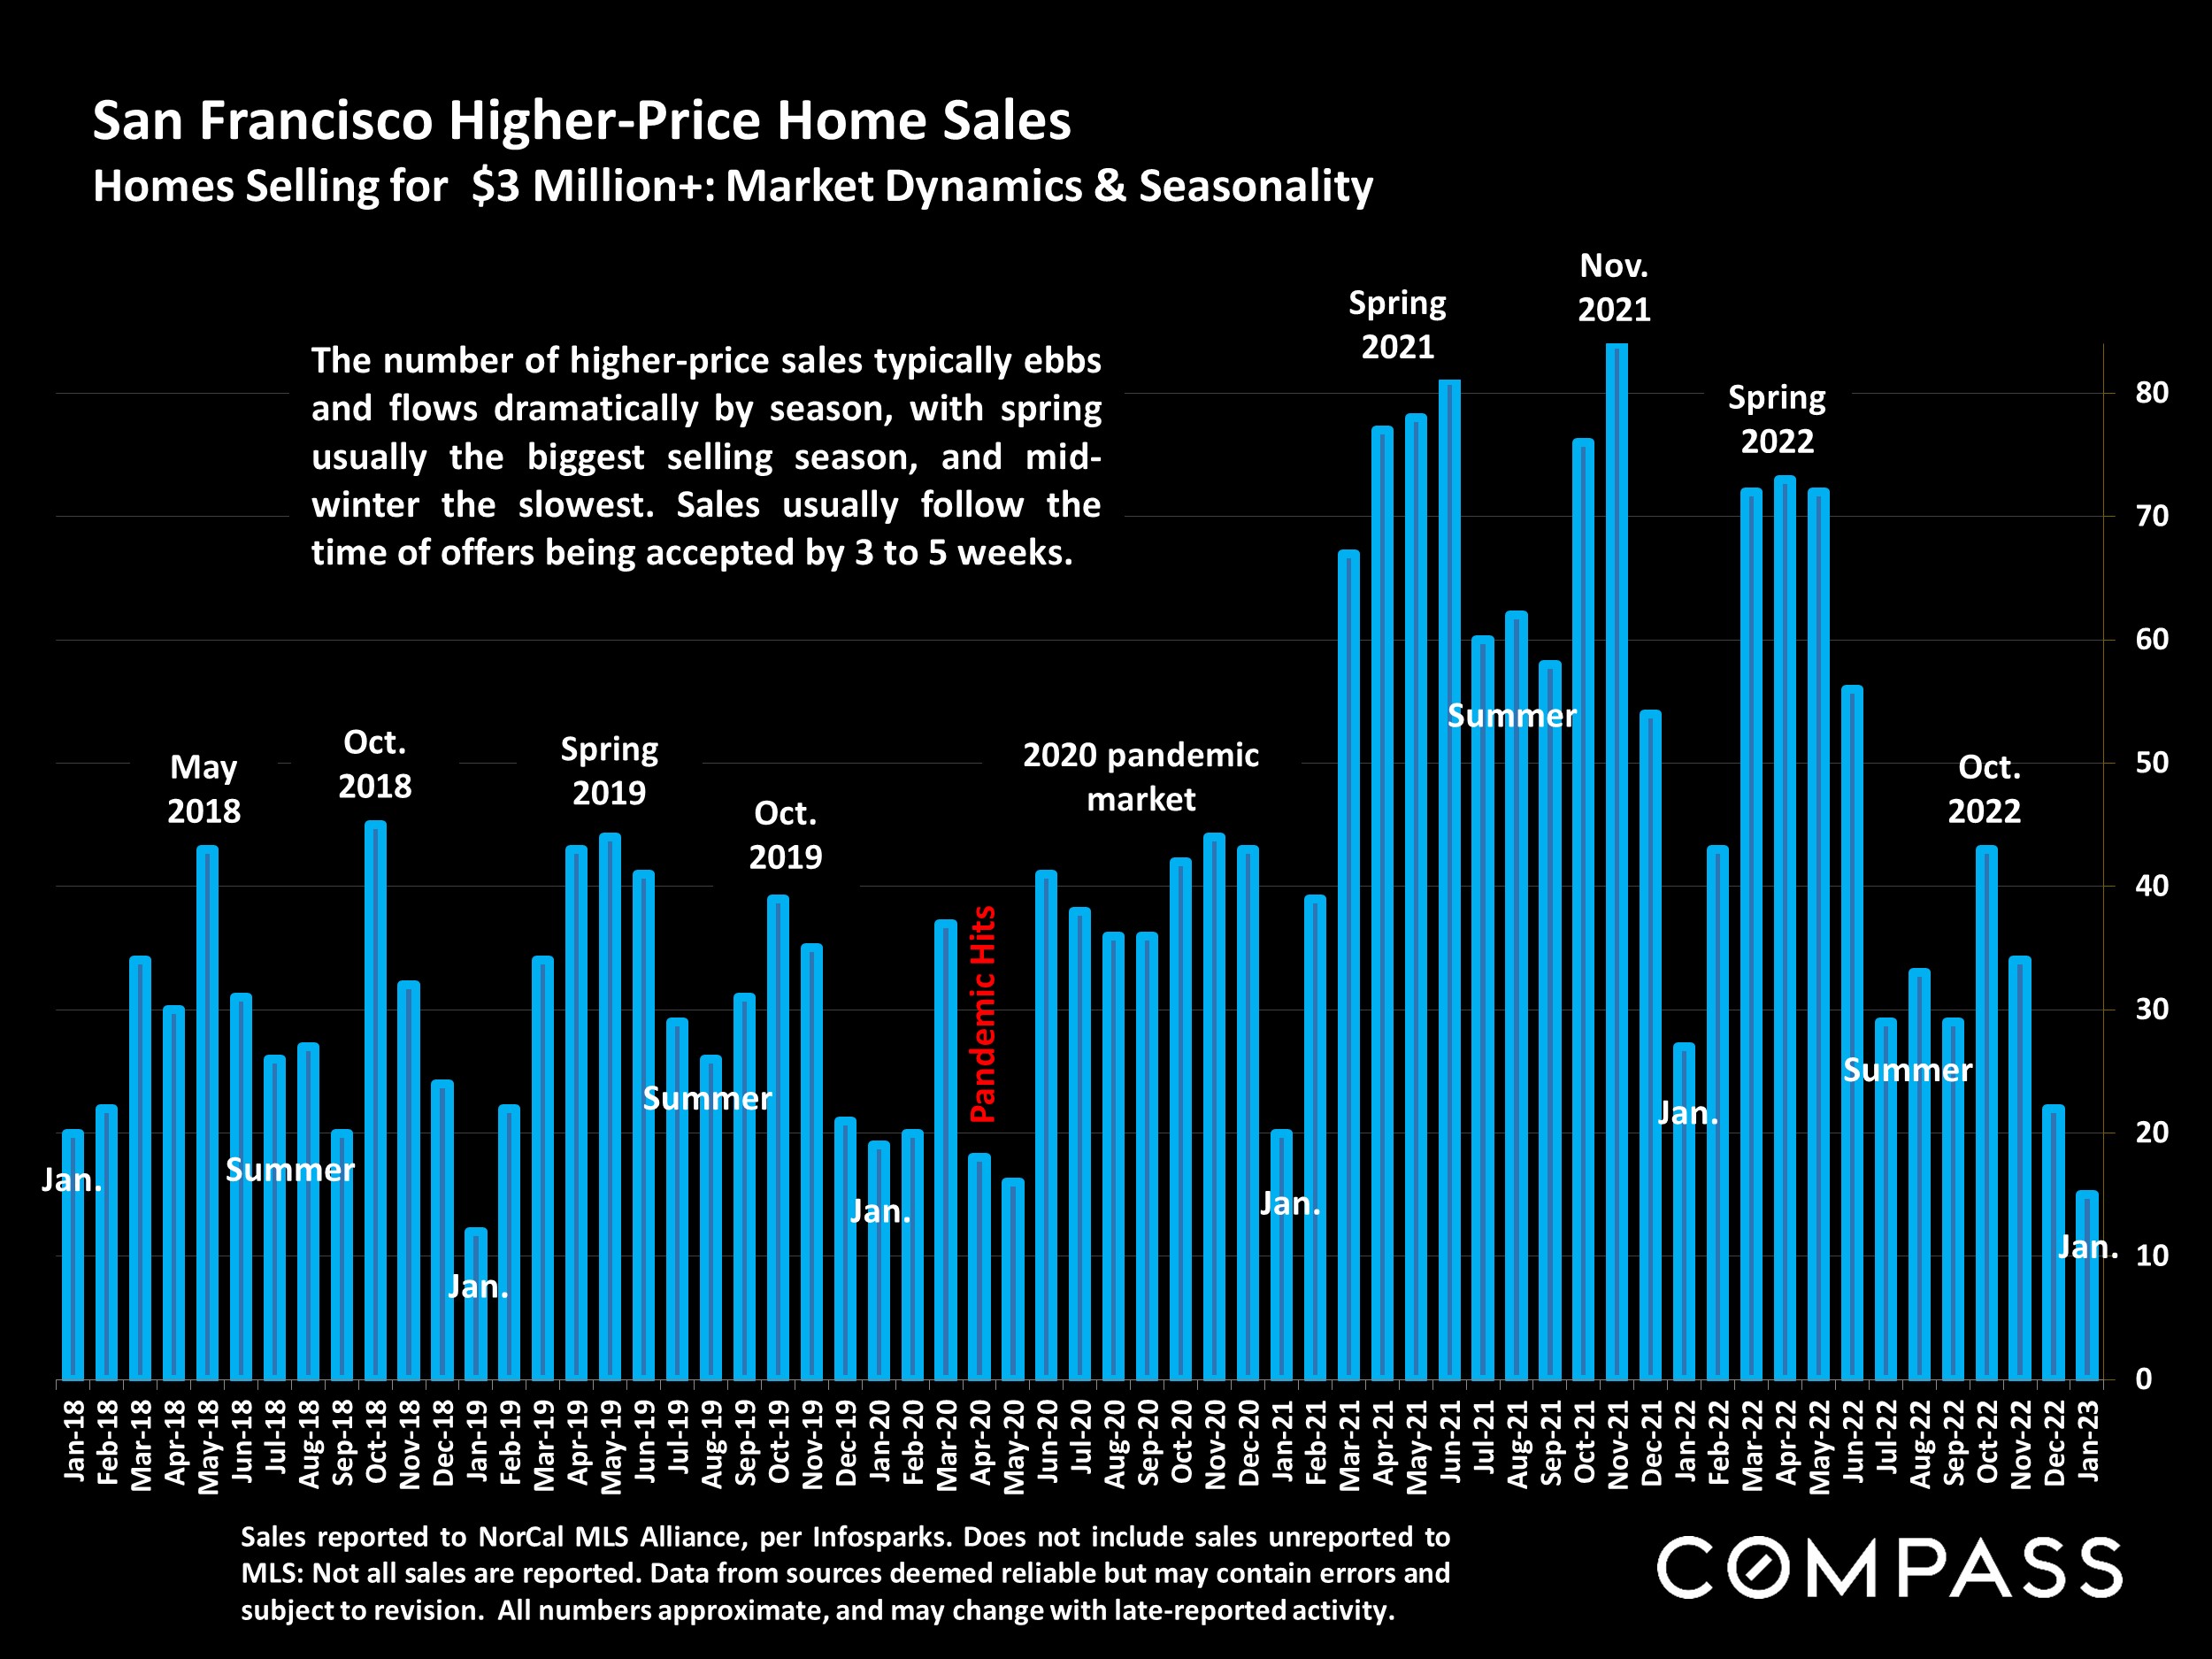
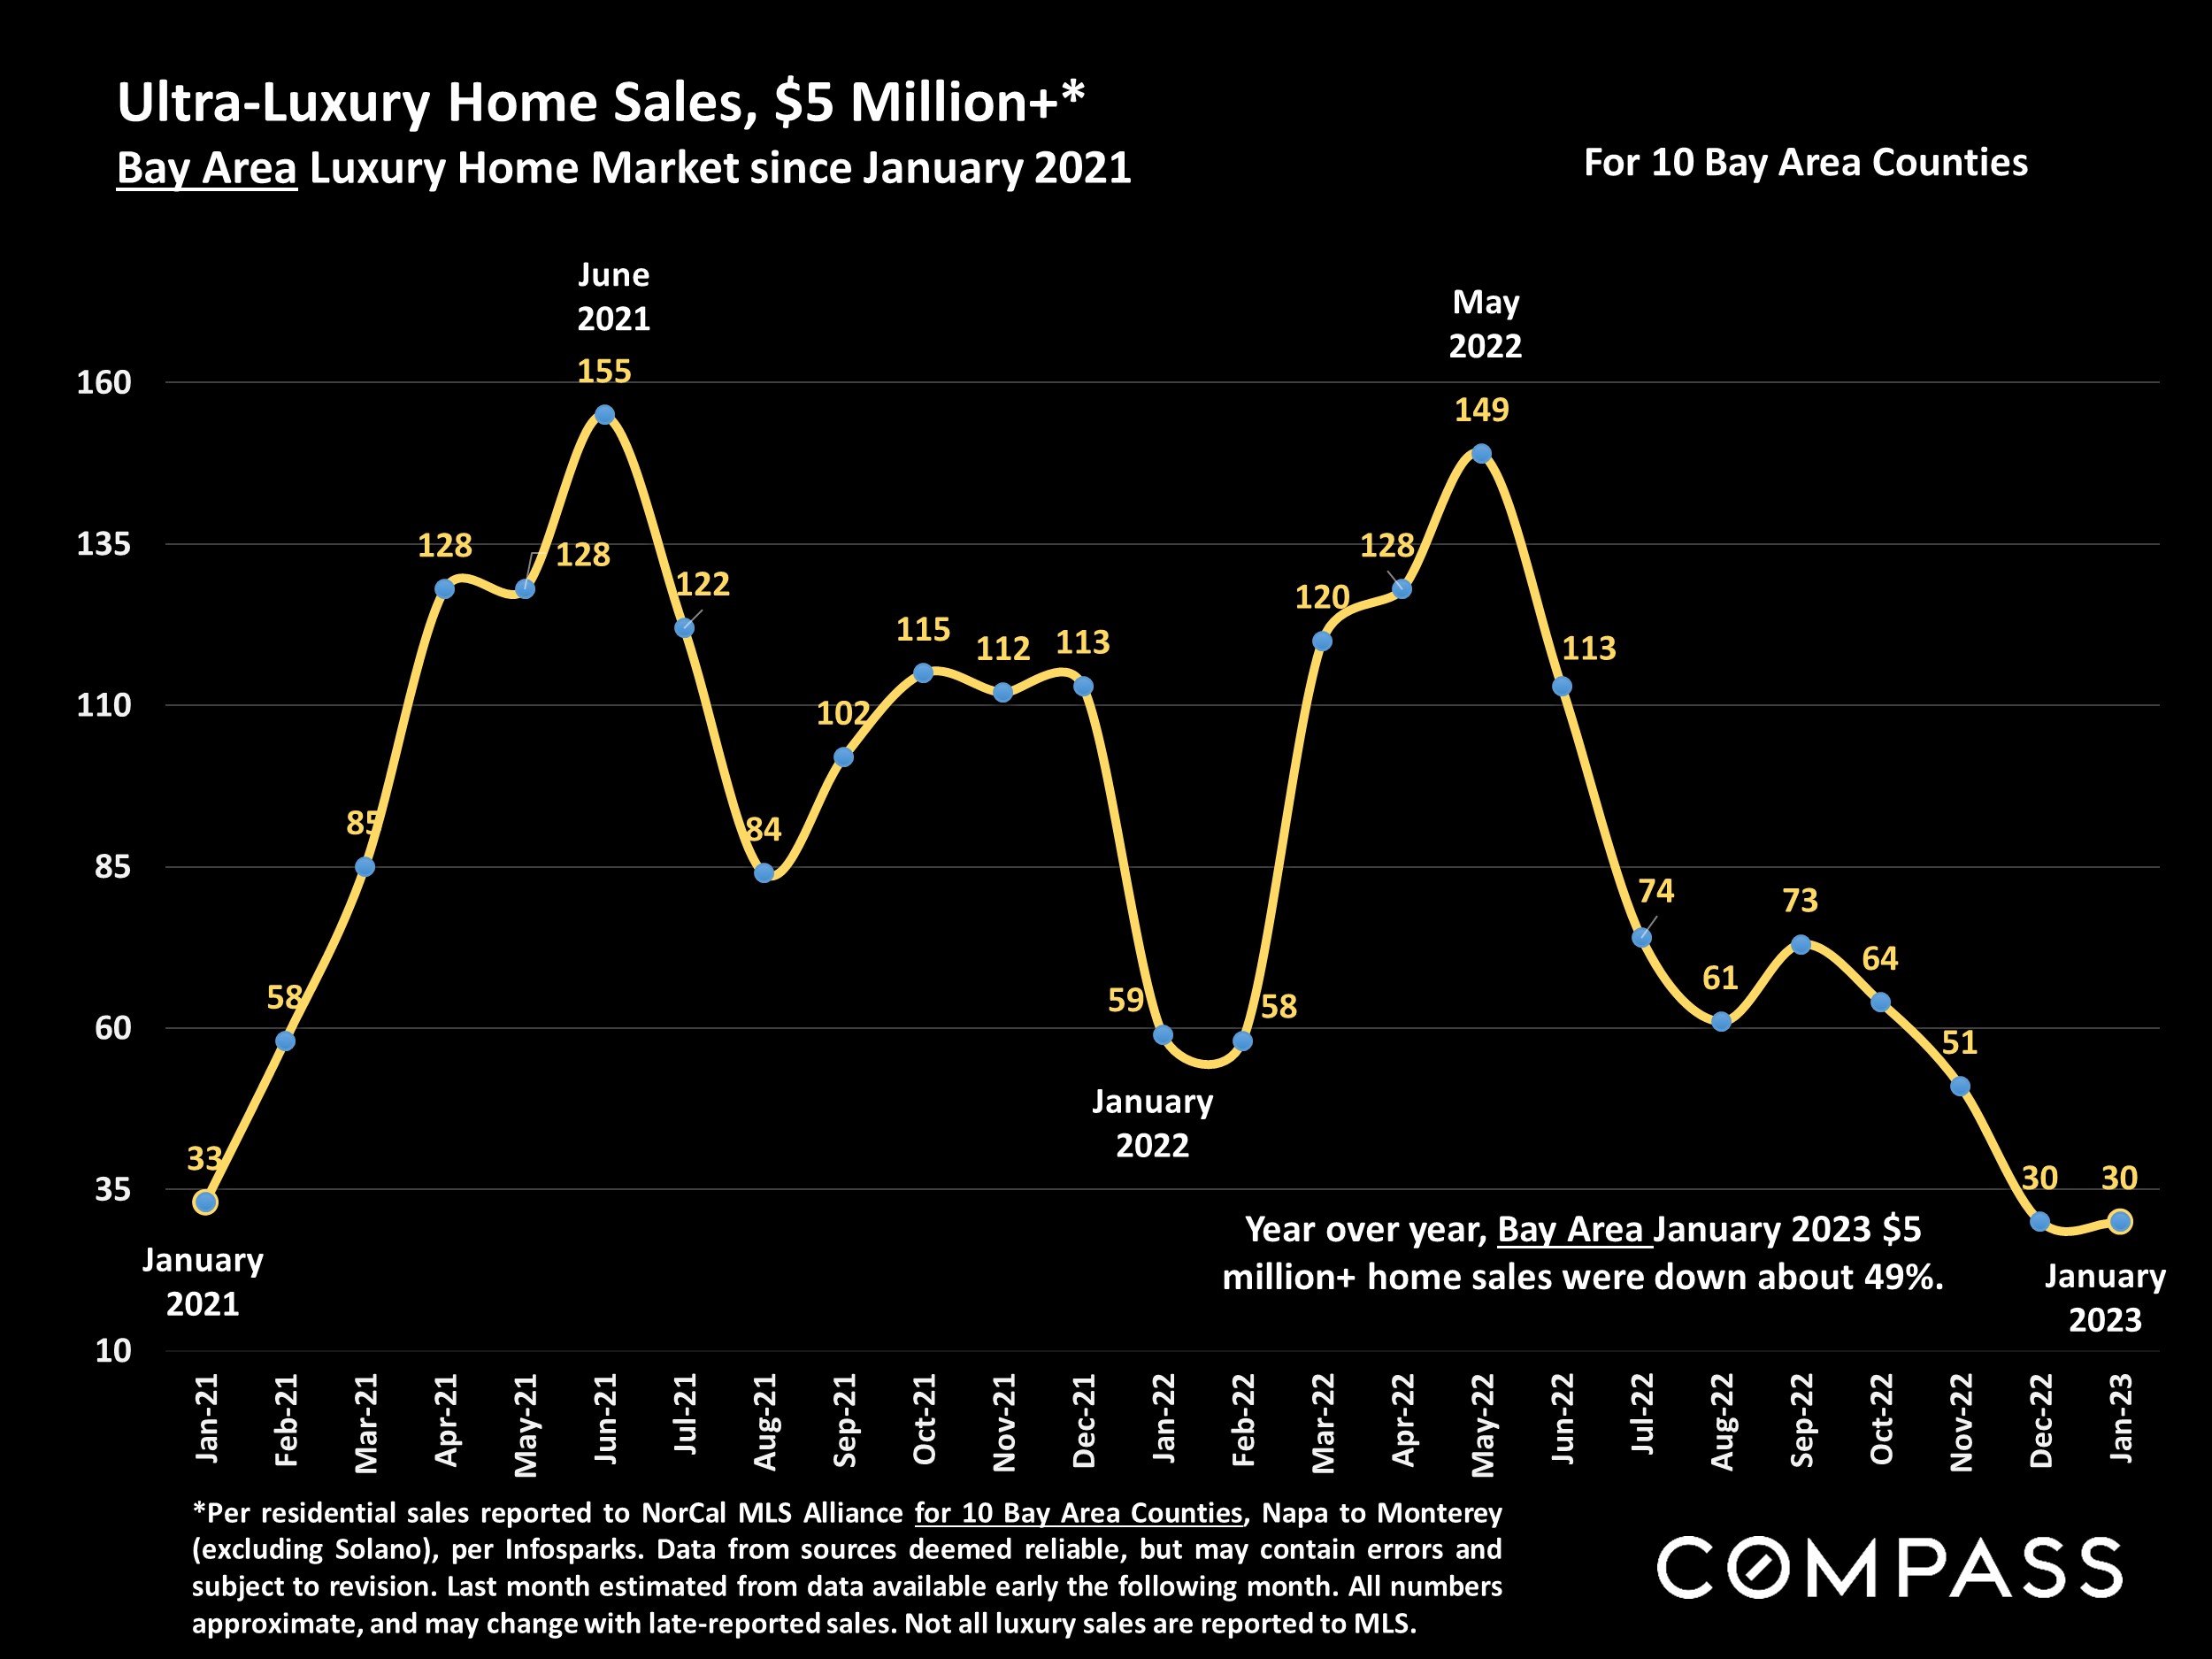
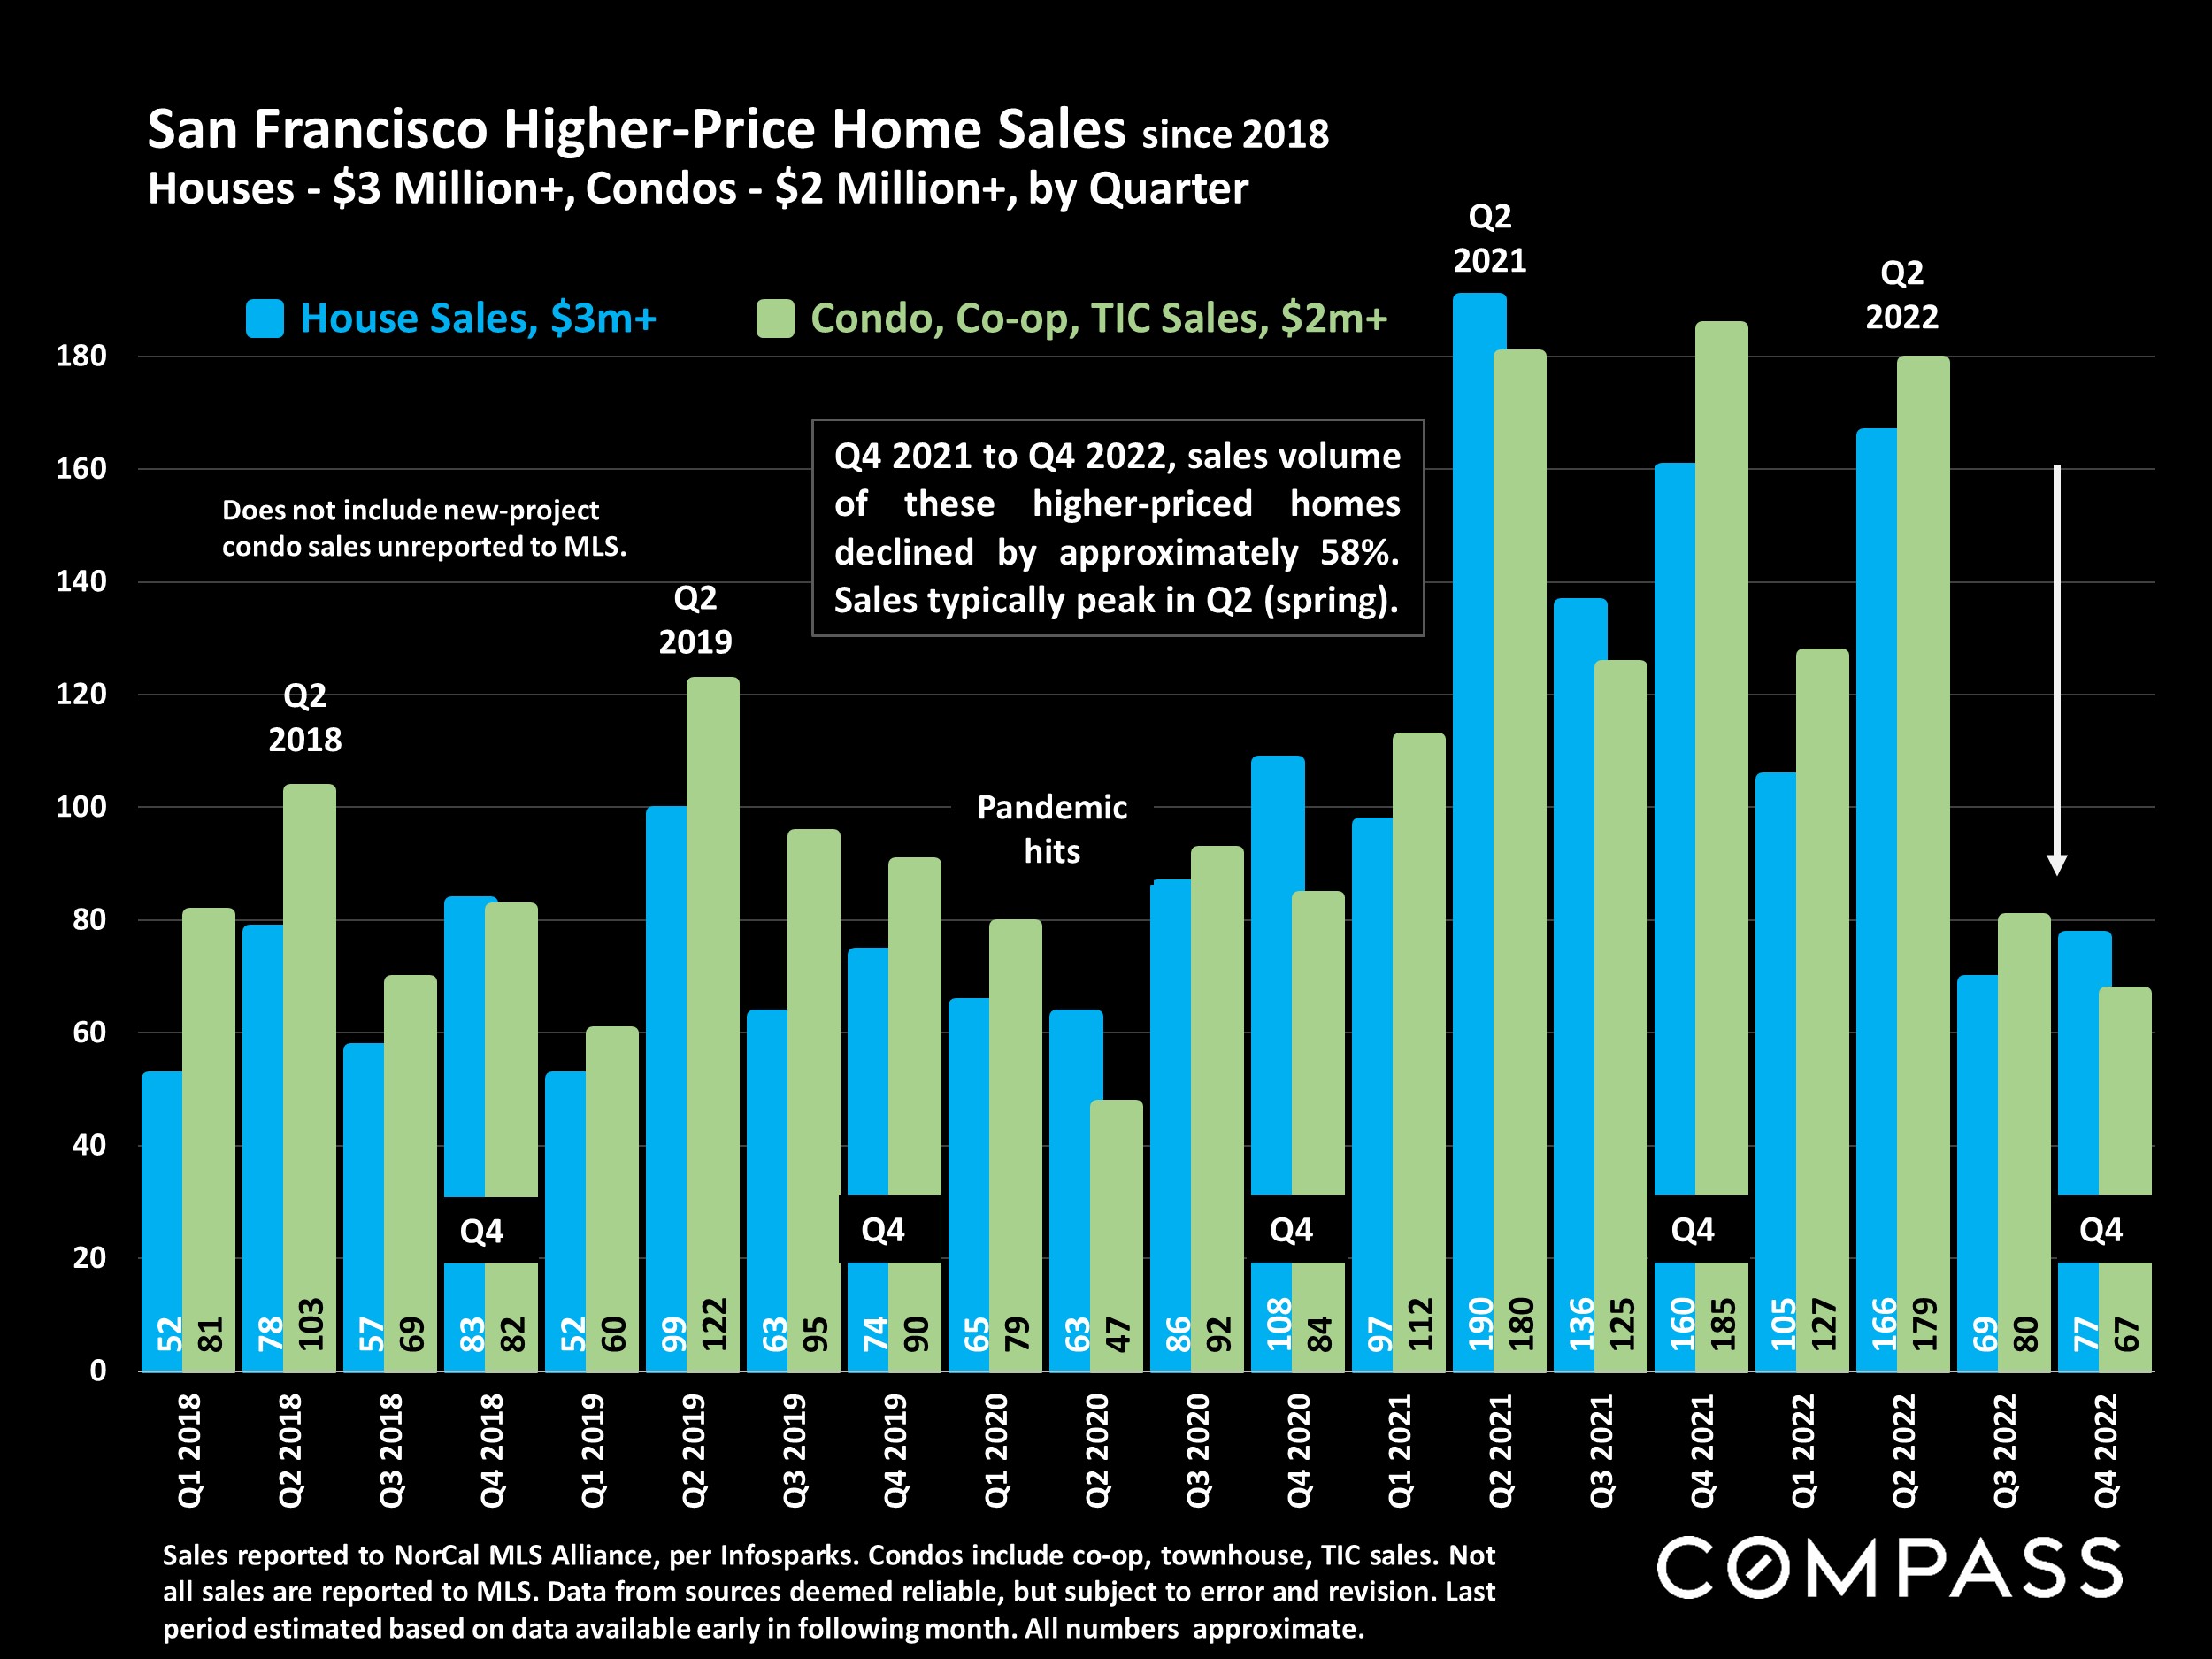
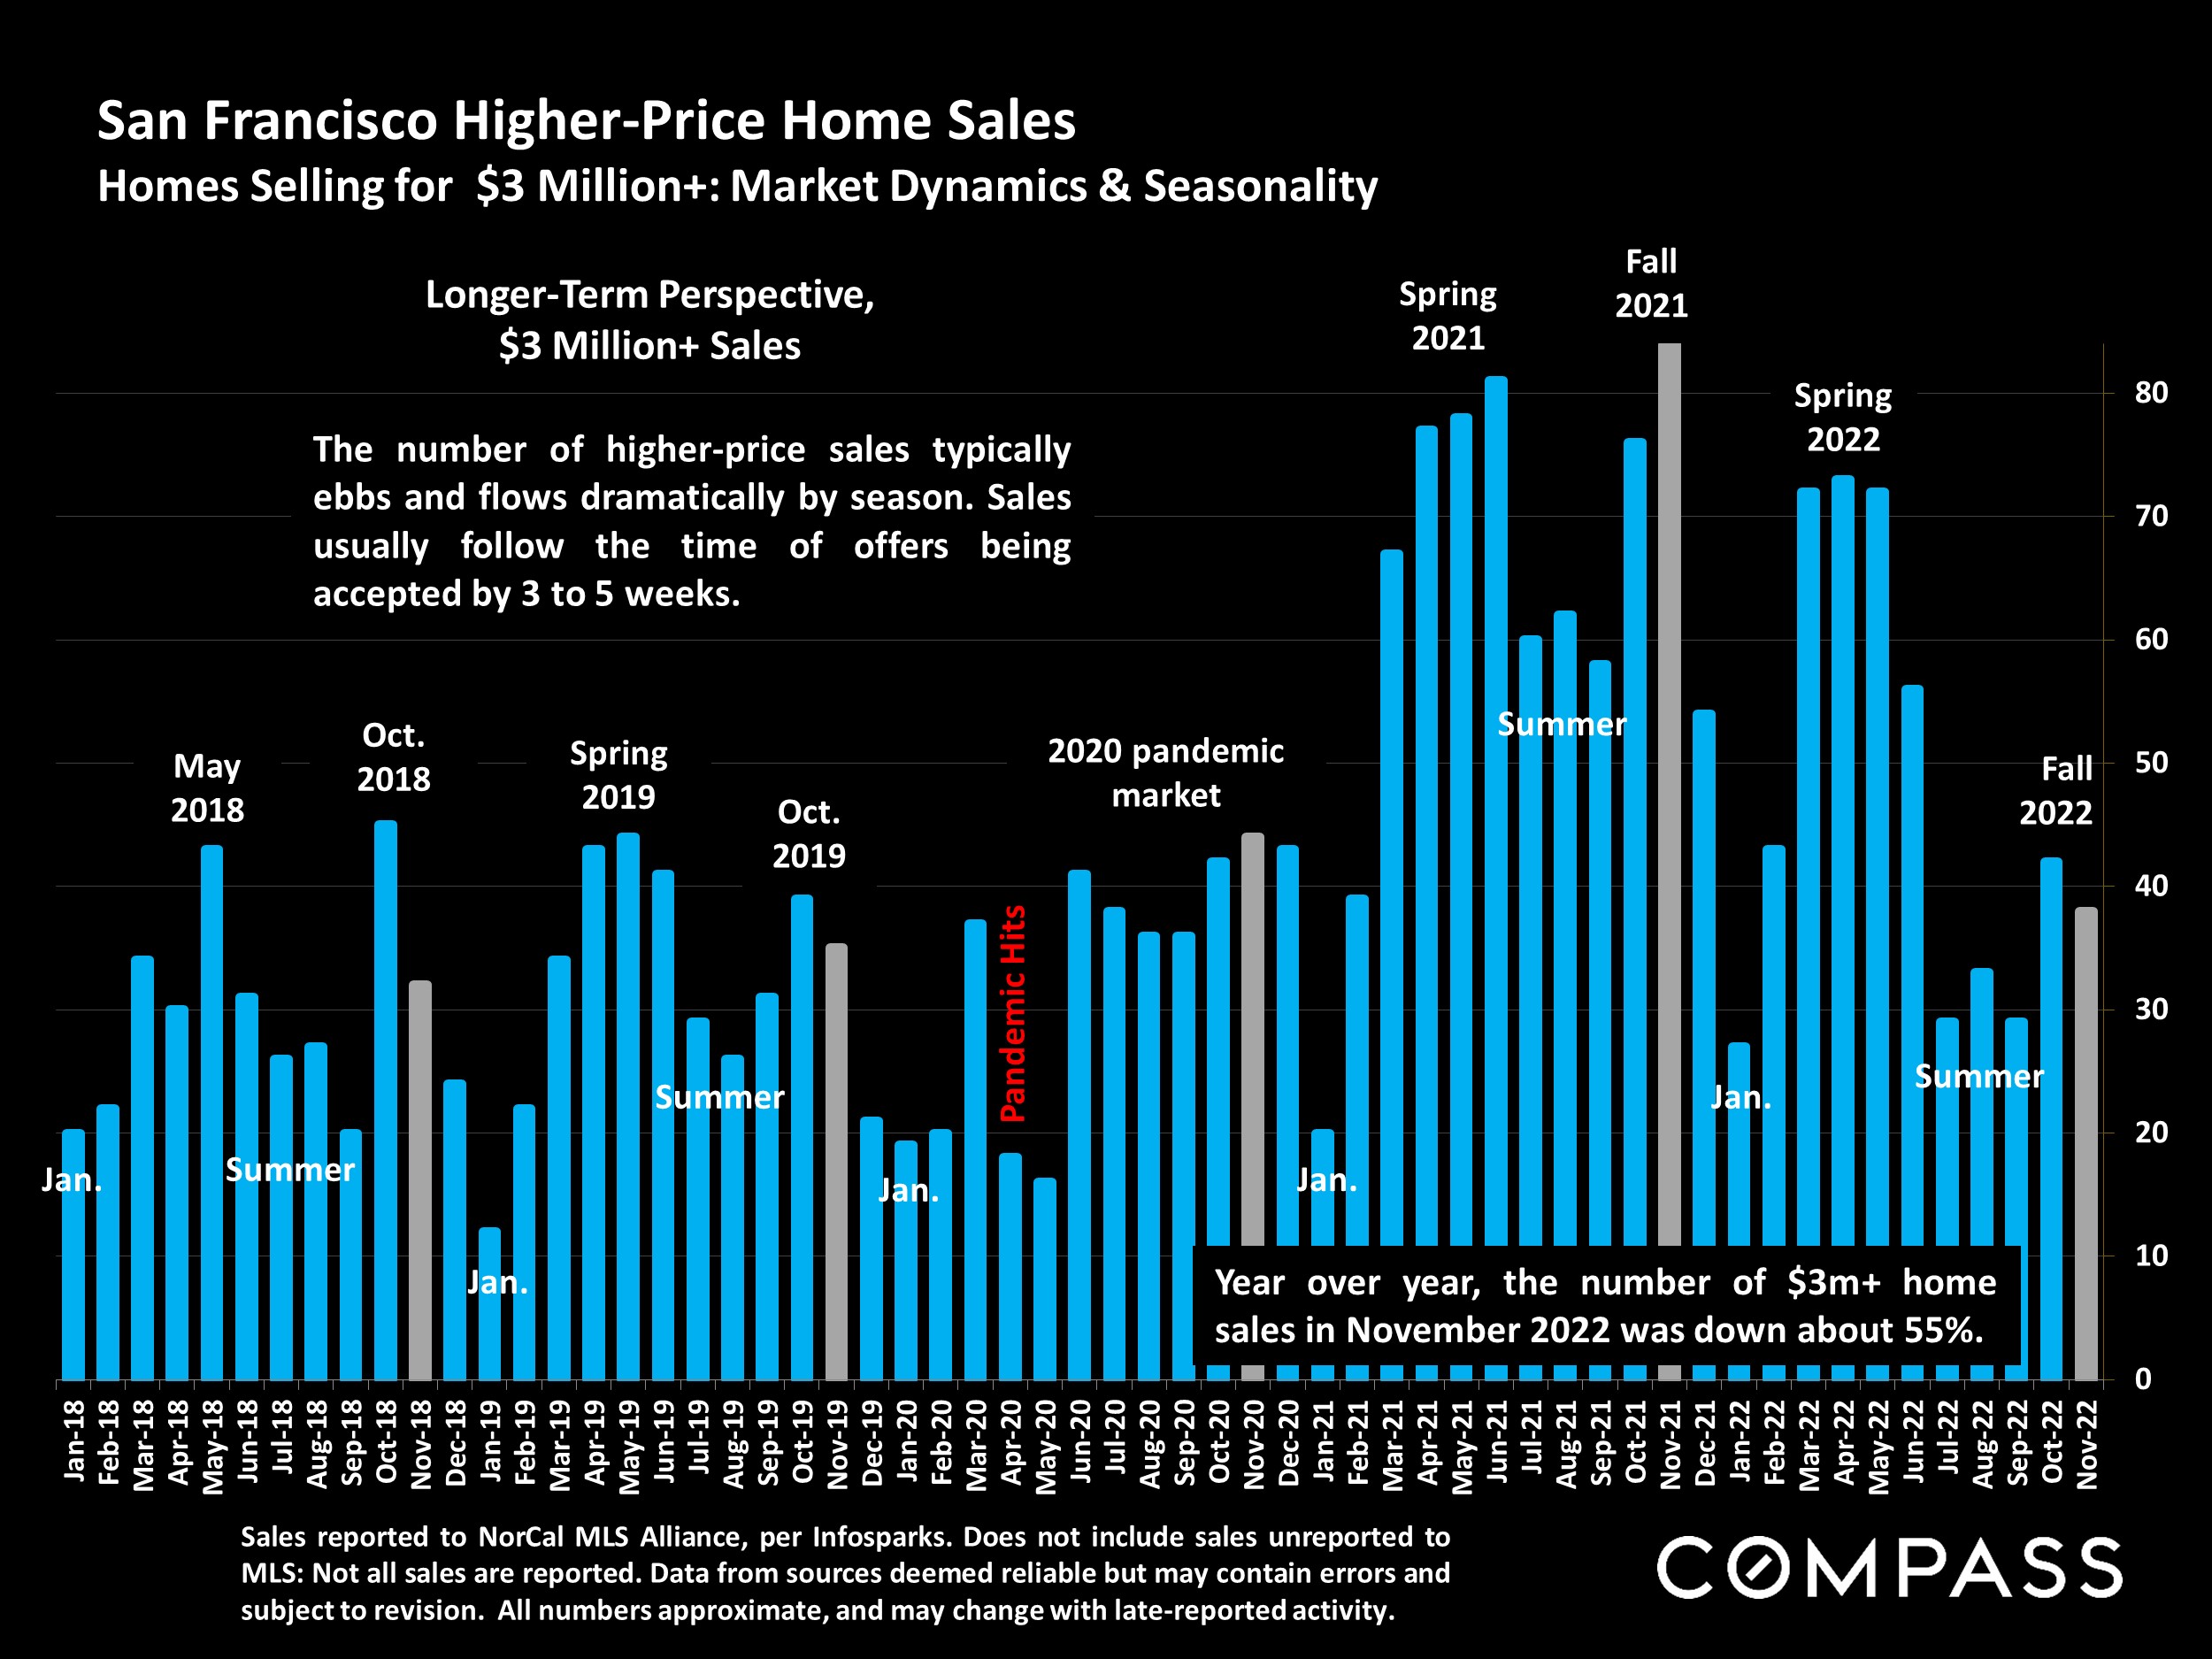
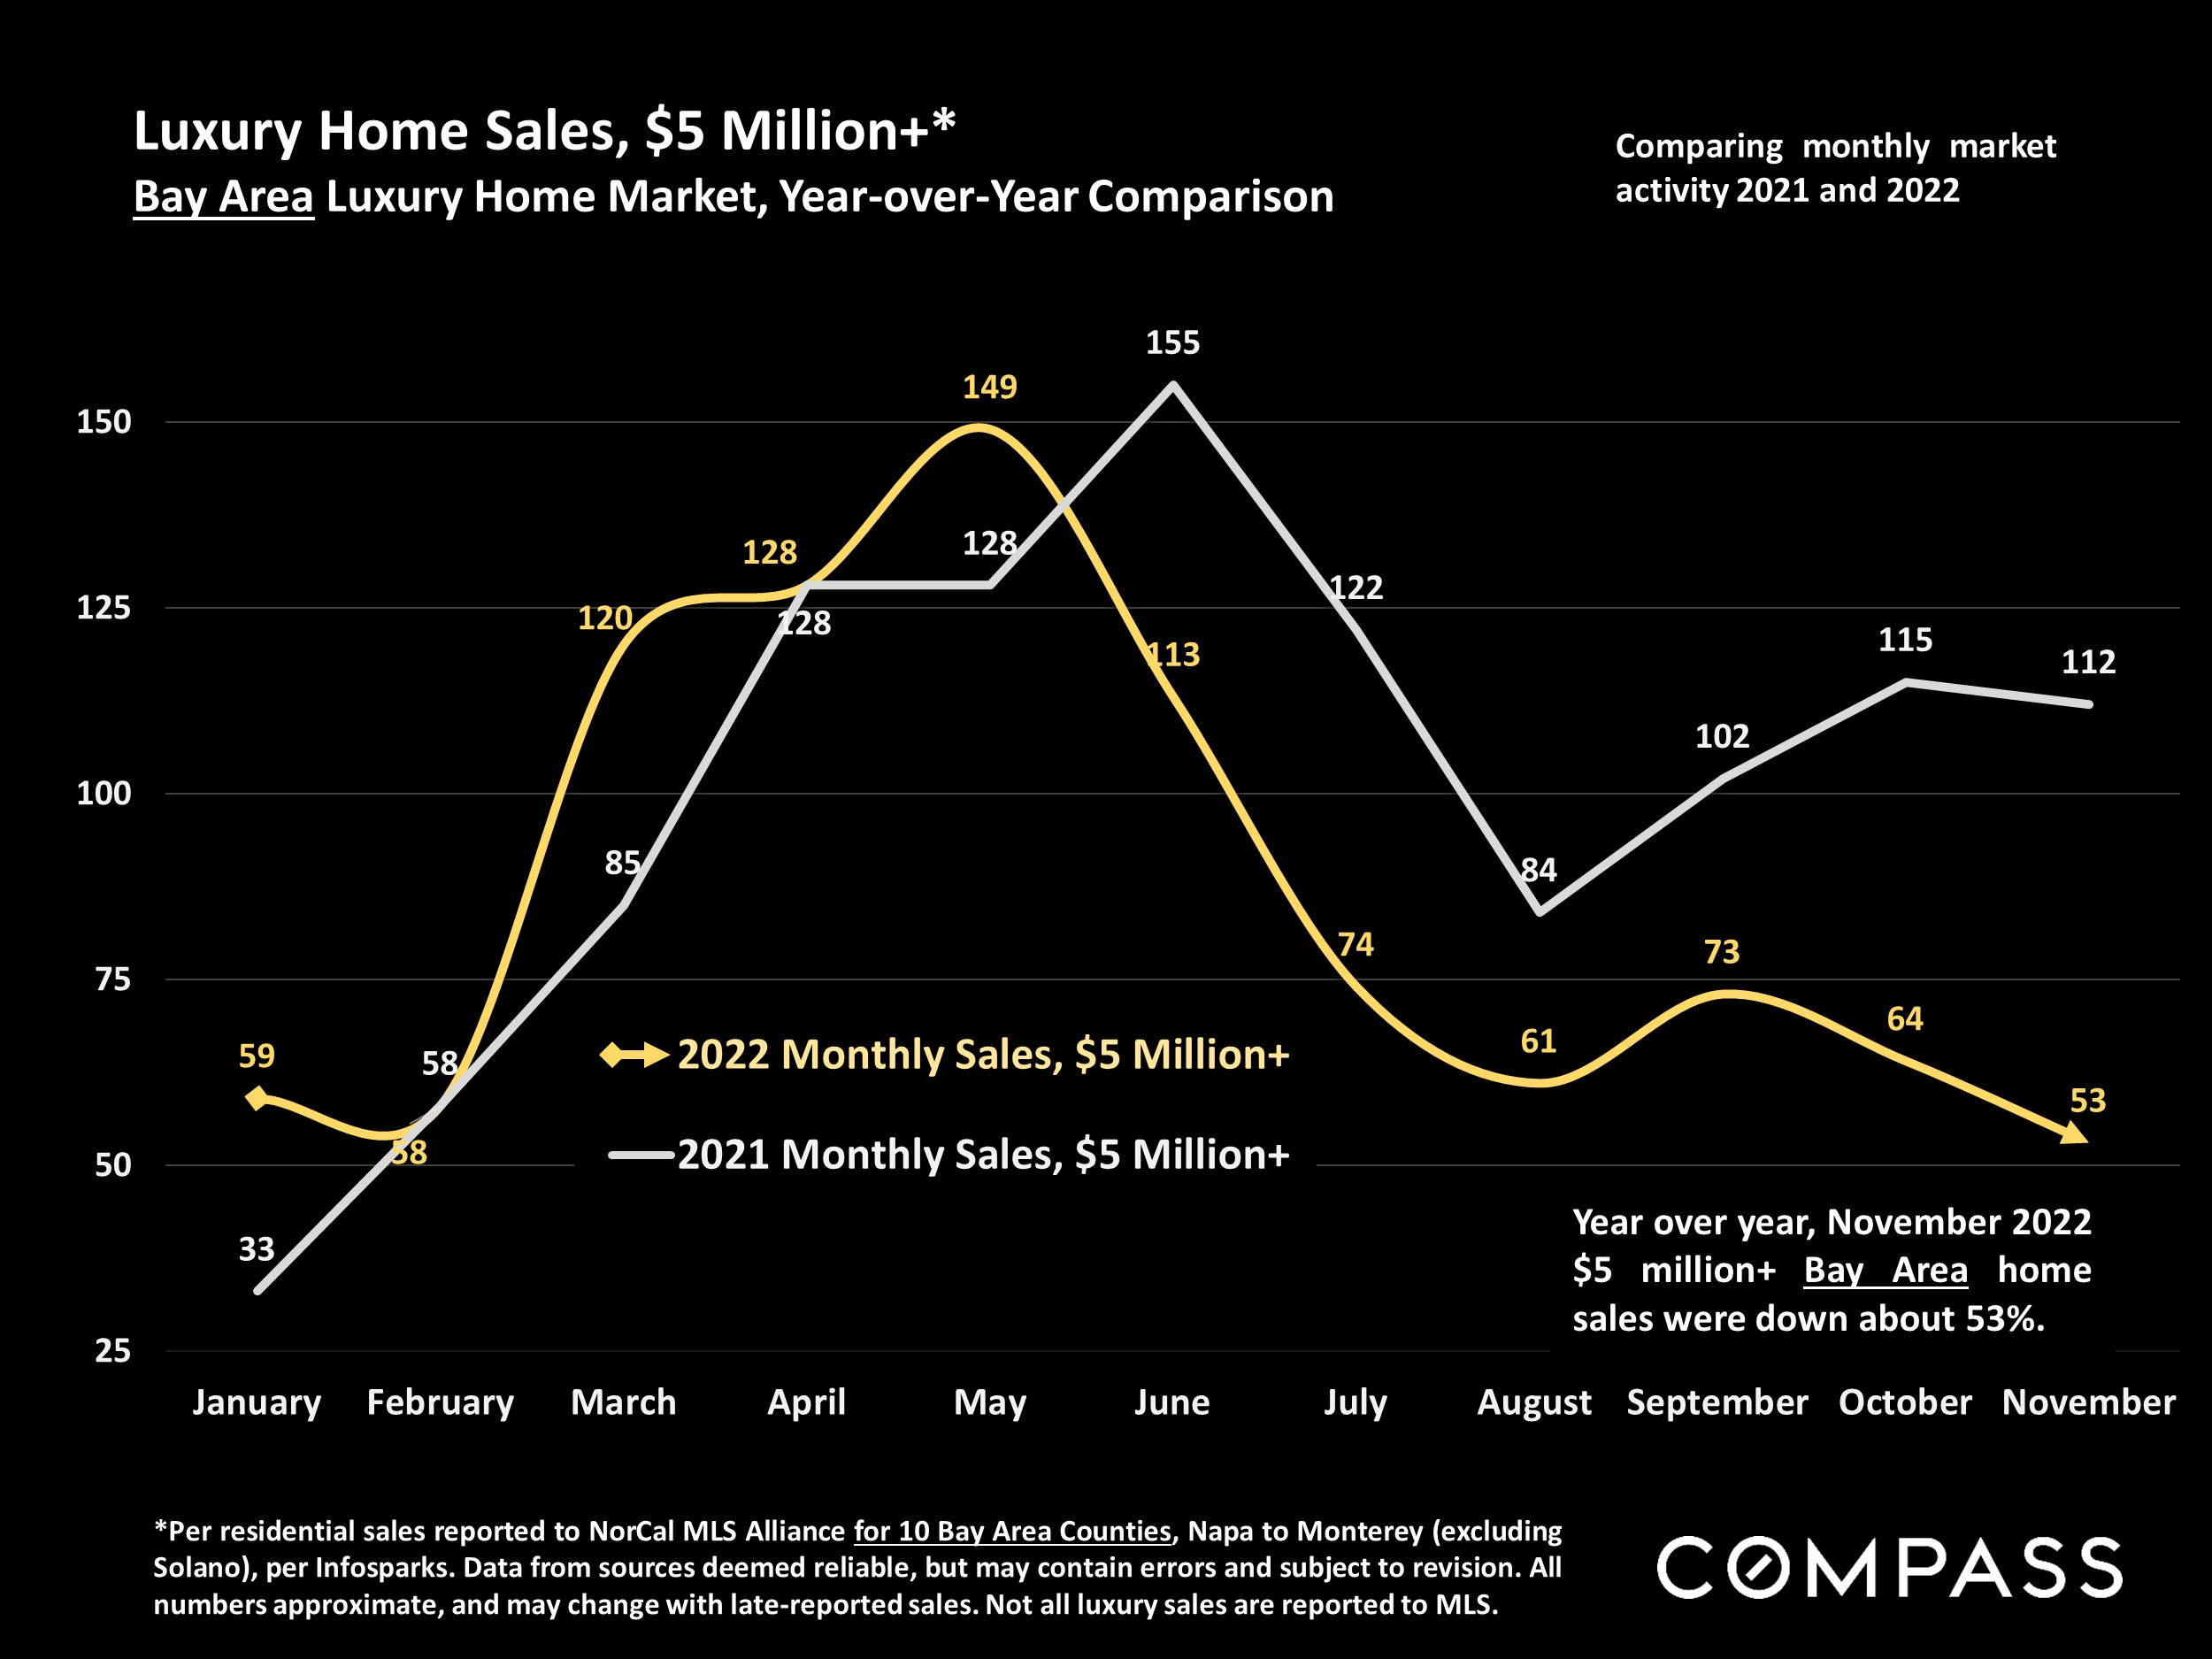
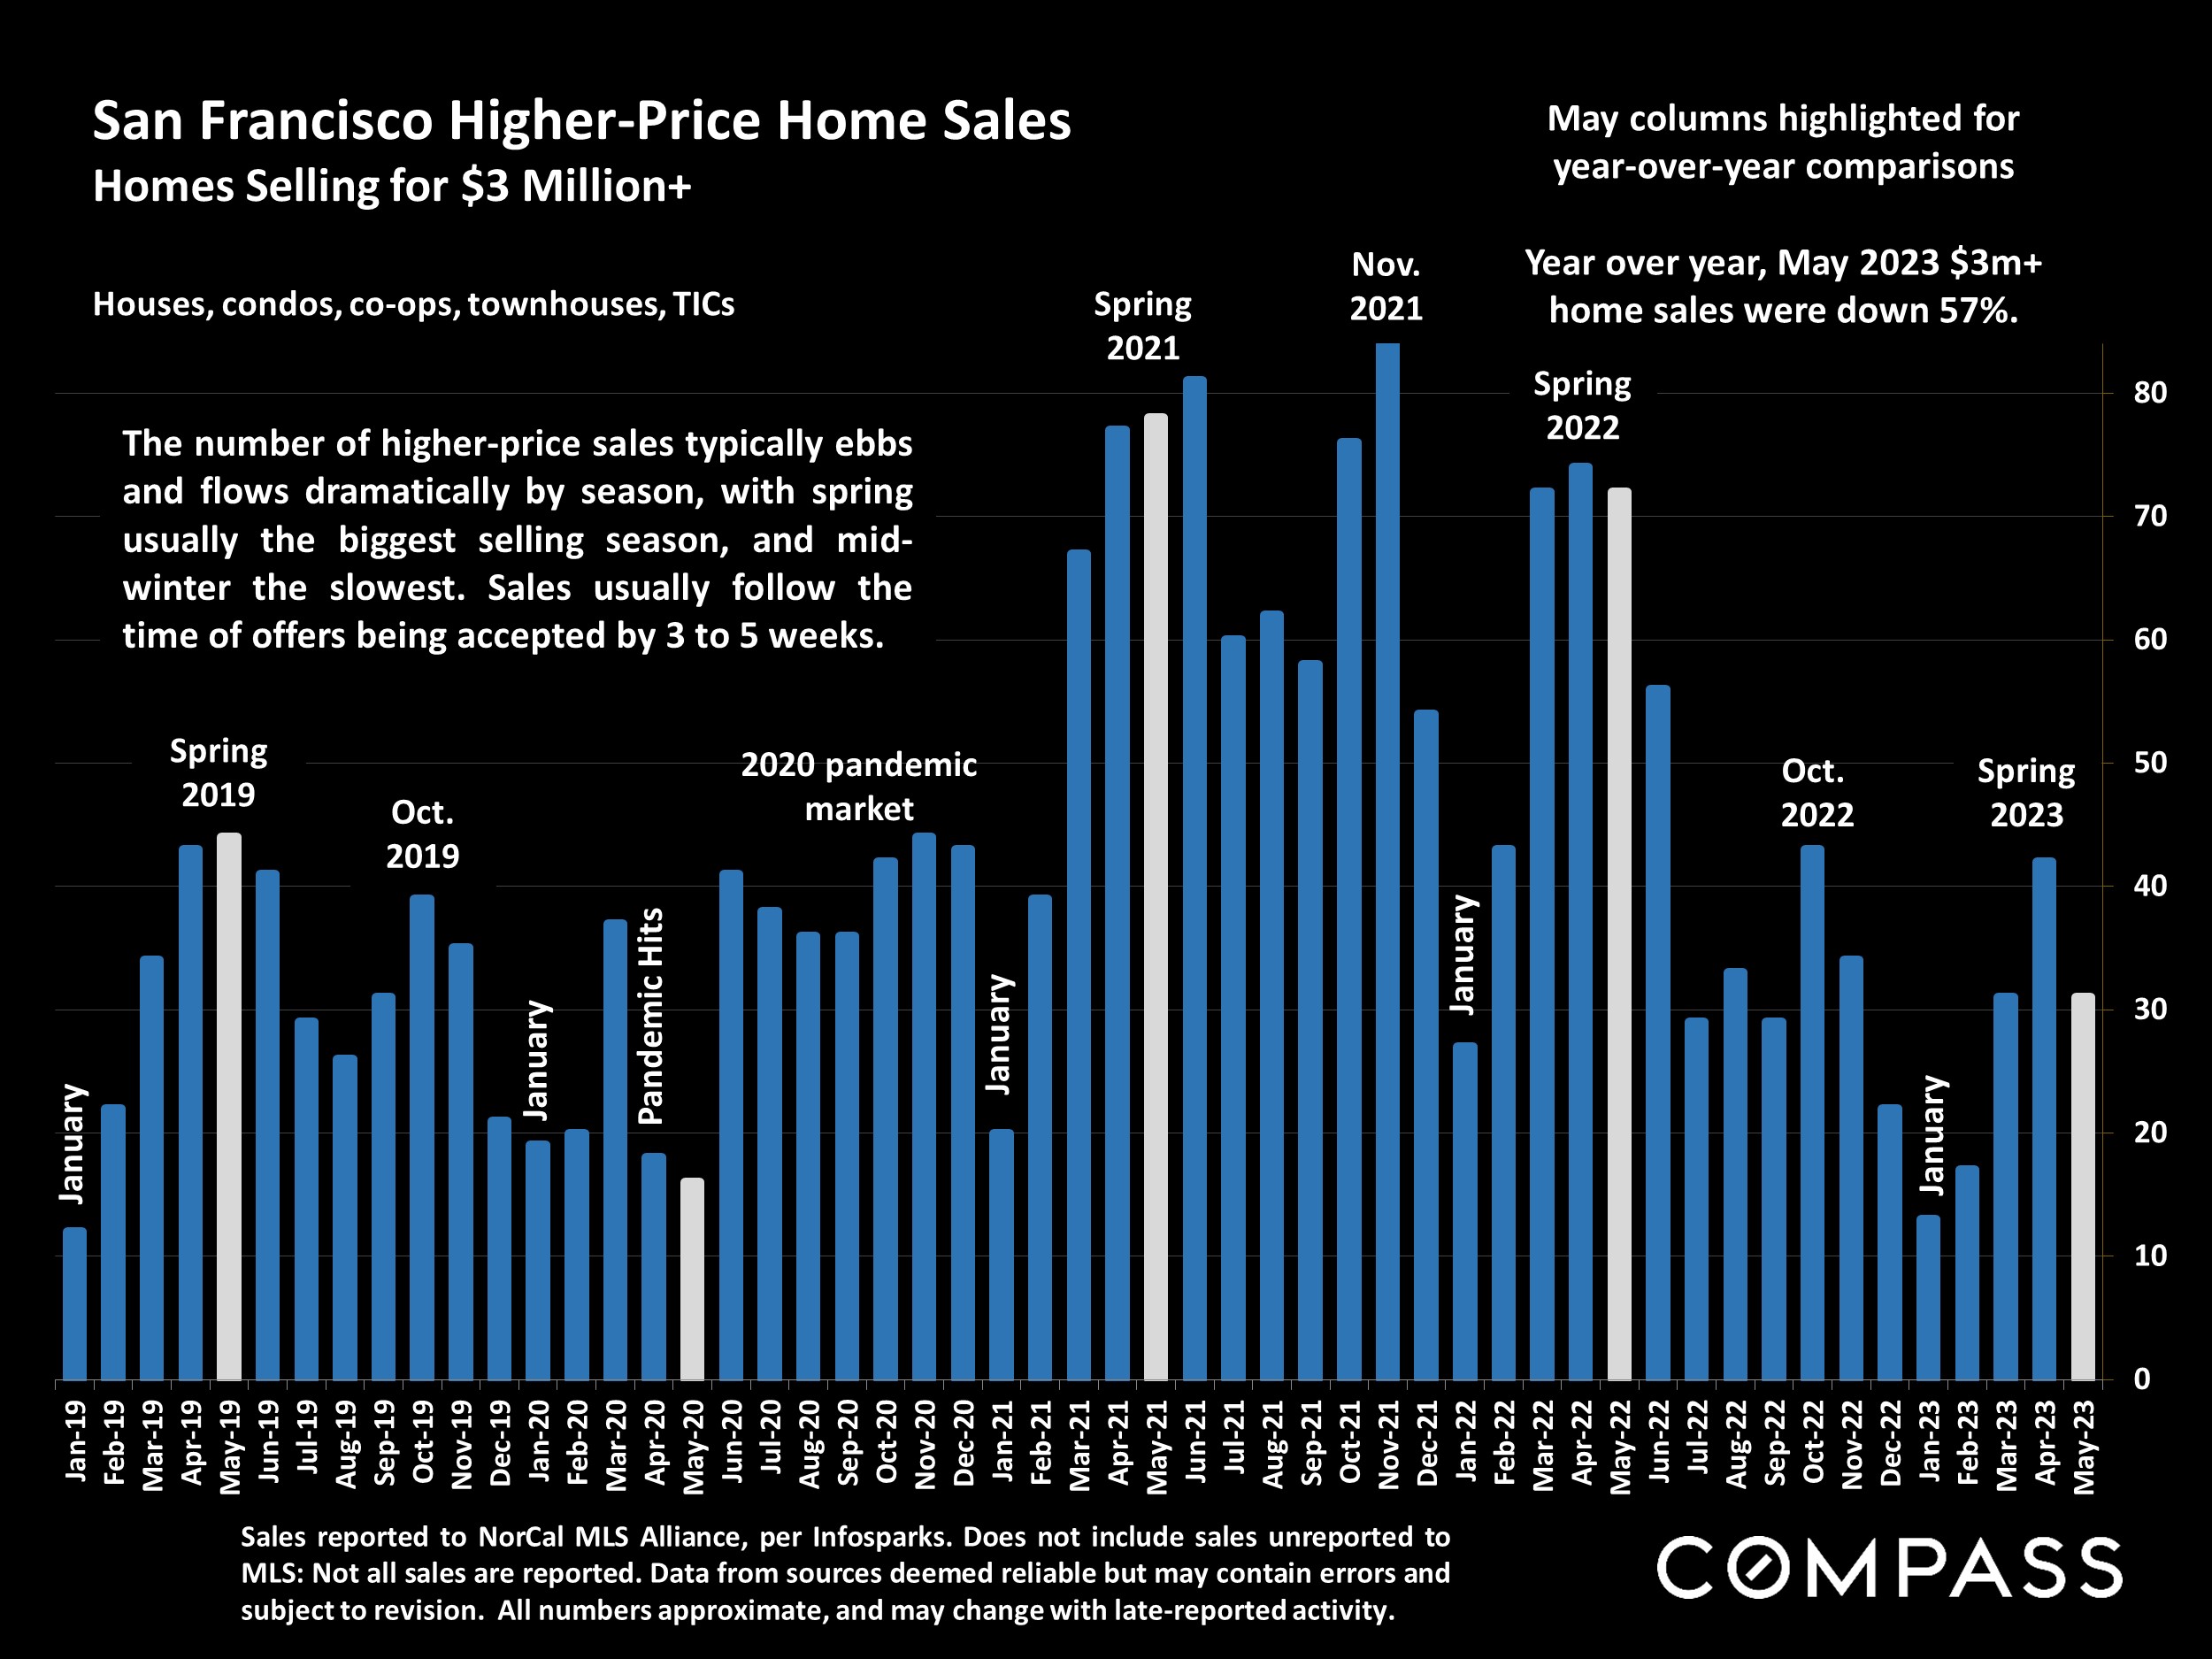
Luxury home sales remain well down from peaks seen at the height of the pandemic boom, but significantly up from late 2022.
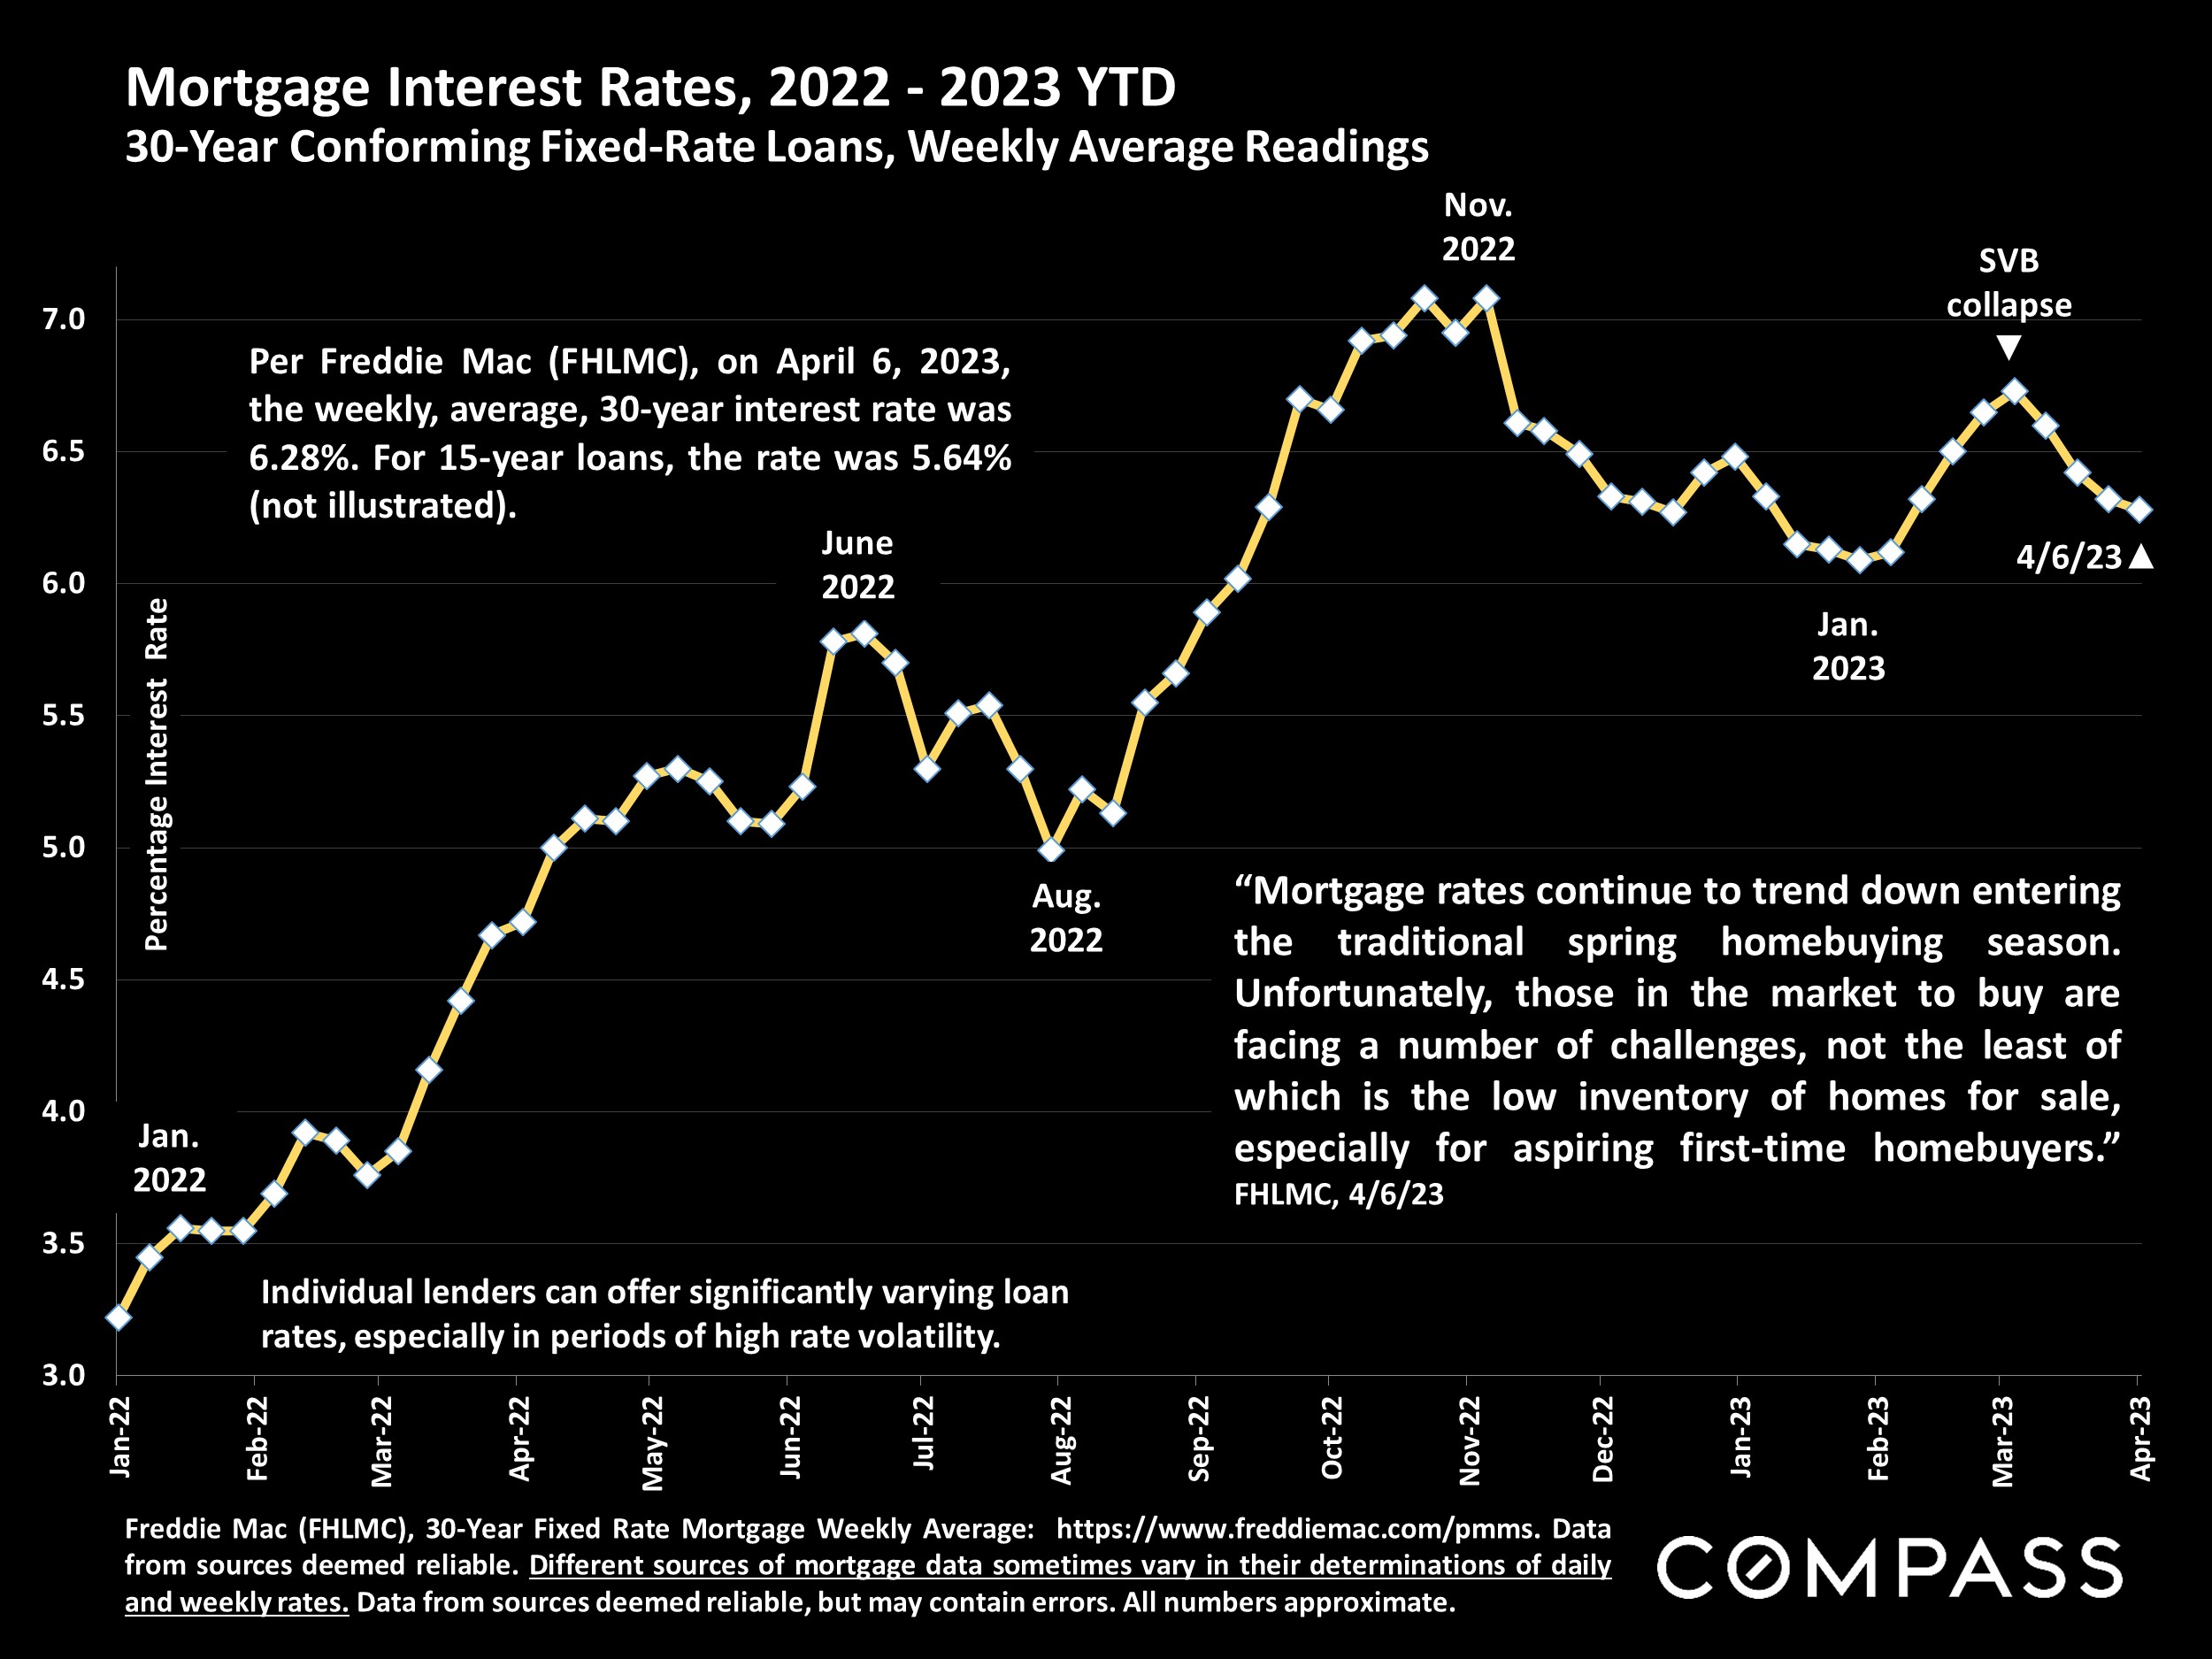
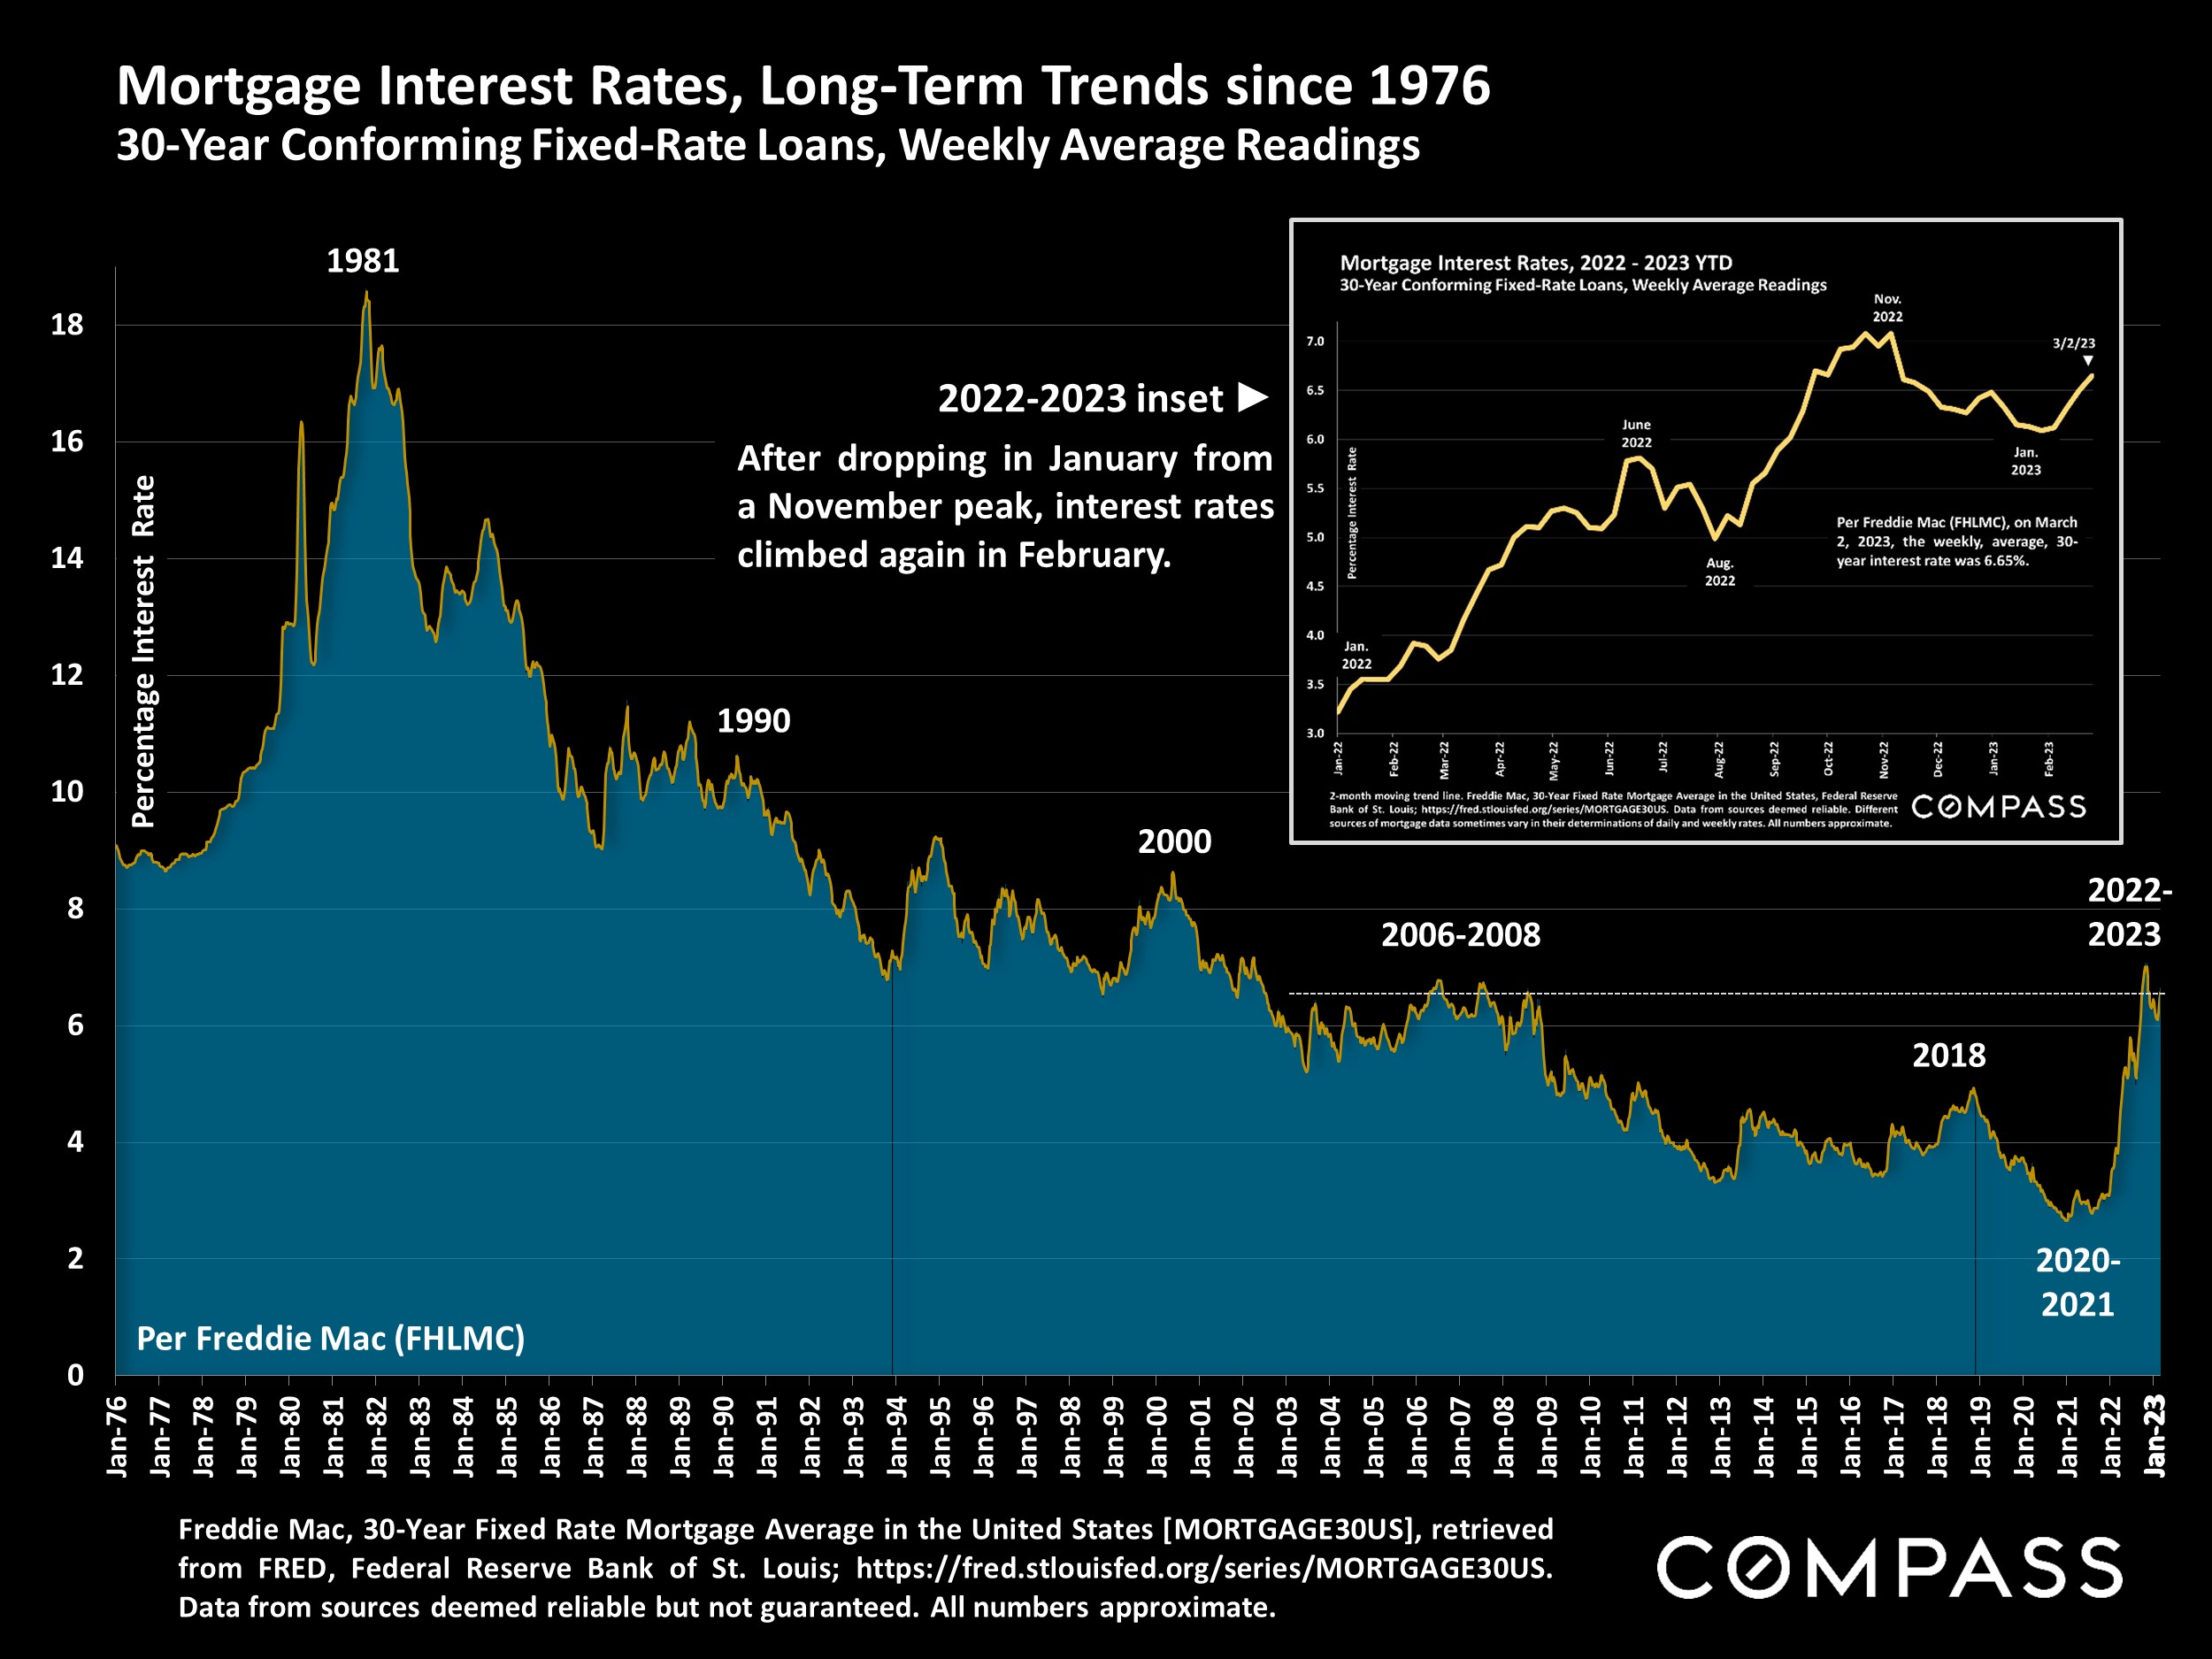
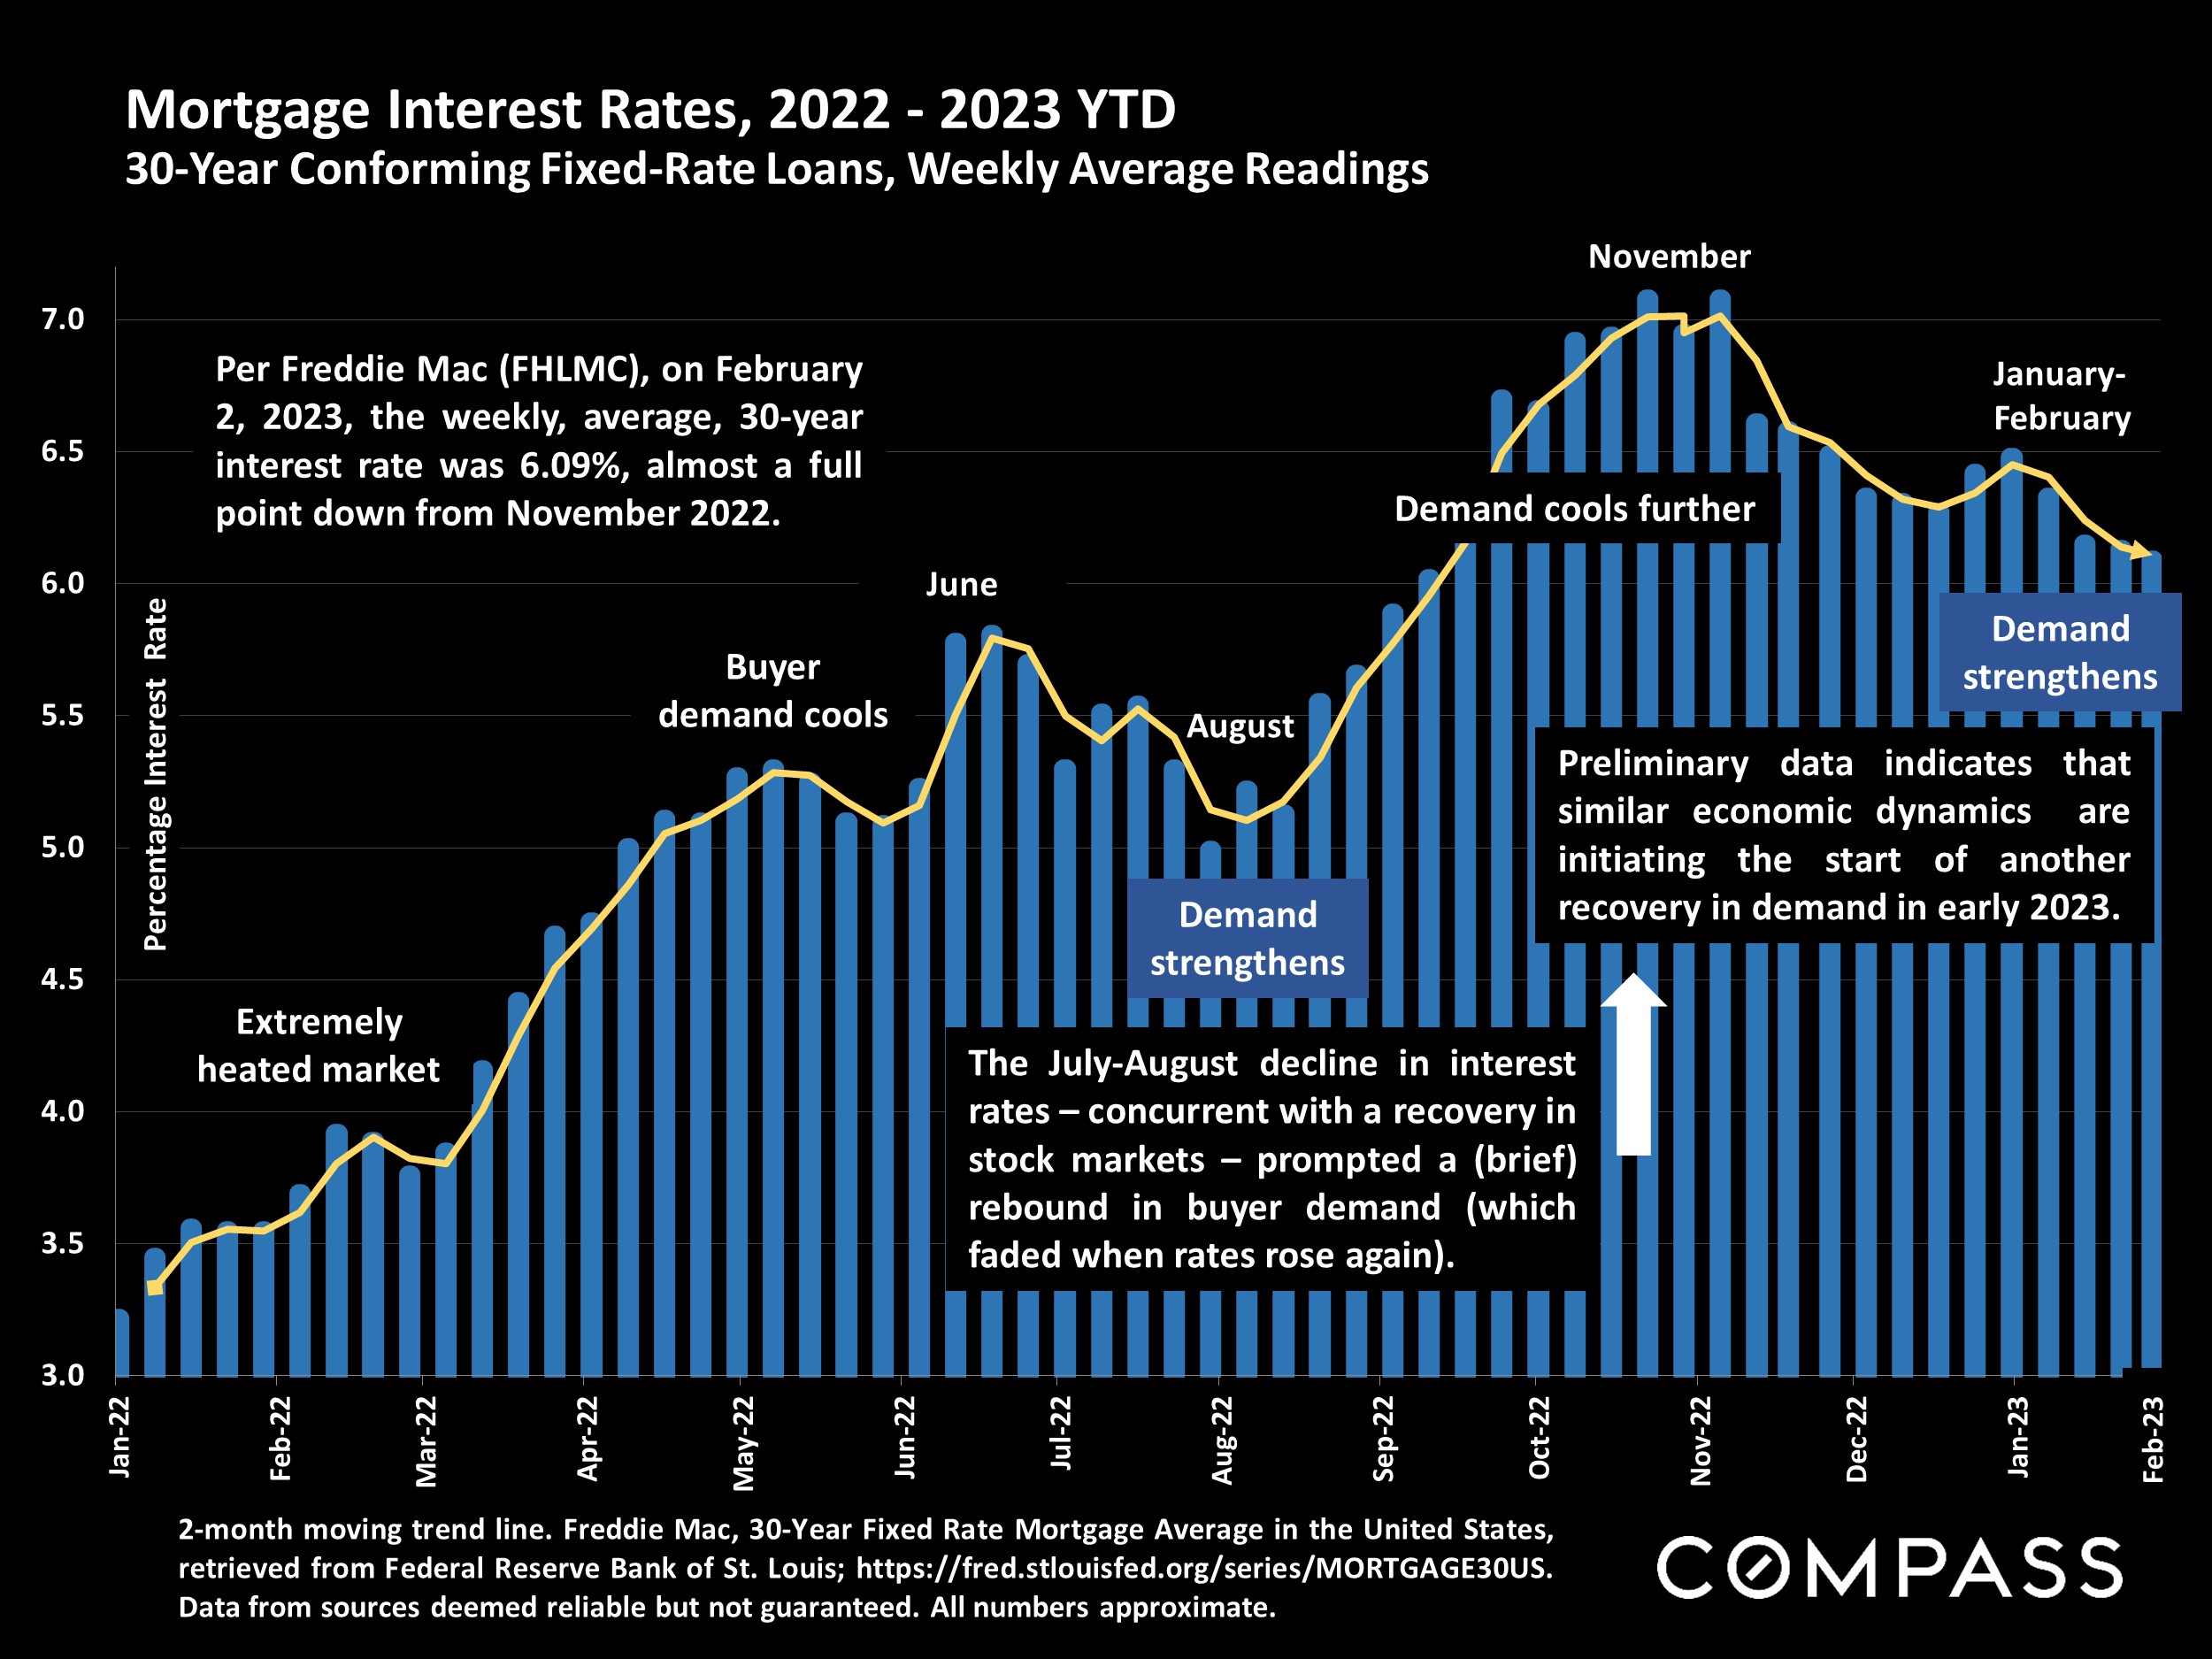
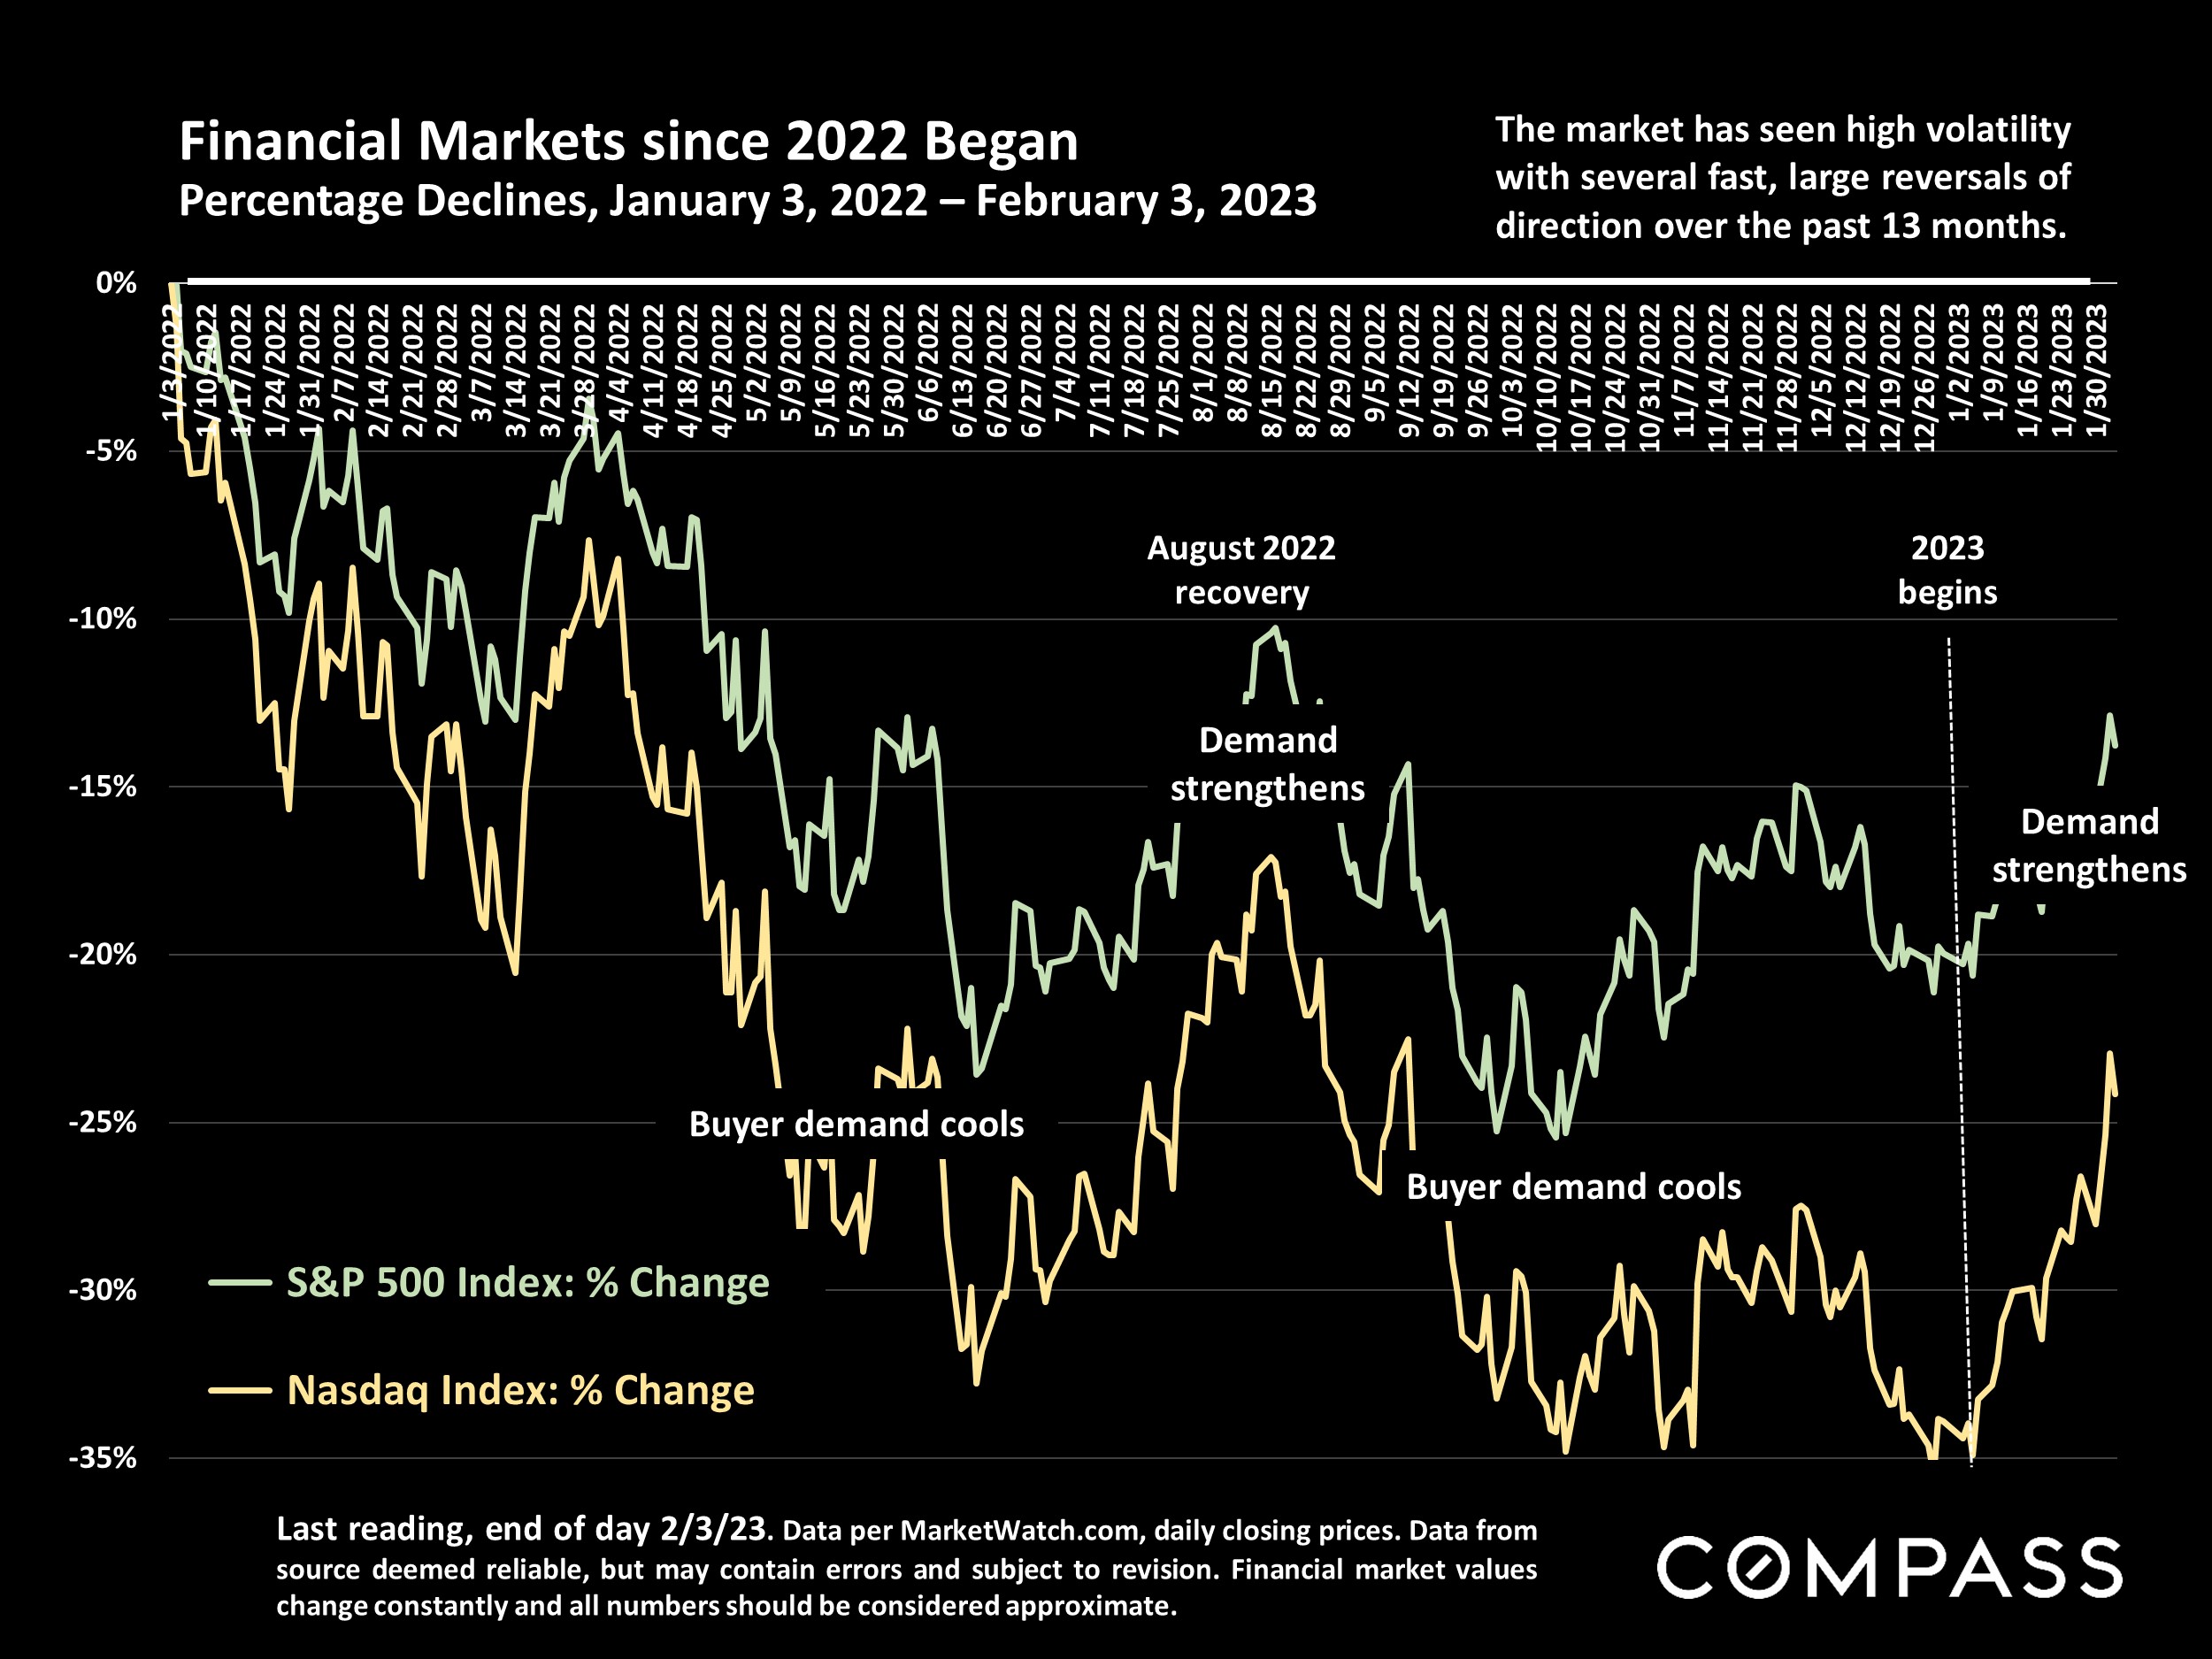
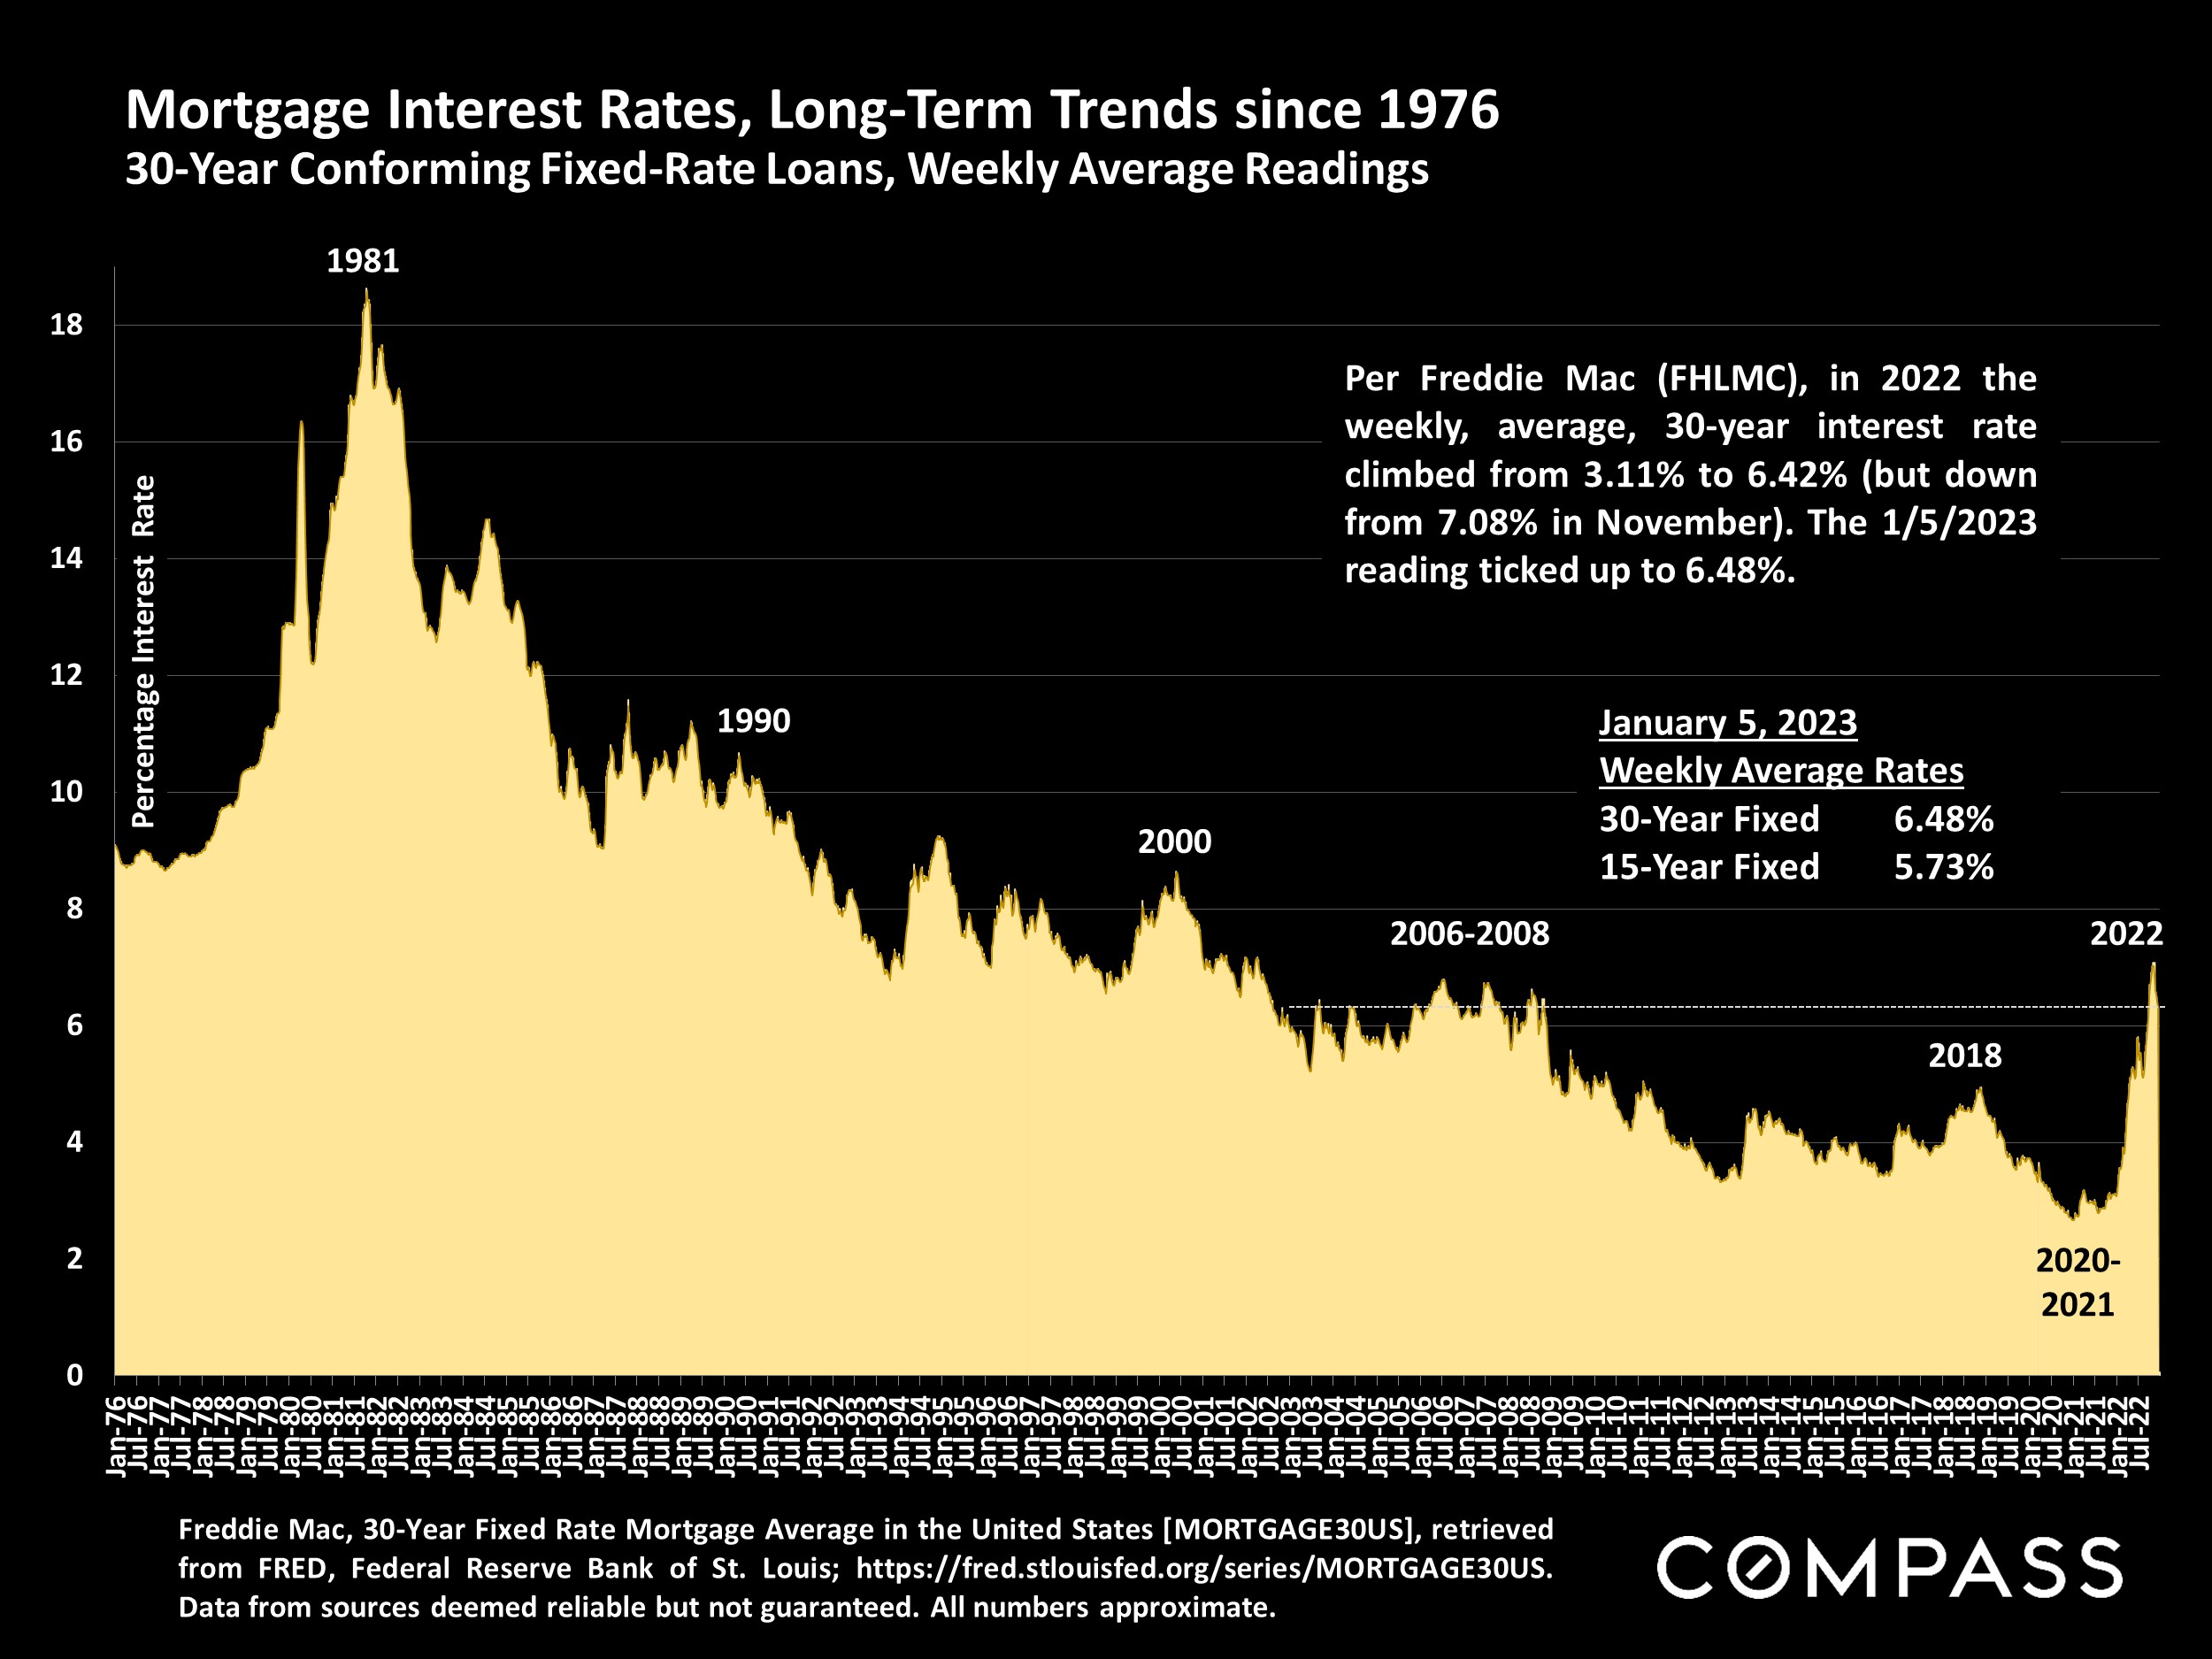
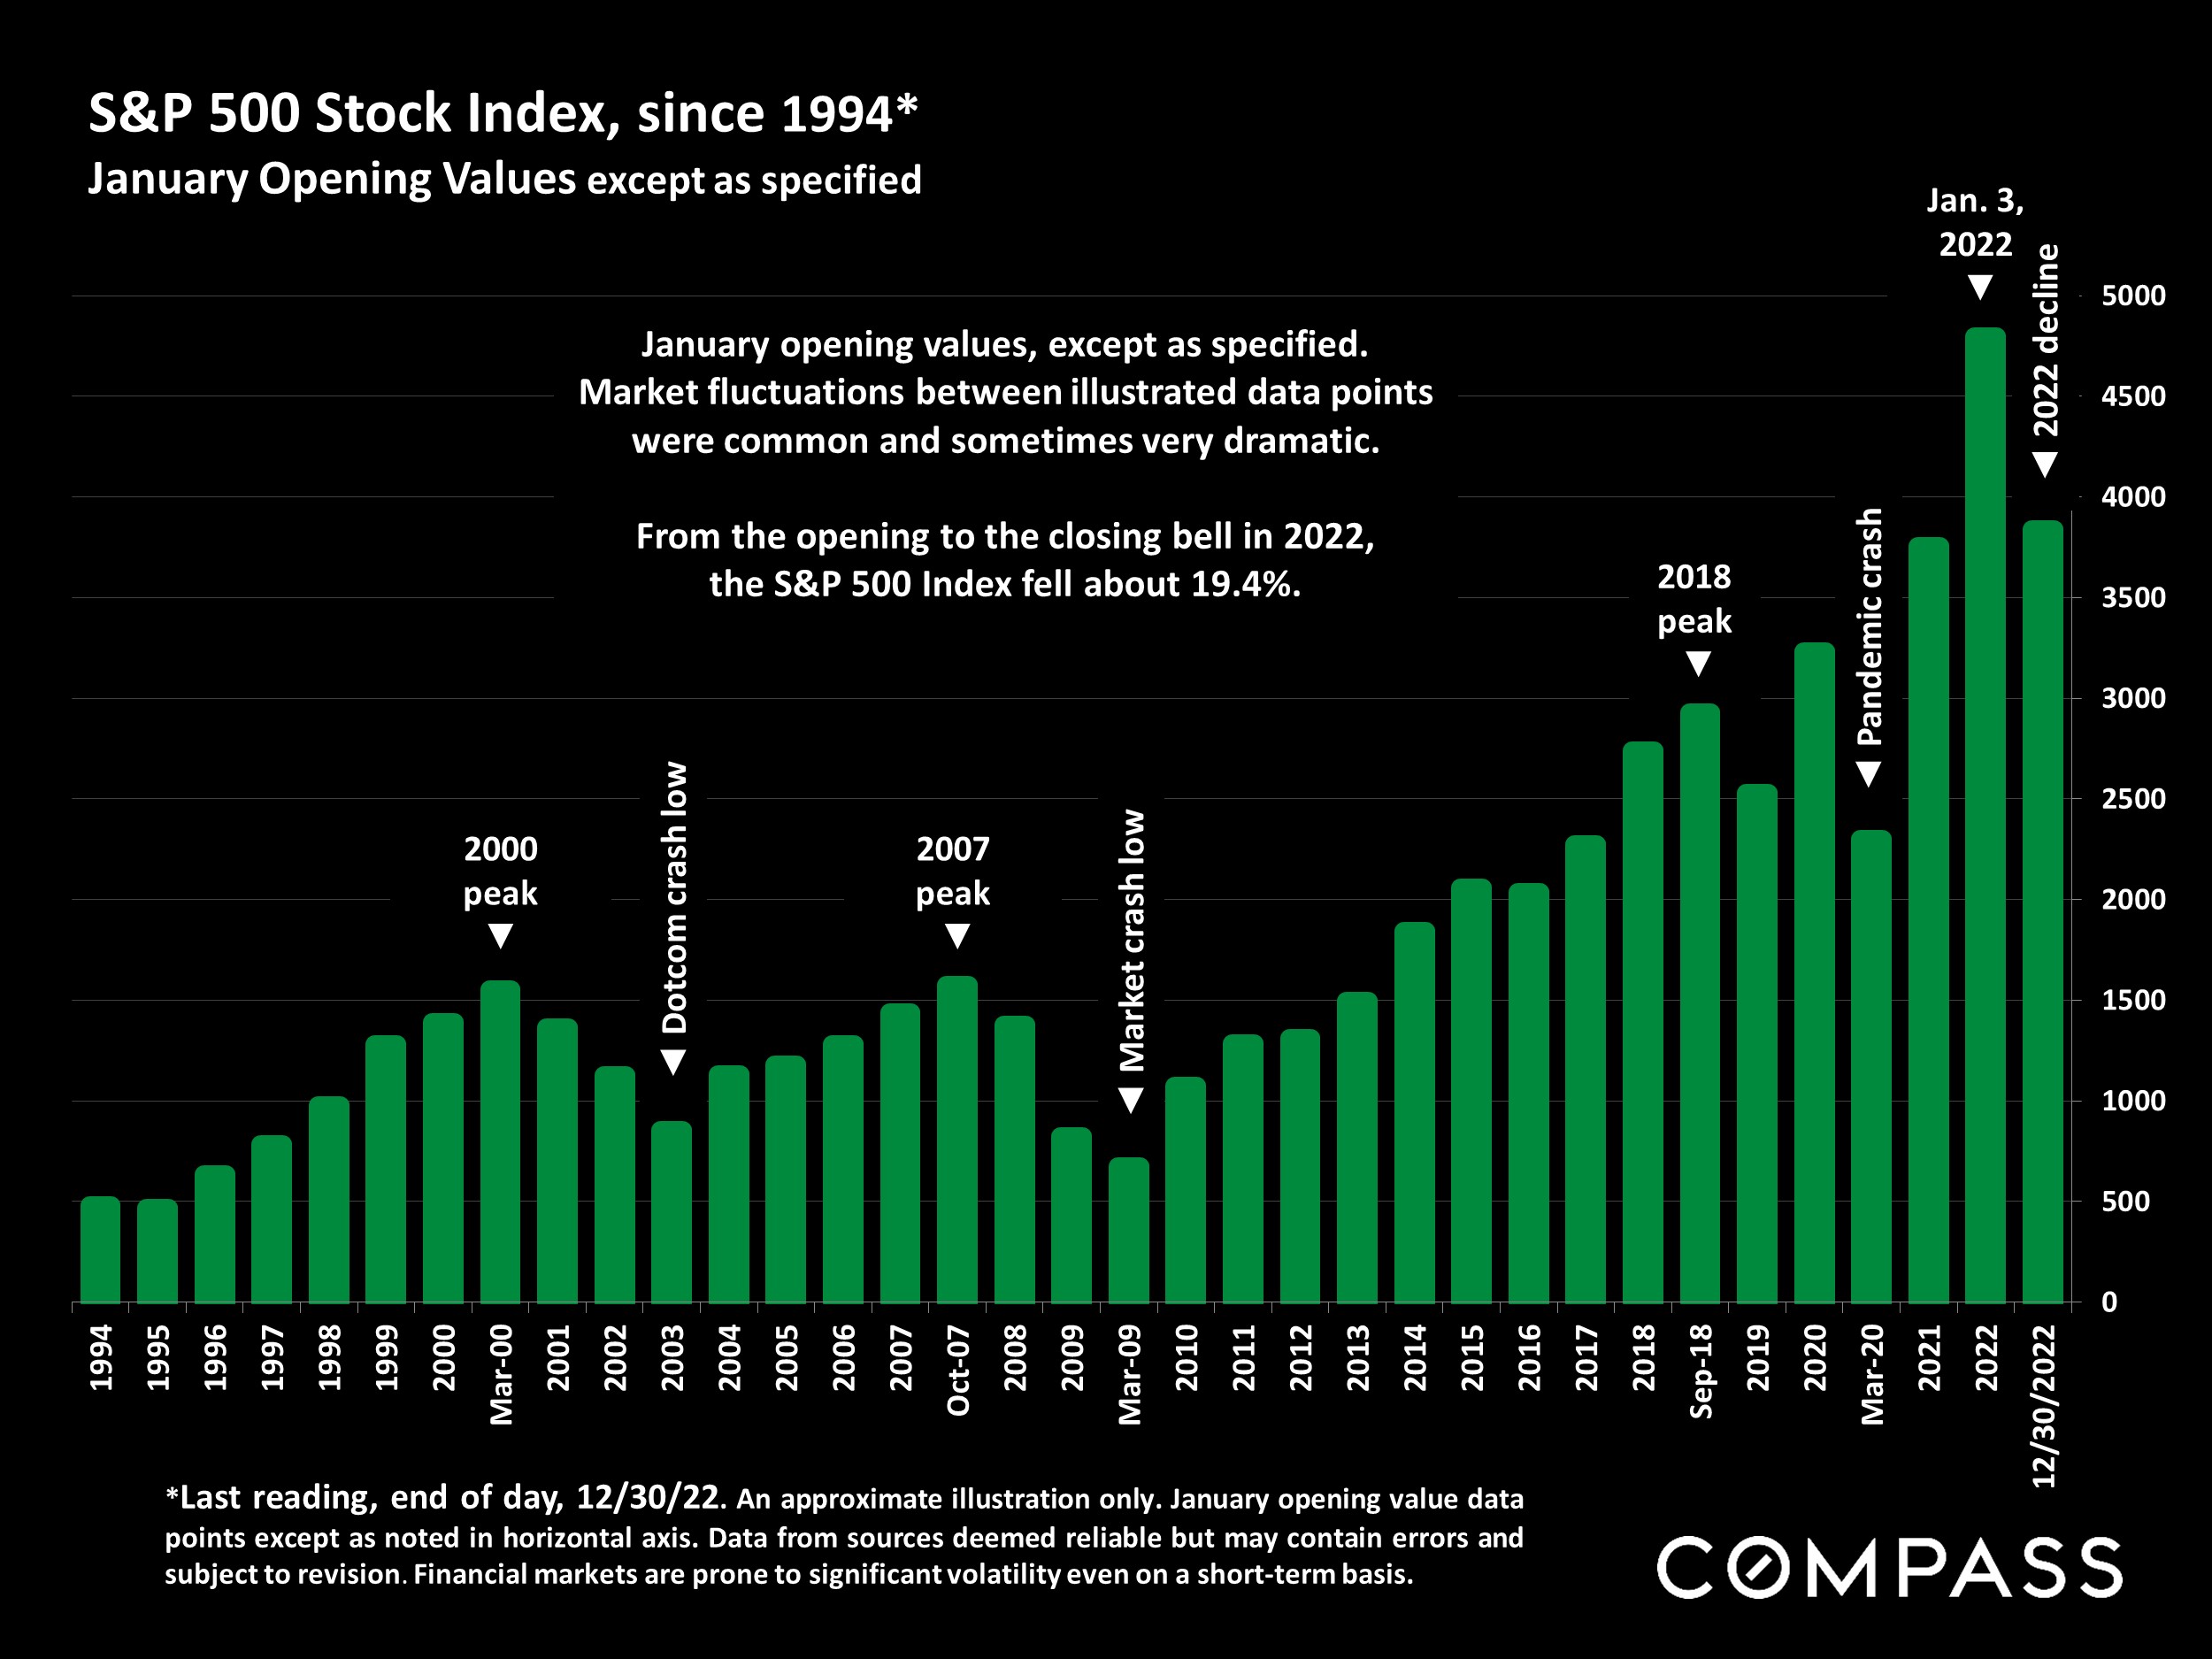
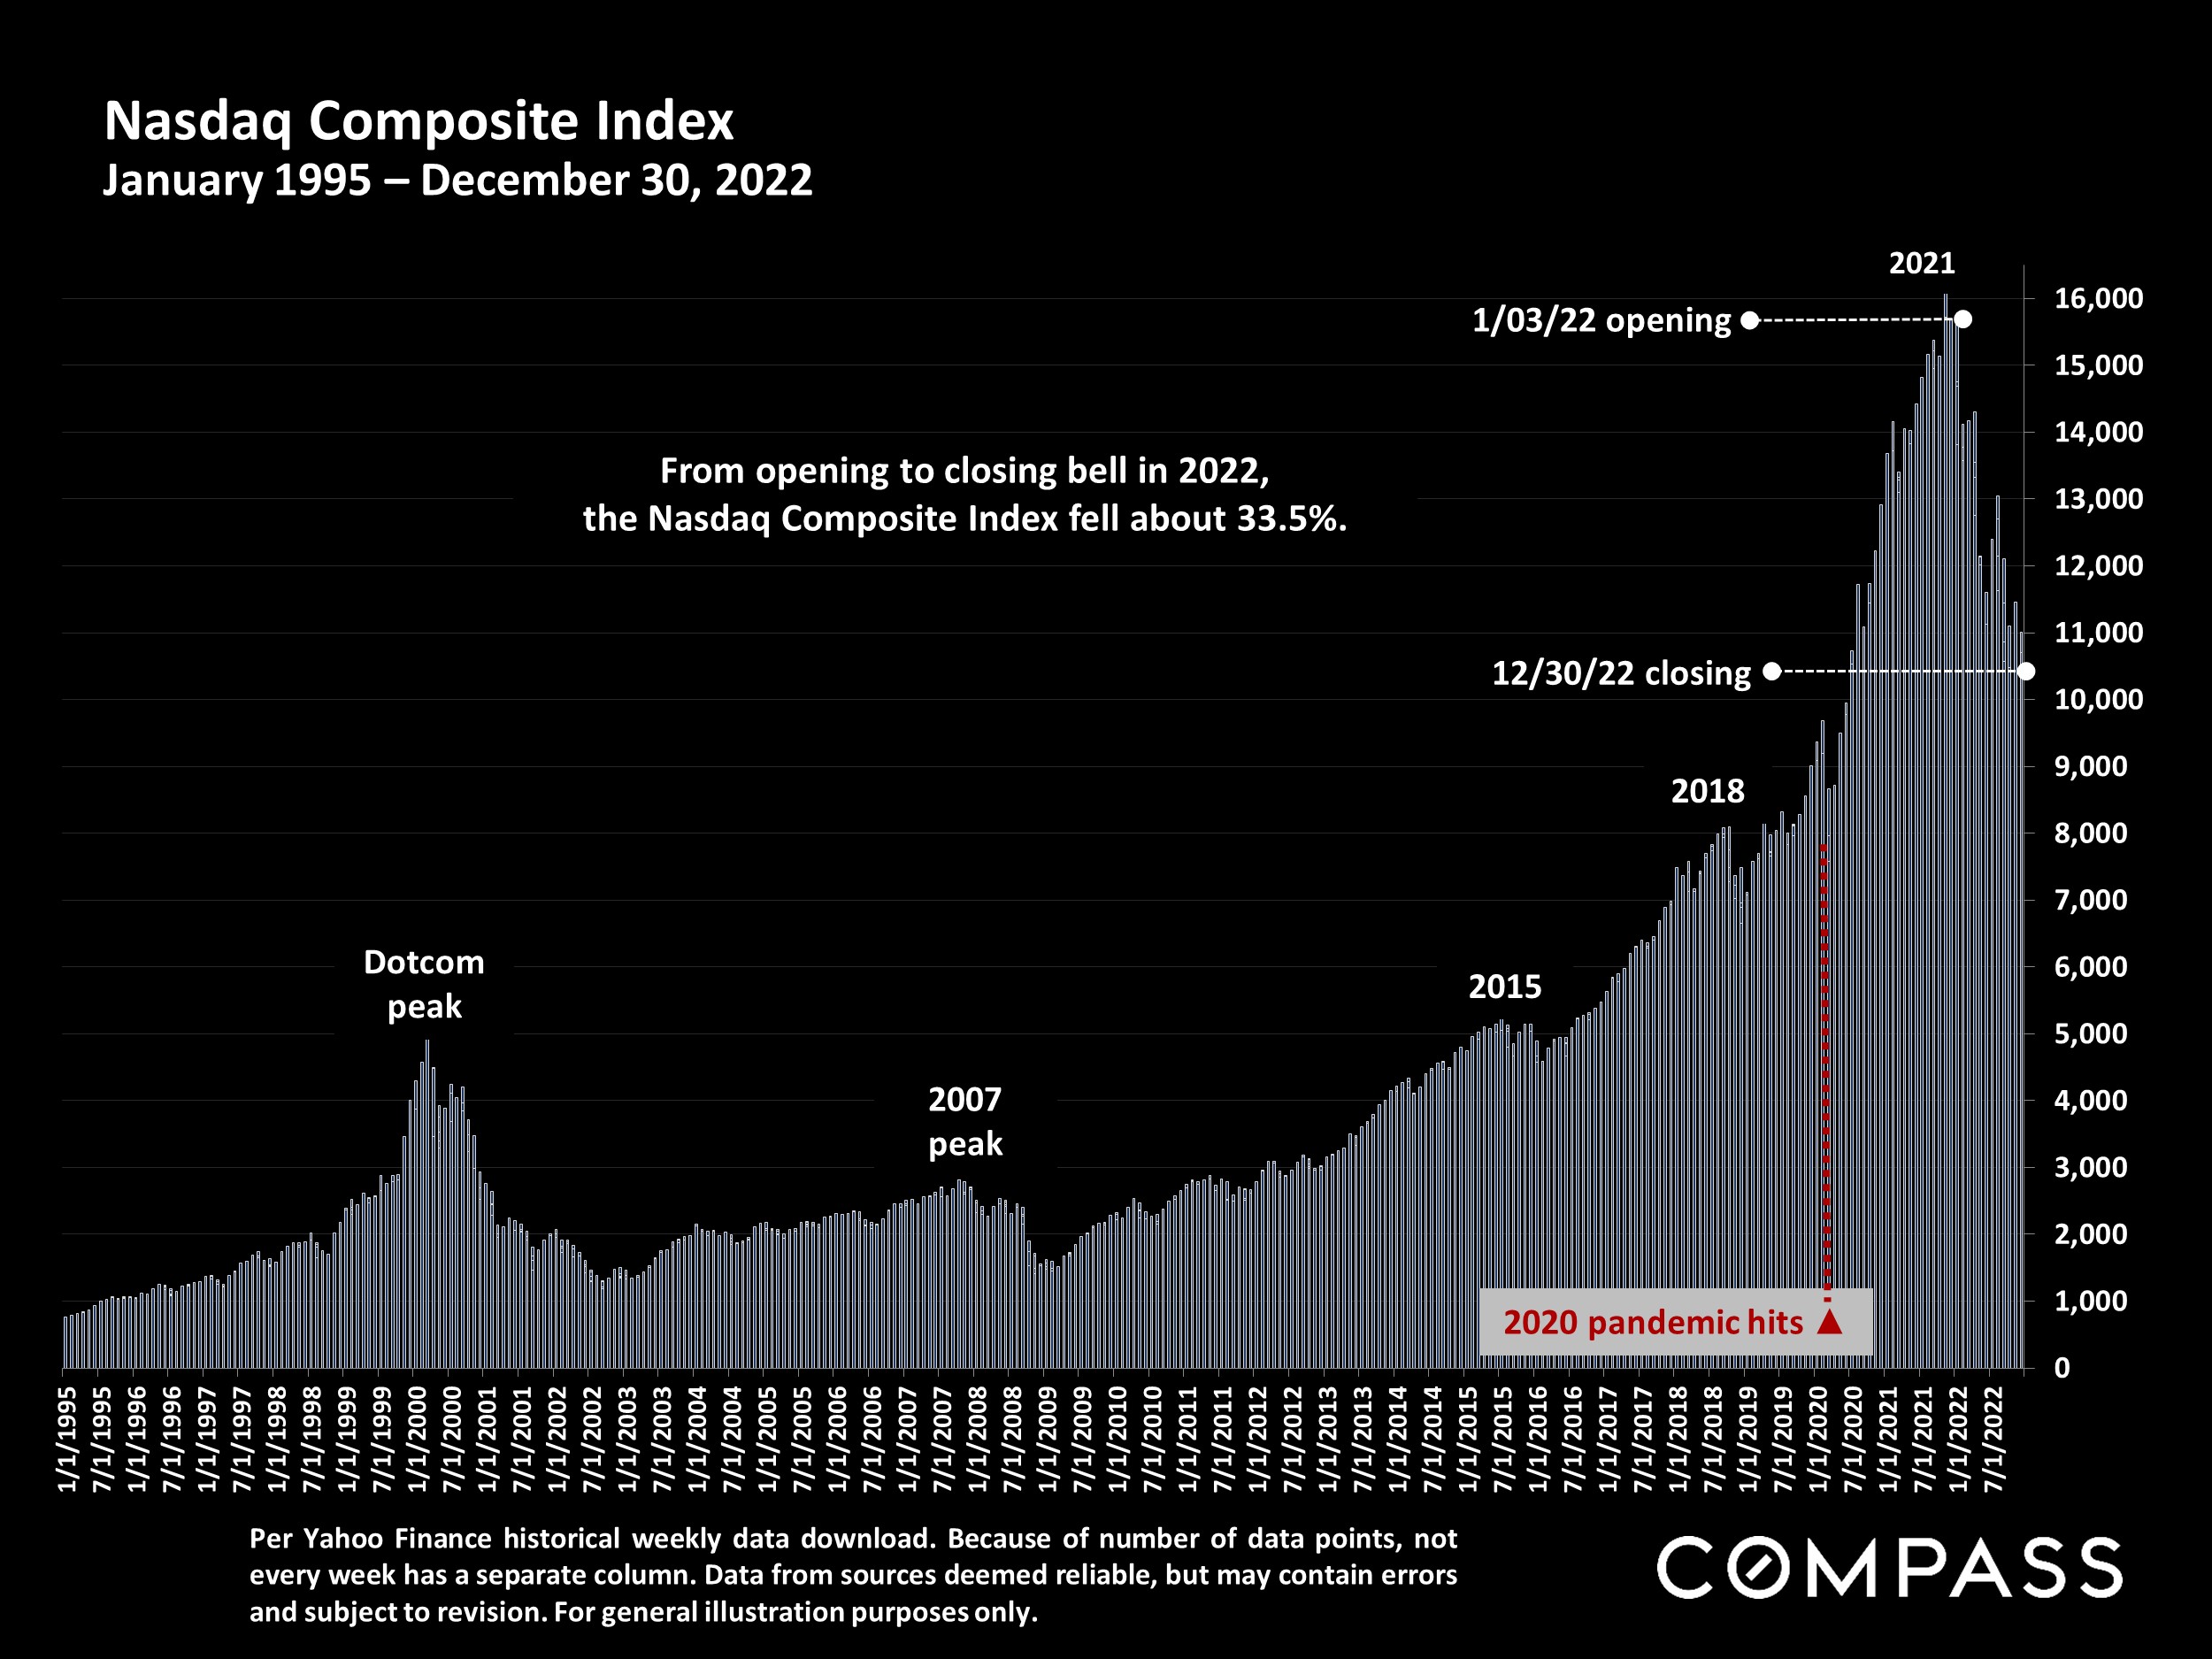
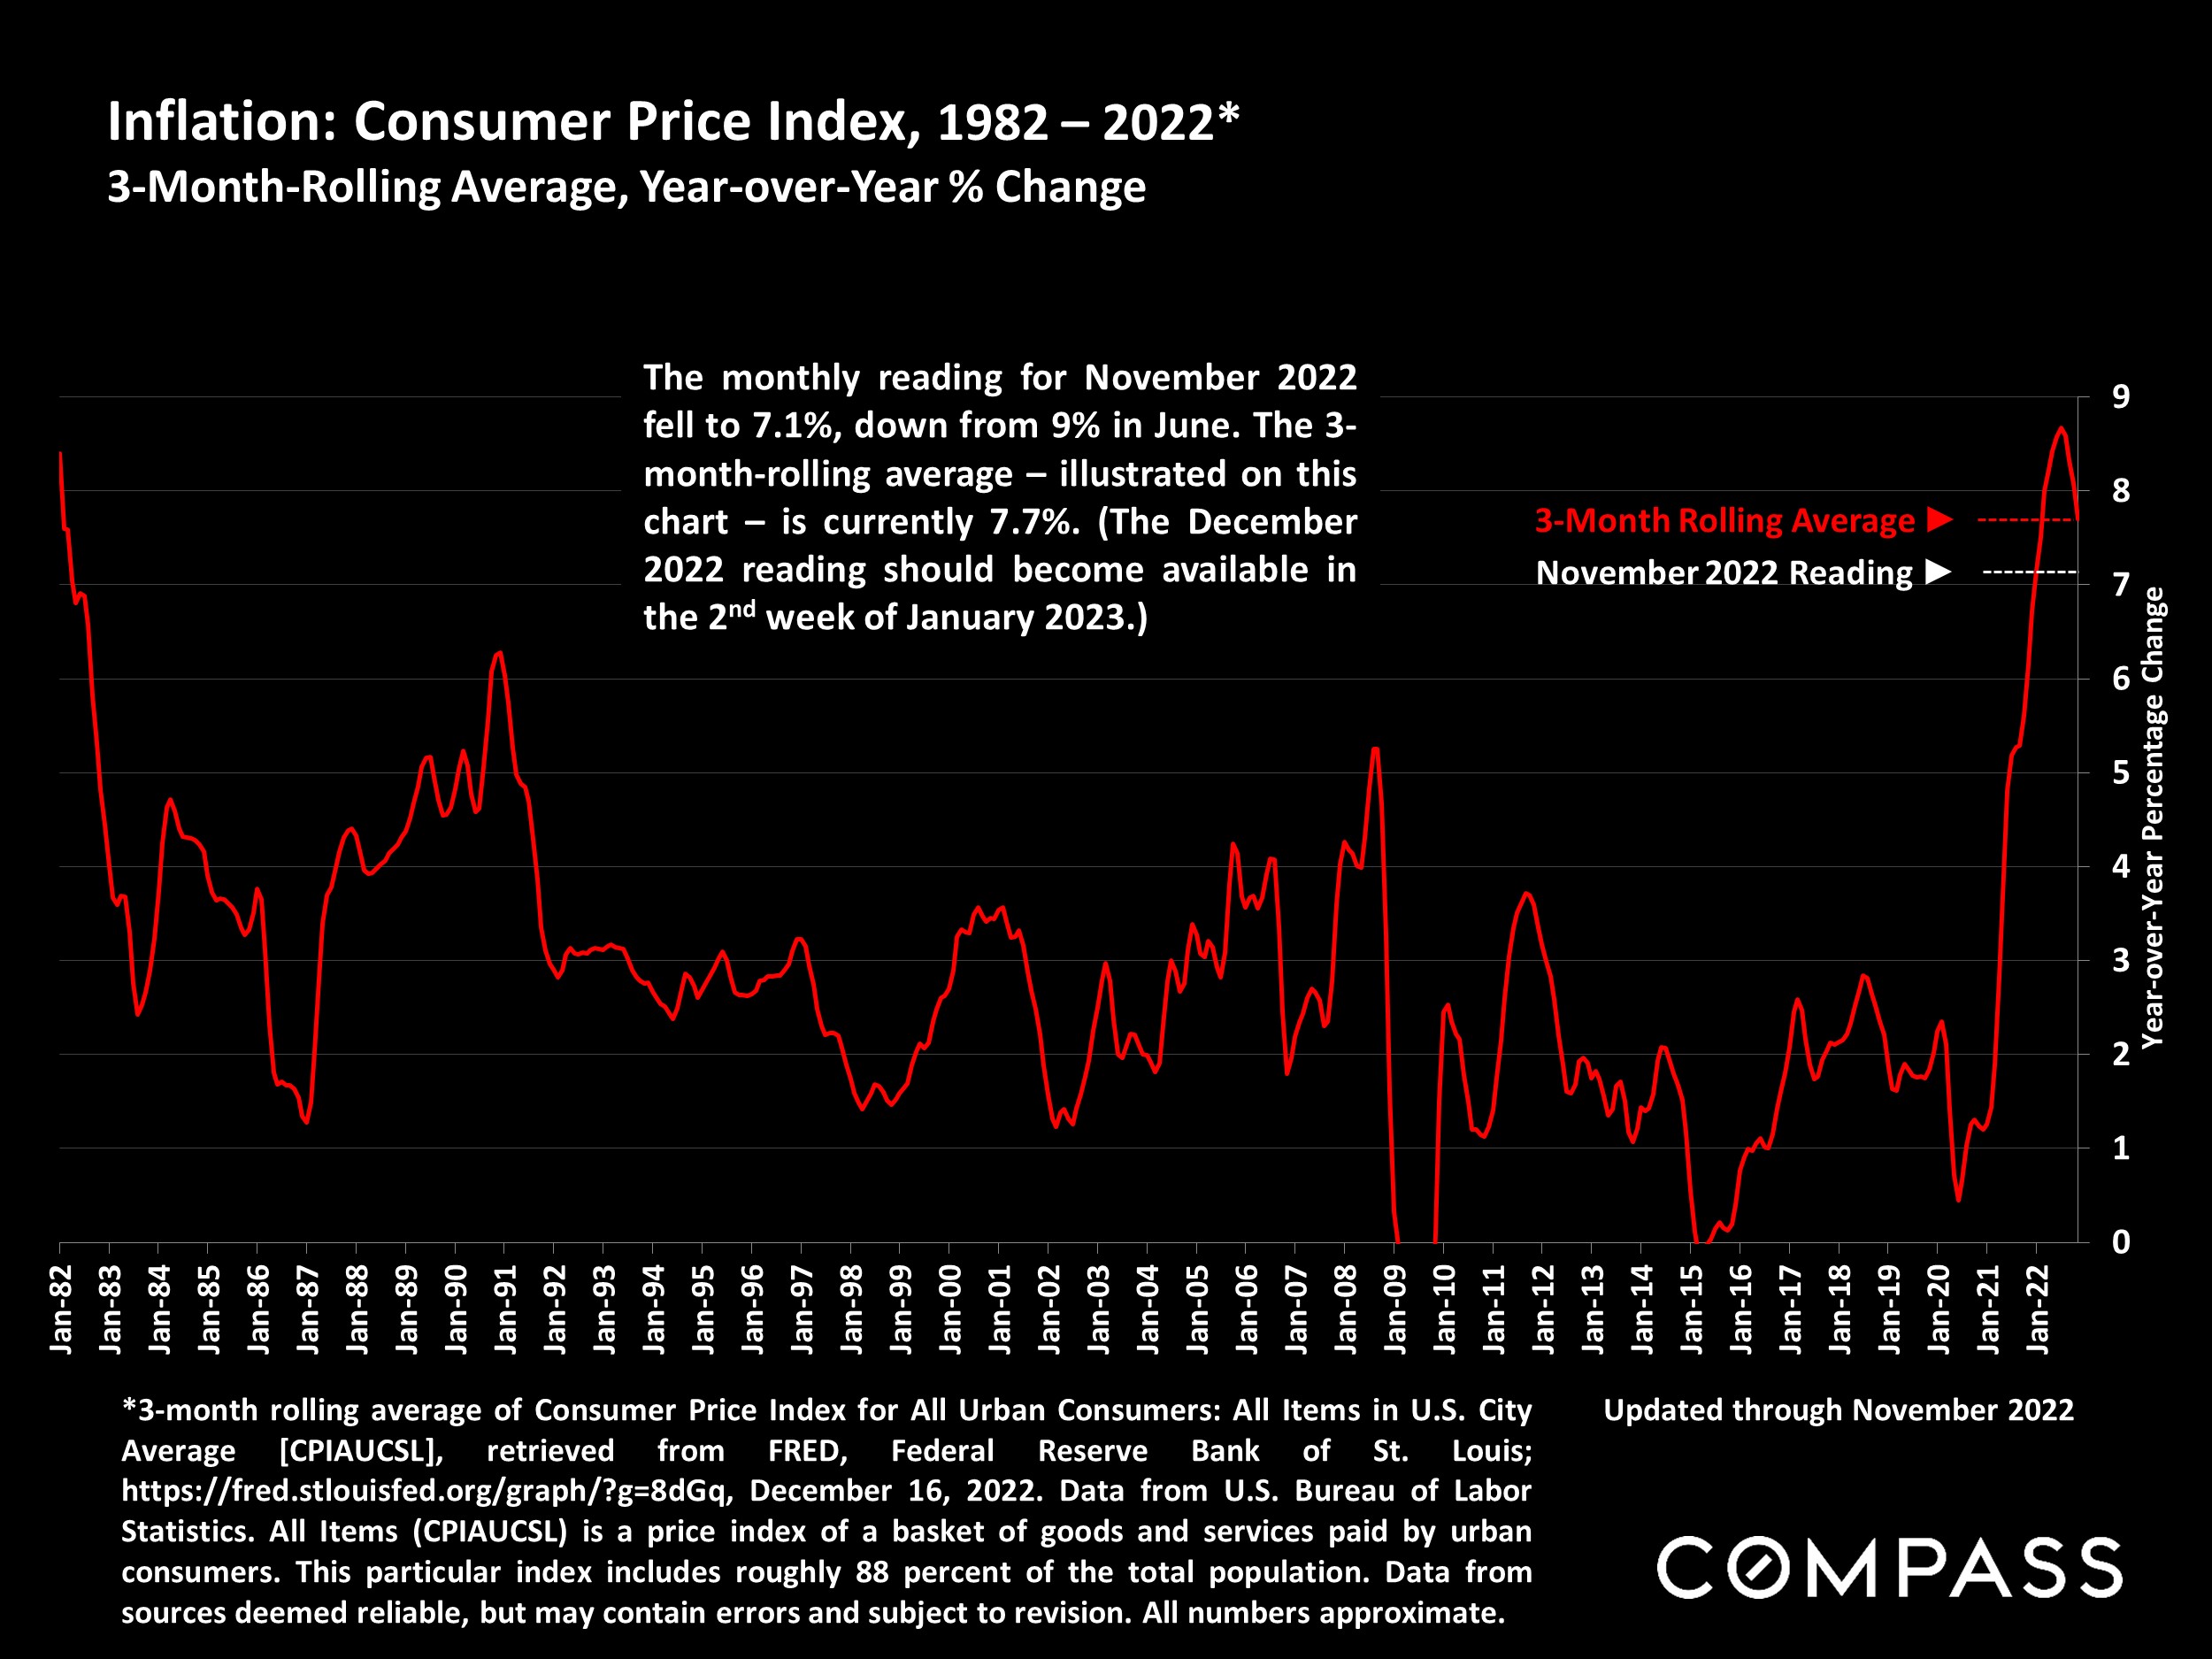
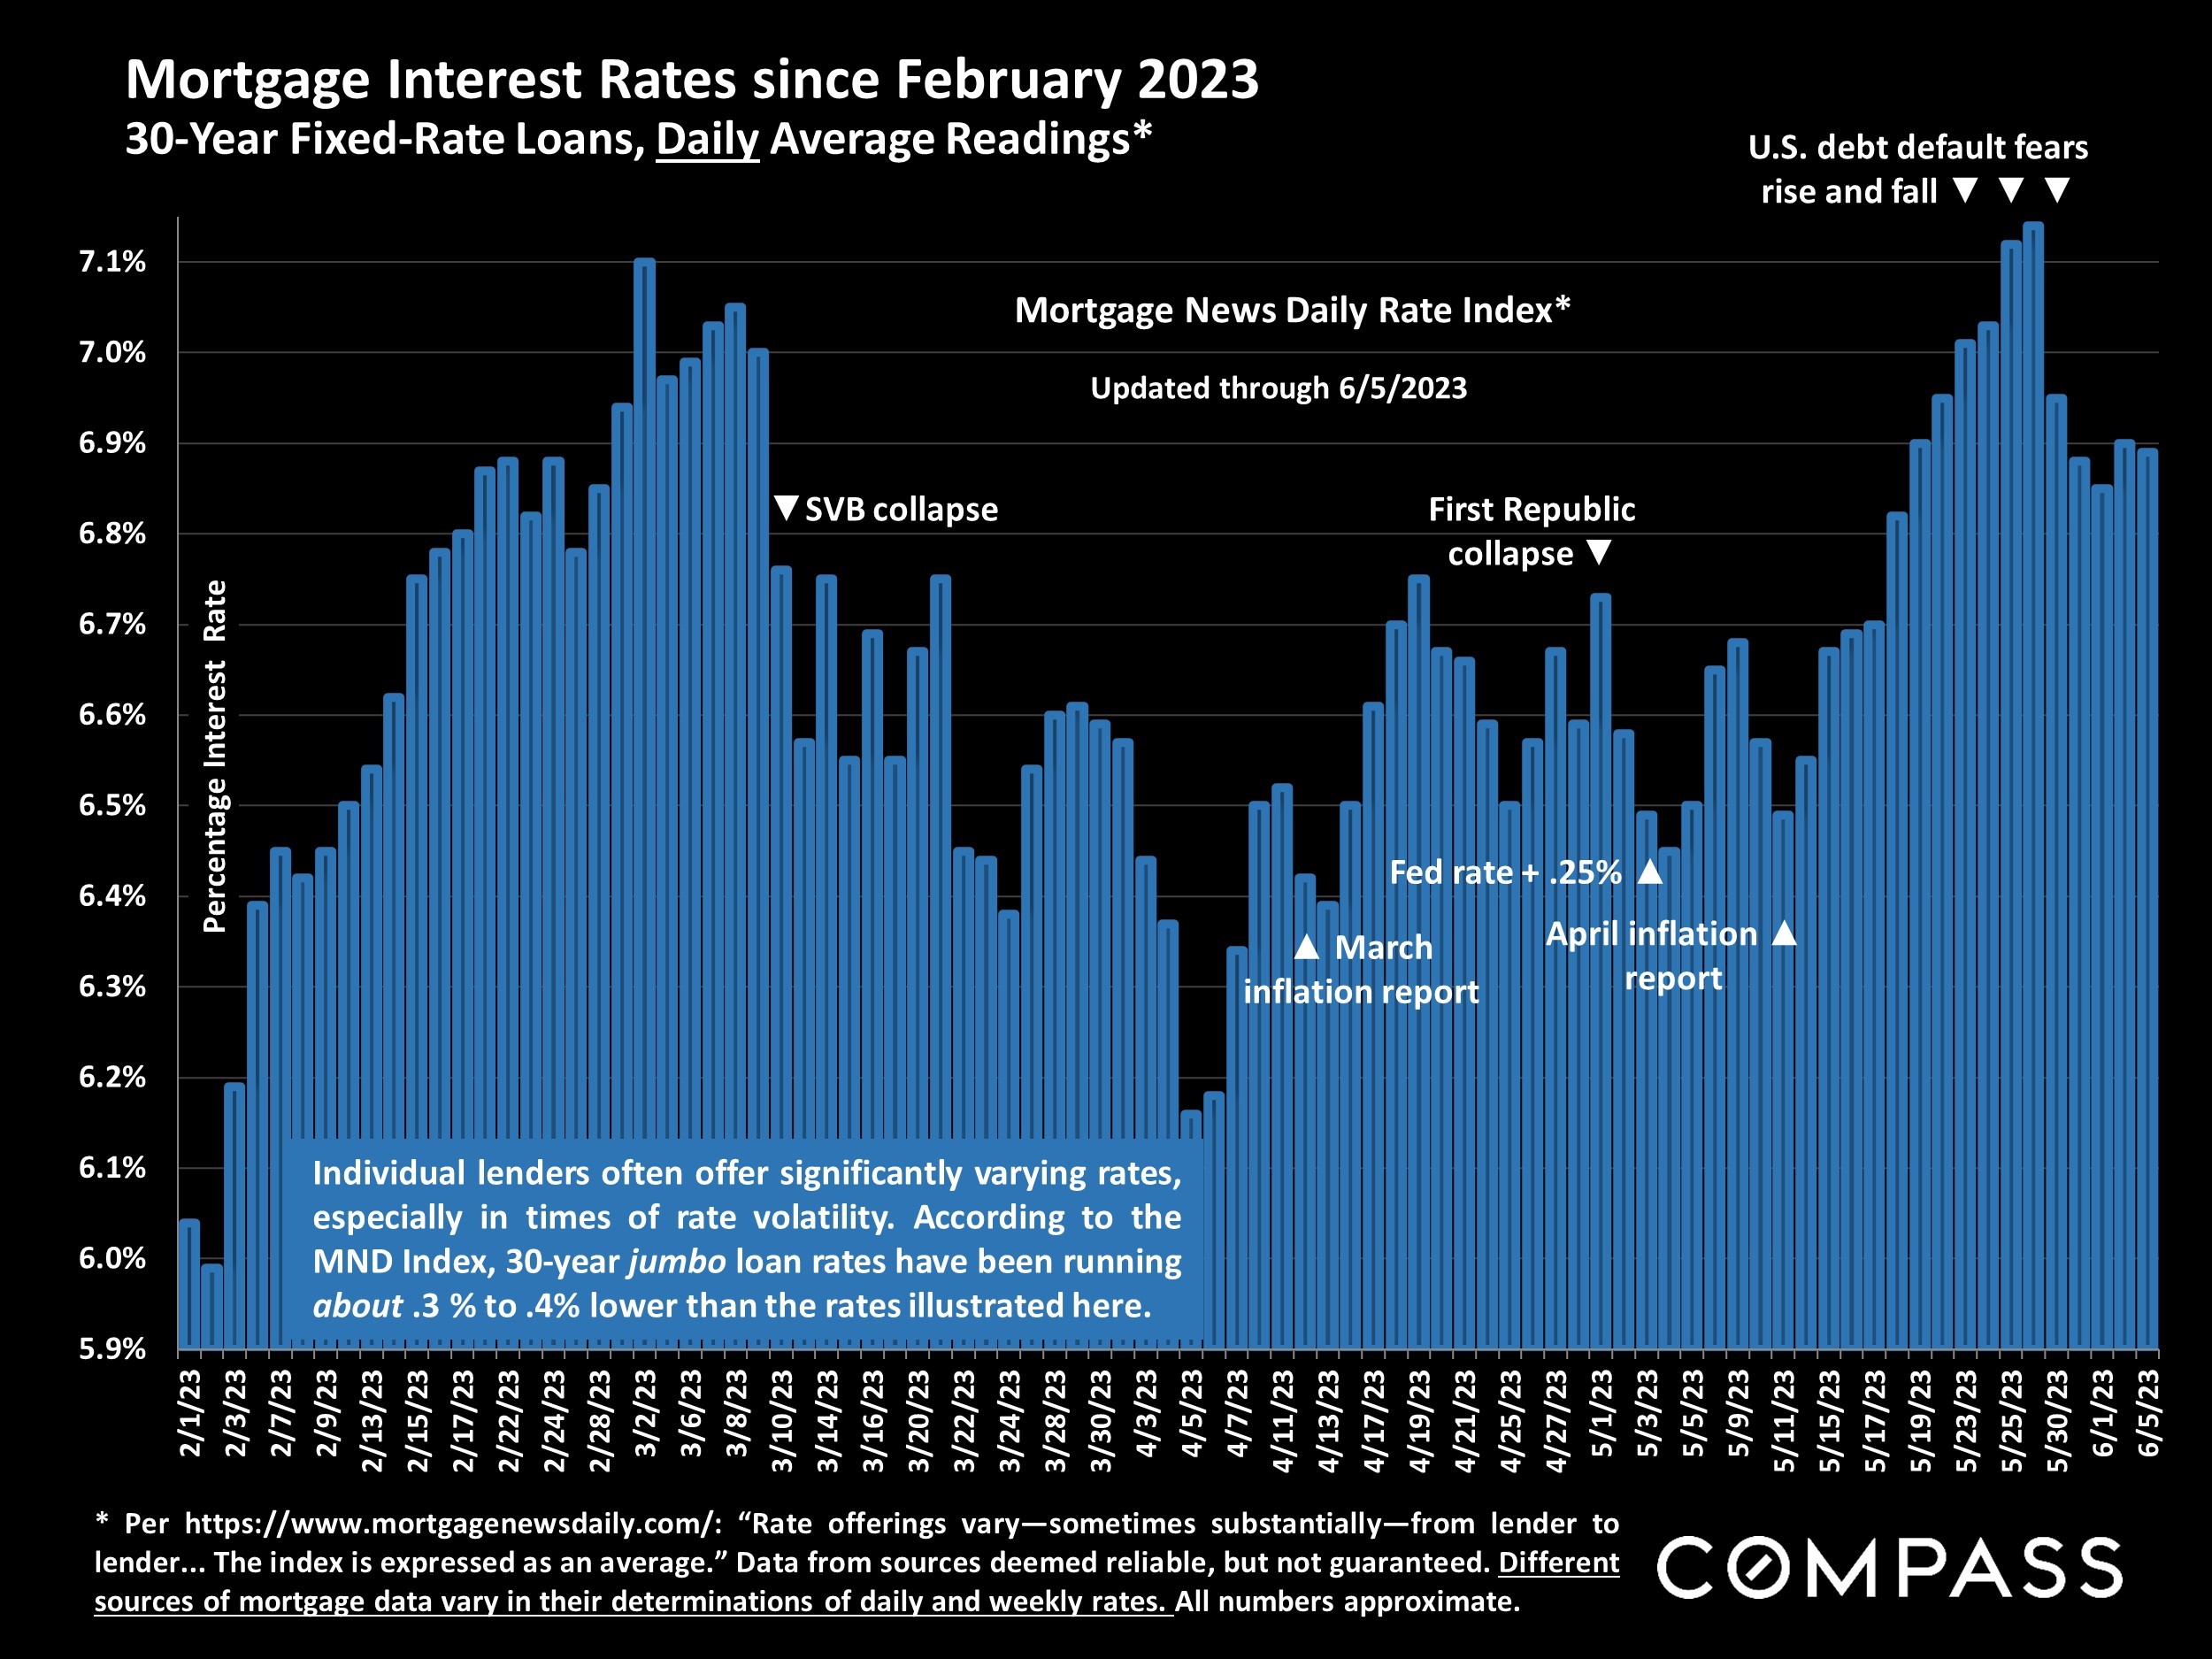
With bank crises, fed actions, inflation readings, and U.S. debt-default fears, interest rates have been volatile in 2023, with significant ups and downs. As of early June, 30-year, fixed-rate mortgages are running about a quarter percent below 7% (but rates can change quickly).
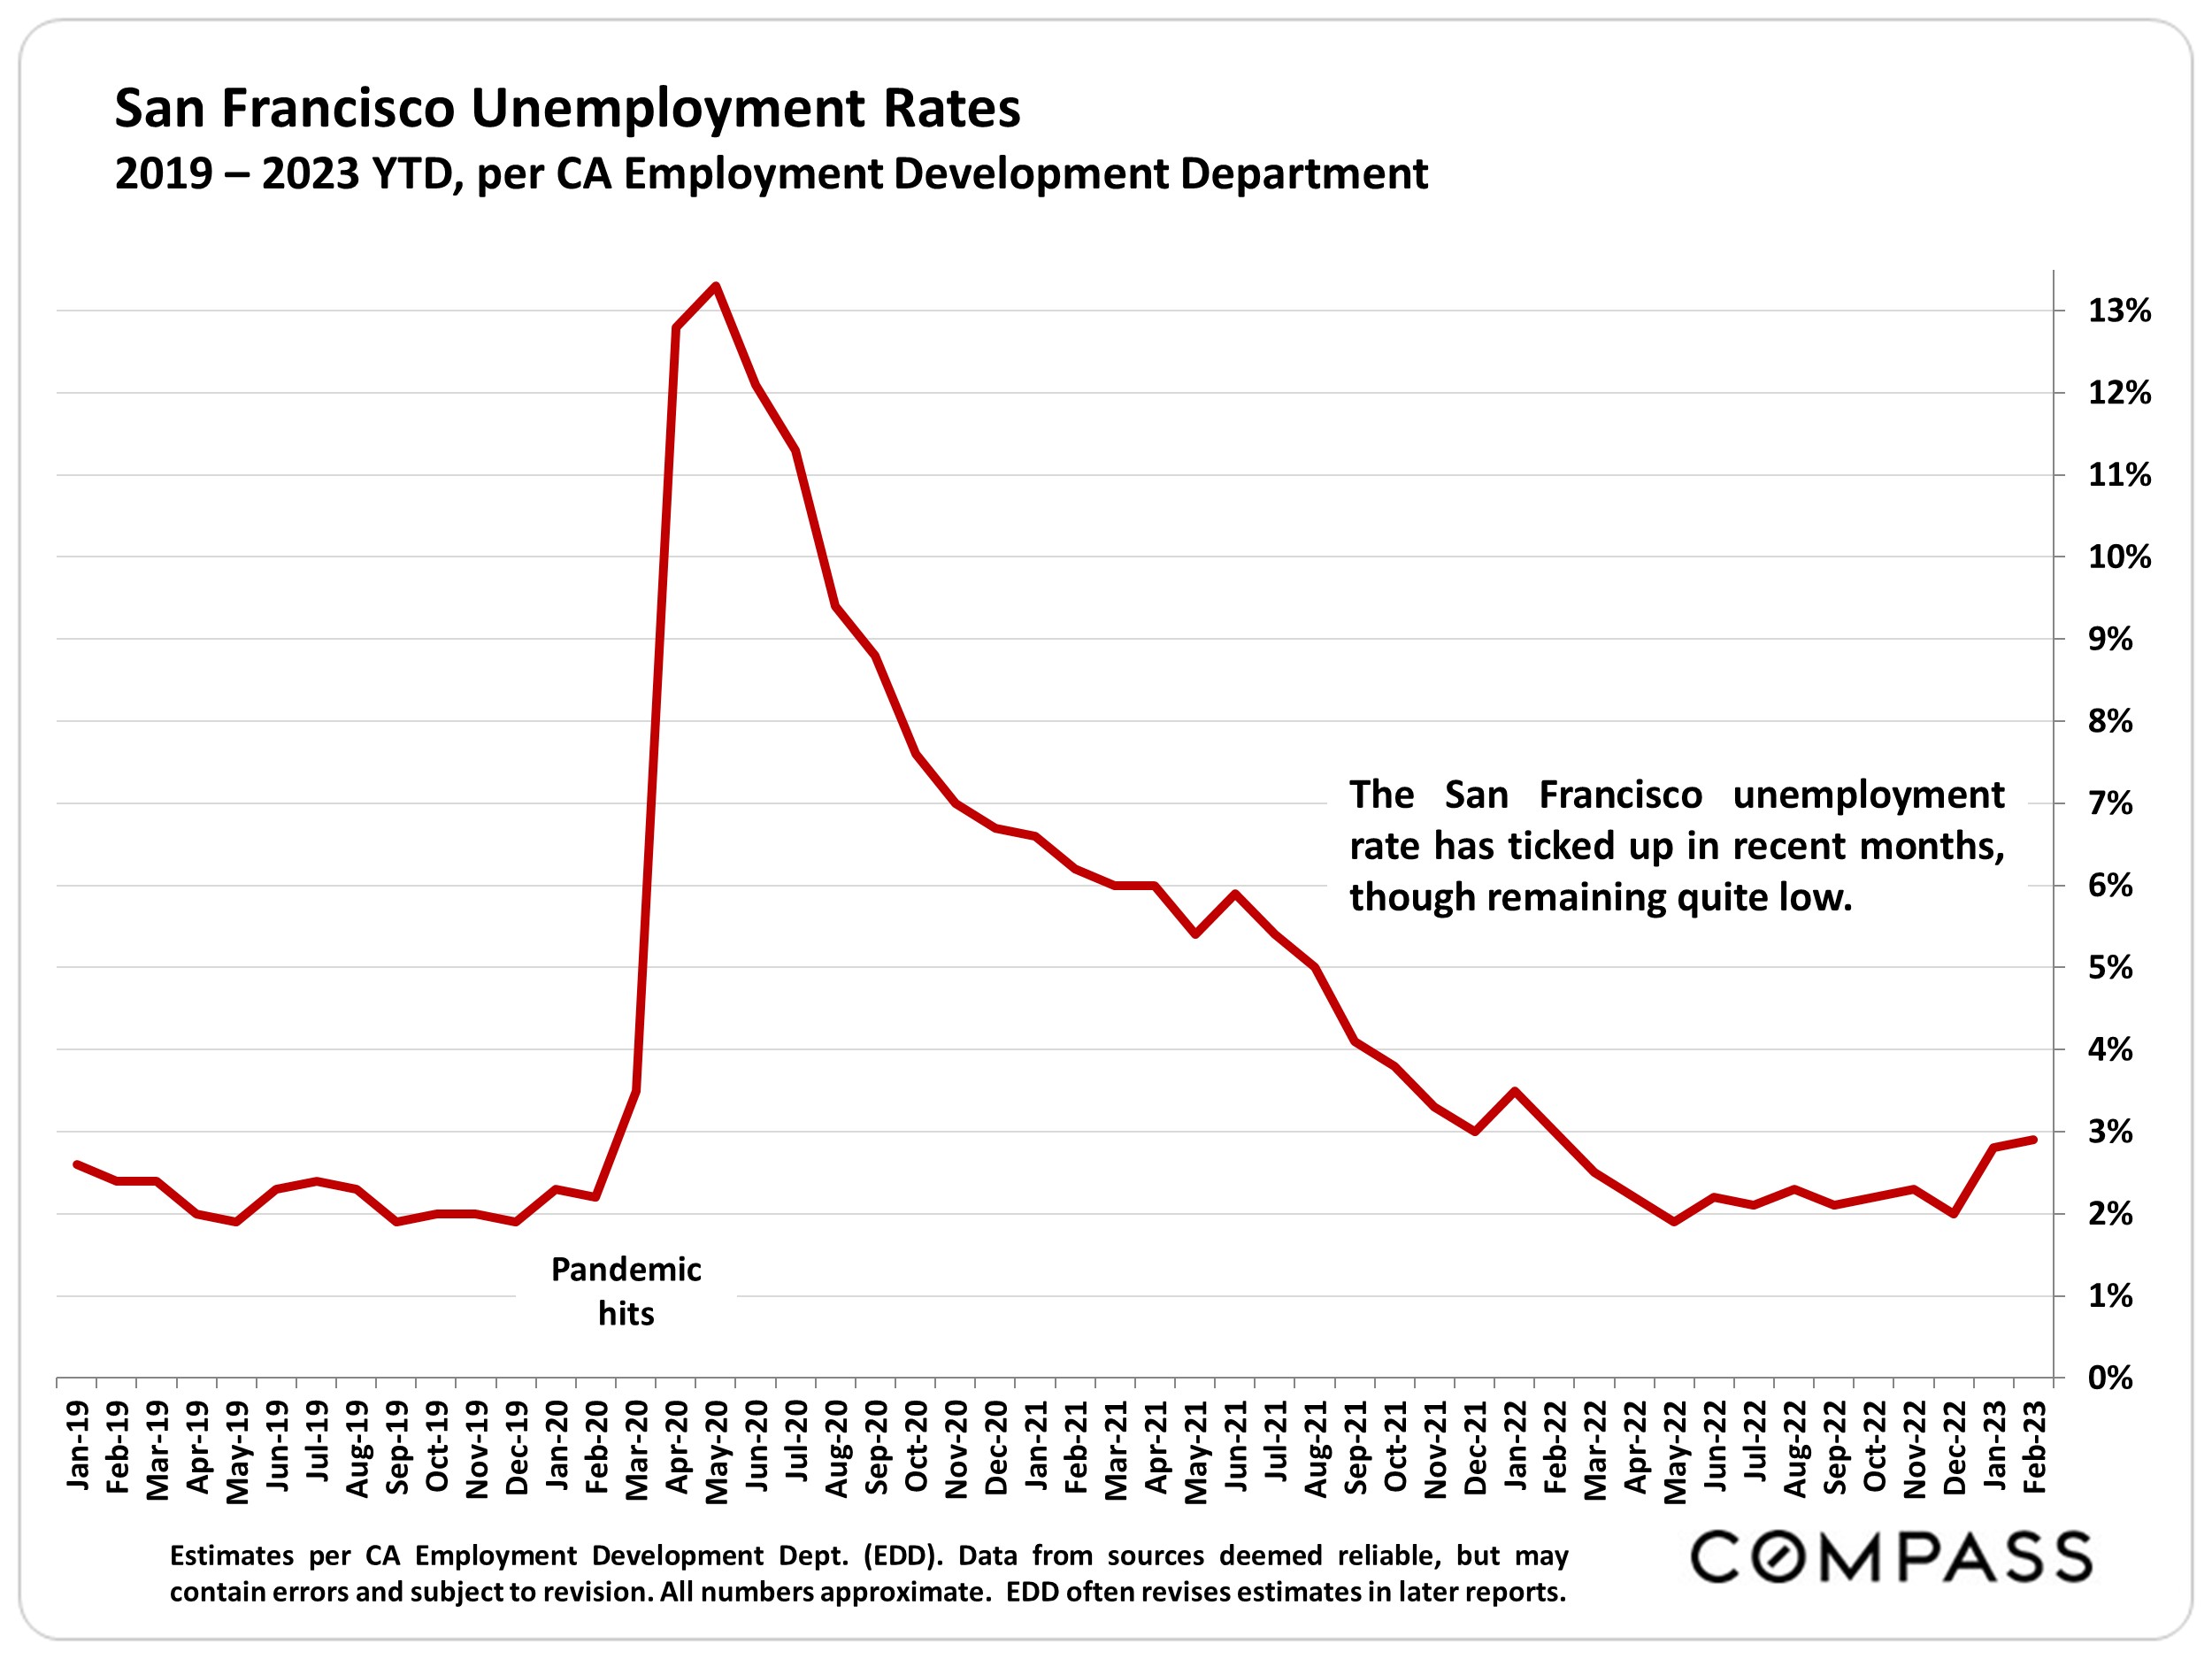
The 1st and 4th largest insurers of CA homes, State Farm and Allstate, have announced they will no longer write new policies in the state due to rising claims costs. It is too early to quantify the exact financial, political and market effects of their actions, or if other insurers will follow suit. Similar issues have come up in other states, such as Florida and Louisiana, and occurred with earthquake insurance in CA in the mid-1990’s, leading to the creation of CA Earthquake Authority.
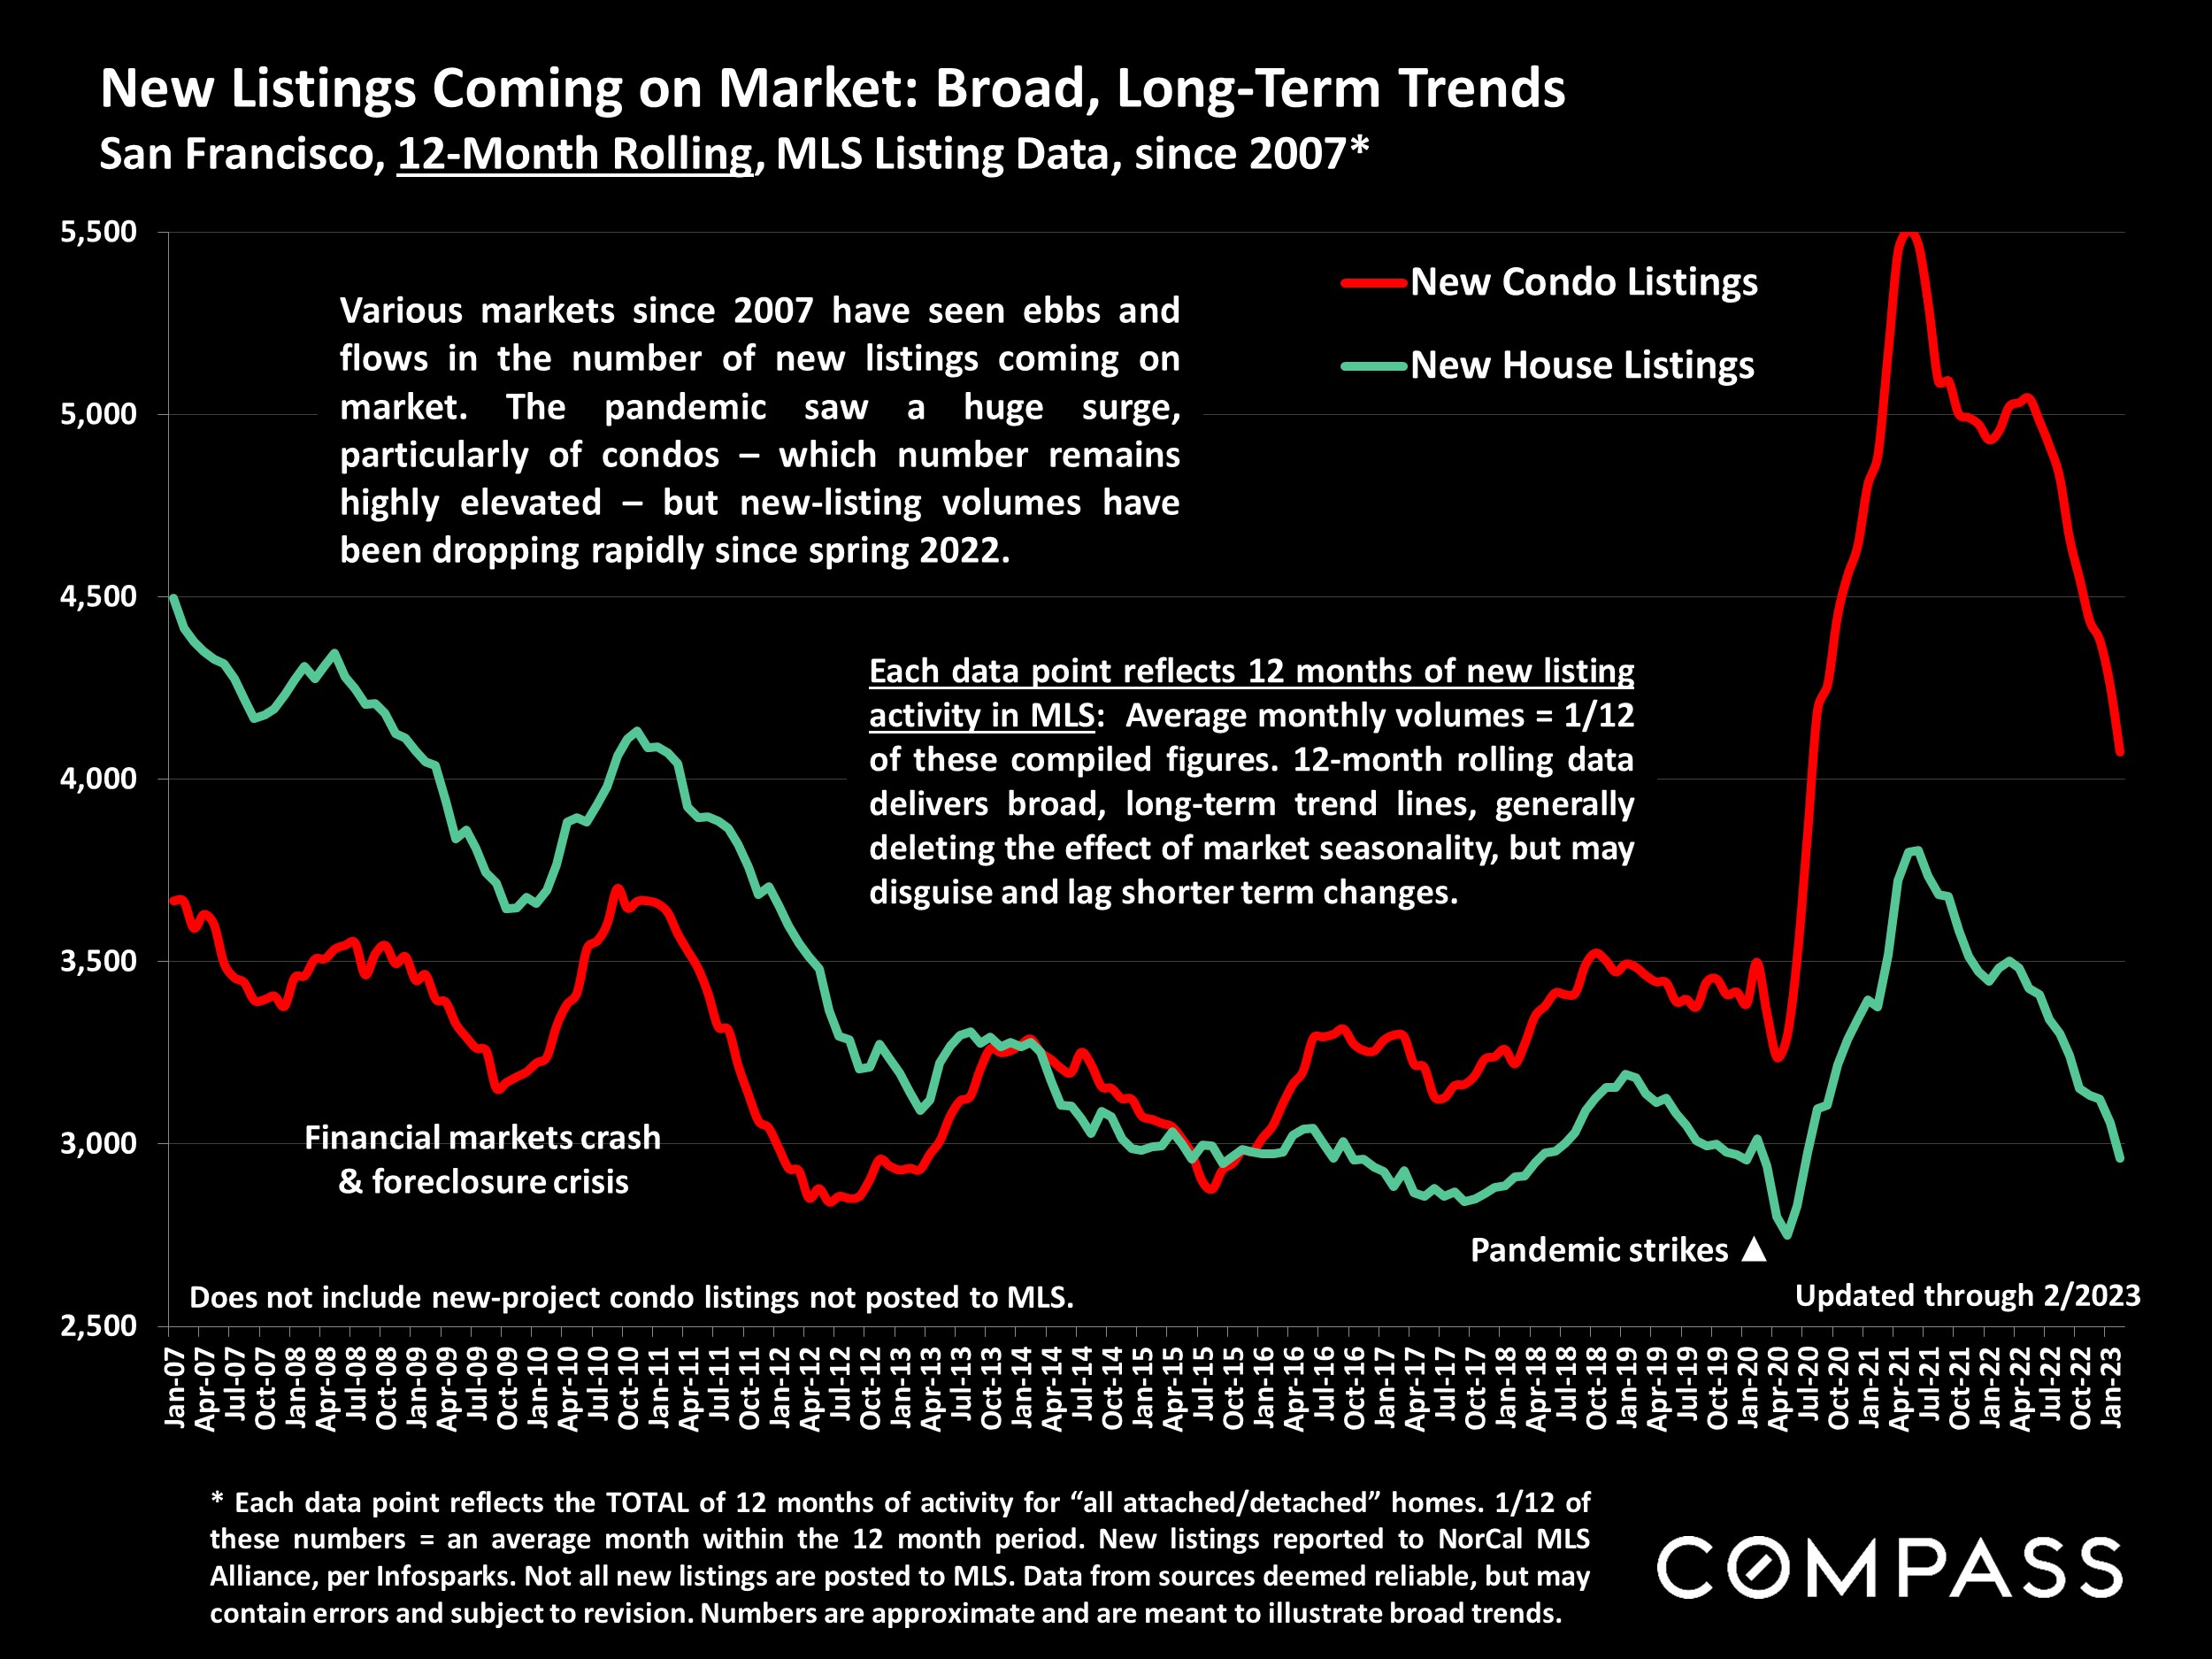
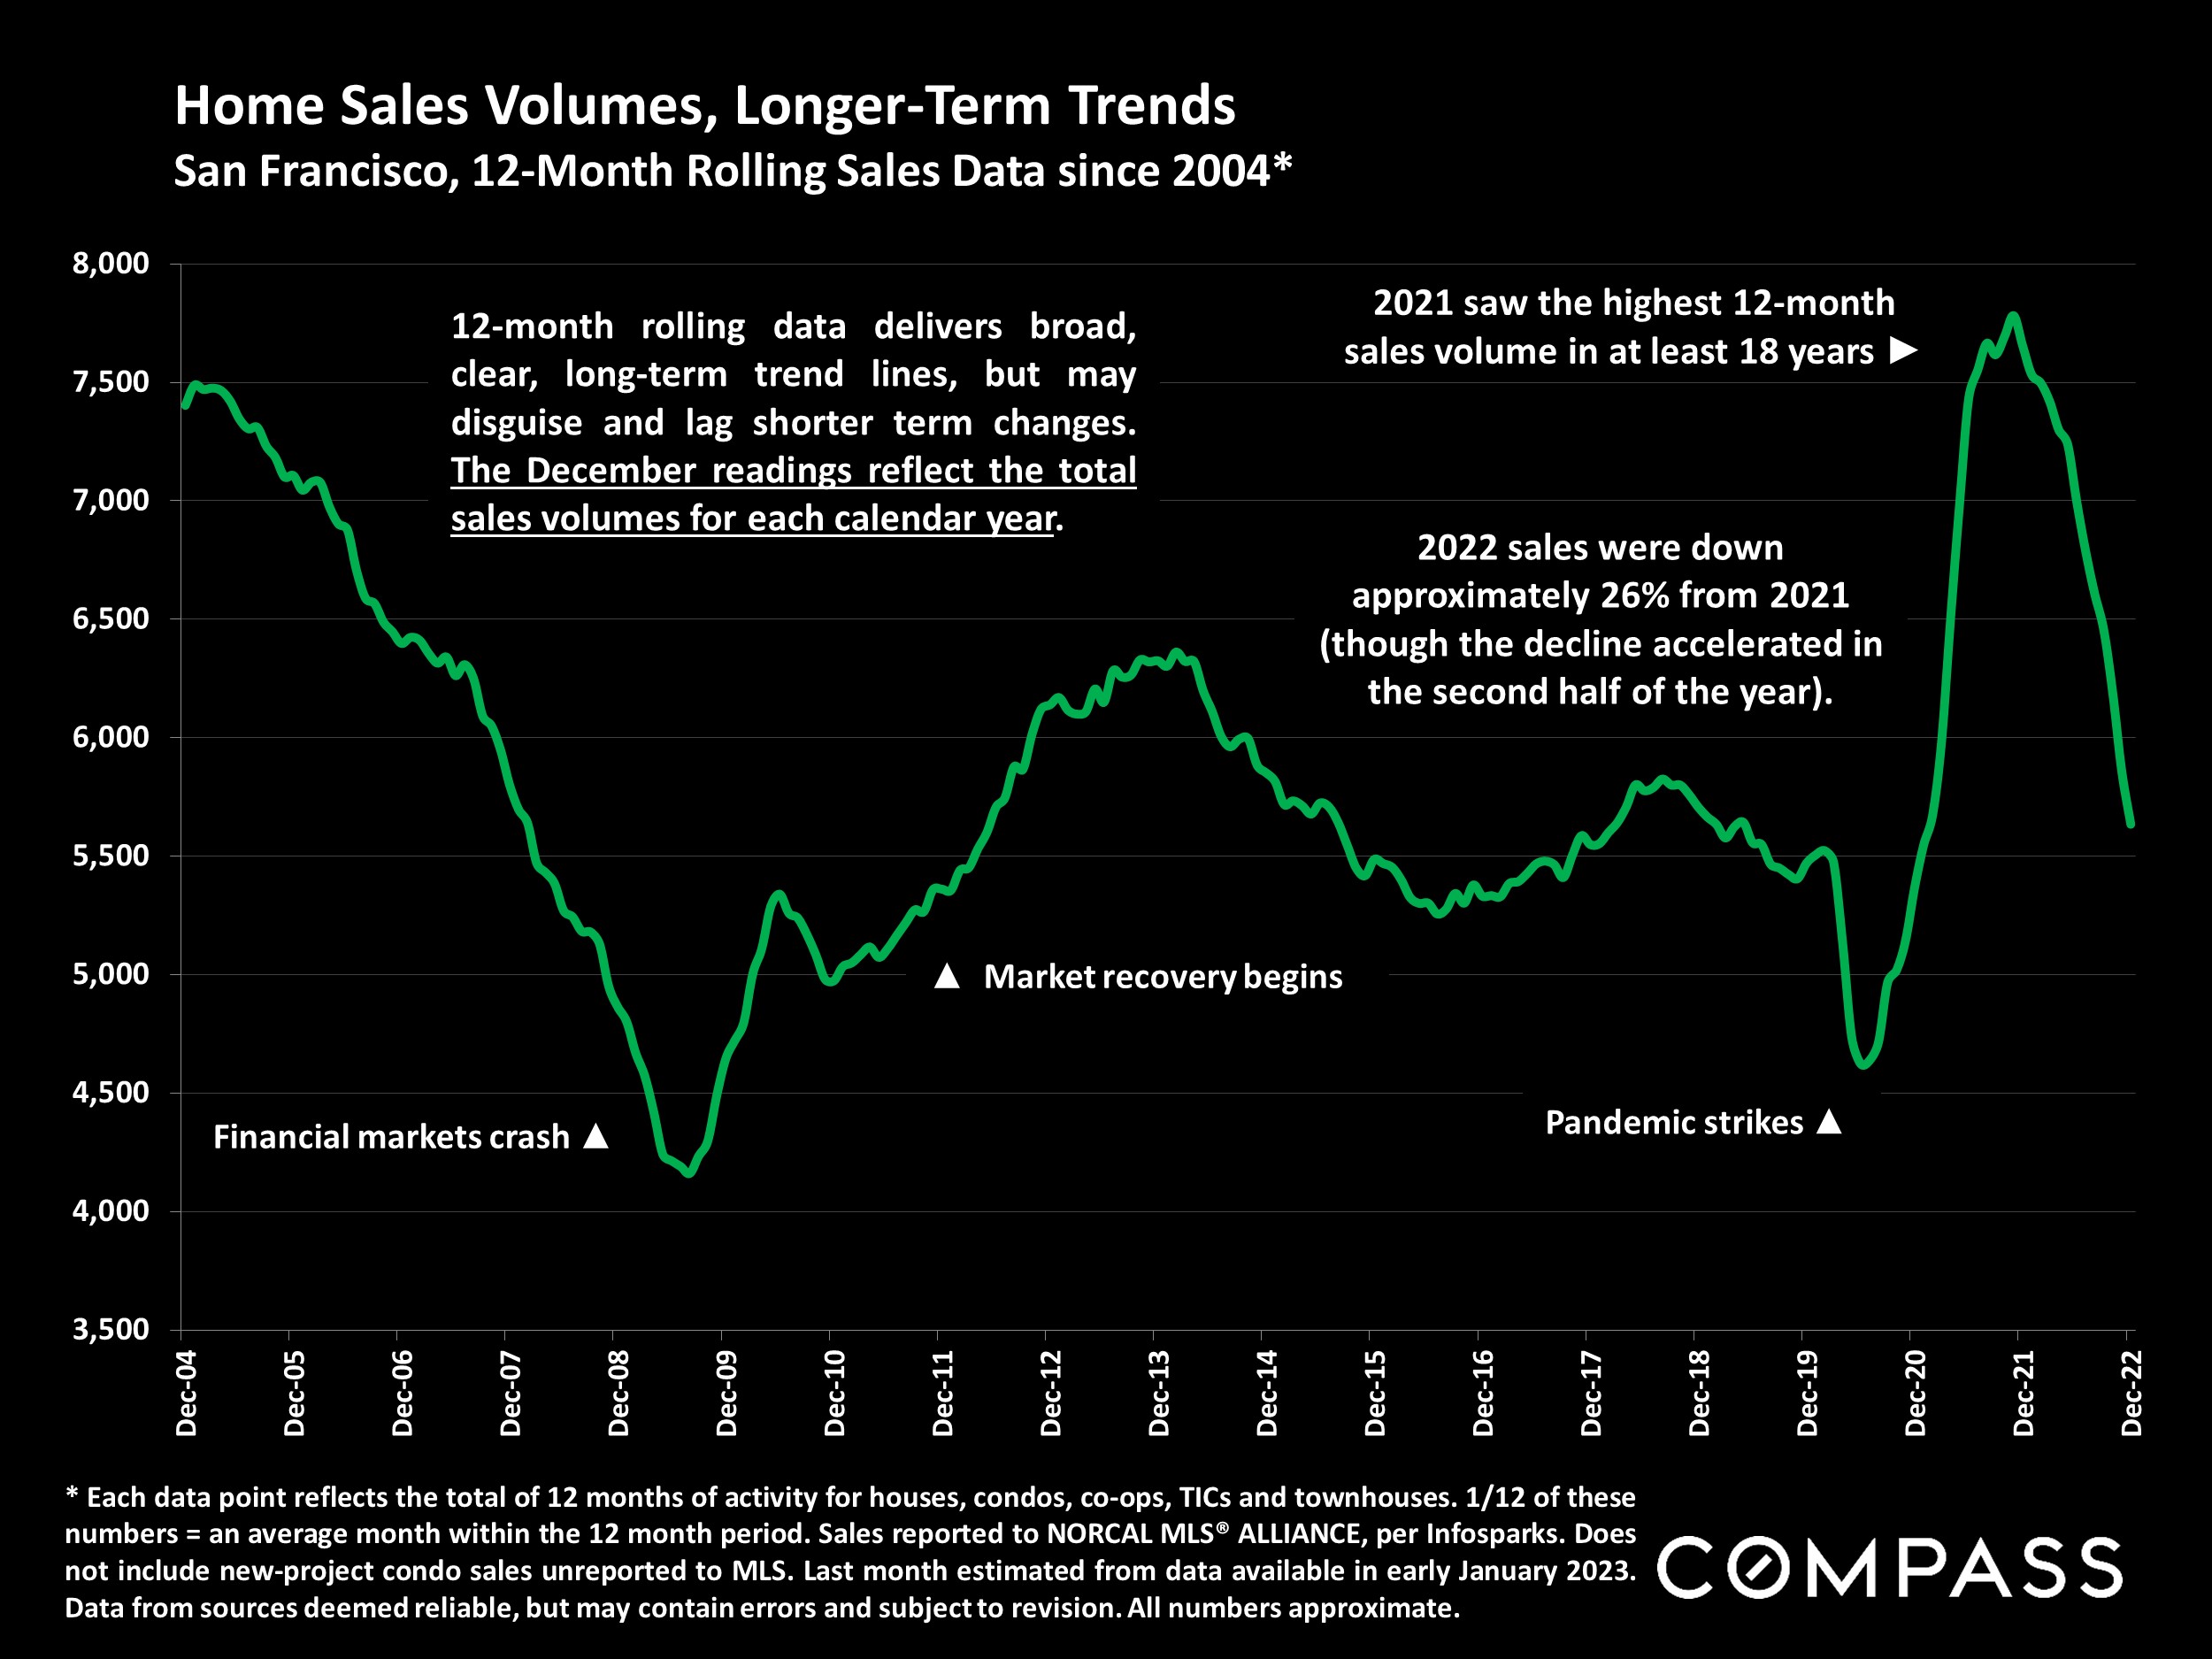
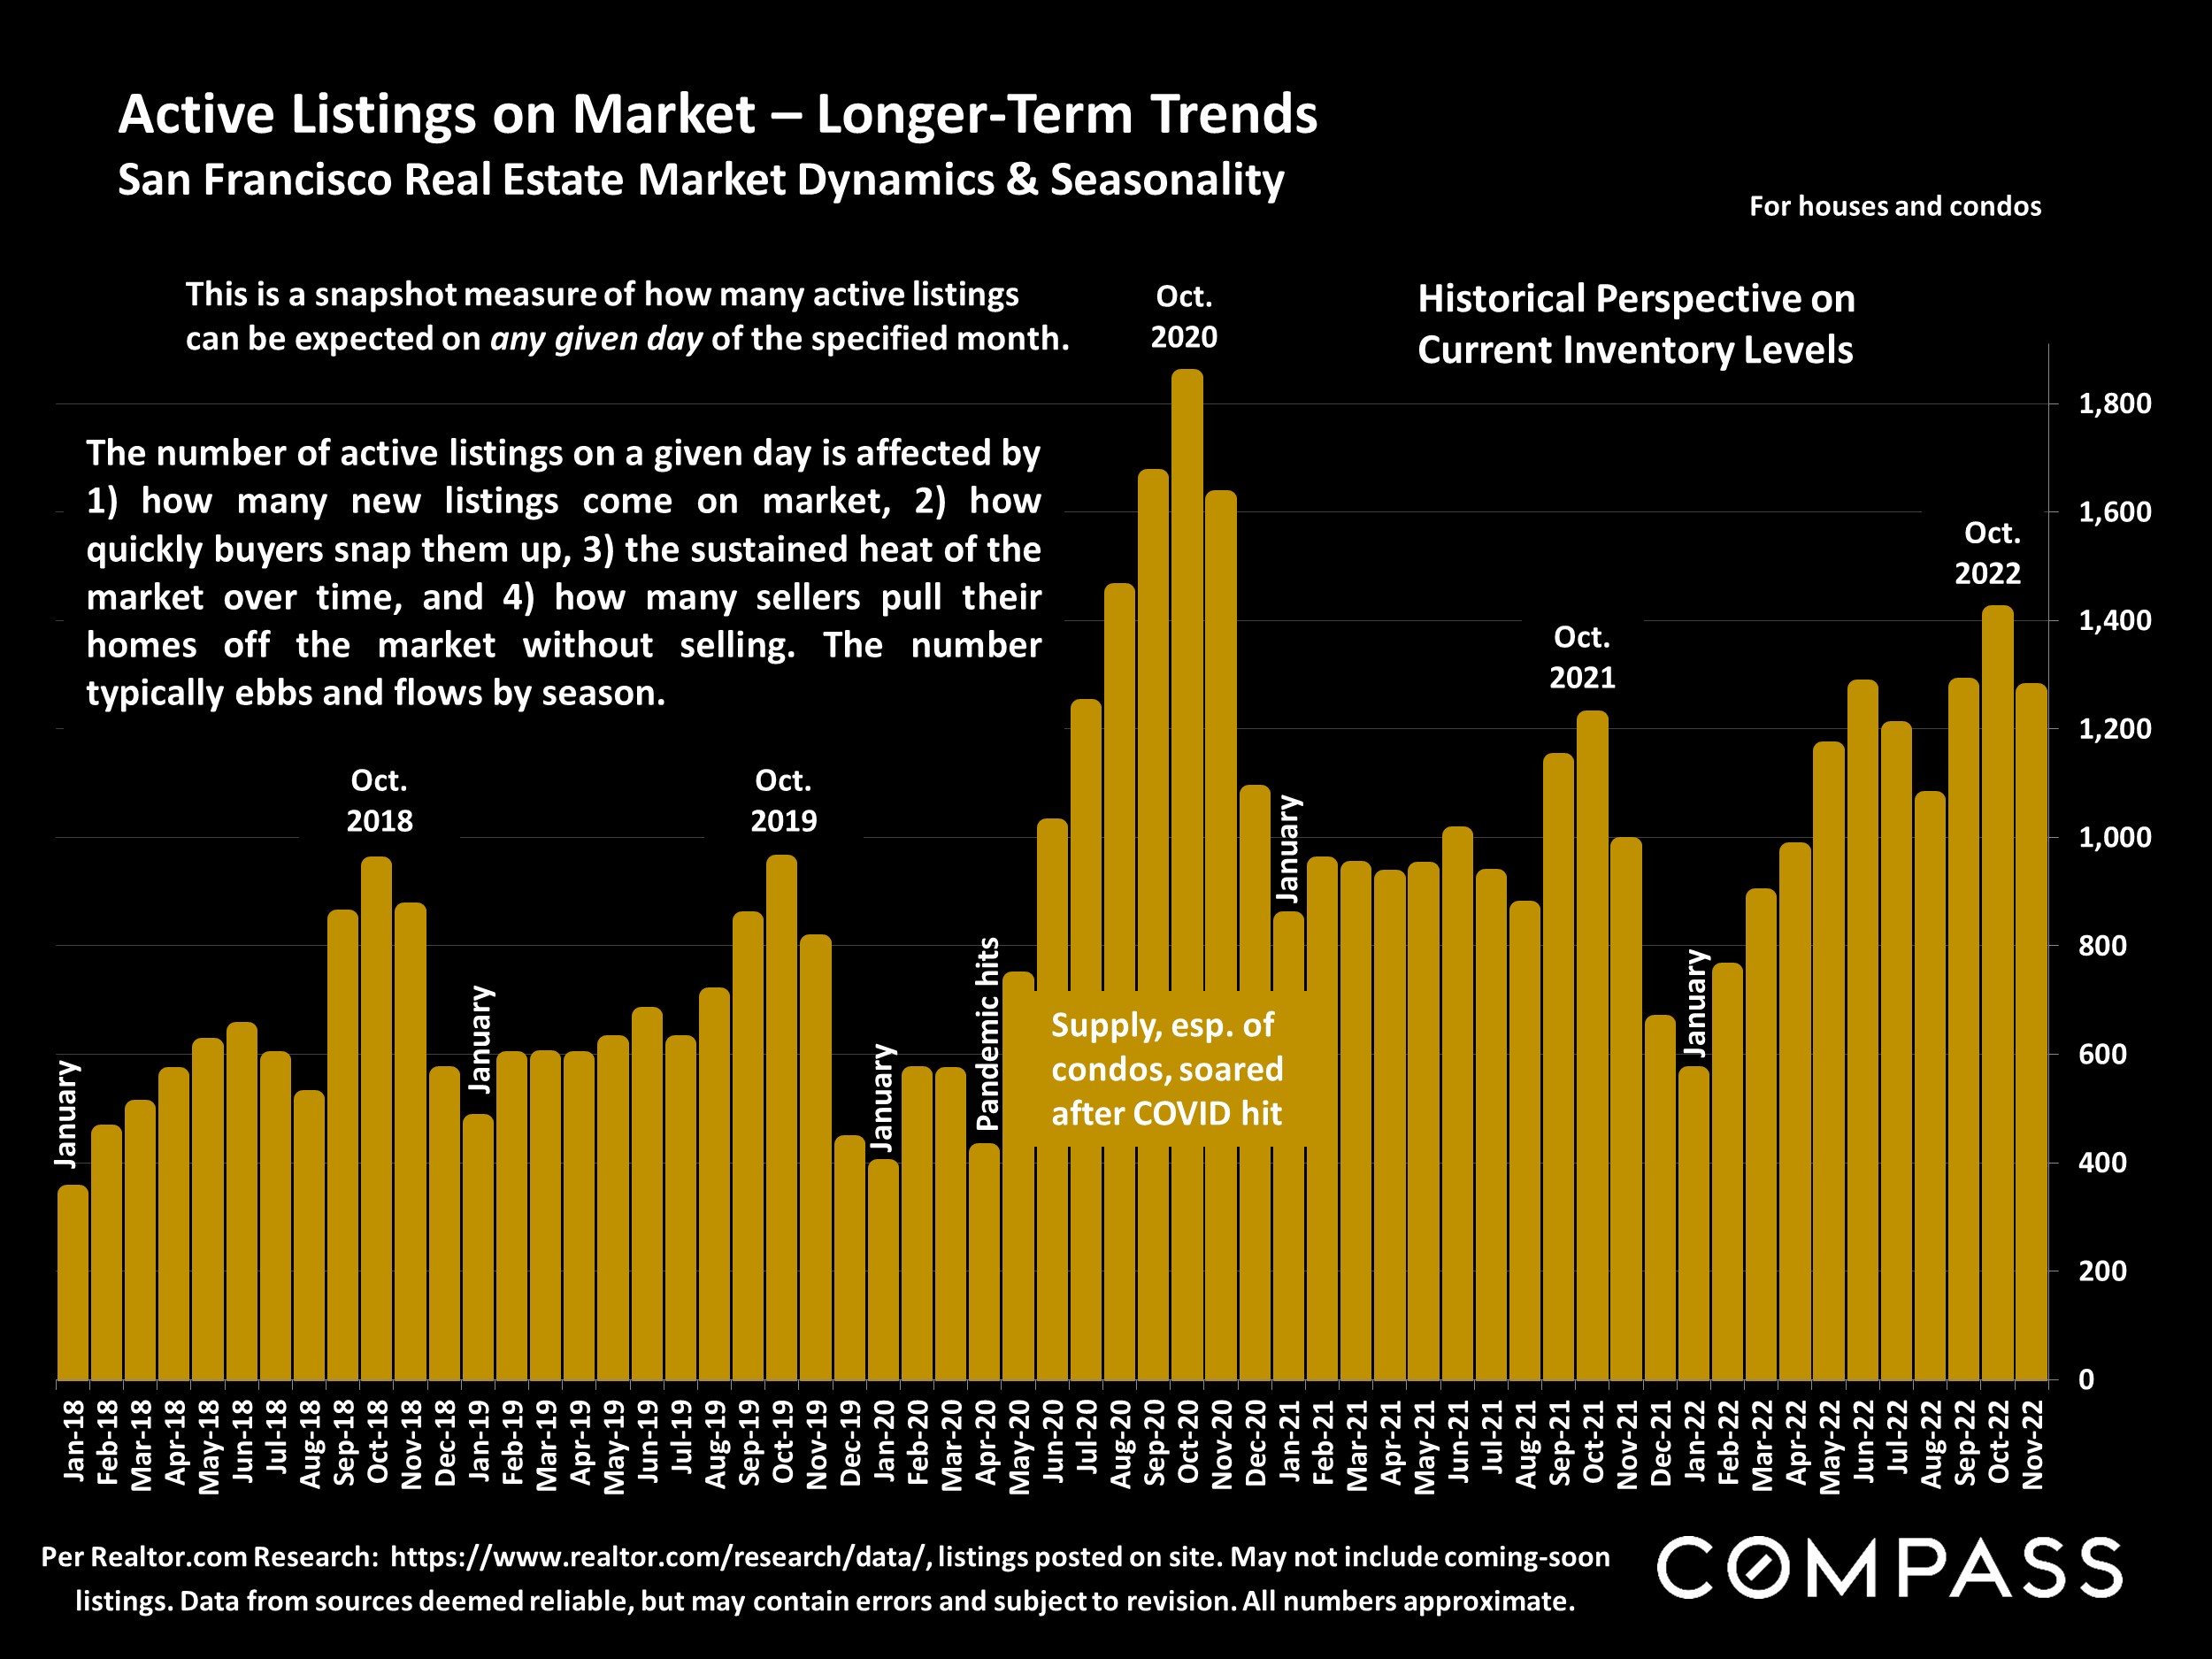
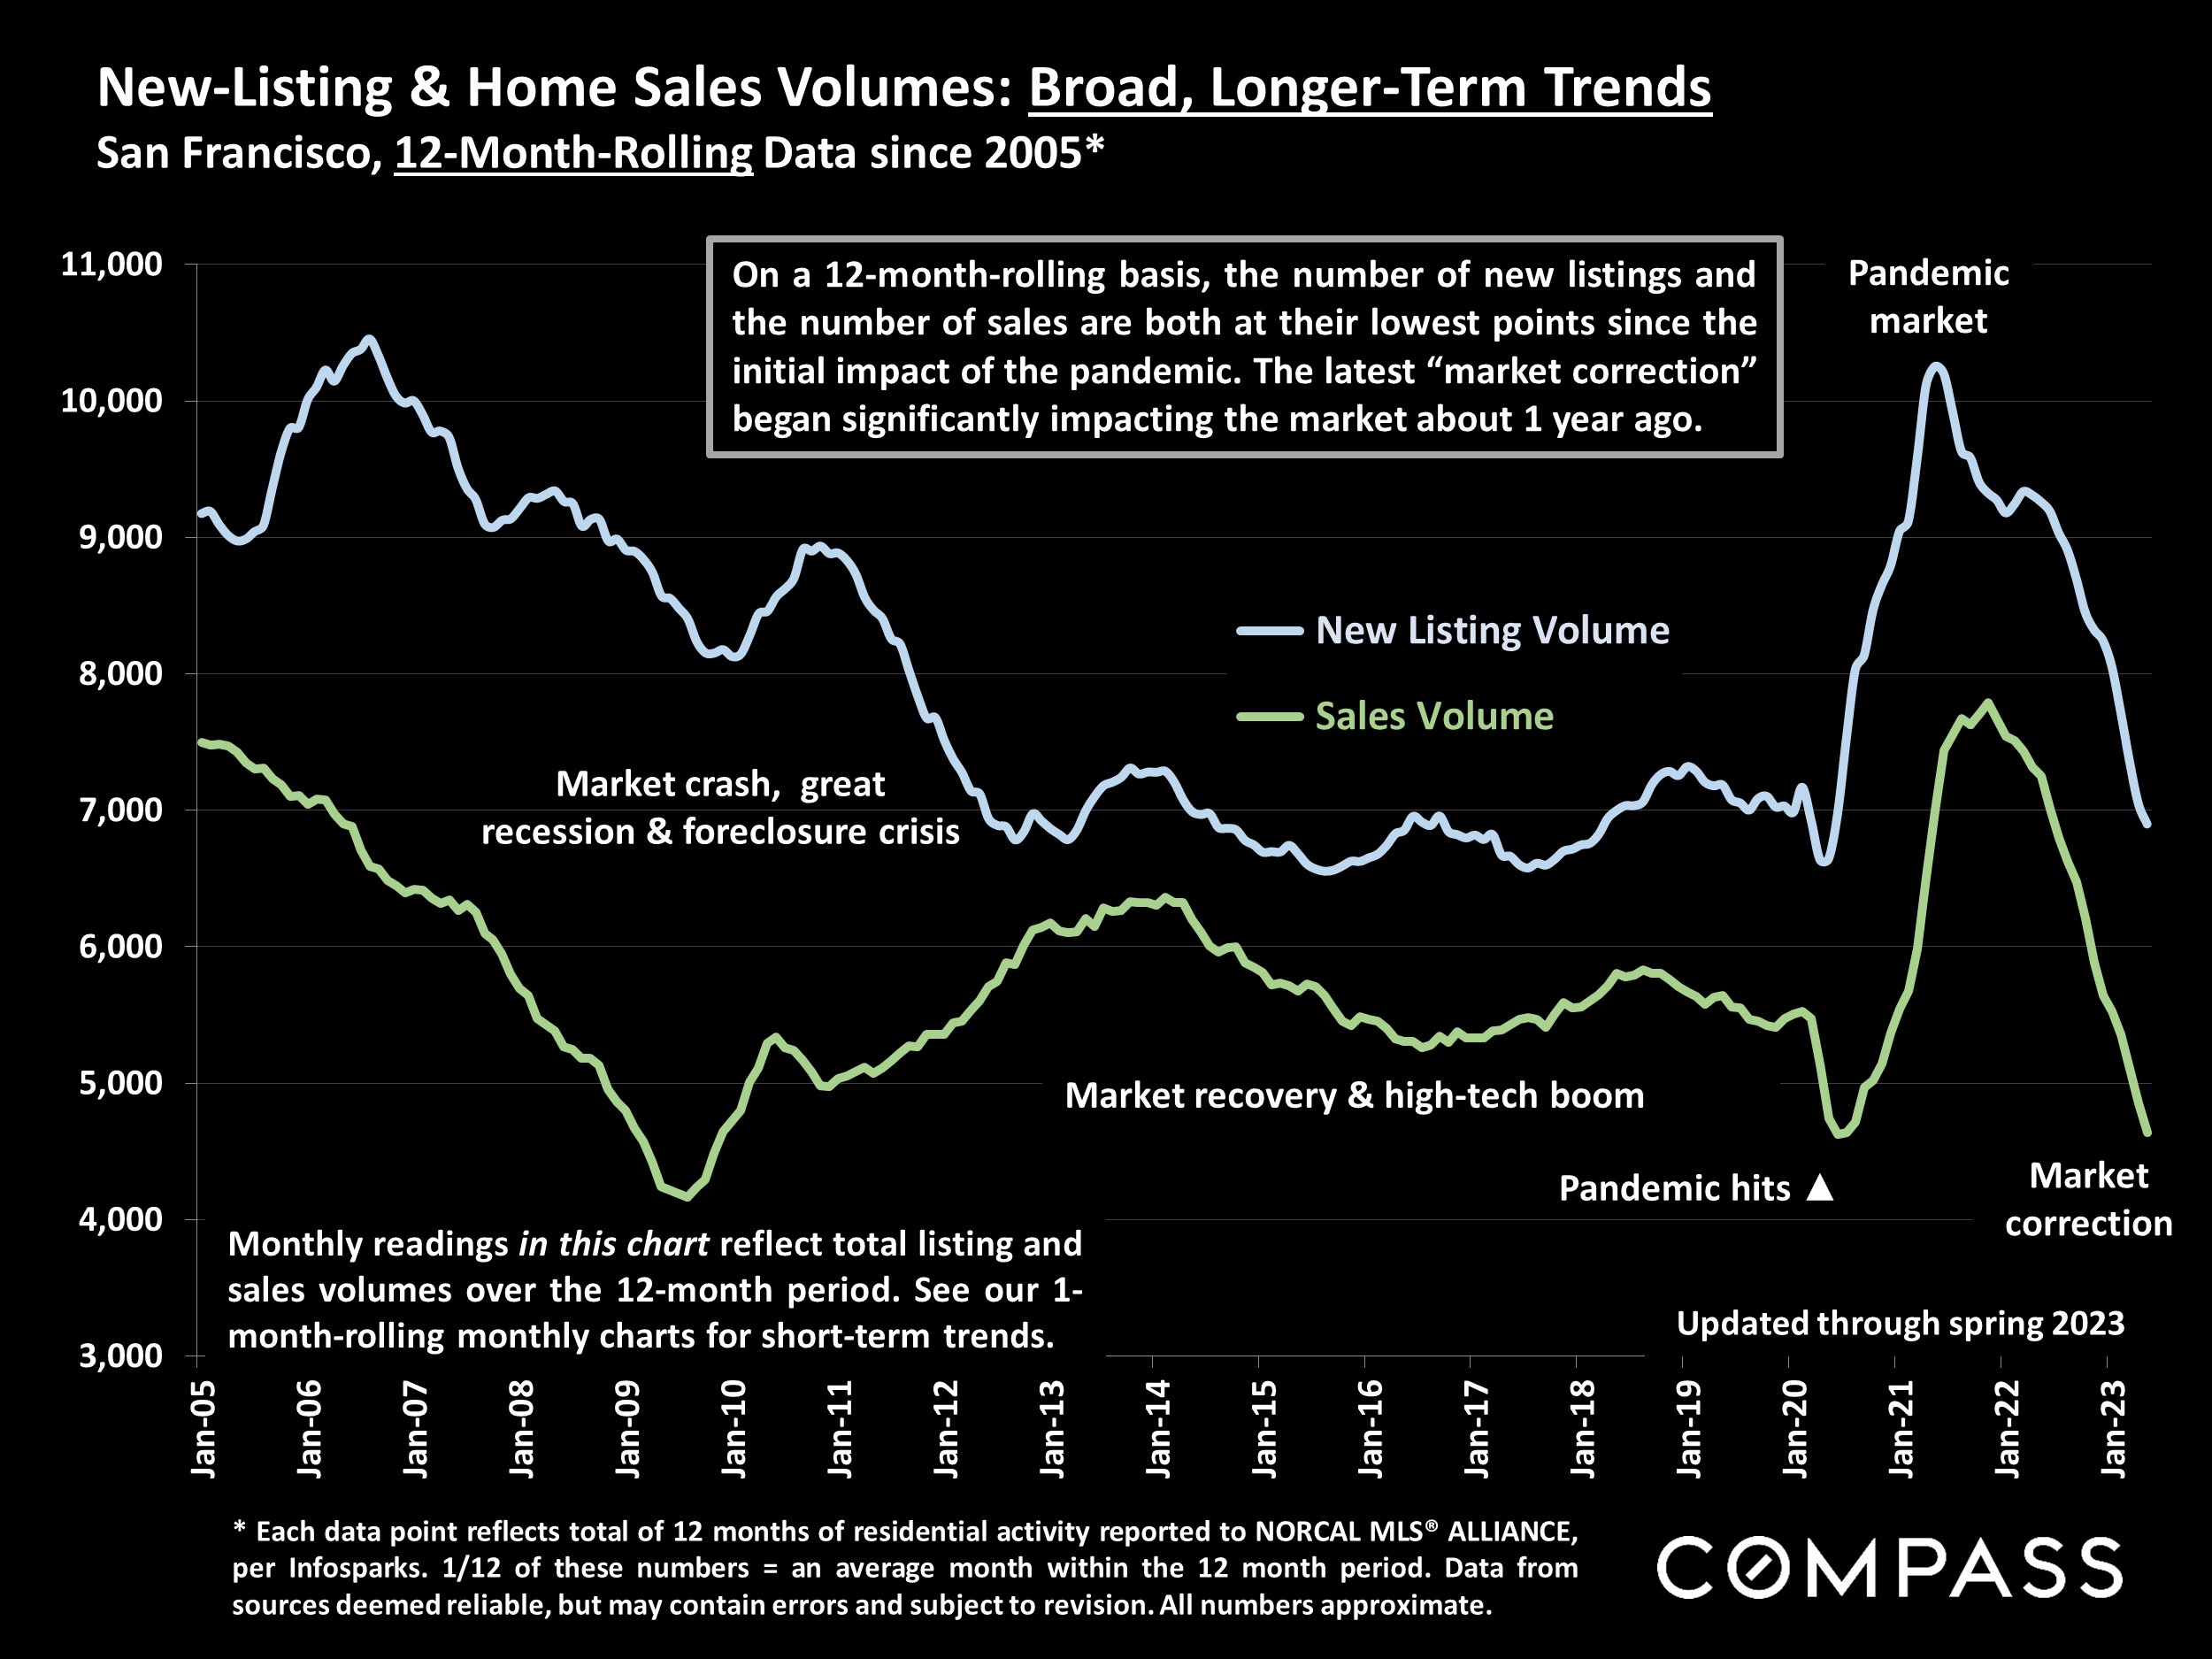
Long-Term, 12-Month-Rolling, Overview of Supply & Demand
Ultimately, it always boils down to supply & demand: When buyers compete for too few listings, home prices rise; when sellers compete for too few buyers, prices drop. The next chart reviews broad, long- term trends in new listings and sales: Each monthly reading reflects activity over a 1-year period. (Note that 12-month-rolling data = clearer trend lines, but can disguise and lag shorter term changes).
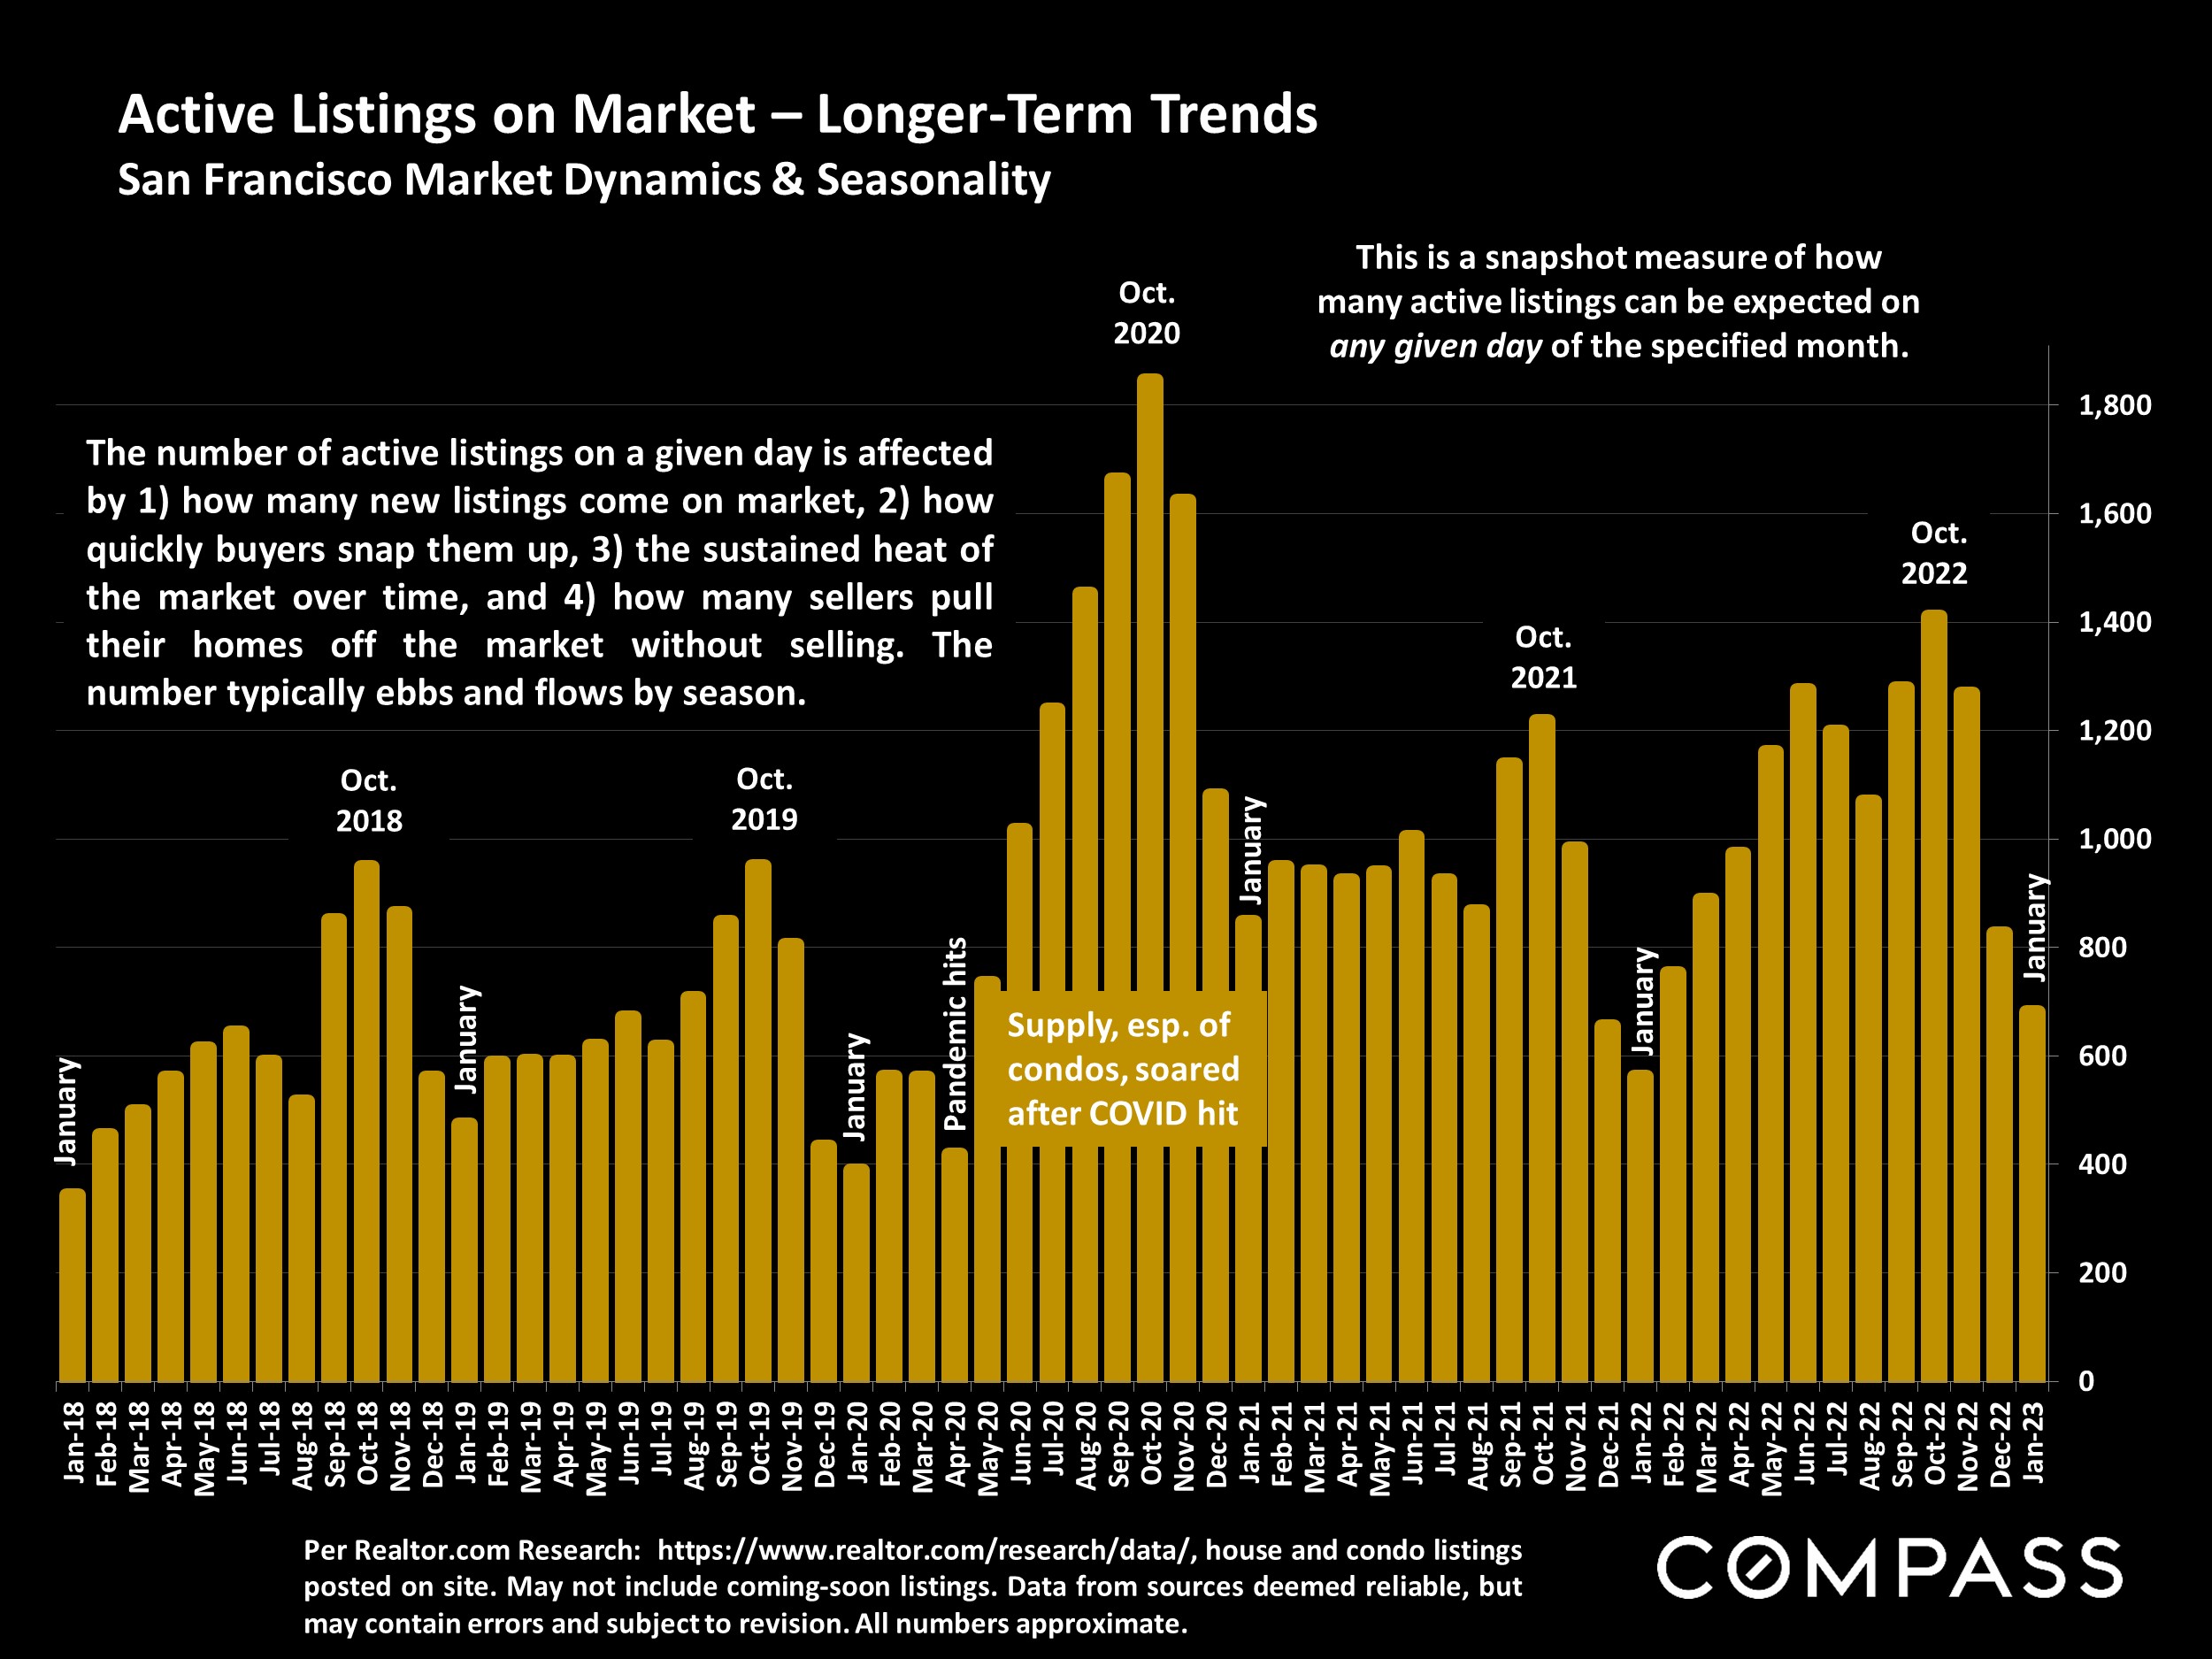
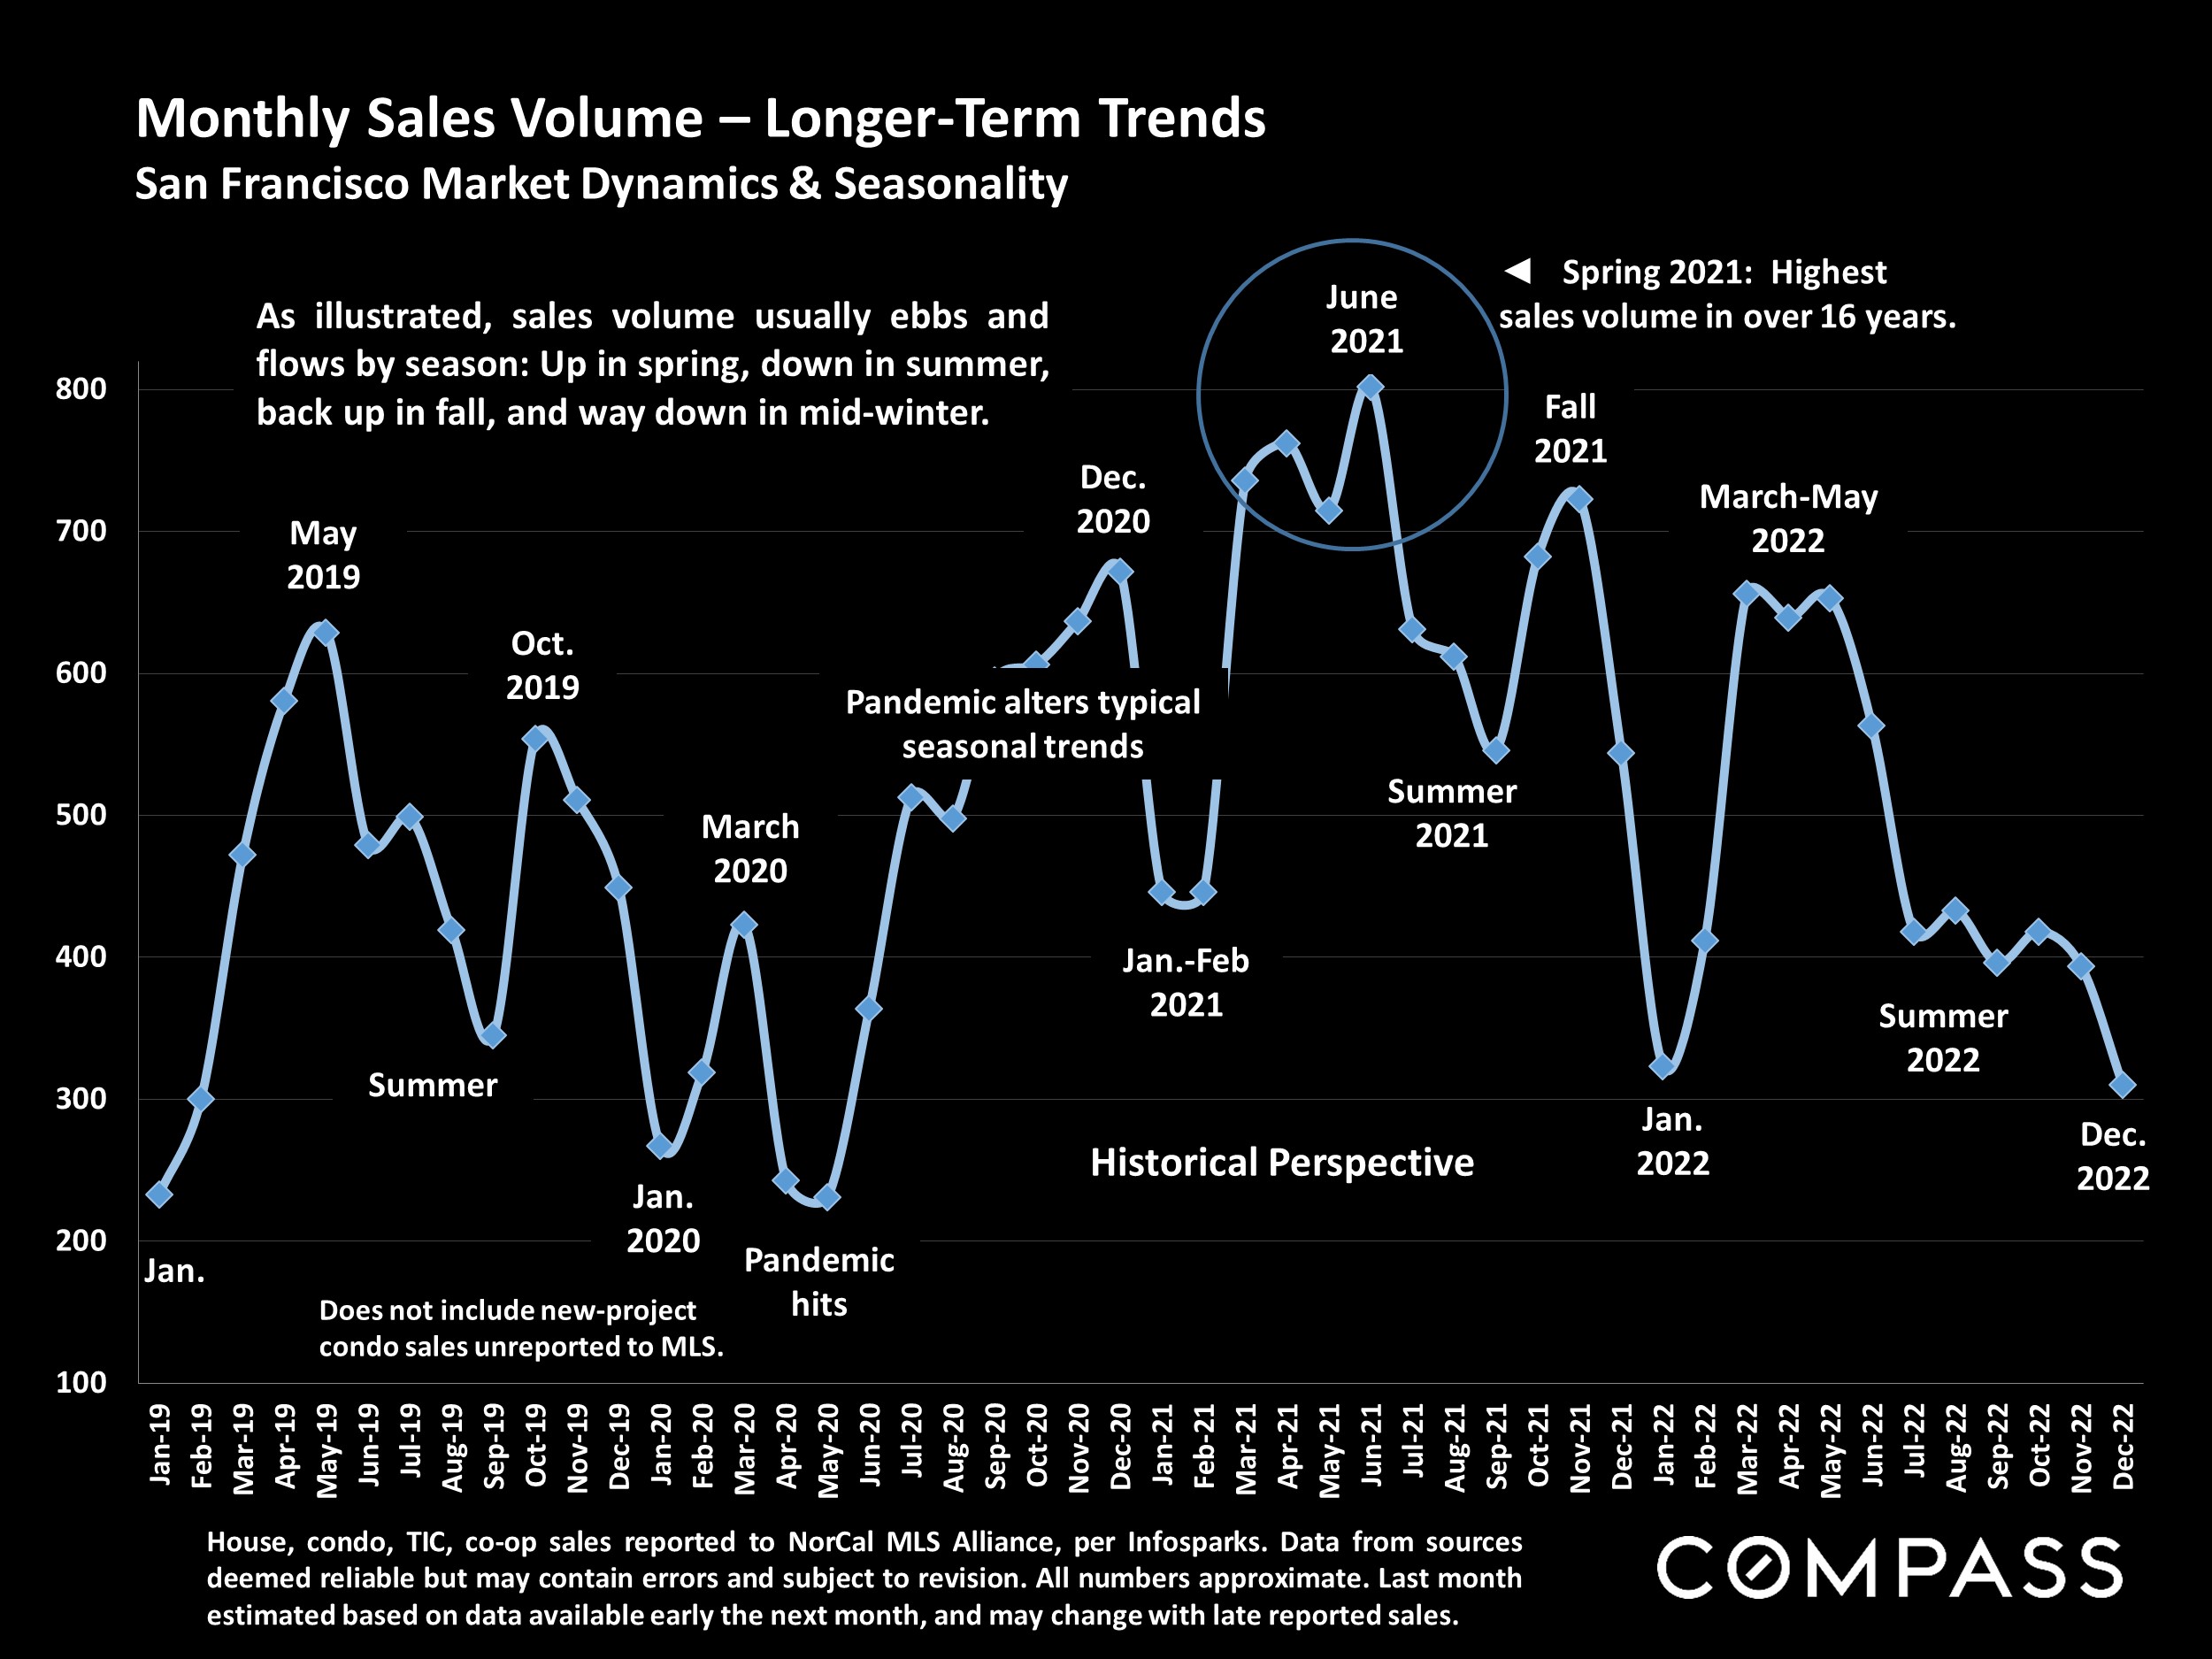
One critical factor missing from the following chart is speed of sale: As a market heats up, new listings sell more quickly: During the pandemic boom, homes typically sold at their fastest rates ever. When demand declines during a downturn, listings take longer to sell: During the 2008-2011 market recession, days-on-market often doubled or tripled from historical norms – the average listing could take months to sell. Even if the new-listing count stays the same, the inventory of active listings available to purchase can climb or fall considerably depending on speed of sale, and how long the boom or slowdown lasts.
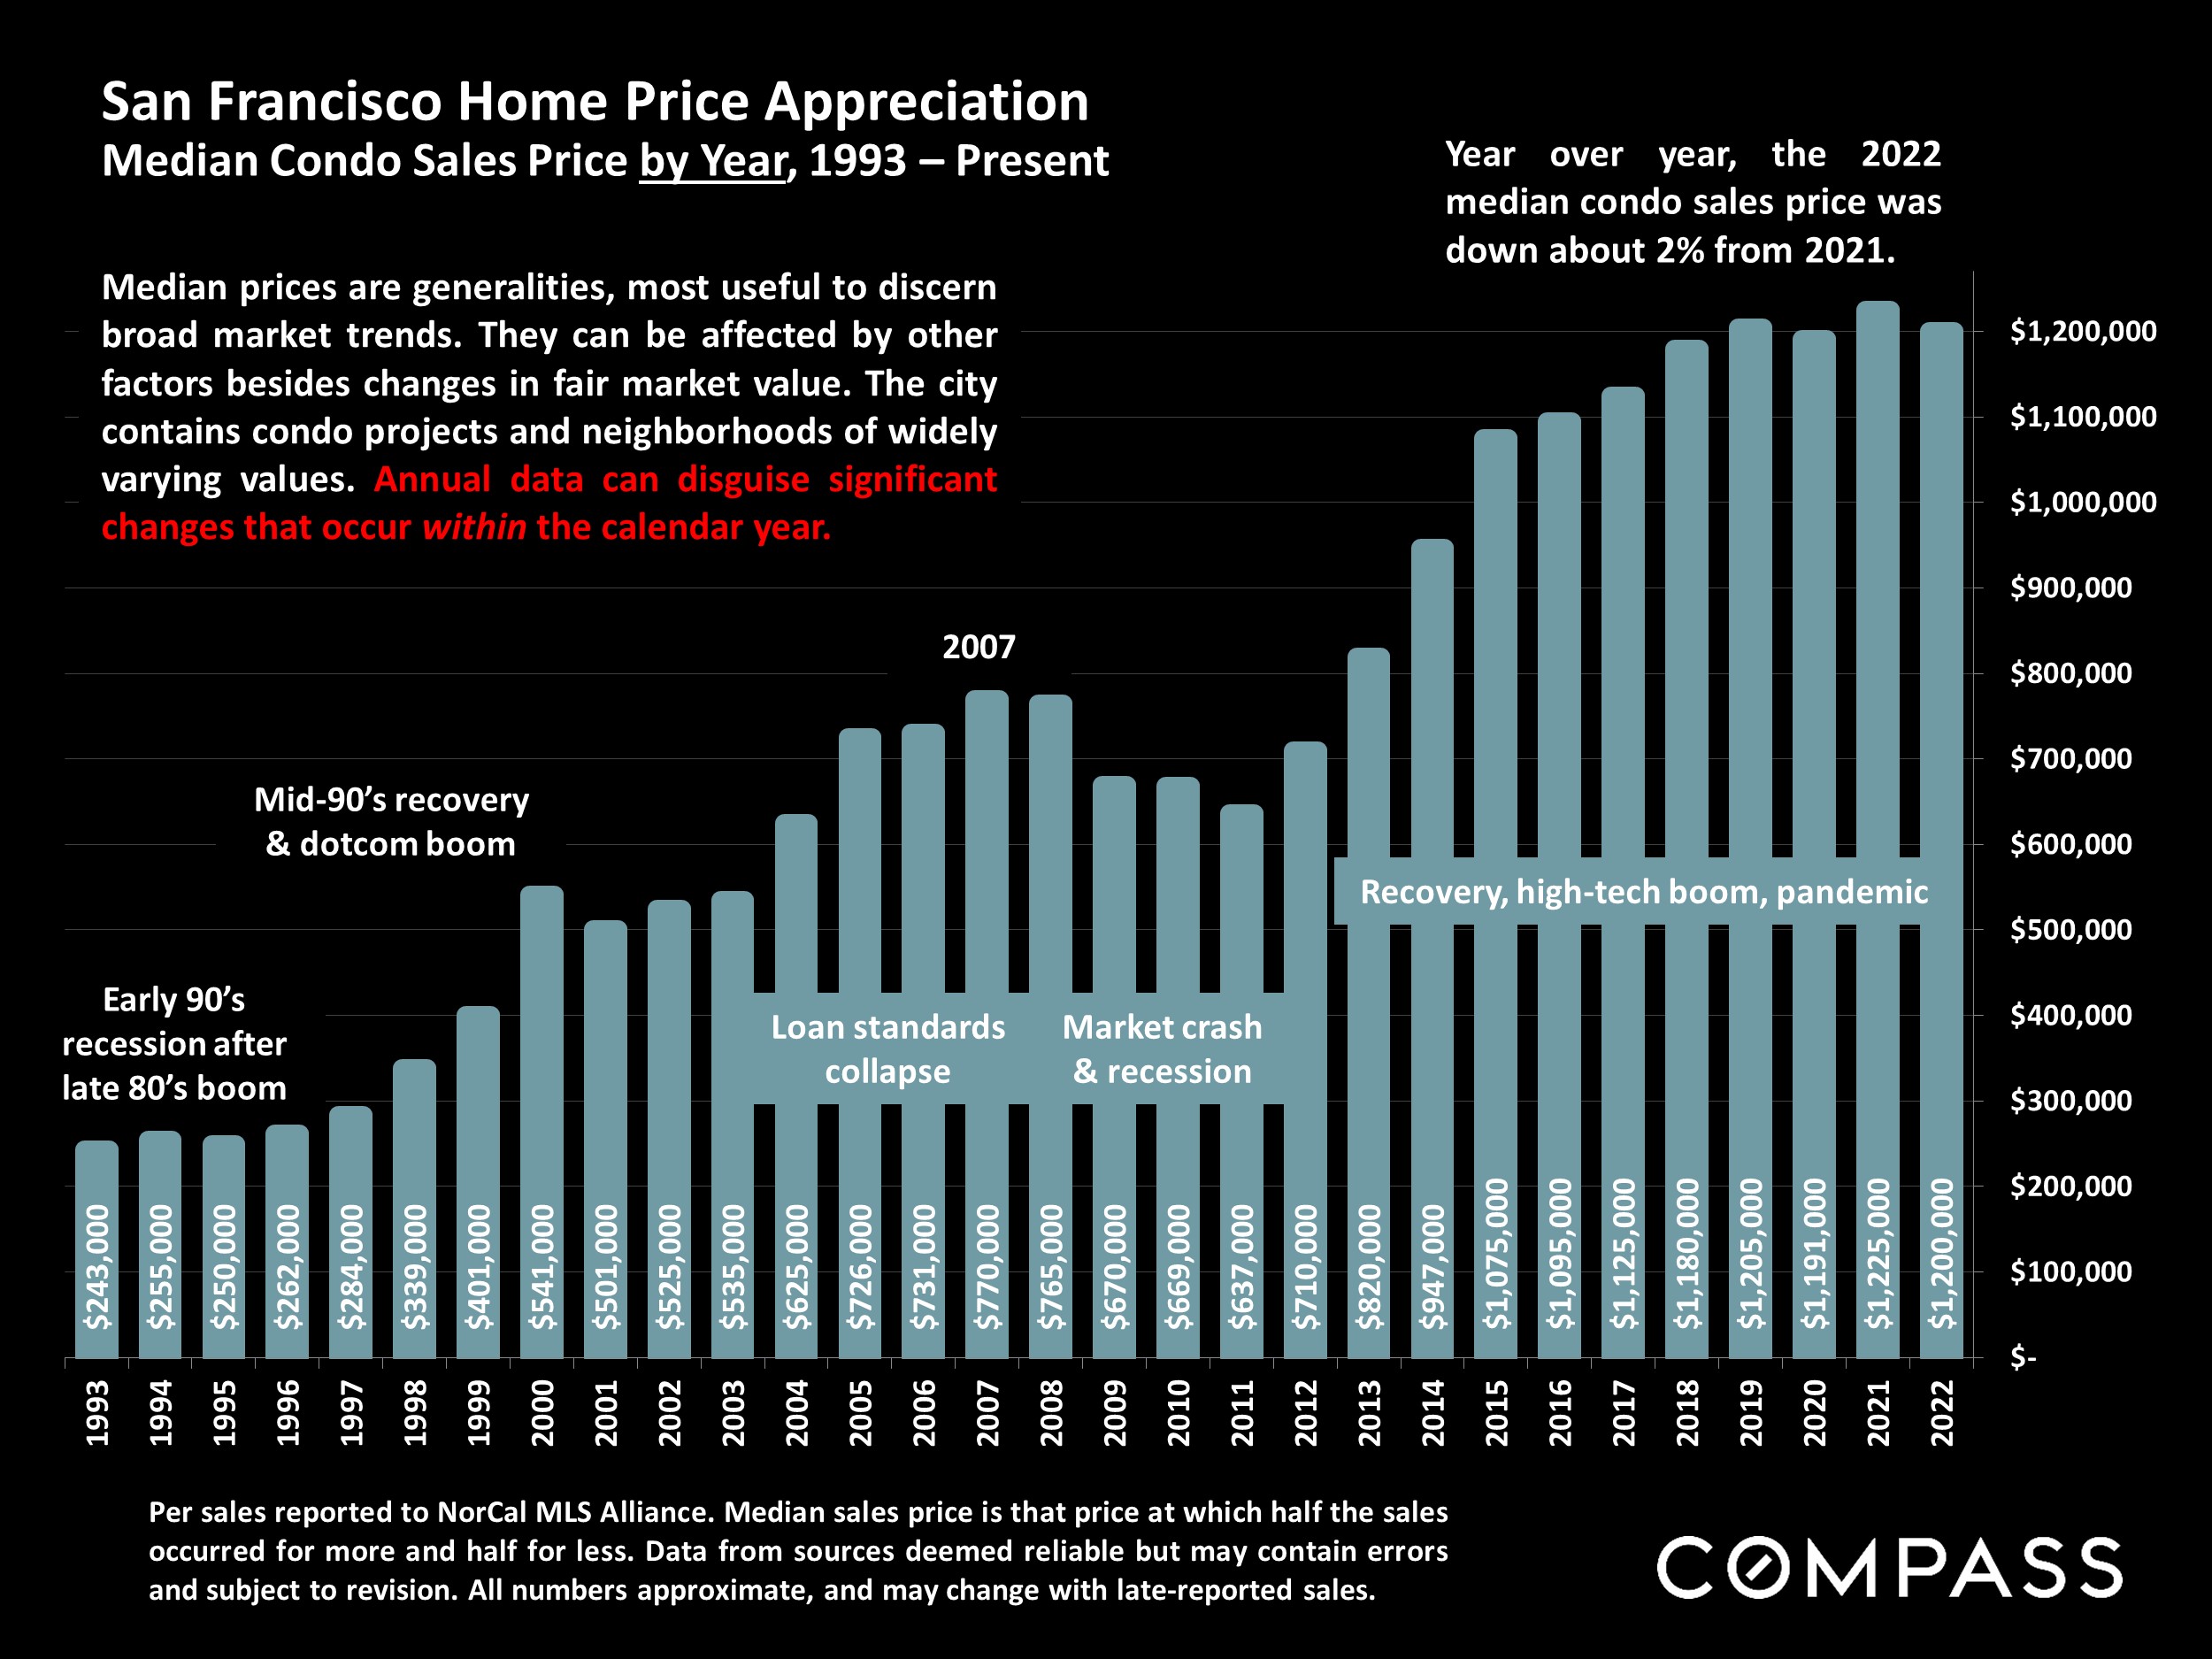
After the 2007-08 housing & stock market crash, buyer demand plunged, foreclosures climbed and inventory soared, home prices cratered. Once the crisis passed, the quantity of listings coming on market dropped – no more foreclosure and short sale listings, and homeowners were moving less often – just as buyer demand jumped with the high-tech hiring, population and wealth boom. Increasing demand vs. decreasing supply created strong upward pressure on prices. When the pandemic hit, a number of factors – interest rates, stock markets, contagion, desire for outside space, work from home, family care, etc. – came together, and the number of new listings quickly escalated, especially of condos. Until the vaccine rollout, conditions in the condo and house markets diverged, but ultimately, at the peak of the pandemic boom, sales volume hit its highest point in 15+ years, and home prices peaked.
Reverses in economic conditions led to the 2022 market correction. Due to the “mortgage lock-in effect,” the number of new listings dropped, but housing costs increased with rising interest rates, consumer confidence slumped with inflation and stock market declines, demand fell, and prices declined significantly from 2022 peaks. In 2023, buyer demand rebounded and prices started to rise again, though trends vary by market segment. (2023 changes do not yet stand out in the 12-month-rolling data. See 1- month-rolling charts later in this report for more recent, shorter-term trends.)
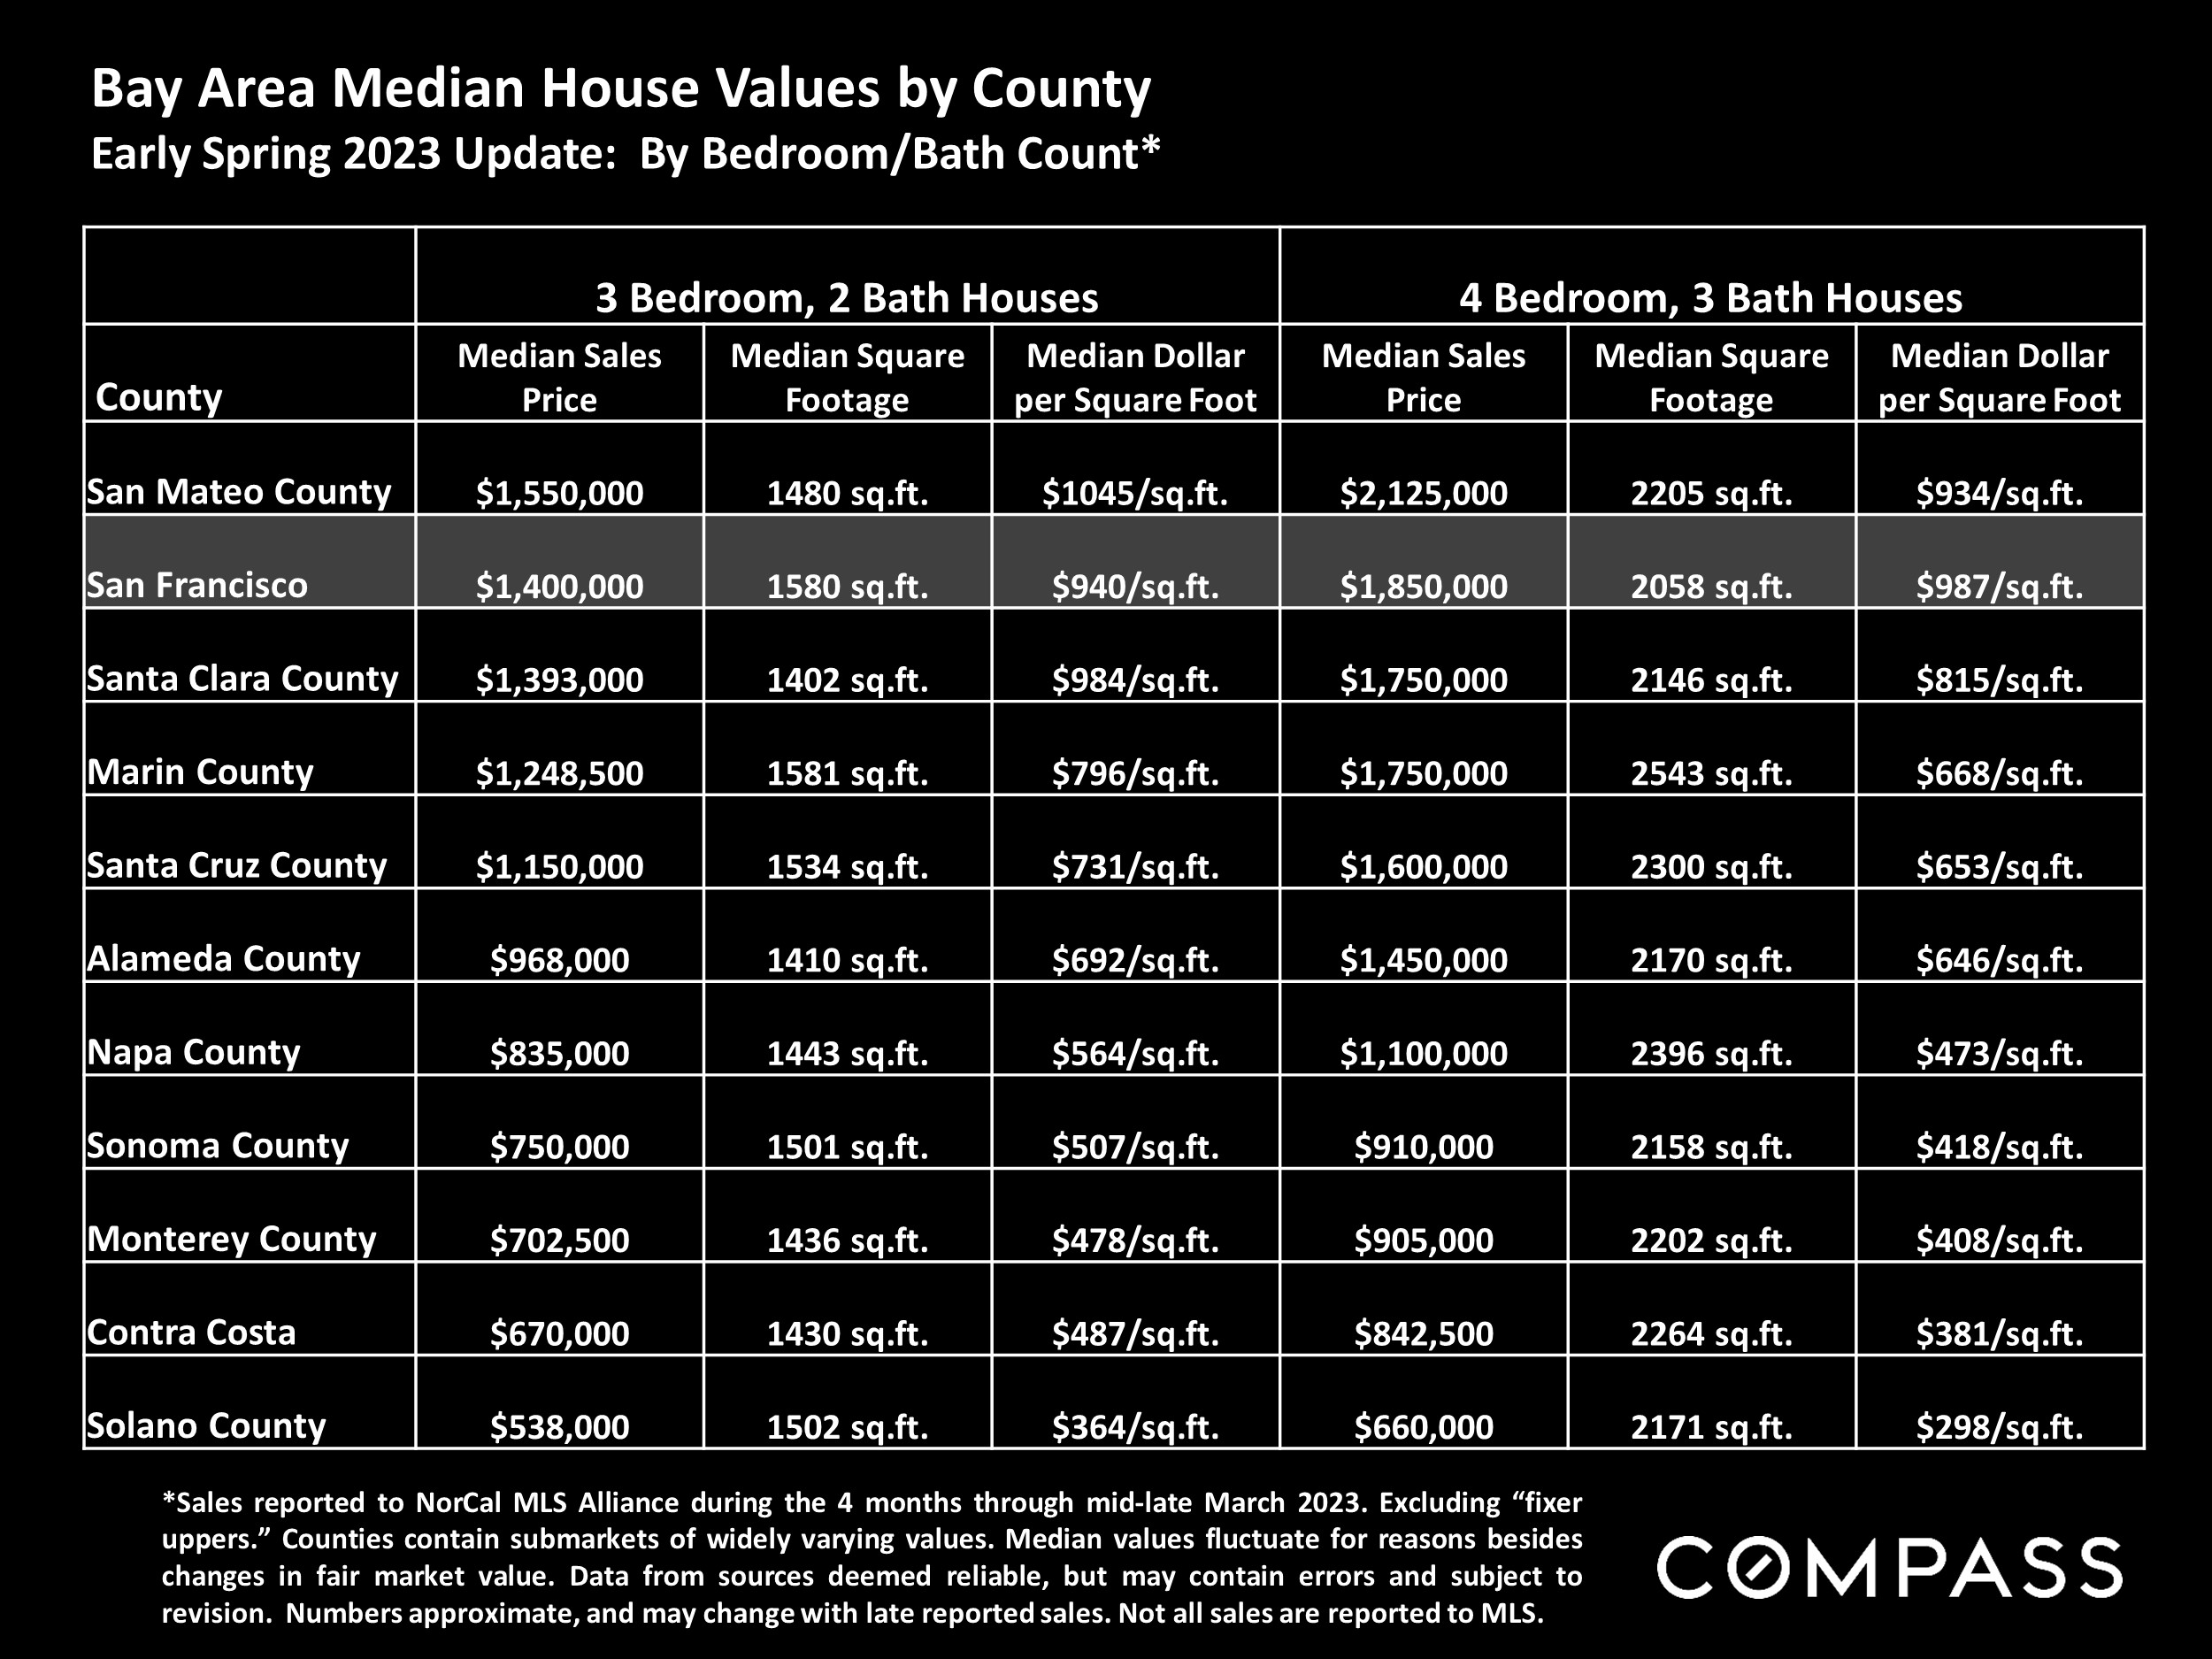
Statistics are generalities, essentially summaries of widely disparate data generated by dozens, hundreds or thousands of unique, individual sales occurring within different time periods. They are best seen not as precise measurements, but as broad, comparative indicators, with reasonable margins of error. Anomalous fluctuations in statistics are not uncommon, especially in smaller, expensive market segments. Last period data should be considered estimates that may change with late-reported data. Different analytics programs sometimes define statistics – such as “active listings,” “days on market,” and “months supply of inventory” – differently: what is most meaningful are not specific calculations but the trends they illustrate. Most listing and sales data derives from the local or regional multi-listing service (MLS) of the area specified in the analysis, but not all listings or sales are reported to MLS and these won’t be reflected in the data. “Homes” signifies real-property, single-household housing units: houses, condos, co-ops, townhouses, duets and TICs (but not mobile homes), as applicable to each market. City/town names refer specifically to the named cities and towns, unless otherwise delineated. Multi-county metro areas will be specified as such. Data from sources deemed reliable, but may contain errors and subject to revision. All numbers to be considered approximate.
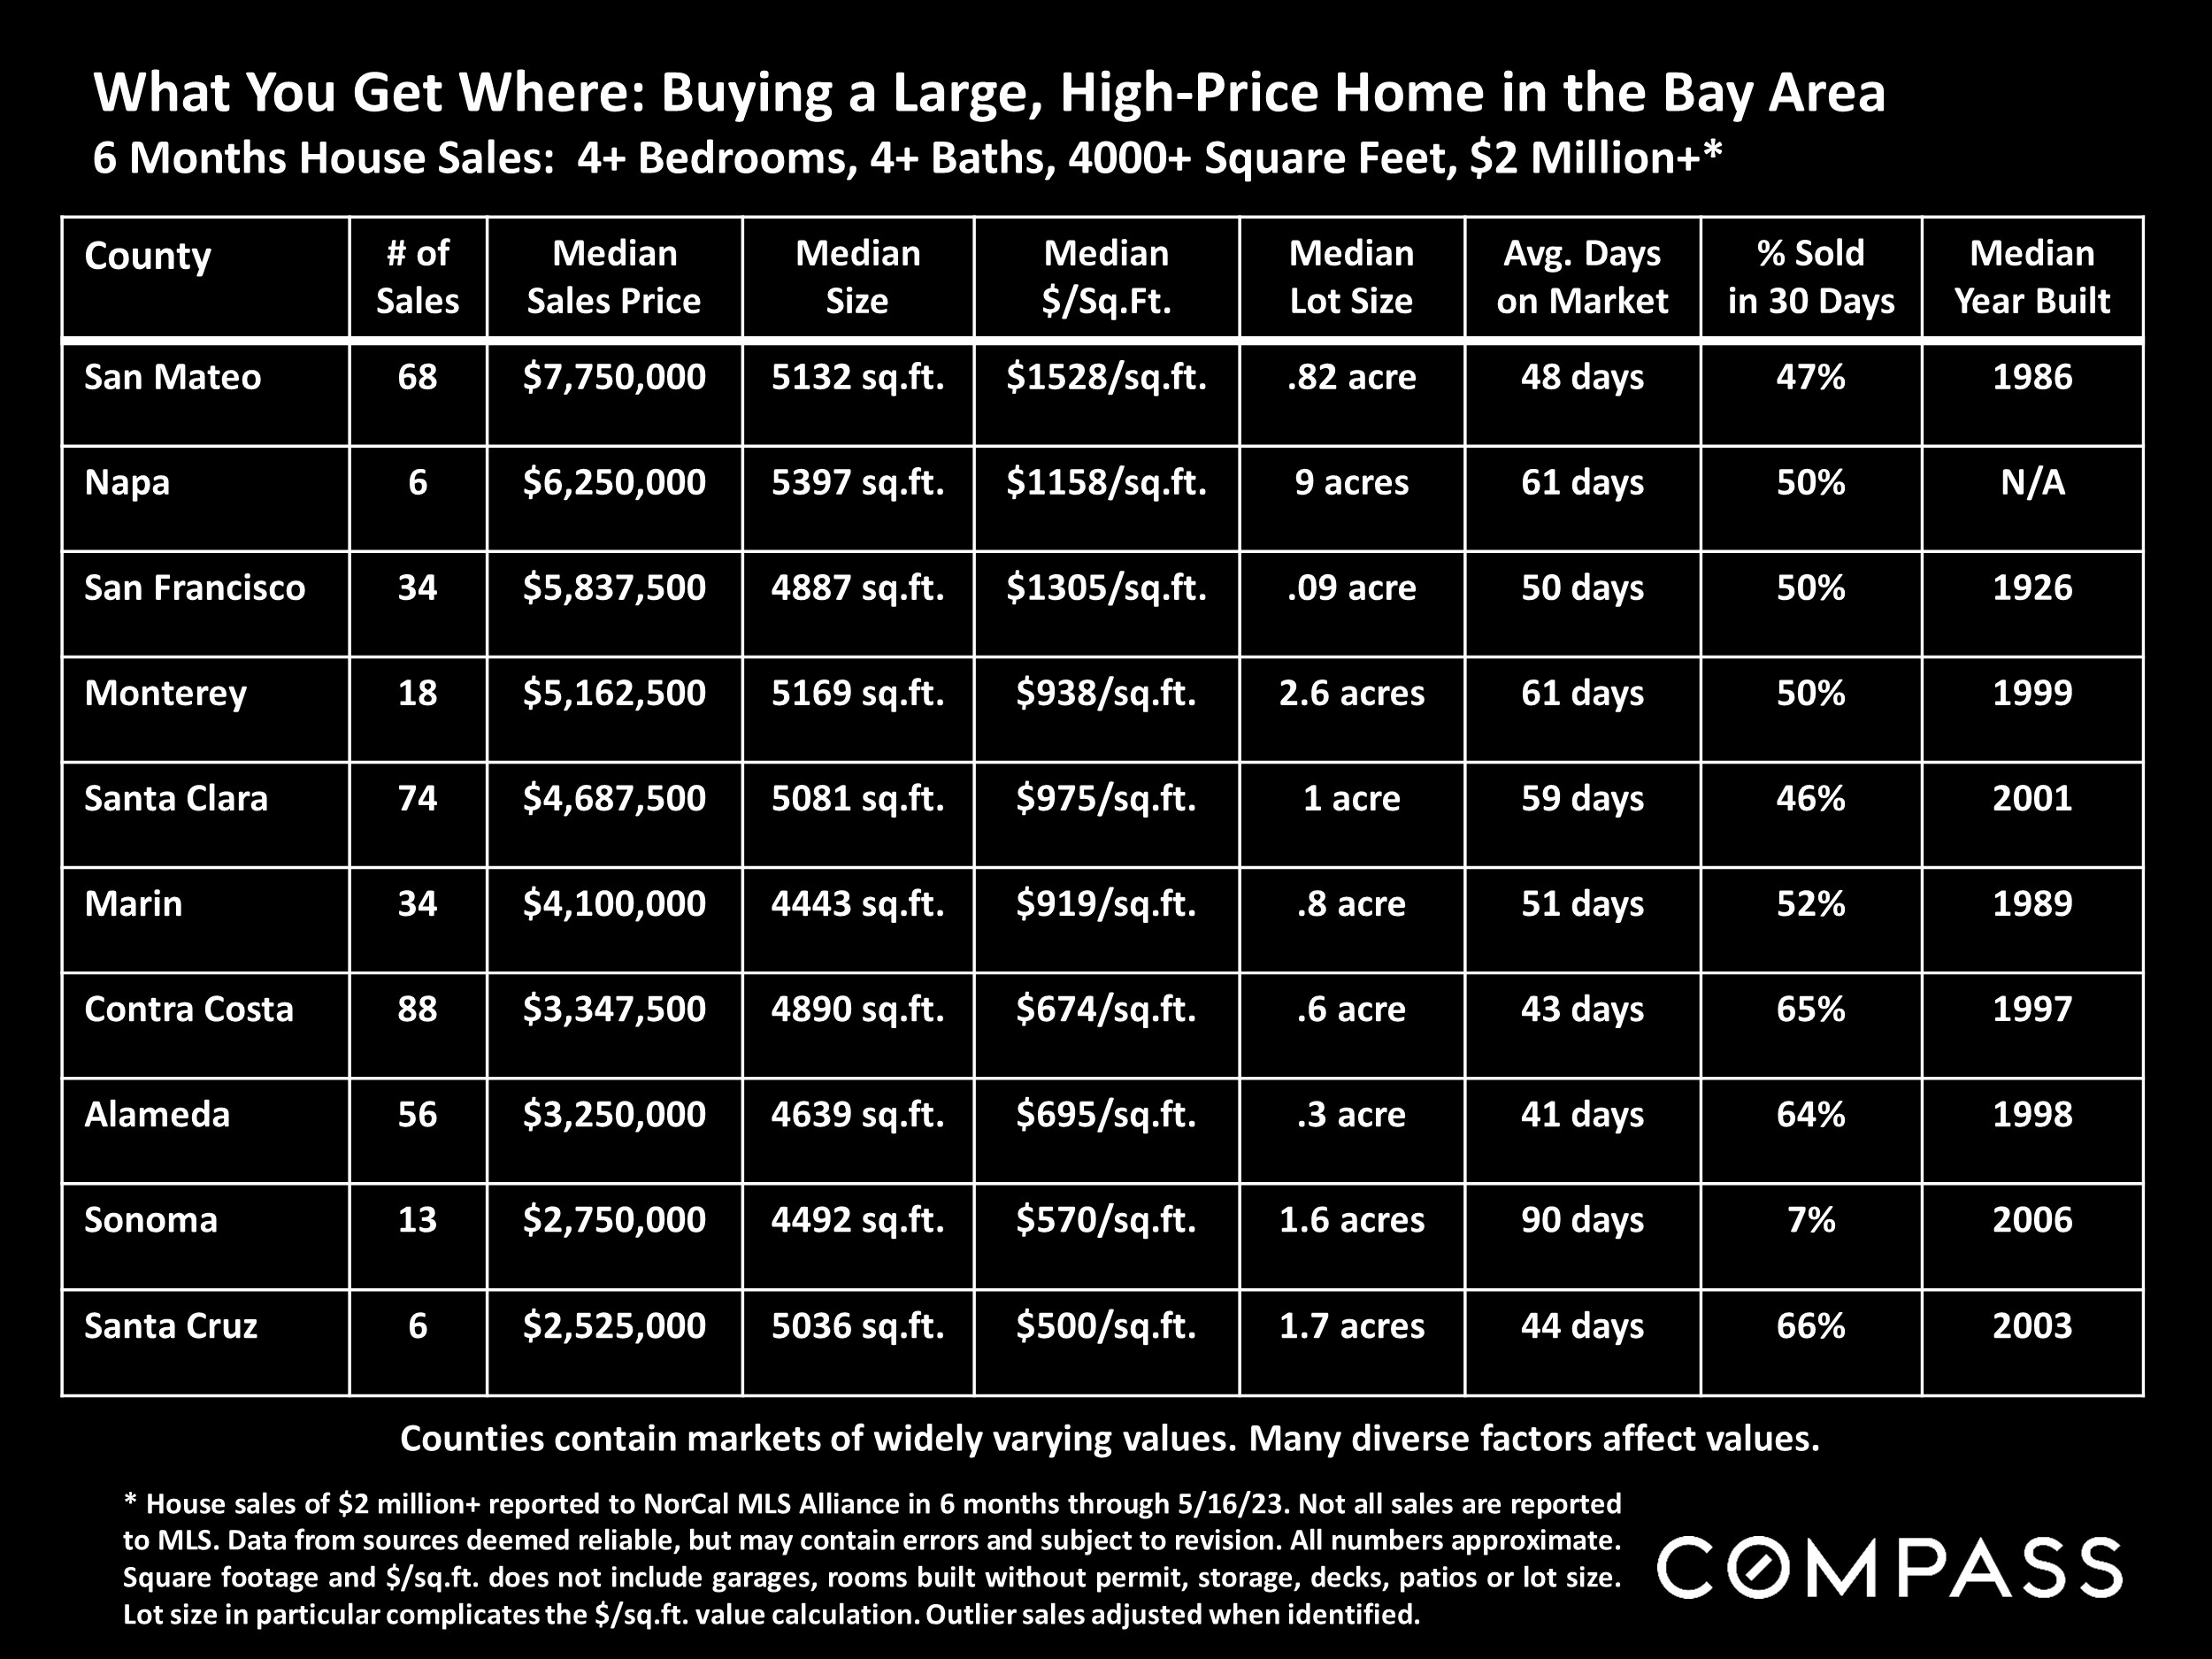
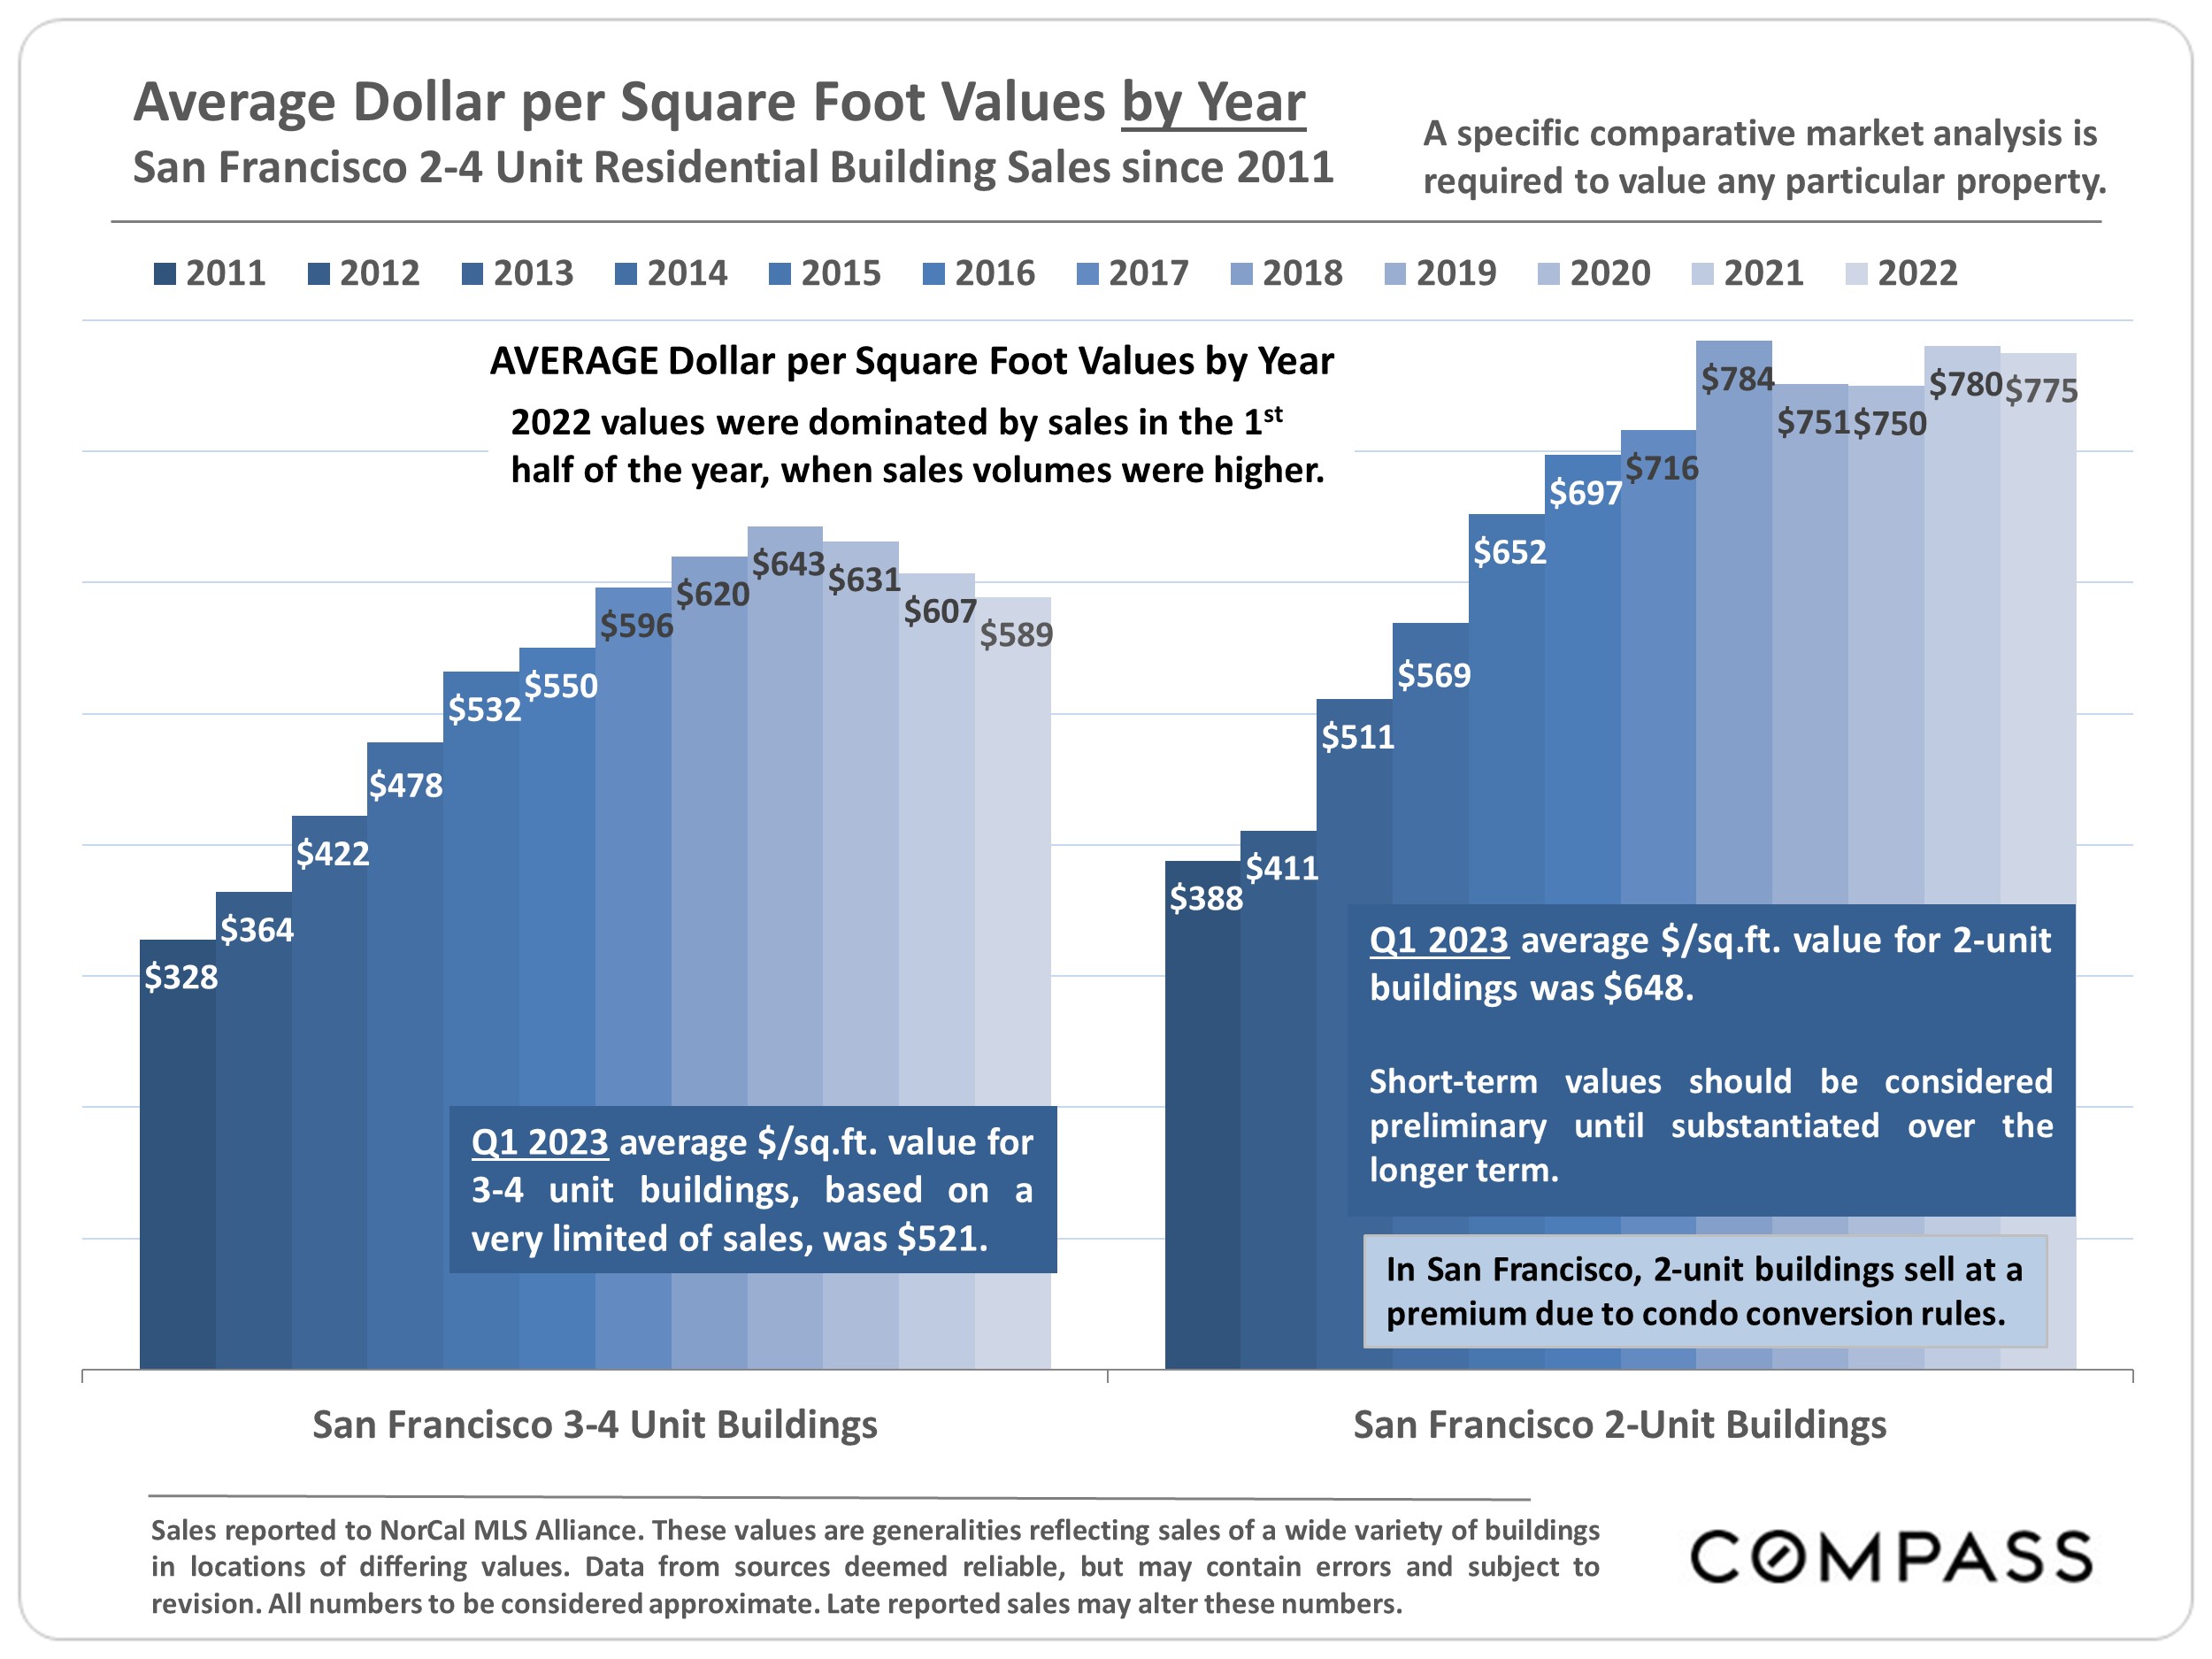
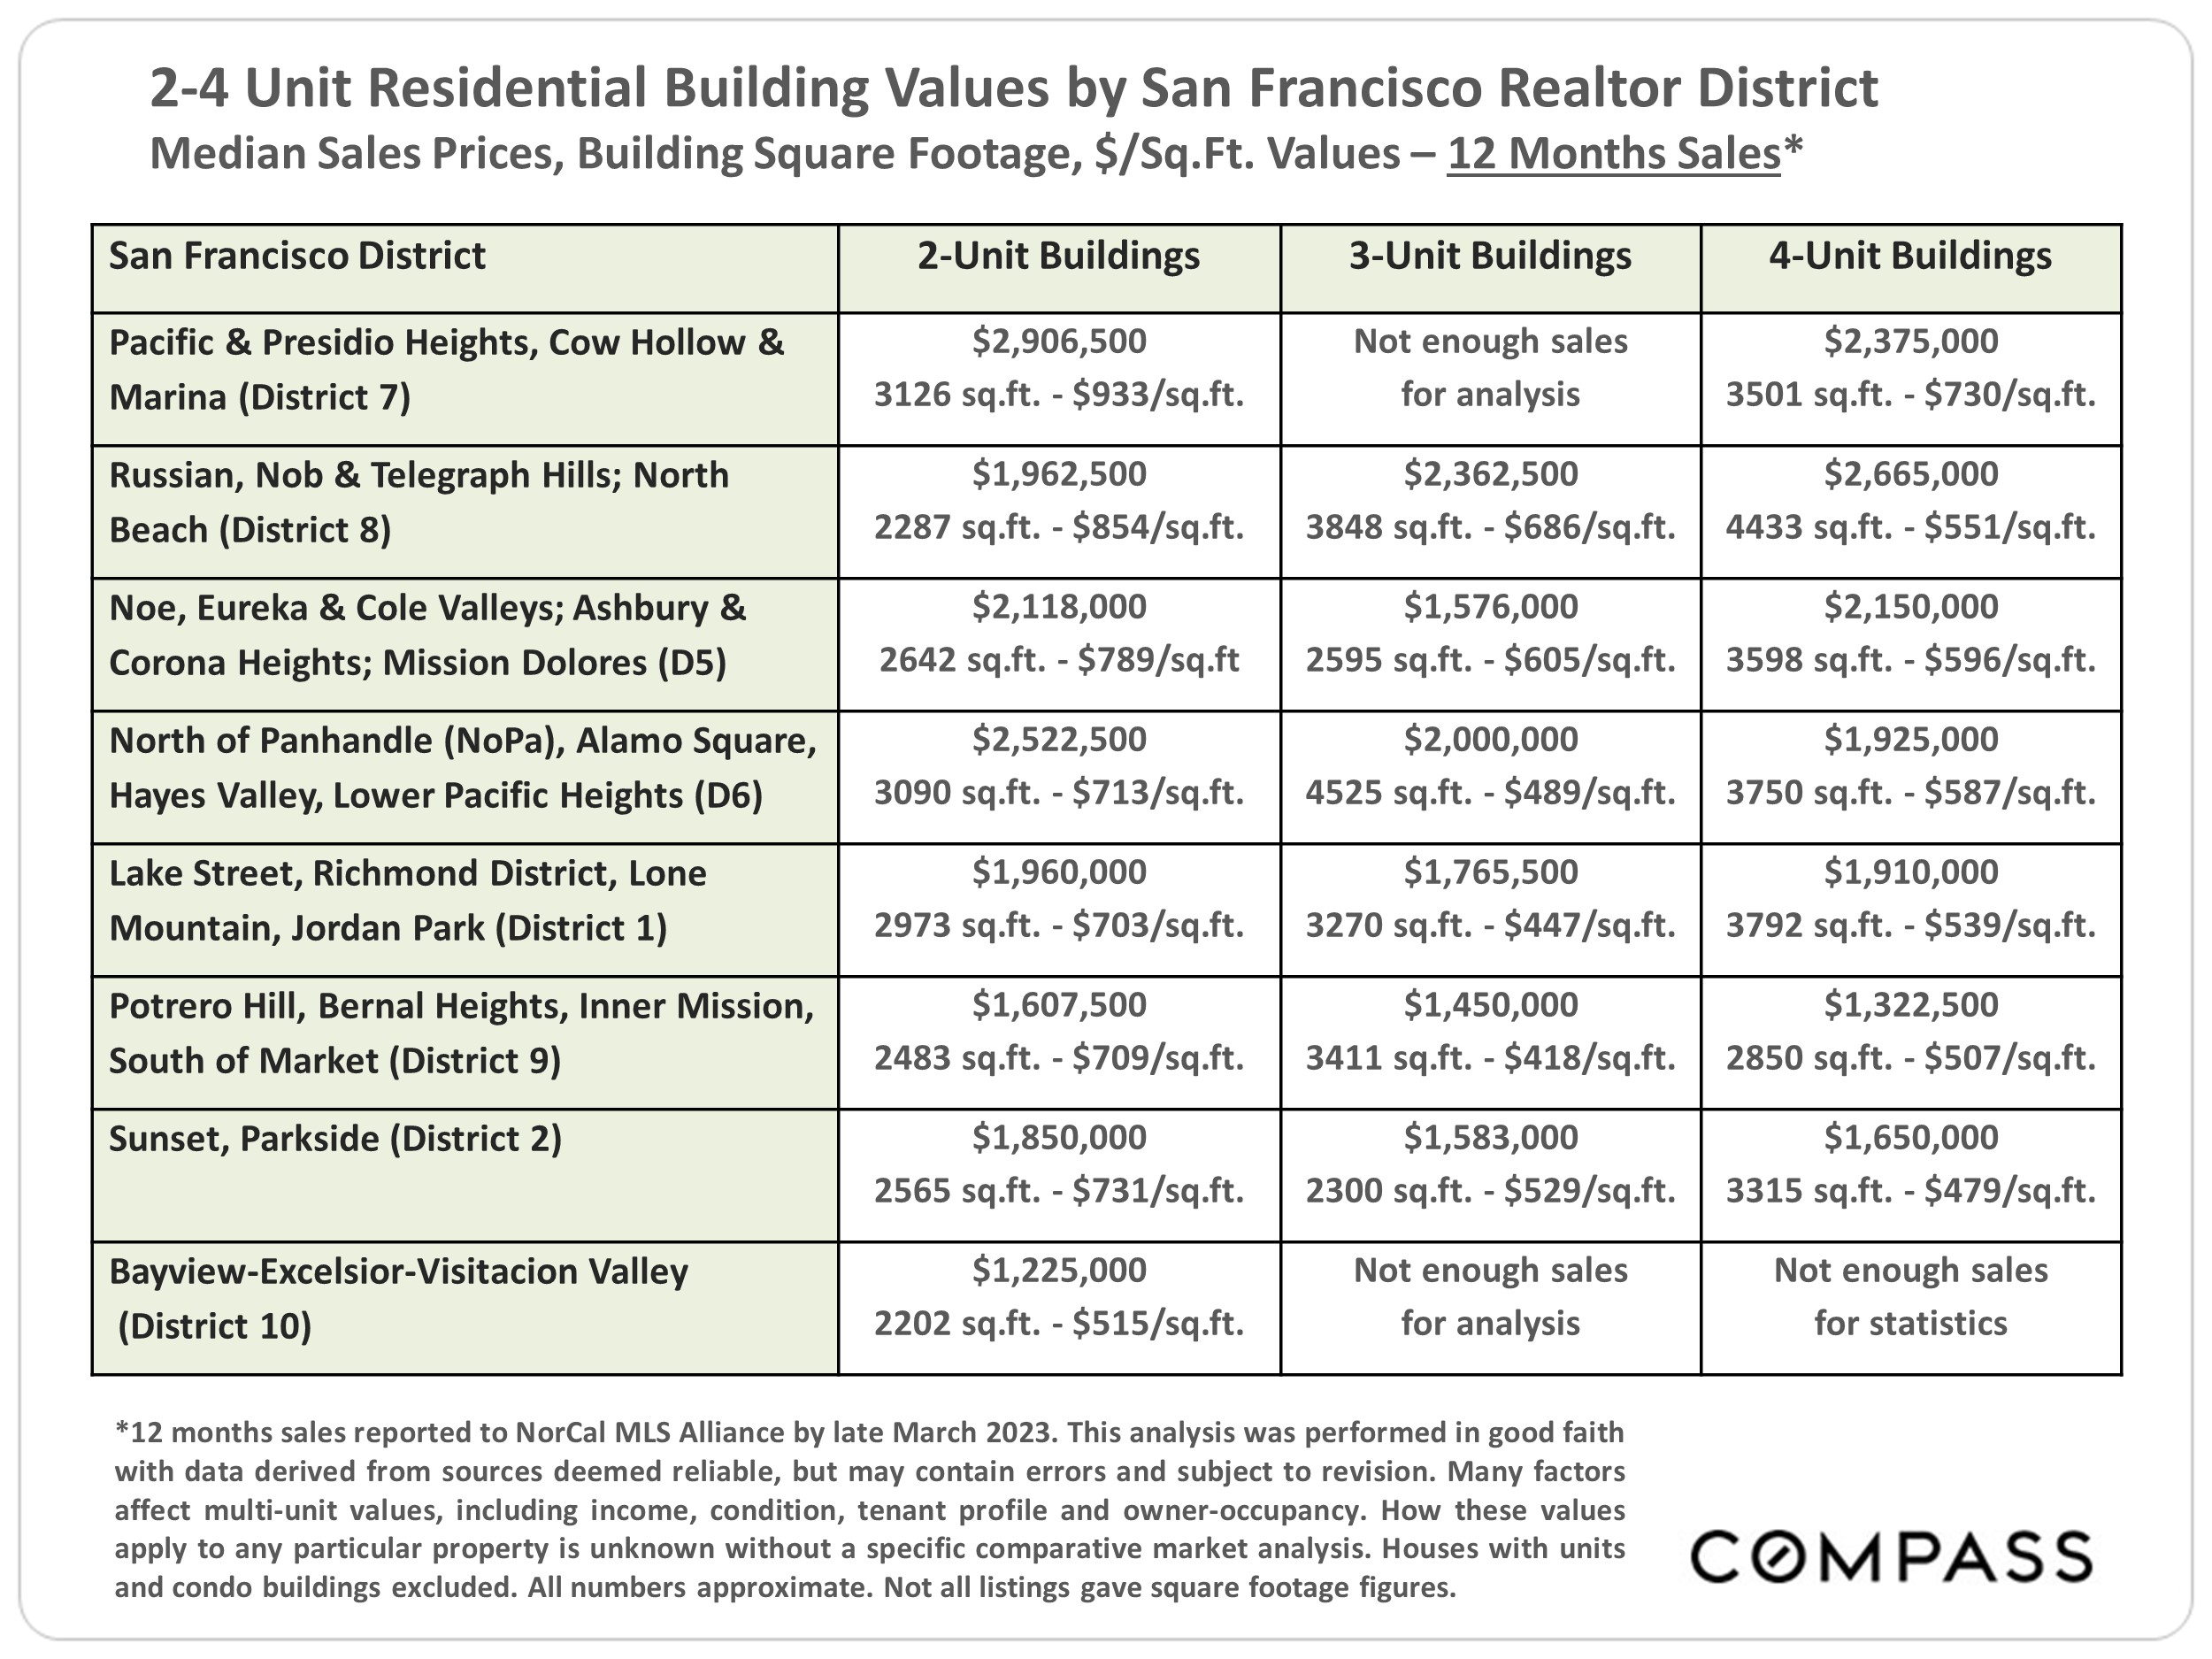
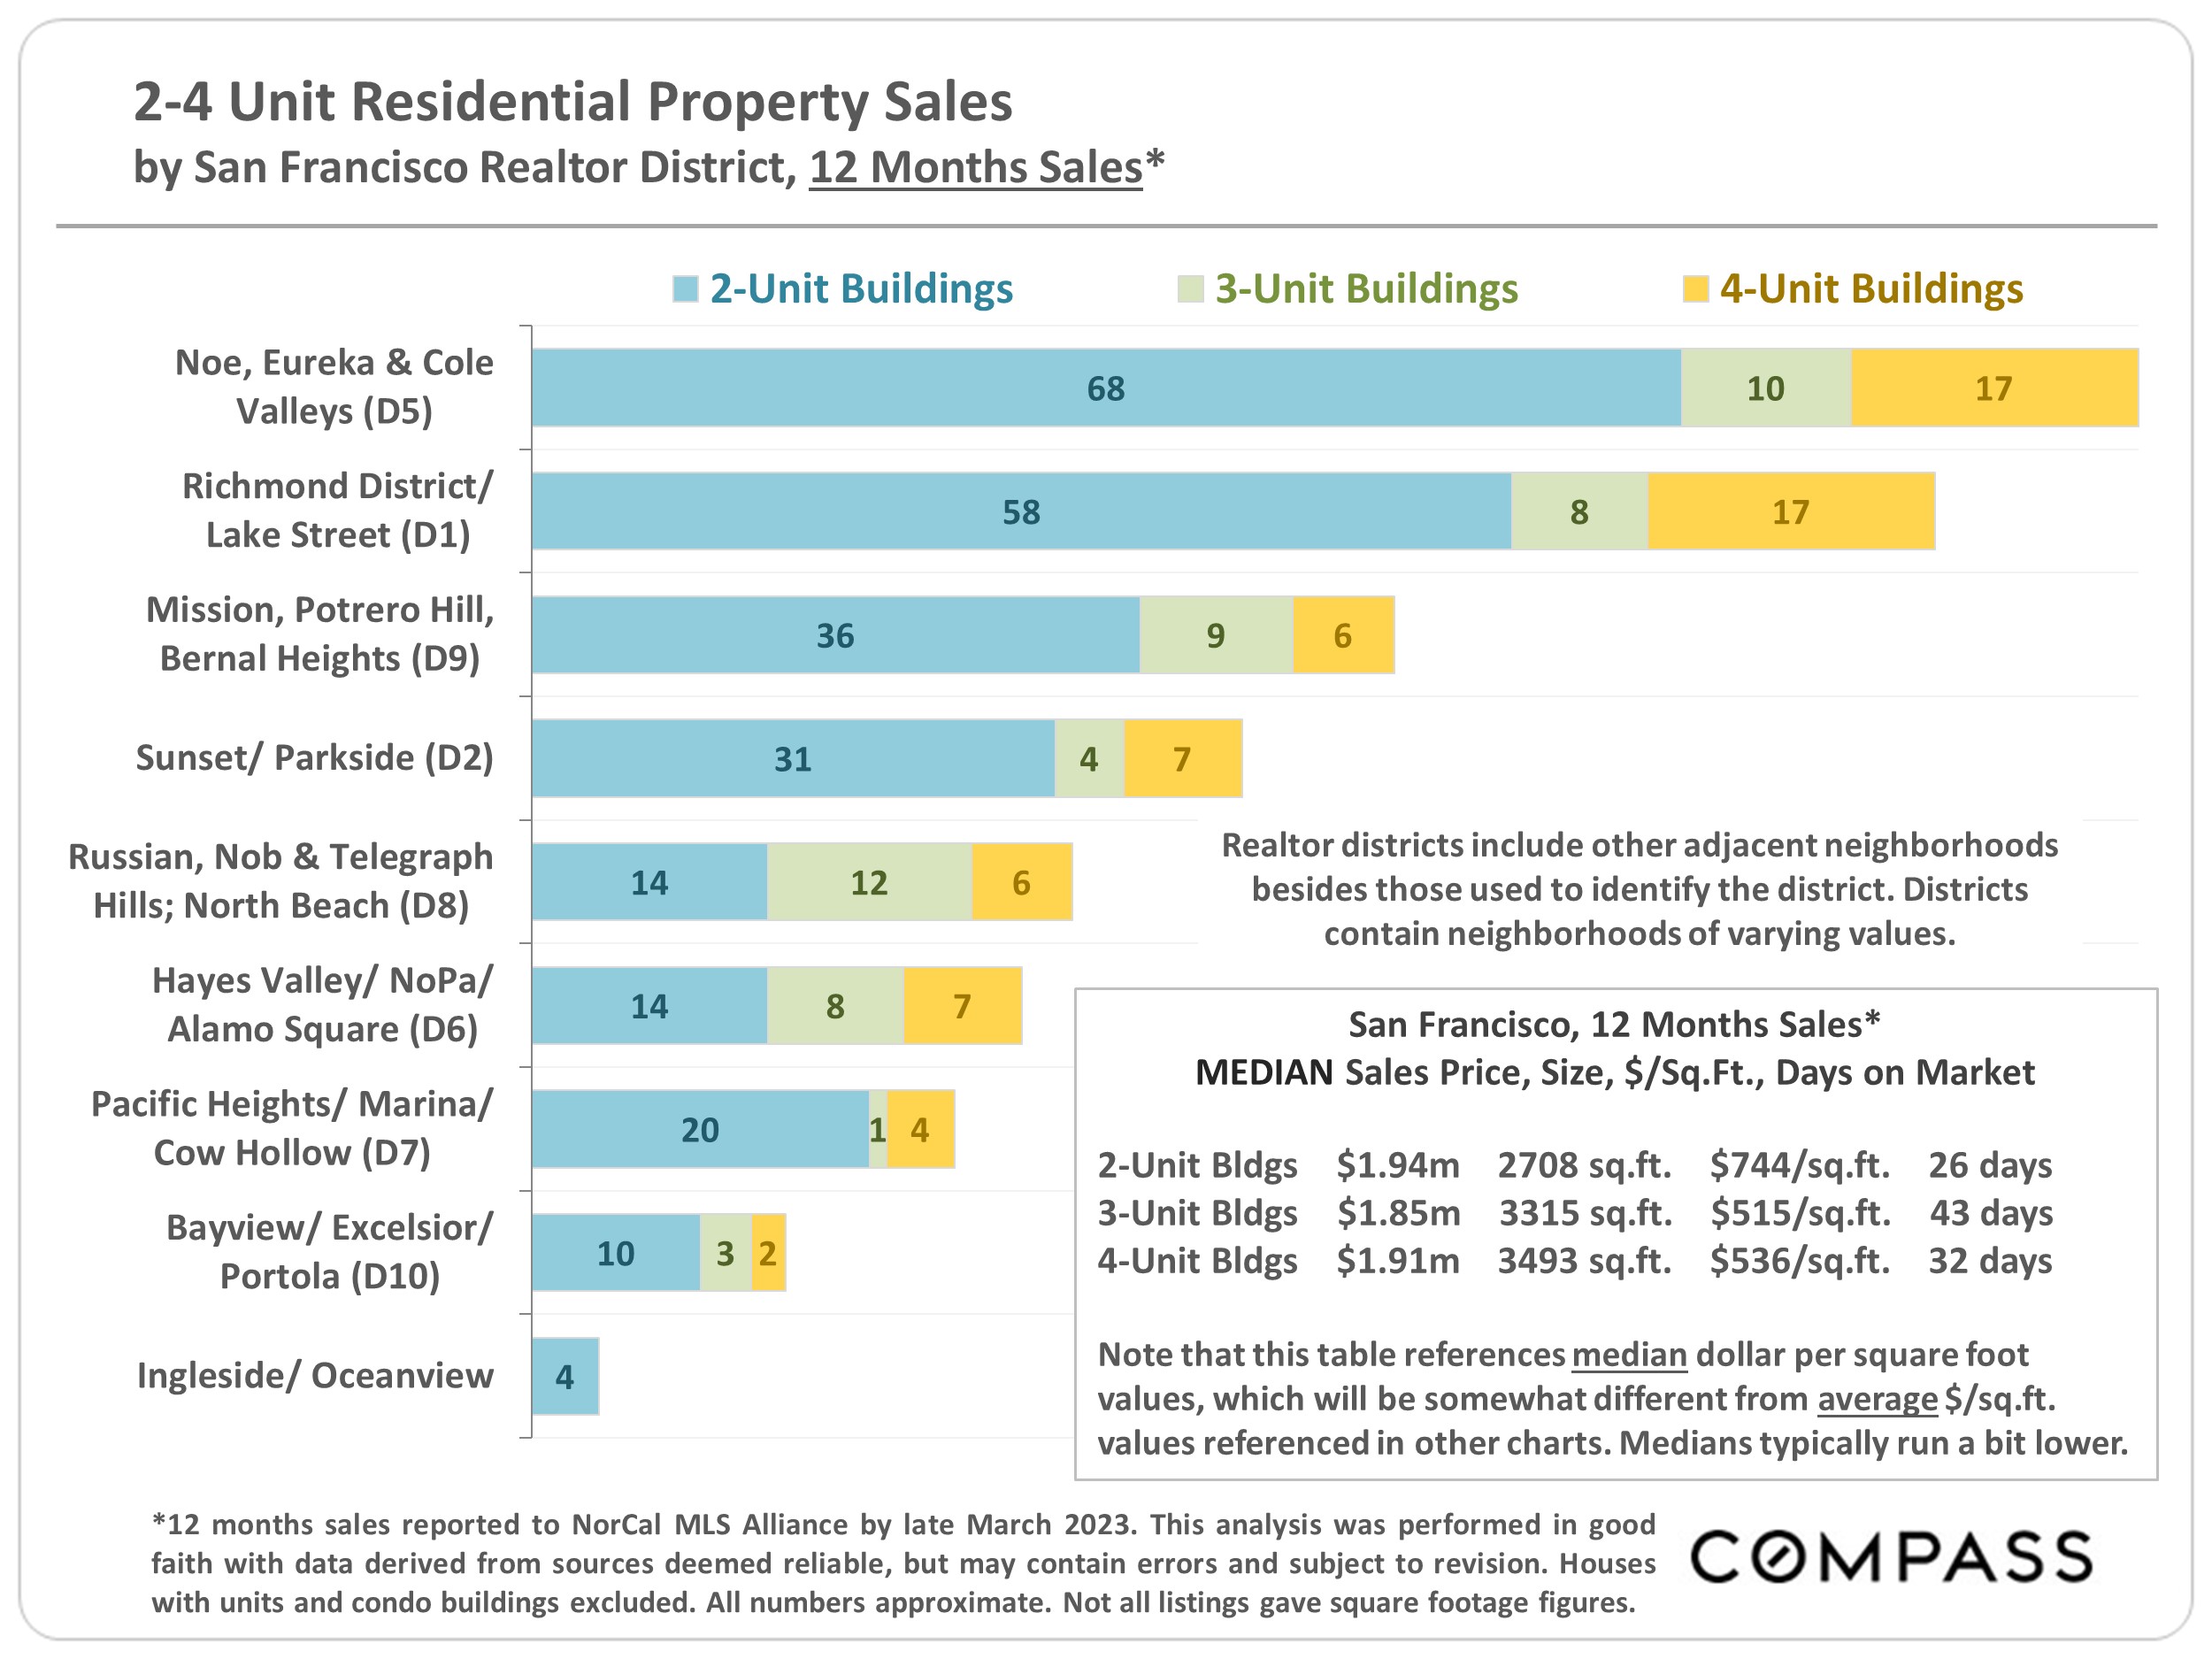
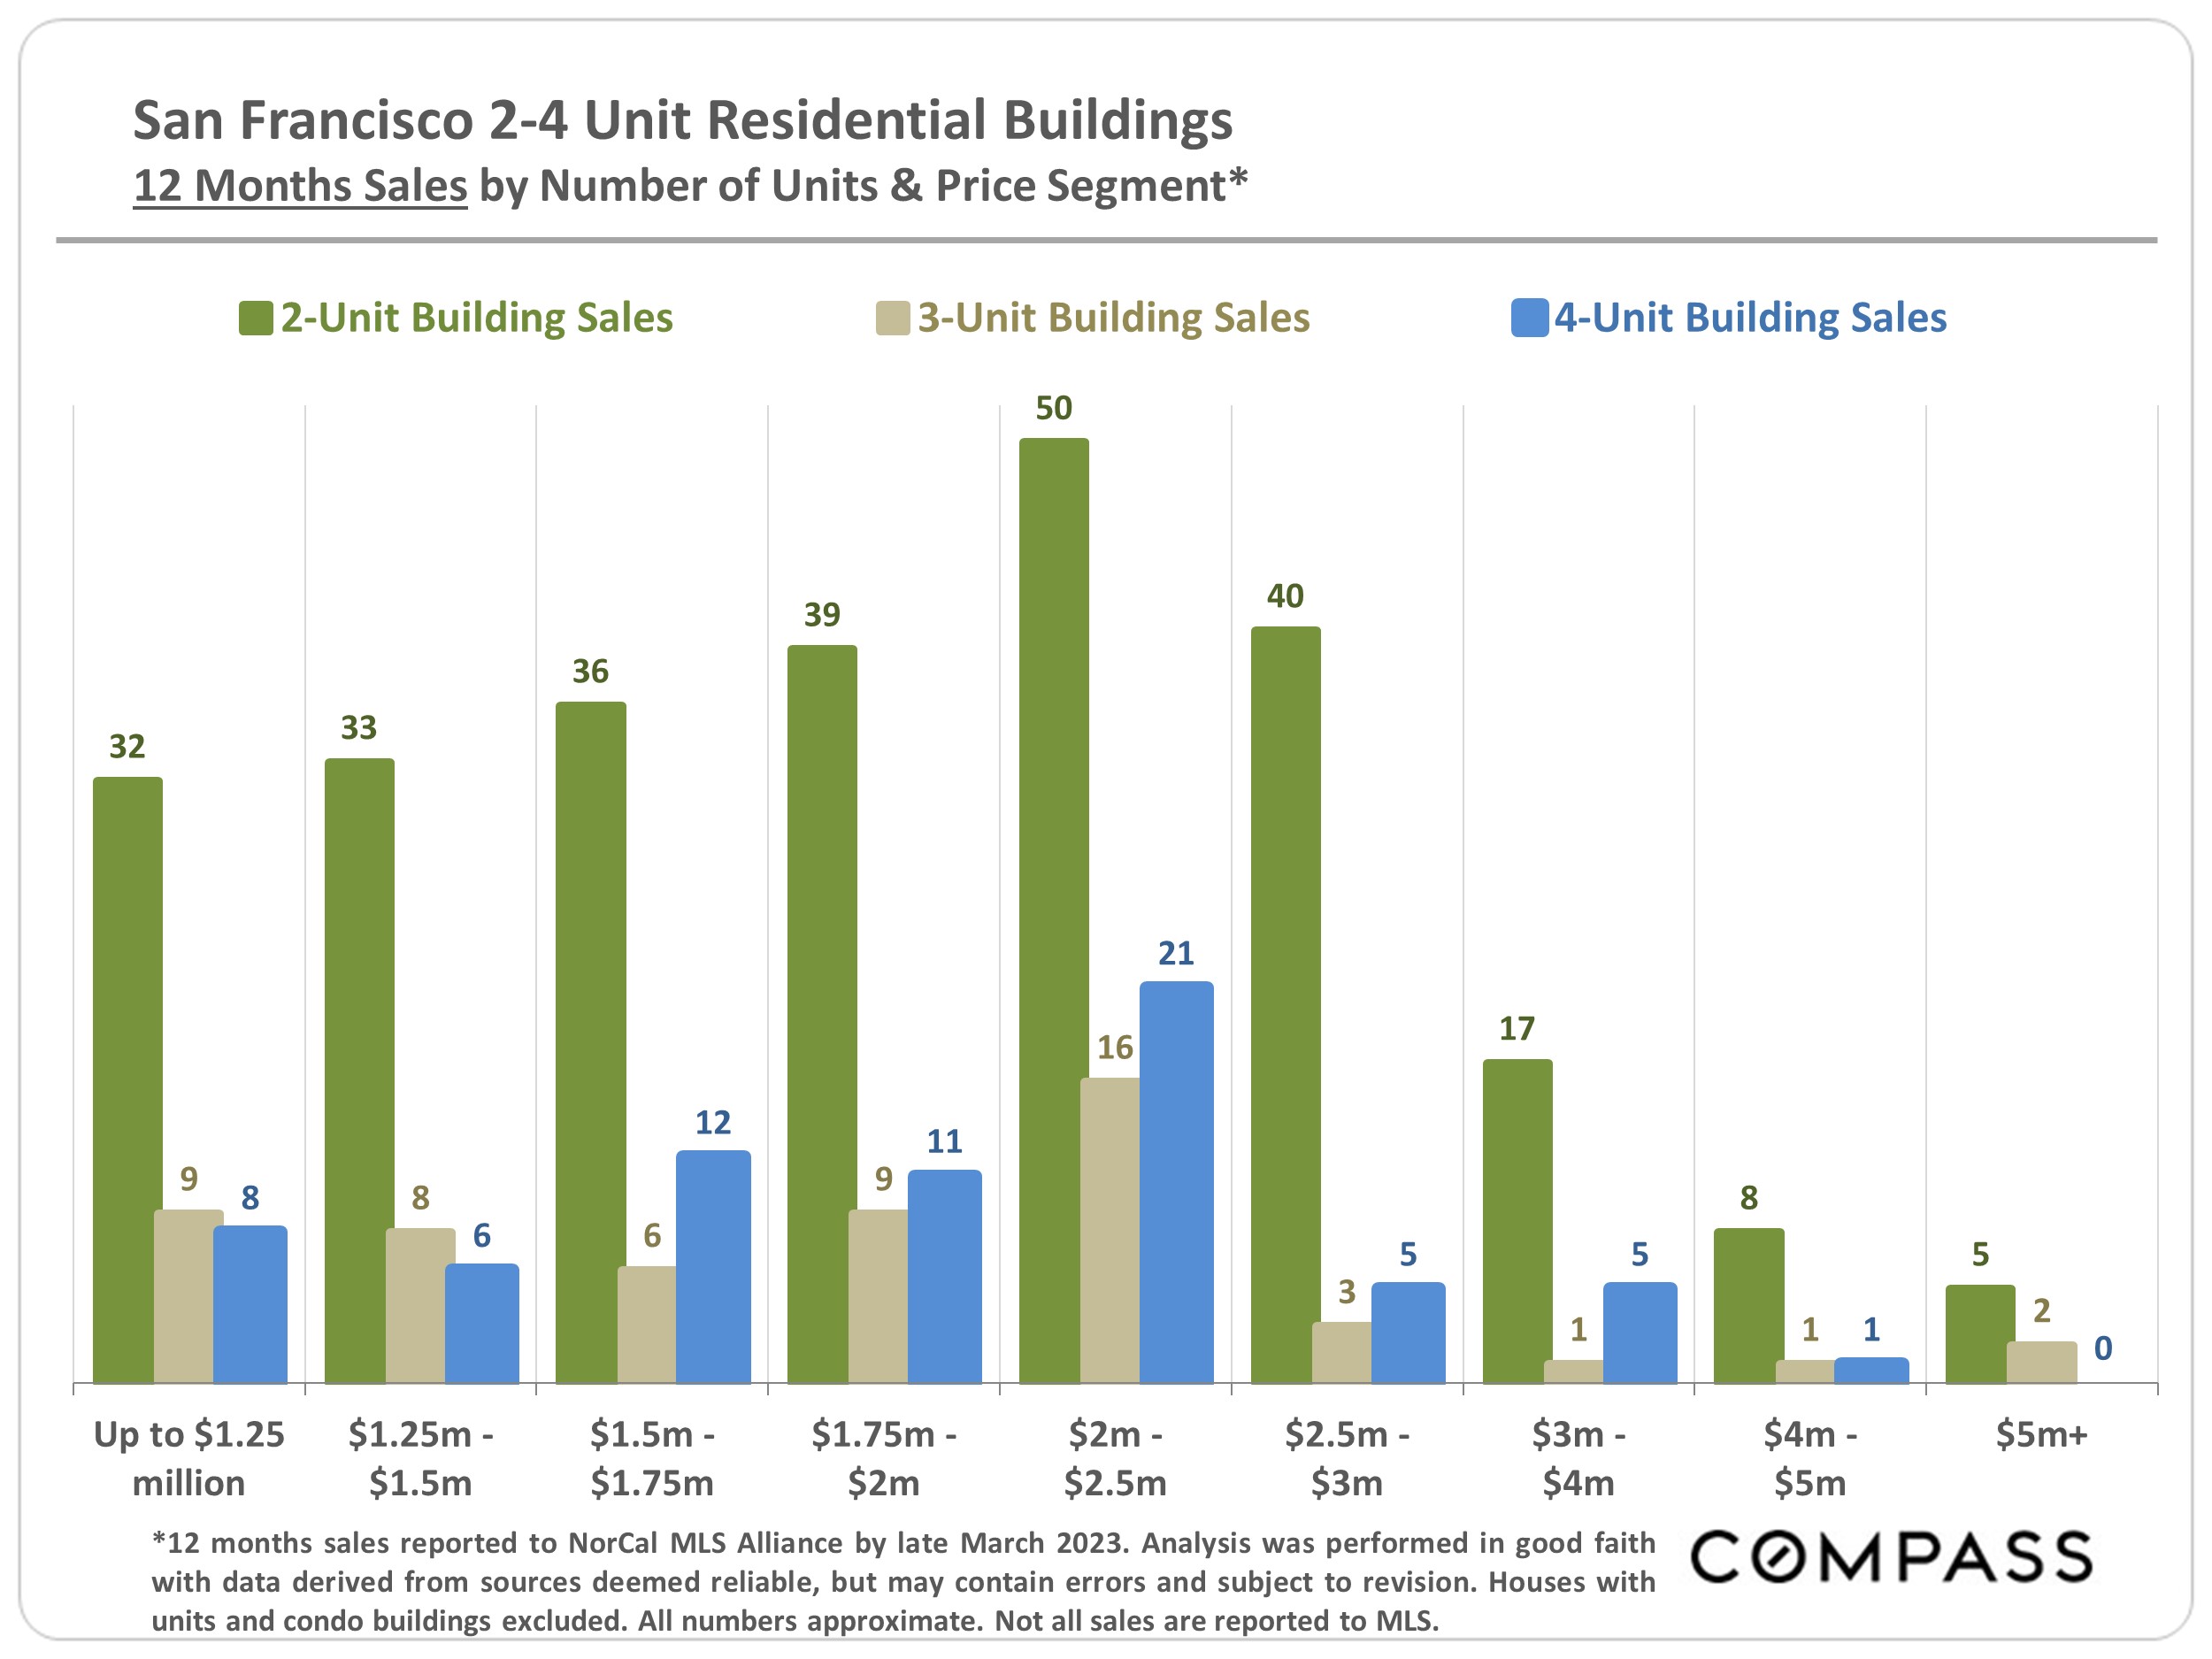
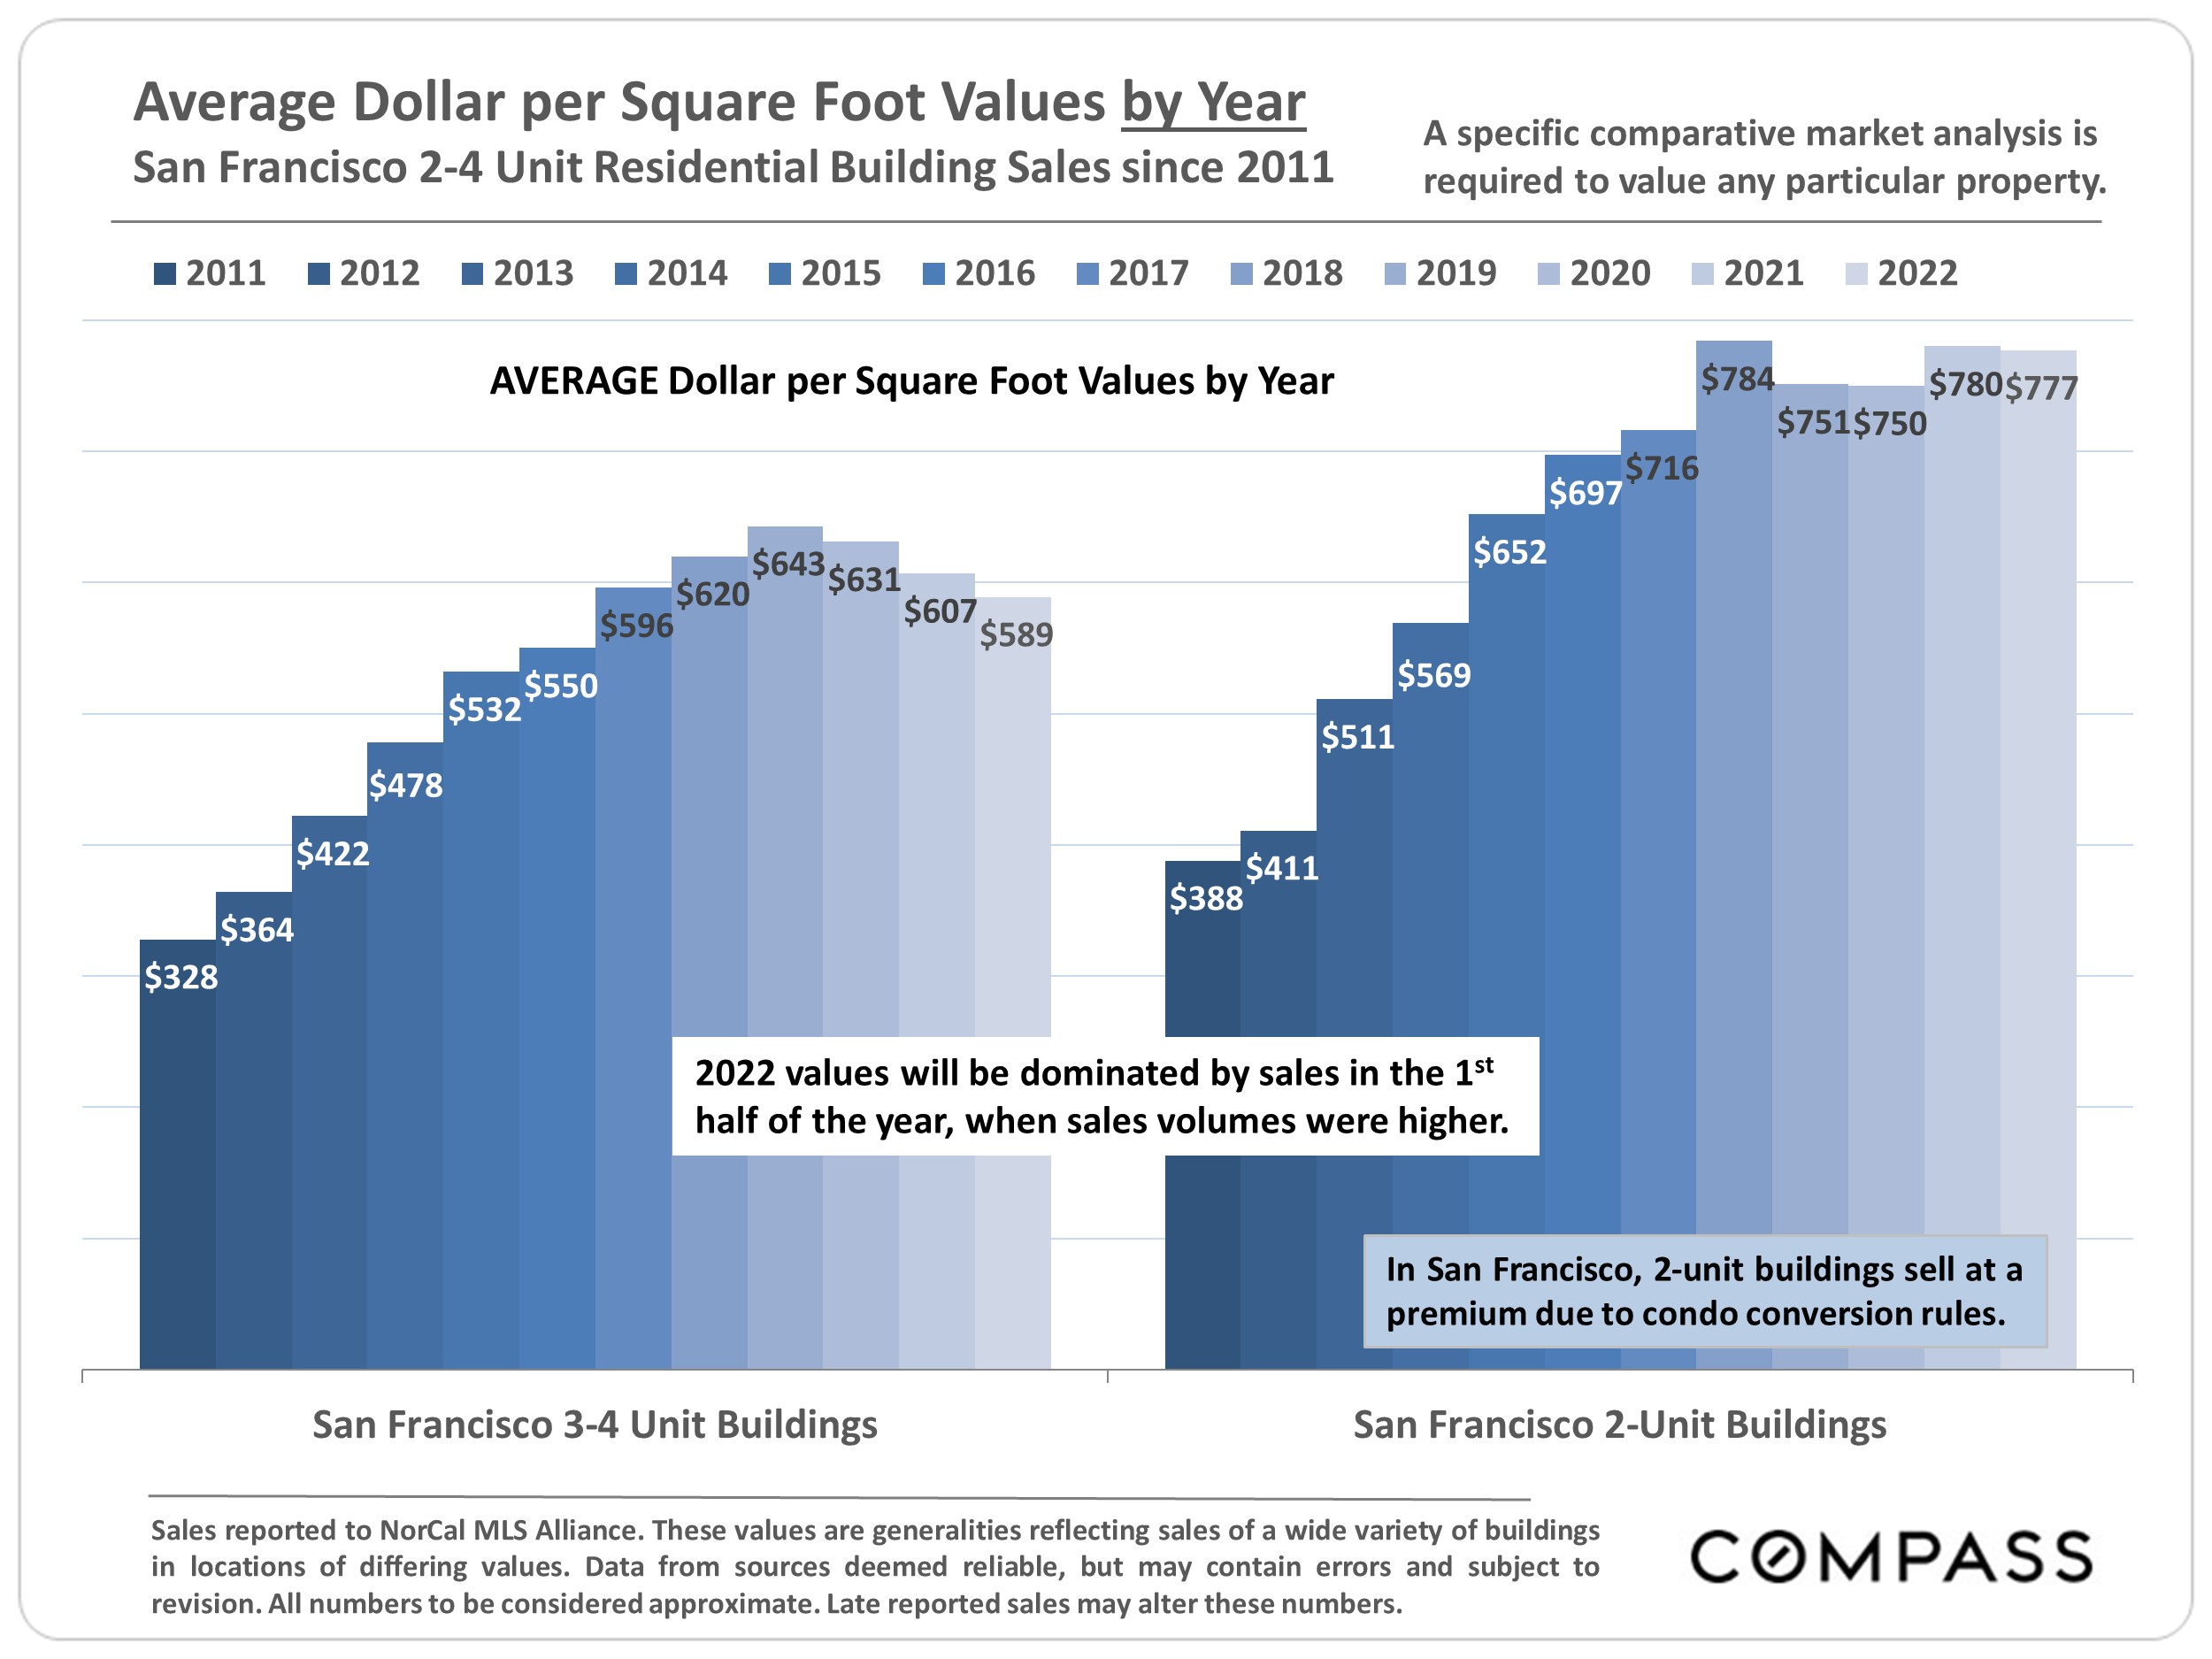
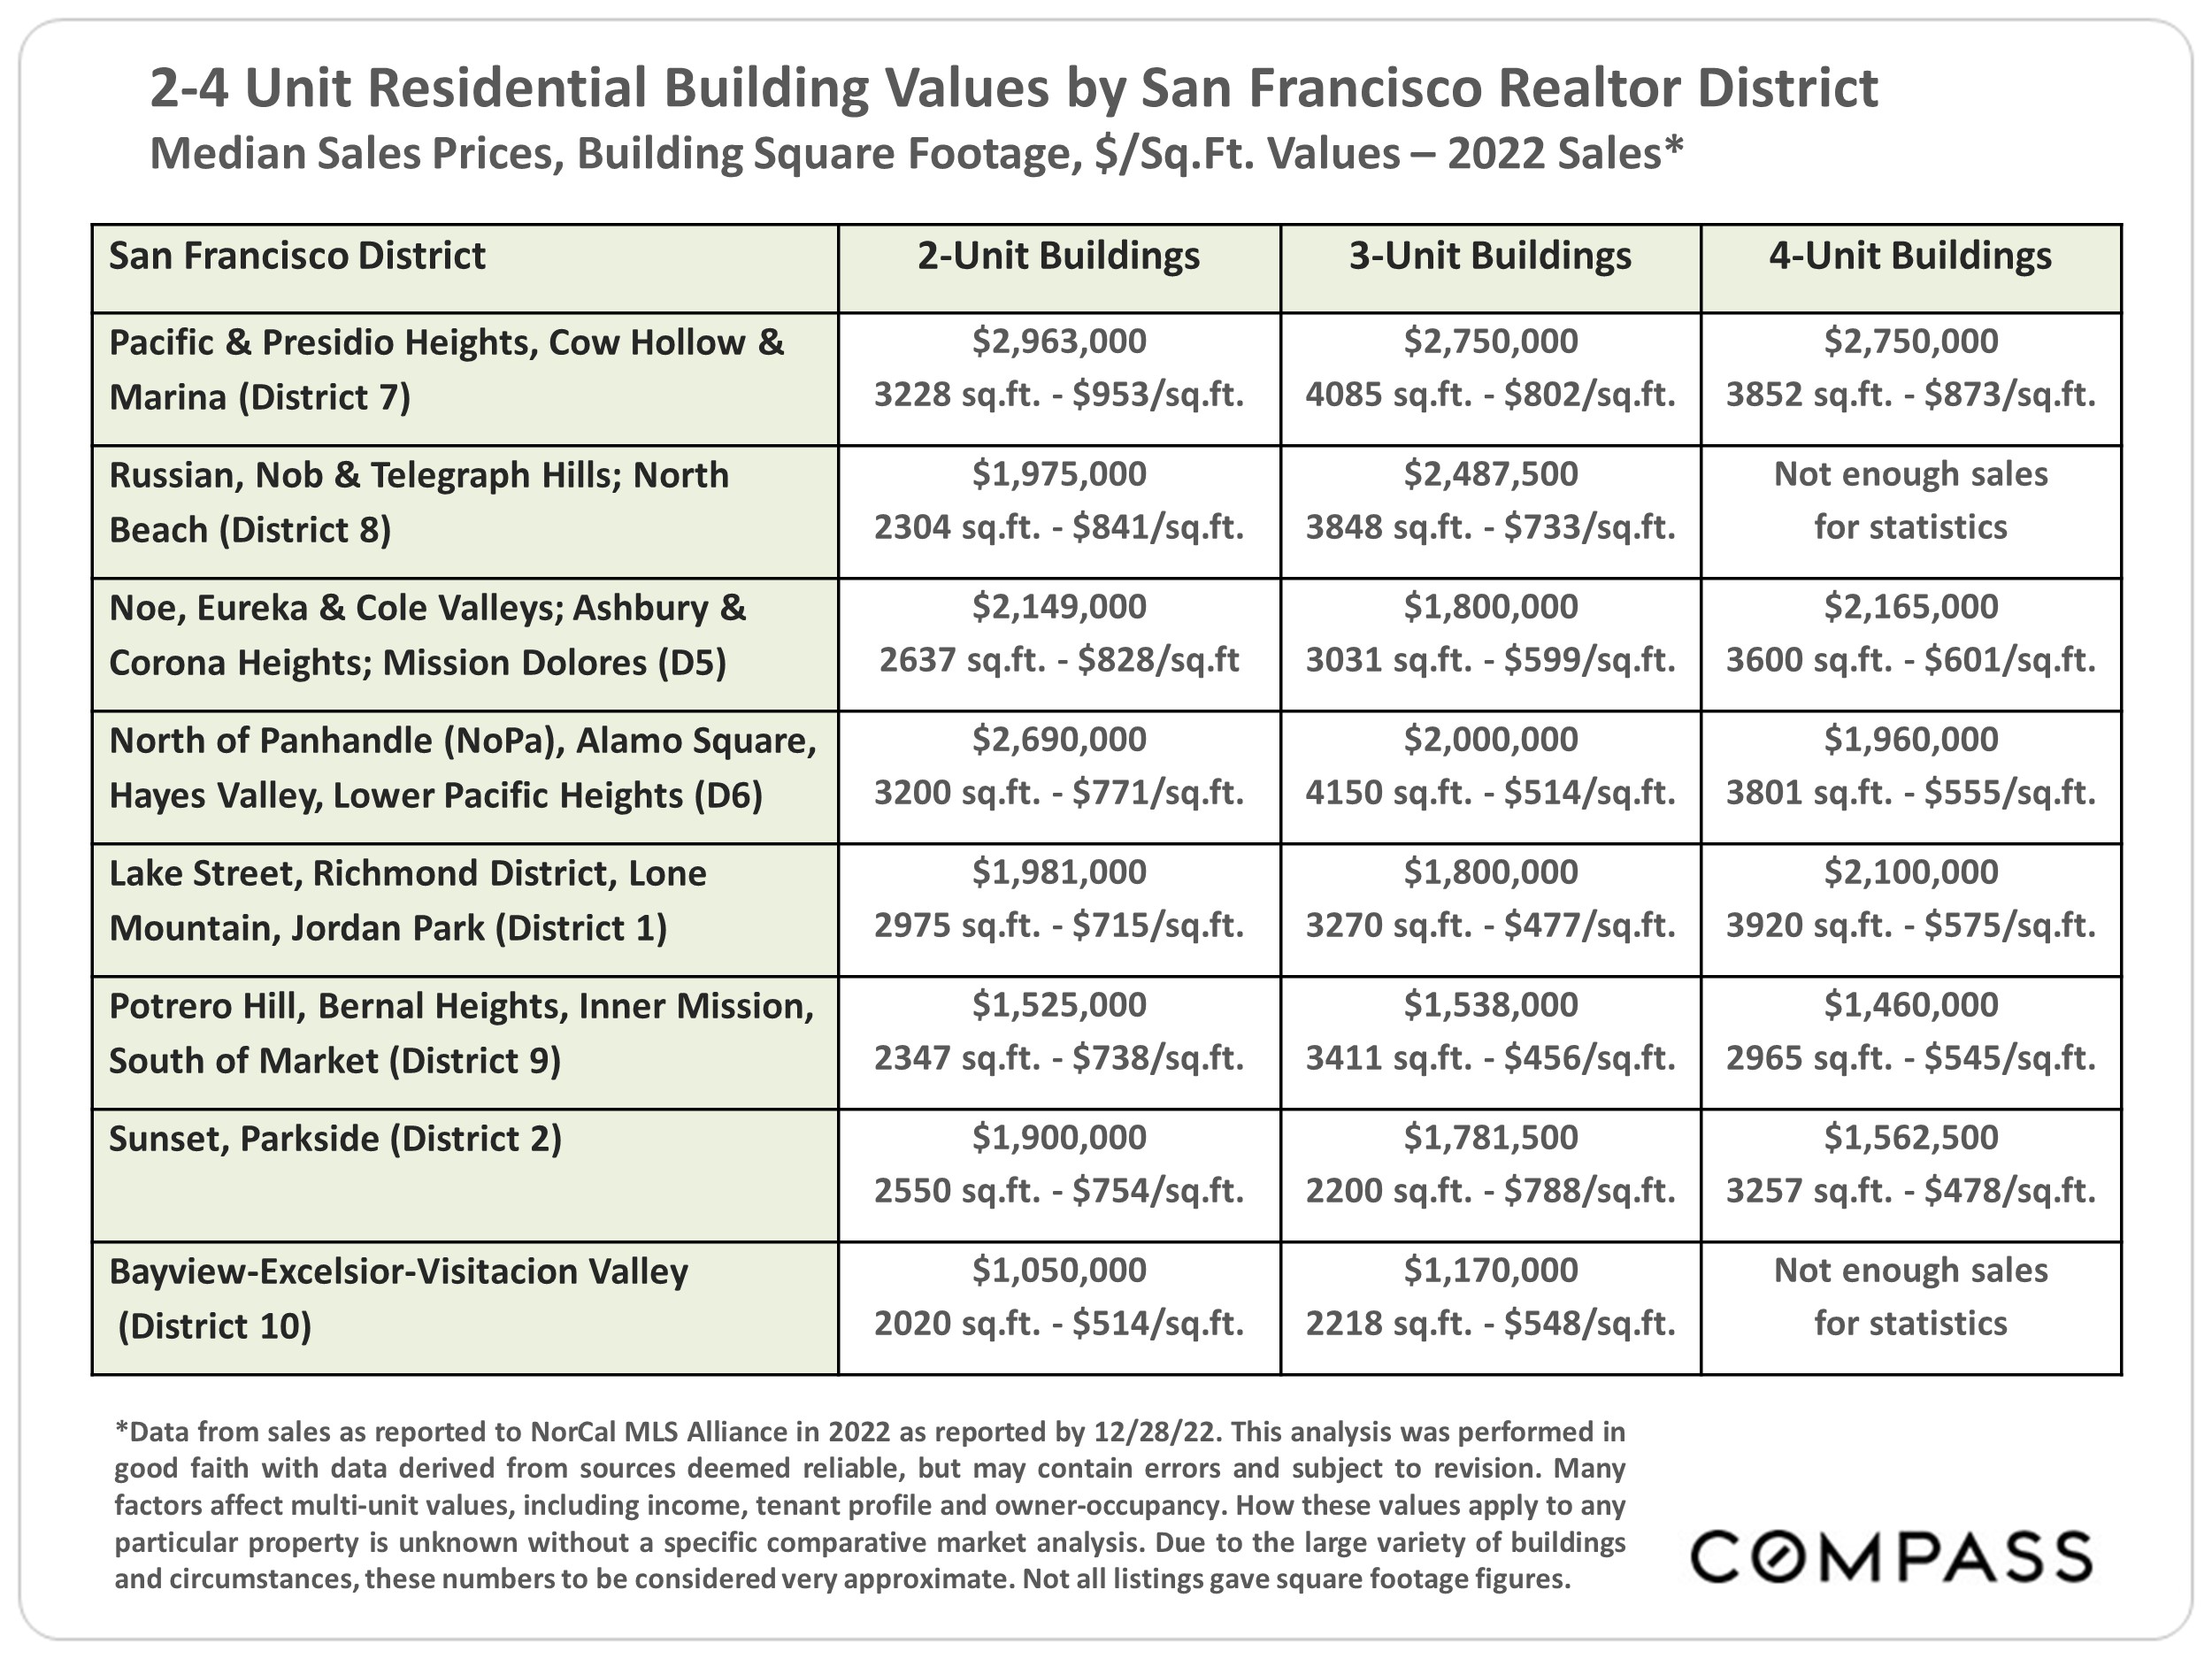
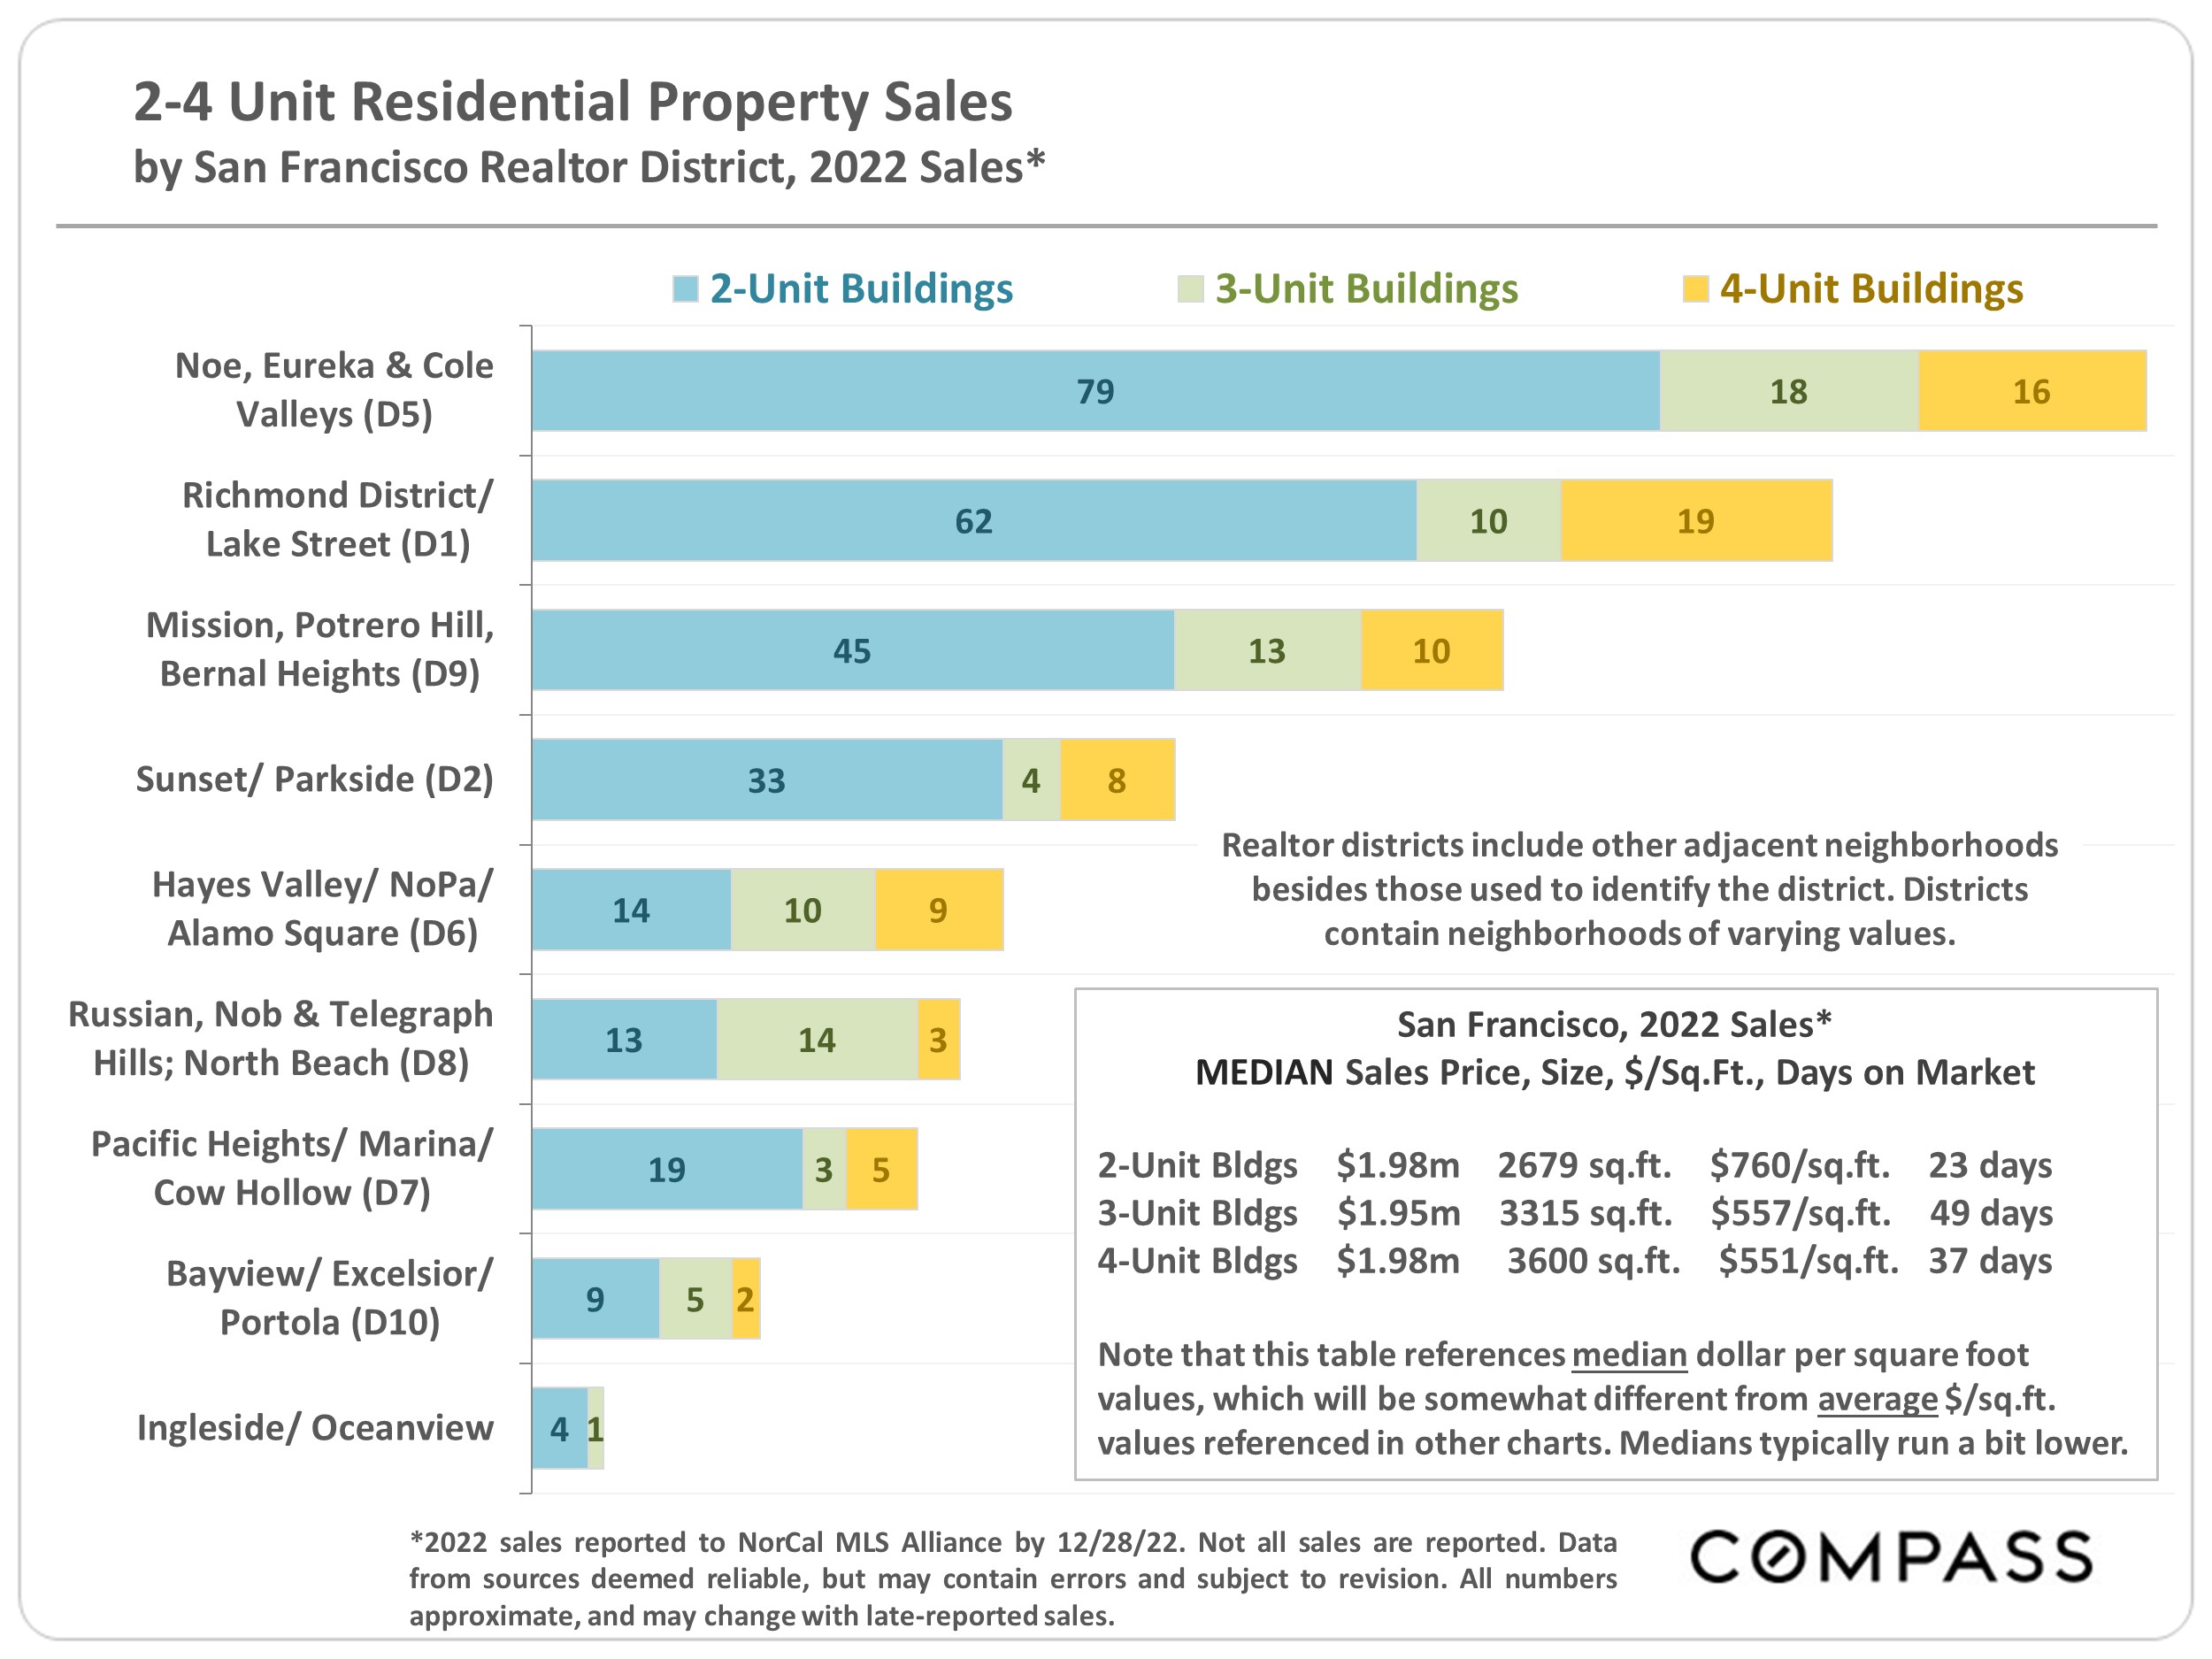
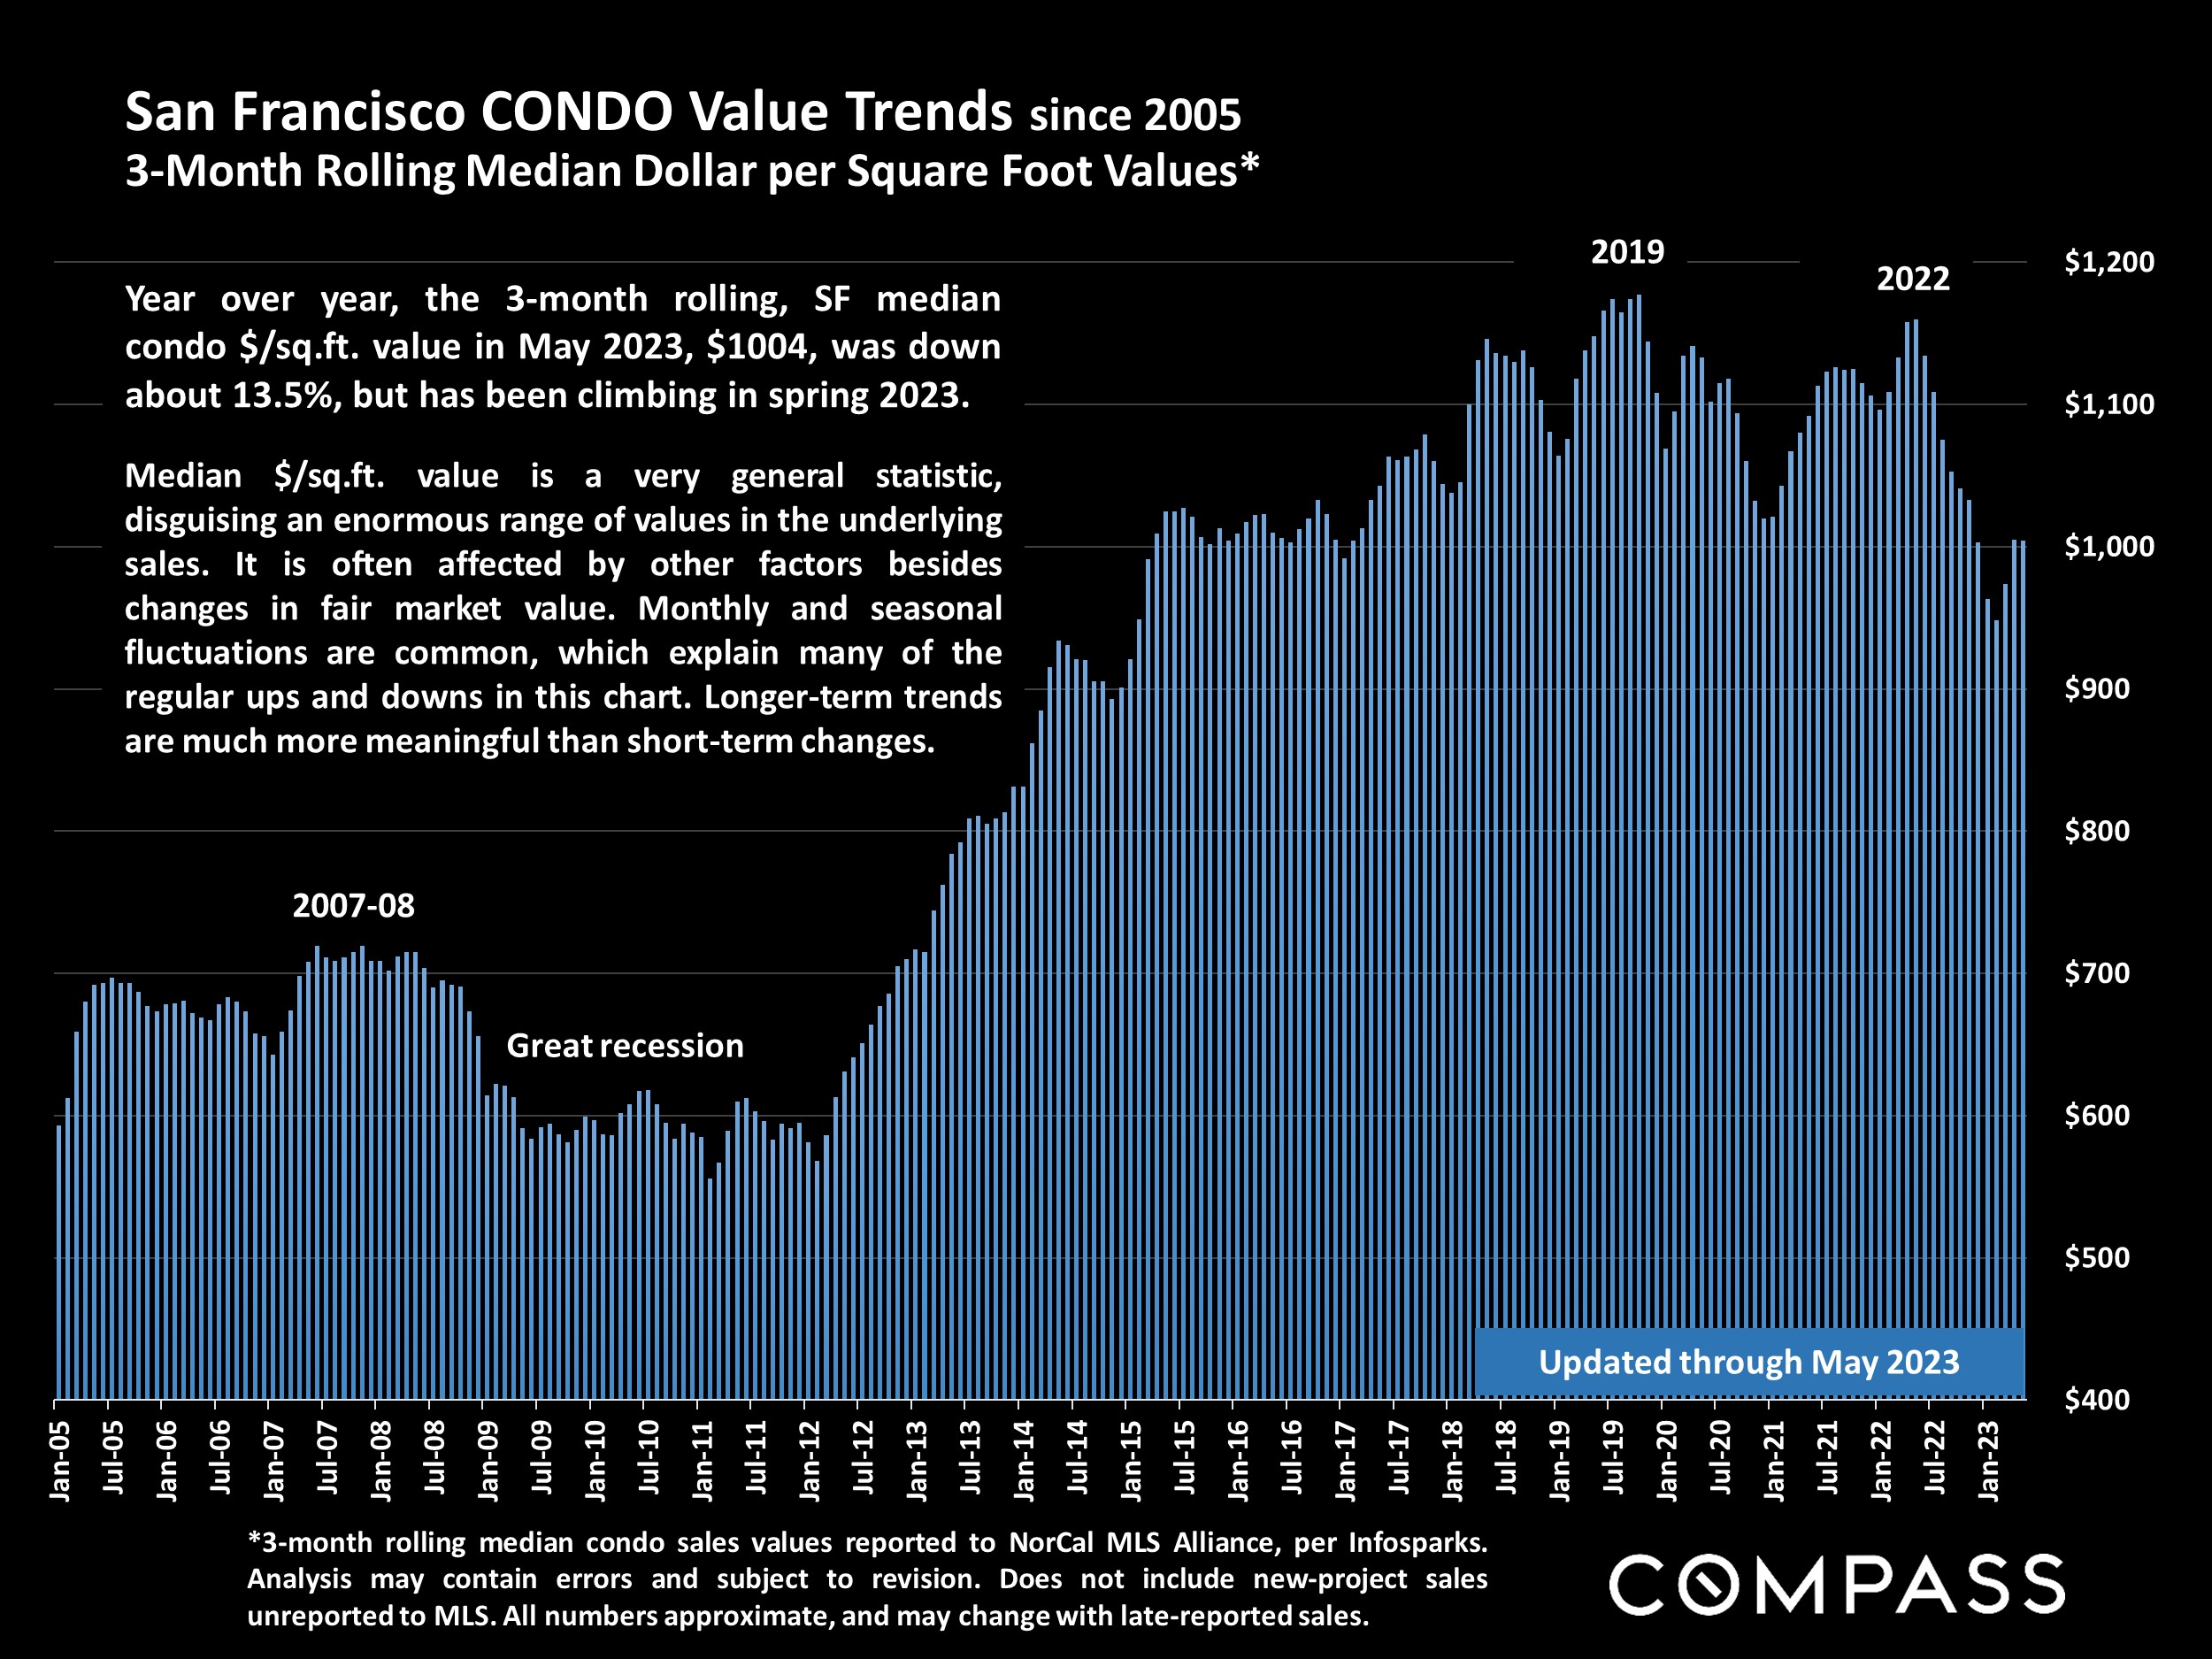
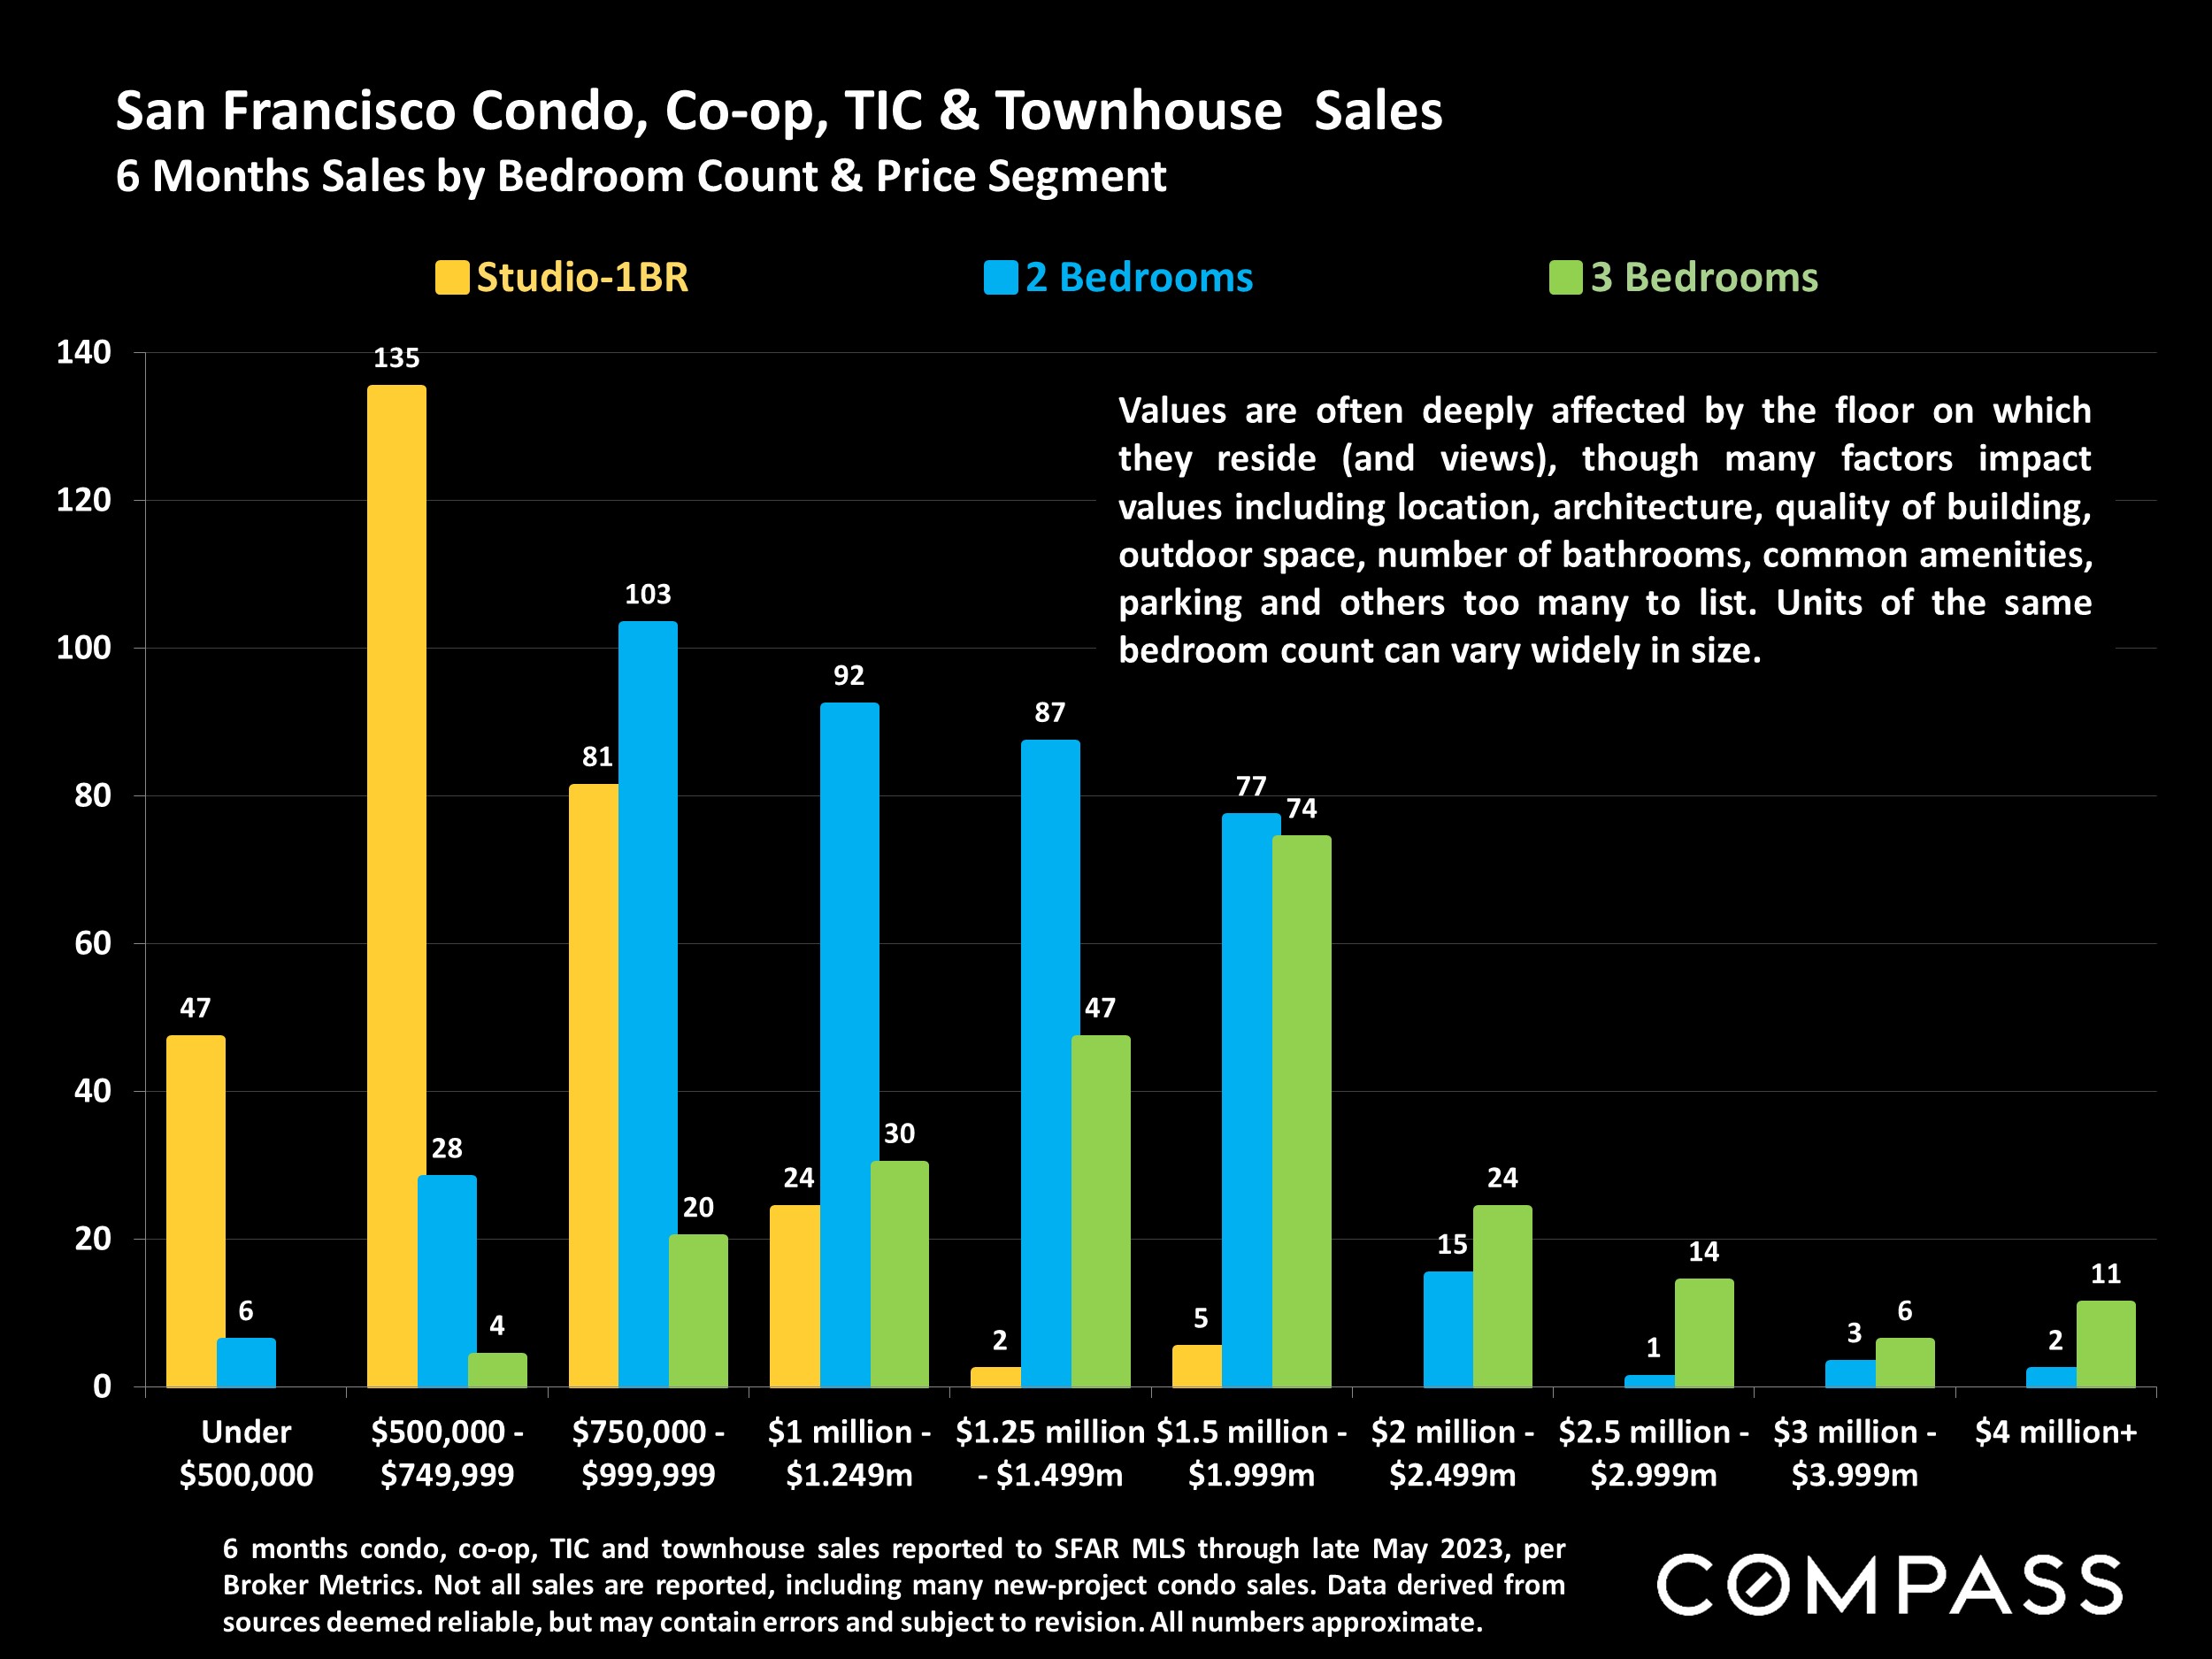
Many aspects of value cannot be adequately reflected in median and average statistics: curb appeal, age, condition, amenities, views, lot size, quality of outdoor space, “bonus” rooms, additional parking, quality of location within the neighborhood, and so on. How any of these statistics apply to any particular home is unknown without a specific comparative market analysis. Median Sales Price is that price at which half the properties sold for more and half for less. It may be affected by seasonality, “unusual” events, or changes in inventory and buying trends, as well as by changes in fair market value. The median sales price for an area will often conceal an enormous variety of sales prices in the underlying individual sales.
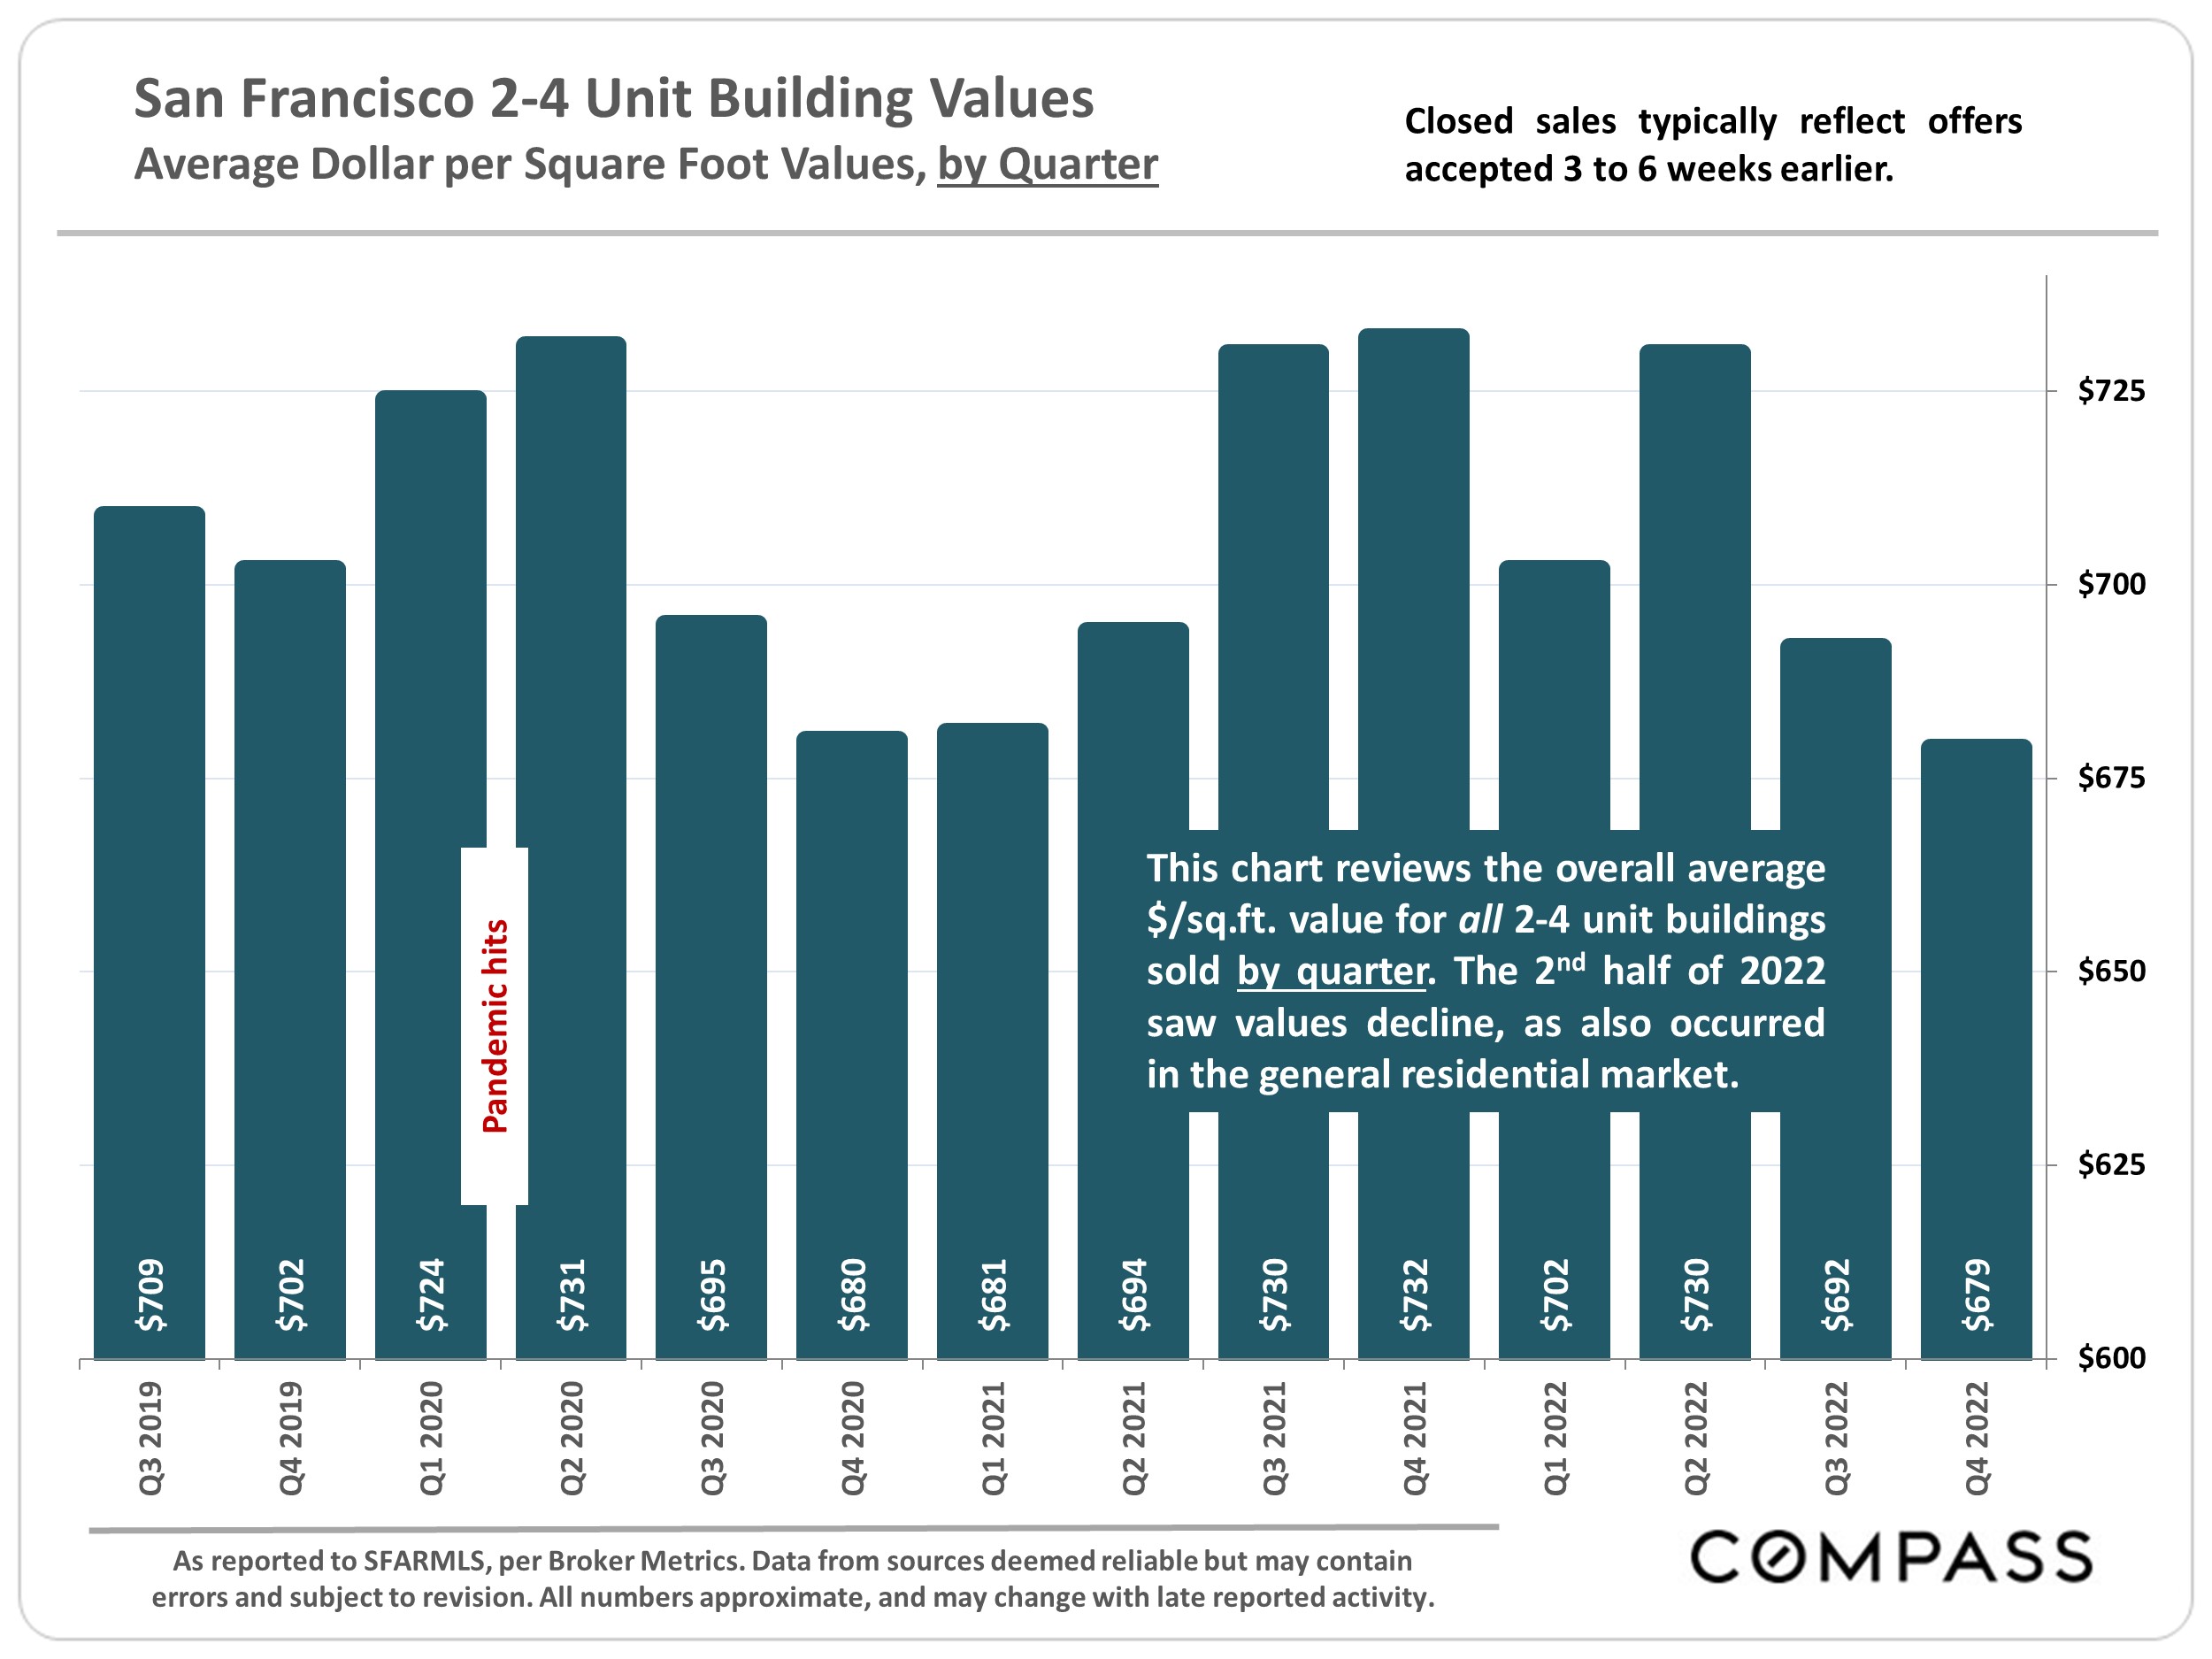
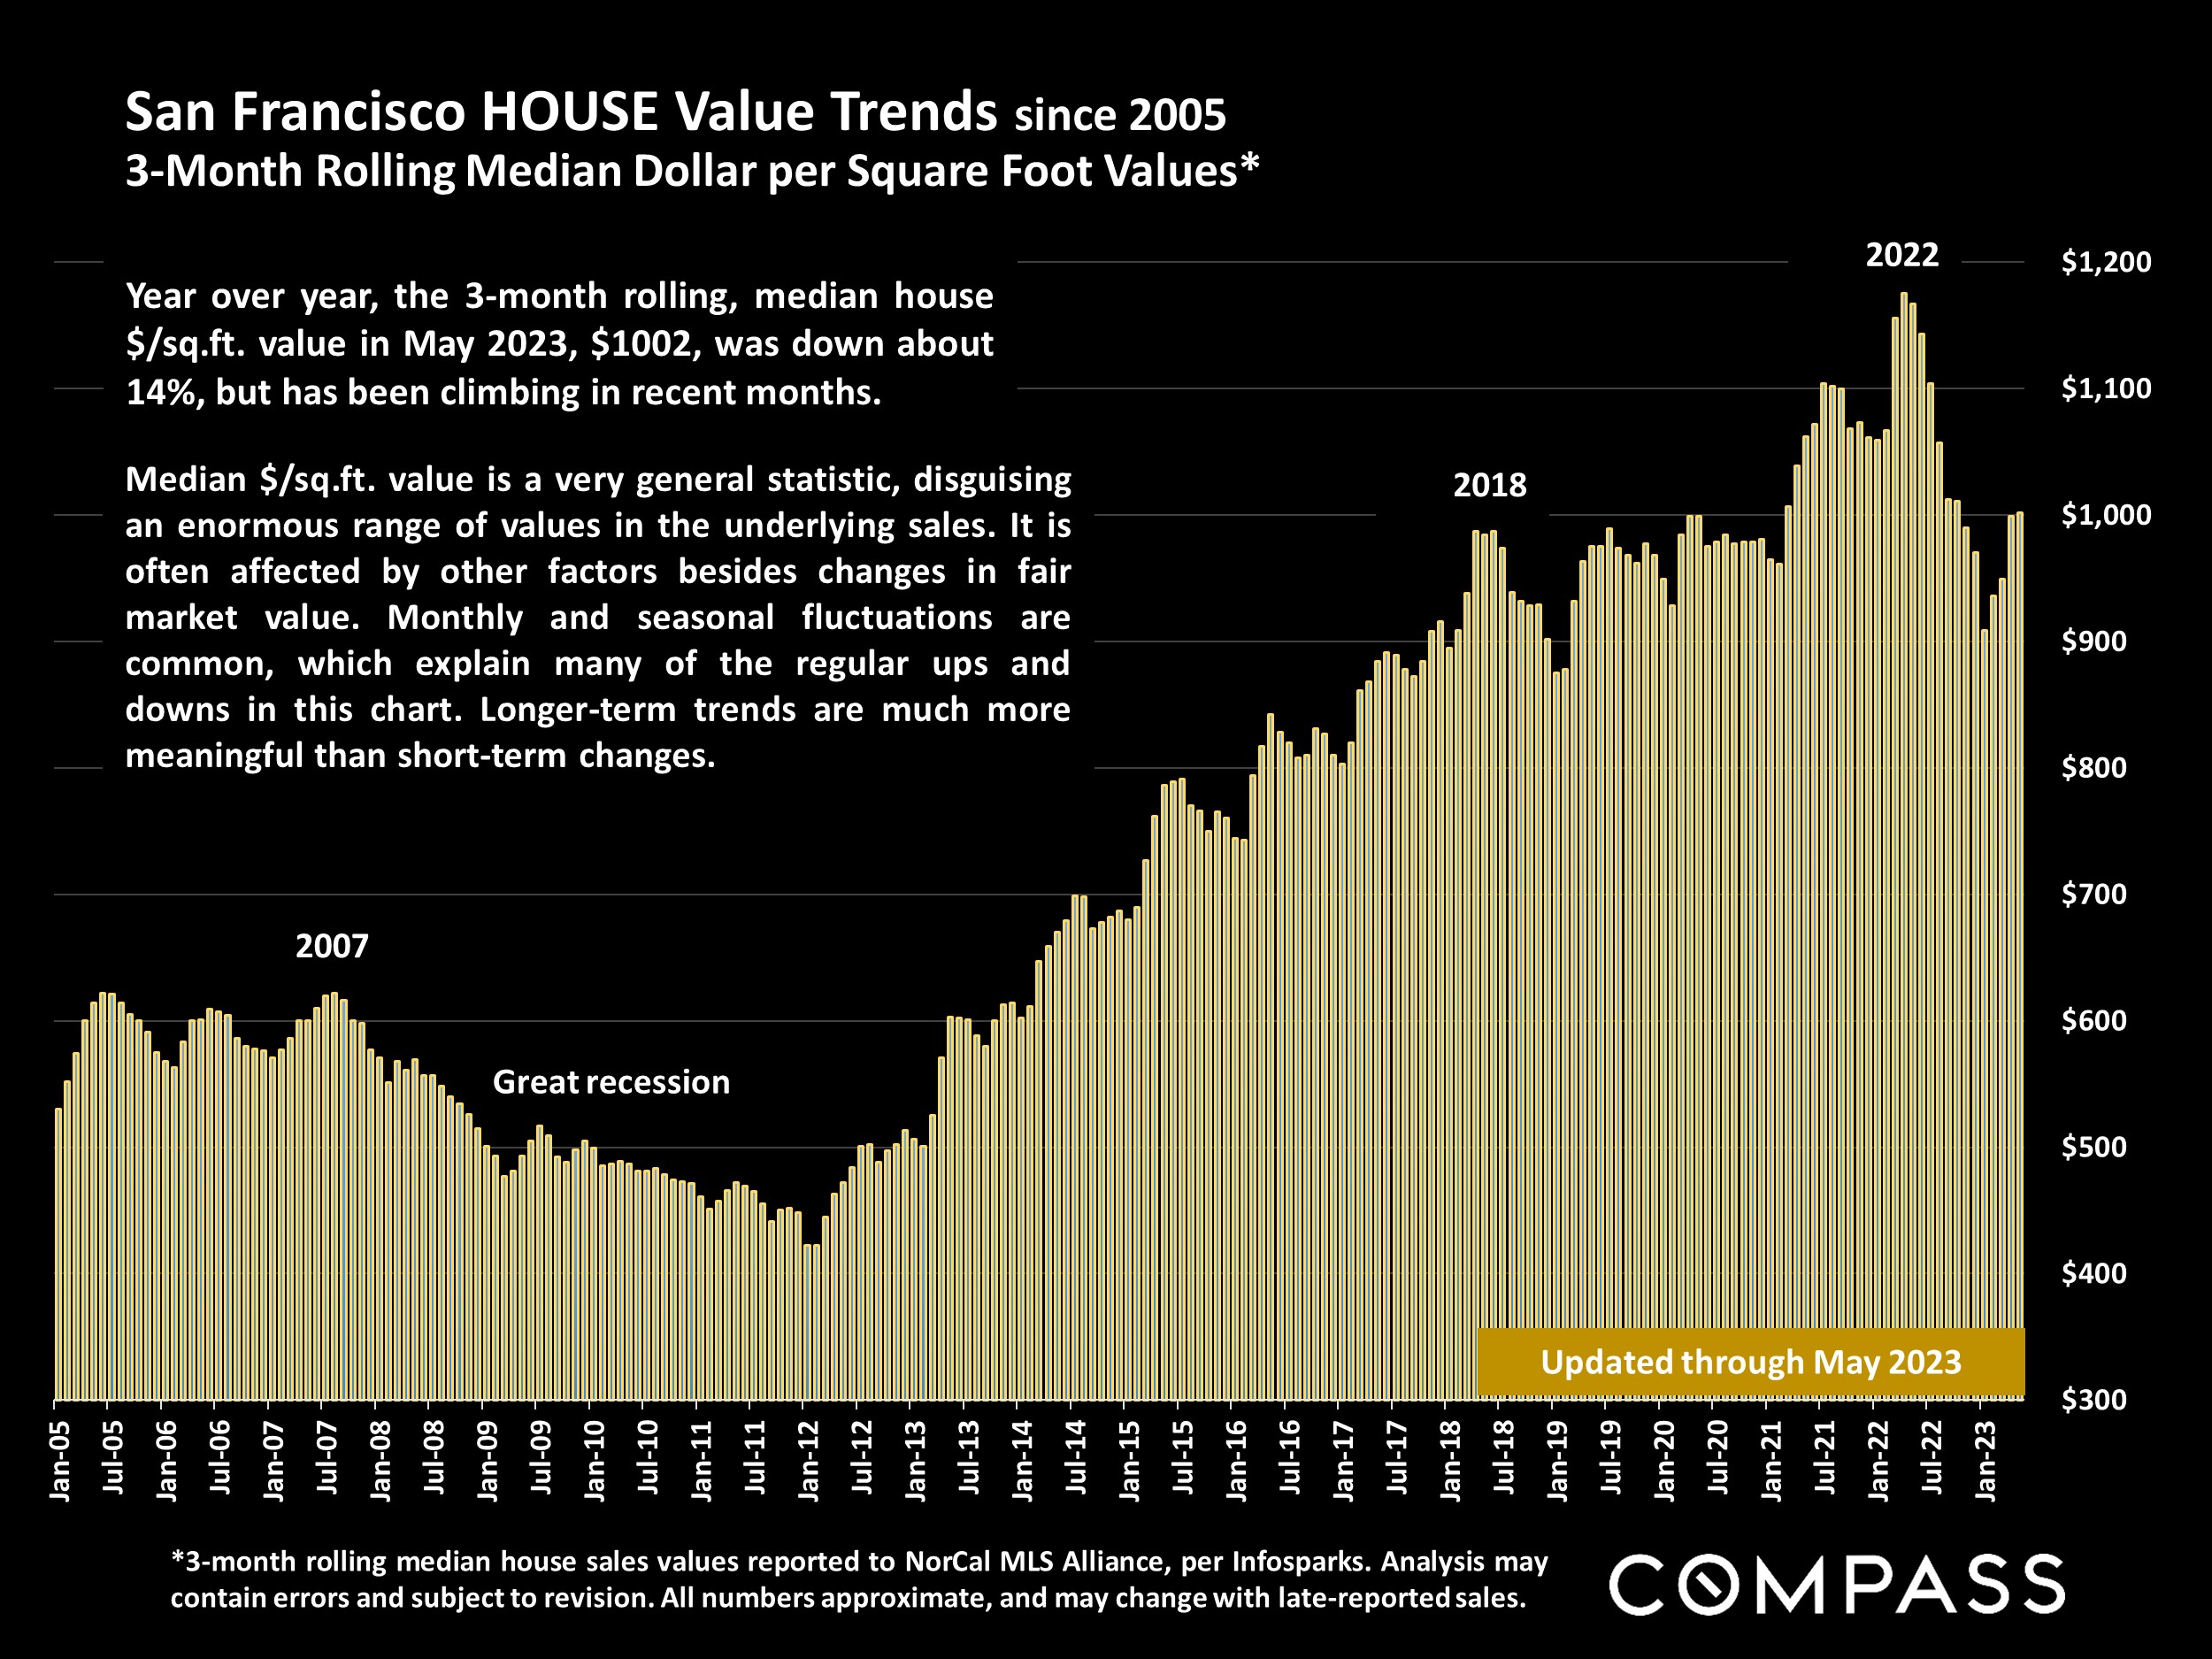
Dollar per Square Foot is based upon the home’s interior living space and does not include garages, unfinished attics and basements, rooms built without permit, patios, decks or yards (though all those can add value to a home). These figures are usually derived from appraisals or tax records, but are sometimes unreliable (especially for older homes) or unreported altogether. The calculation can only be made on those home sales that reported square footage.
Compass is a real estate broker licensed by the State of California, DRE 01527235. Equal Housing Opportunity. This report has been prepared solely for information purposes. The information herein is based on or derived from information generally available to the public and/or from sources believed to be reliable. No representation or warranty can be given with respect to the accuracy or completeness of the information. Compass disclaims any and all liability relating to this report, including without limitation any express or implied representations or warranties for statements contained in, and omissions from, the report. Nothing contained herein is intended to be or should be read as any regulatory, legal, tax, accounting or other advice and Compass does not provide such advice. All opinions are subject to change without notice. Compass makes no representation regarding the accuracy of any statements regarding any references to the laws, statutes or regulations of any state are those of the author(s). Past performance is no guarantee of future results.