Early 2023 Data Suggests Buyers Are Beginning to Jump Back In
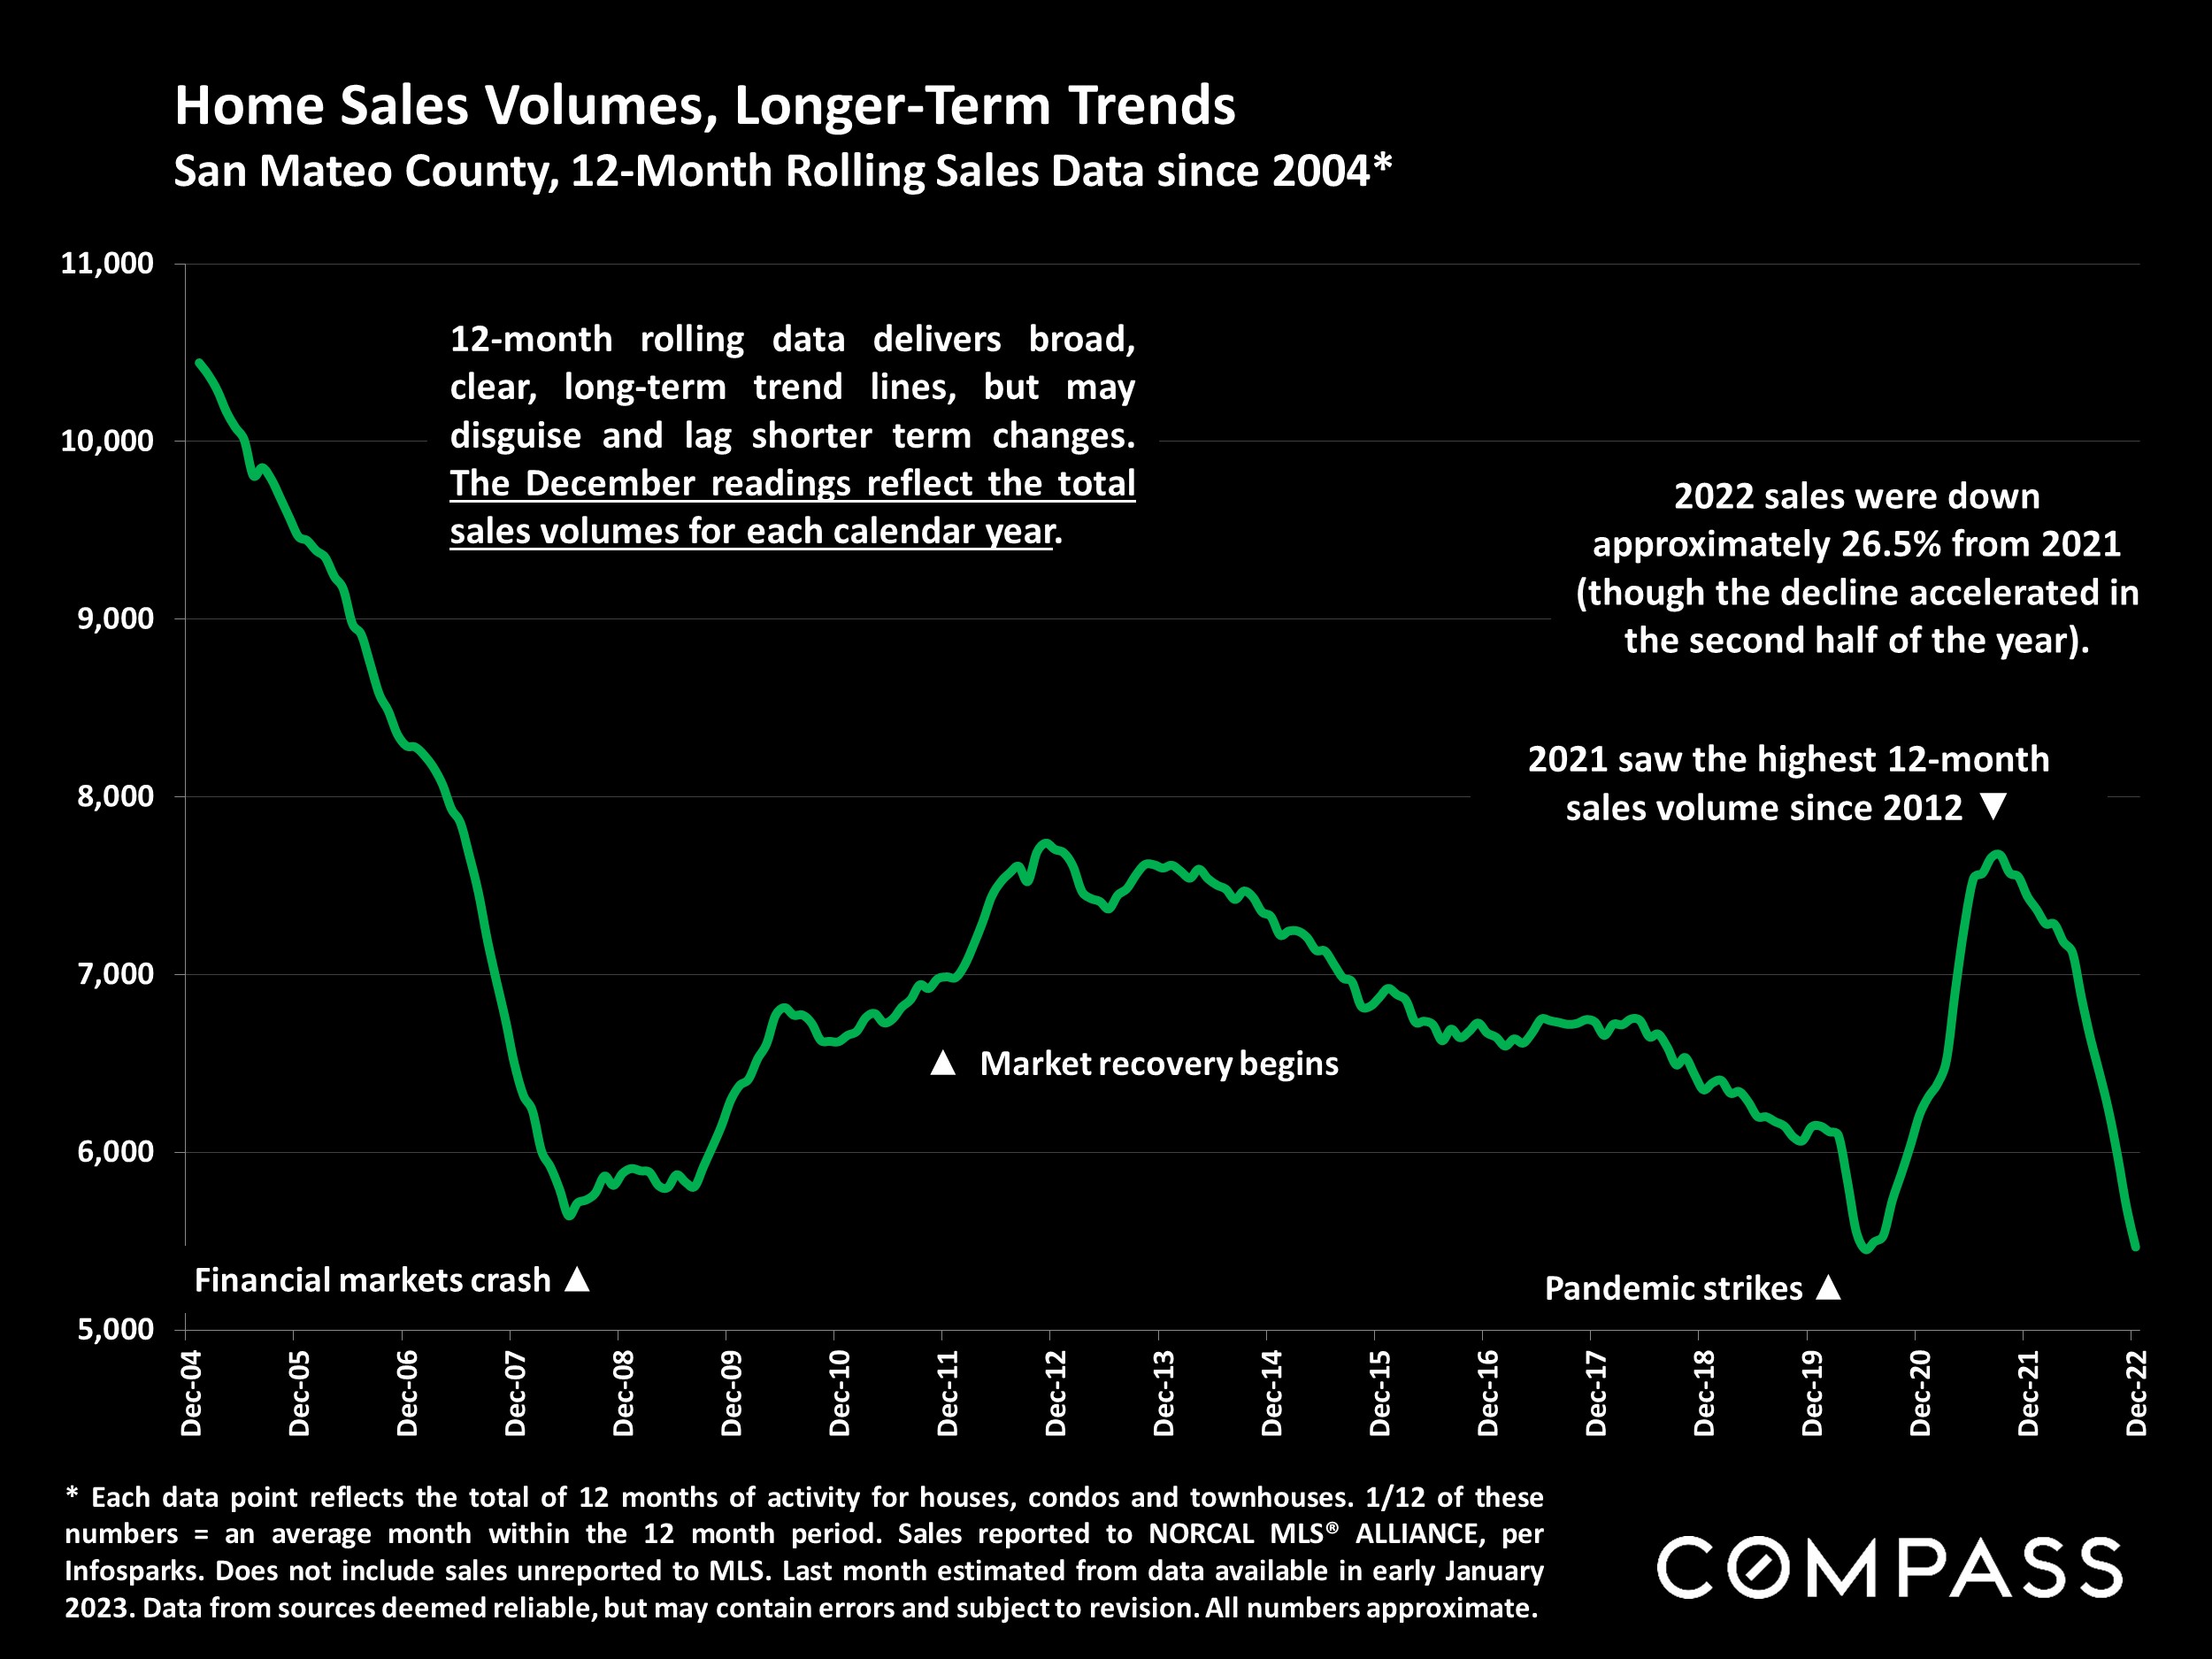
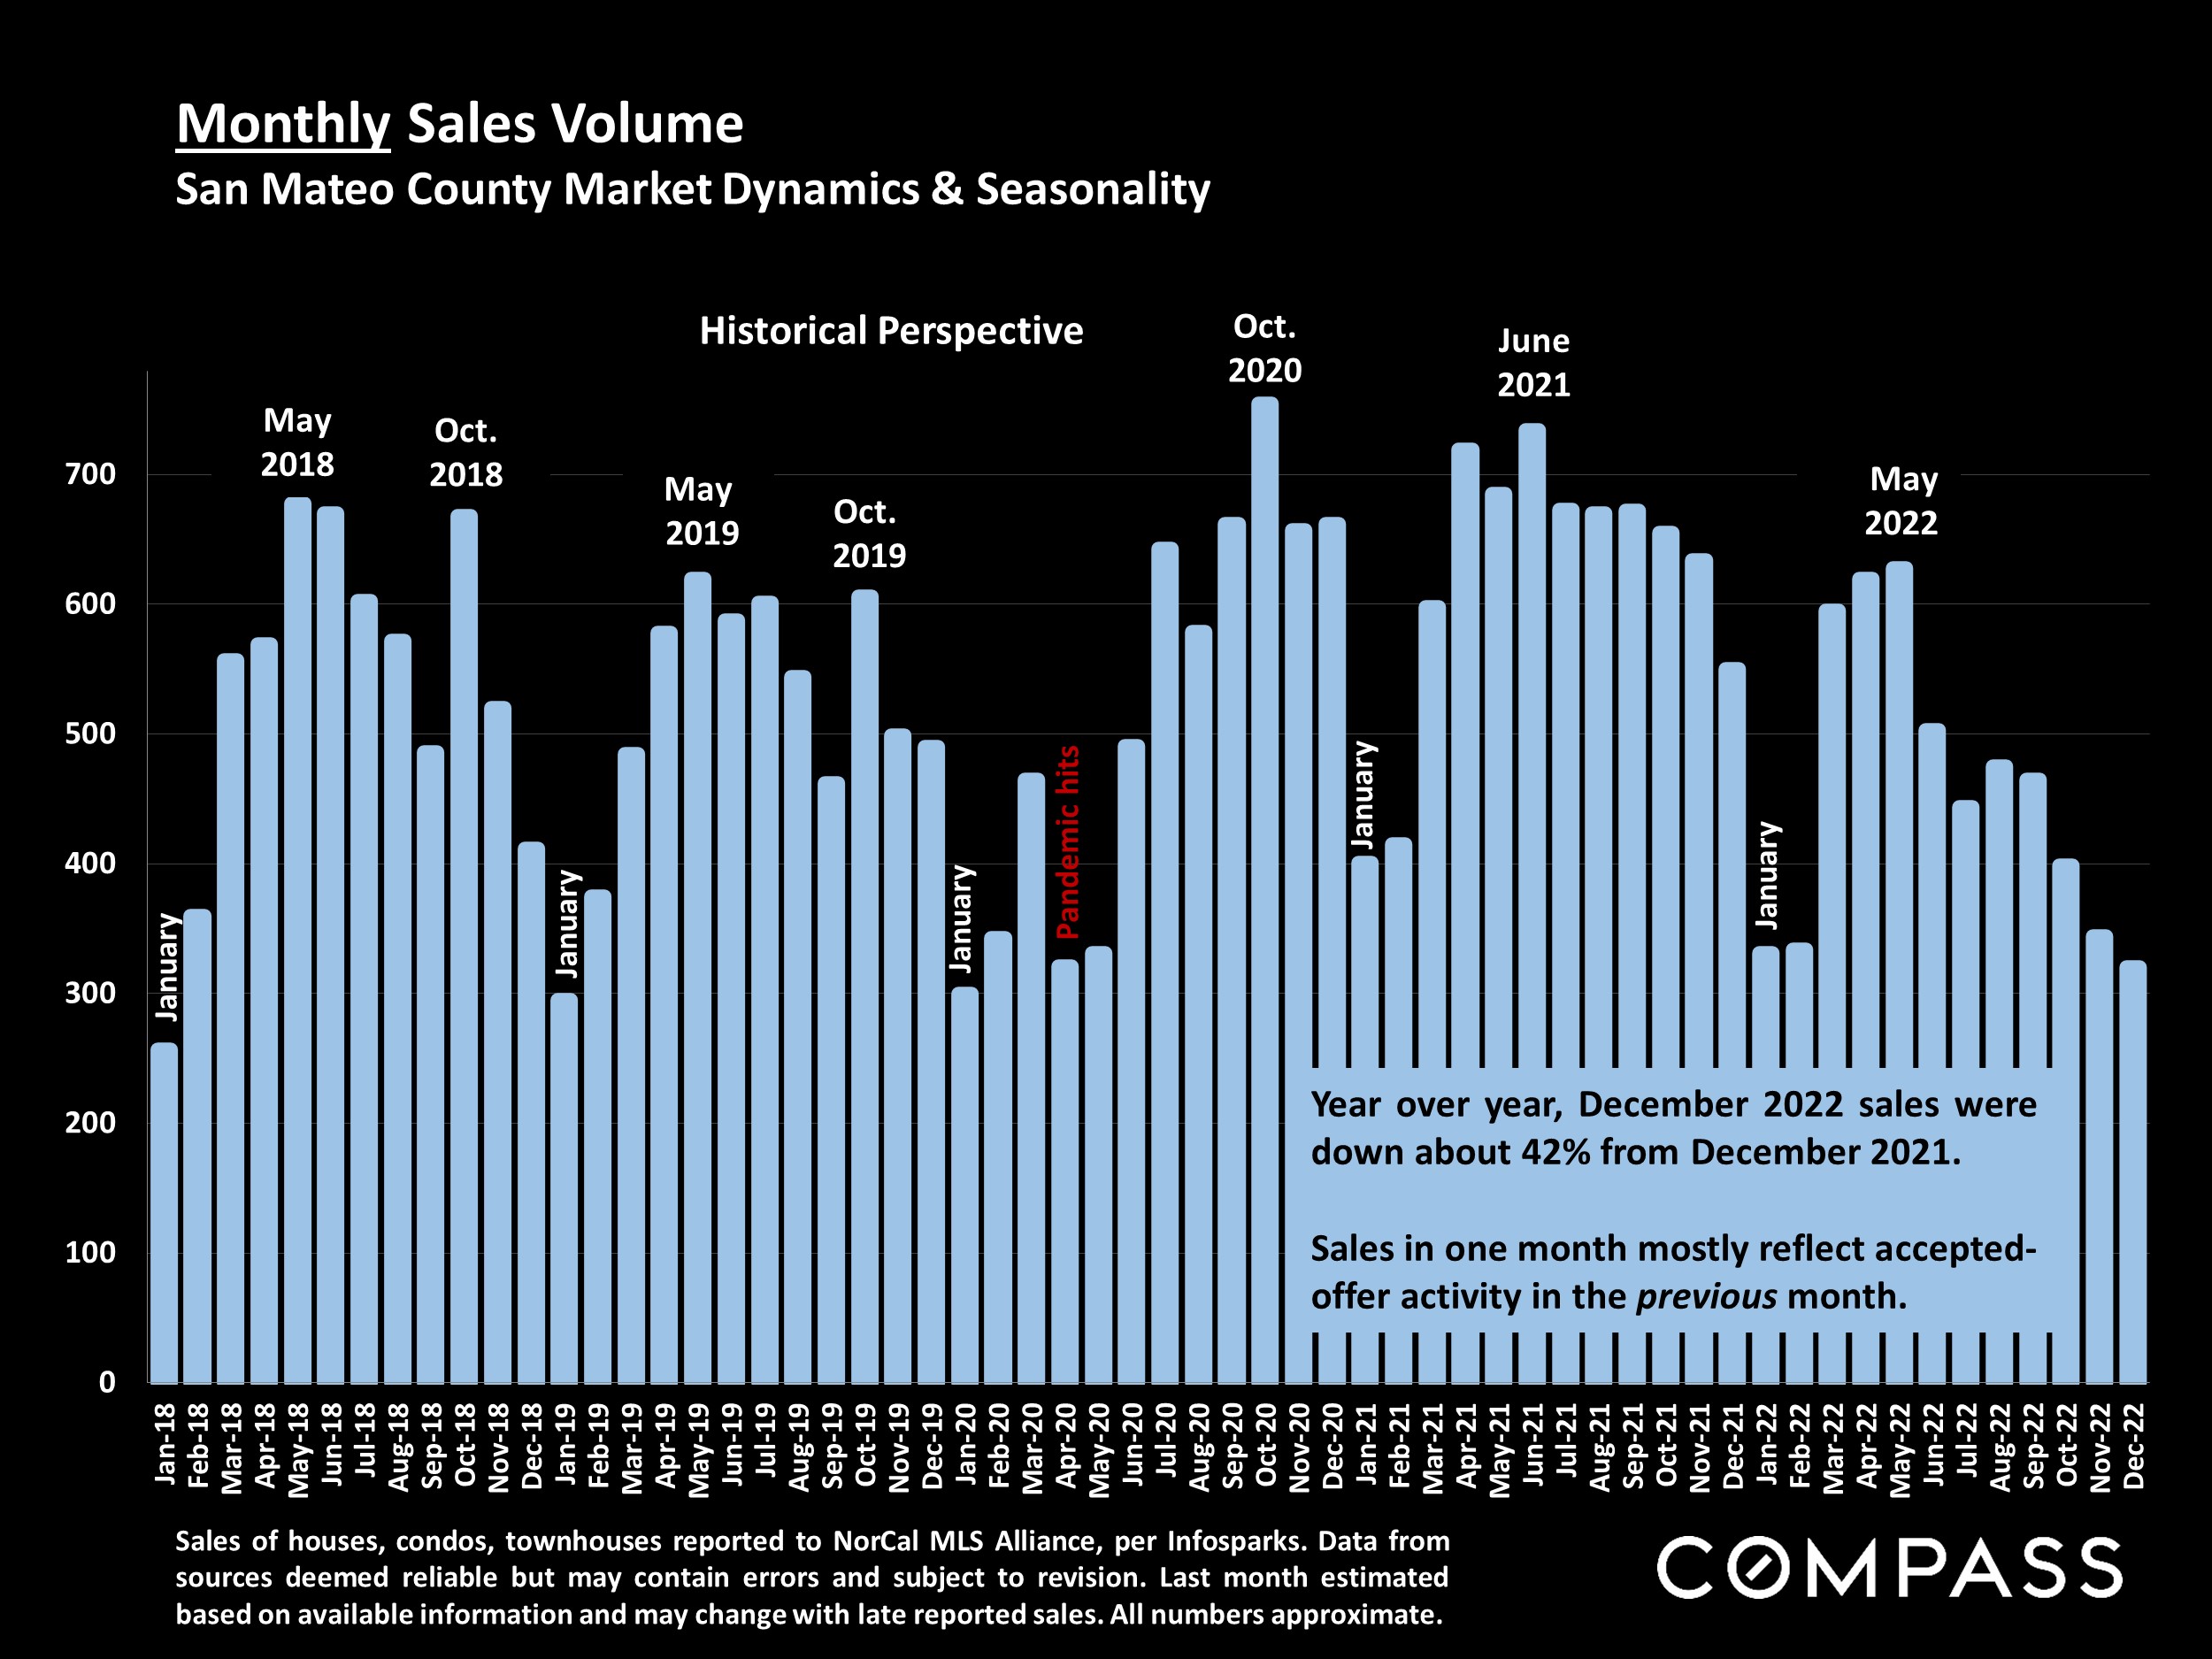
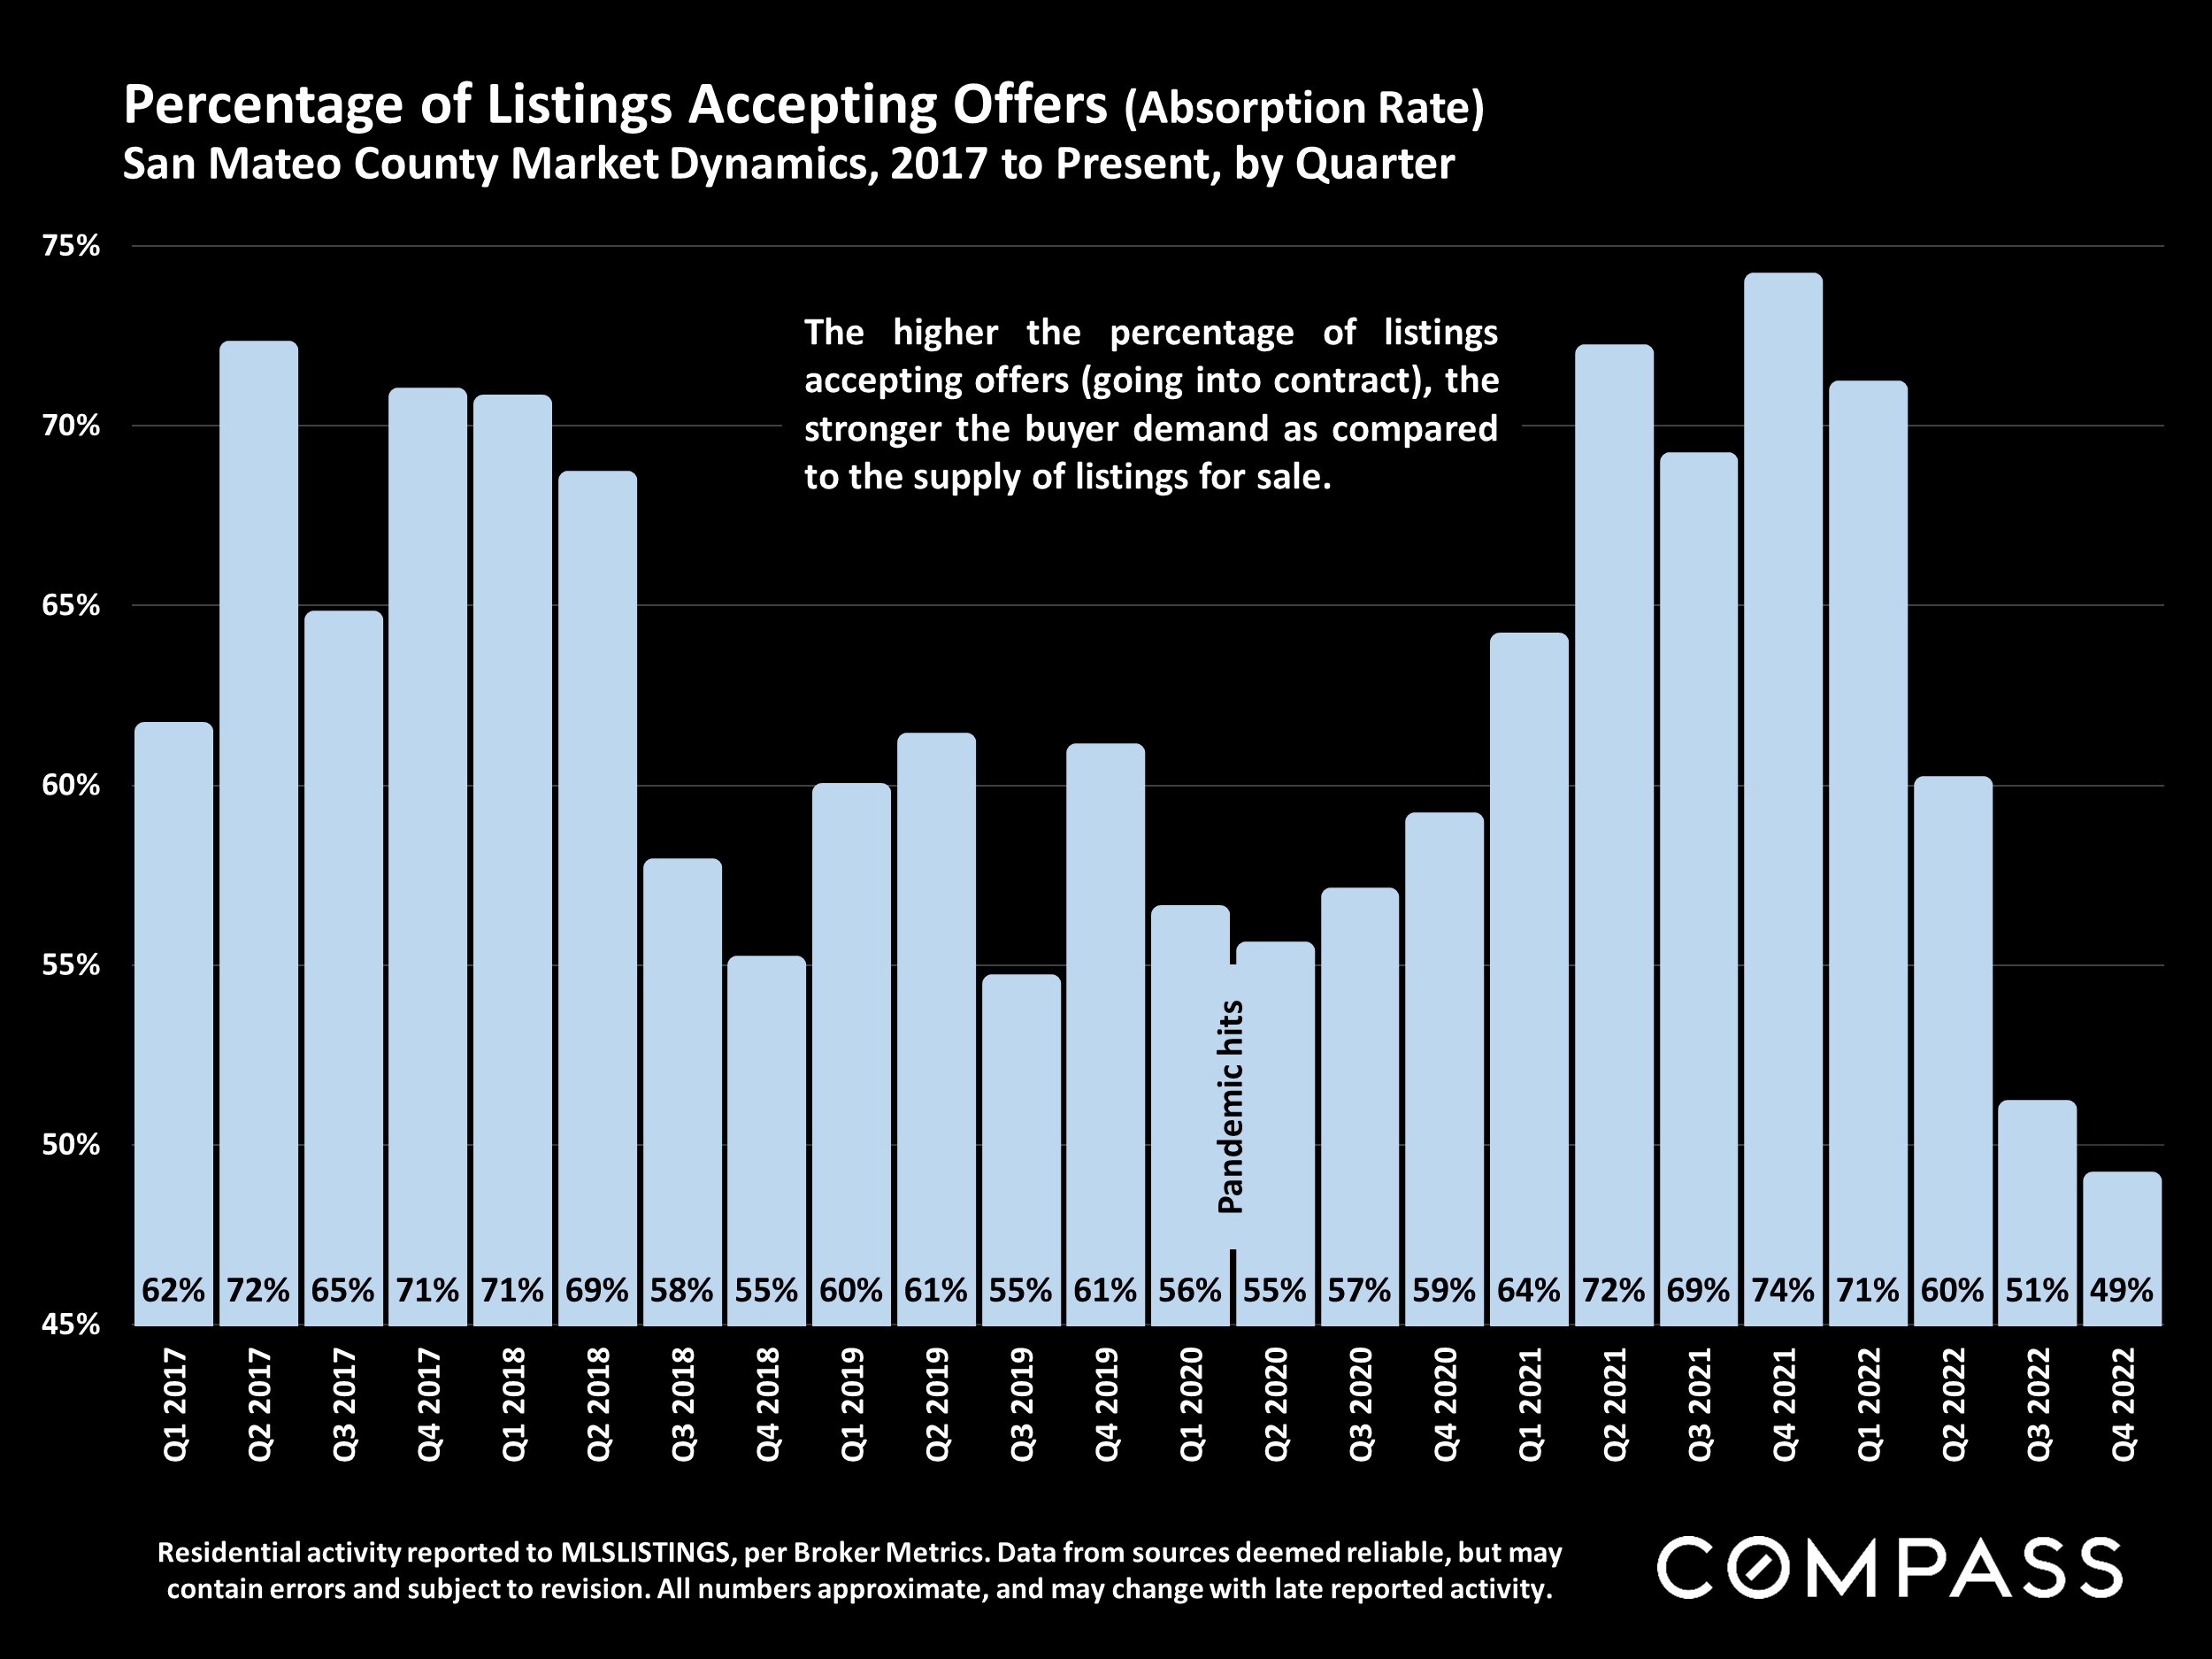
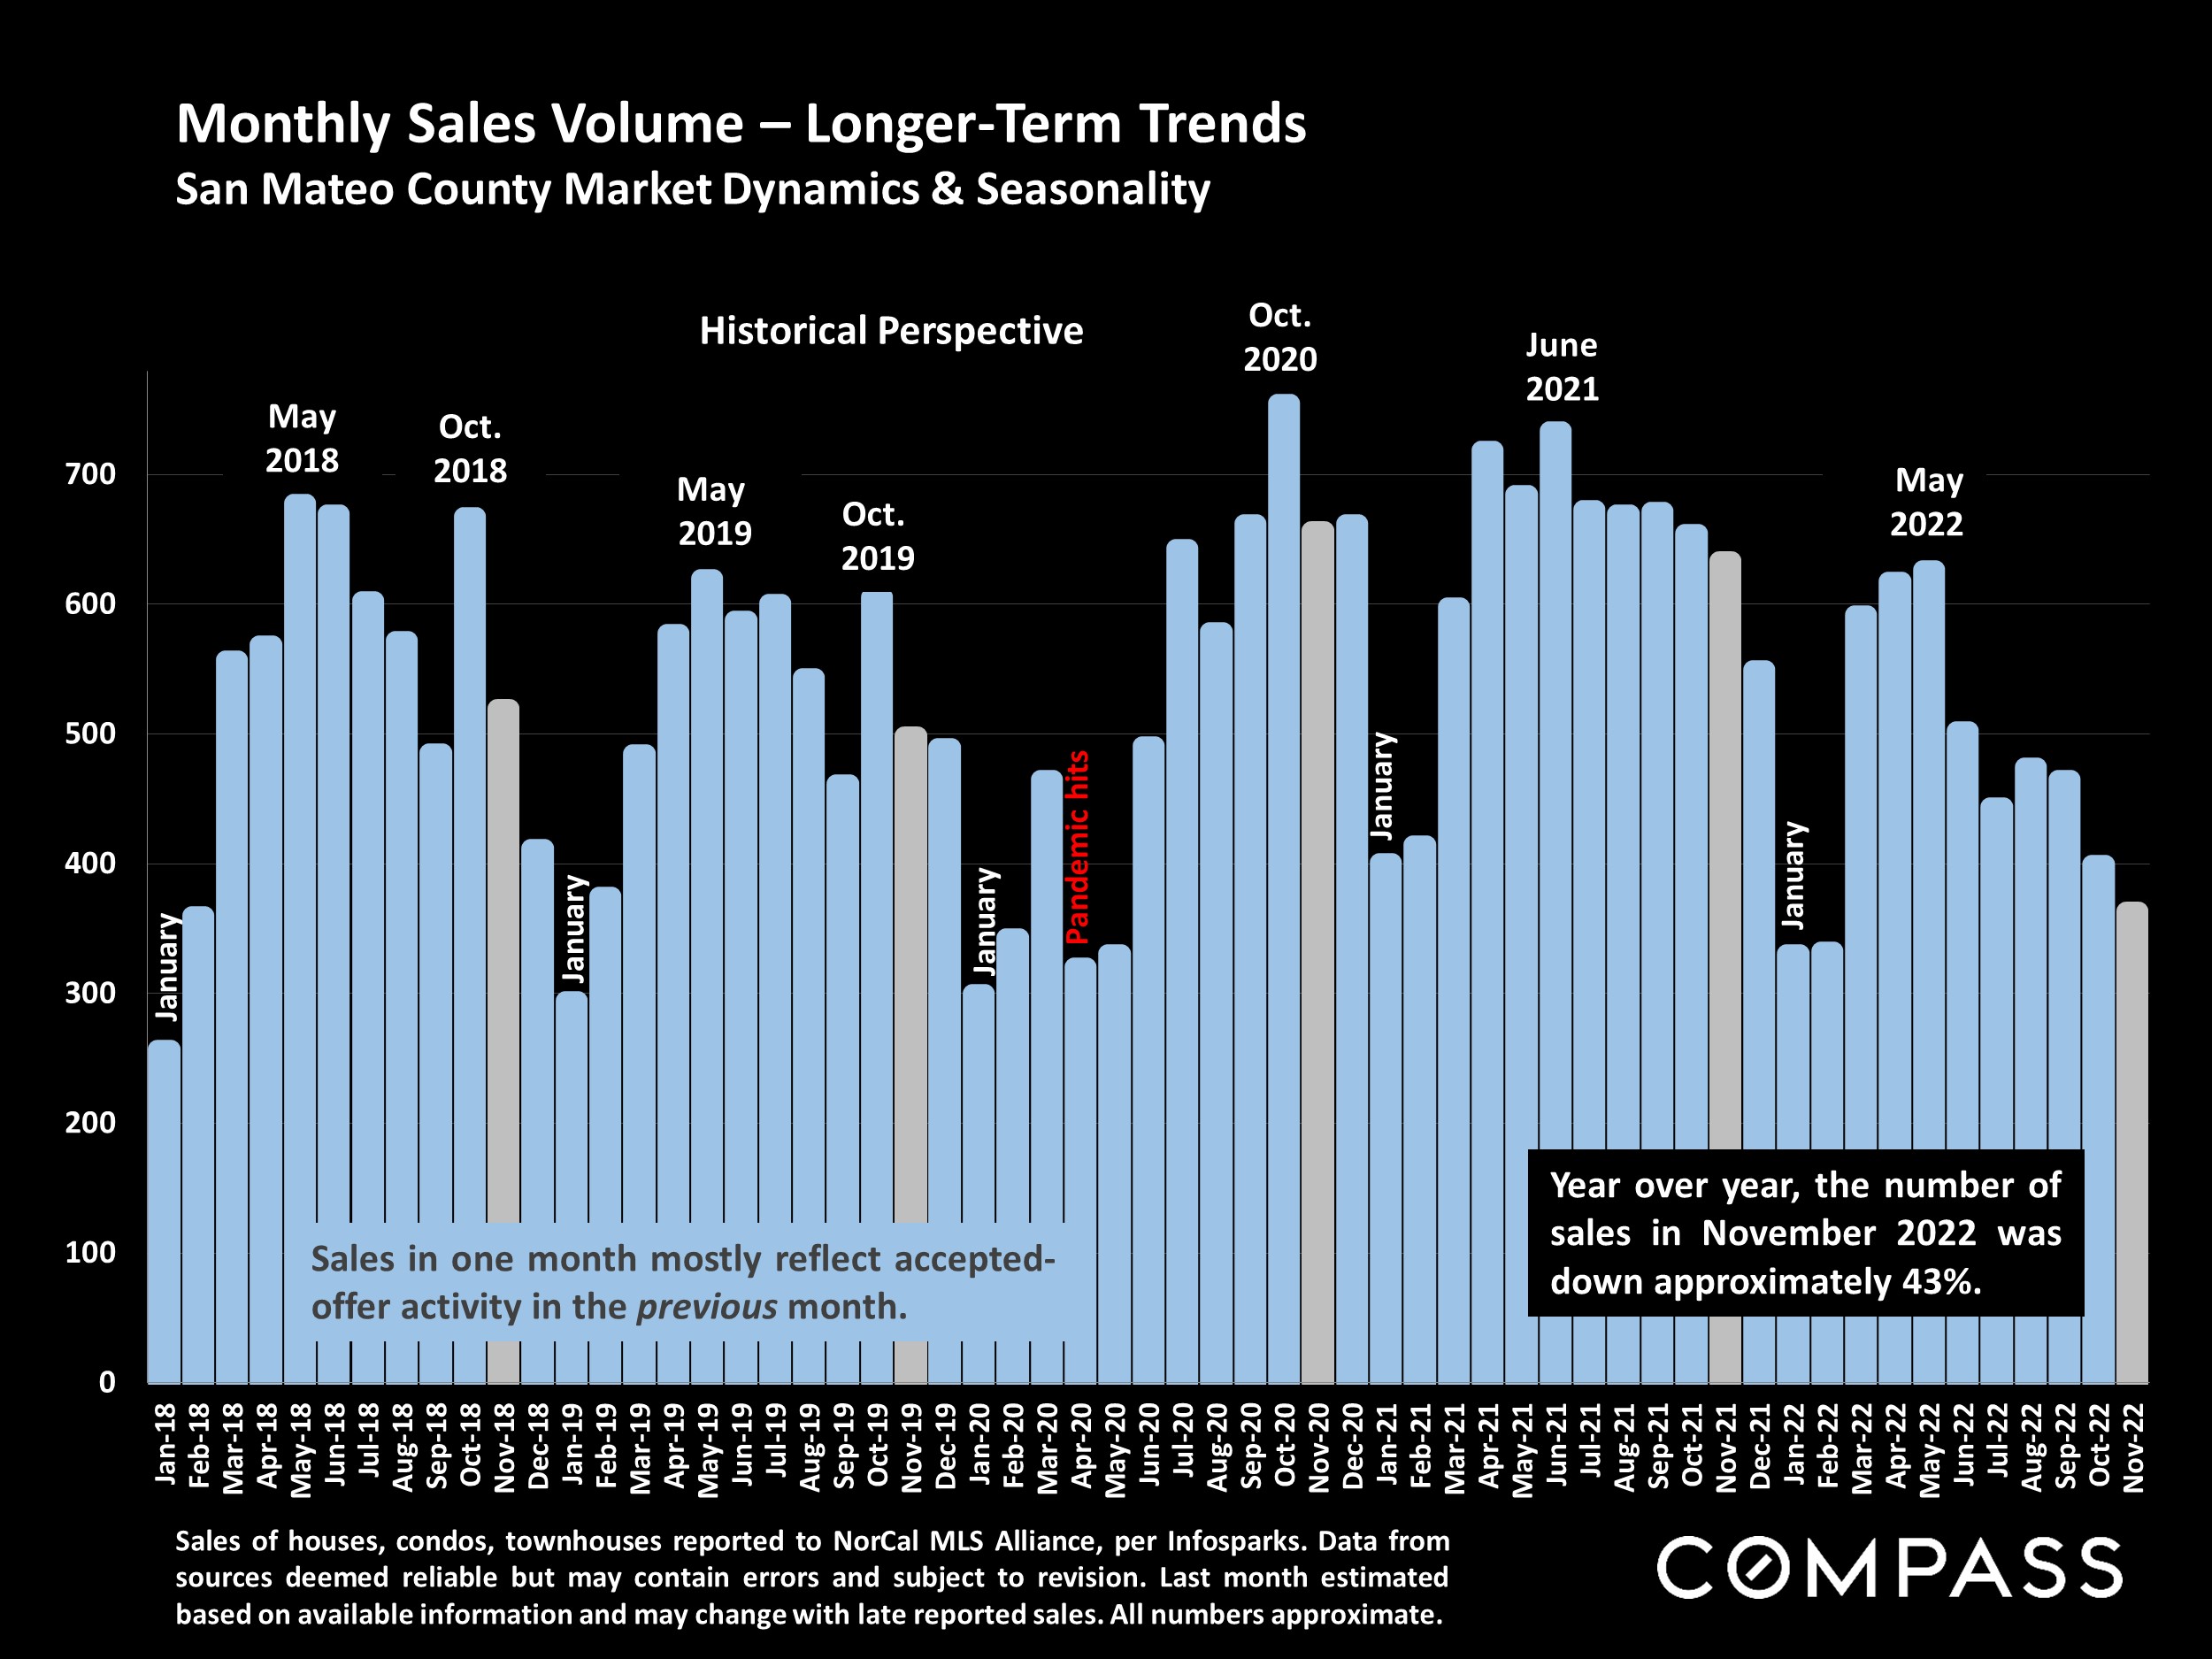
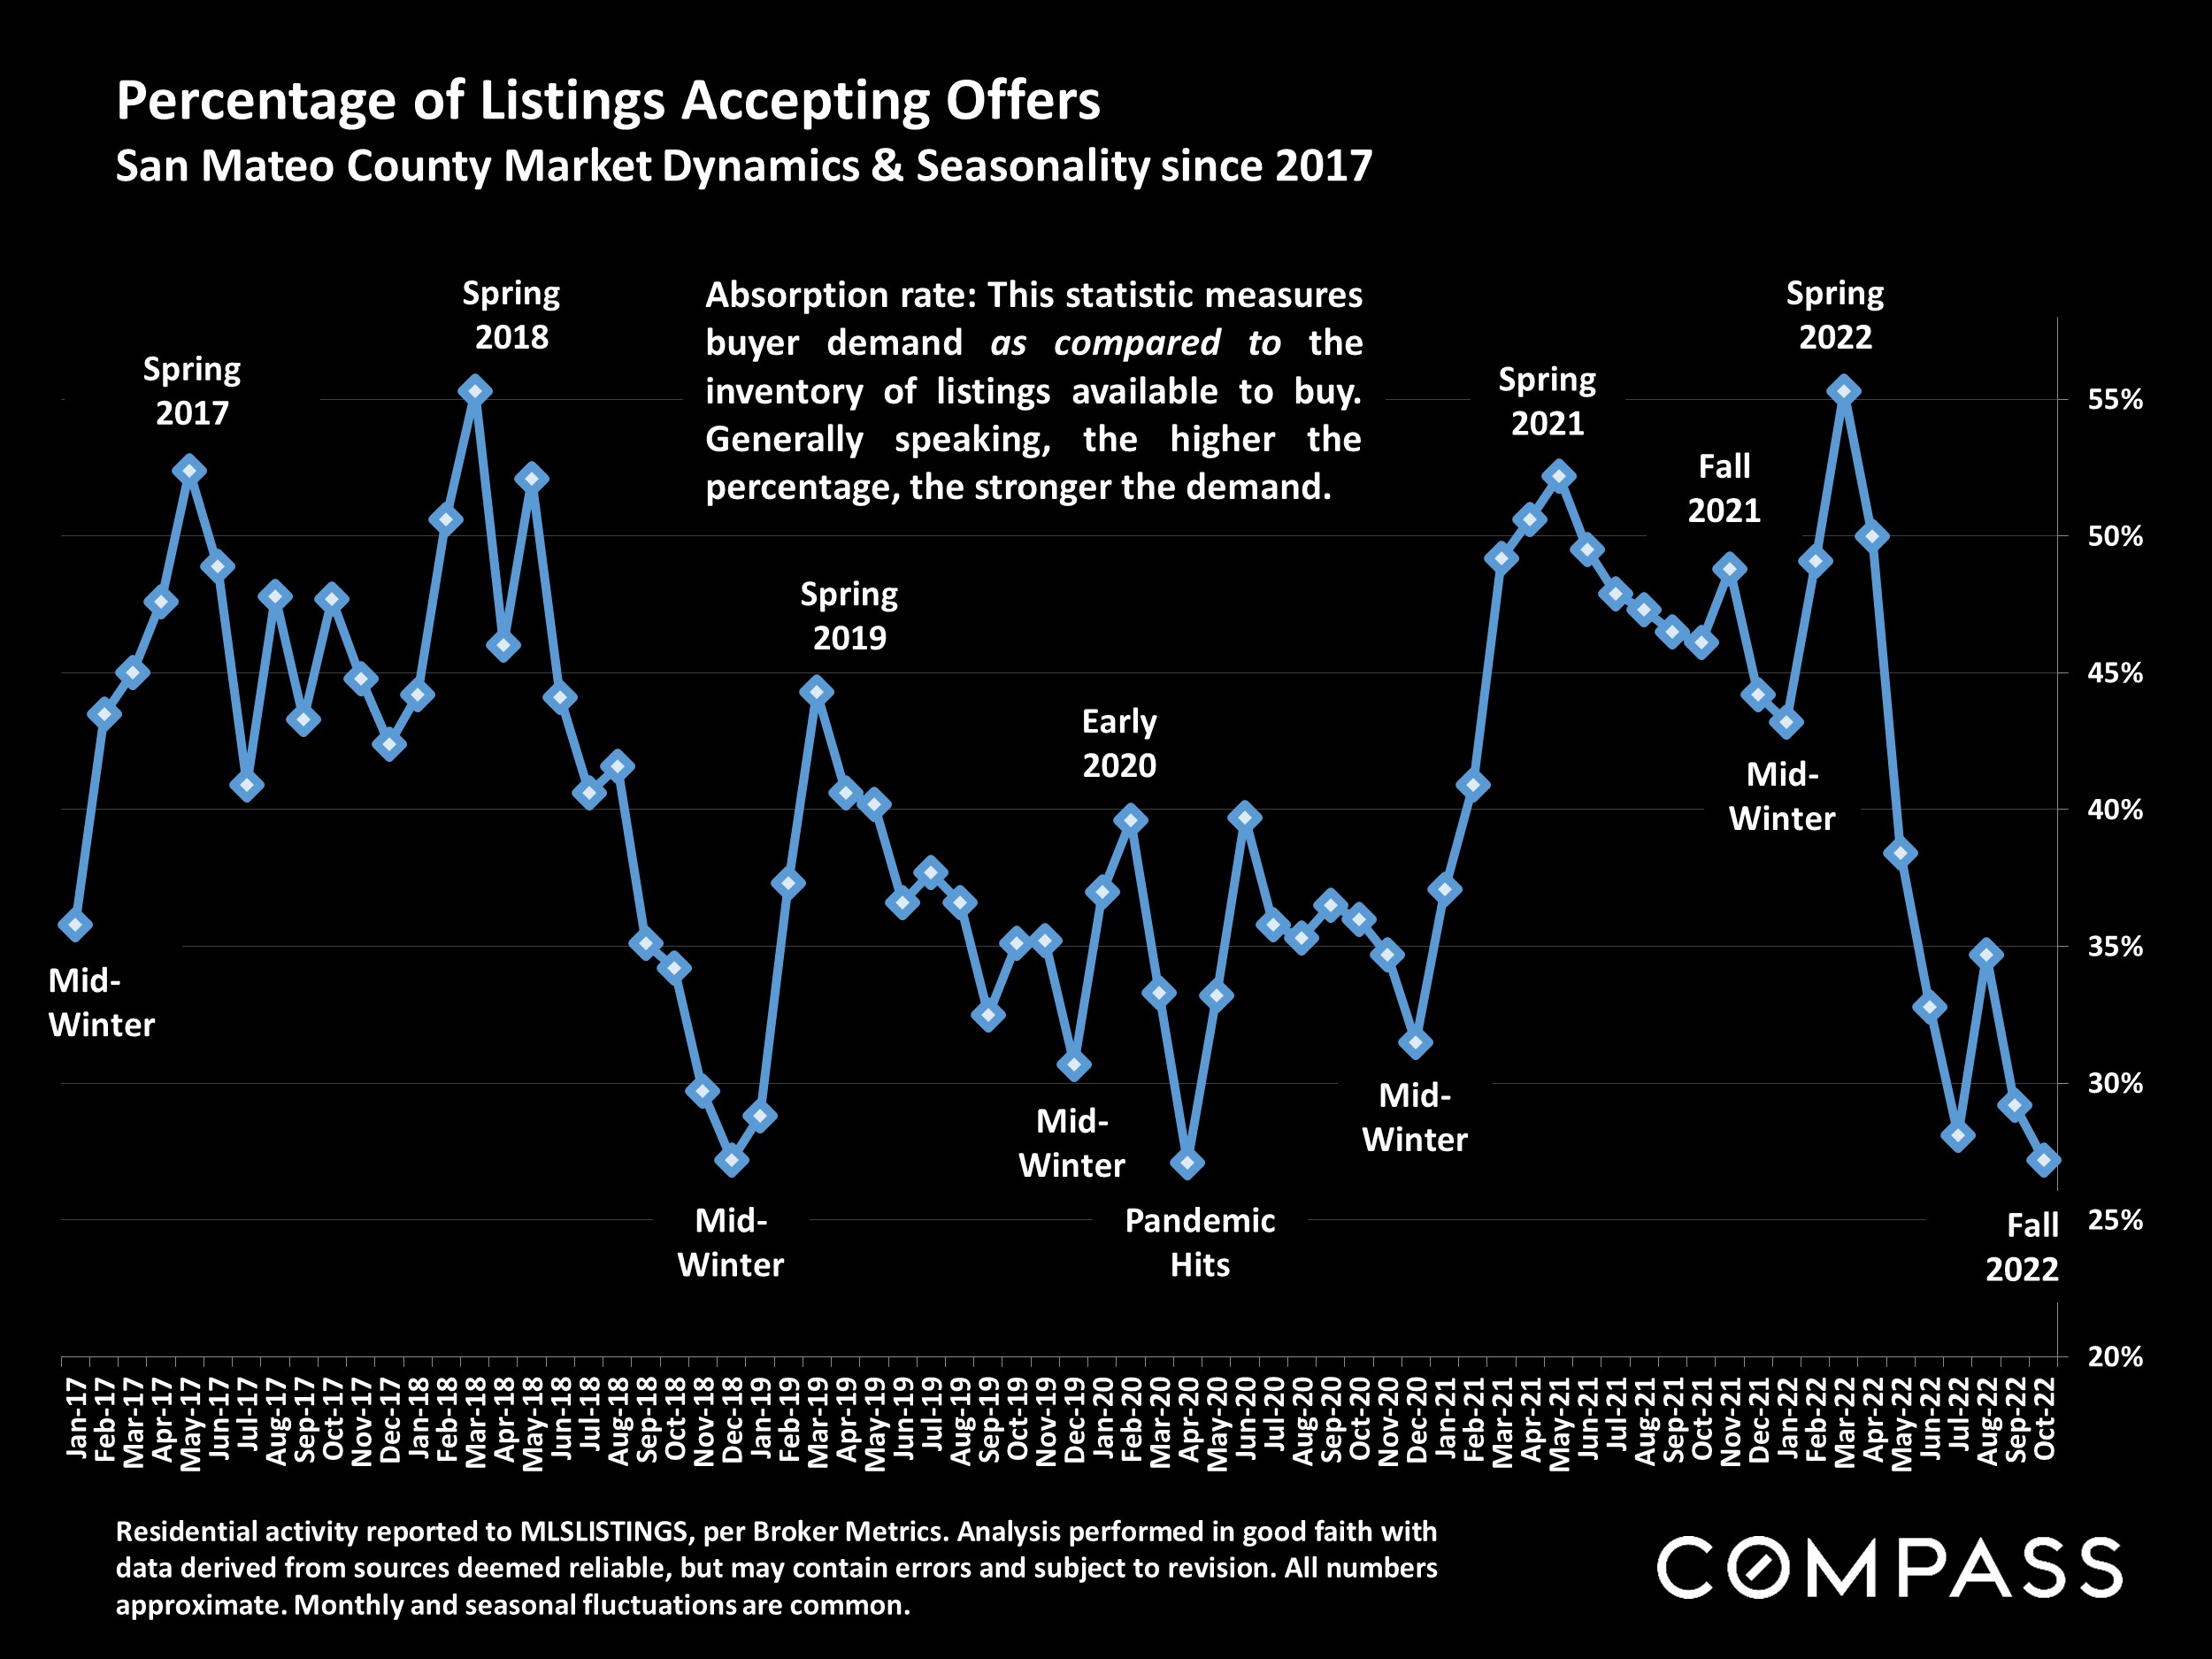
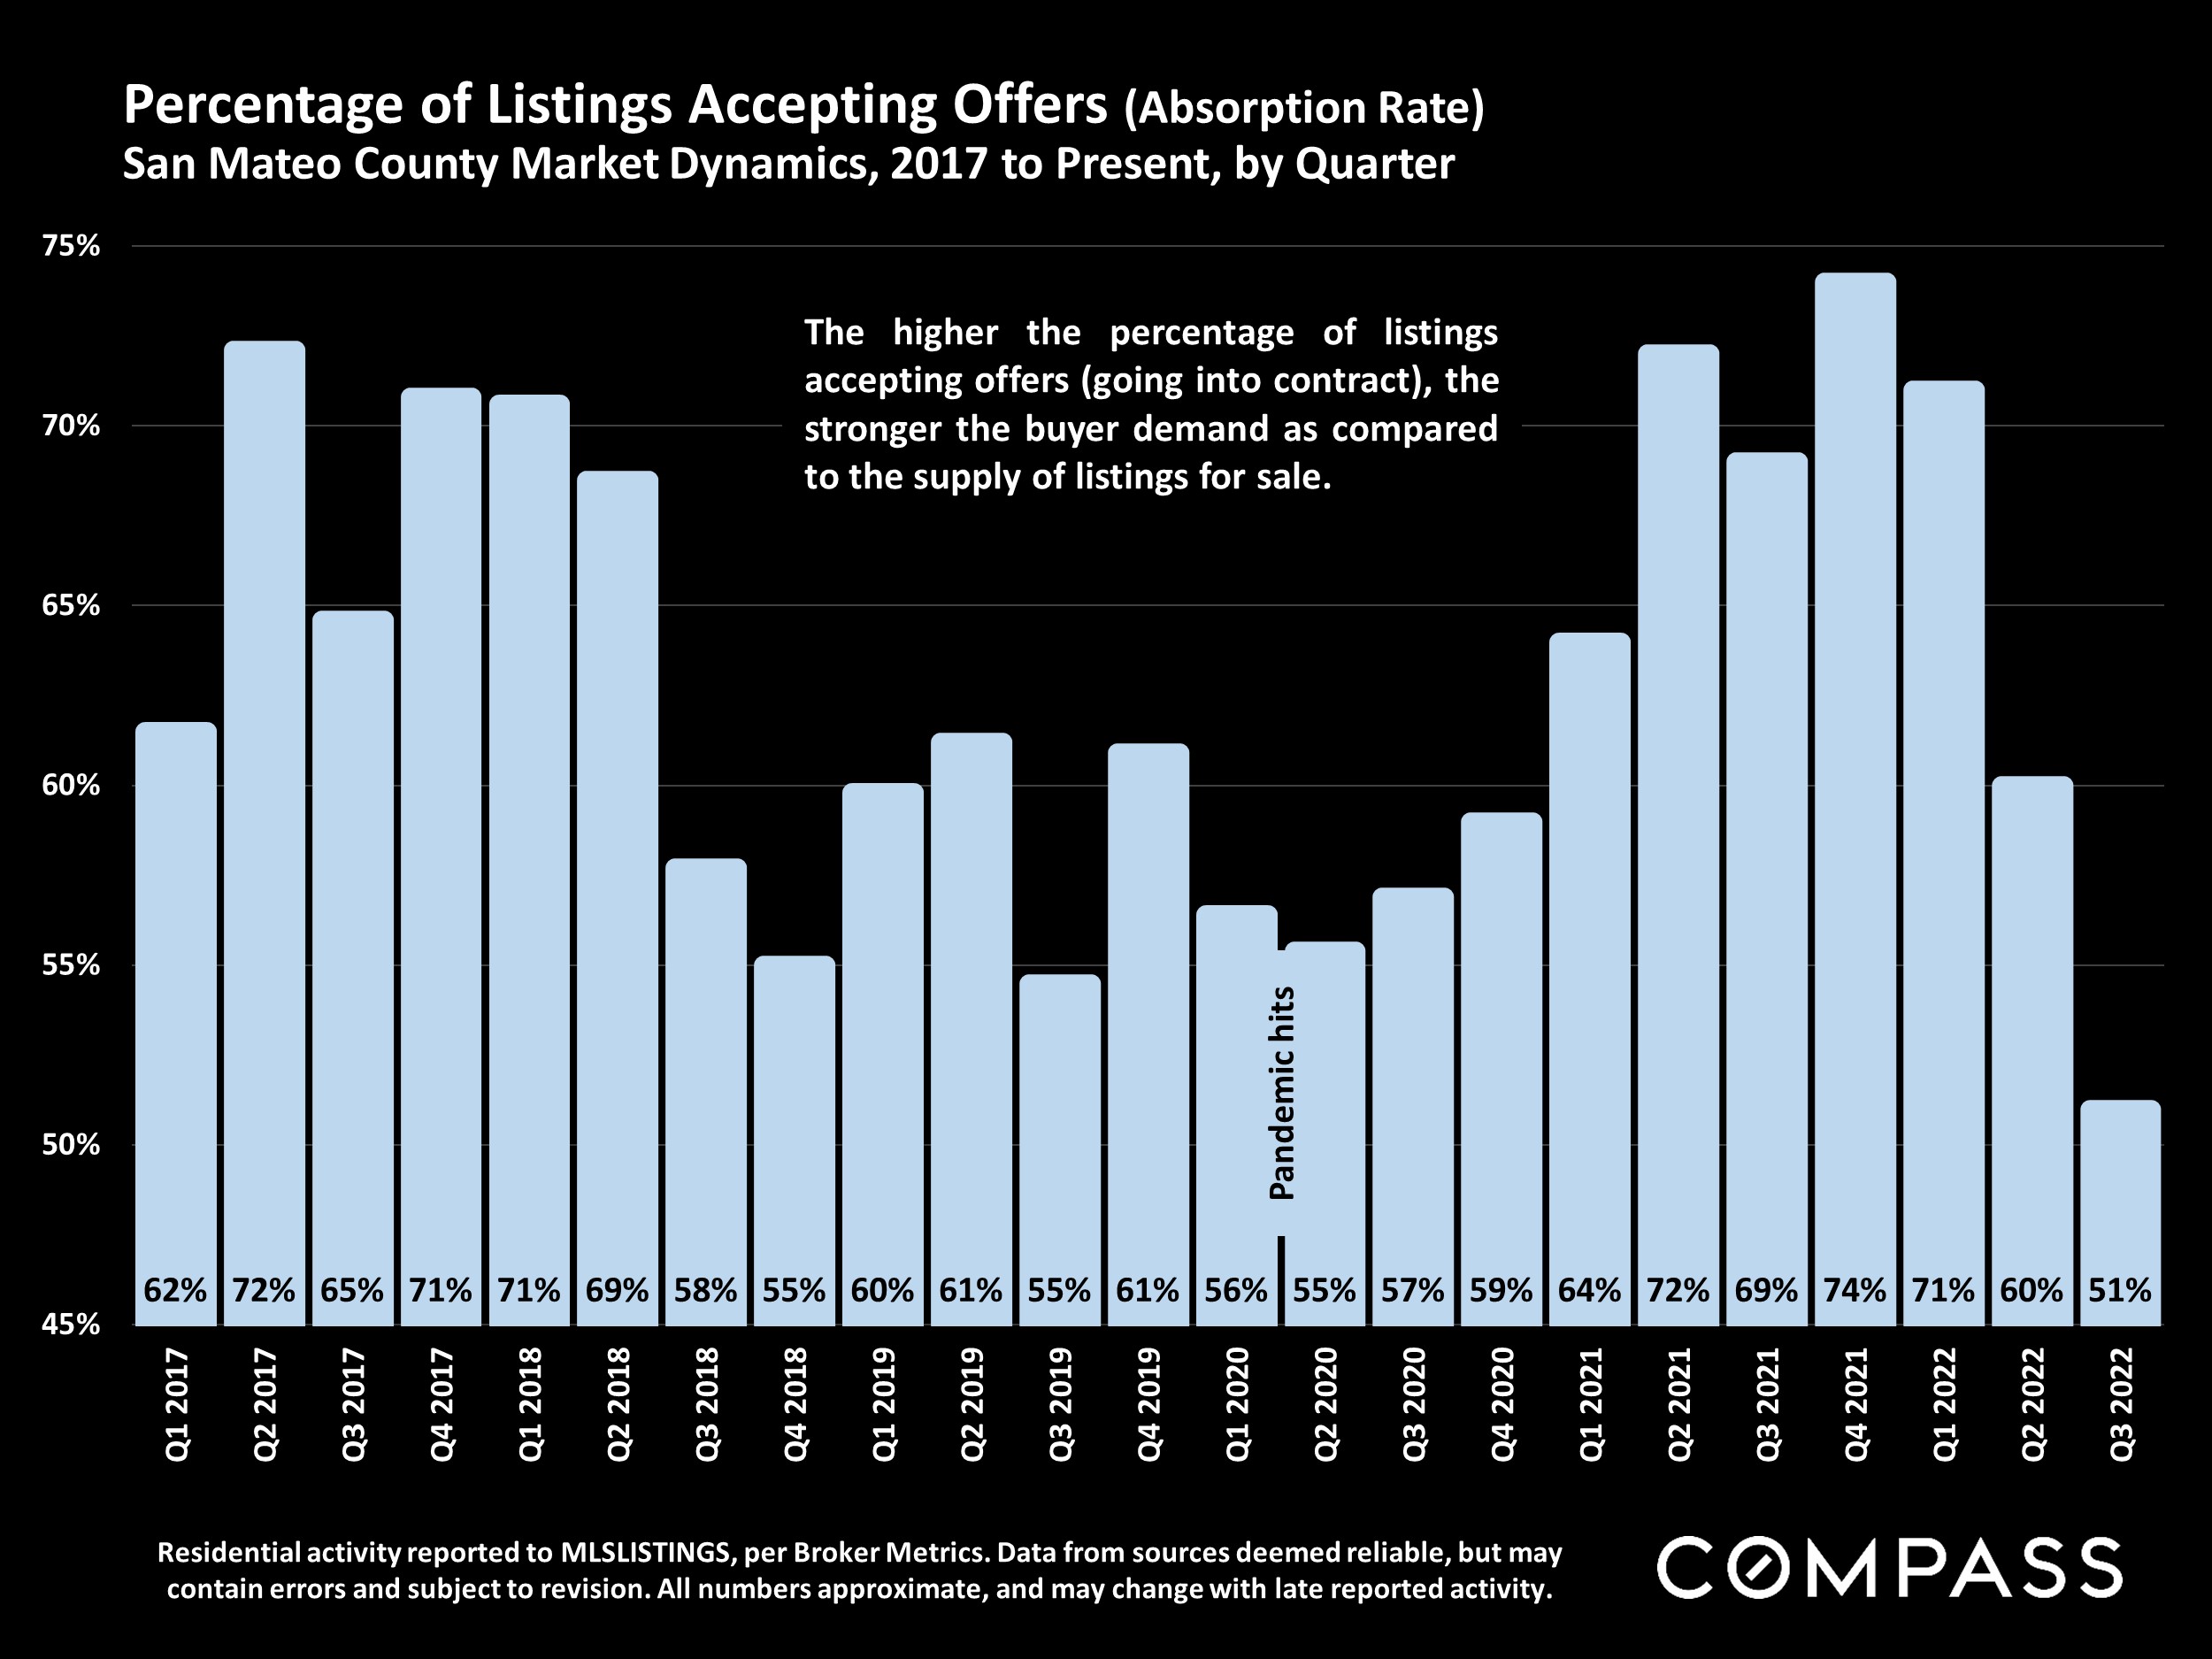
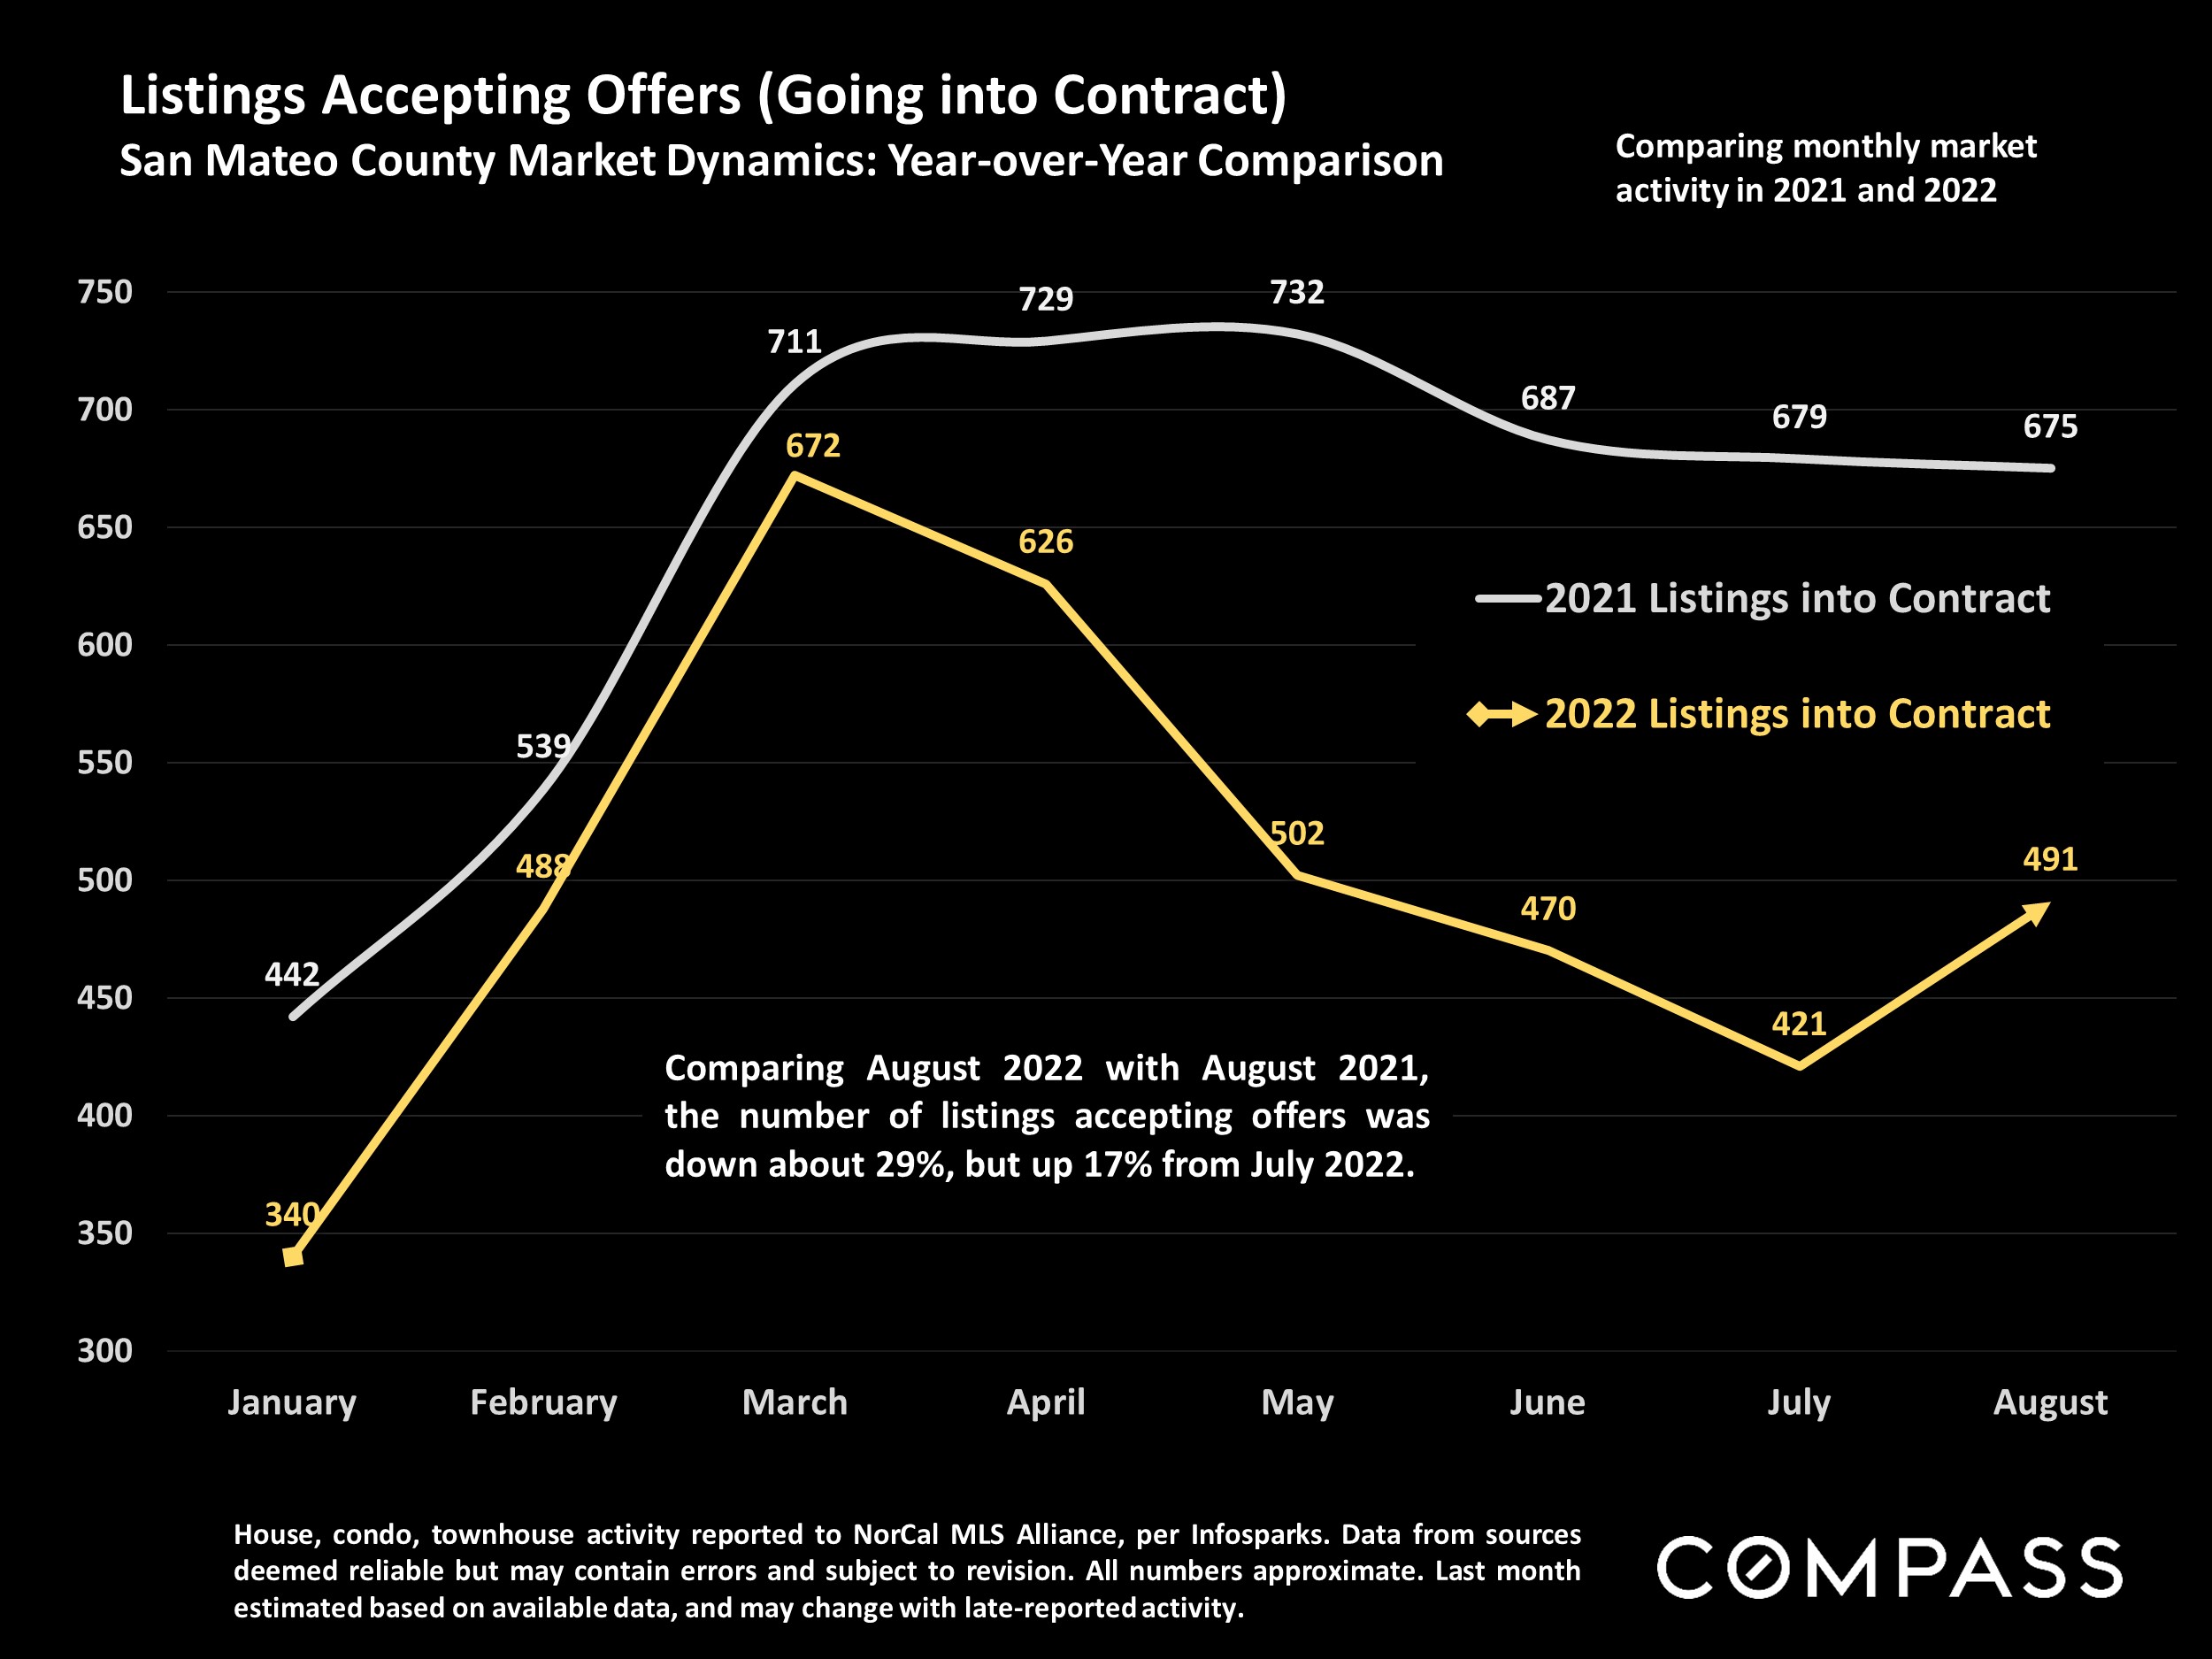
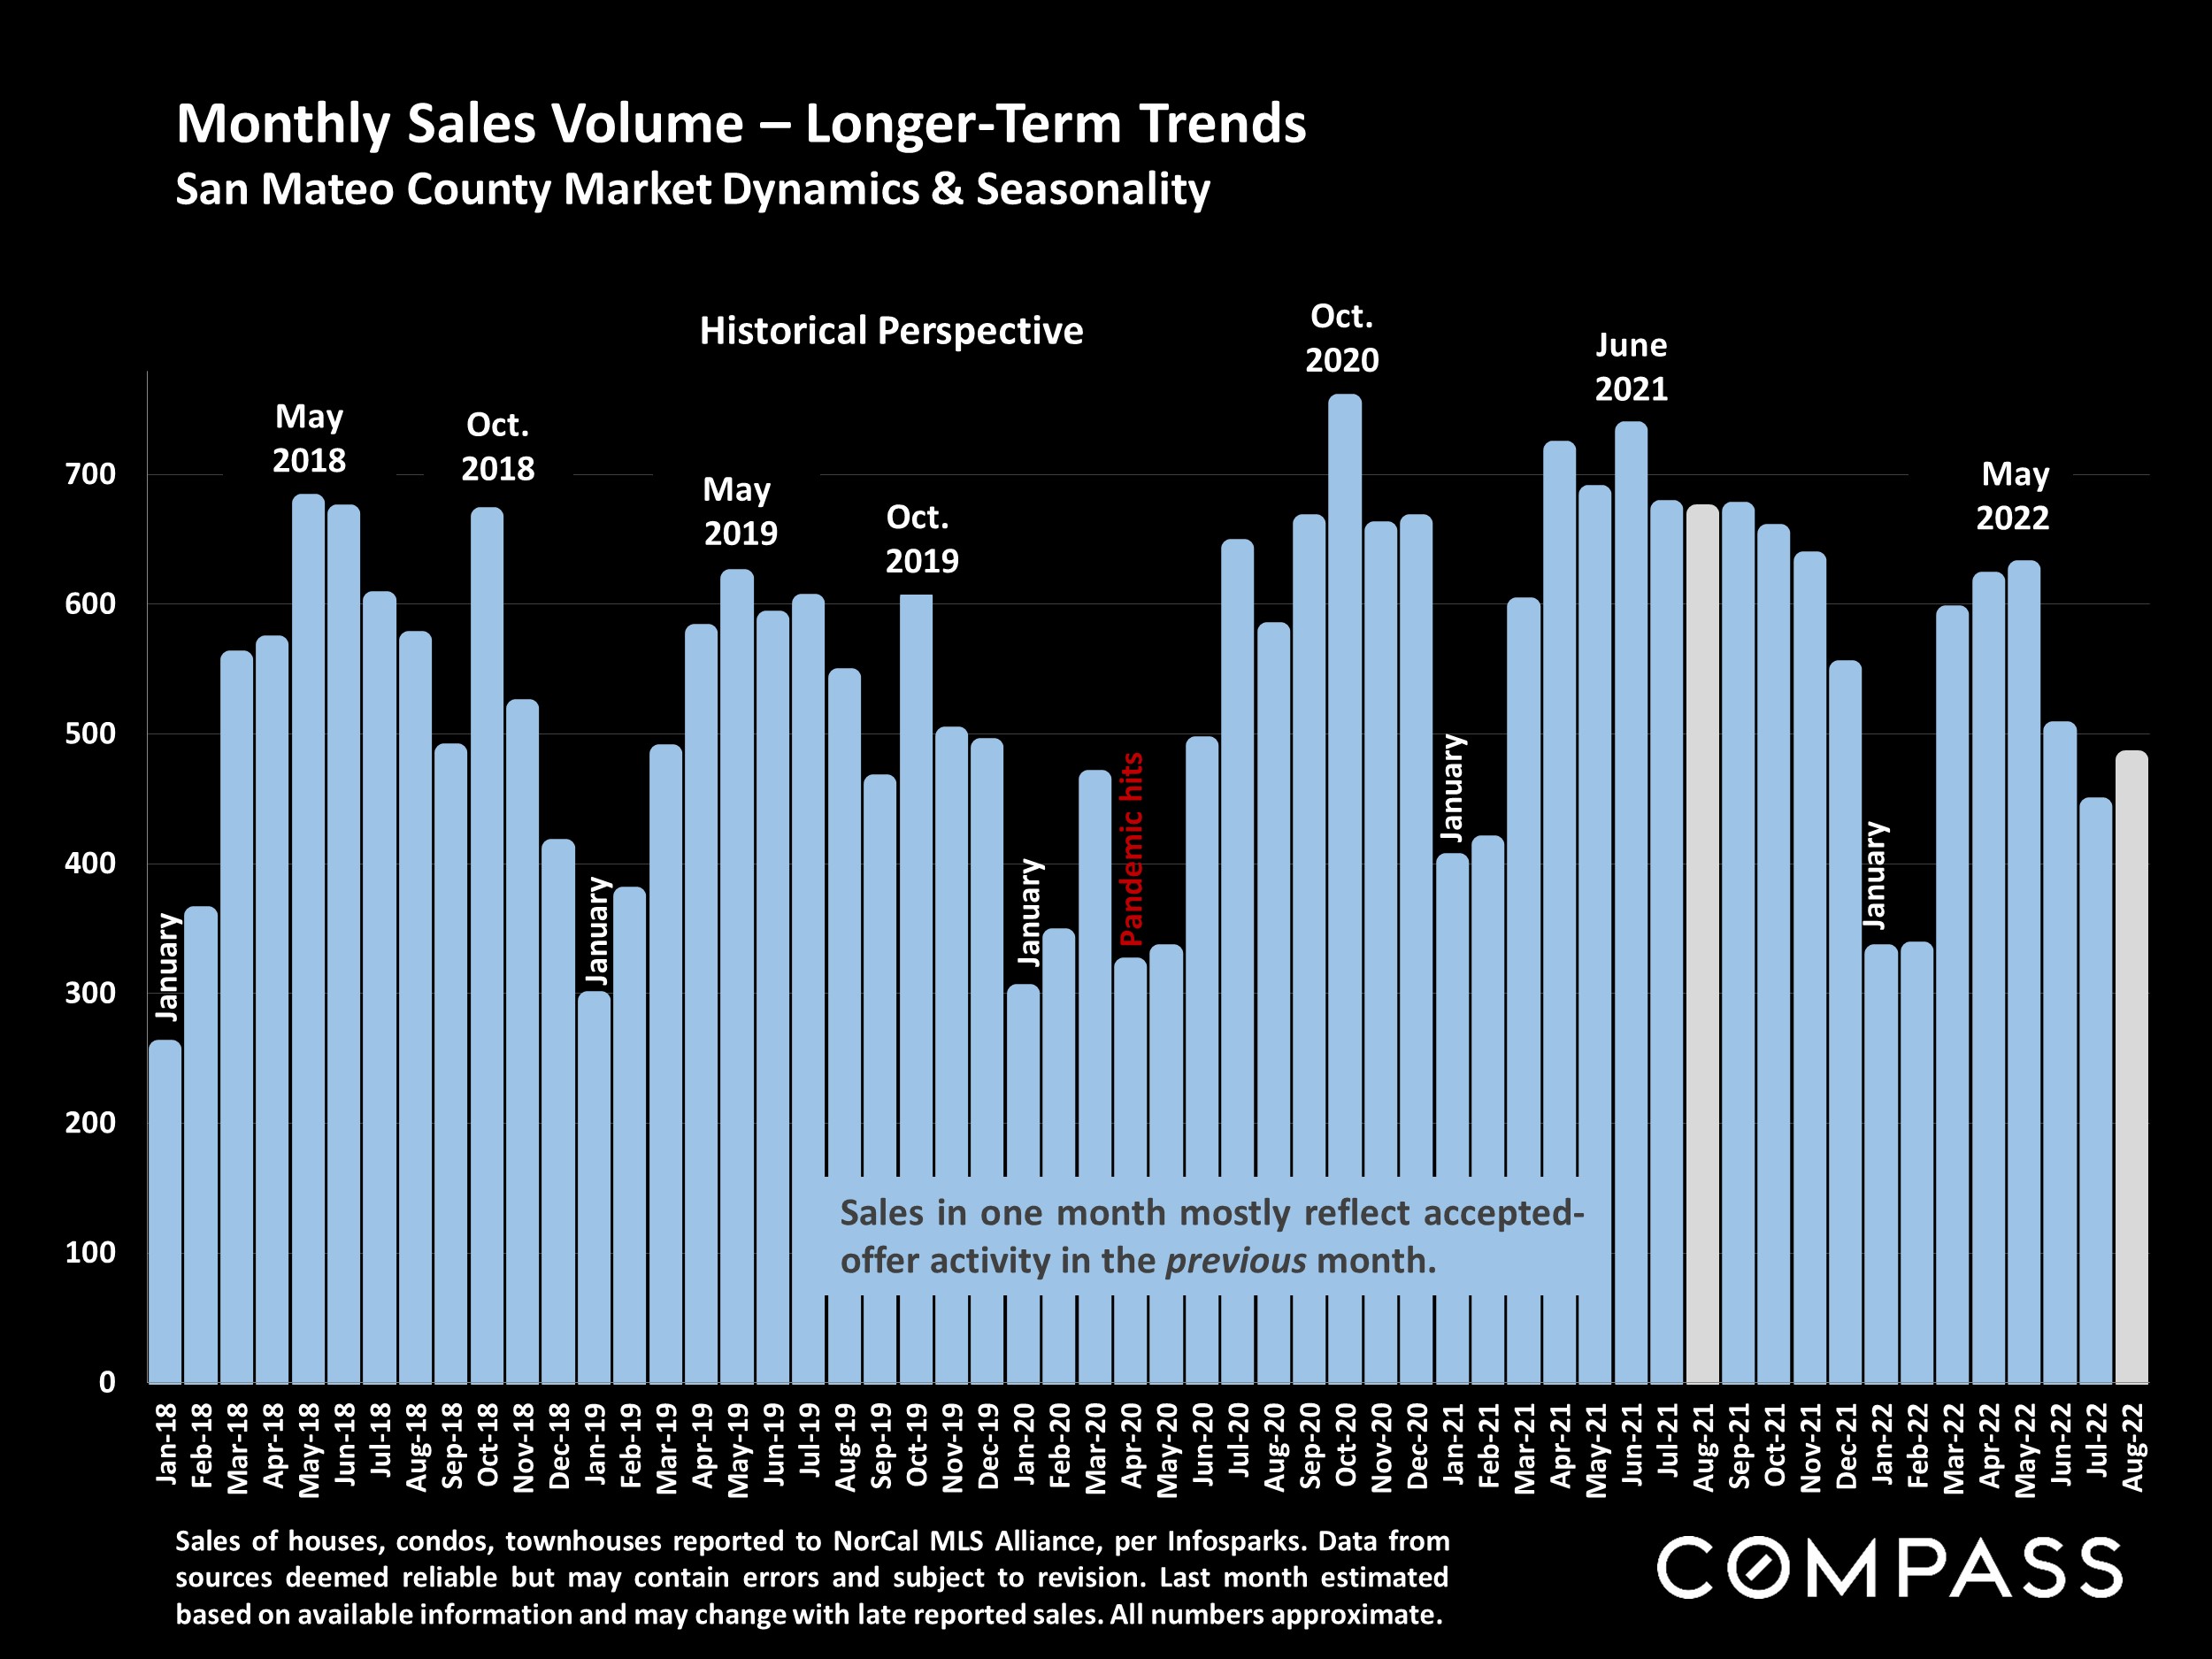
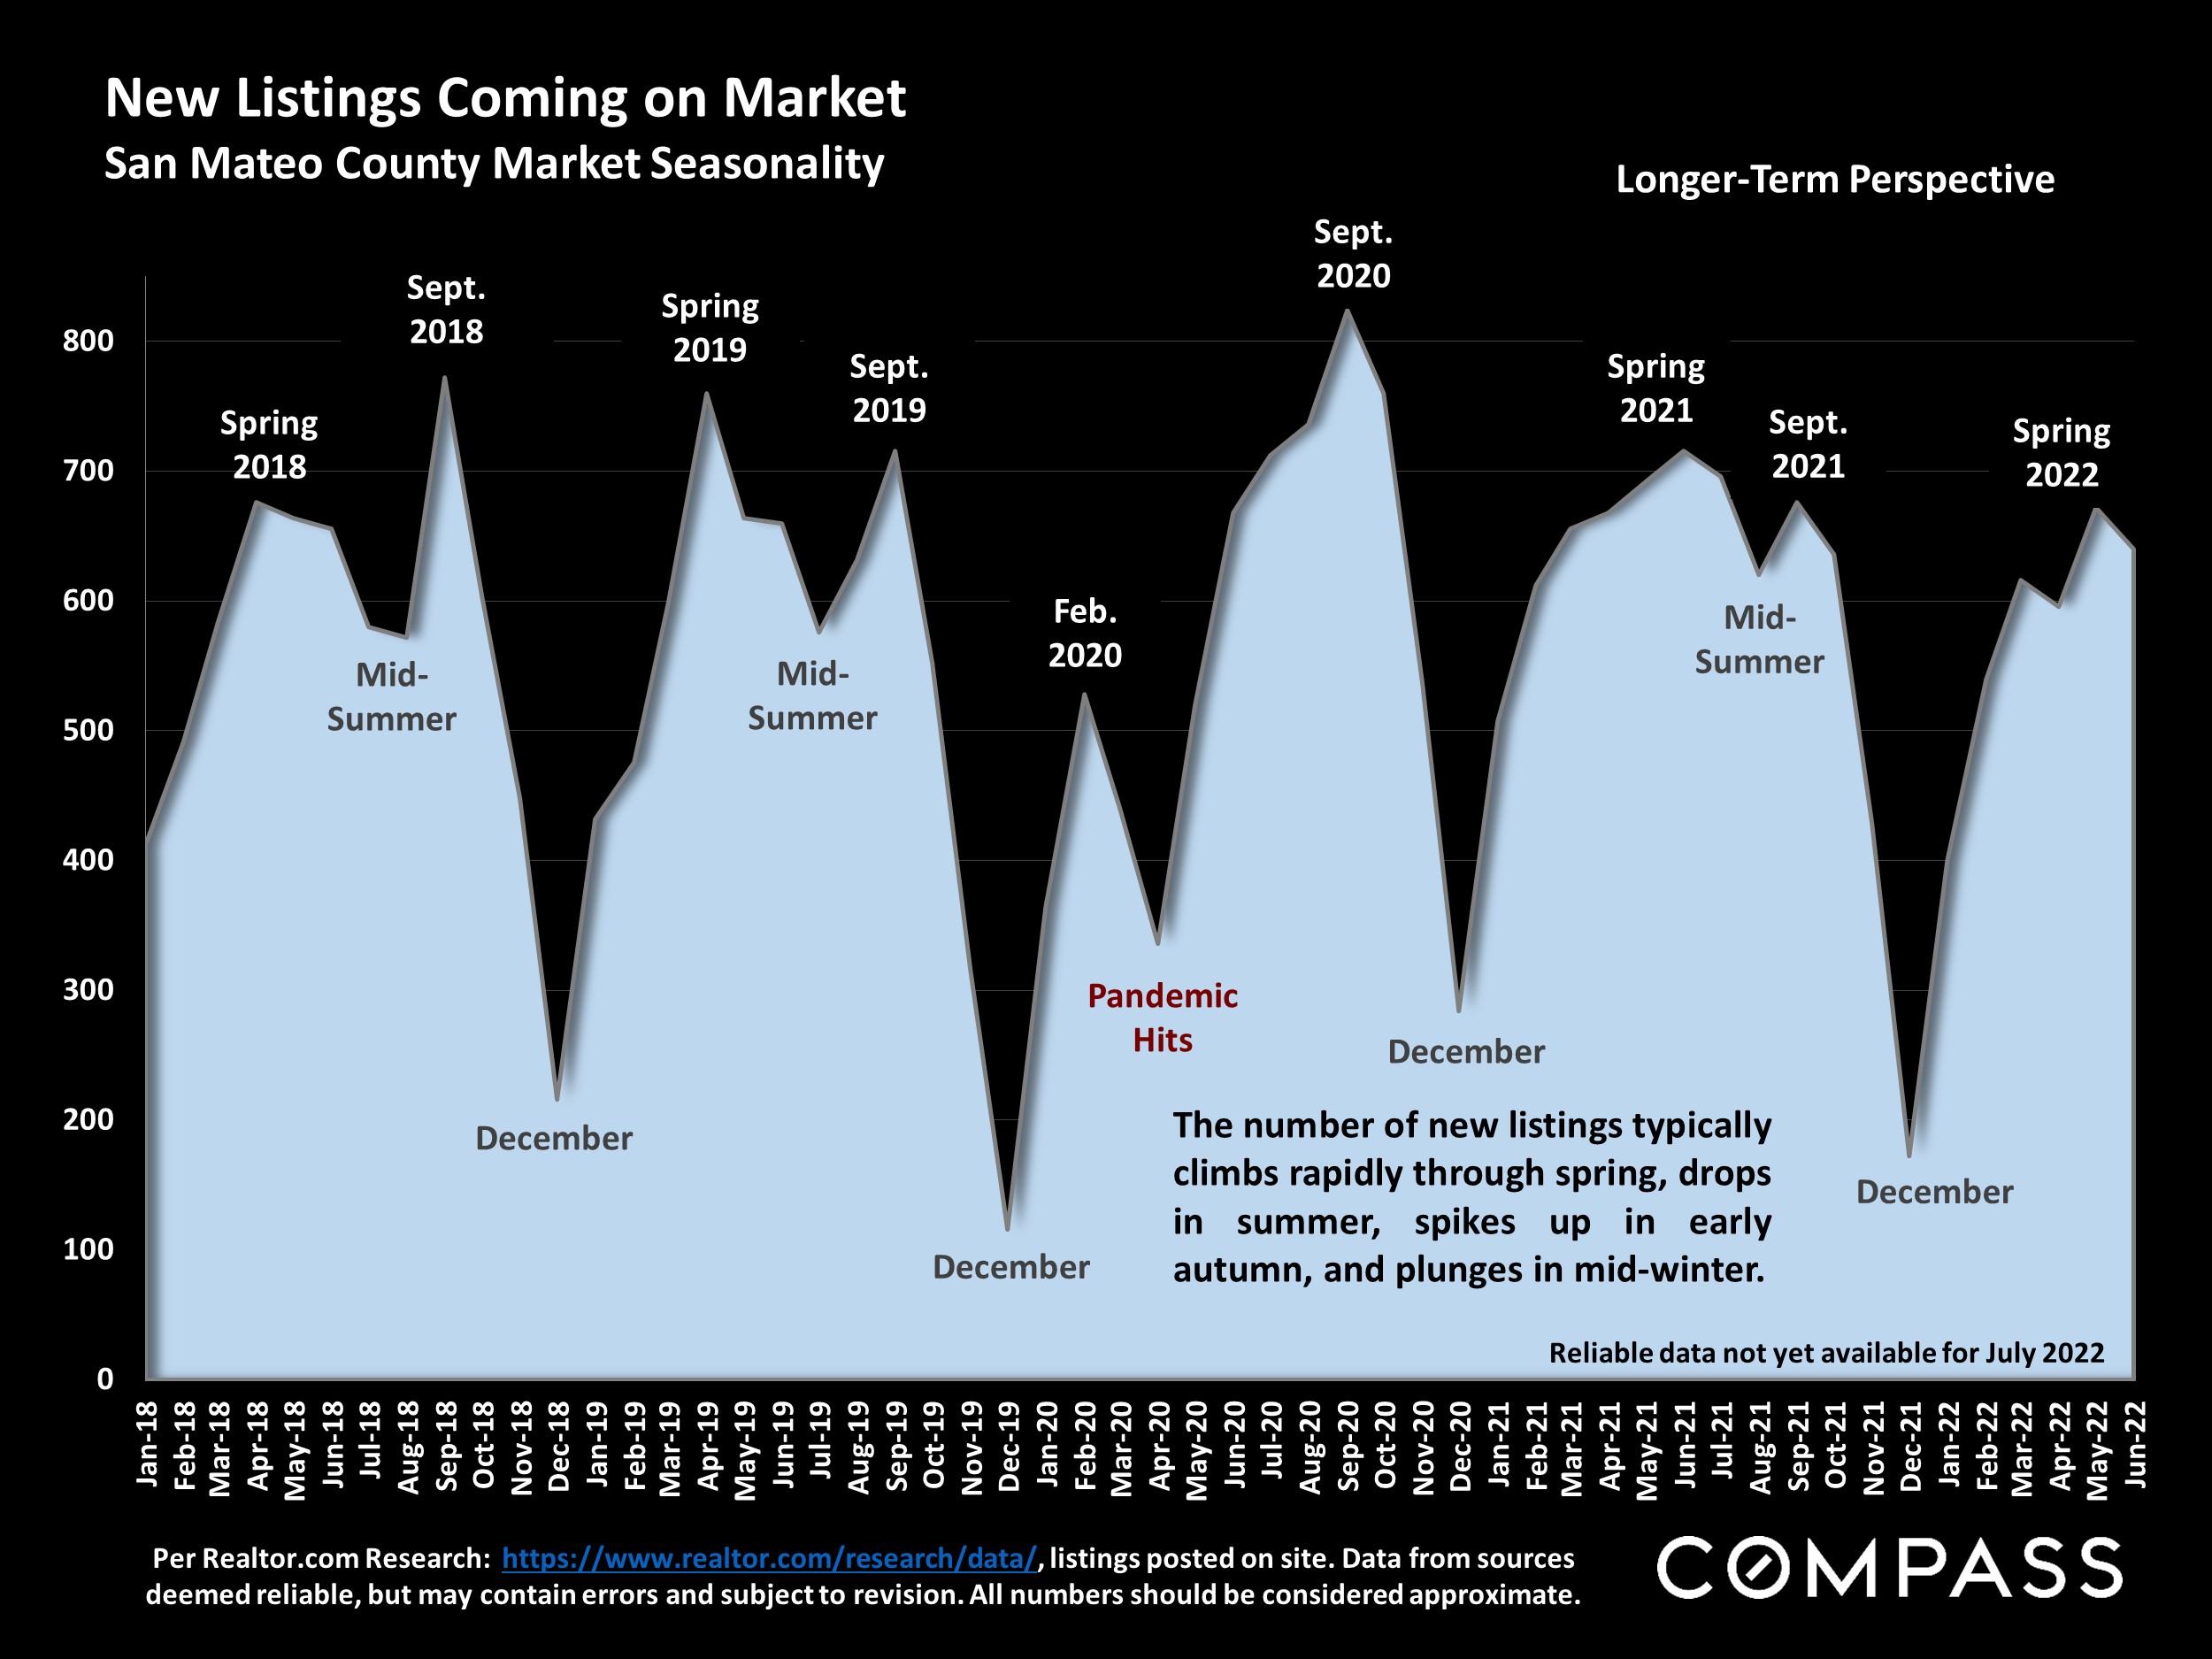
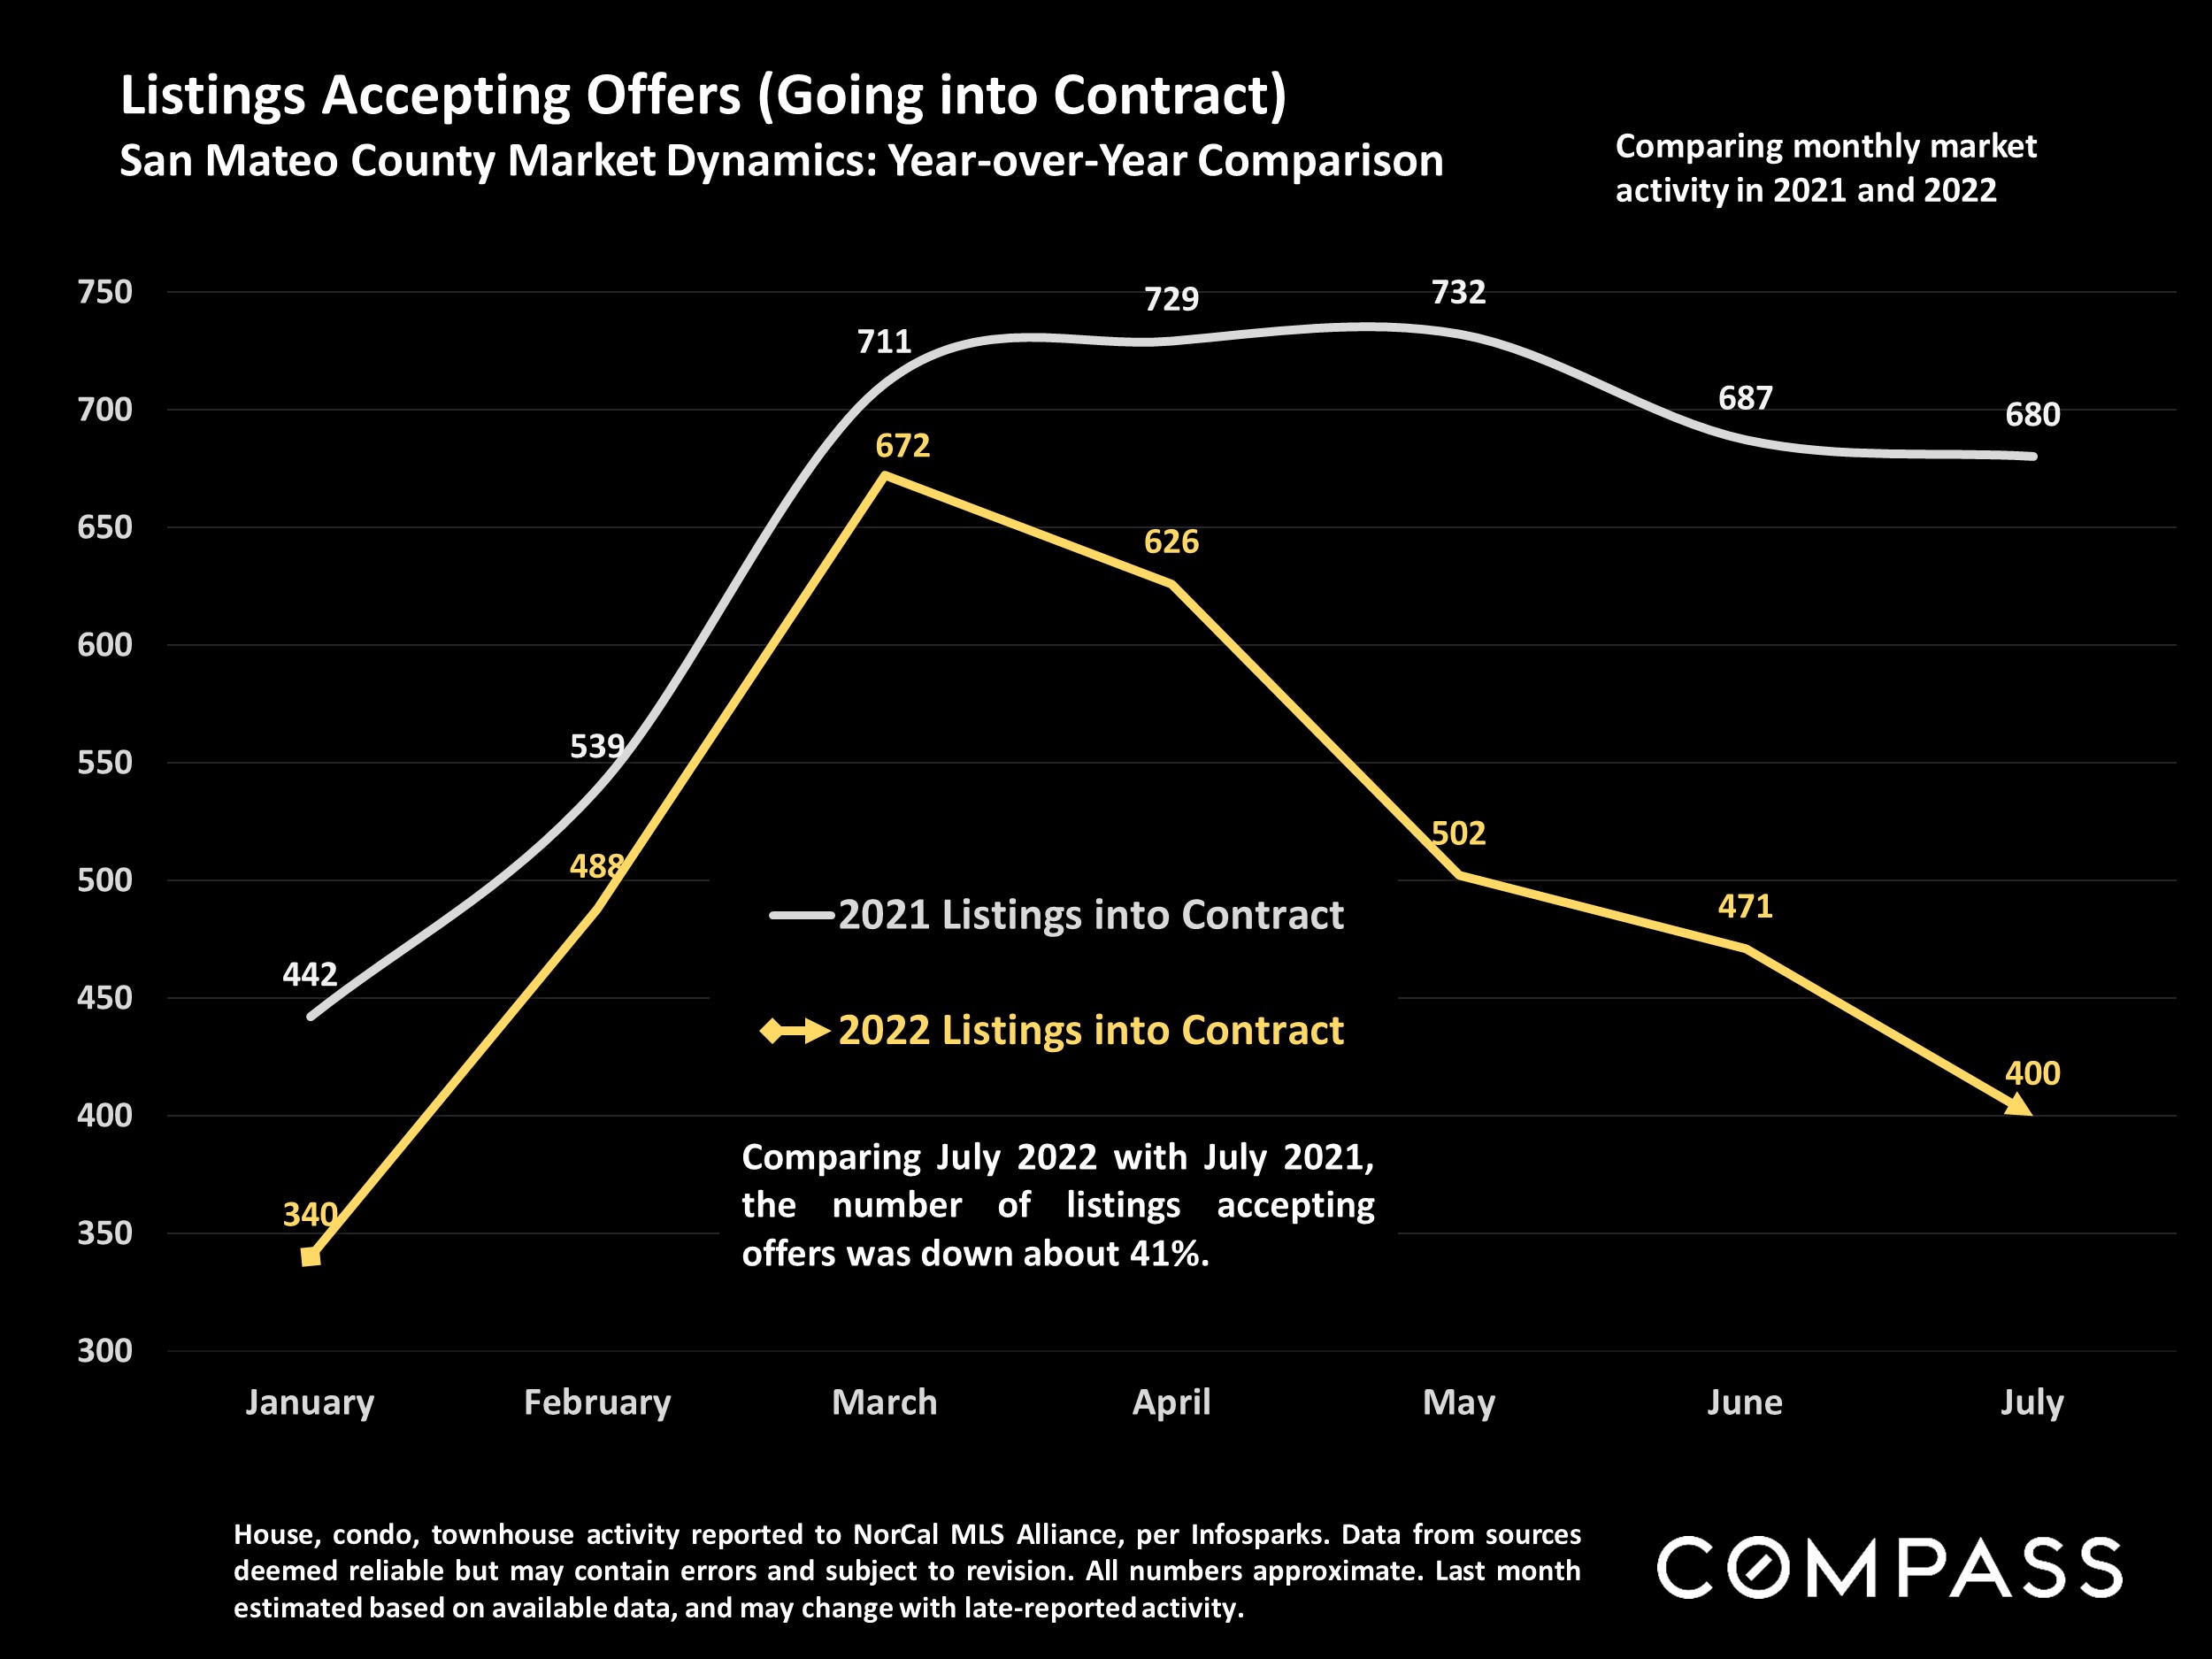
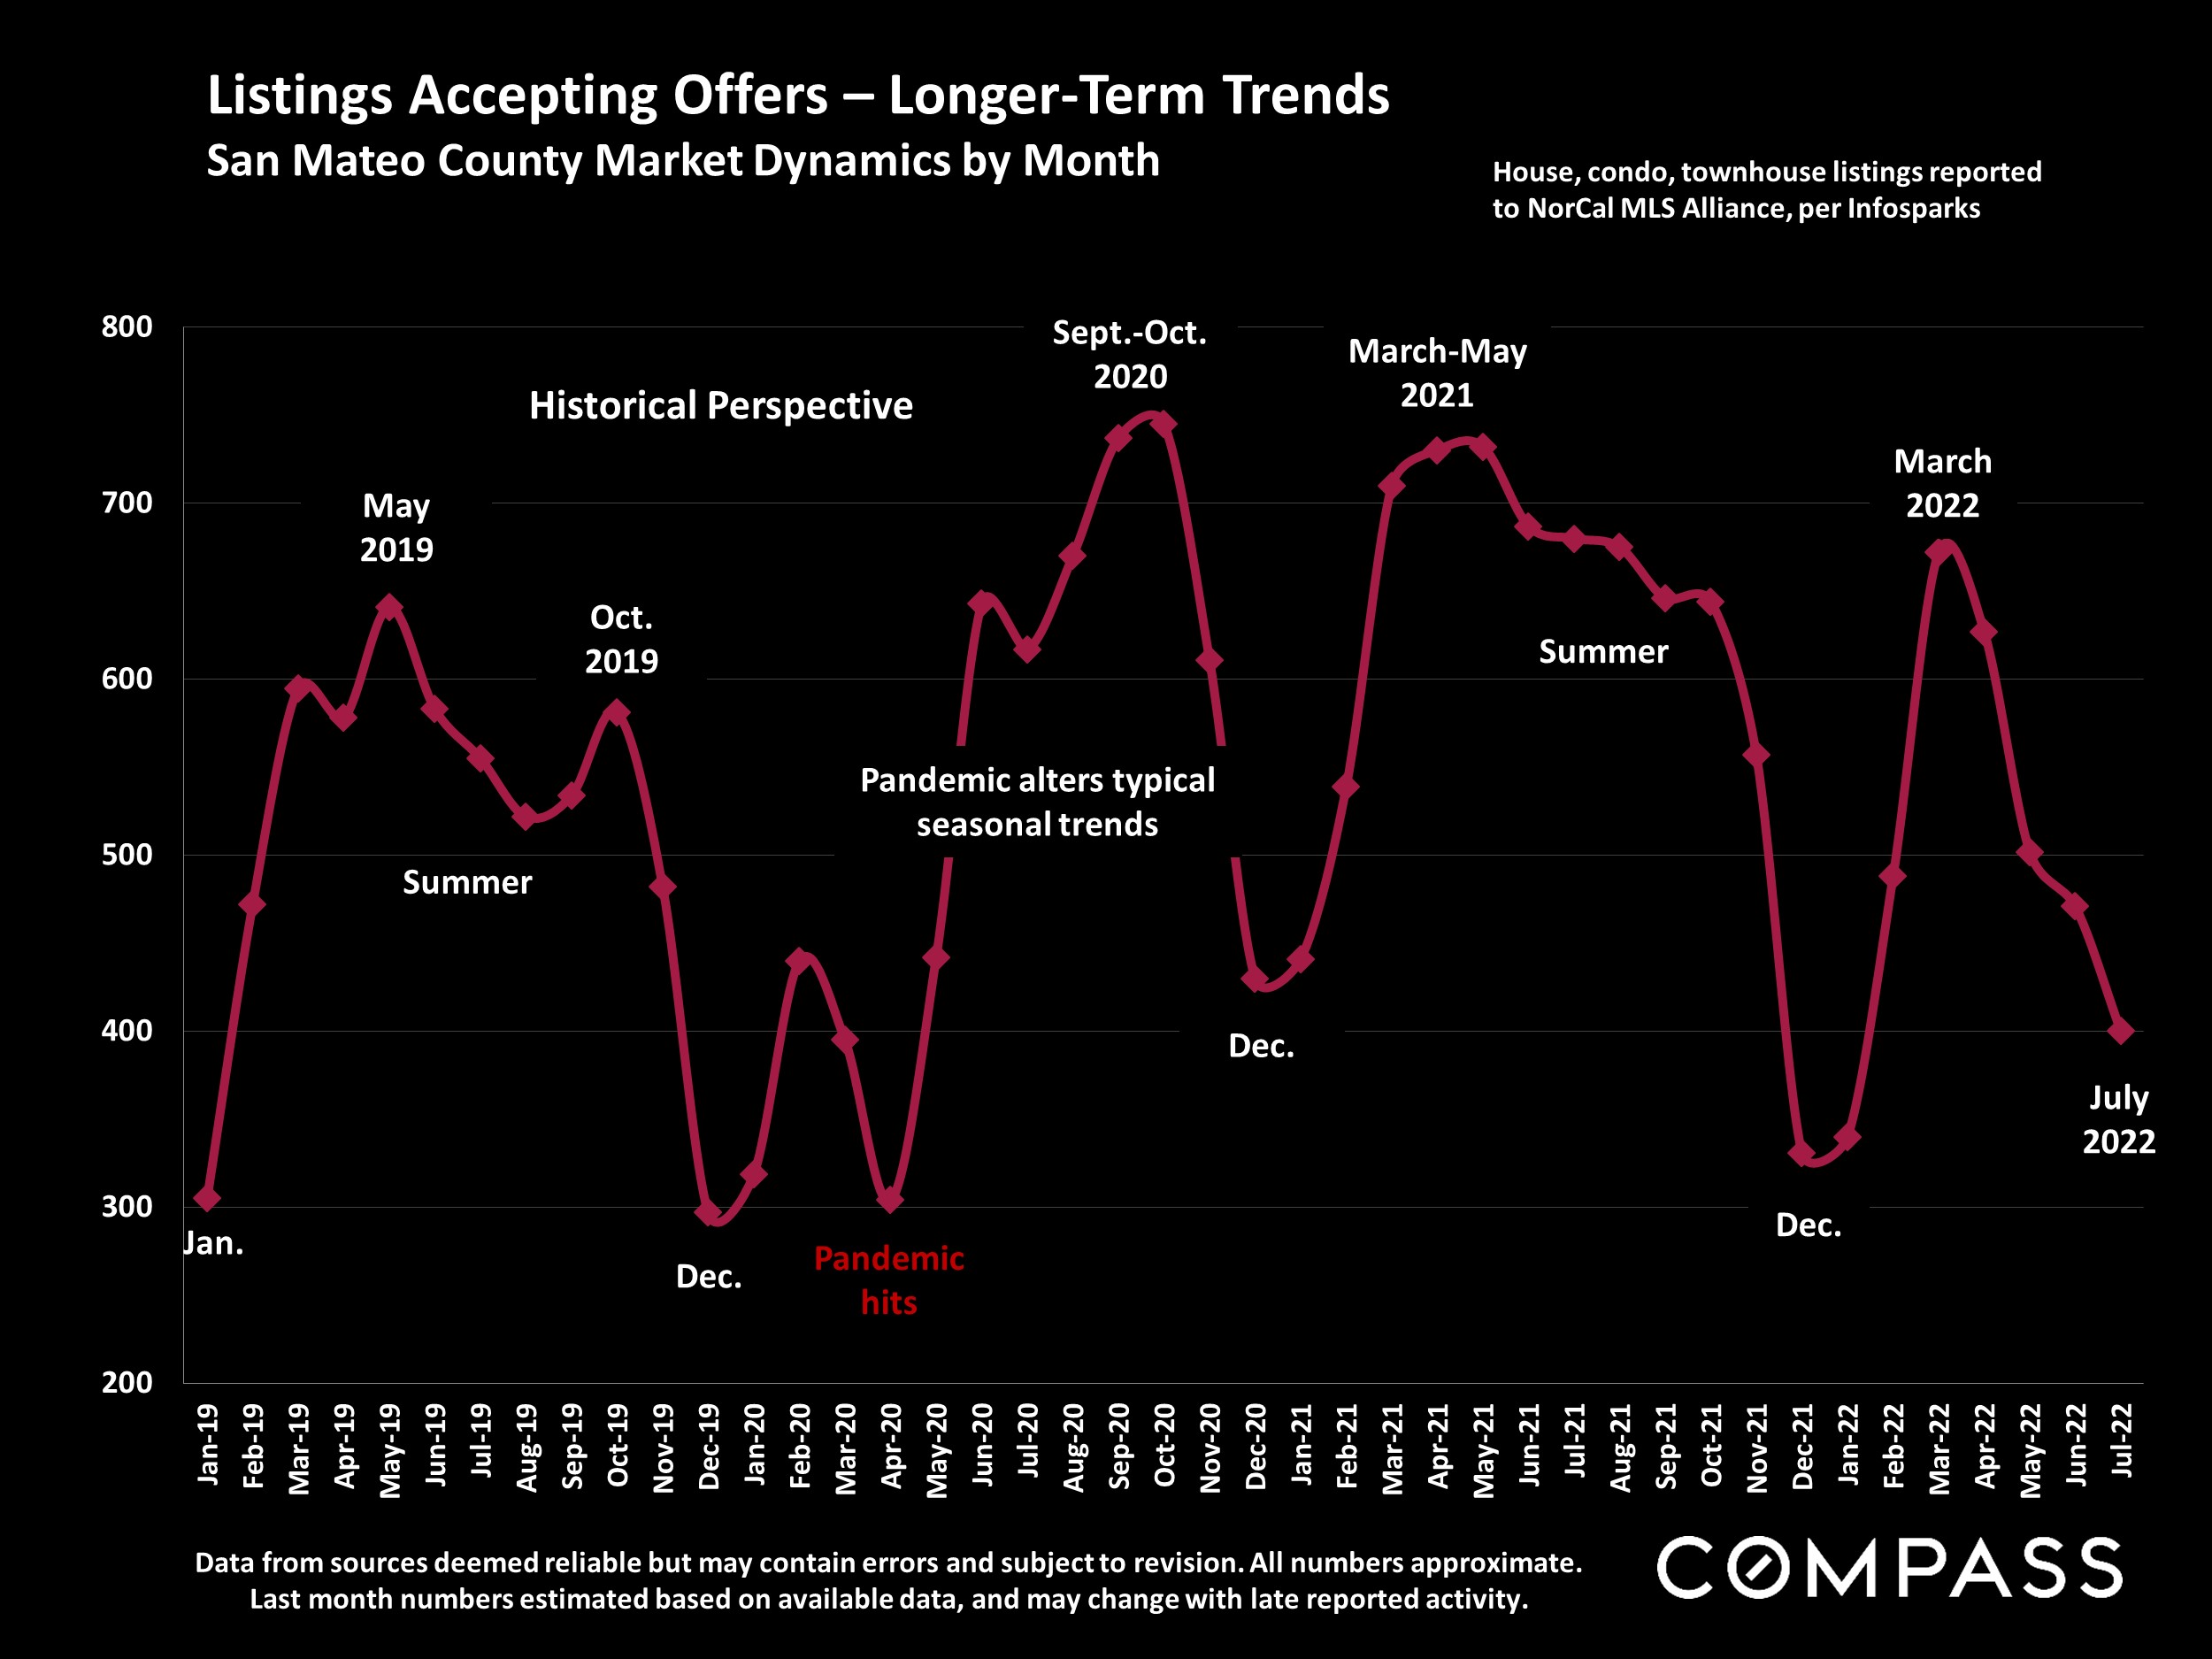
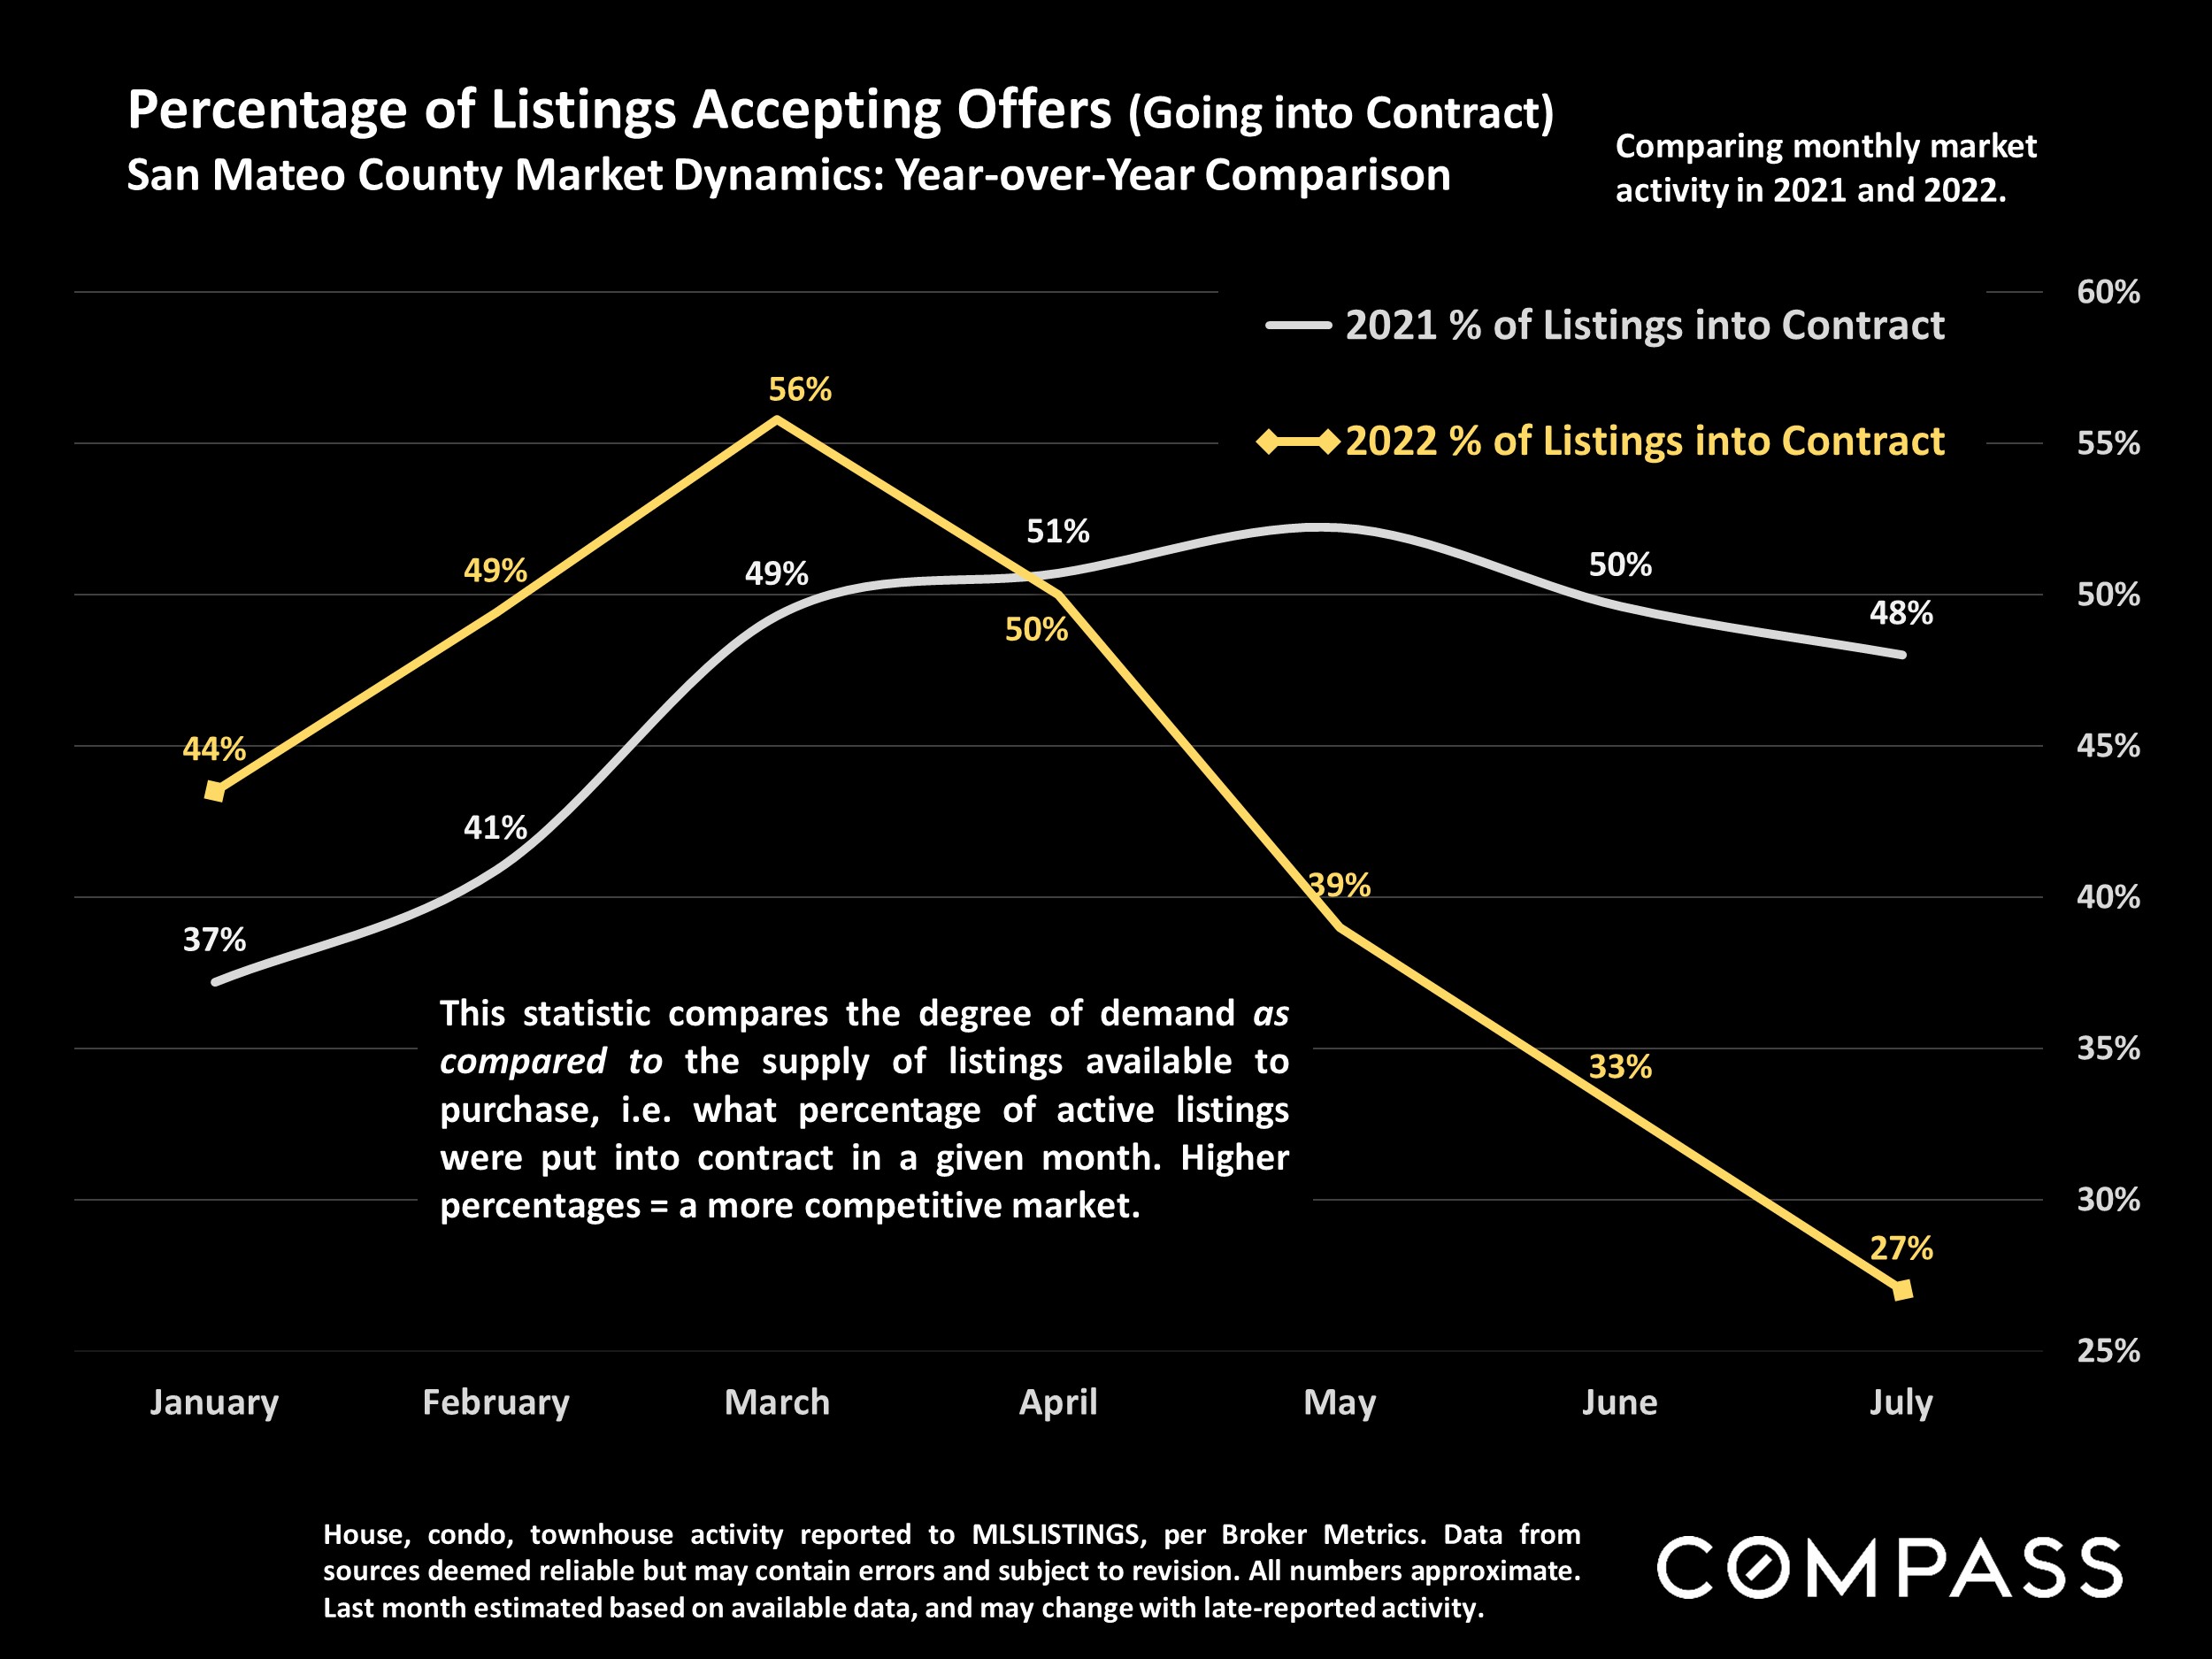
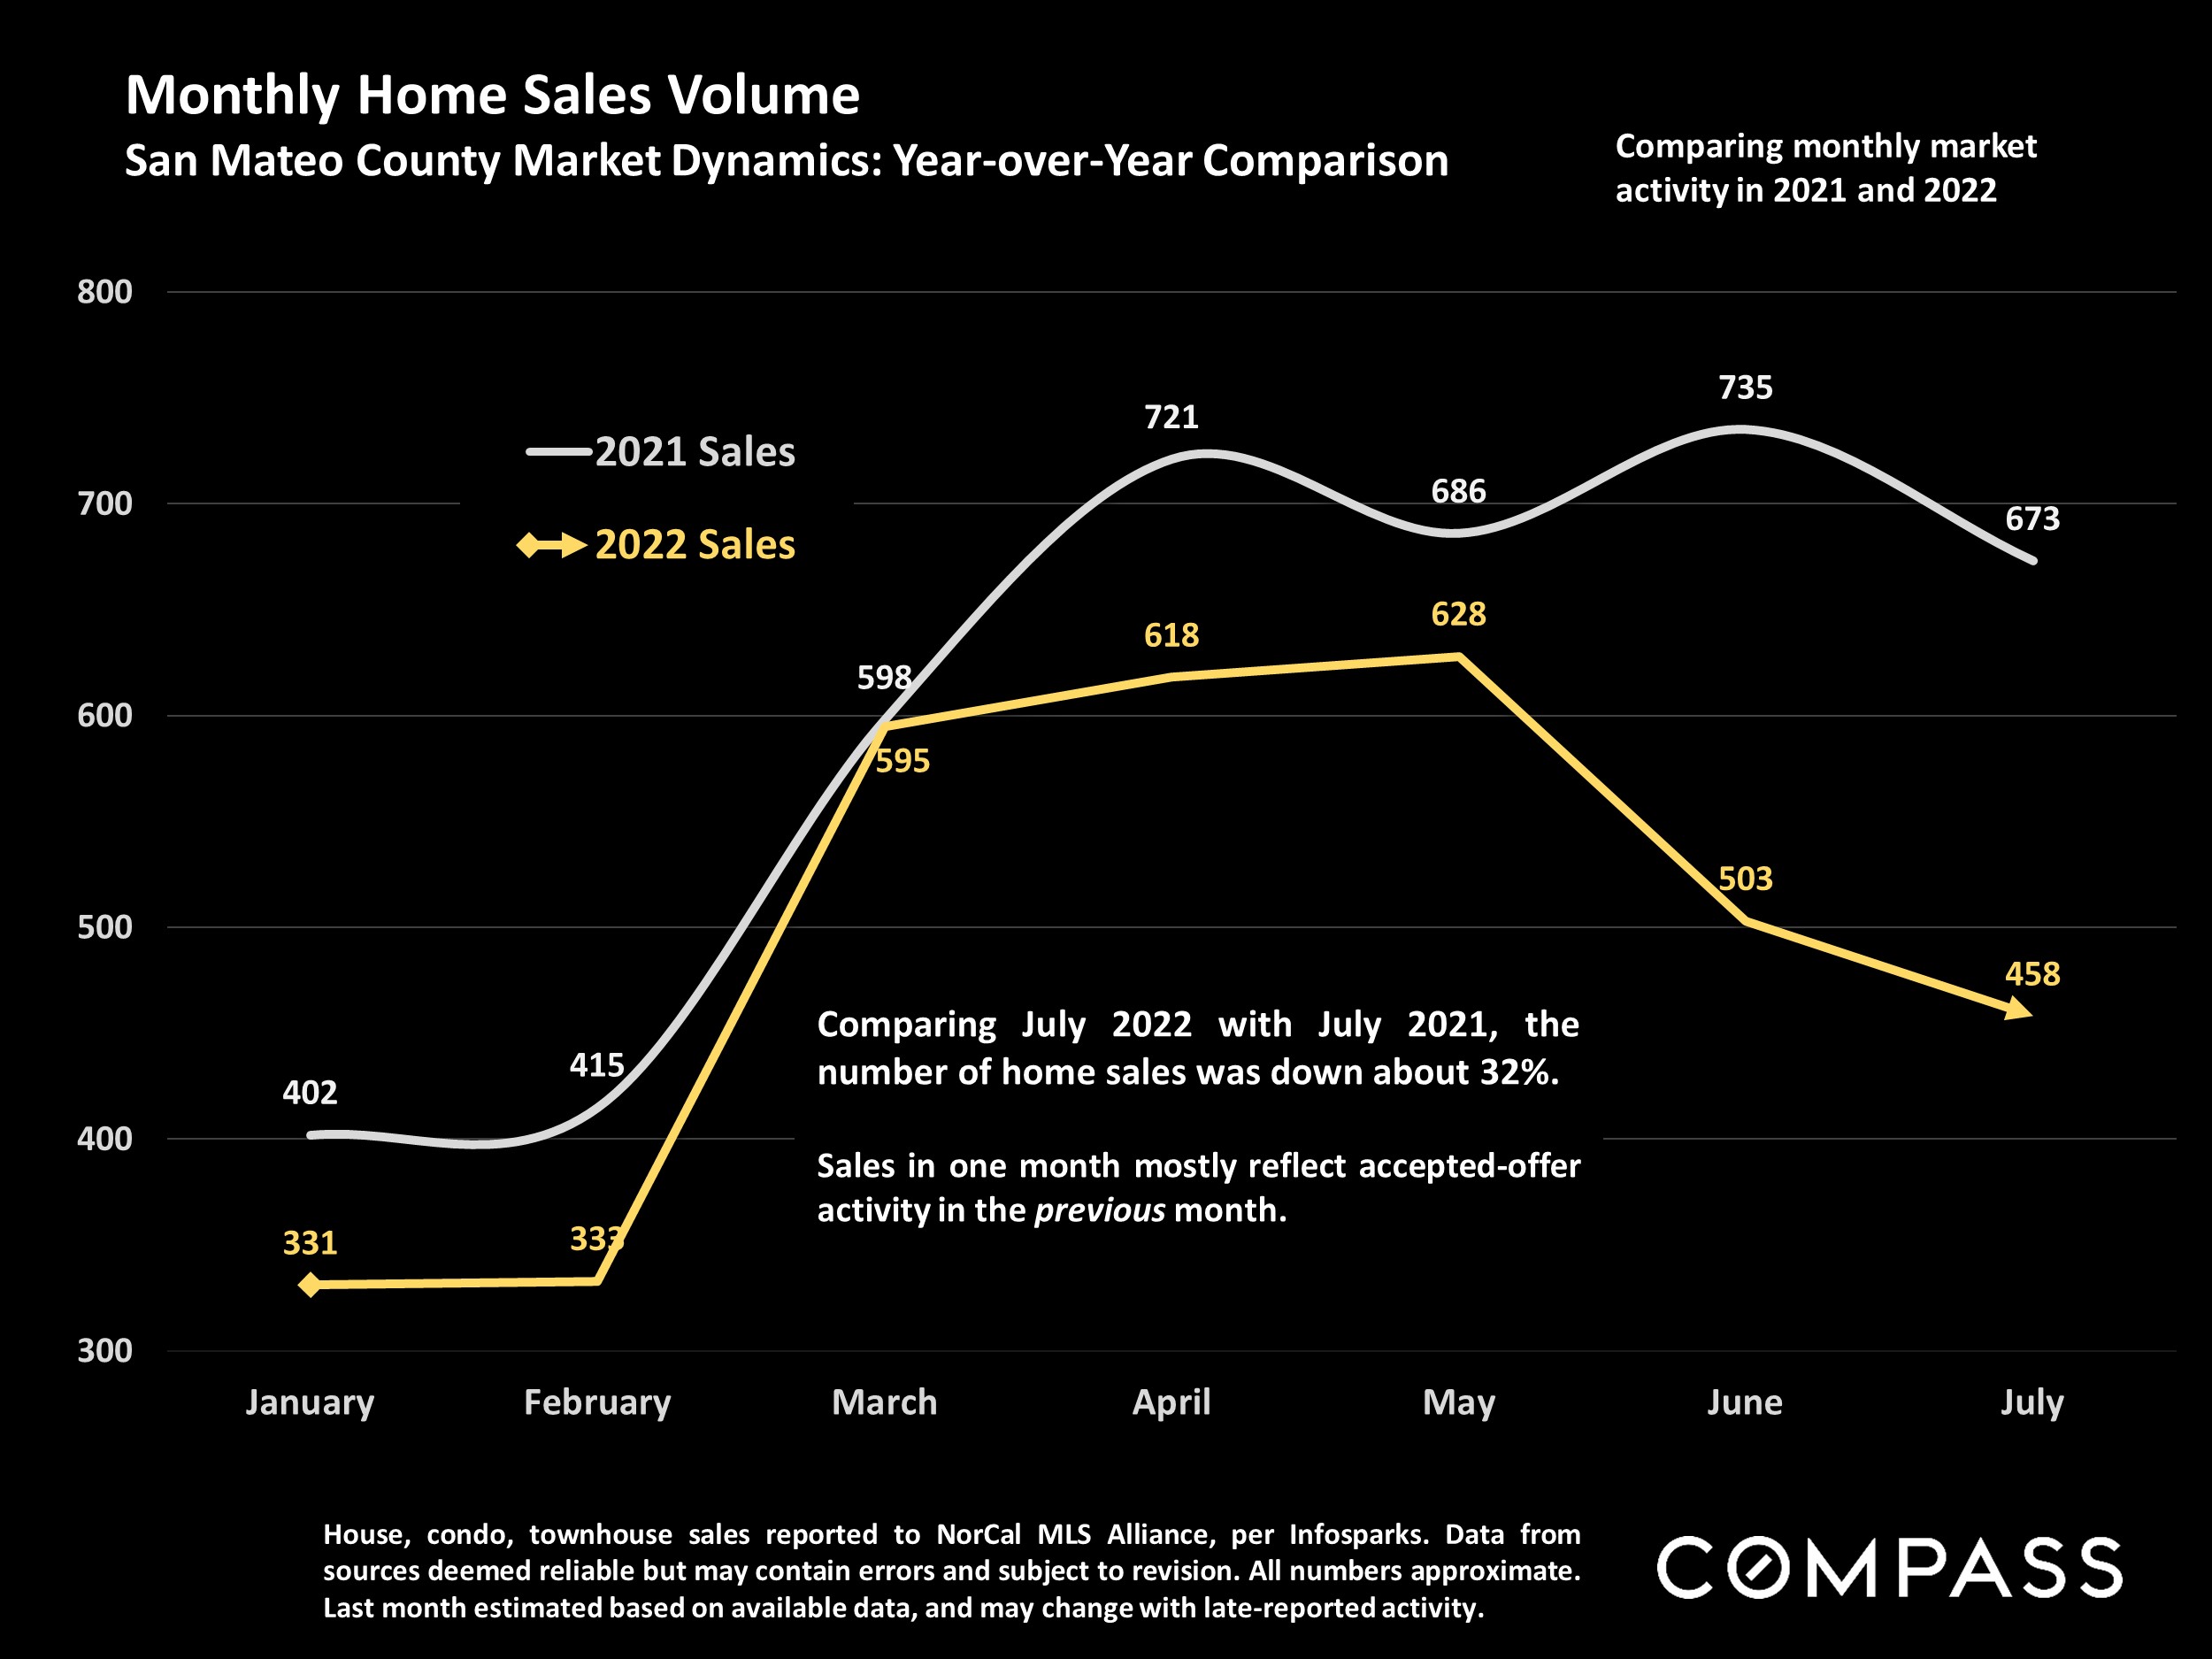
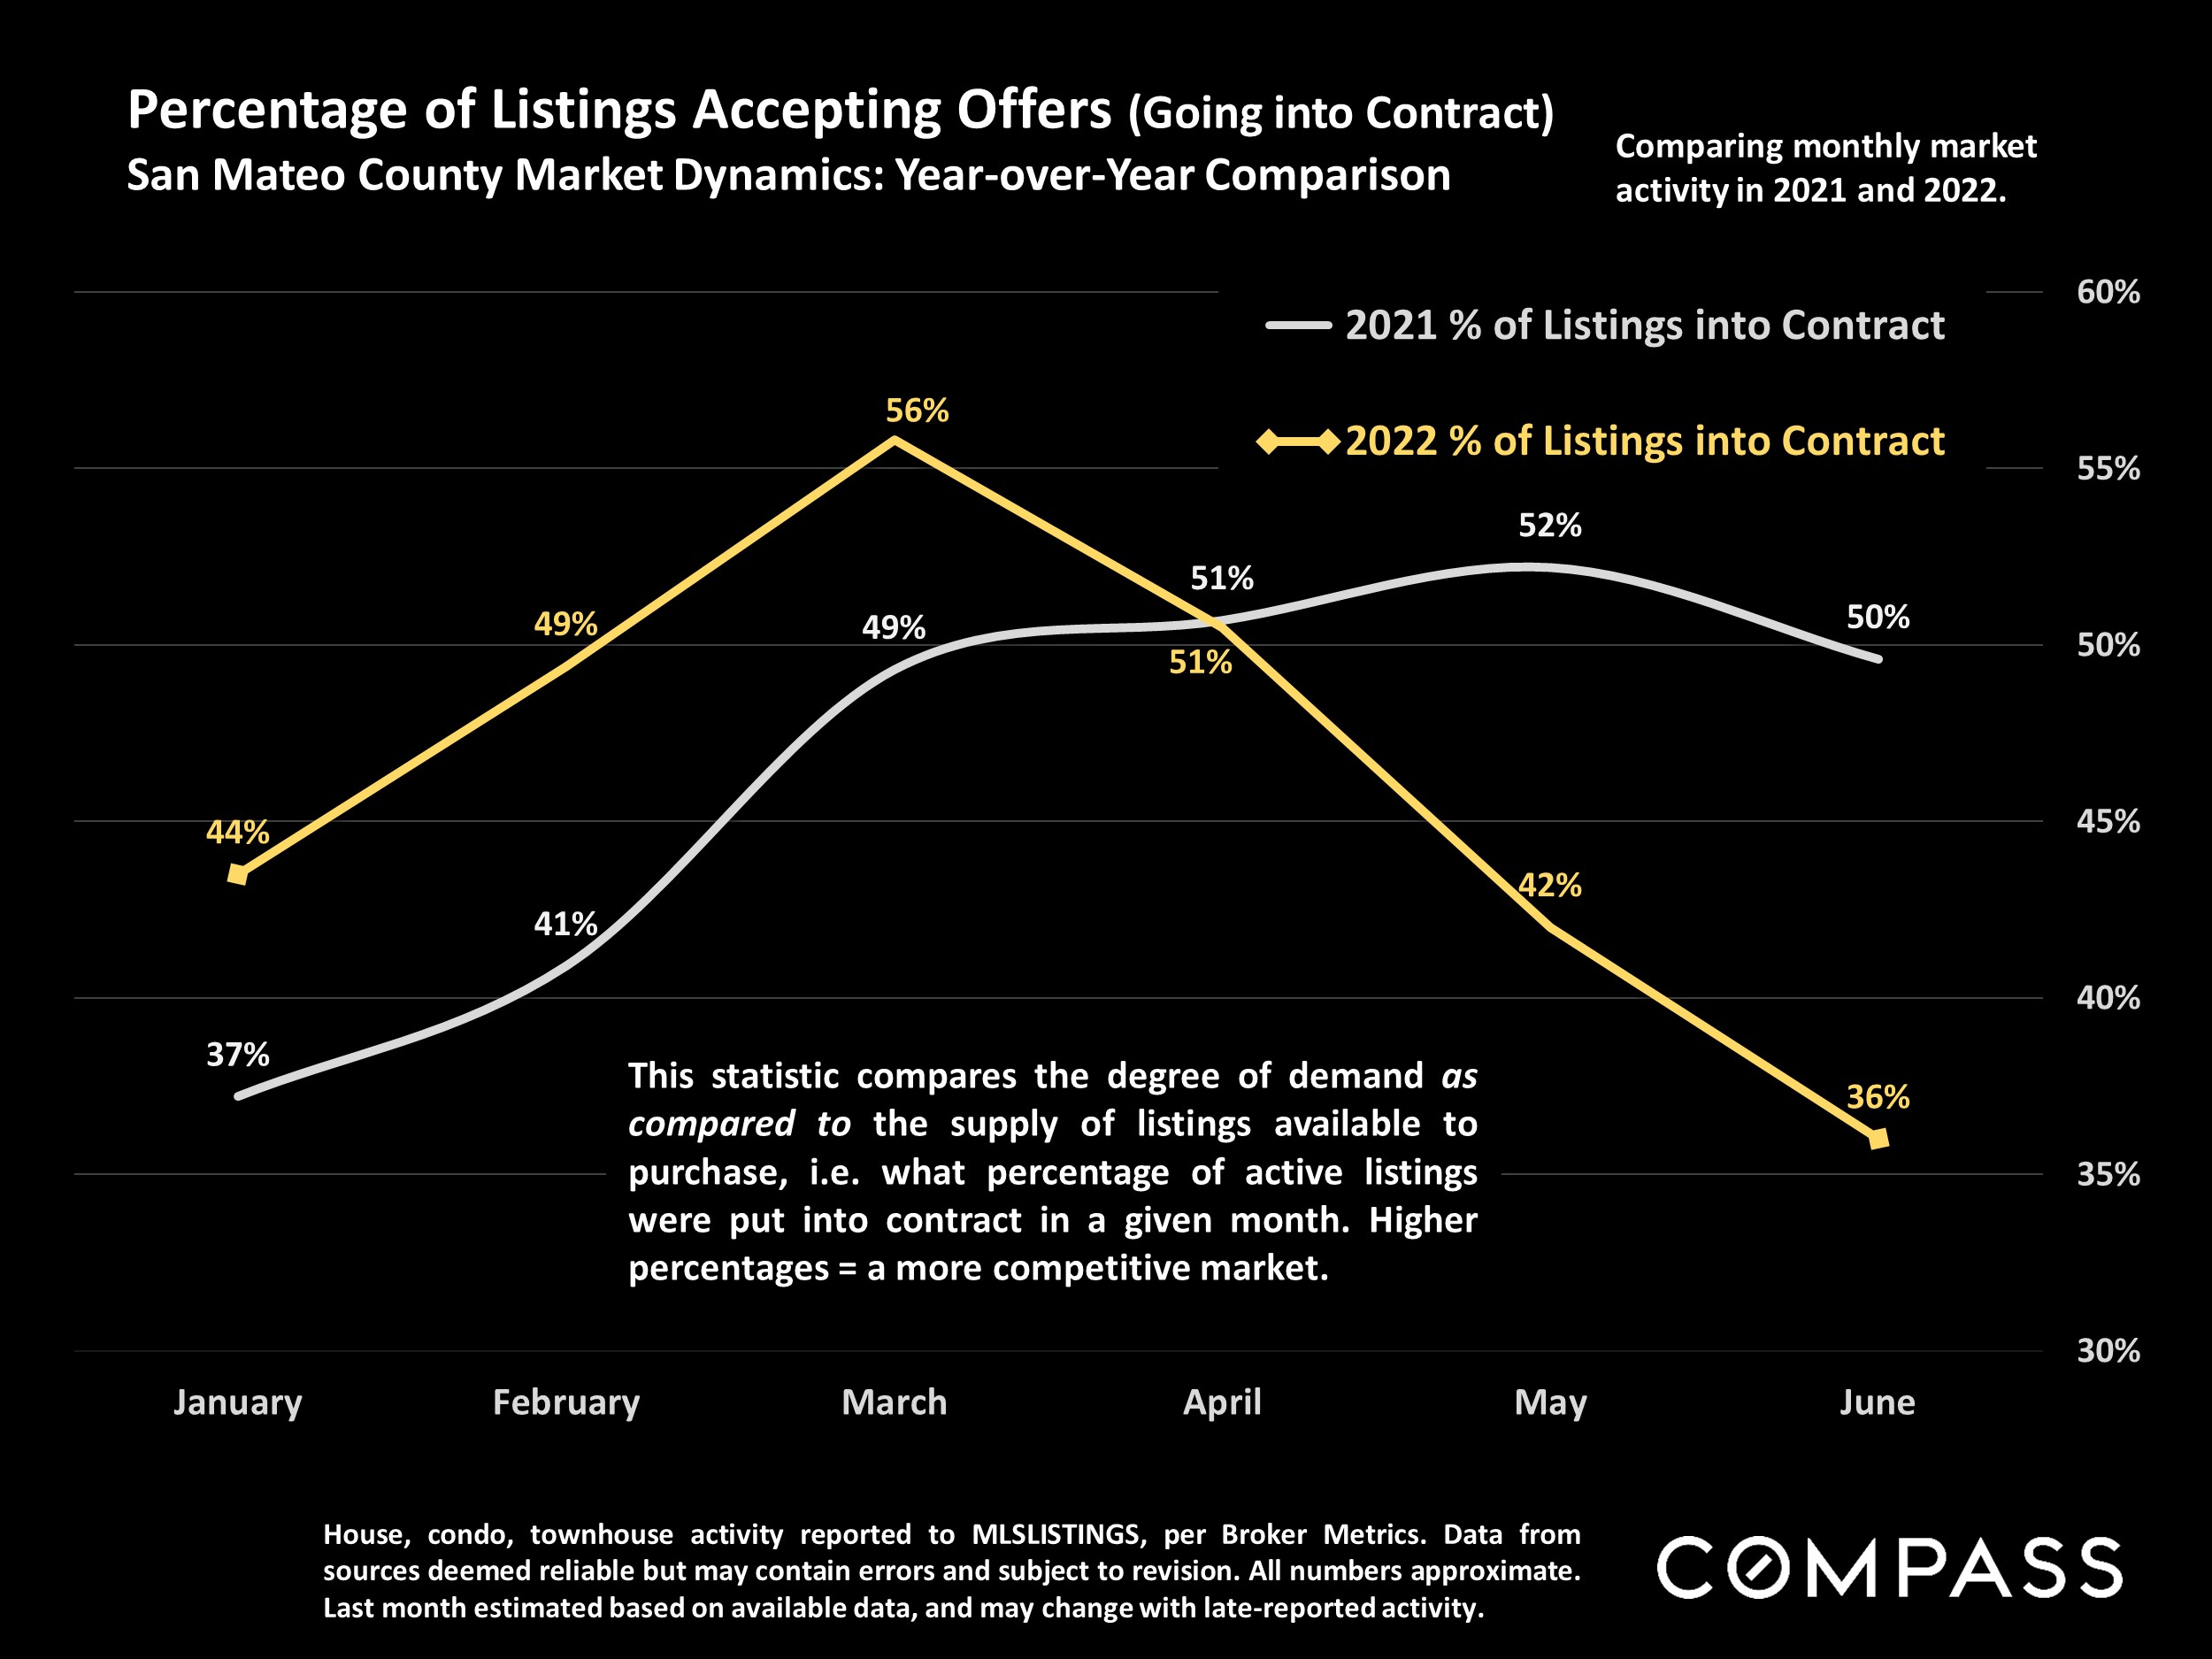
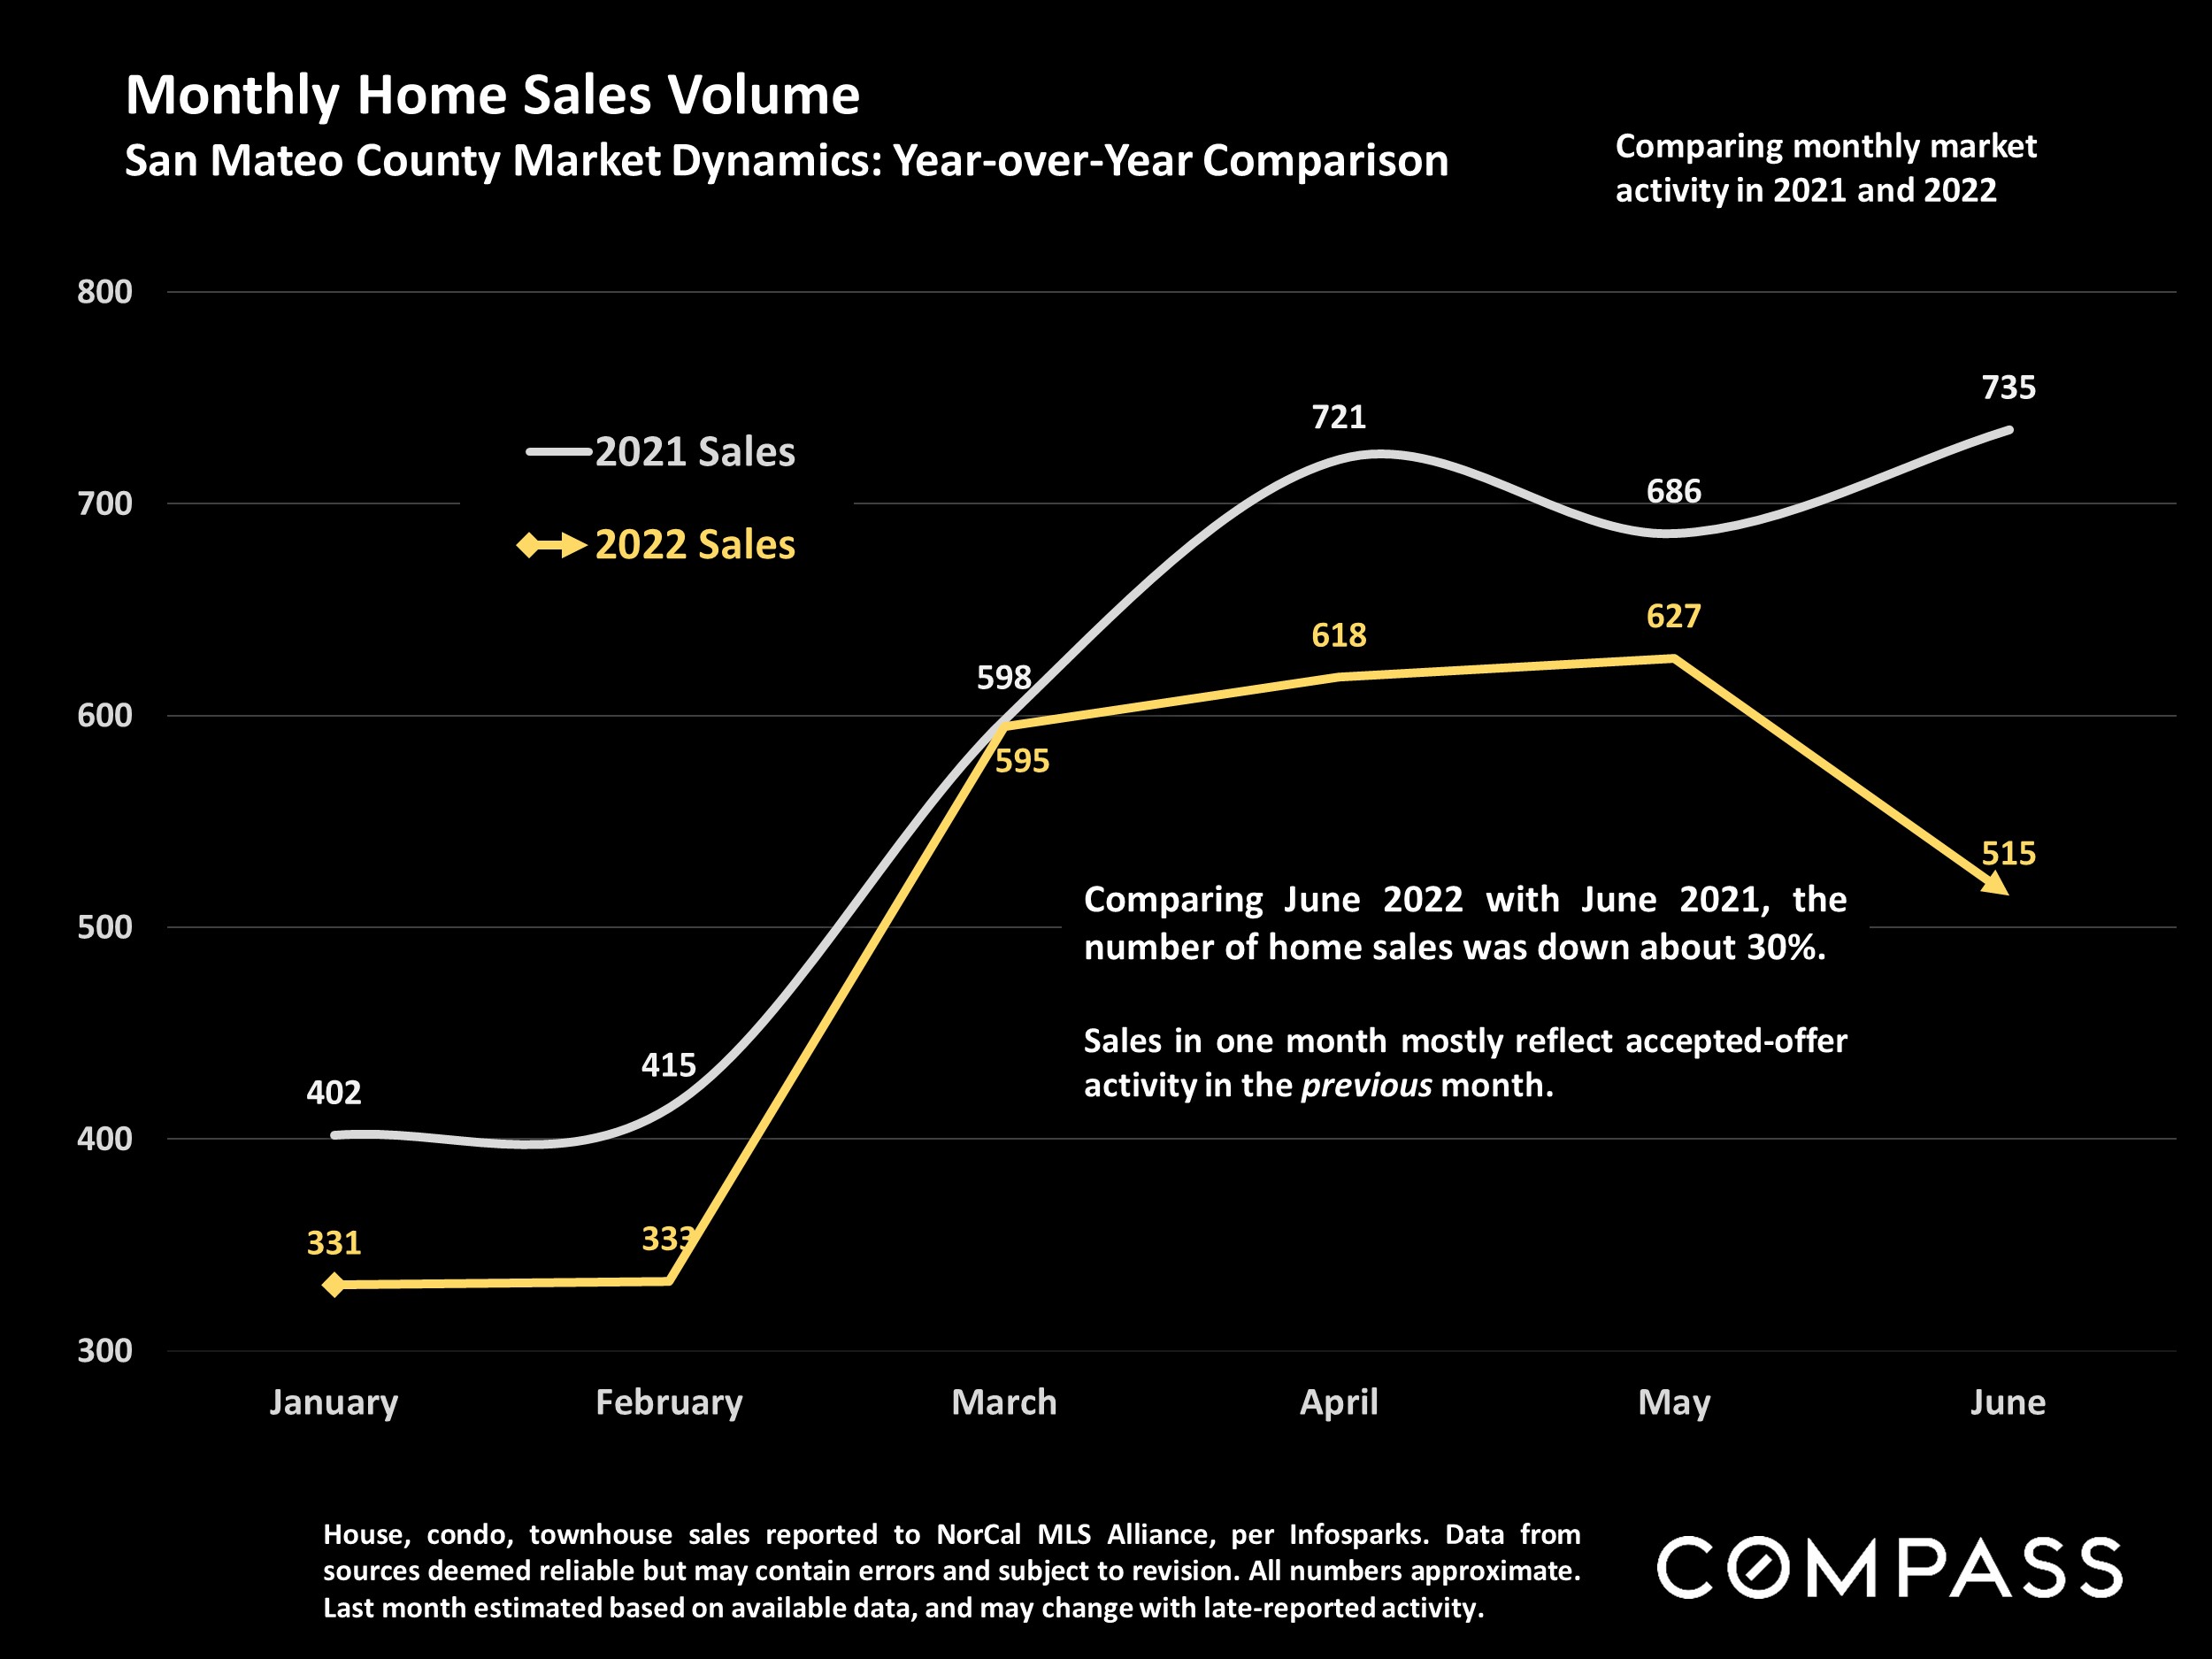
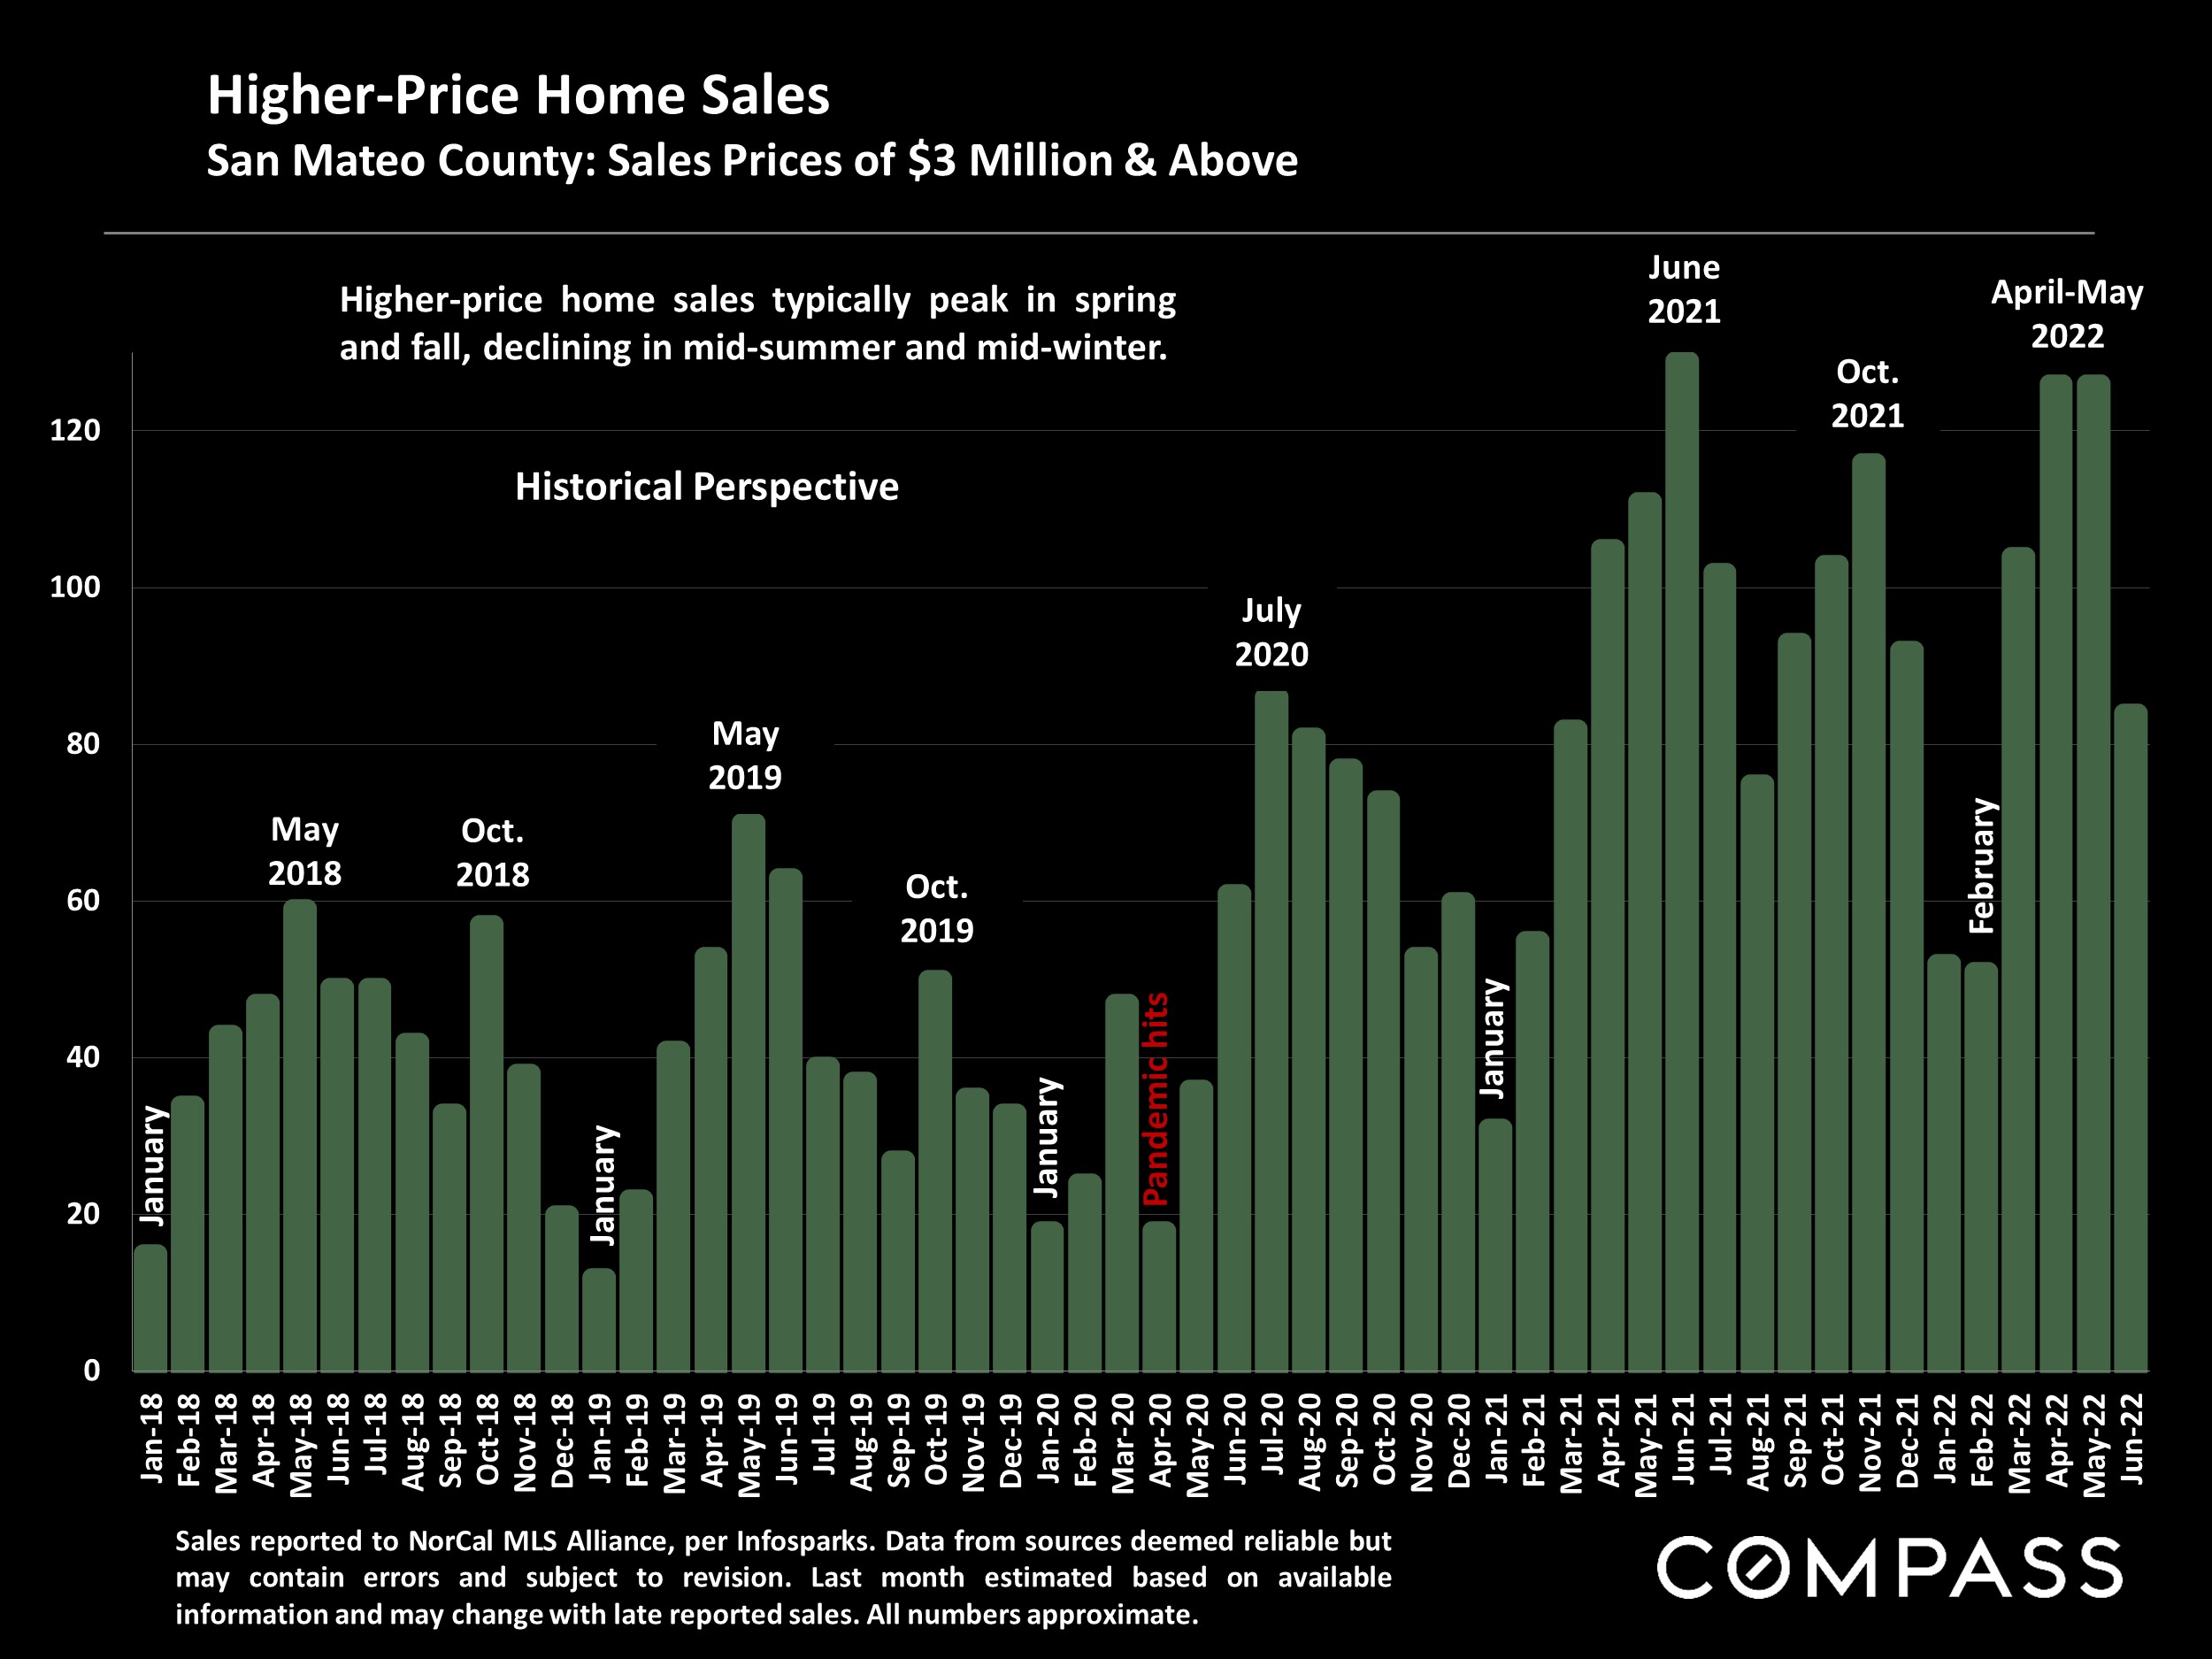
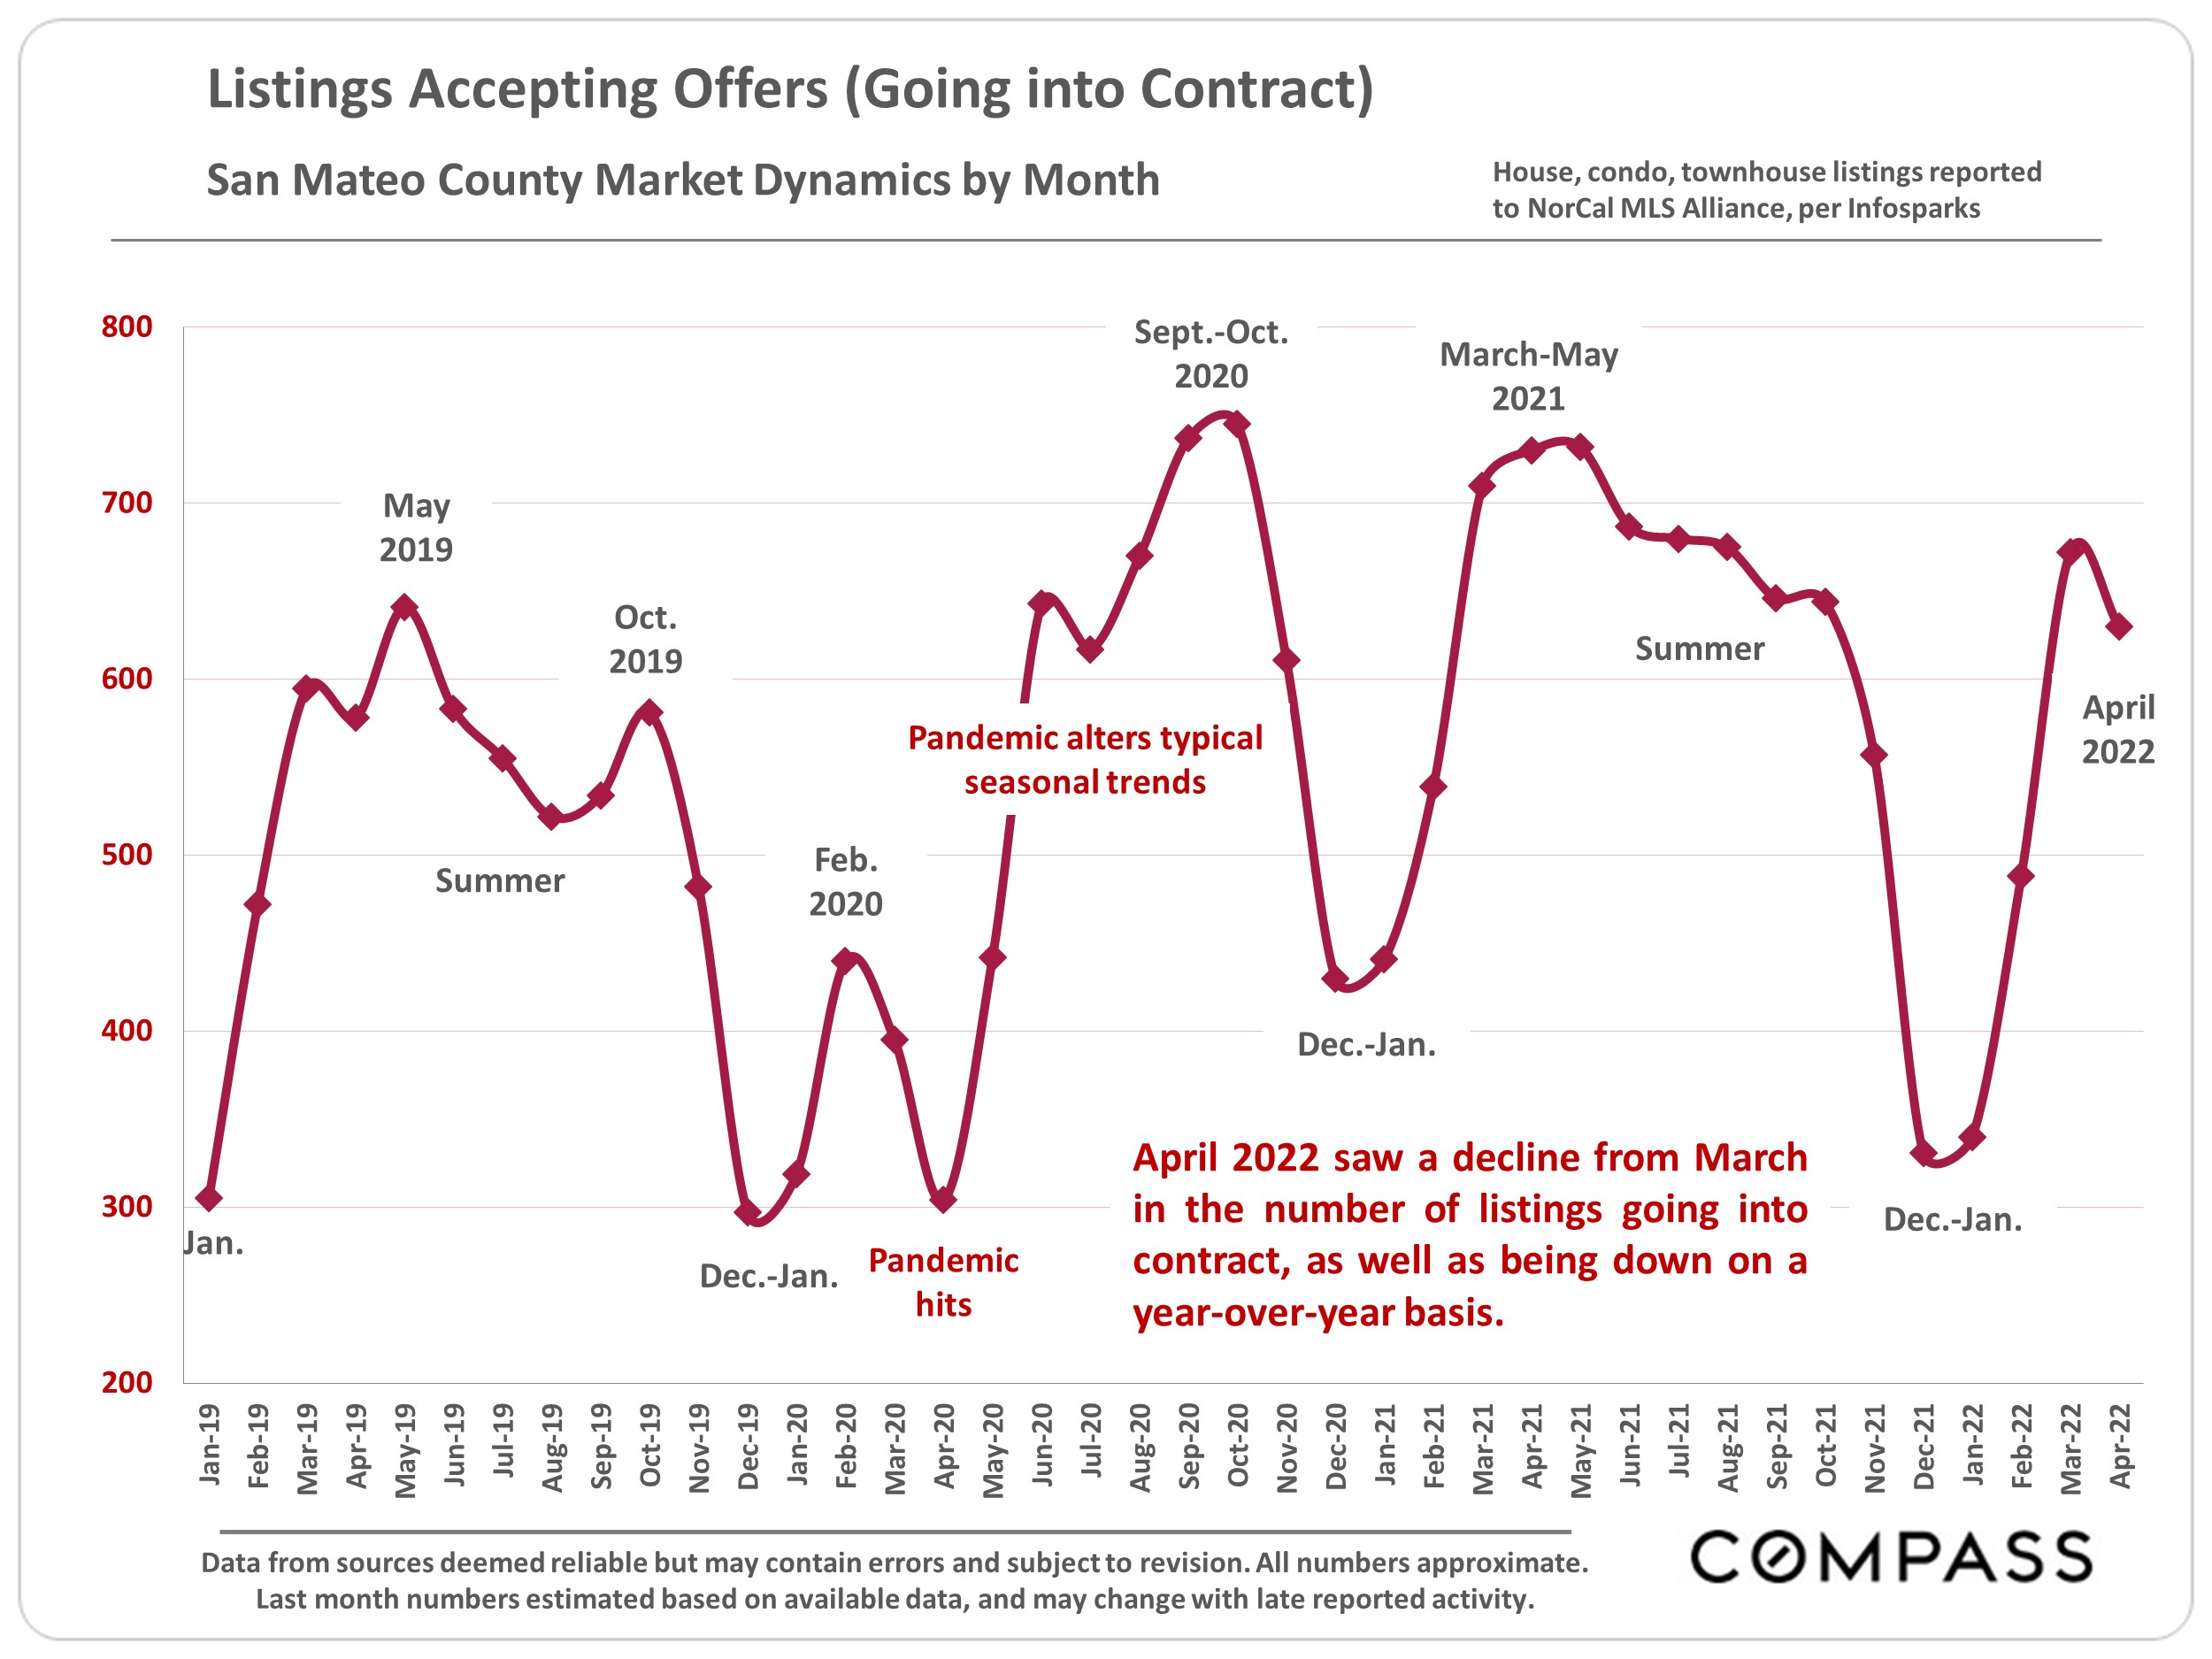
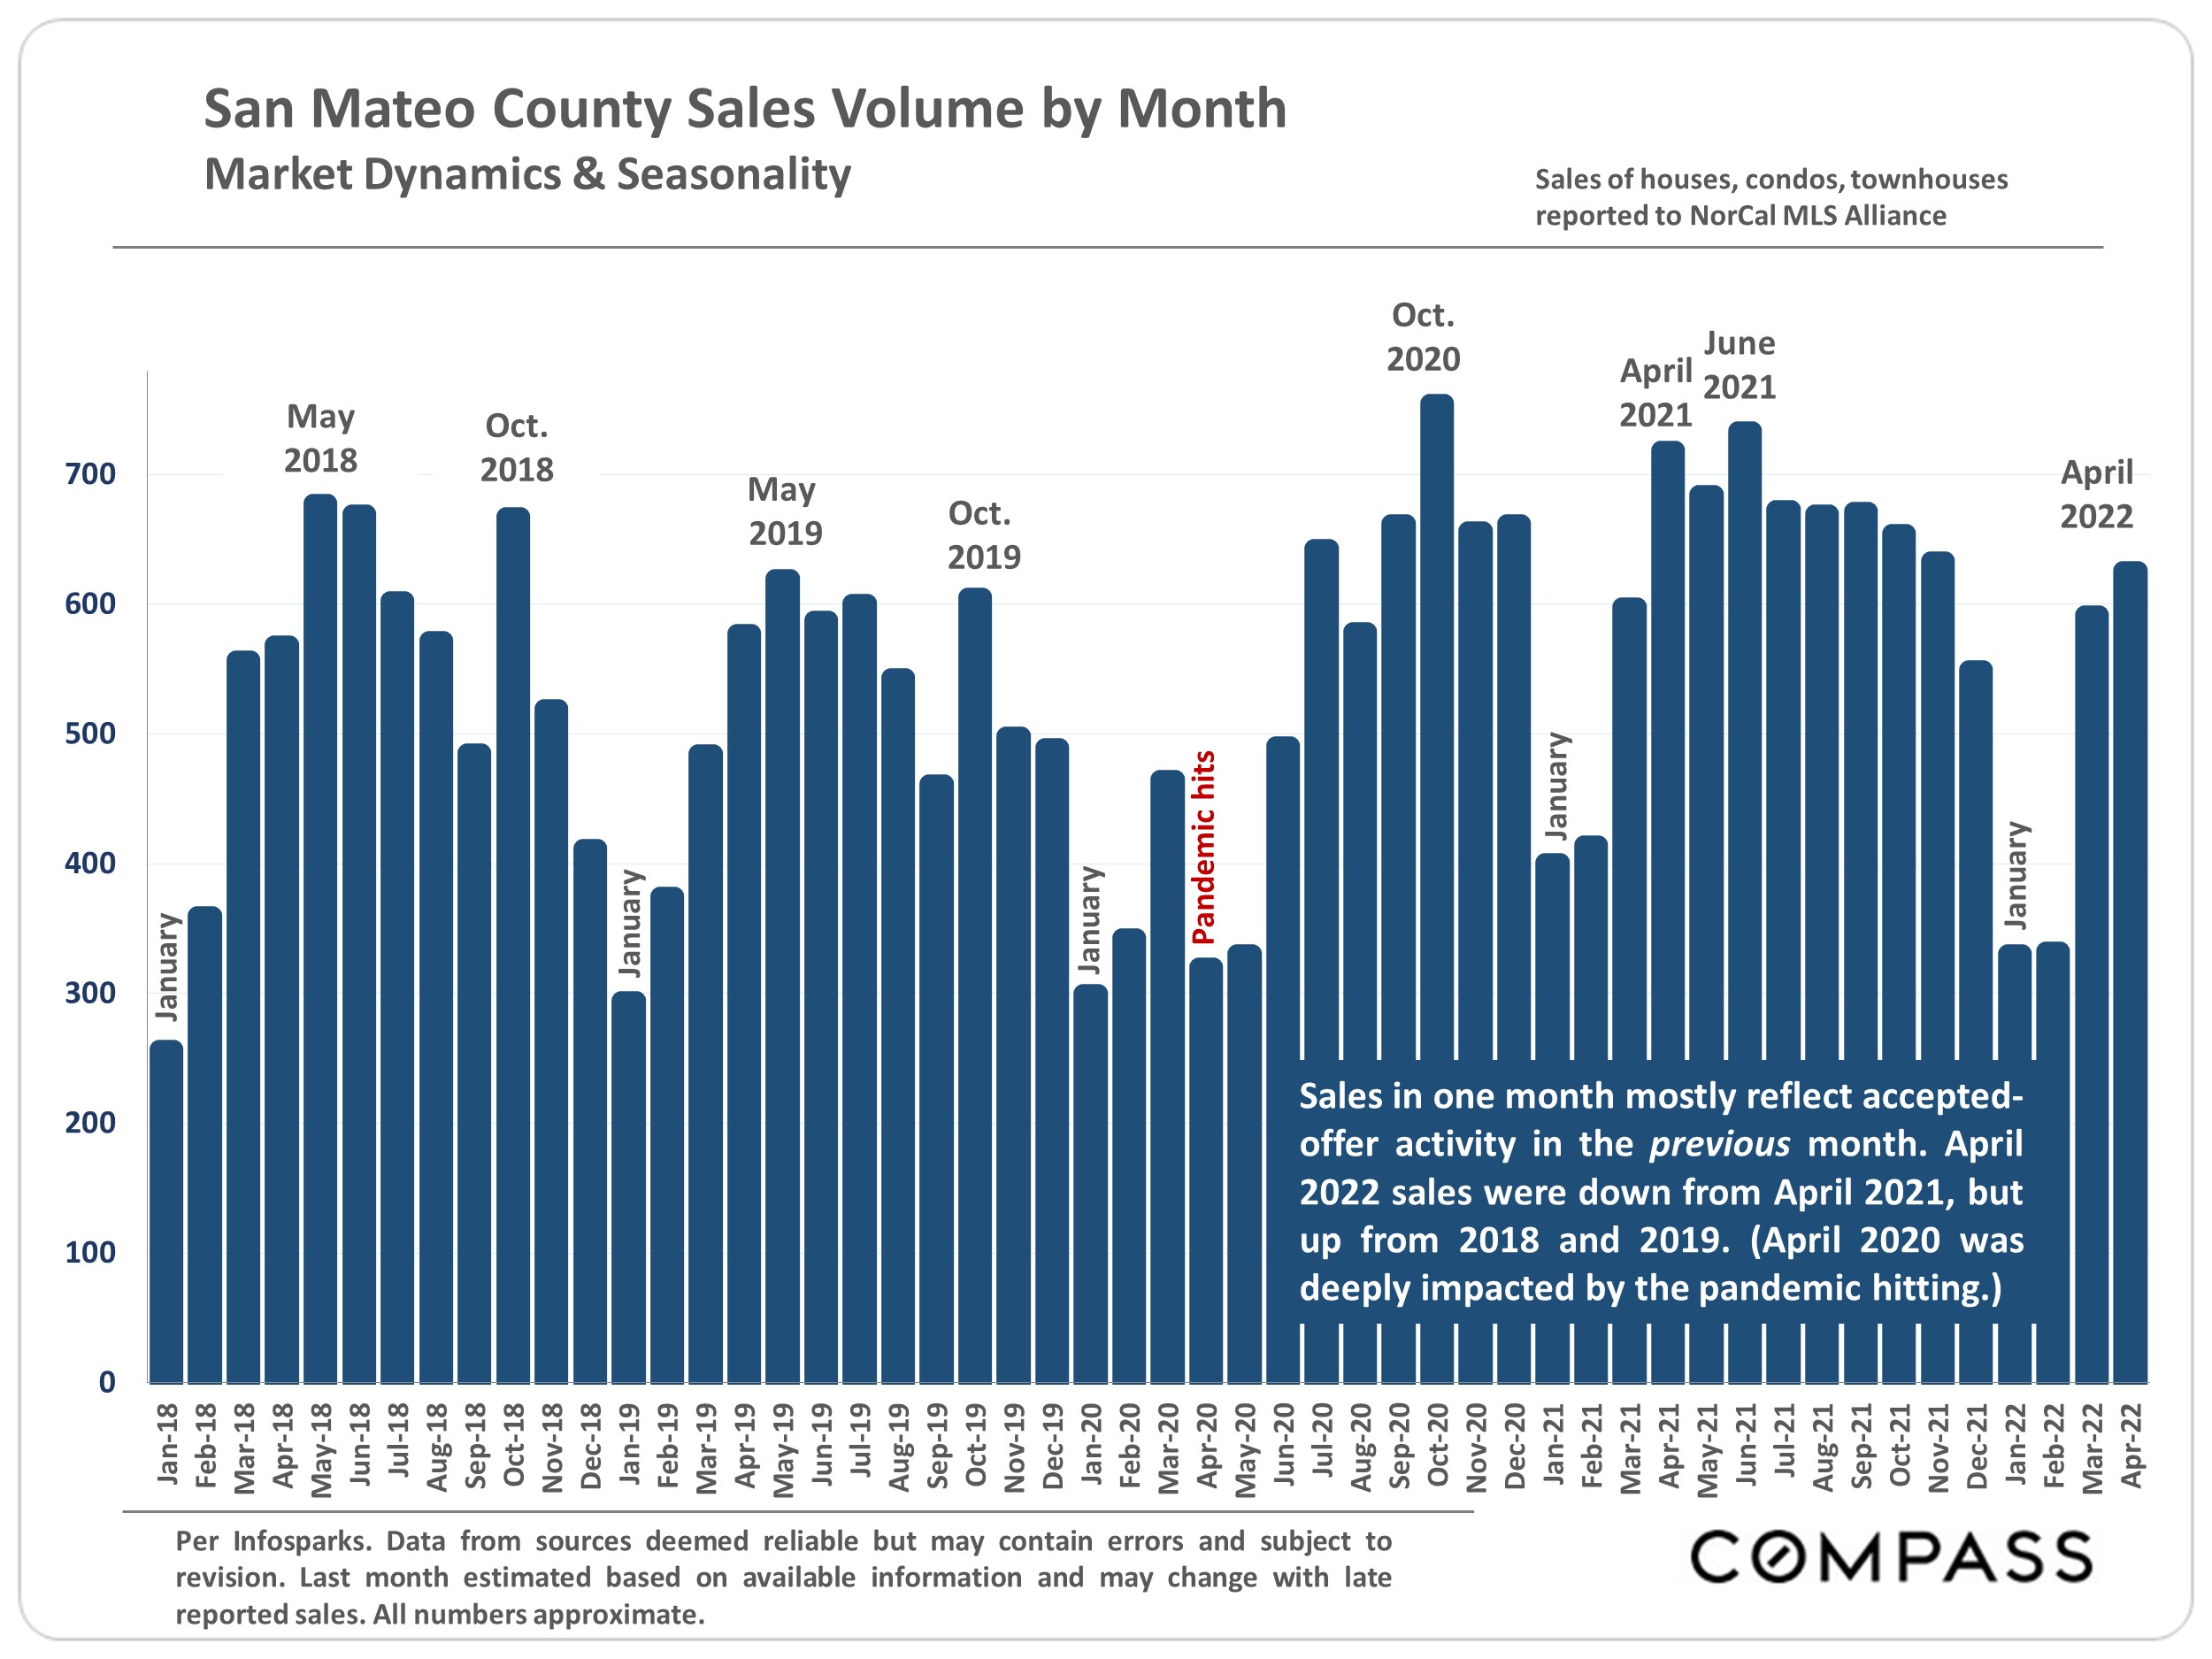
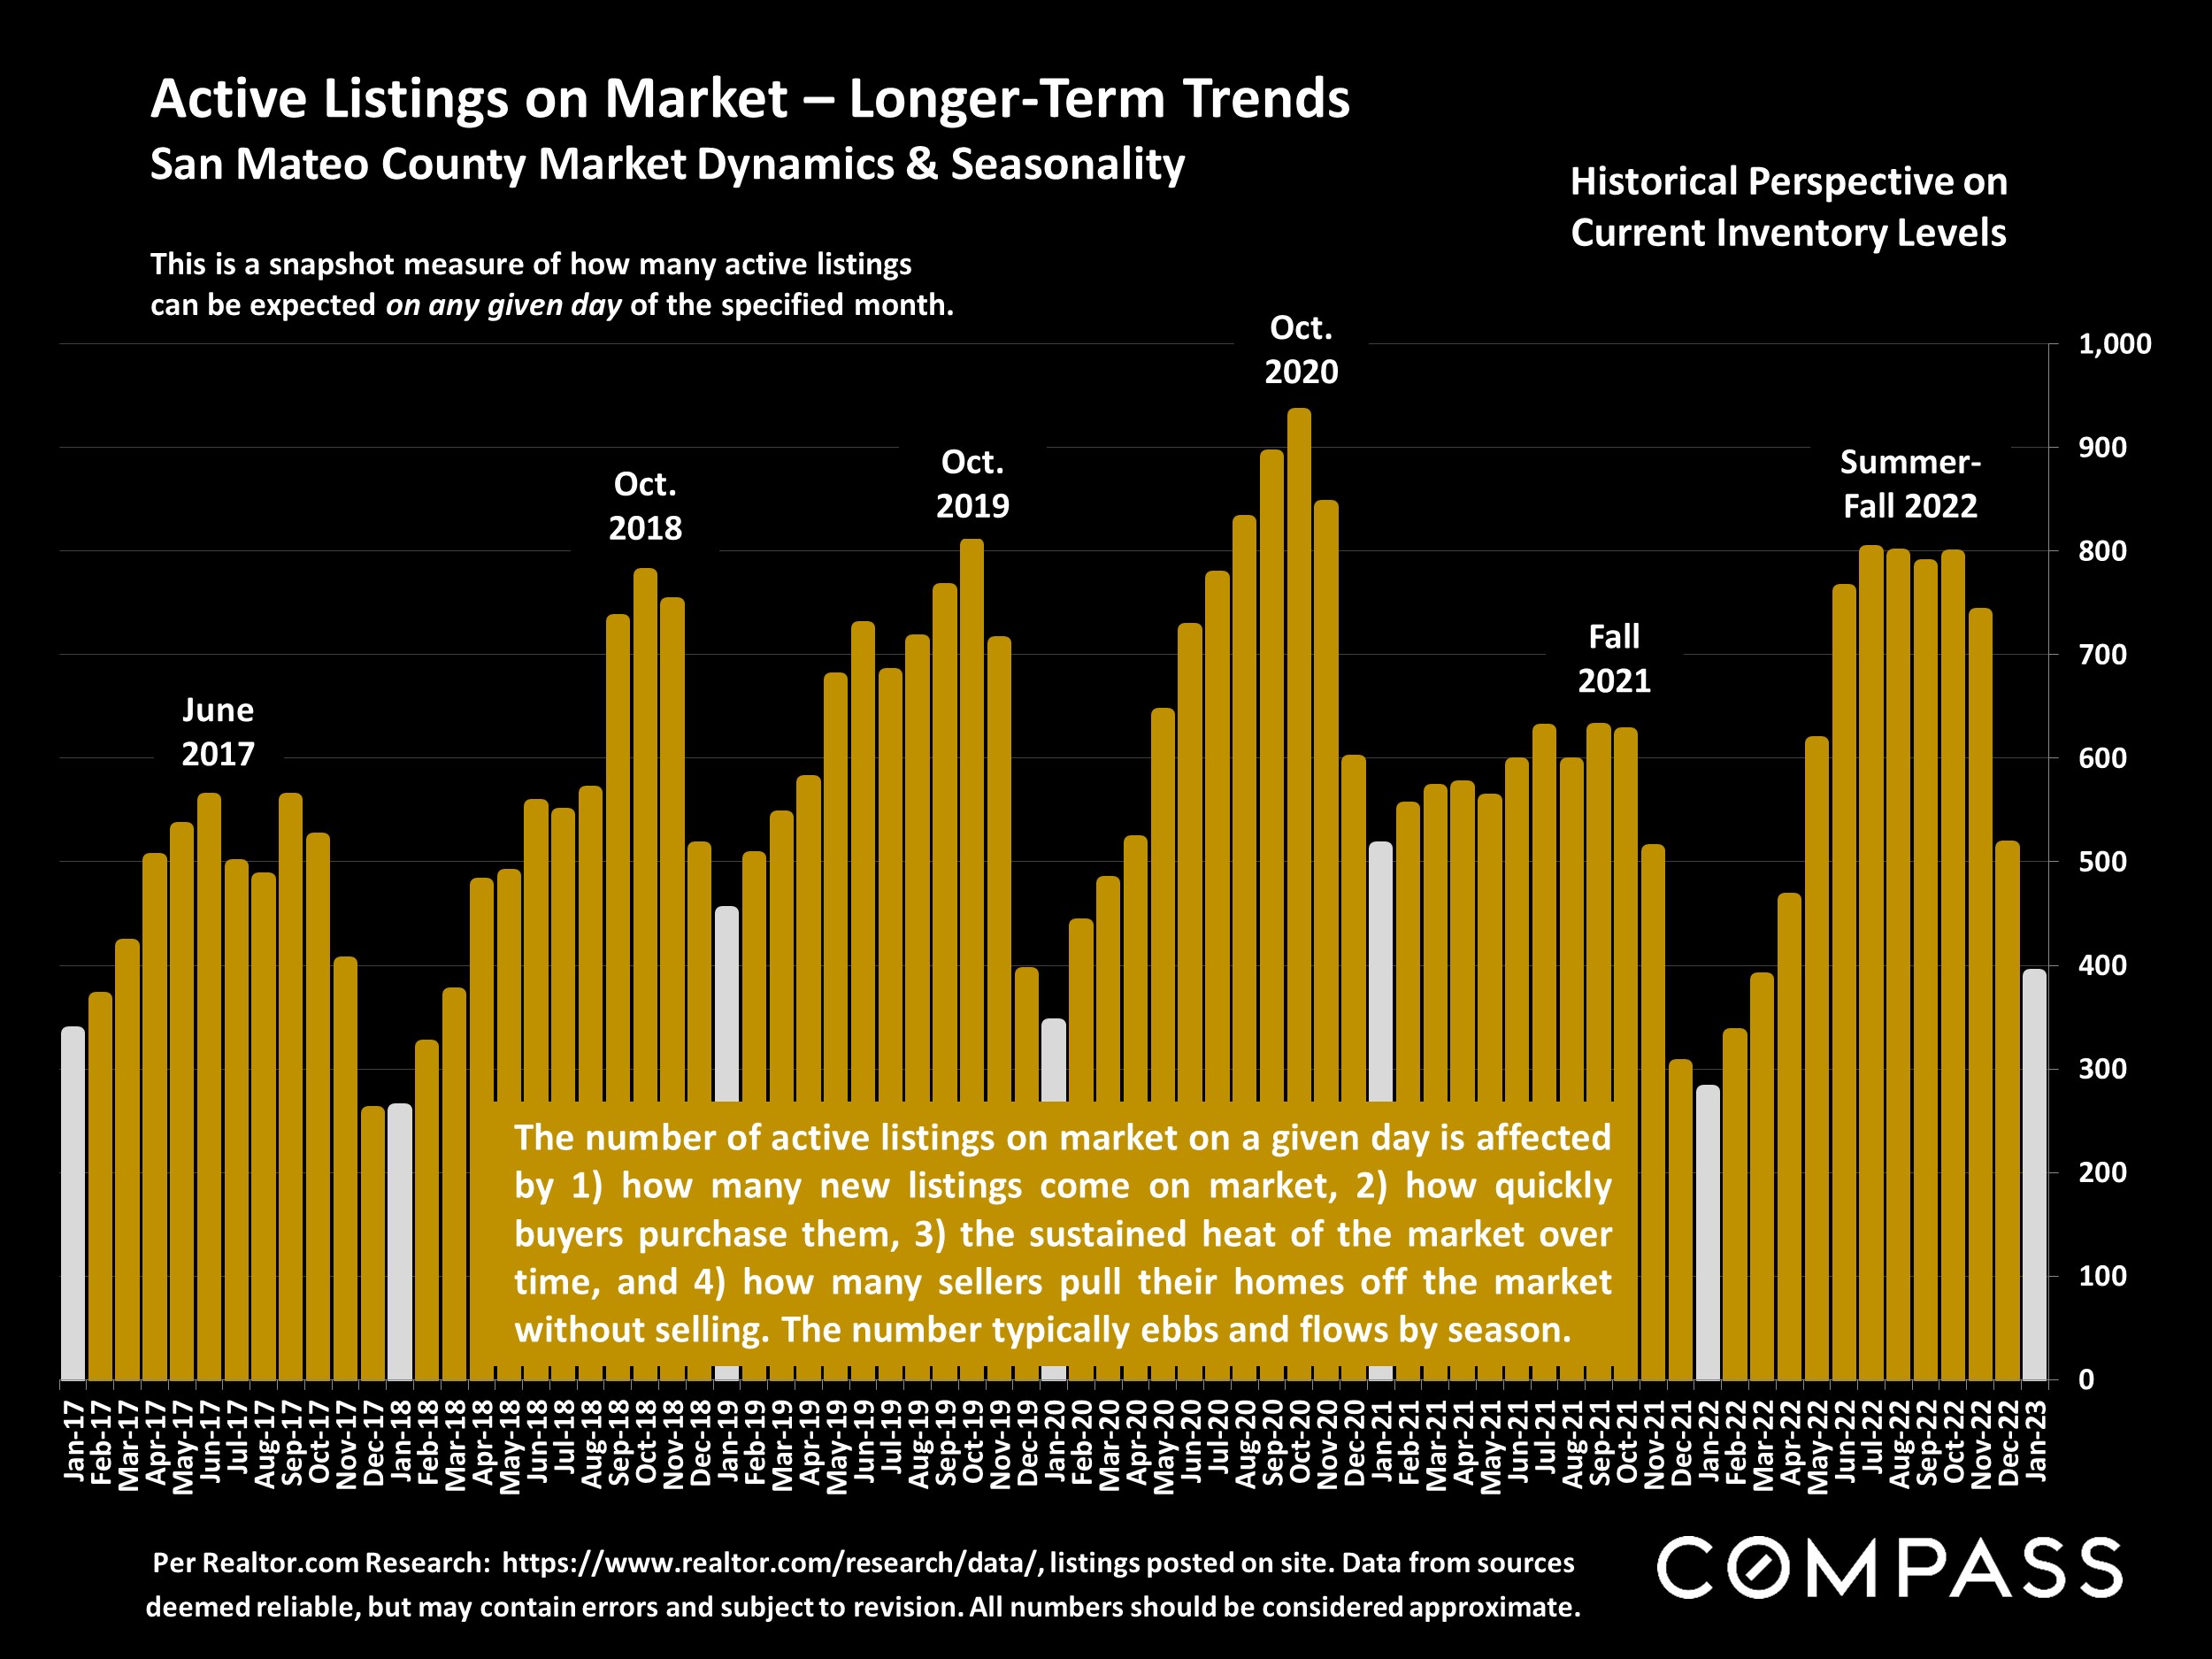
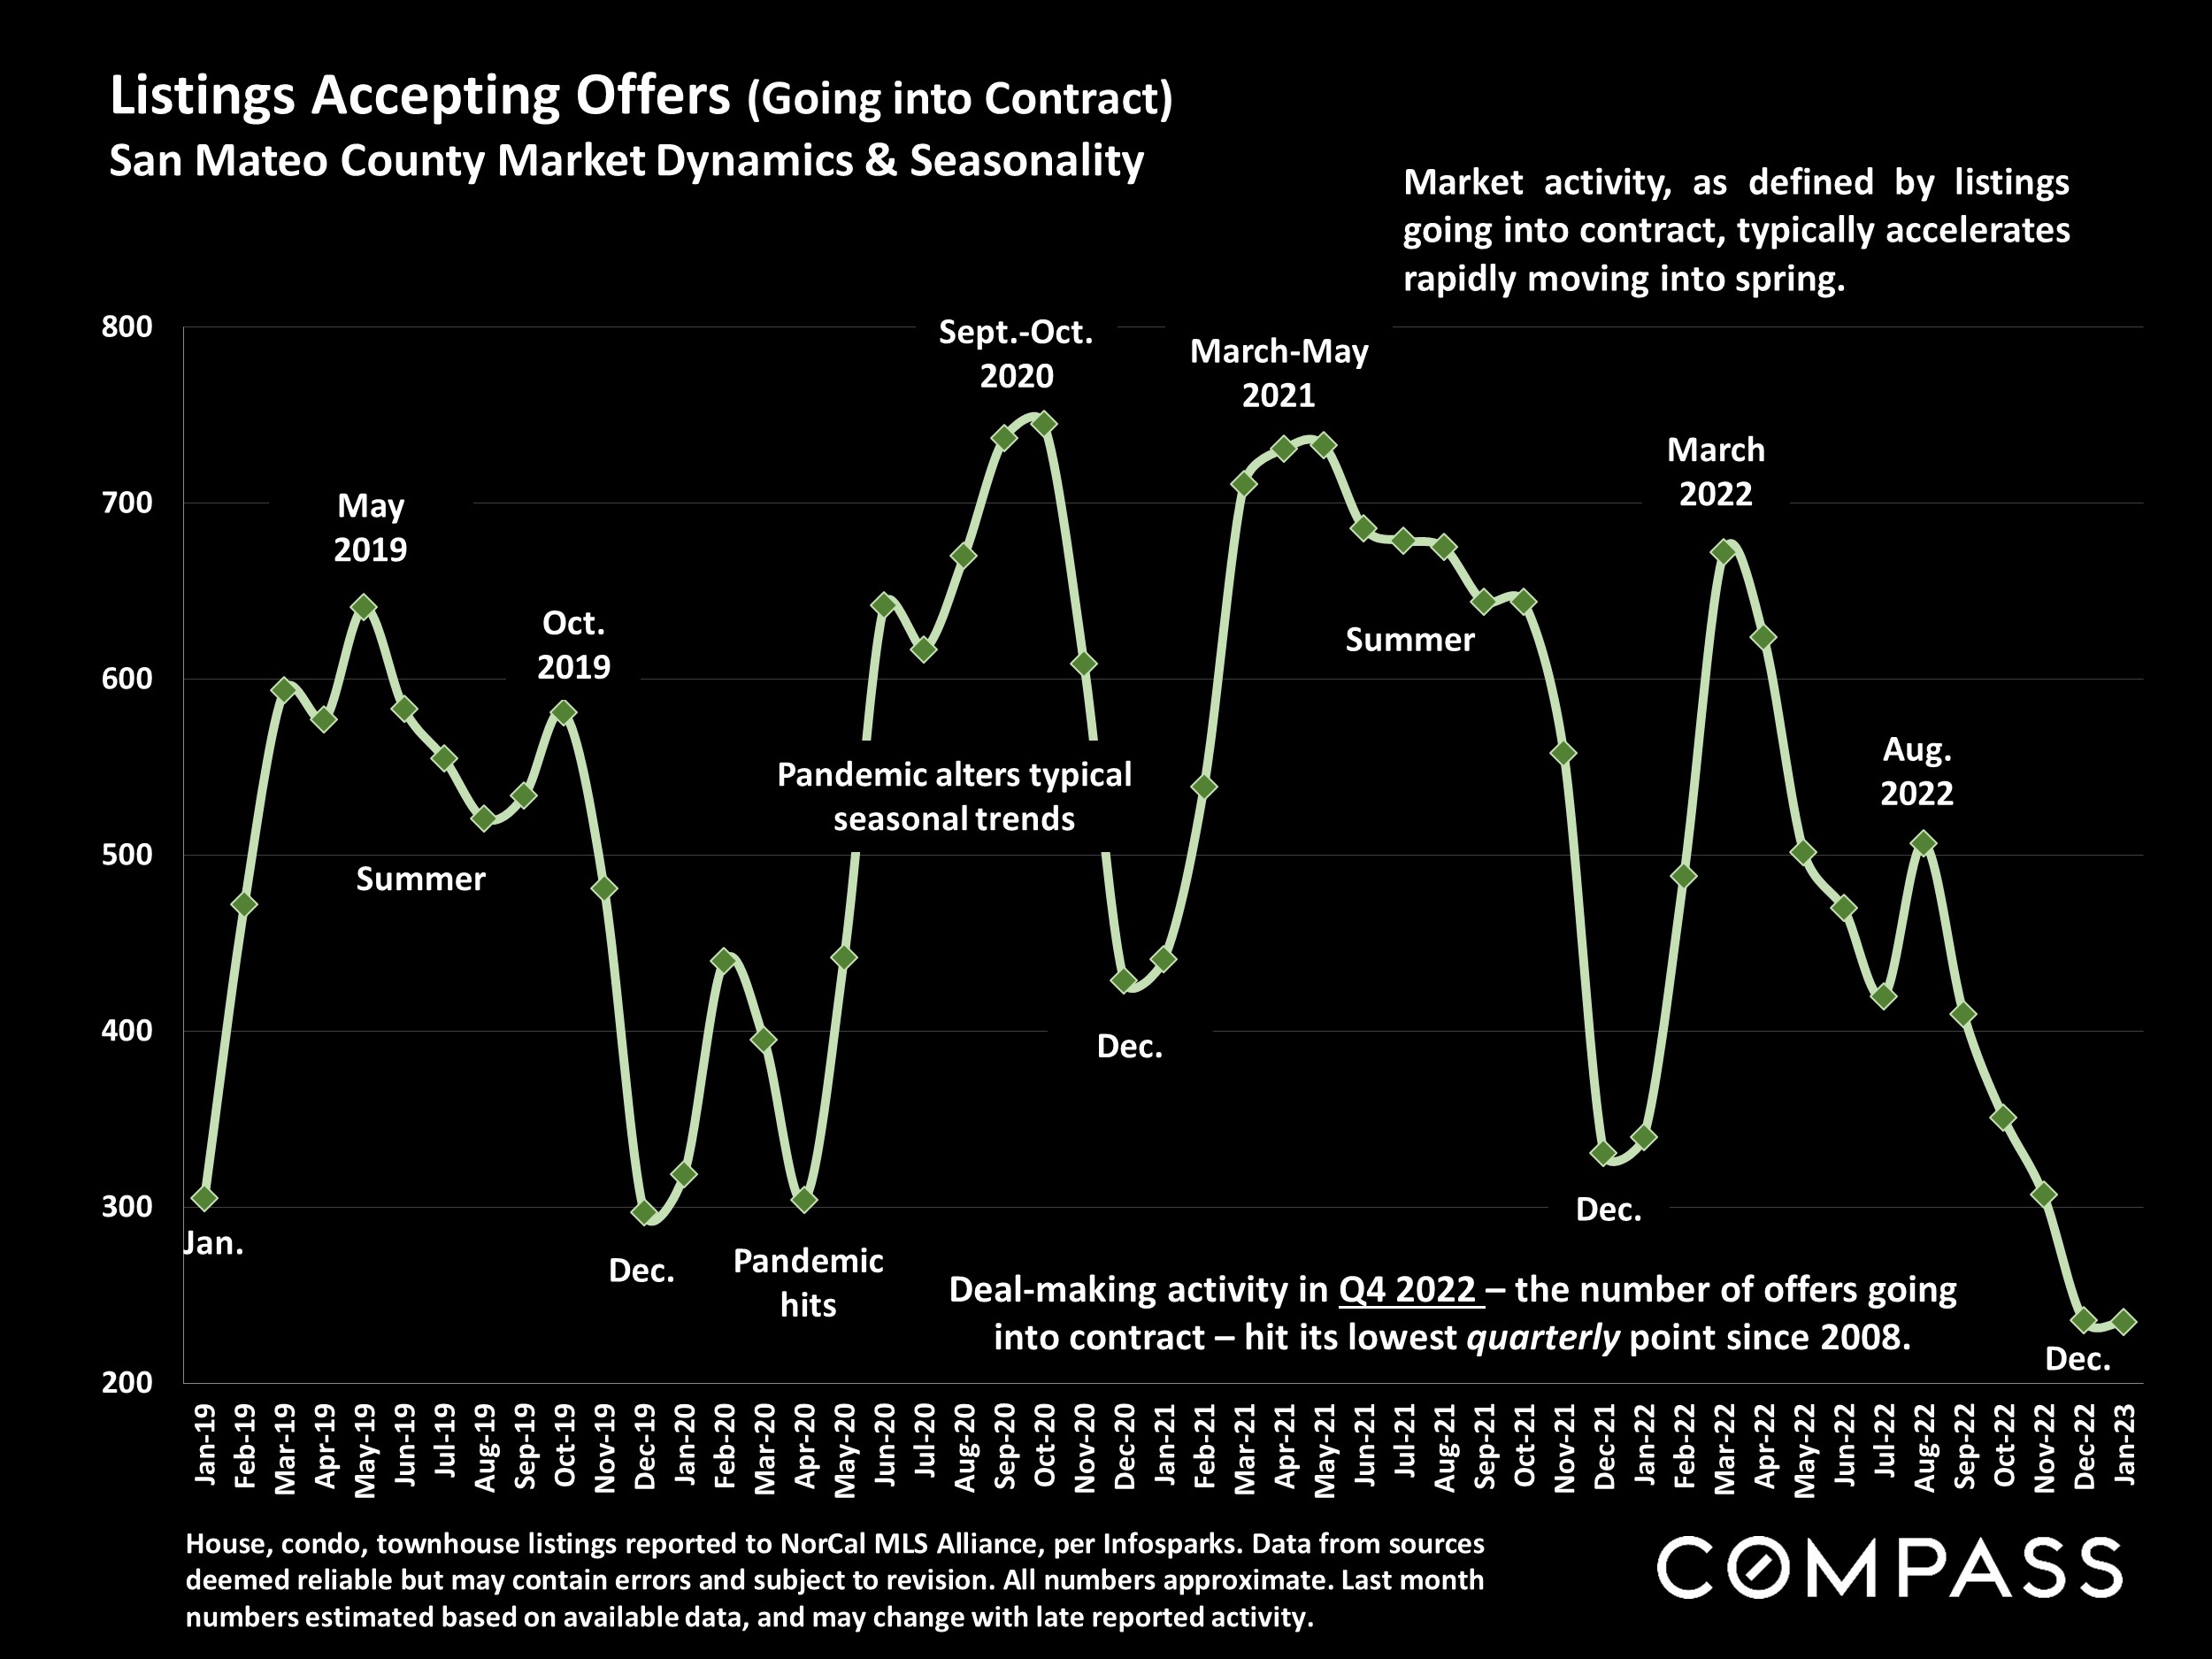
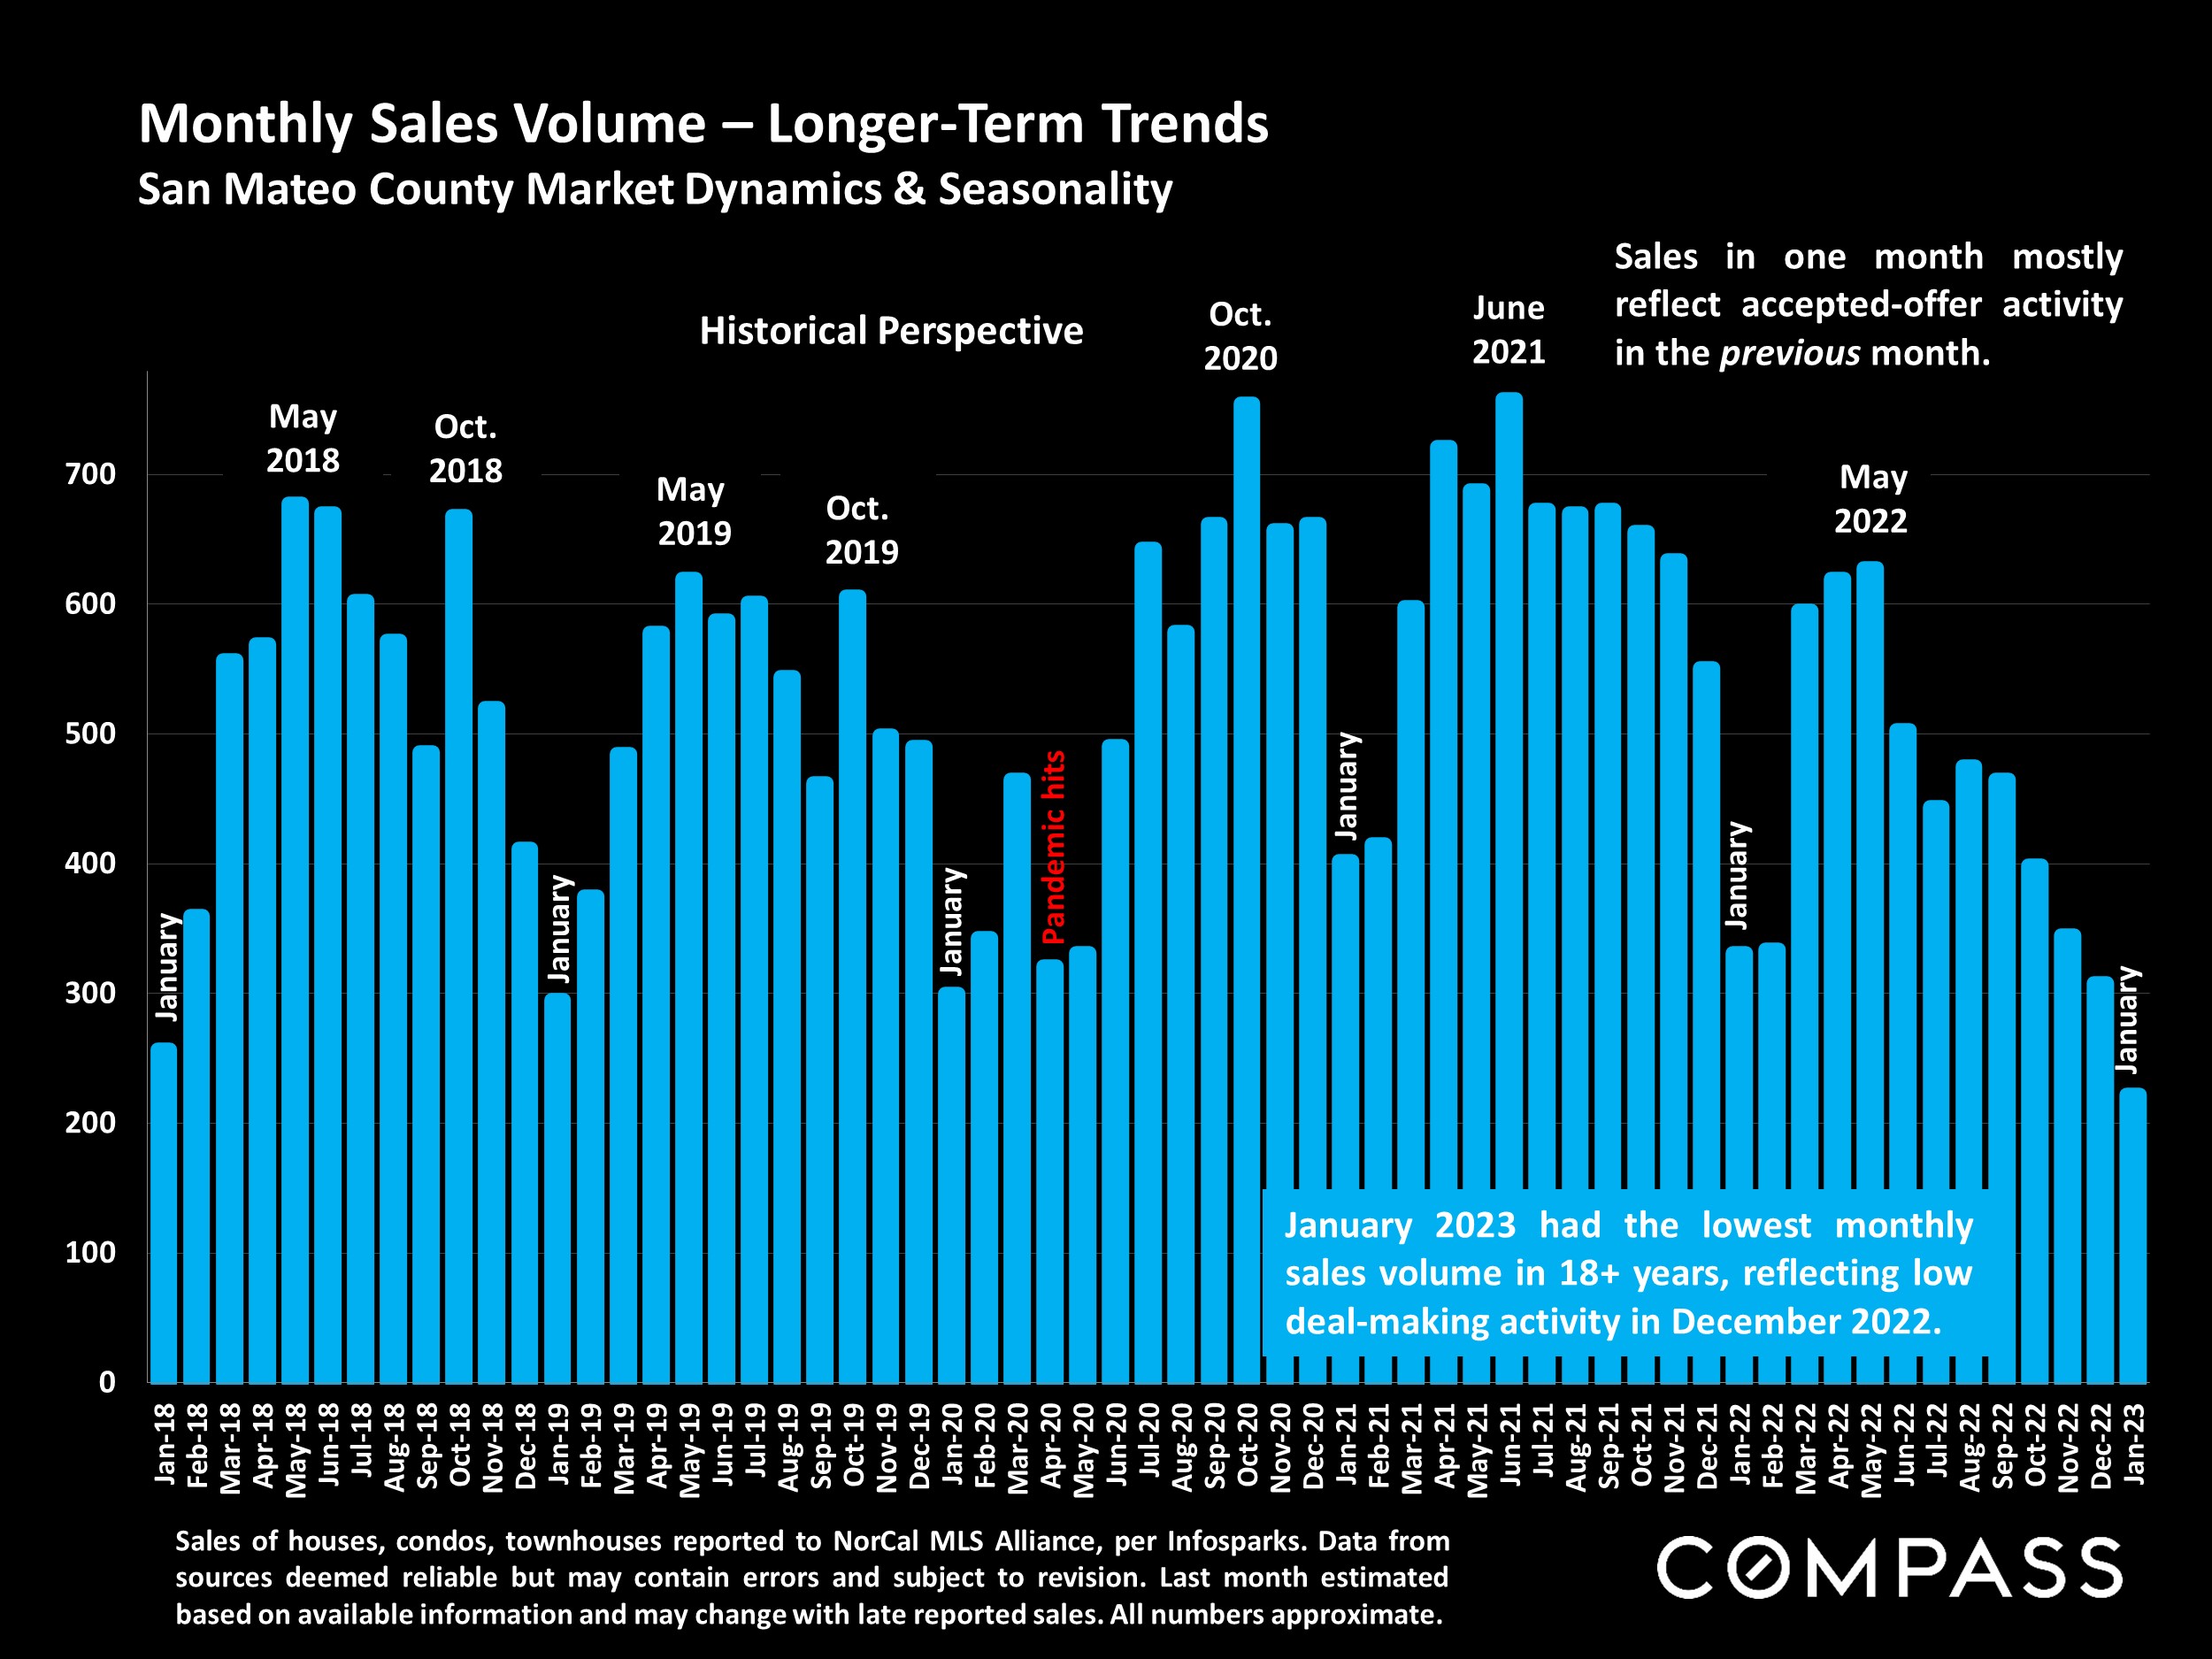
December is typically the month that sees the year’s lowest level of deal-making activity – i.e. listings accepting offers (going into contract) – which leads to January usually posting the lowest monthly number of closed sales. (Sales typically close 3 to 6 weeks after going into contract.) In the 11-county, greater Bay Area, accepted-offer activity in December 2022 and closed sales volume in January 2023 generally hit their lowest monthly points in 15 years.
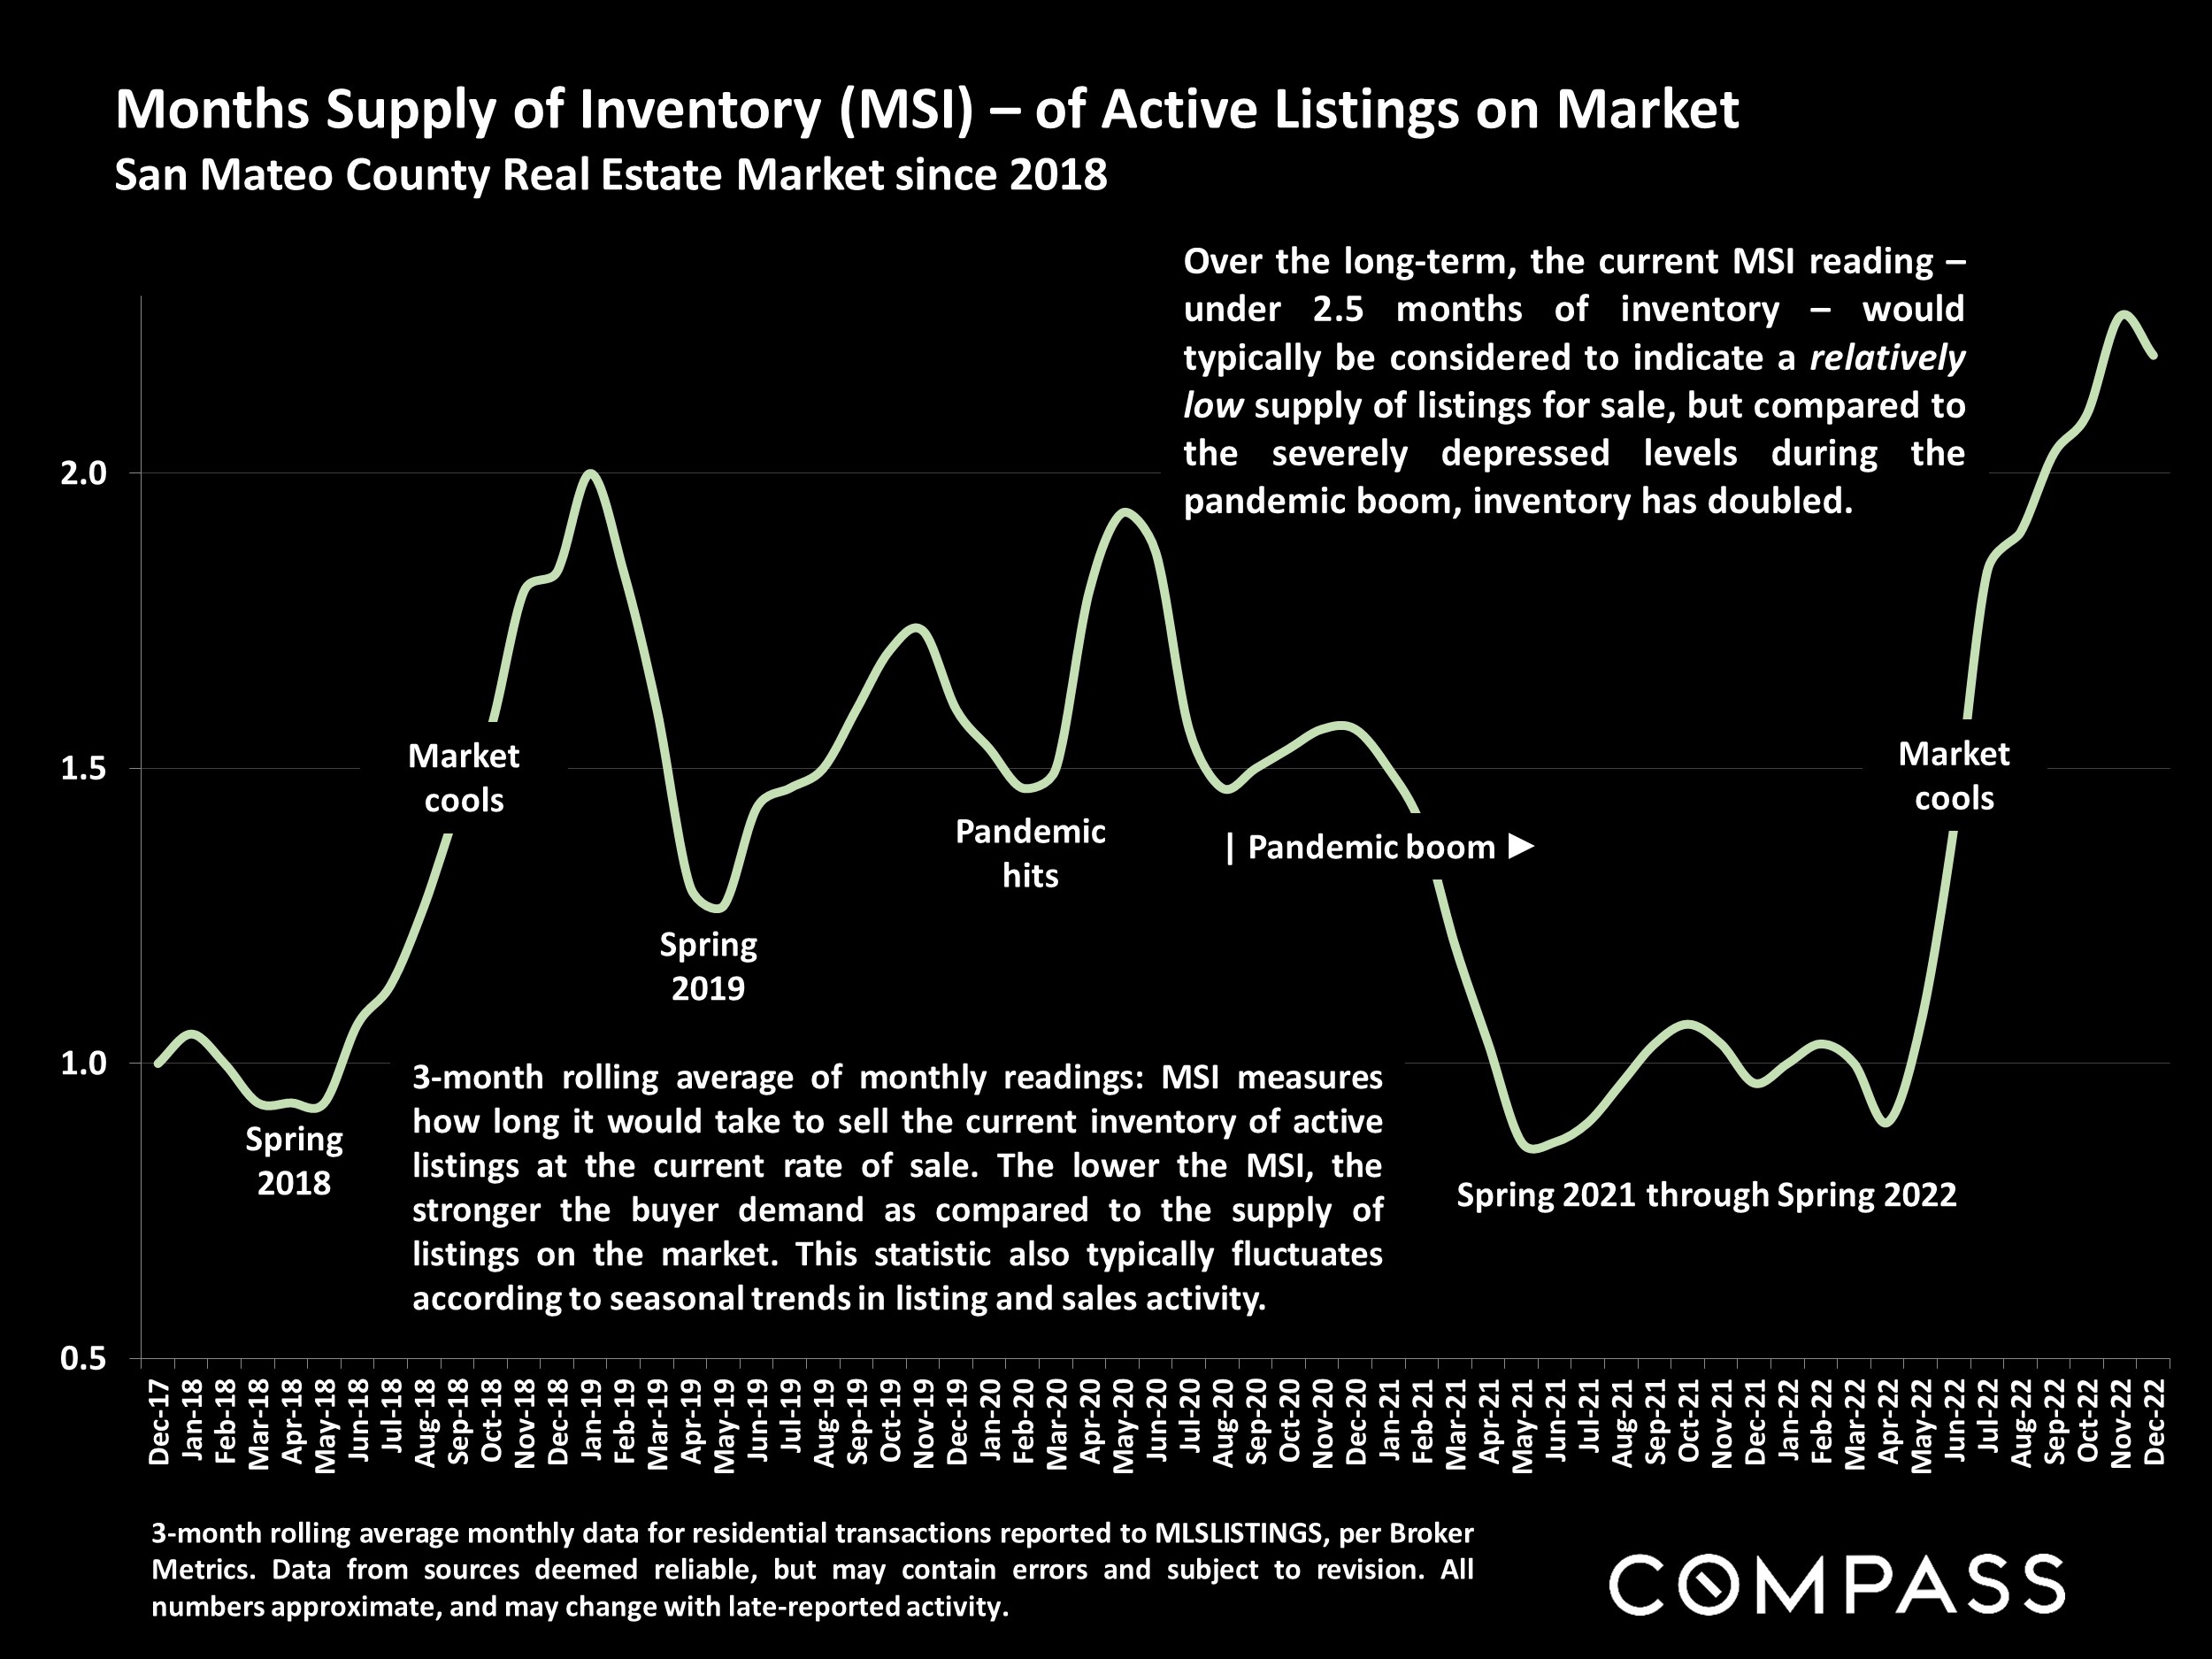
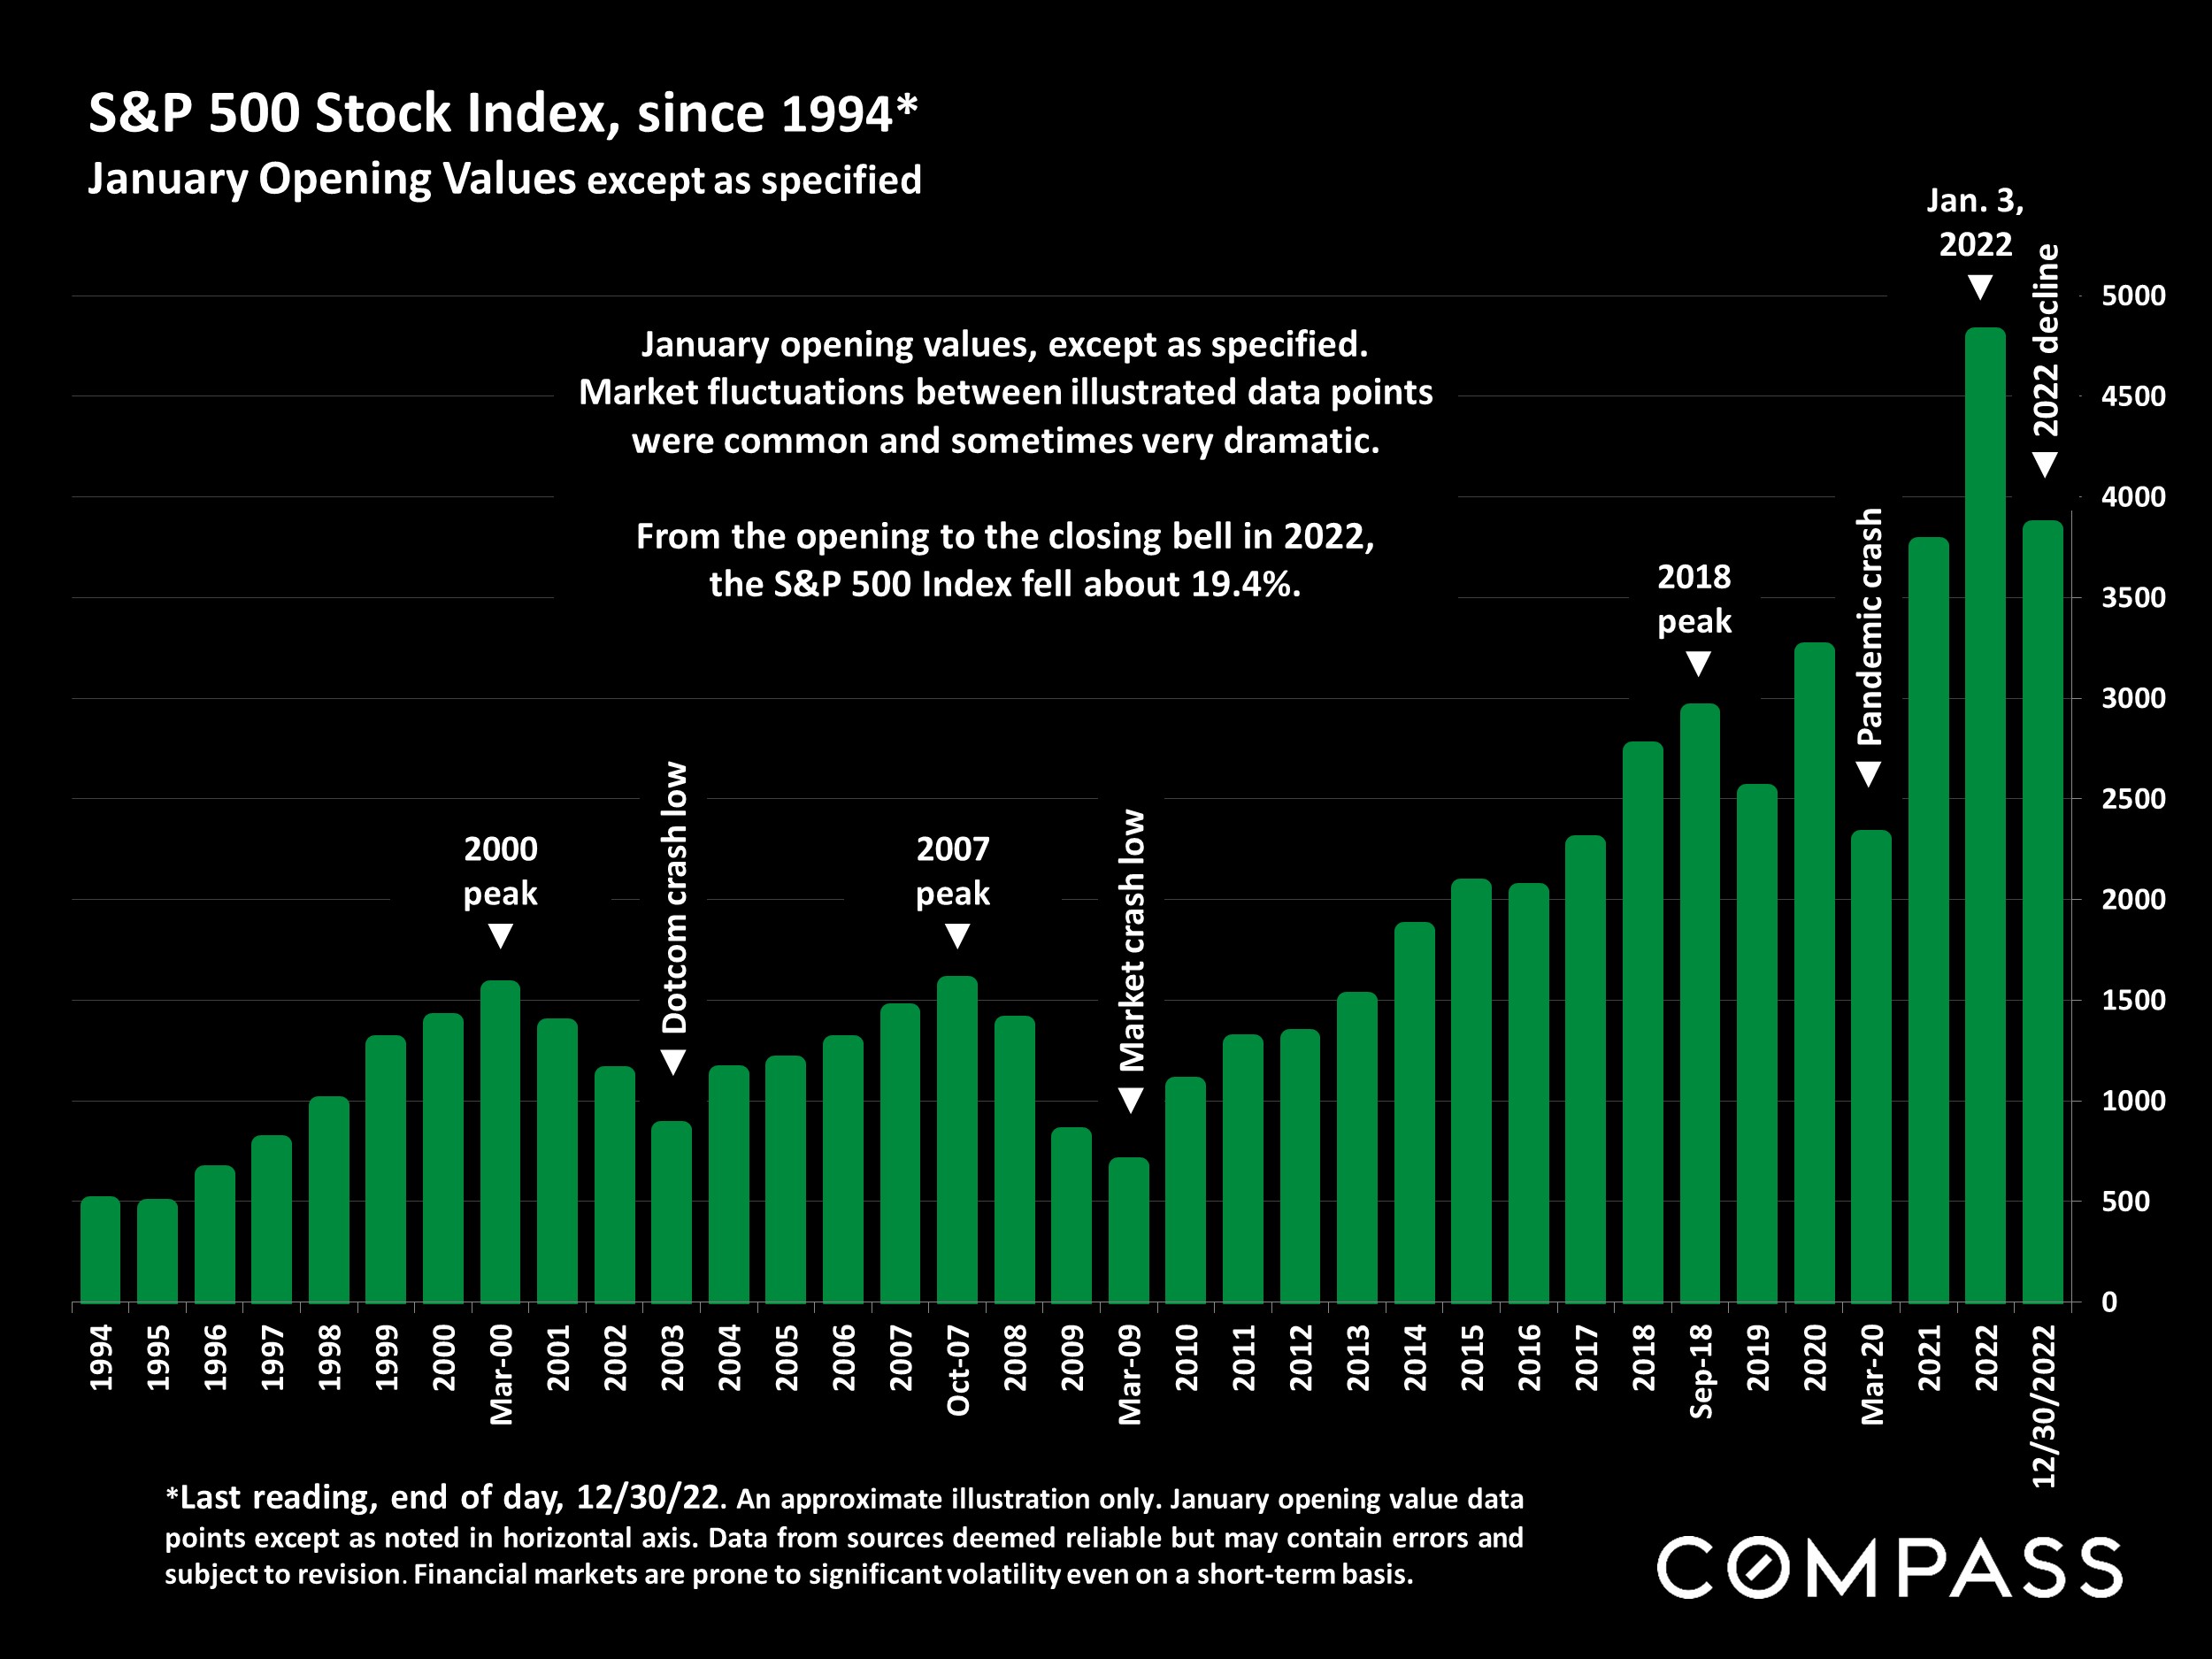
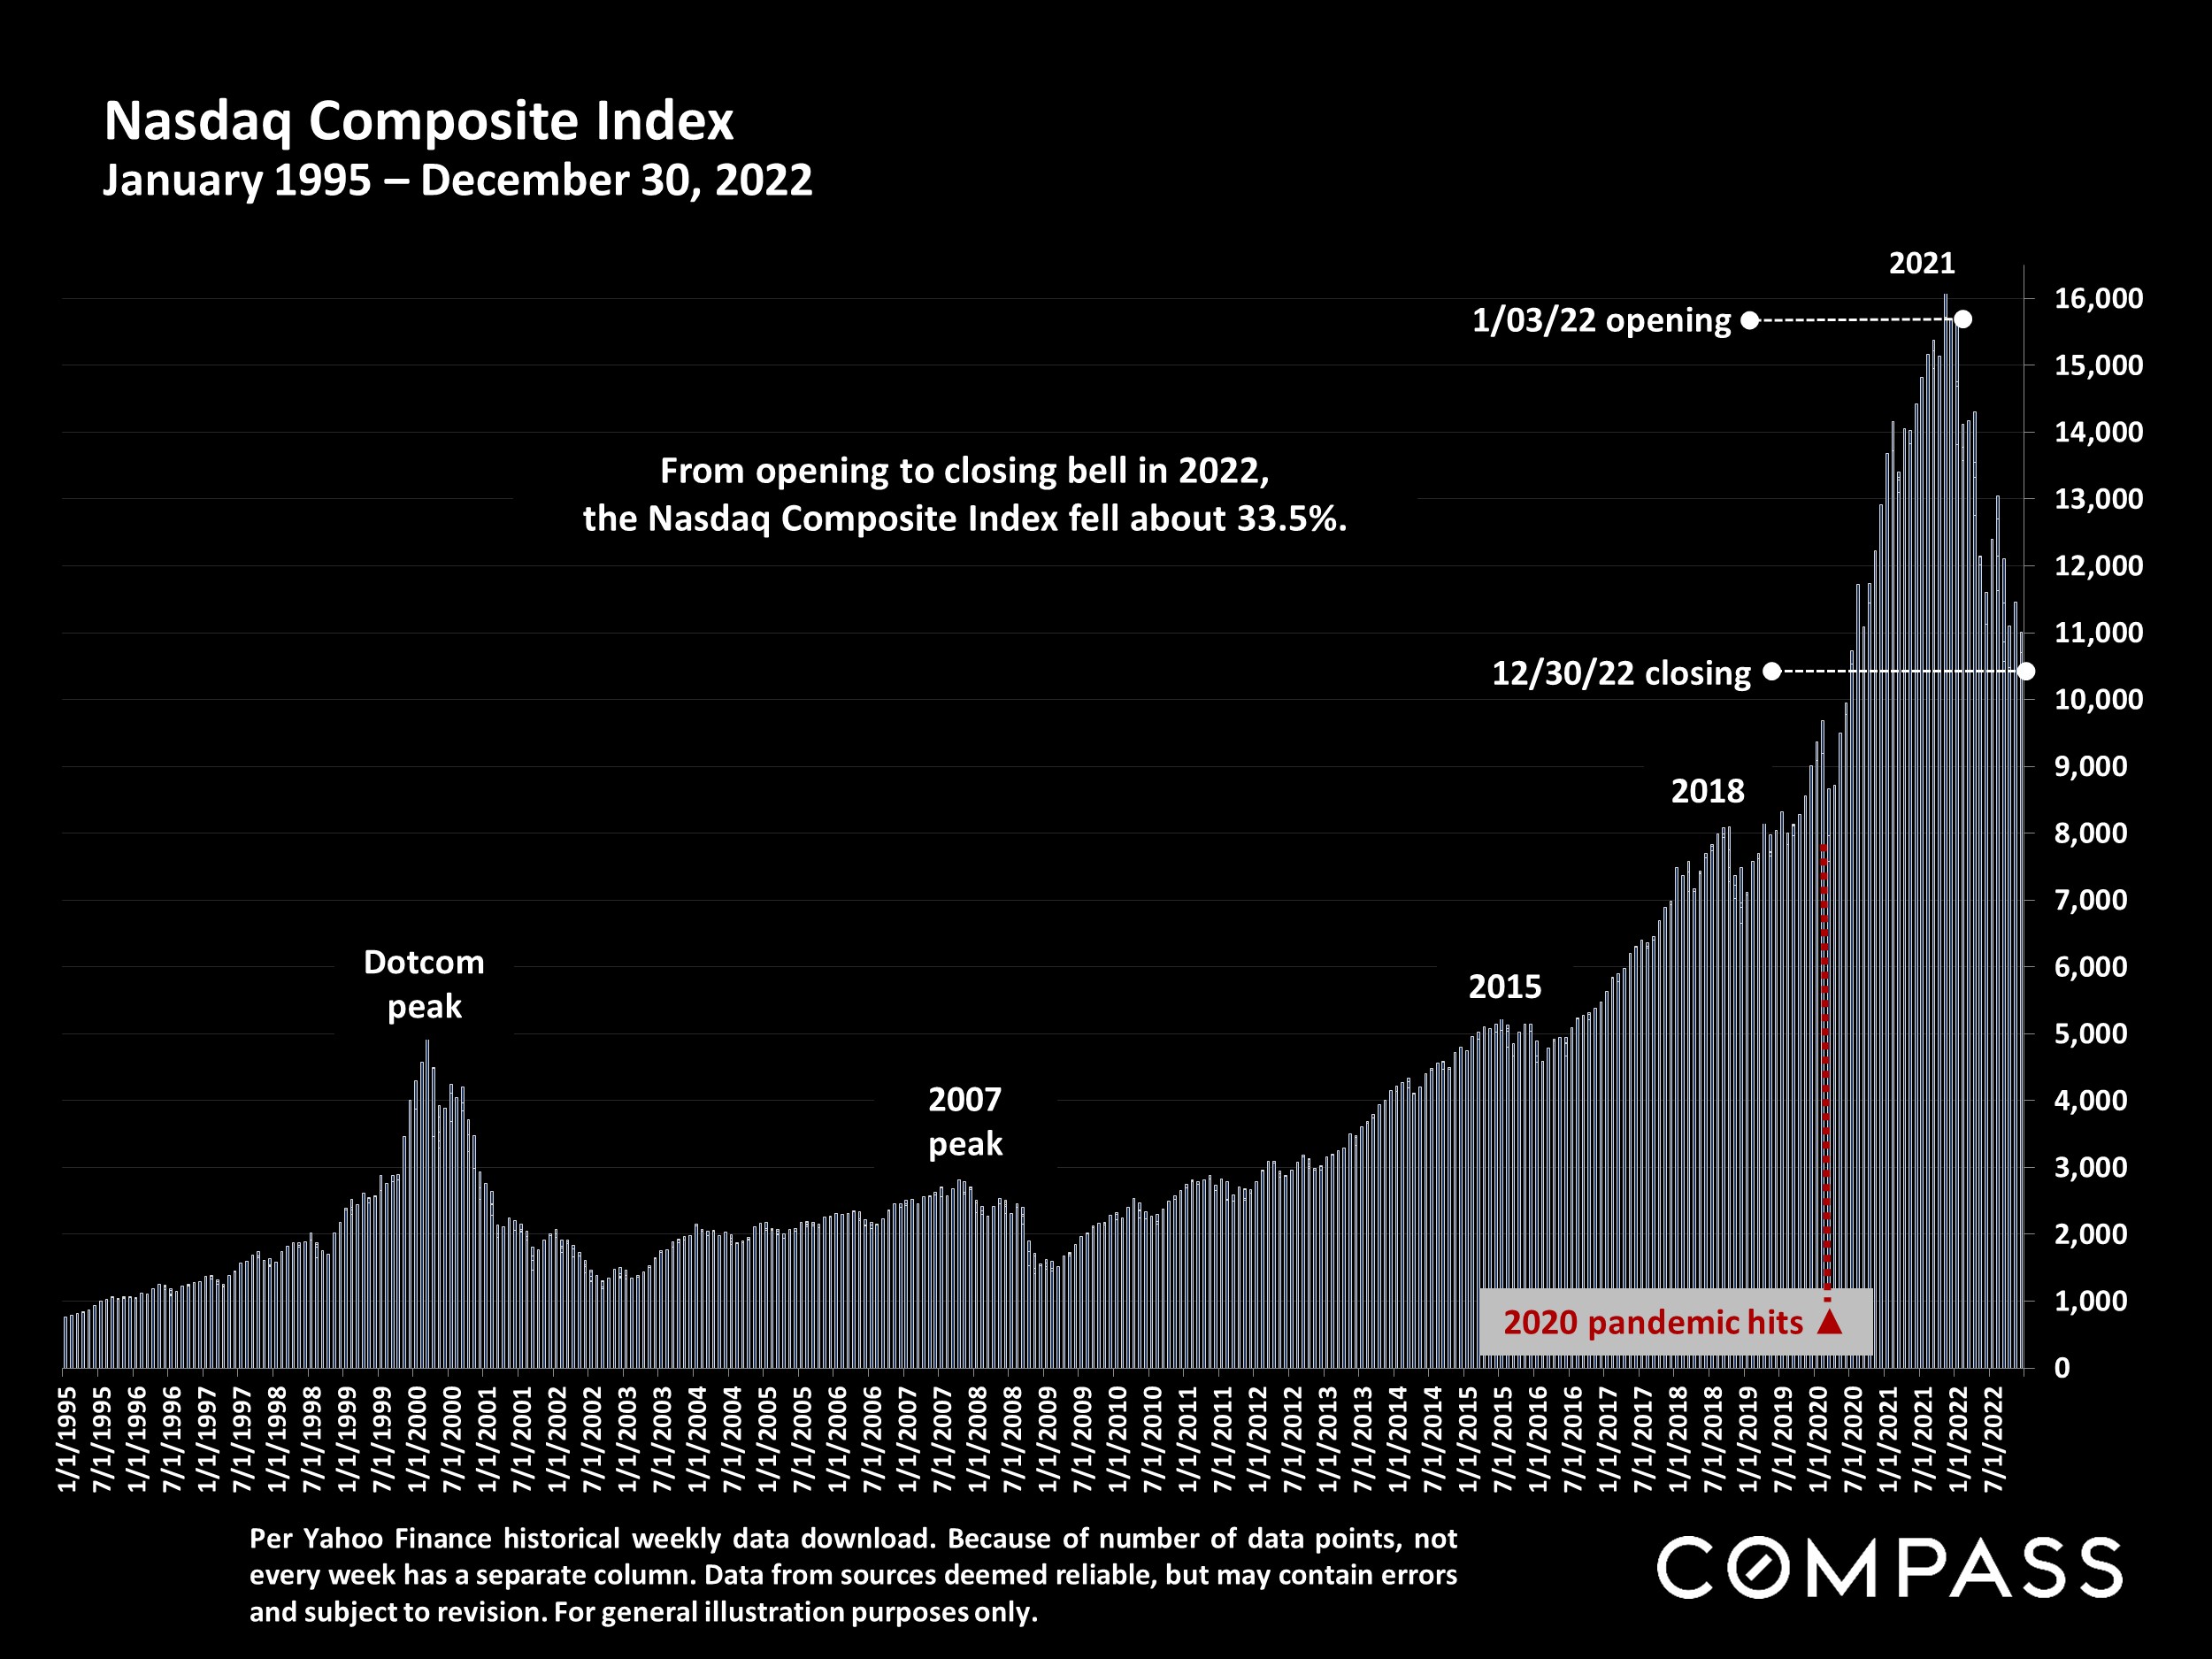
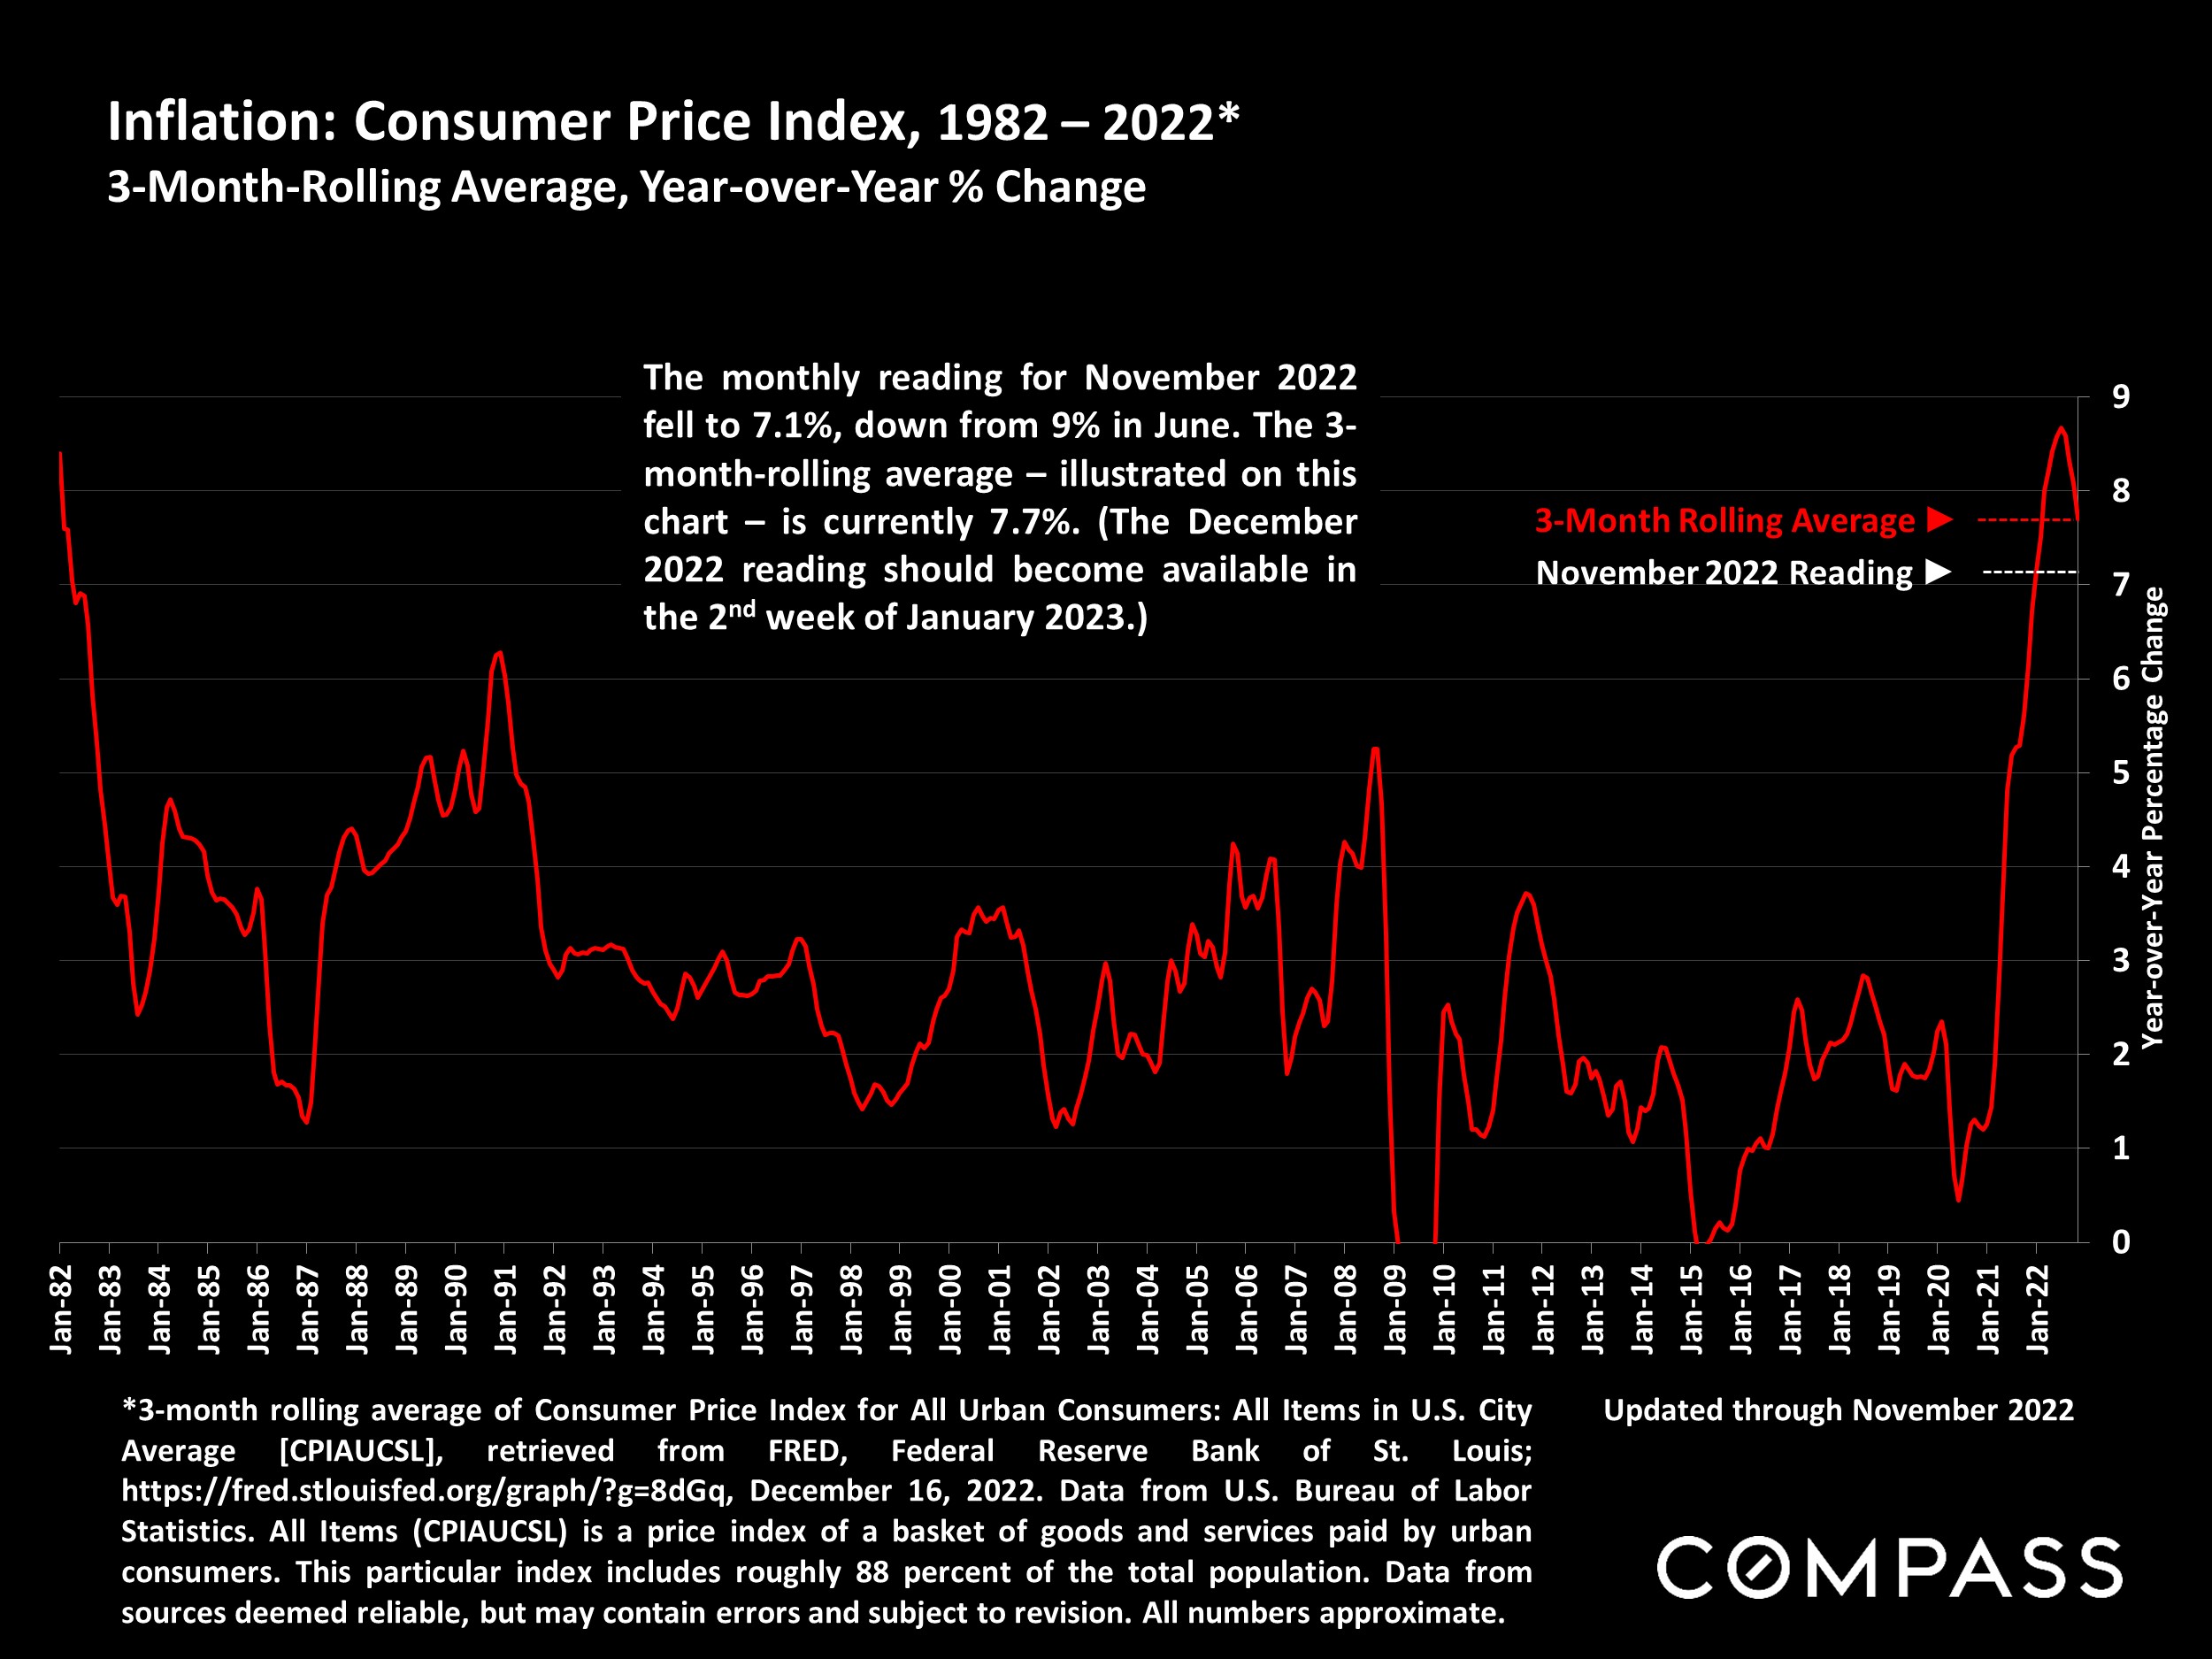
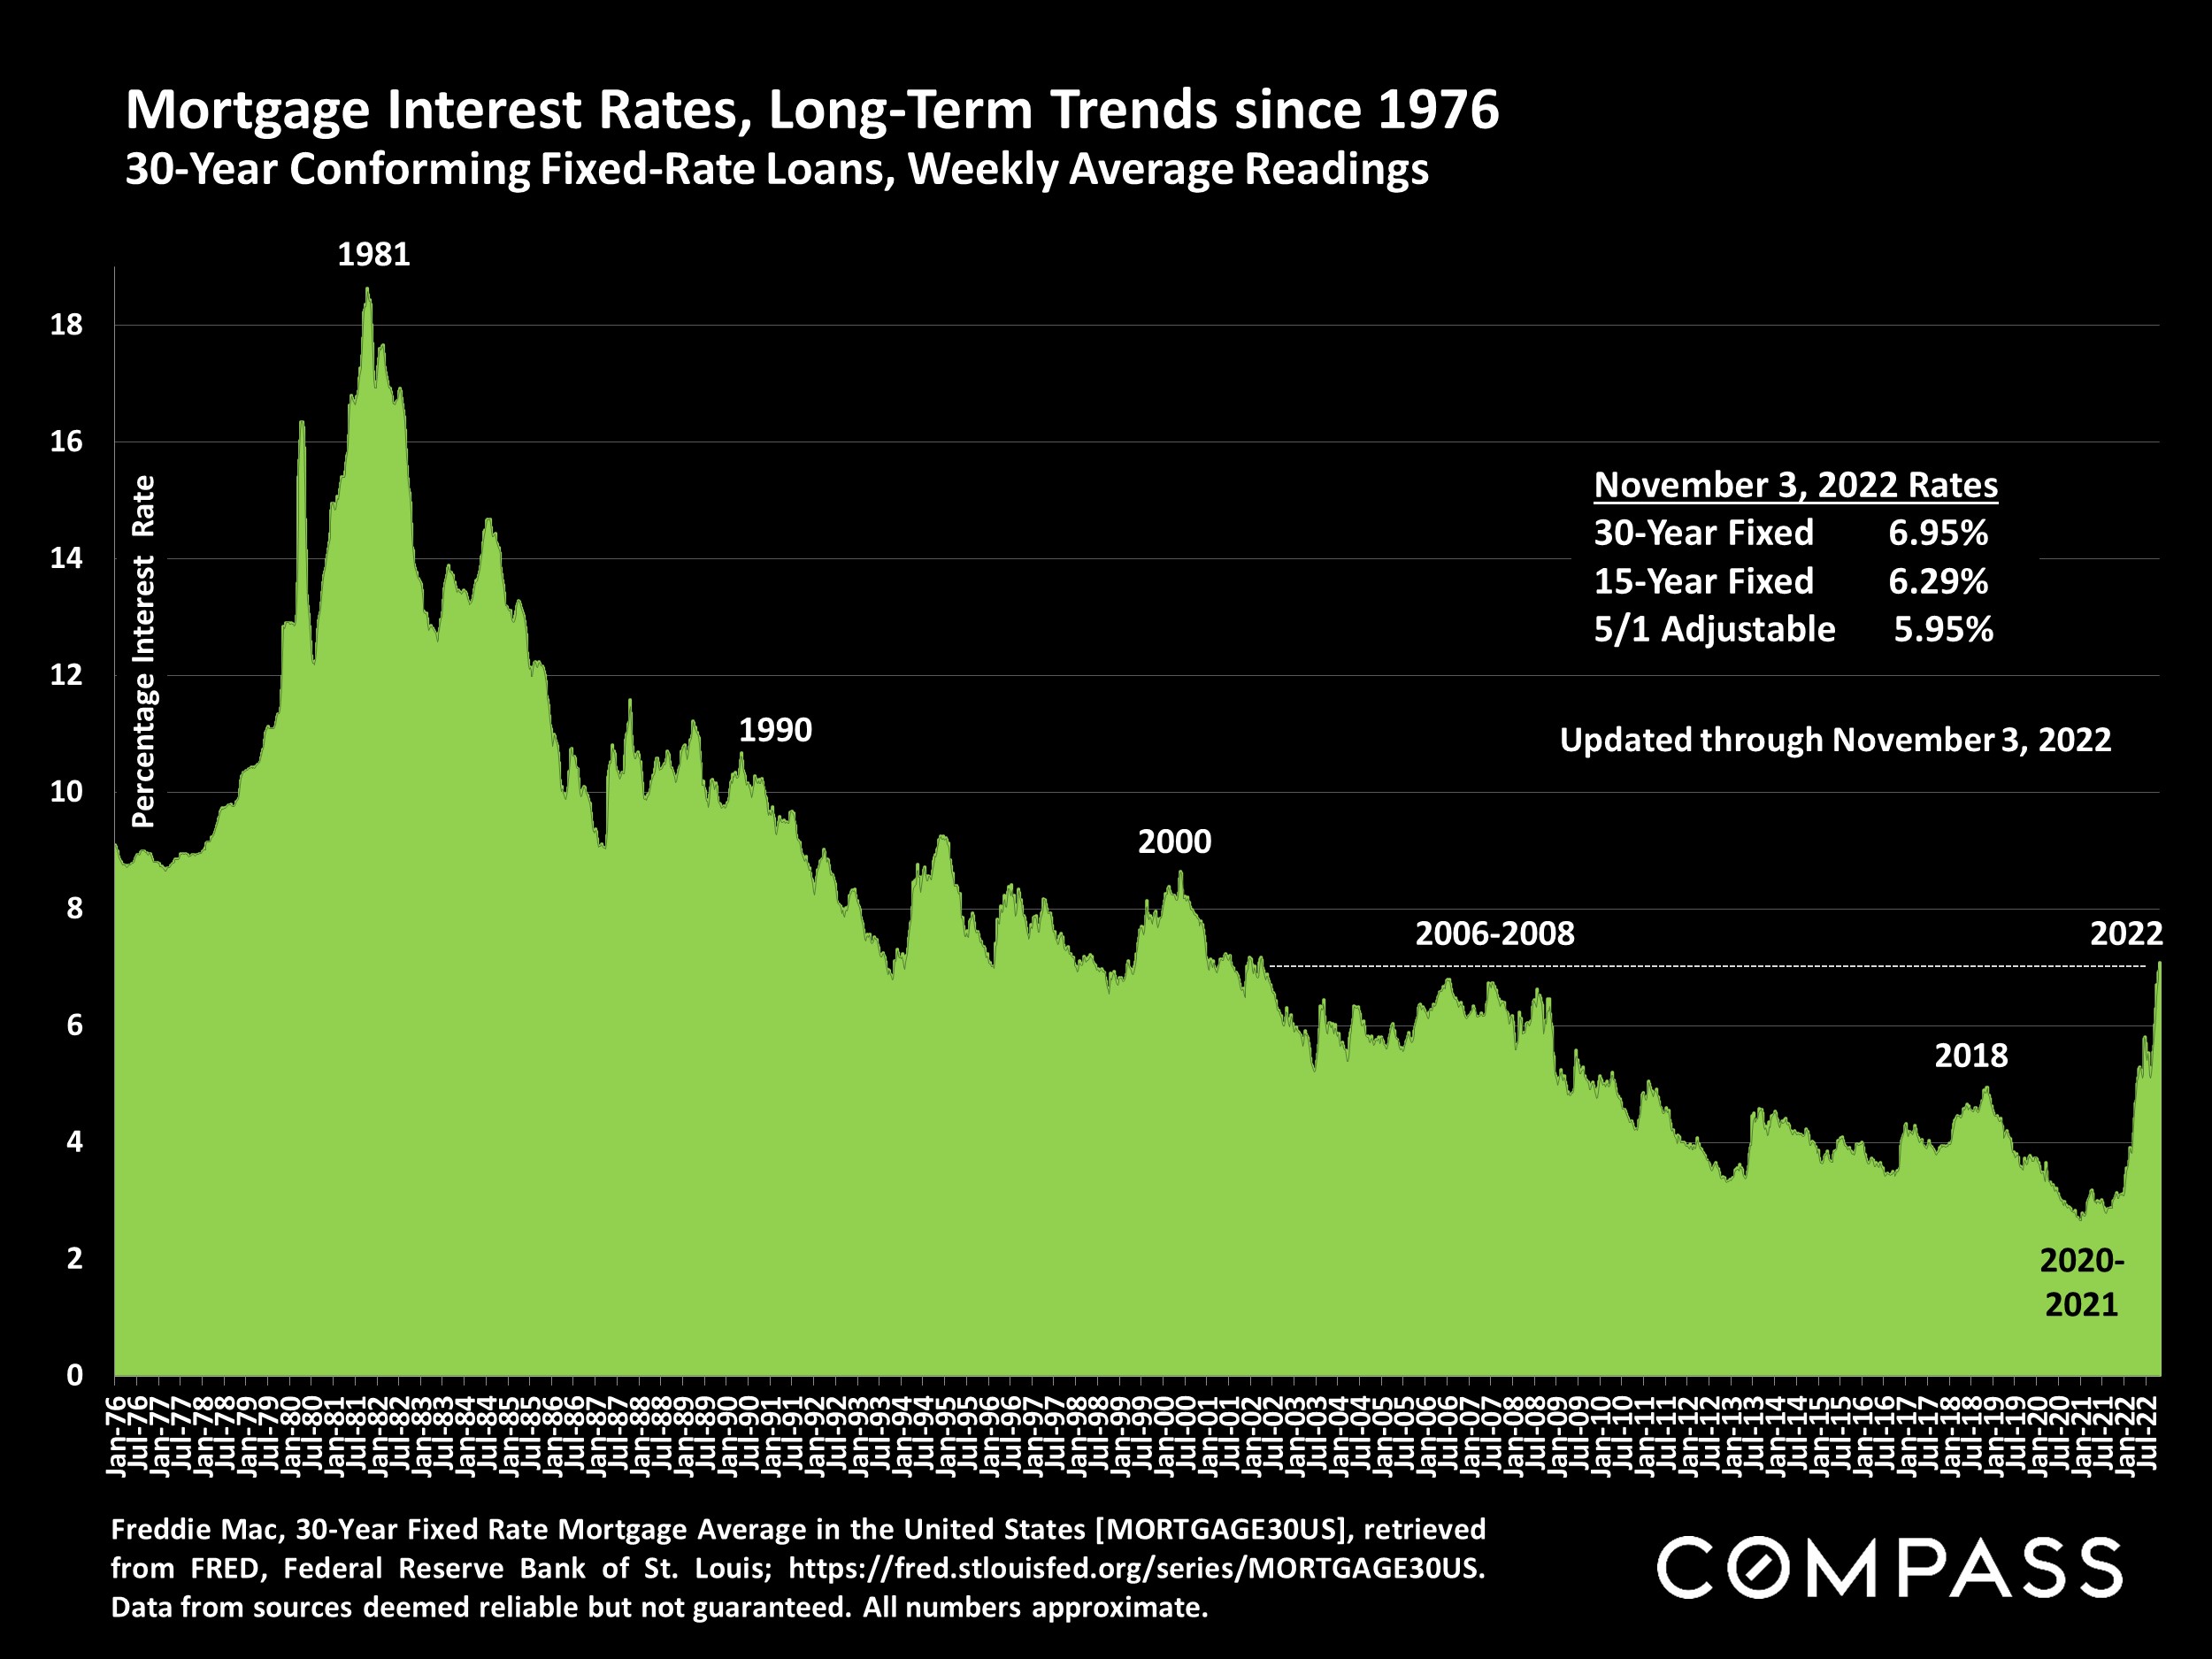
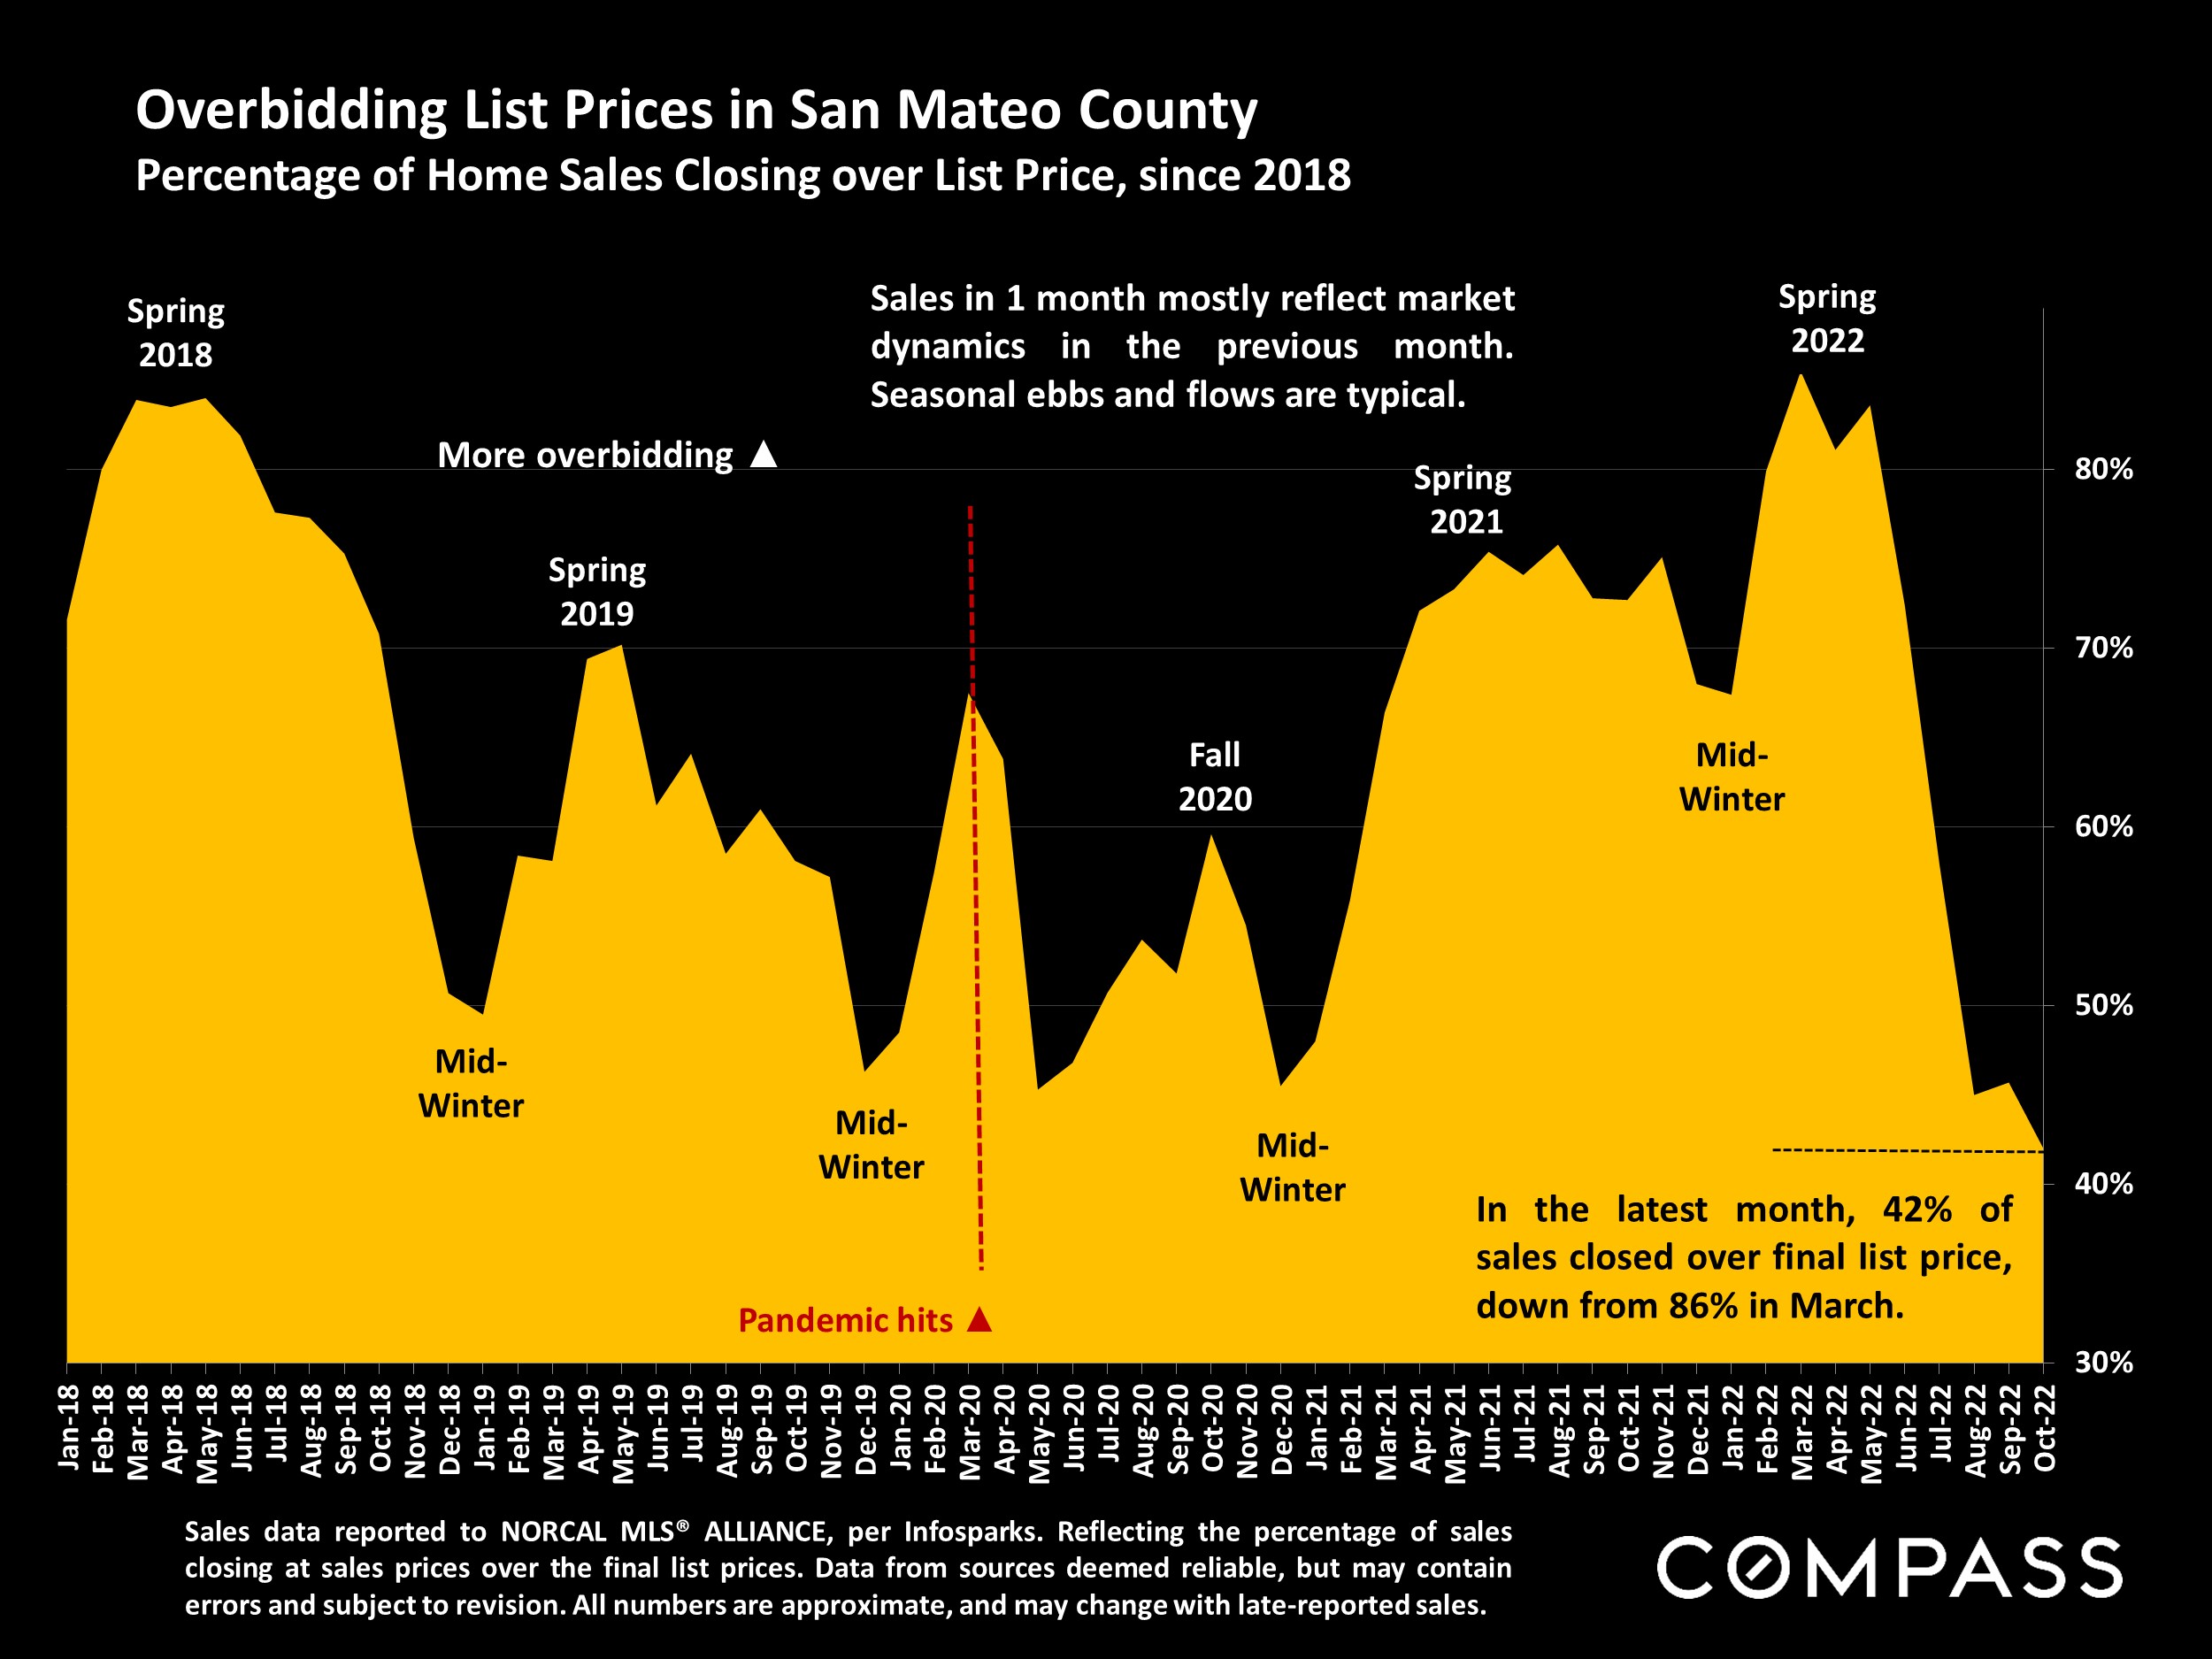
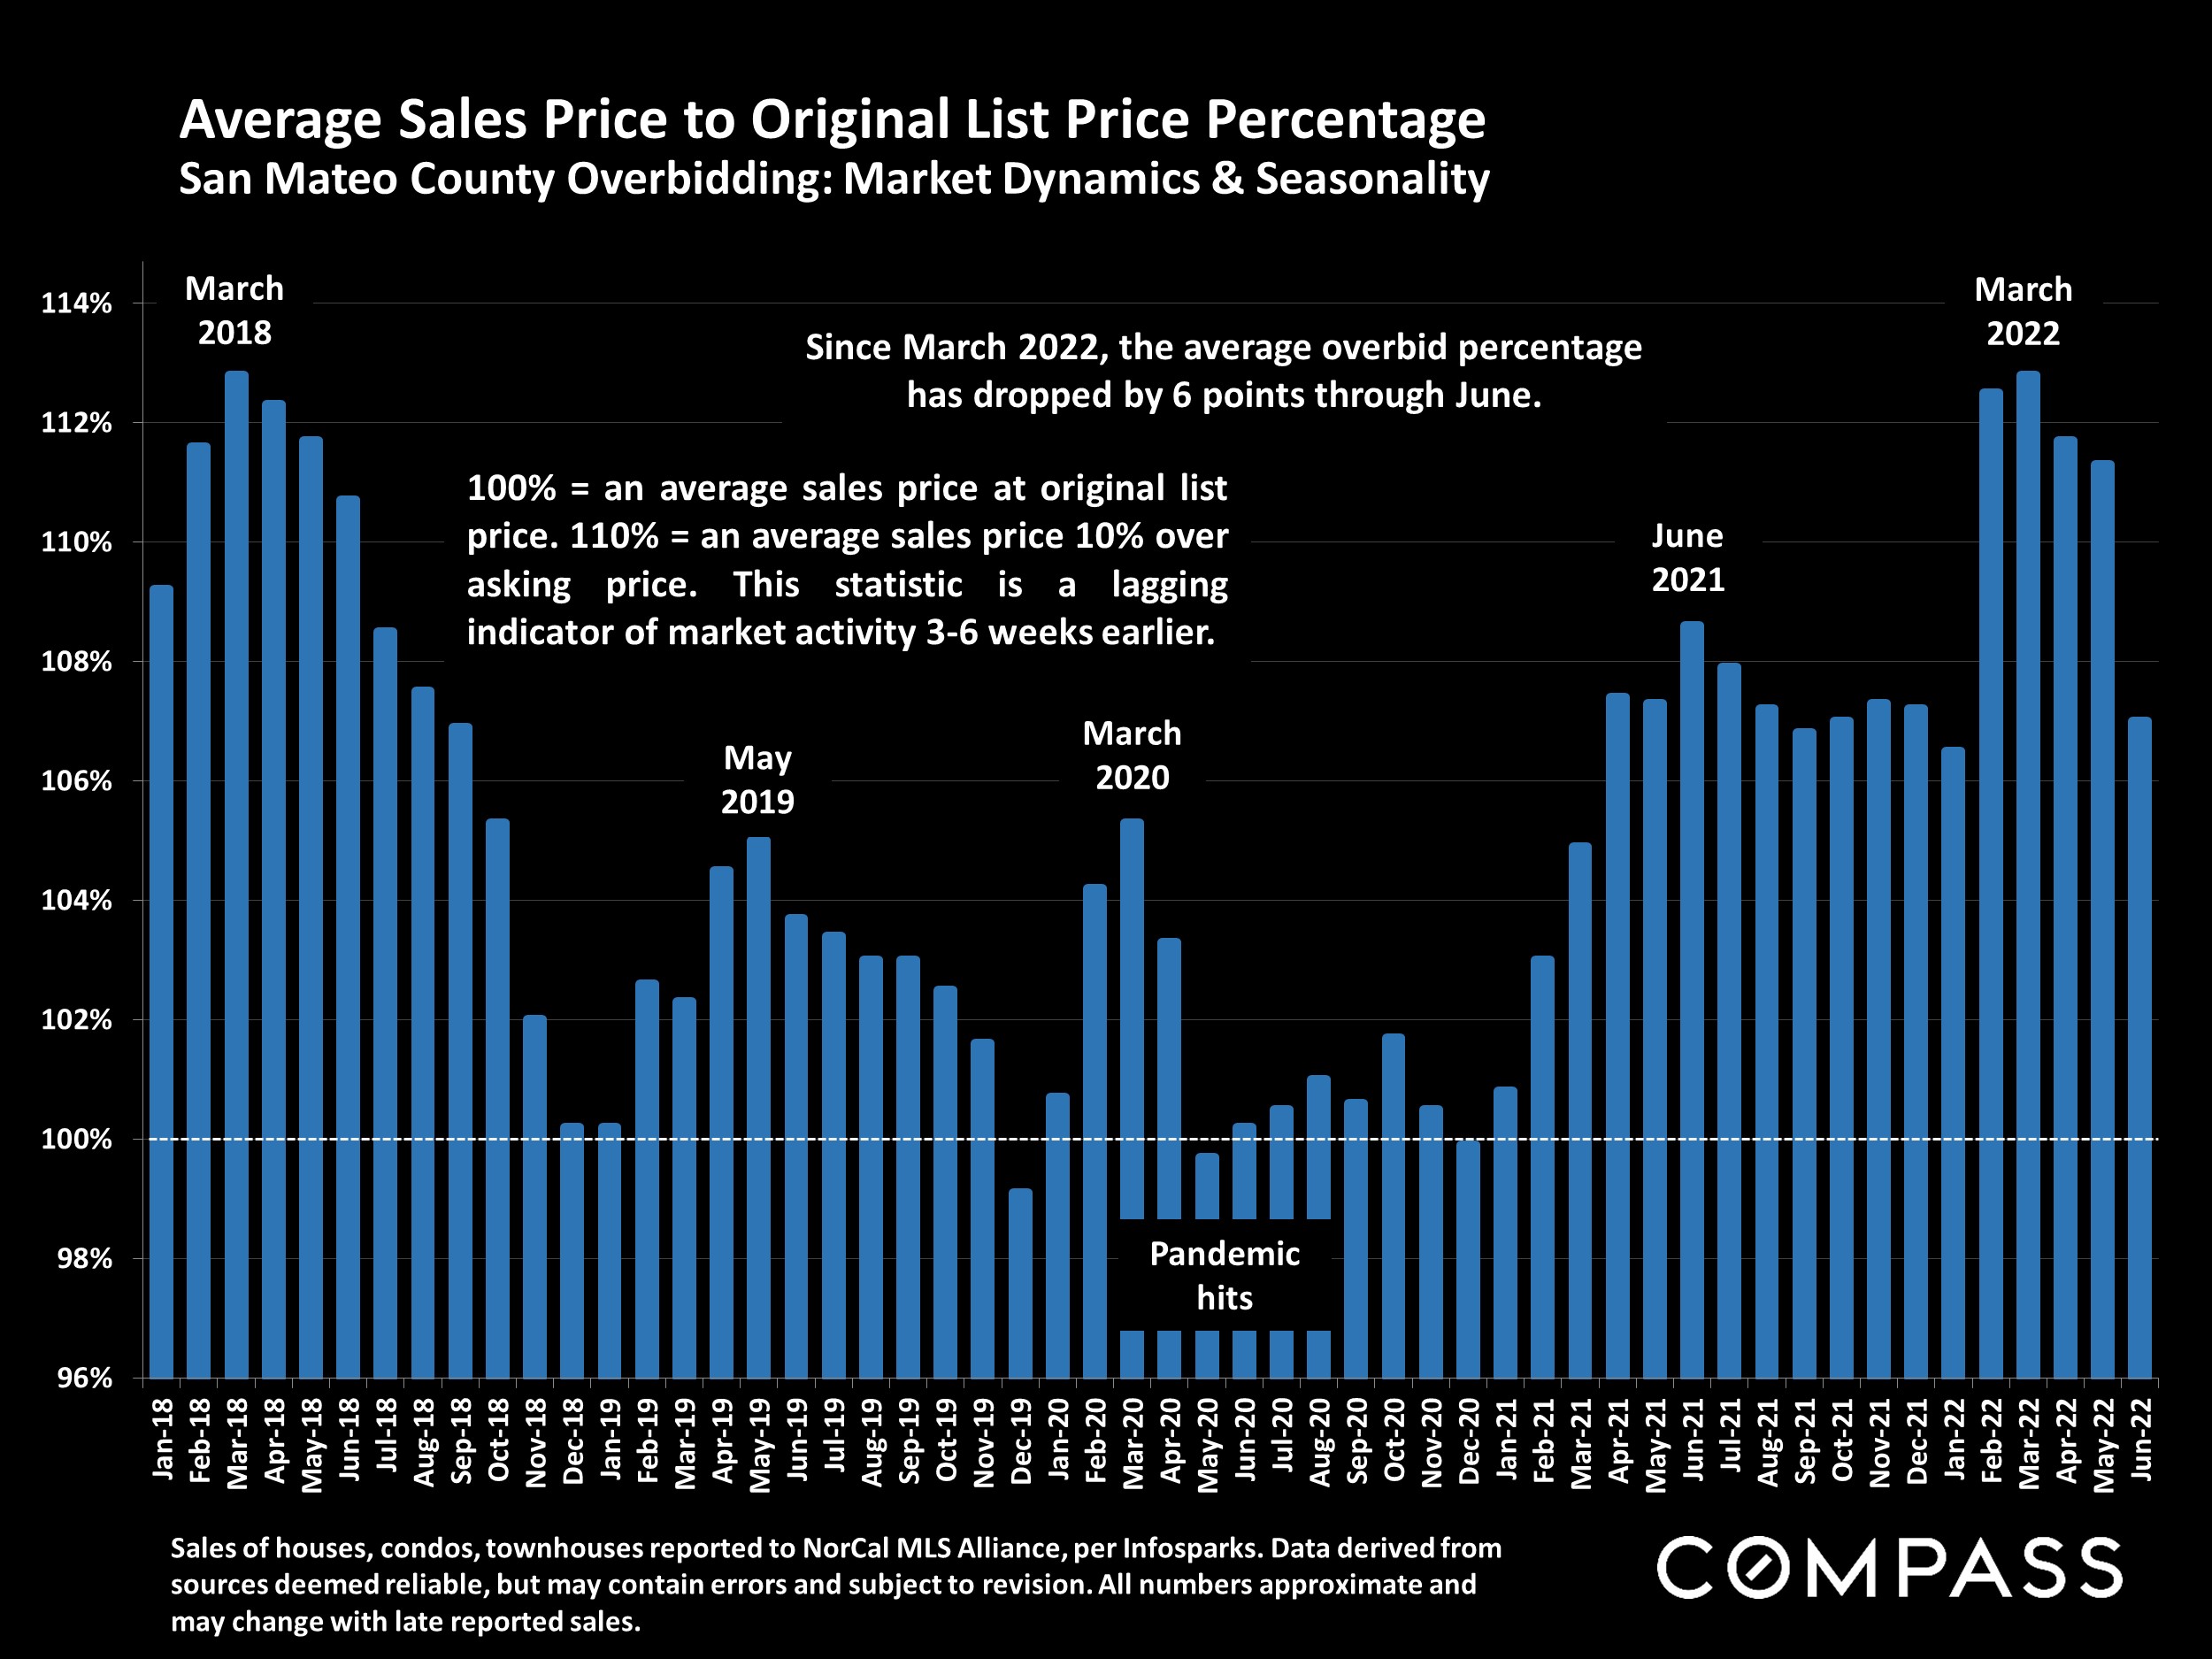
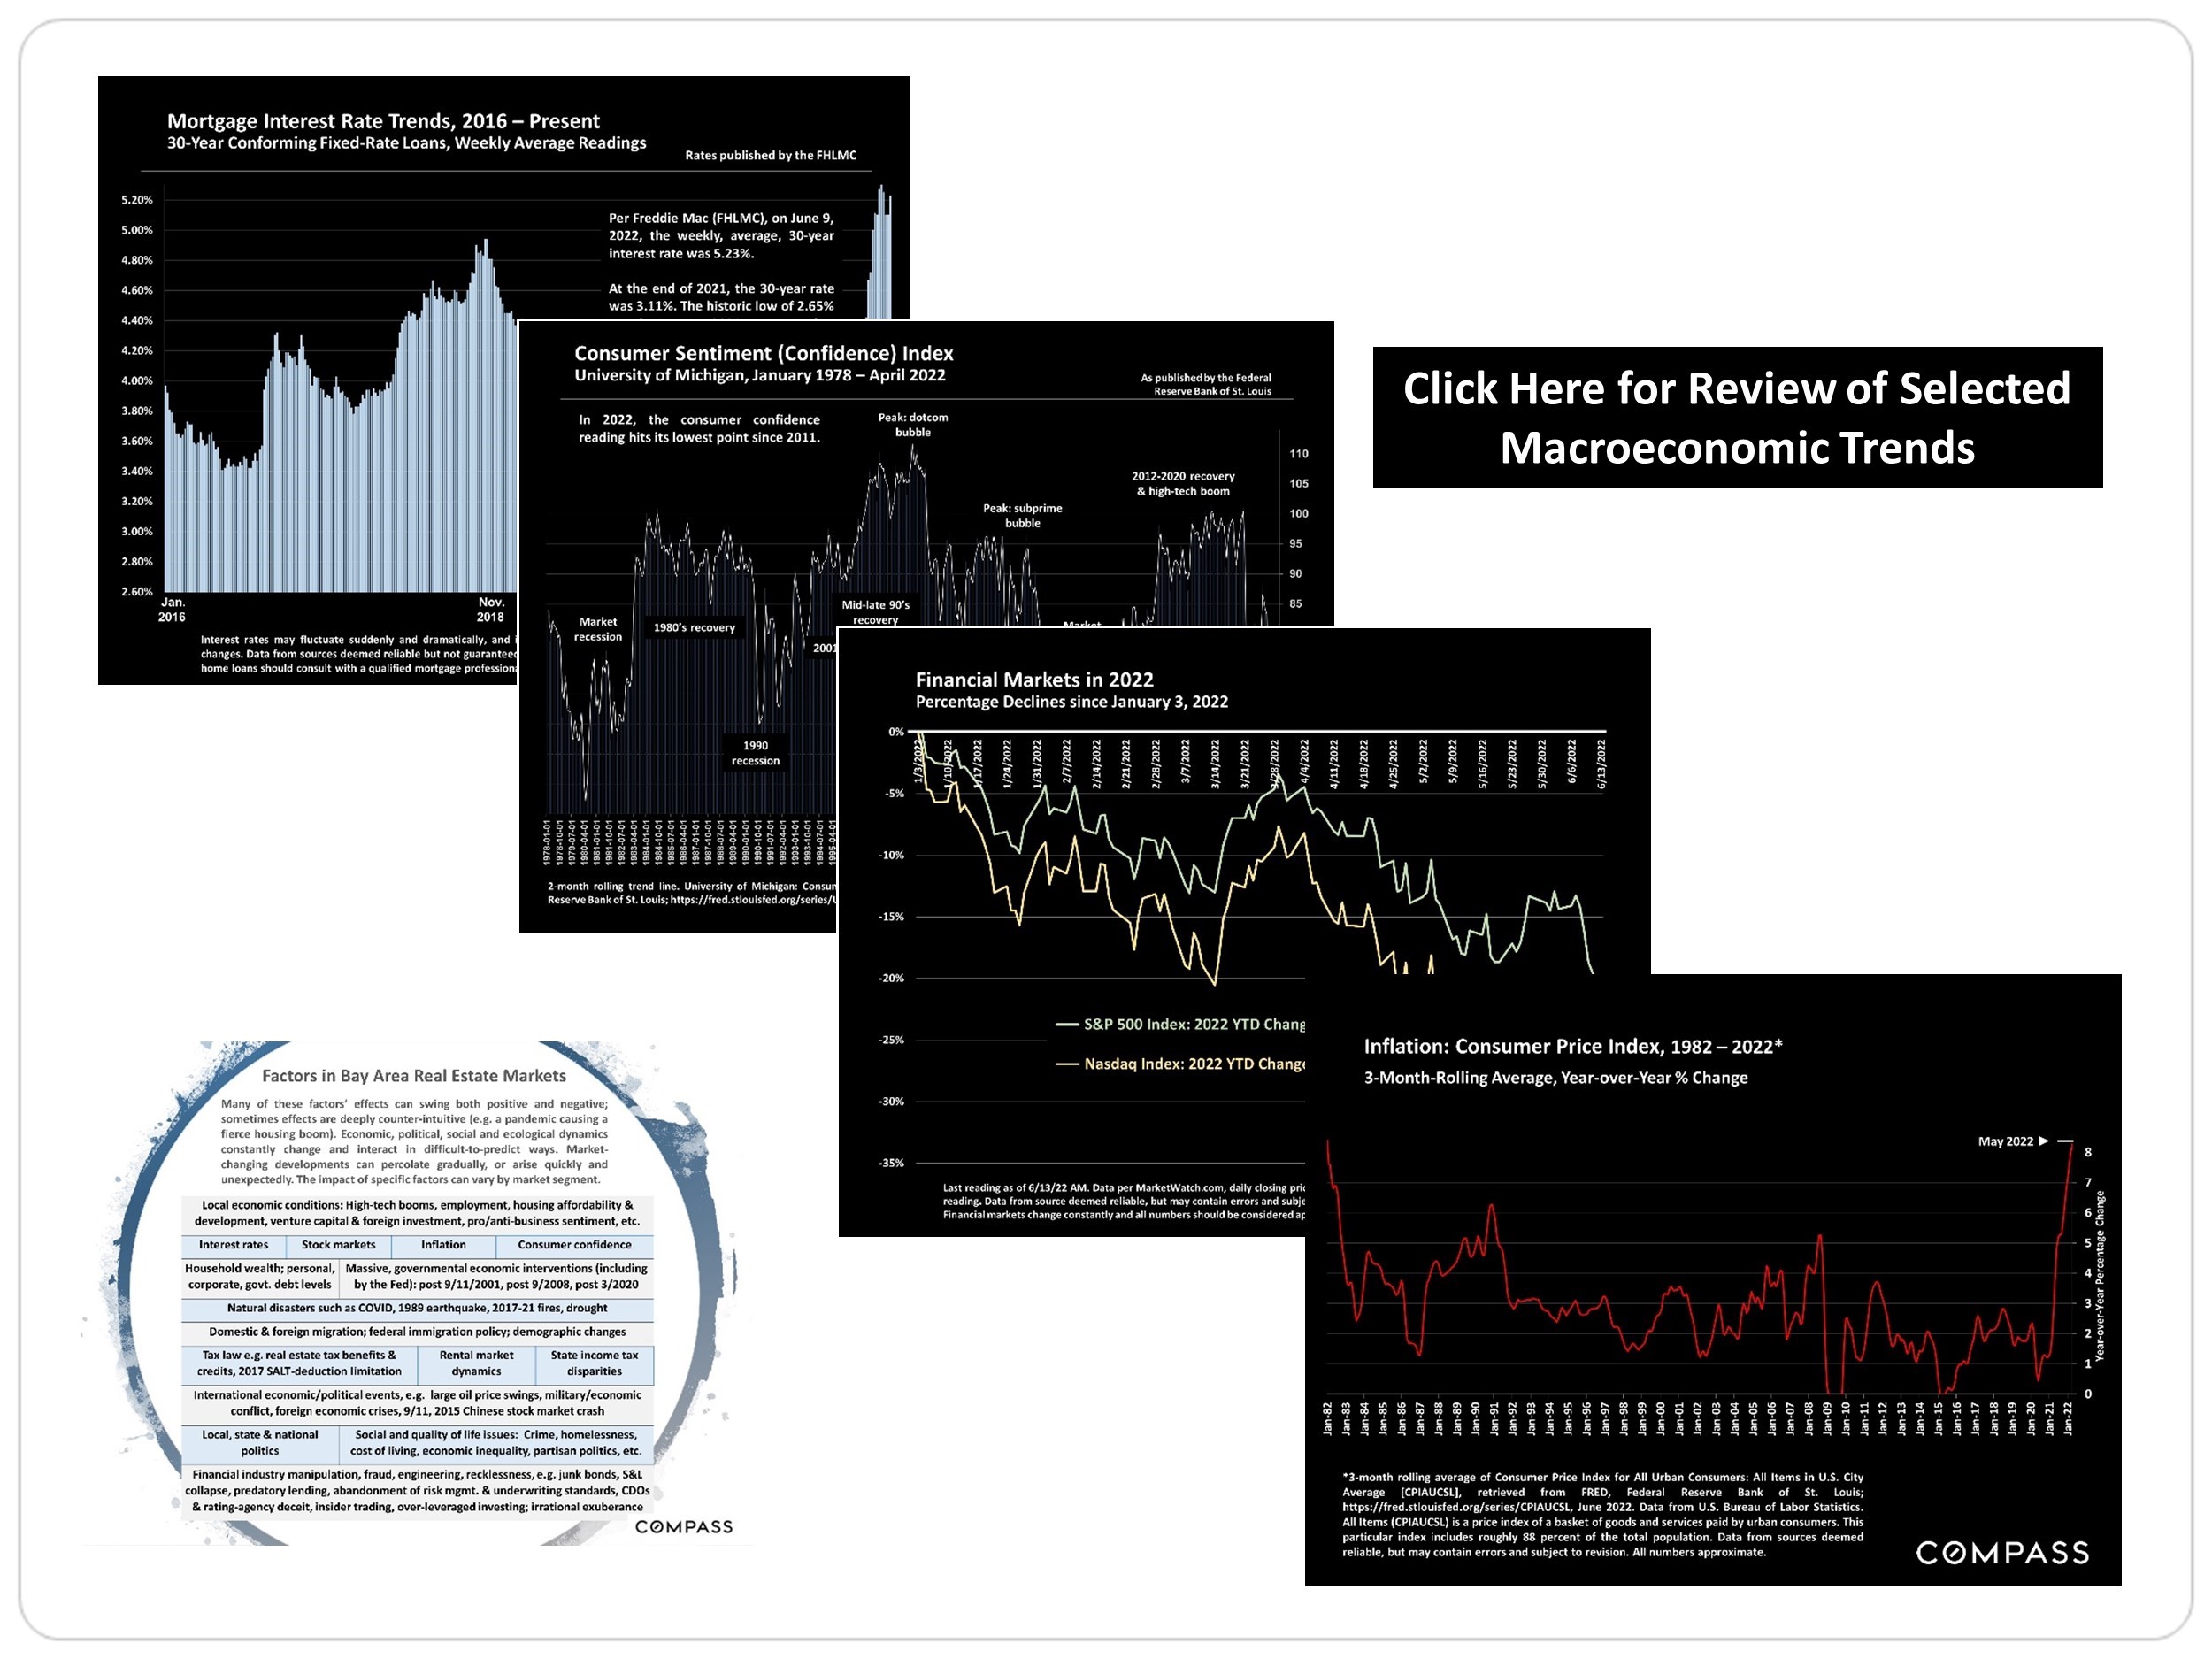
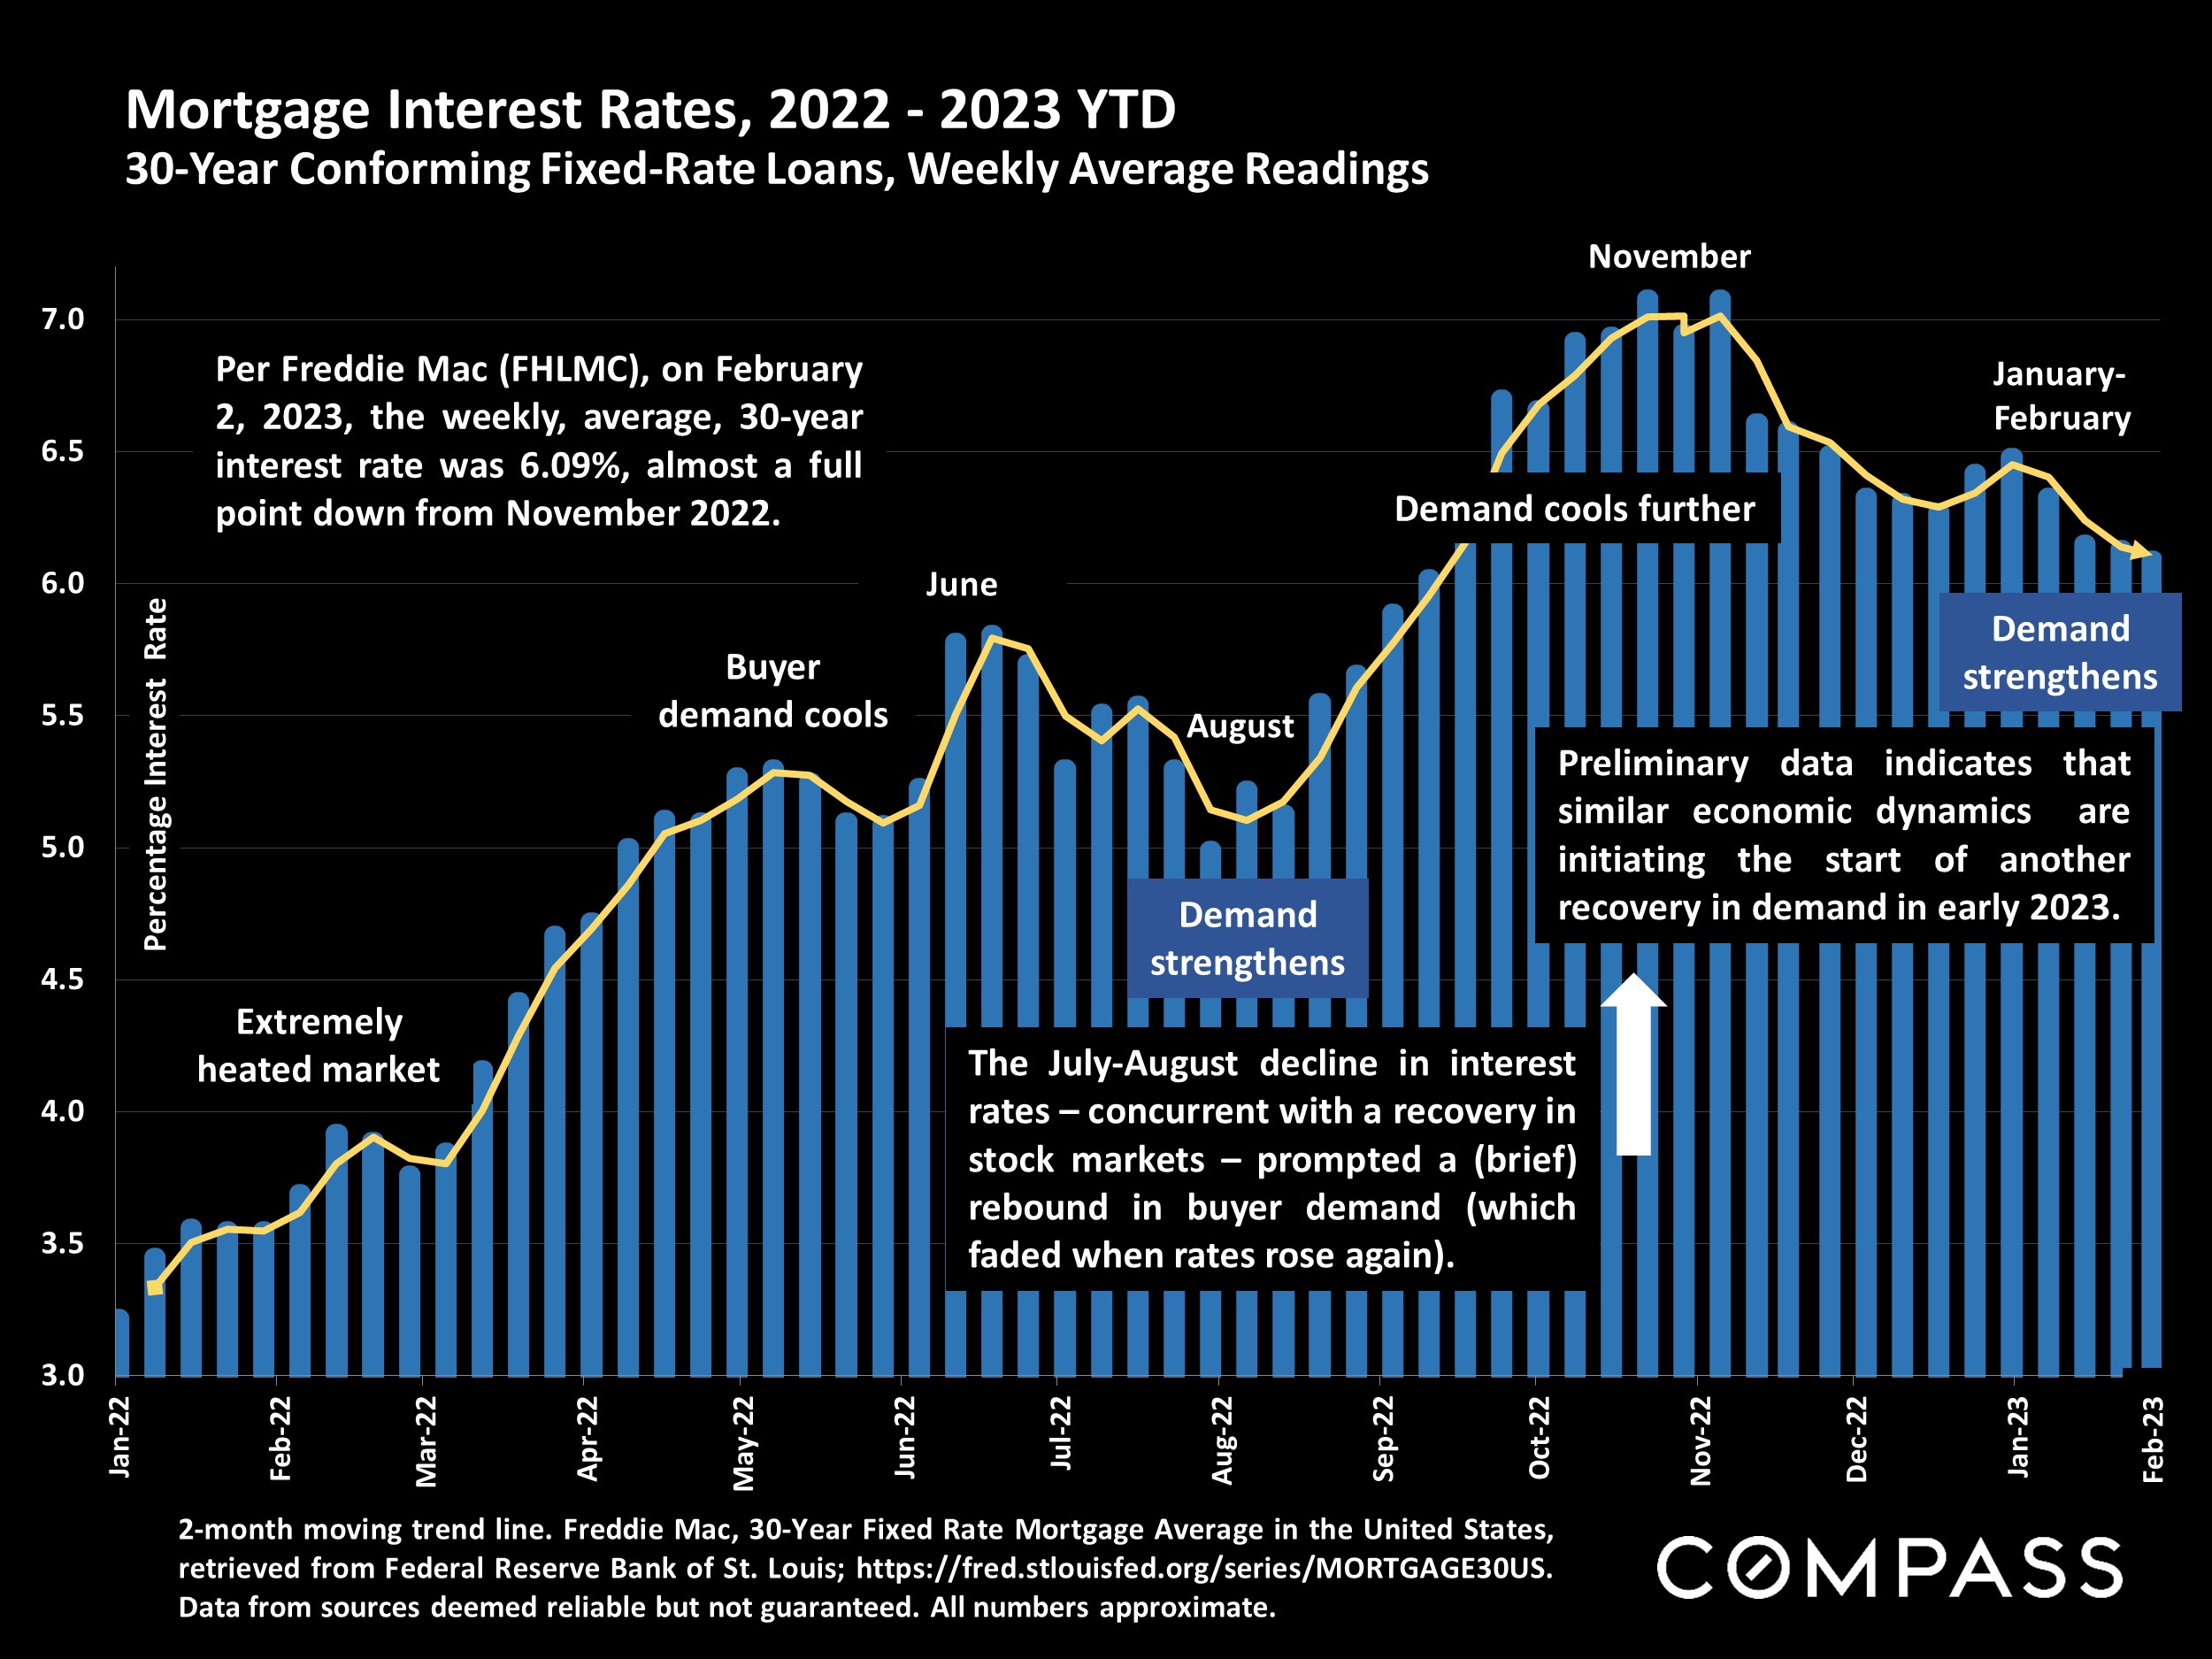
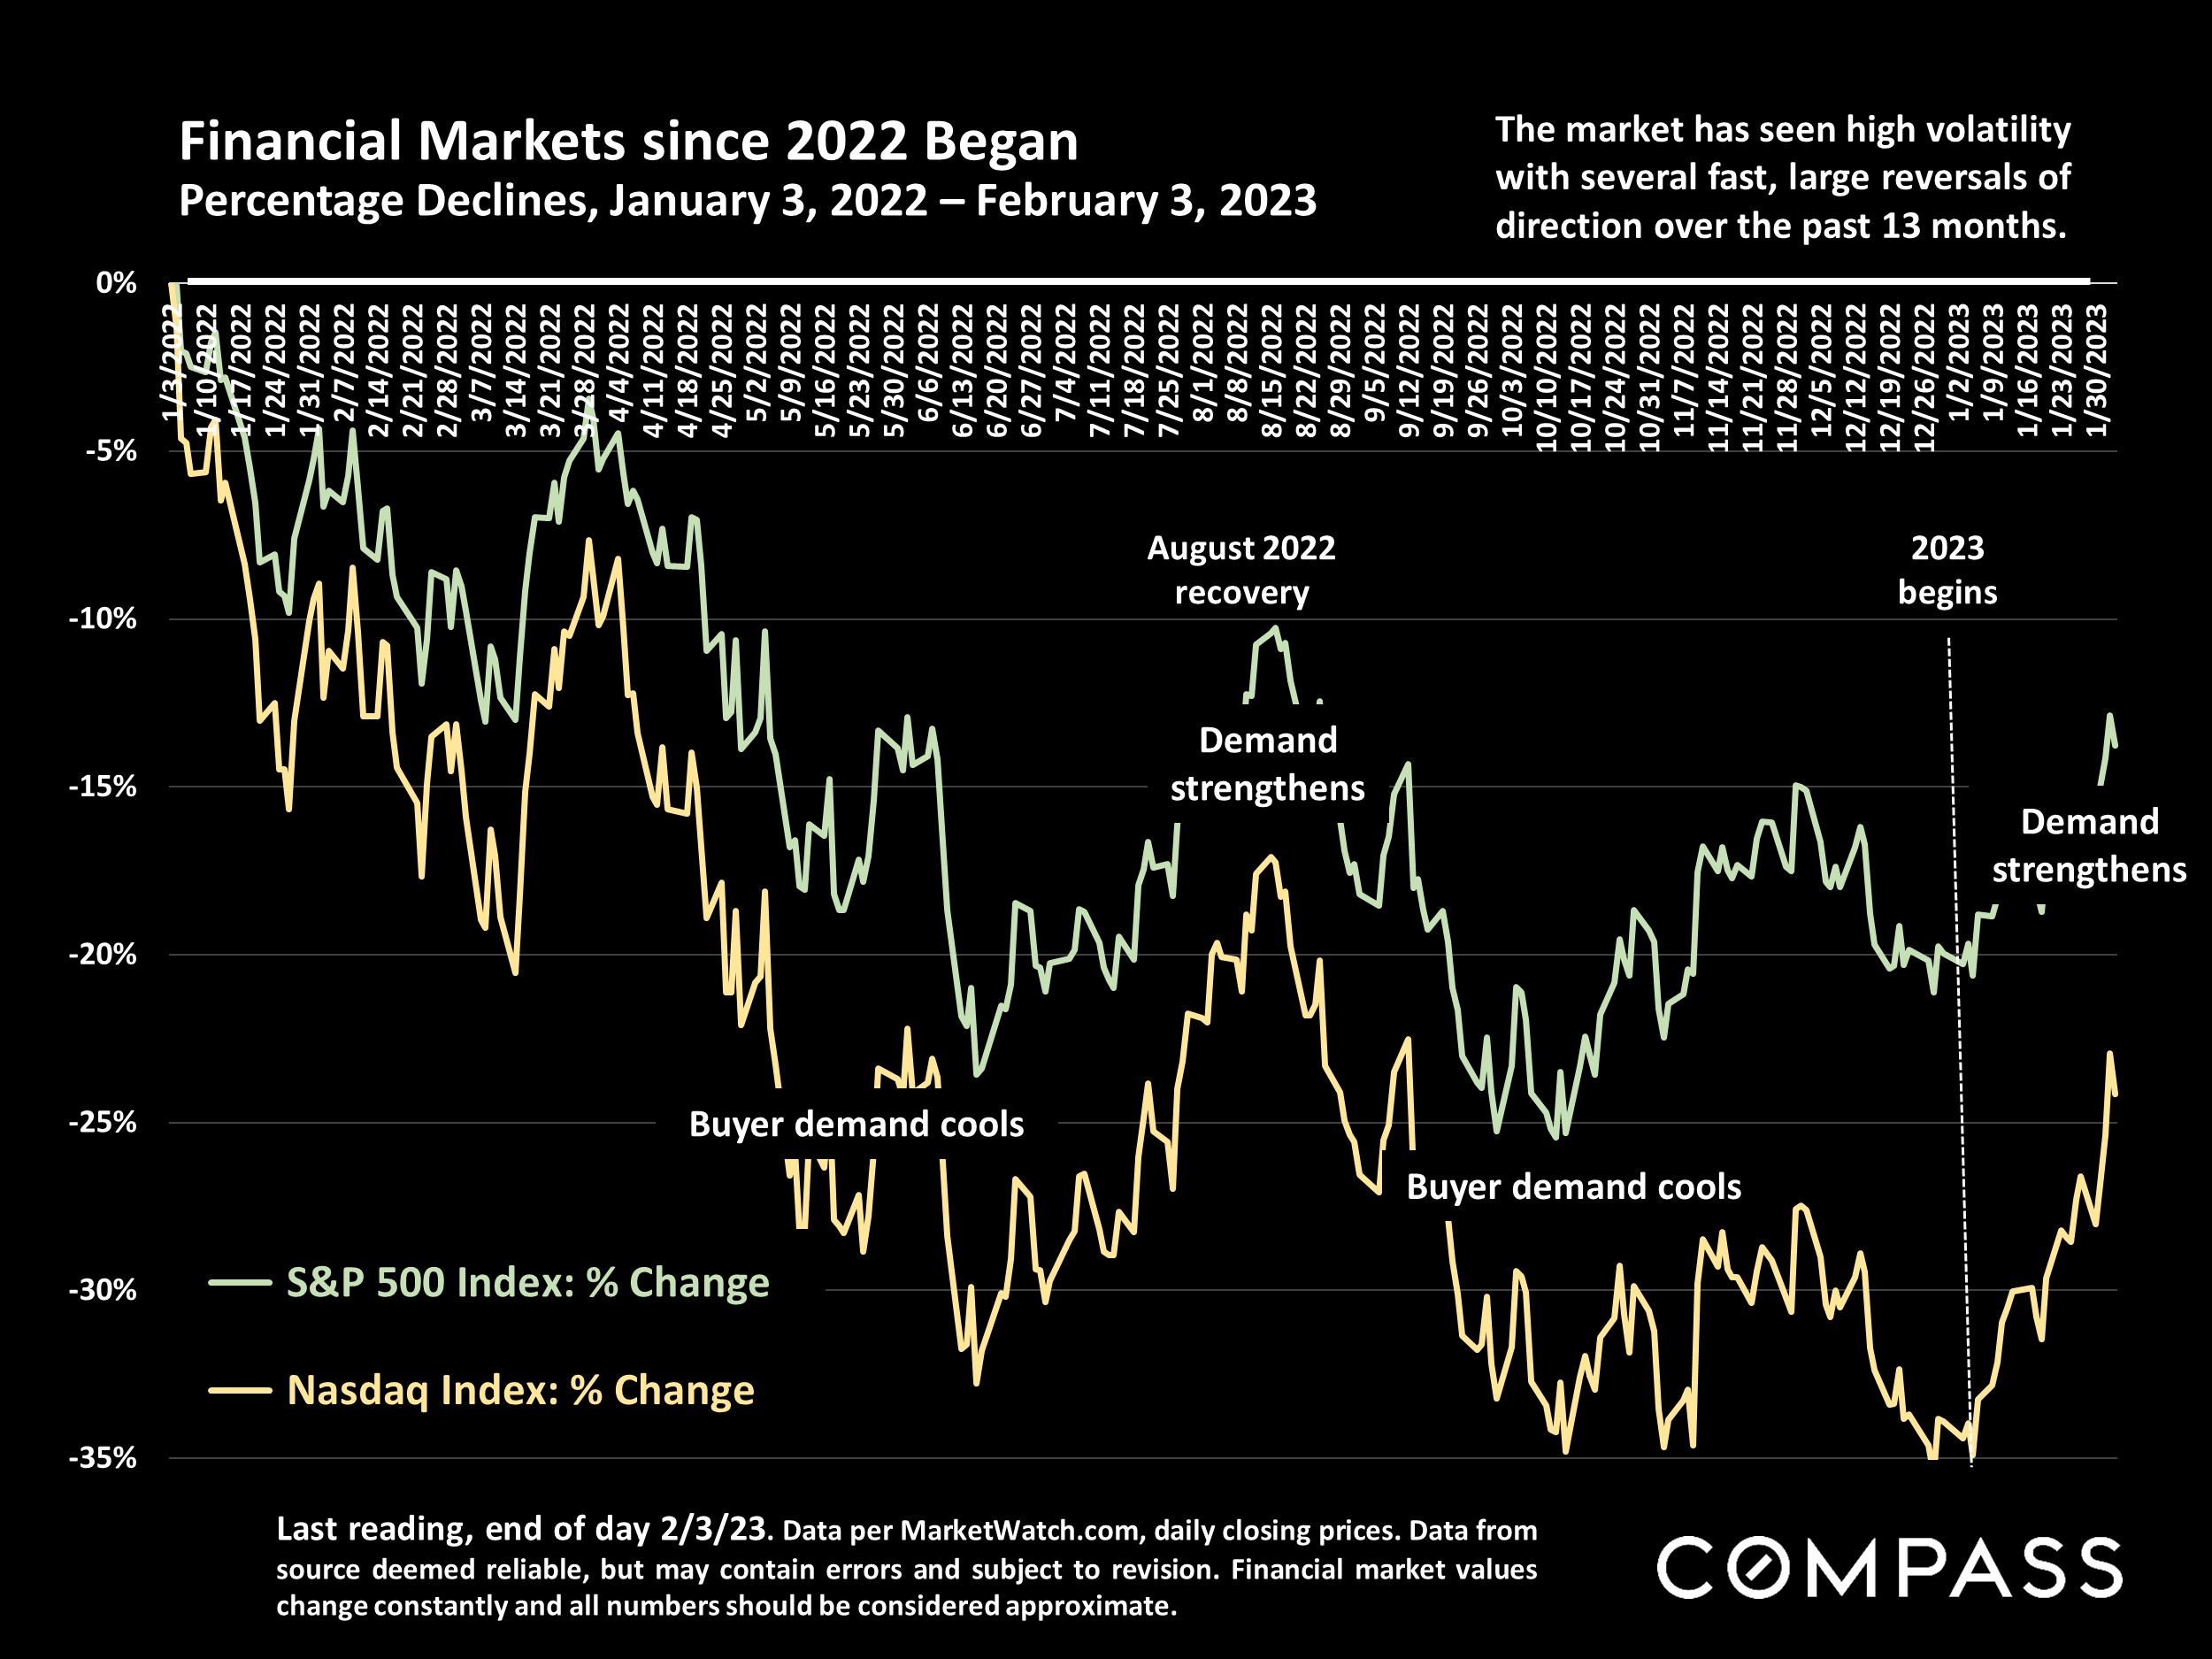
Typically, after the long holiday slowdown, the market just begins to wake up in mid-January before accelerating into spring. That being said, inflation has dropped substantially since June and interest rates since November, home prices are well down from last spring, stock markets are up 8% (S&P) to 15% (Nasdaq) YTD as of 2/3/23 (albeit with continuing volatility), and despite escalating layoffs in high tech, early indications in 2023 point to rebounding buyer demand. Open house traffic has jumped, more buyers are requesting listing disclosure packages, and there have been increasing reports of multiple offers and (often unexpected) overbidding of asking price. Based on this preliminary data (much of it still anecdotal*), it appears that buyer demand severely repressed by economic conditions in the 2nd half of 2022 has begun to bounce back.
A similar rebound began in mid-late summer 2022 for similar reasons – a significant drop in mortgage rates and a large rise in stock markets – which then quickly faded when positive economic developments went into reverse. Market activity then slowed further through the rest of 2022. There are currently considerable hopes for a more lasting economic recovery in 2023.
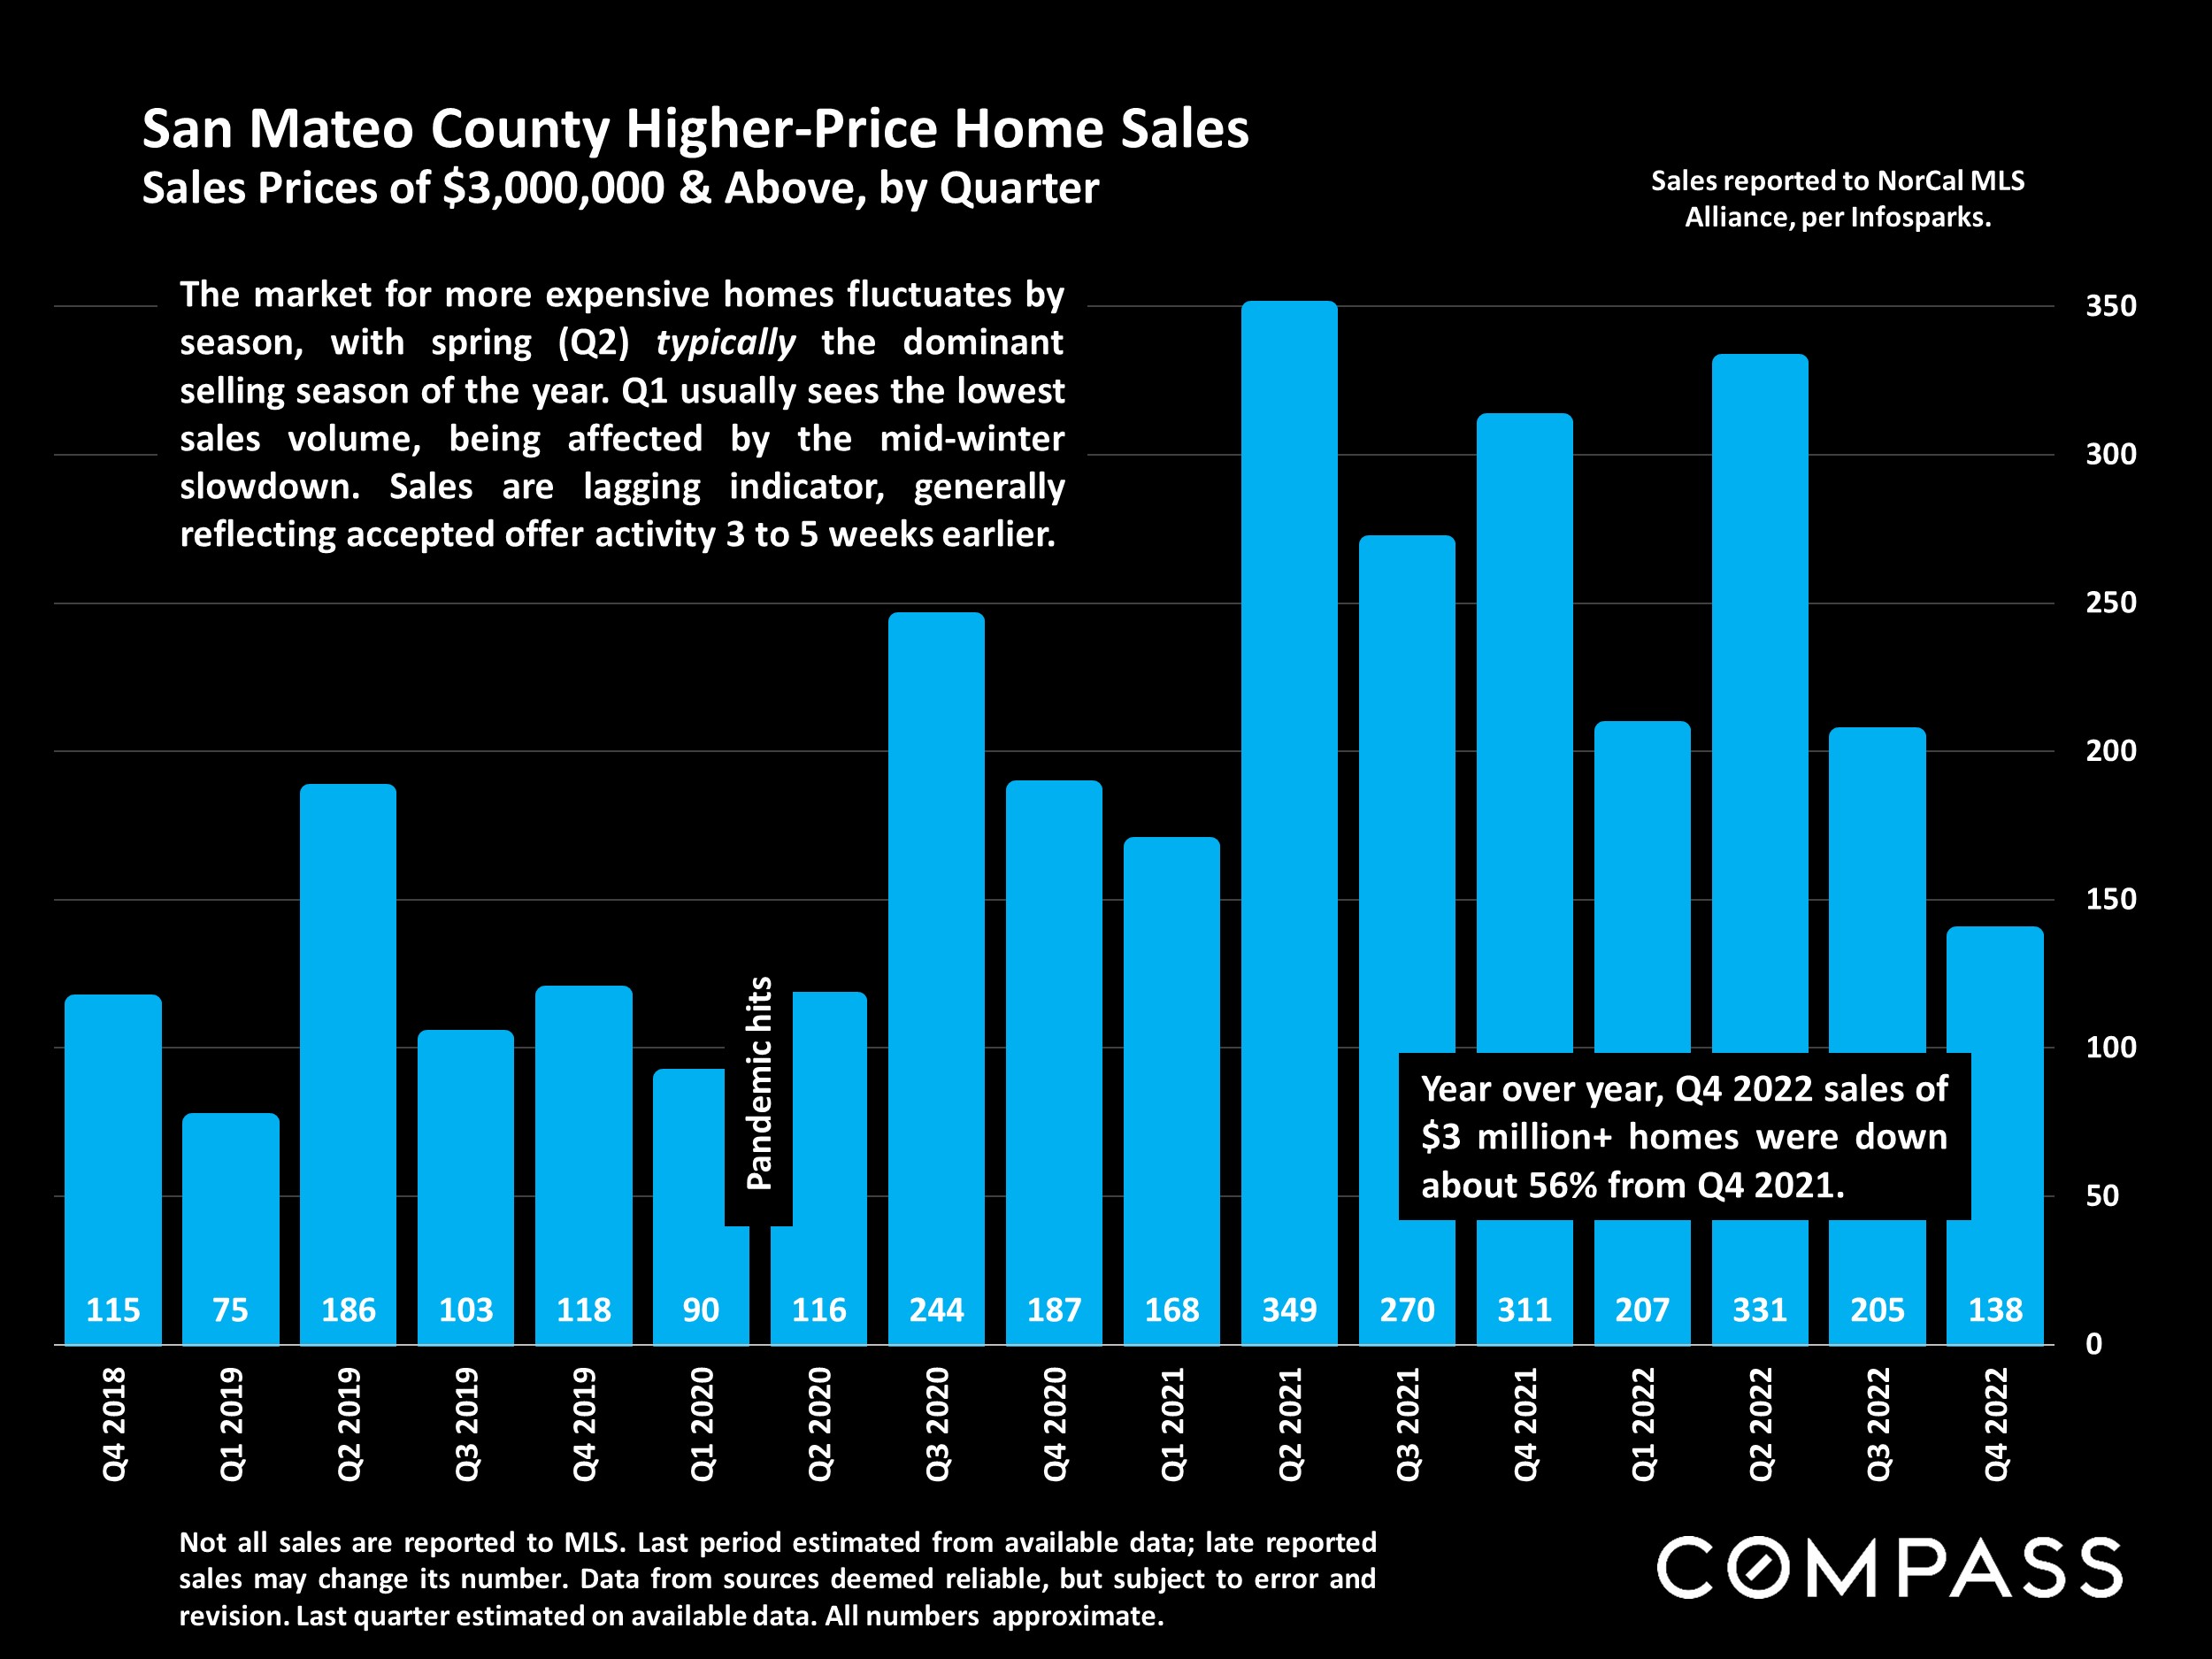
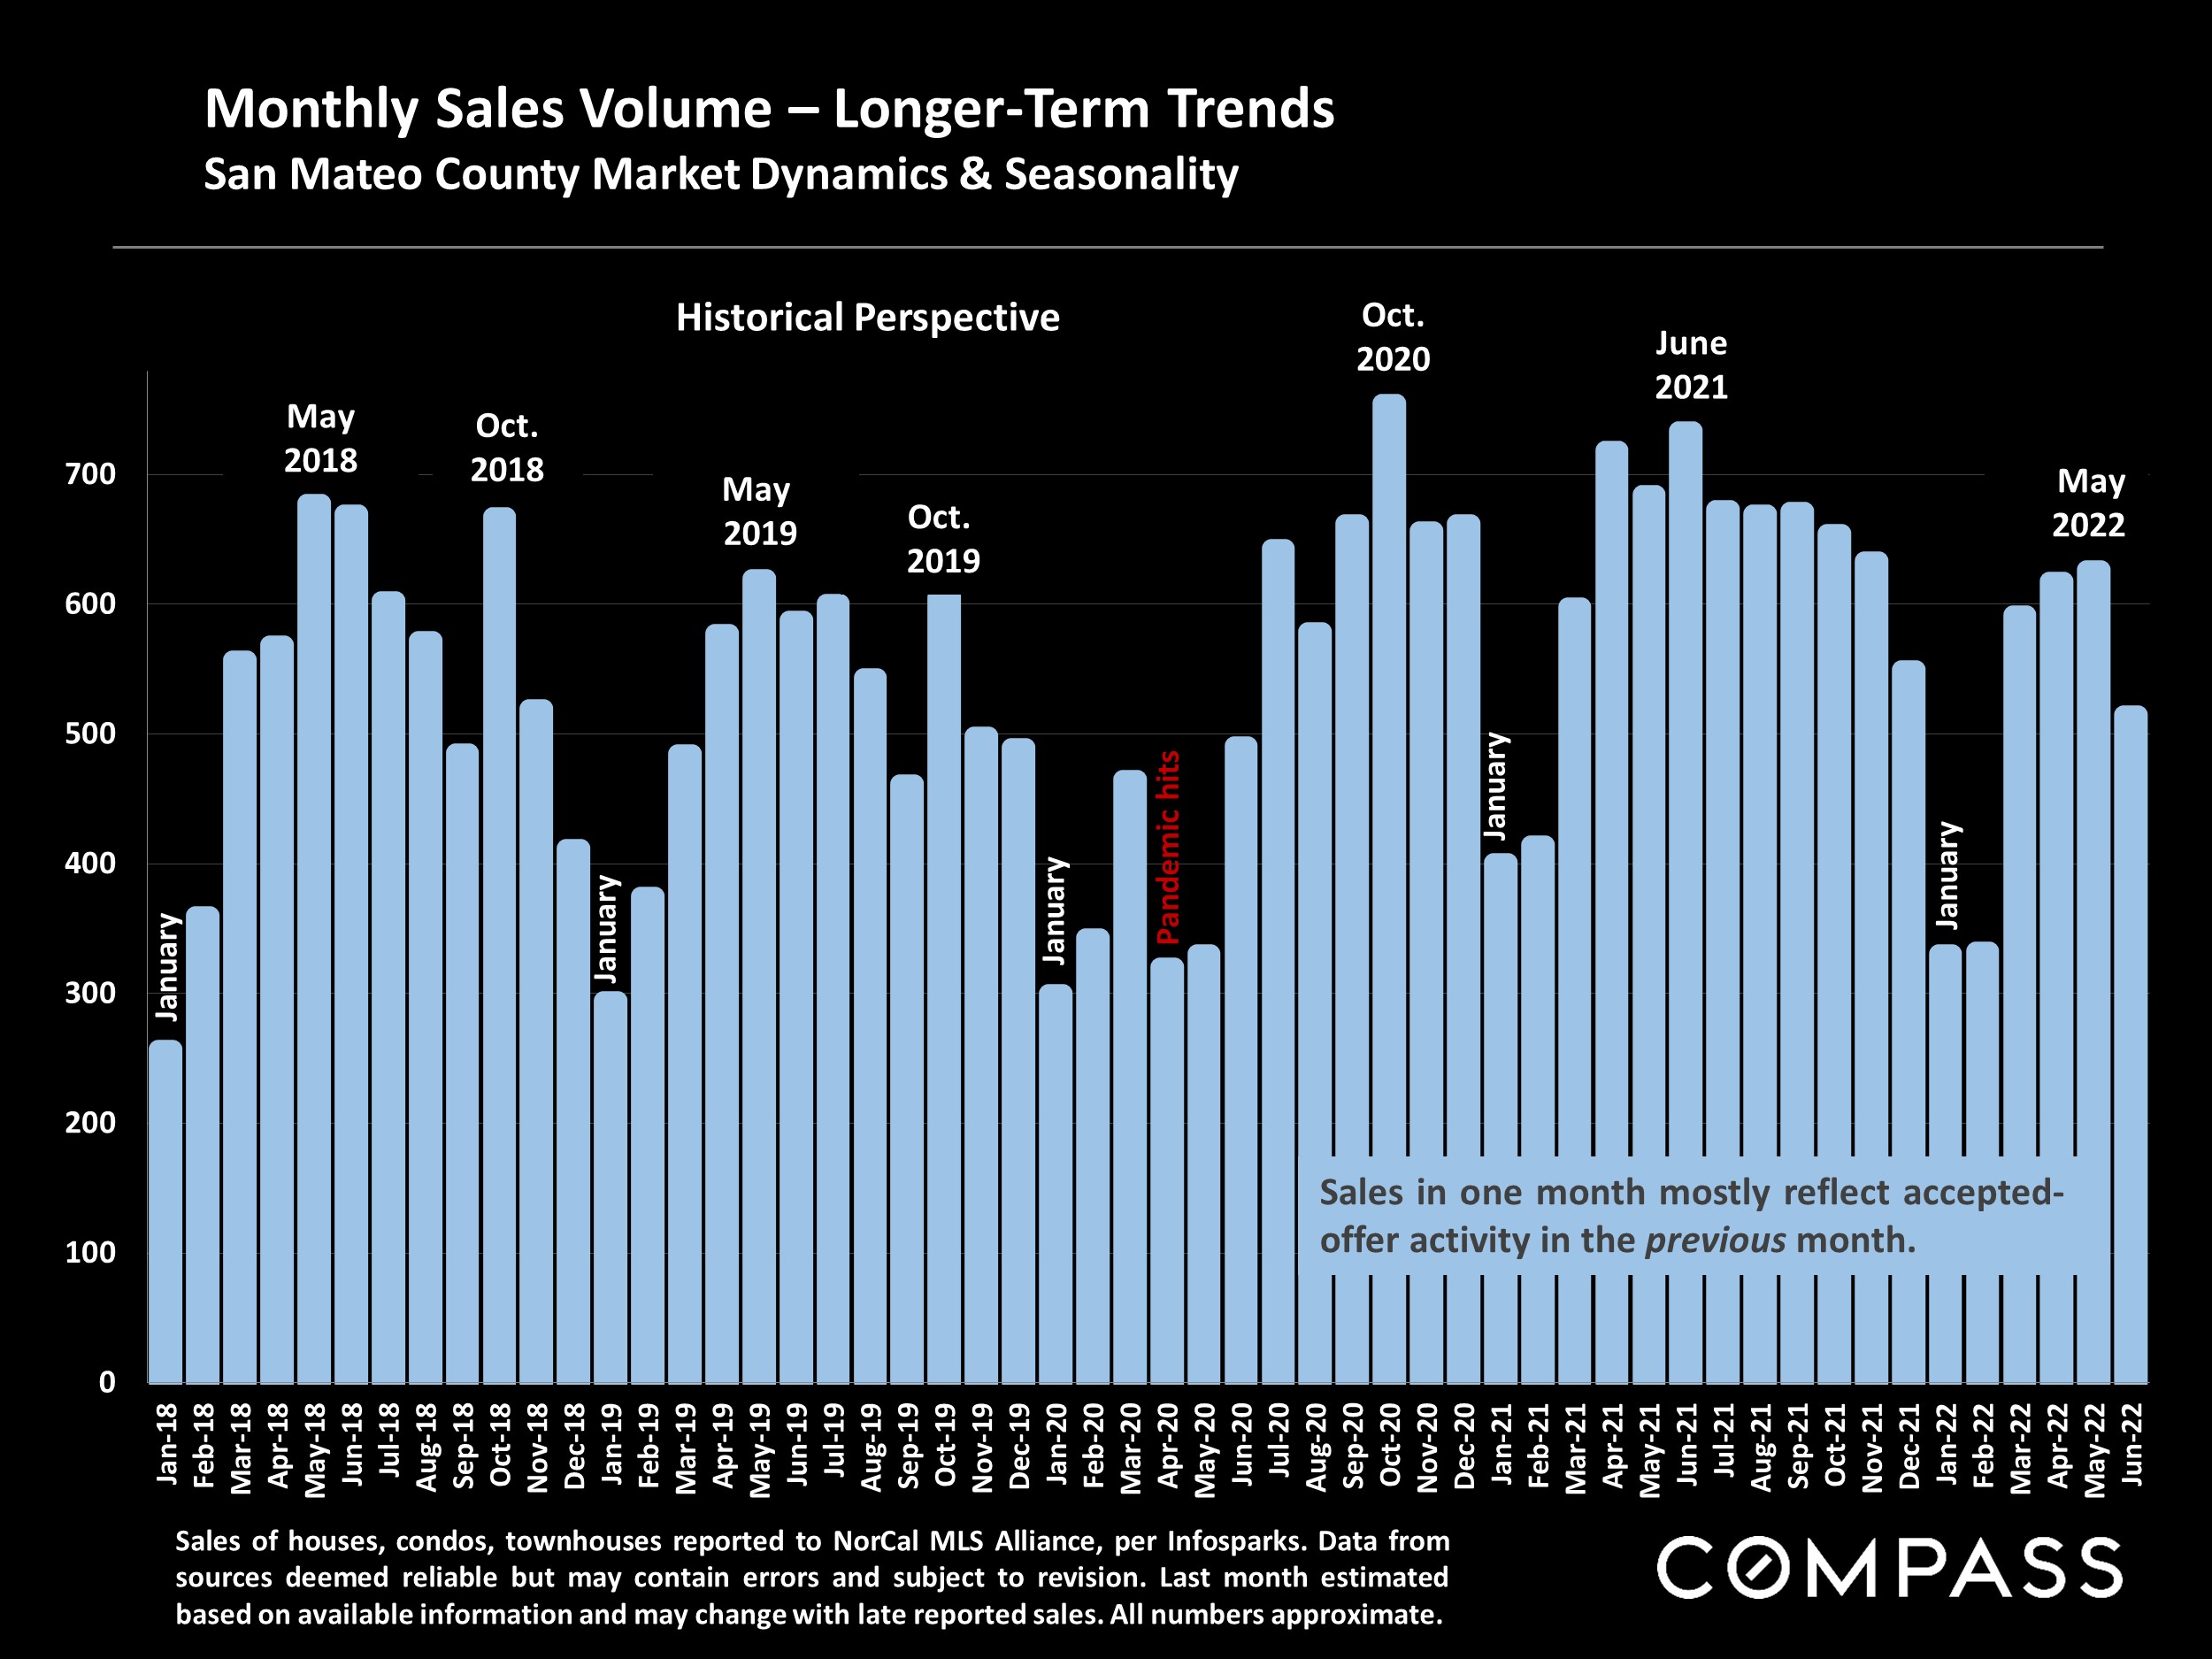
During the long high-tech and pandemic housing boom – which peaked in April/May 2022 – as each new year began, the classic dynamic was for buyers to jump back into the market much more quickly than sellers, creating an immediate imbalance between supply and demand. Too few new listings compared to the quantity of motivated buyers sparked often ferocious bidding wars, leading to considerable home price gains virtually every spring. It is too early to conclude, after the general price declines and steep drops in market activity seen in the 2nd half of 2022, that a sustained recovery in market conditions is now underway, and if it is, how quickly it will develop and its impact on prices in 2023. Many economic conditions remain challenging – with critical indicators still much weaker on a year-over-year basis – and forecasts by economists and analysts vary widely. Hopefully, economic conditions will continue to improve, providing the foundation for the recovery in real estate. In the meantime, preliminary indicators are surprisingly positive, and the CEO of Compass recently stated his belief that Q4 2022 saw the bottom of the market.
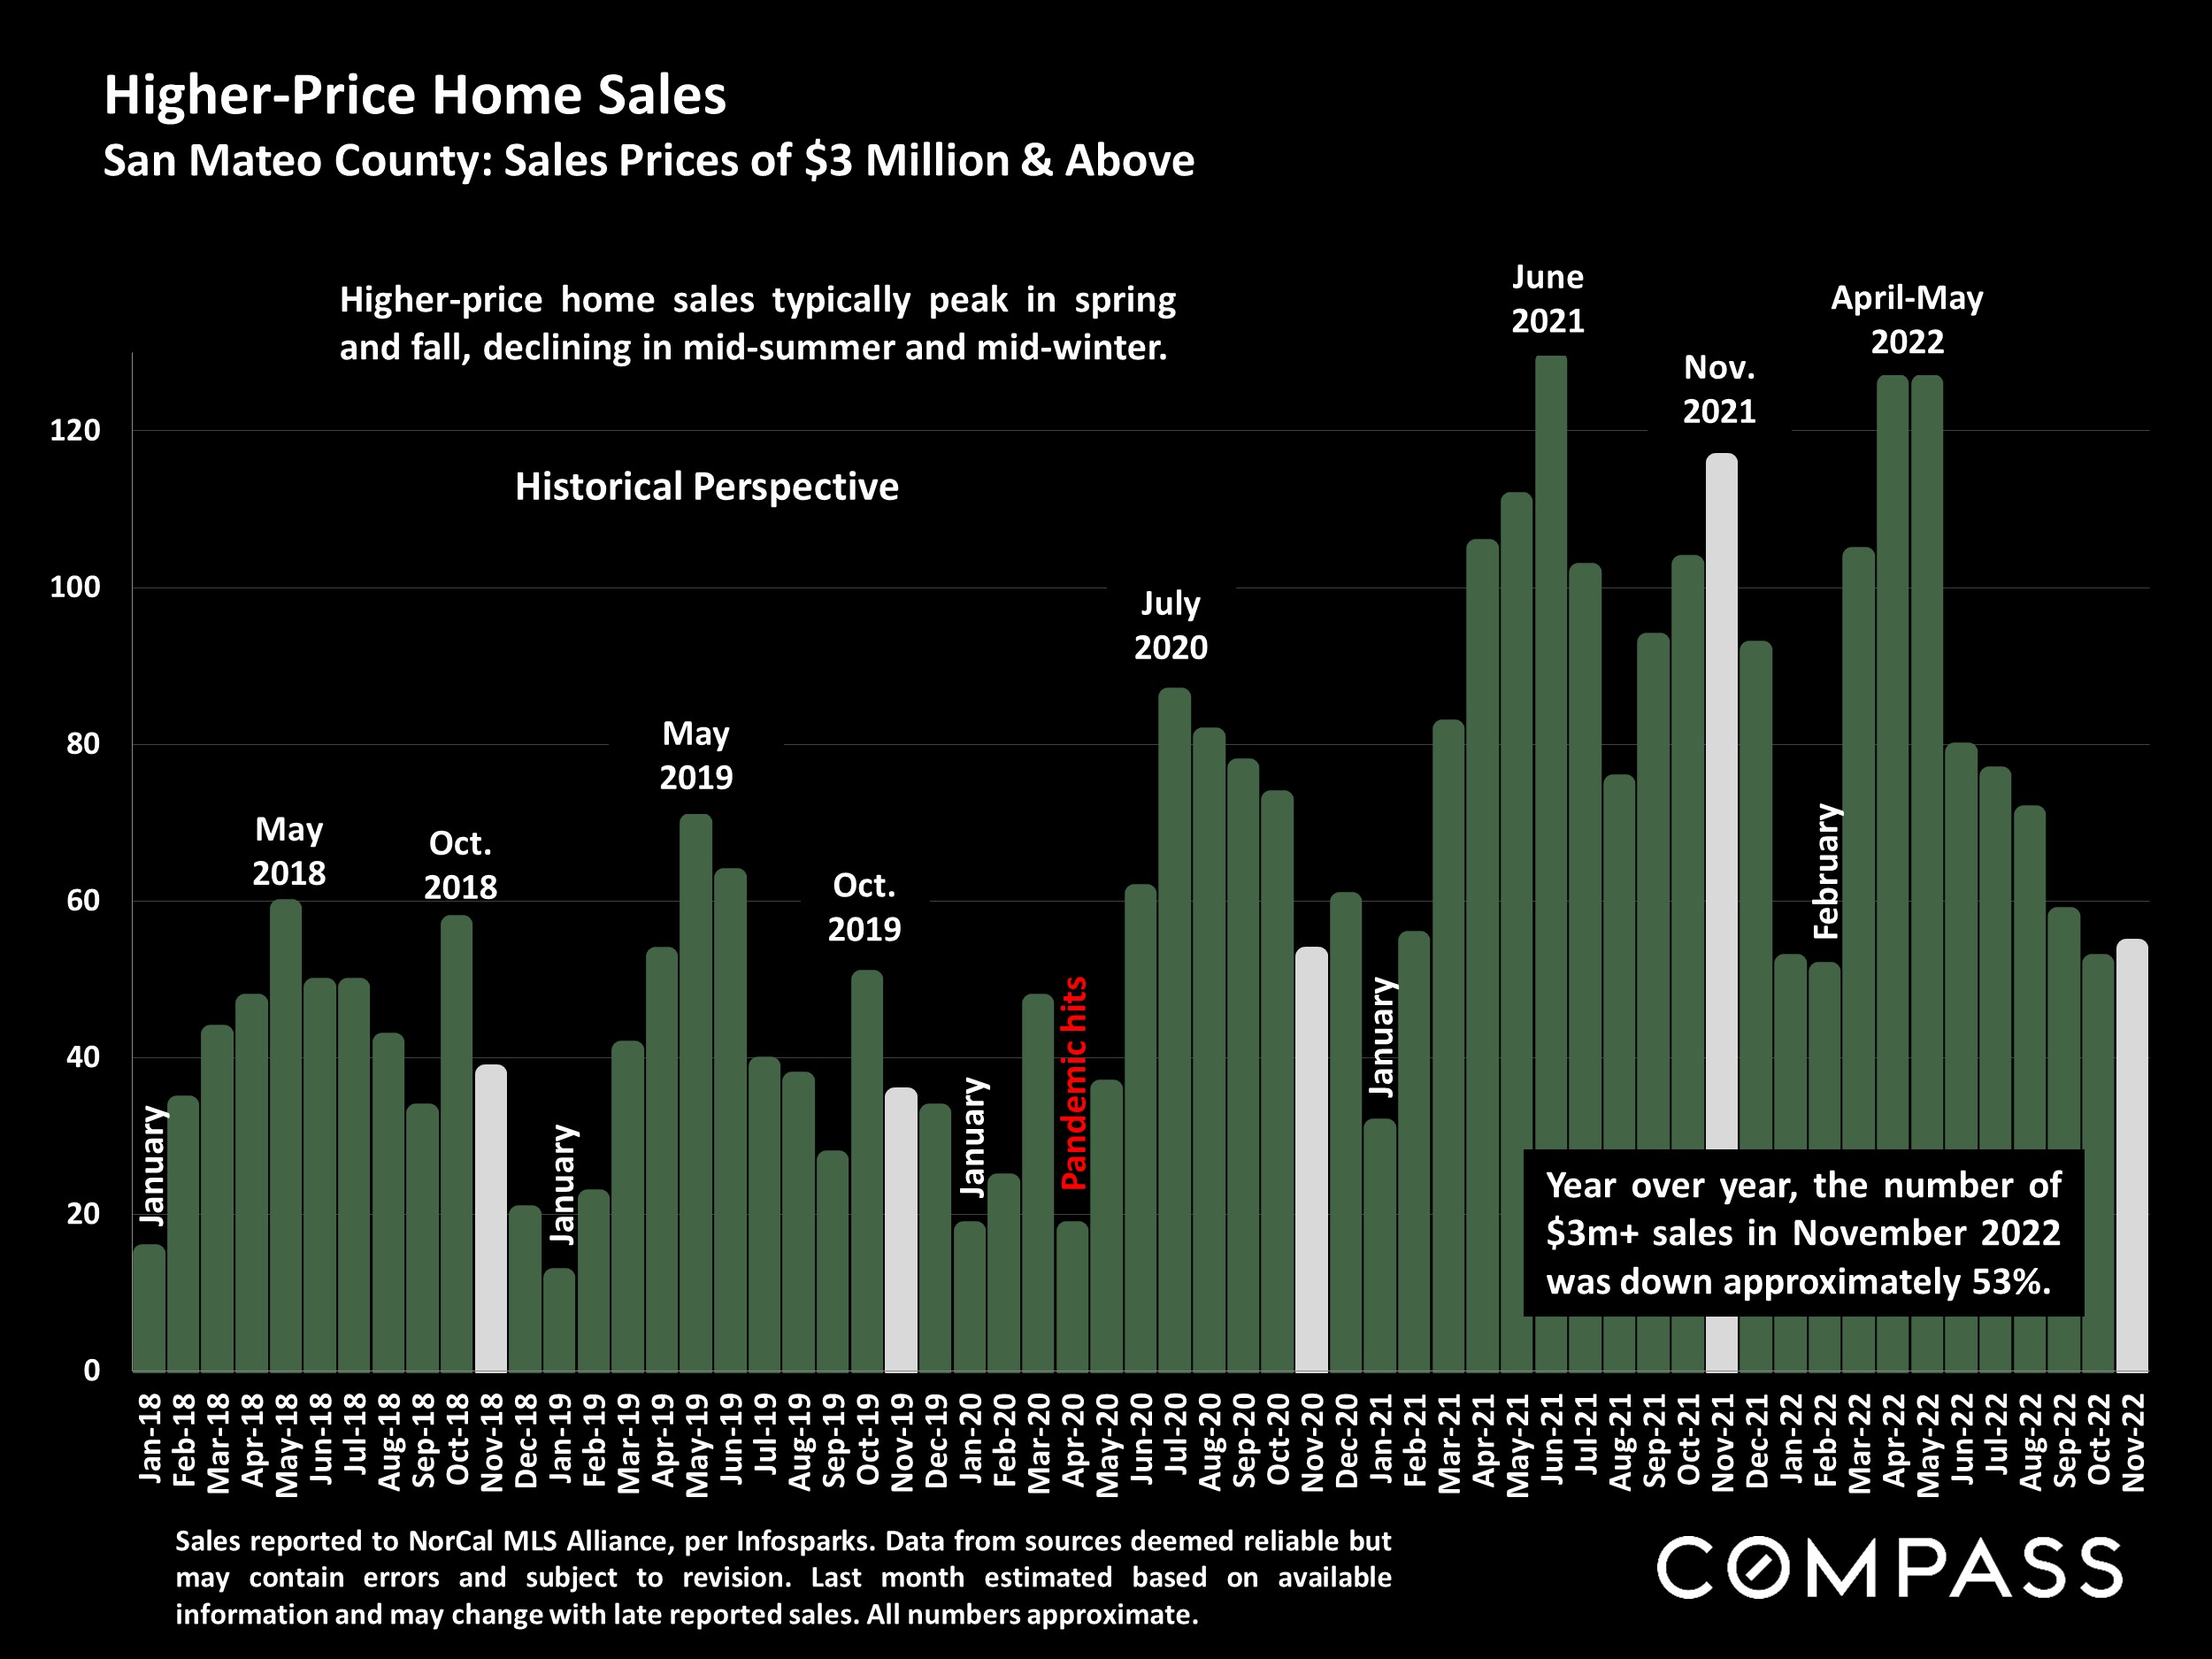
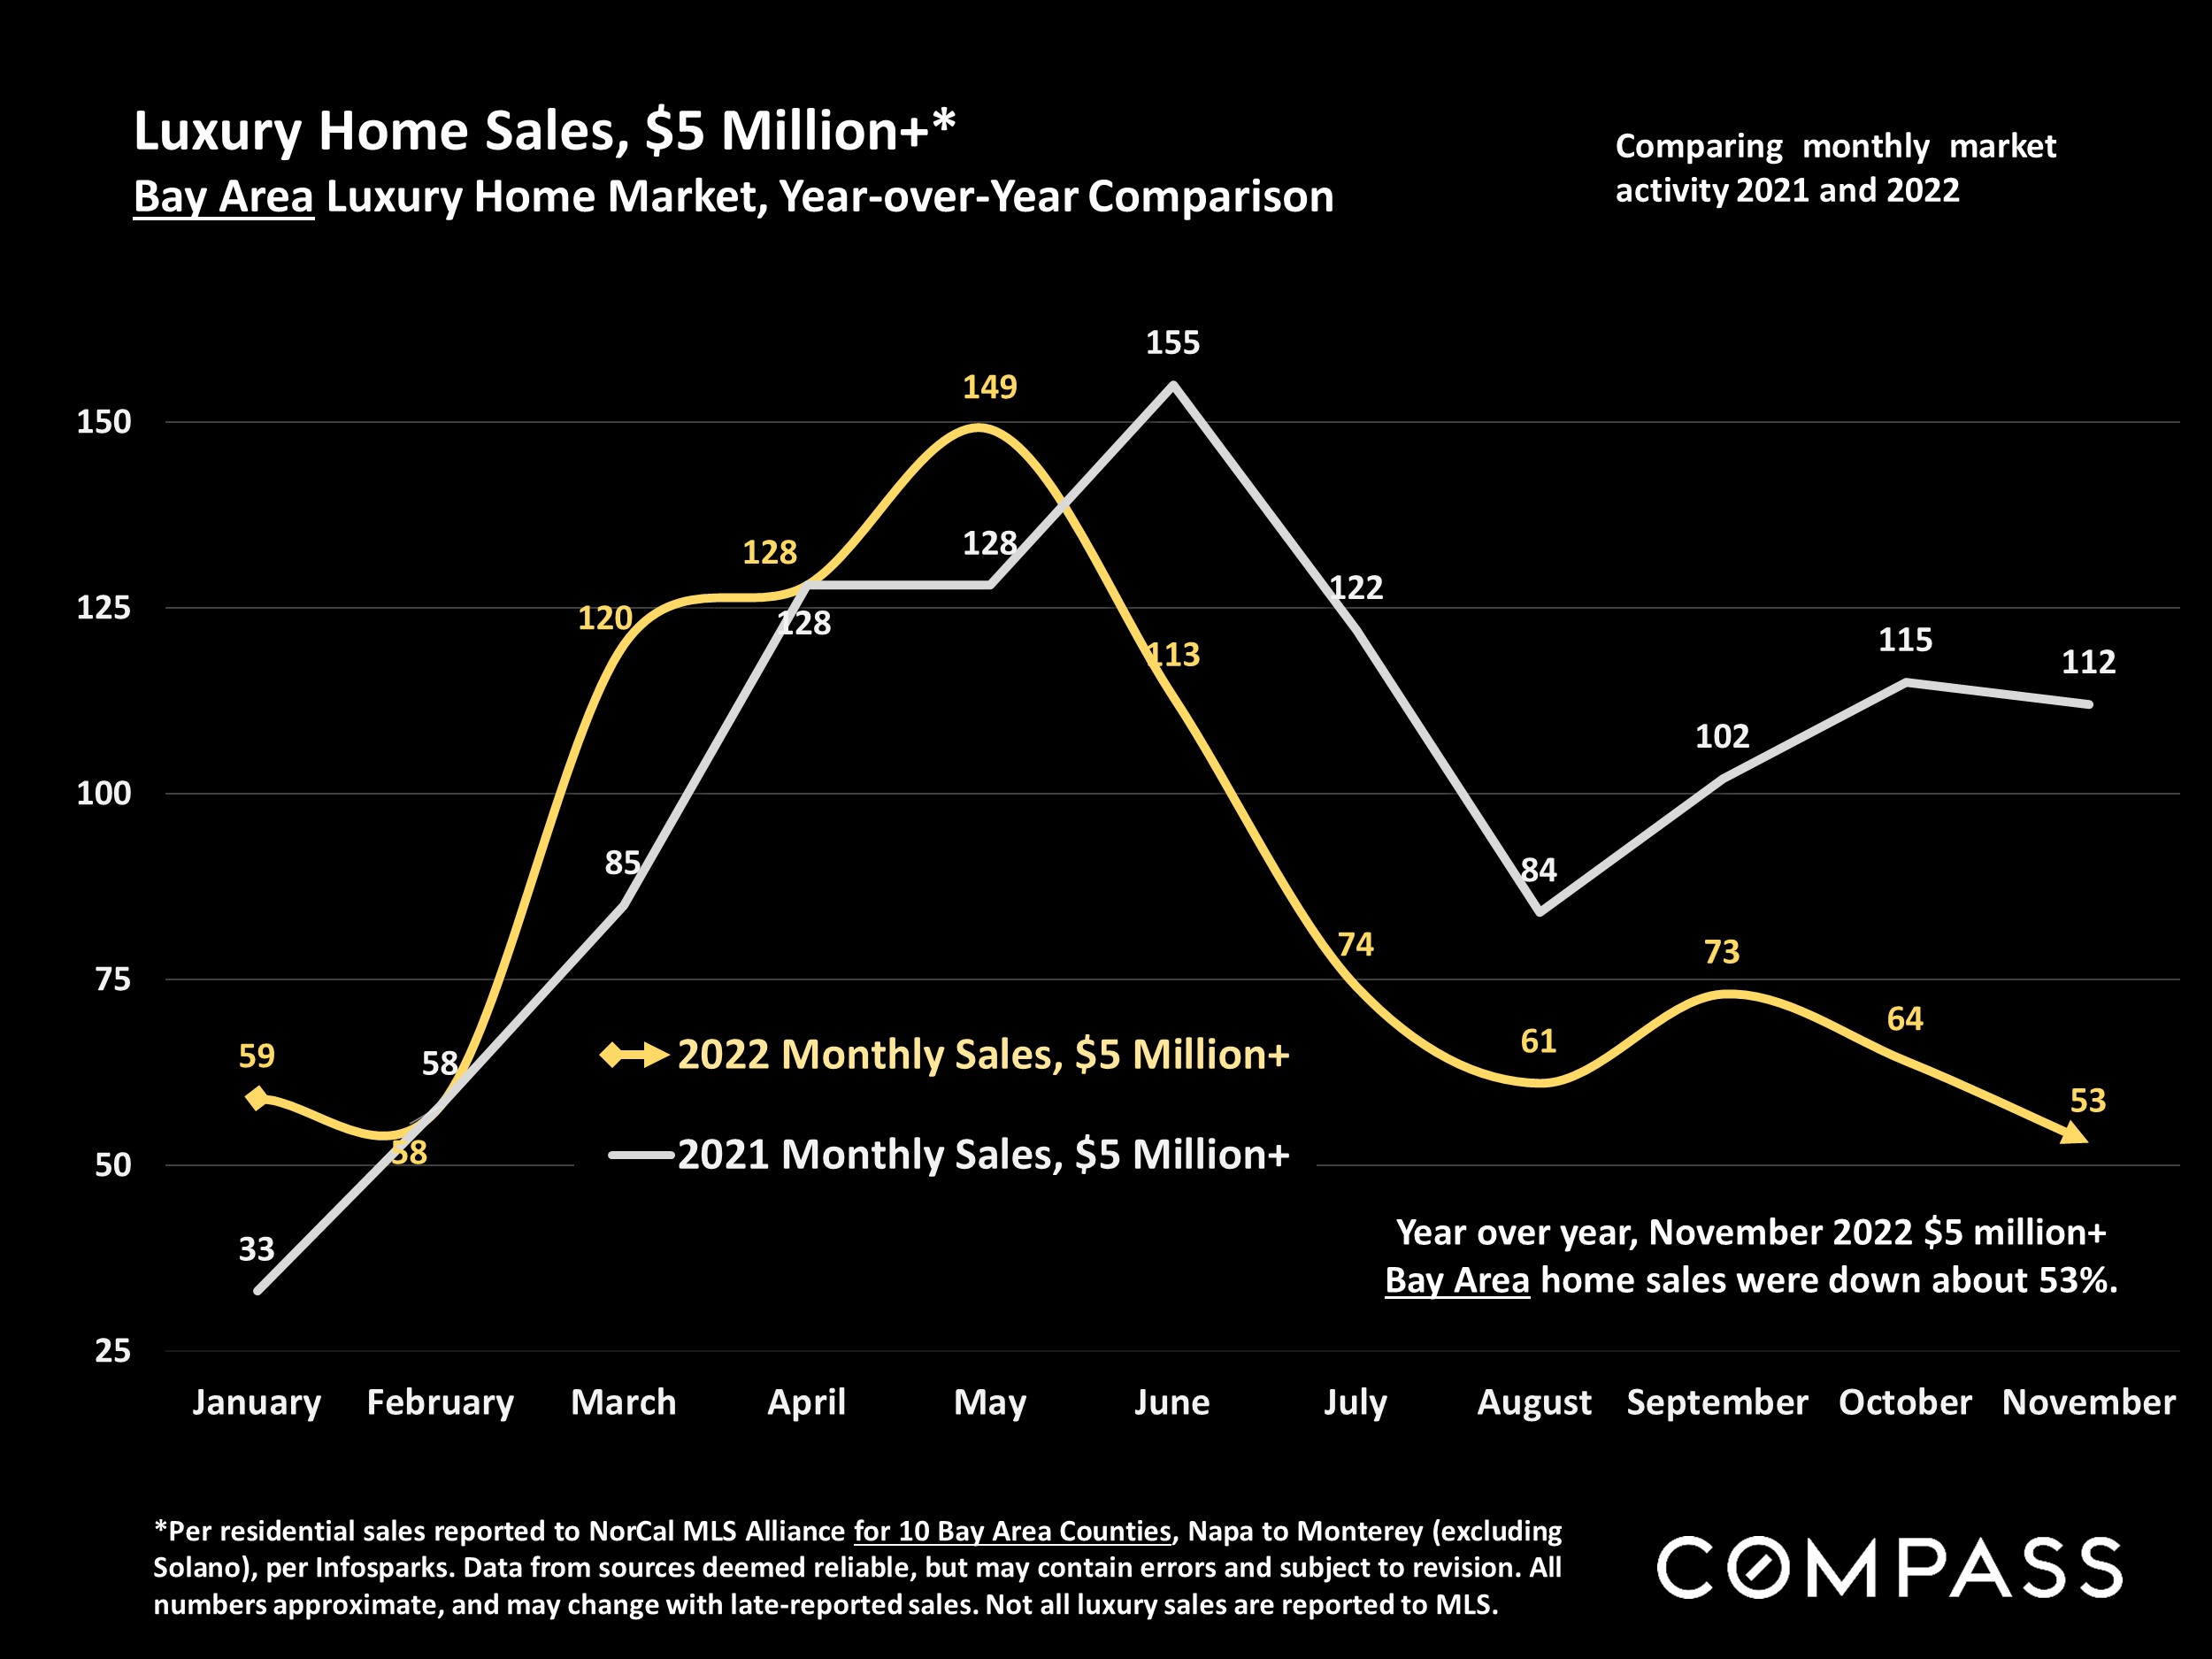
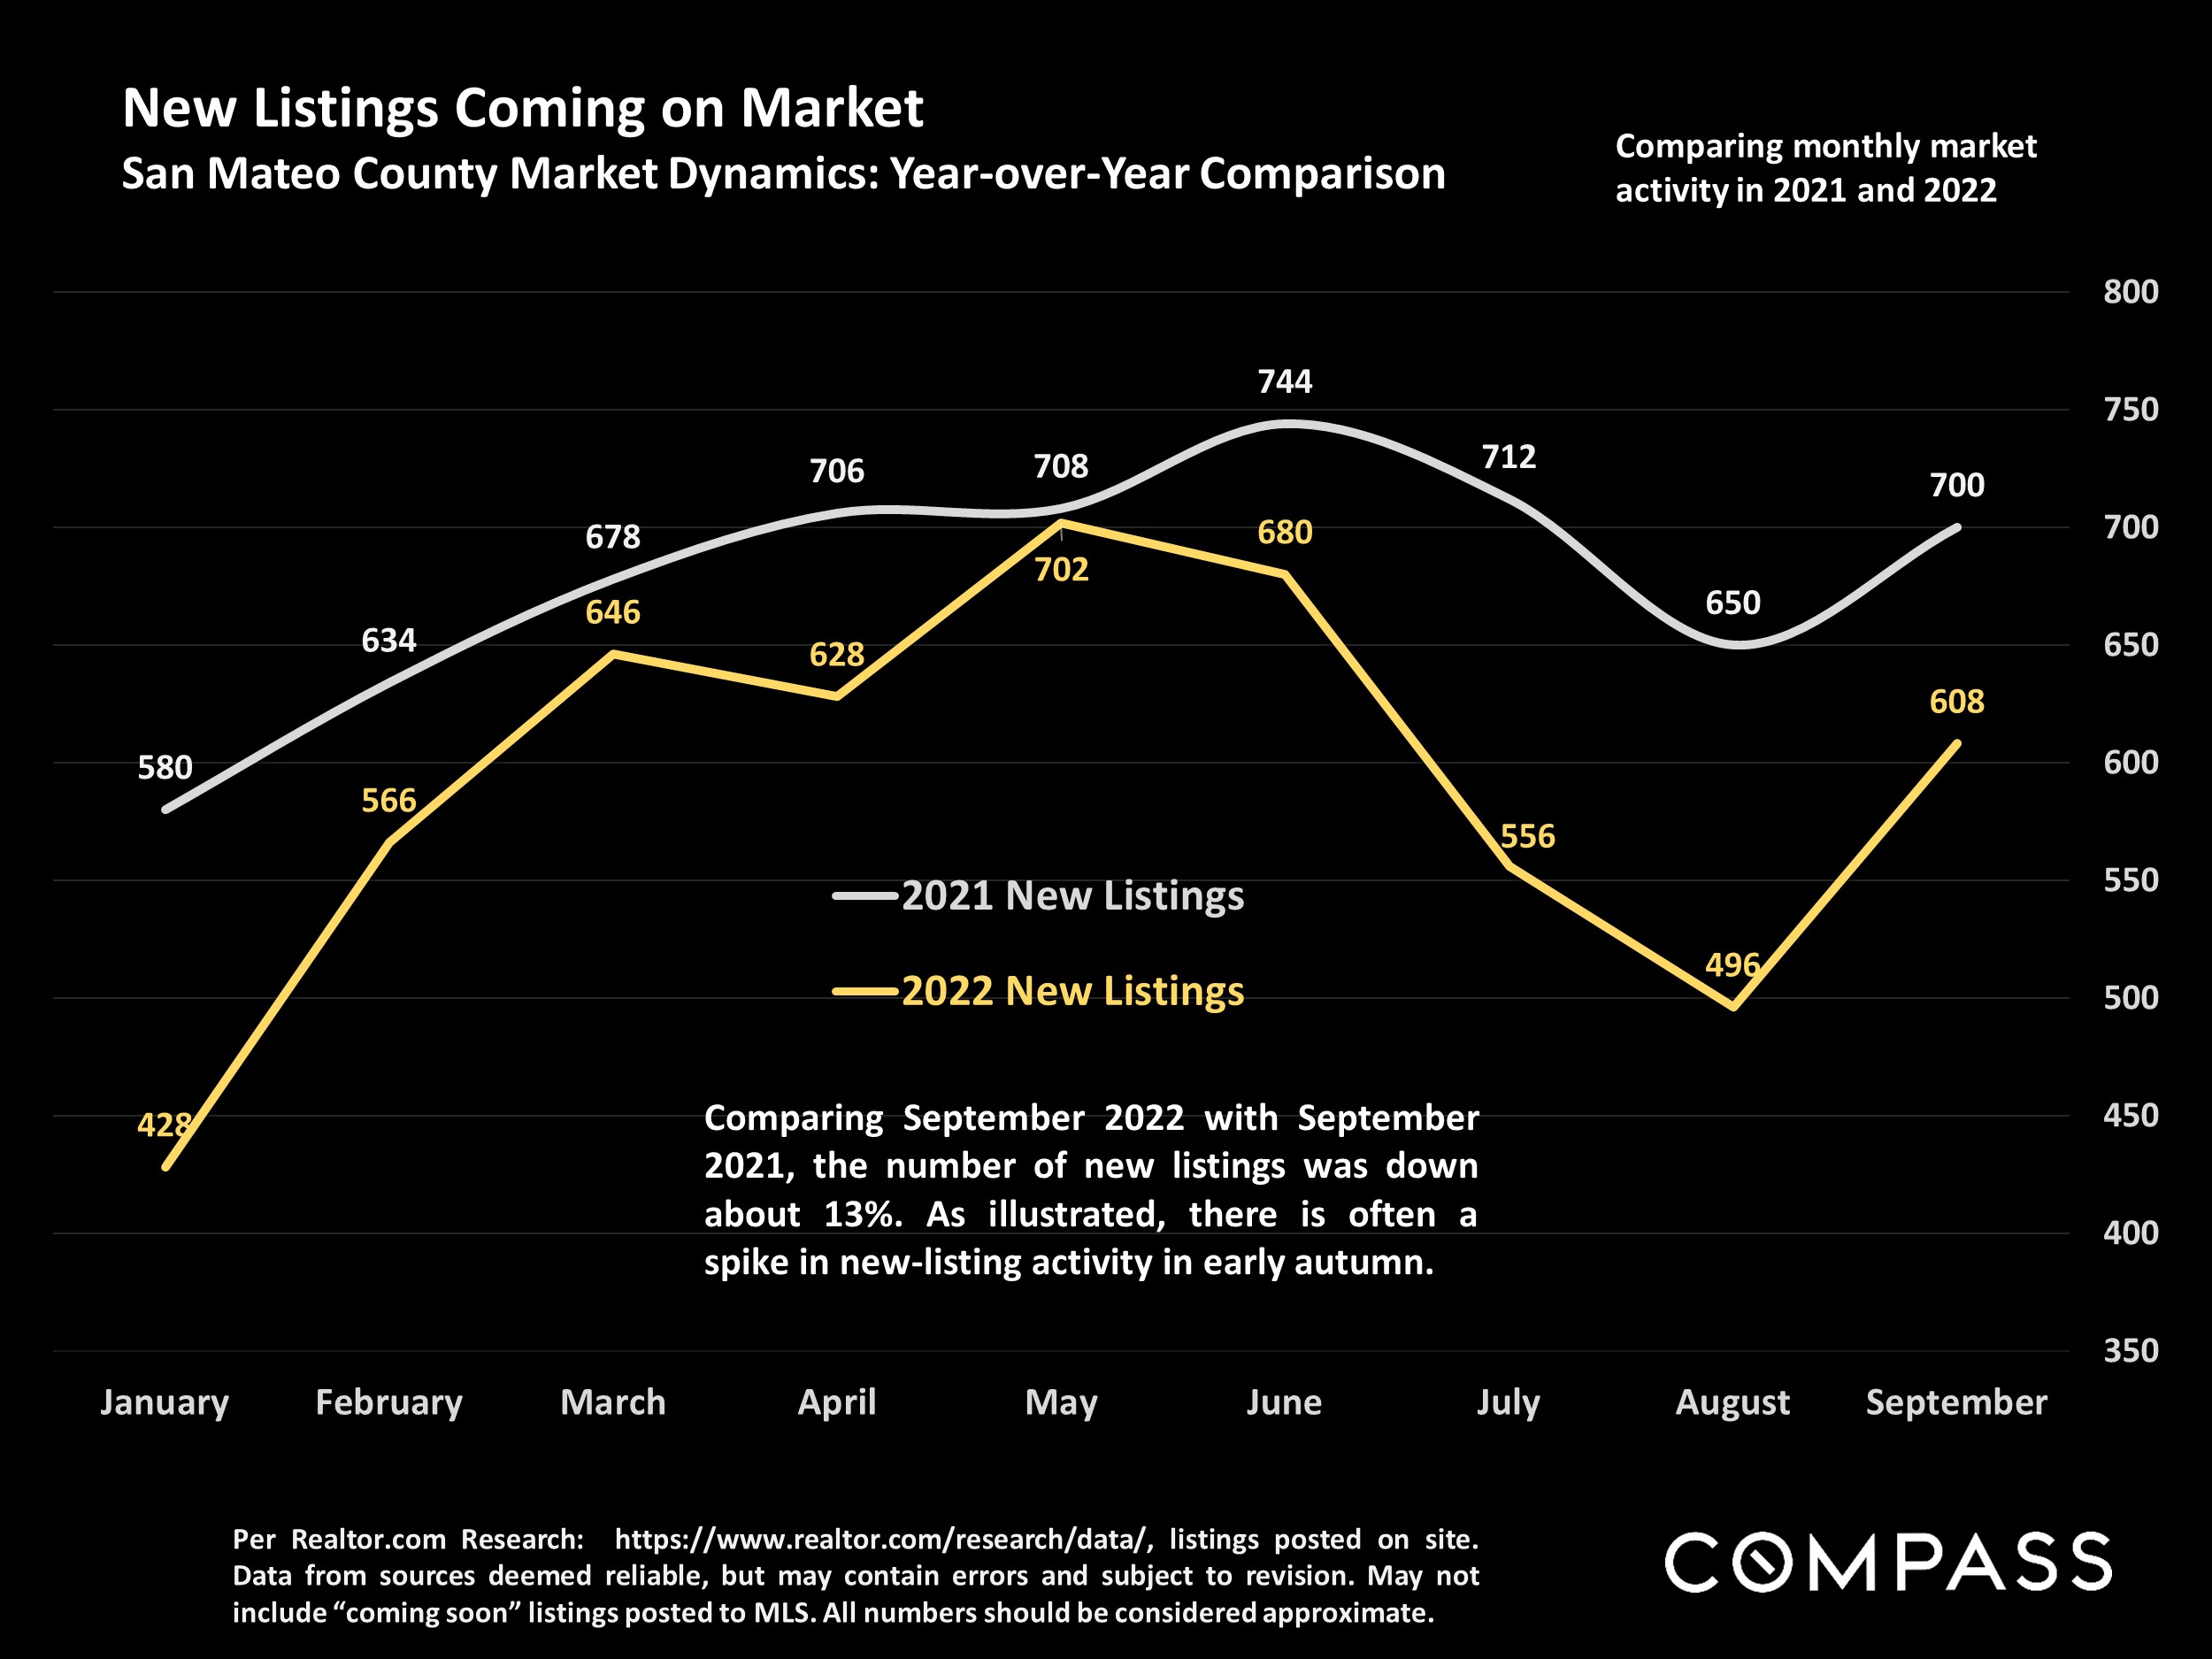
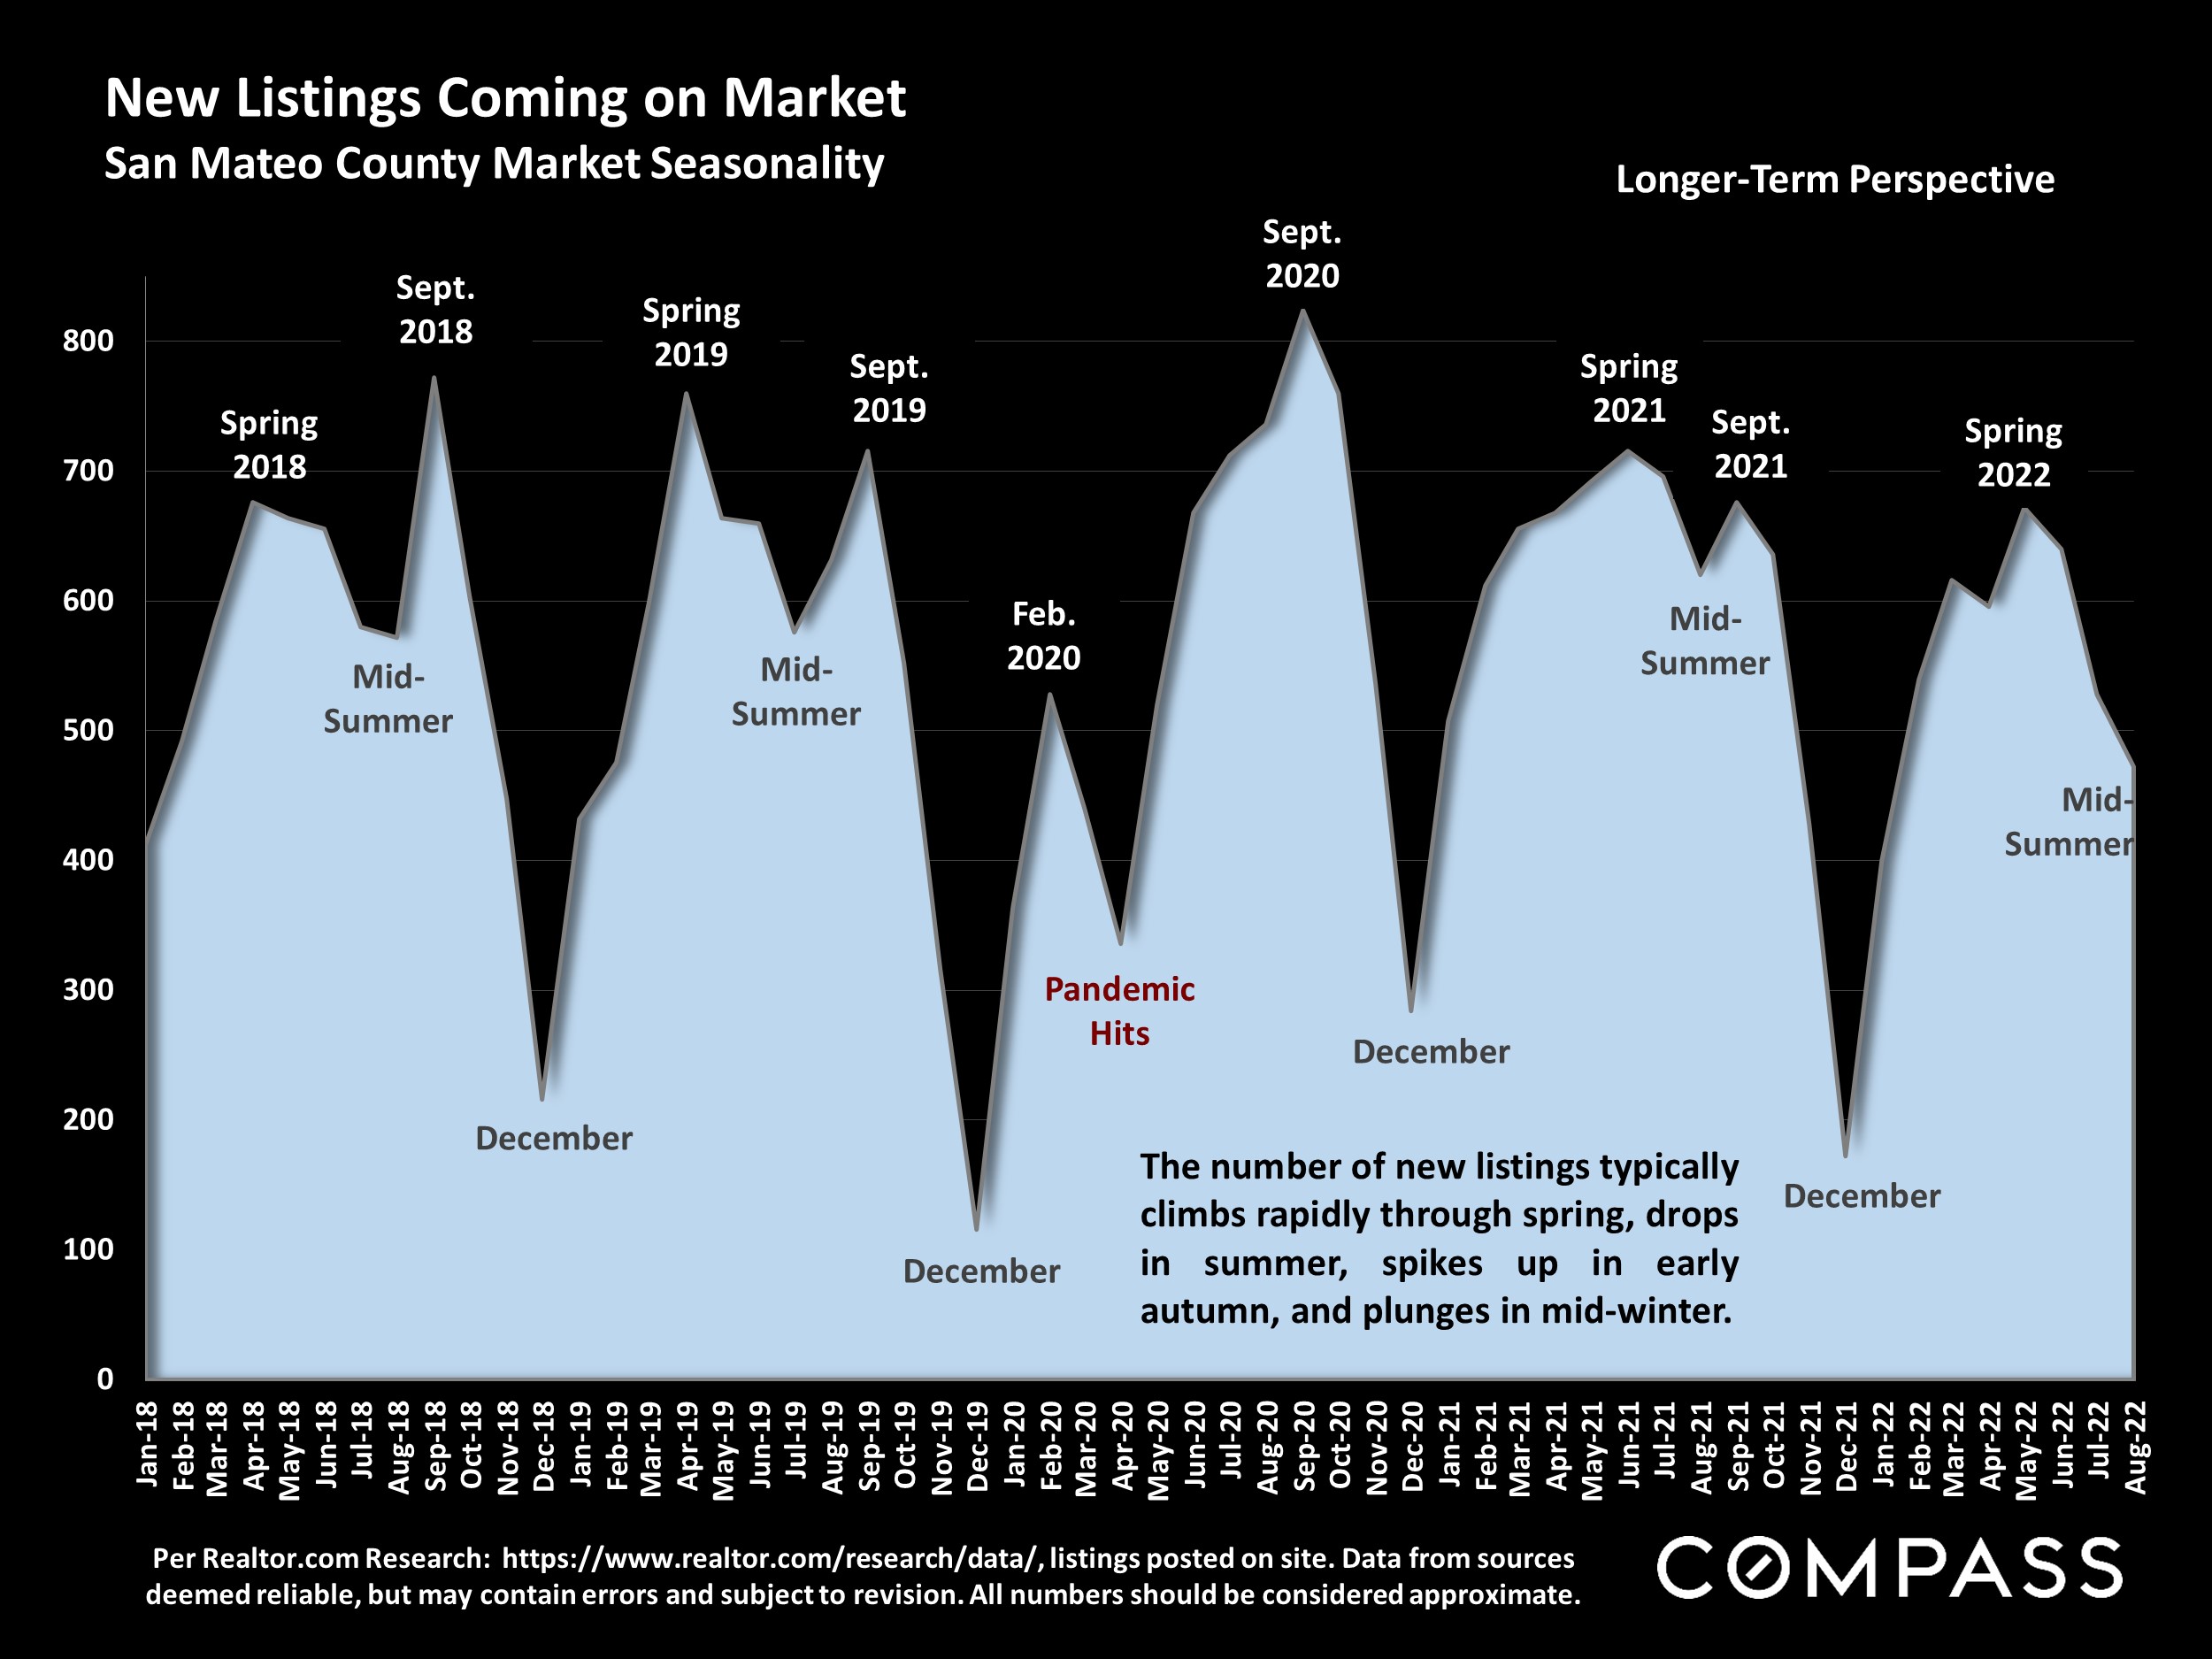
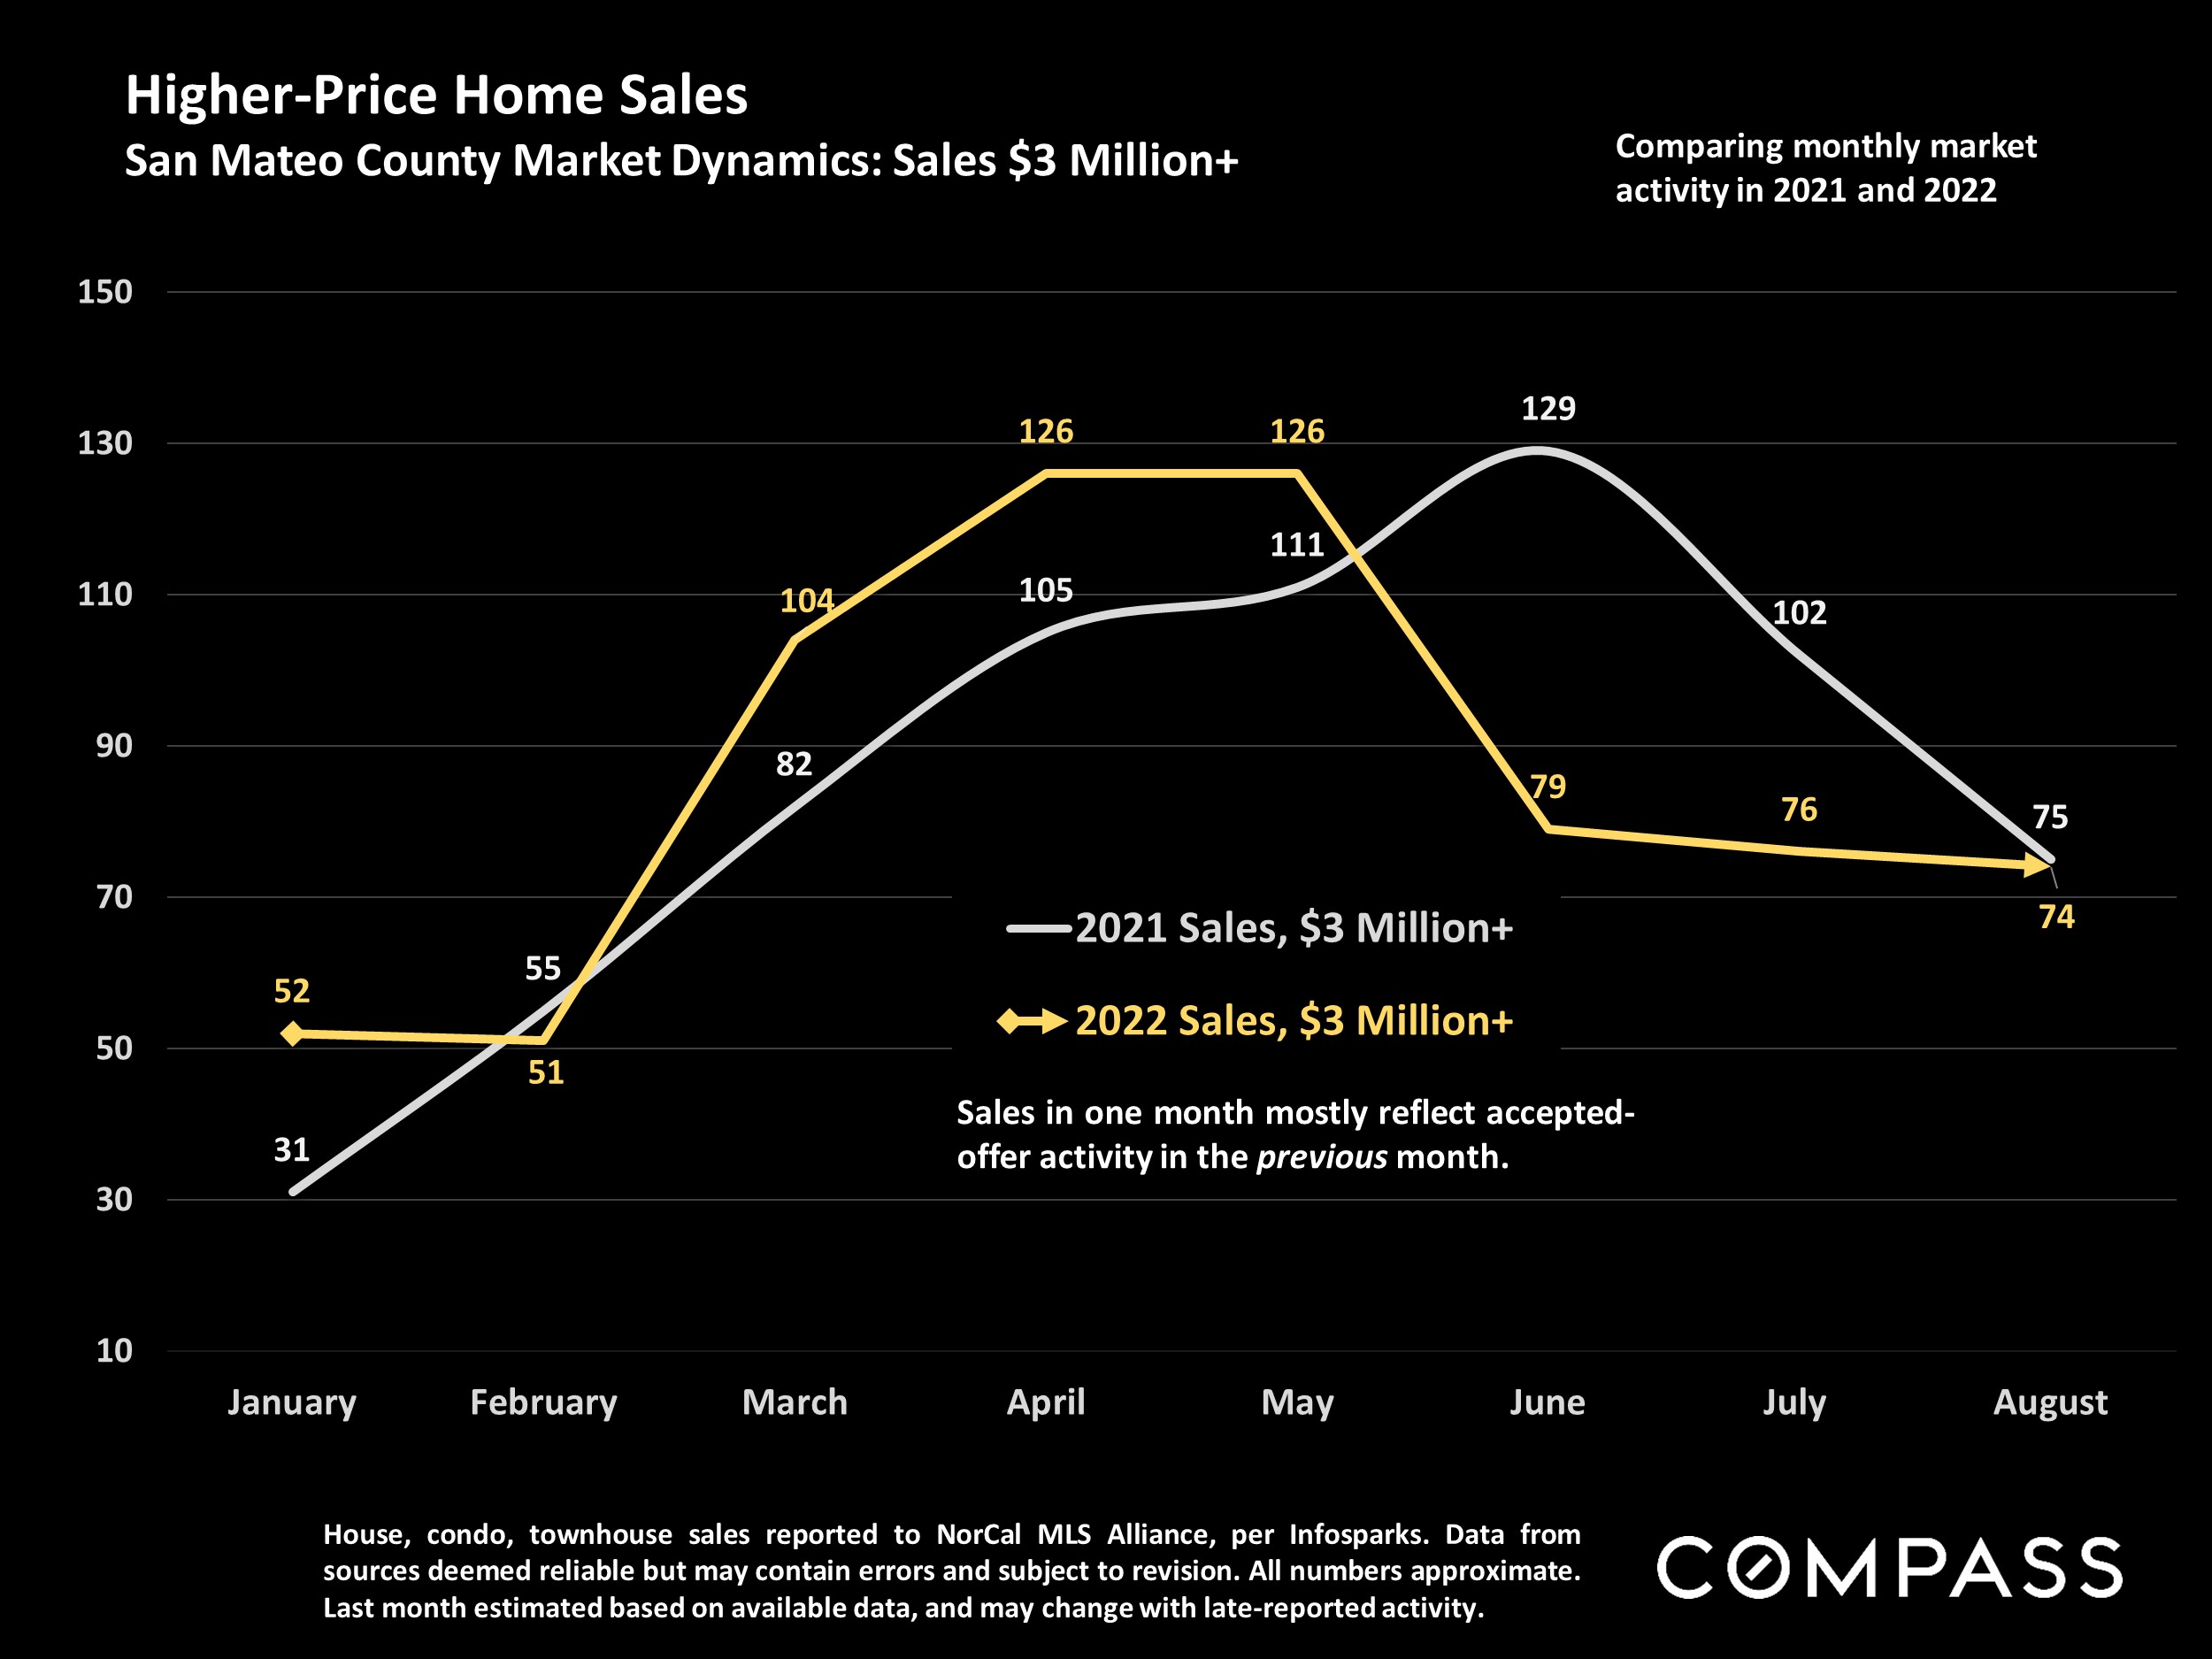
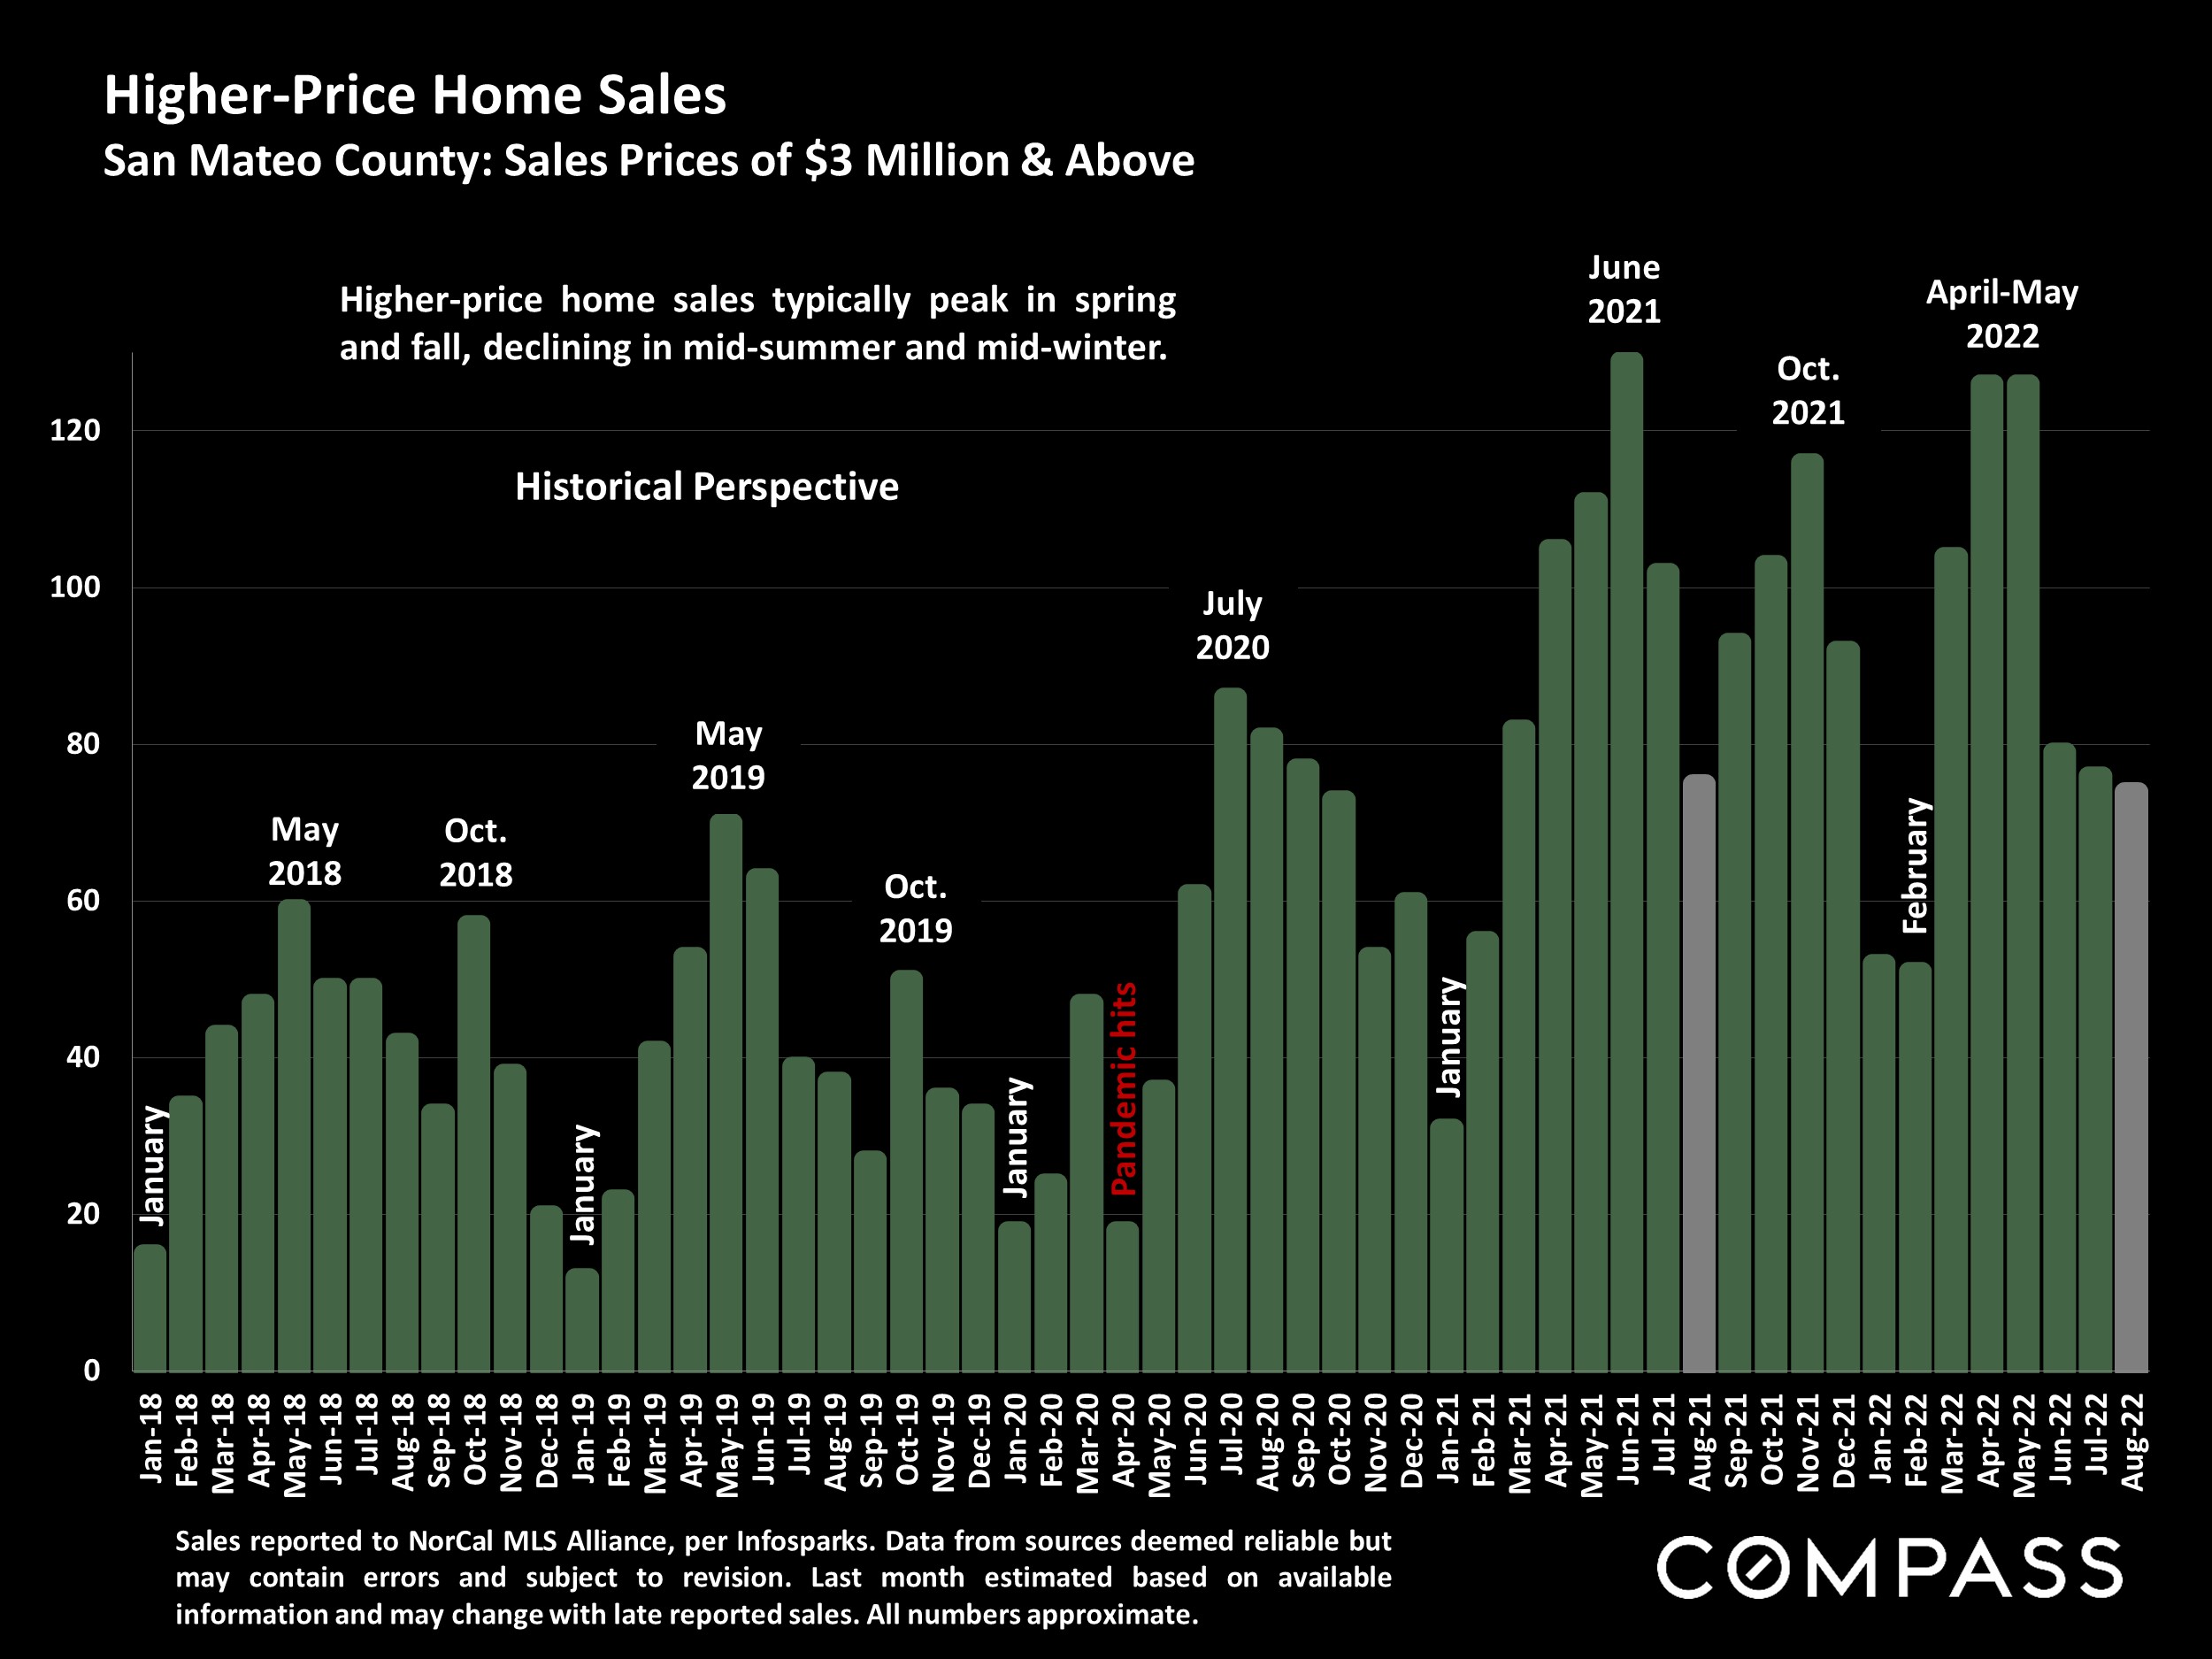
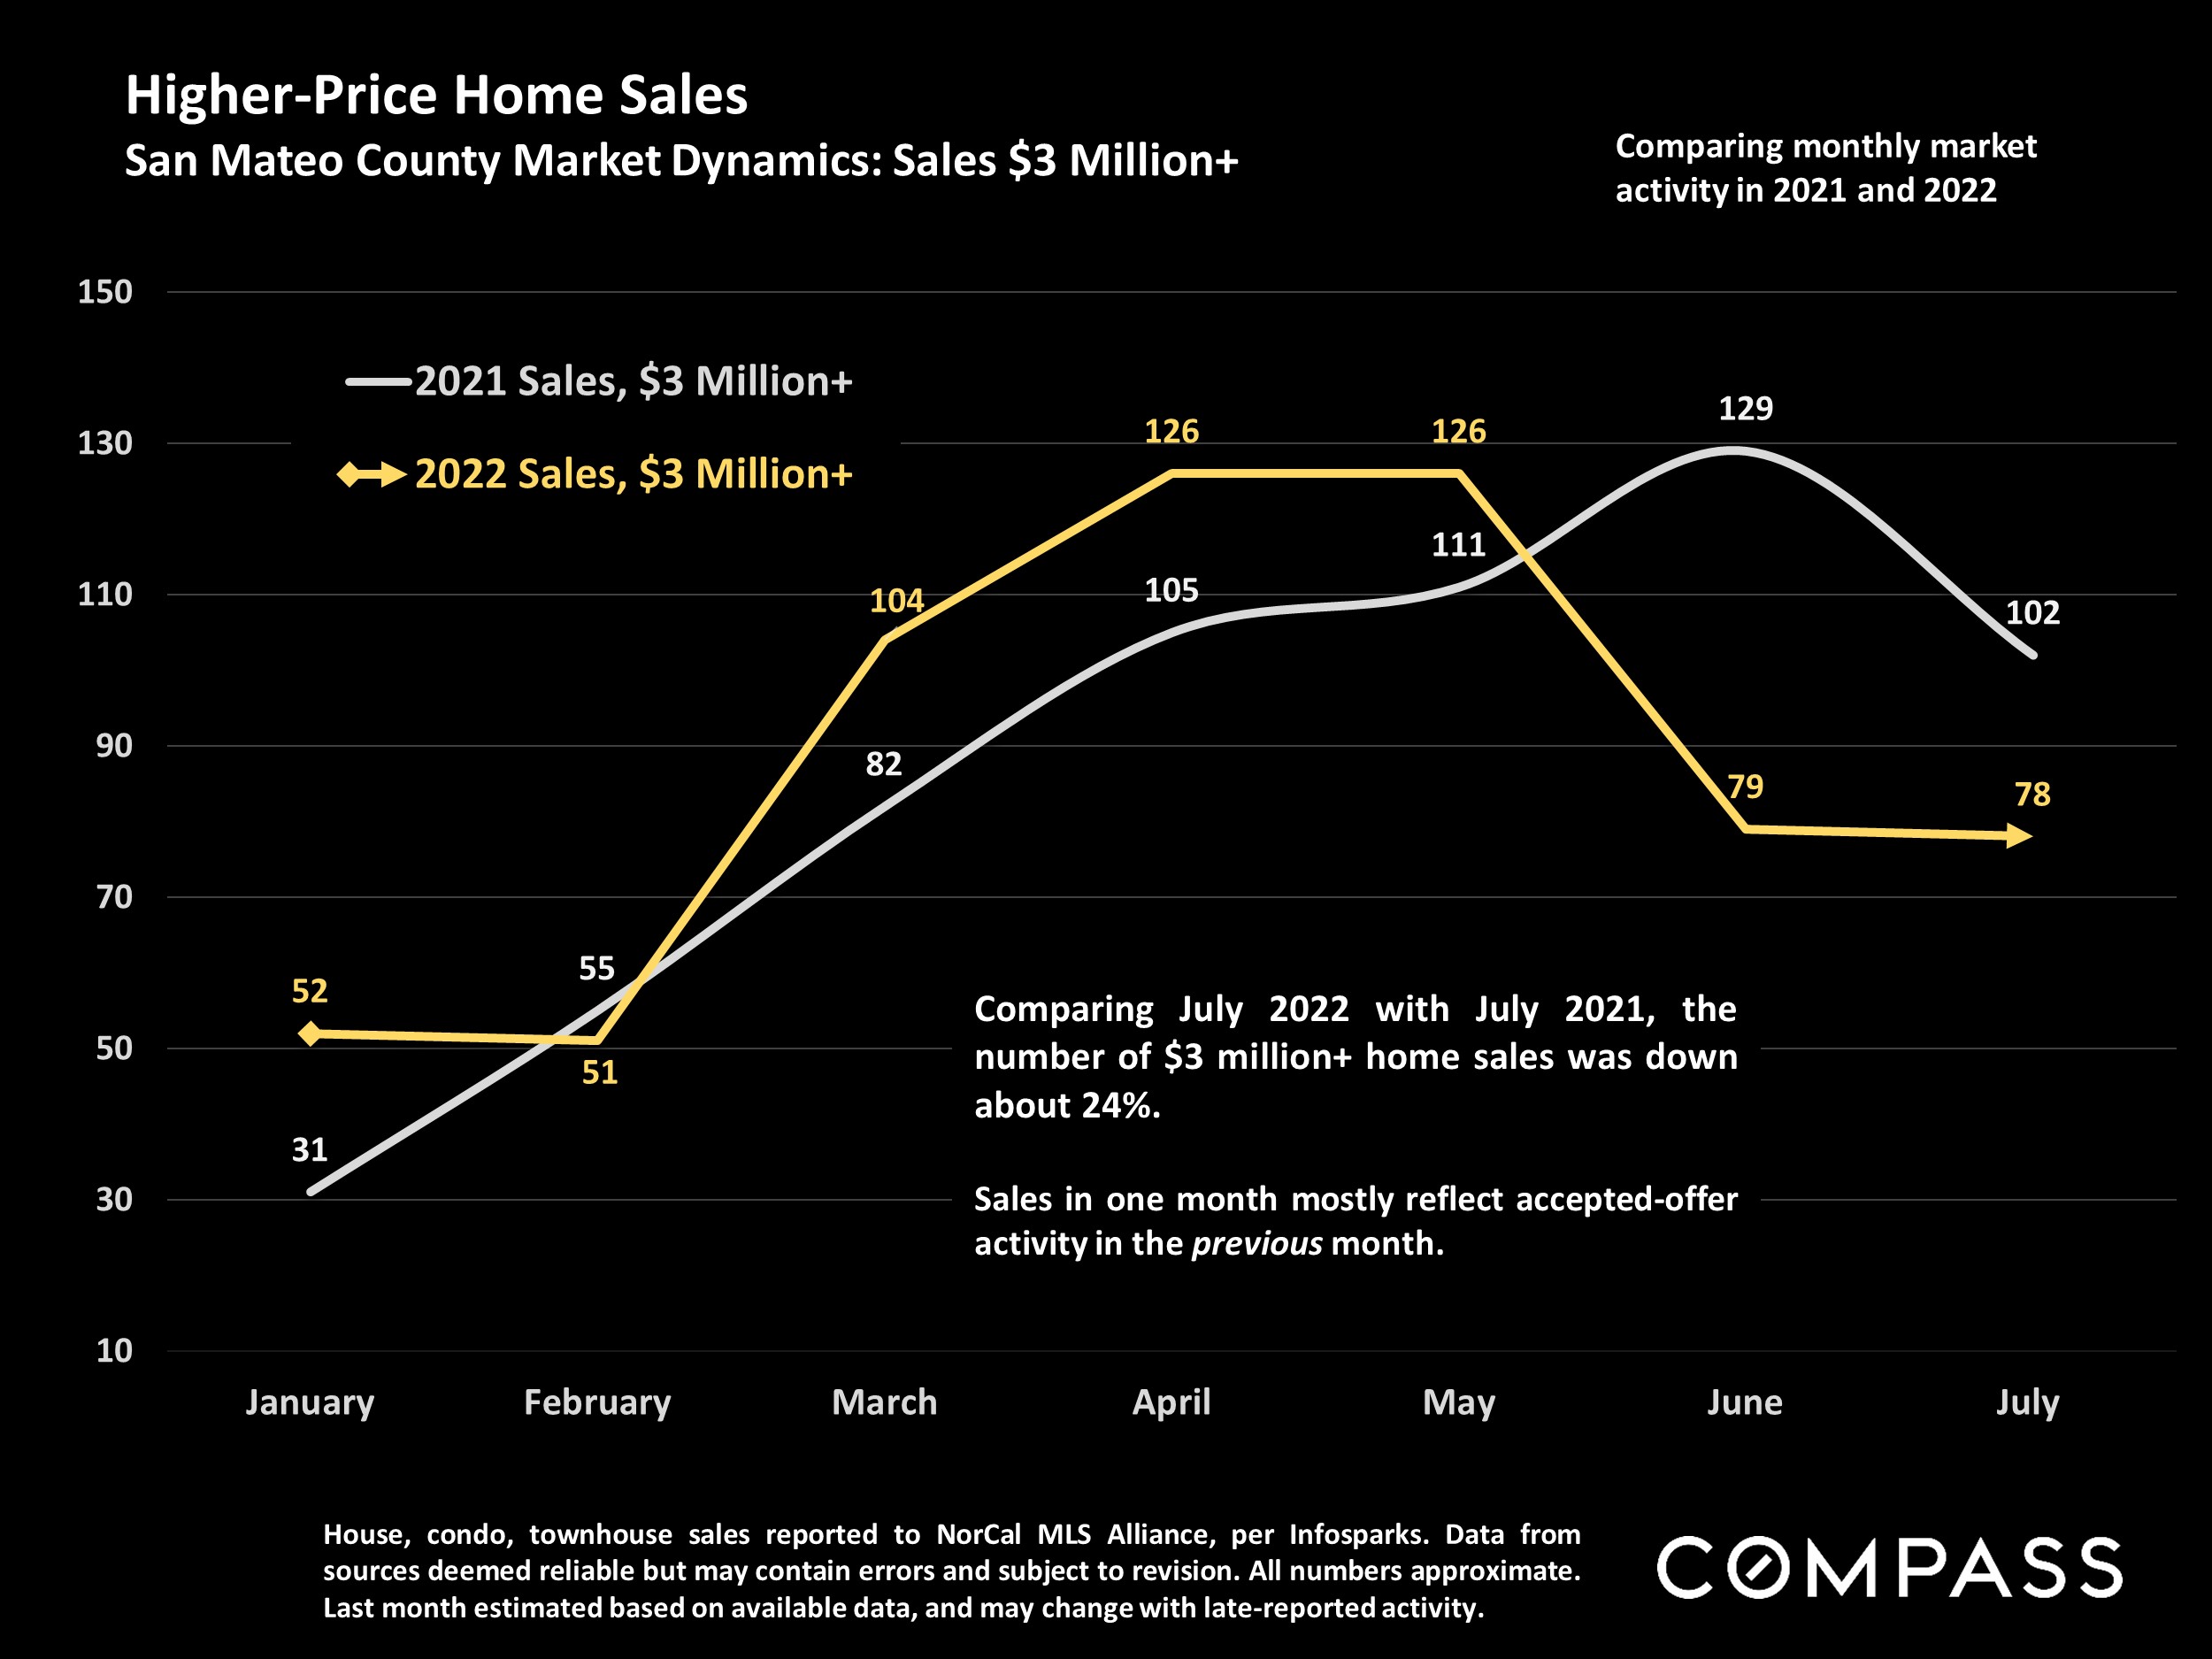
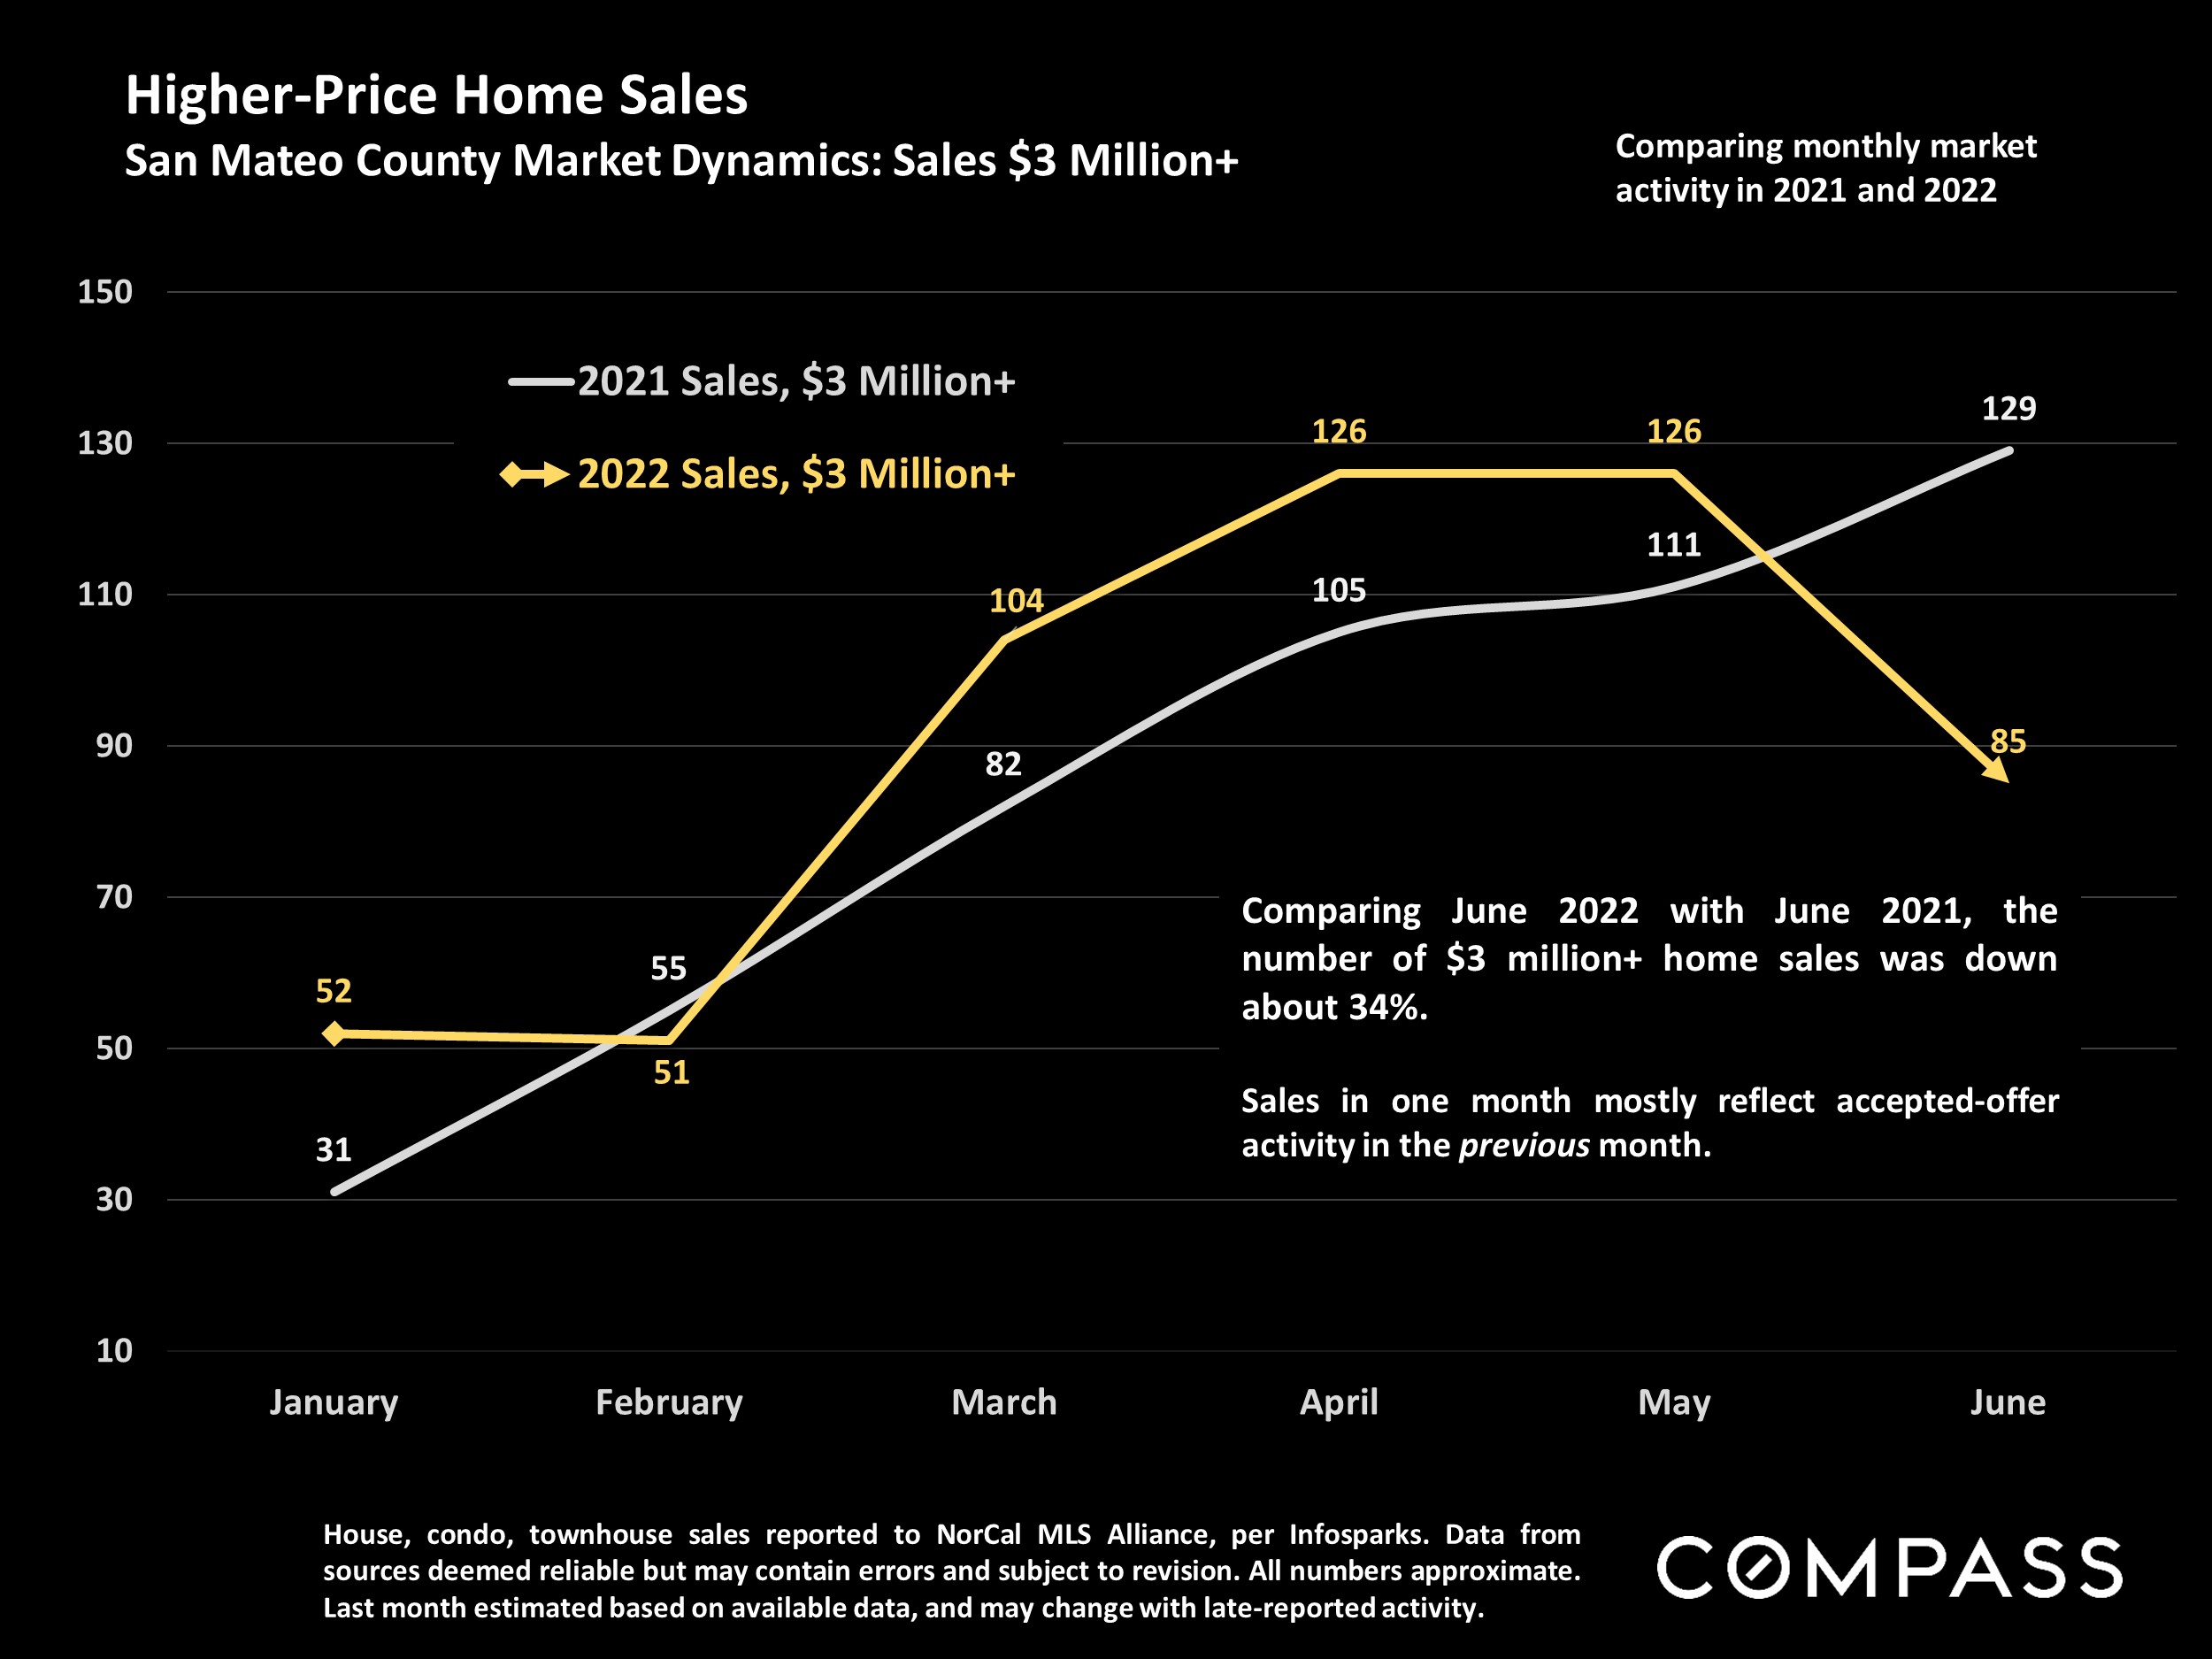
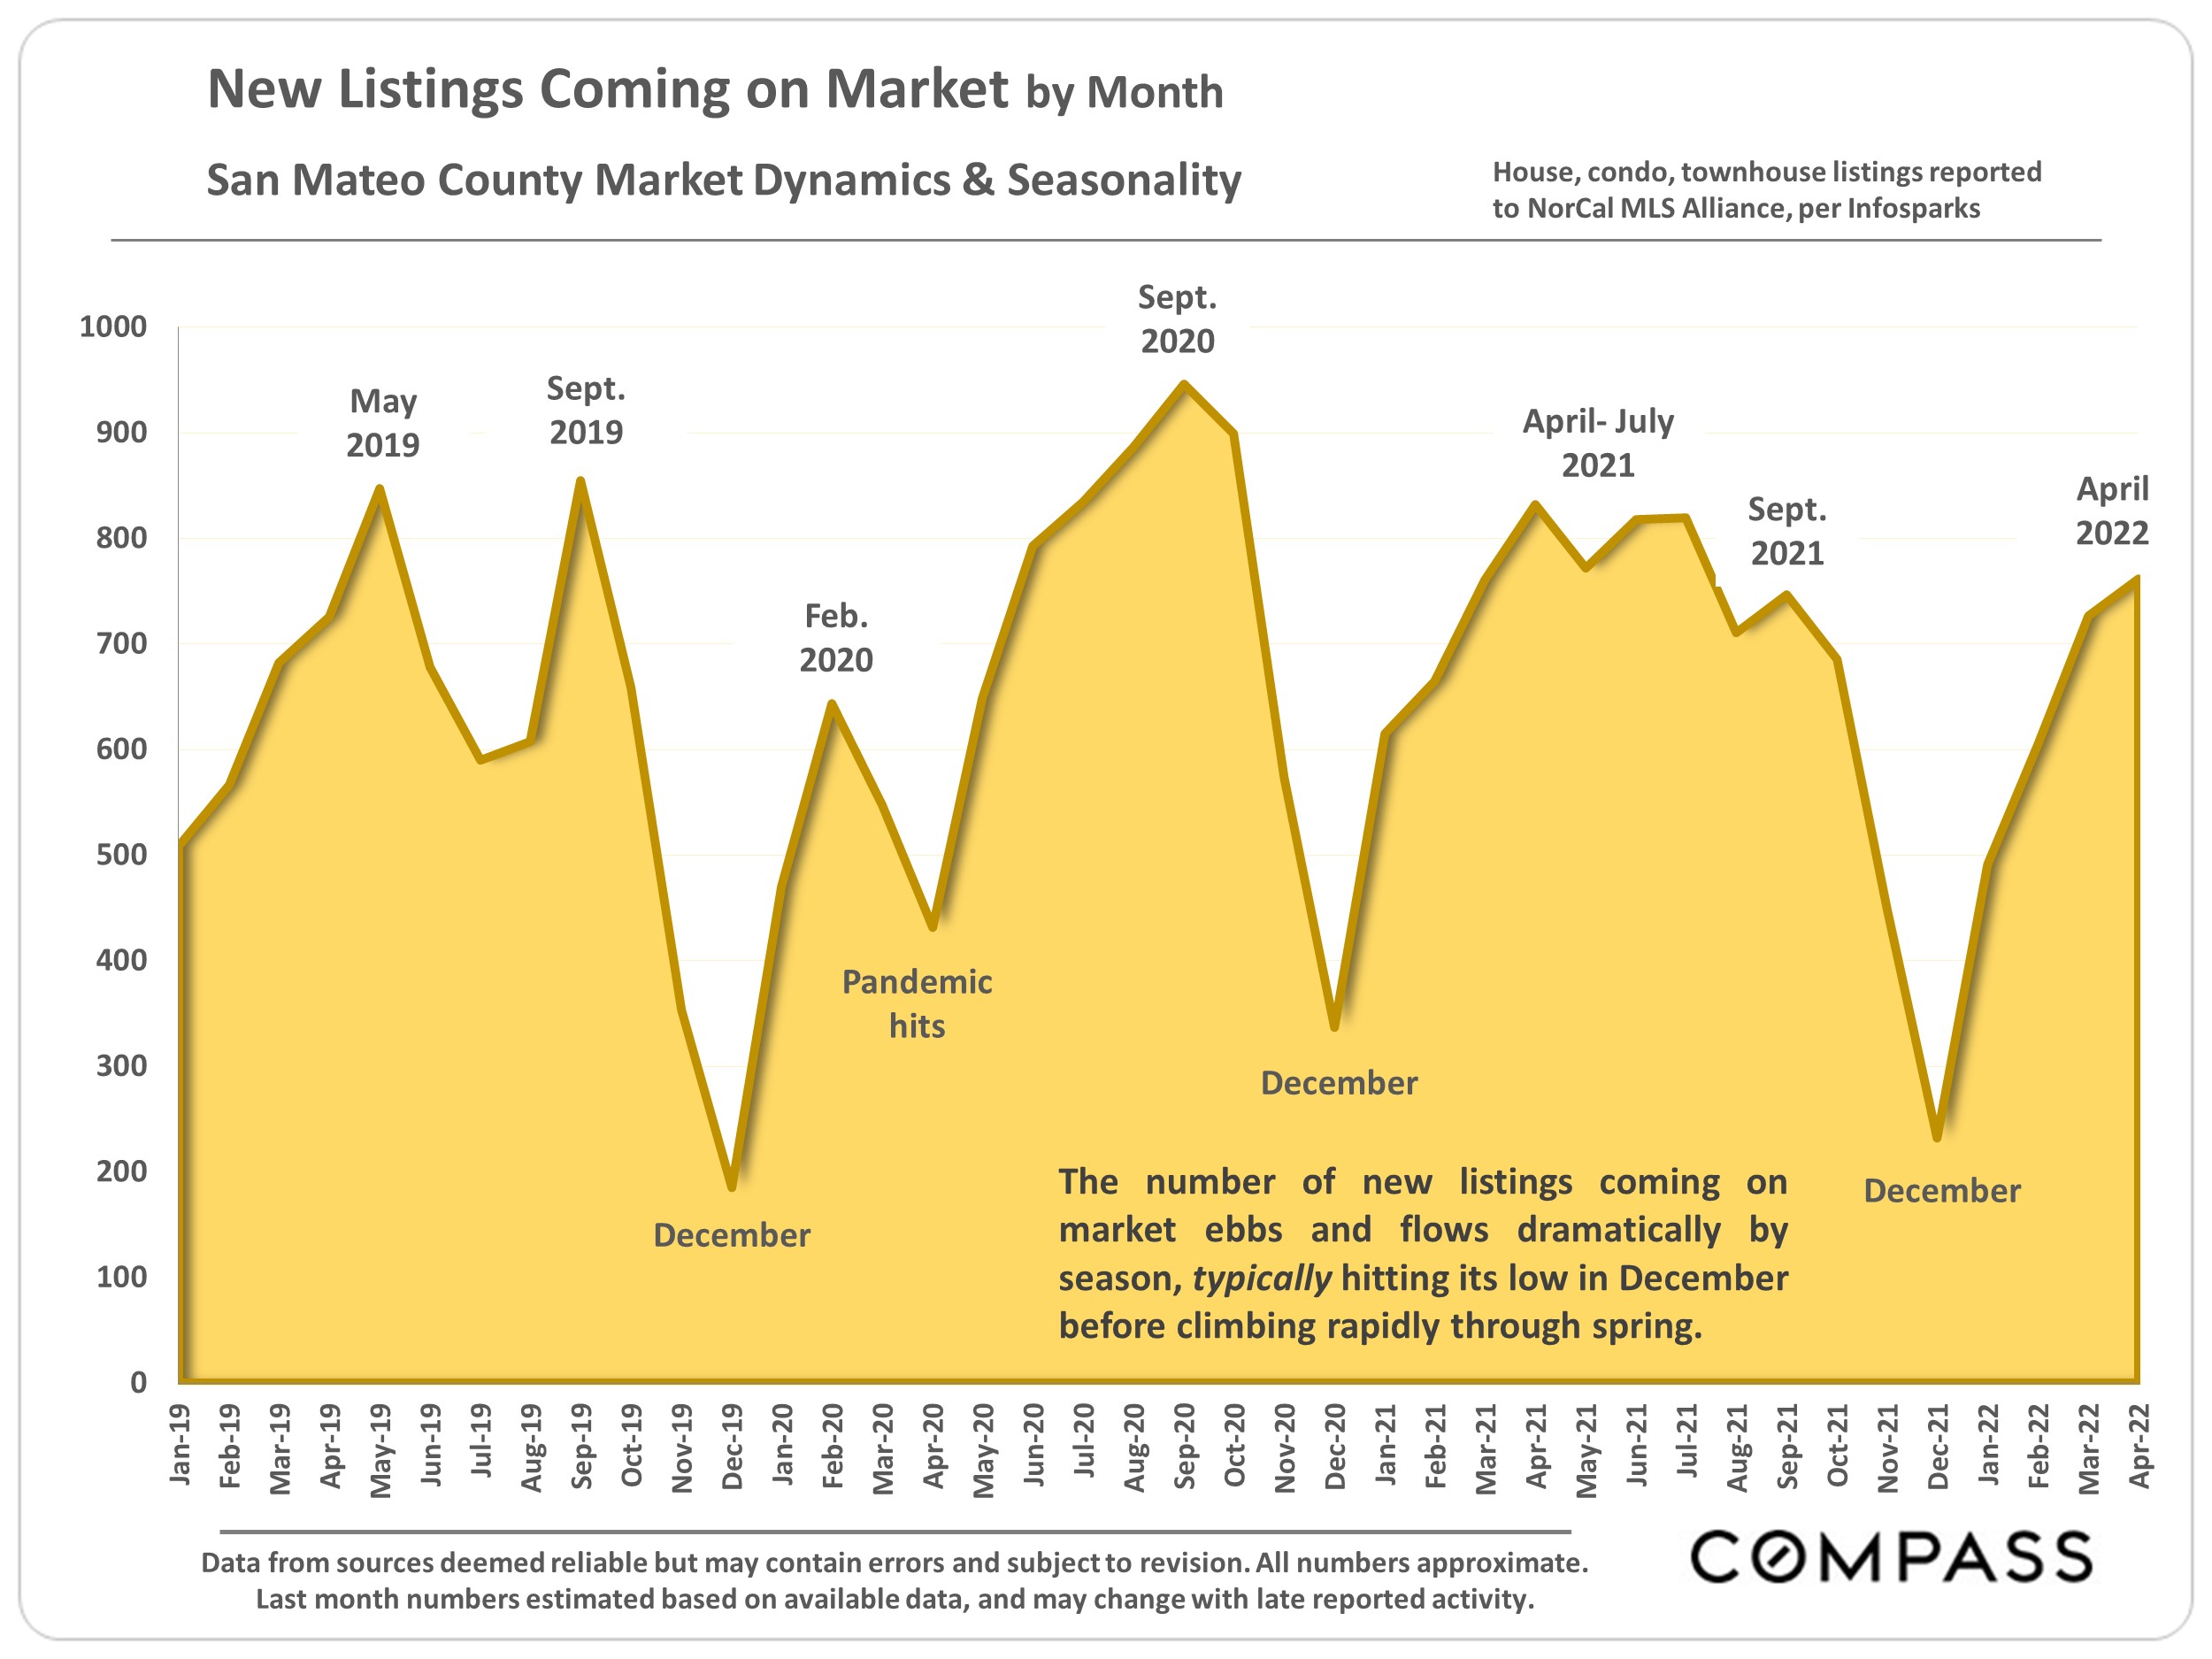
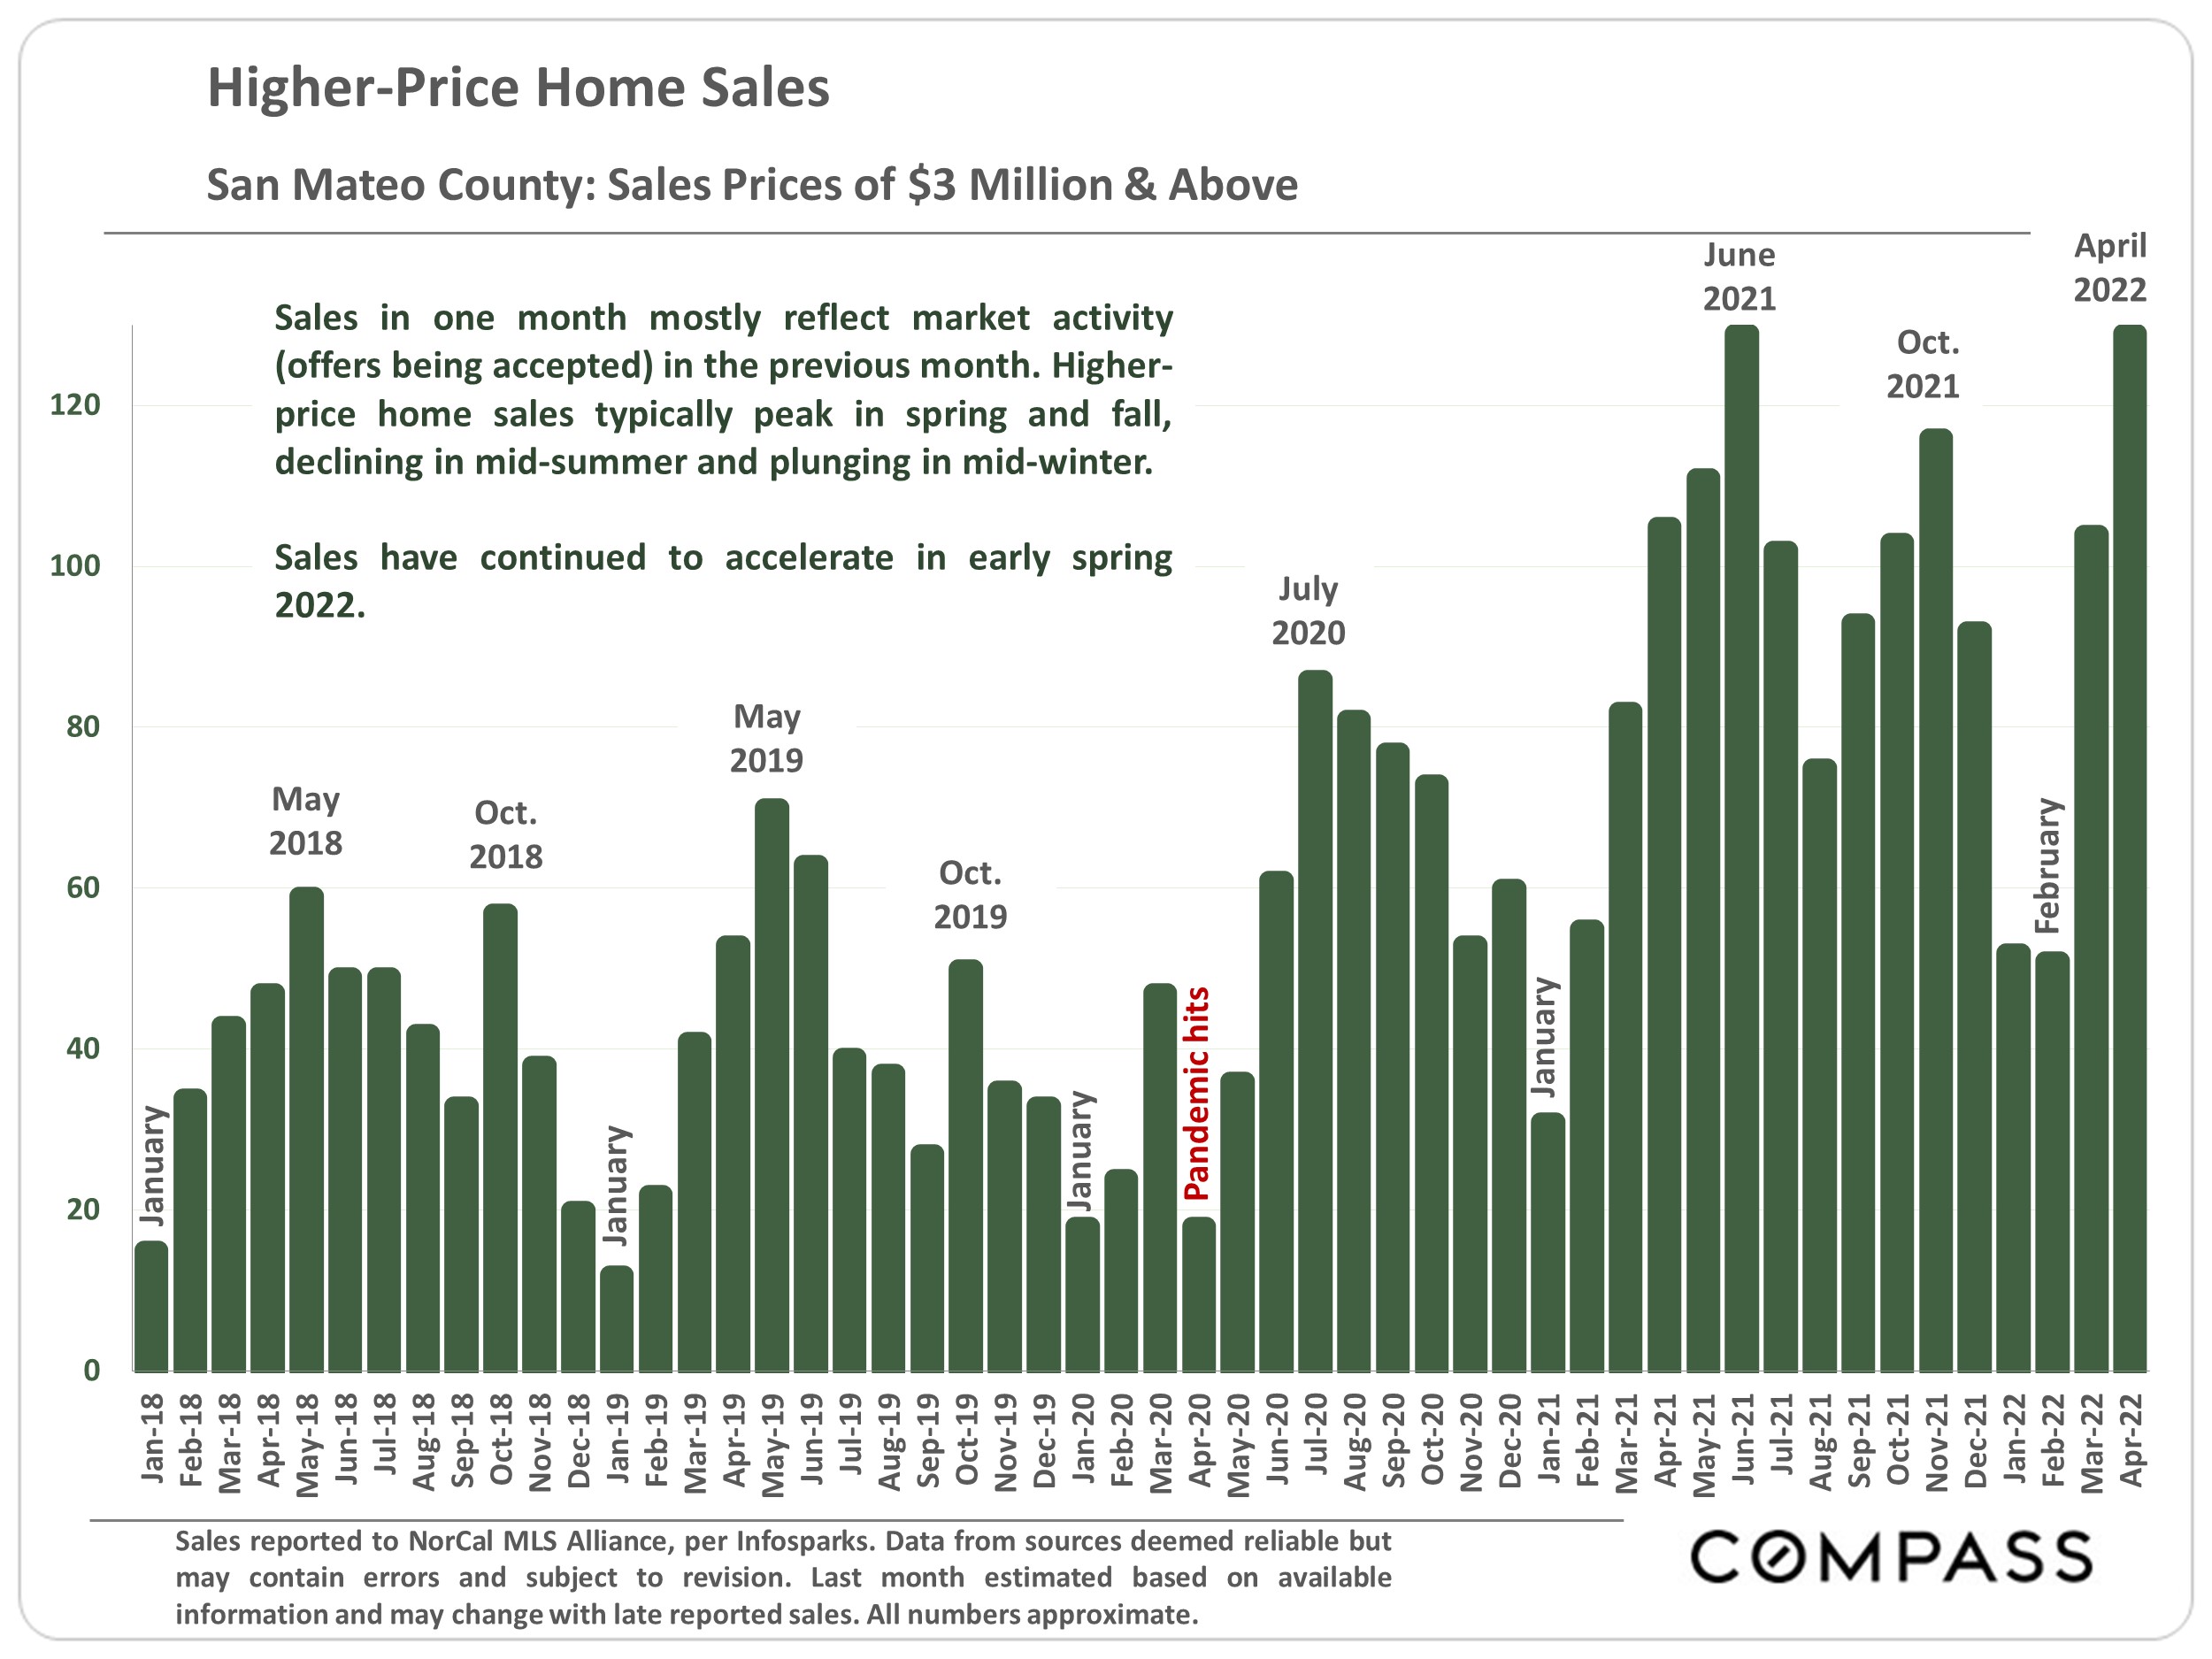
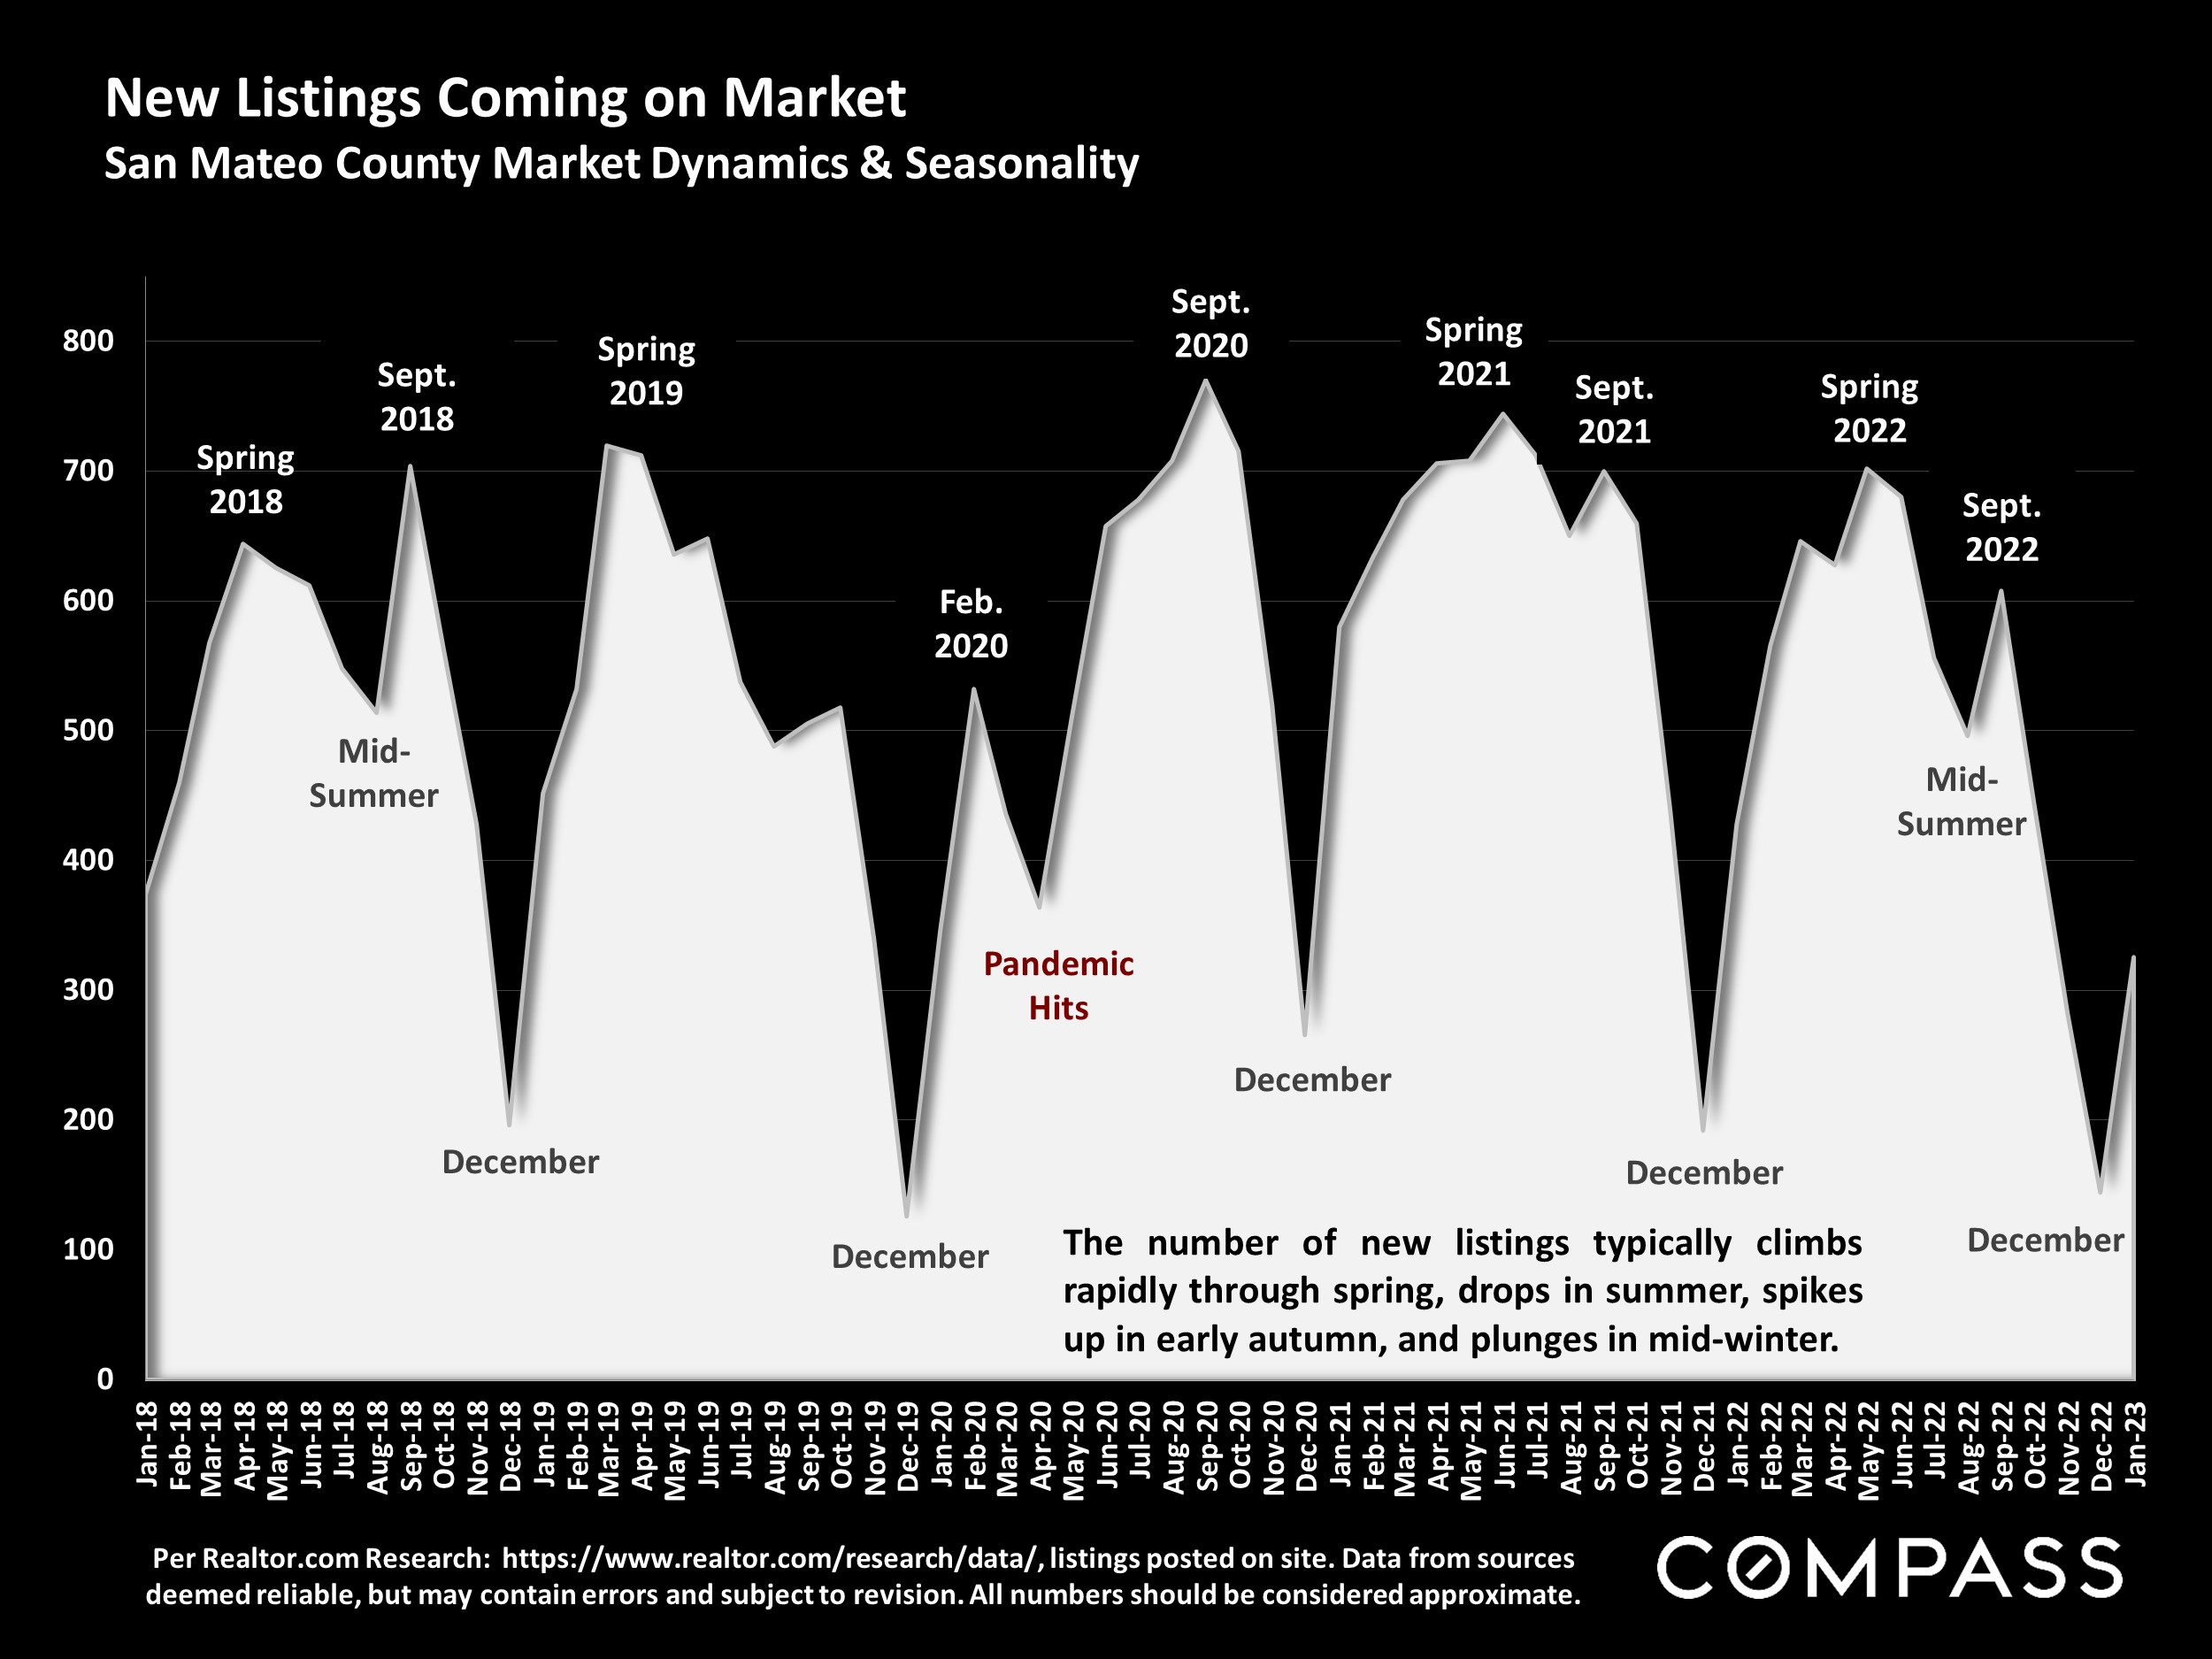
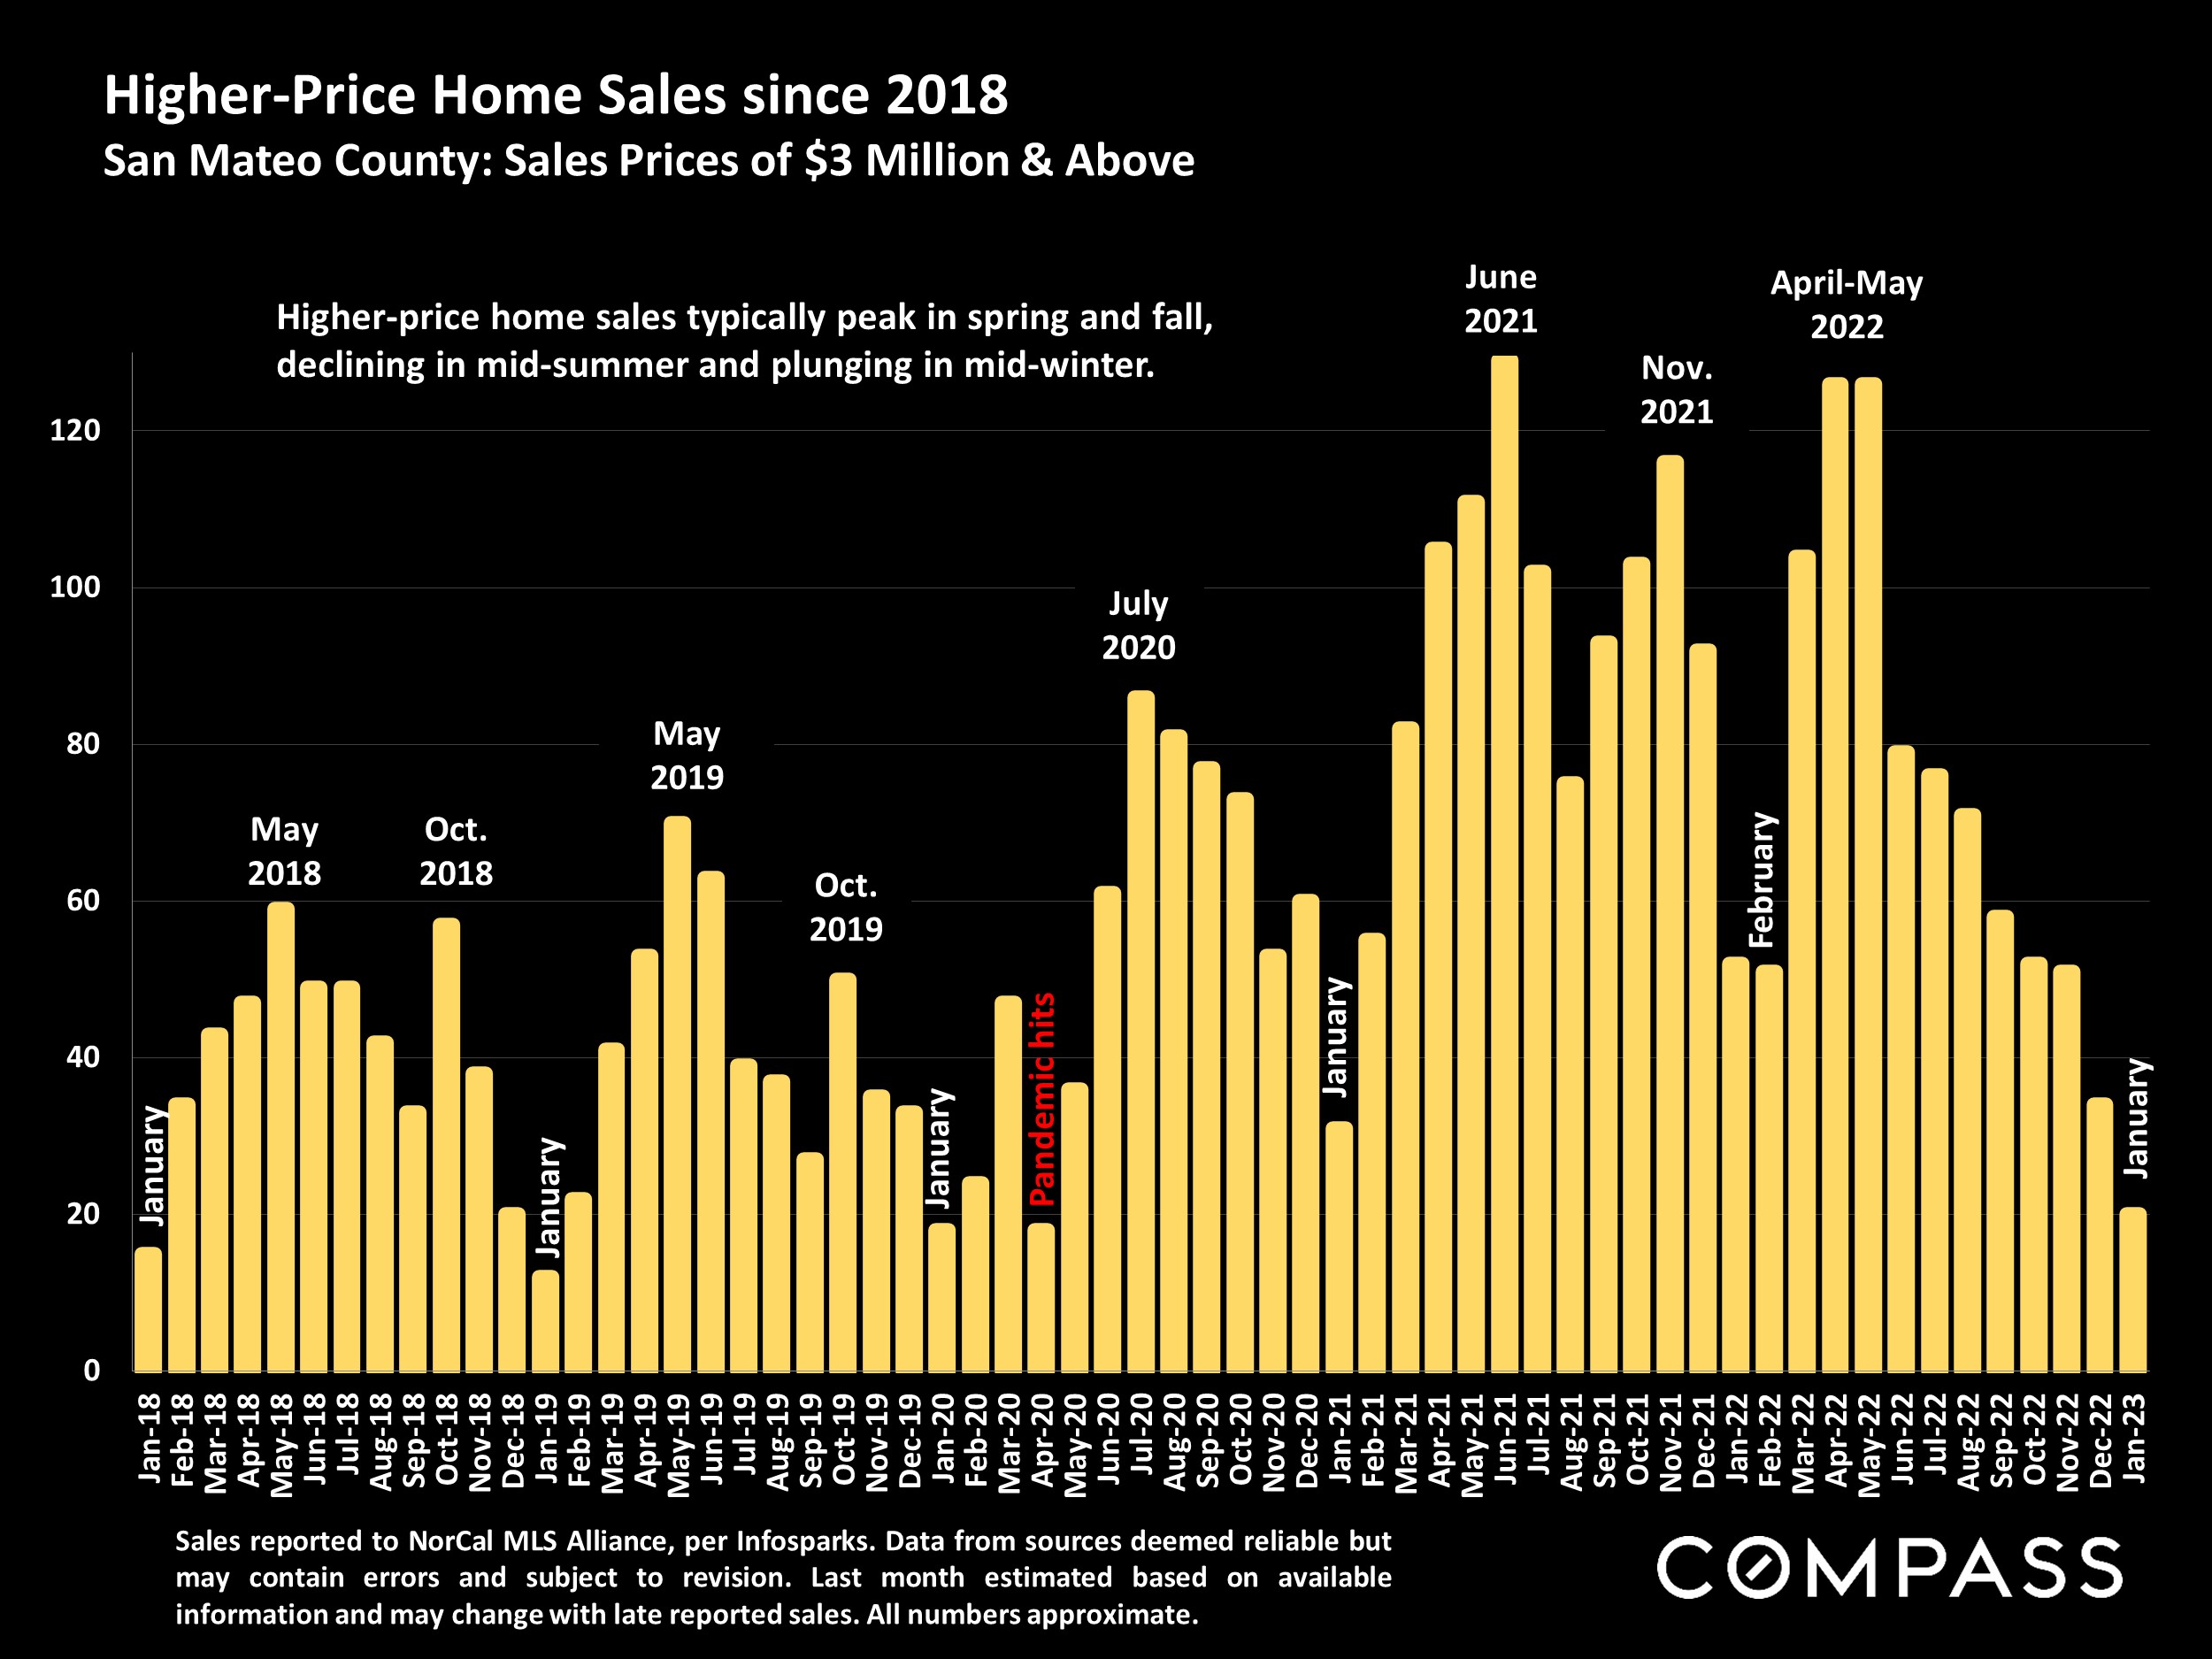
The “spring market,” which can begin as early as February in the Bay Area, is typically the biggest selling season of the year, especially for luxury homes, and more data regarding new listings coming on market, listings going into contract, sales volumes, speed of sale, overbidding and sales prices will soon become available.*
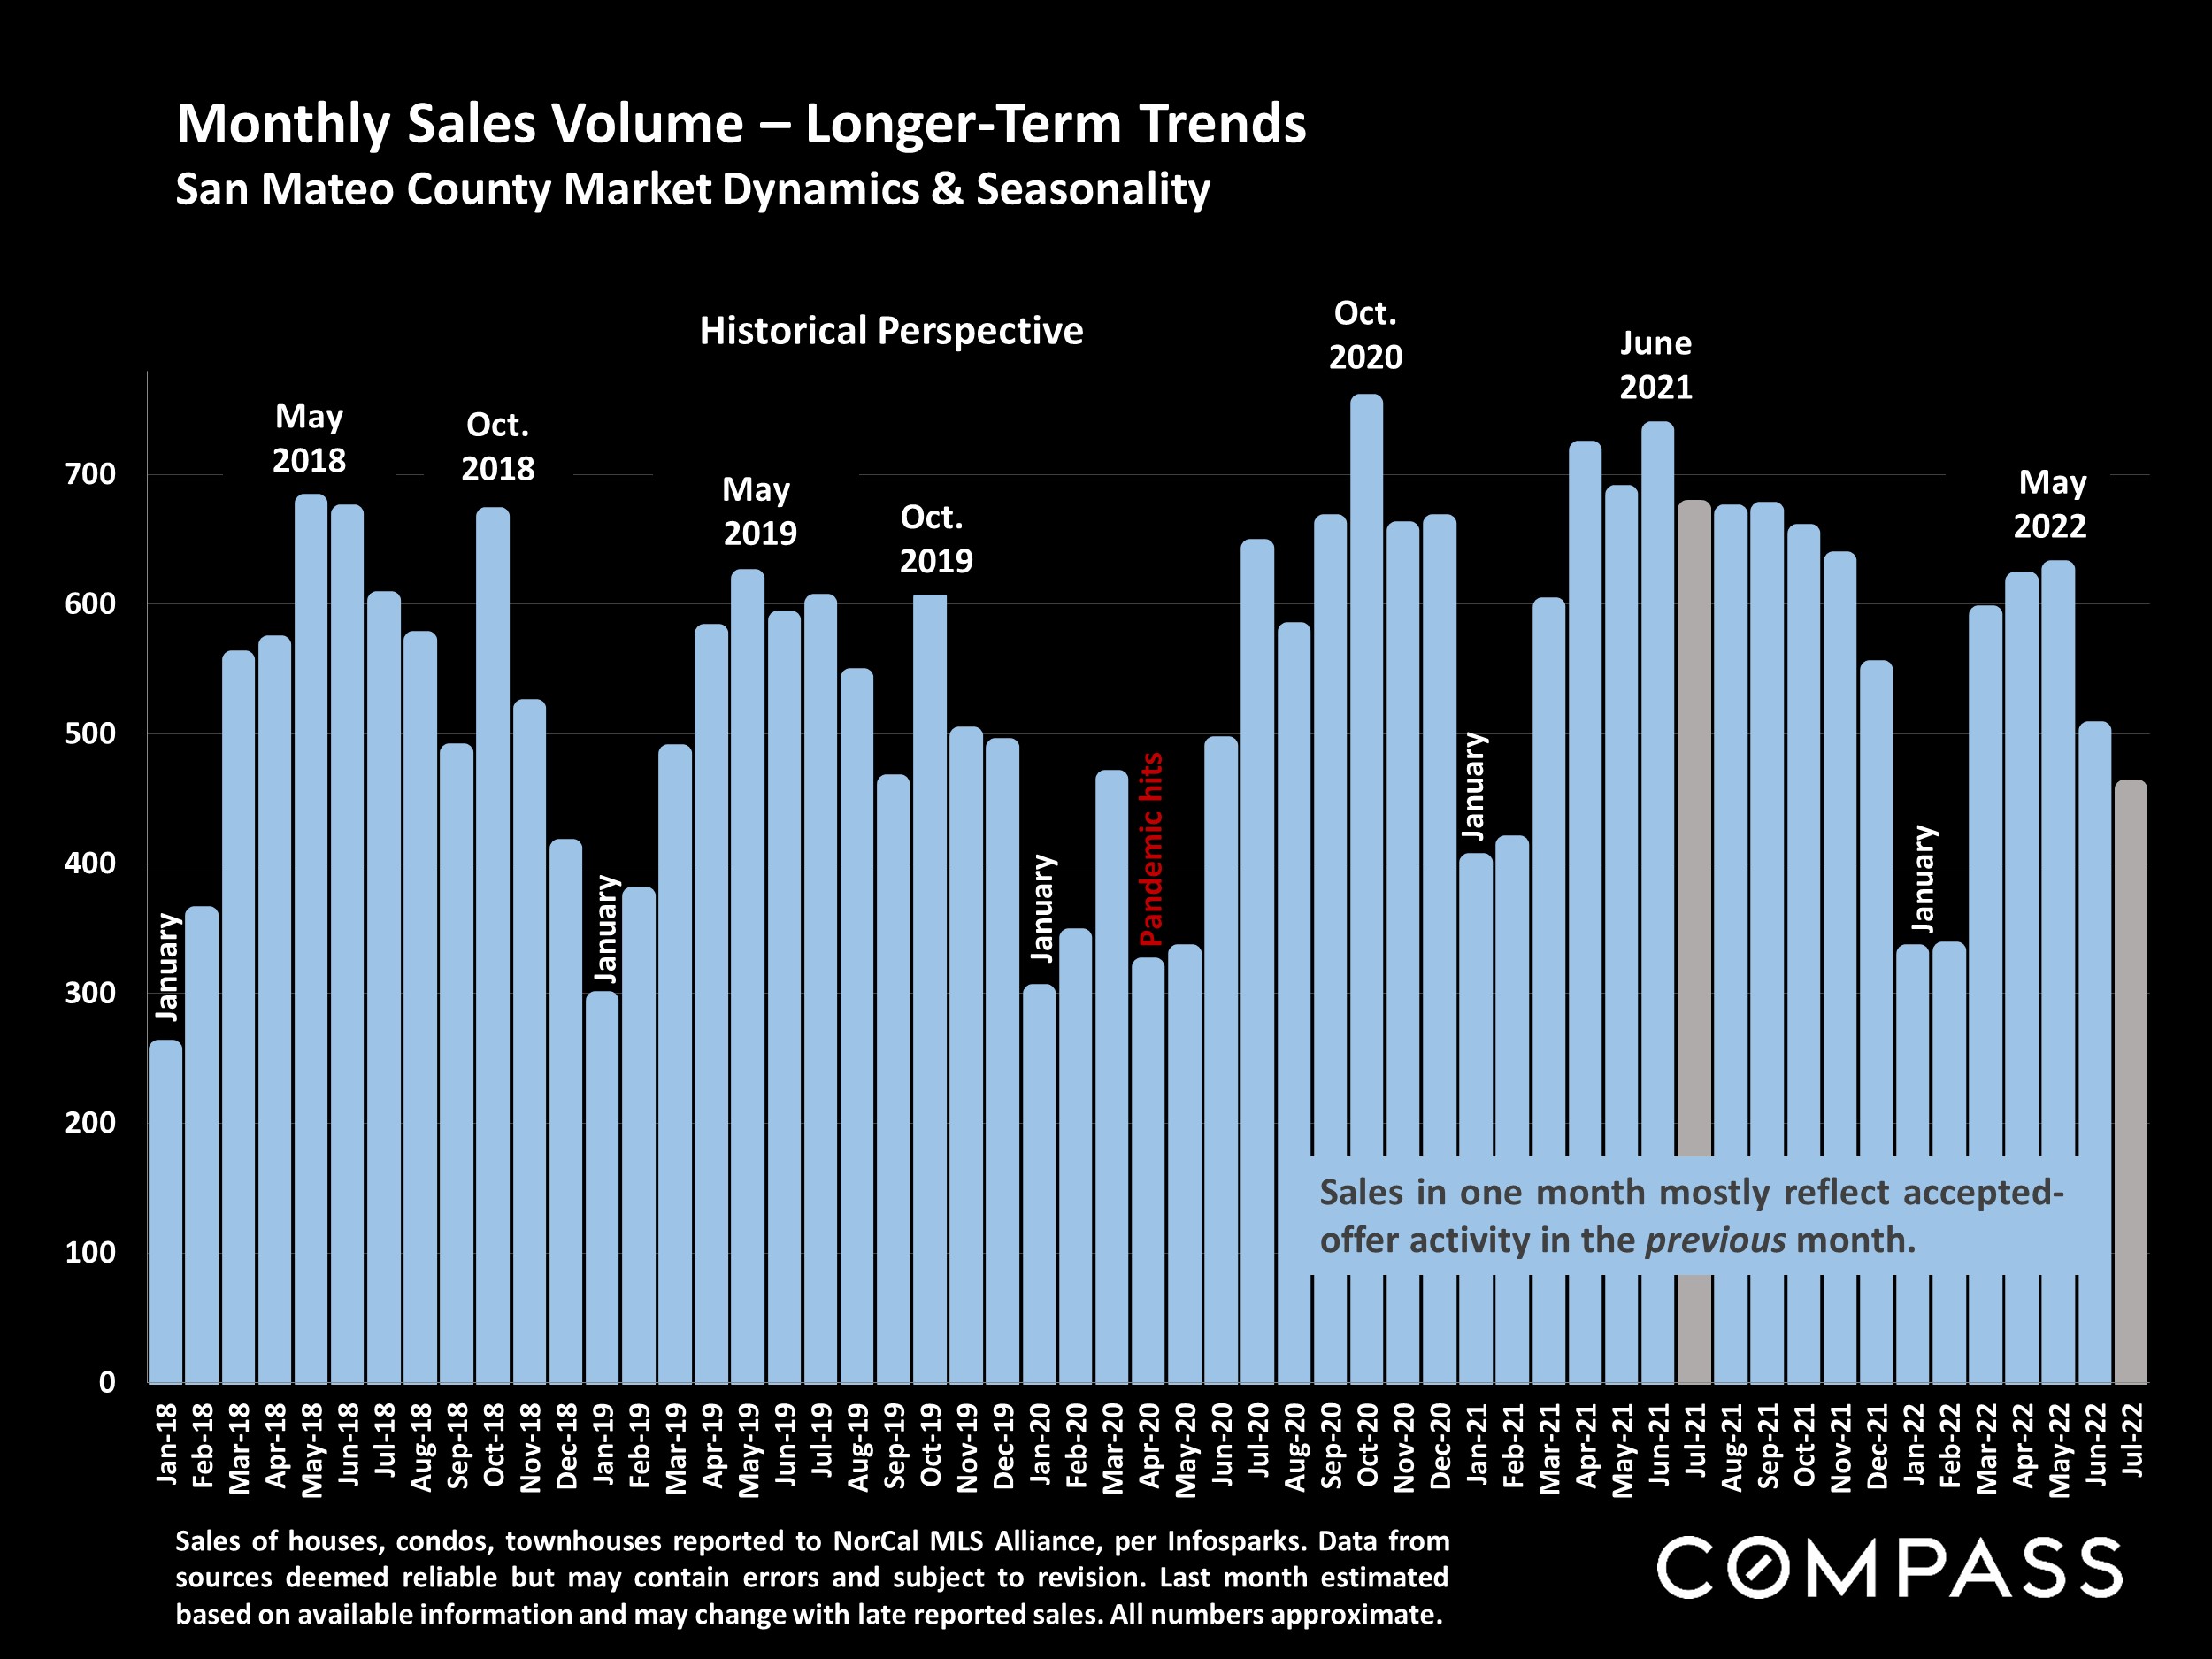
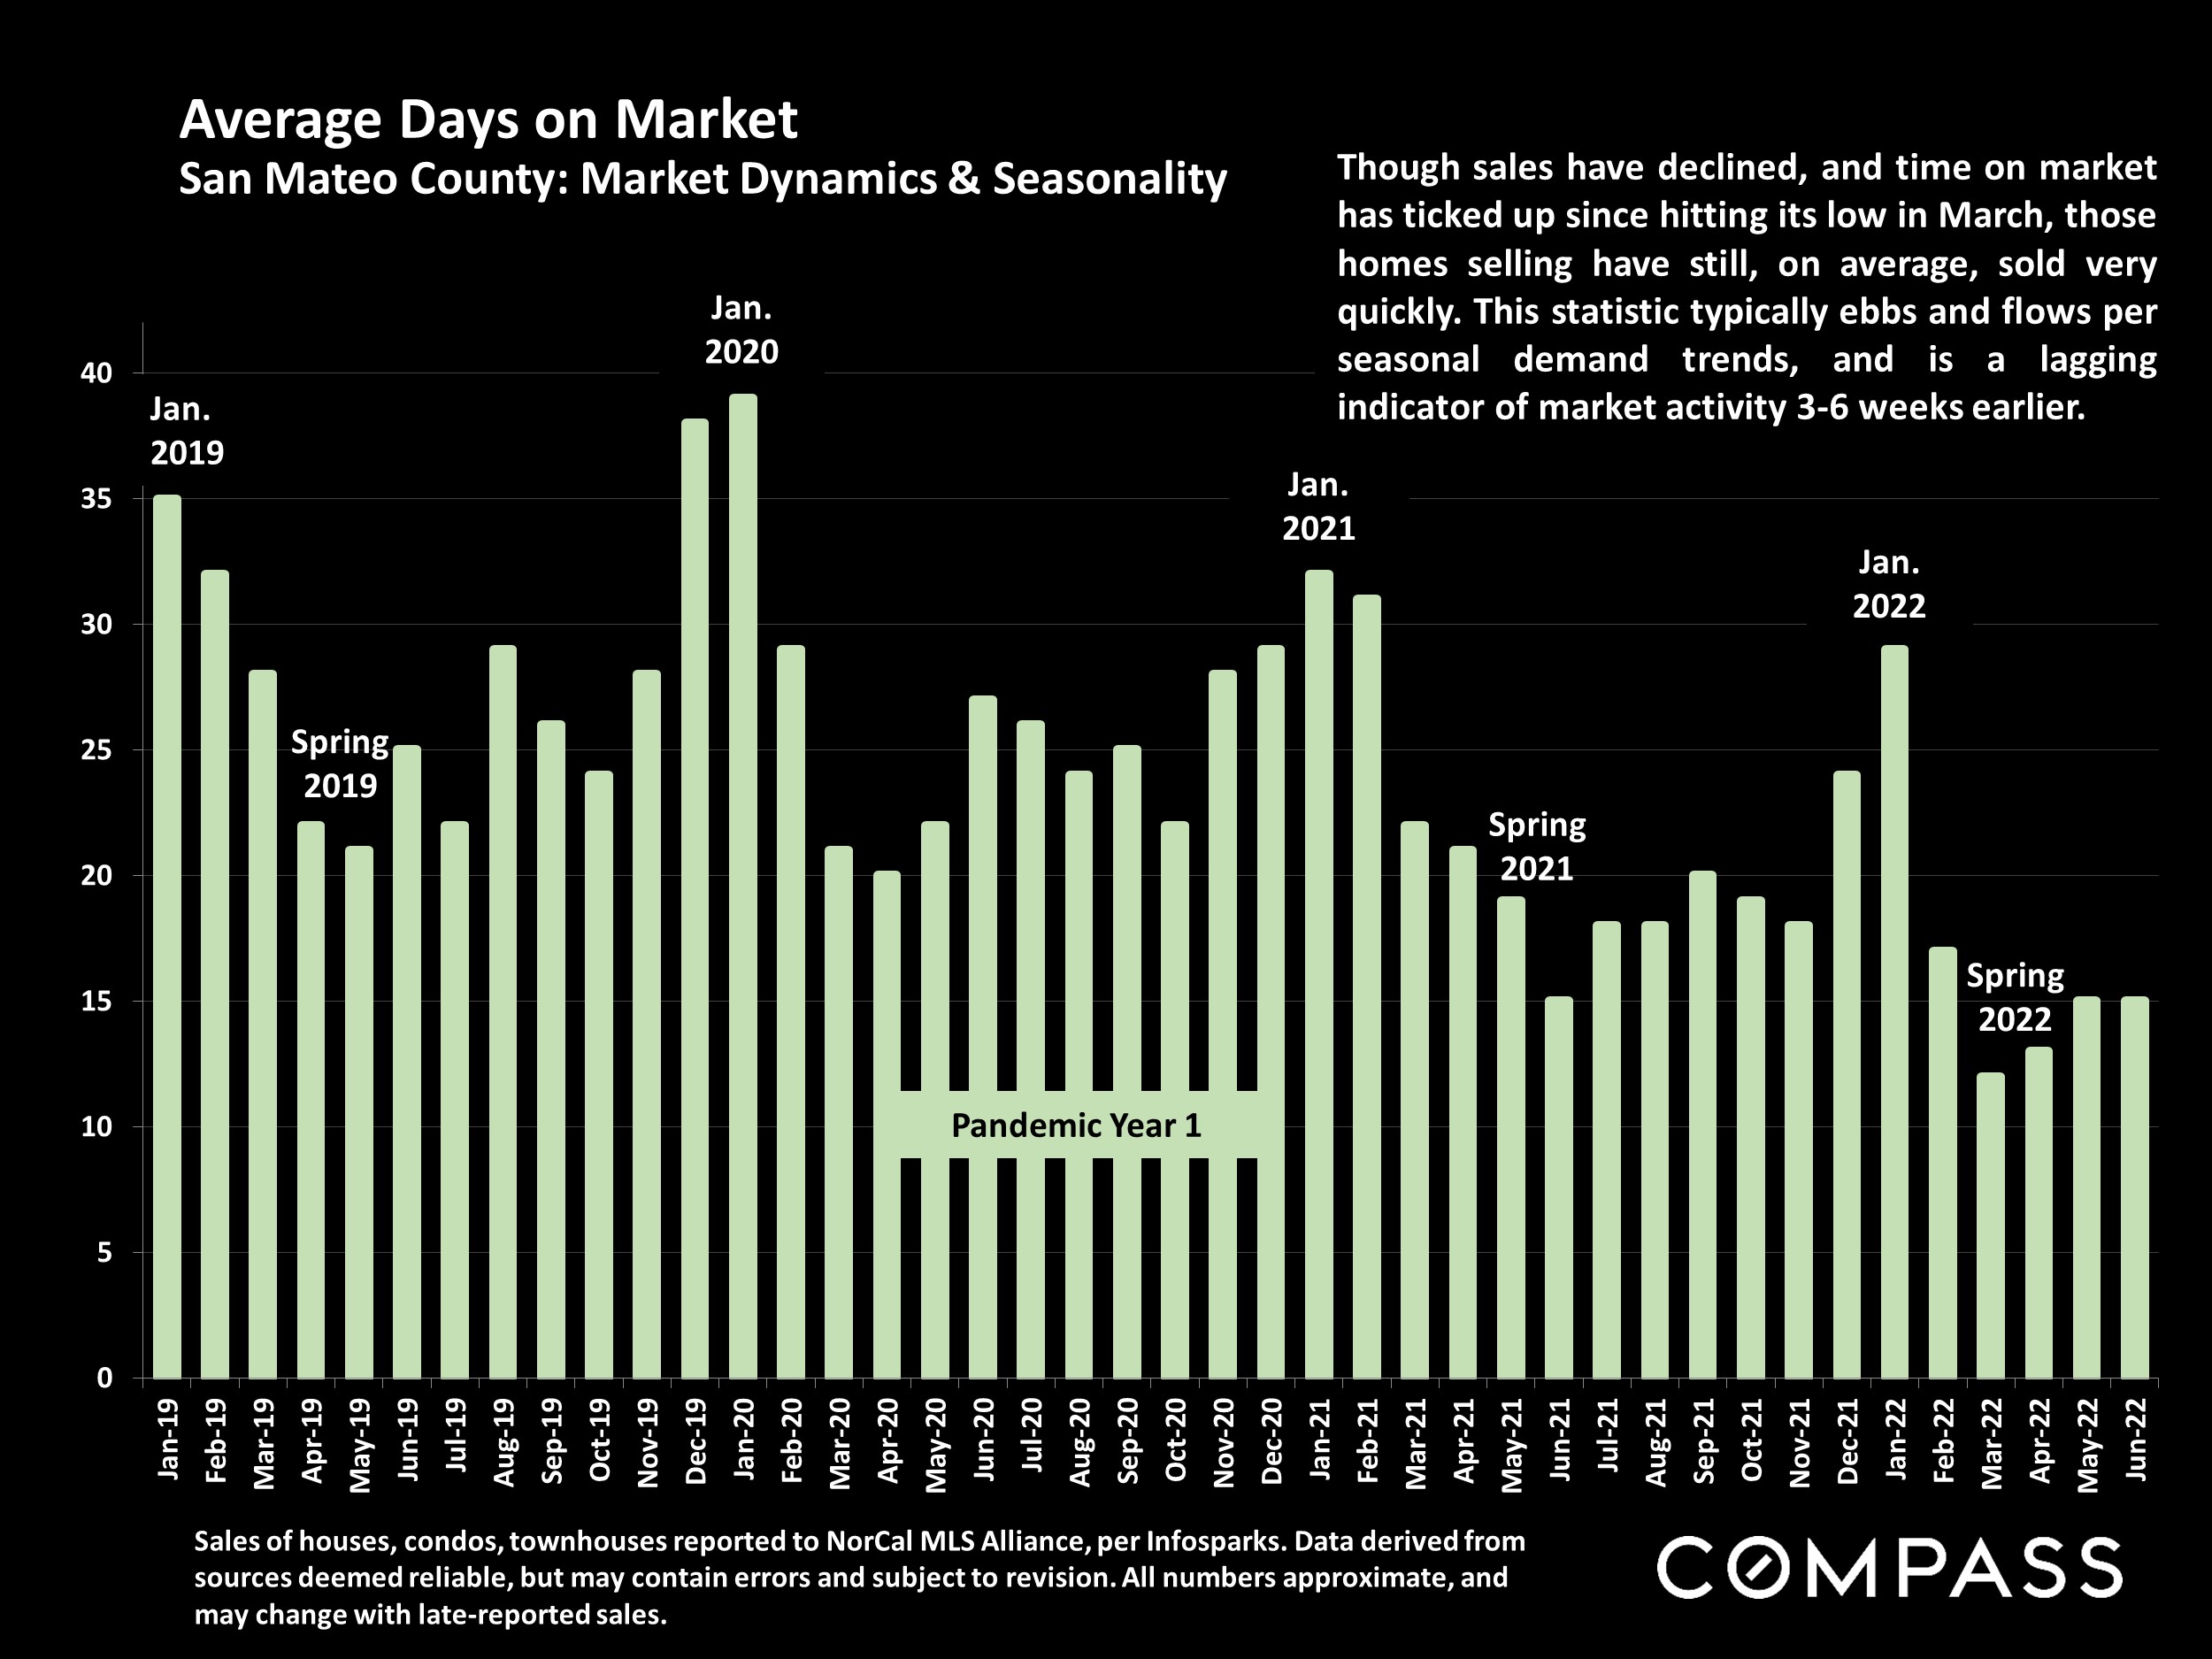
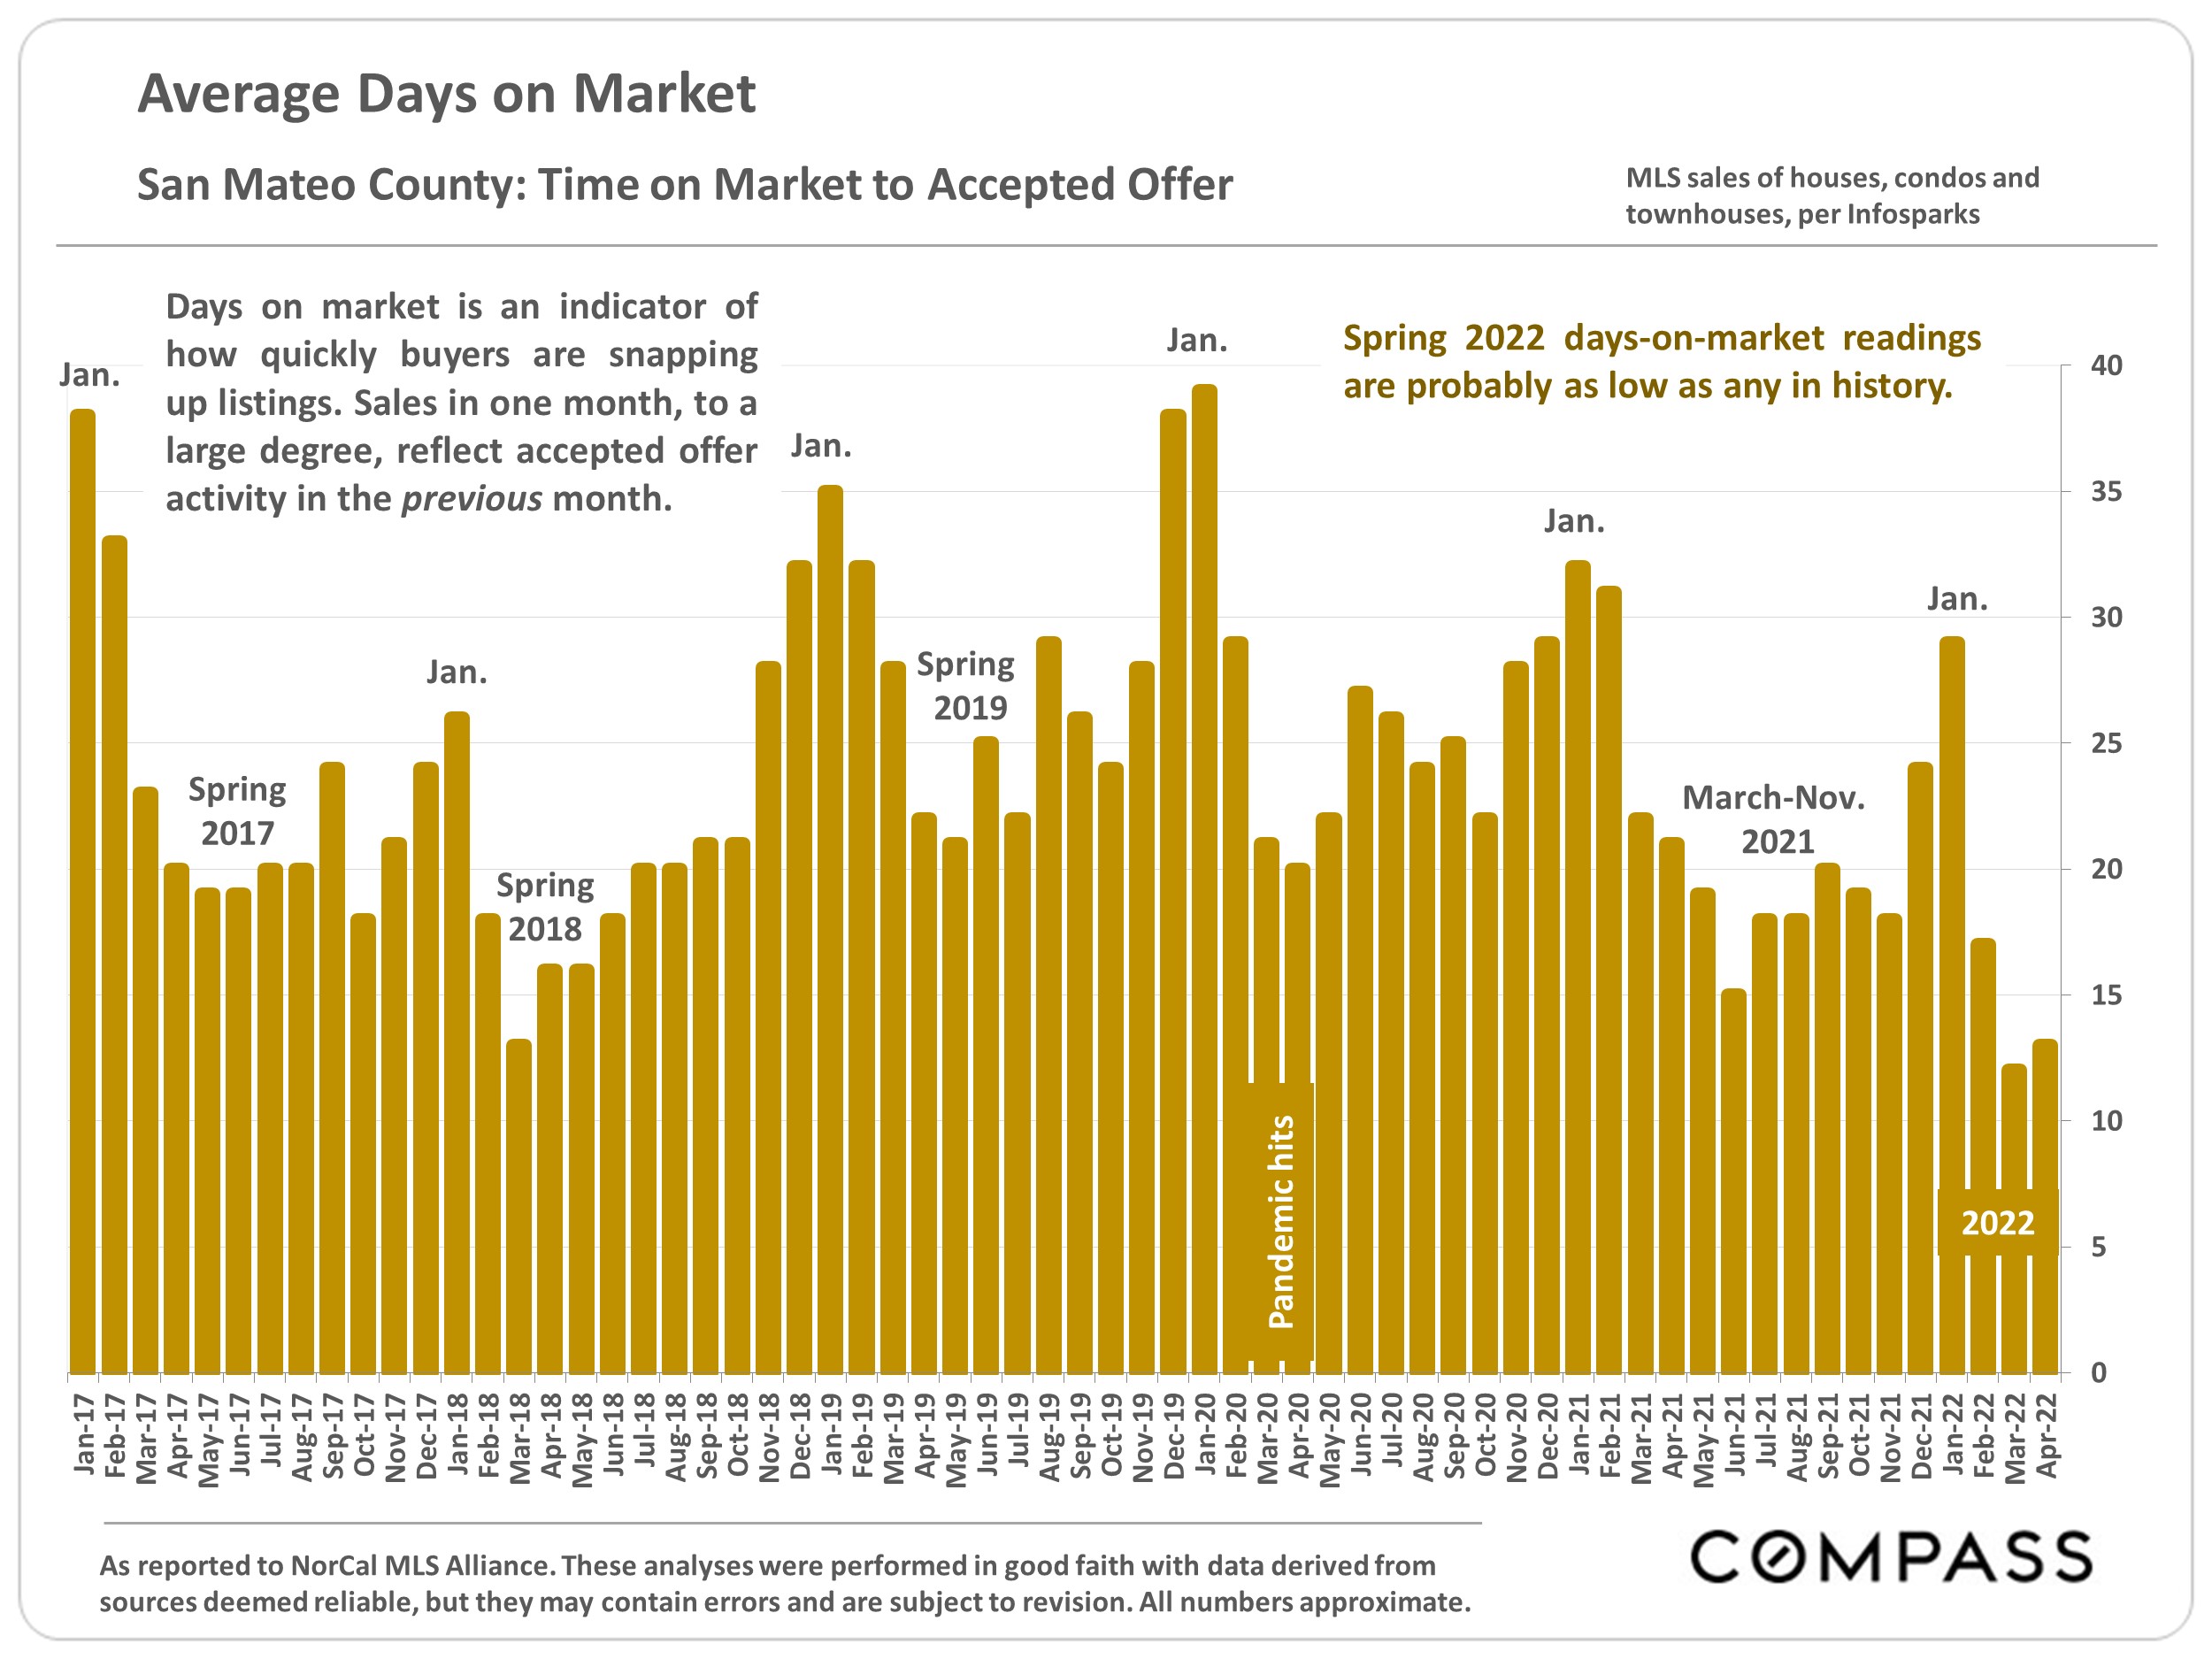
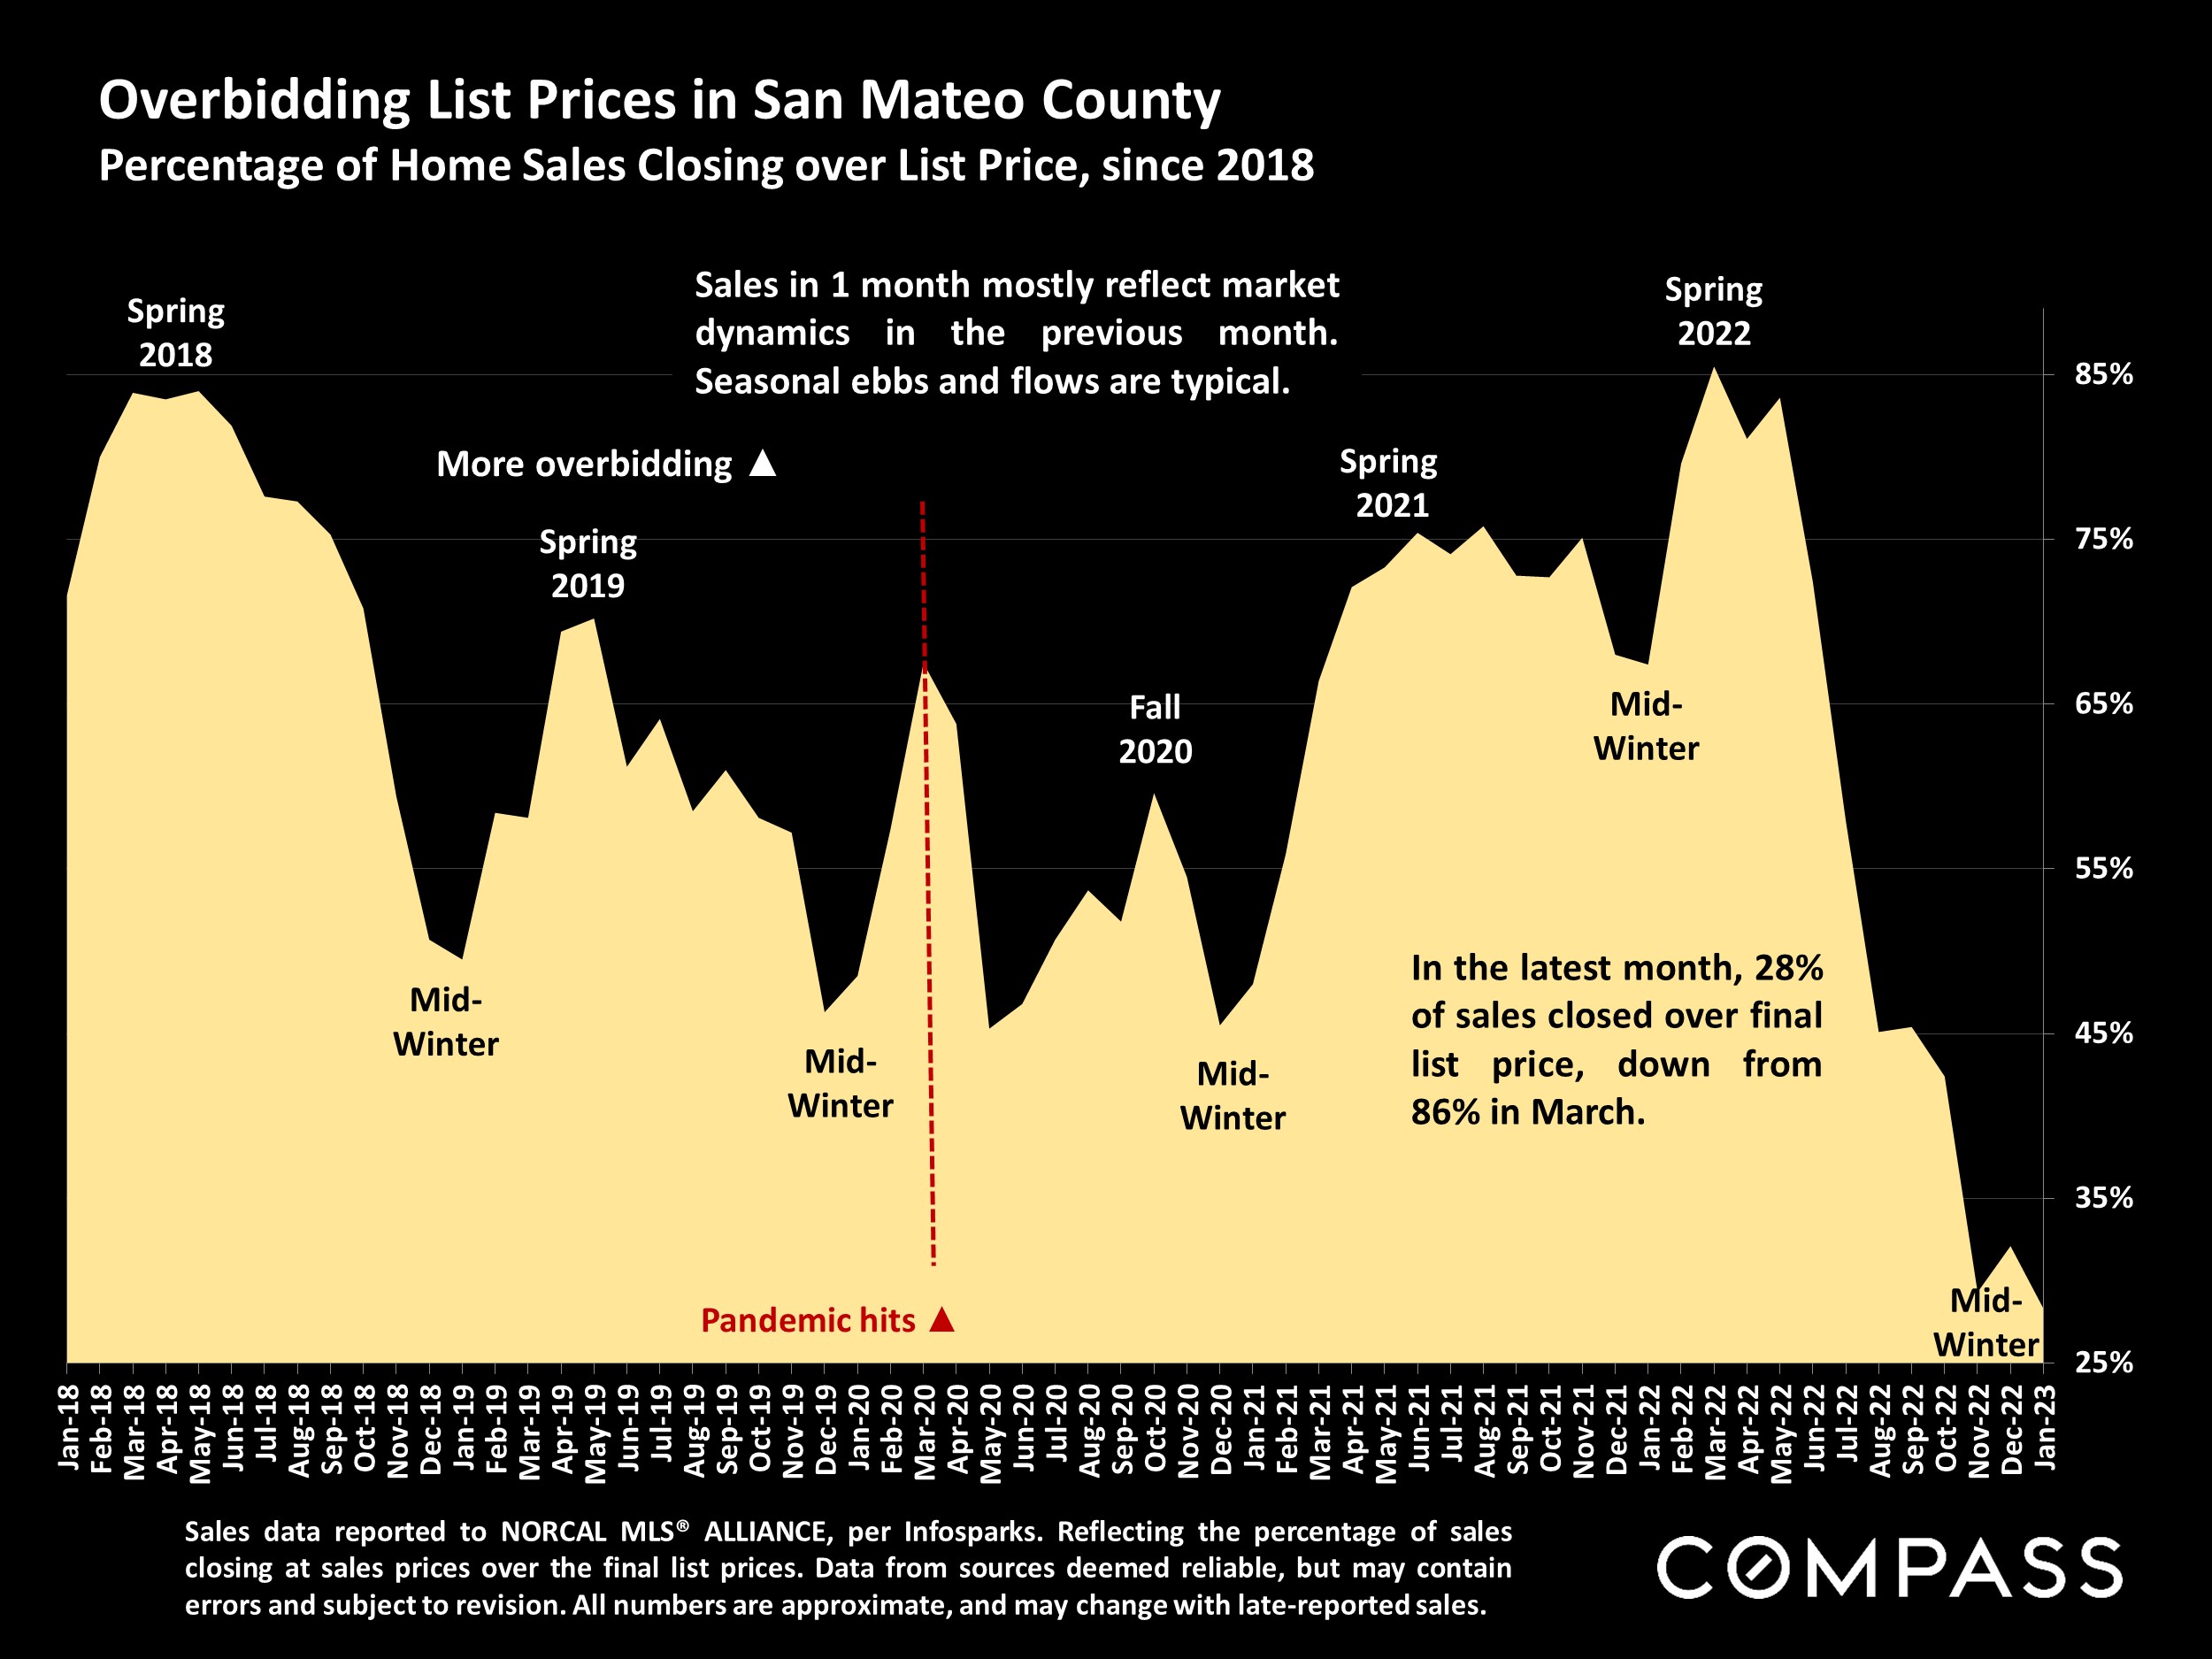
* Most “hard” data in real estate is based on closed, recorded sales, a lagging indicator which generally reflects deal-making activity in the previous month, when offers were negotiated. January sales, the basis for many analyses in this report, mostly reflect the December 2022 market when new listing activity and buyer demand were typically at their lowest ebb in years. February and March listing and sales data will begin to better reflect early 2023 conditions.
Data from sources deemed reliable, but may contain errors and subject to revision. All numbers approximate, and may change with late-reported activity.
Statistics are generalities, essentially summaries of widely disparate data generated by dozens, hundreds or thousands of unique, individual sales occurring within different time periods. They are best seen not as precise measurements, but as broad, comparative indicators, with reasonable margins of error. Anomalous fluctuations in statistics are not uncommon, especially in smaller, expensive market segments. Last period data should be considered estimates that may change with late-reported data. Different analytics programs sometimes define statistics – such as “active listings,” “days on market,” and “months supply of inventory” – differently: what is most meaningful are not specific calculations but the trends they illustrate. Most listing and sales data derives from the local or regional multi-listing service (MLS) of the area specified in the analysis, but not all listings or sales are reported to MLS and these won’t be reflected in the data. “Homes” signifies real-property, single-household housing units: houses, condos, co-ops, townhouses, duets and TICs (but not mobile homes), as applicable to each market. City/town names refer specifically to the named cities and towns, unless otherwise delineated. Multi-county metro areas will be specified as such. Data from sources deemed reliable, but may contain errors and subject to revision. All numbers to be considered approximate.
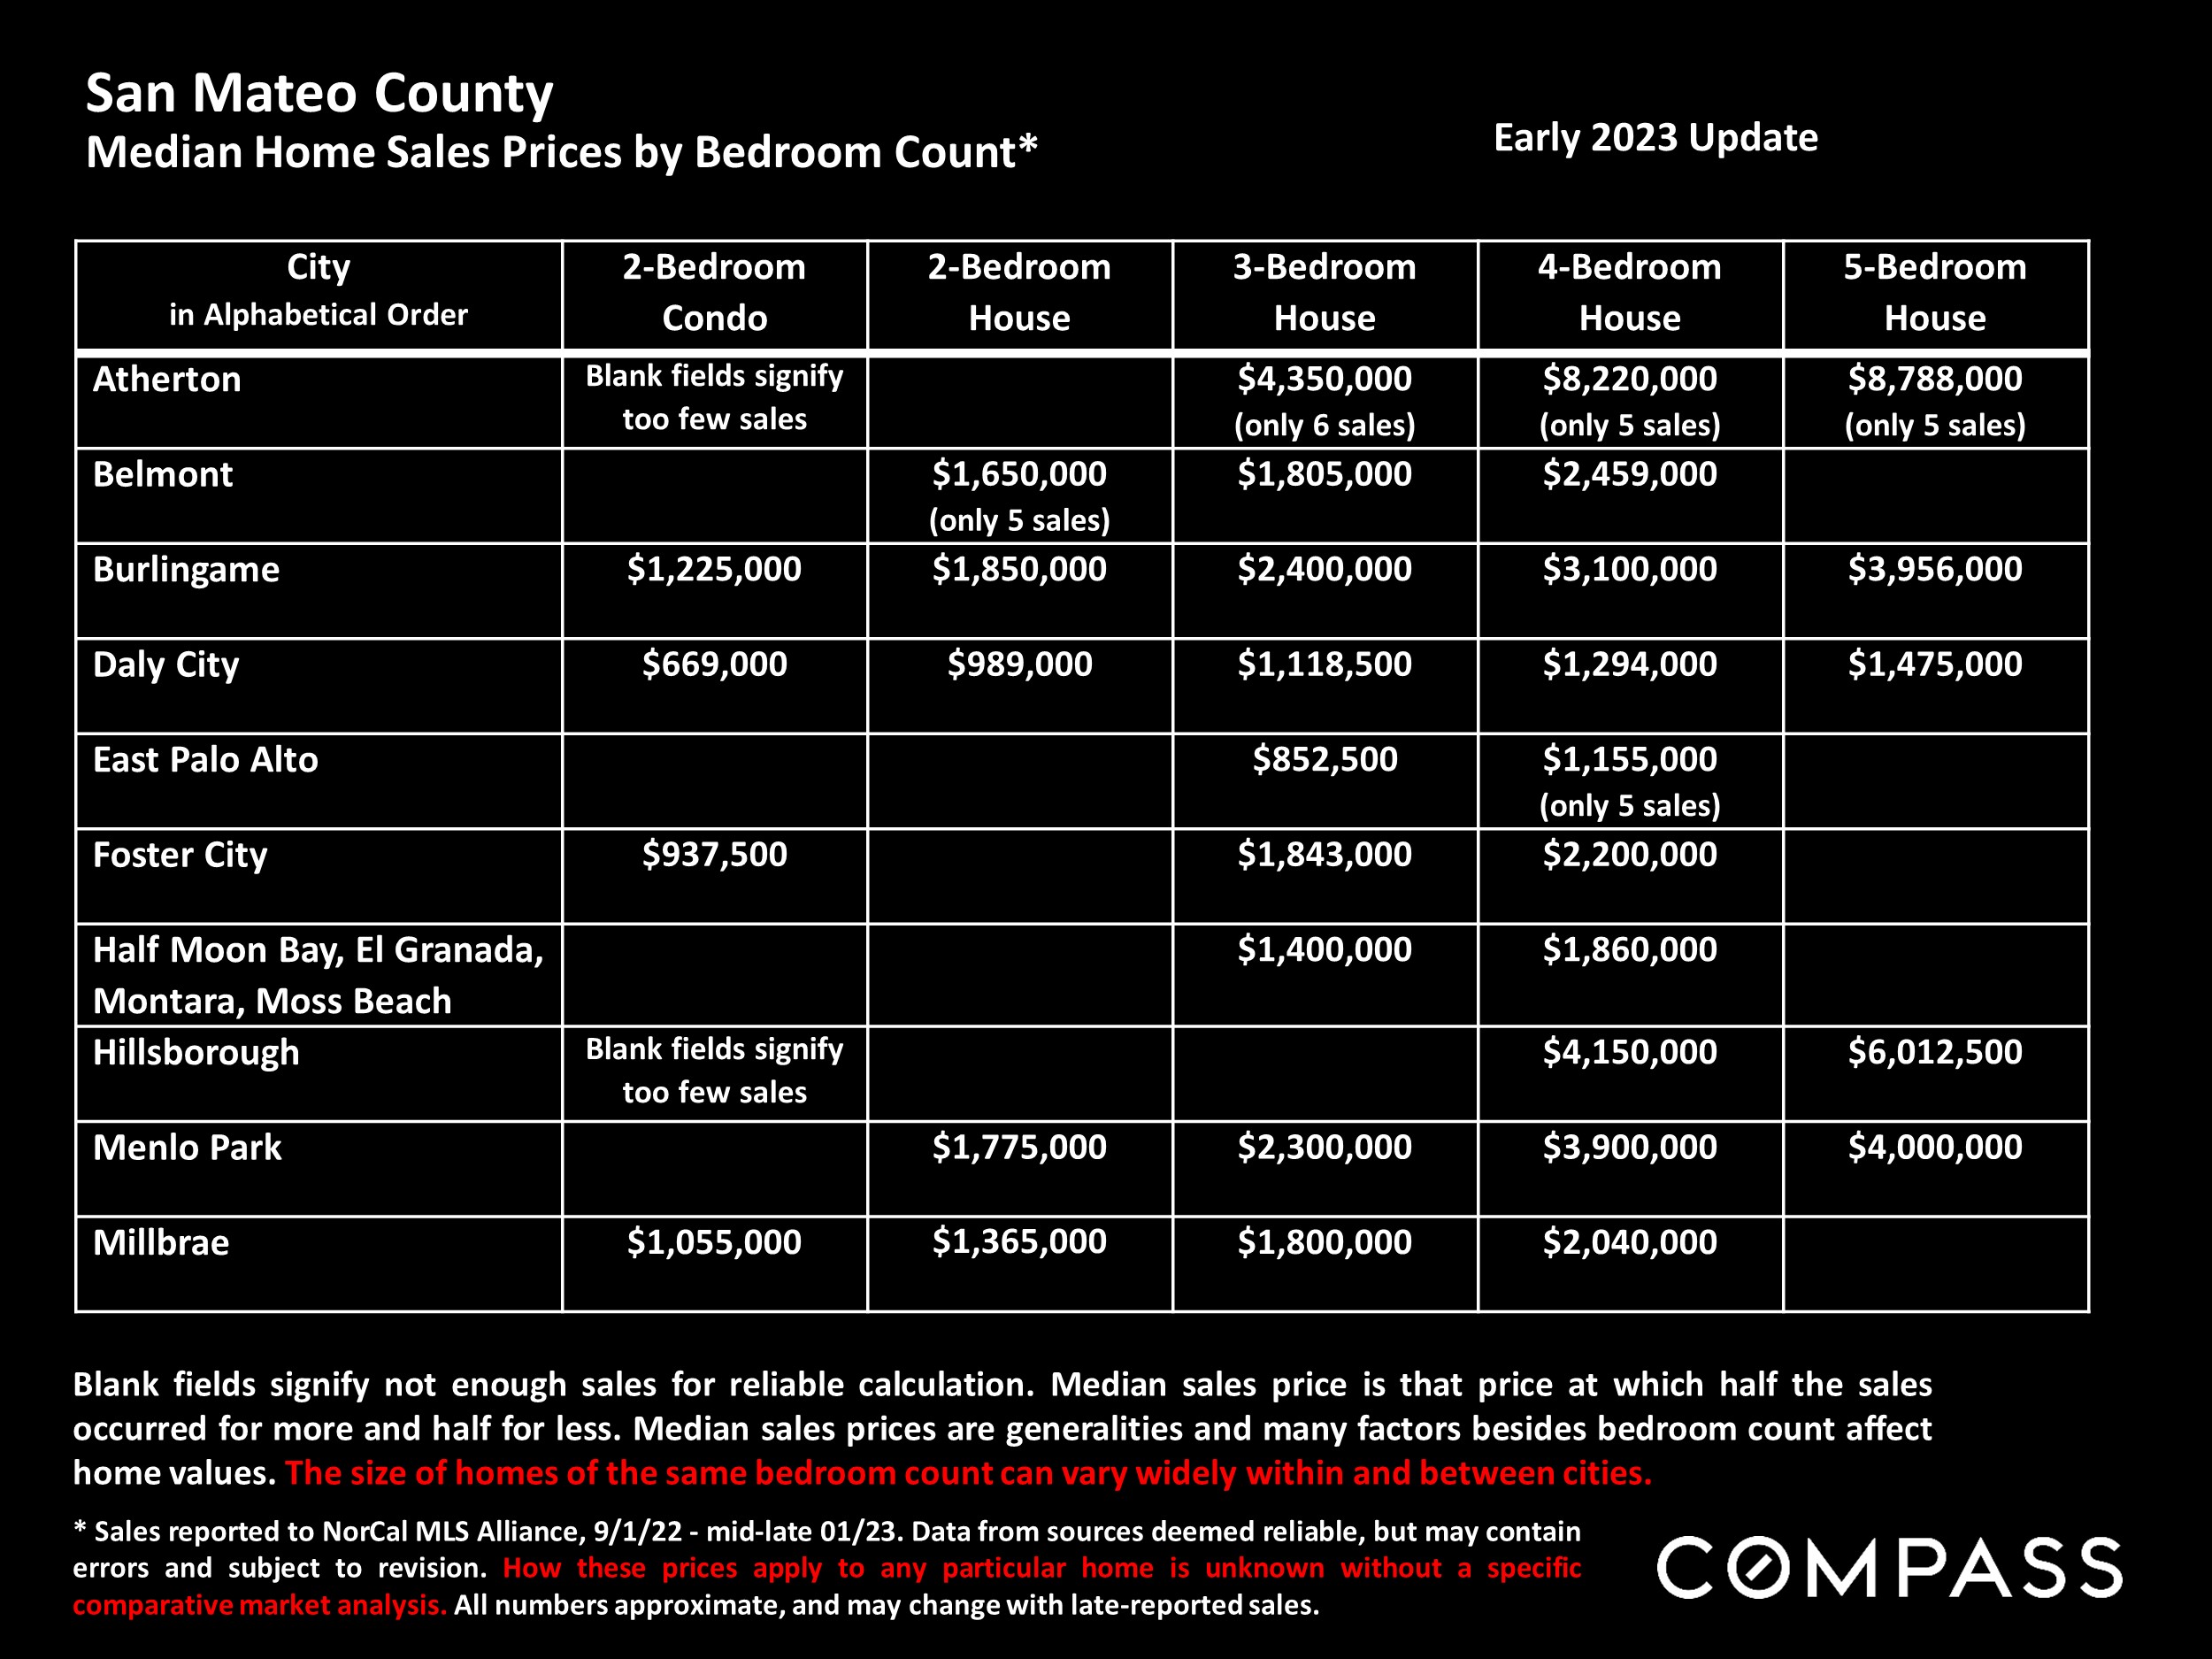
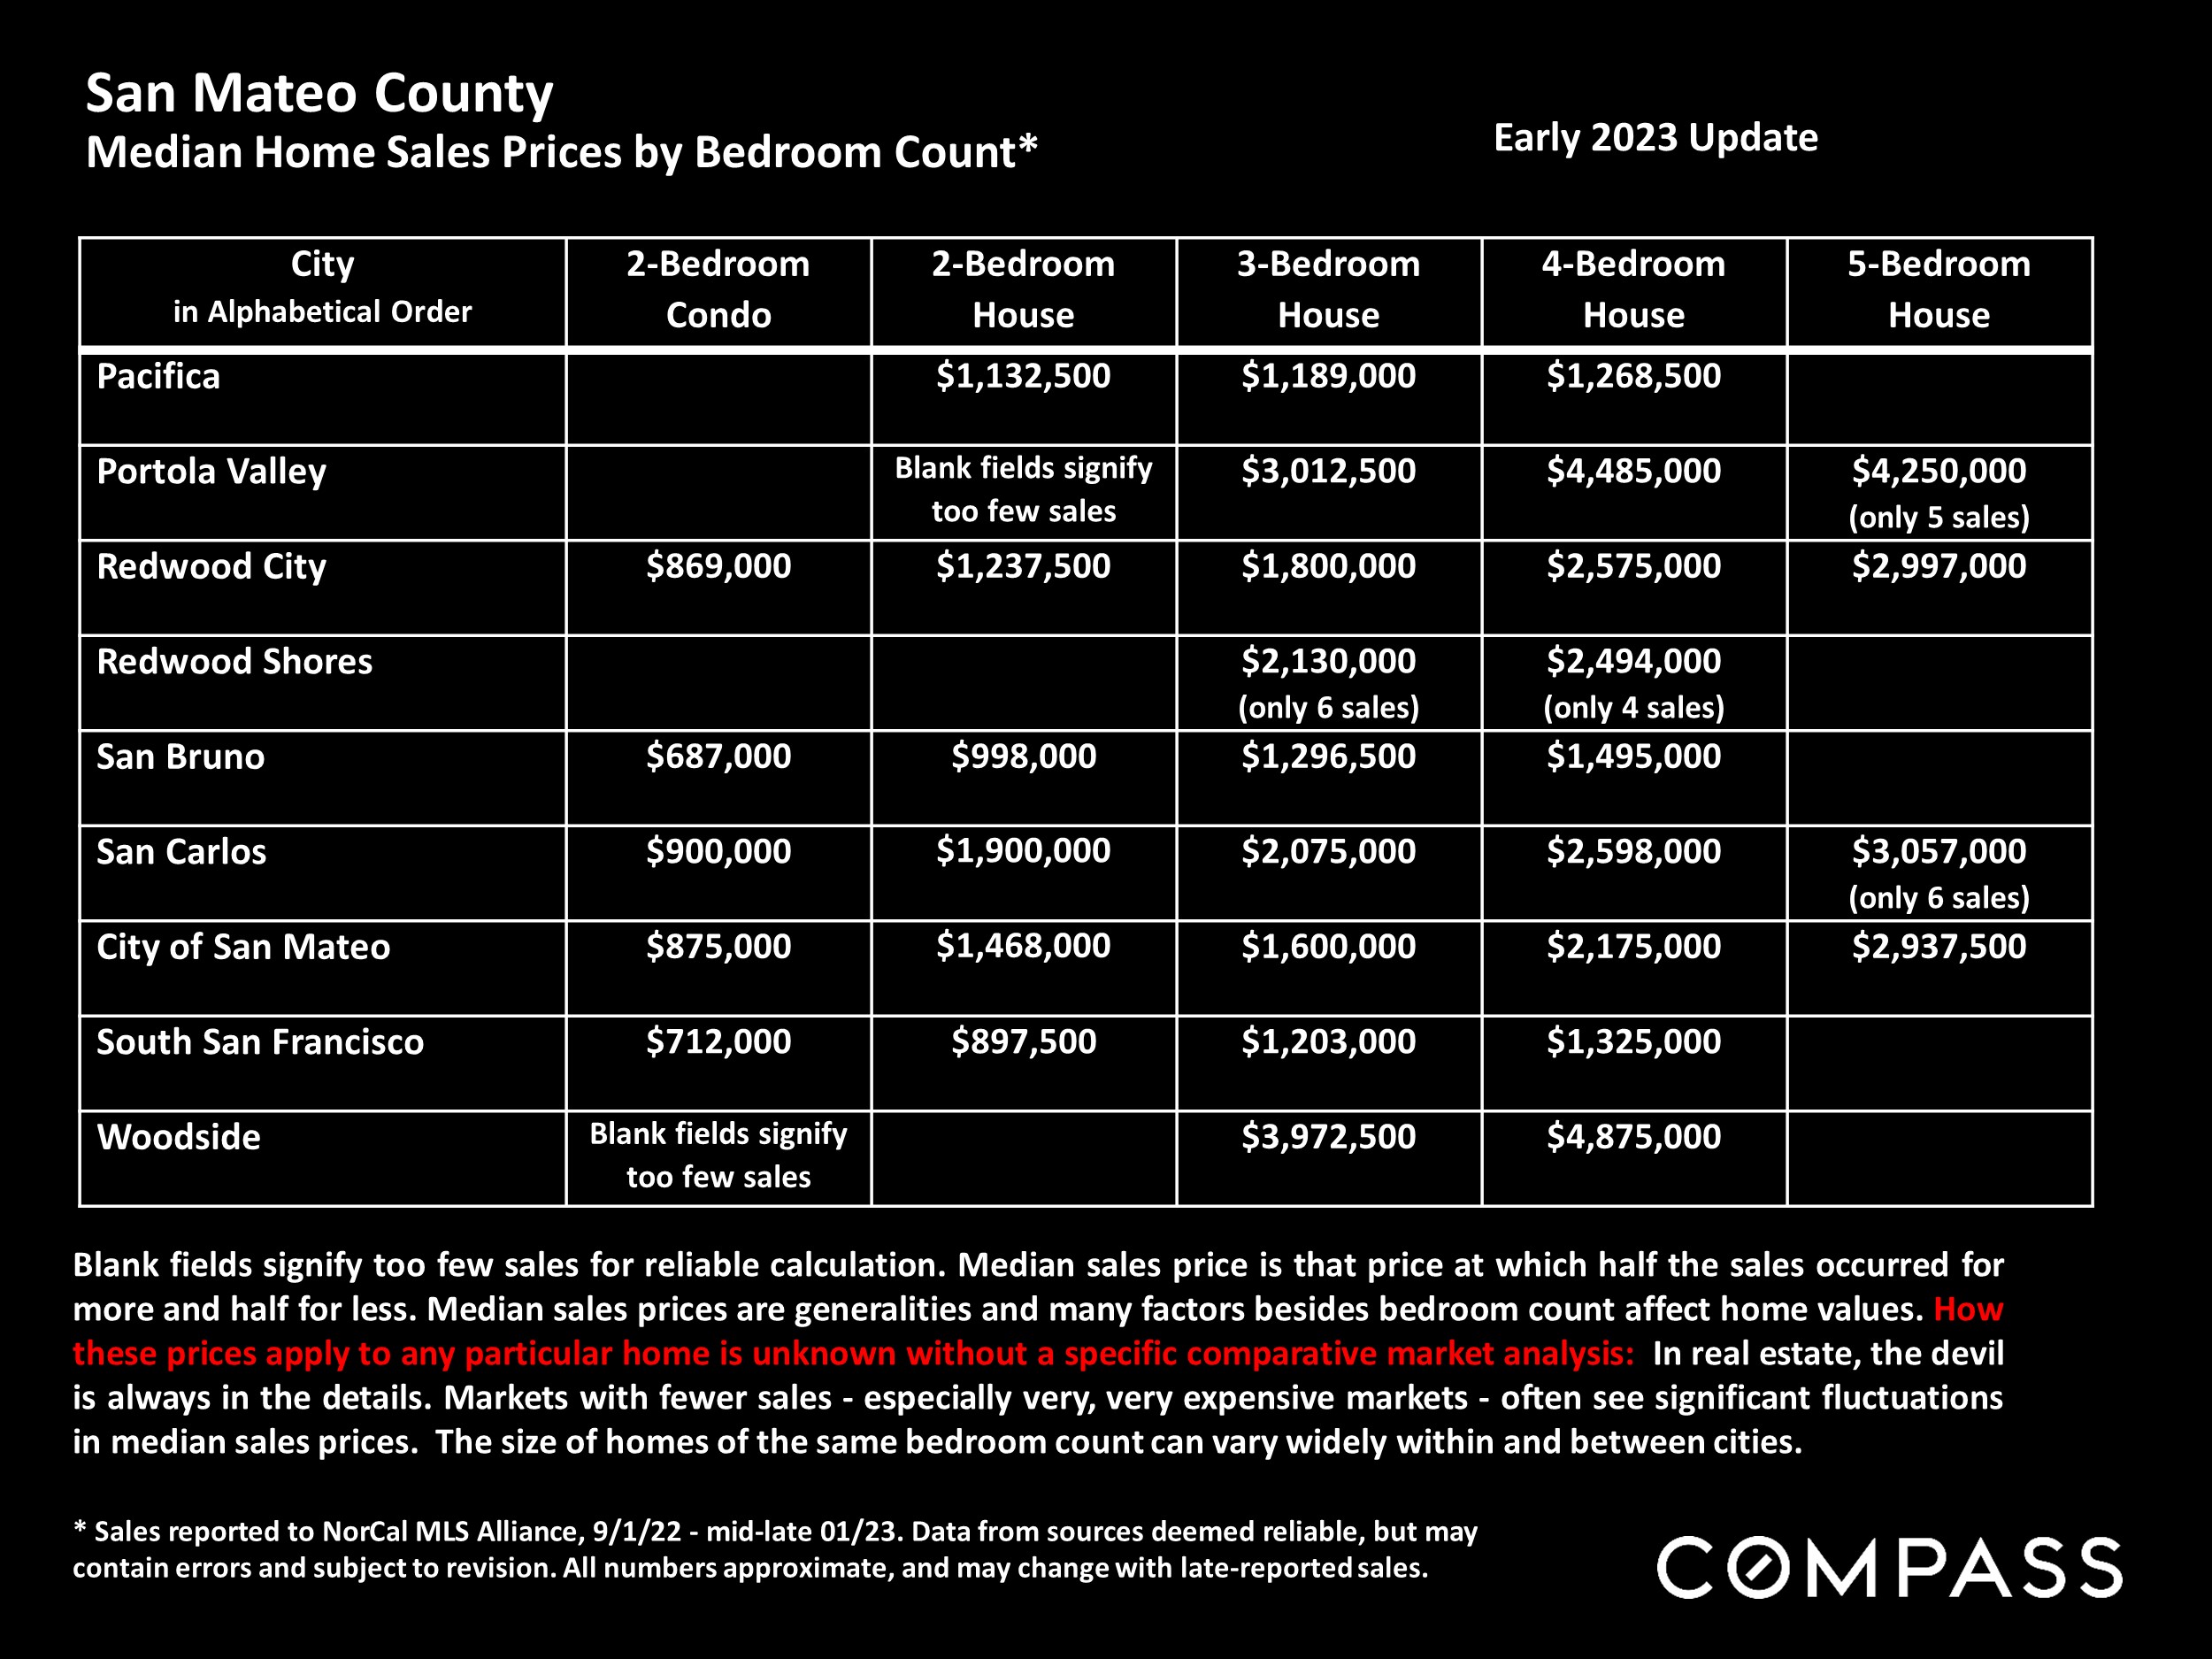
Many aspects of value cannot be adequately reflected in median and average statistics: curb appeal, age, condition, amenities, views, lot size, quality of outdoor space, “bonus” rooms, additional parking, quality of location within the neighborhood, and so on. How any of these statistics apply to any particular home is unknown without a specific comparative market analysis.
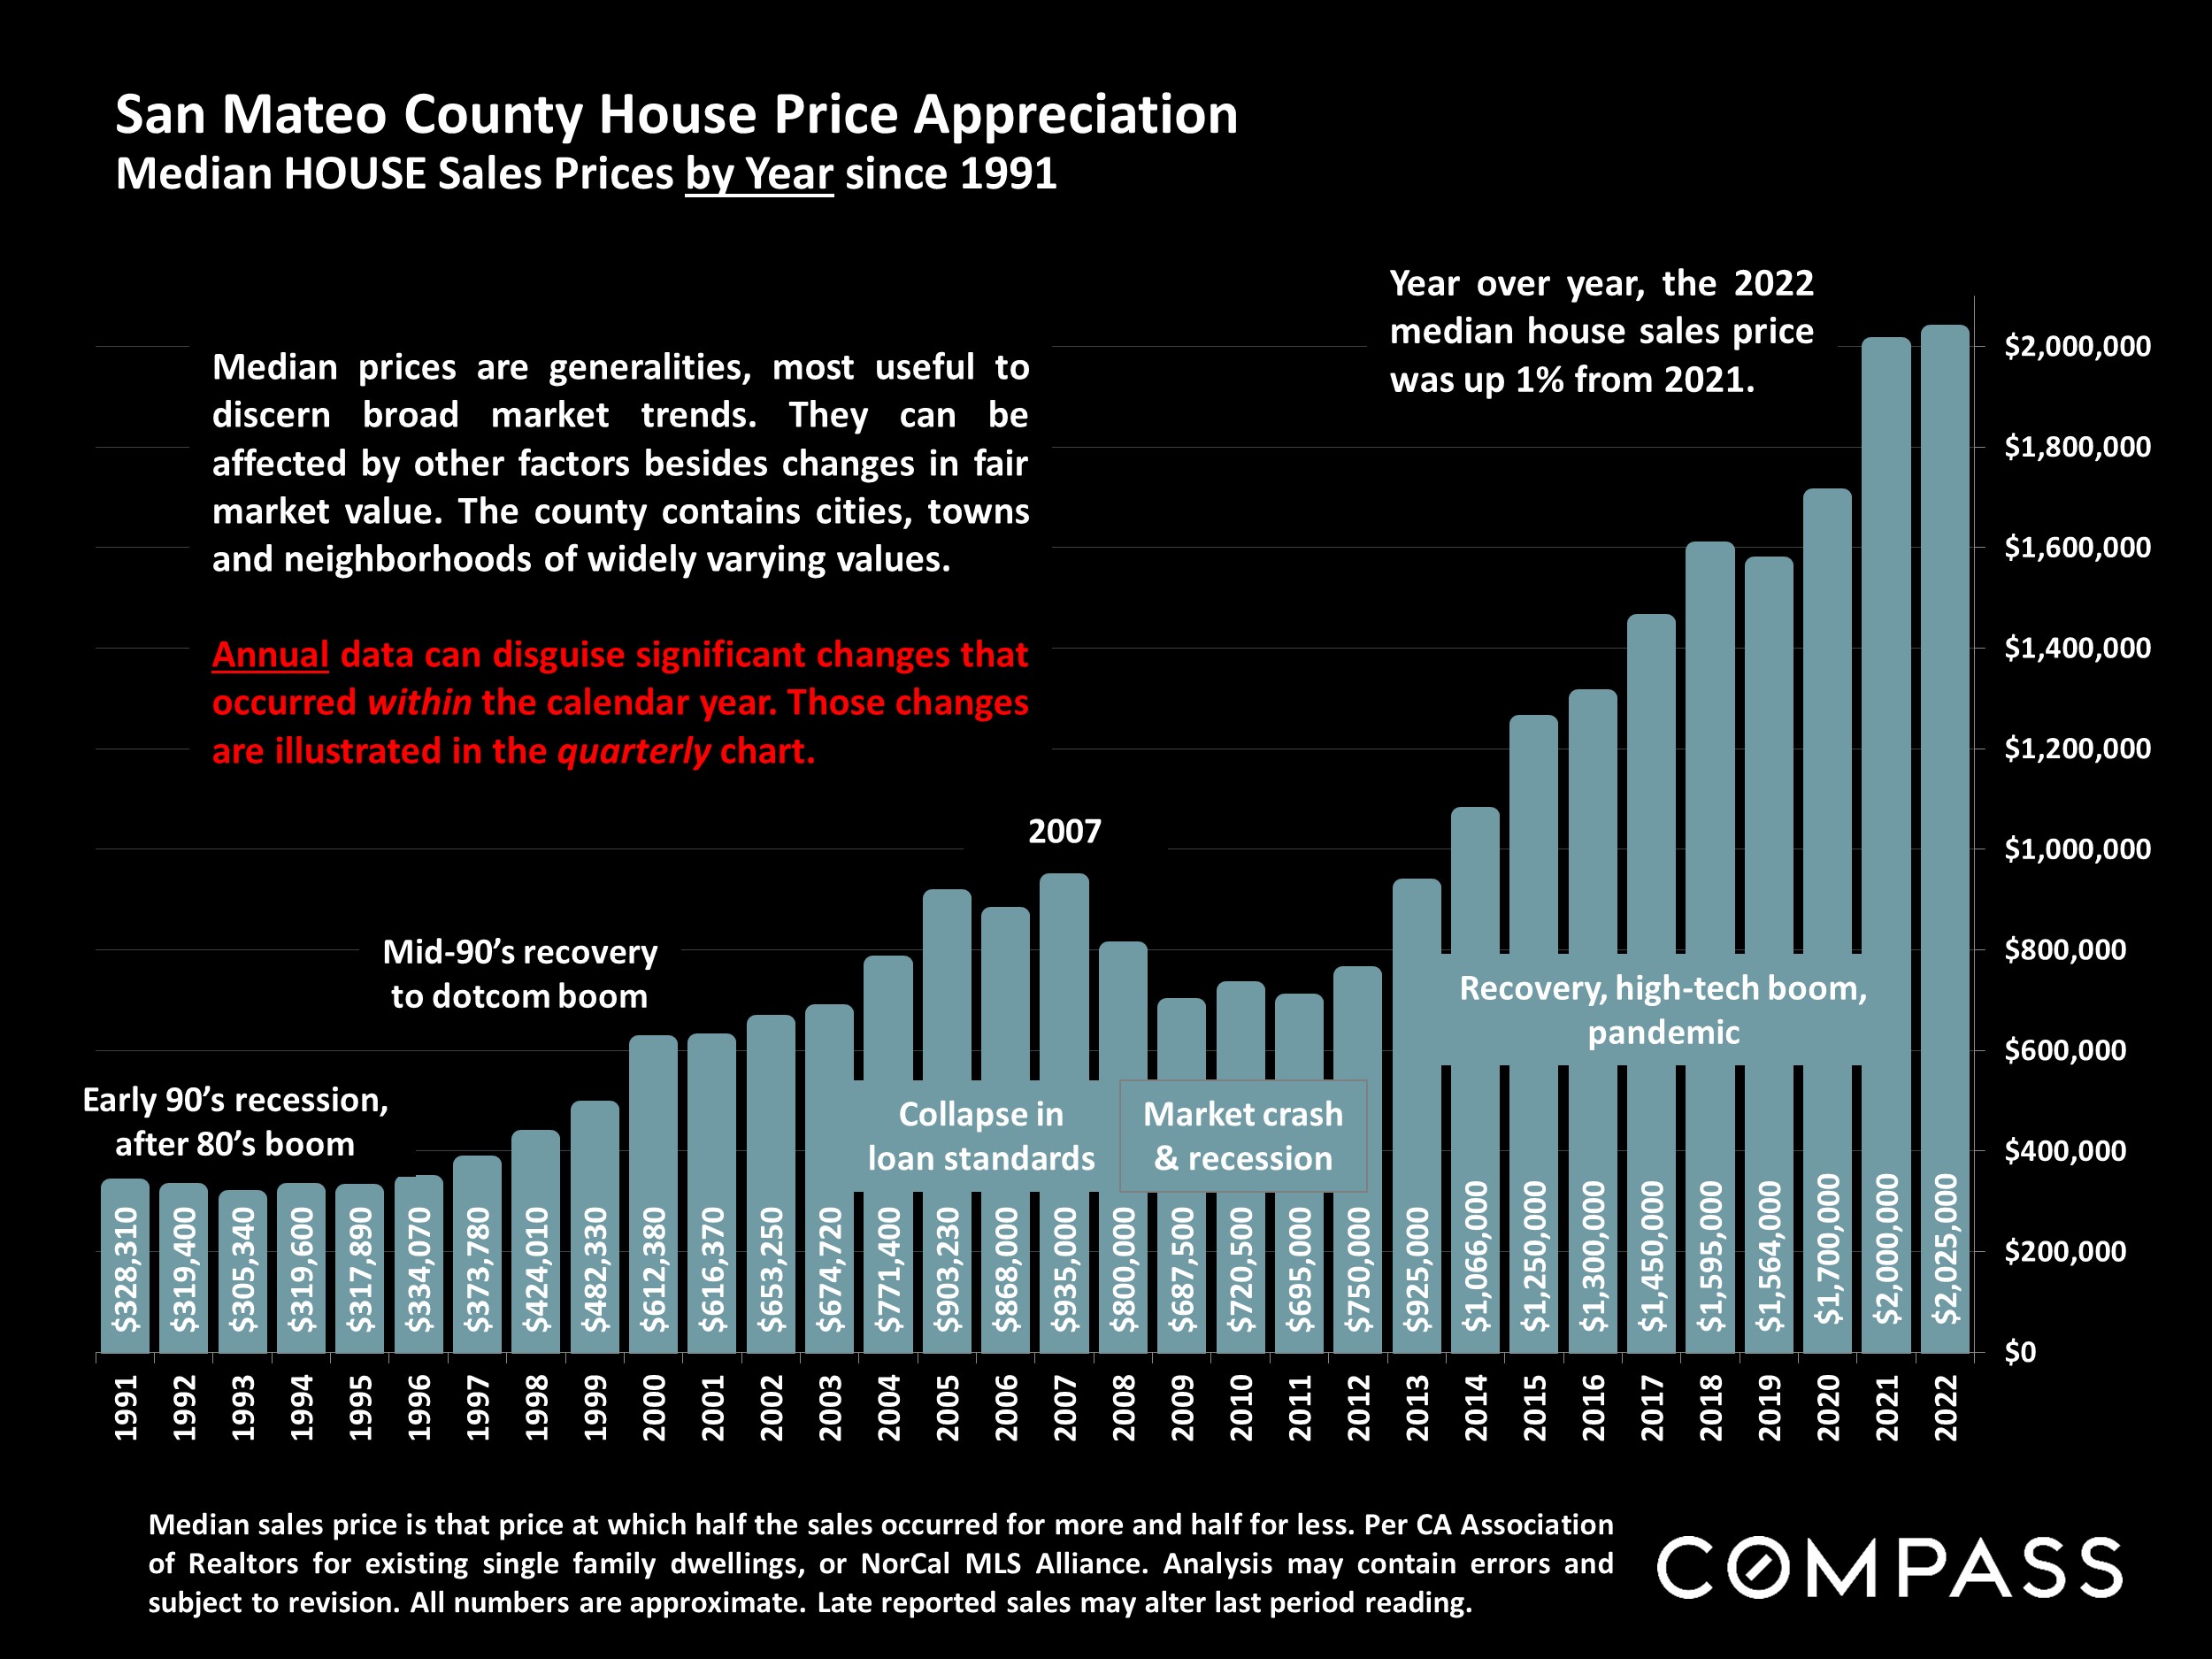
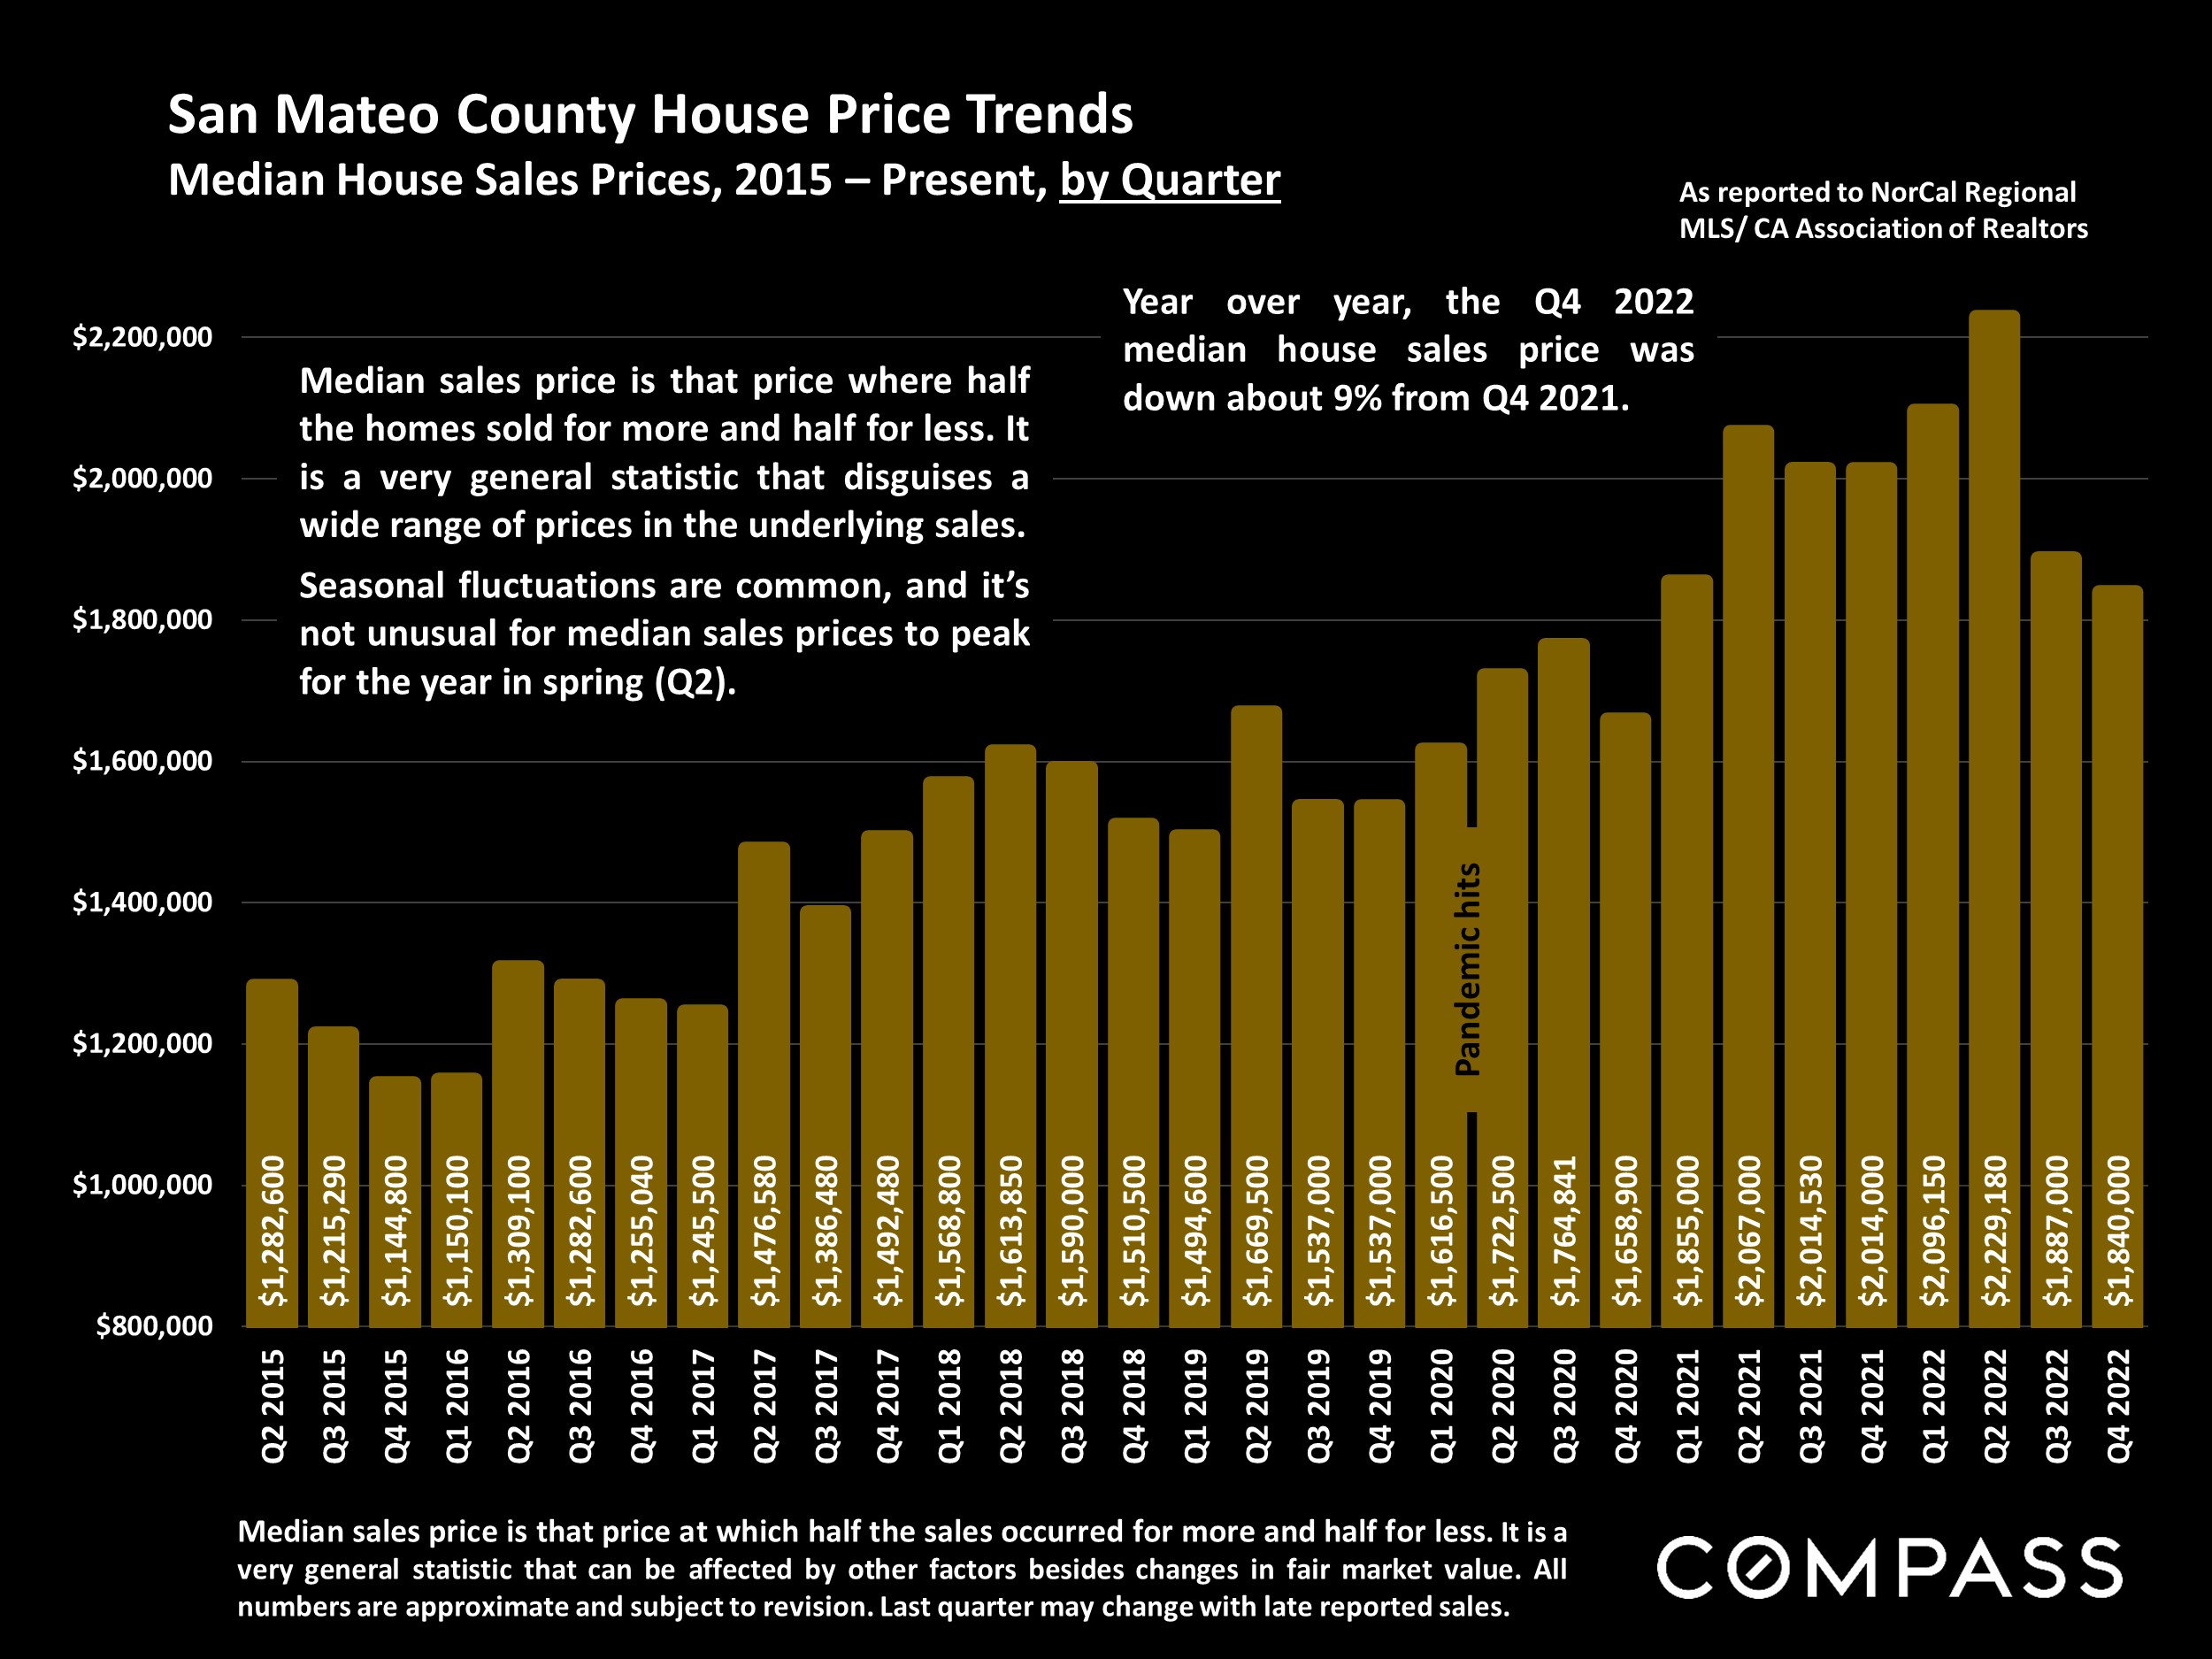
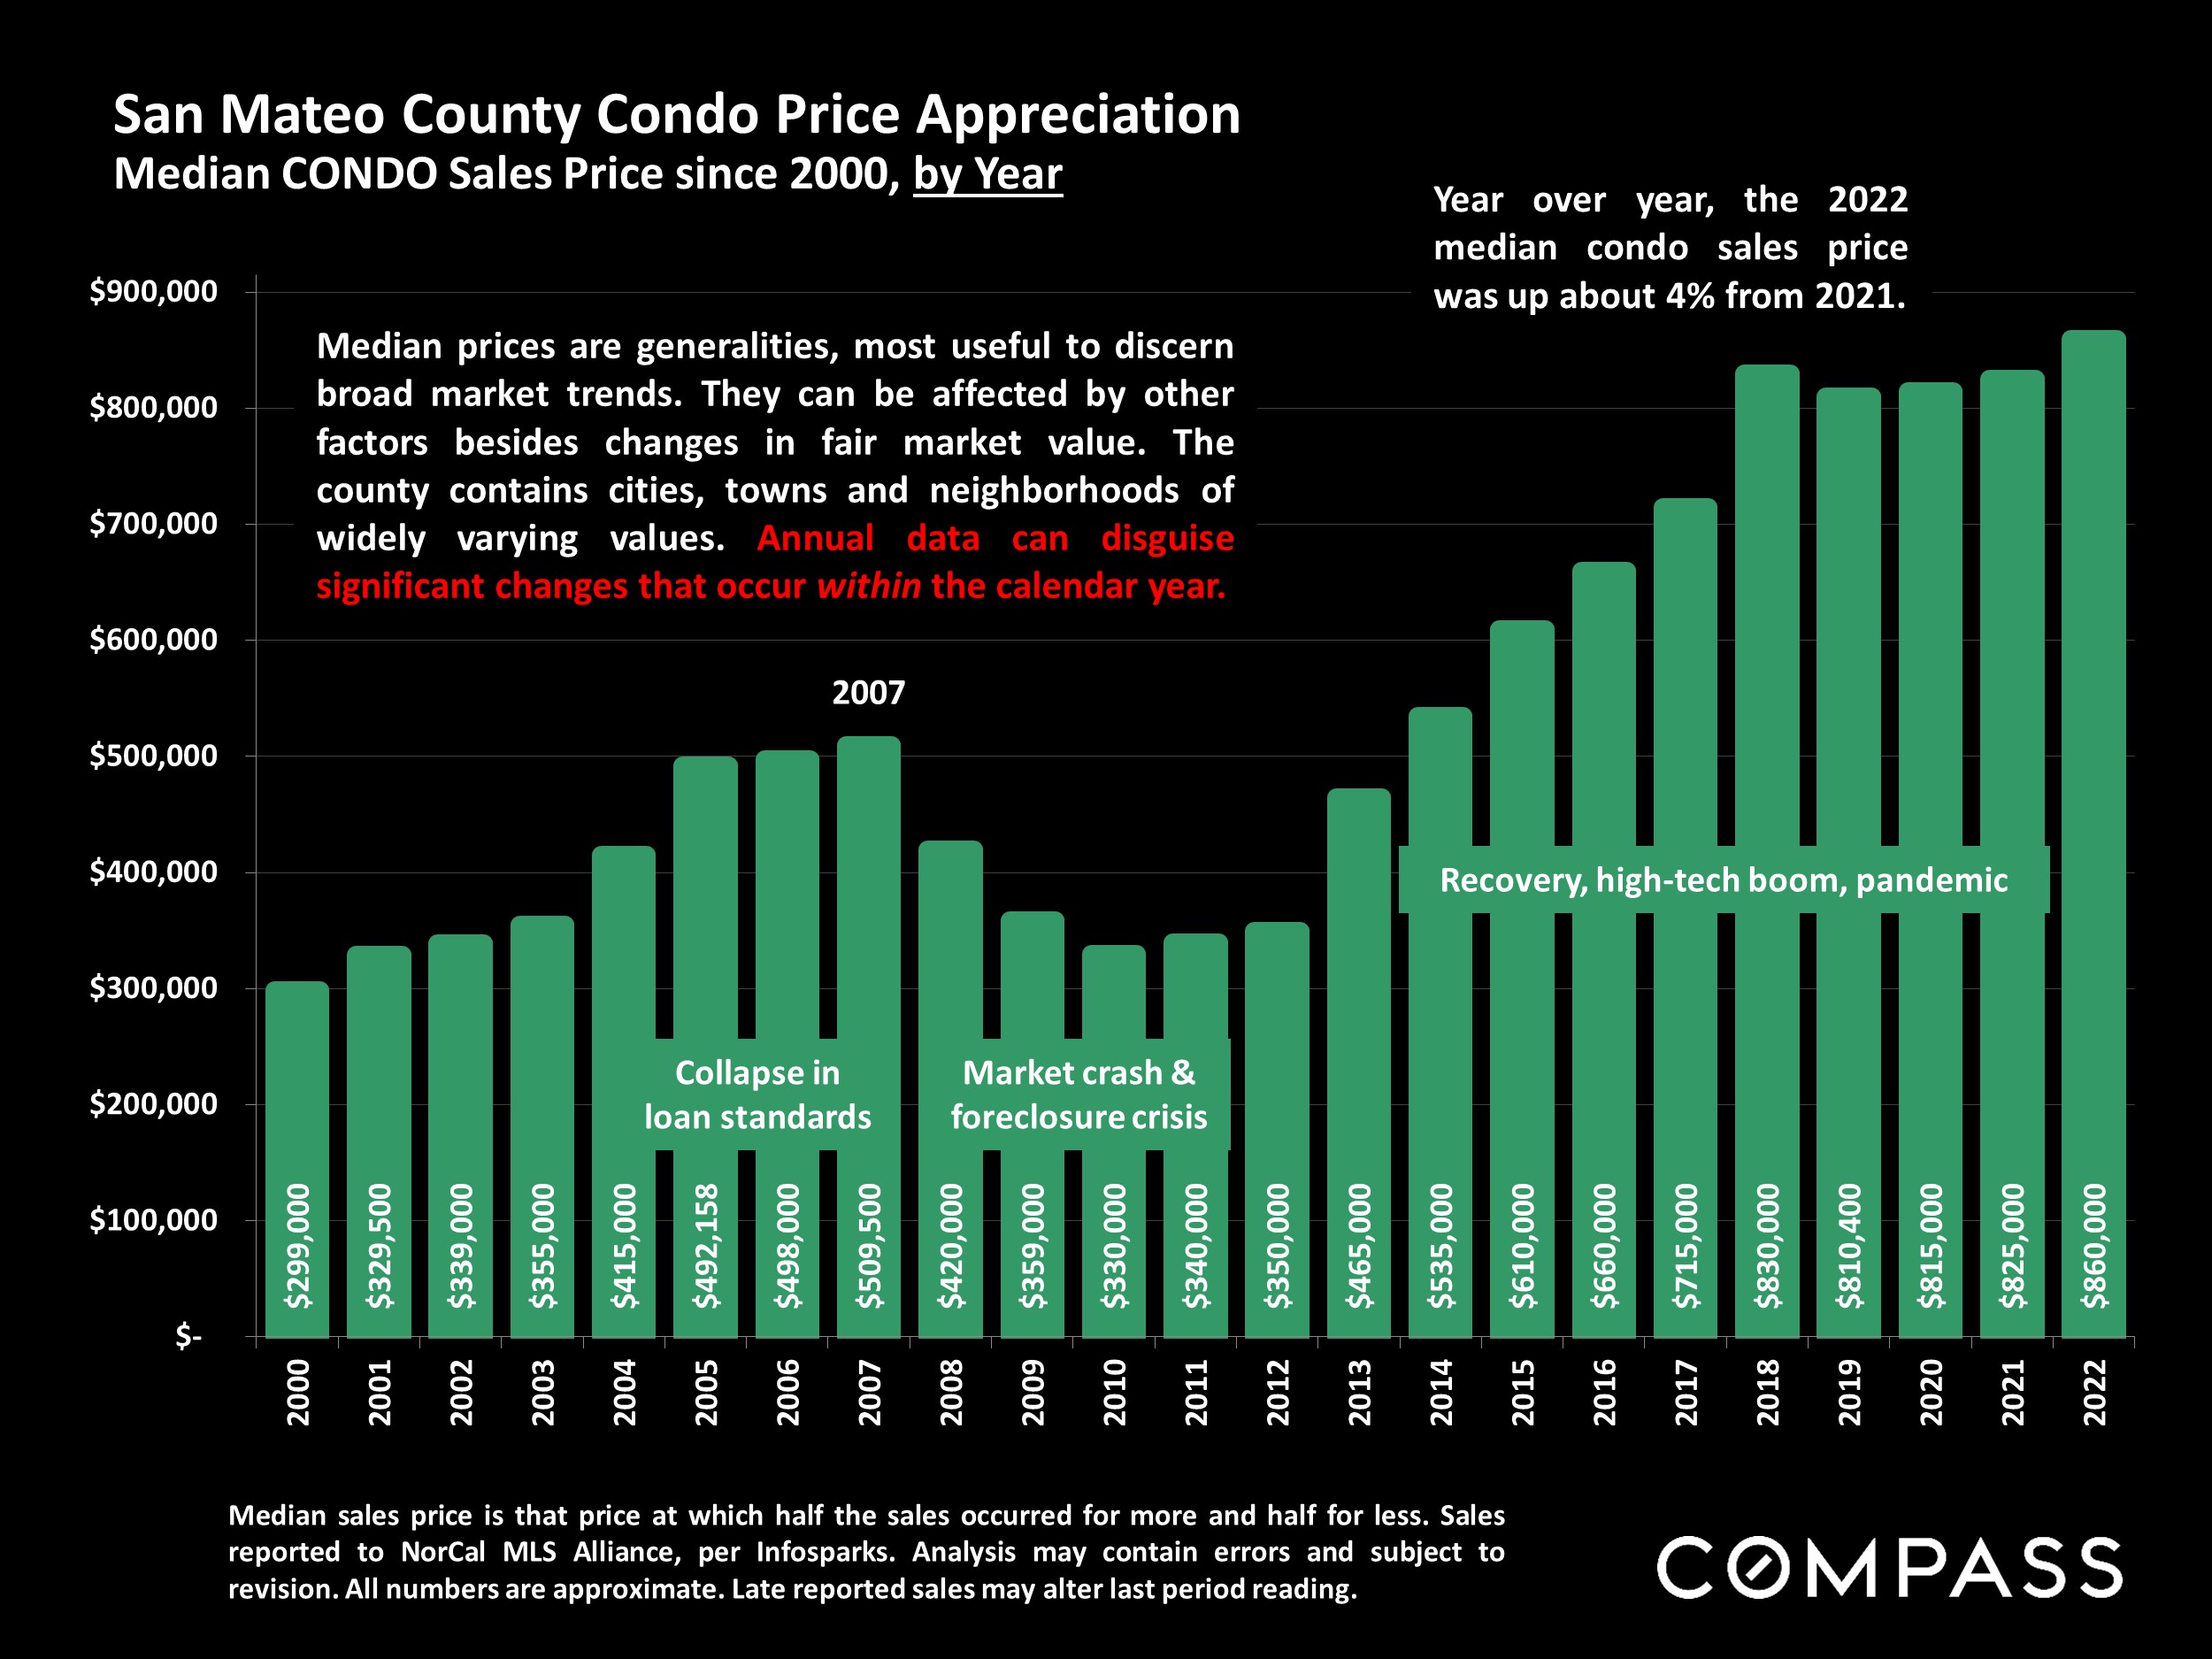
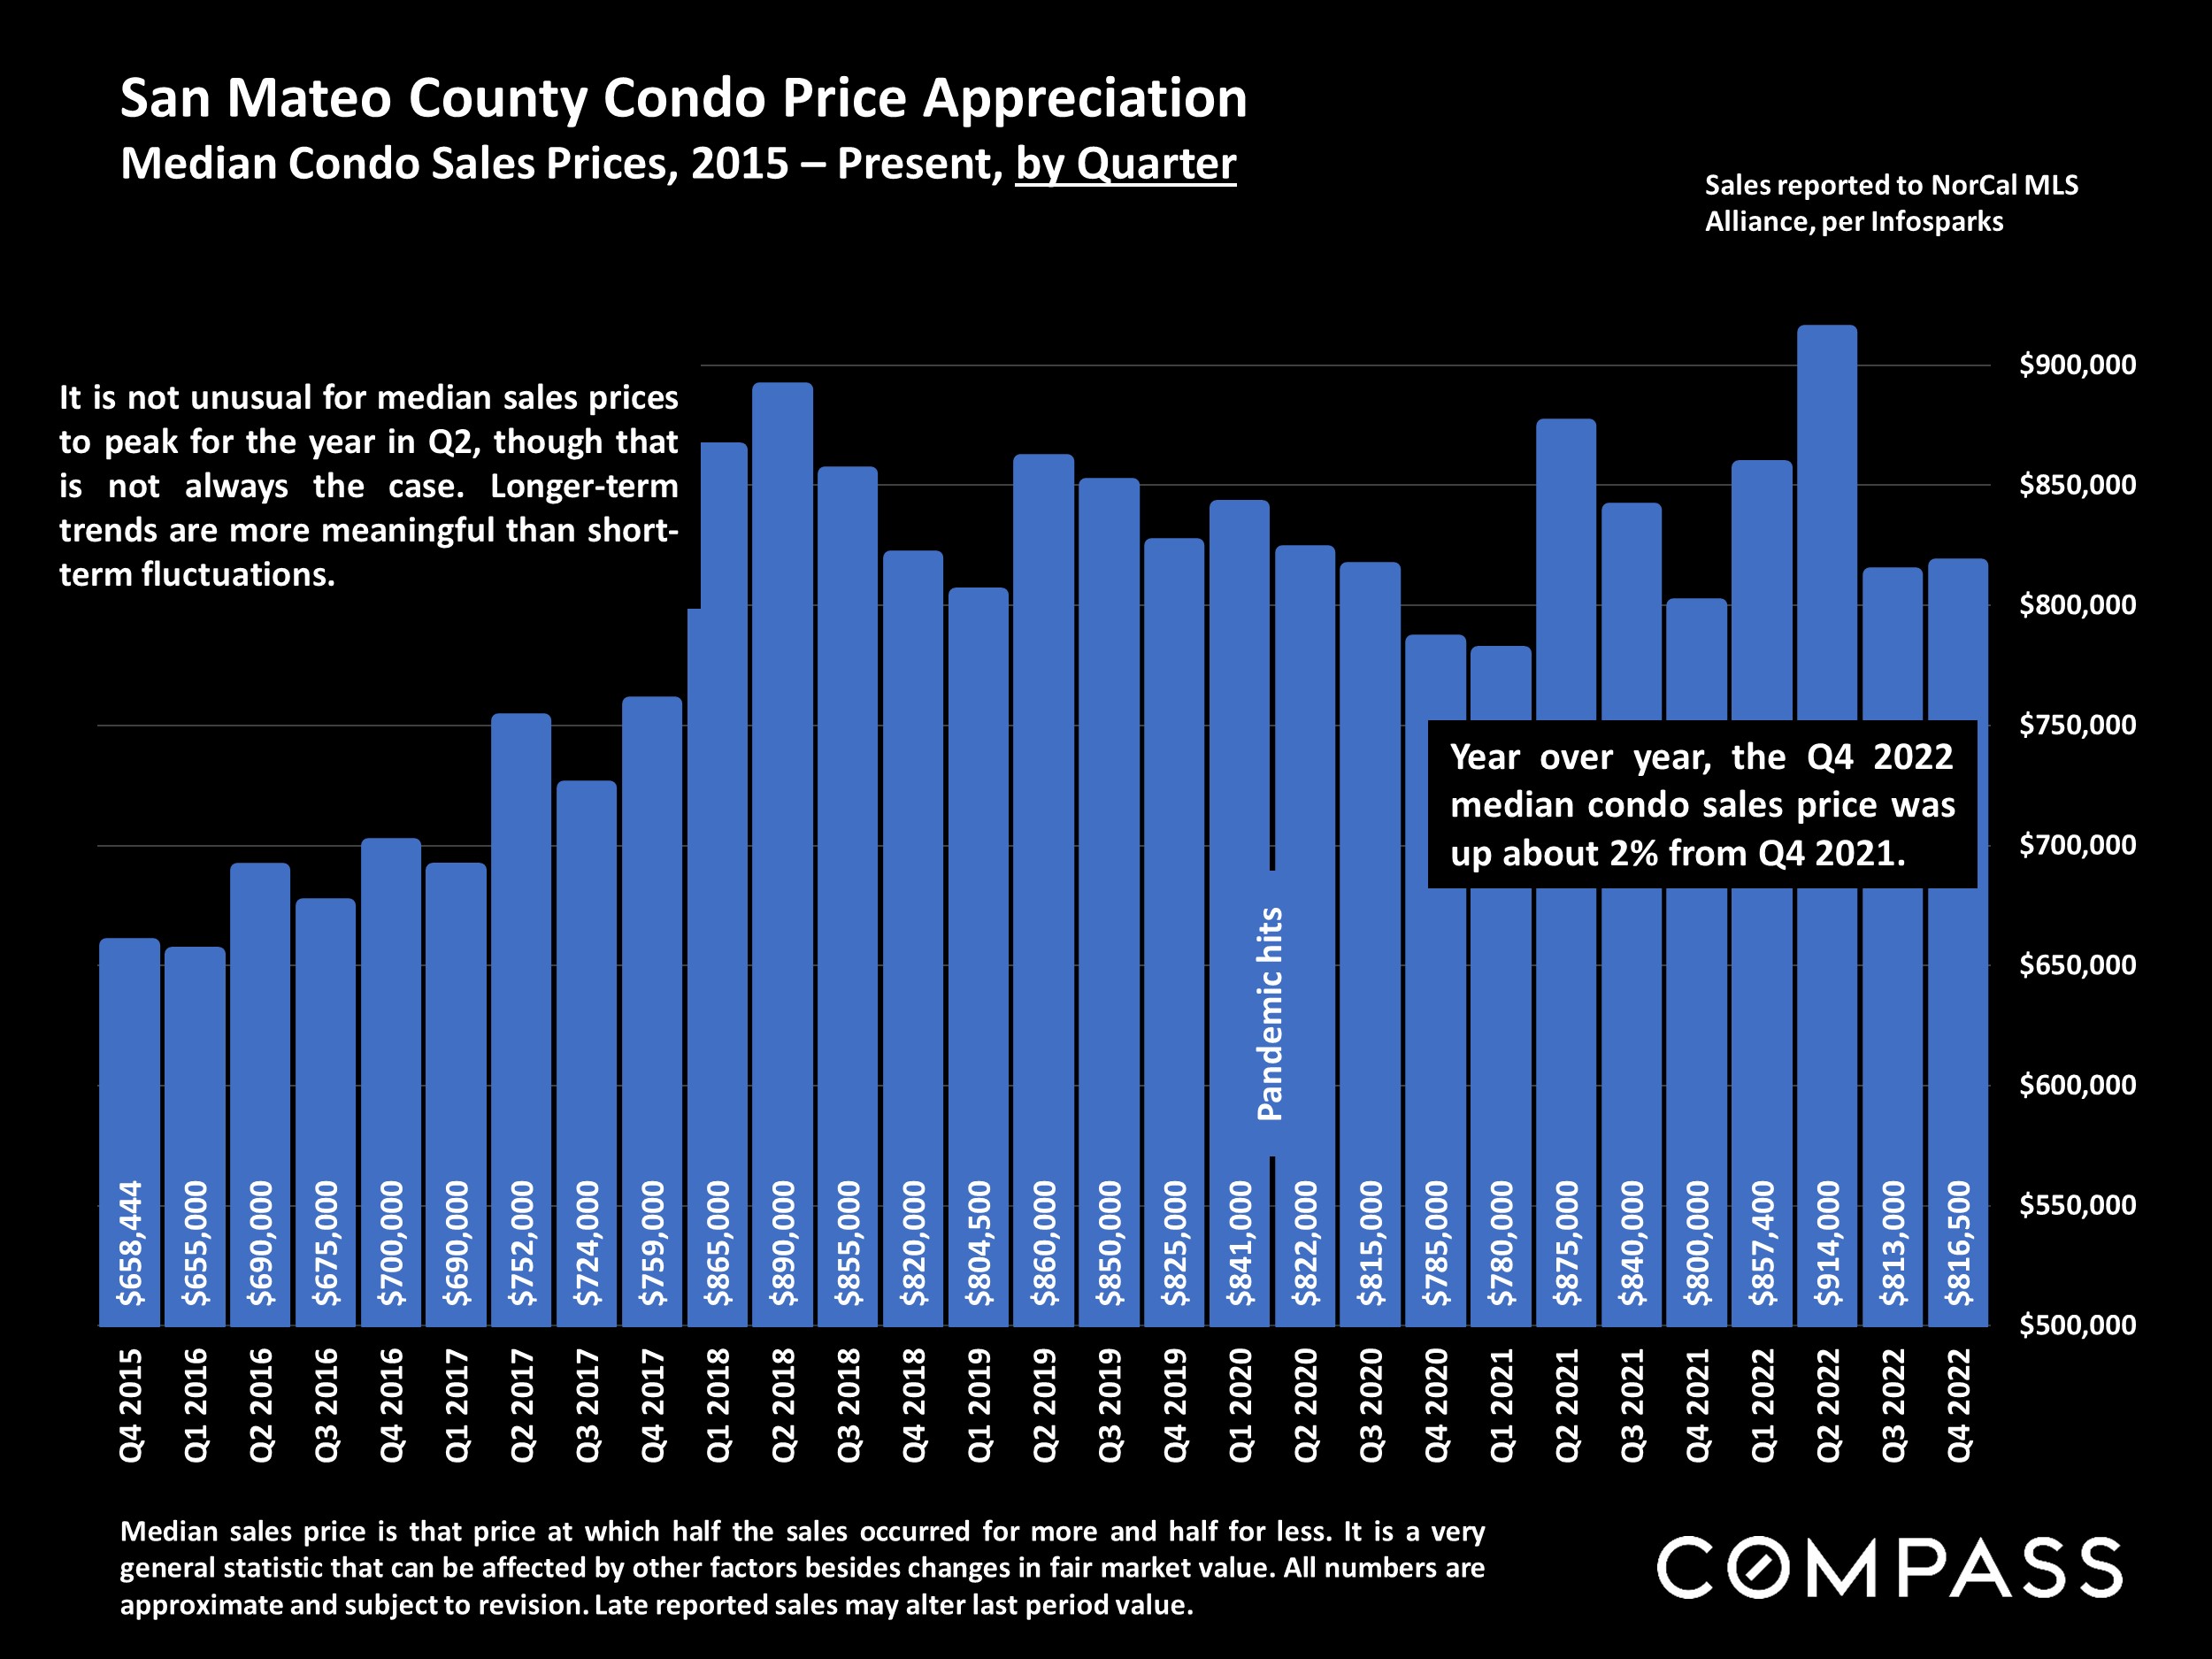
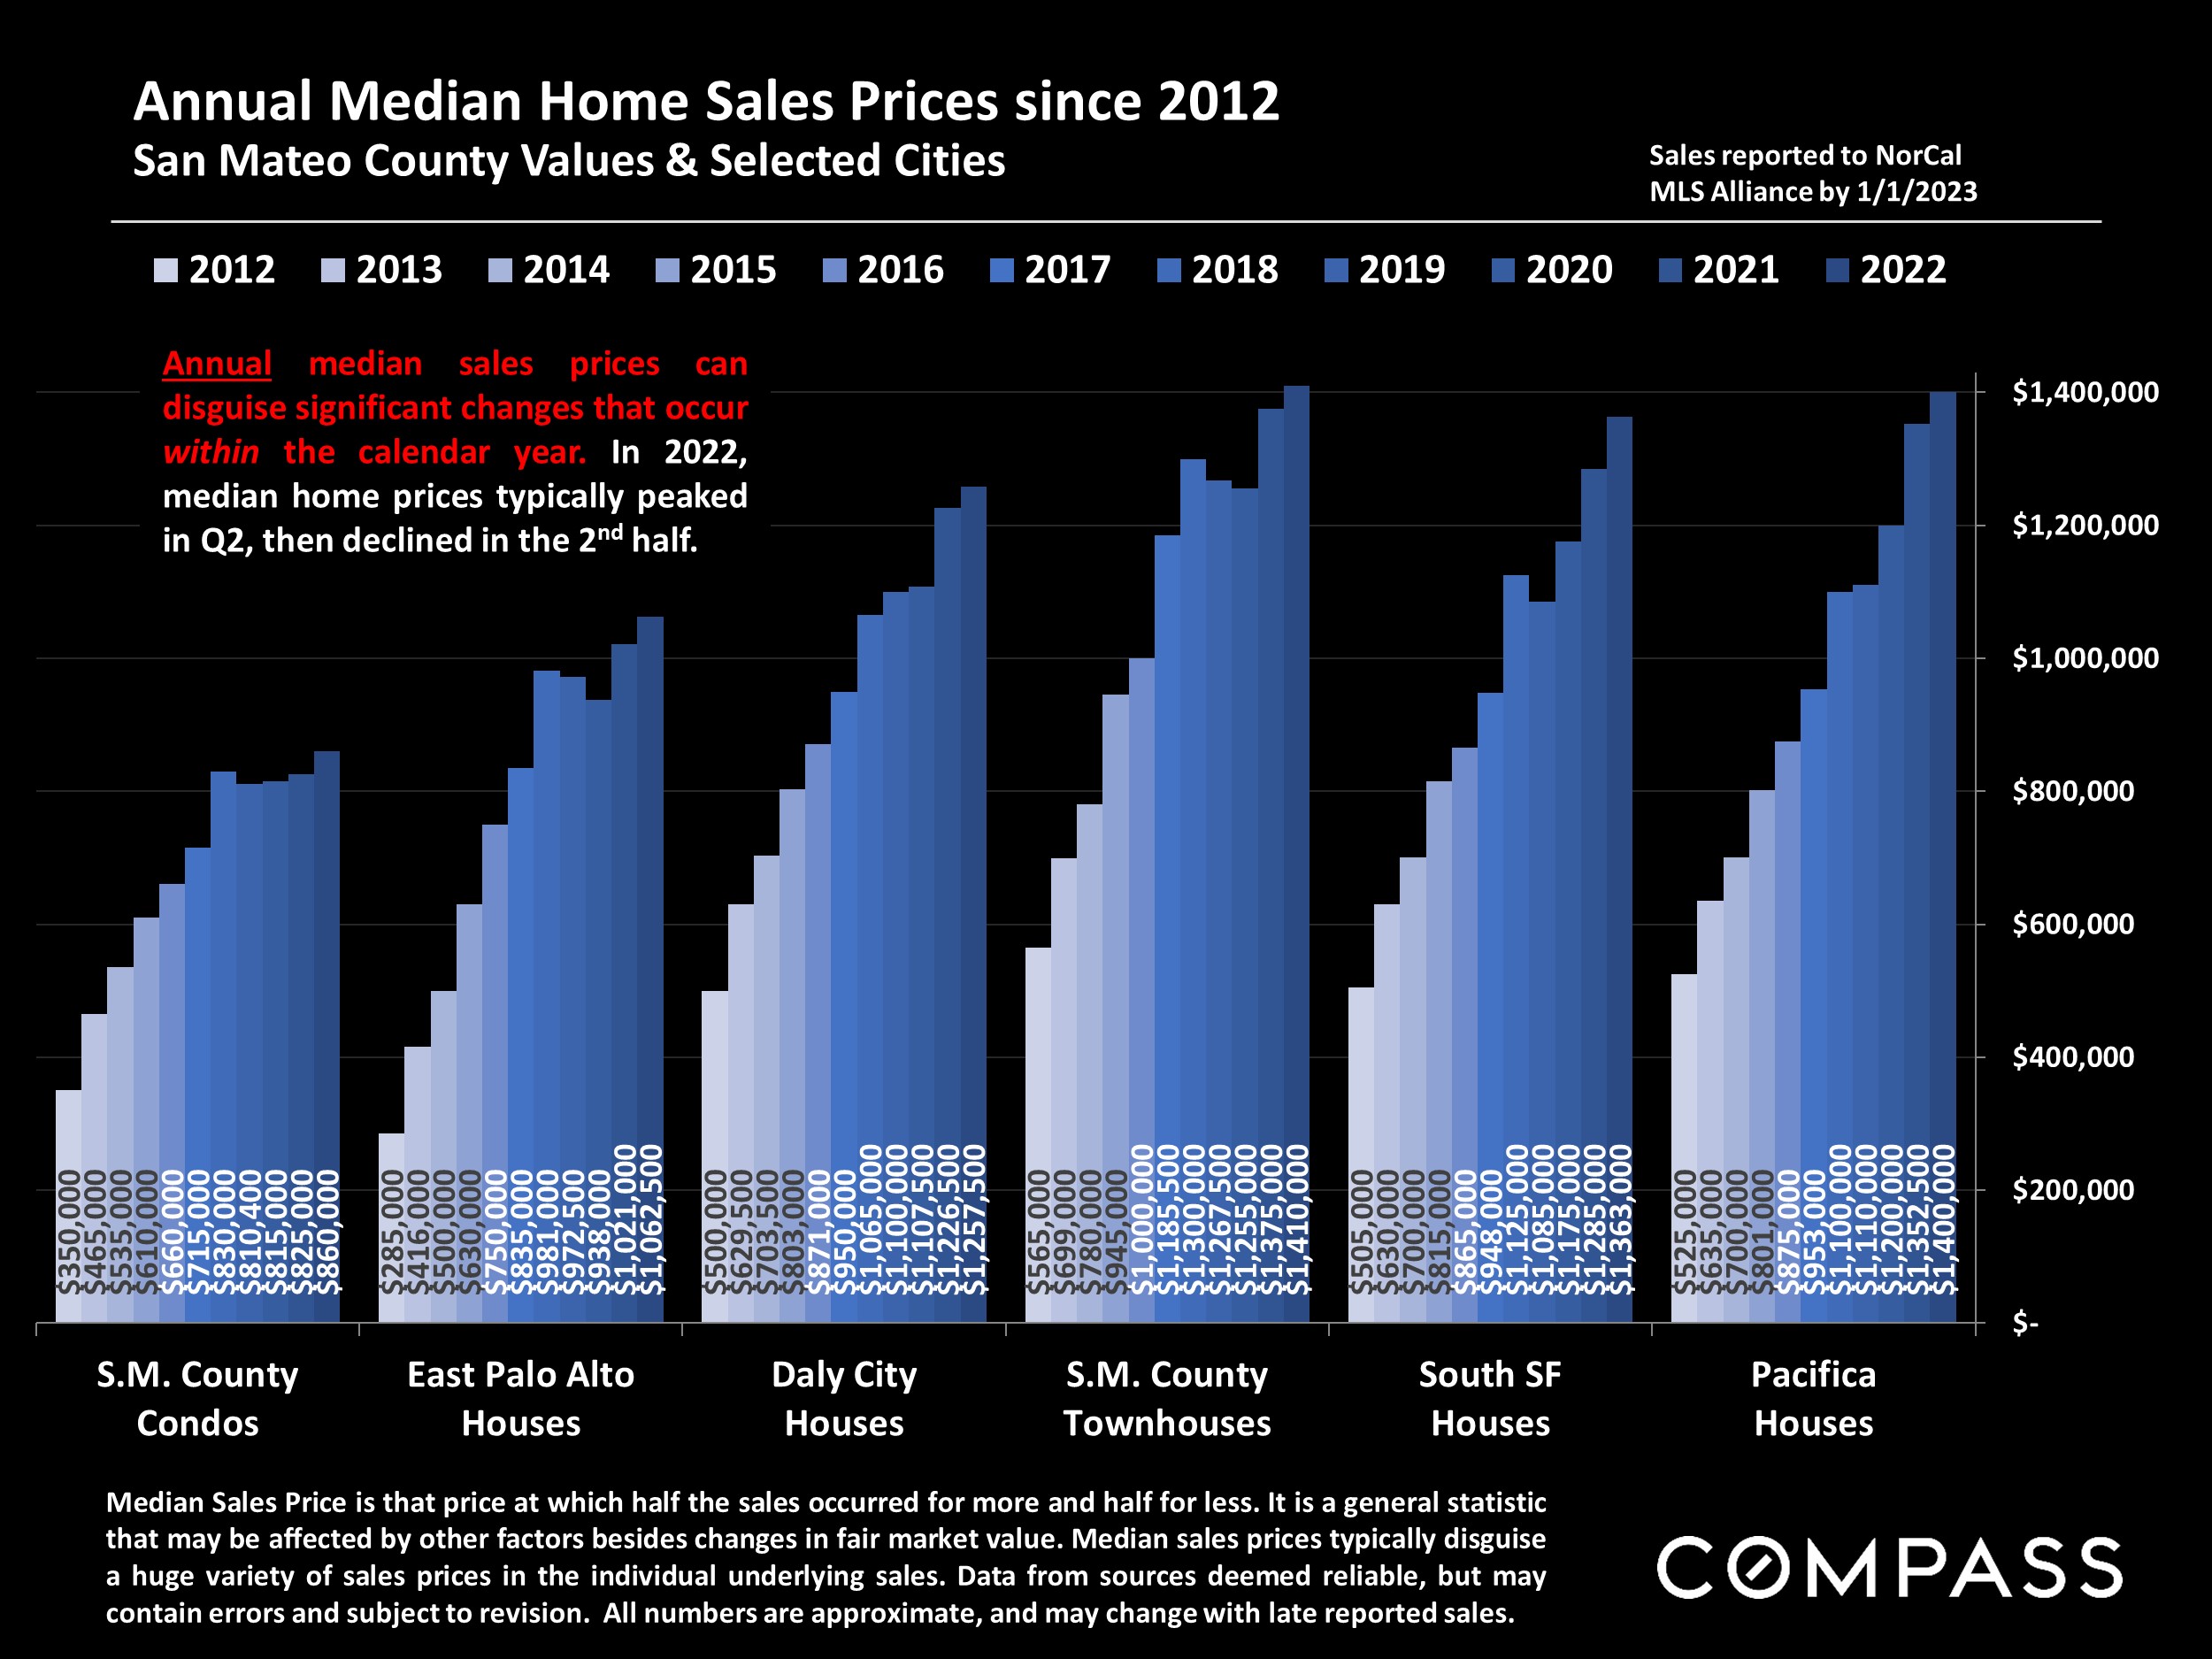
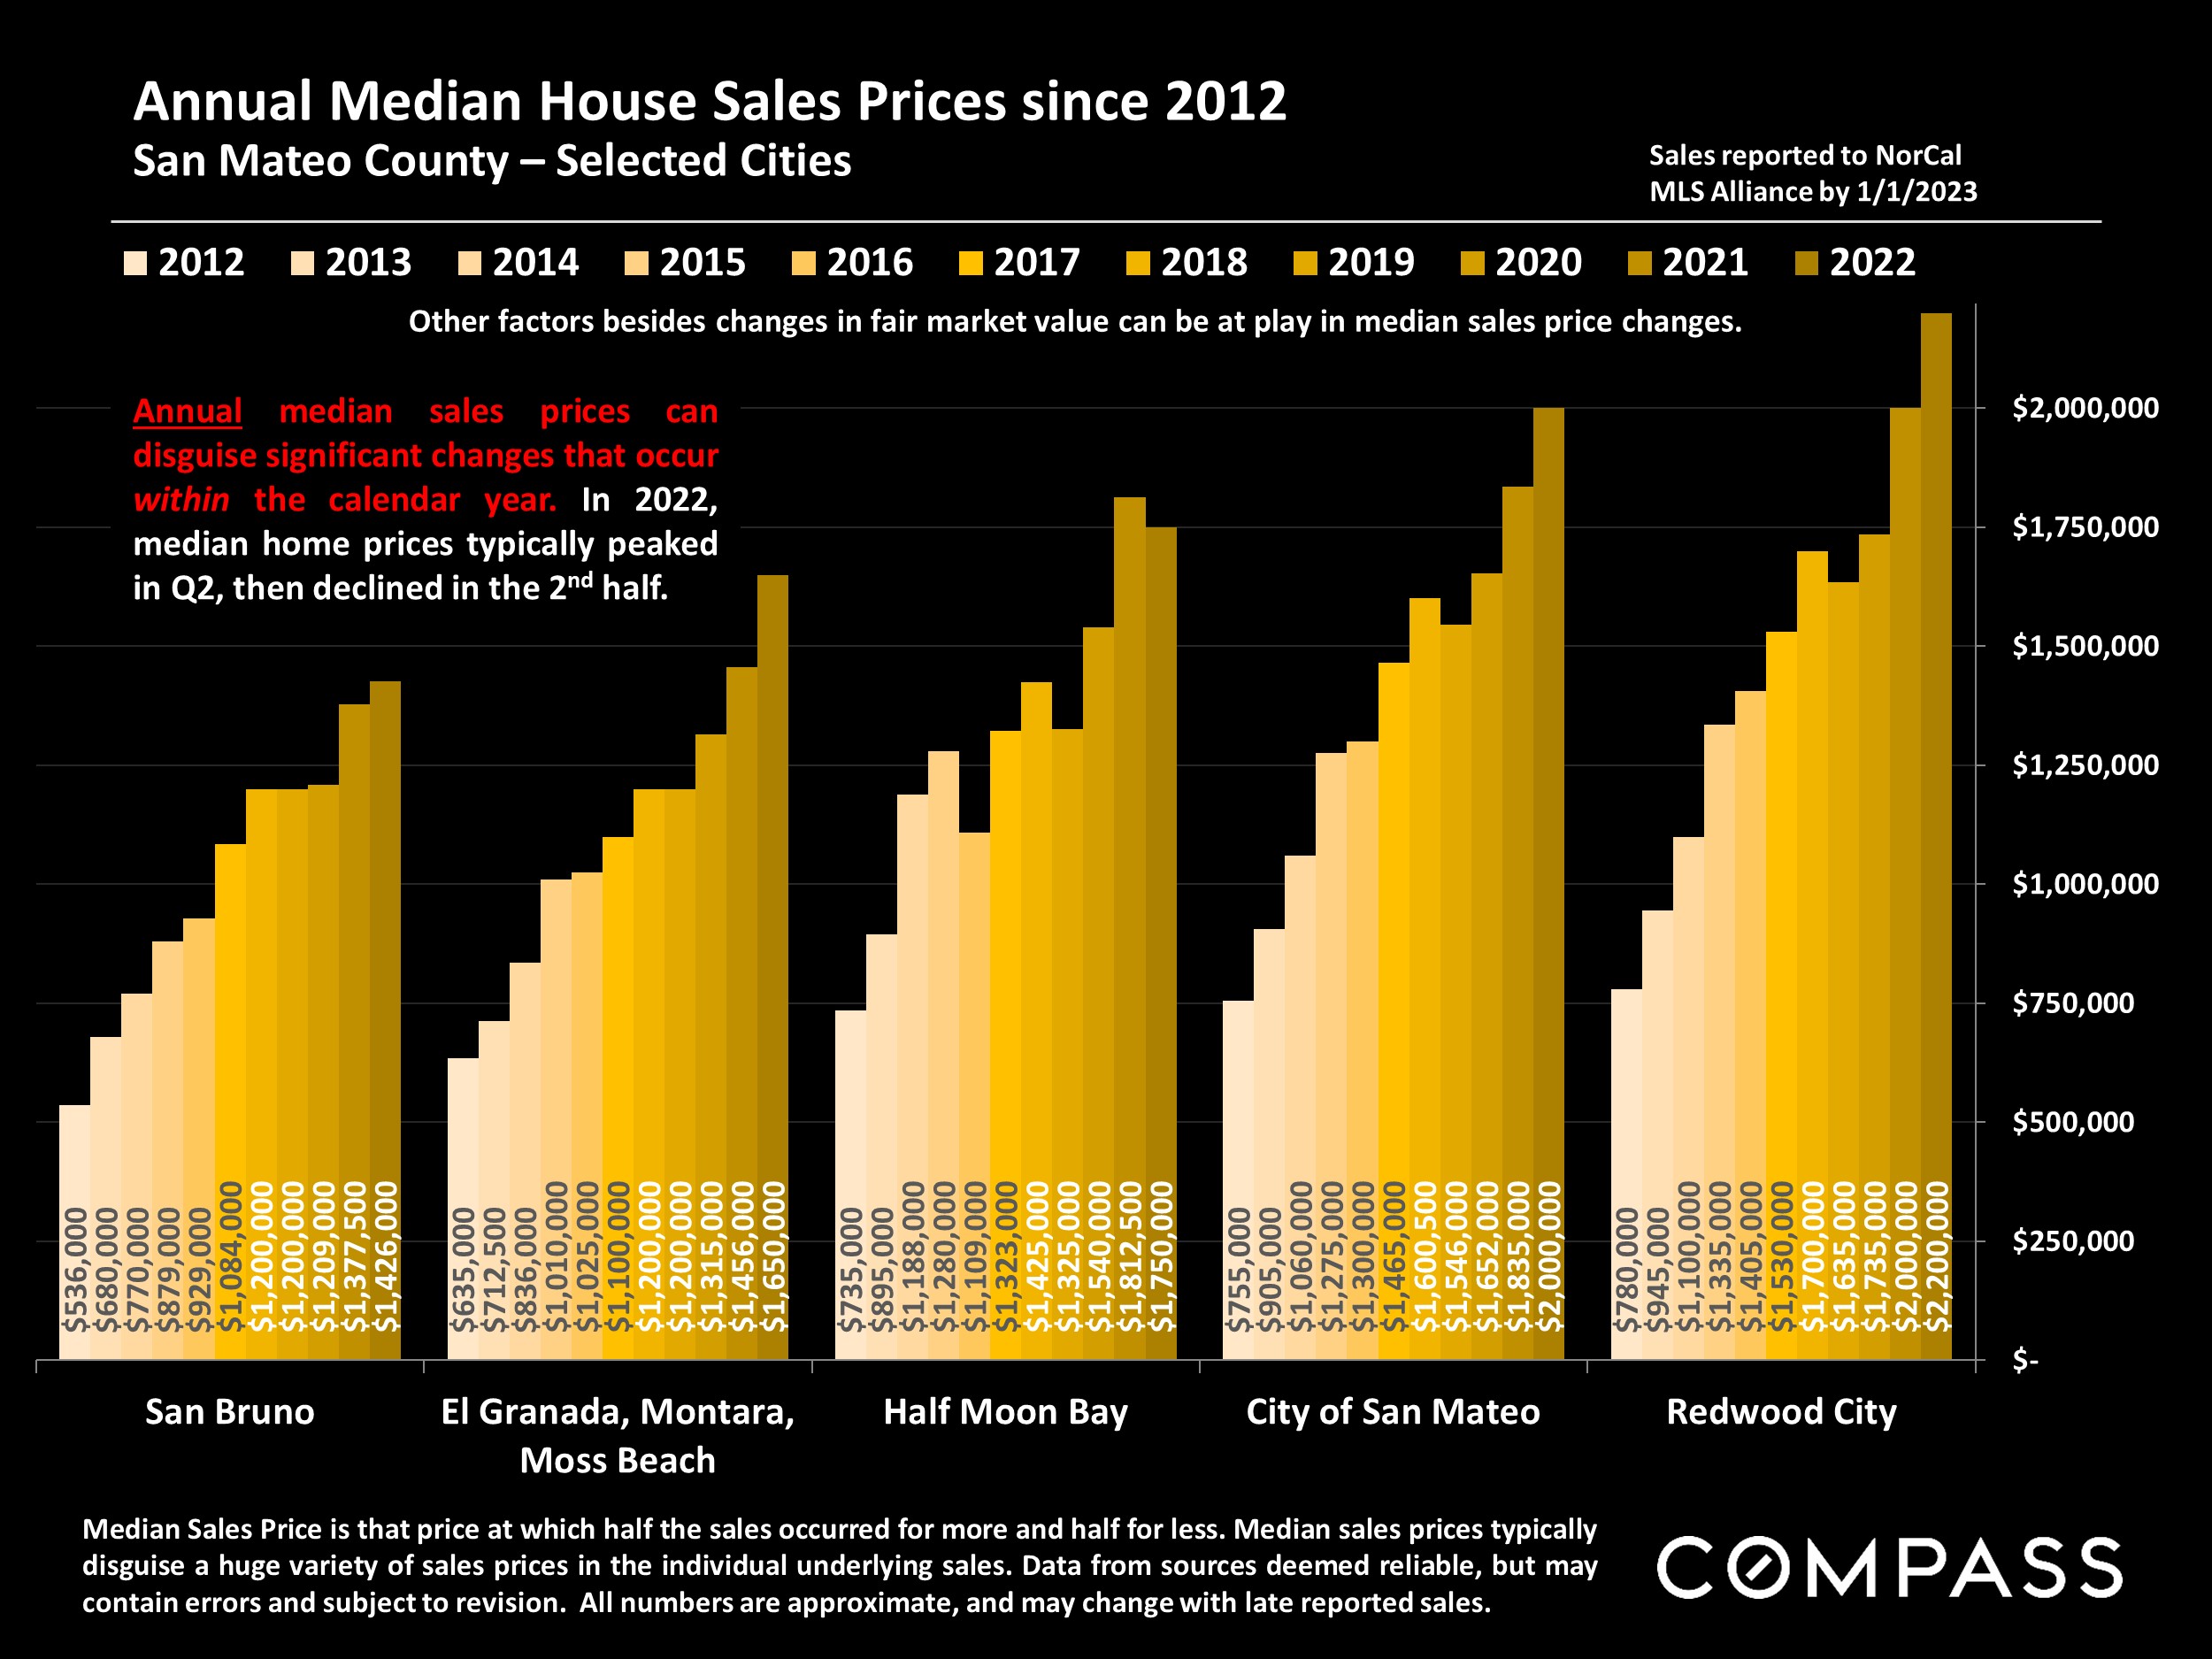
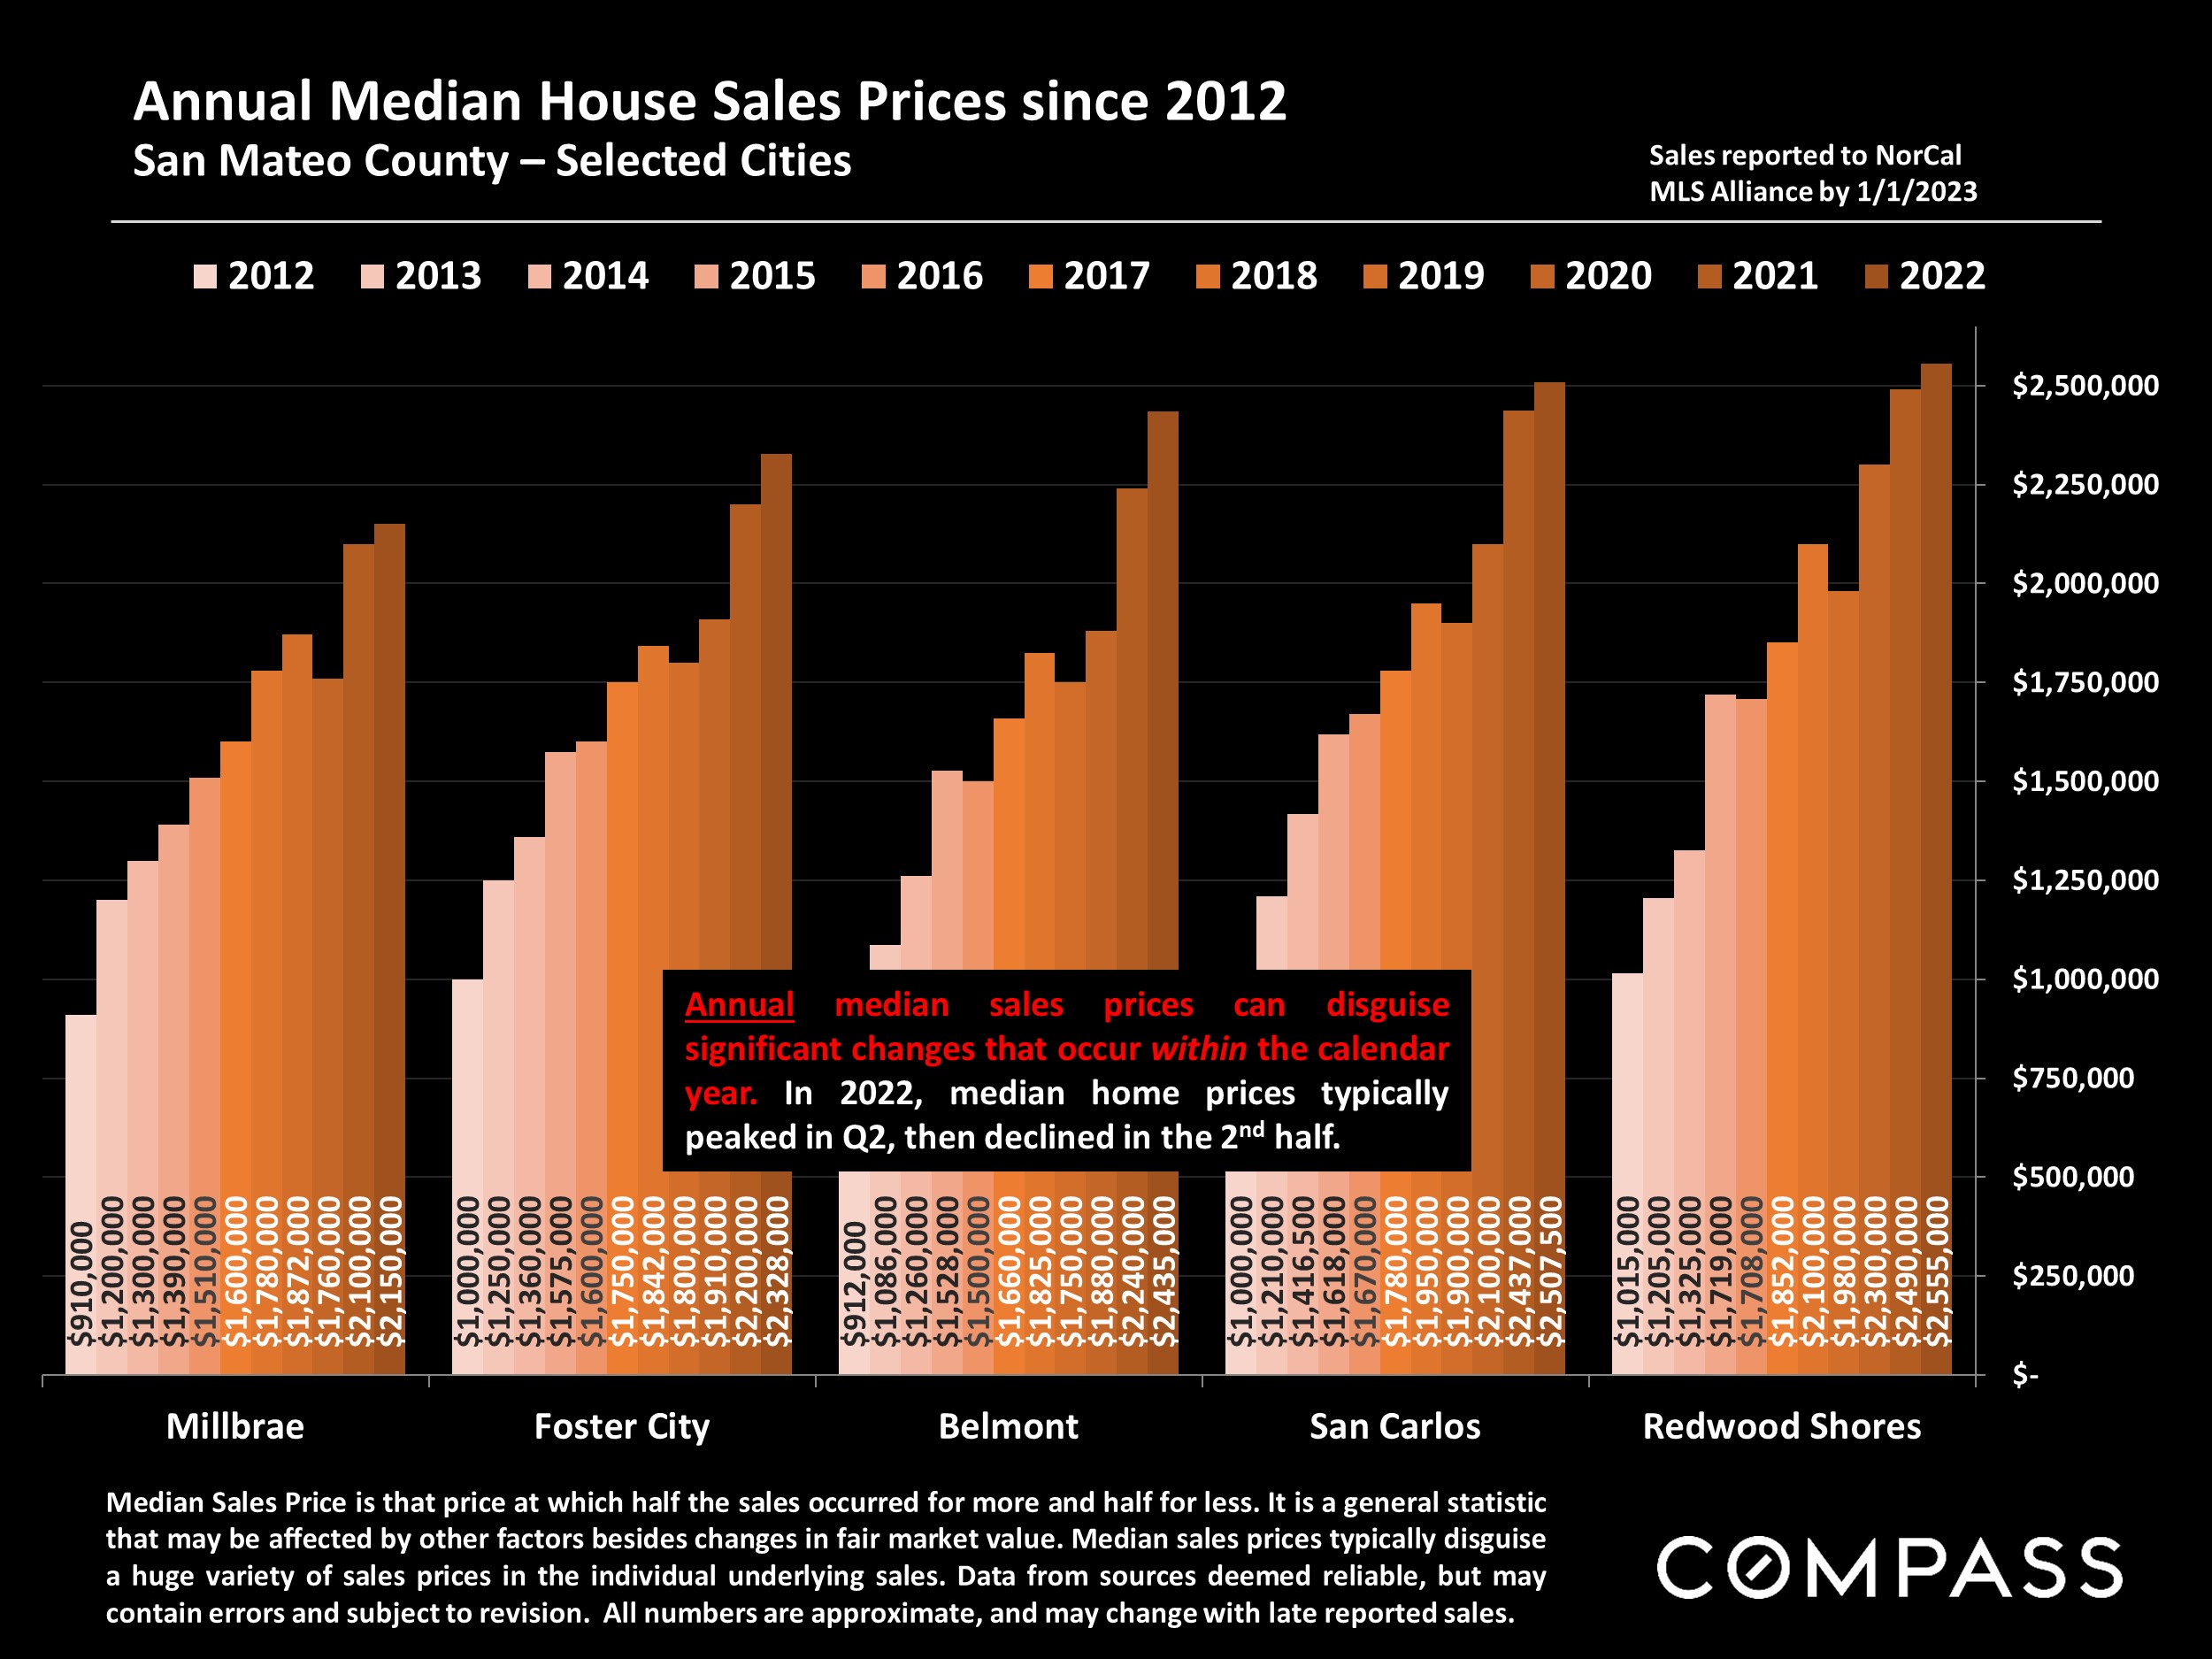
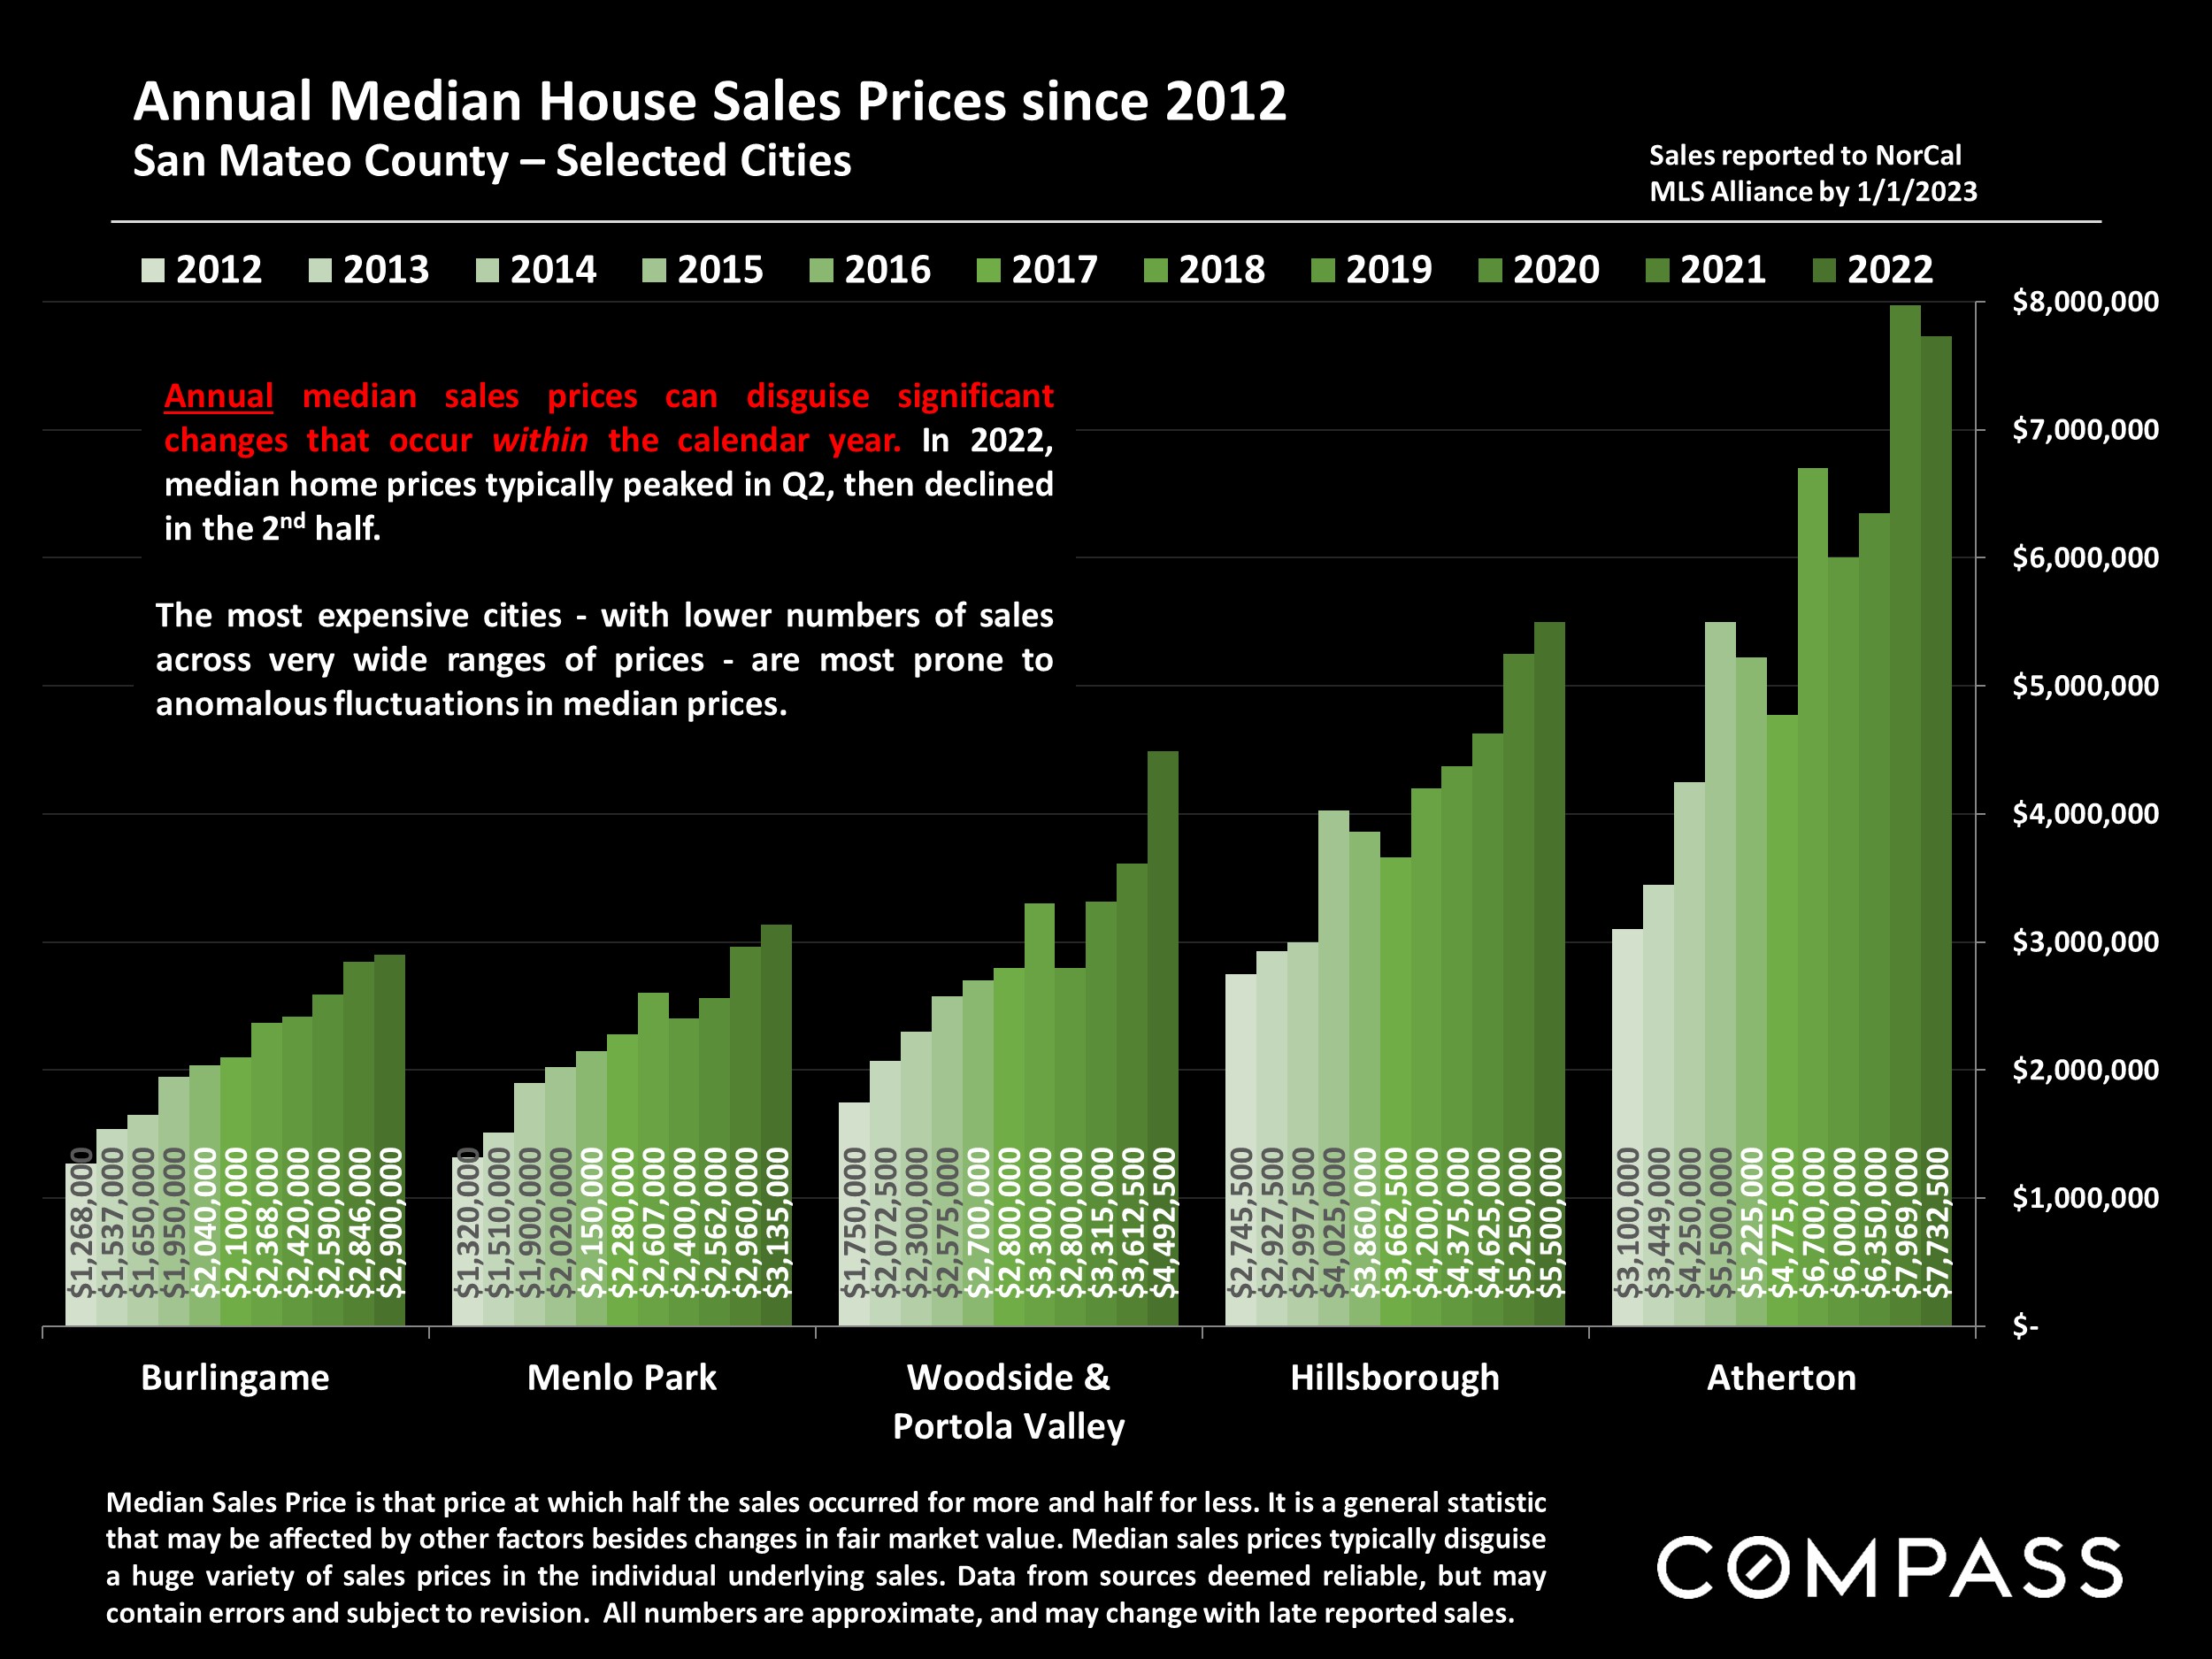
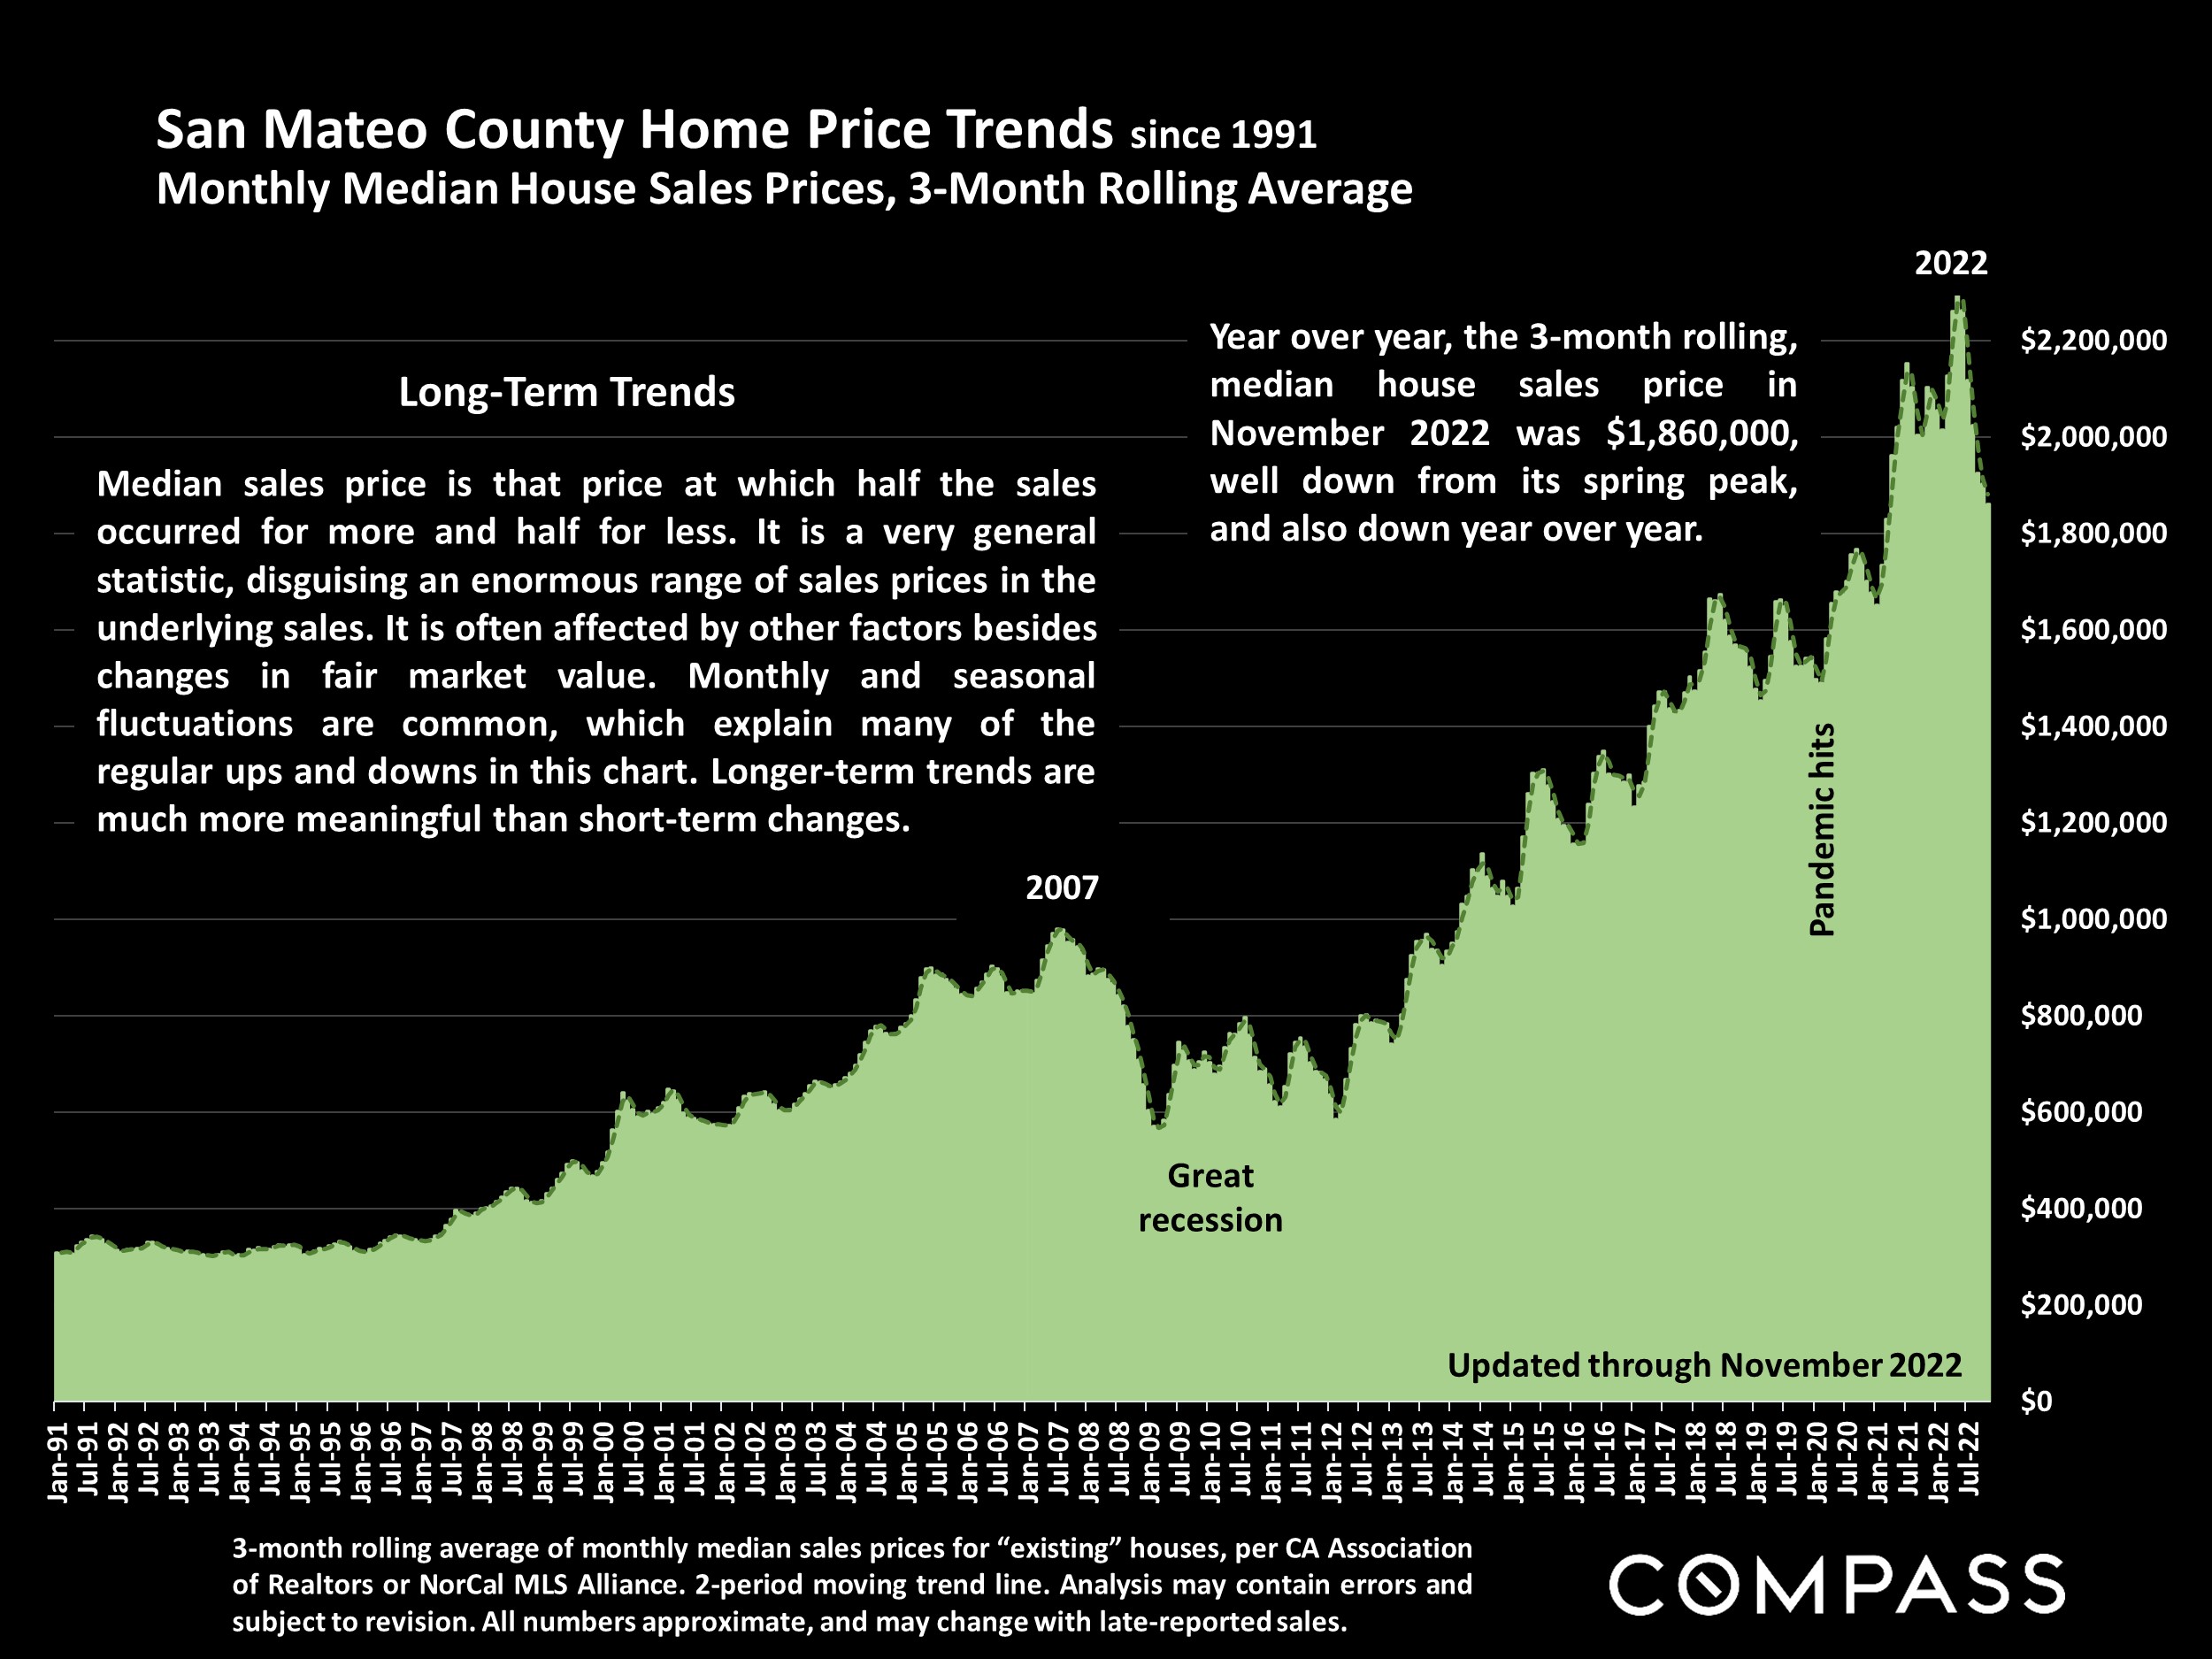
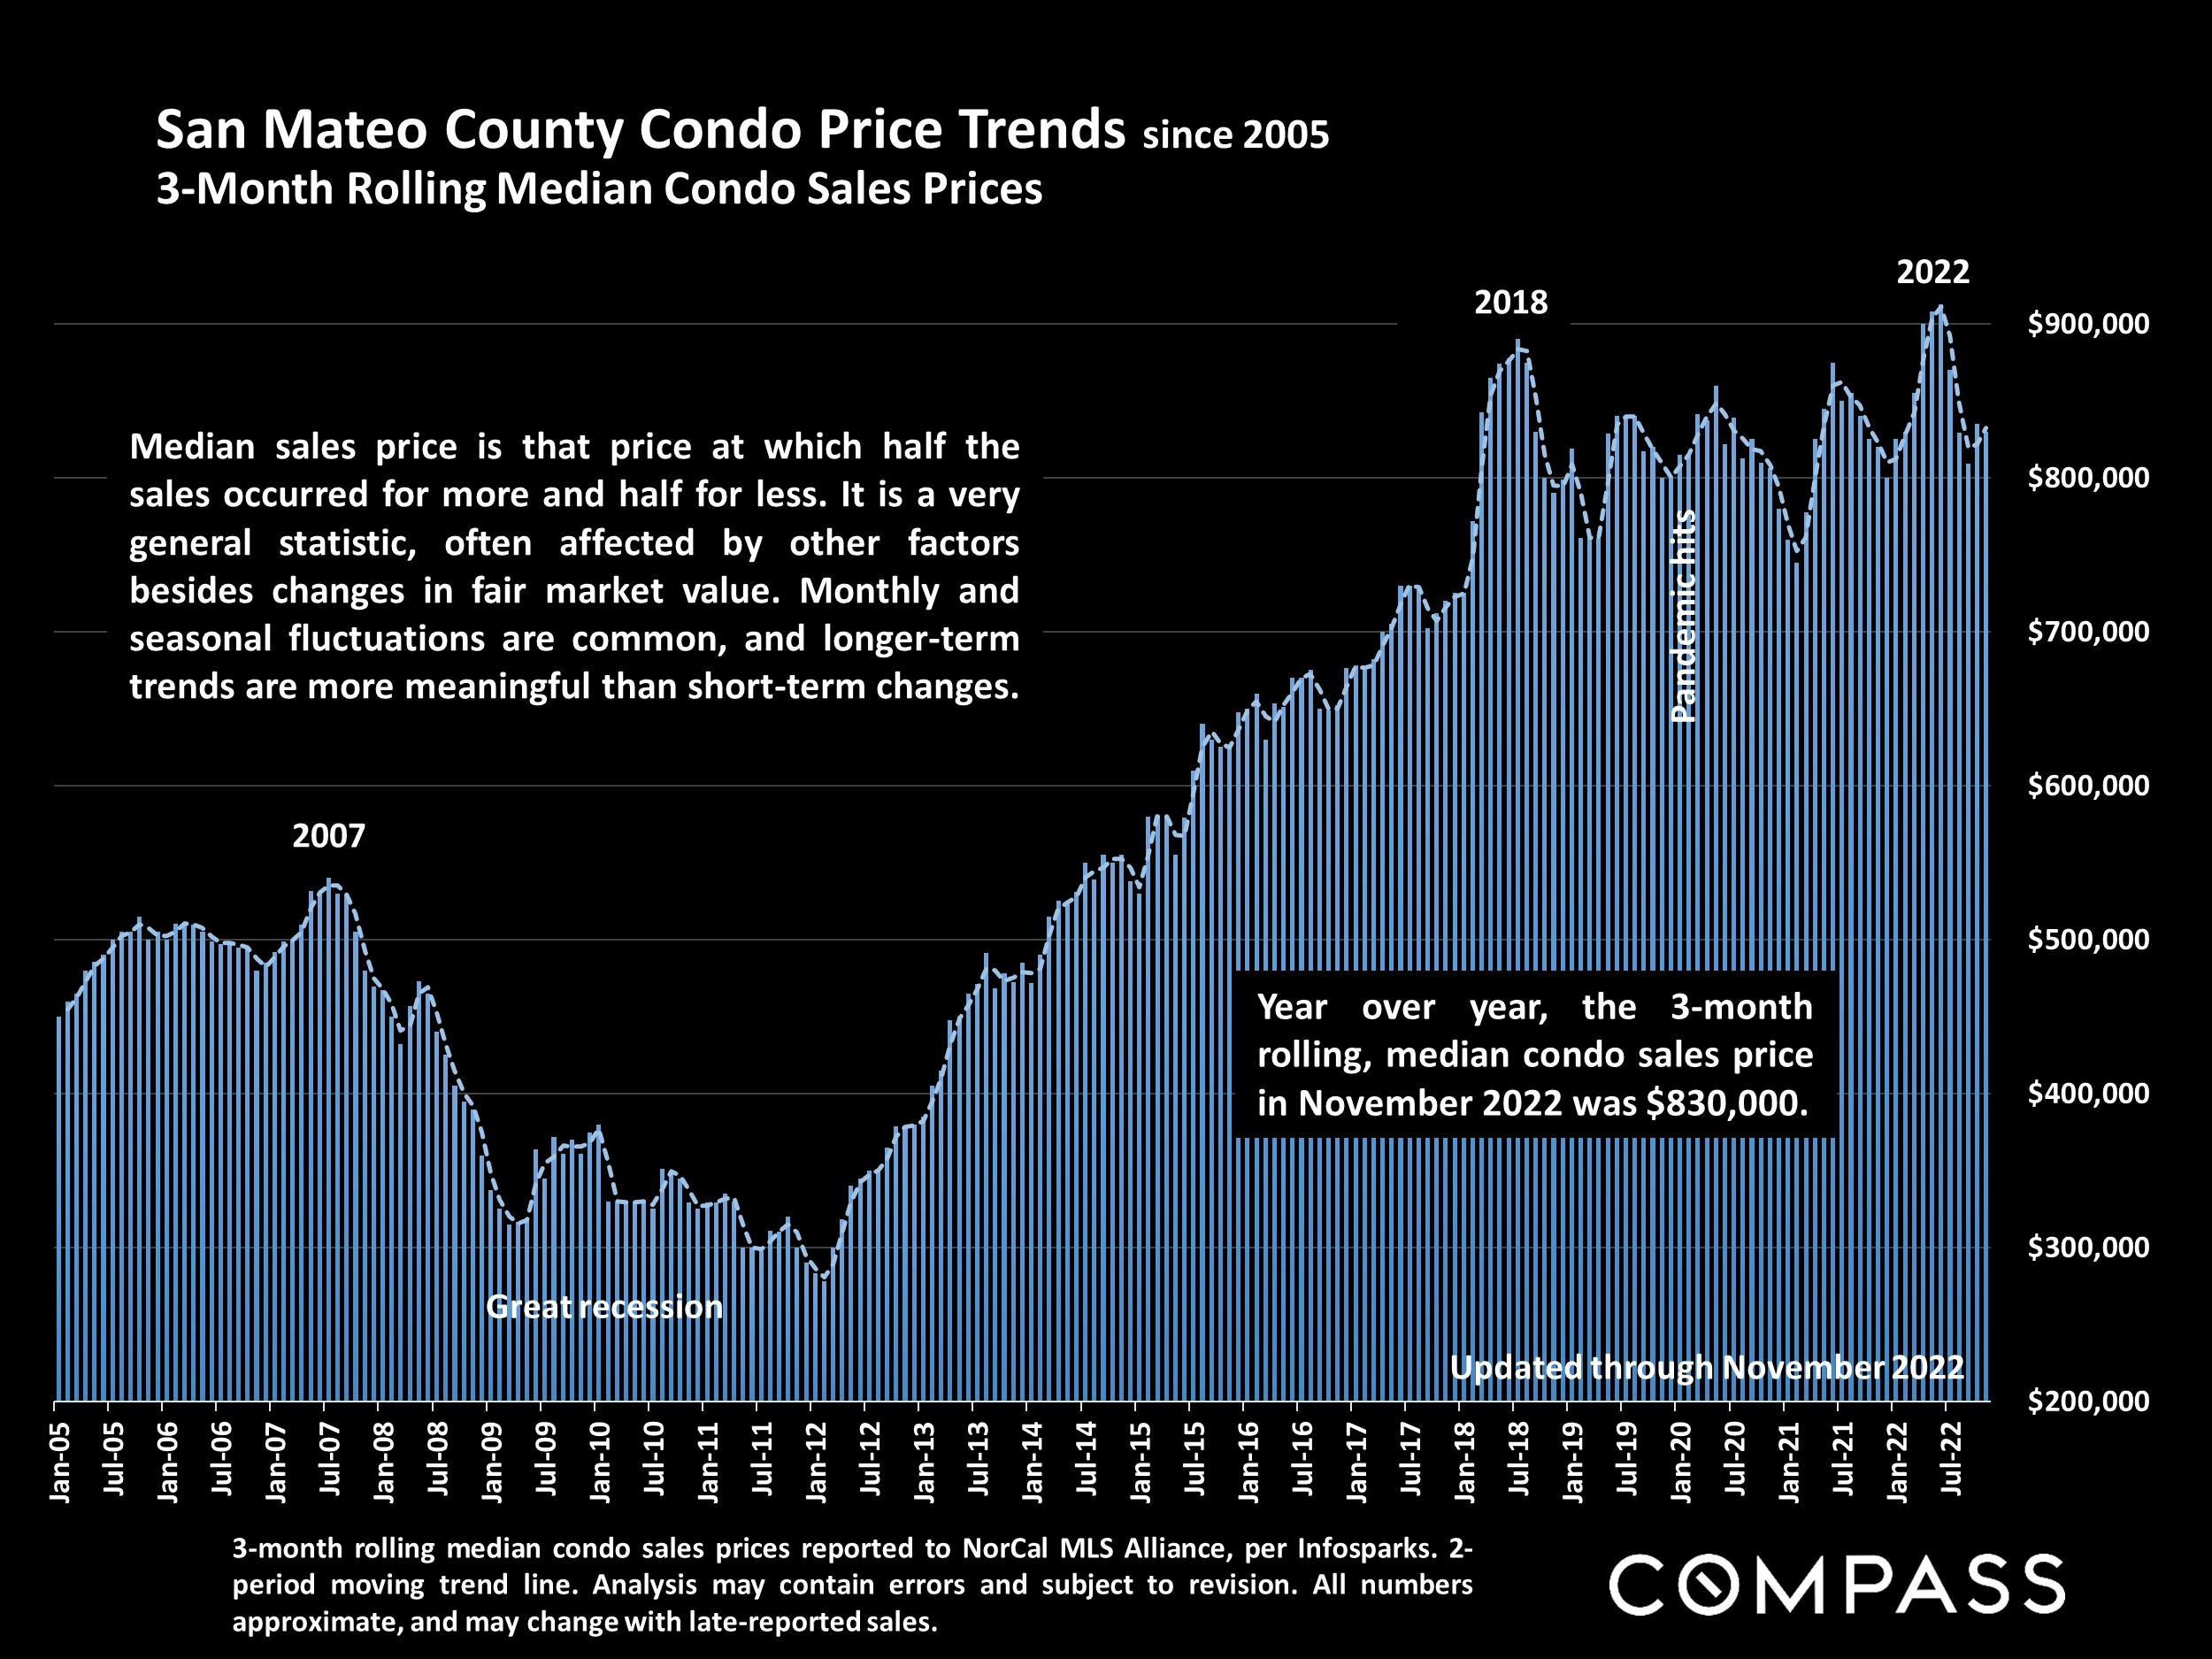
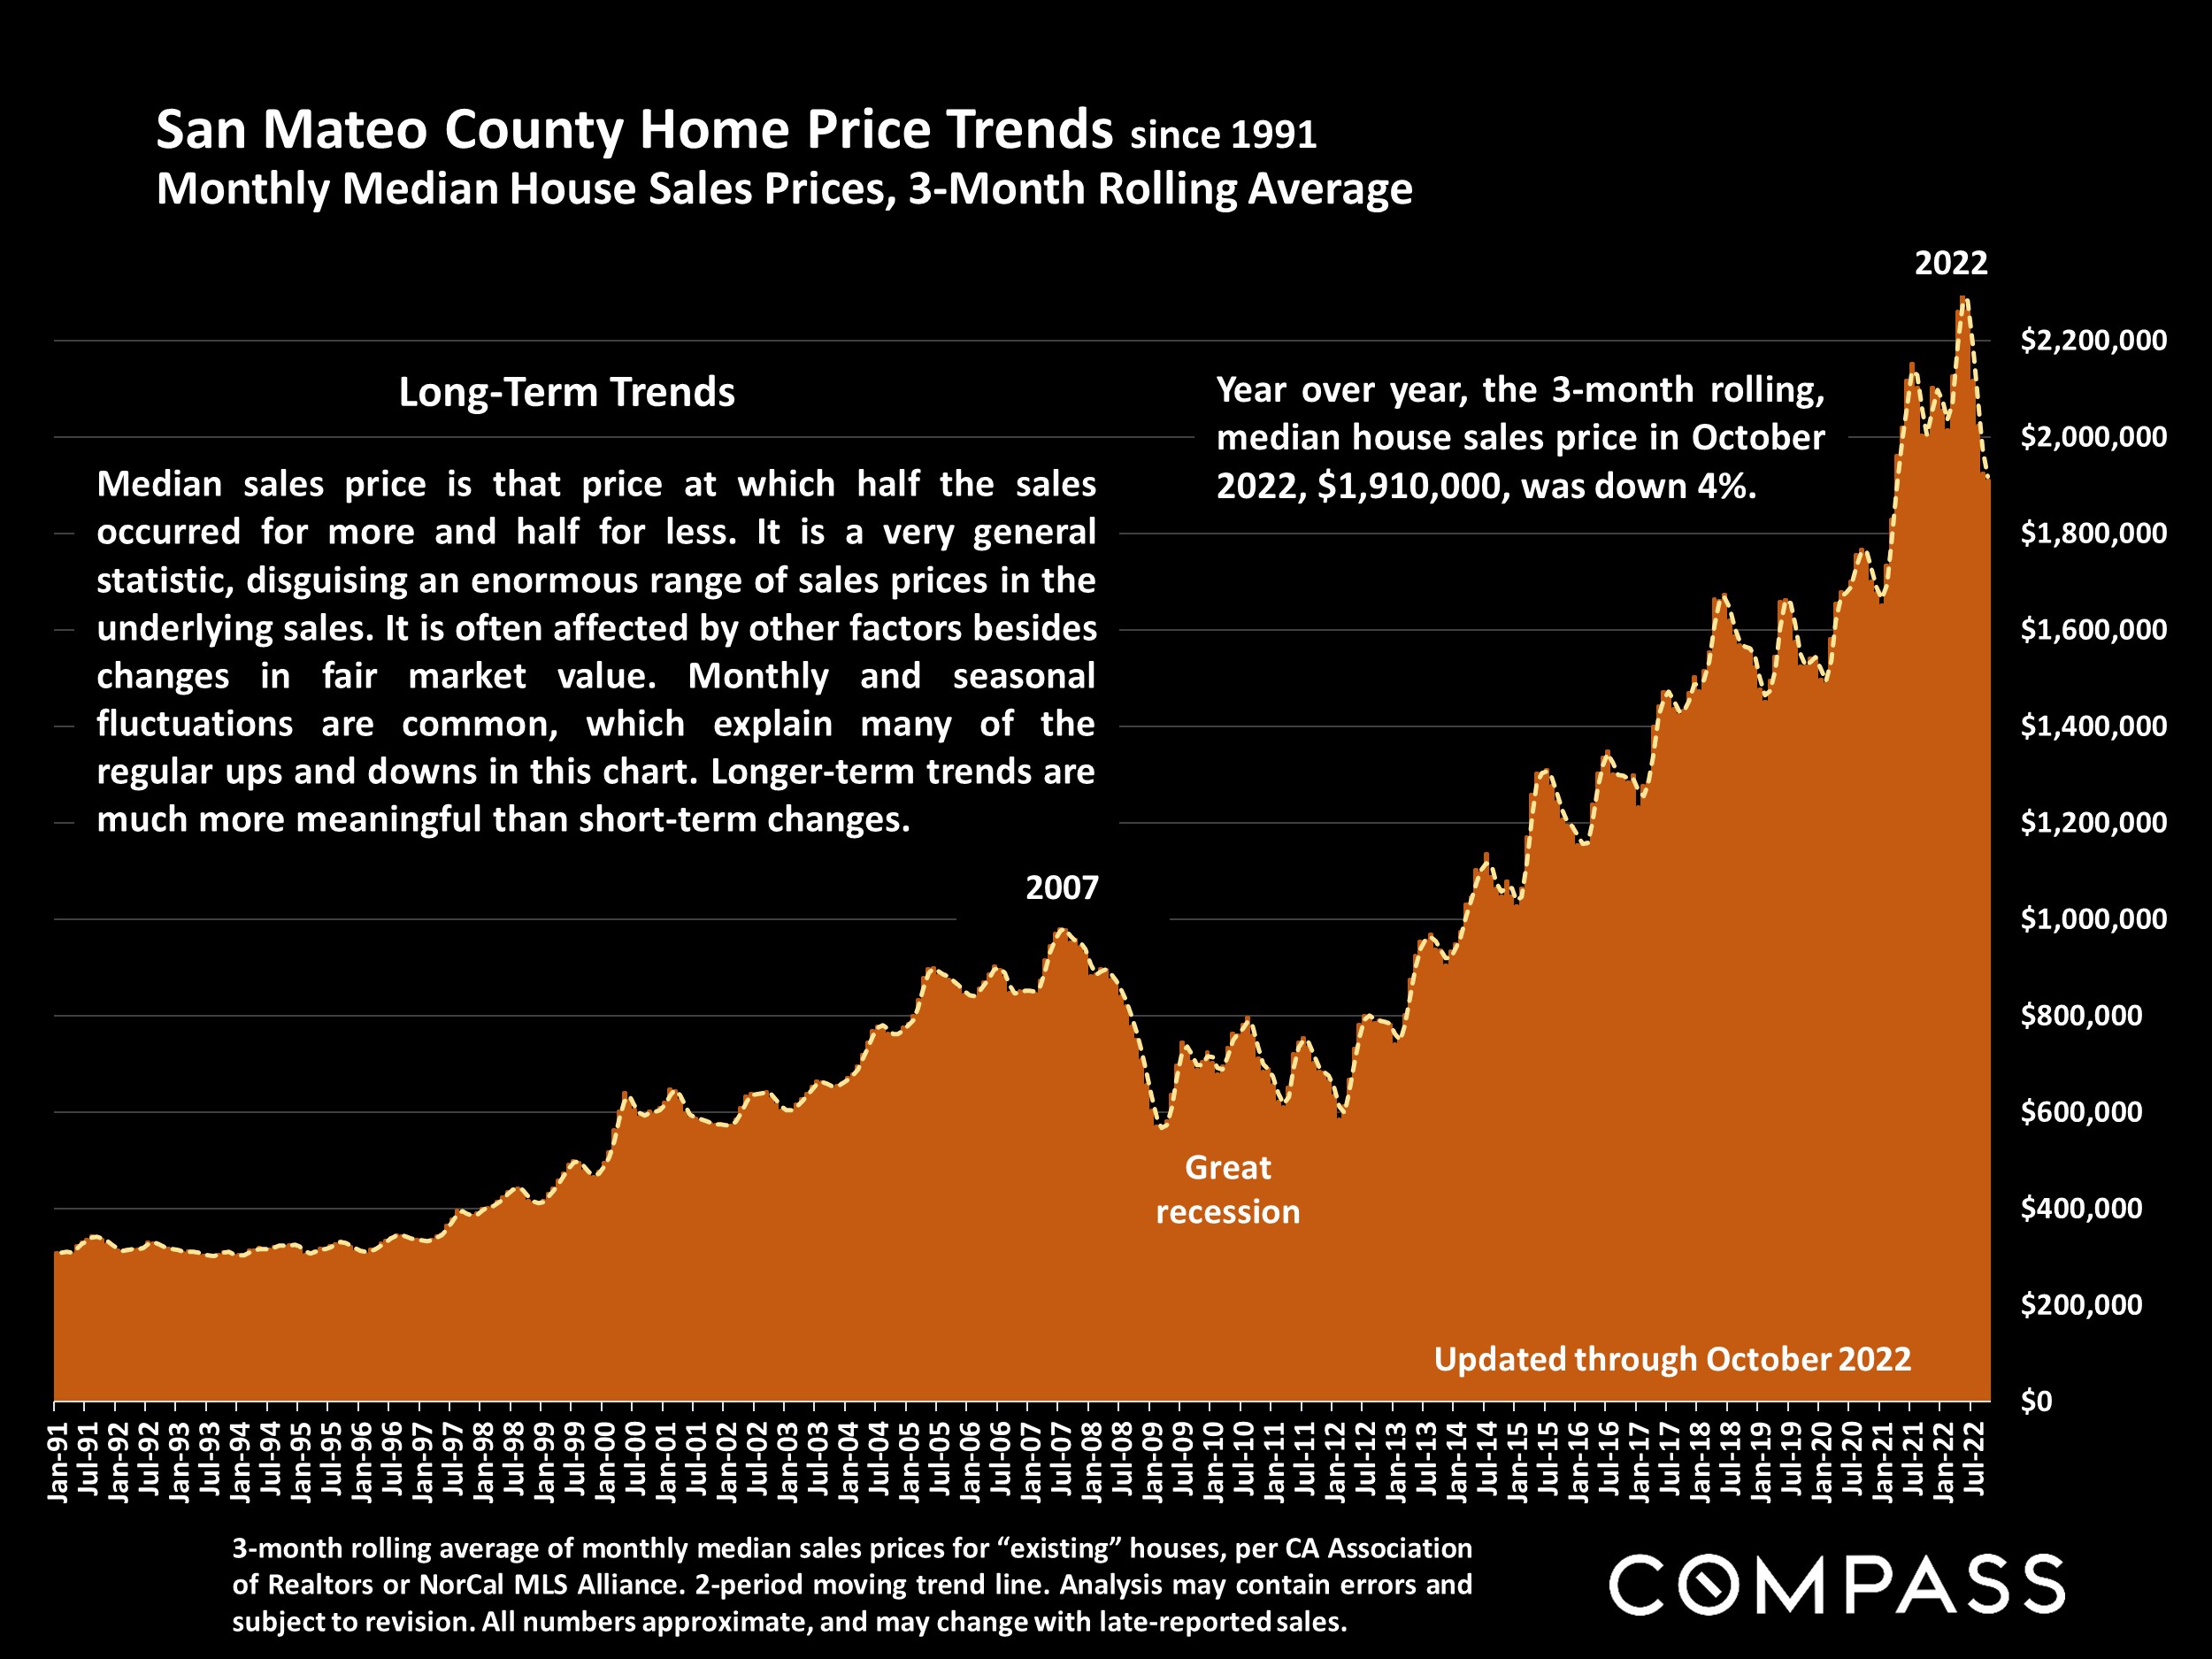
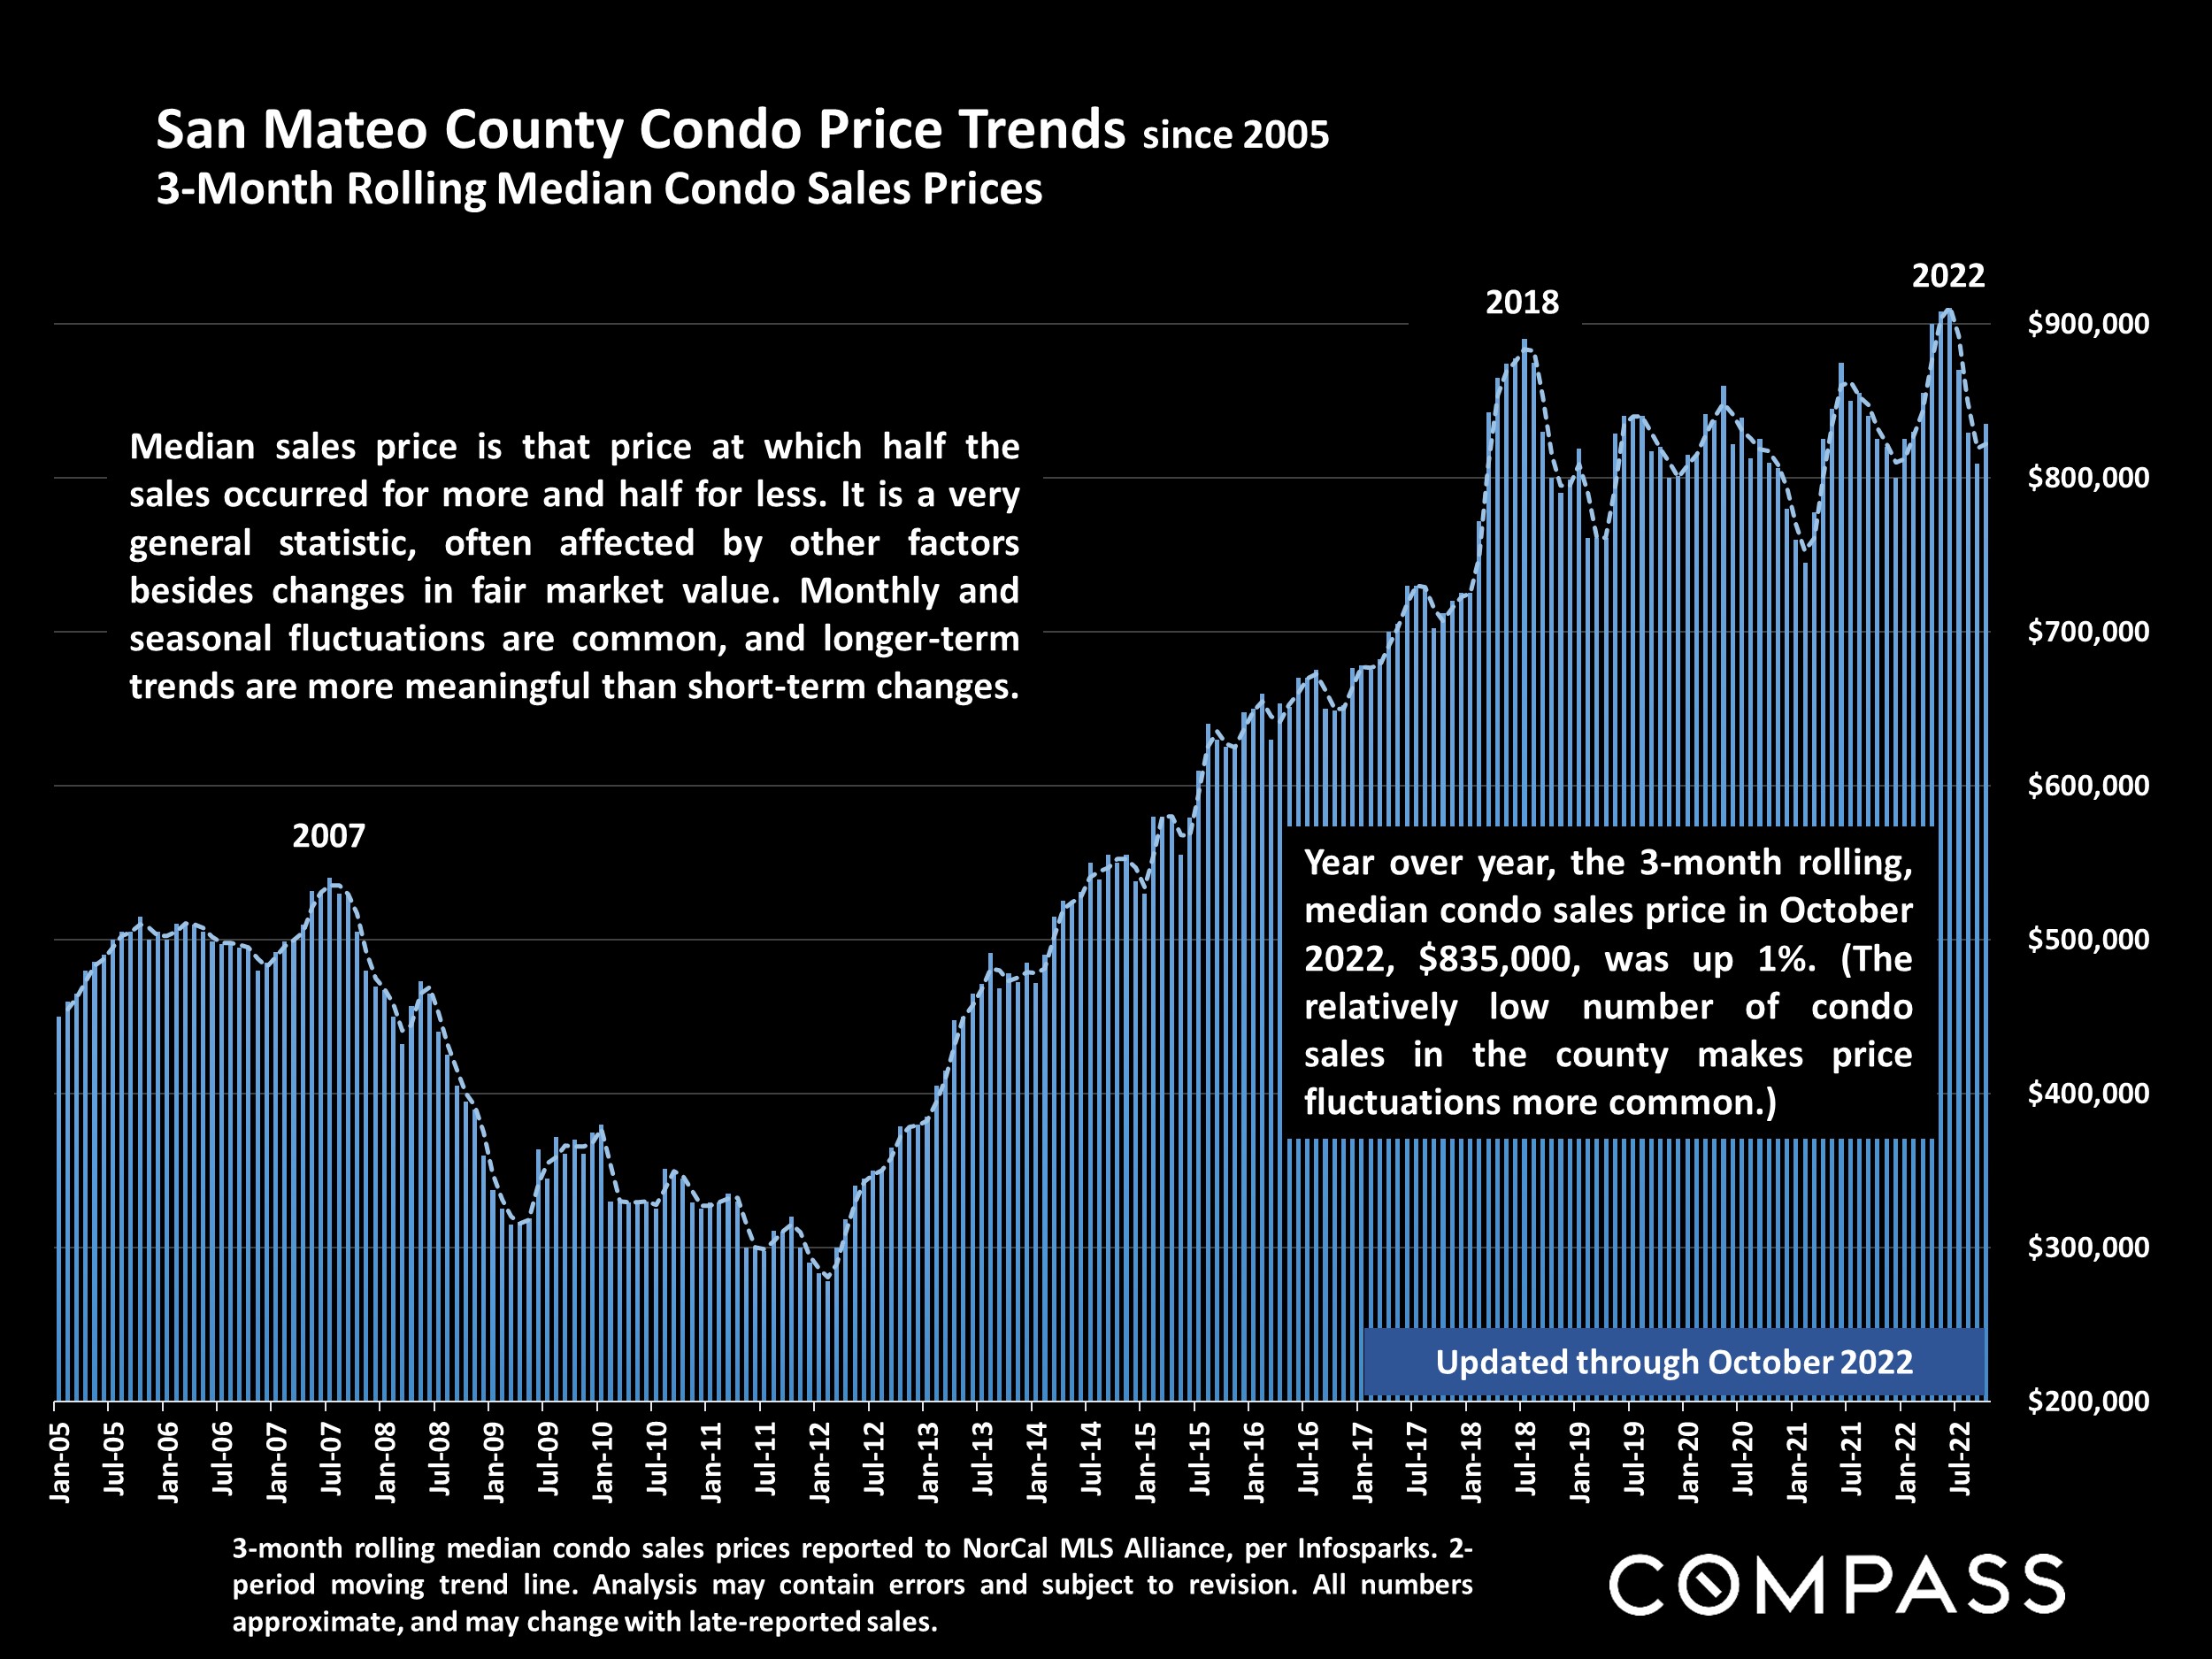
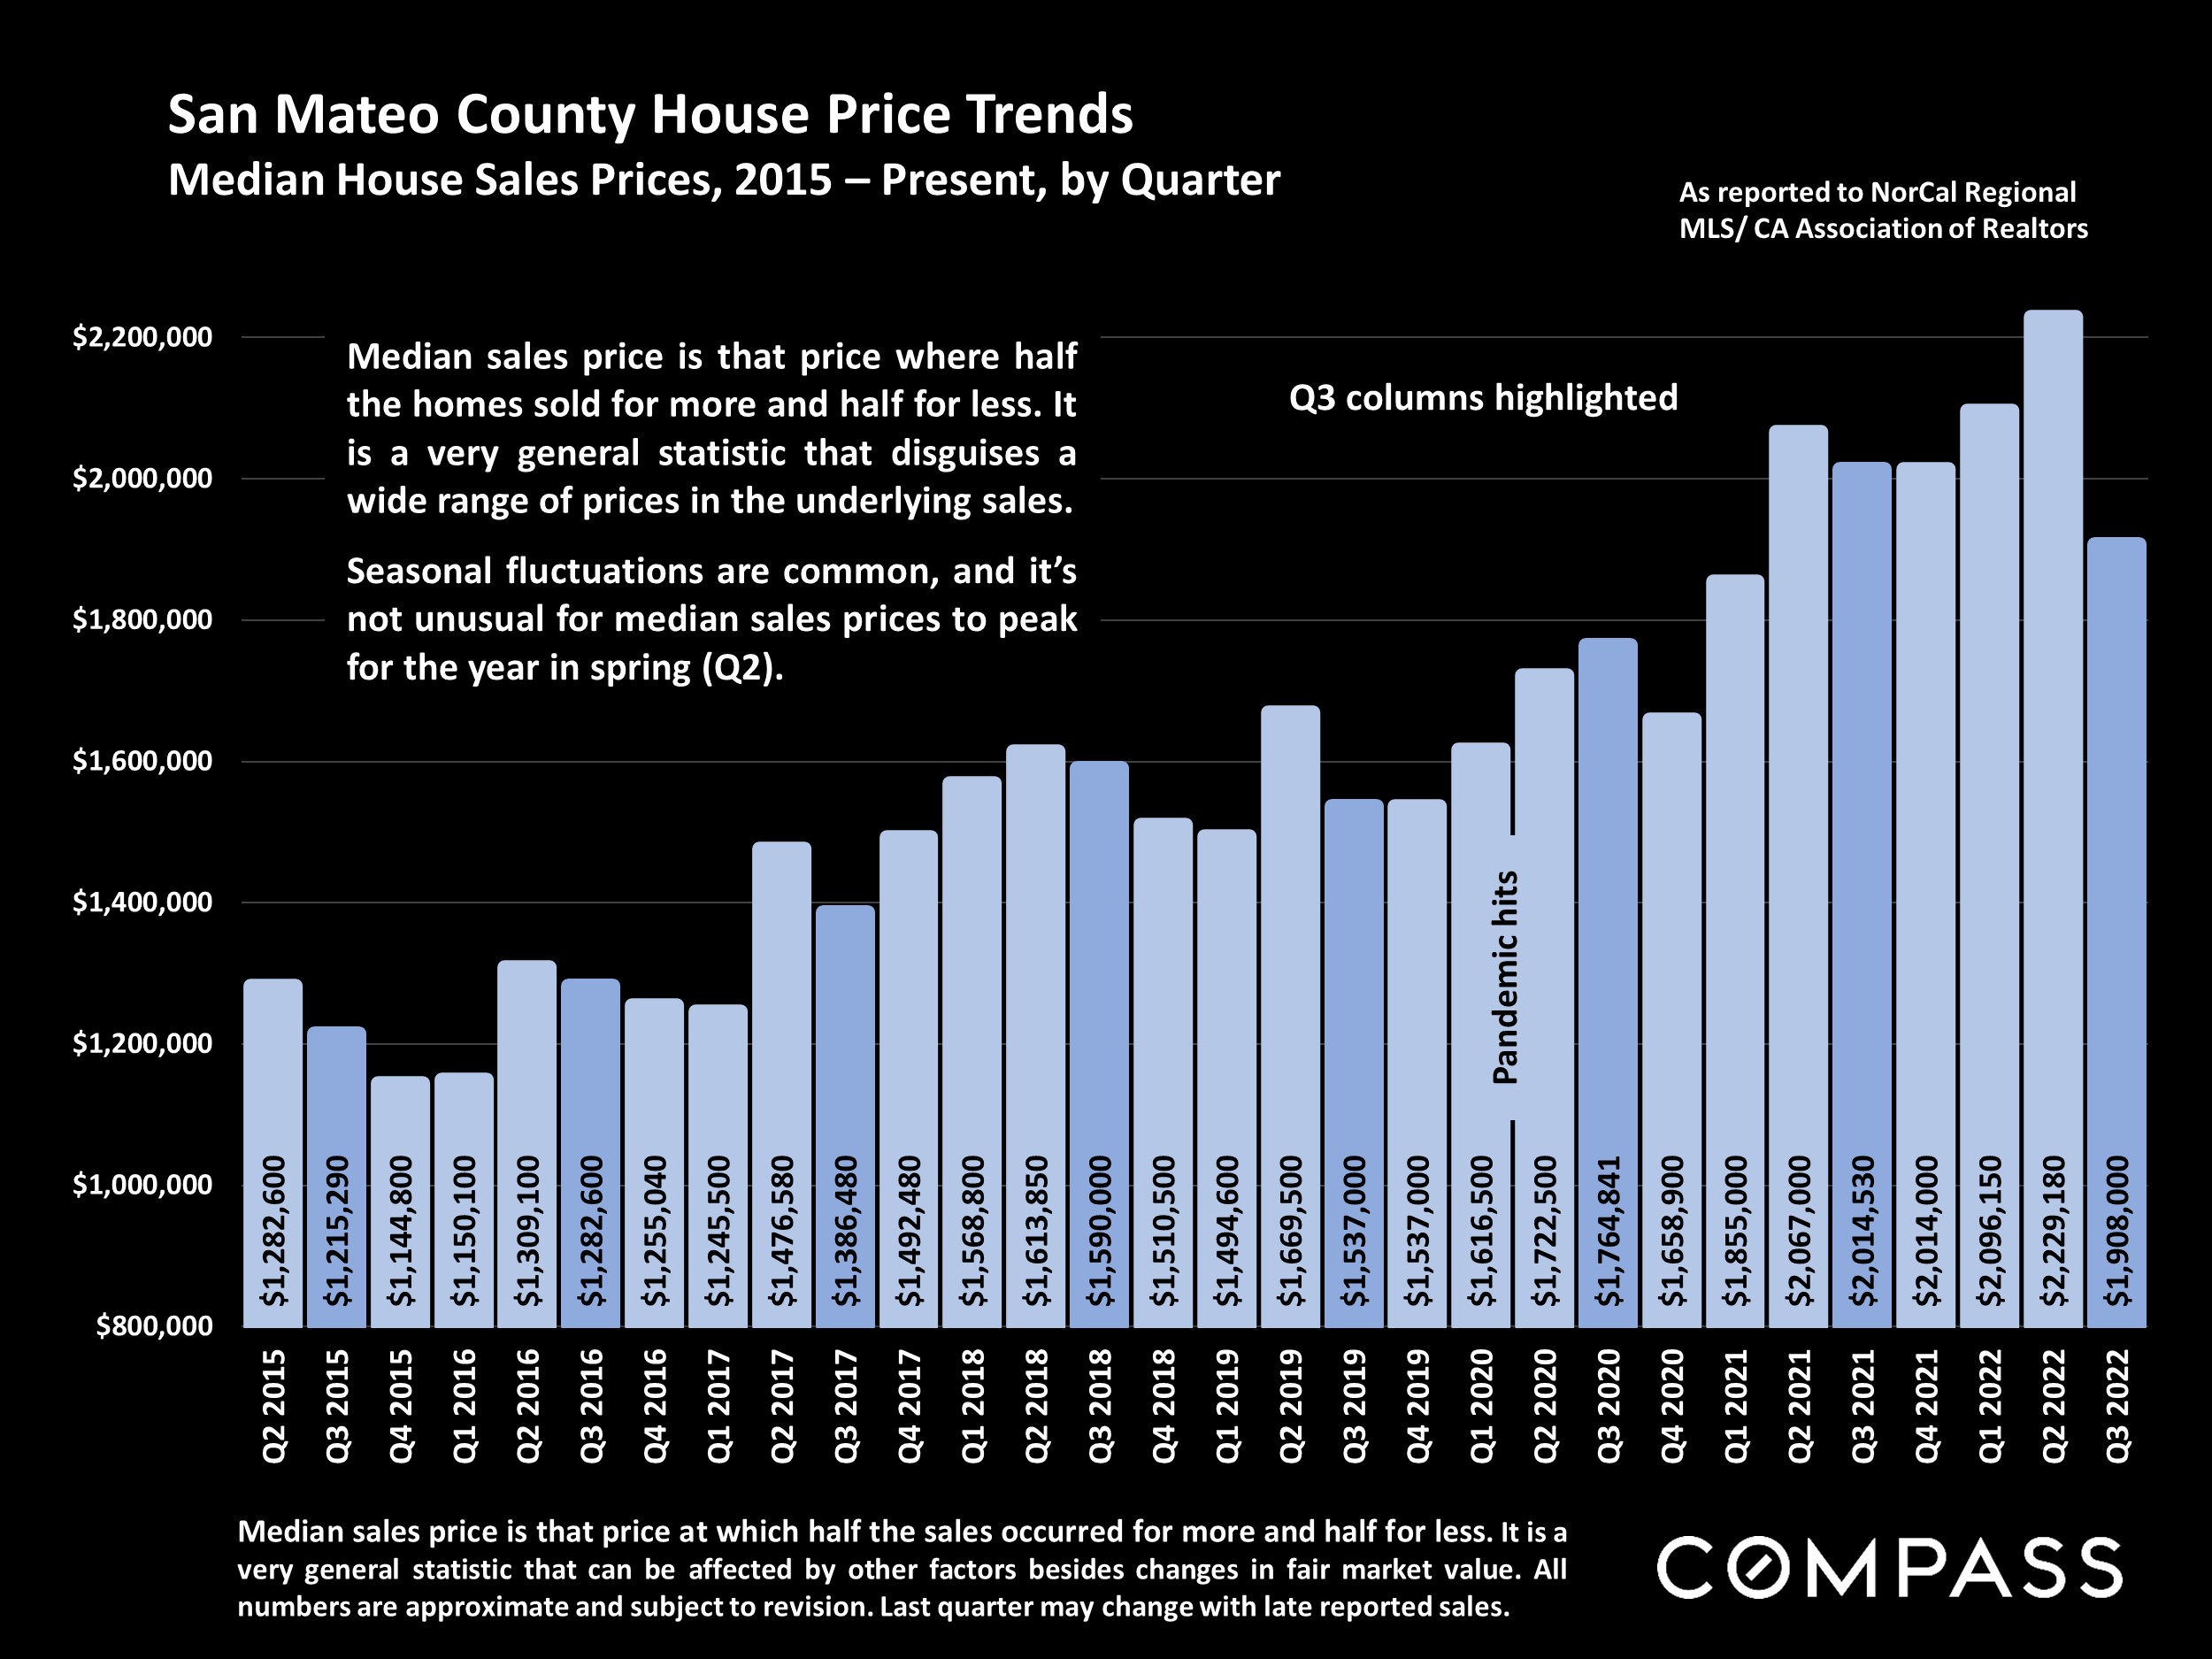
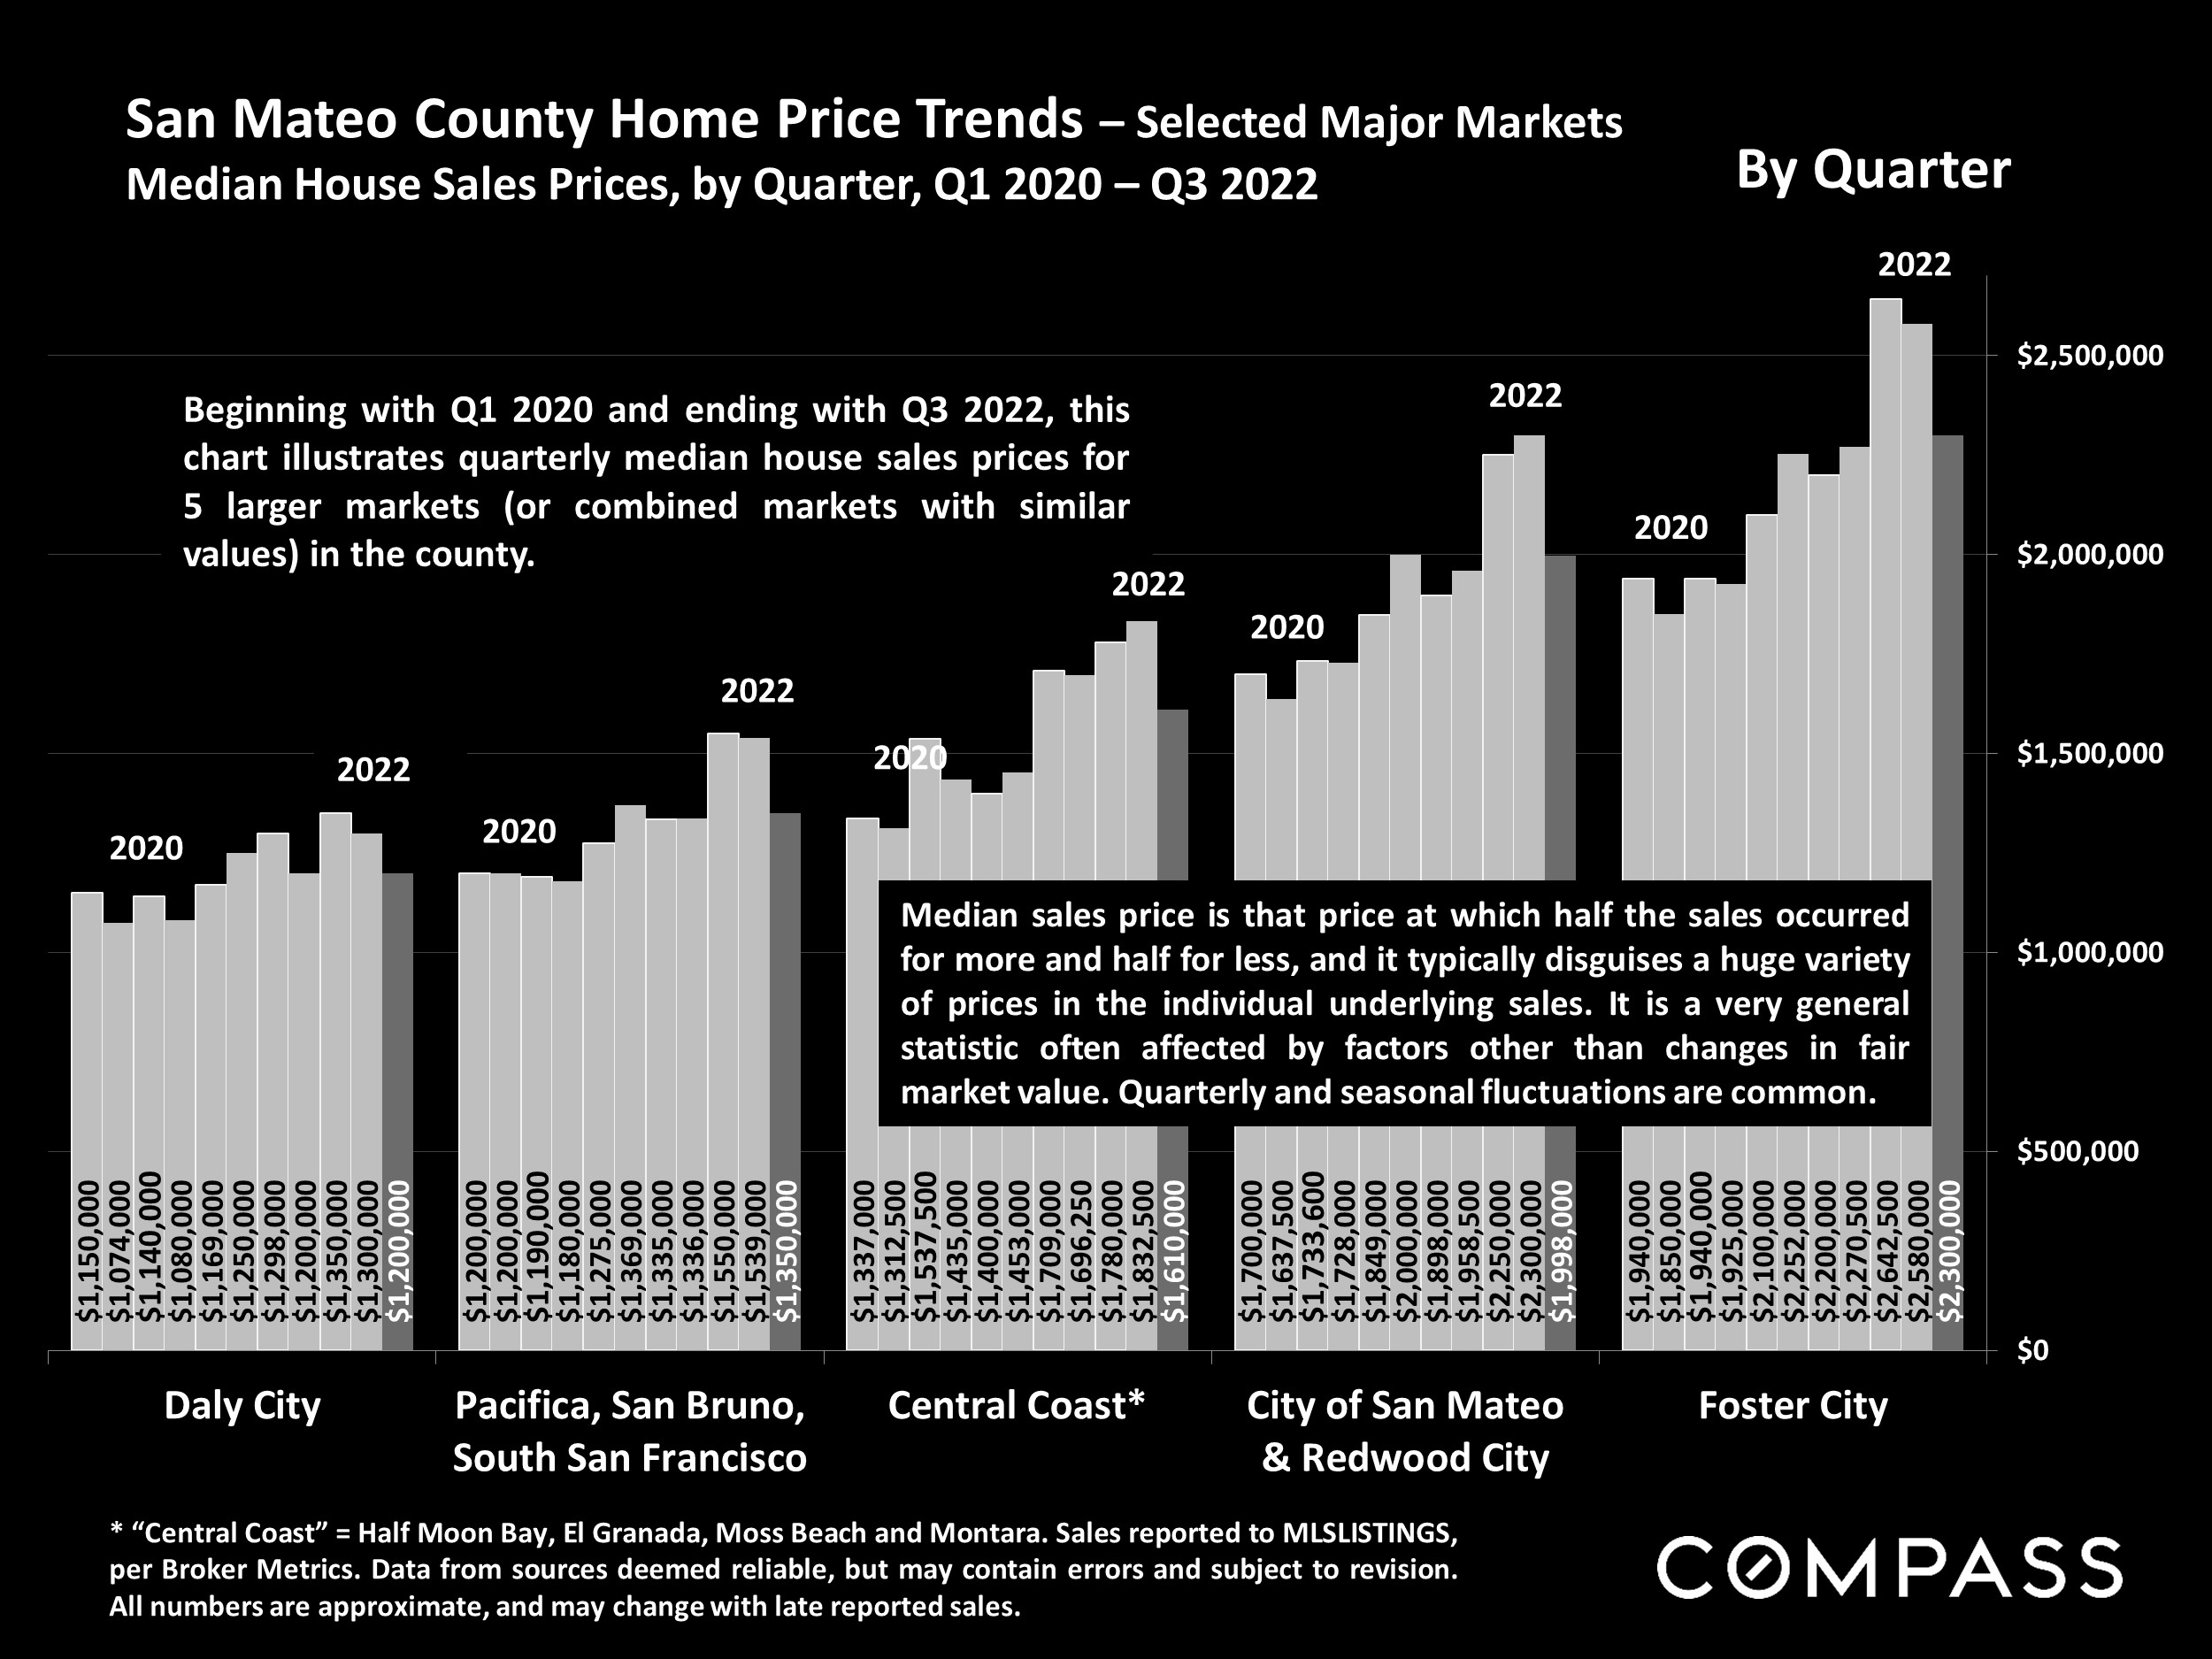
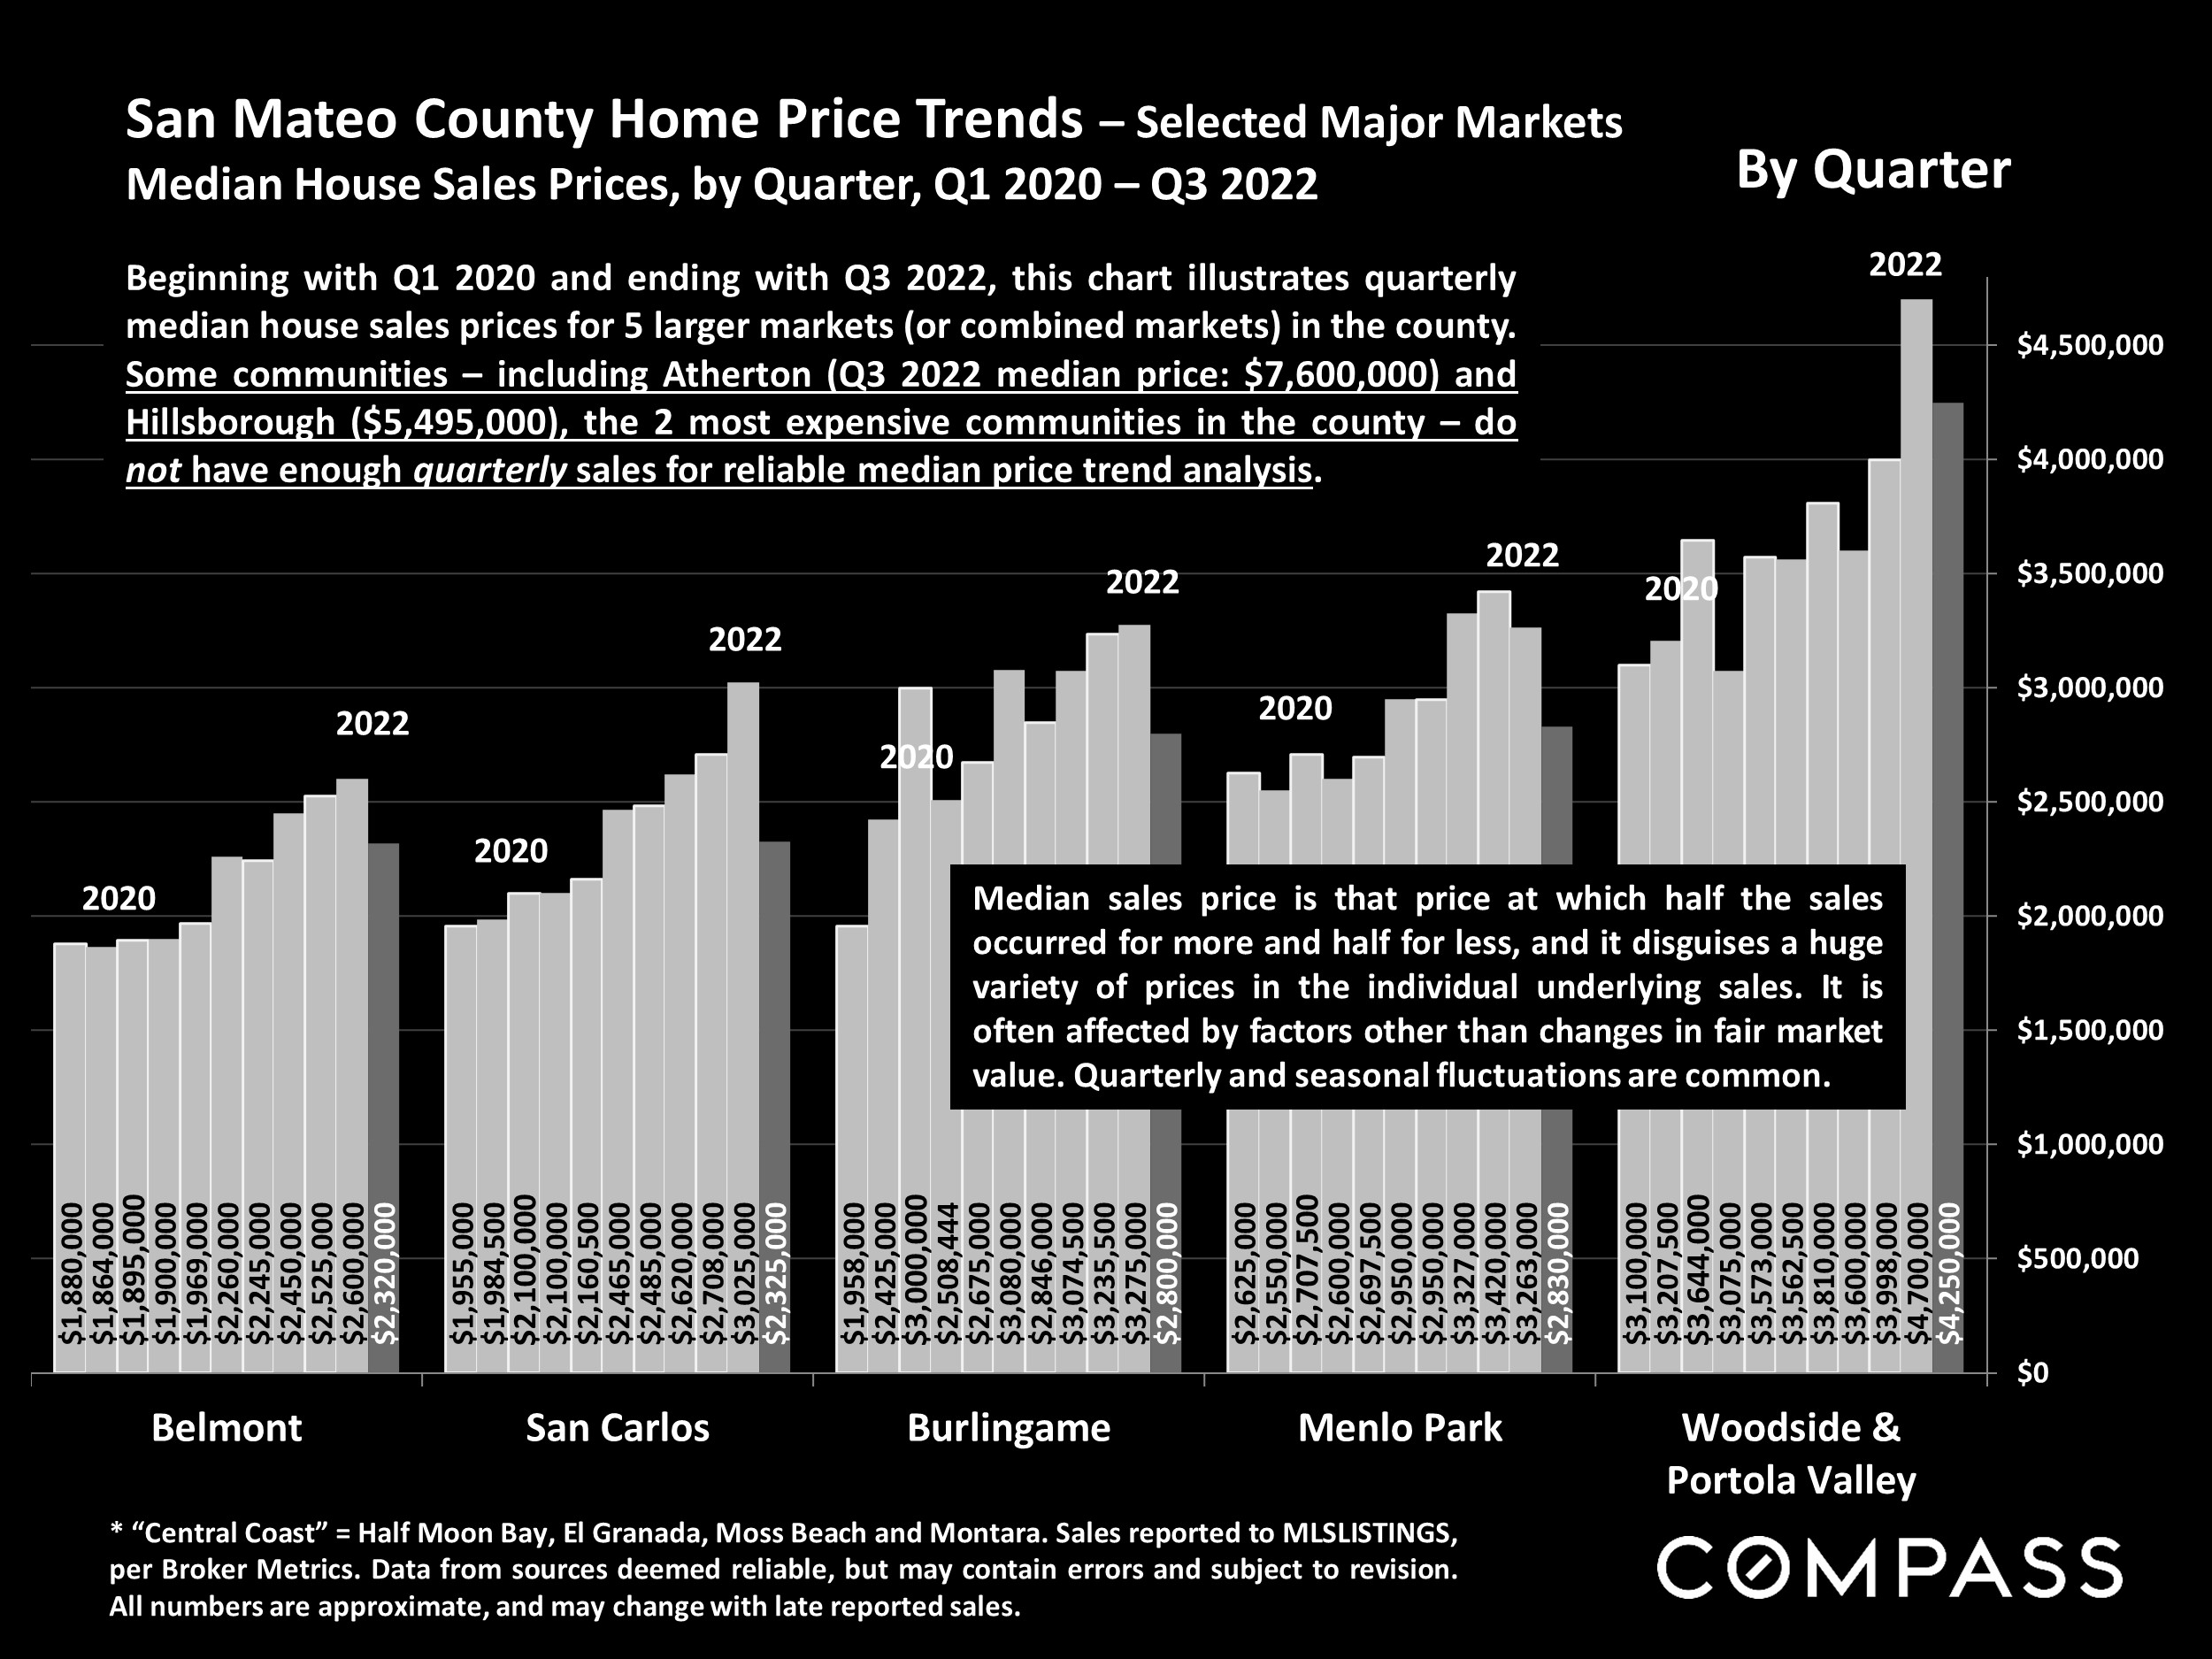
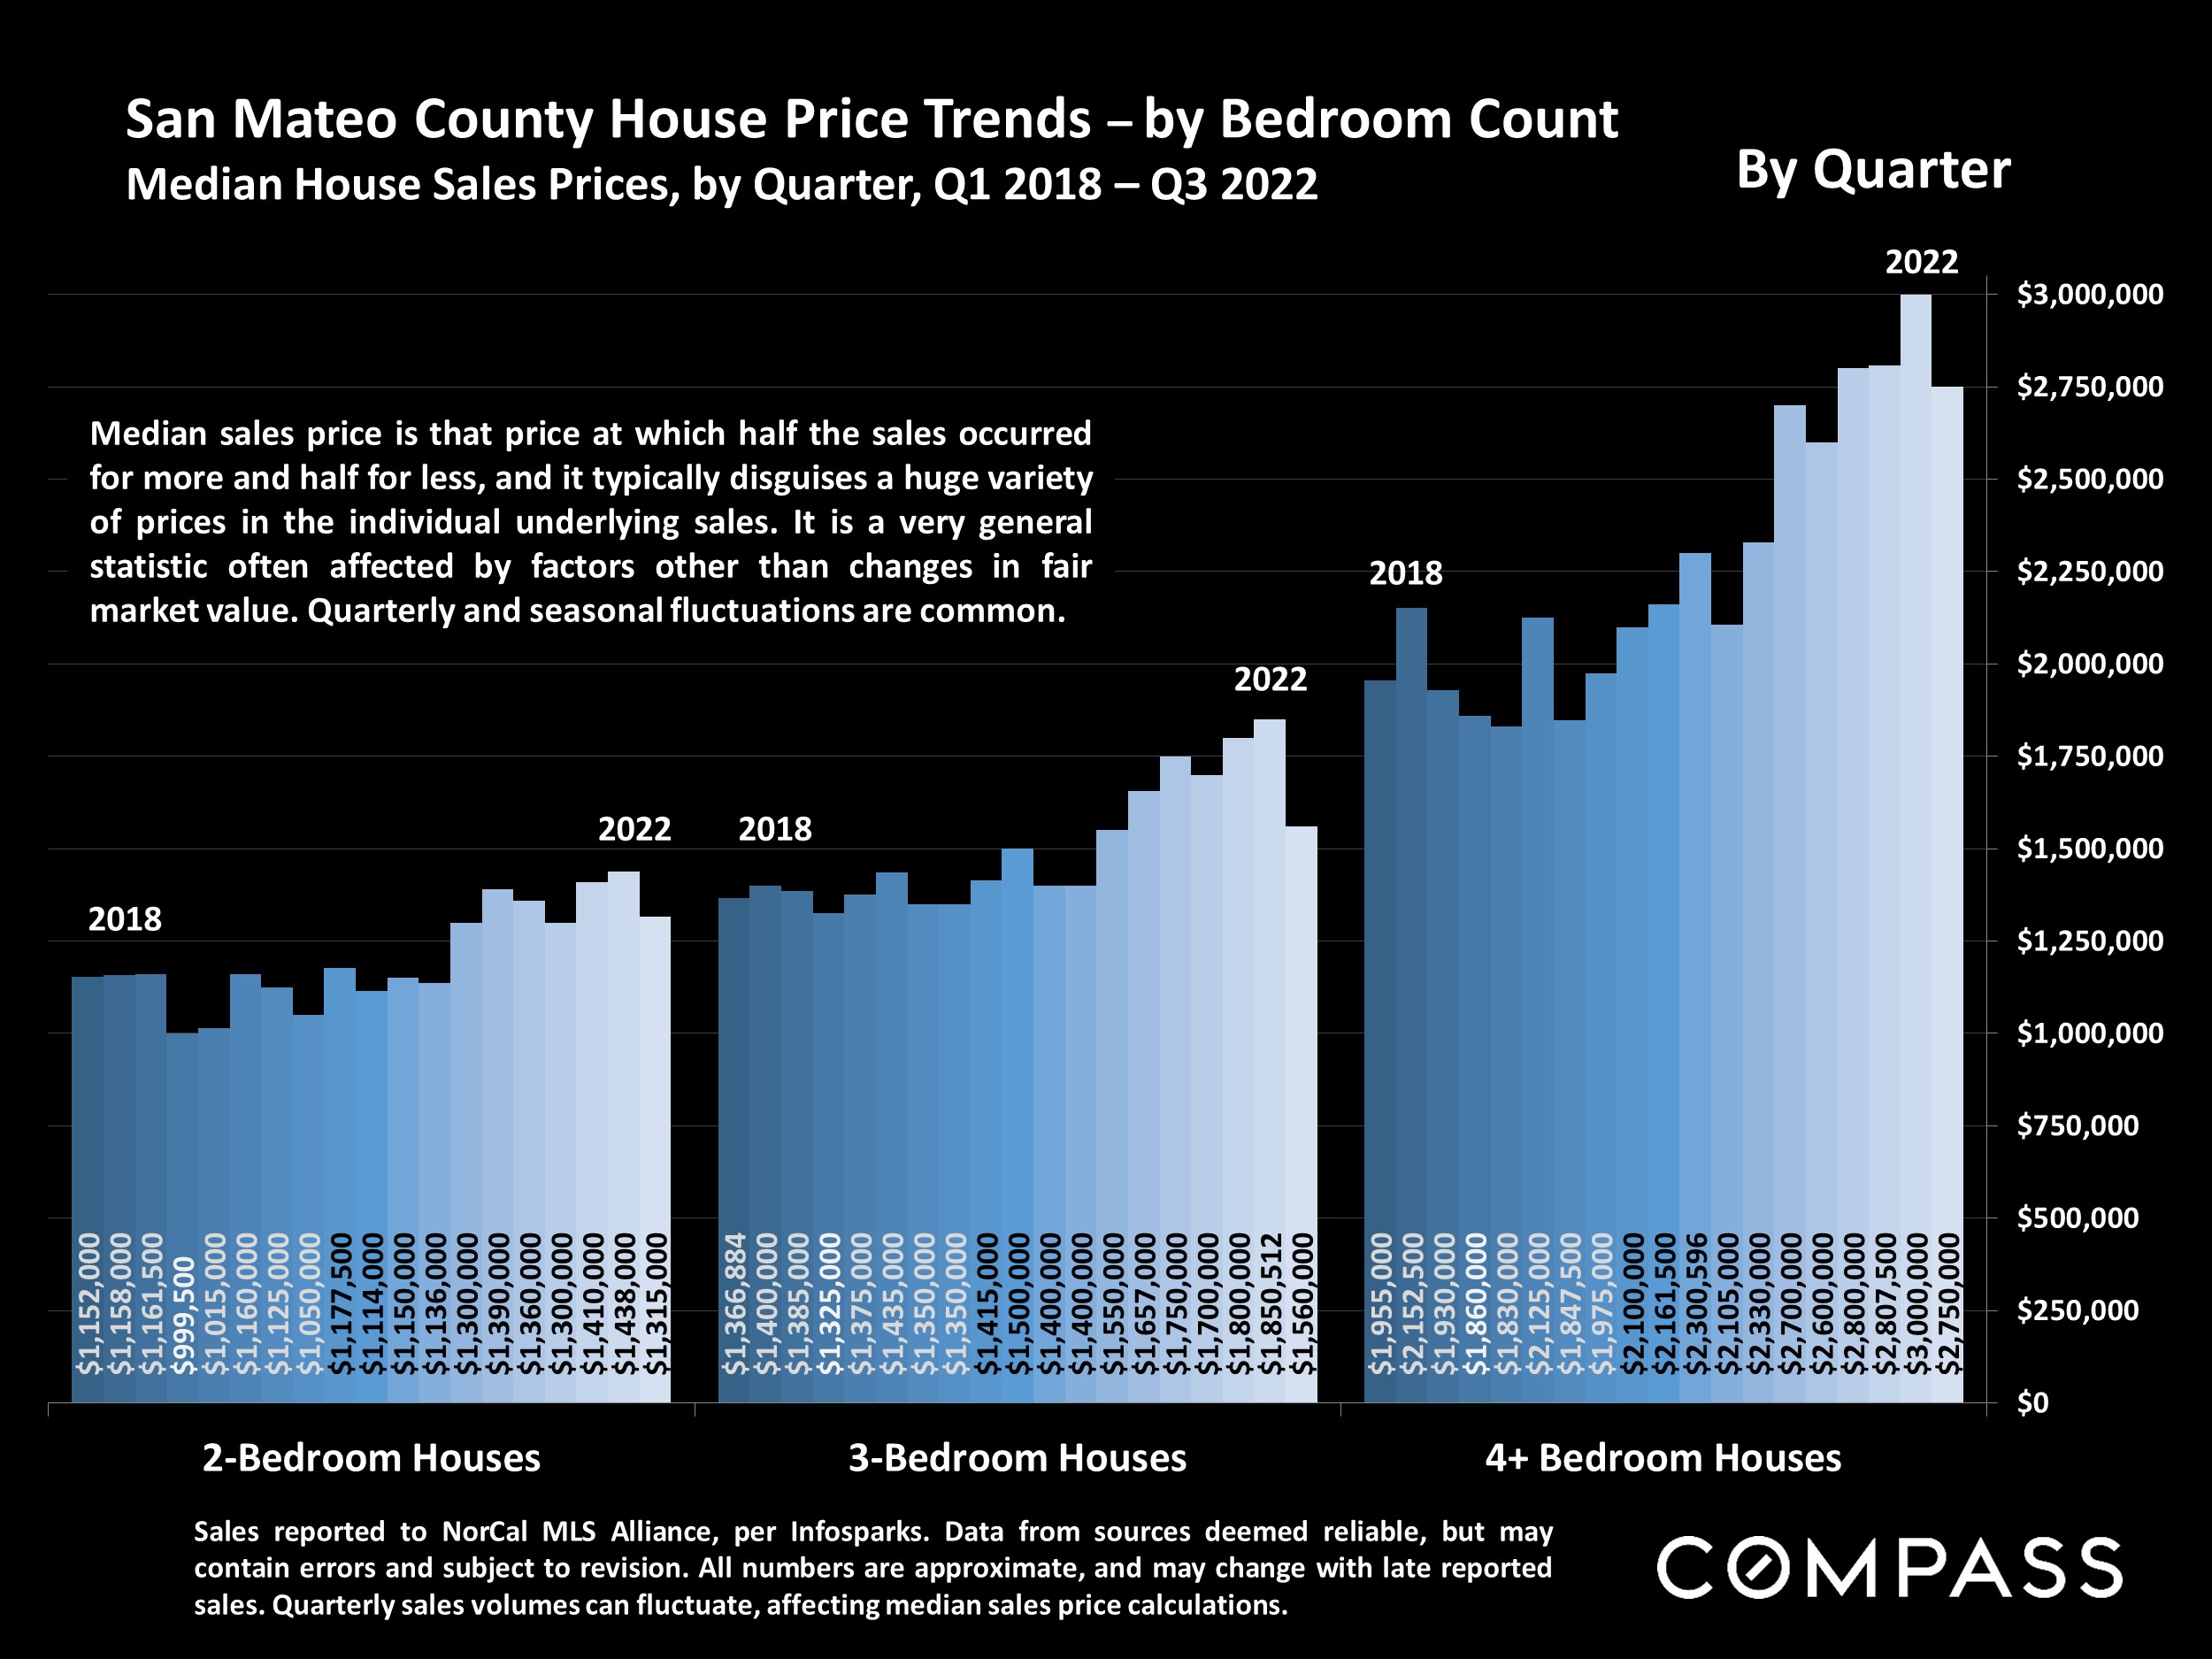
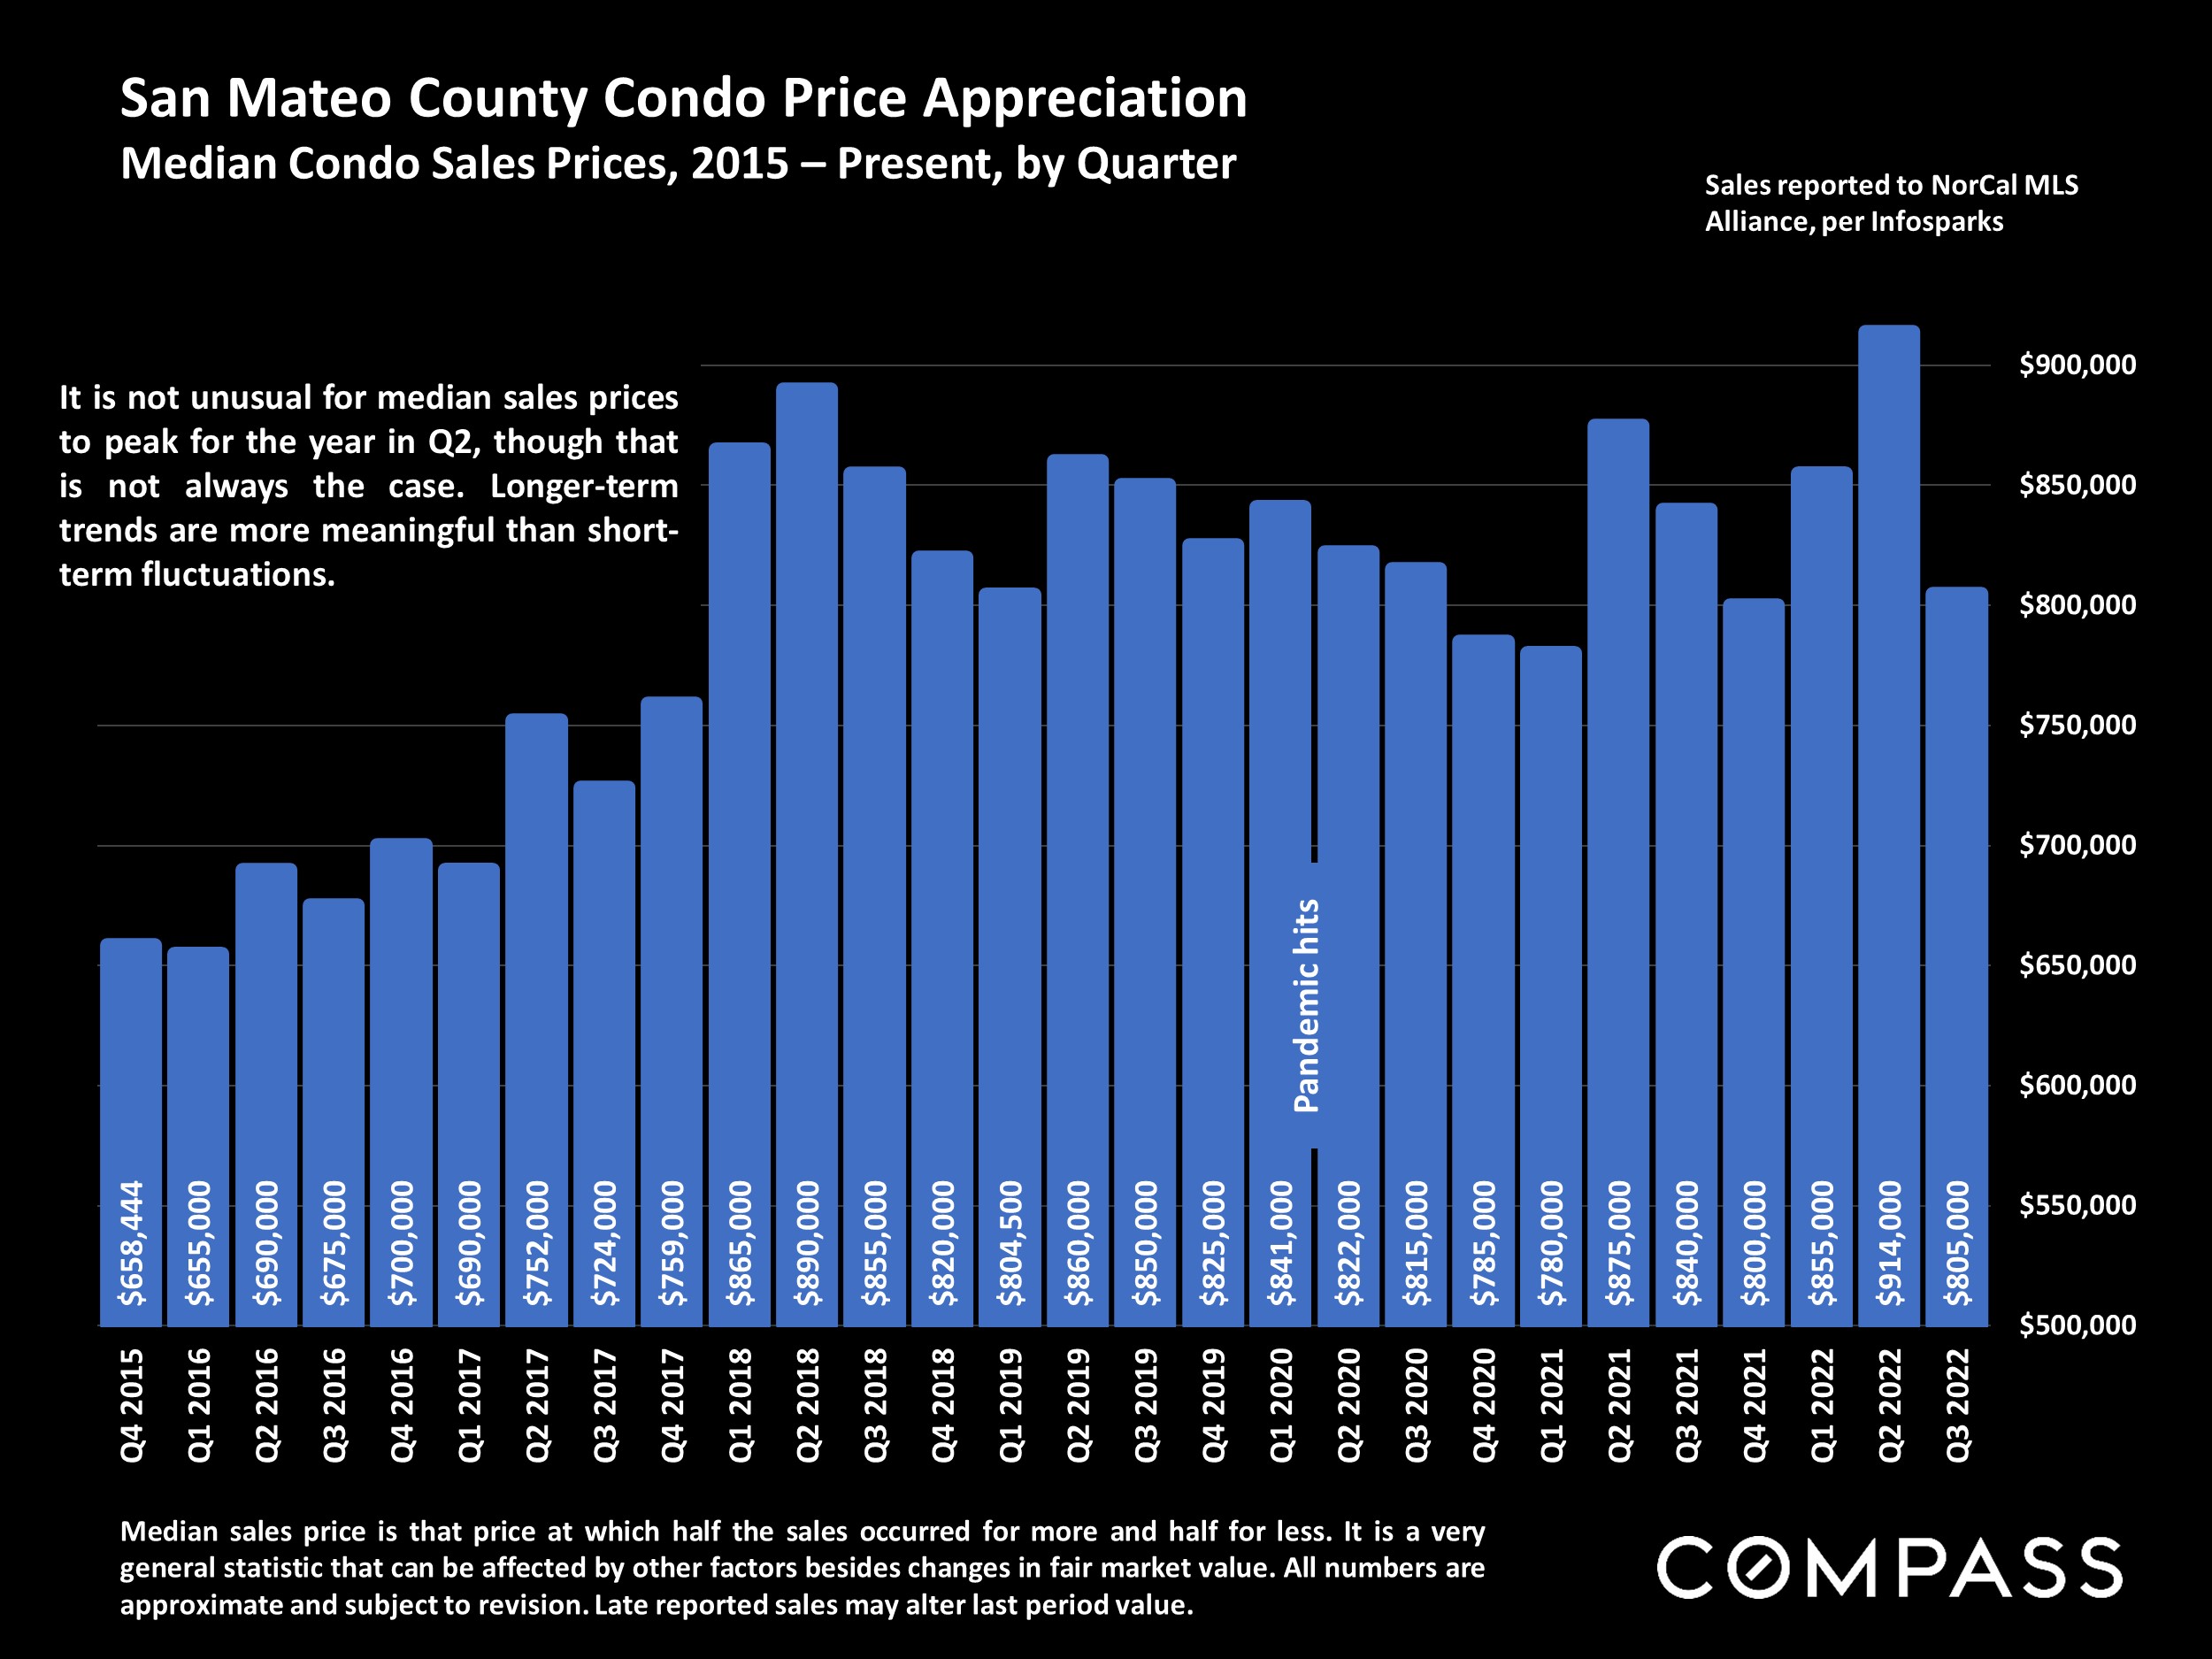
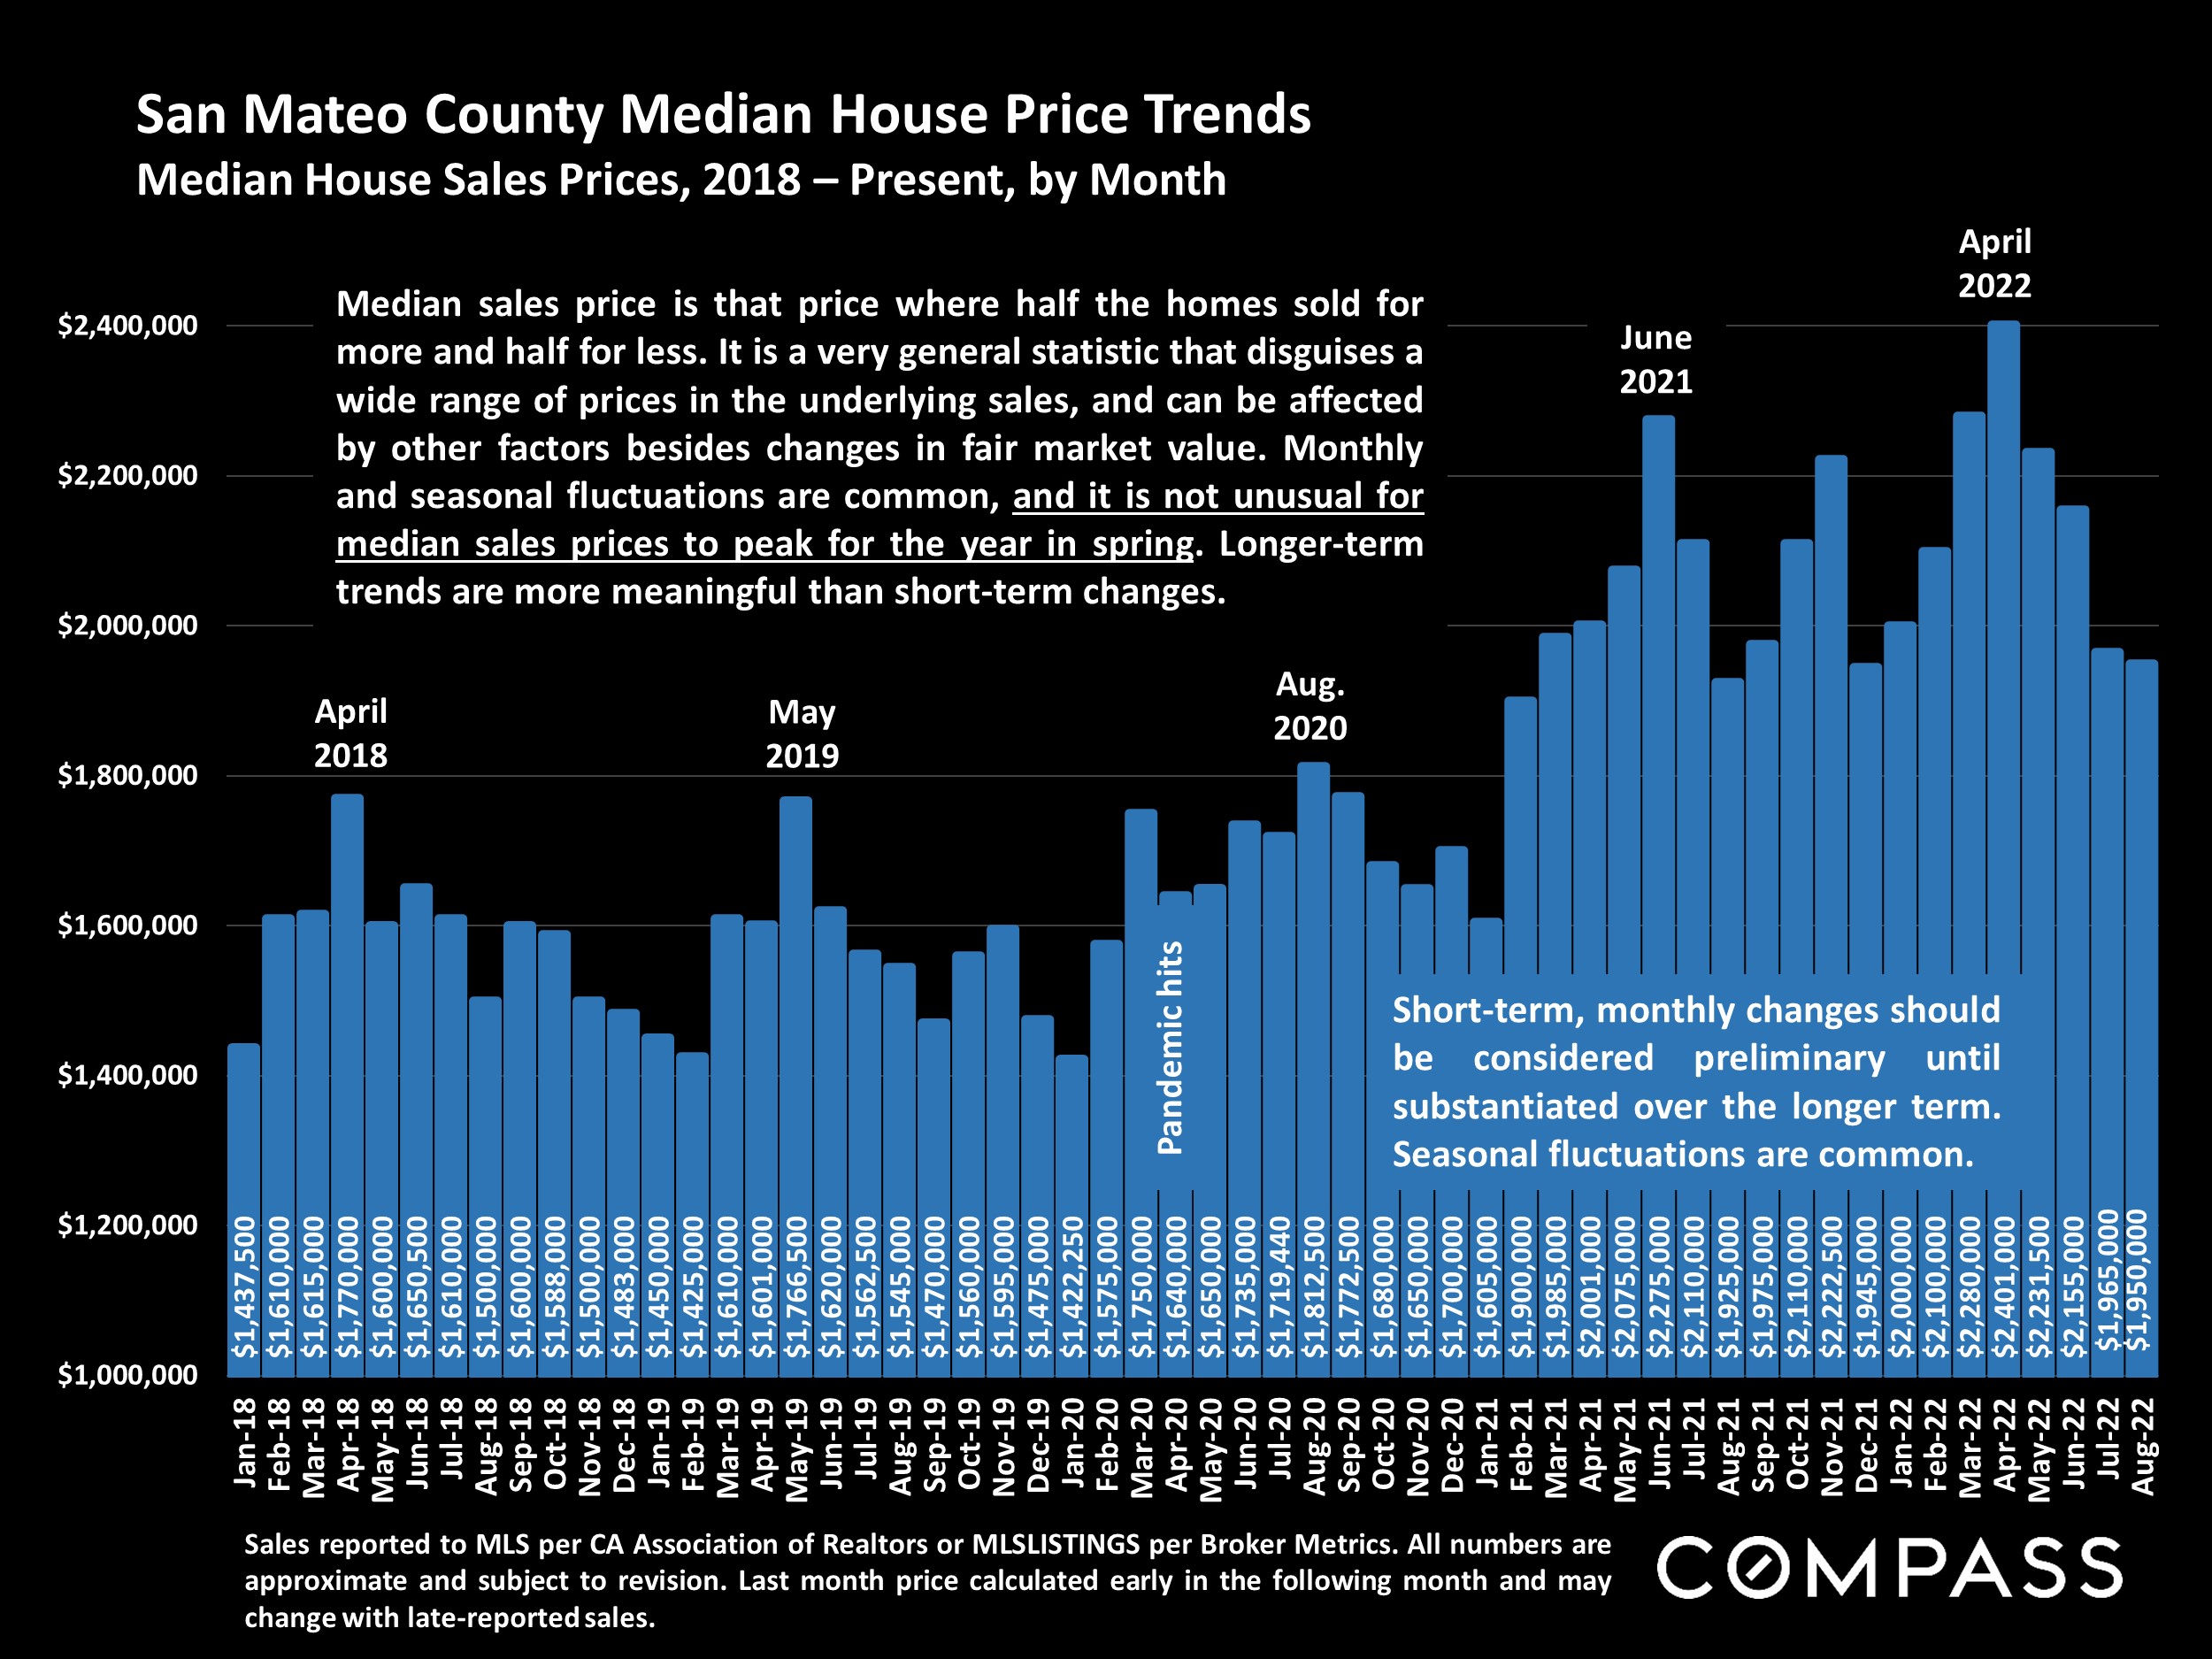
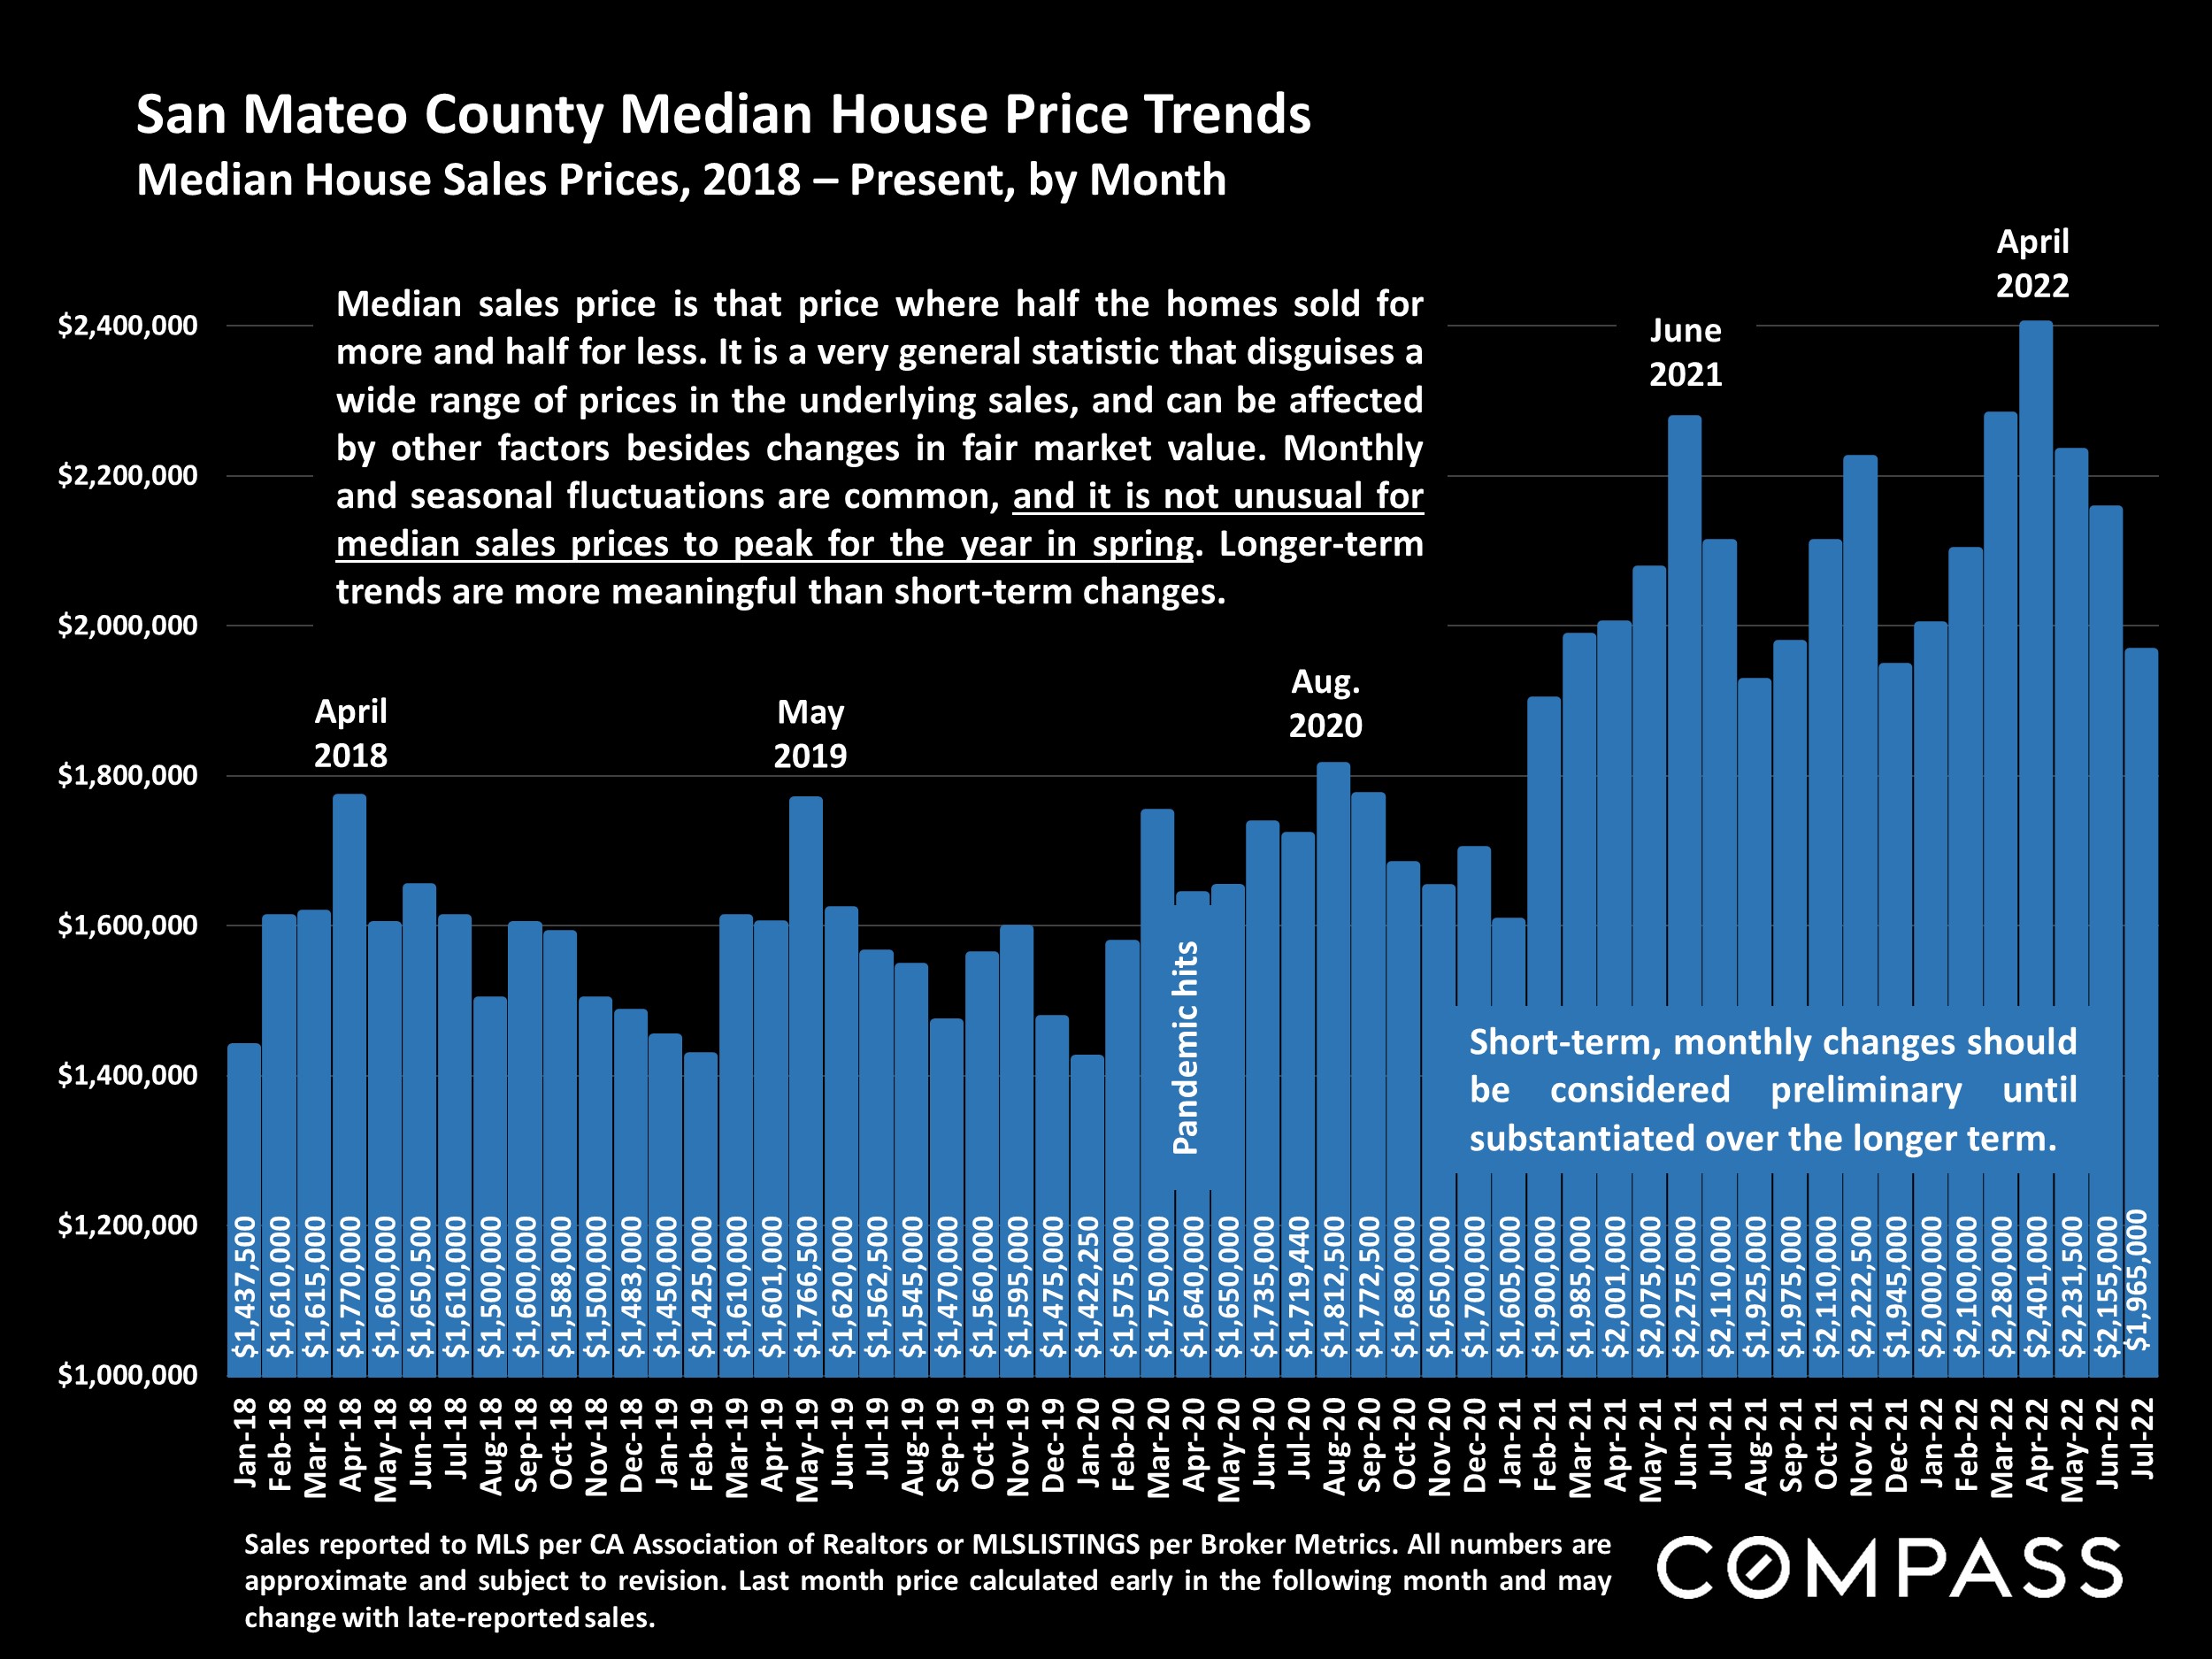
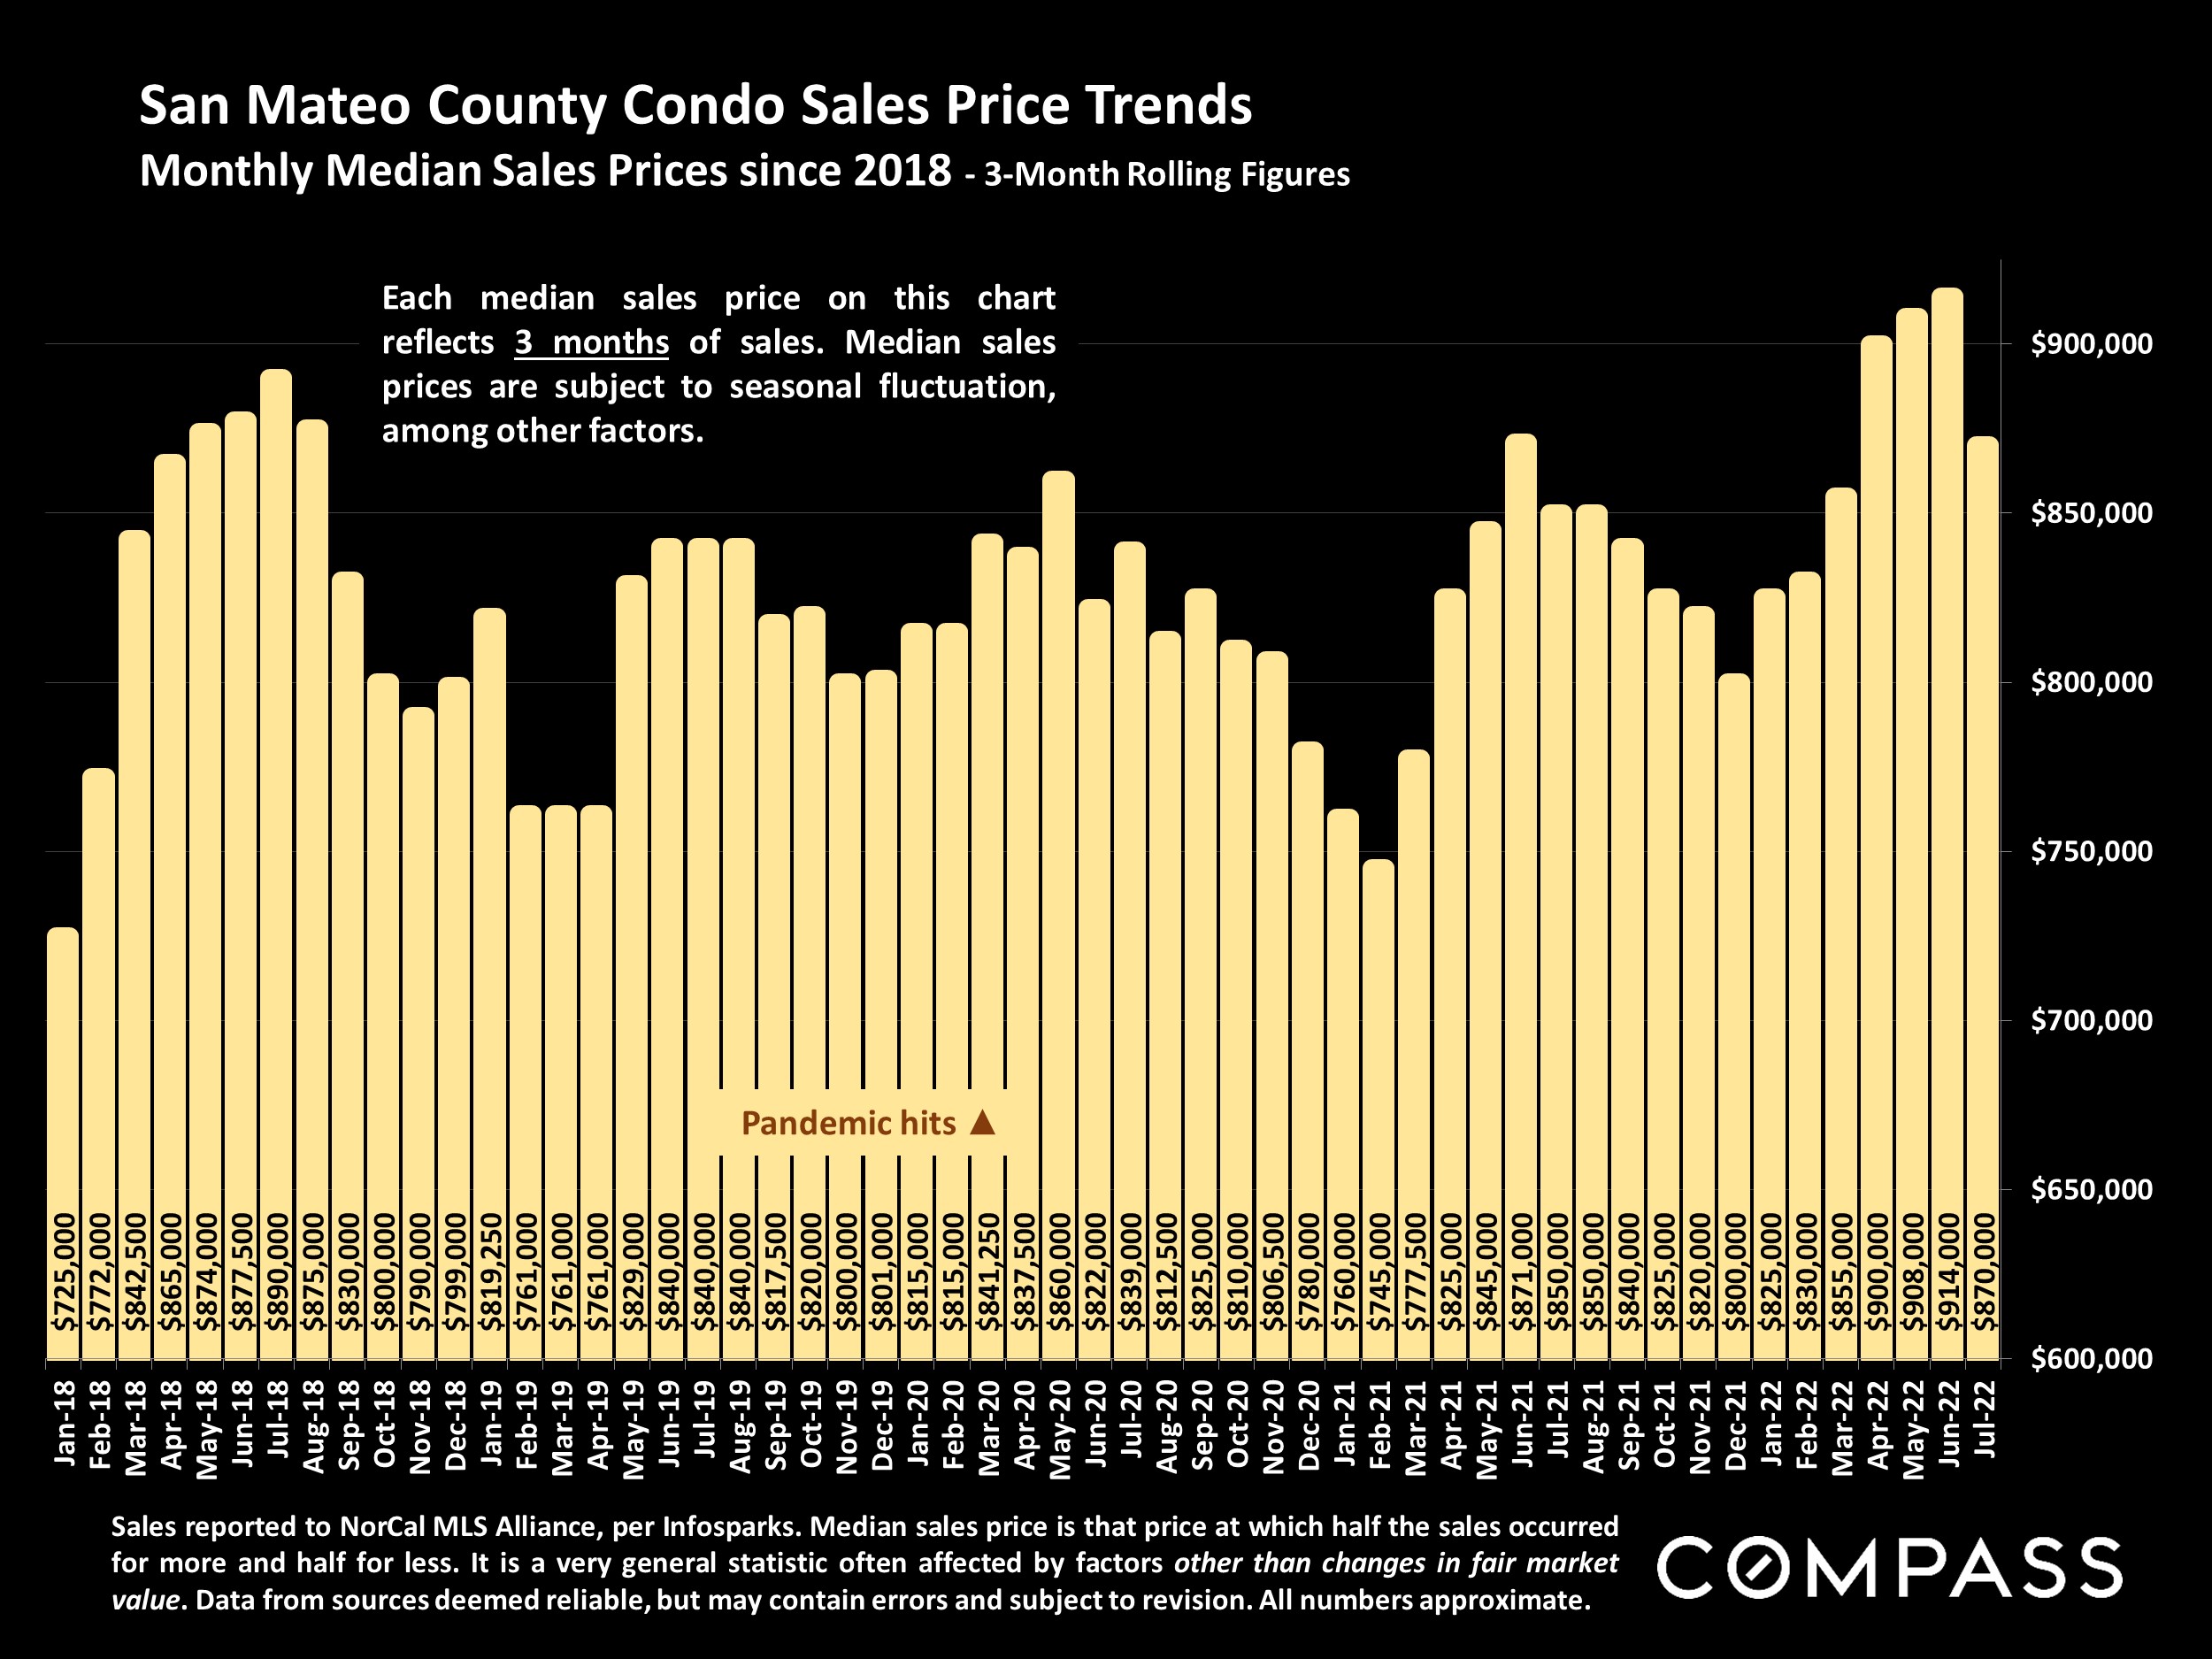
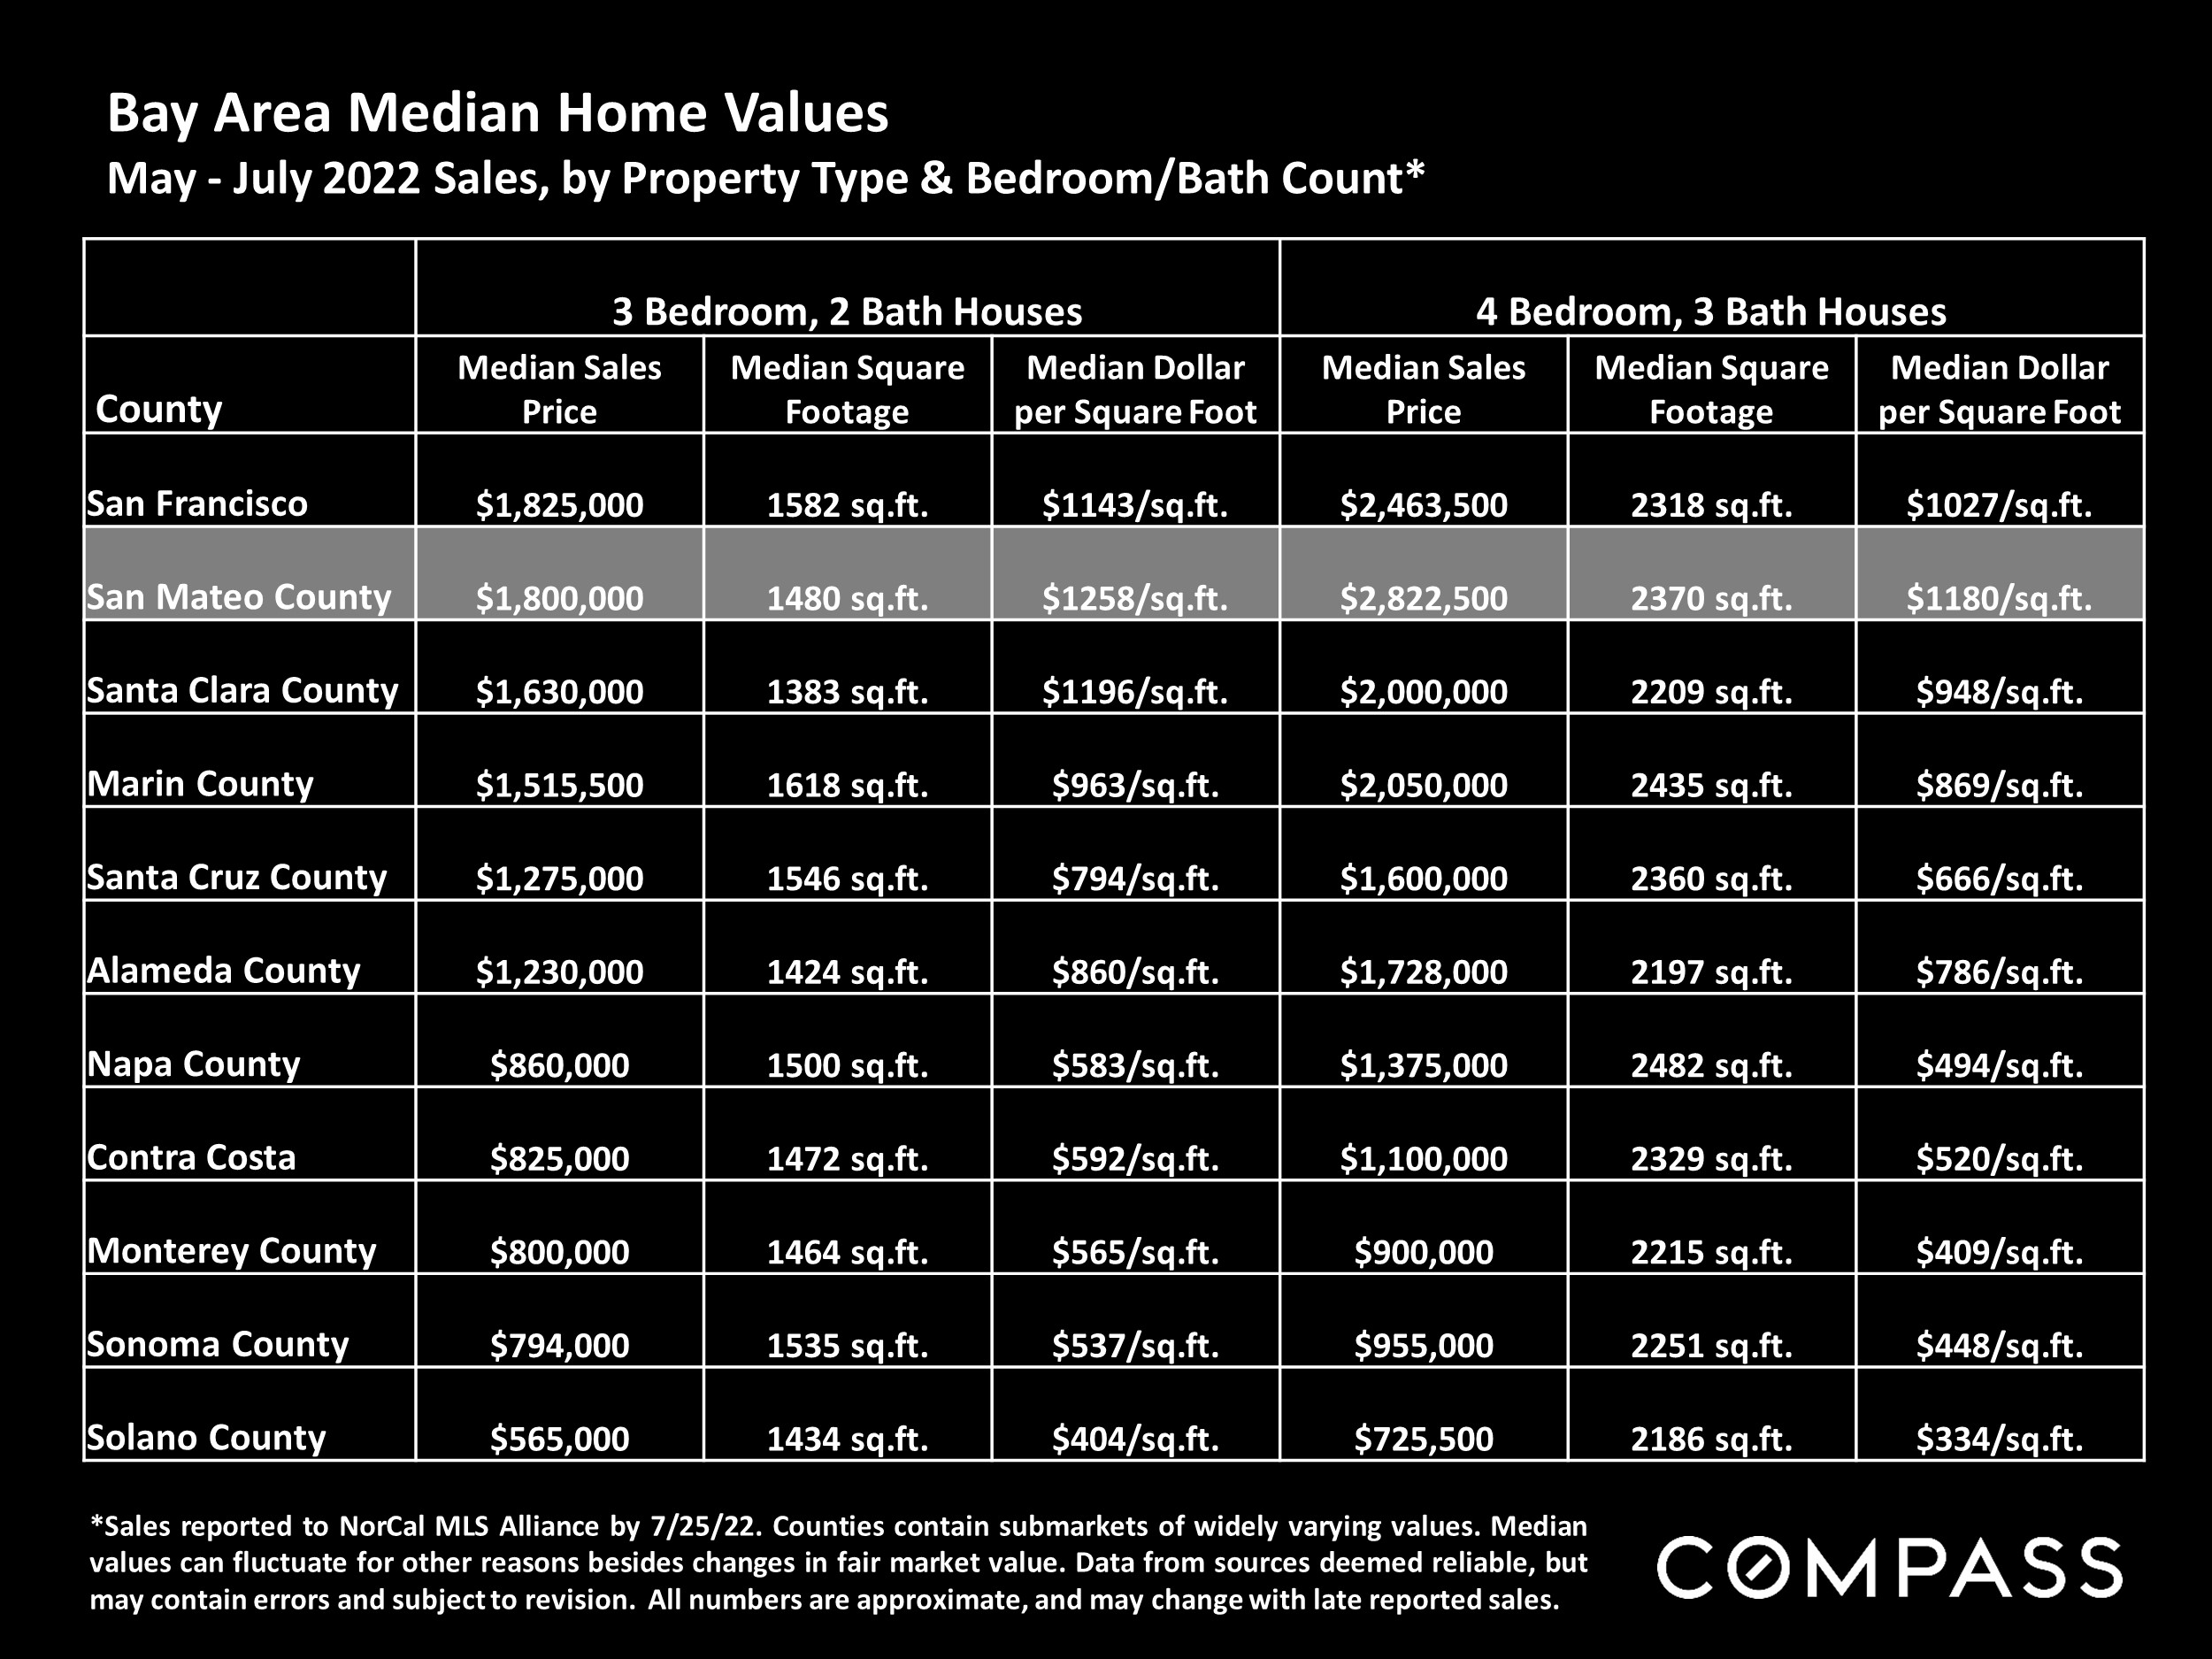
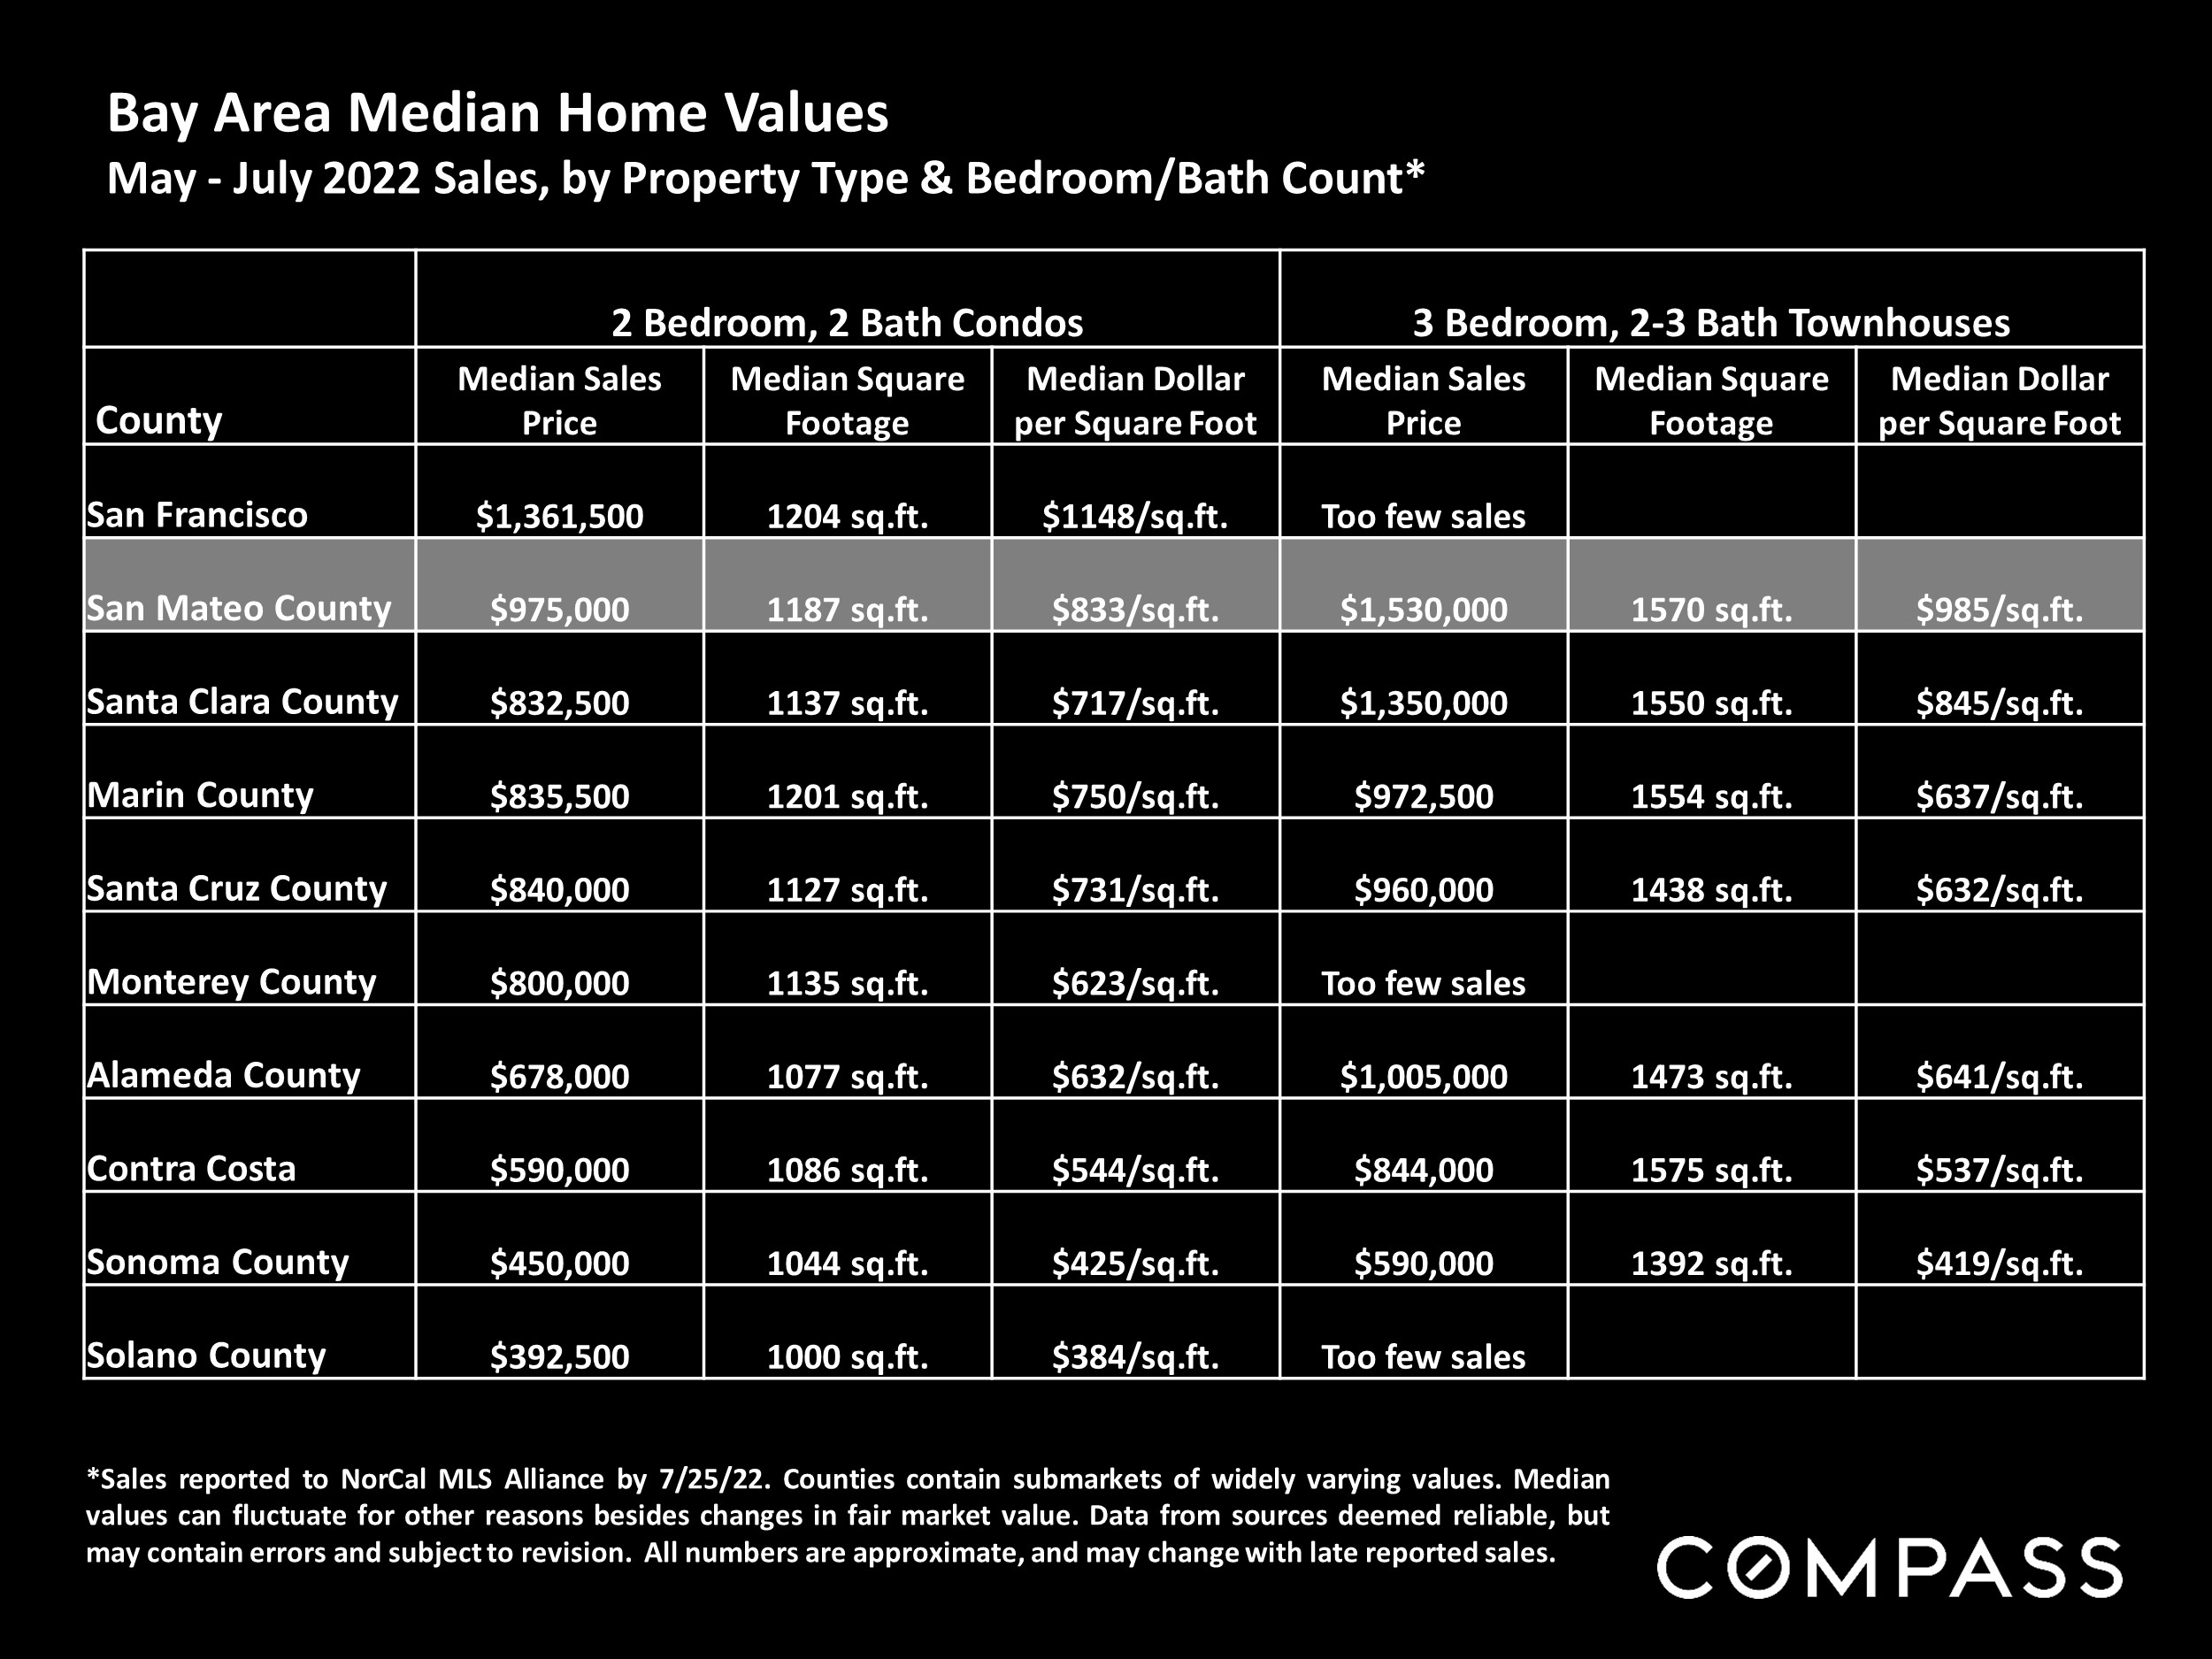
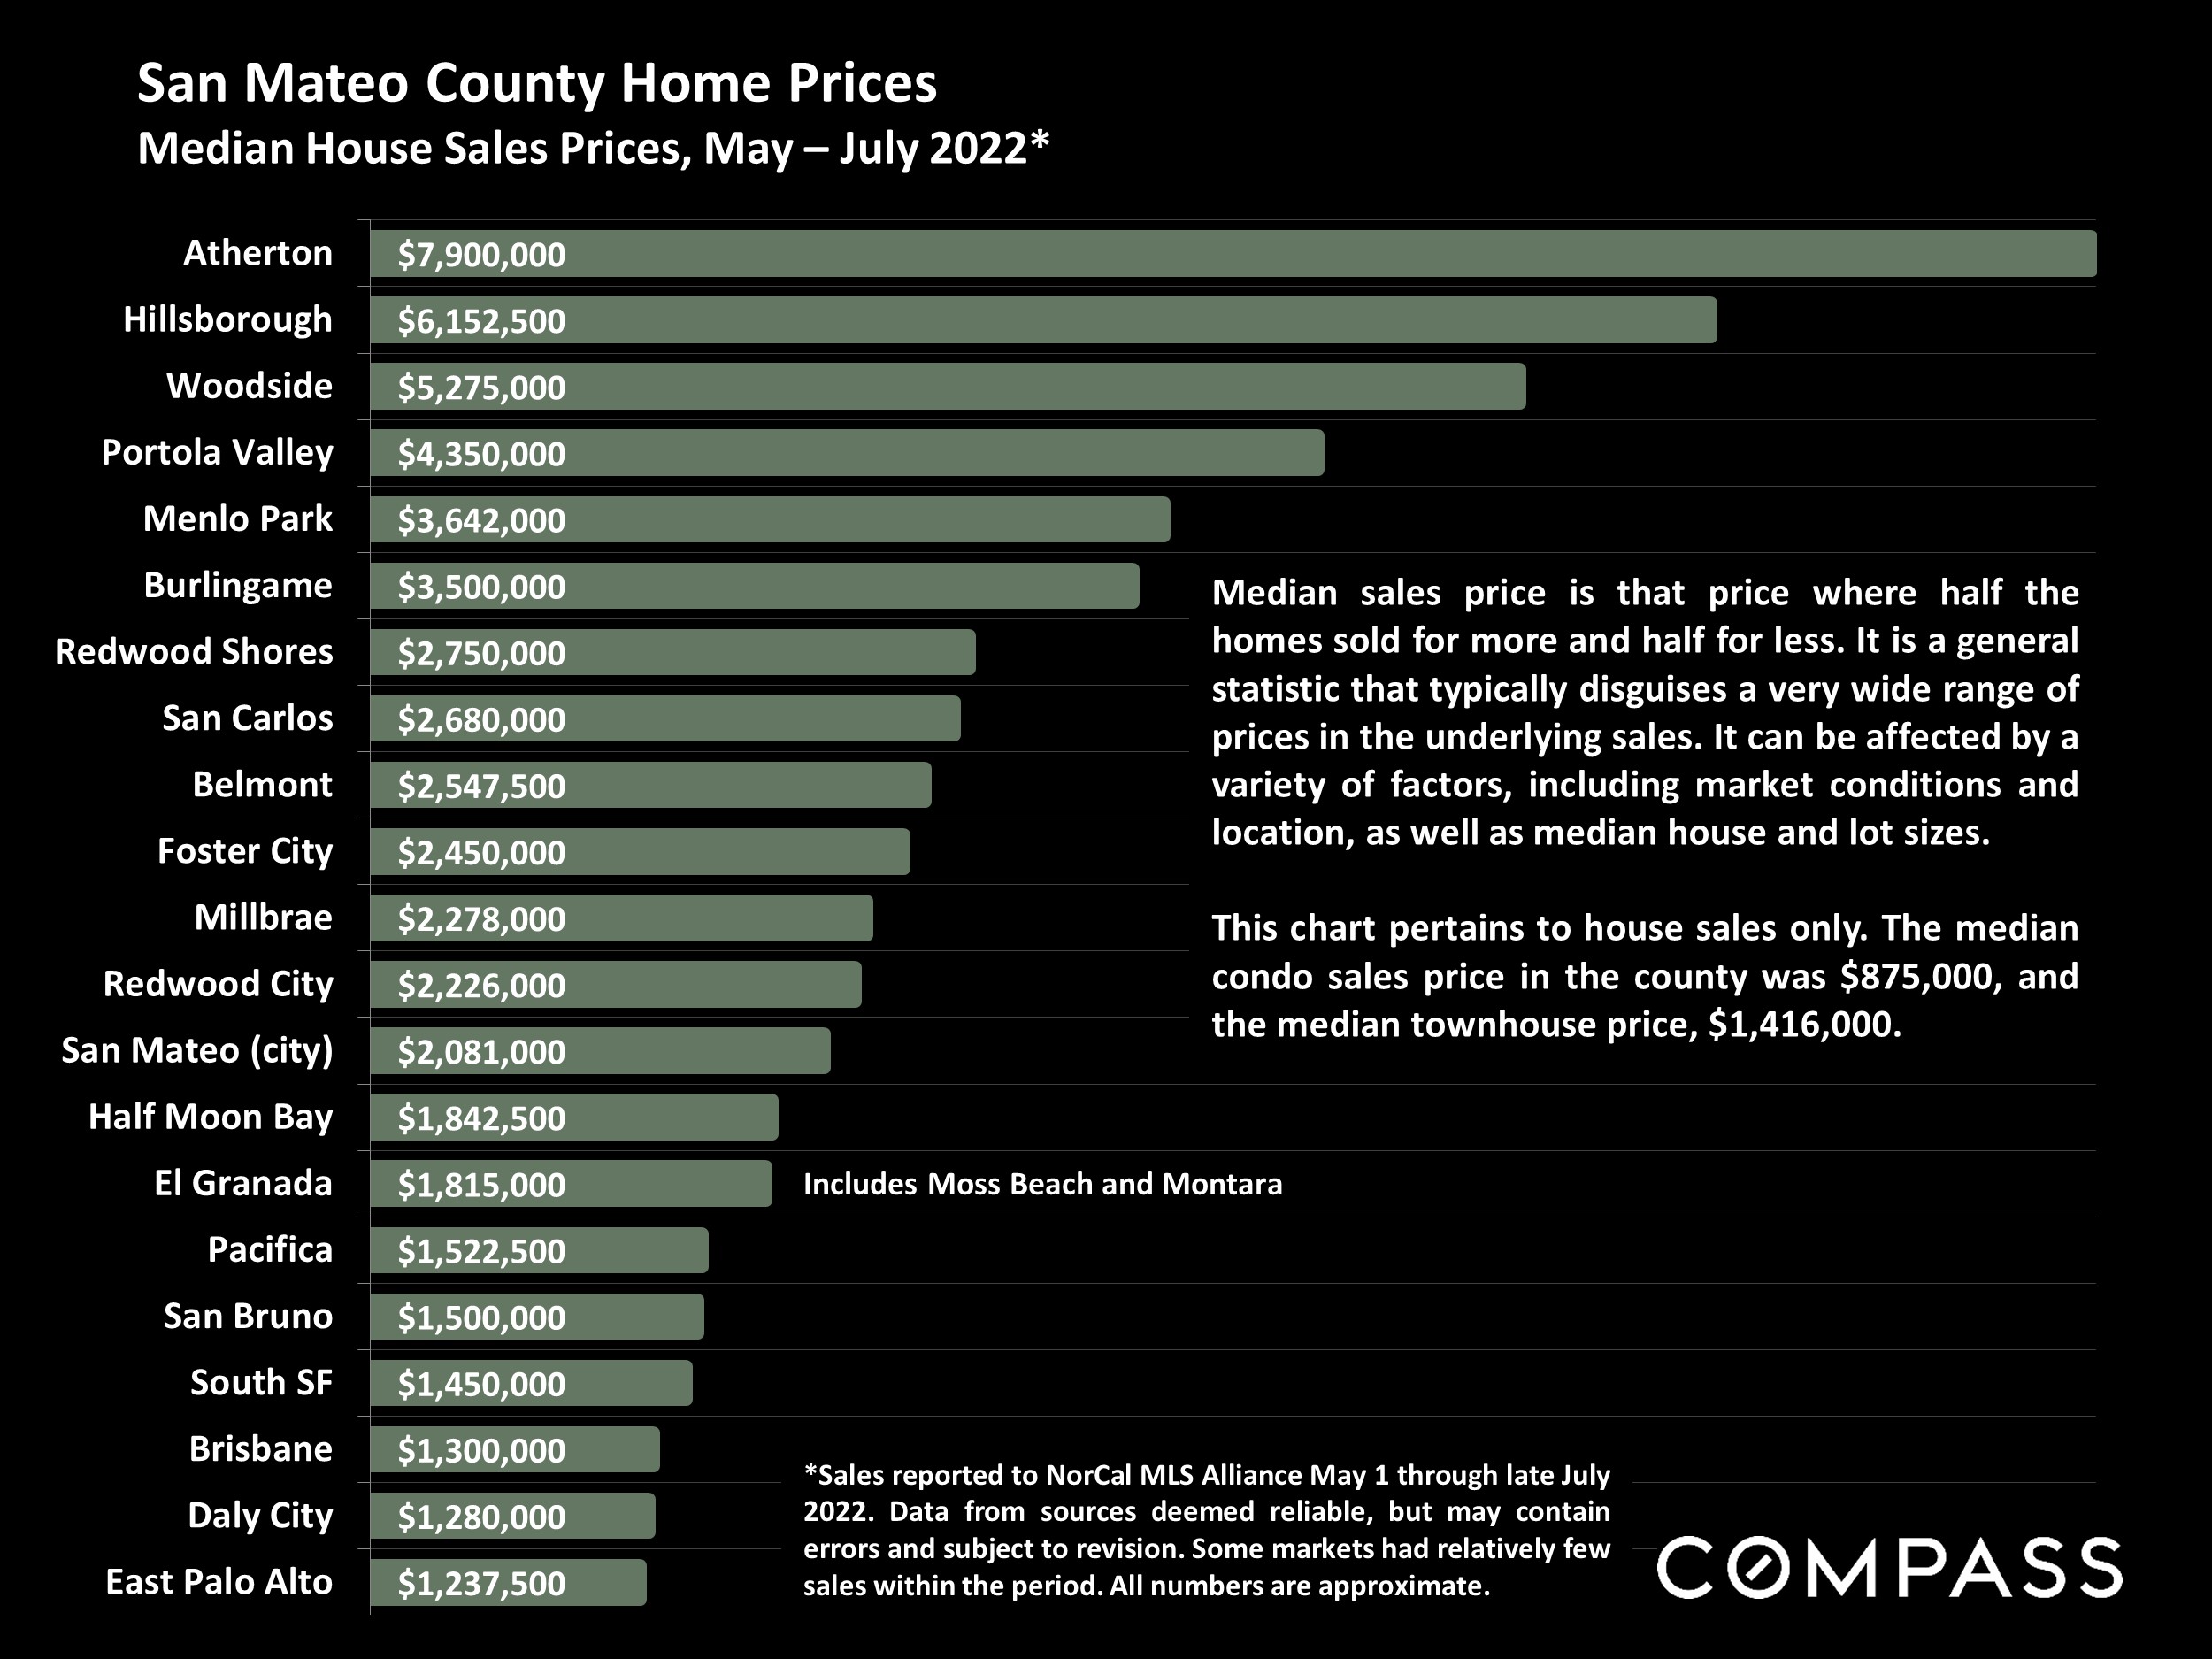
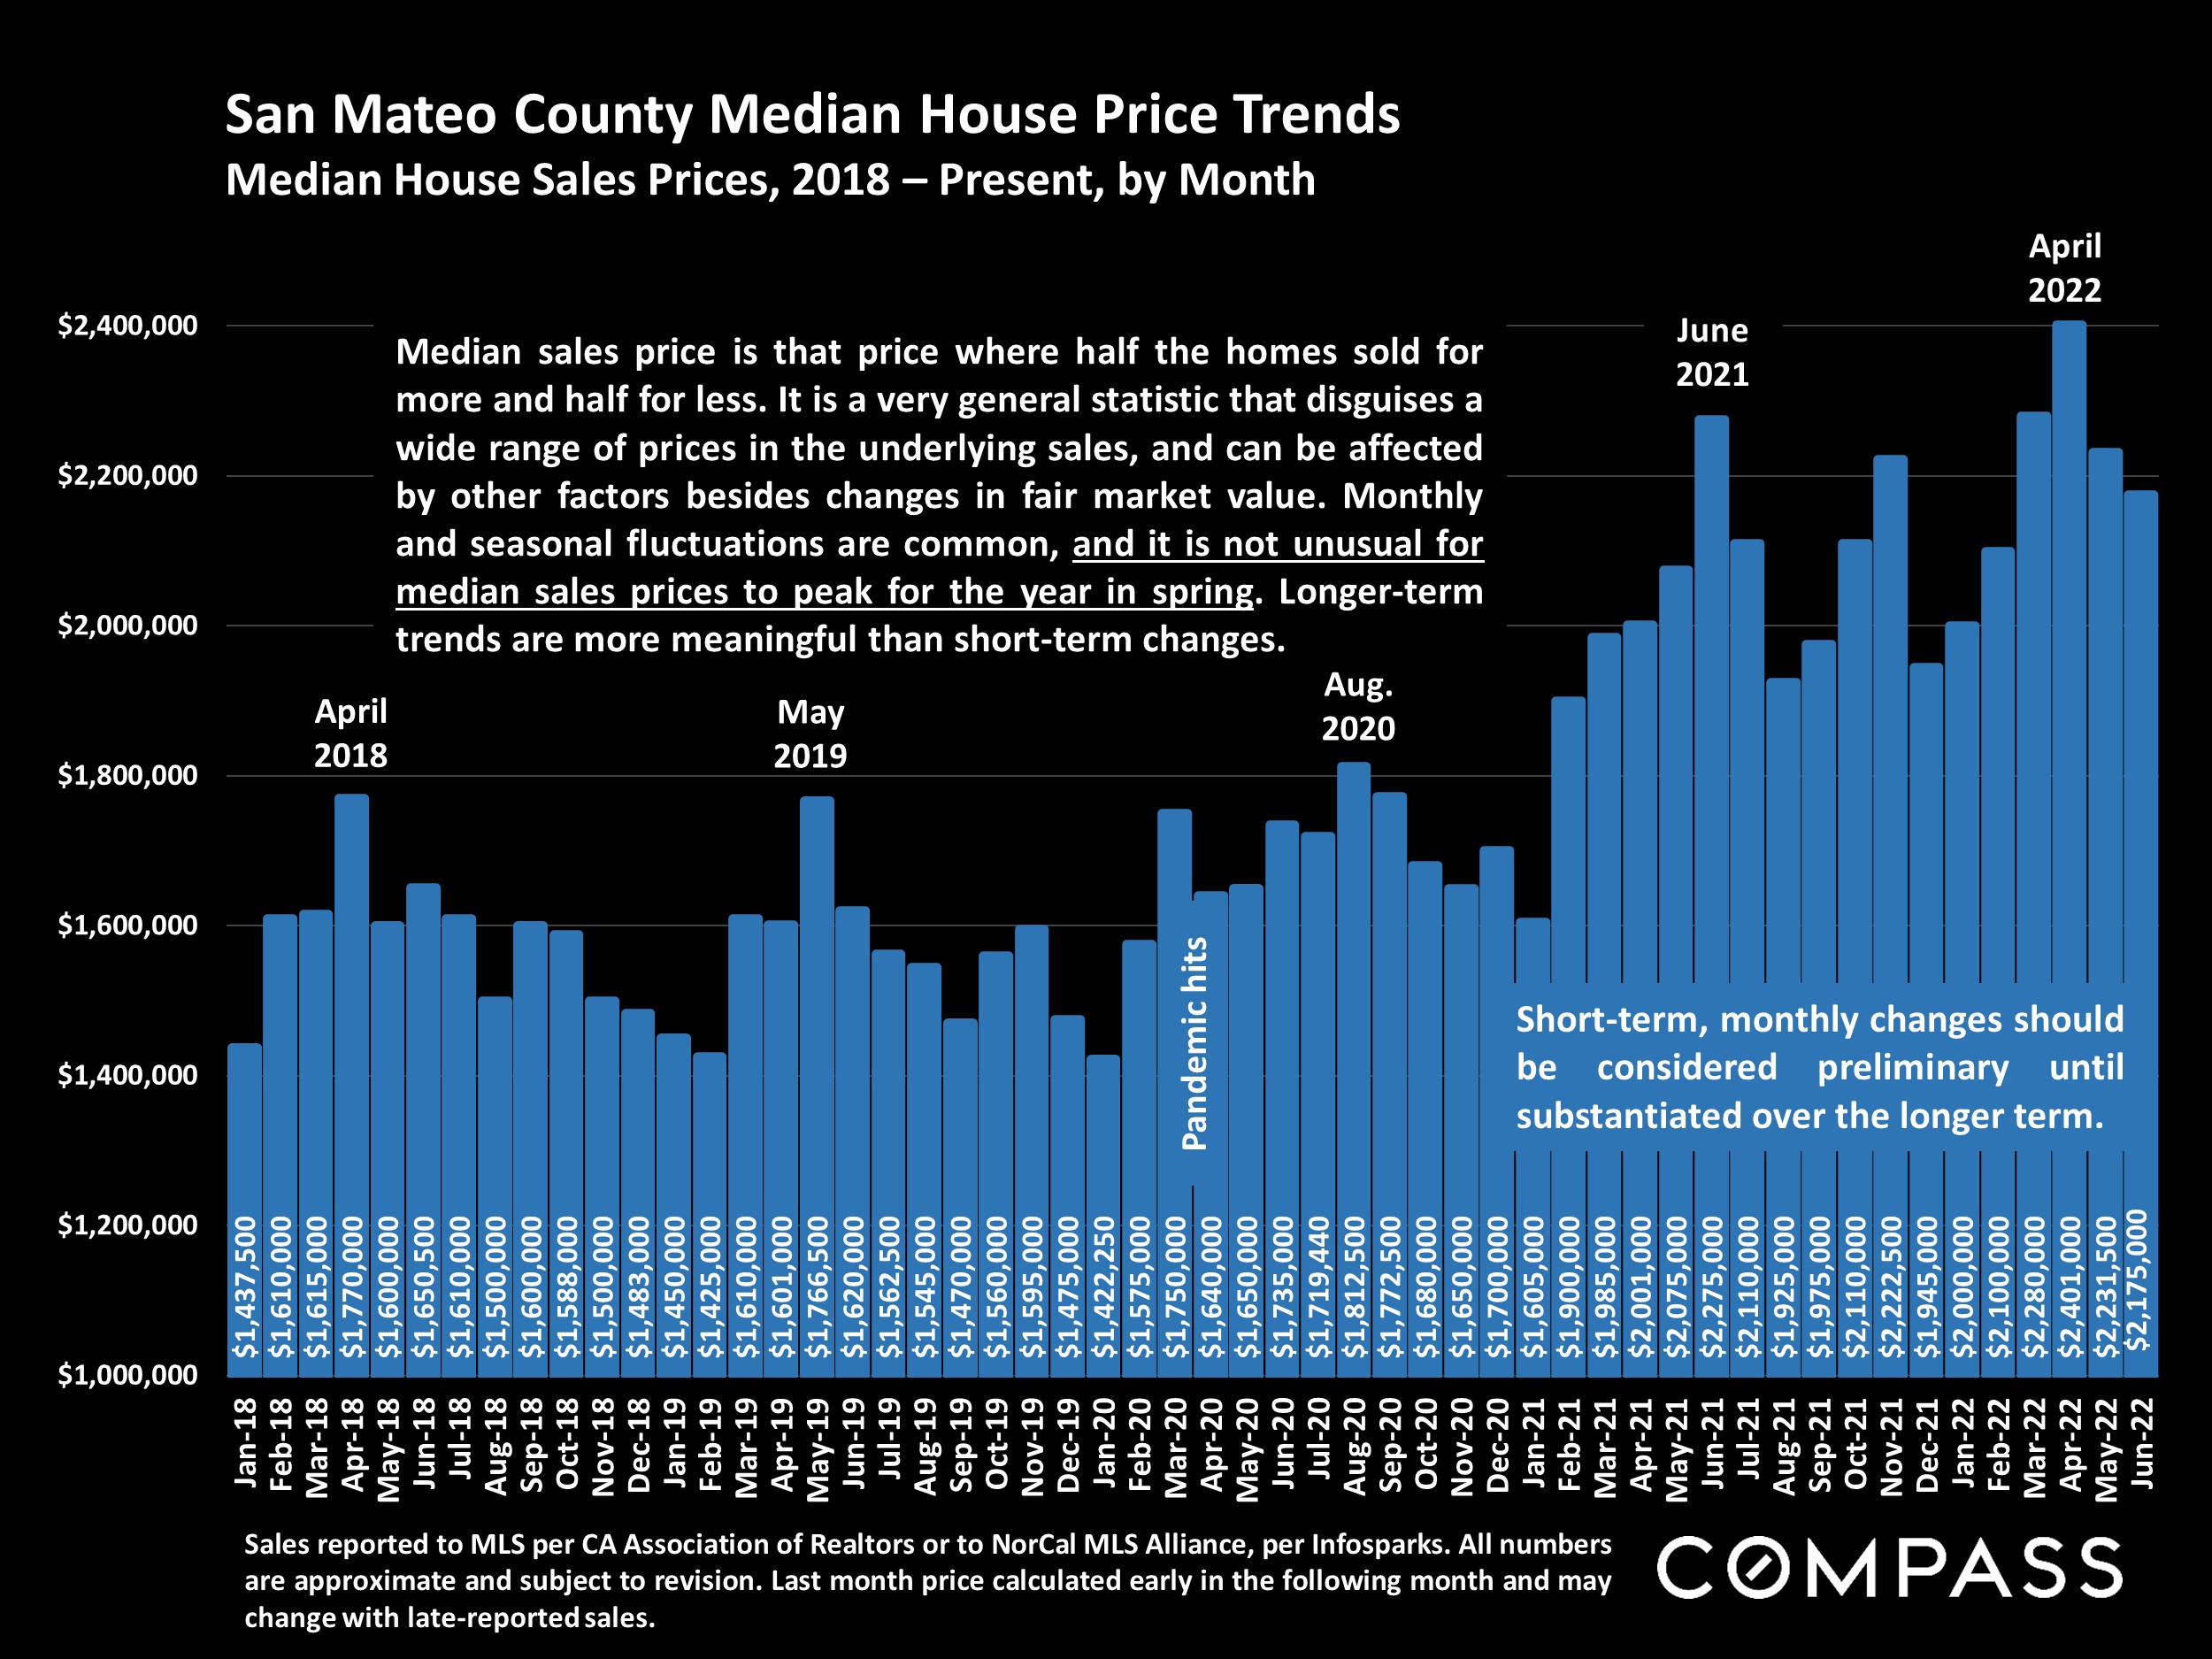
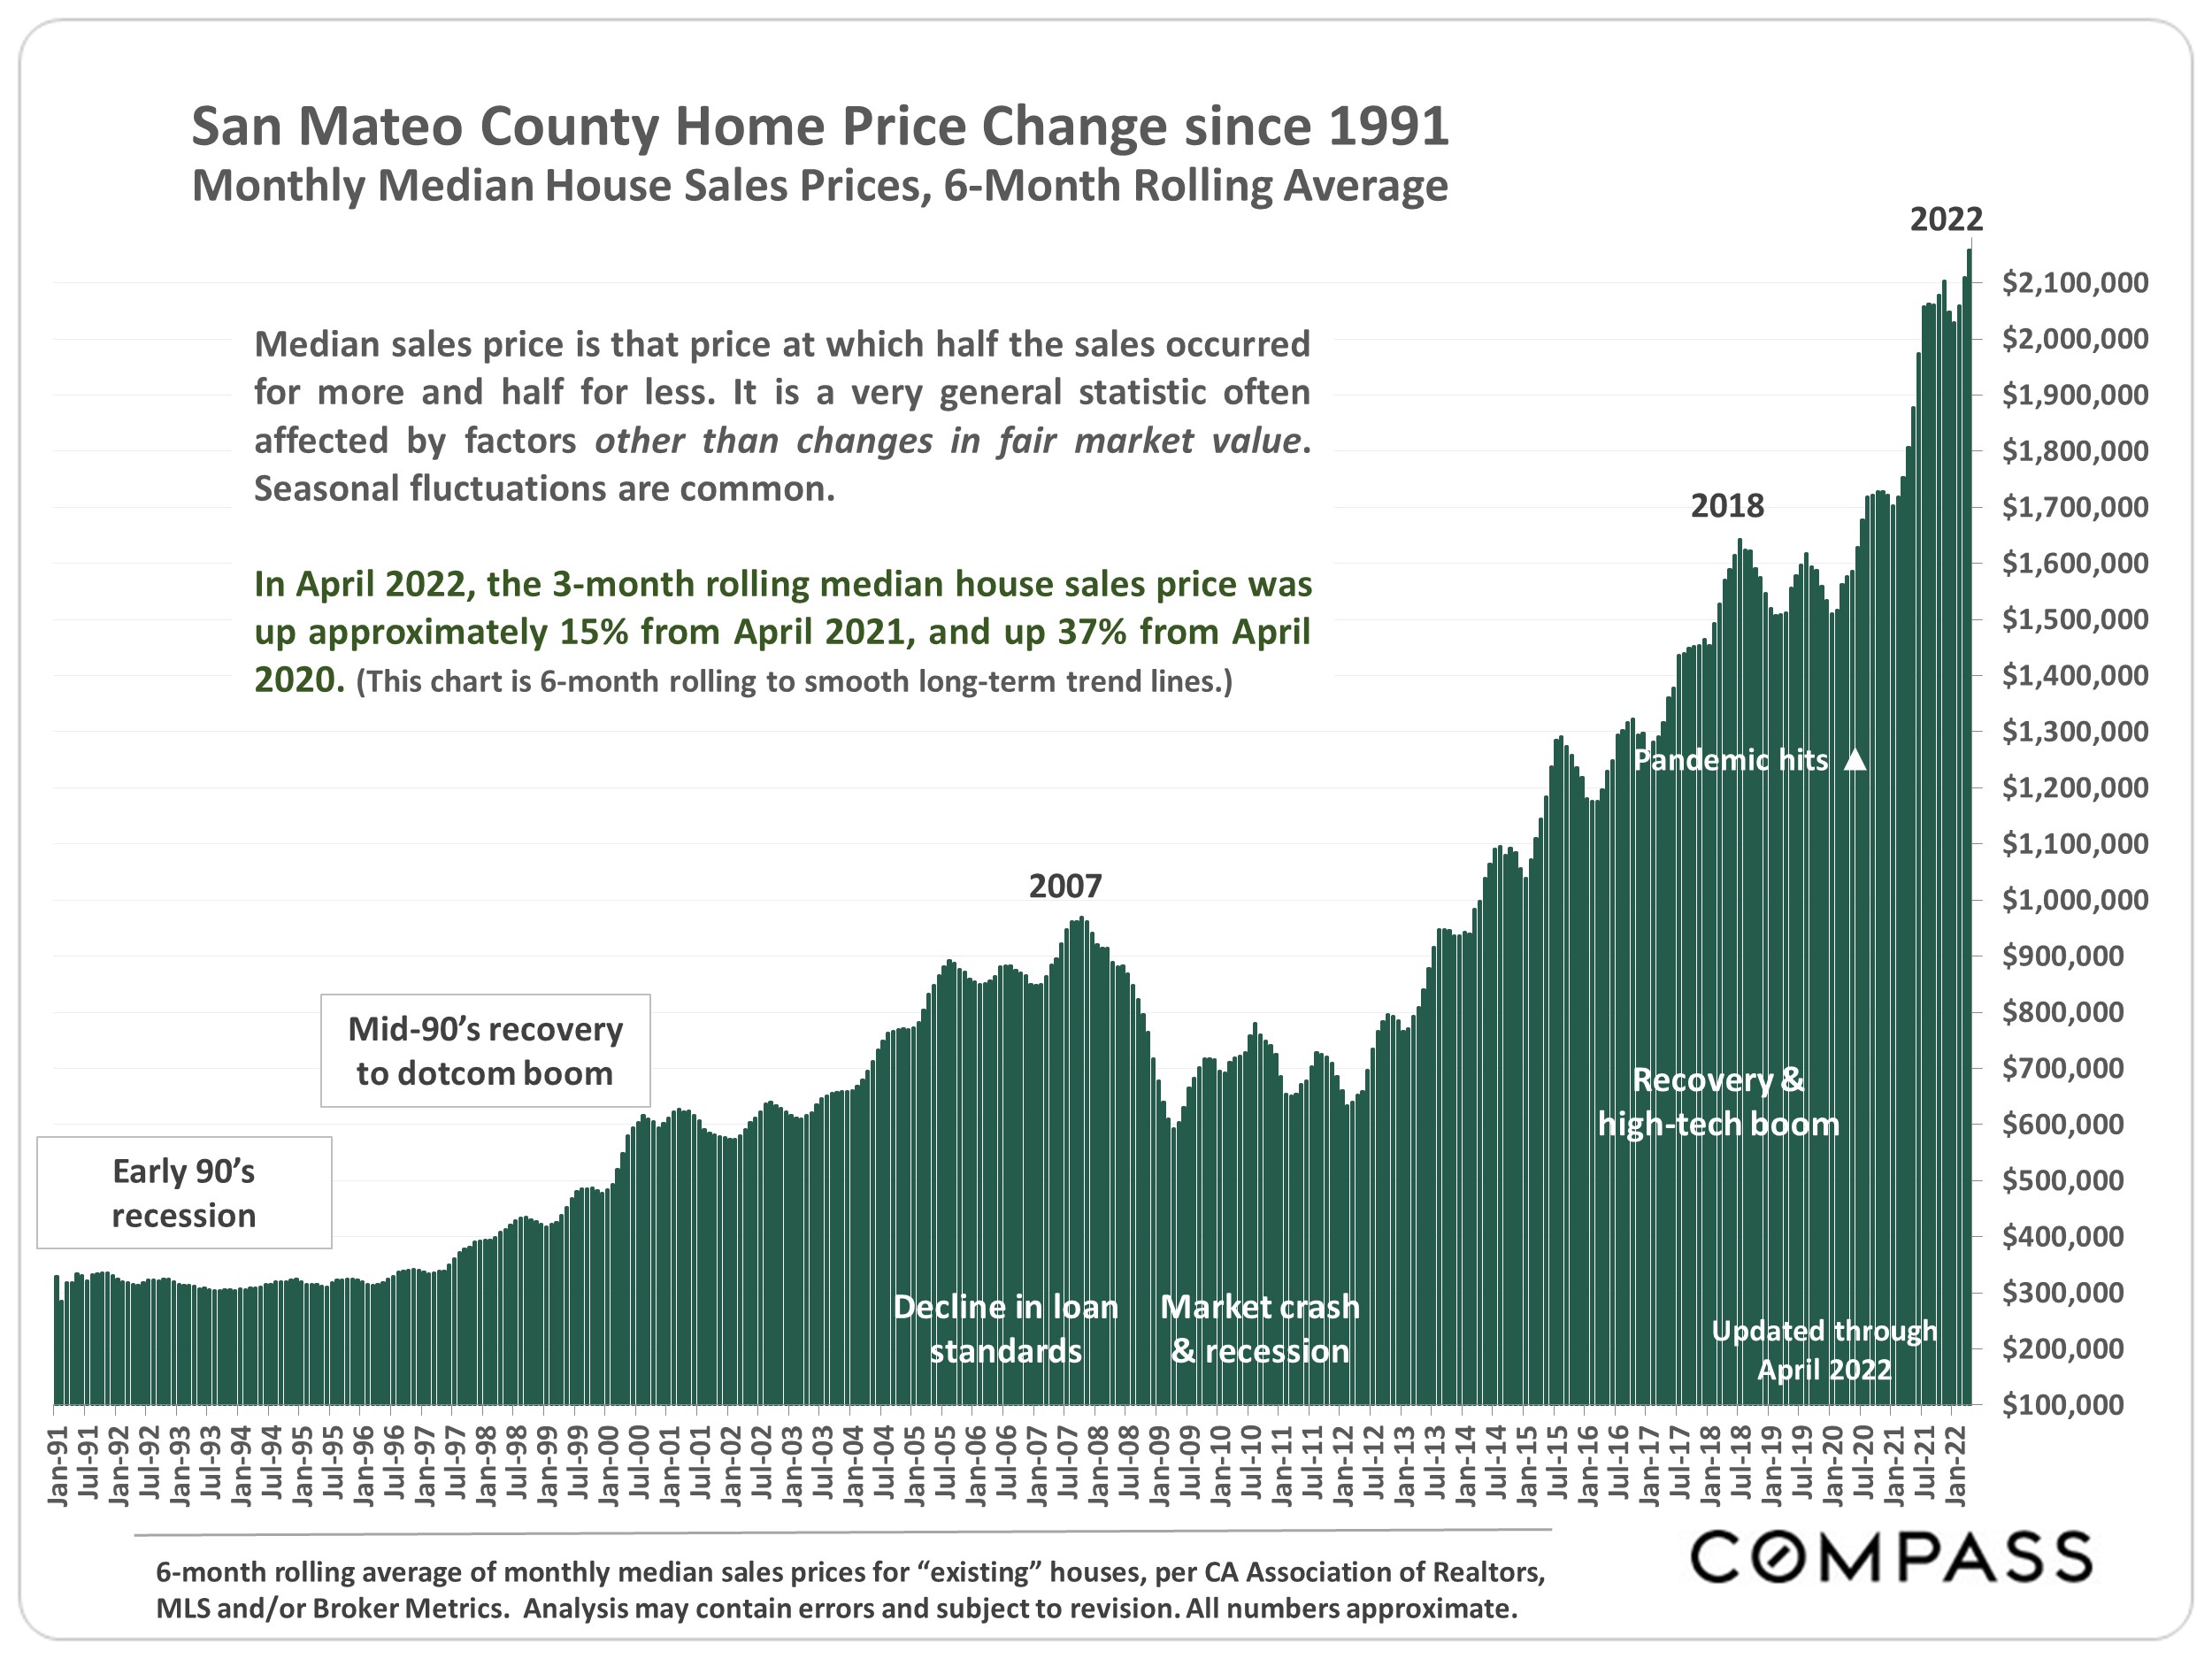
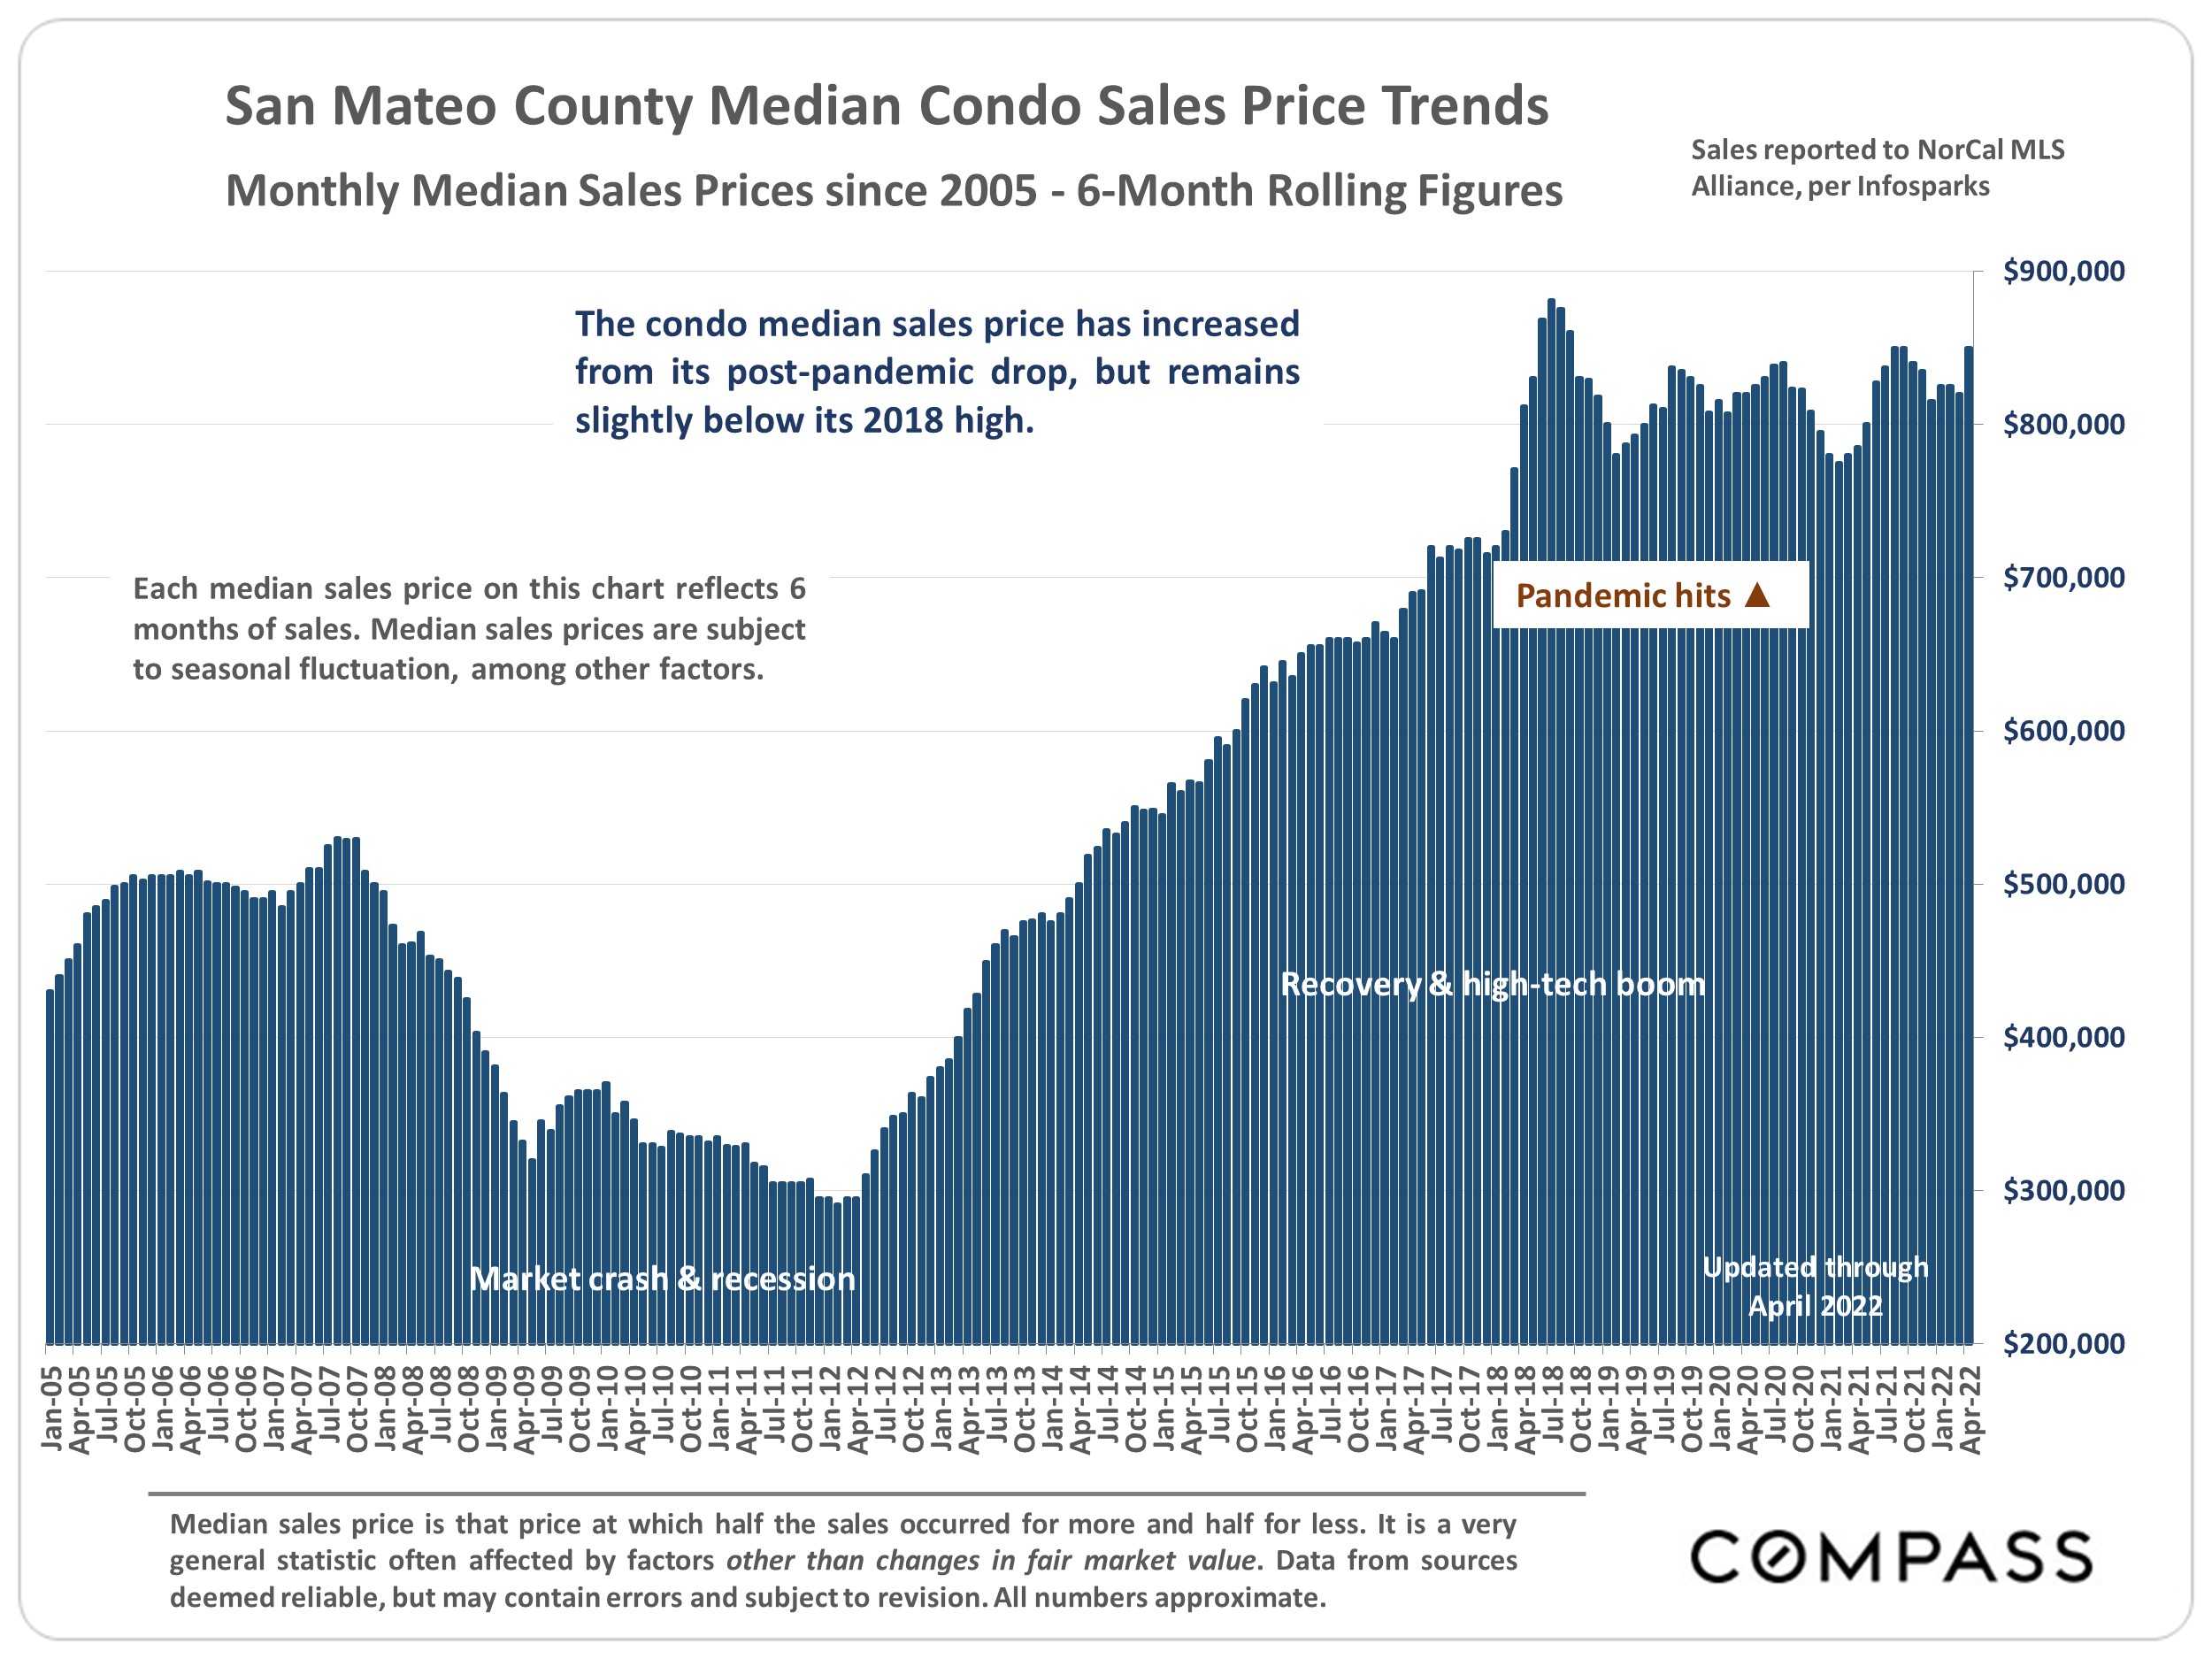
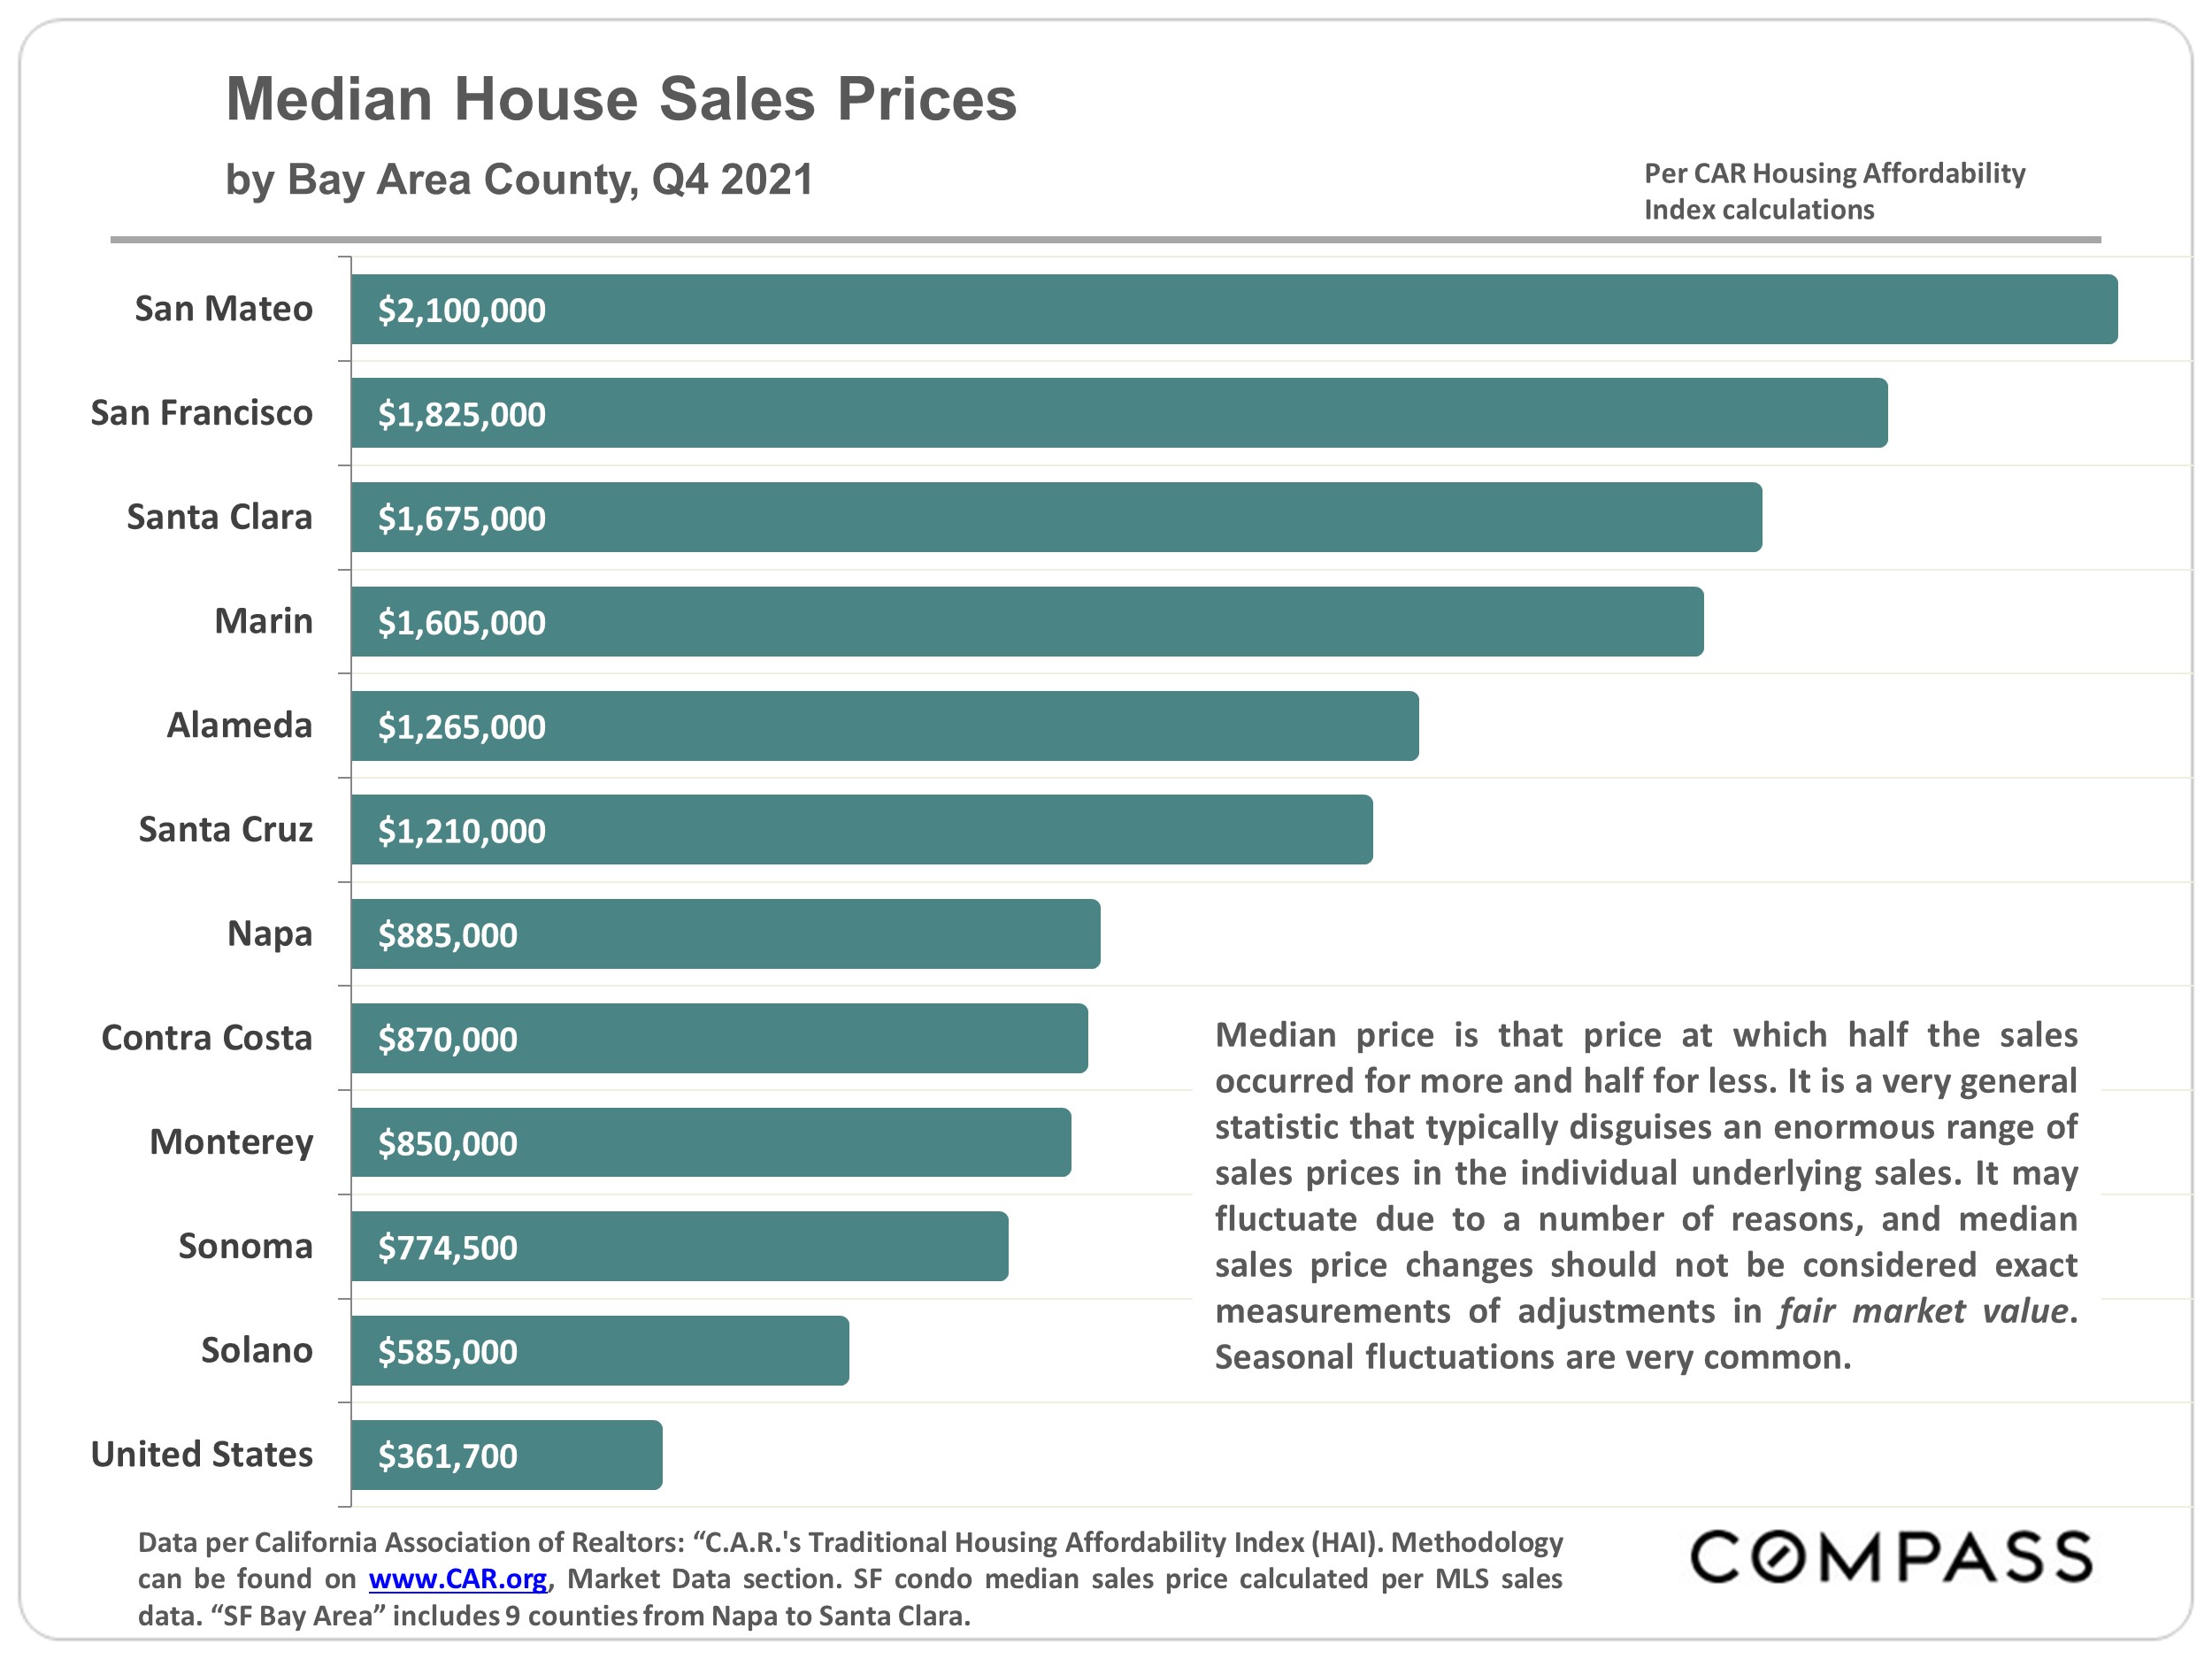
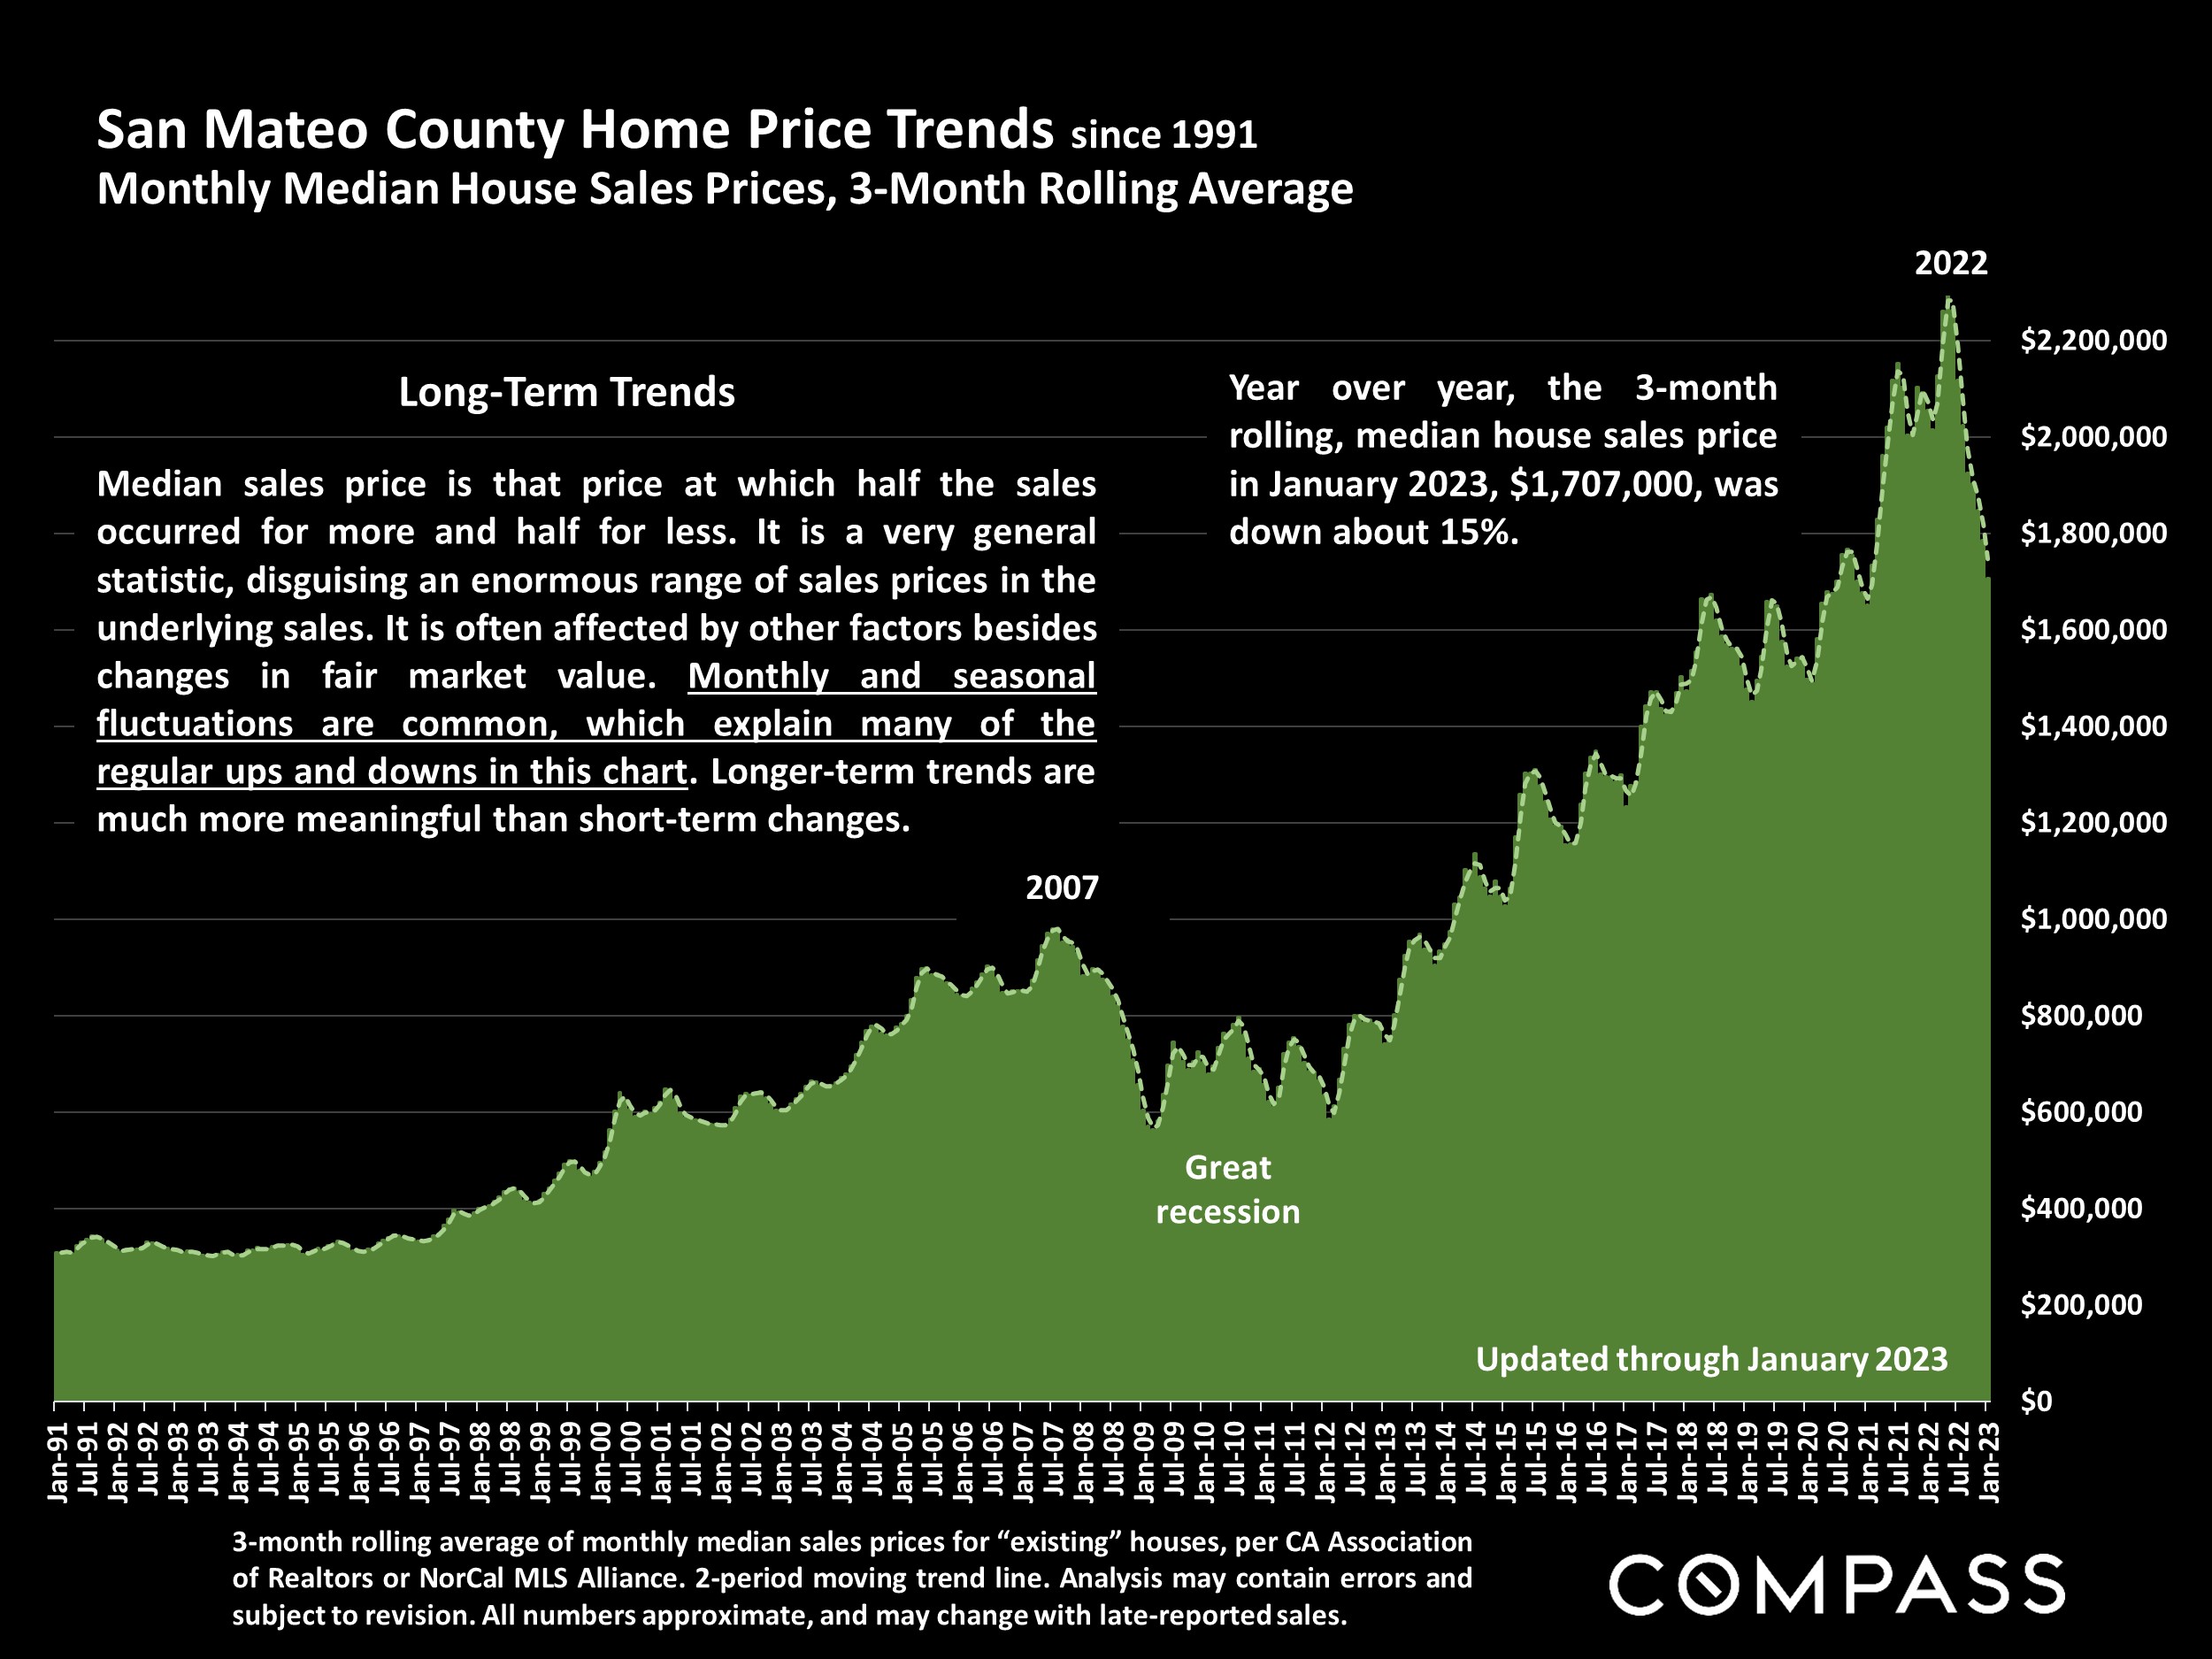
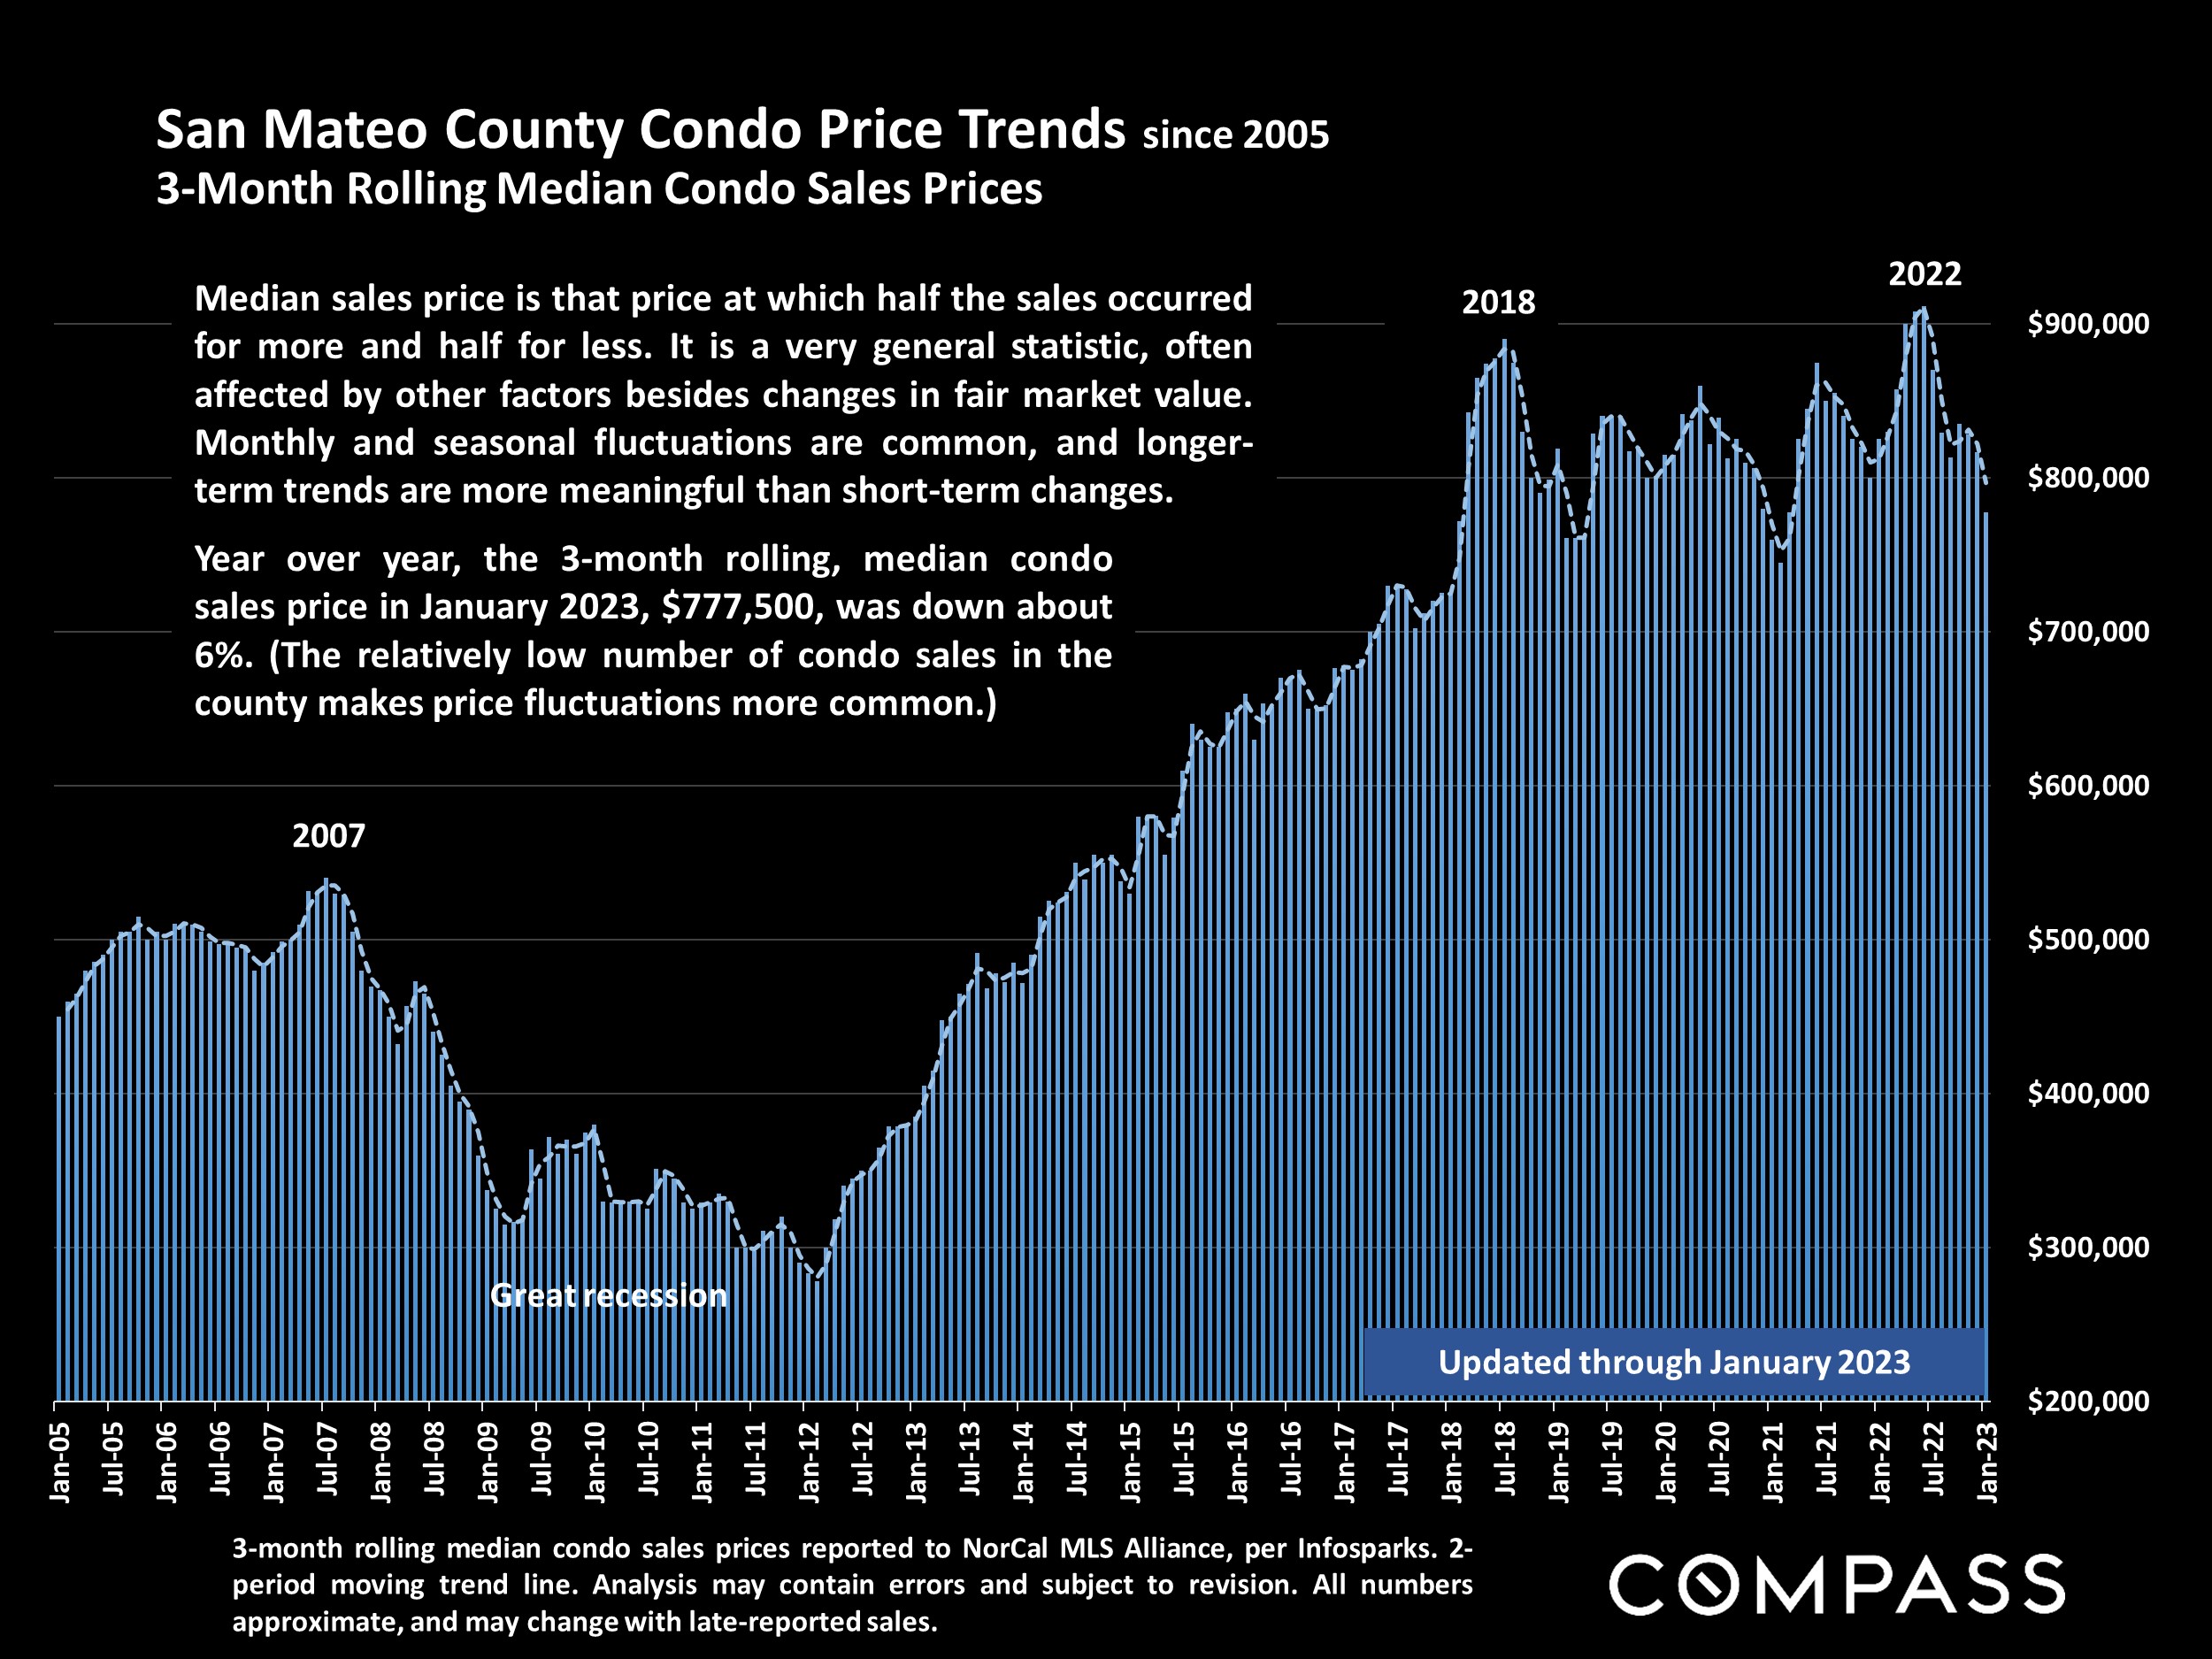
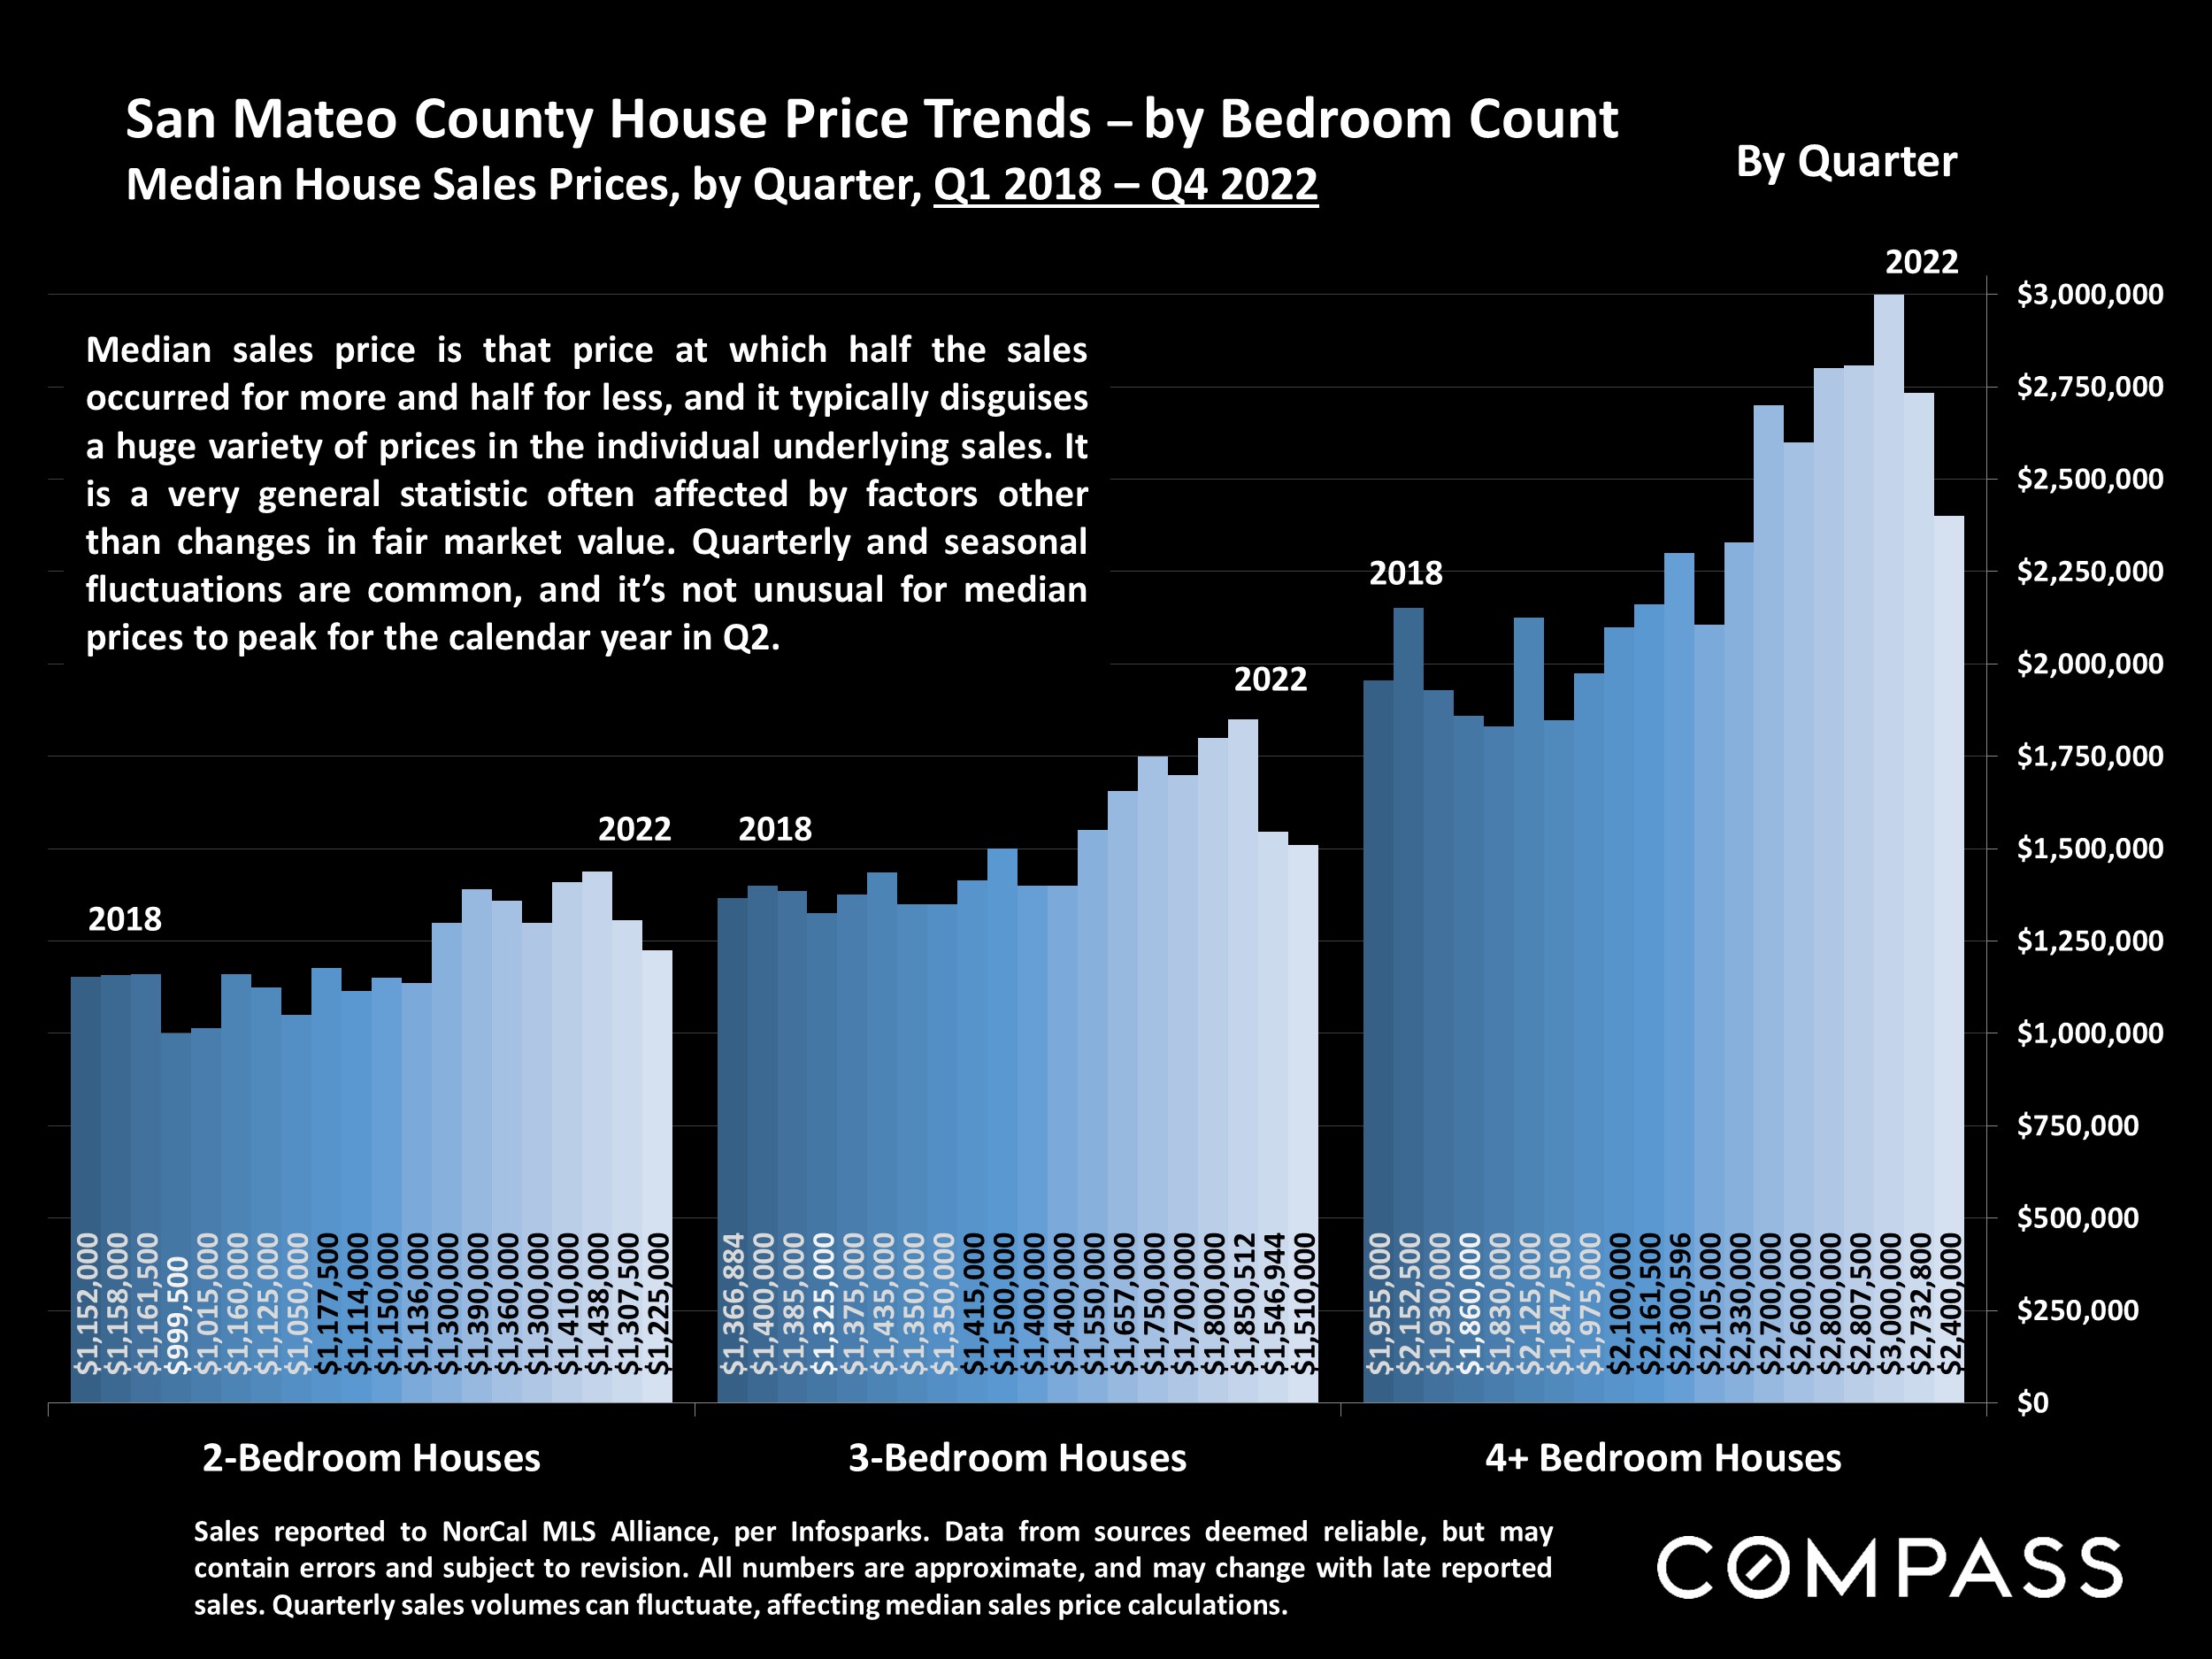
Median Sales Price is that price at which half the properties sold for more and half for less. It may be affected by seasonality, “unusual” events, or changes in inventory and buying trends, as well as by changes in fair market value. The median sales price for an area will often conceal an enormous variety of sales prices in the underlying individual sales.
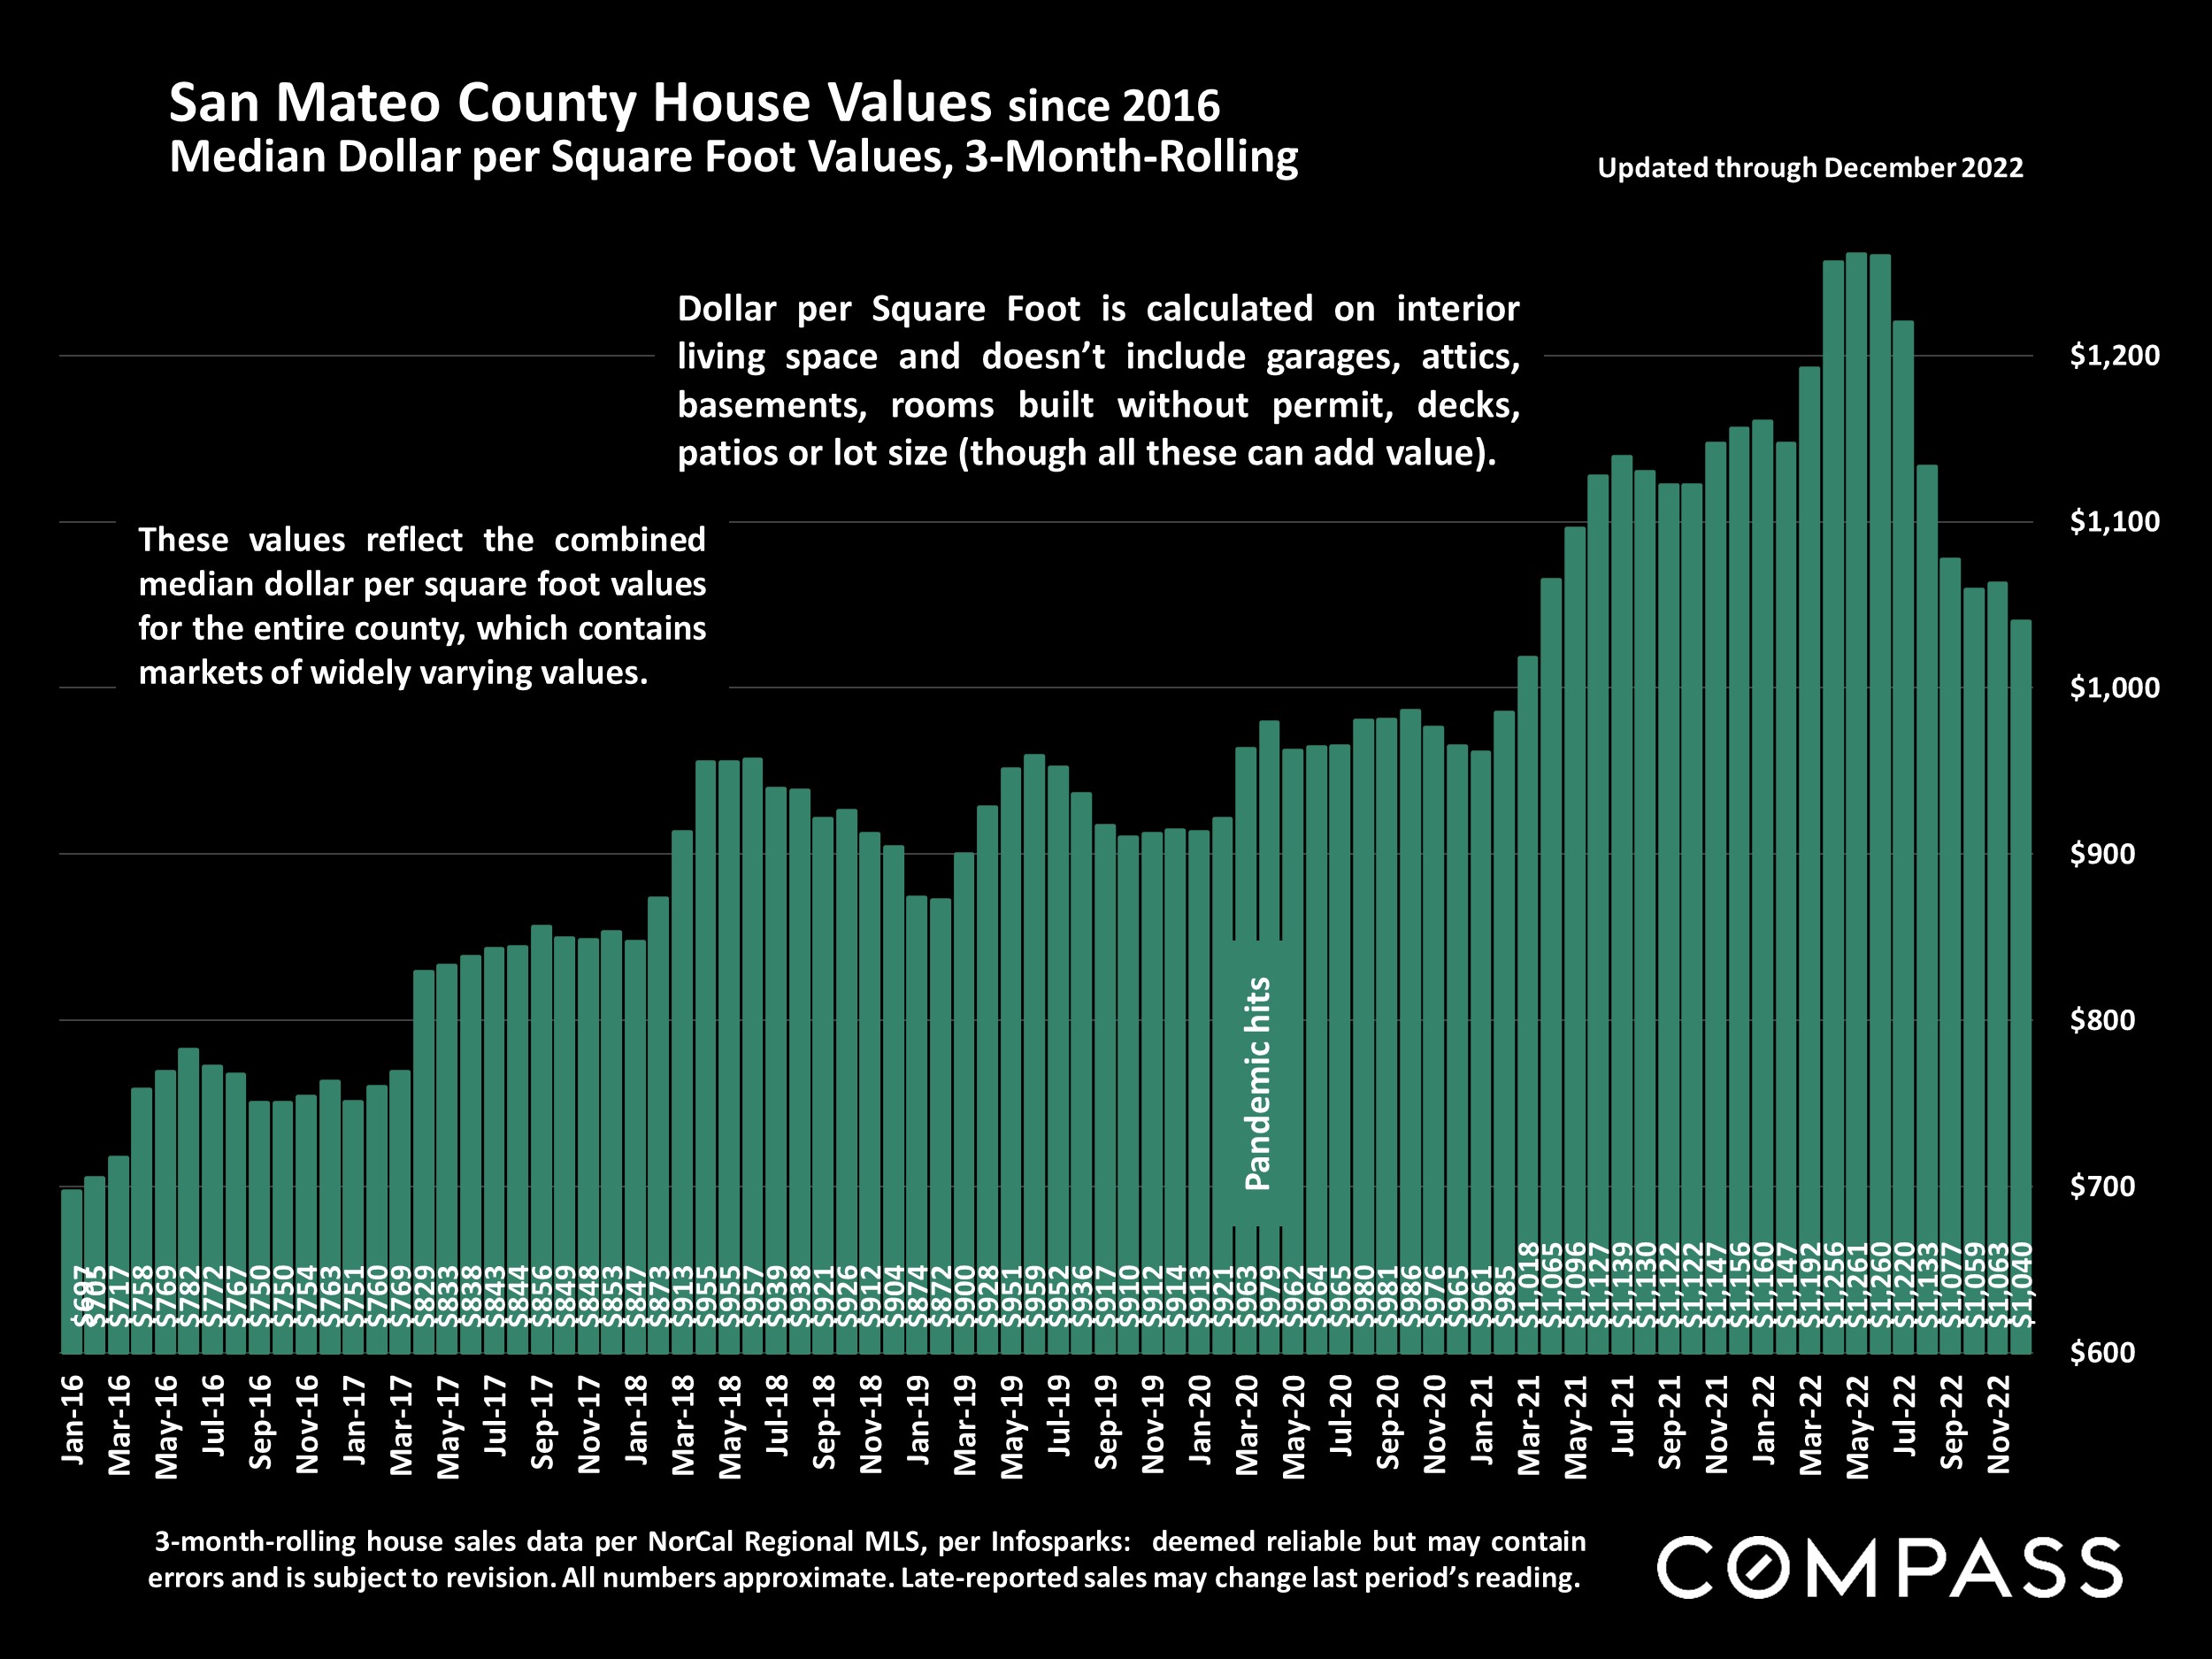
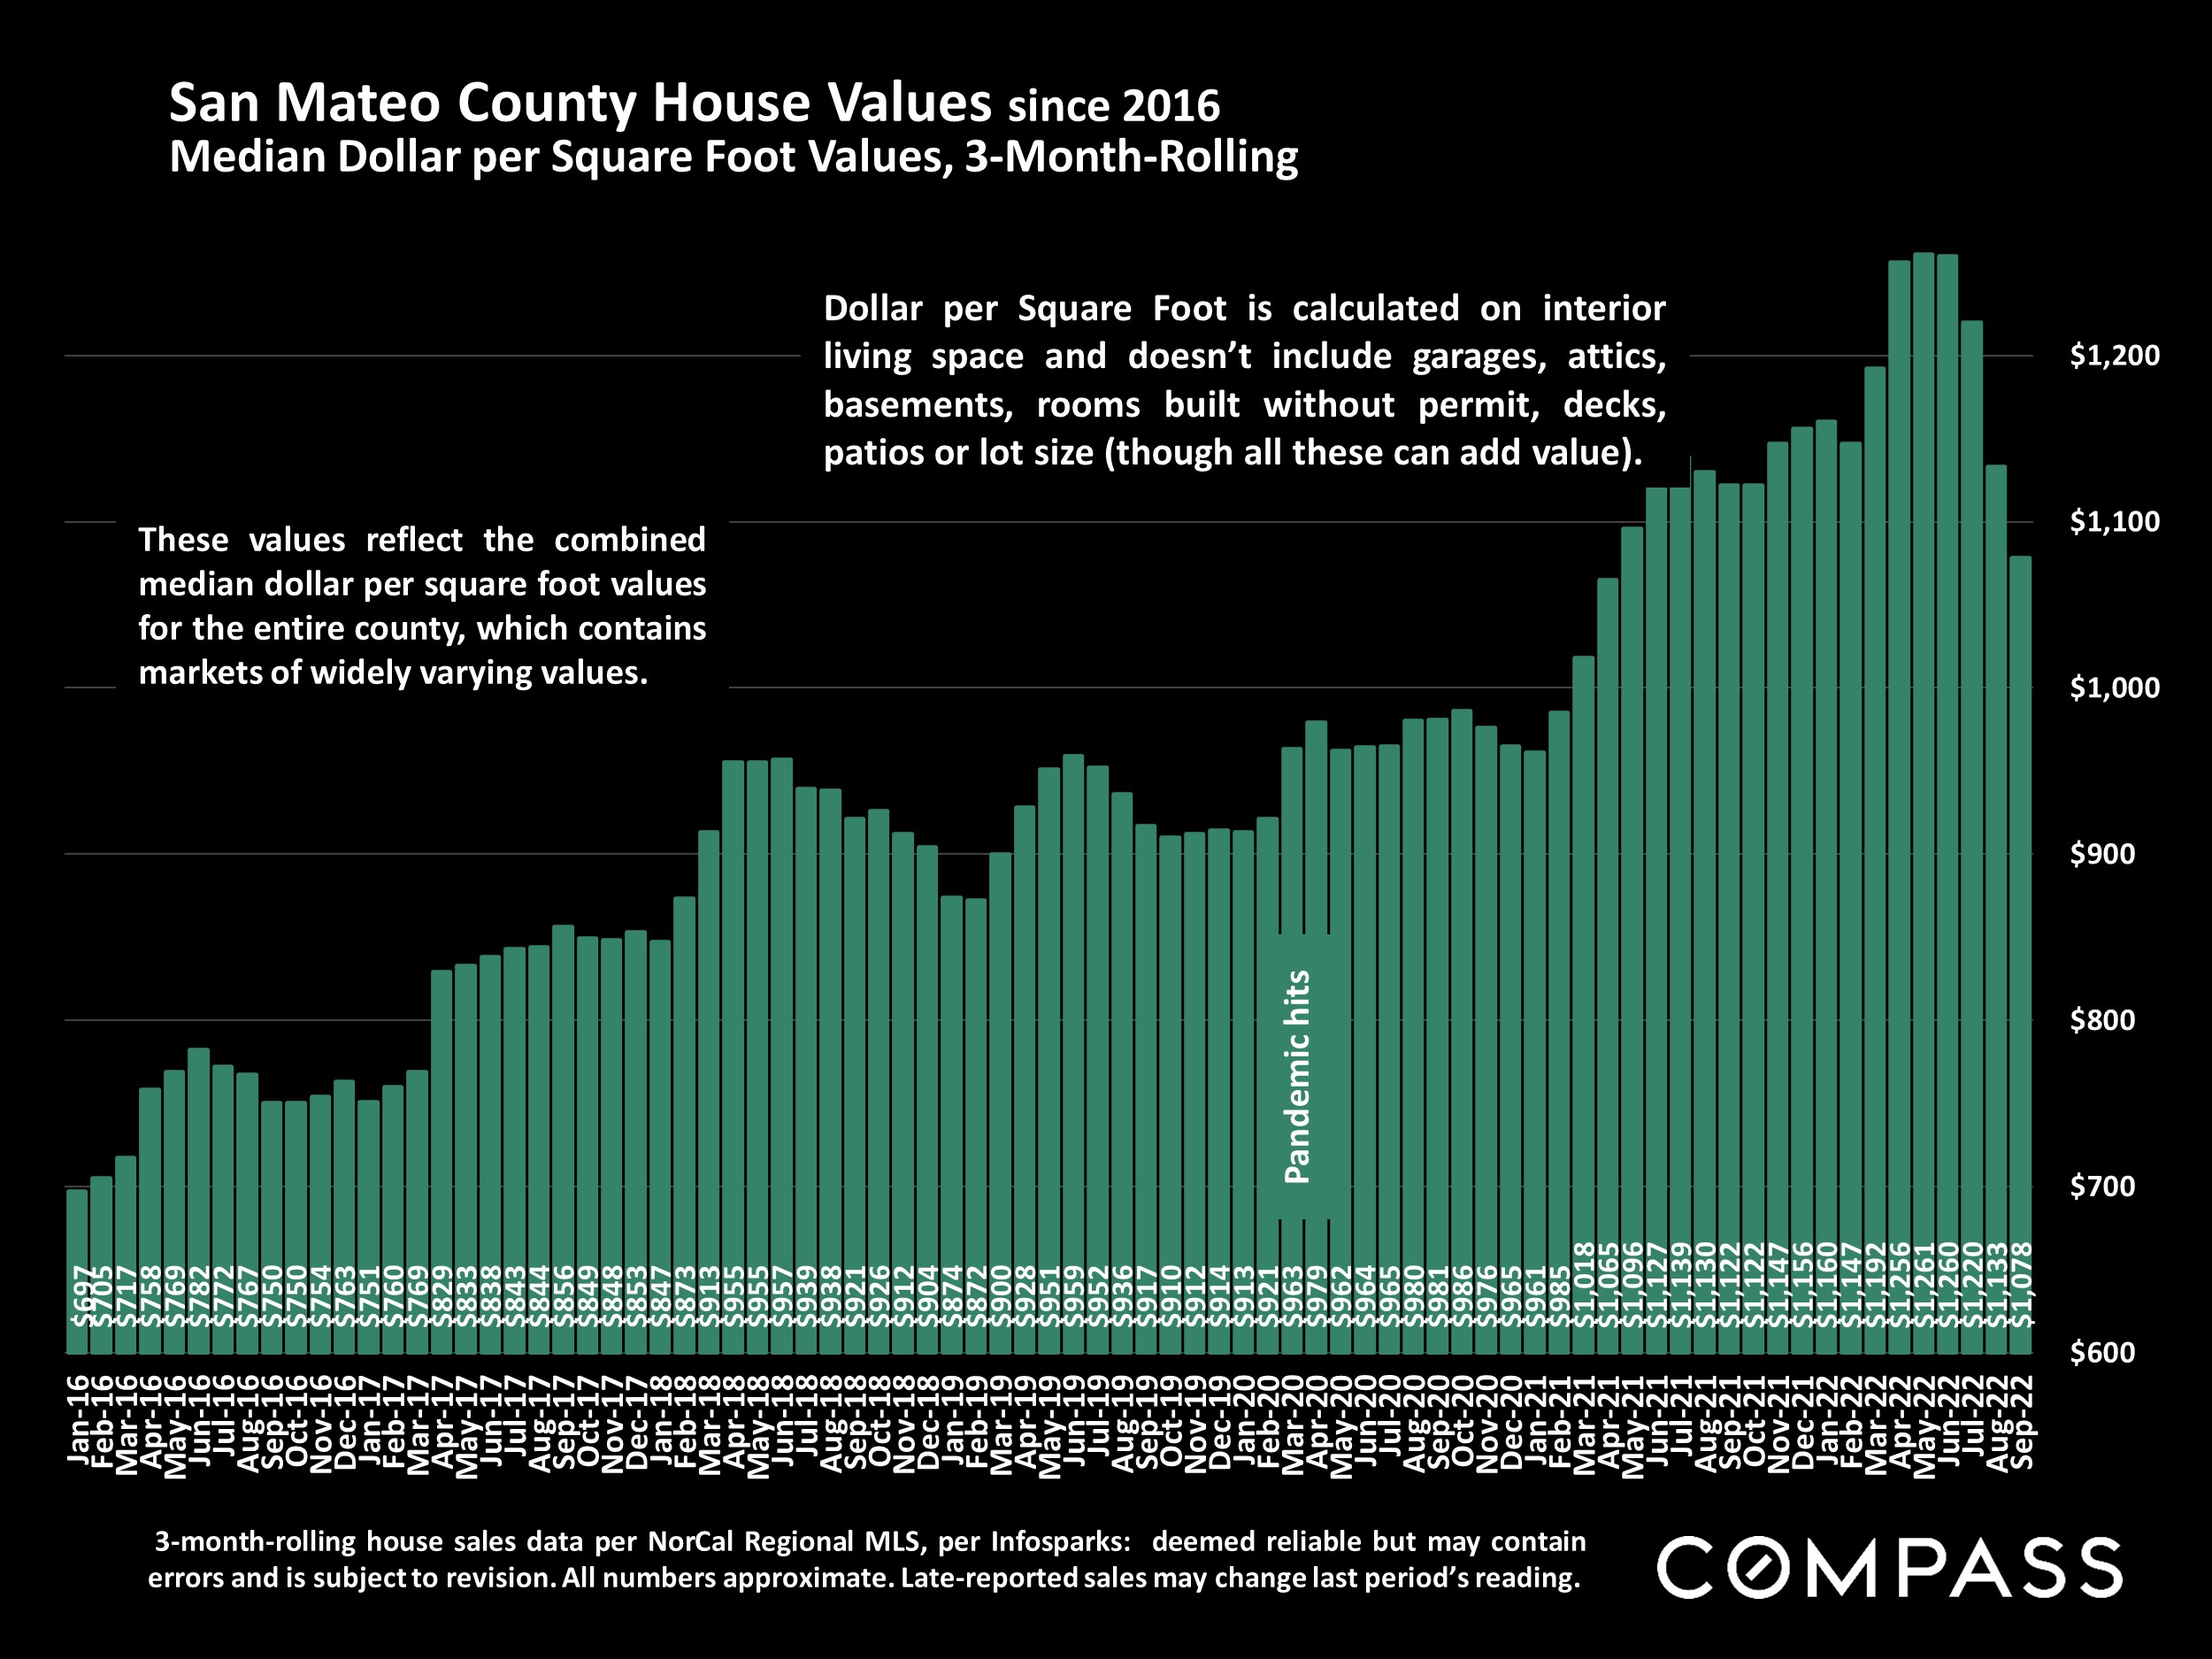
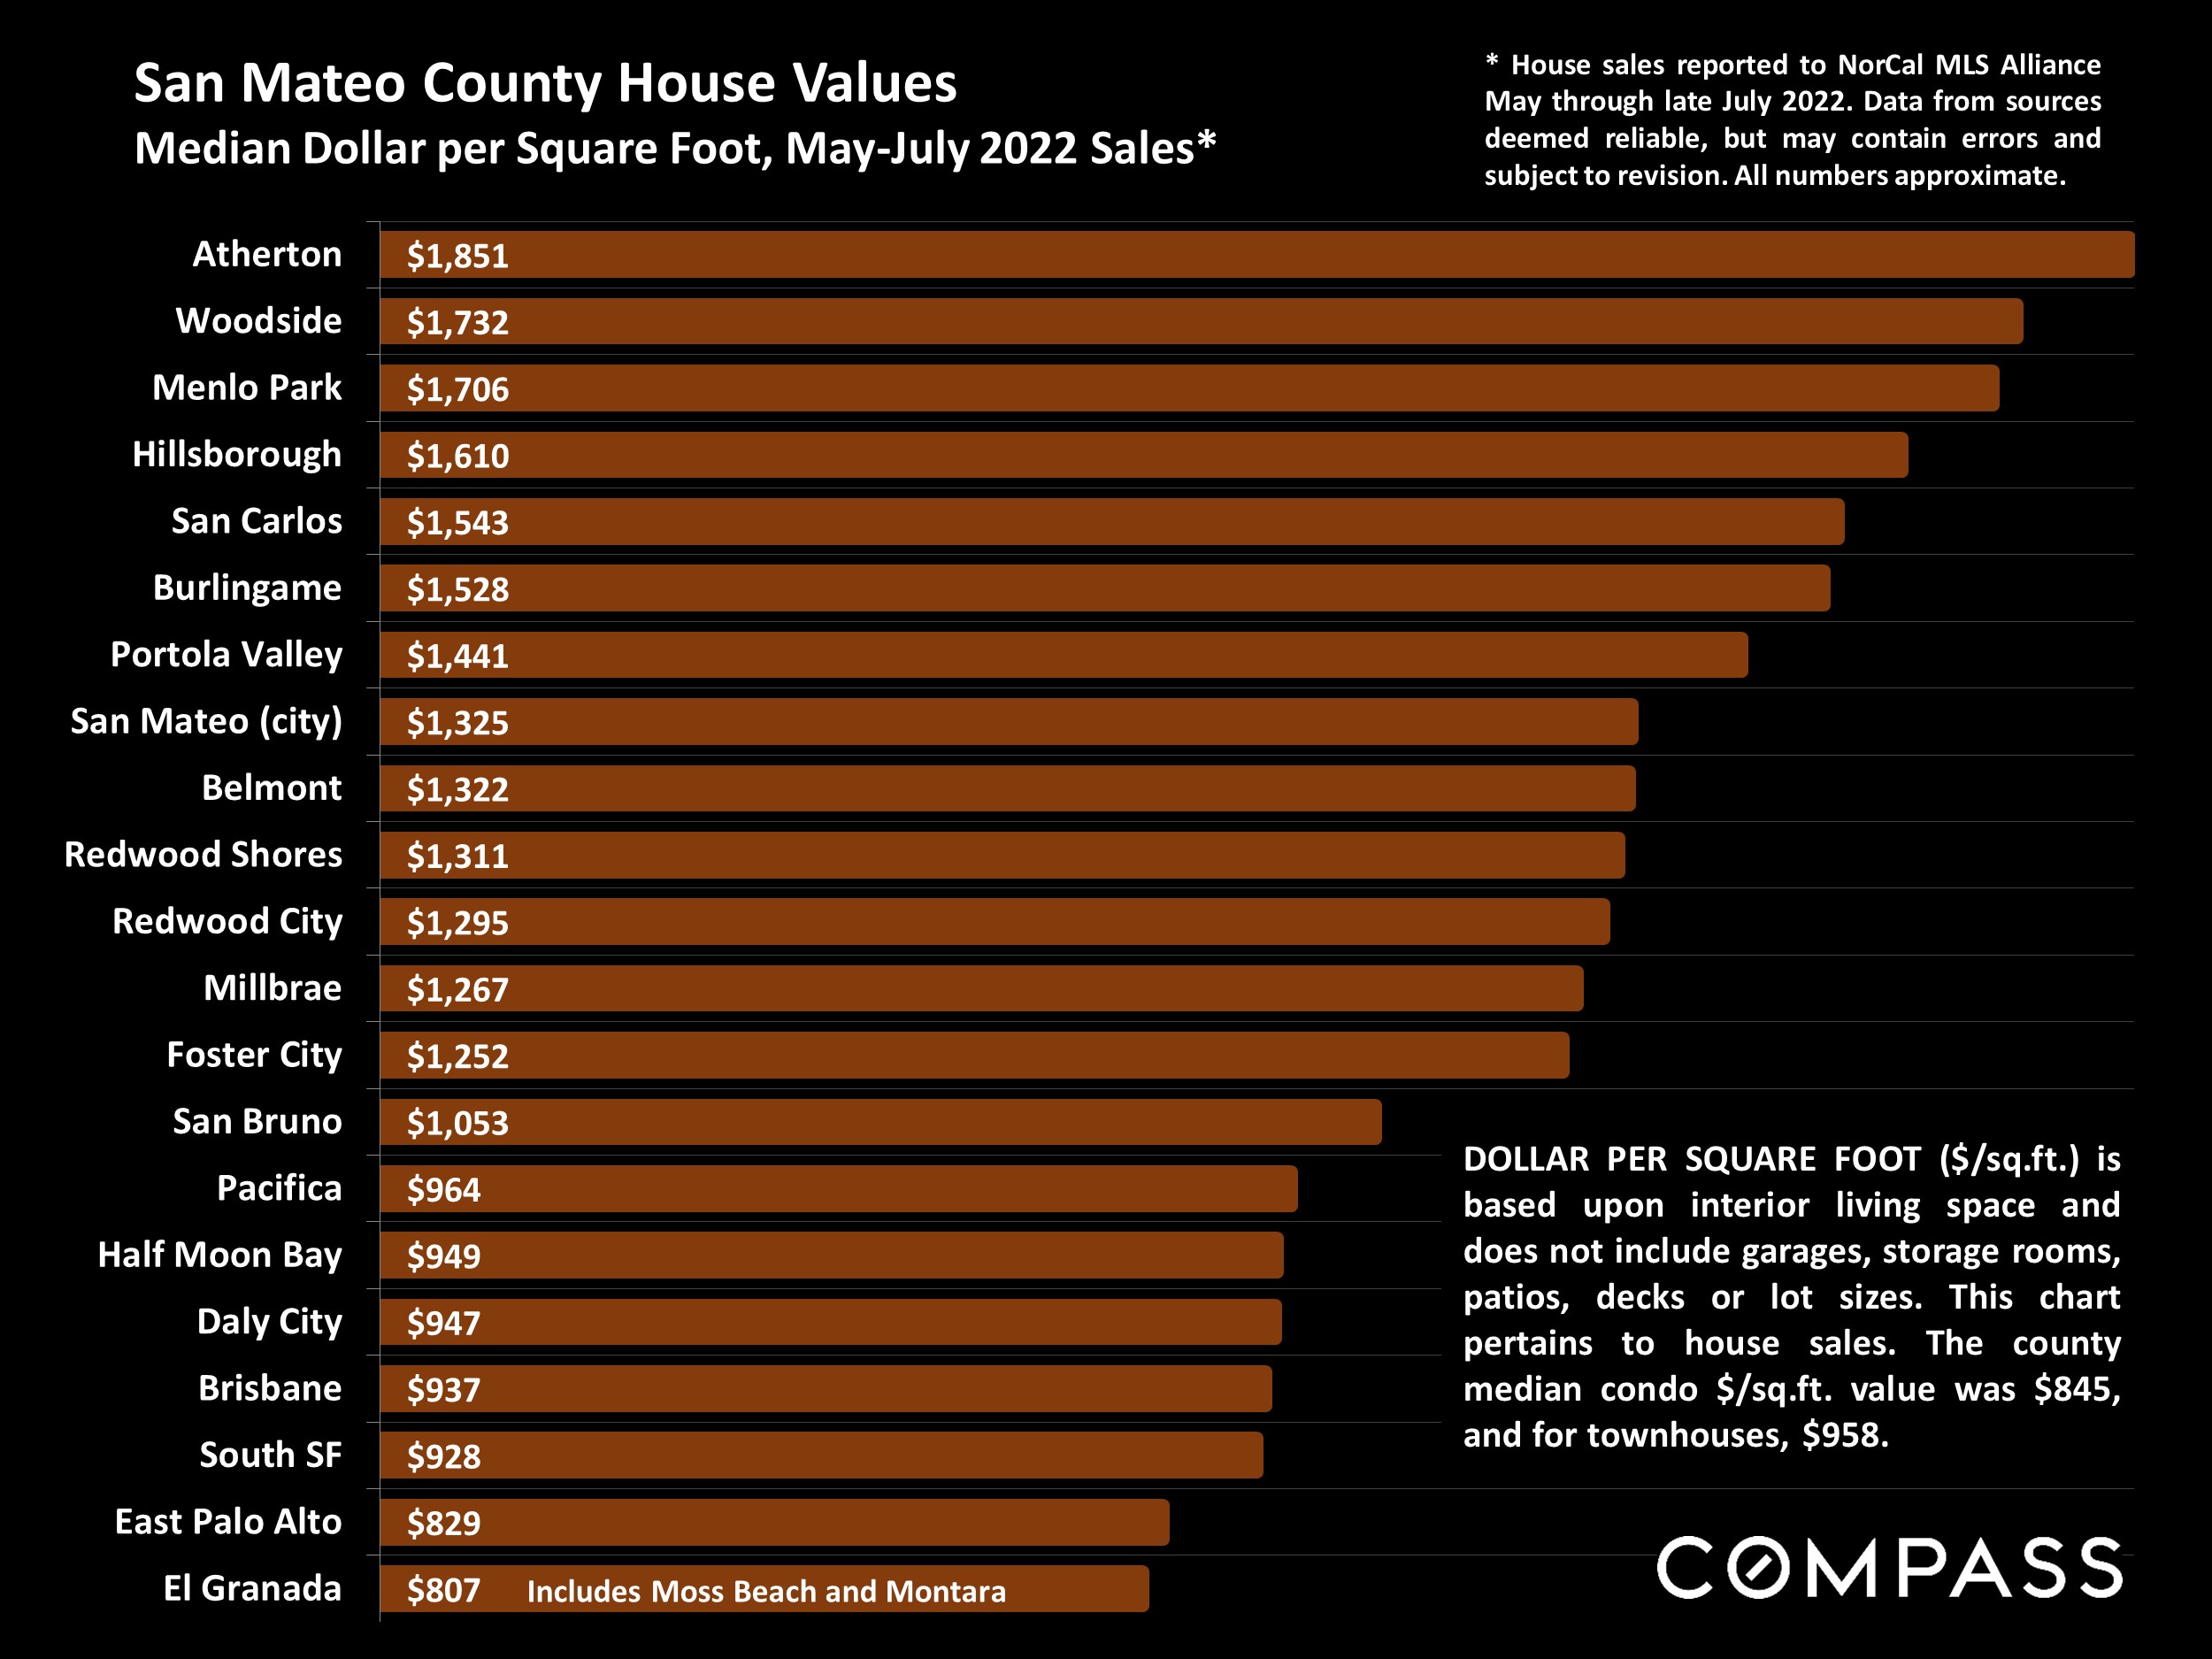
Dollar per Square Foot is based upon the home’s interior living space and does not include garages, unfinished attics and basements, rooms built without permit, patios, decks or yards (though all those can add value to a home). These figures are usually derived from appraisals or tax records, but are sometimes unreliable (especially for older homes) or unreported altogether. The calculation can only be made on those home sales that reported square footage.
Compass is a real estate broker licensed by the State of California, DRE 01527235. Equal Housing Opportunity. This report has been prepared solely for information purposes. The information herein is based on or derived from information generally available to the public and/or from sources believed to be reliable. No representation or warranty can be given with respect to the accuracy or completeness of the information. Compass disclaims any and all liability relating to this report, including without limitation any express or implied representations or warranties for statements contained in, and omissions from, the report. Nothing contained herein is intended to be or should be read as any regulatory, legal, tax, accounting or other advice and Compass does not provide such advice. All opinions are subject to change without notice. Compass makes no representation regarding the accuracy of any statements regarding any references to the laws, statutes or regulations of any state are those of the author(s). Past performance is no guarantee of future results.