

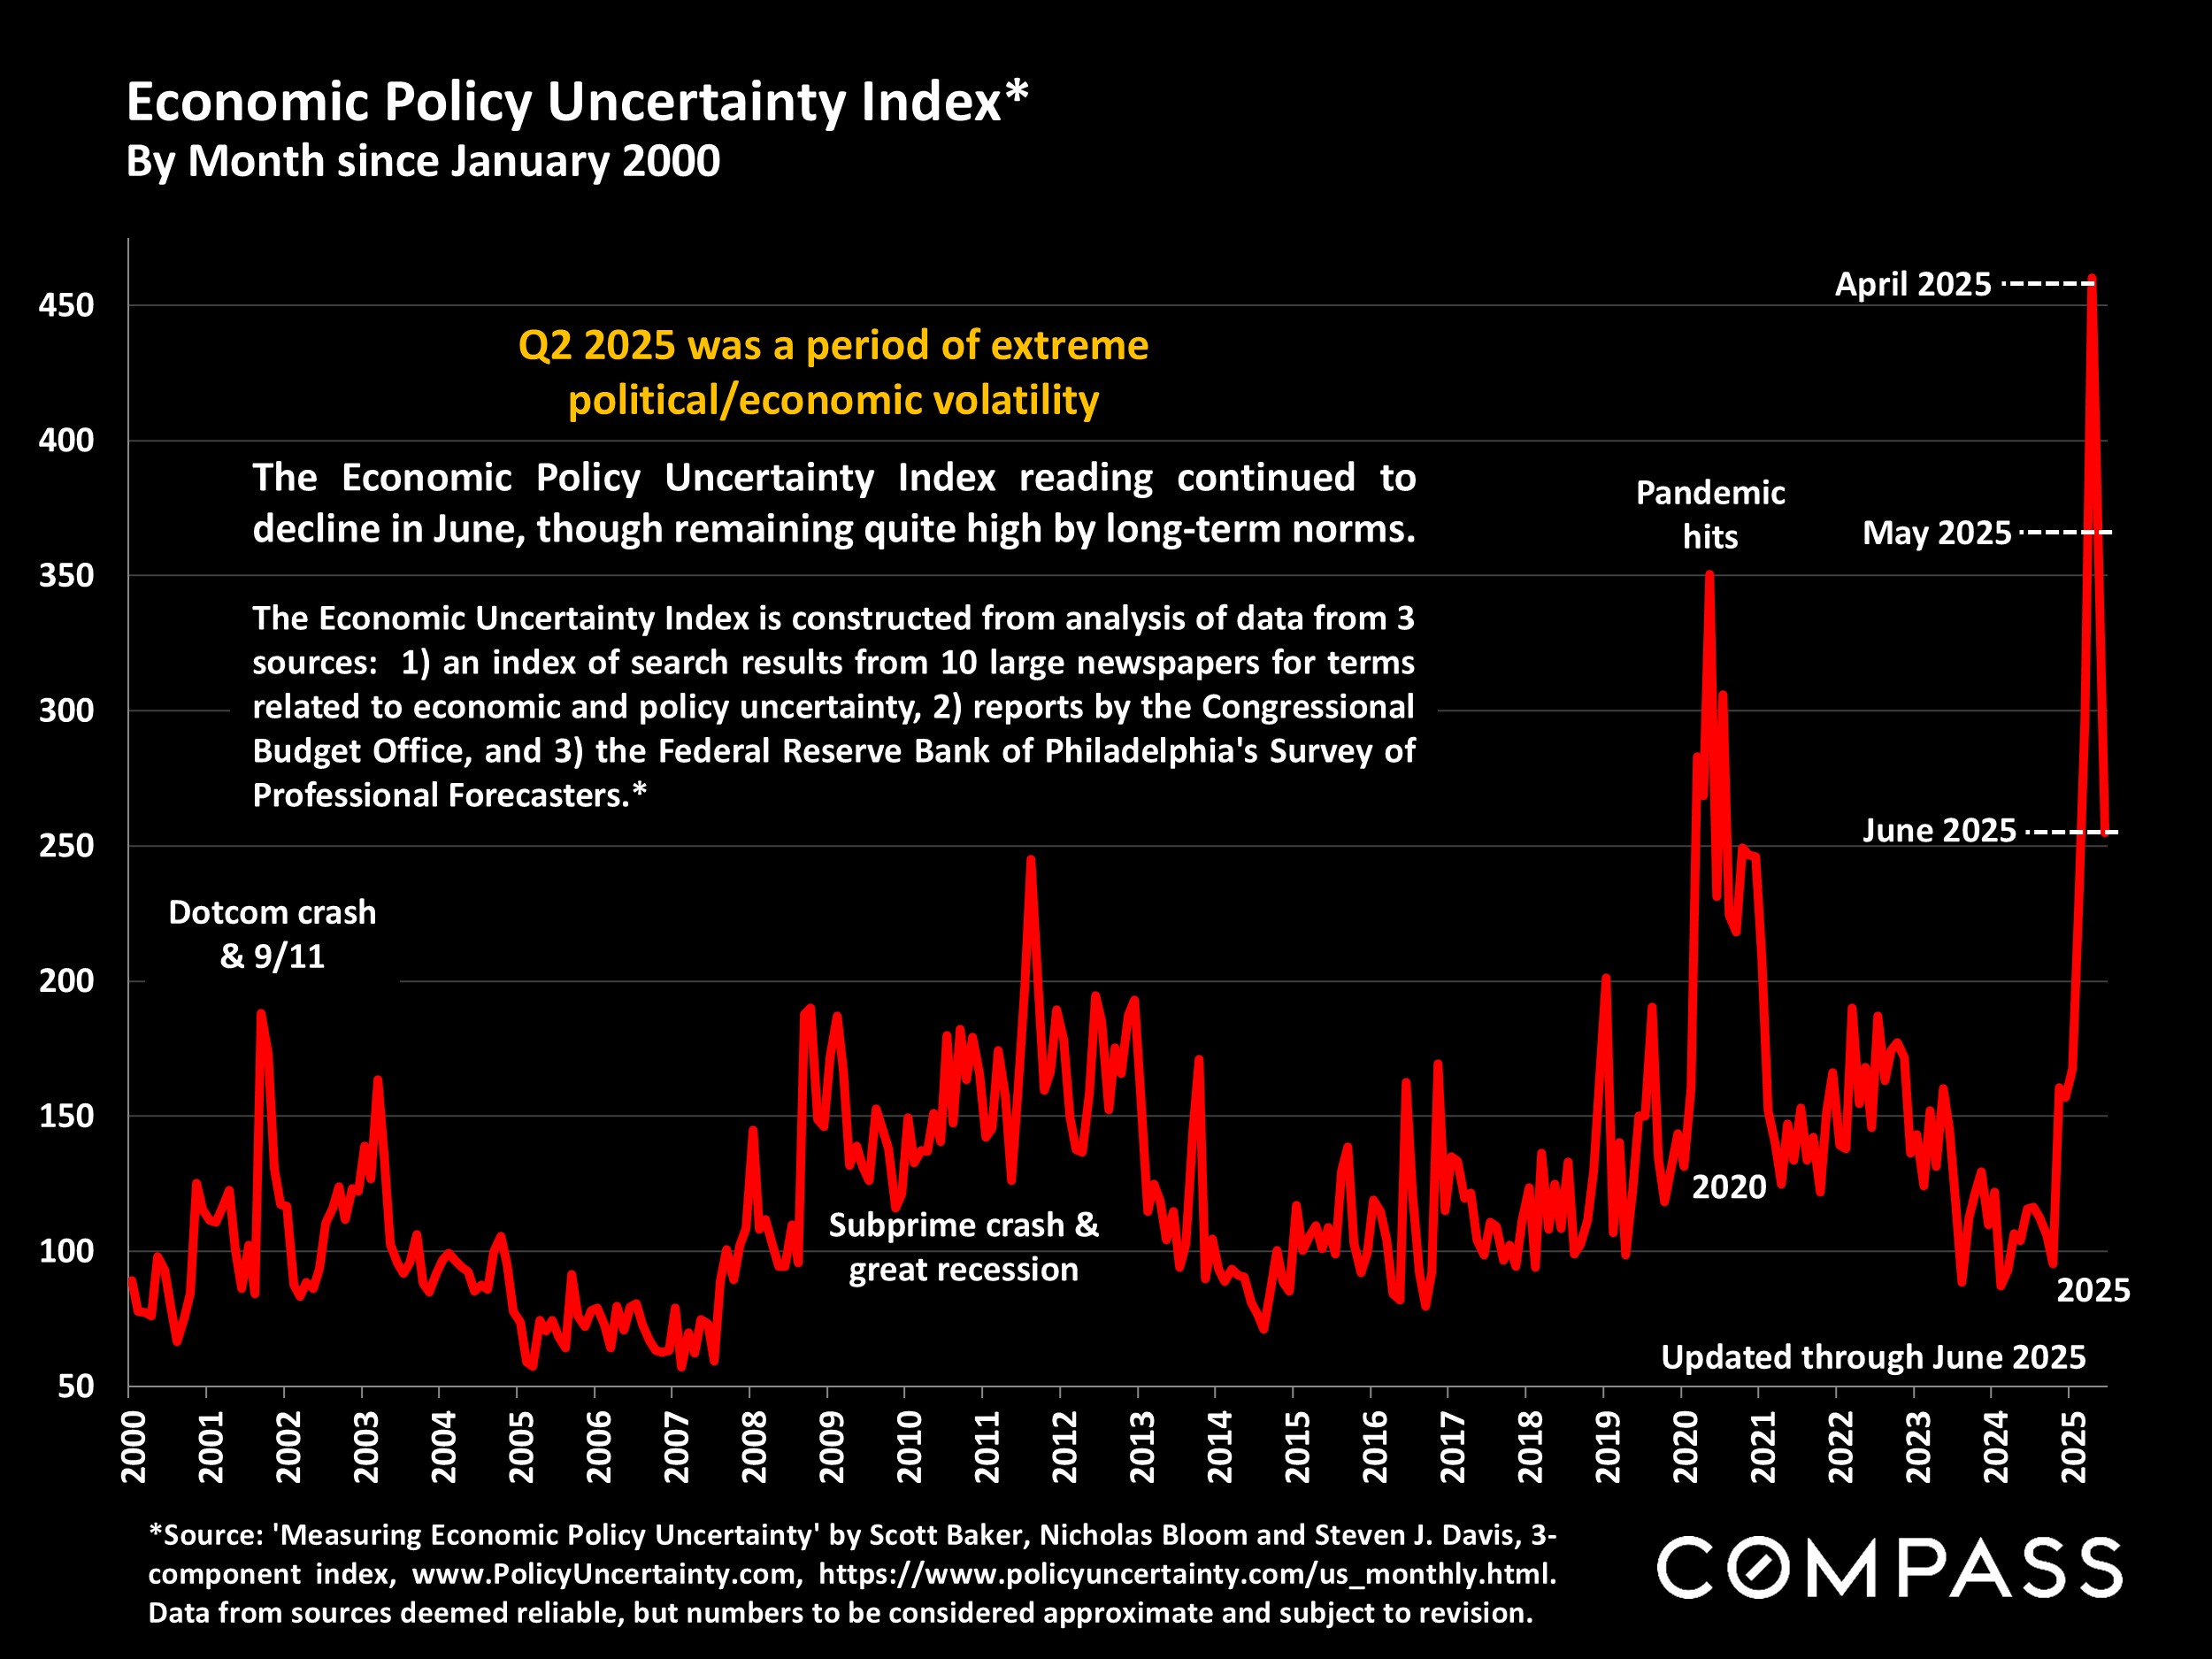
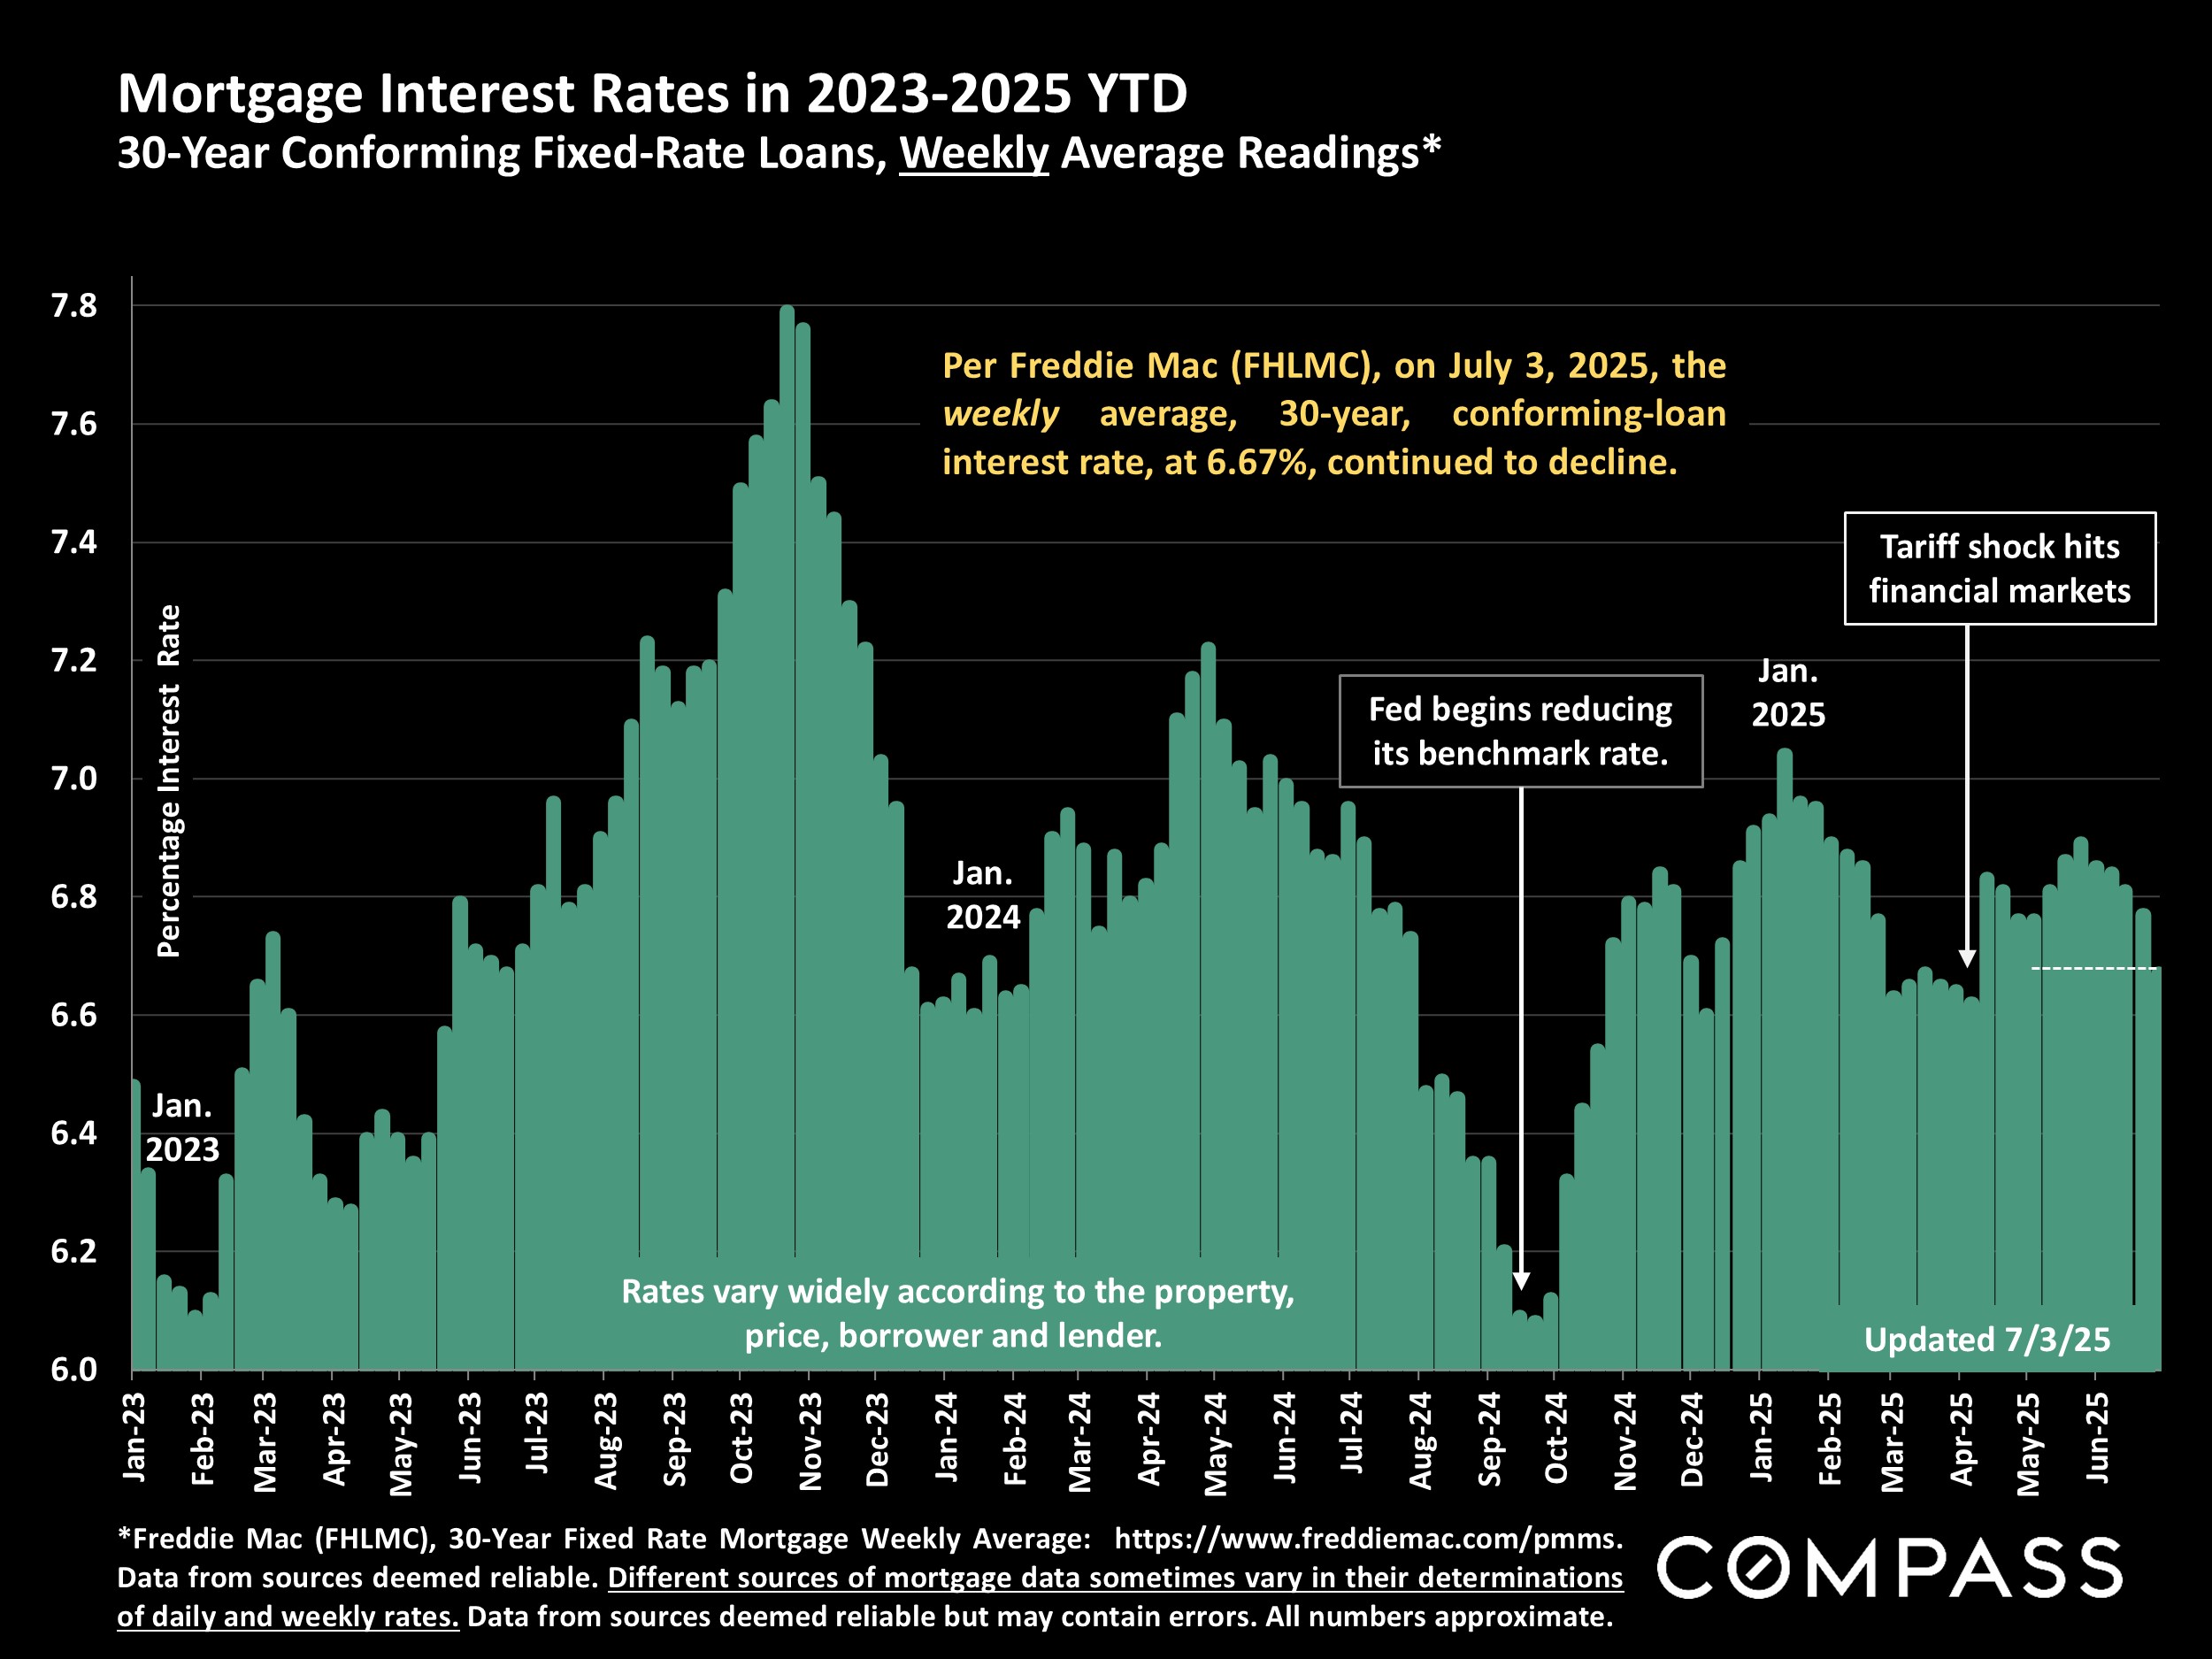
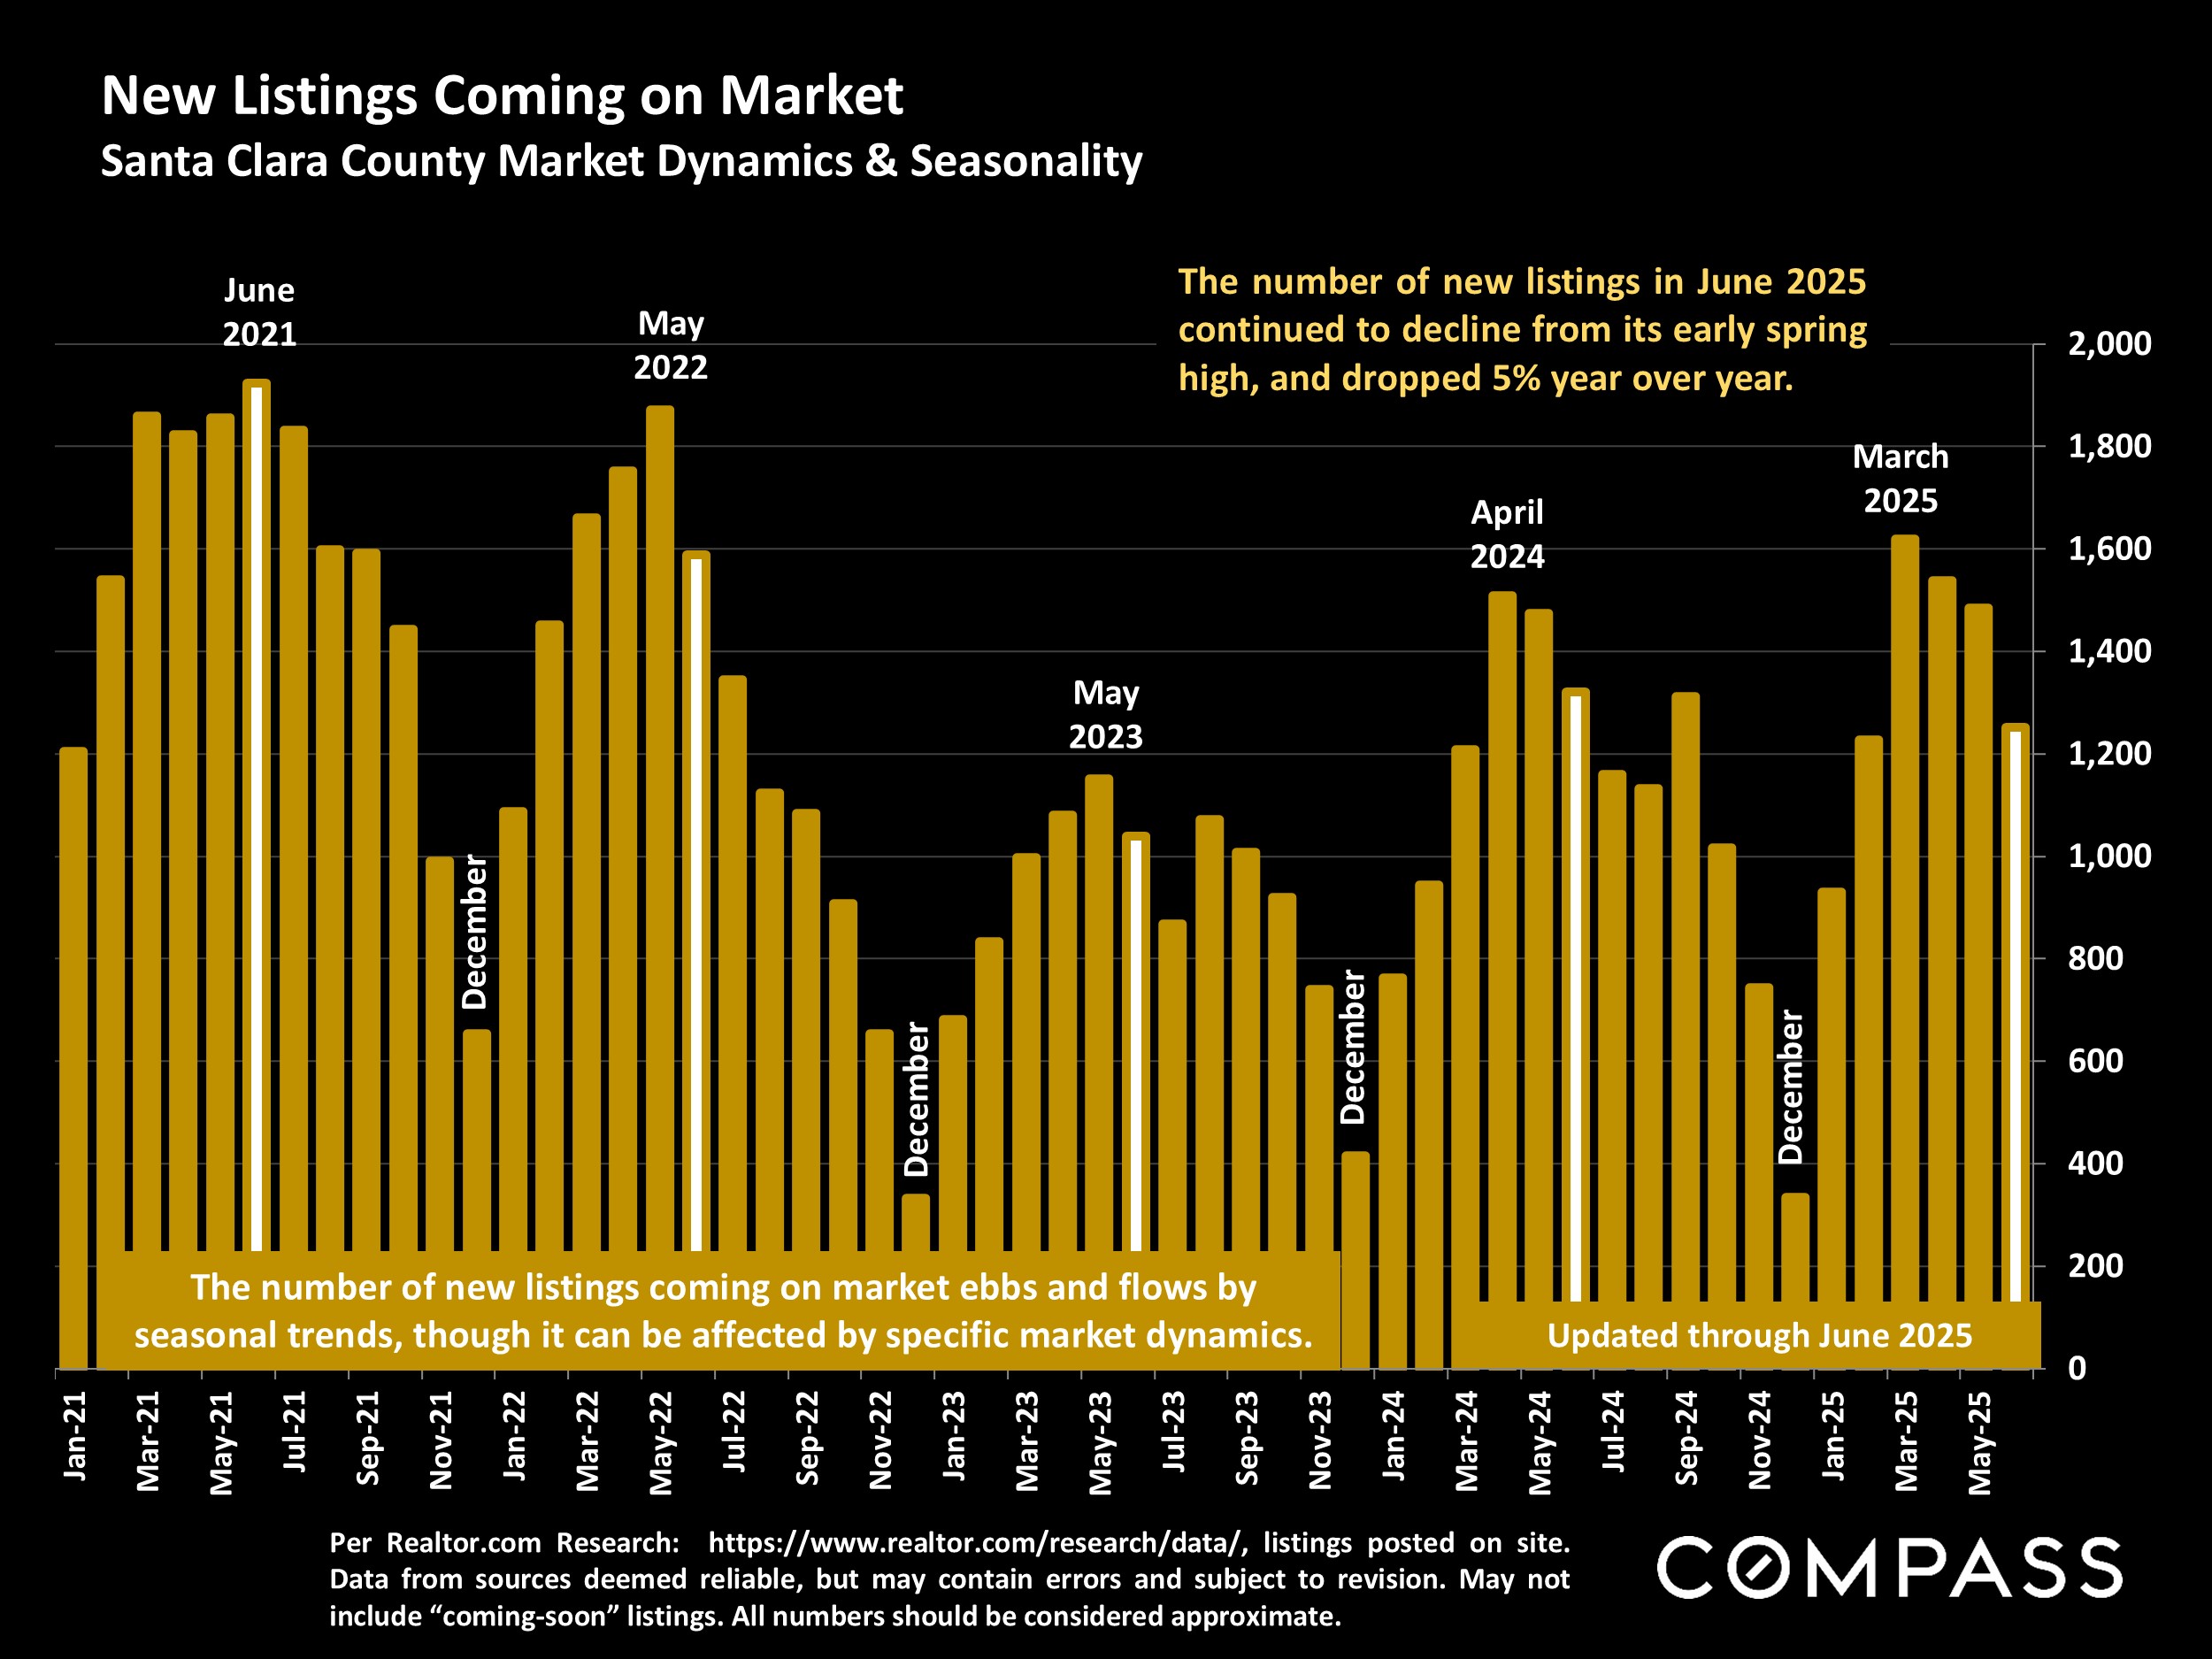
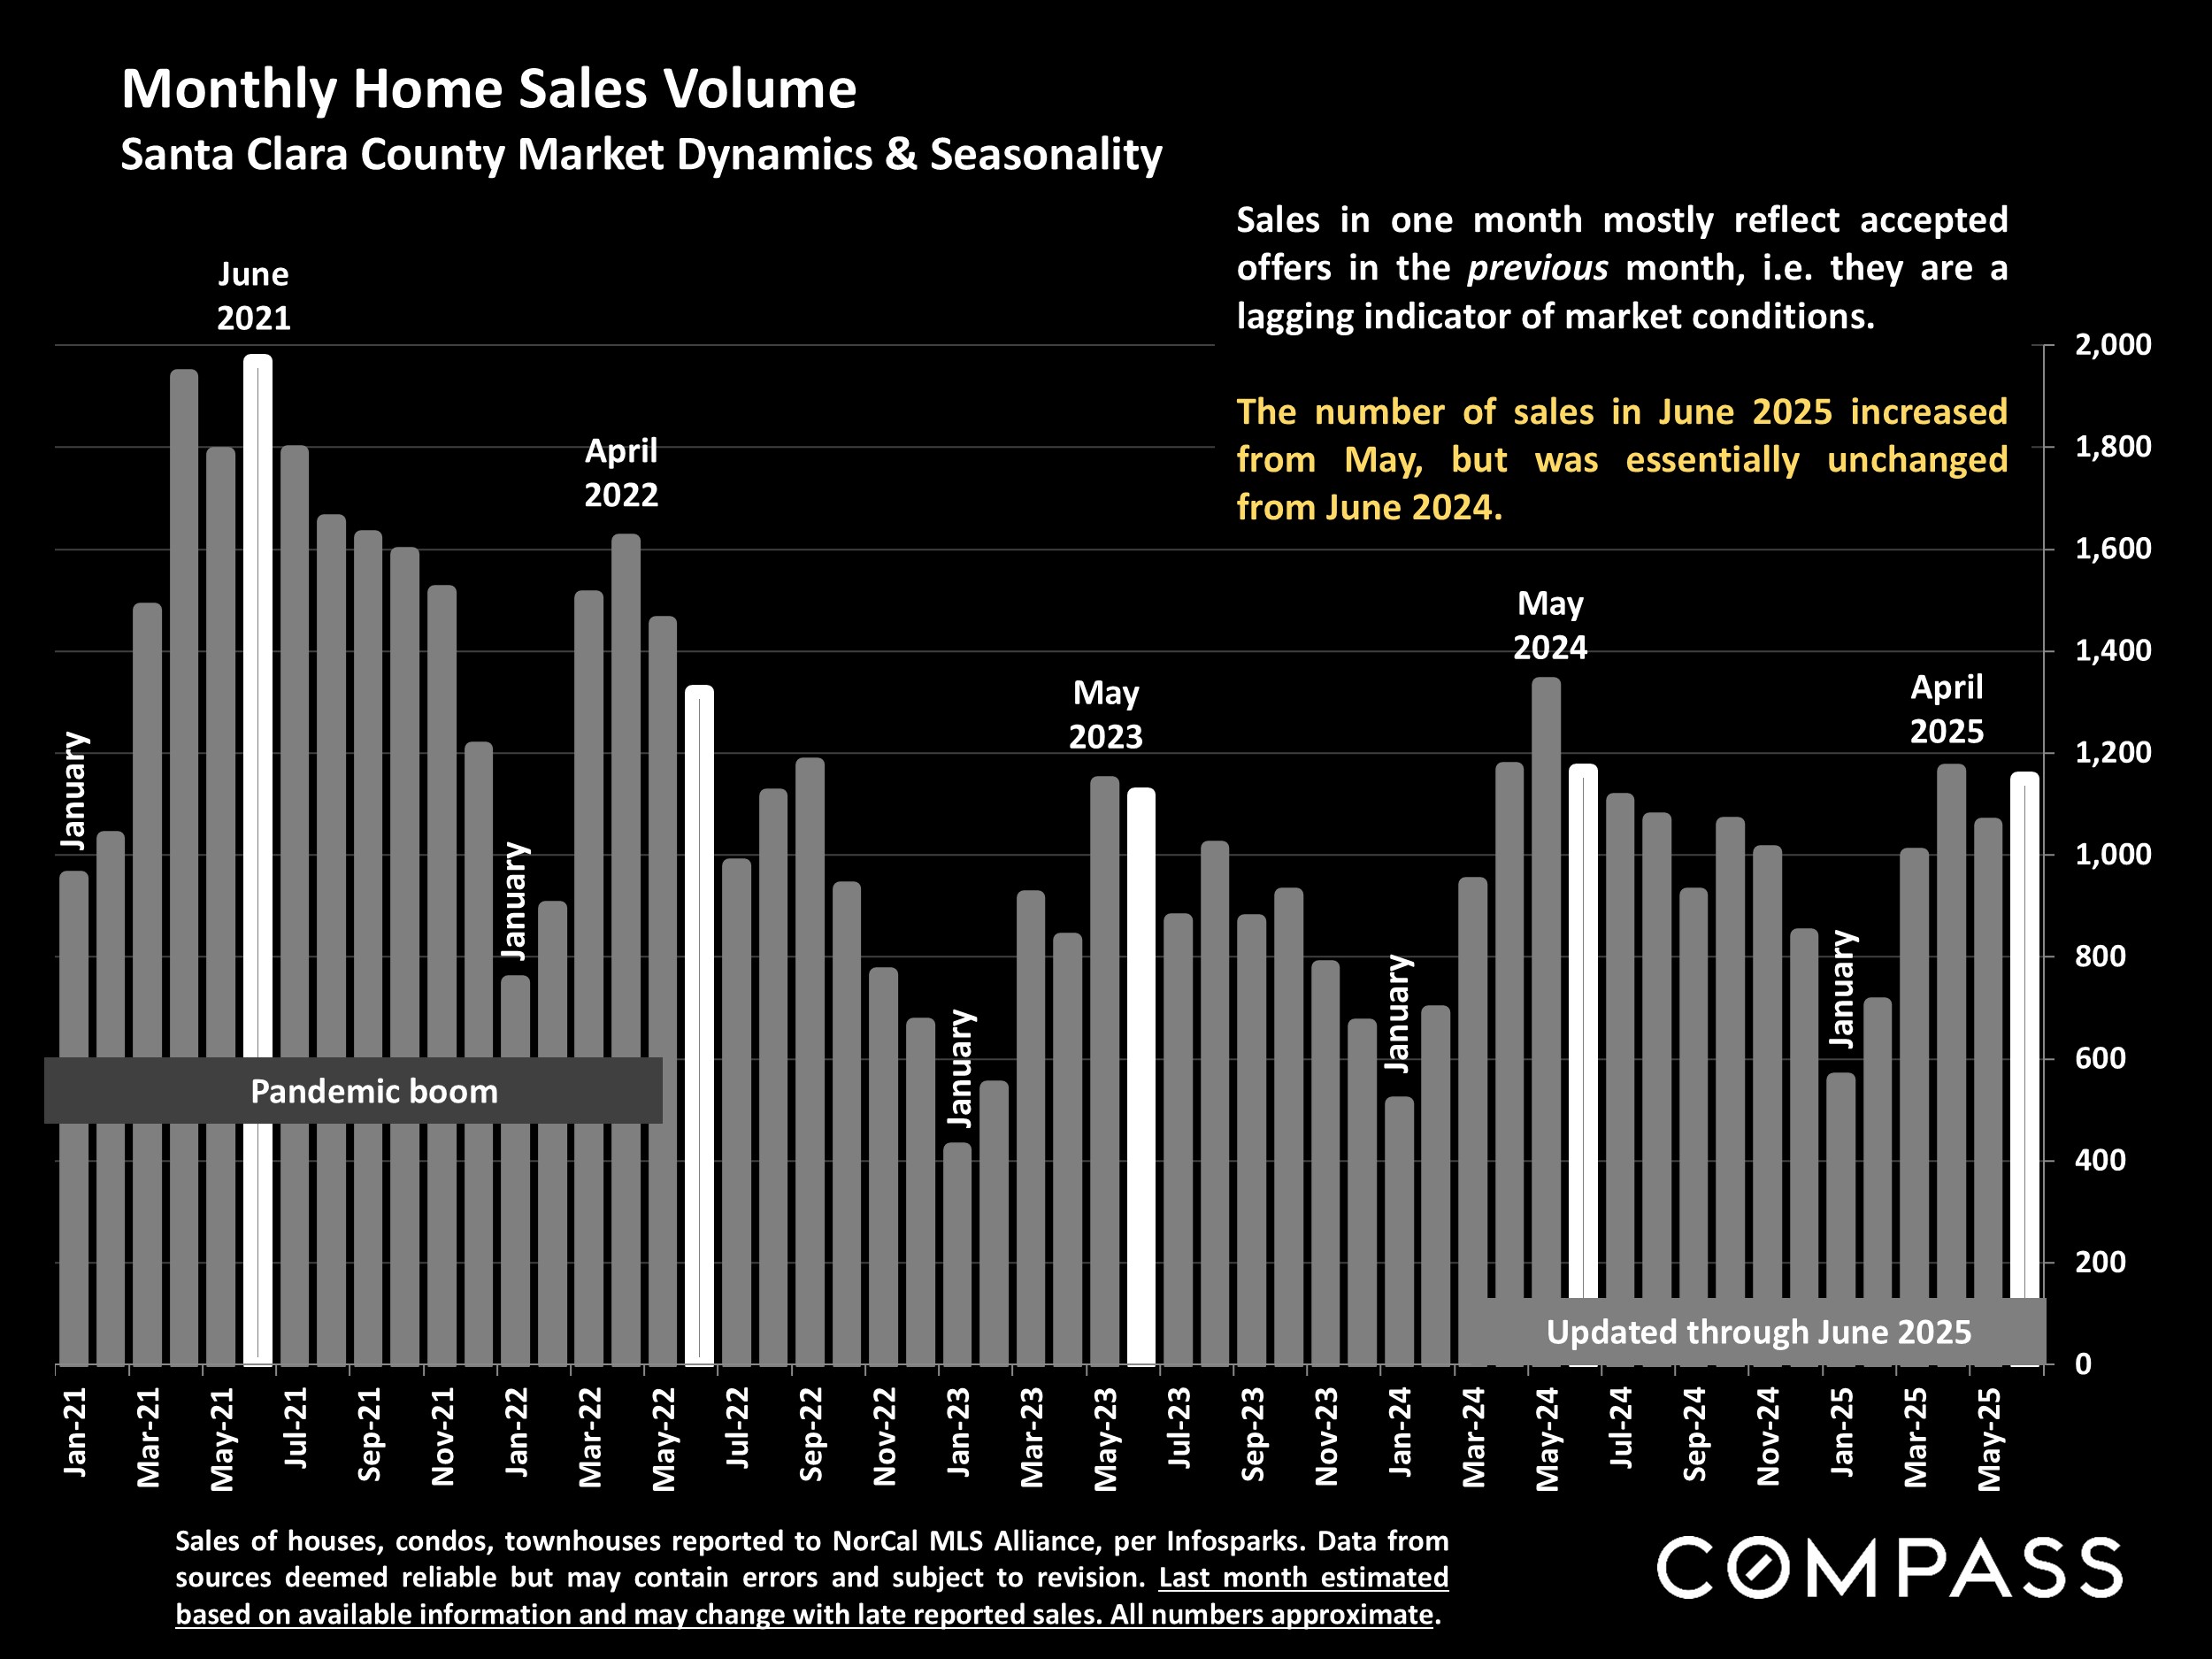
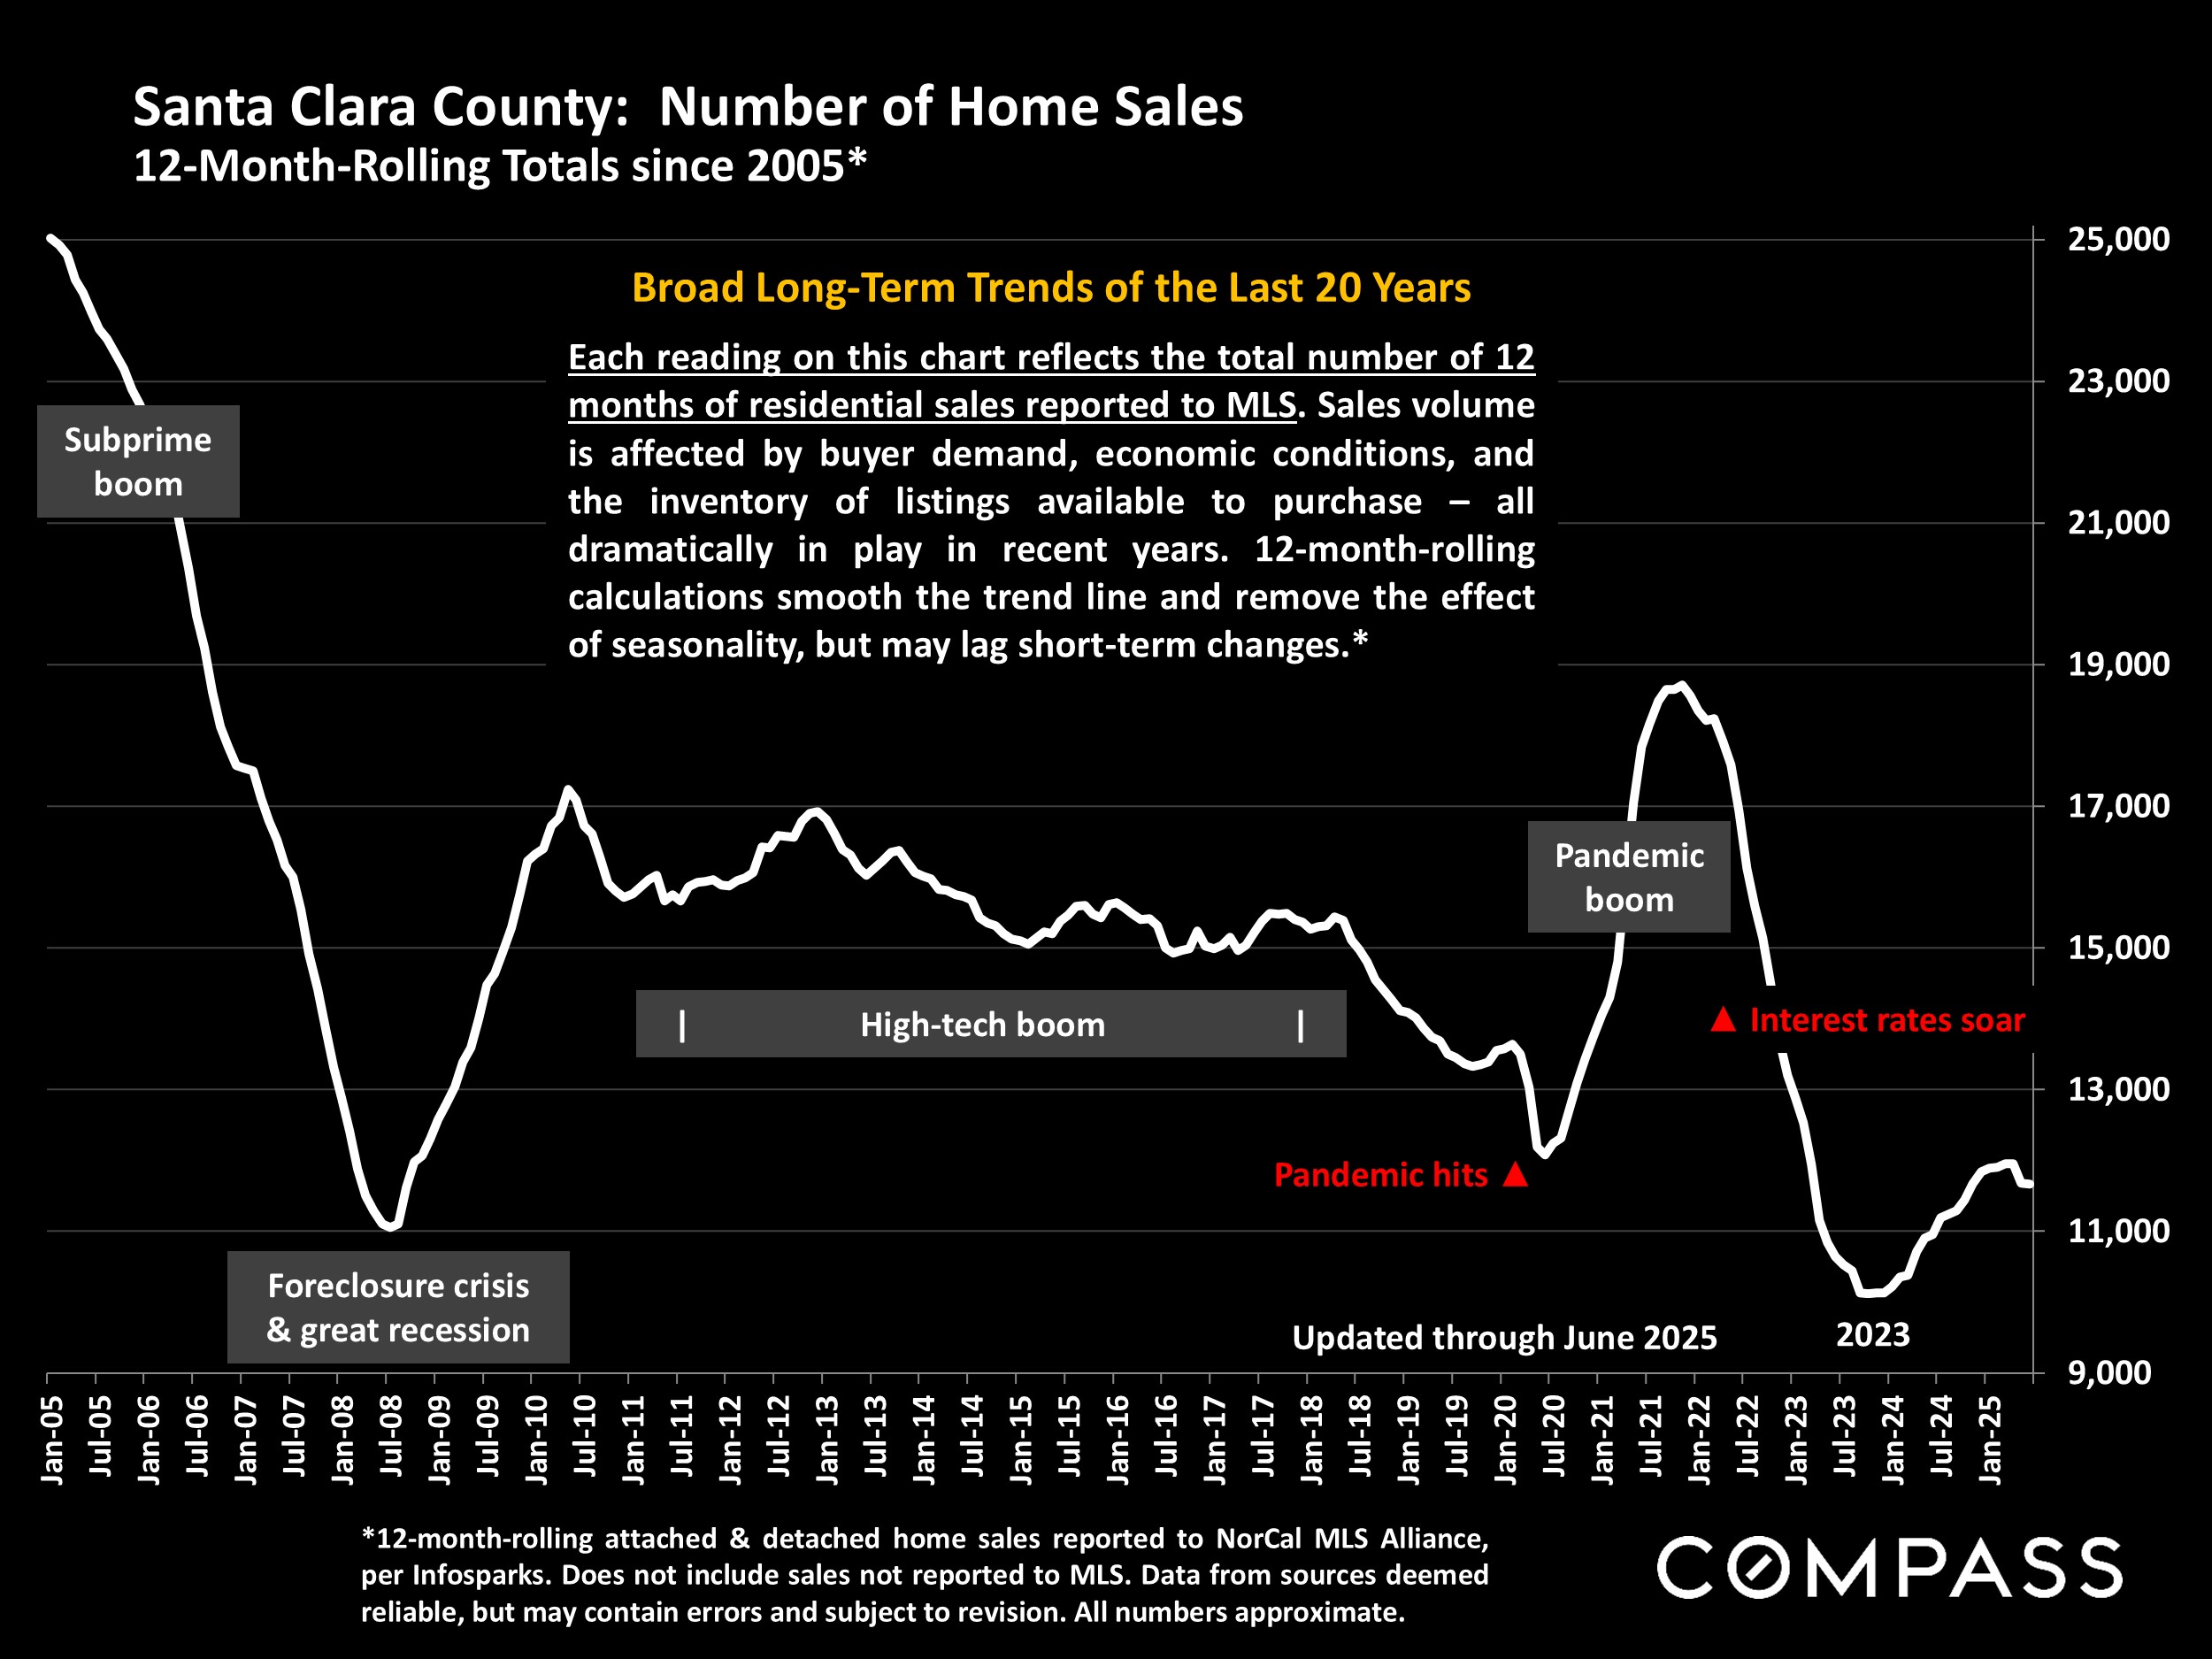
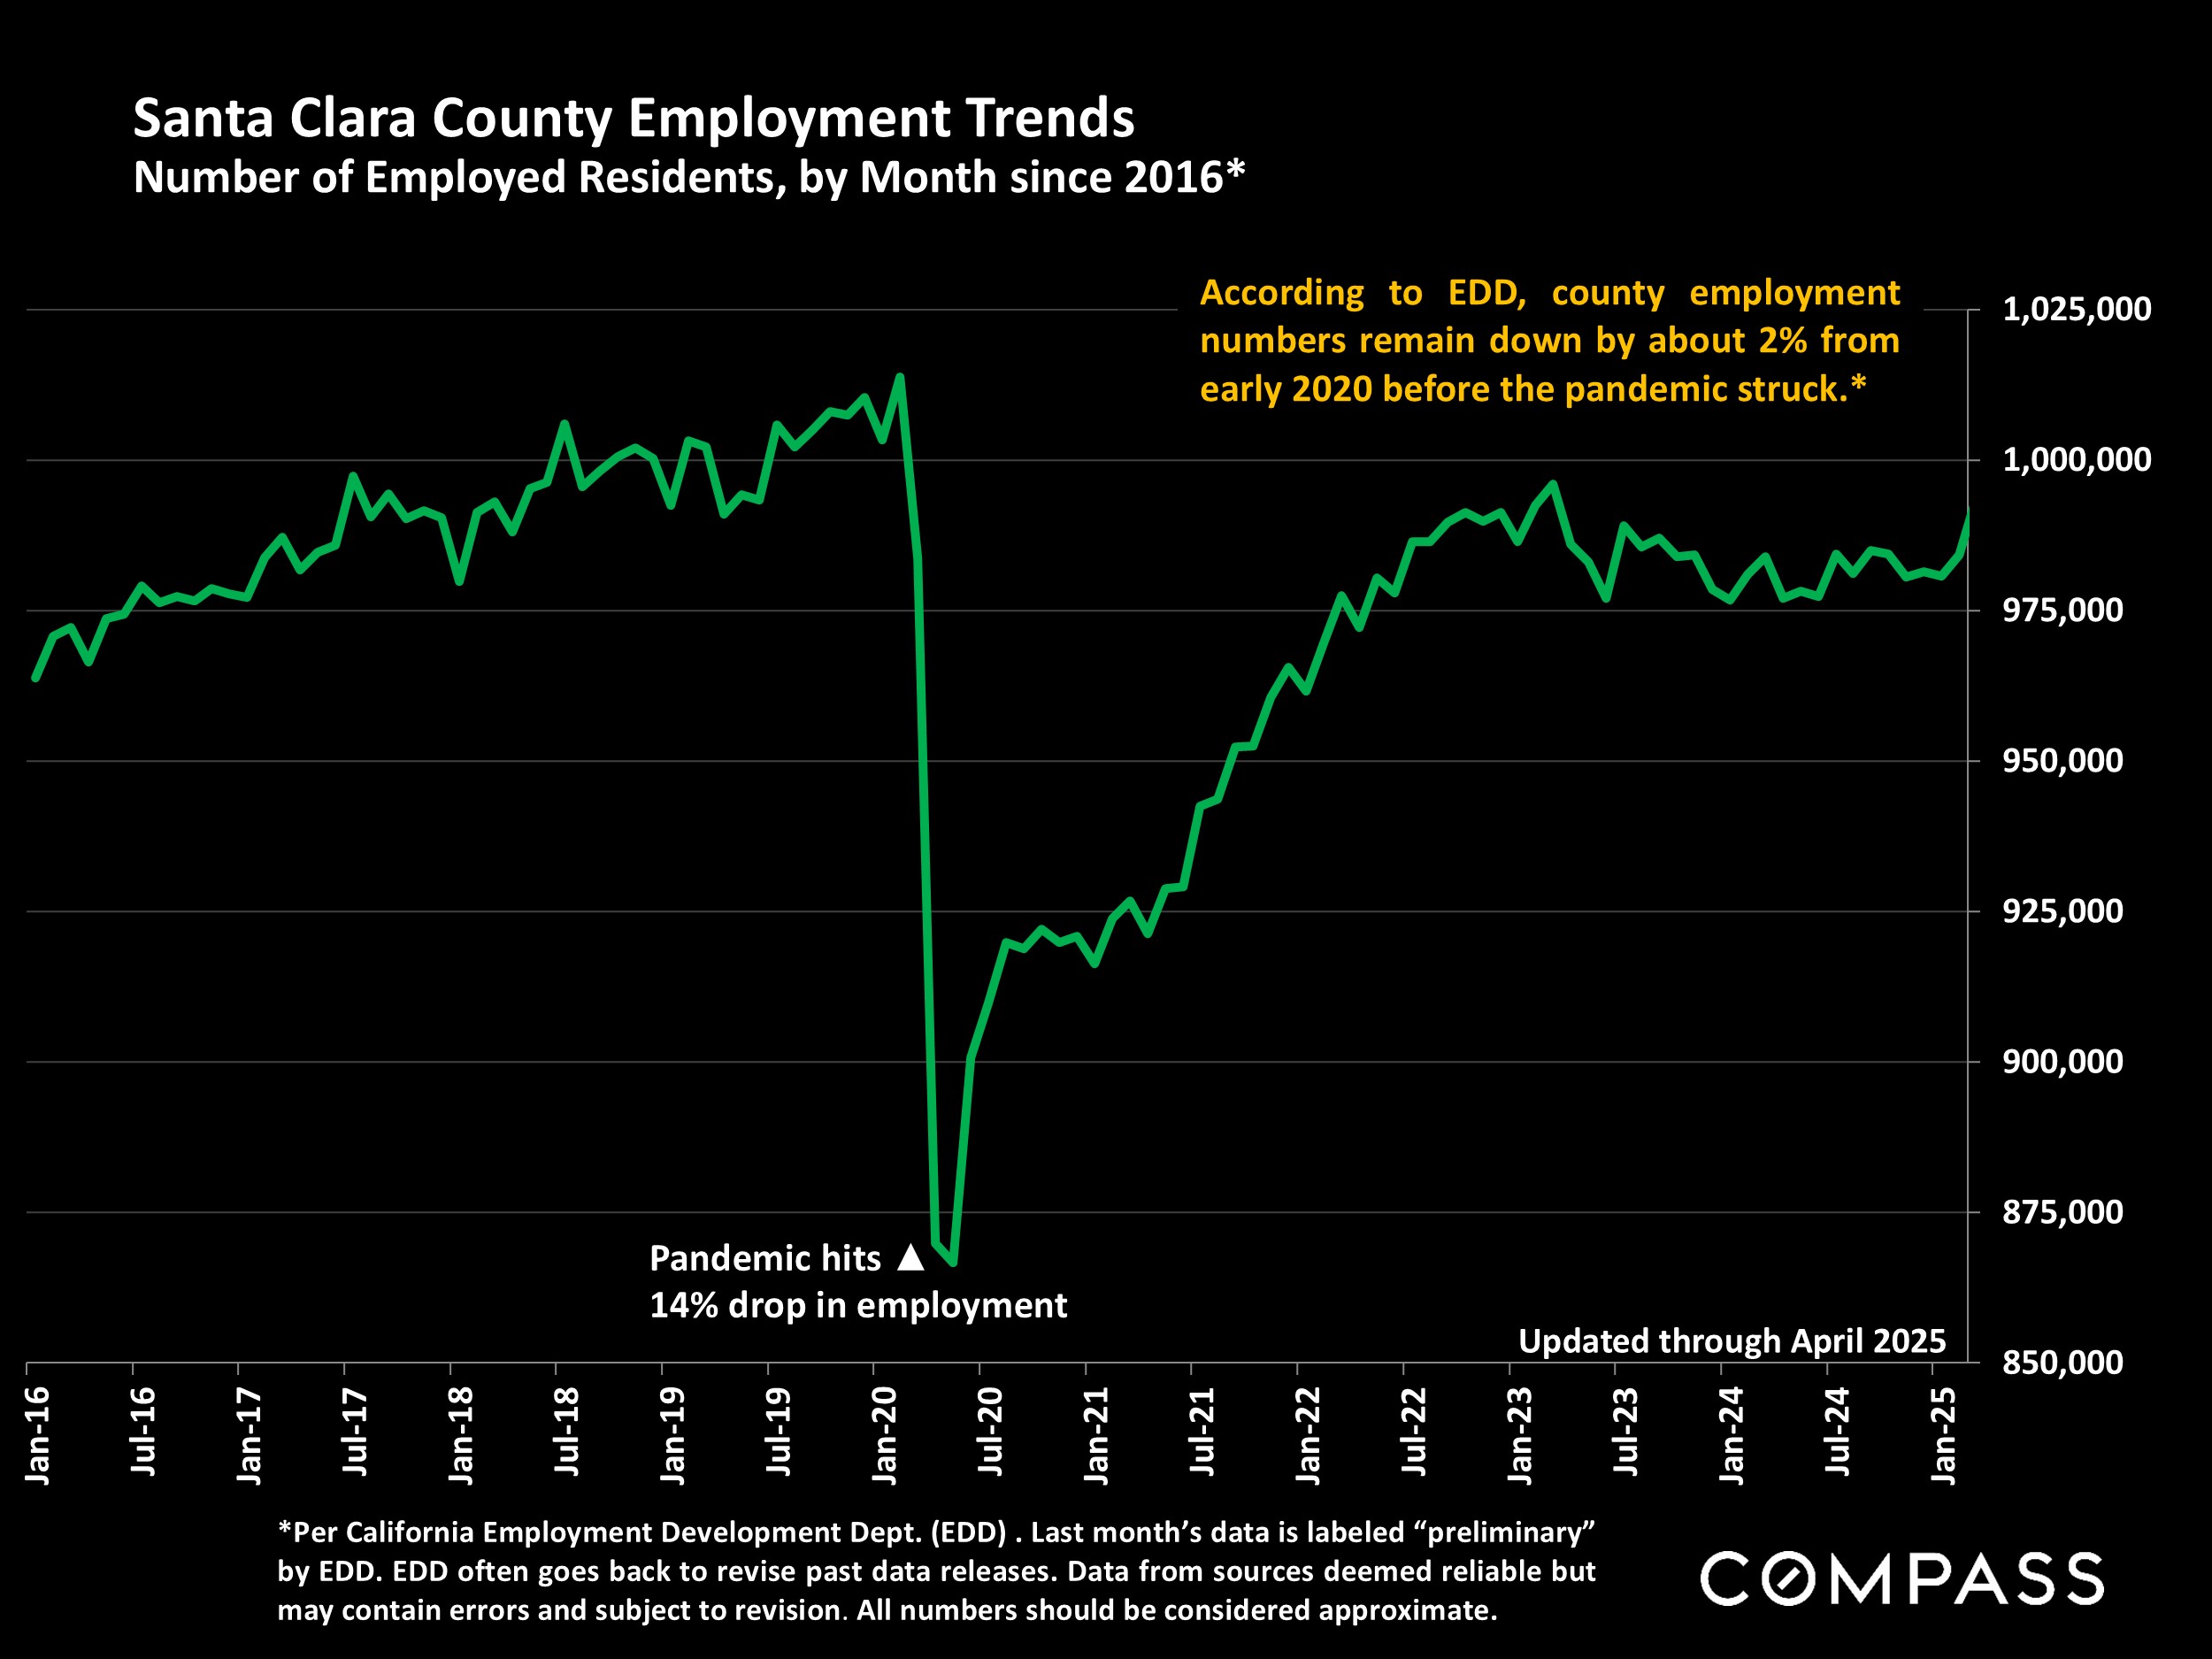
Across most of the Bay Area, the severe economic volatility which prevailed in Q2 – and the absence of a meaningful decline in mortgage interest rates – generally caused a significant year-over-year weakening in the spring selling season, usually the most dynamic of the year.
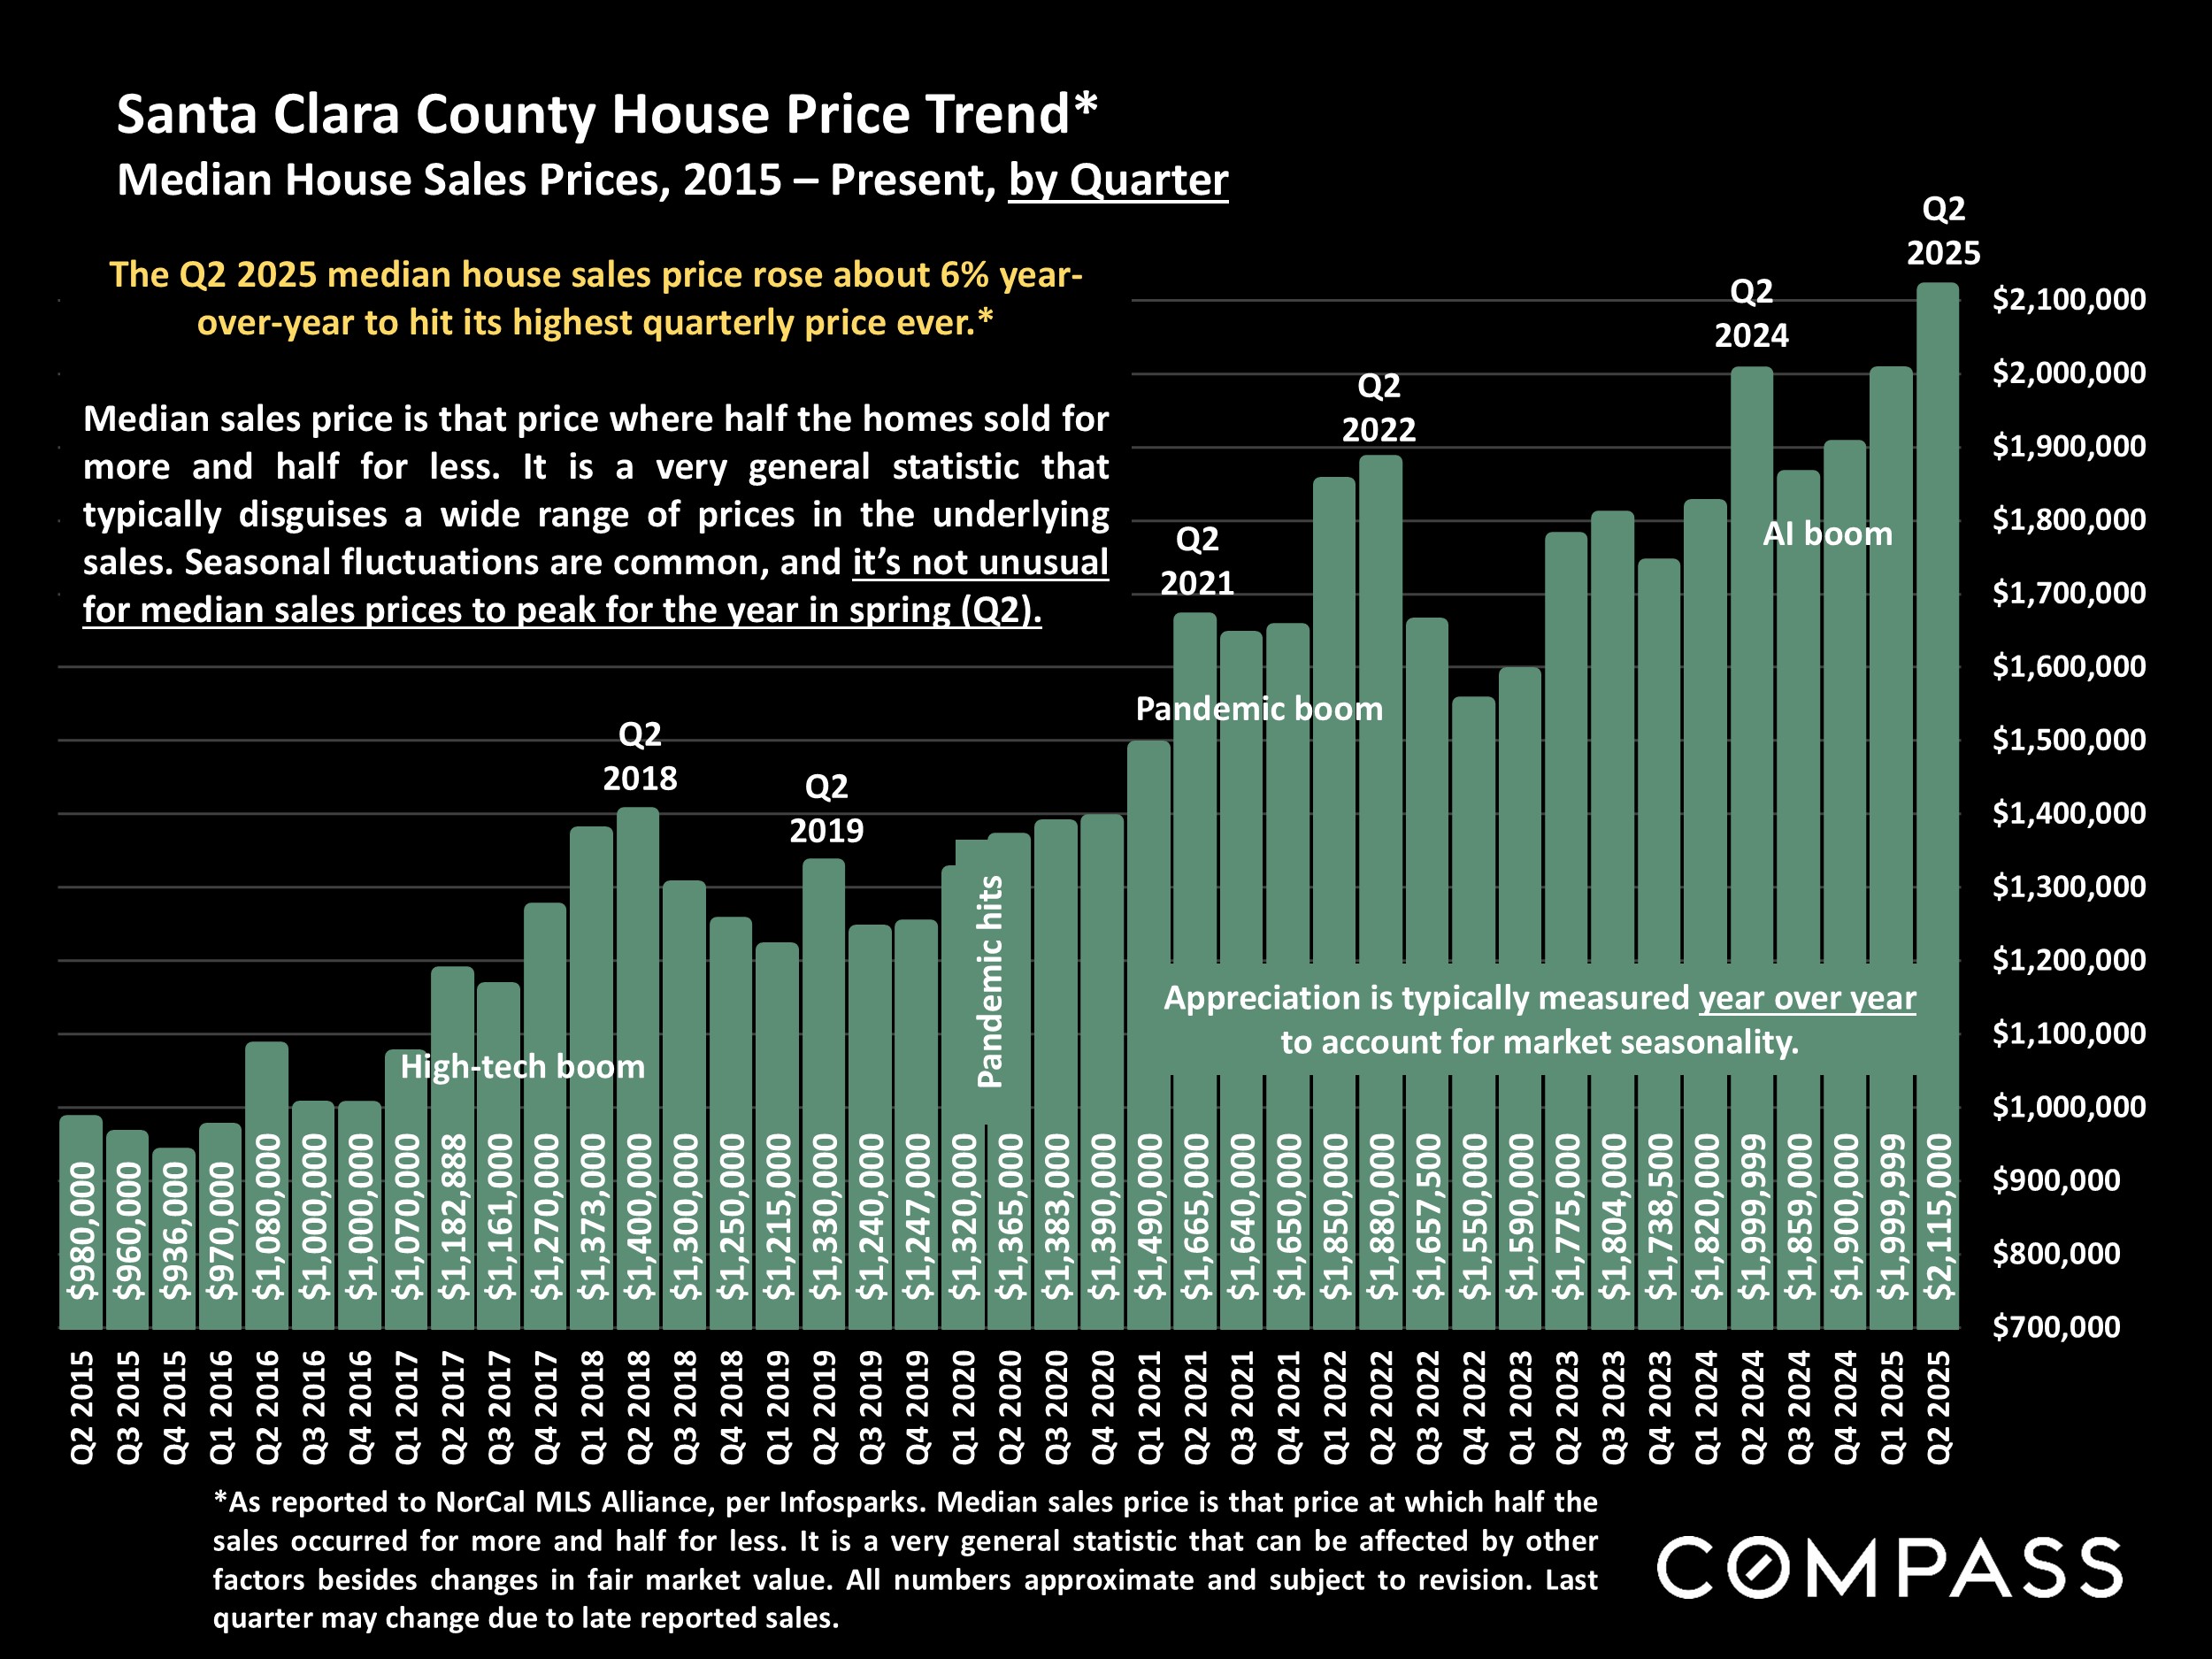
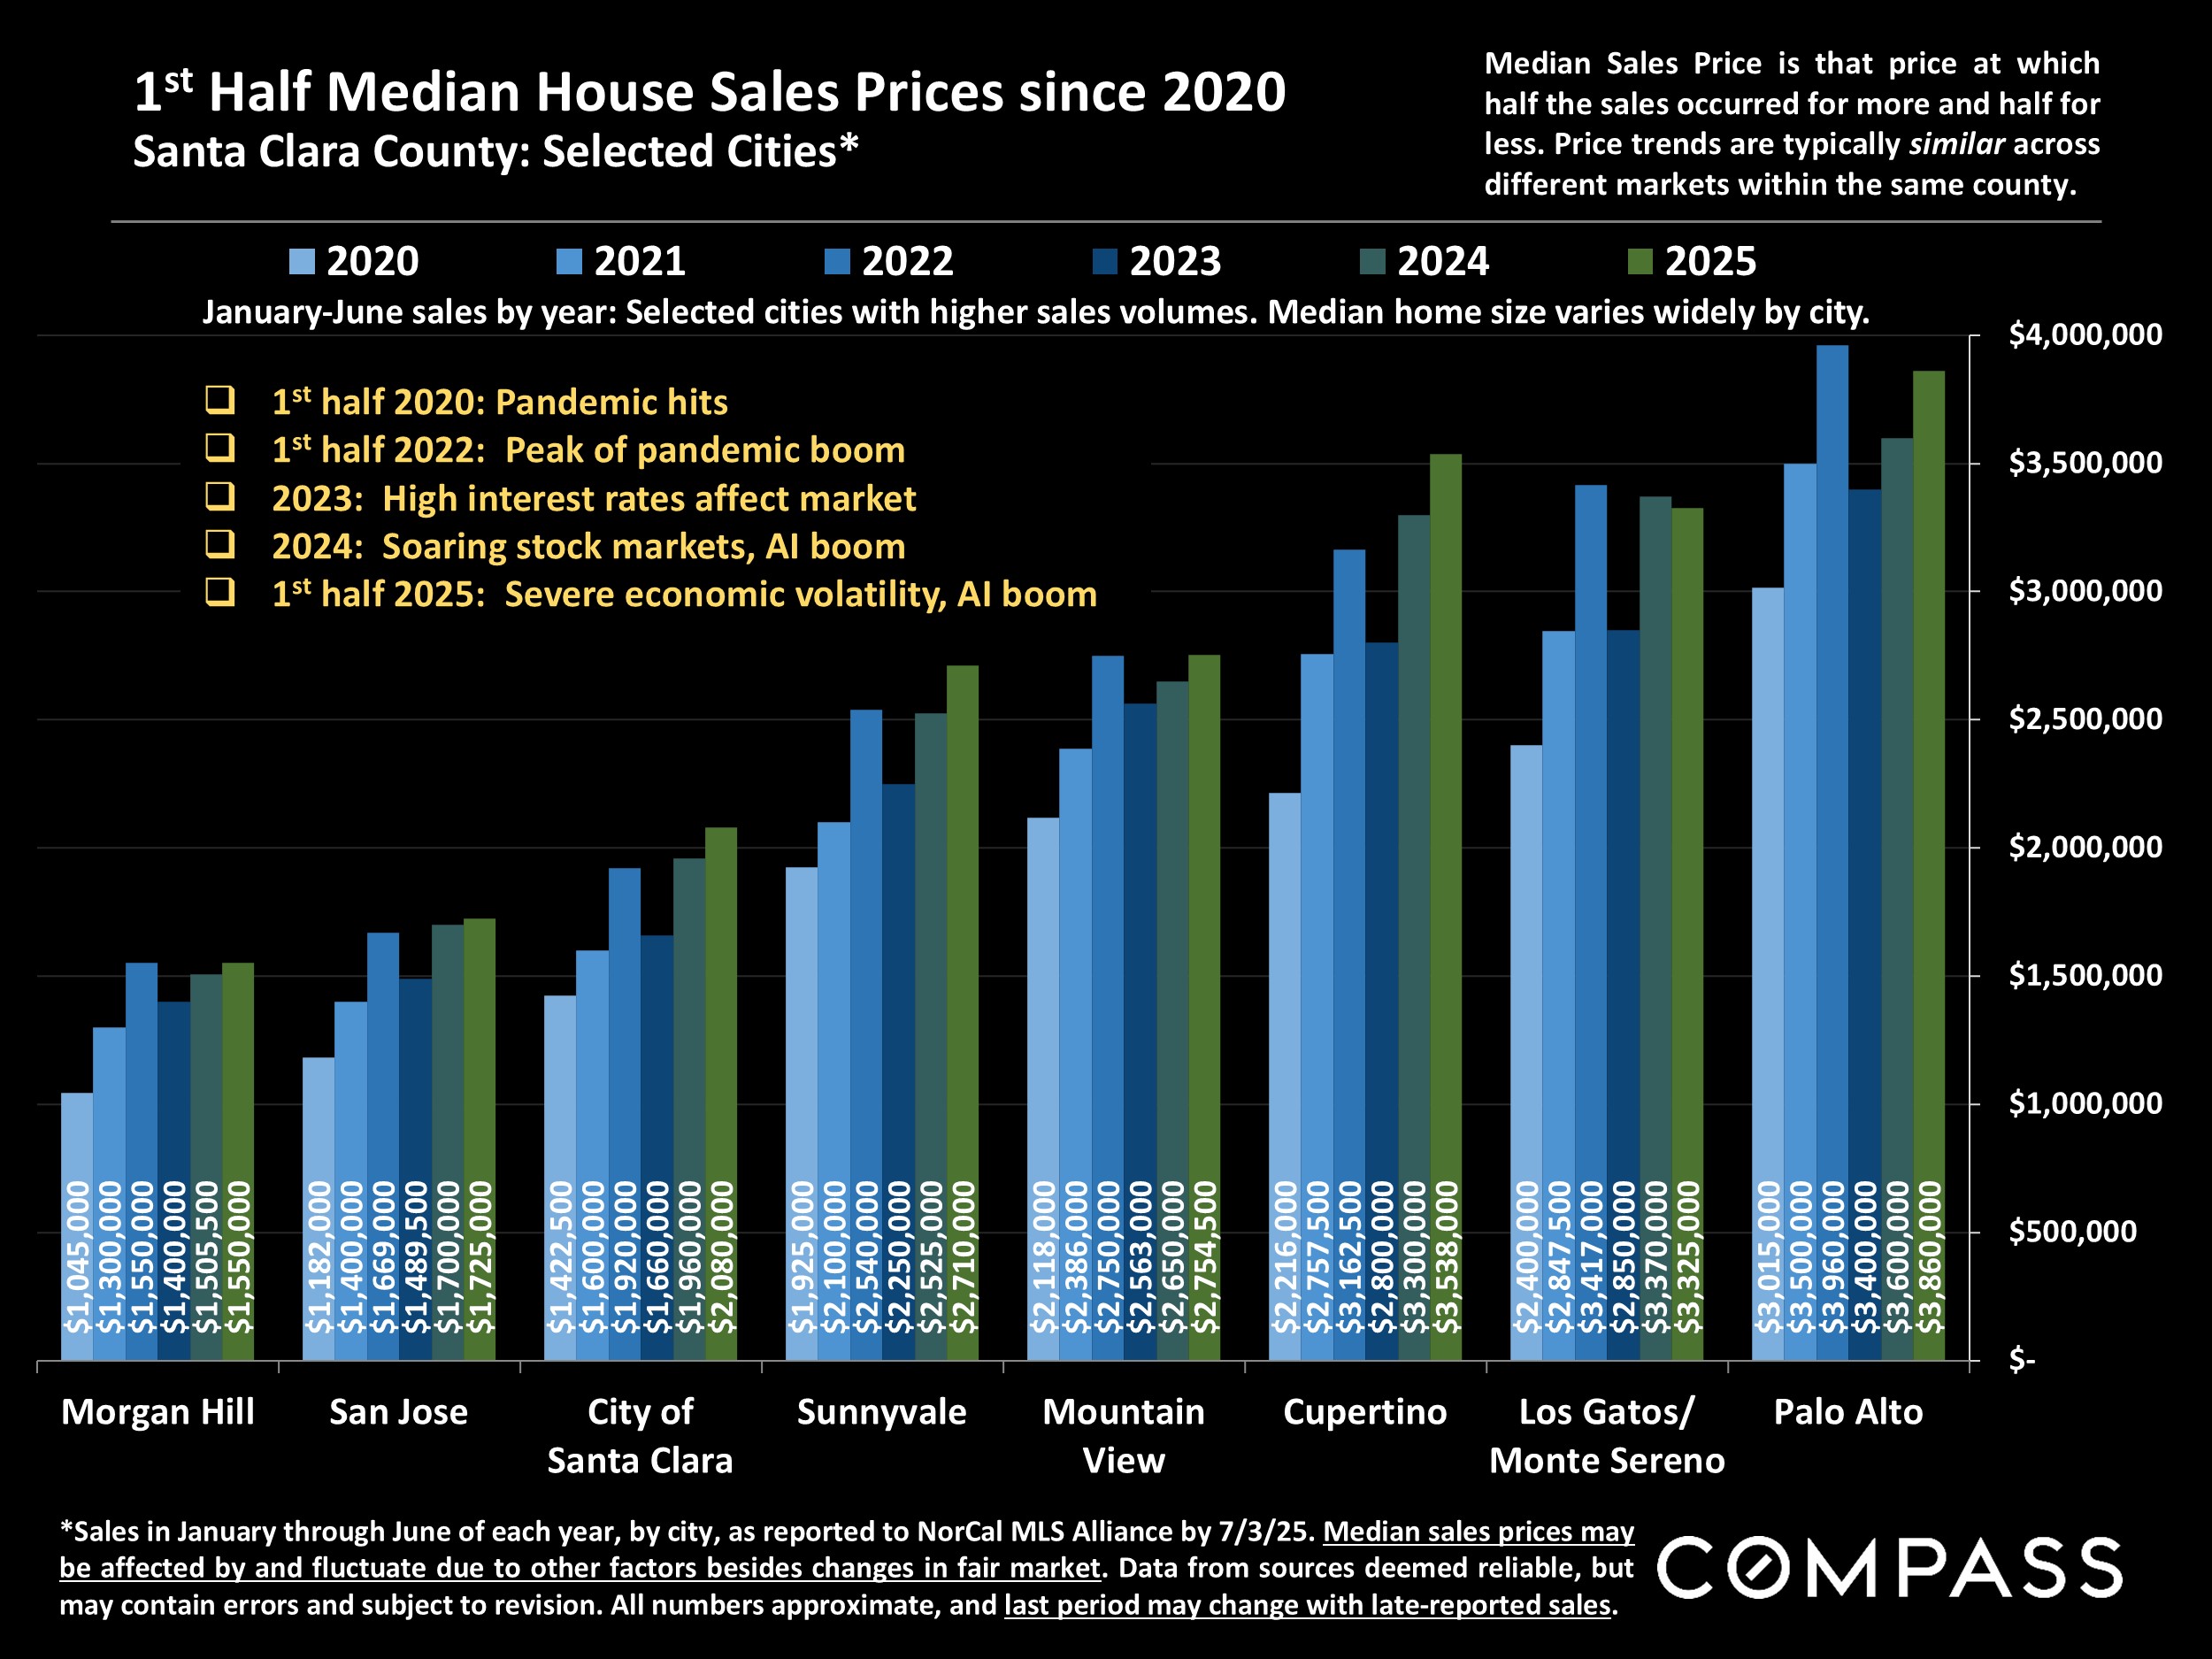
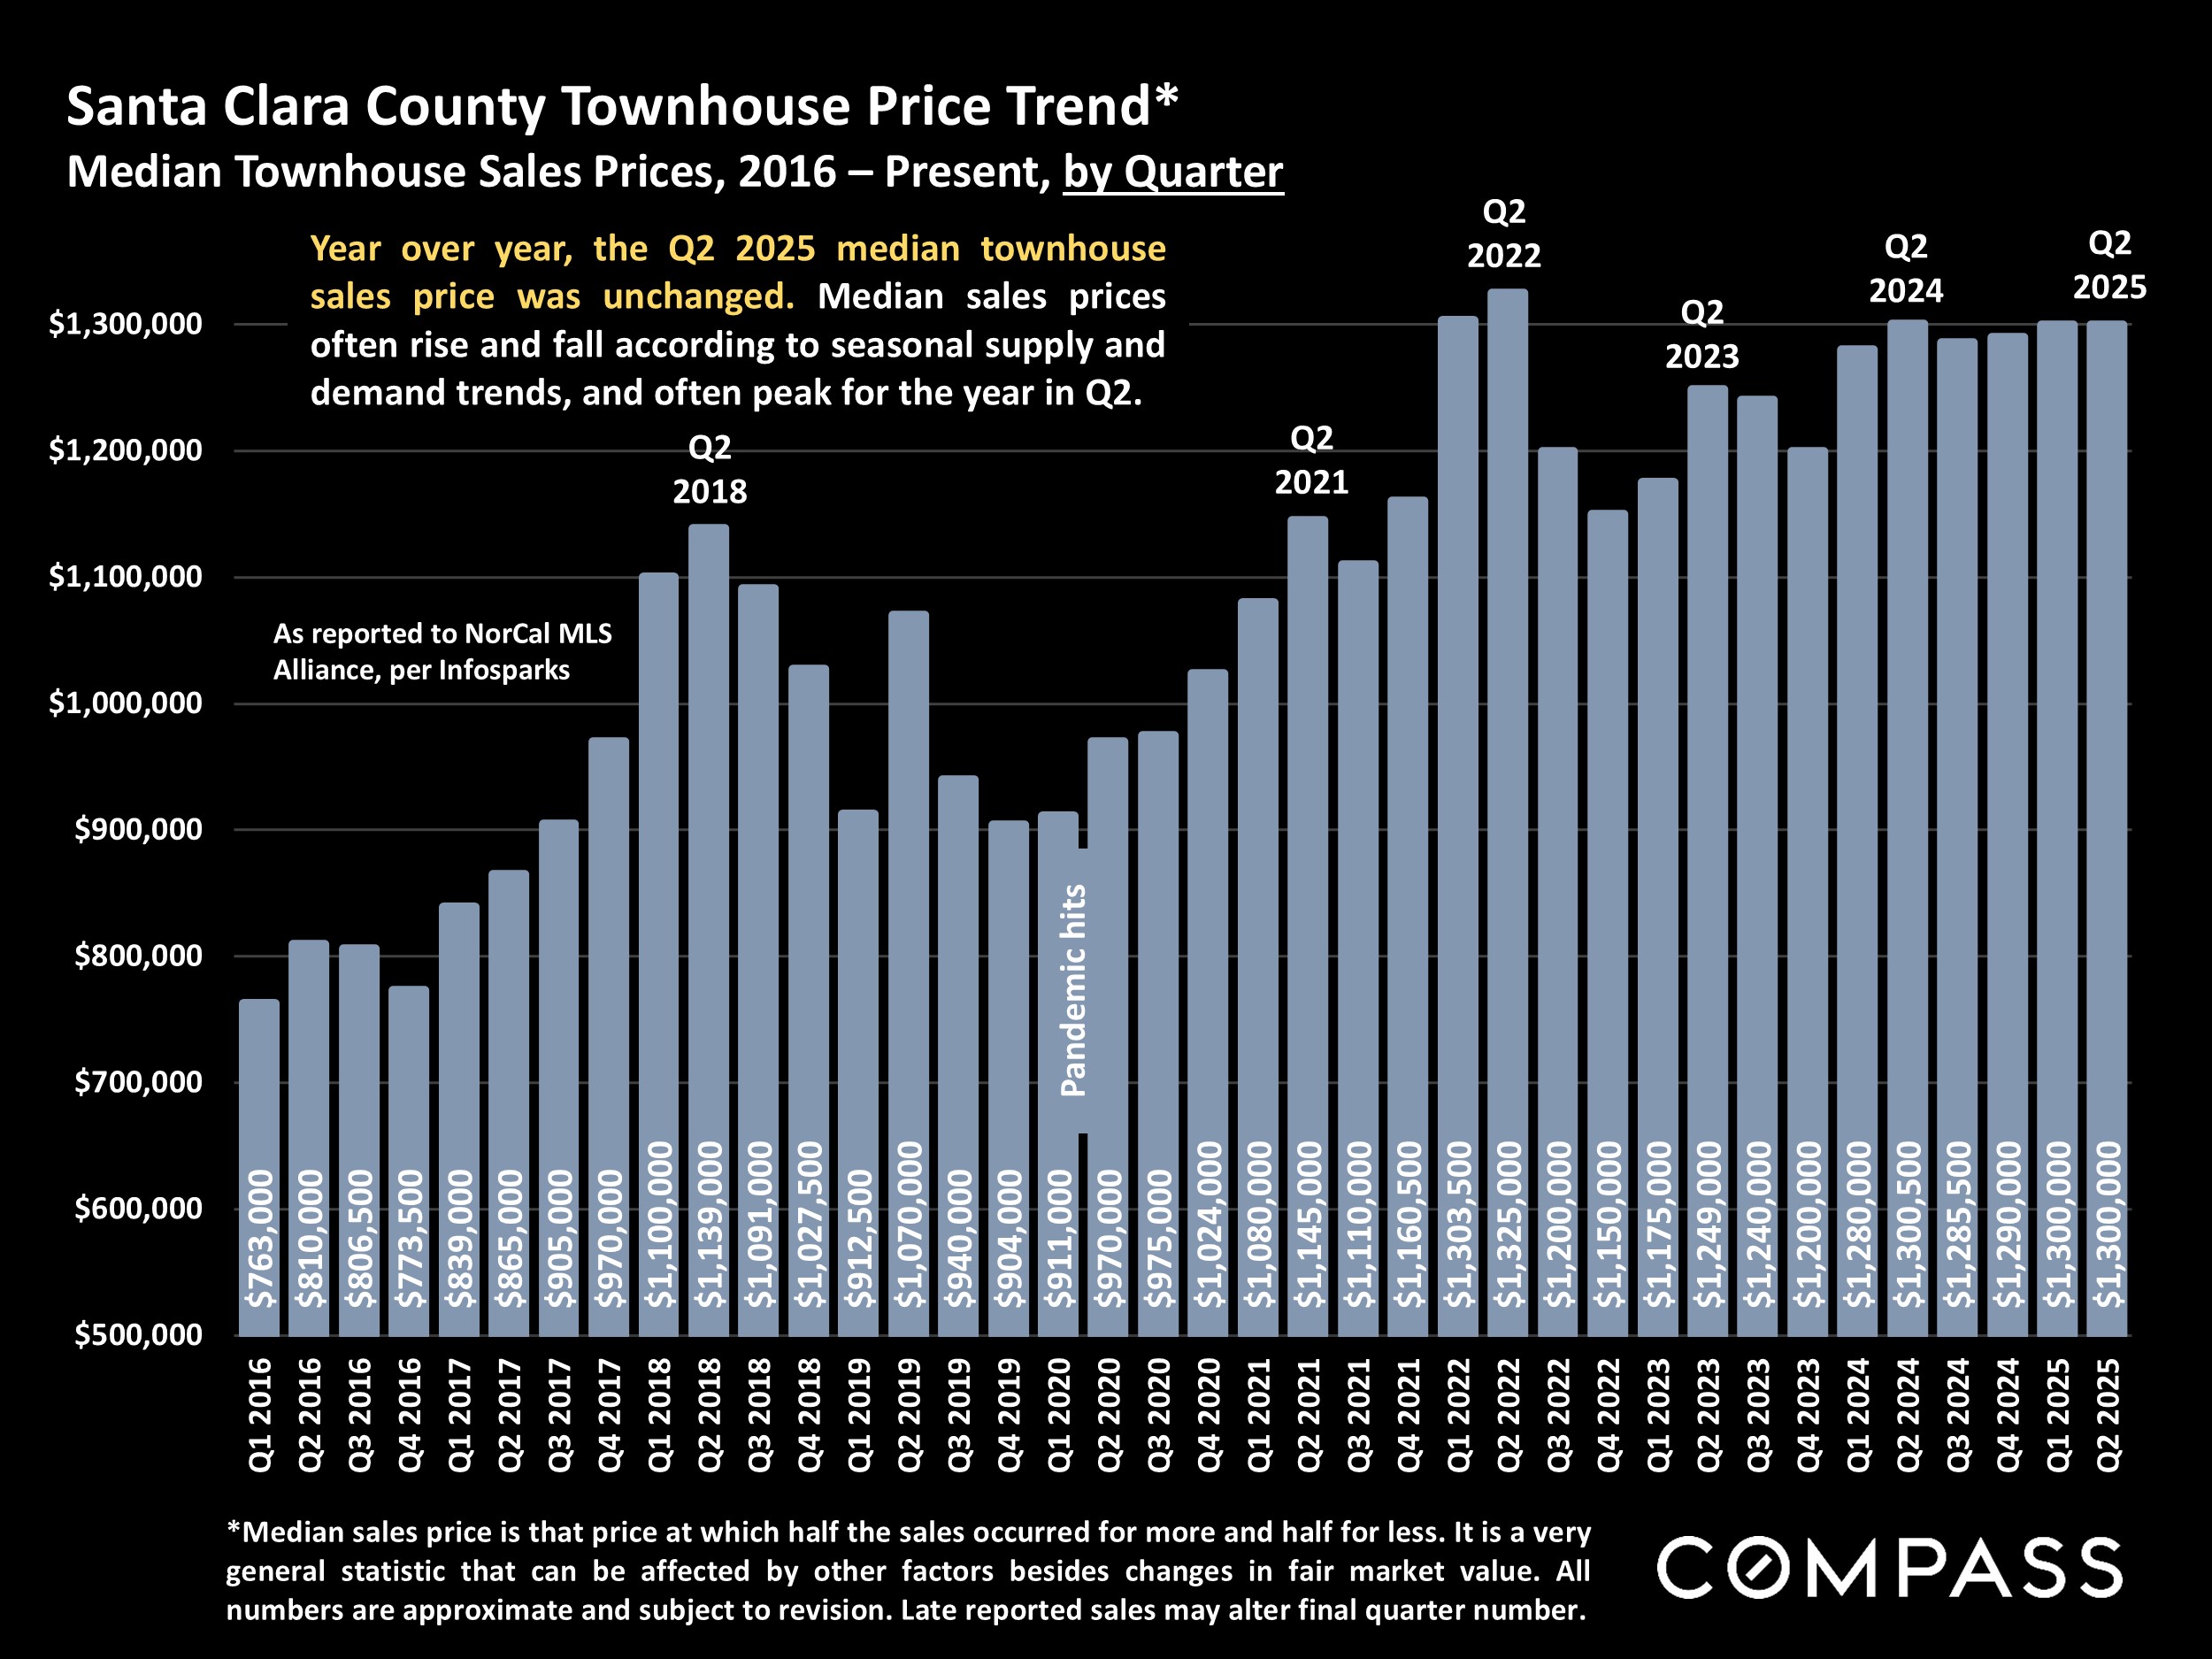
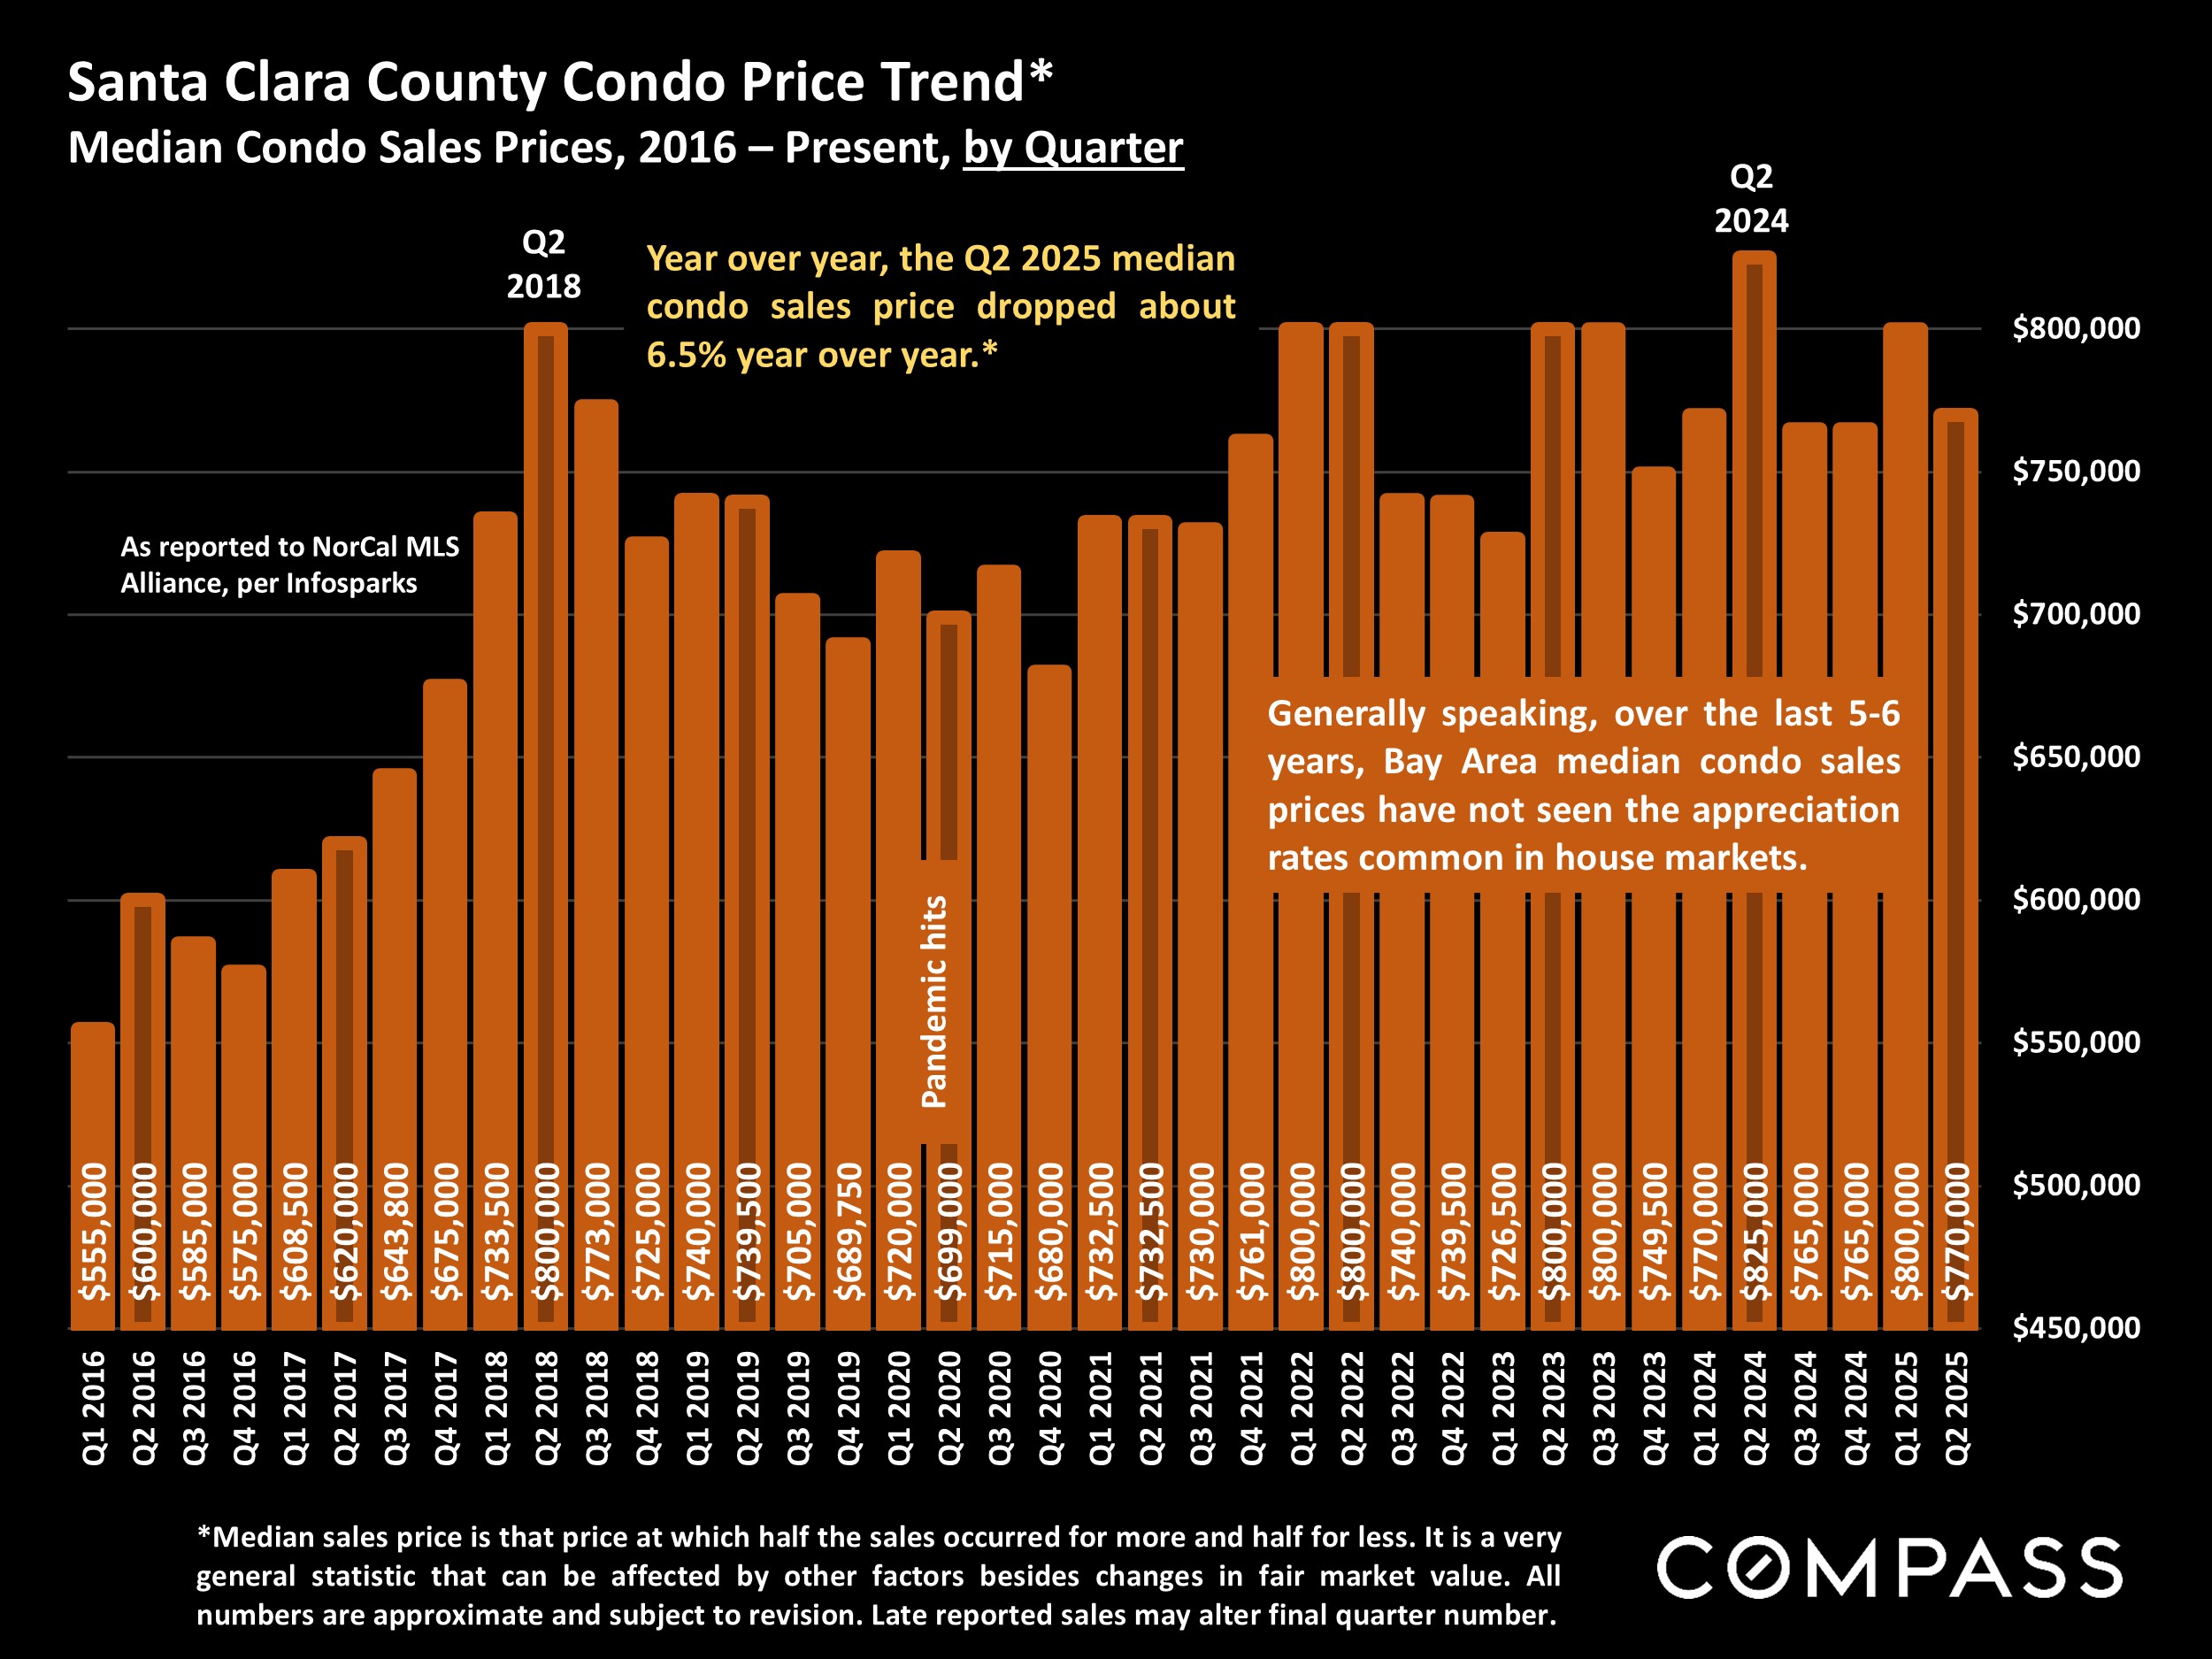
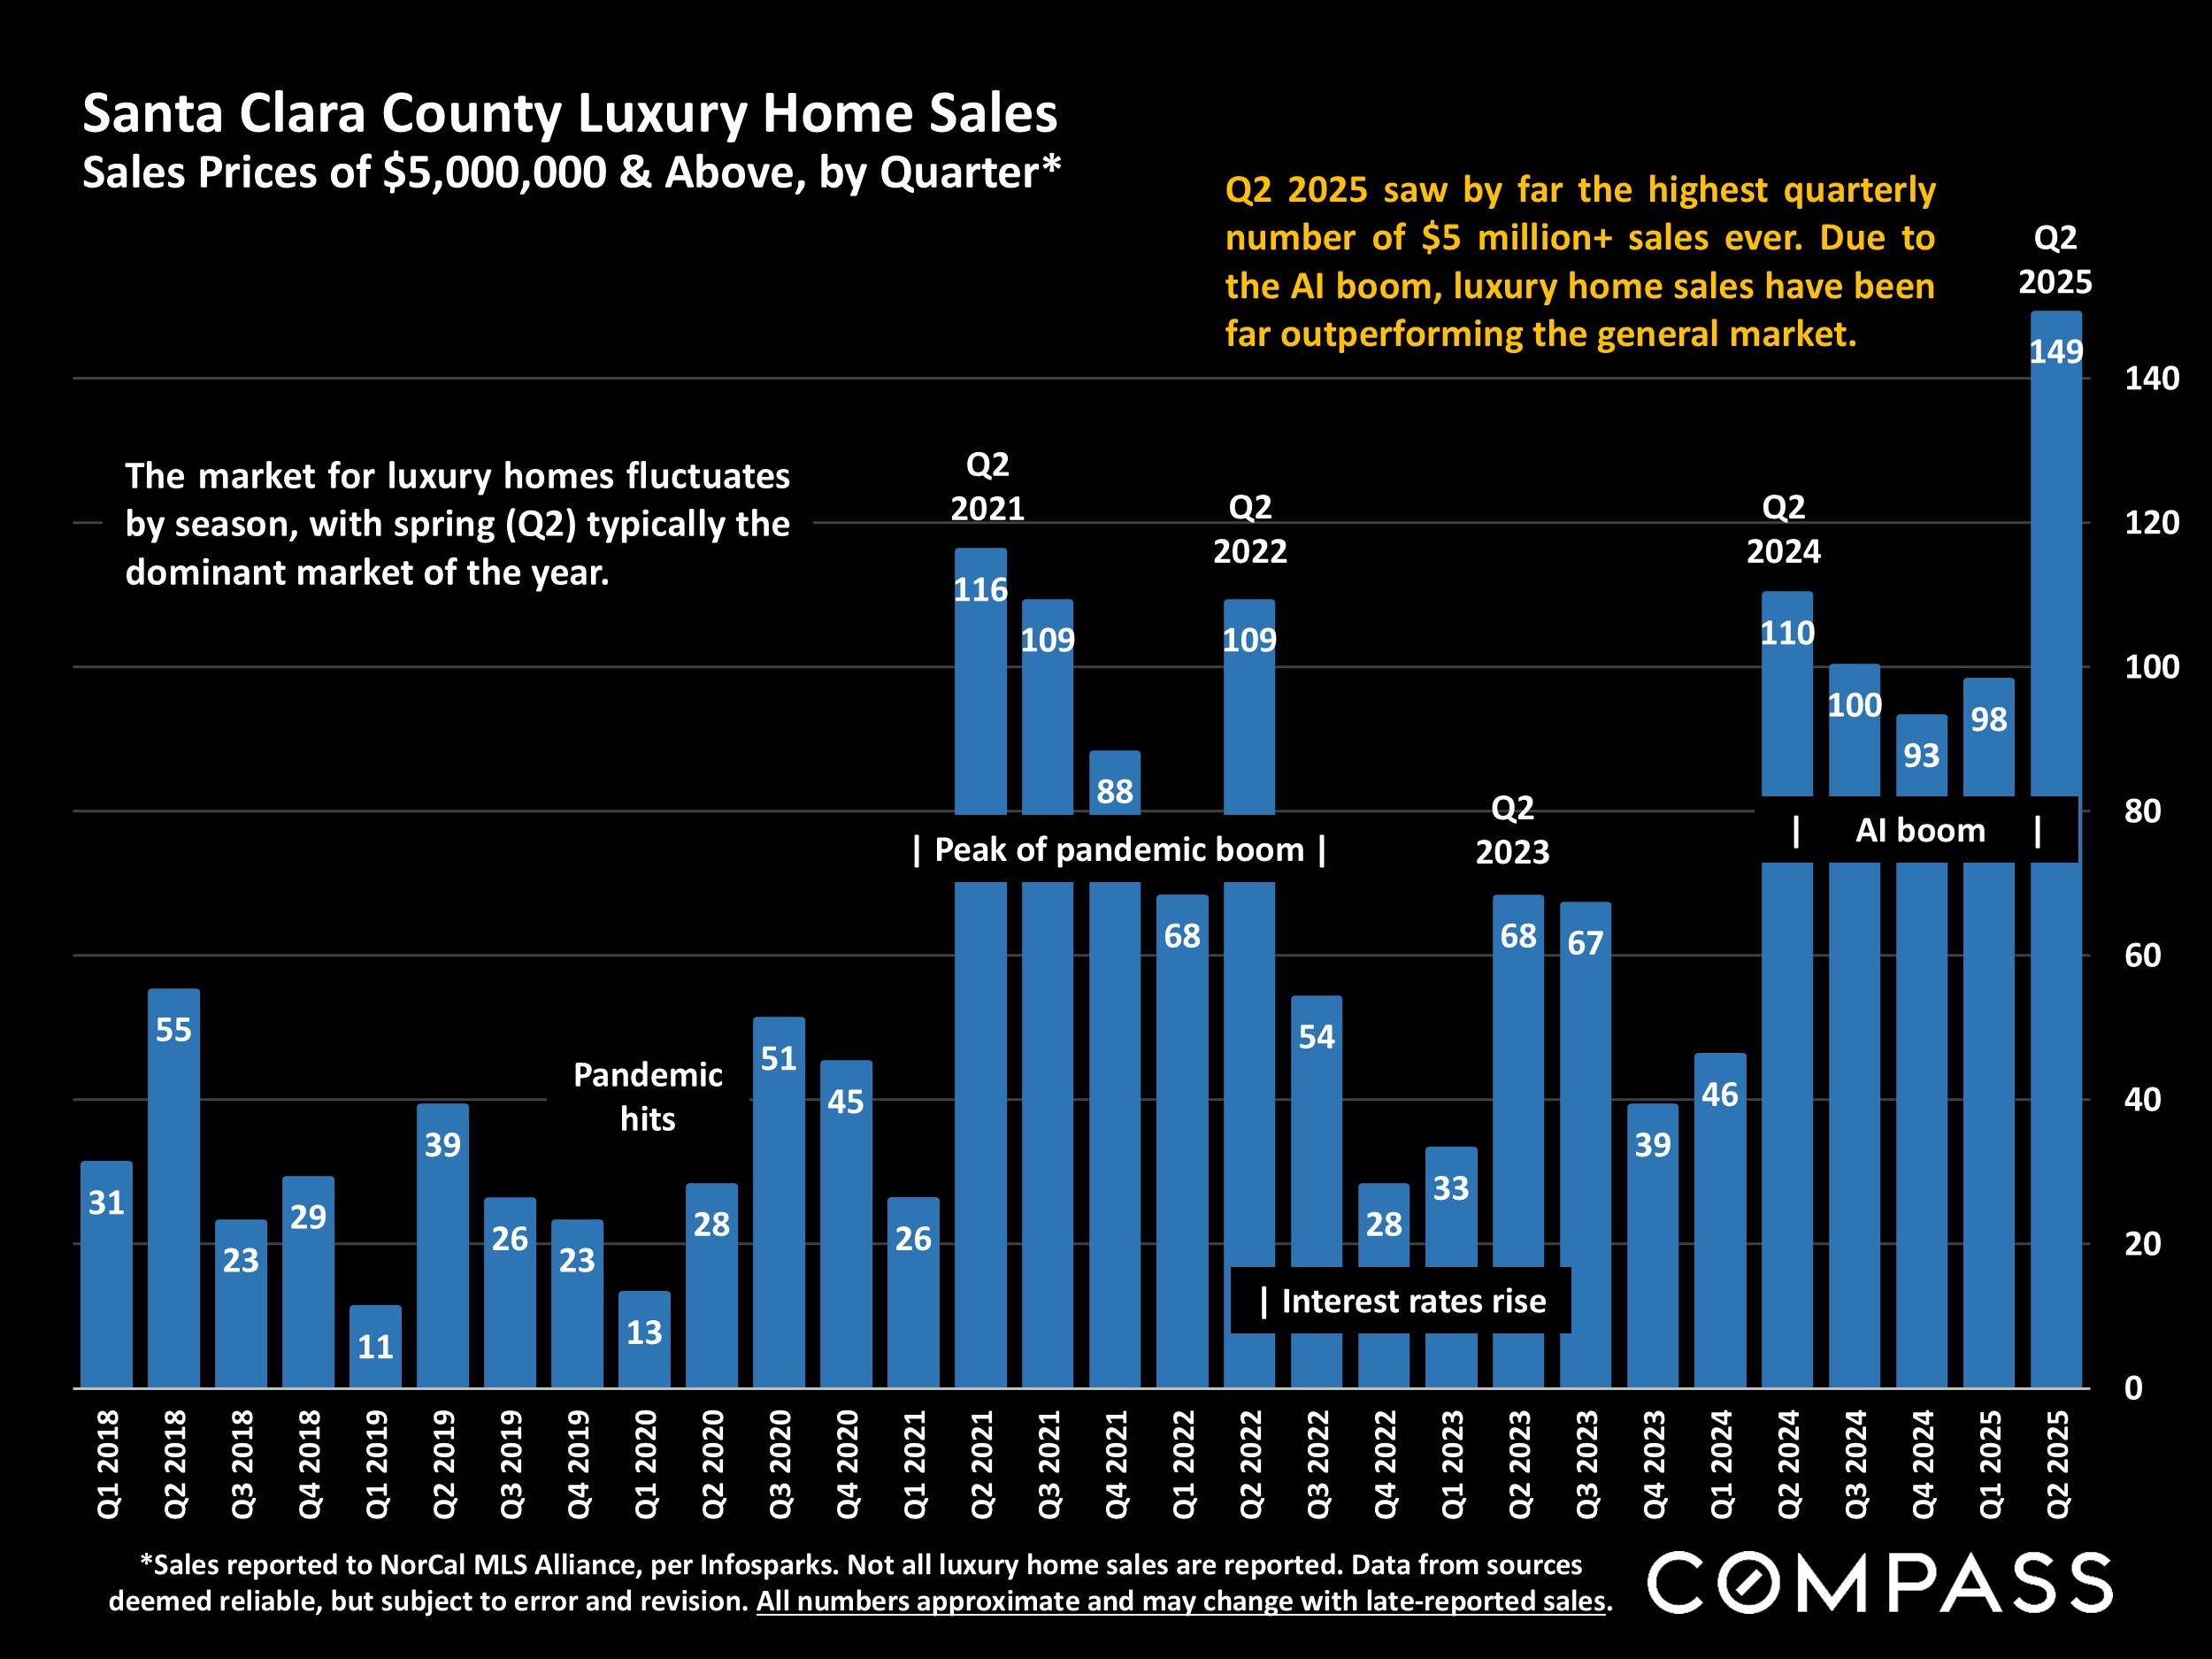
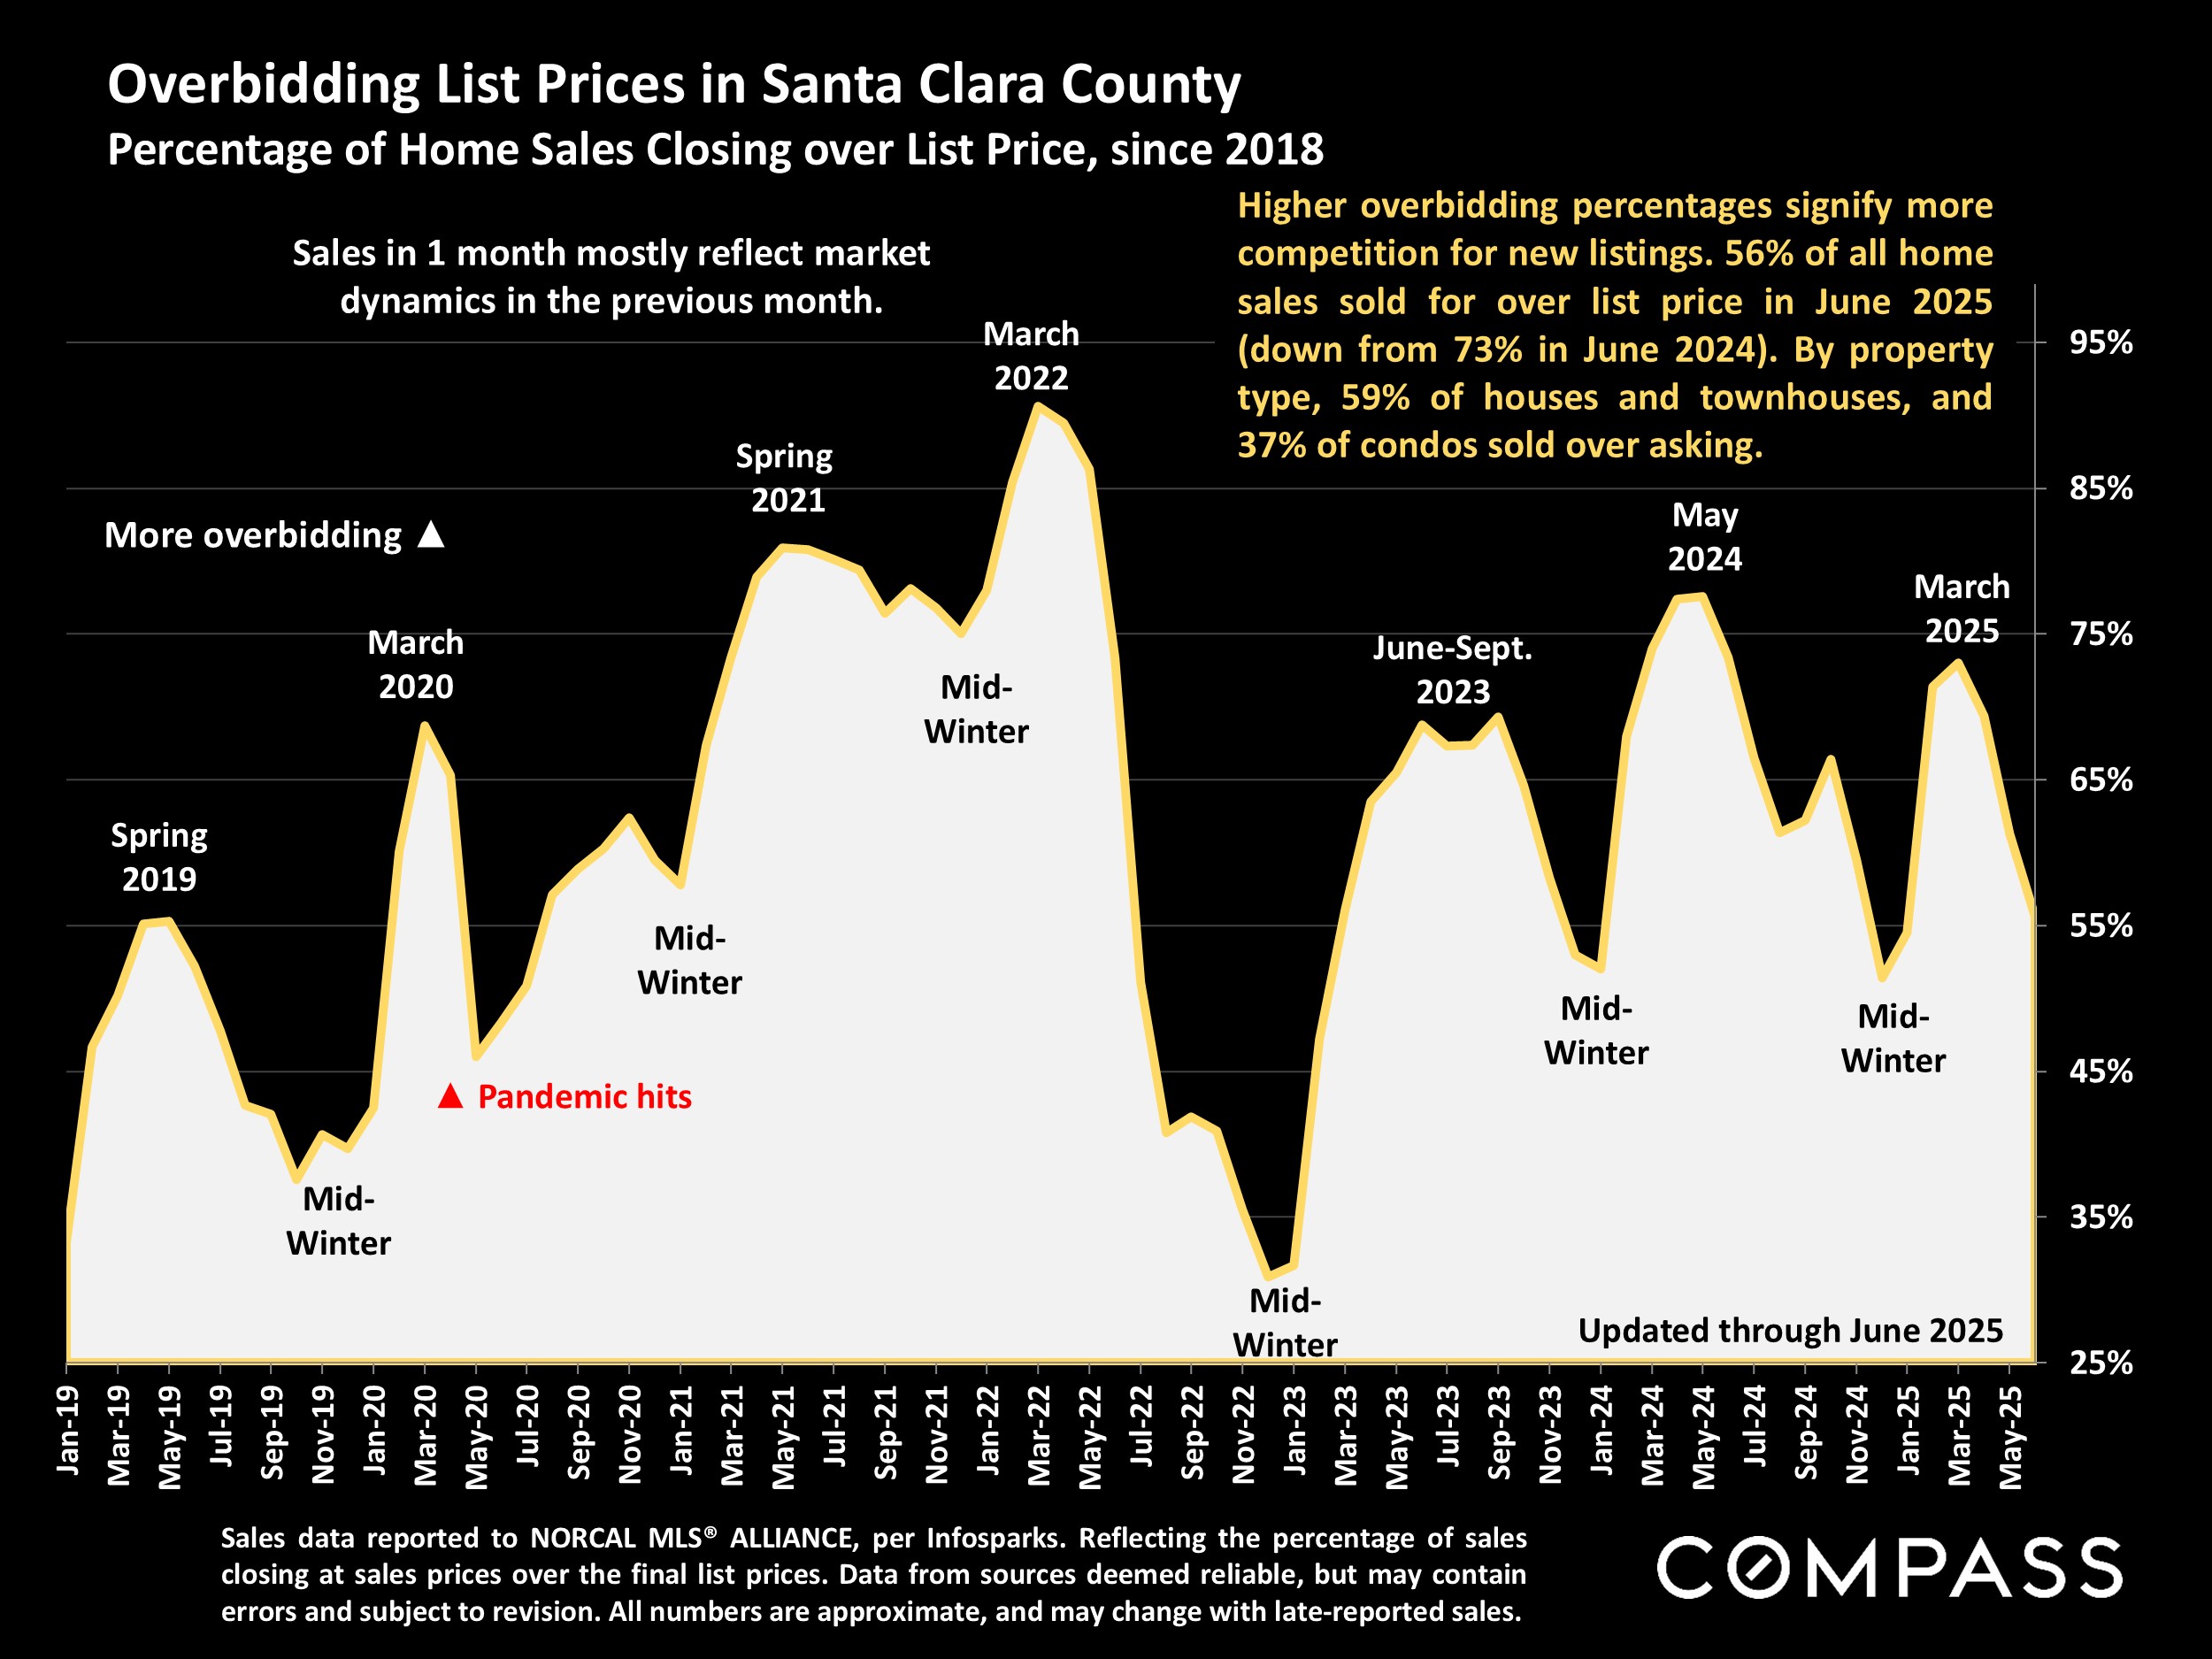
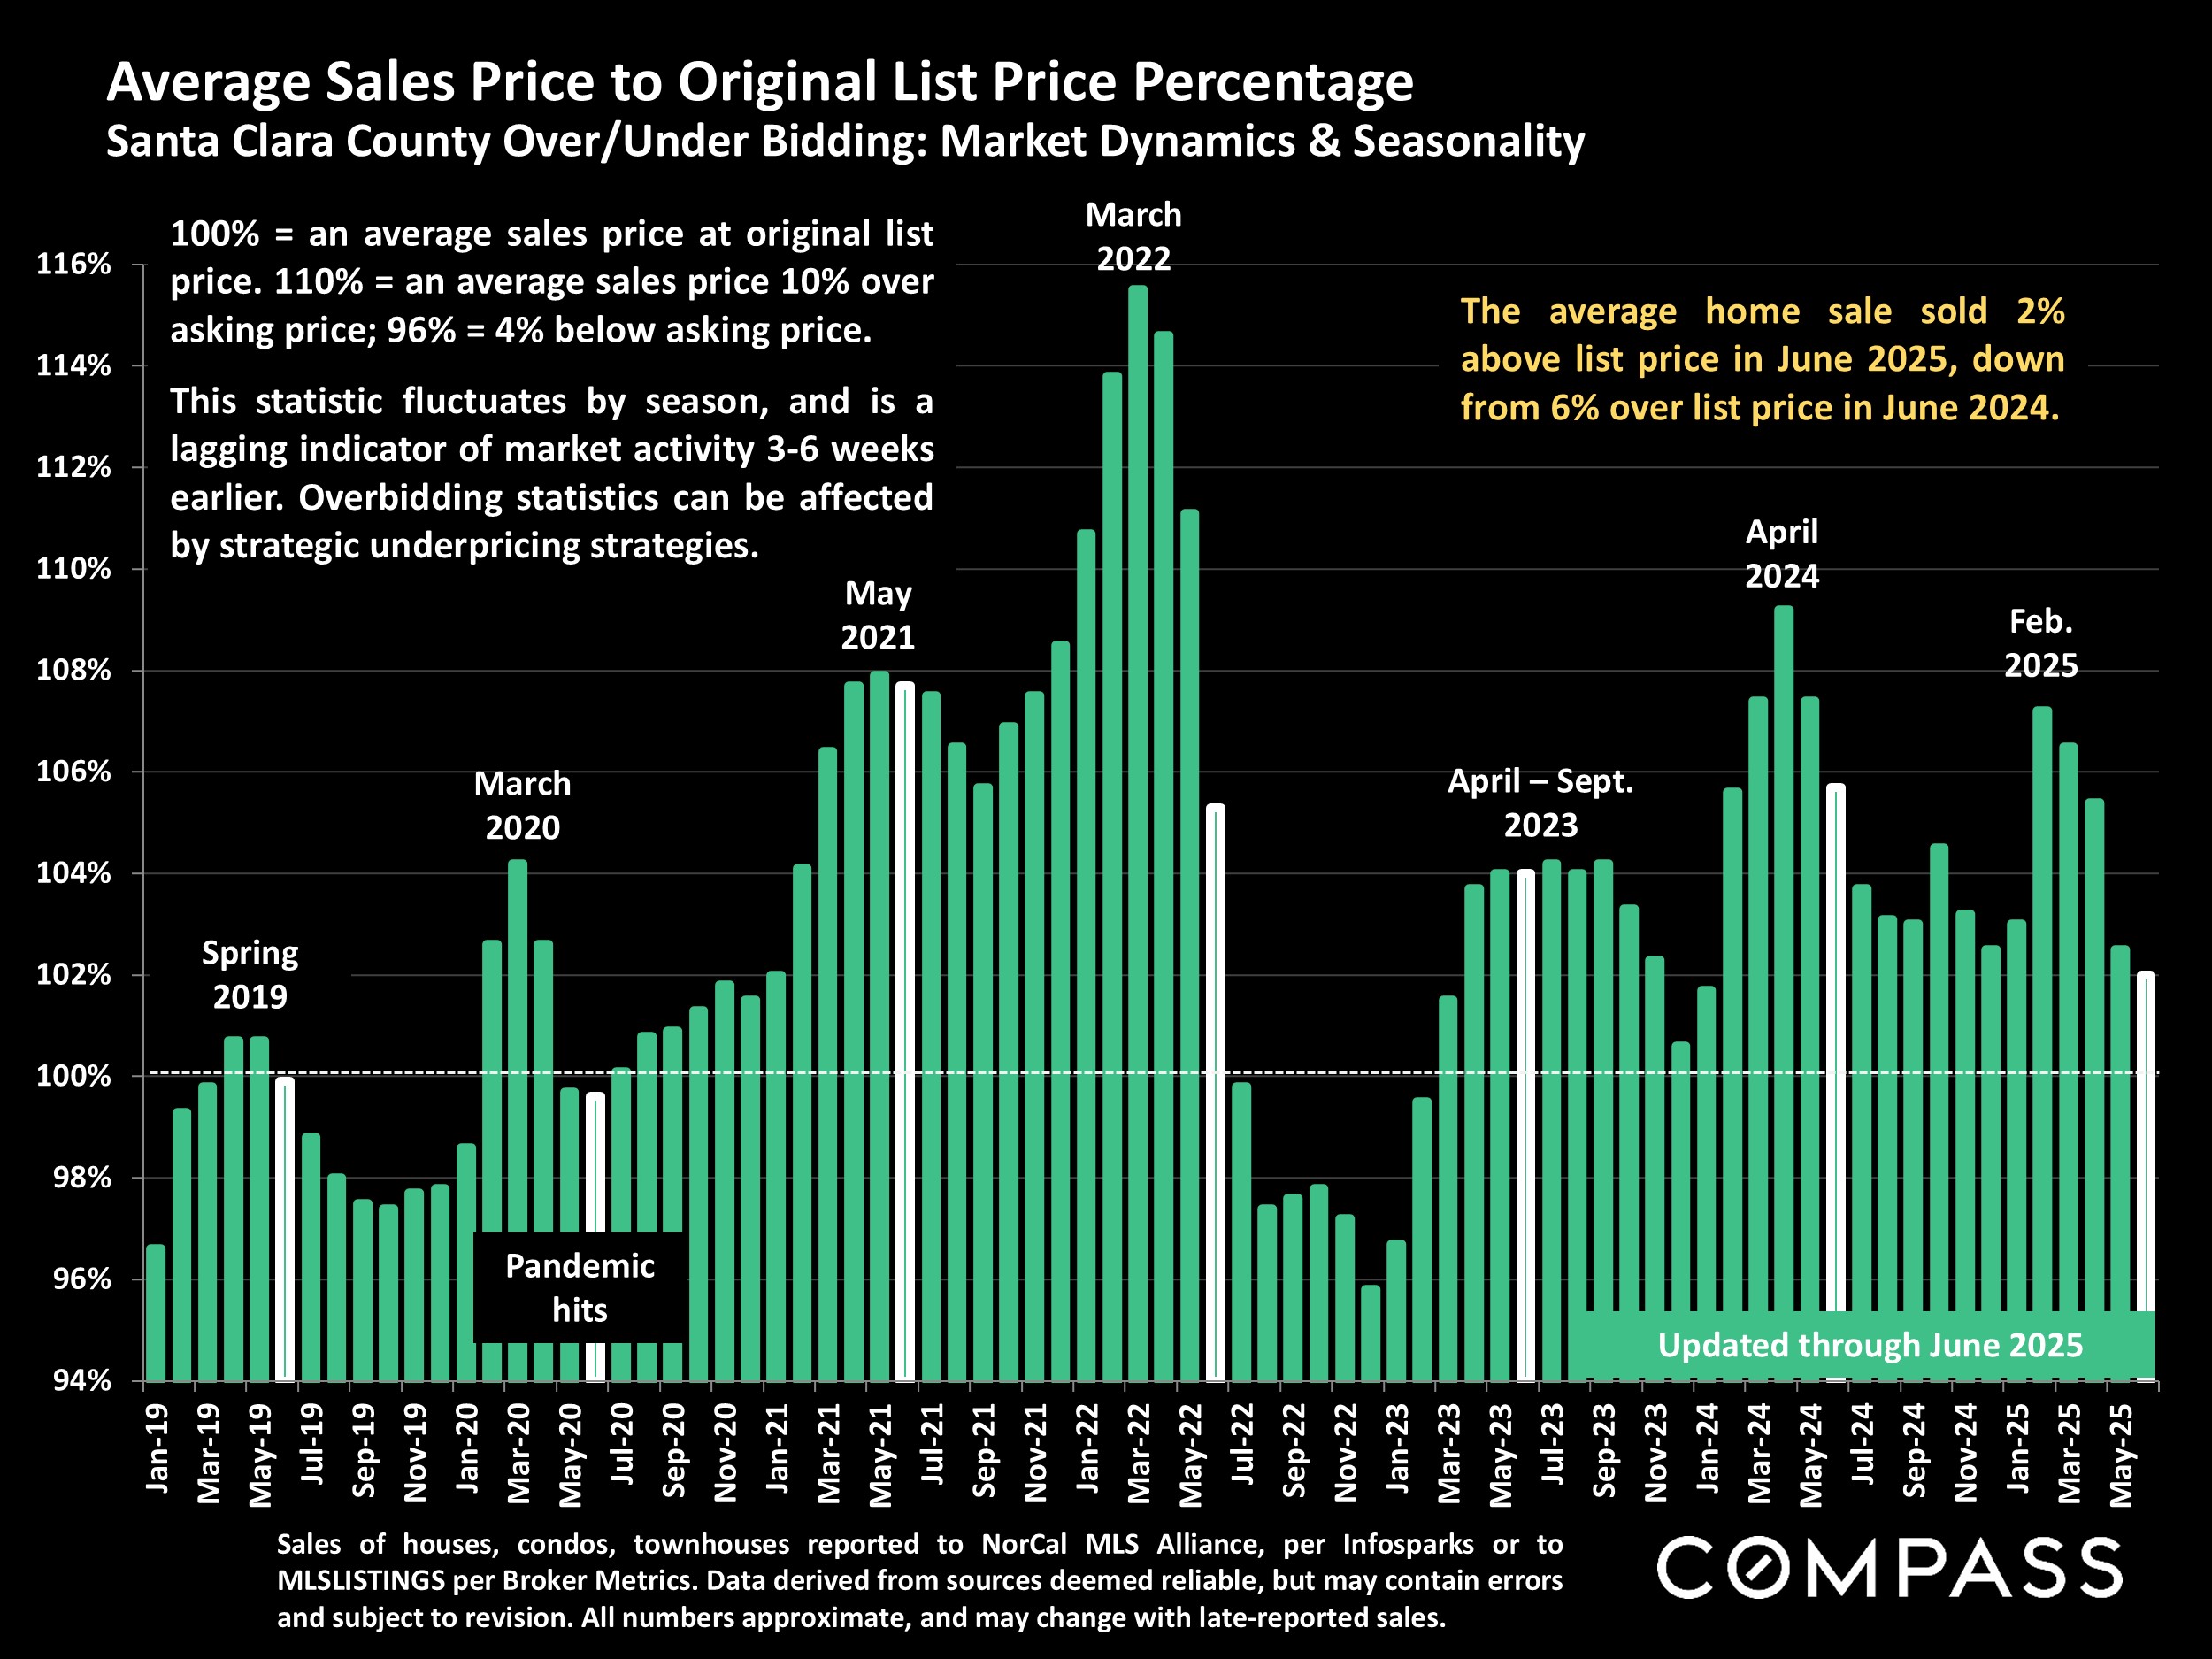
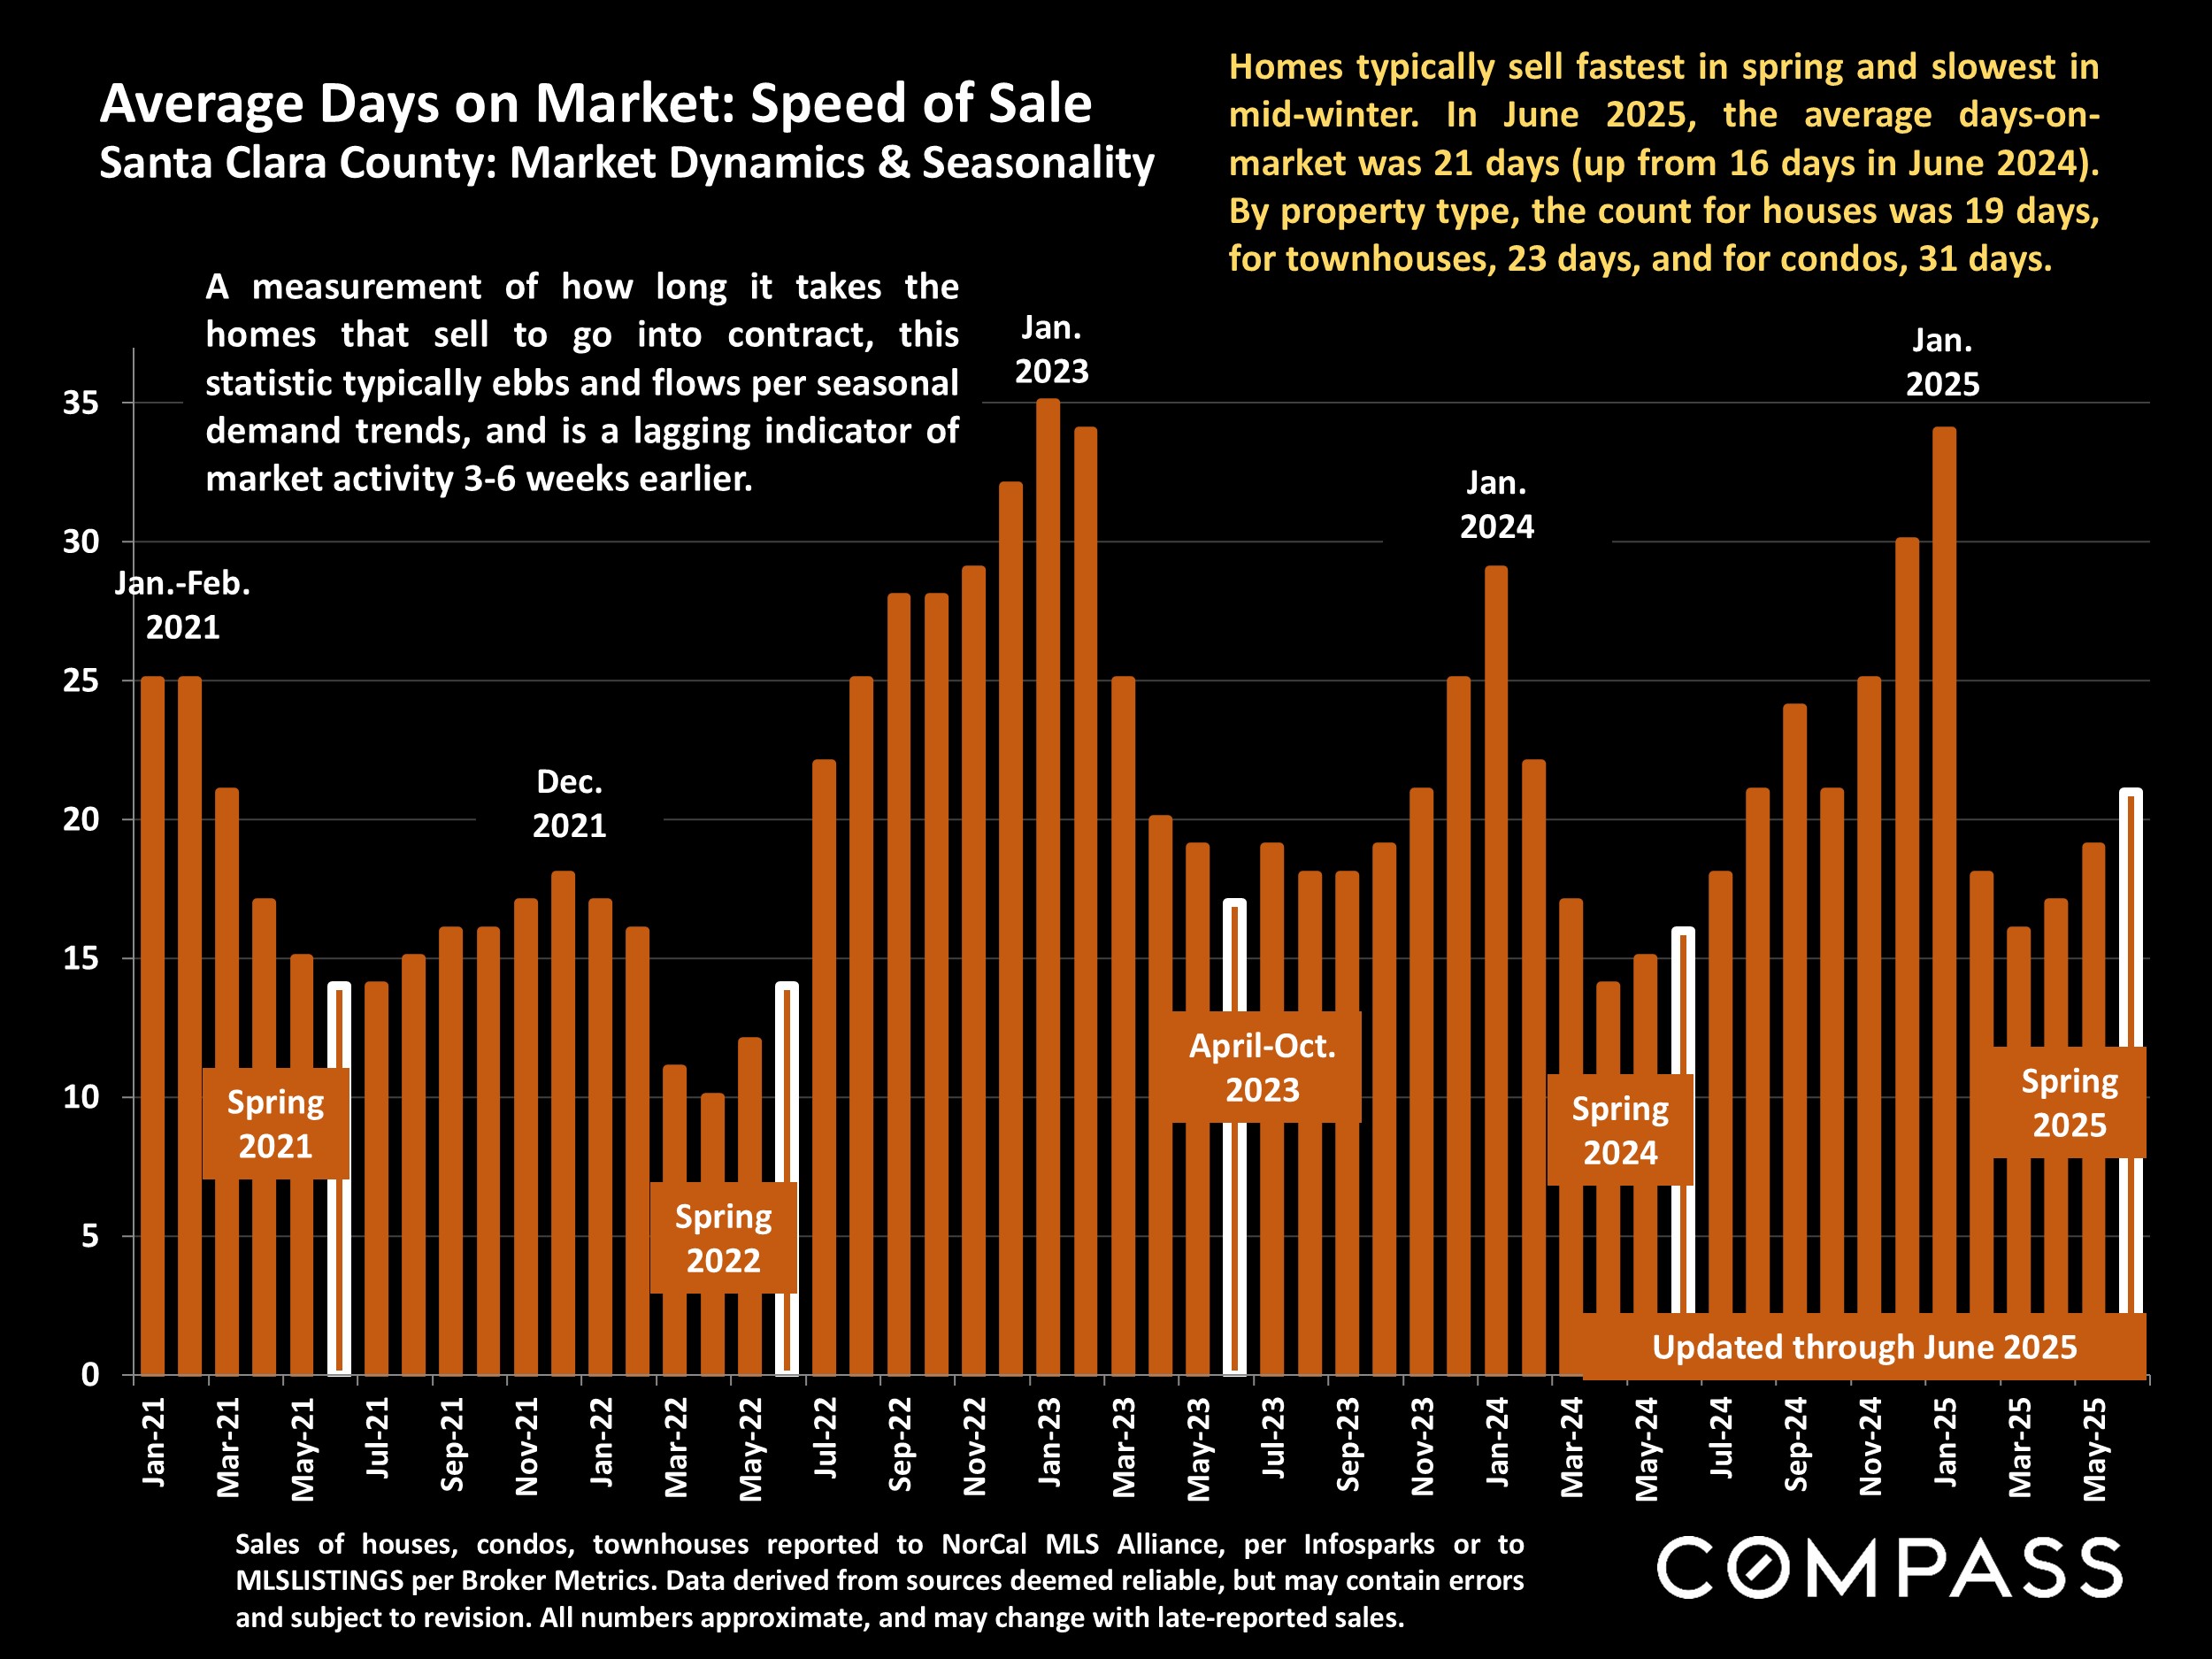
However, though Santa Clara County experienced a distinct year-over-year softening in market conditions – the indicators are illustrated in this report – its market remained very heated by any normal measure, and was the strongest in the Bay Area. Its median house sales price hit a new peak in Q2 – while most other counties saw year-over-year price declines – and, fueled by the AI boom, the number of $5 million+ home sales reached its highest quarterly count ever. Many homes sold very quickly with multiple offers for well over asking price. Though one has to assume it would have been even more competitive if macroeconomic conditions had been more favorable, the Santa Clara County market remained quite robust.
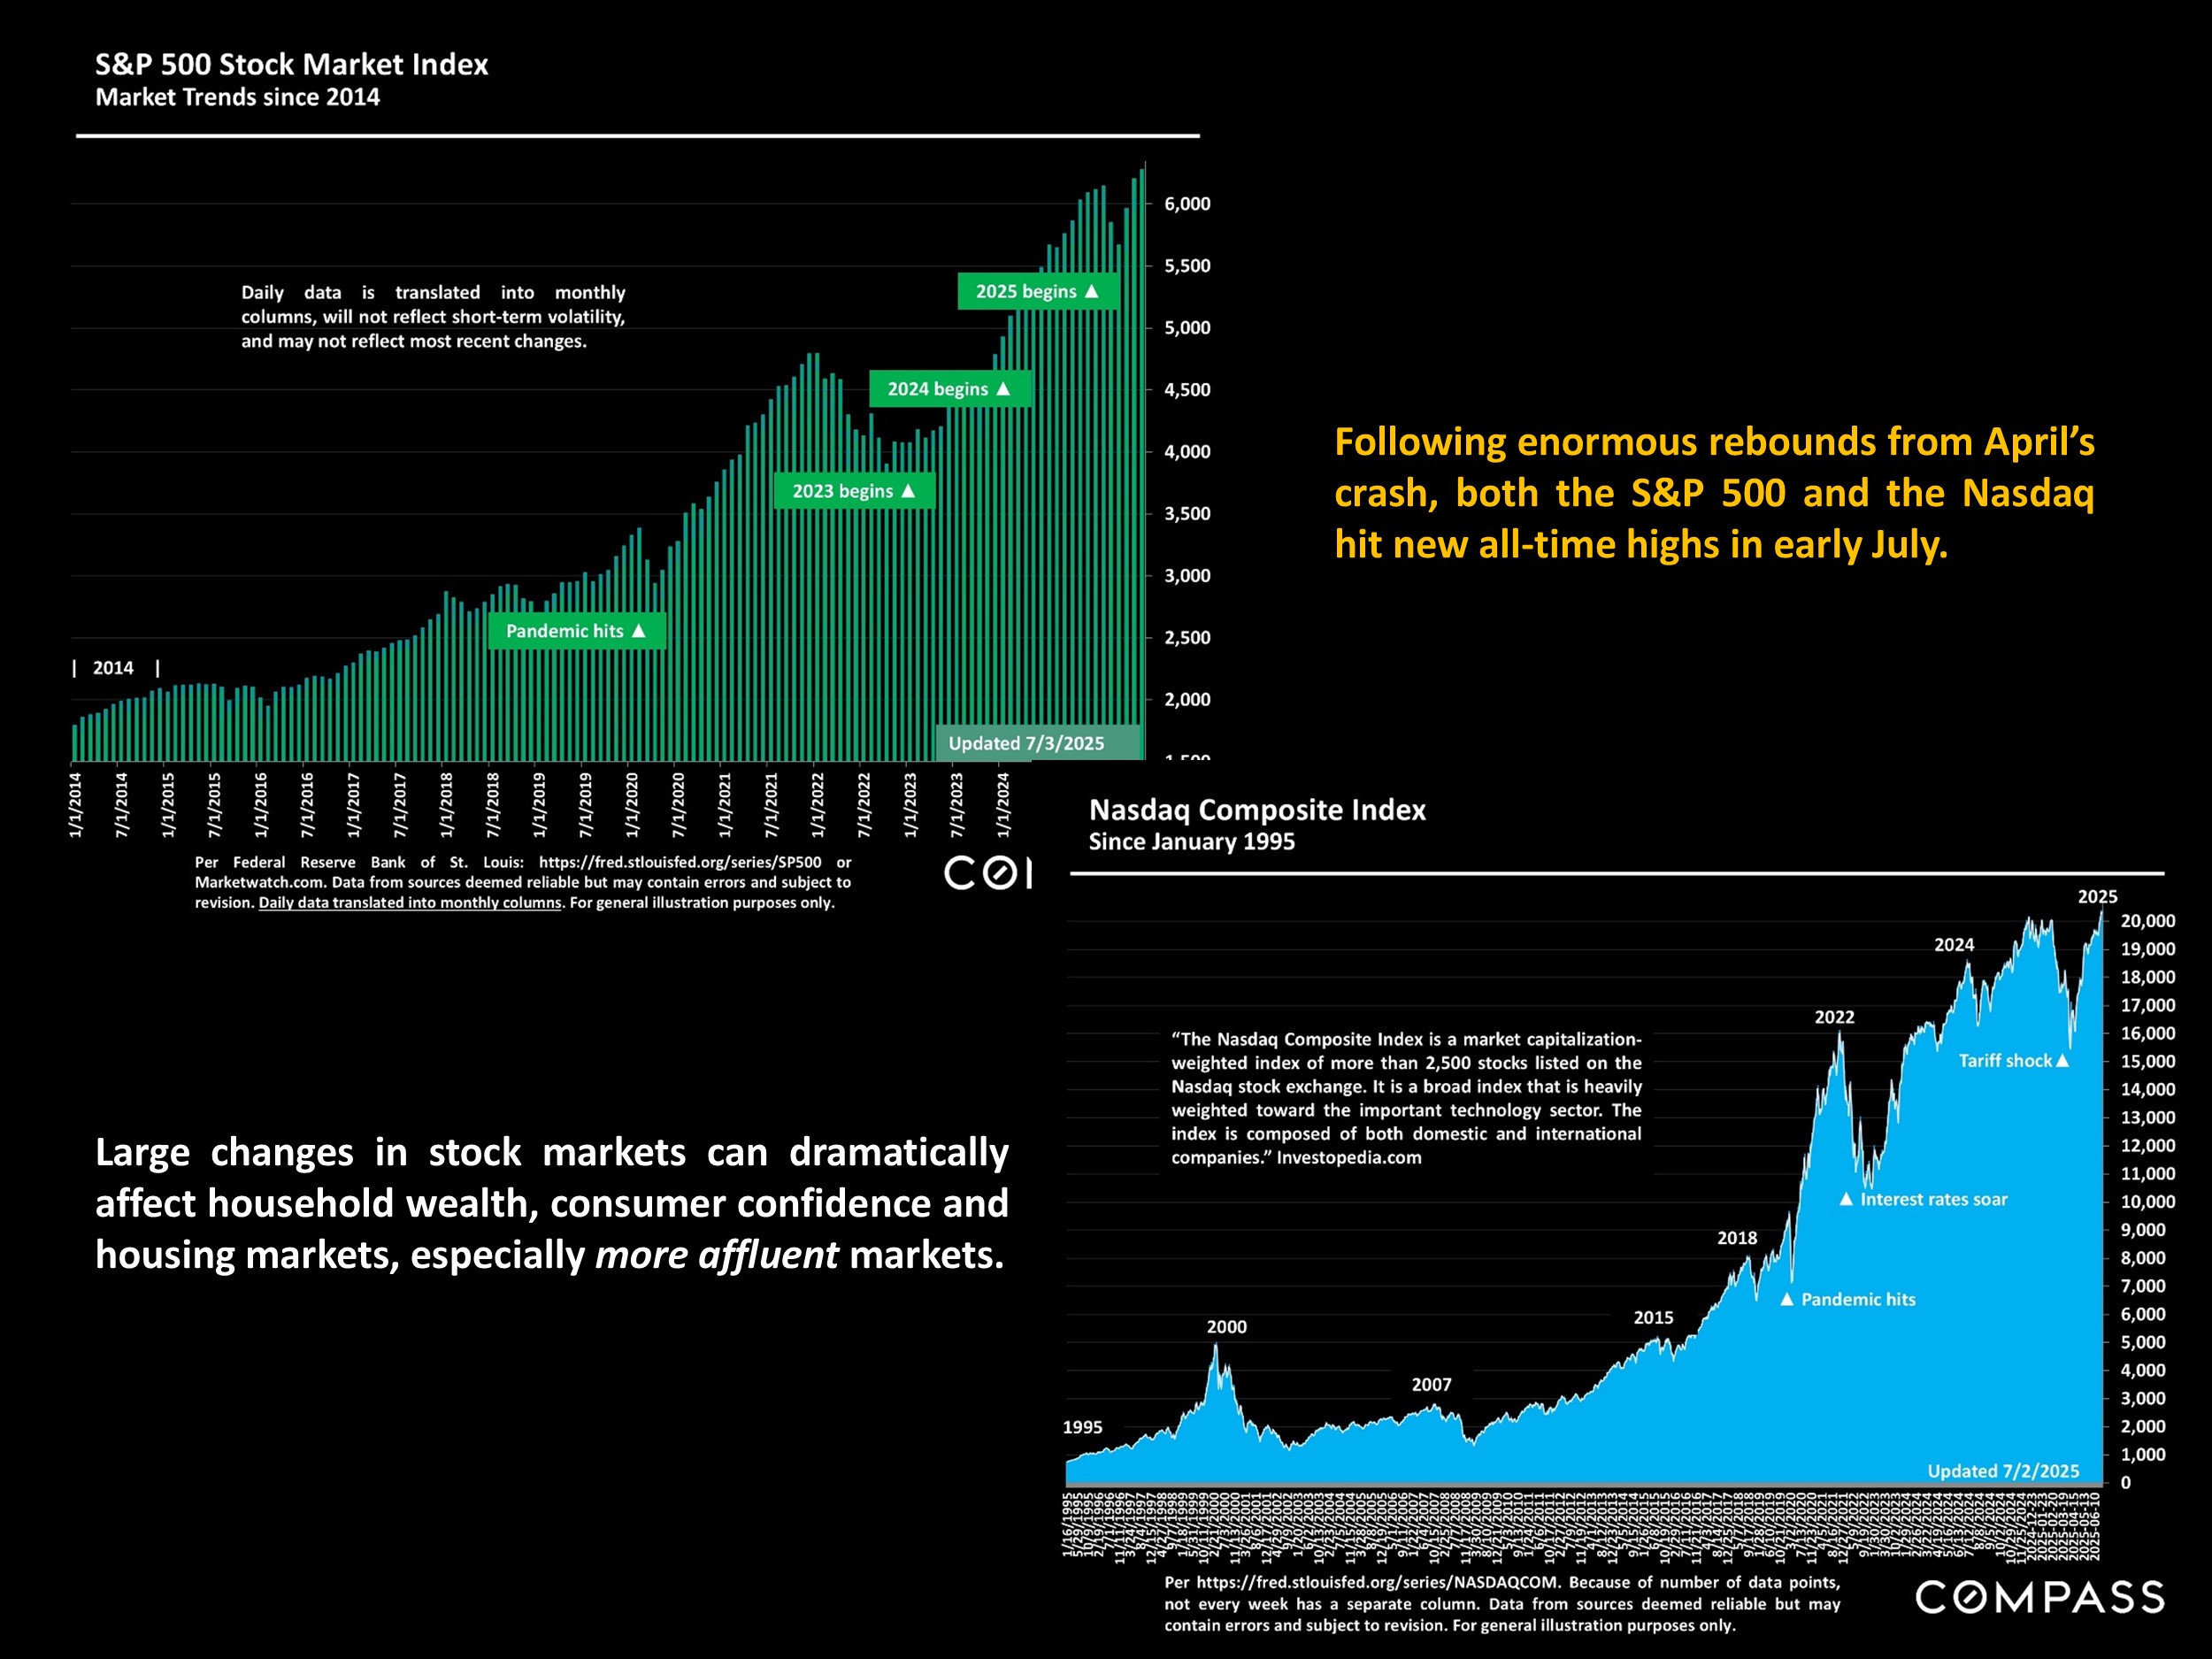
Furthermore, as of early July, measures of economic uncertainty were dropping, stock markets had staged an astounding recovery to hit new highs, consumer confidence had begun to rebound, and interest rates were gradually declining. Hopefully, these positive changes will continue.
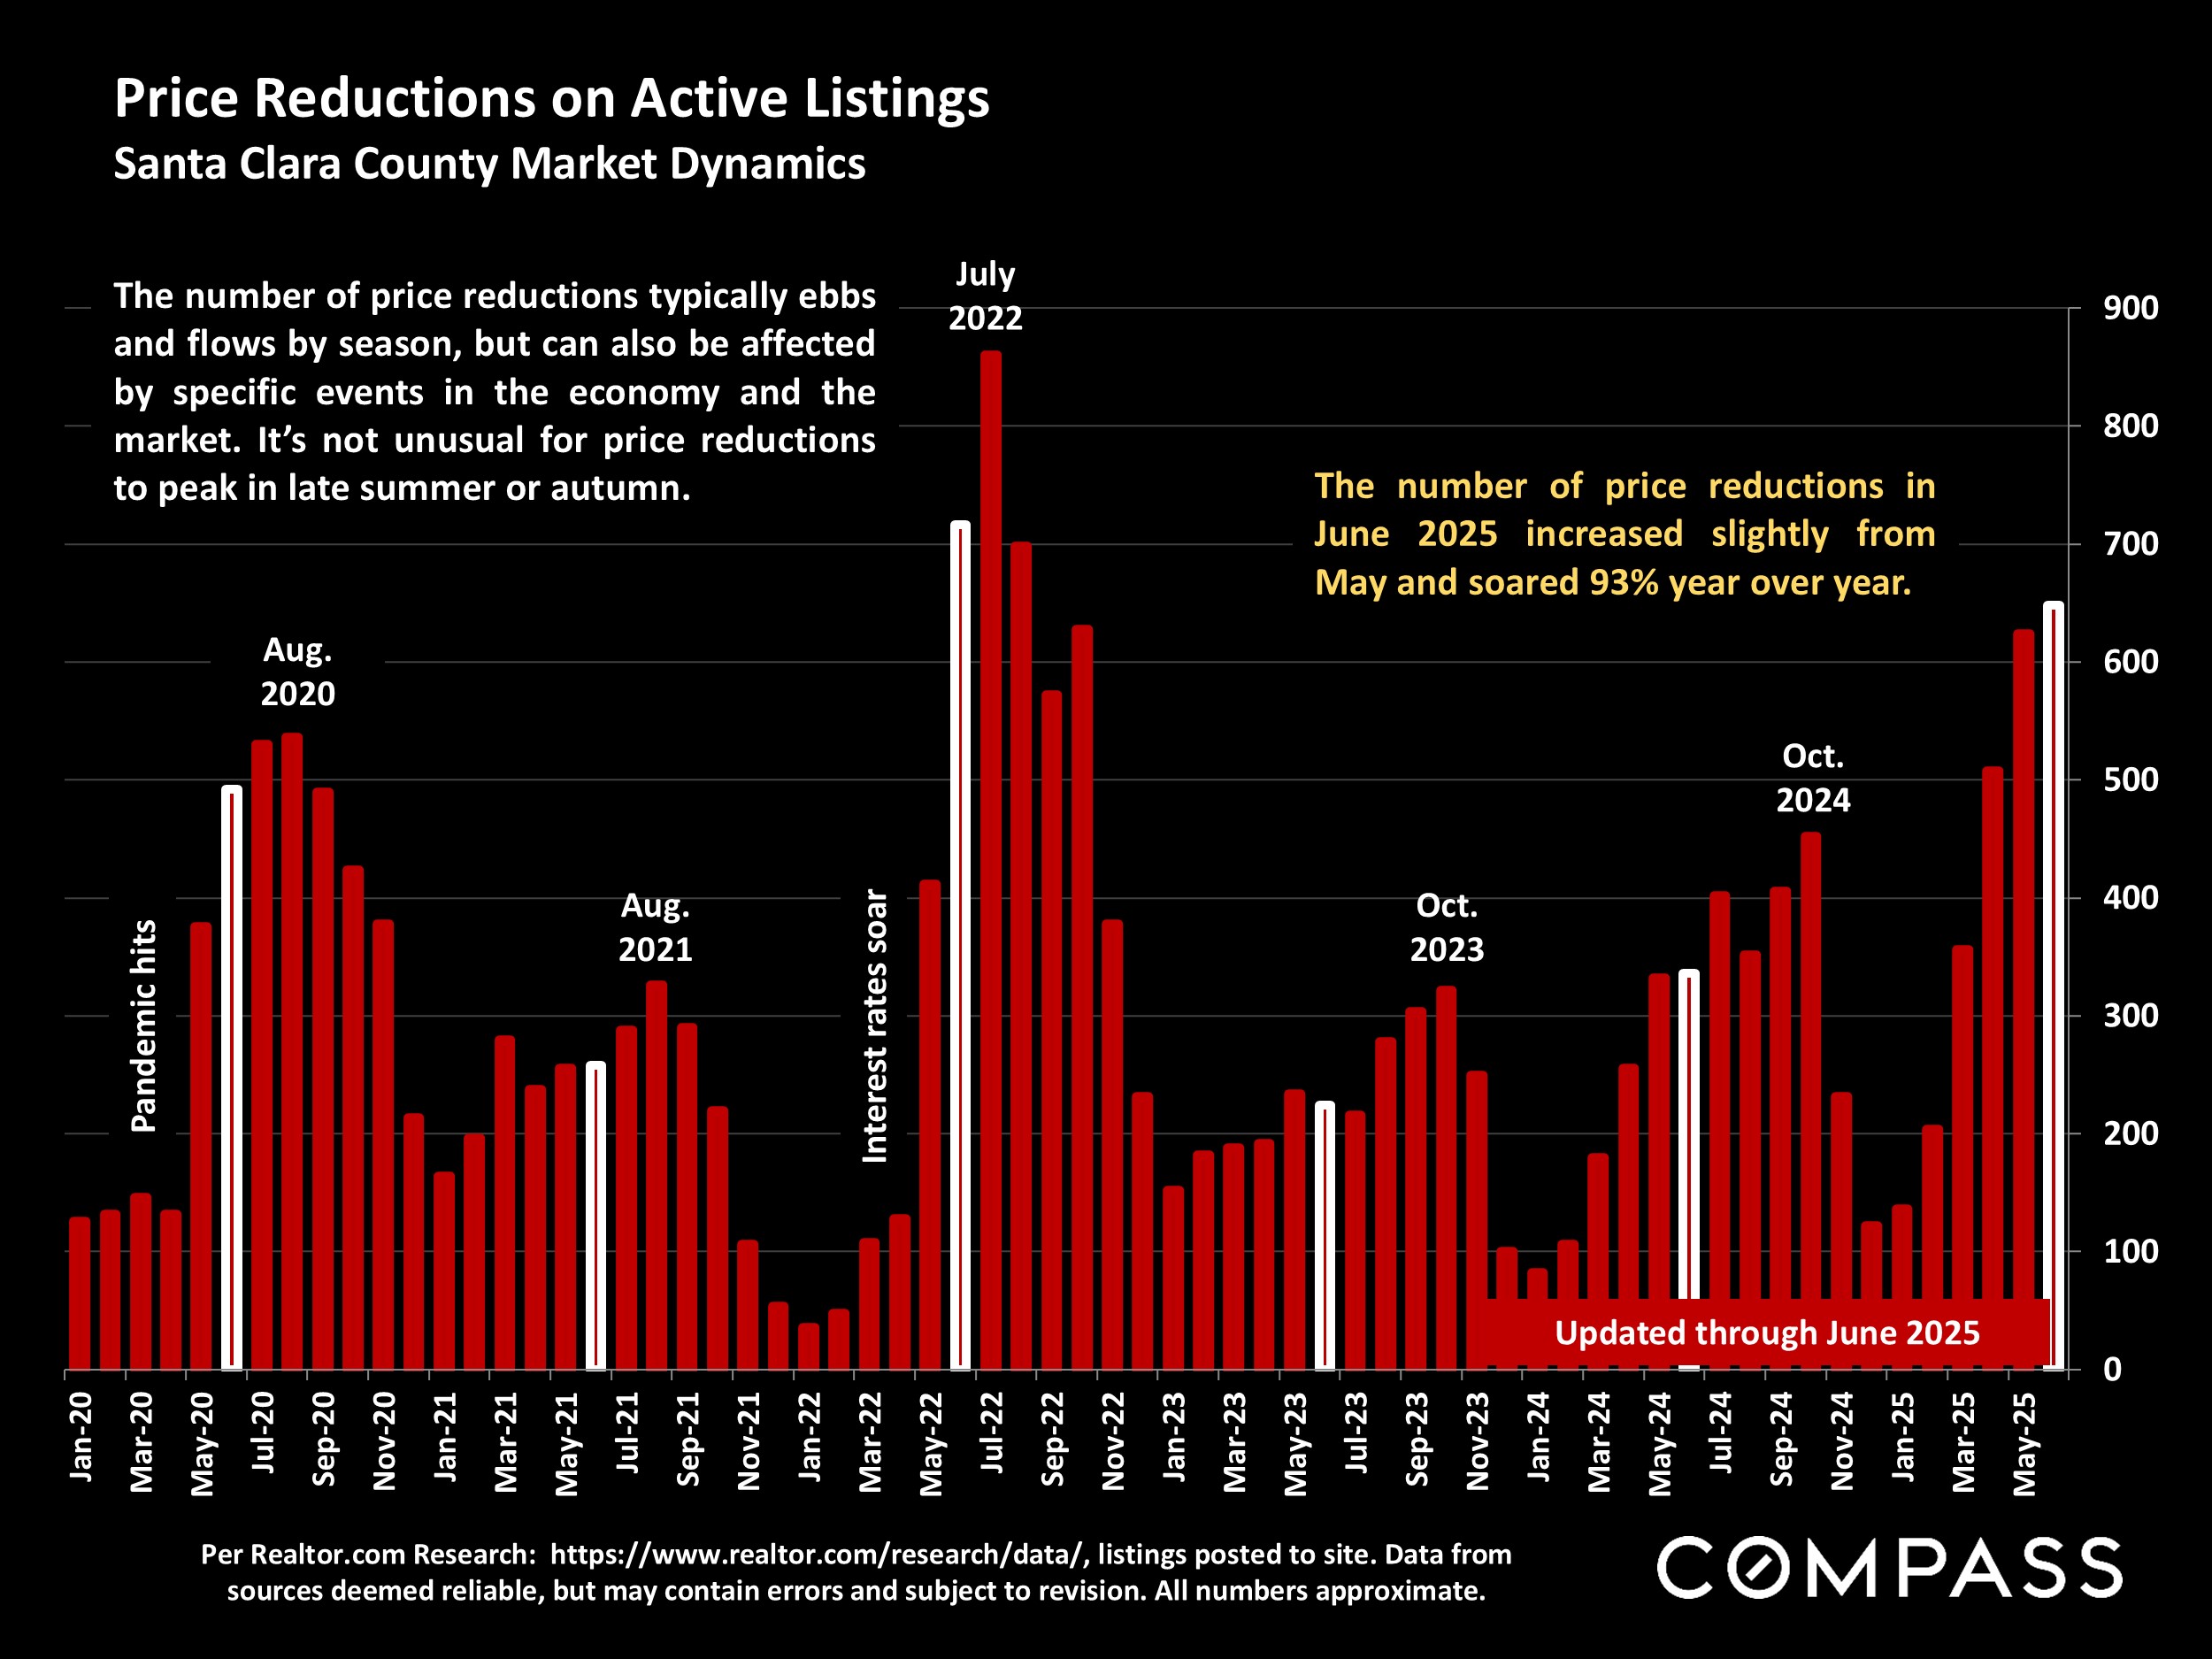
As always, correct pricing, preparation and marketing are imperatives for sellers who desire the best results. And opportunities still exist for buyers who keep a close eye on both new and older listings, monitor time-on-market and price reductions on unsold homes – or perhaps need a little bit of work – and are prepared to move quickly and aggressively.
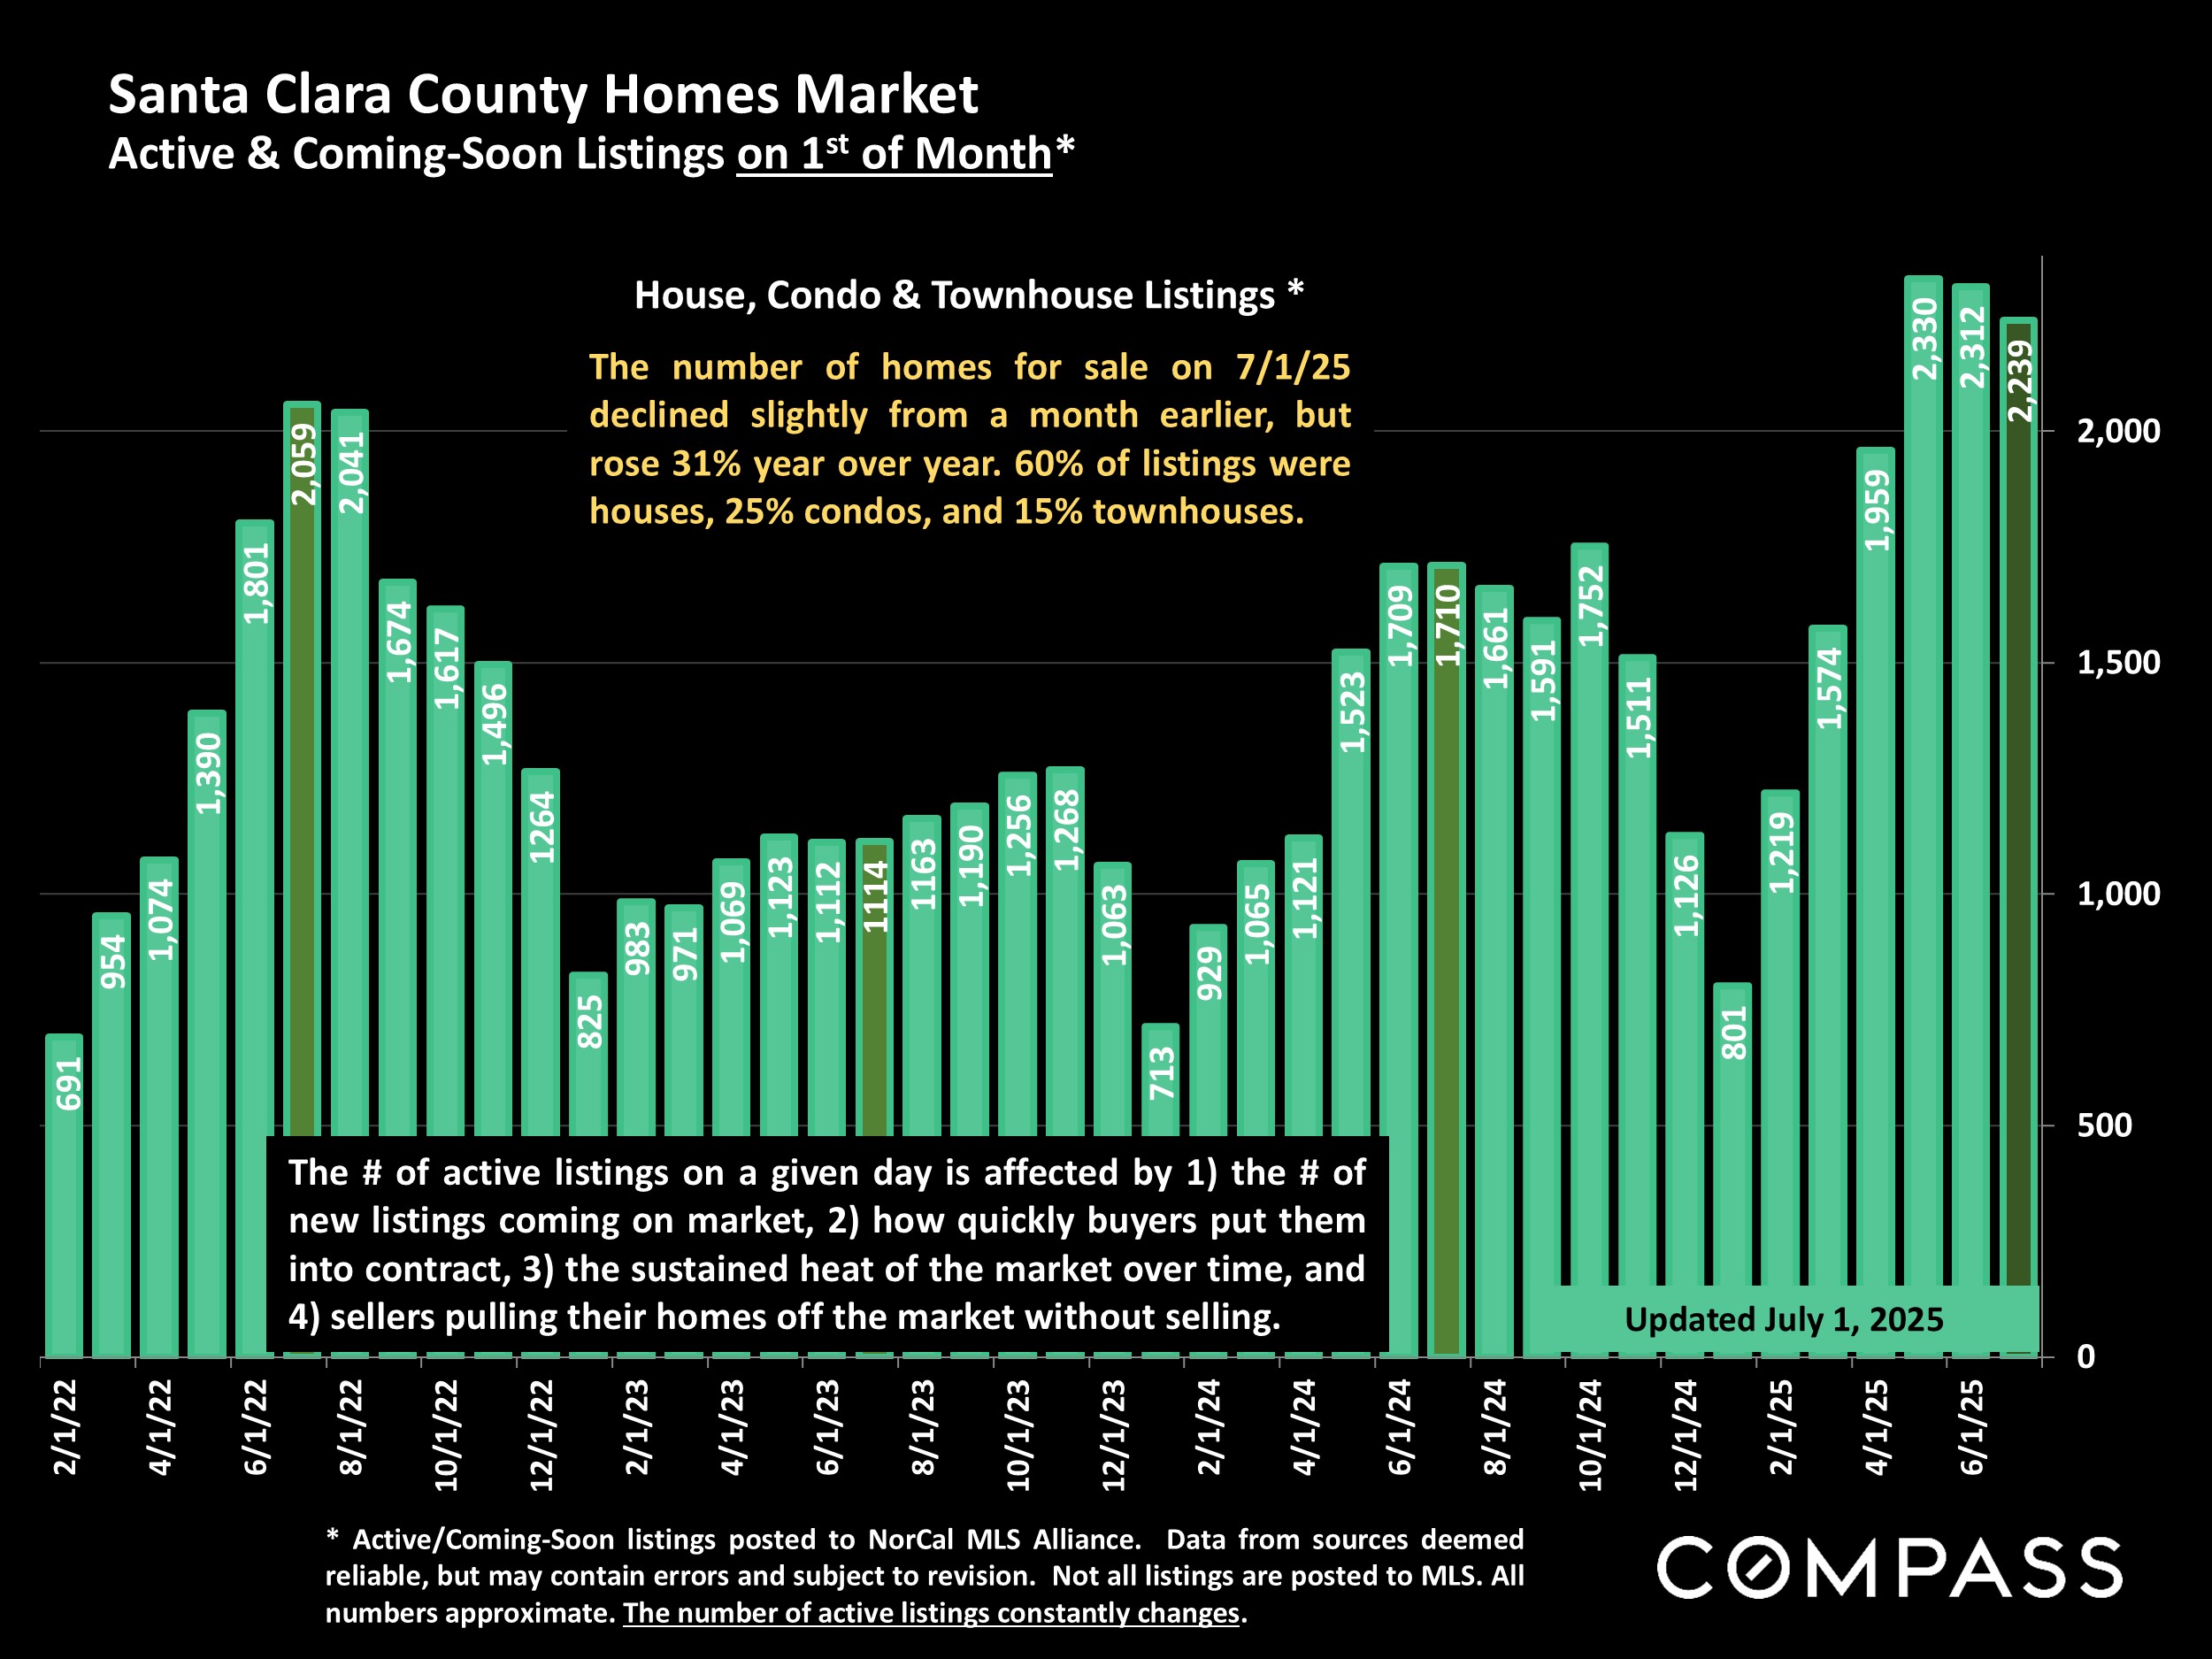
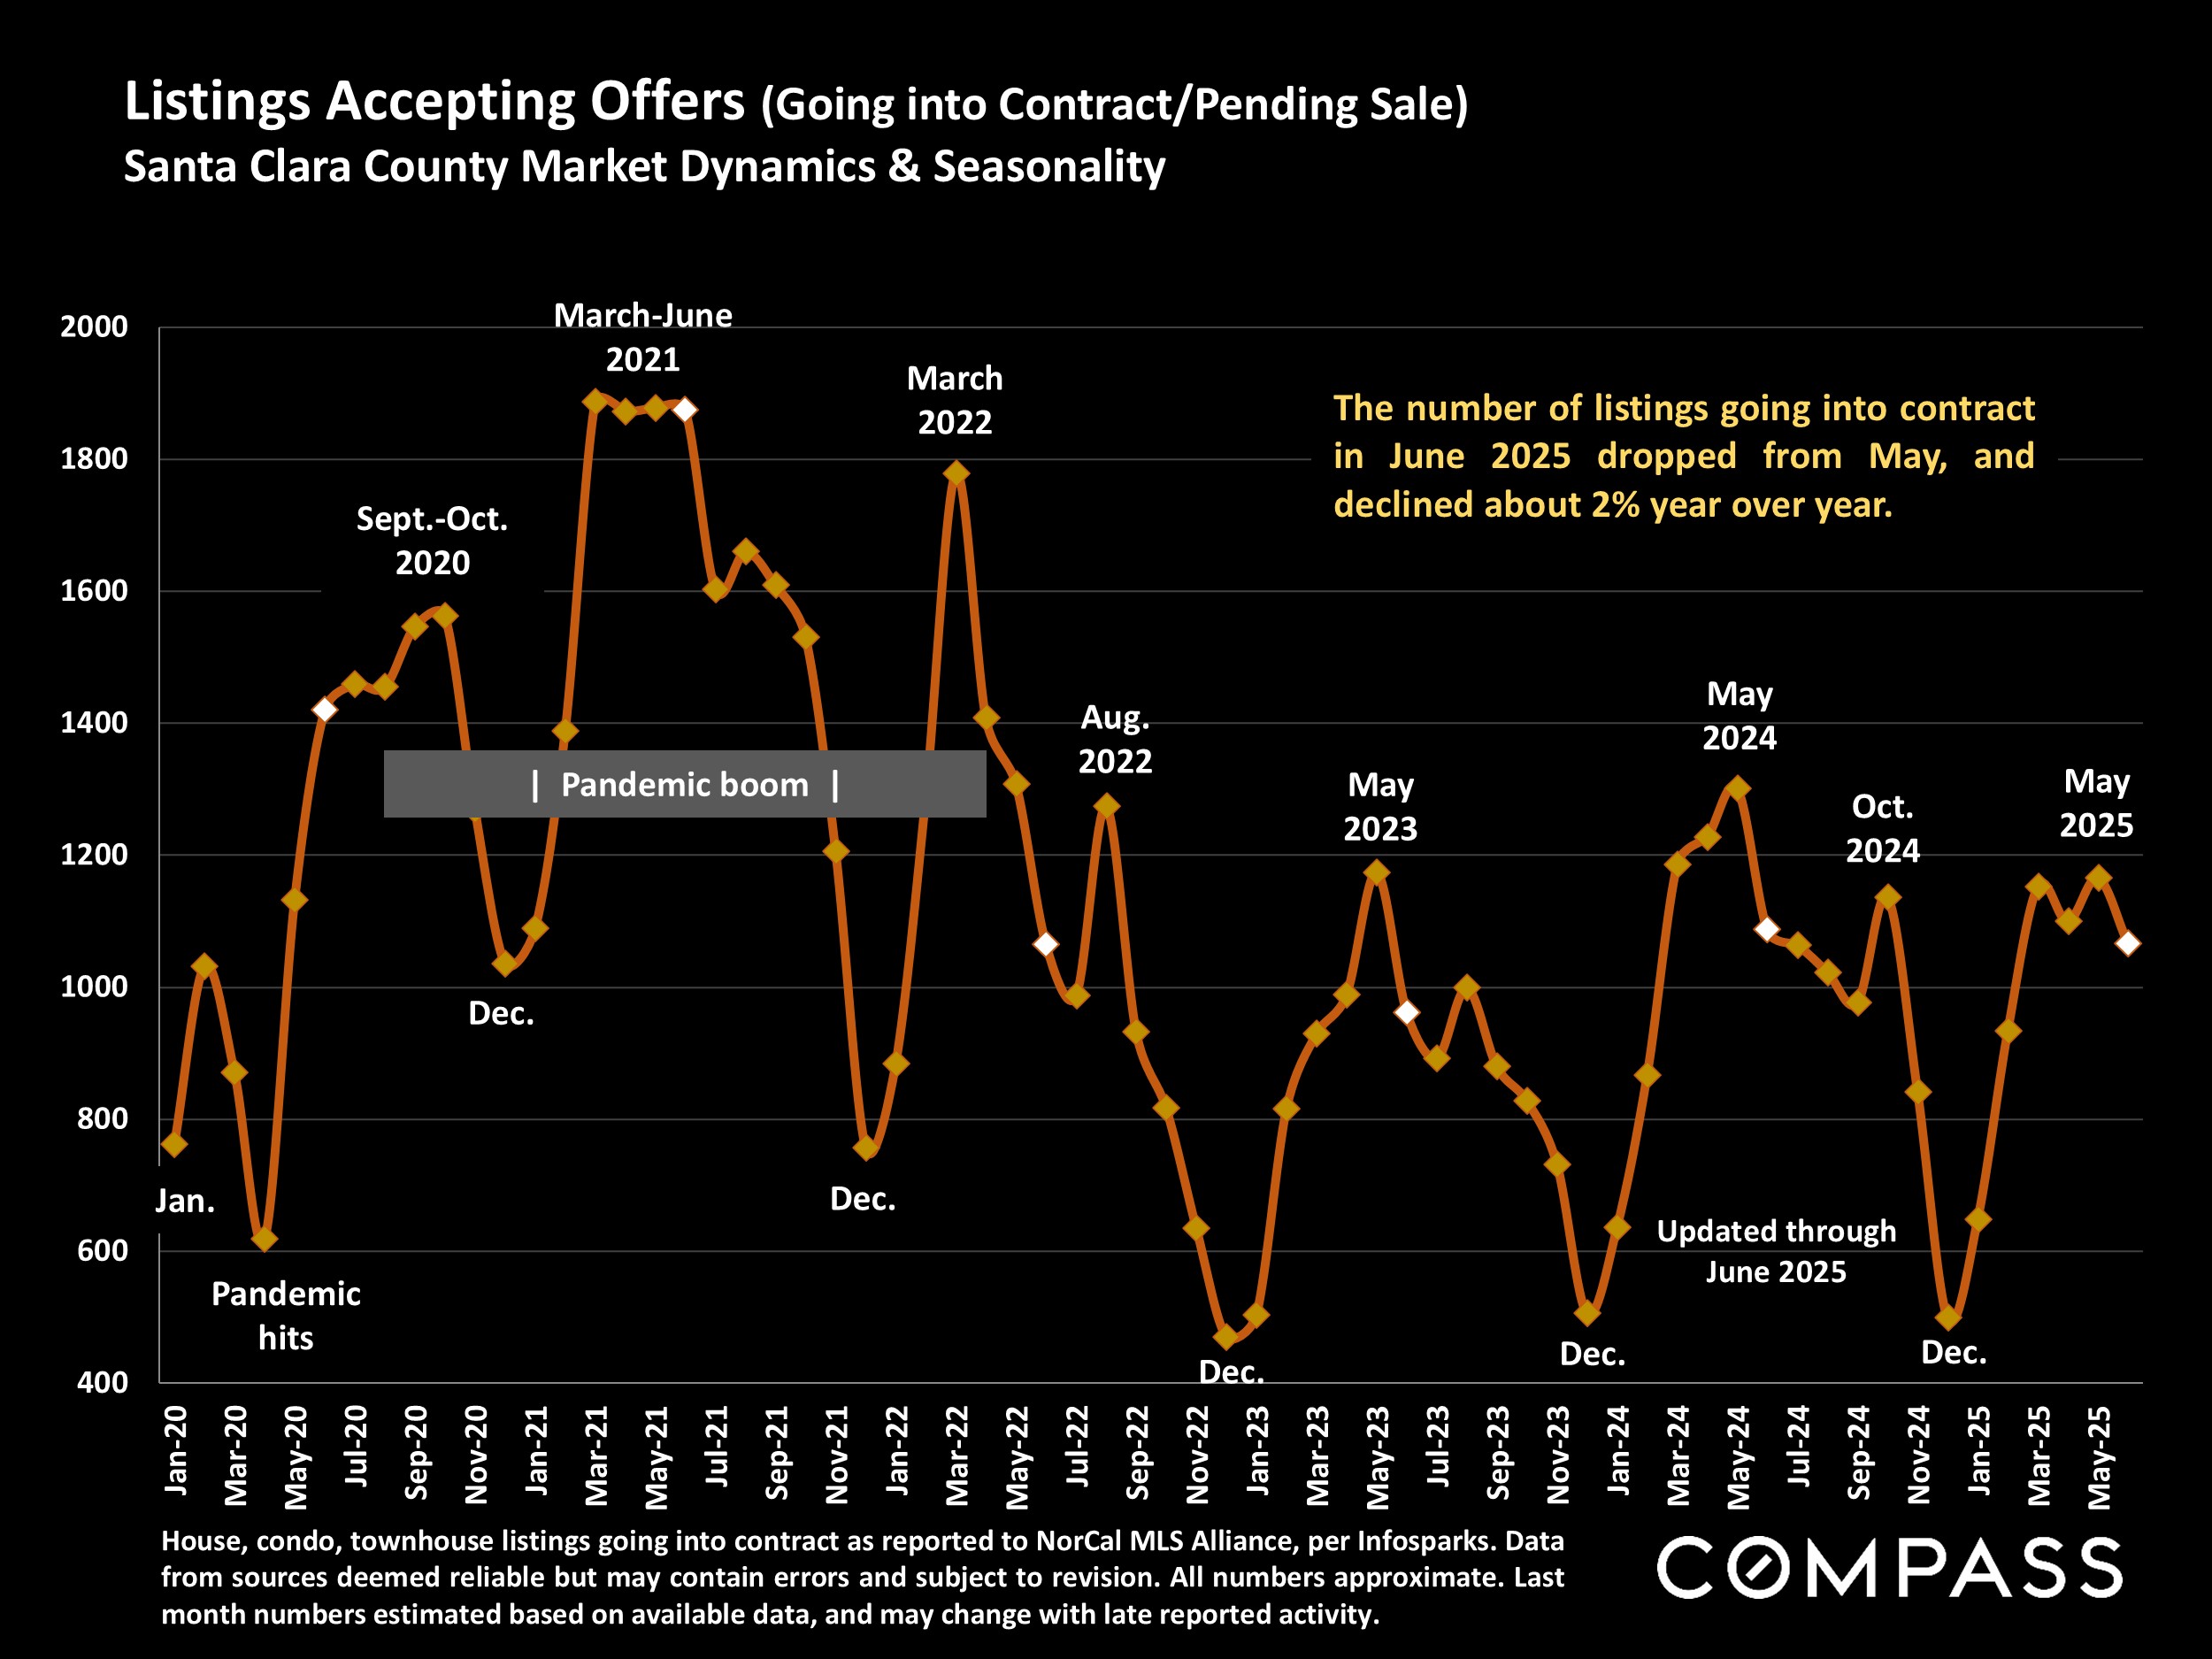
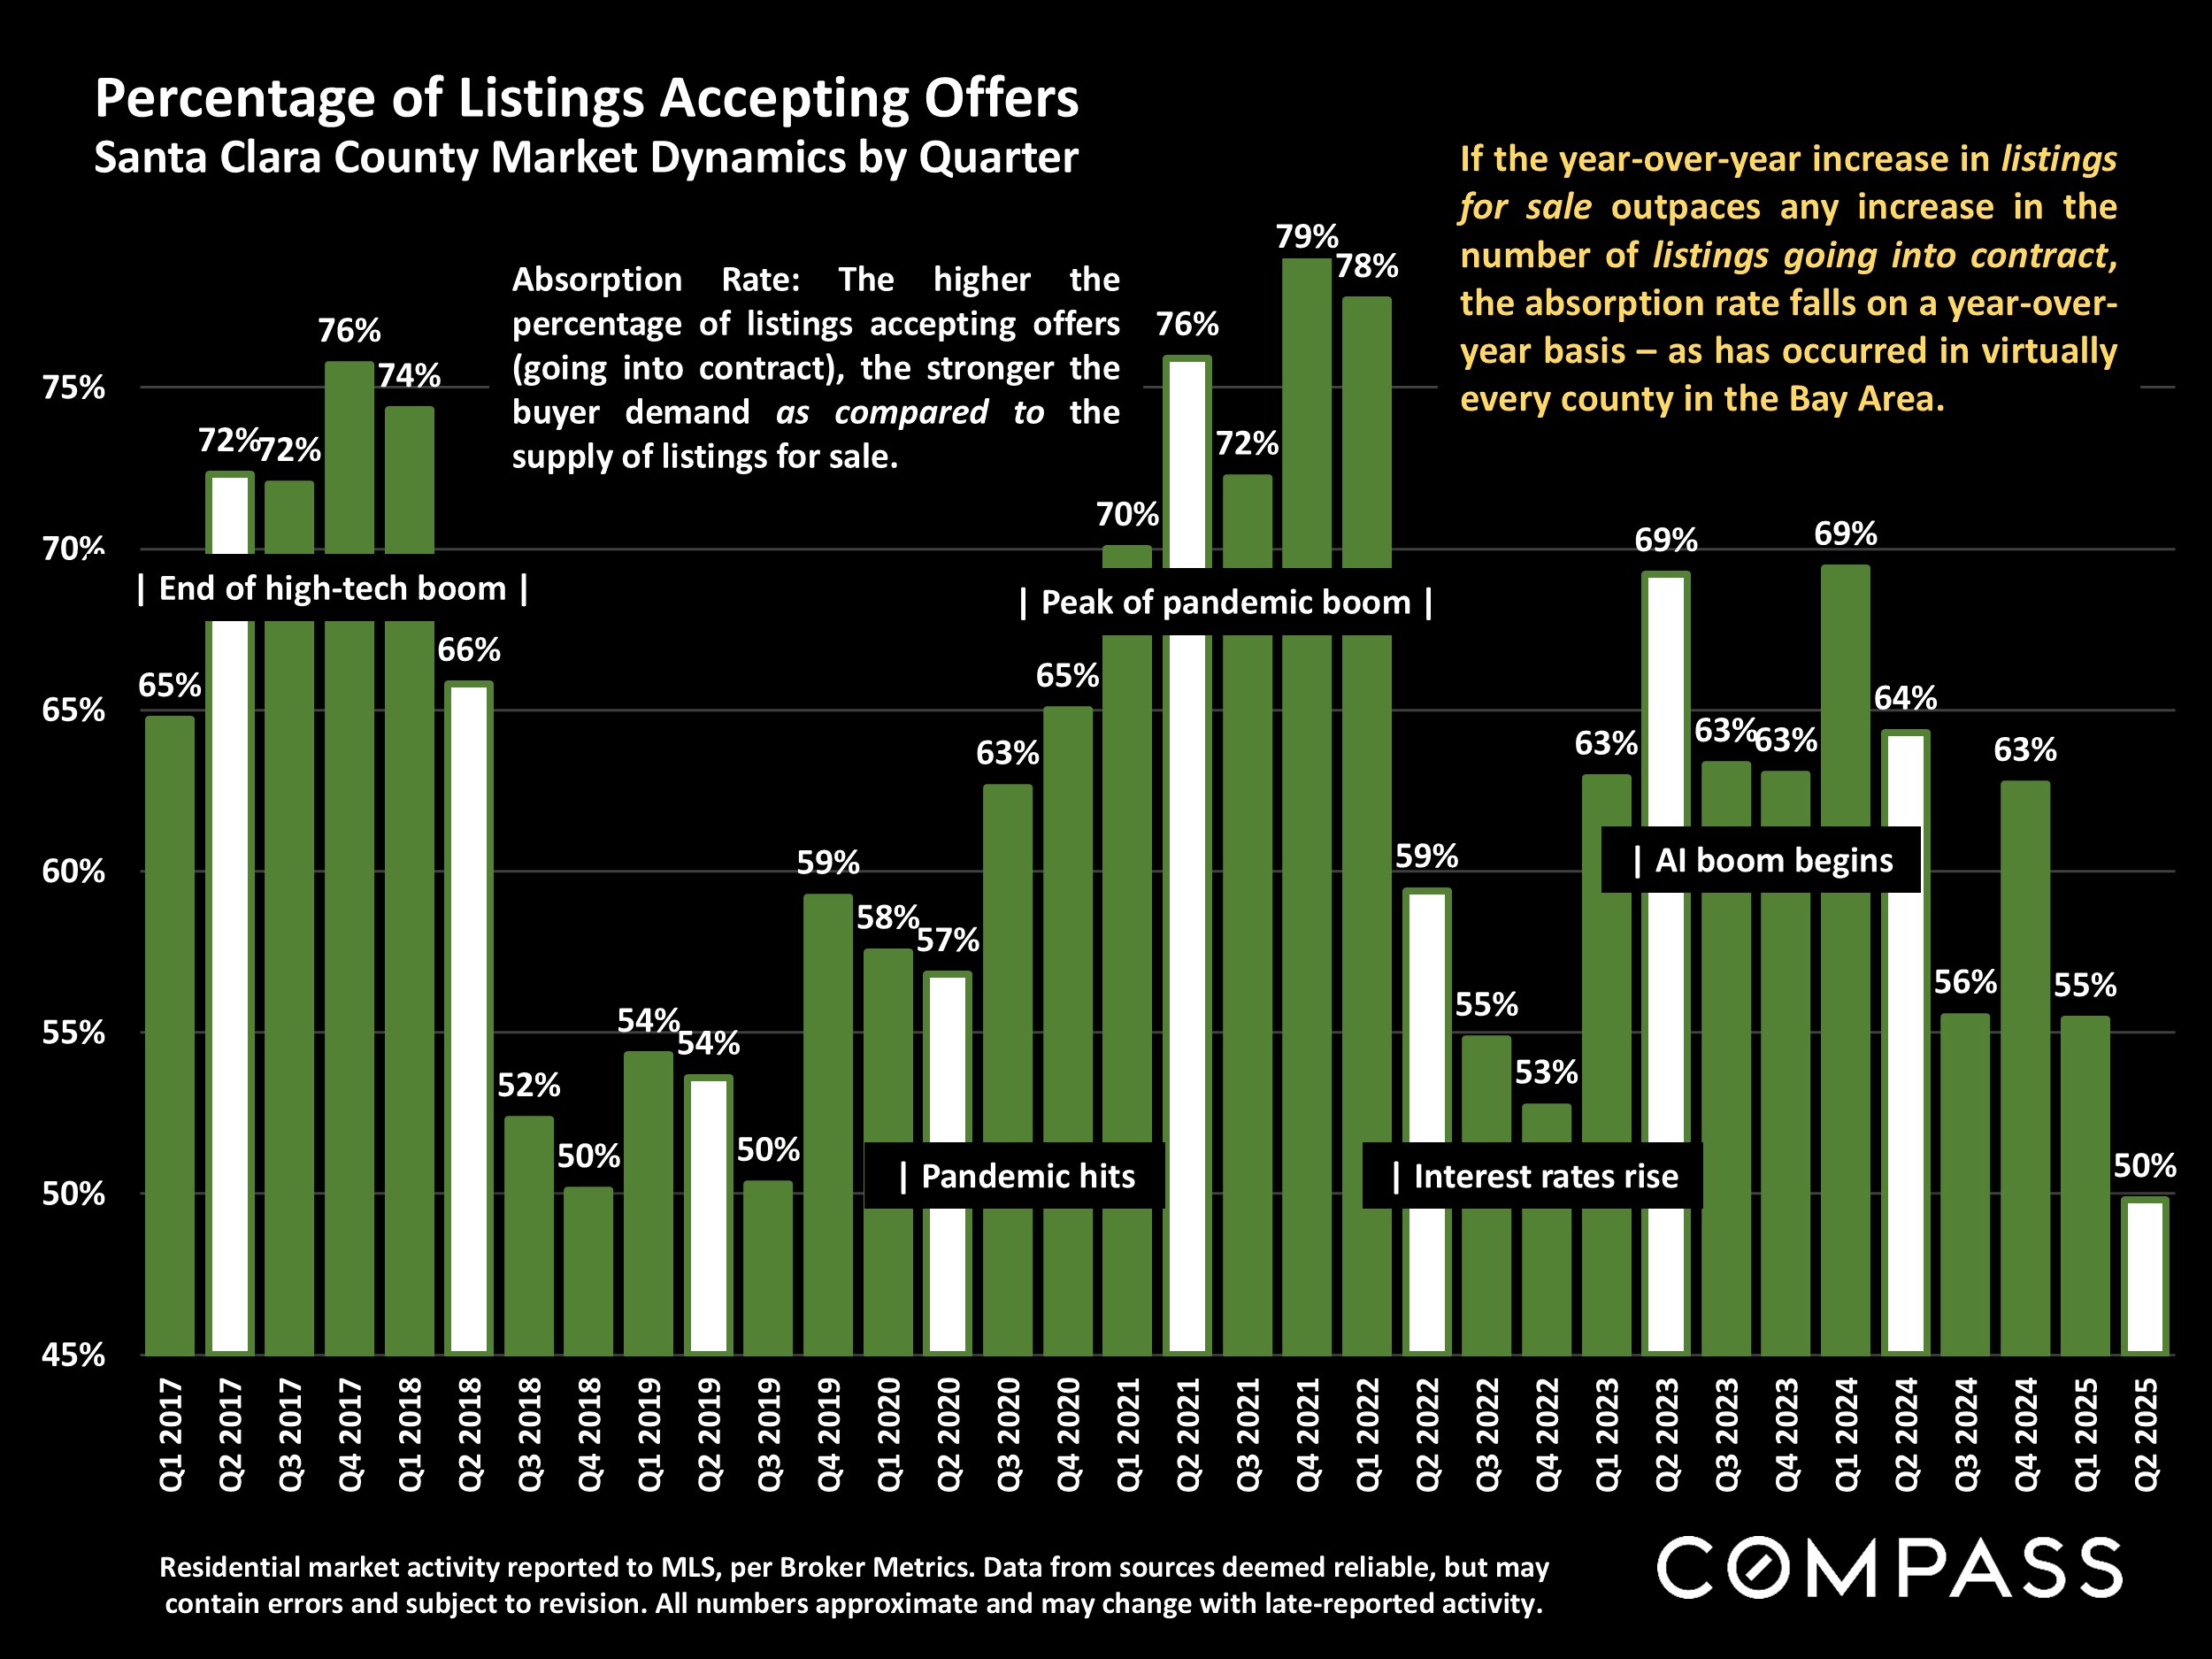
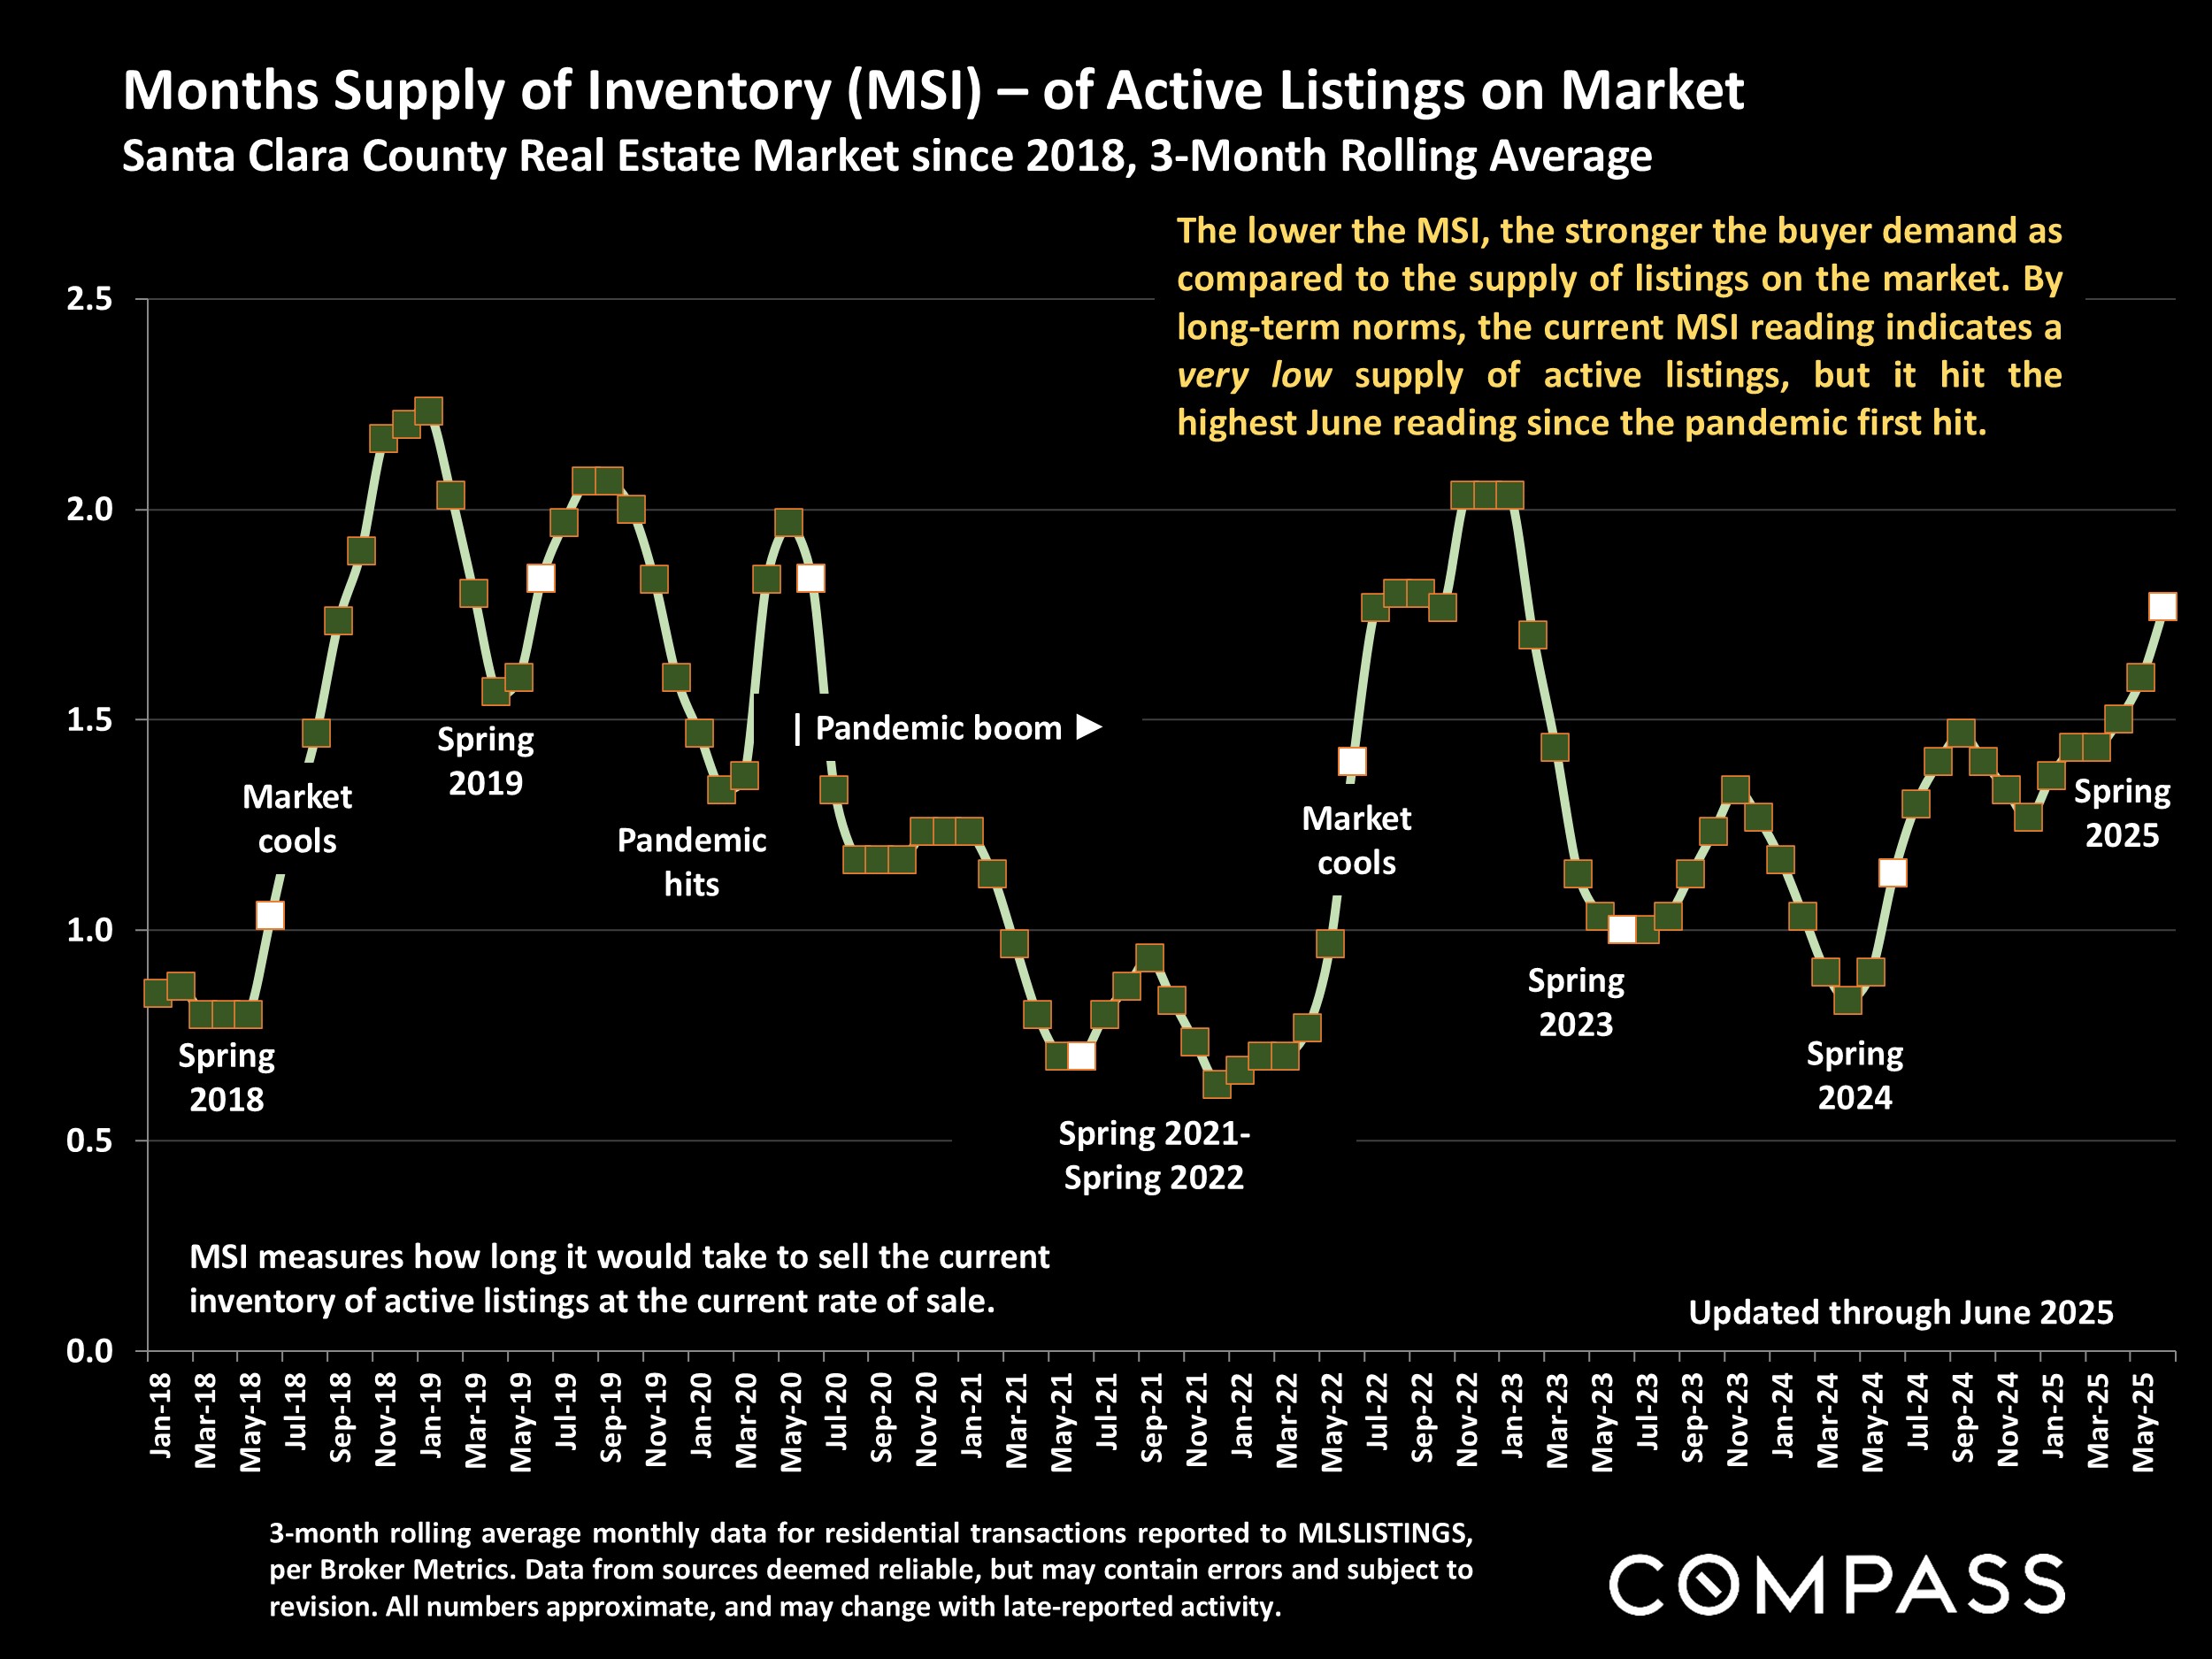
Statistics are generalities, essentially summaries of widely disparate data generated by dozens, hundreds or thousands of unique, individual sales occurring within different time periods. They are best seen not as precise measurements, but as broad, comparative indicators, with reasonable margins of error. Anomalous fluctuations in statistics are not uncommon, especially in smaller, expensive market segments. Last period data should be considered estimates that may change with late-reported data. Different analytics programs sometimes define statistics – such as “active listings,” “days on market,” and “months supply of inventory” – differently: what is most meaningful are not specific calculations but the trends they illustrate. Most listing and sales data derives from the local or regional multi-listing service (MLS) of the area specified in the analysis, but not all listings or sales are reported to MLS and these won’t be reflected in the data. “Homes” signifies real-property, single-household housing units: houses, condos, co-ops, townhouses, duets and TICs (but not mobile homes), as applicable to each market. City/town names refer specifically to the named cities and towns, unless otherwise delineated. Multi-county metro areas will be specified as such. Data from sources deemed reliable, but may contain errors and subject to revision. All numbers to be considered approximate.
Many aspects of value cannot be adequately reflected in median and average statistics: curb appeal, age, condition, amenities, views, lot size, quality of outdoor space, “bonus” rooms, additional parking, quality of location within the neighborhood, and so on. How any of these statistics apply to any particular home is unknown without a specific comparative market analysis.
Median Sales Price is that price at which half the properties sold for more and half for less. It may be affected by seasonality, “unusual” events, or changes in inventory and buying trends, as well as by changes in fair market value. The median sales price for an area will often conceal an enormous variety of sales prices in the underlying individual sales.
Dollar per Square Foot is based upon the home’s interior living space and does not include garages, unfinished attics and basements, rooms built without permit, patios, decks or yards (though all those can add value to a home). These figures are usually derived from appraisals or tax records, but are sometimes unreliable (especially for older homes) or unreported altogether. The calculation can only be made on those home sales that reported square footage.