Shrugging Off War, Buyer Demand Continues to Strengthen Moving Deeper into Spring
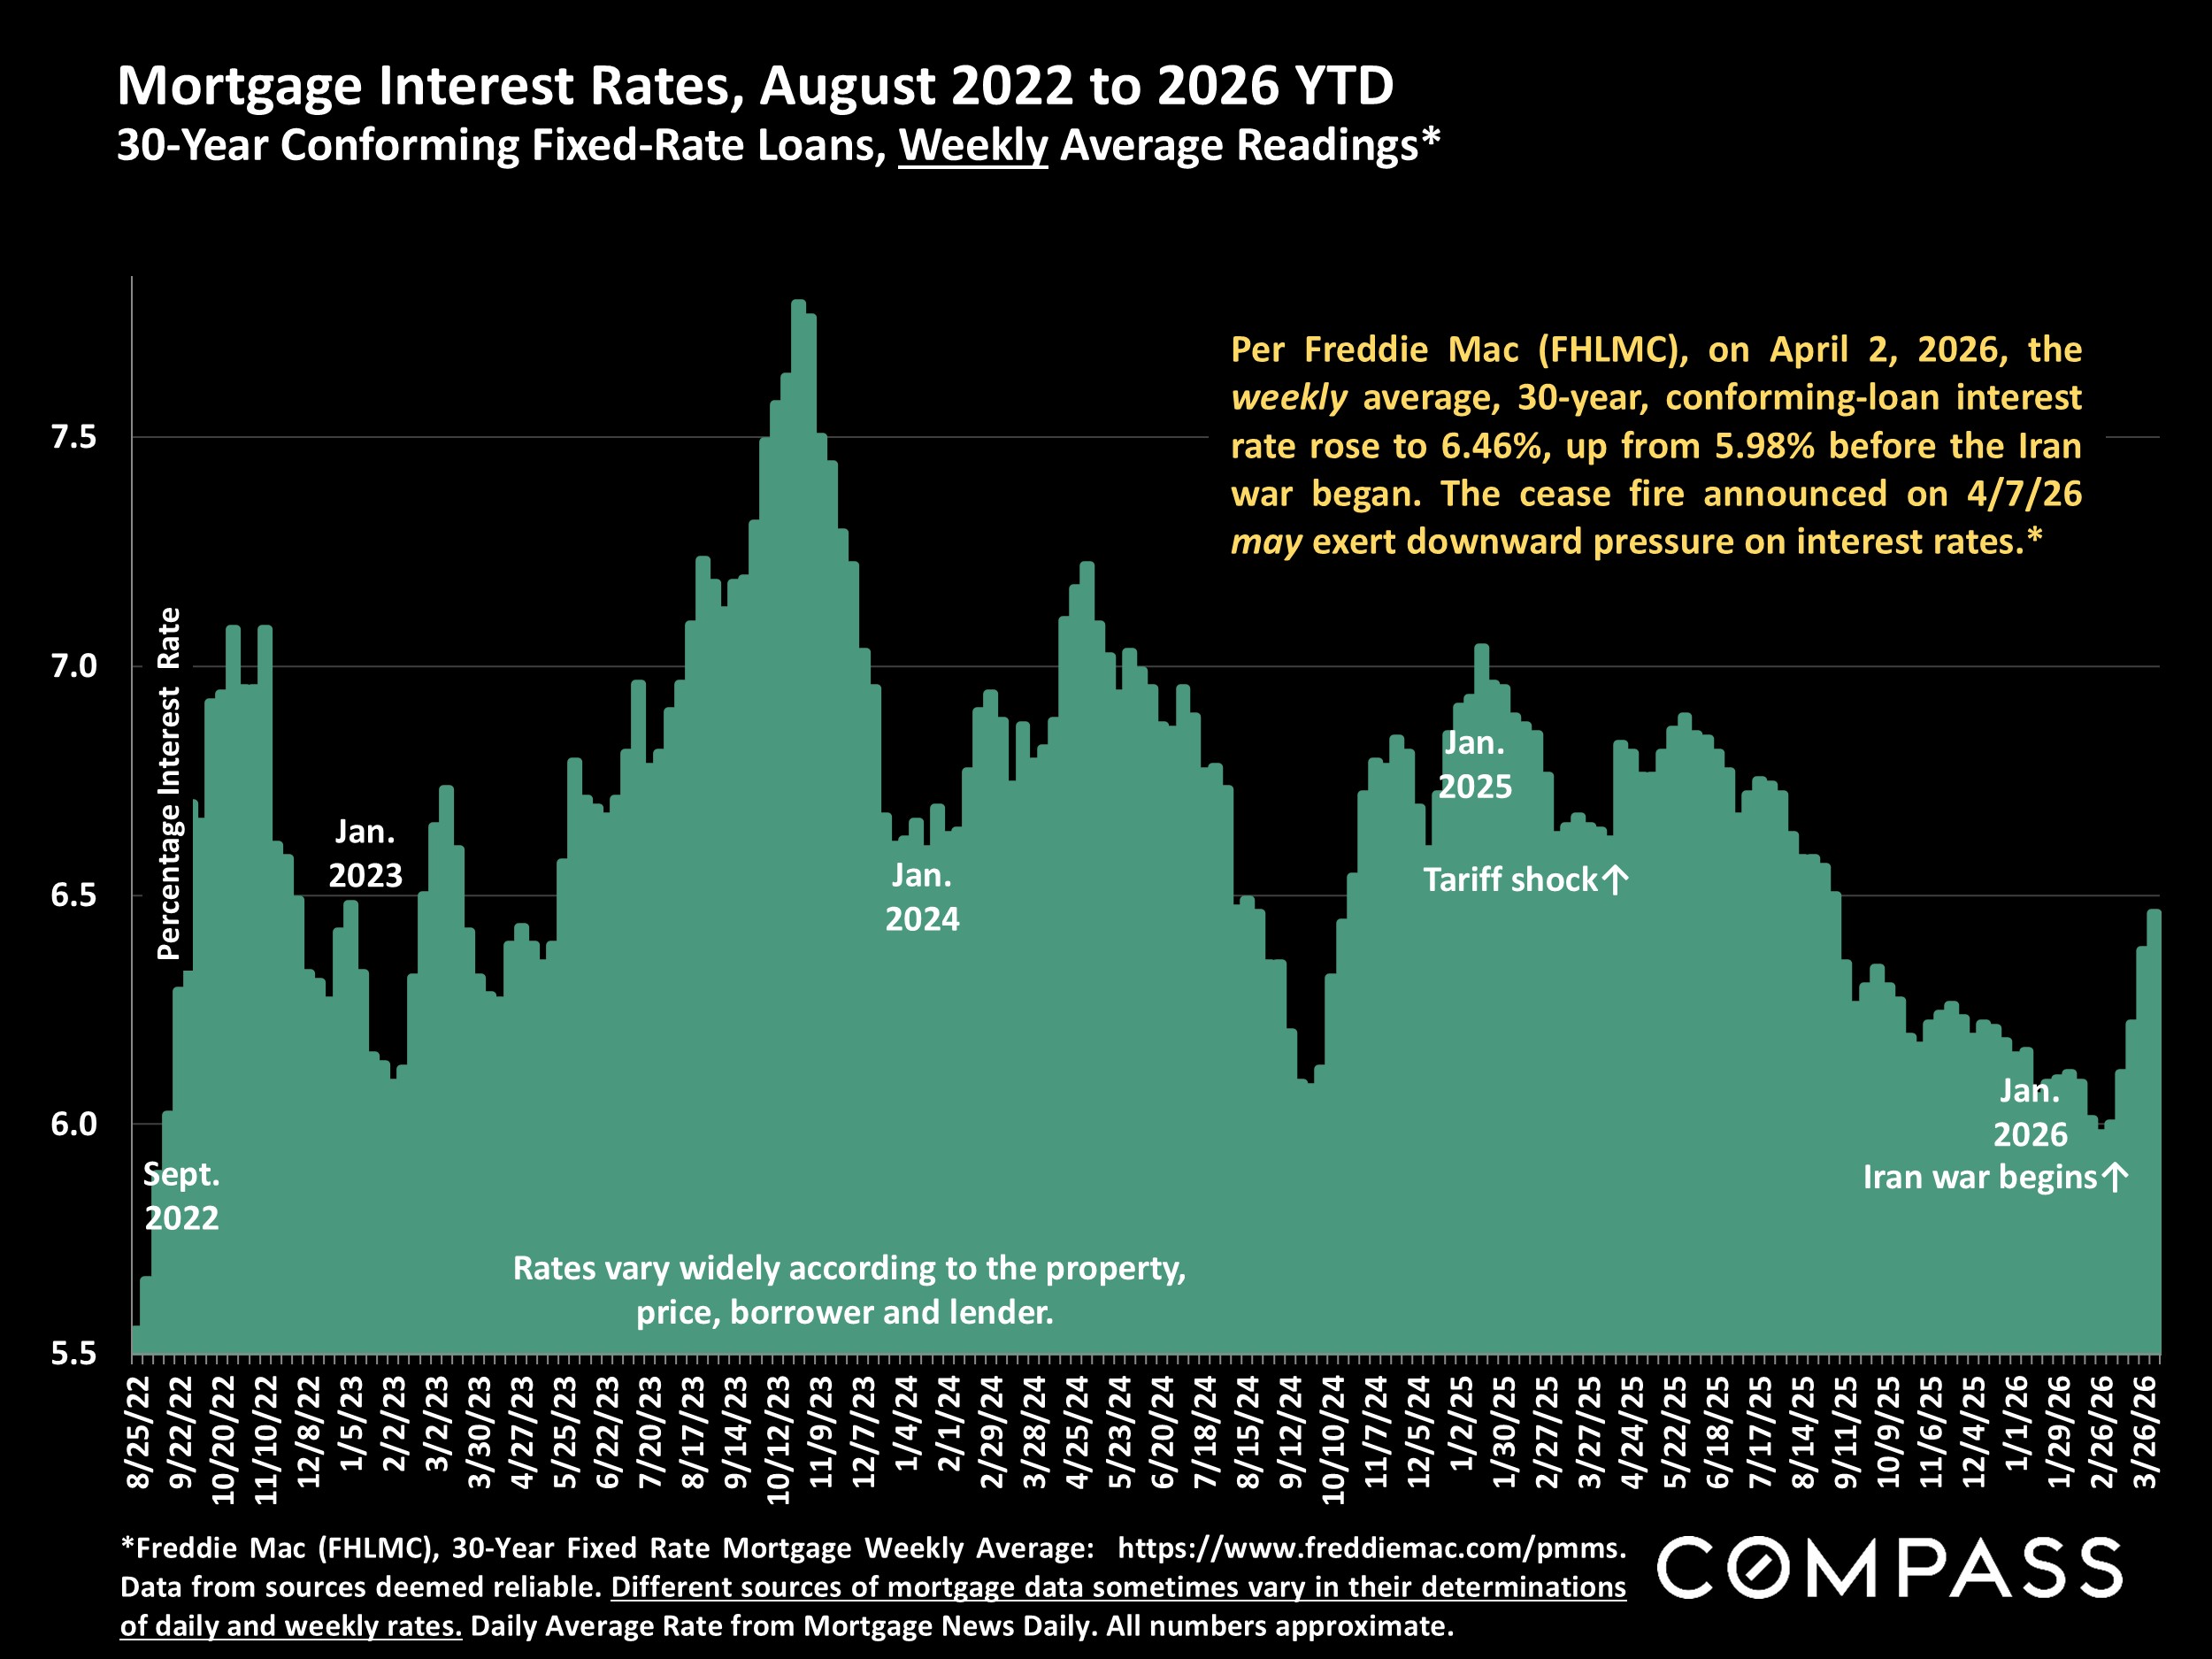
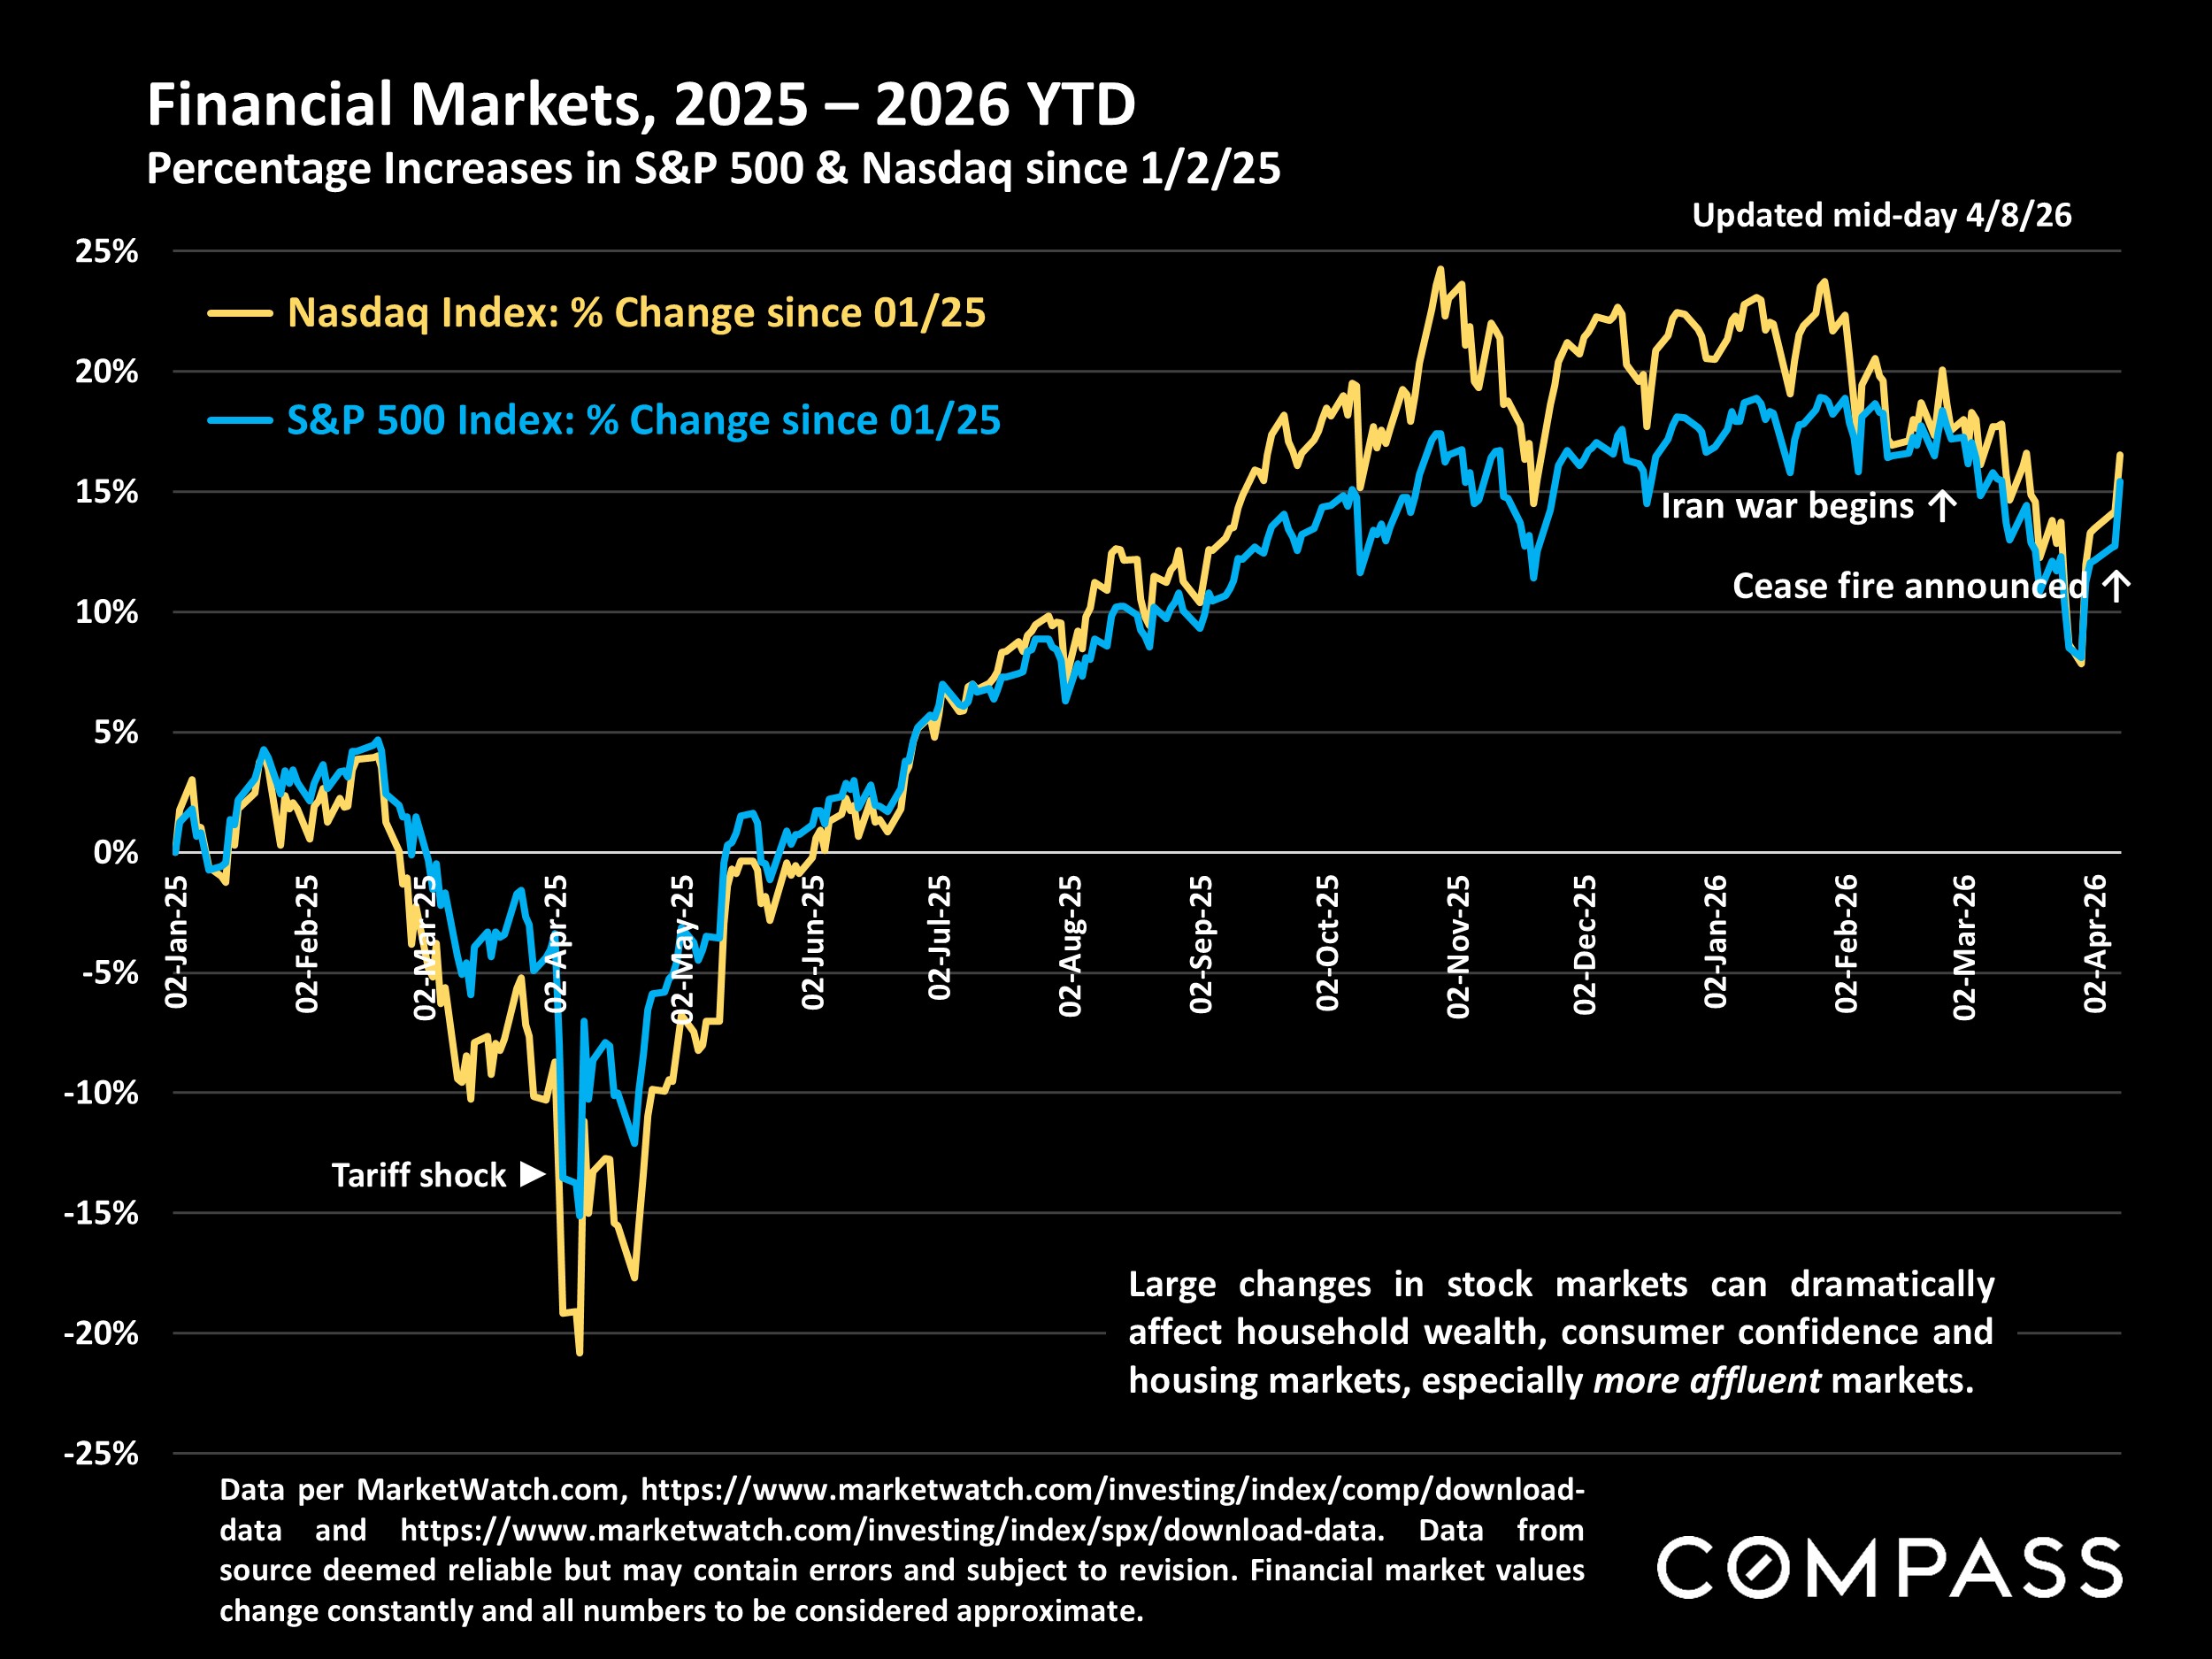
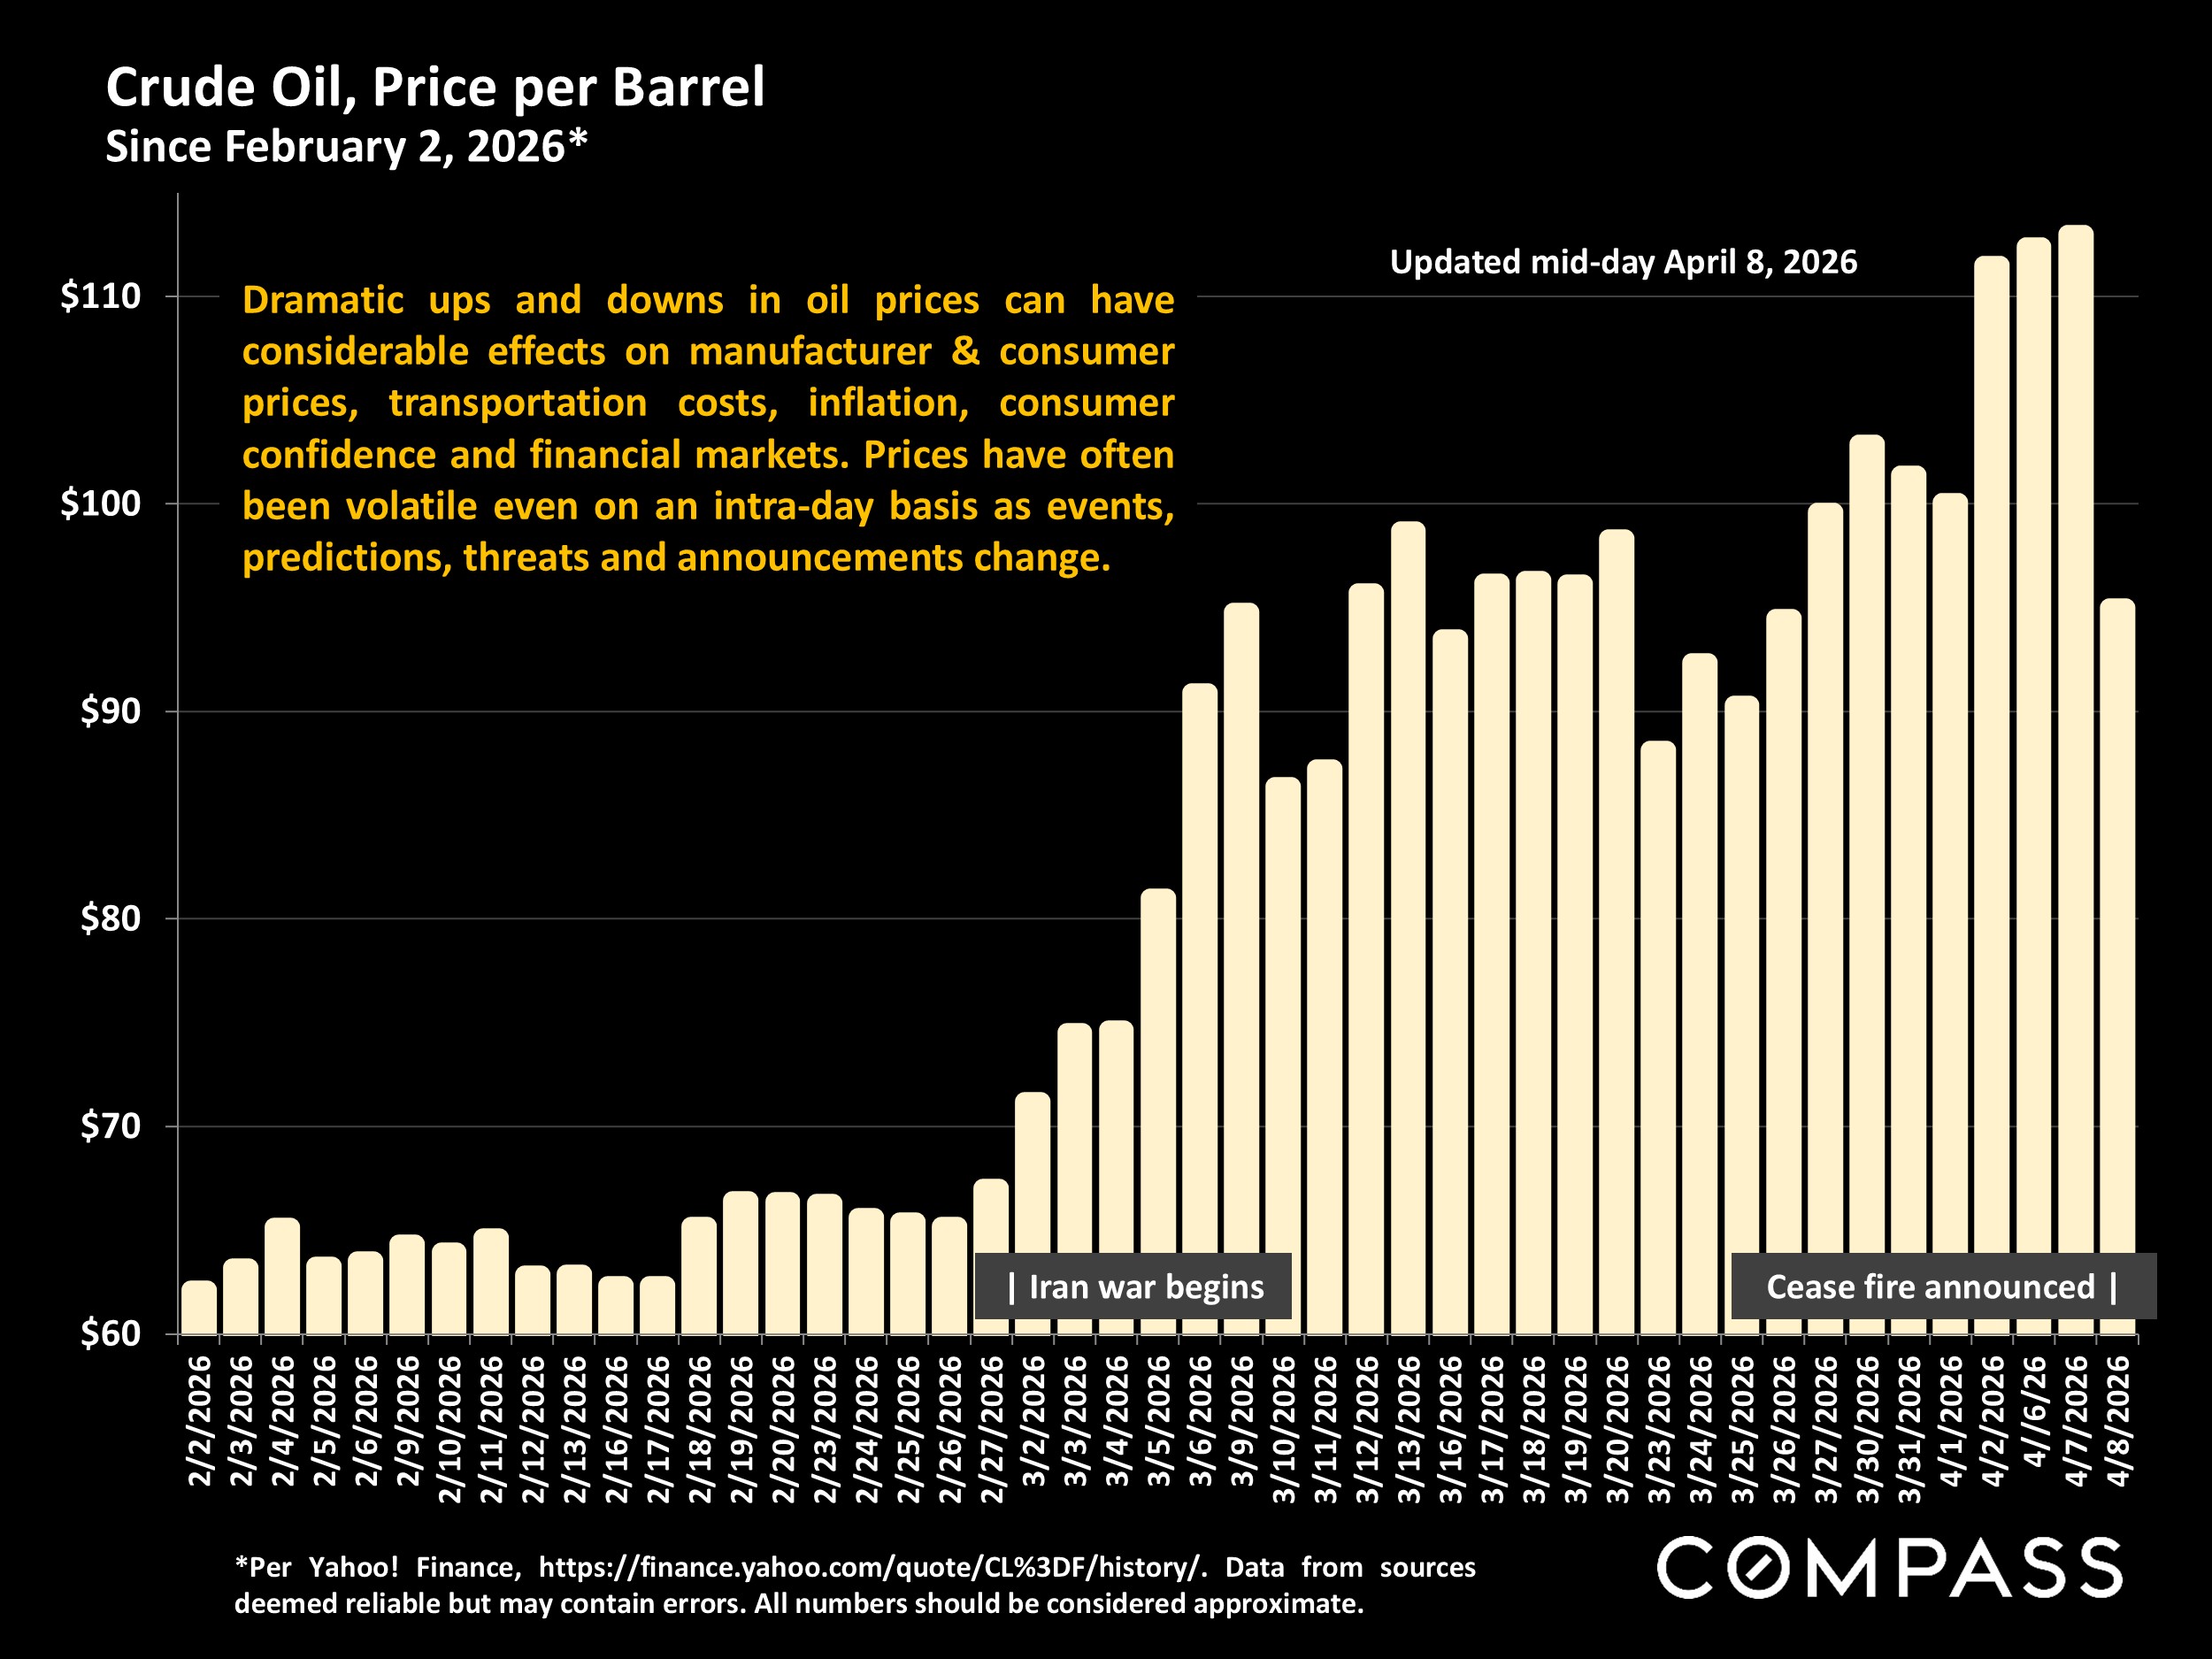
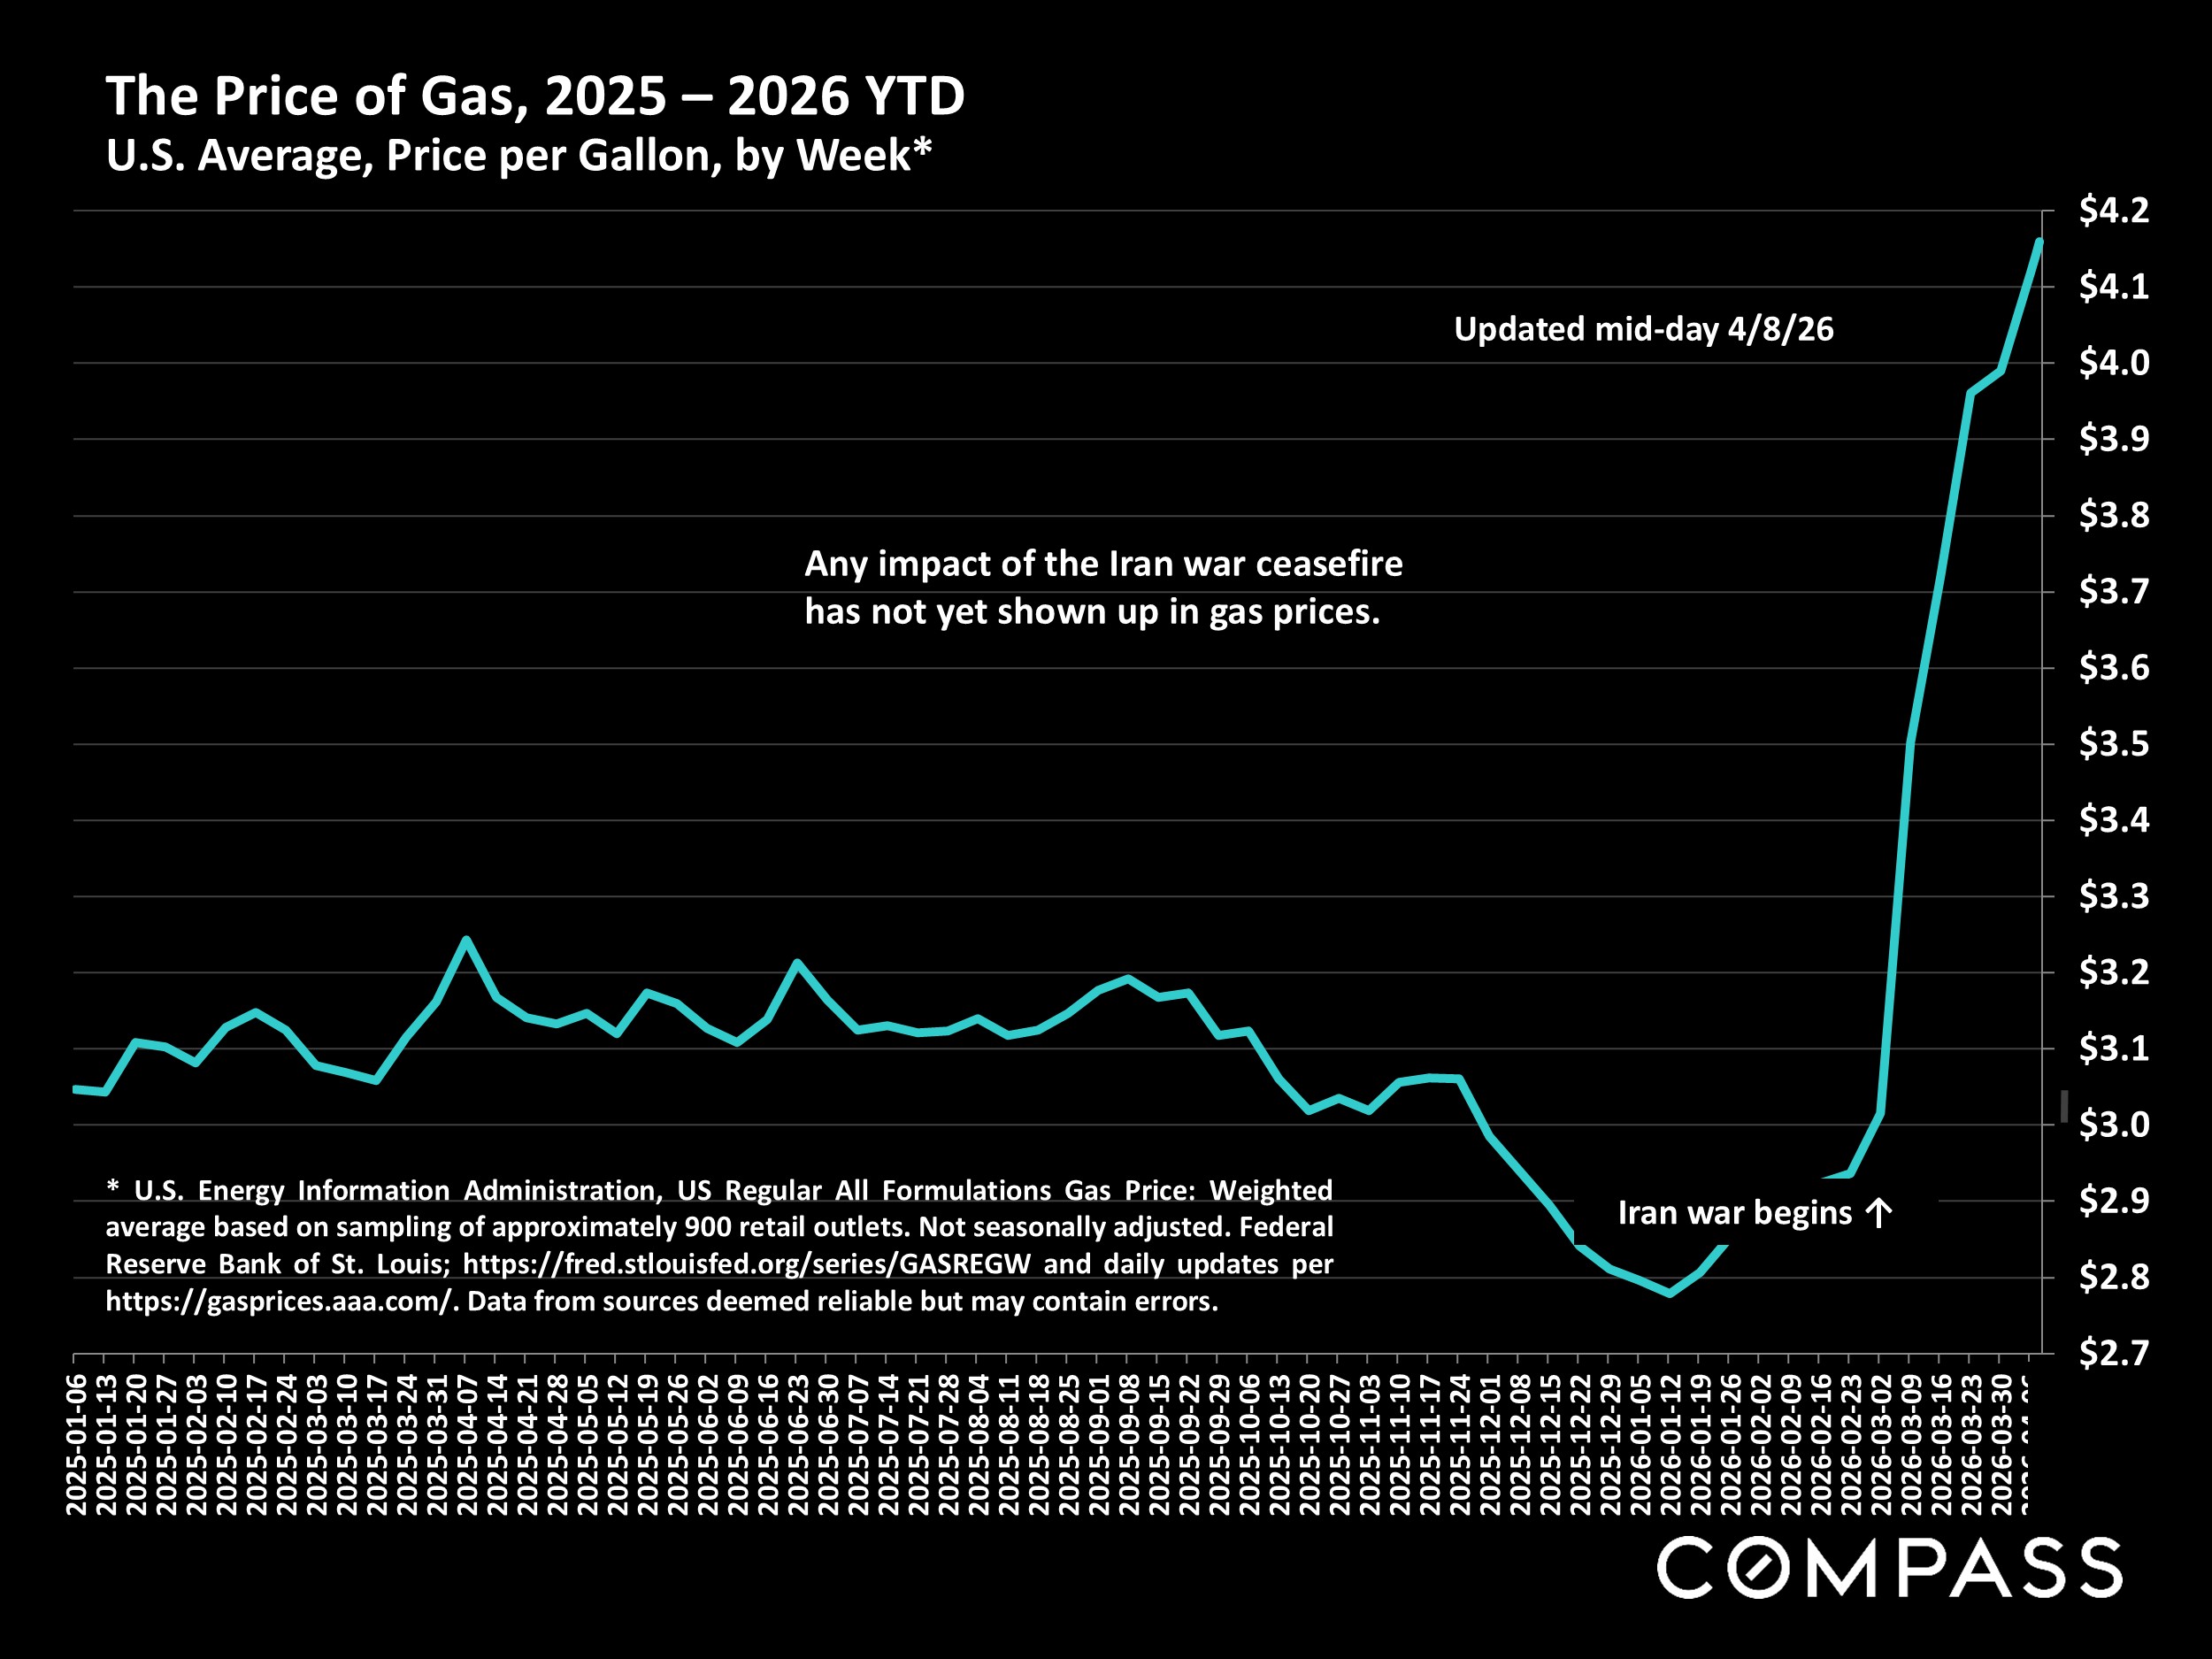
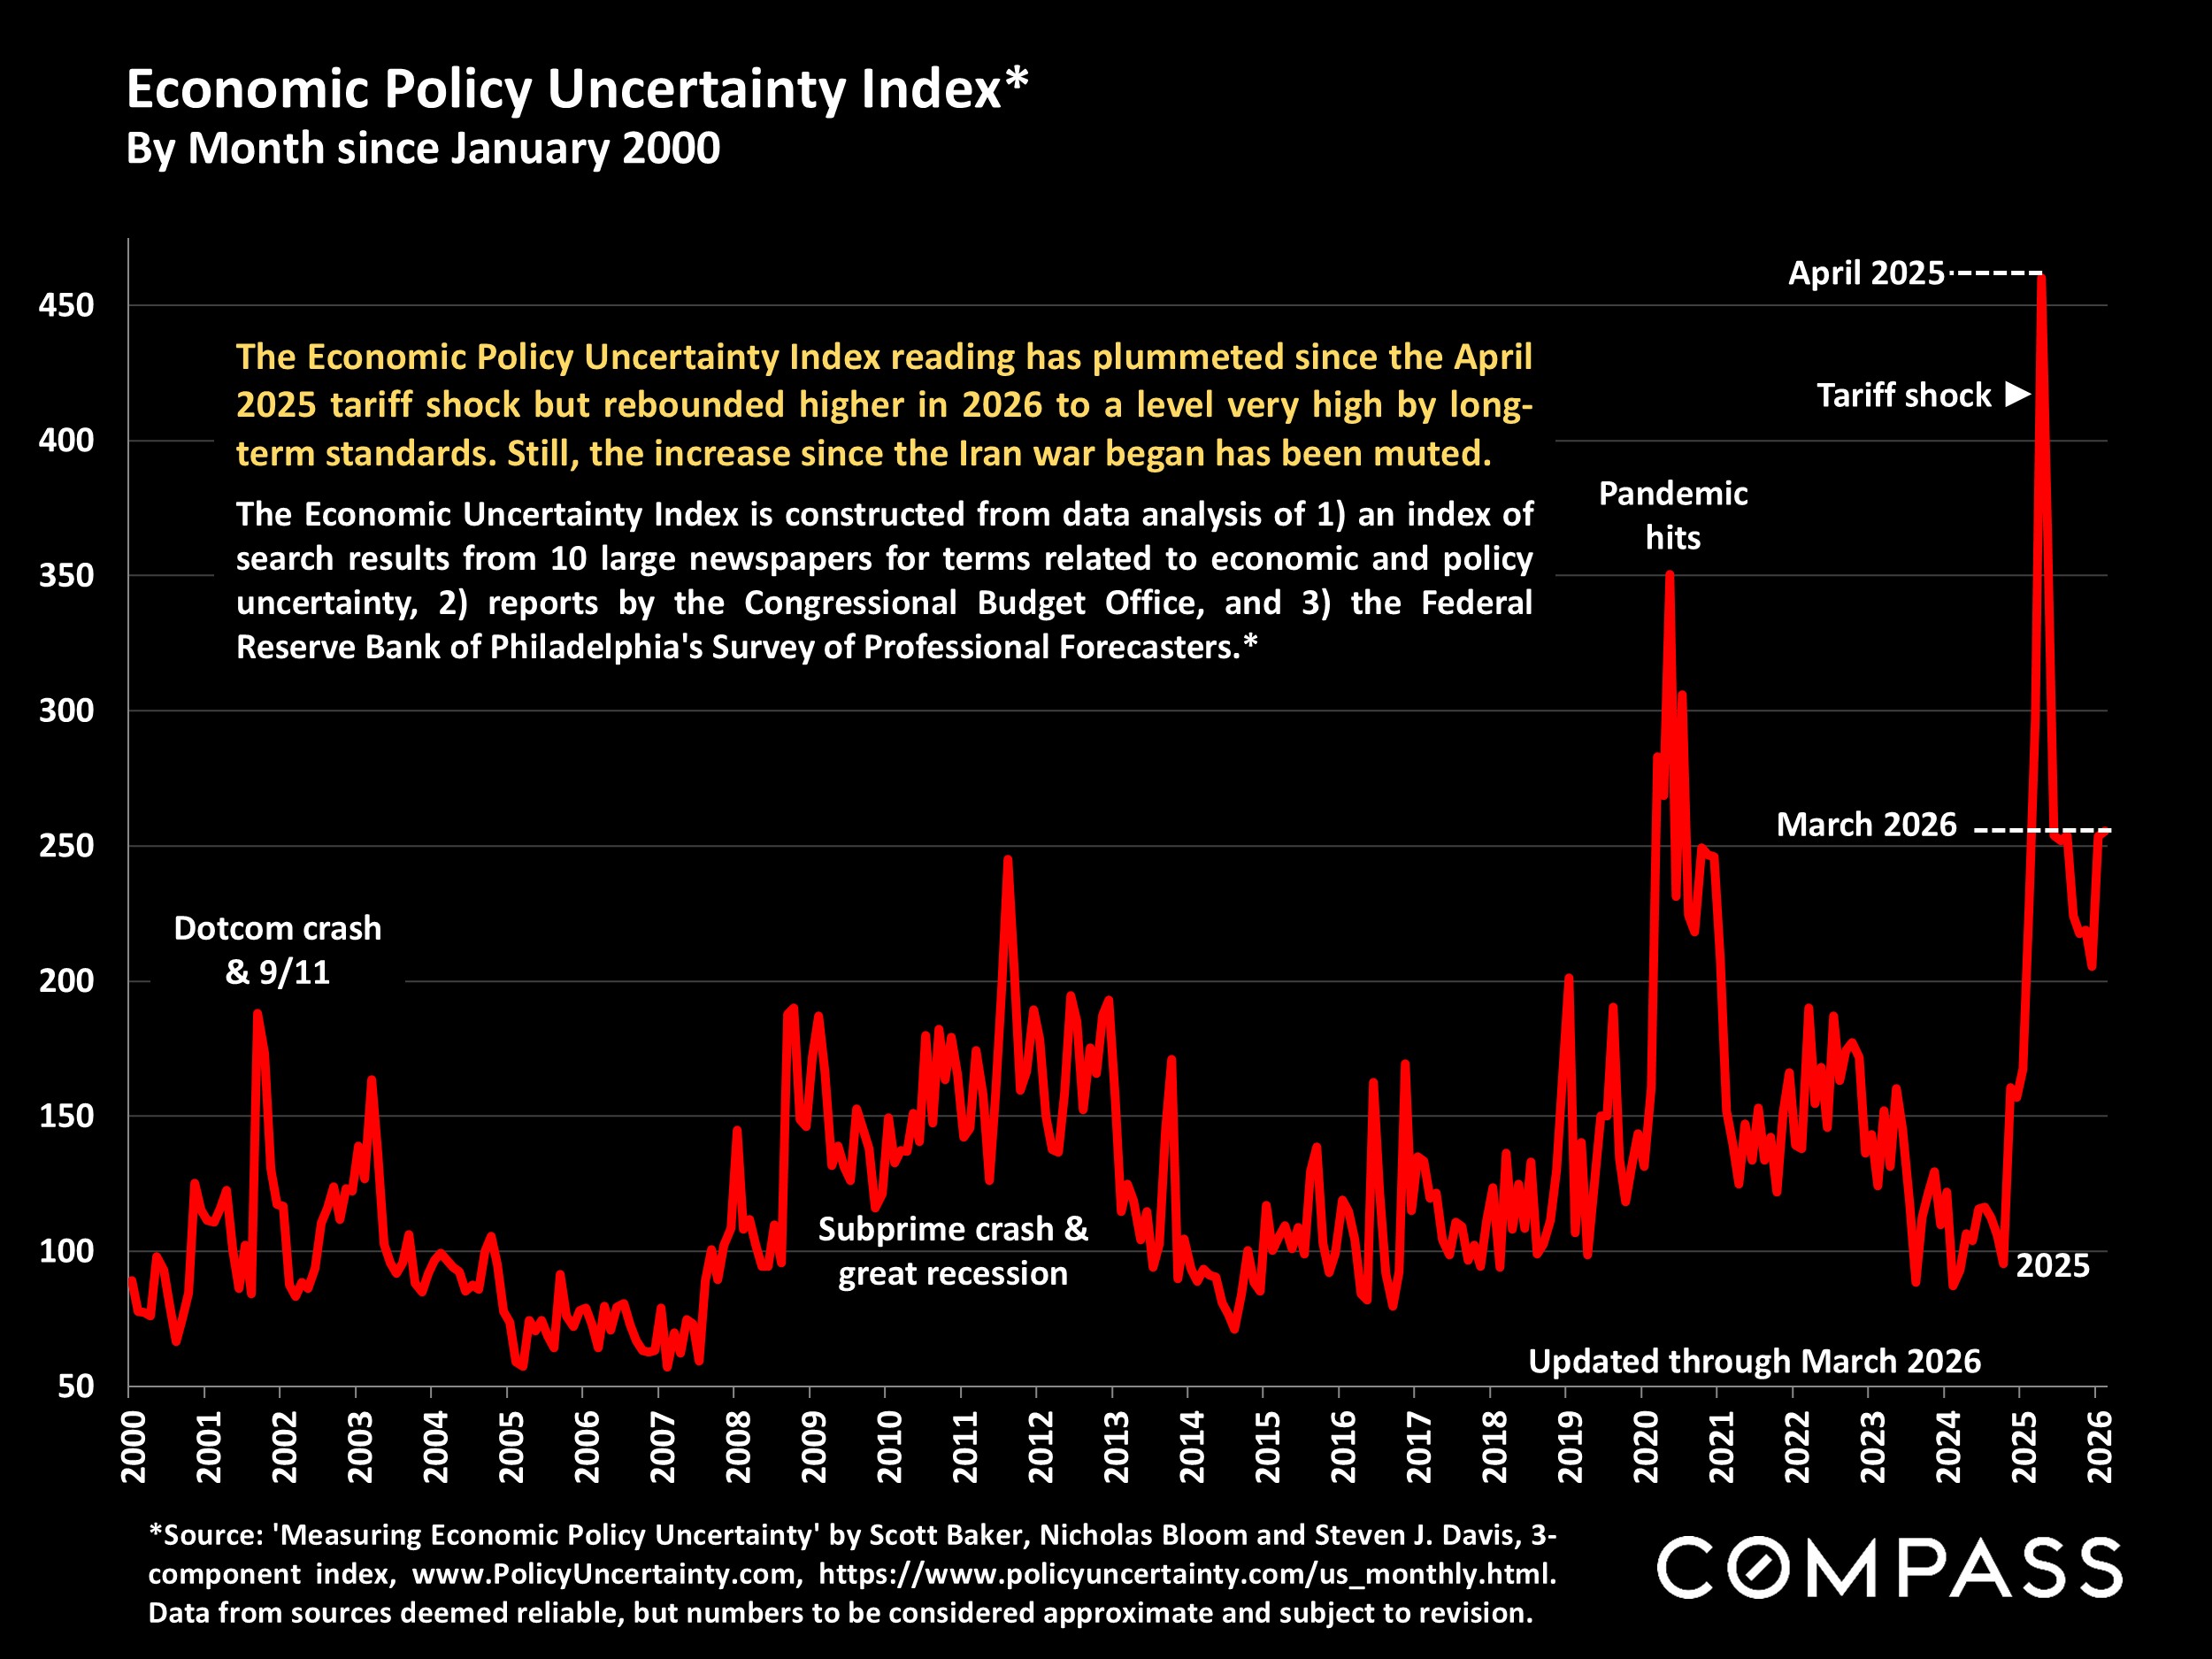
Despite significant negative economic effects from the Iran war – rising interest rates; volatile financial markets; soaring oil and gas prices; and fears of increased inflation – Bay Area real estate markets saw relatively little impact in March. What effects that occurred usually impacted less expensive markets more sensitive to interest rate increases. So far, there has been no reaction comparable to what occurred last year with the tariff shock, and as of April 8th, virtually all economic indicators were turning in positive directions with the cease fire announcement.
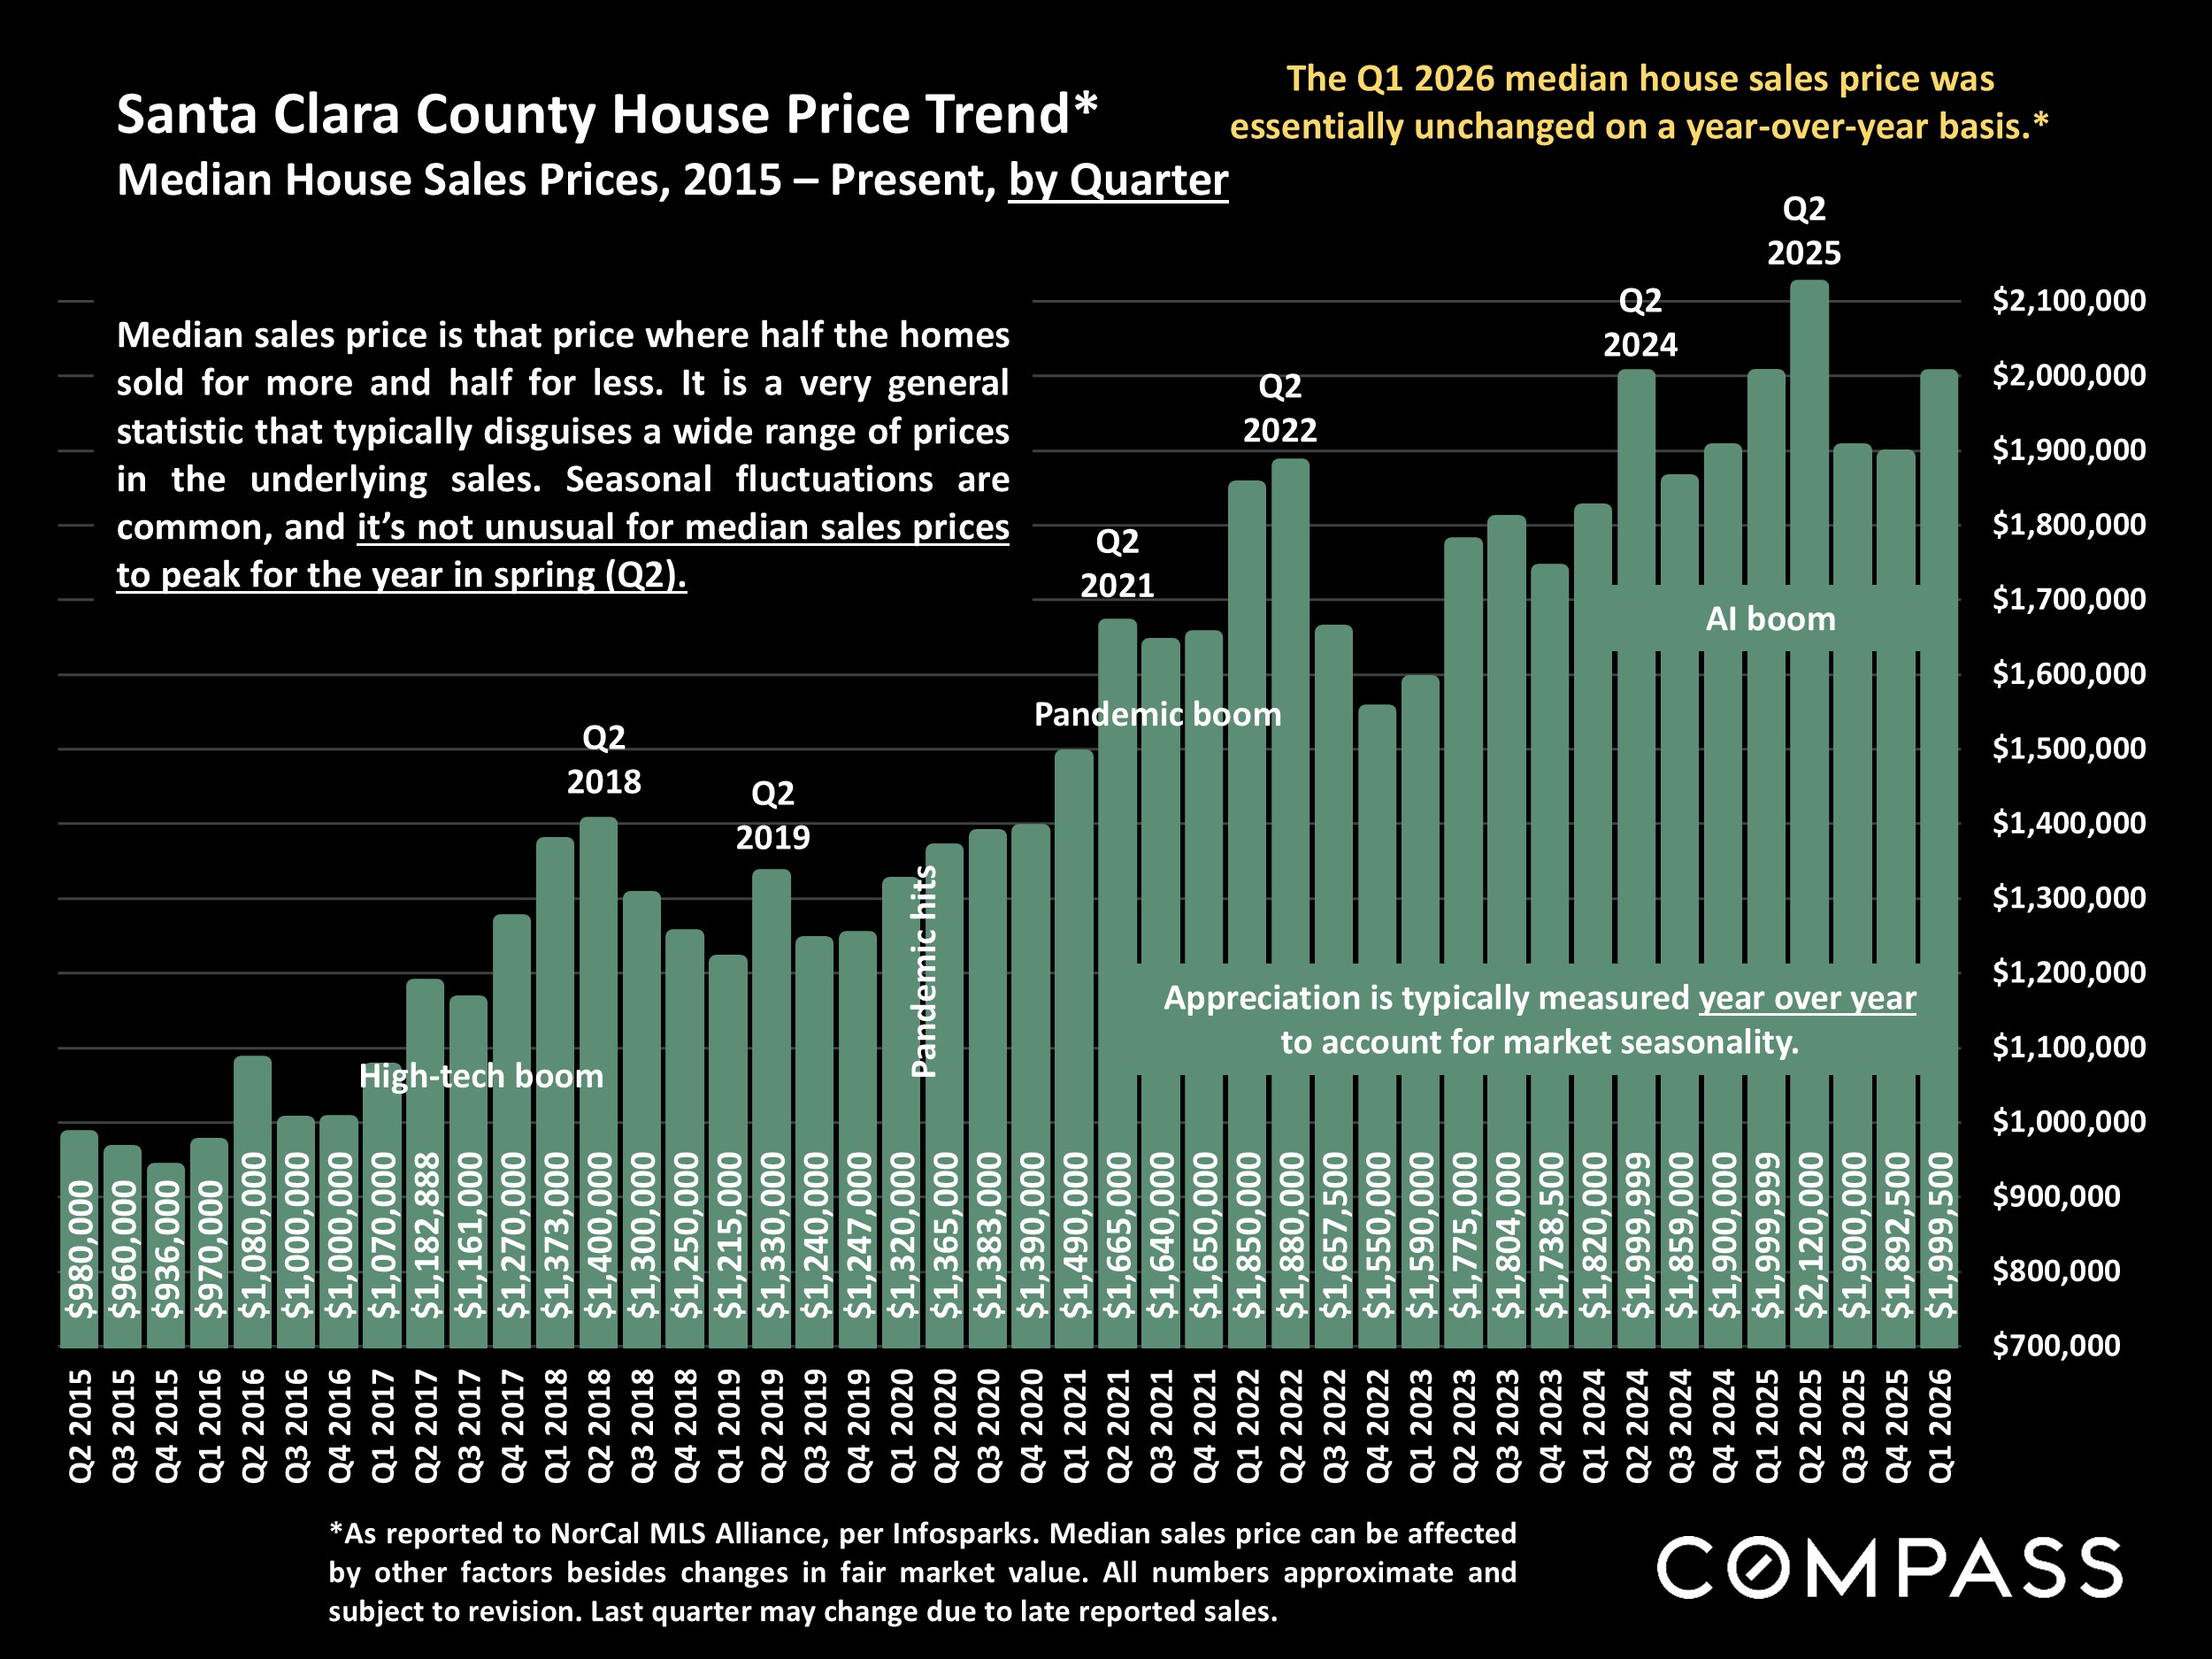
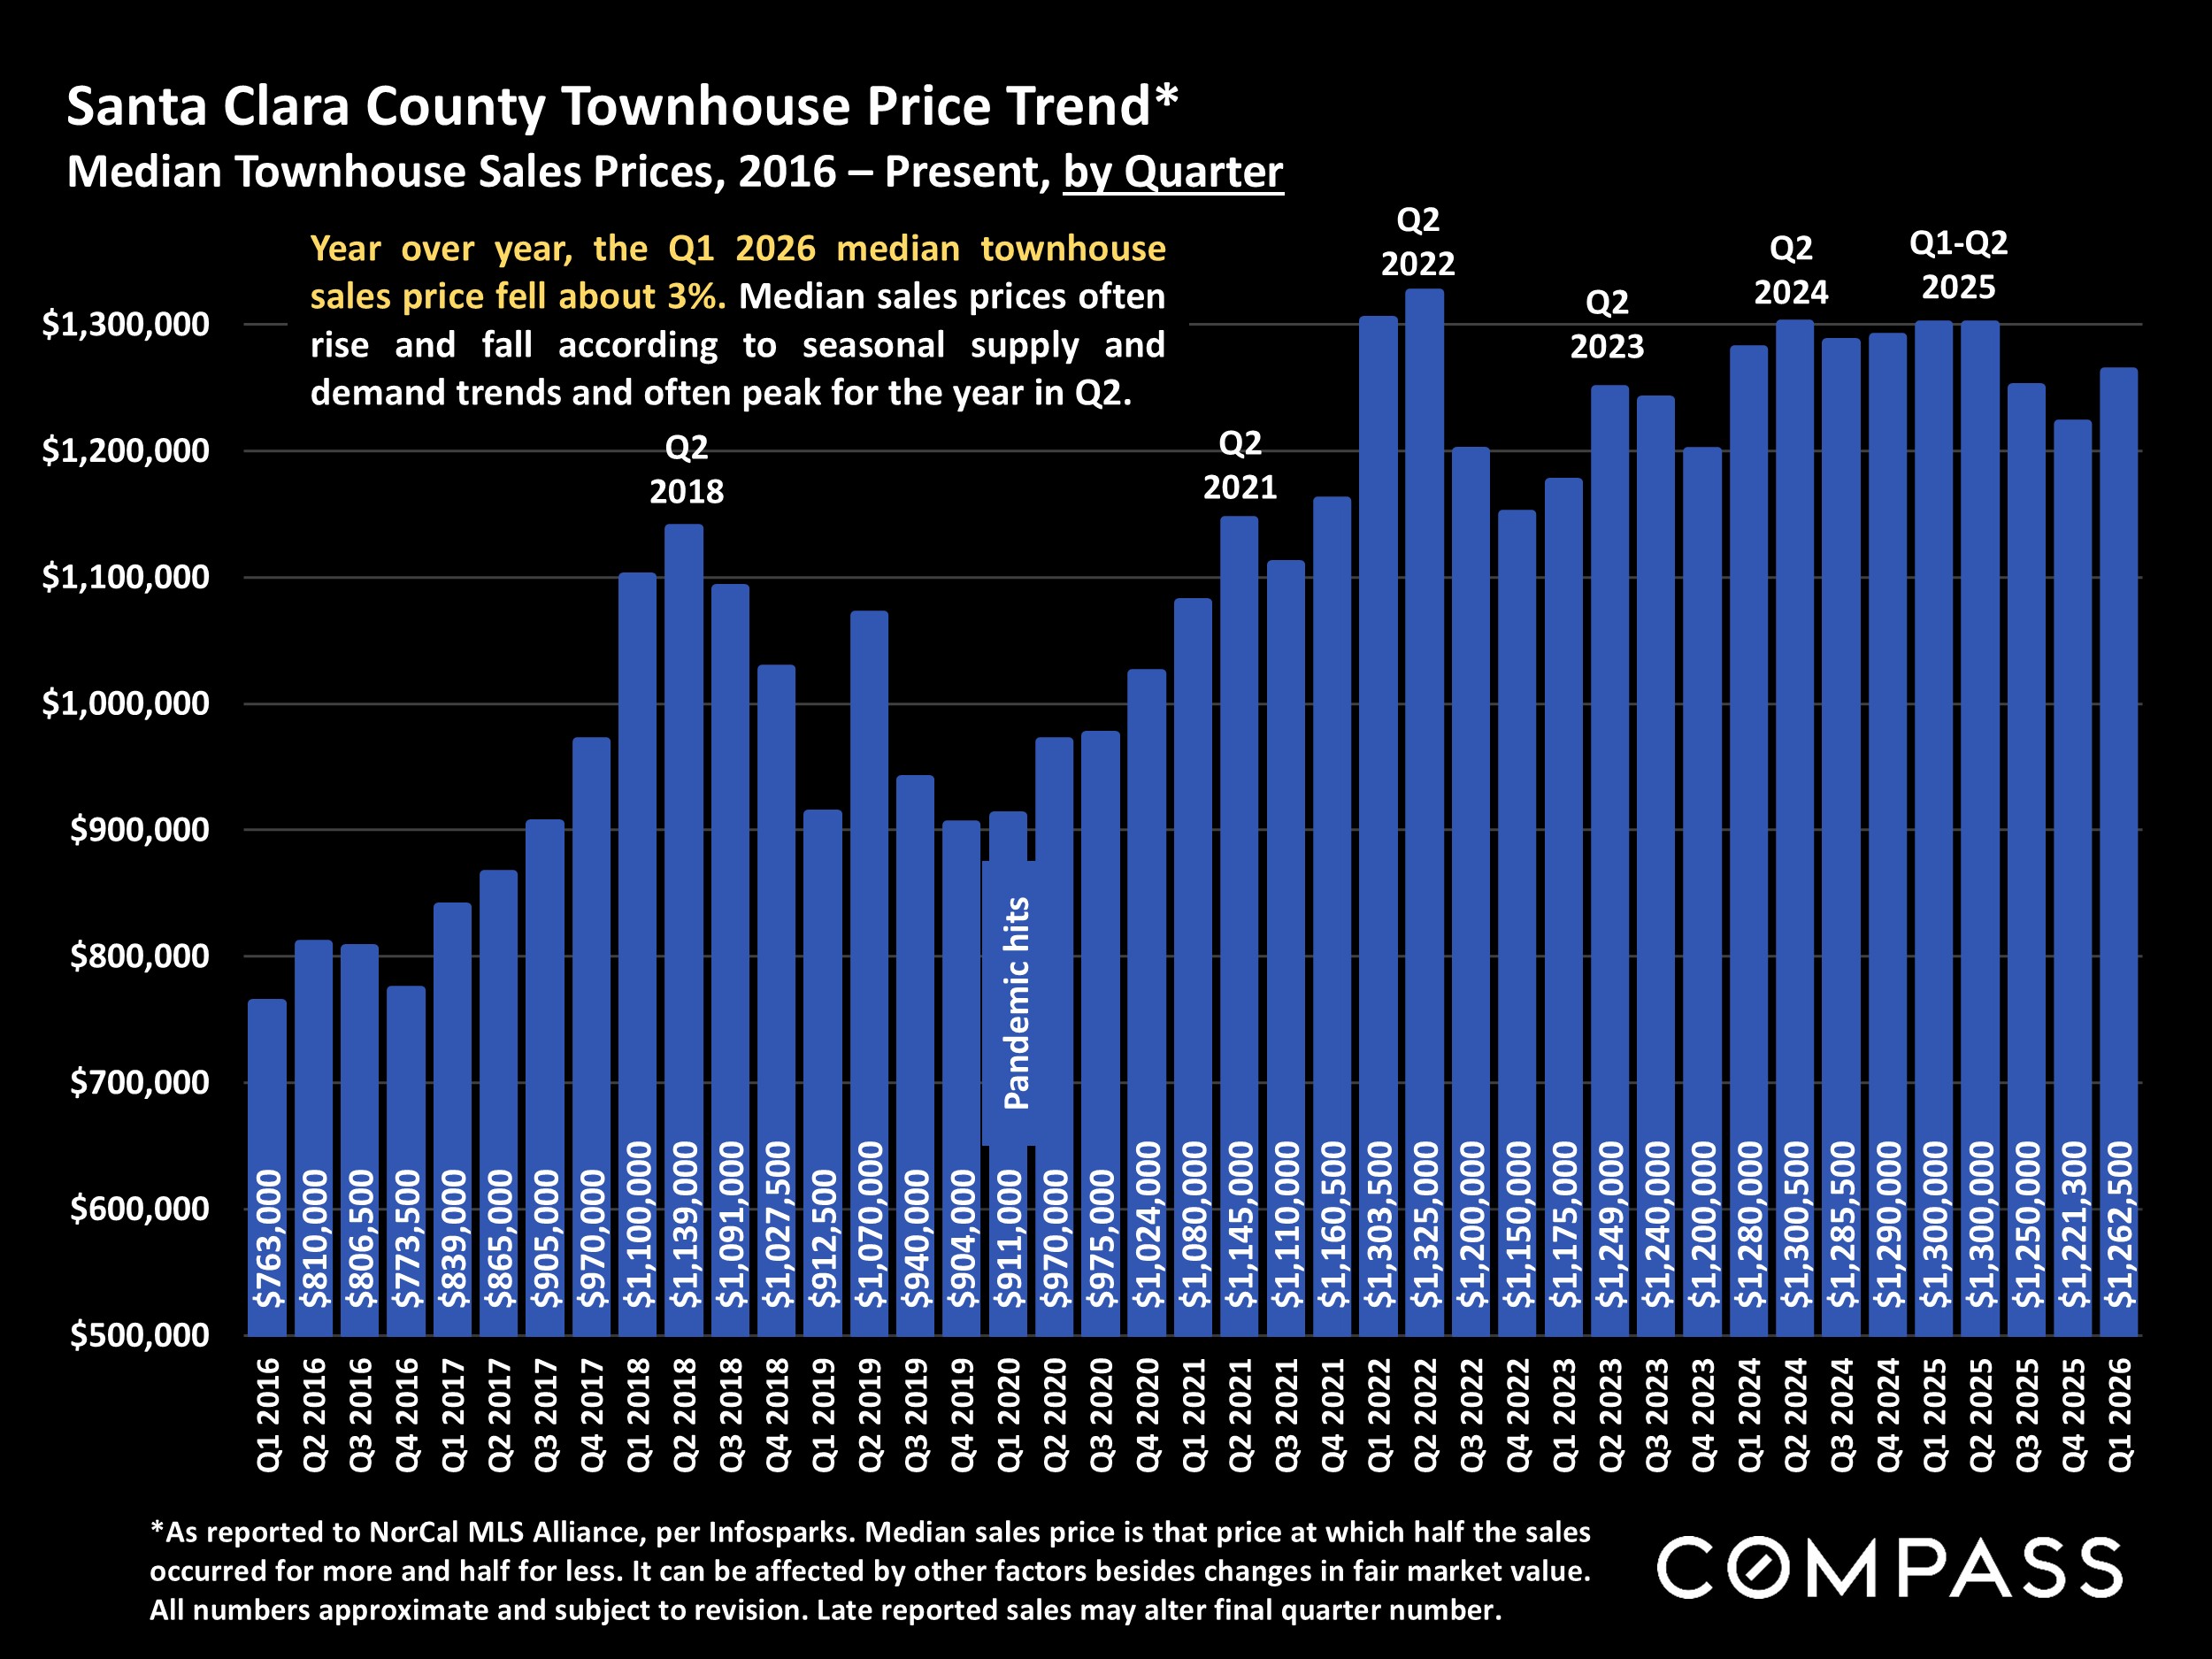
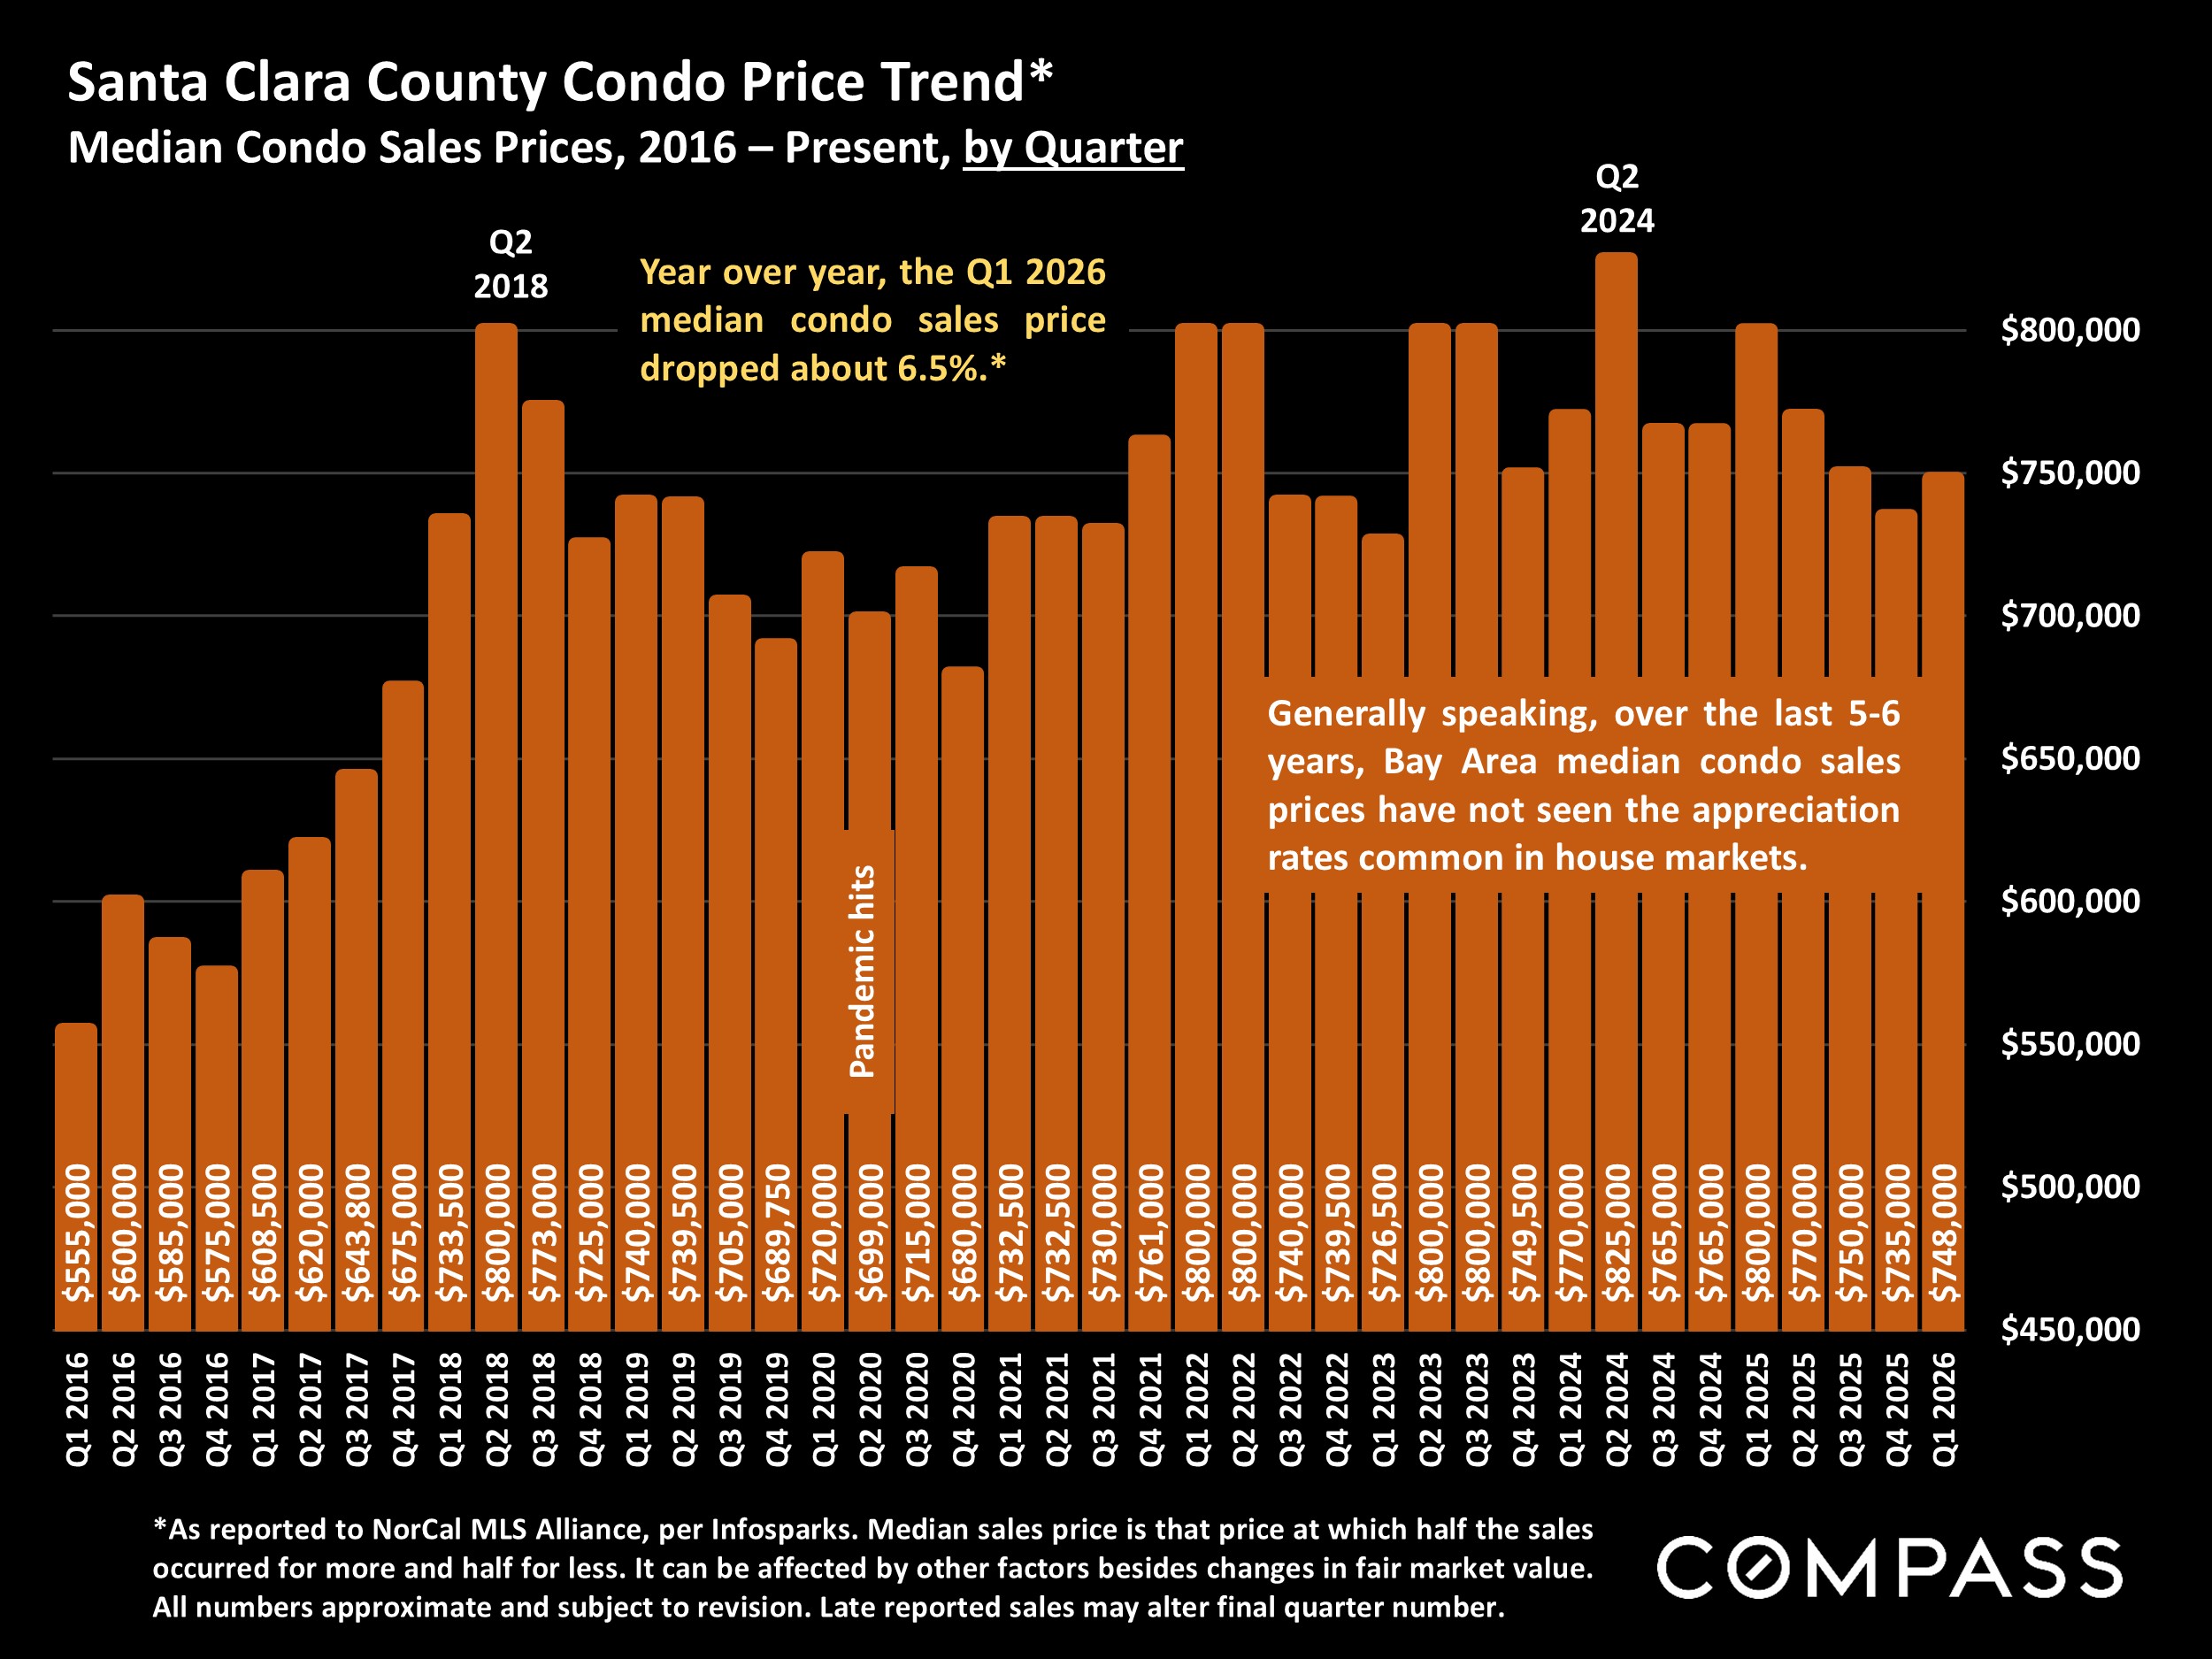
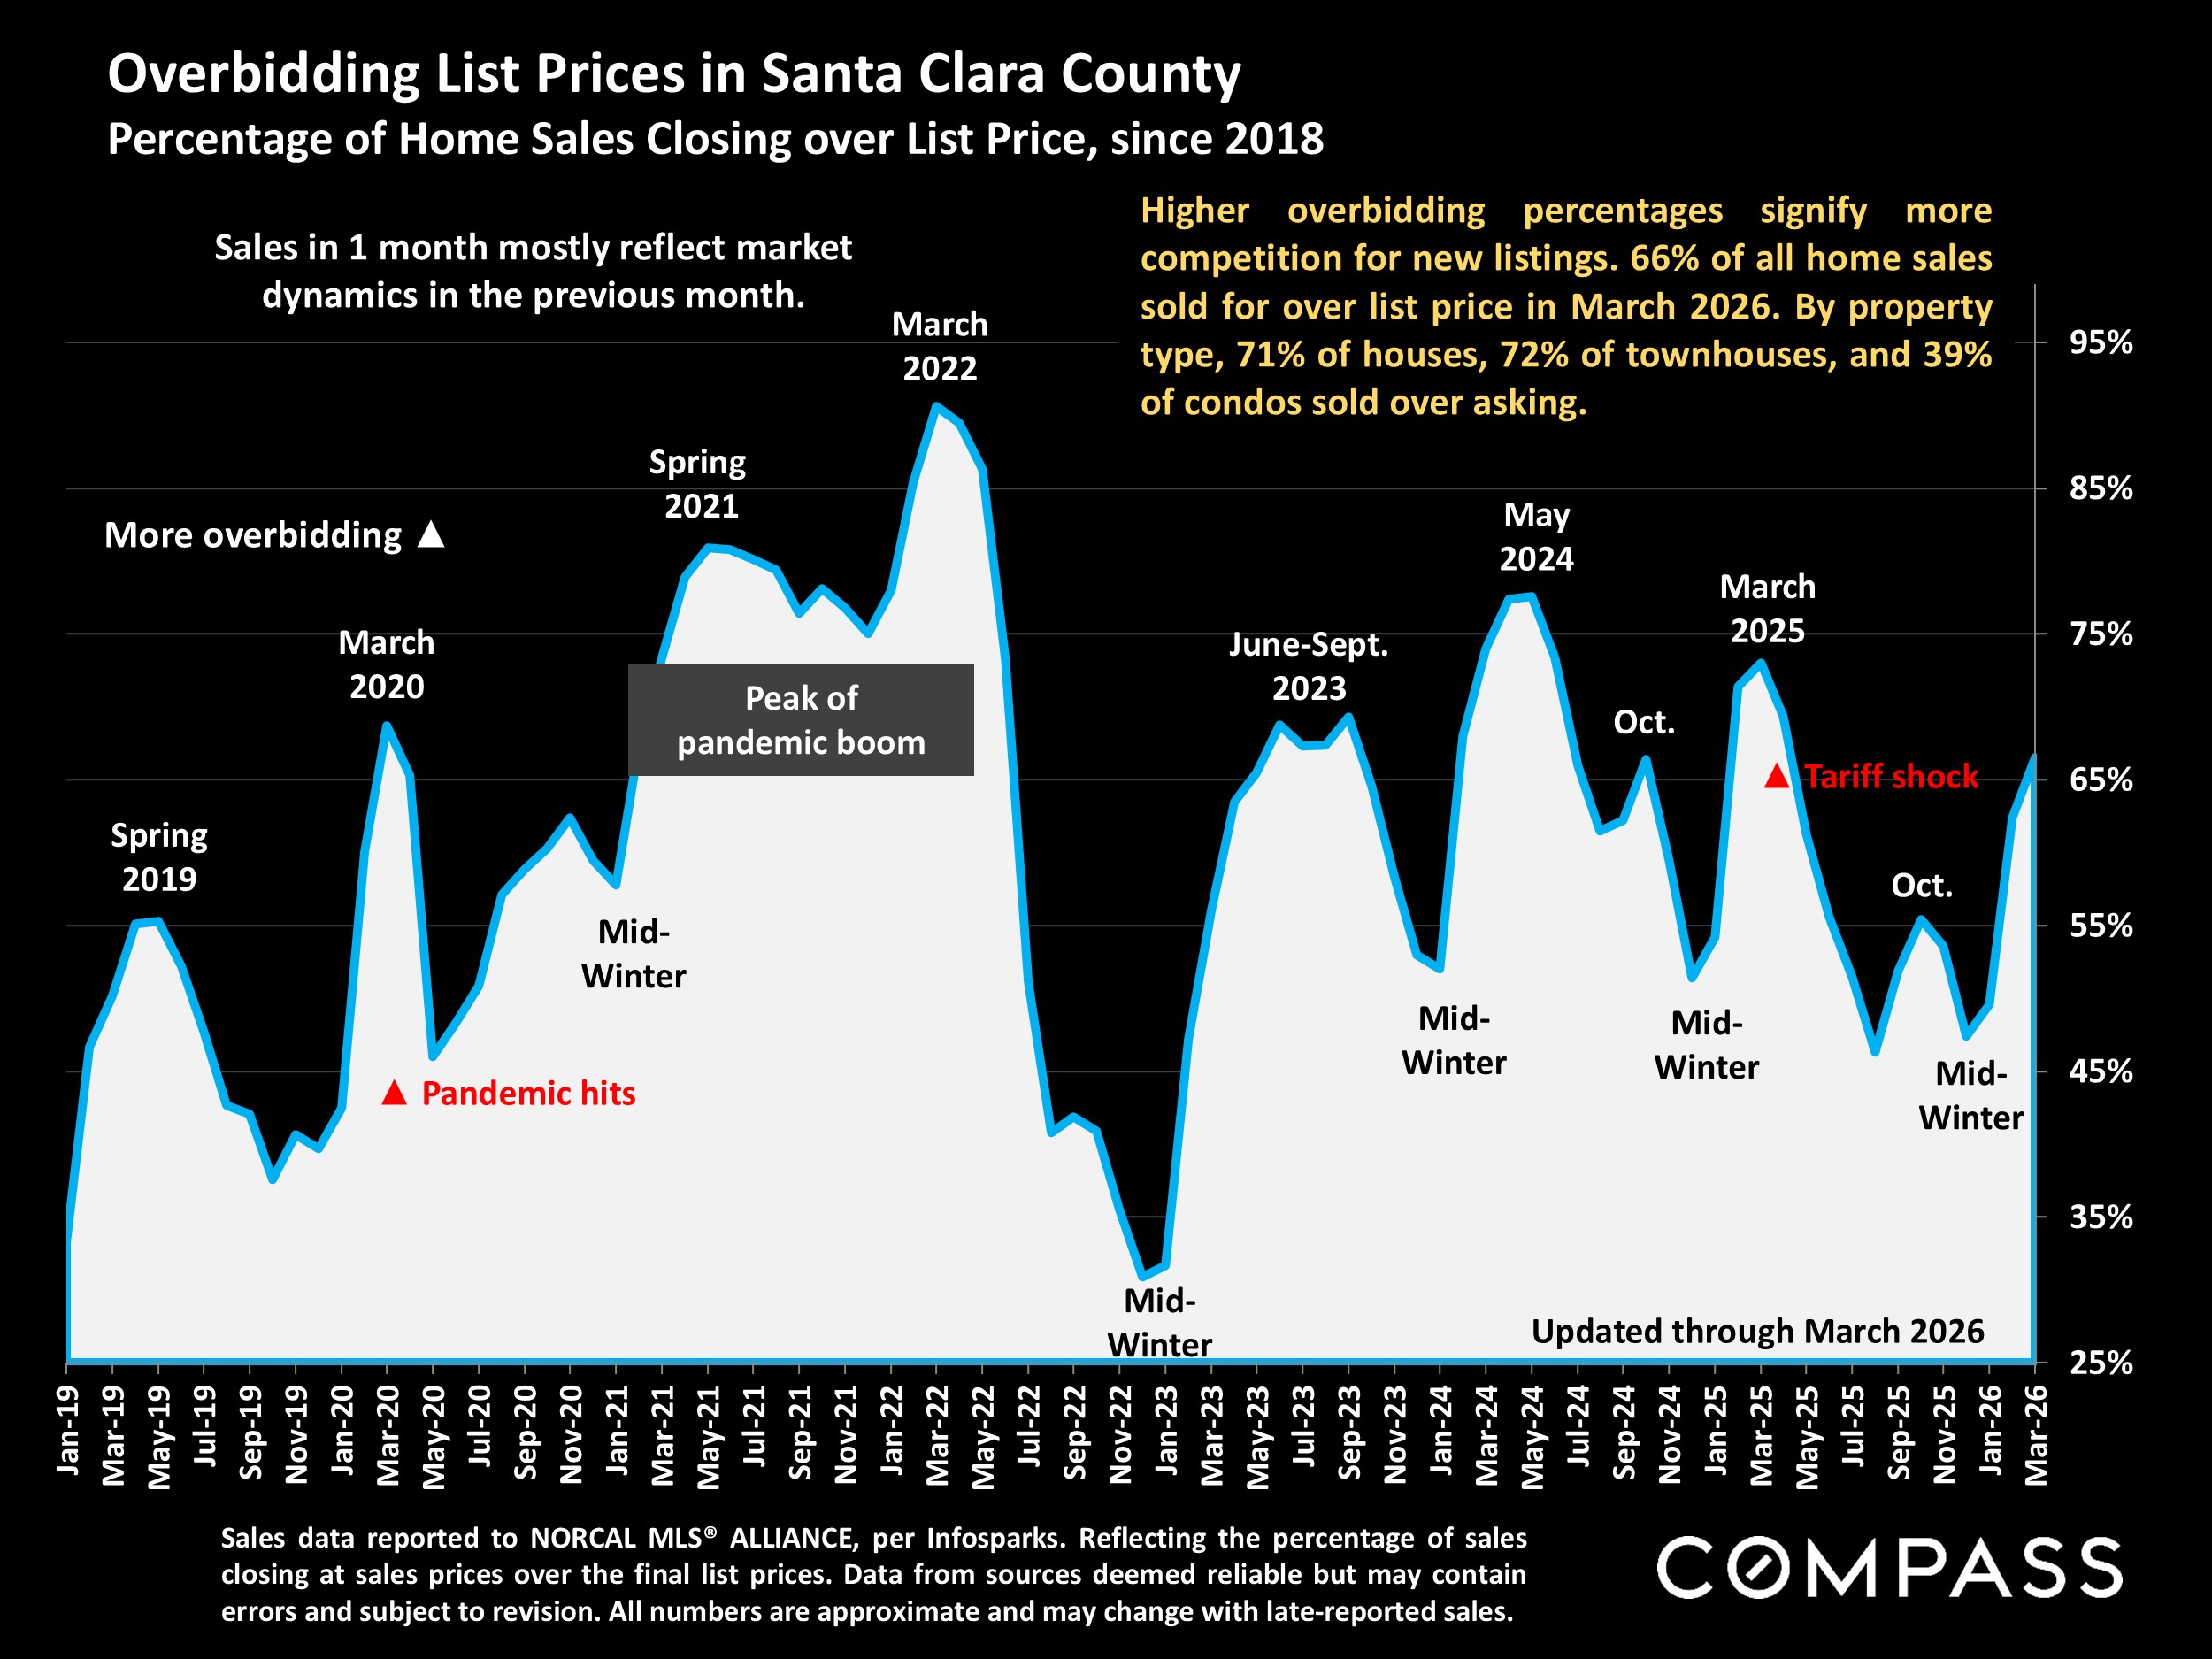
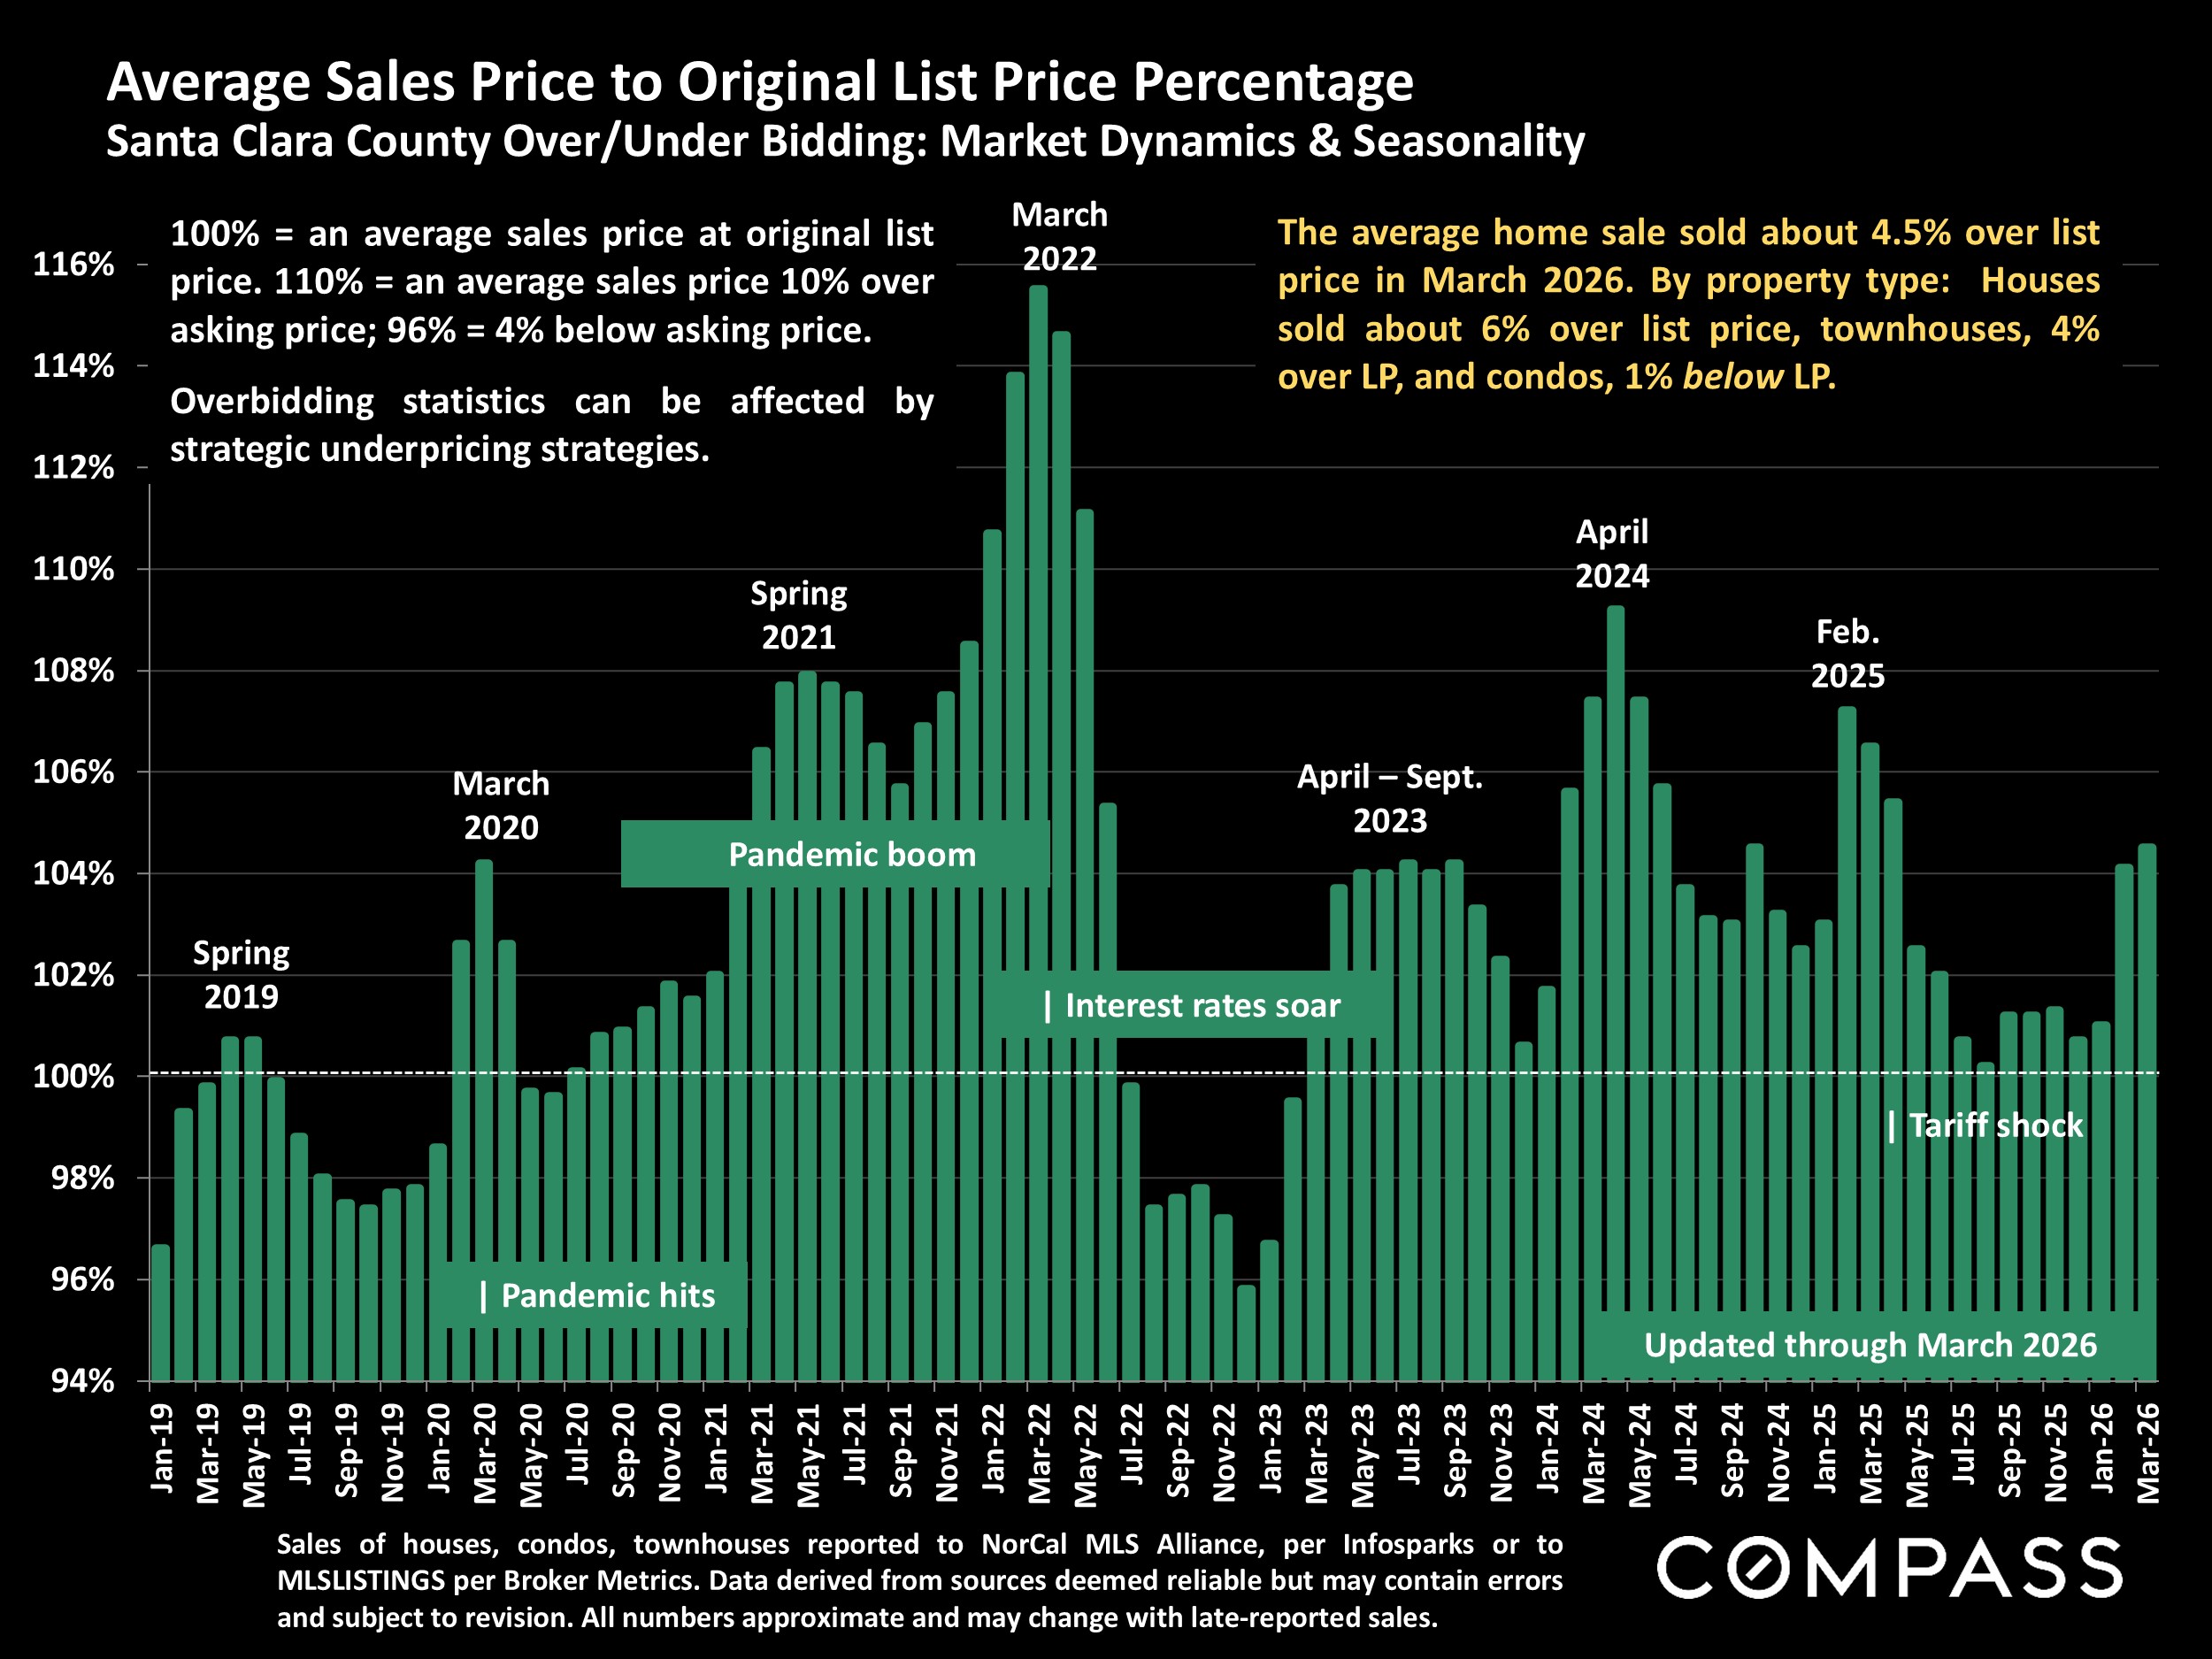
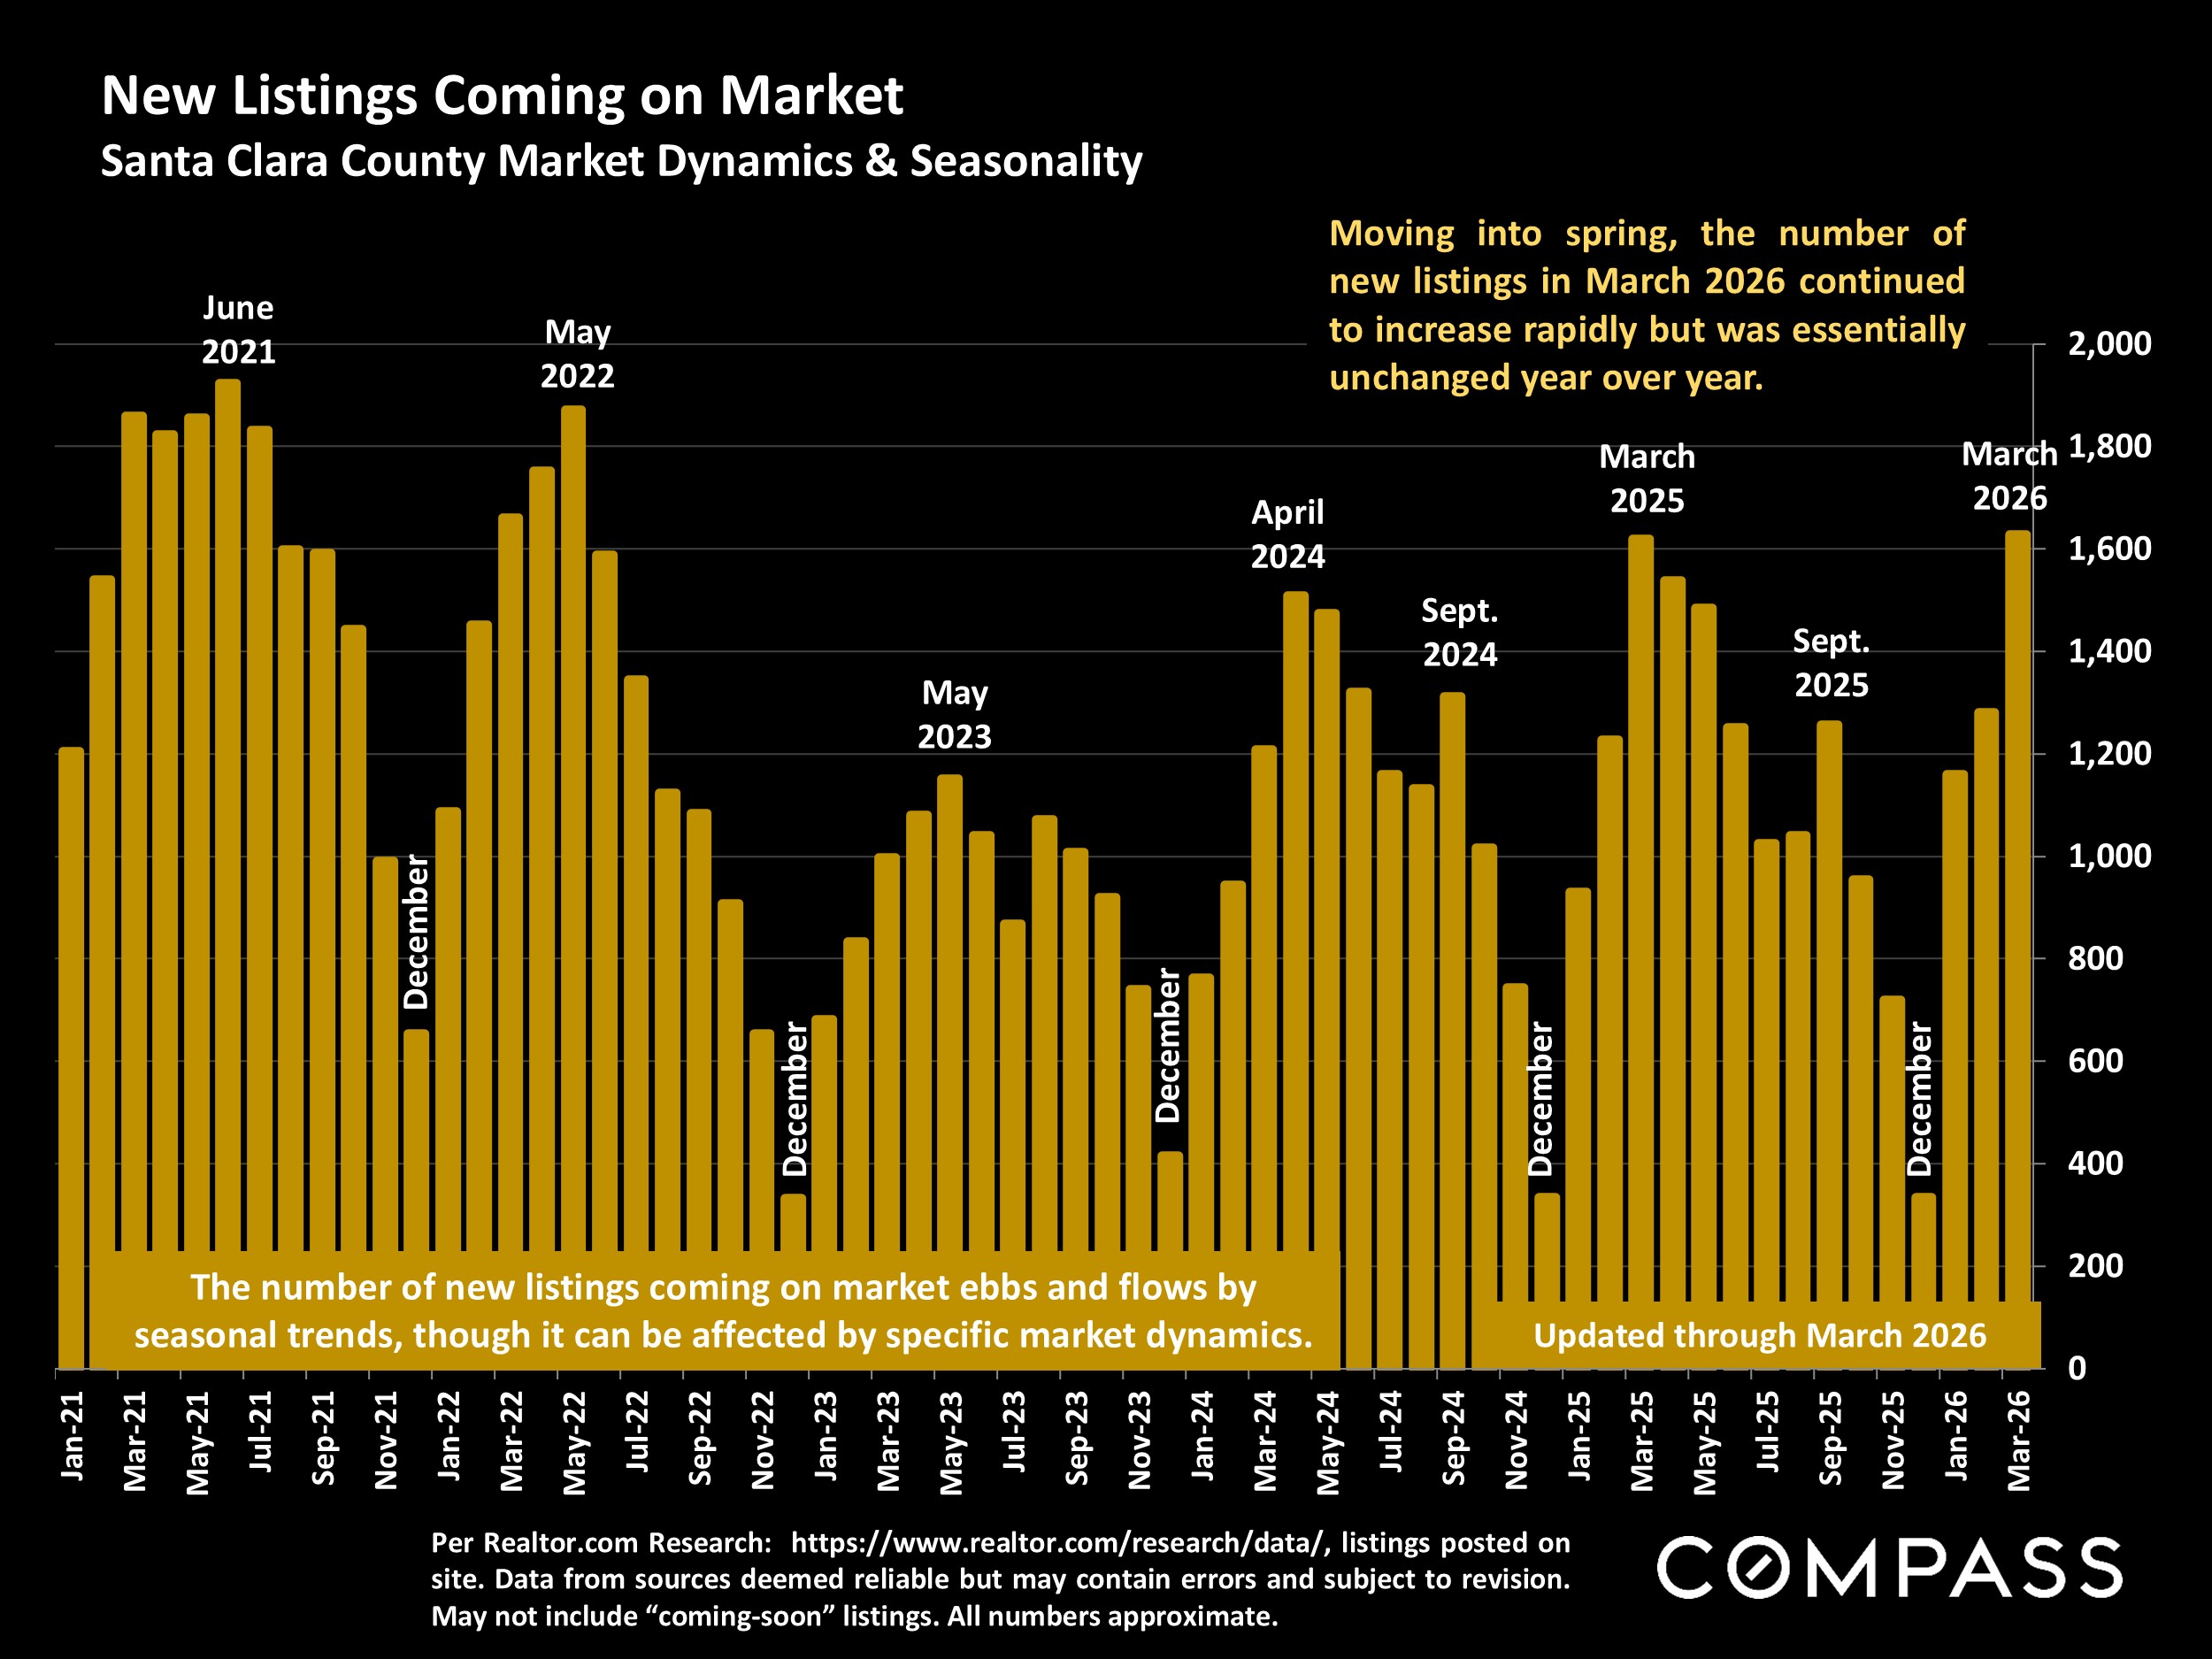
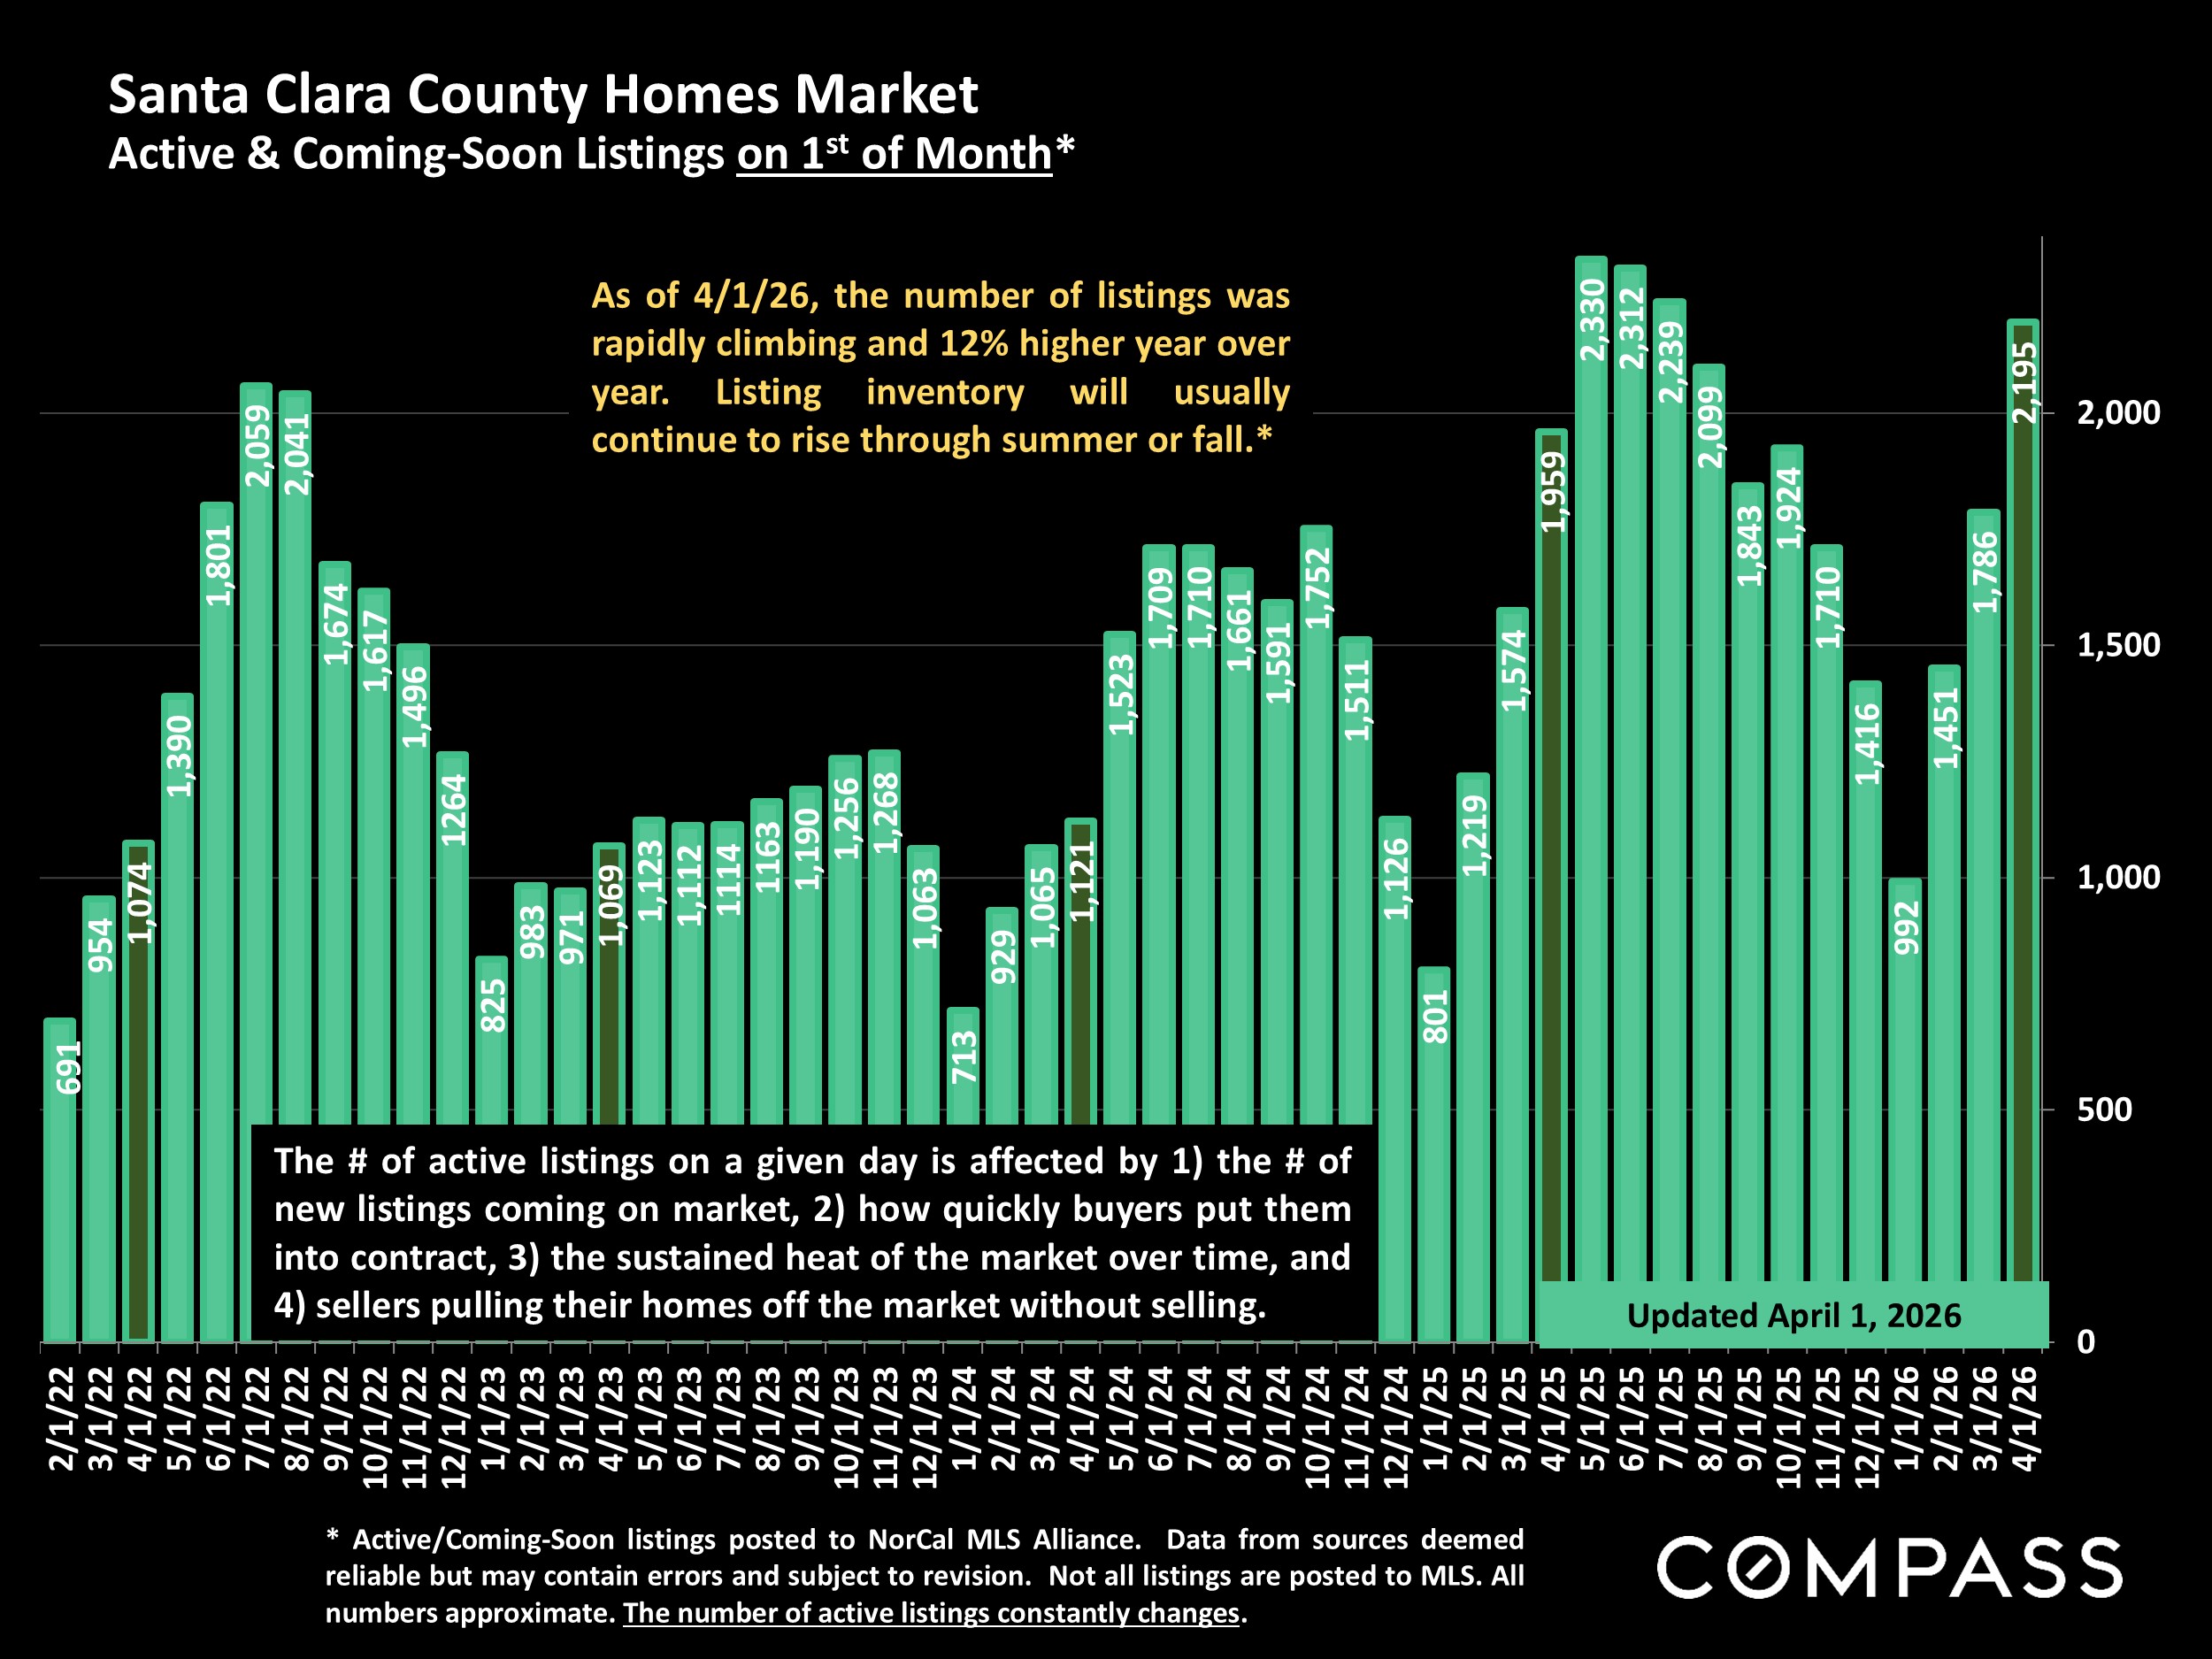
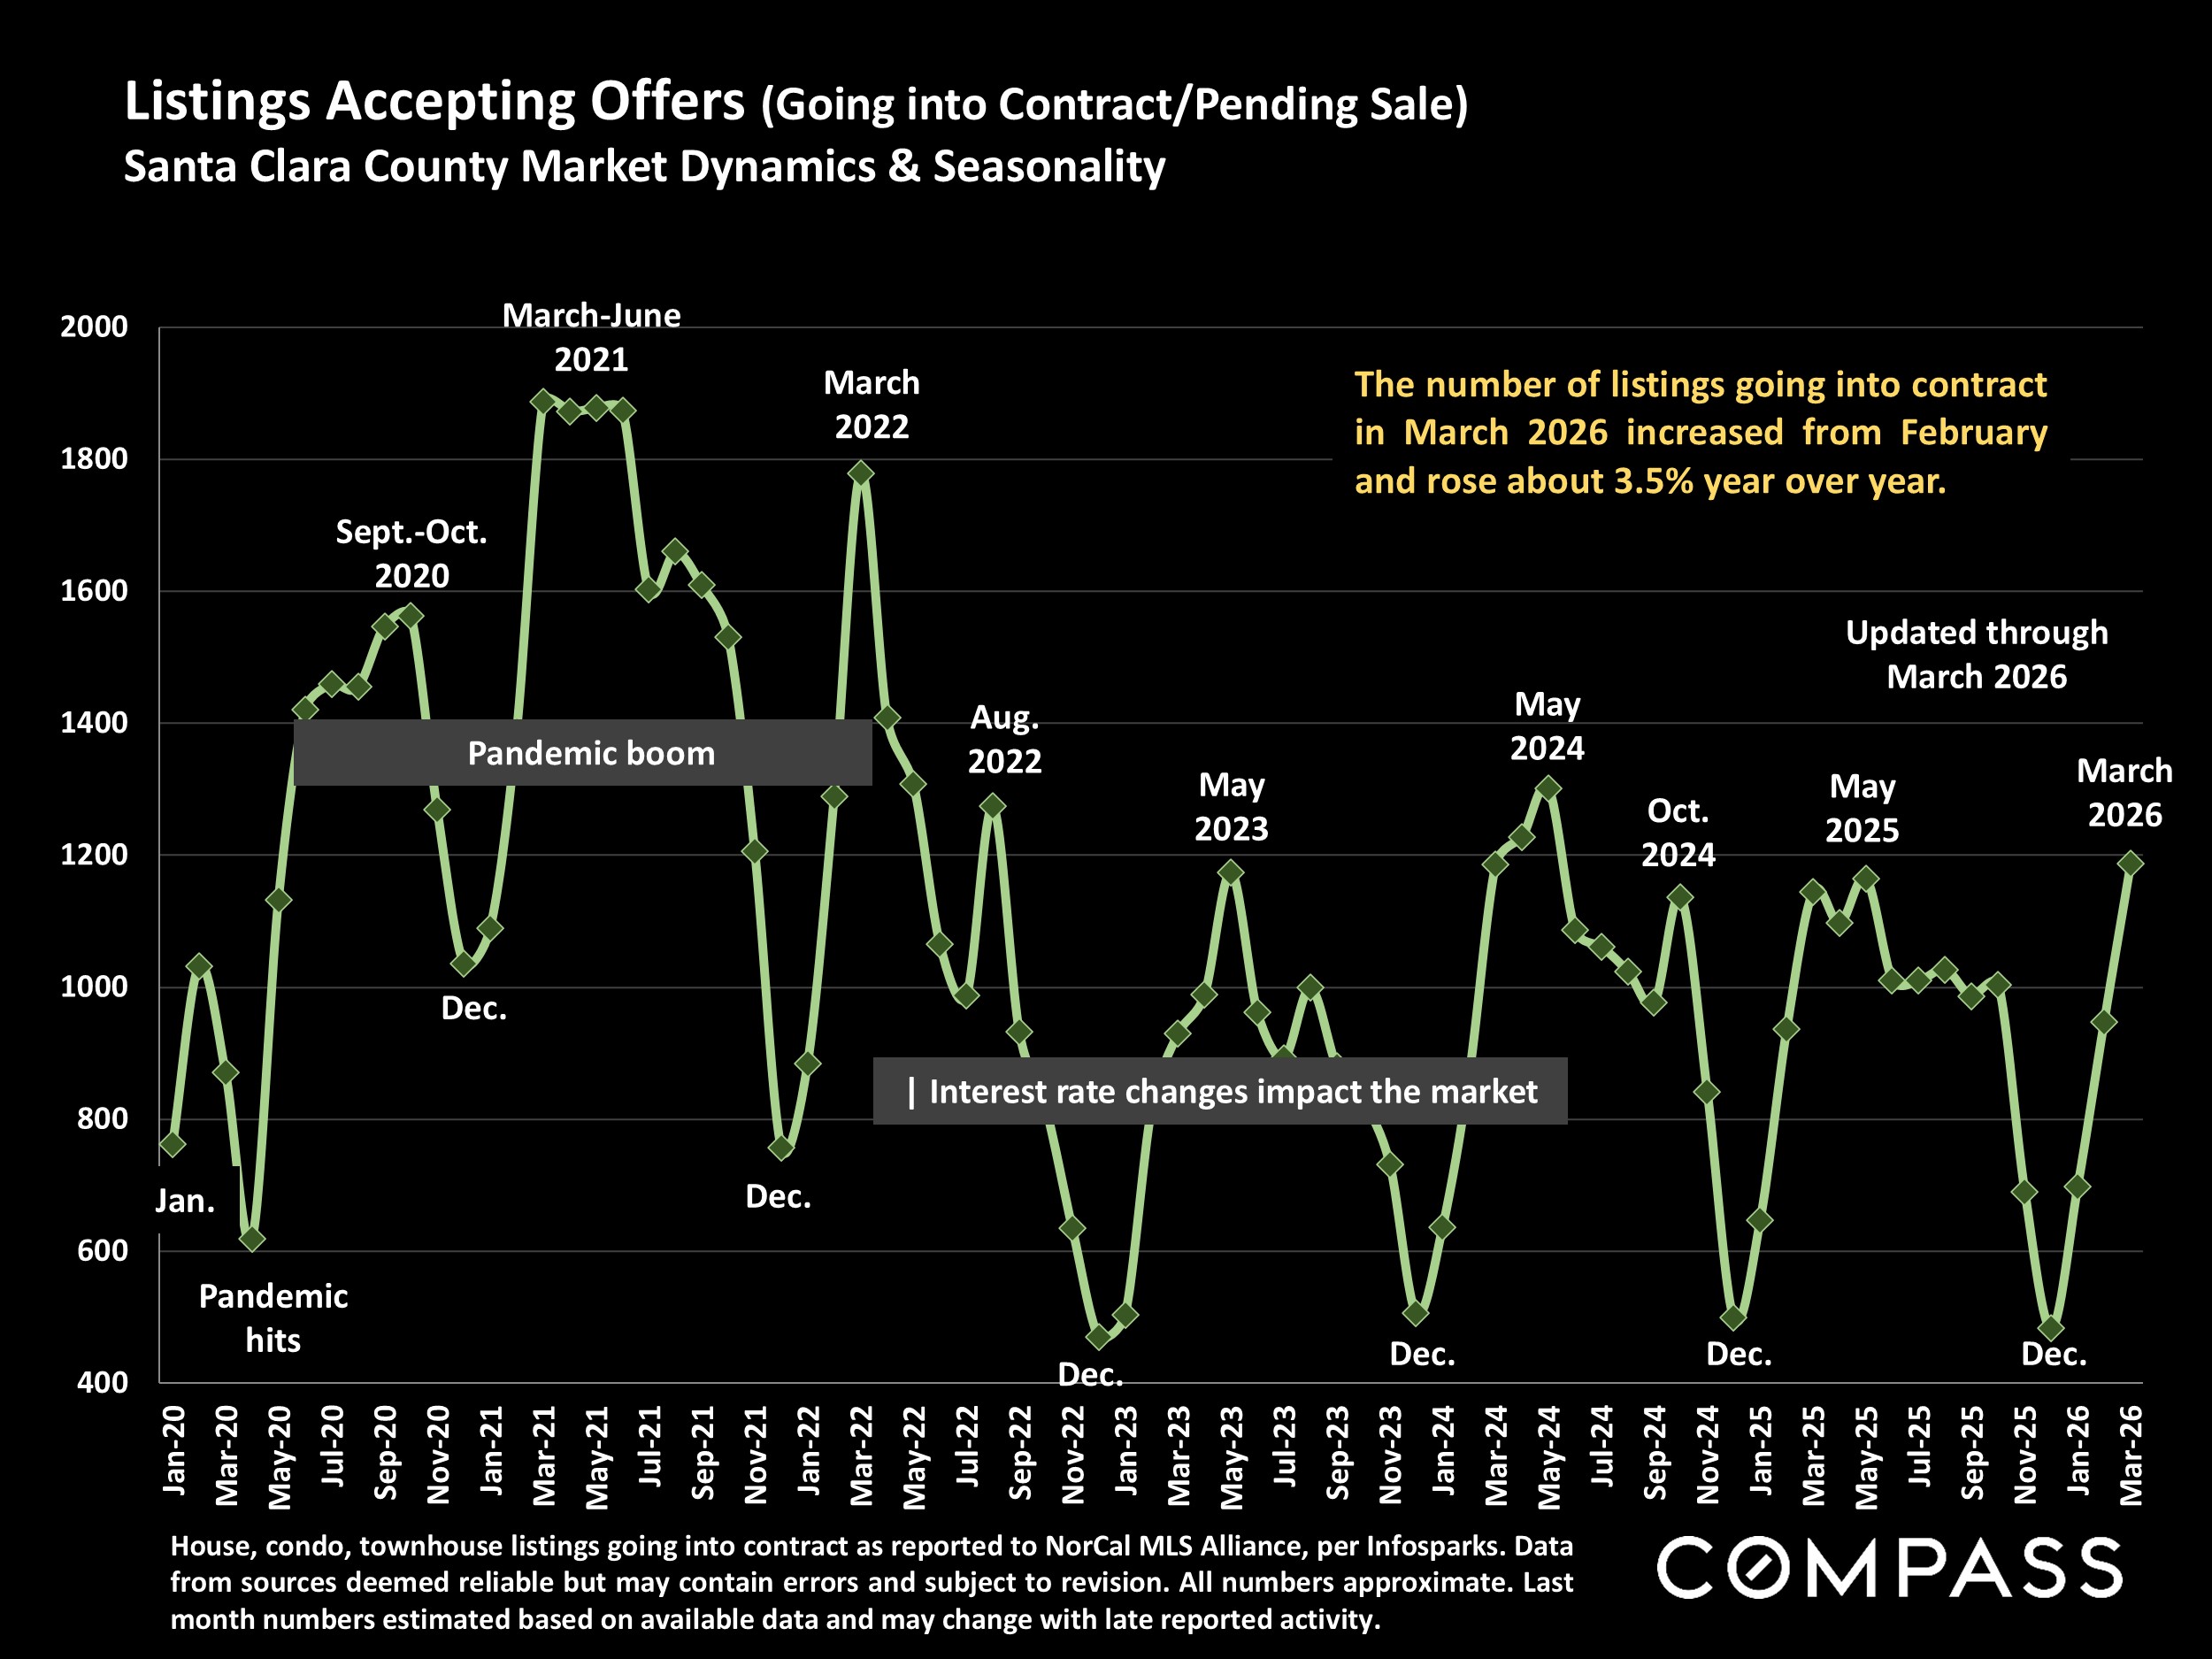
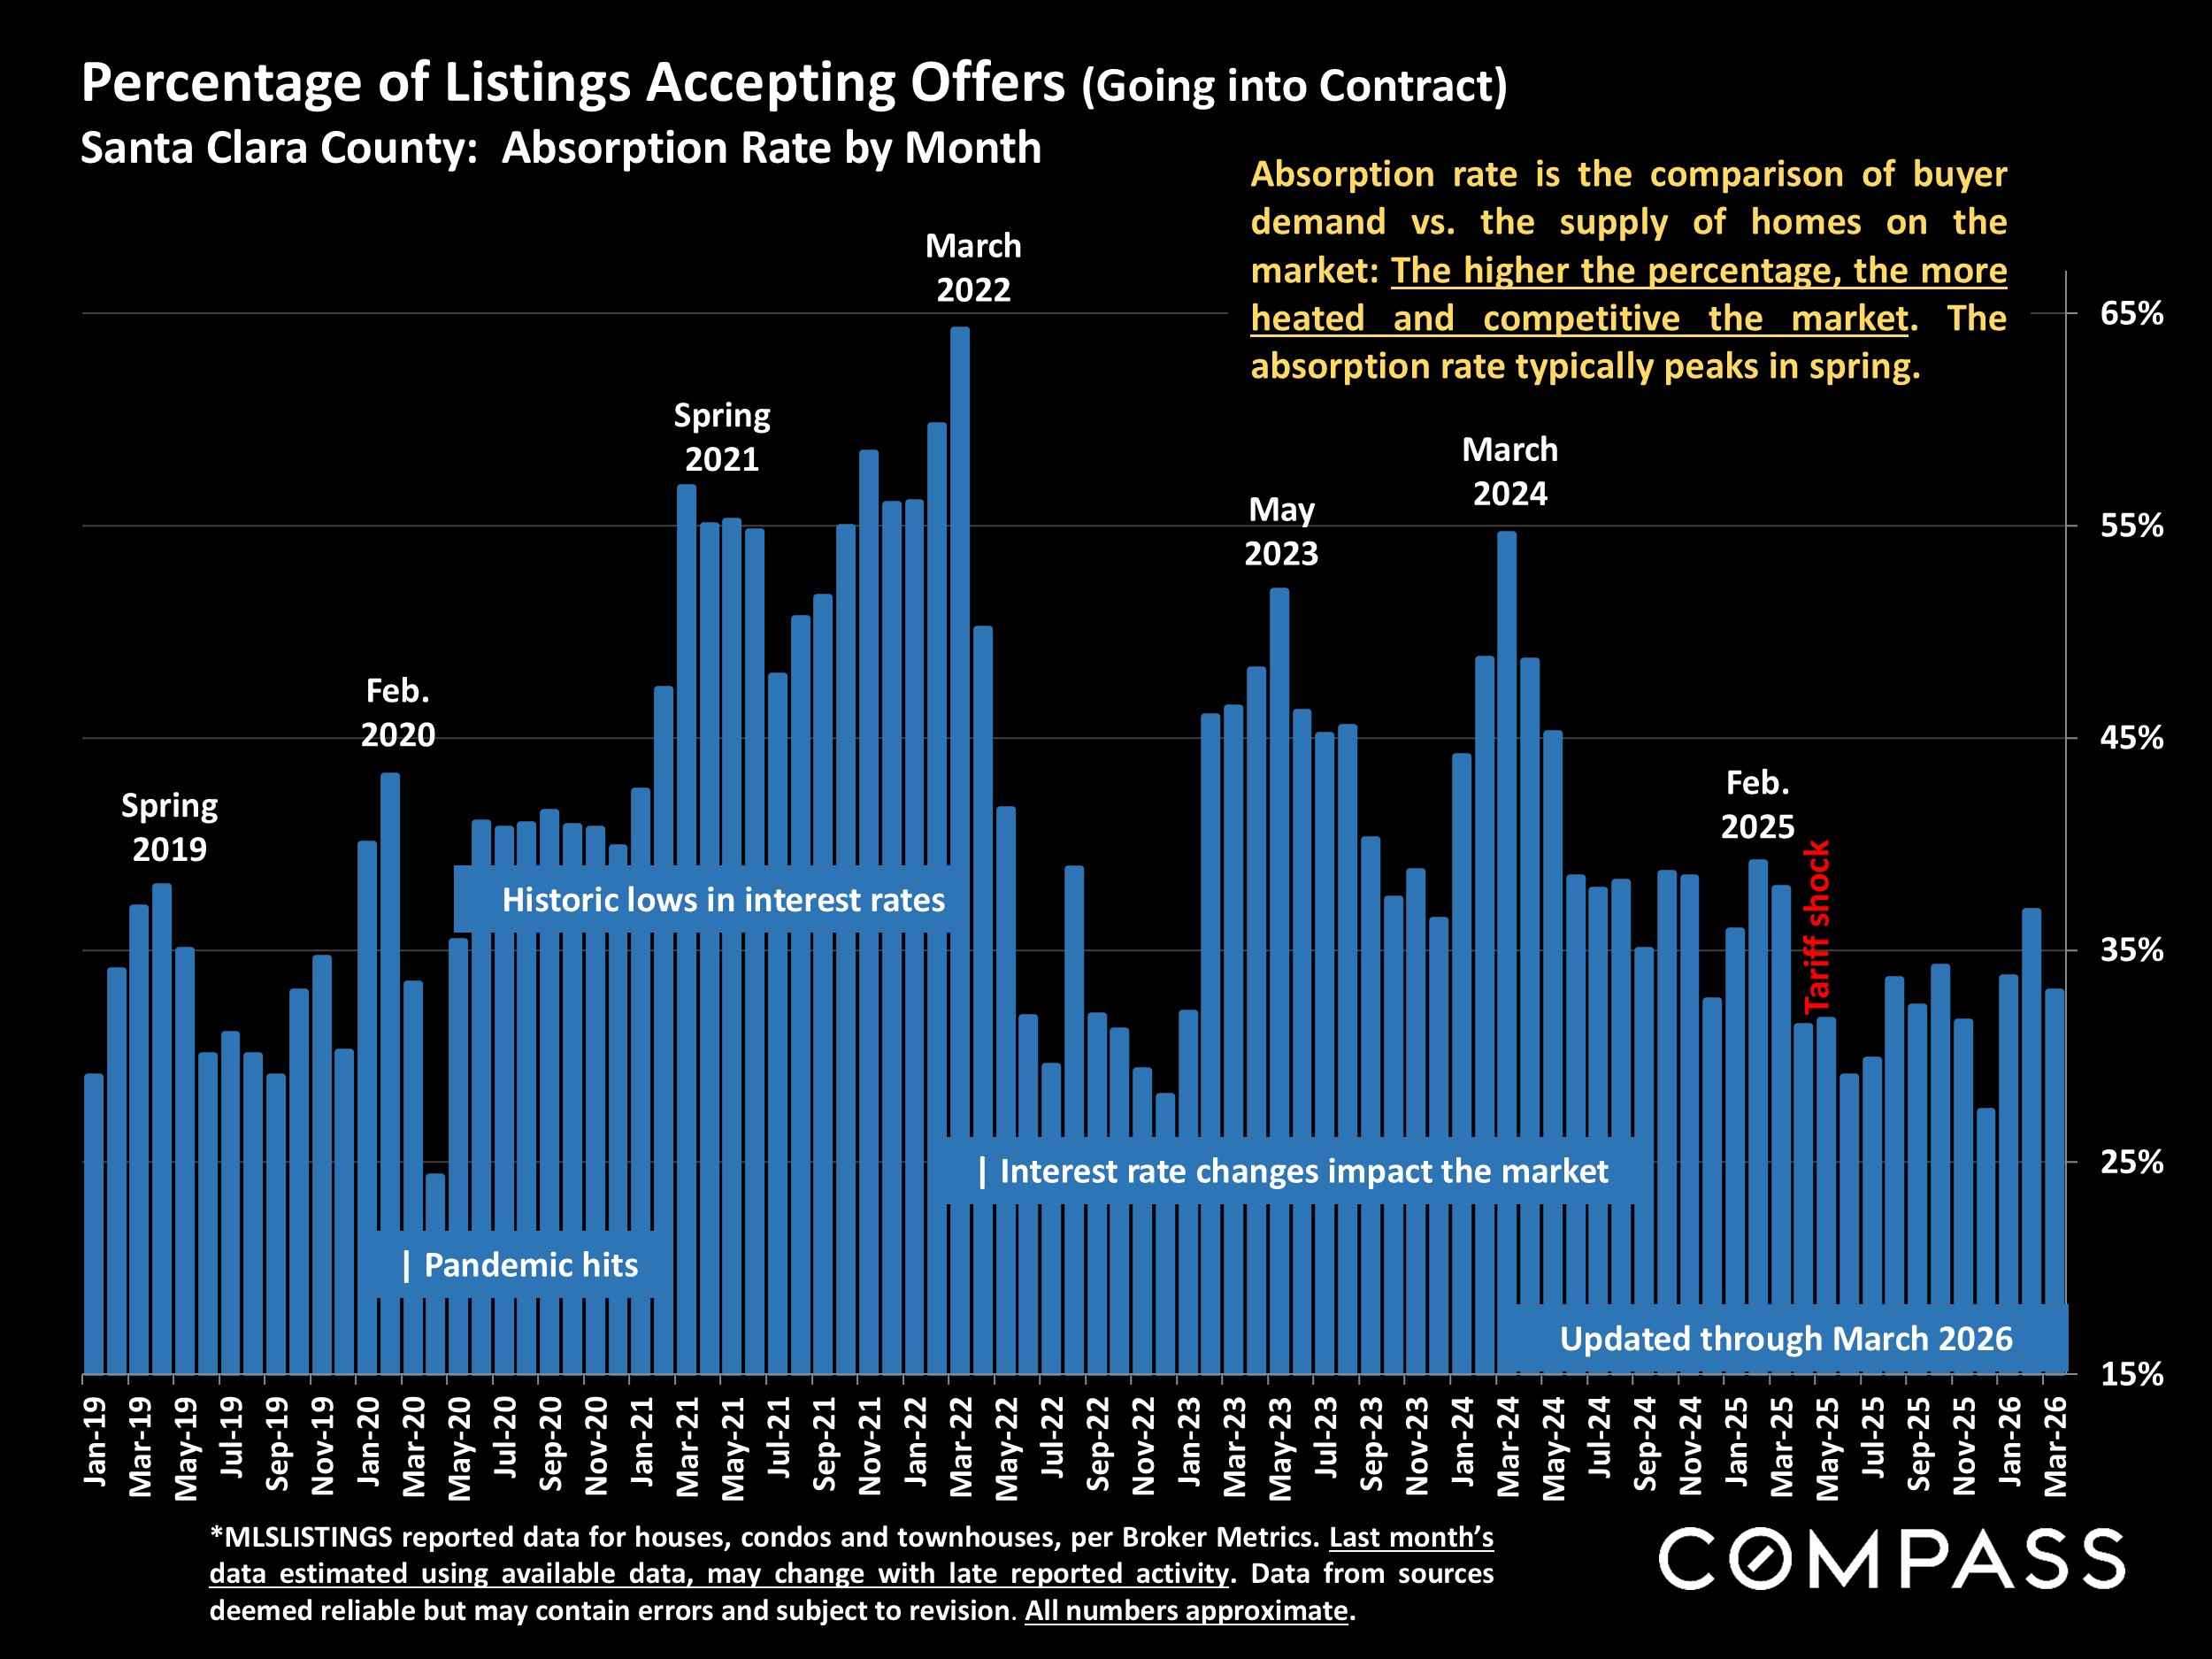
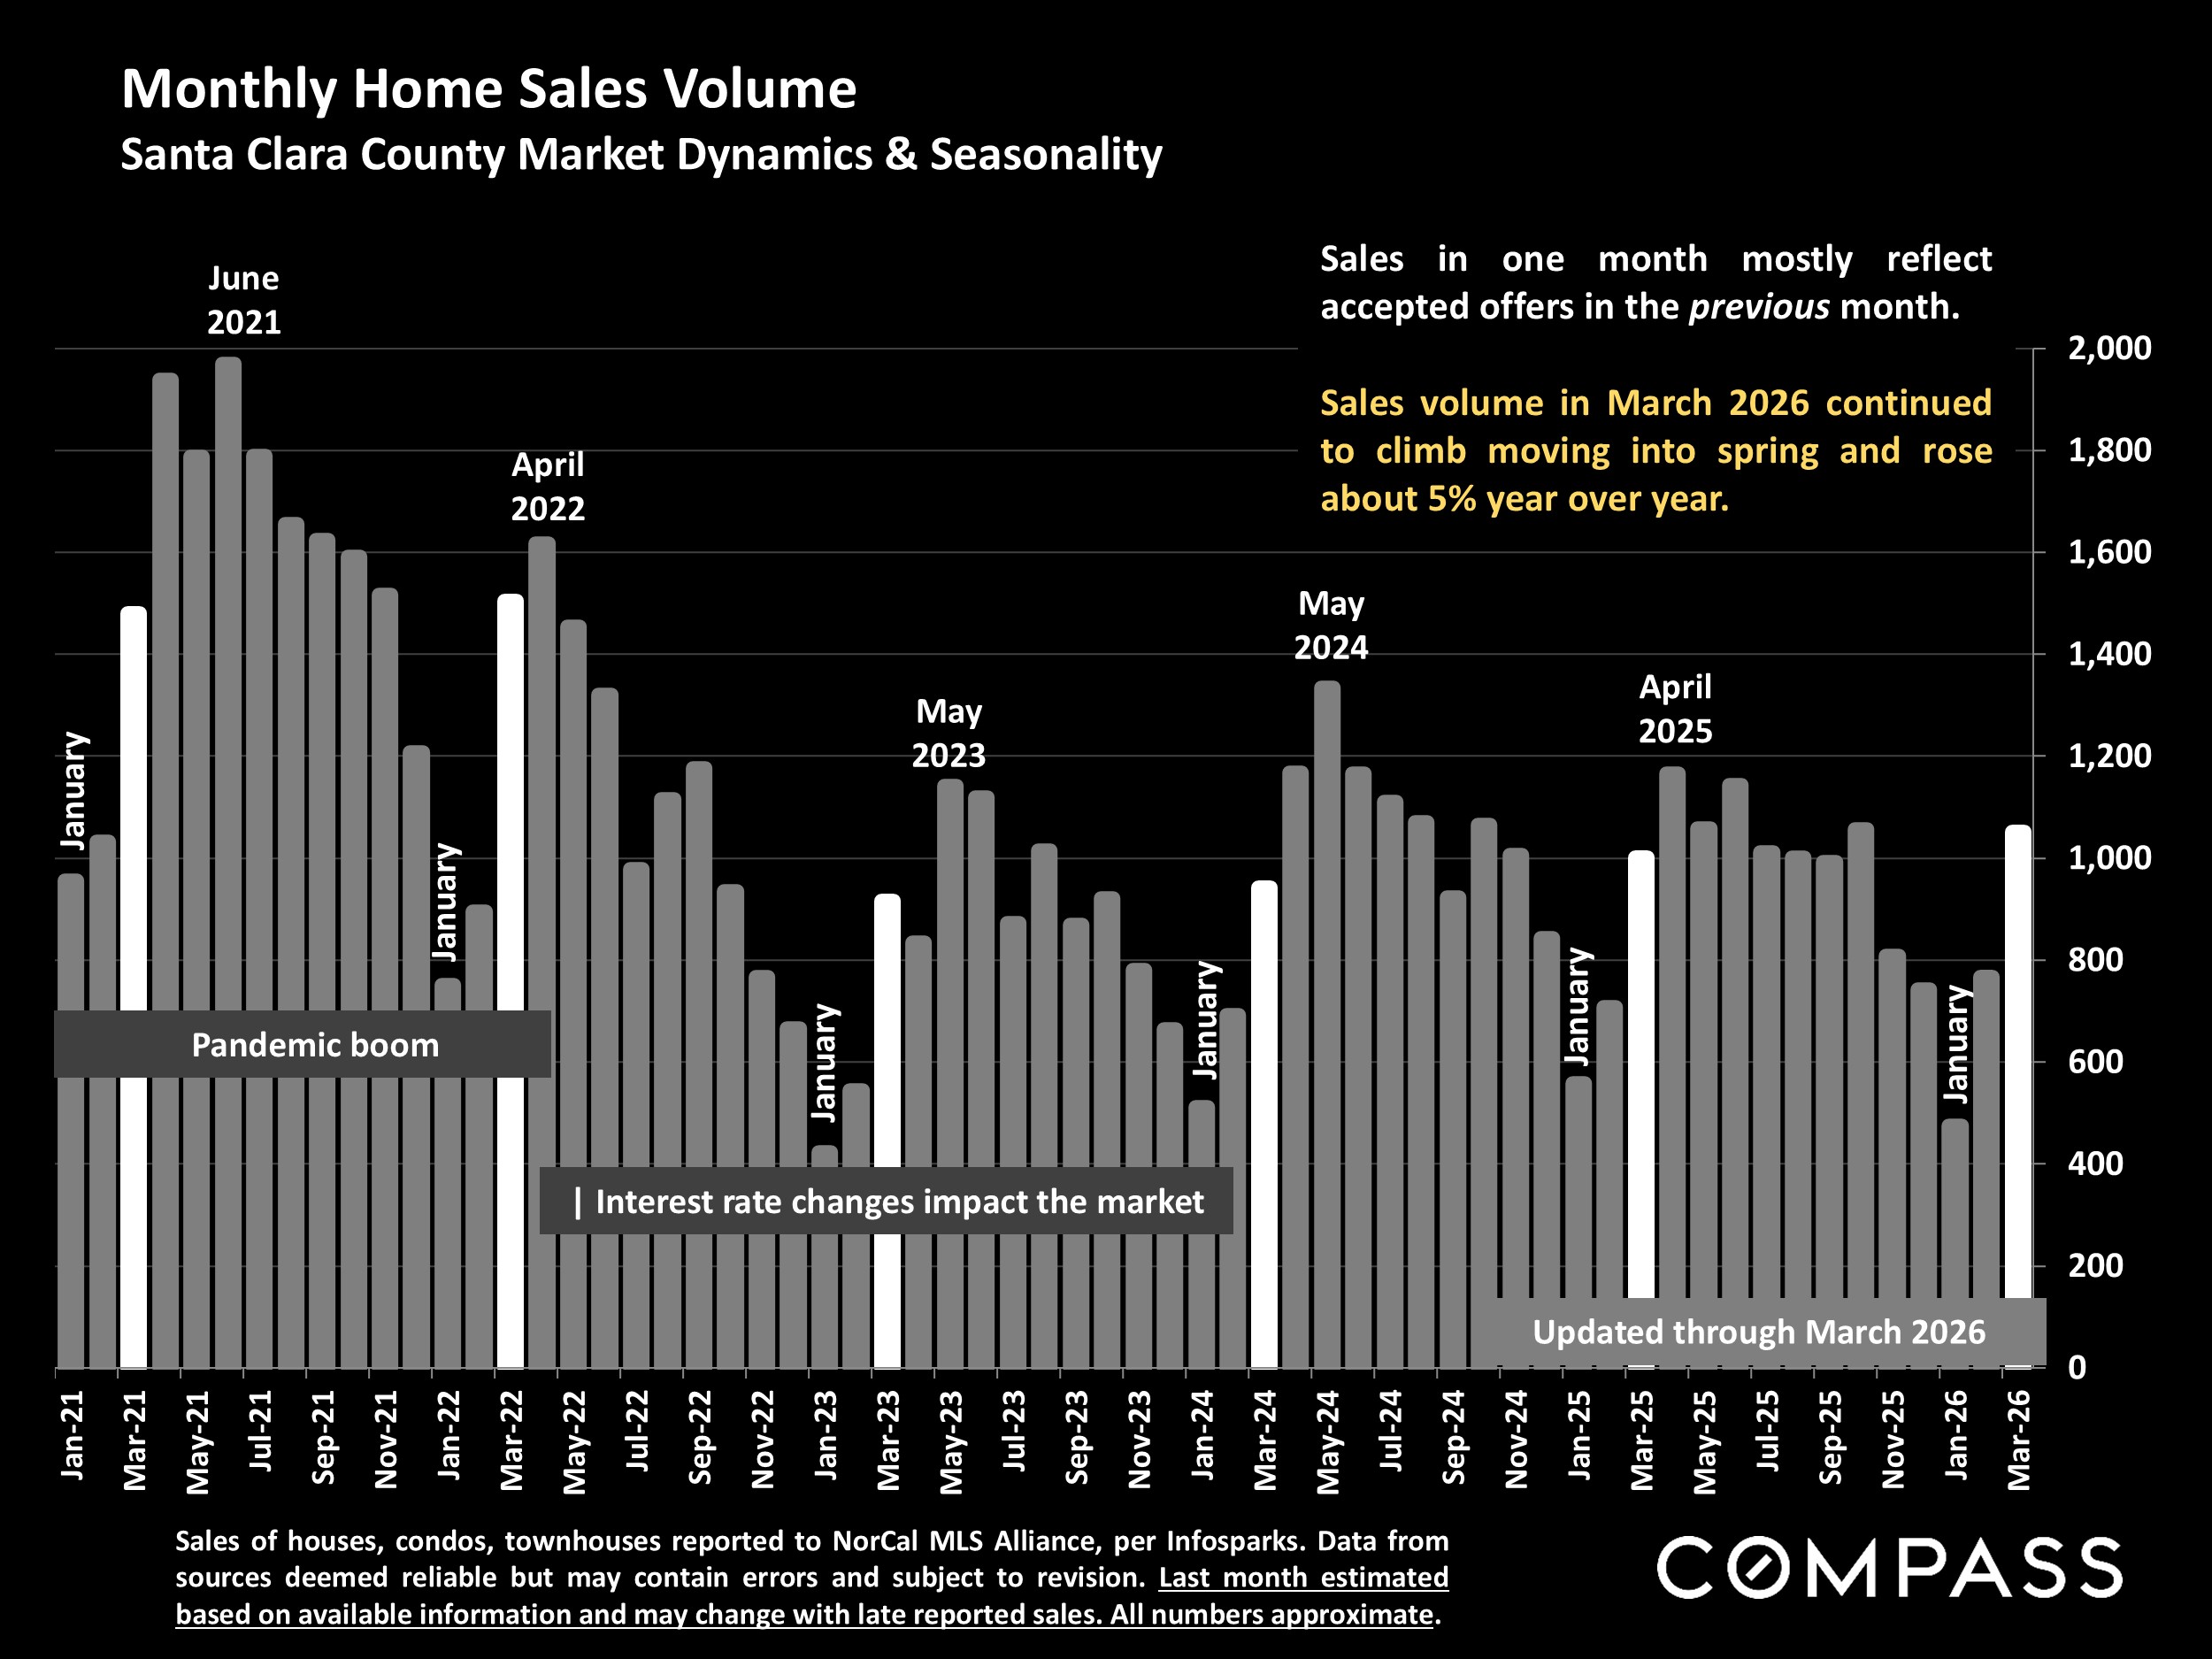
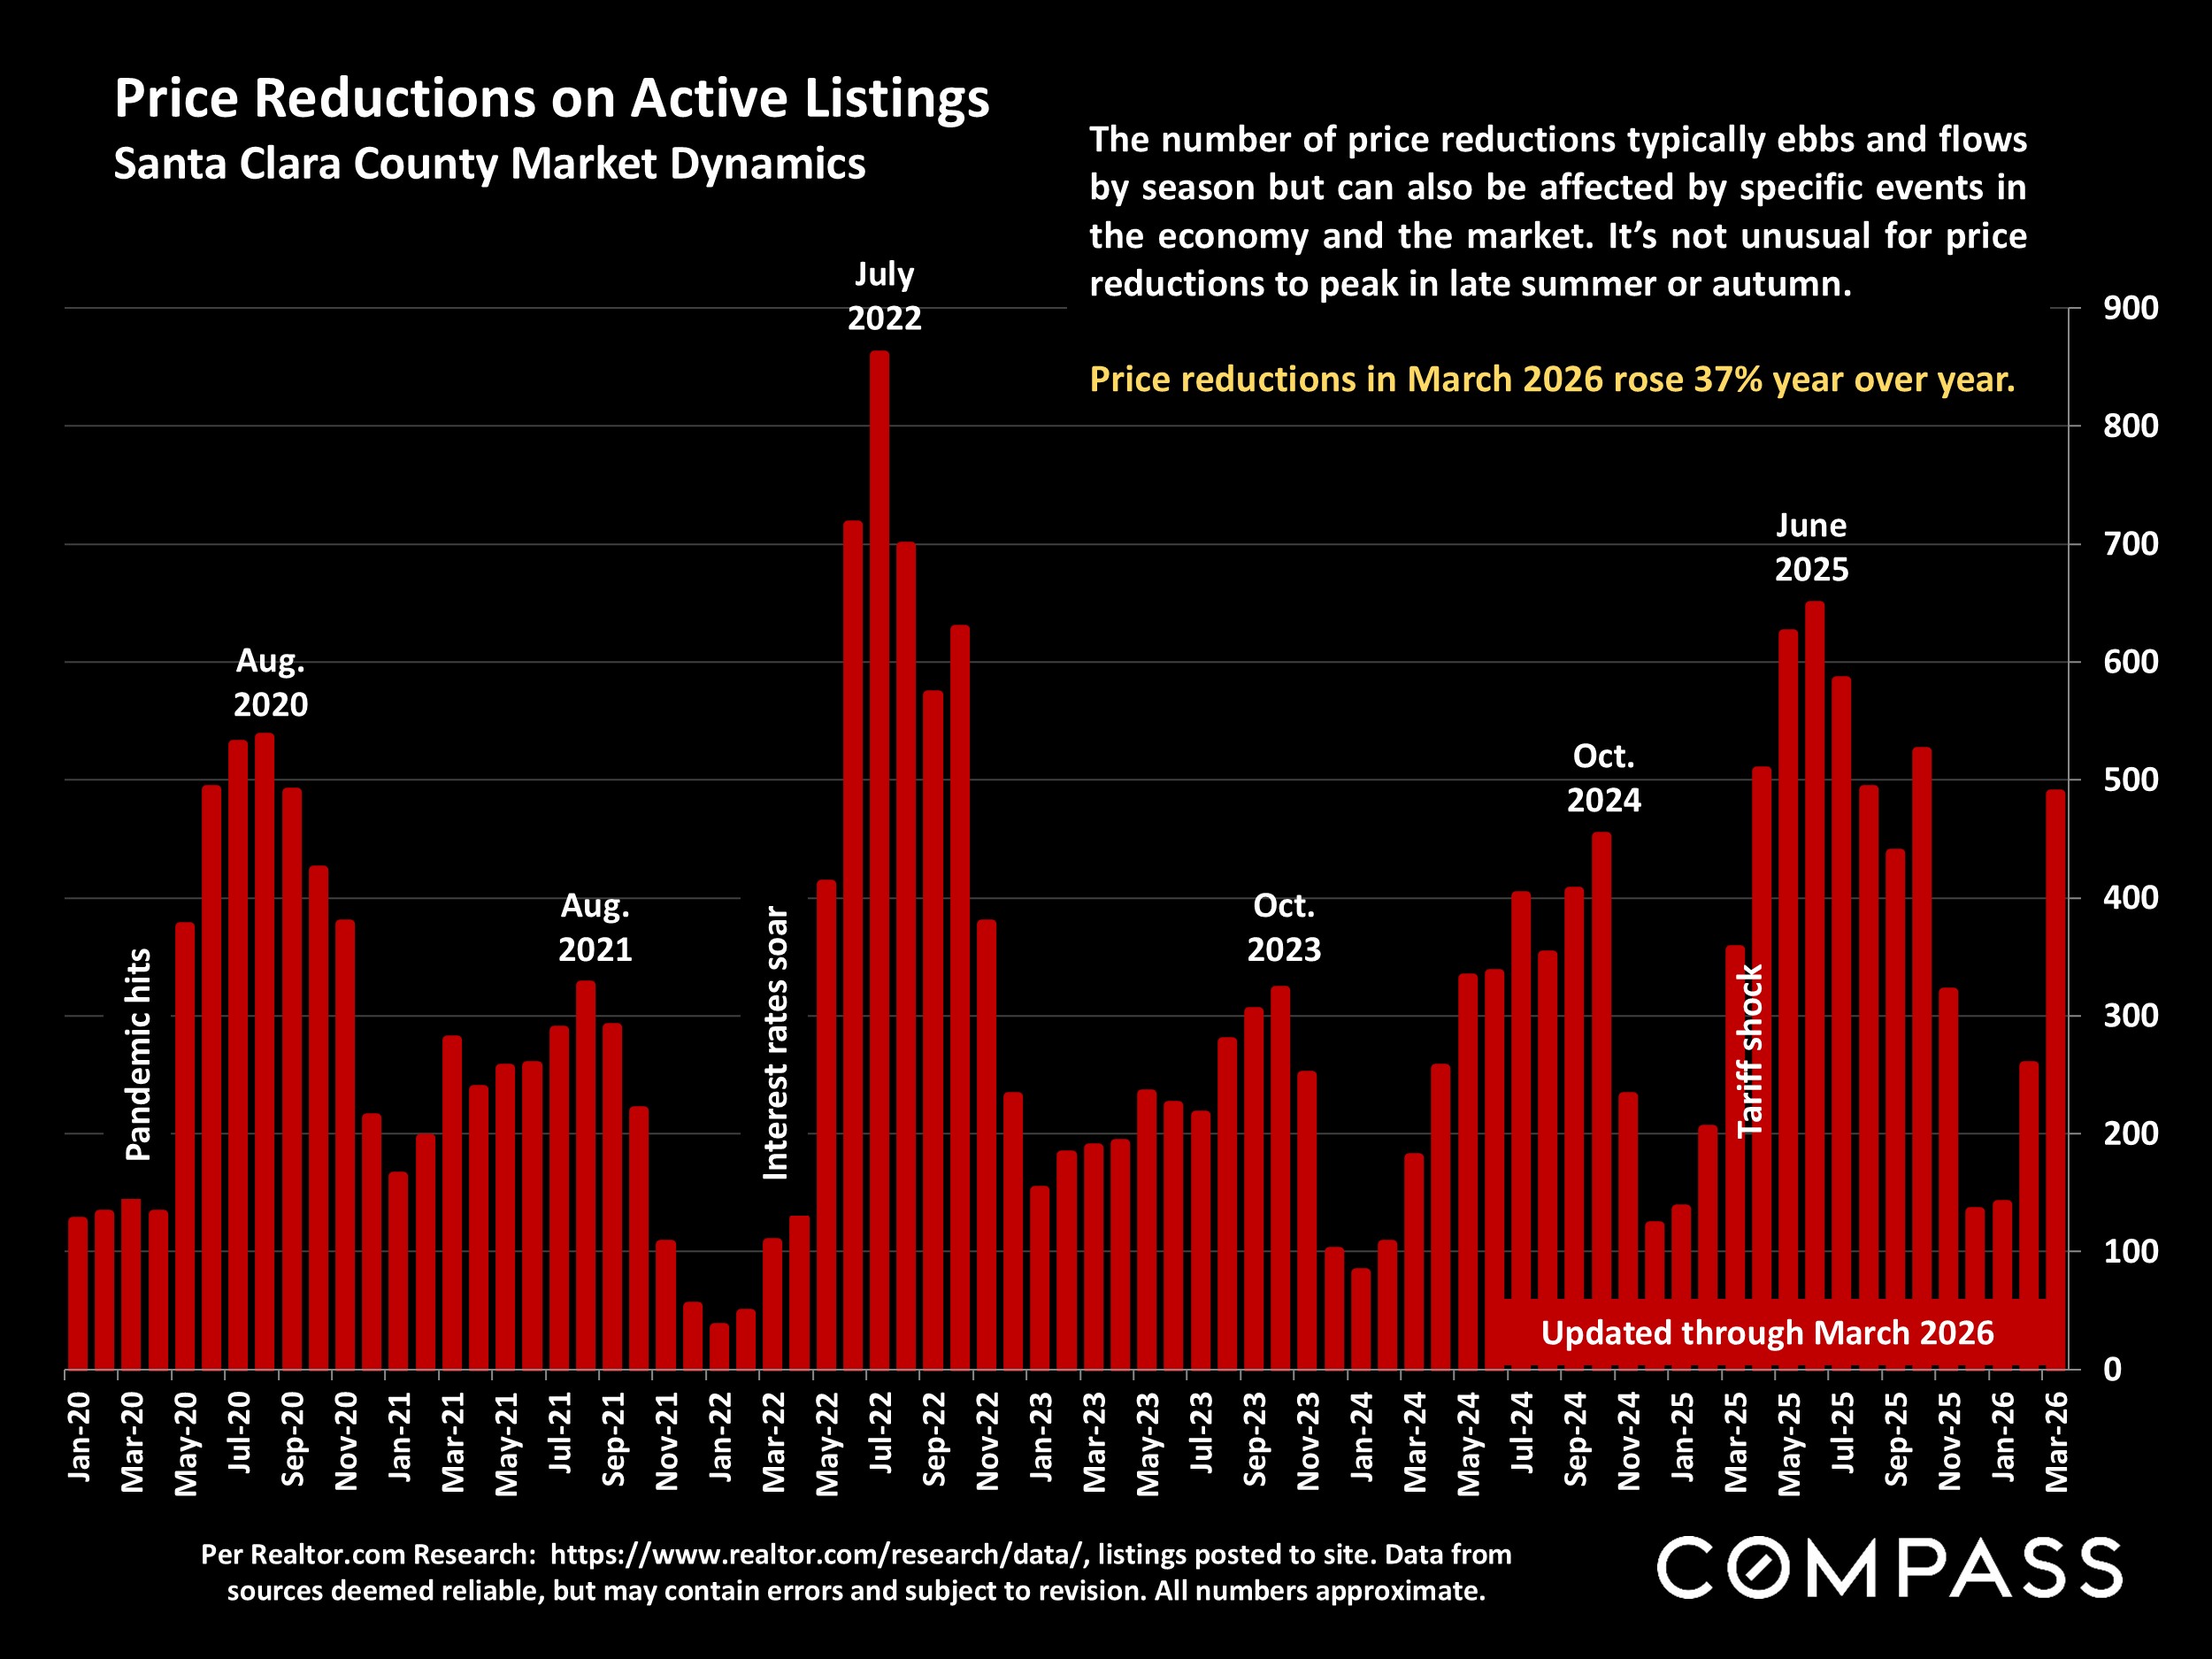
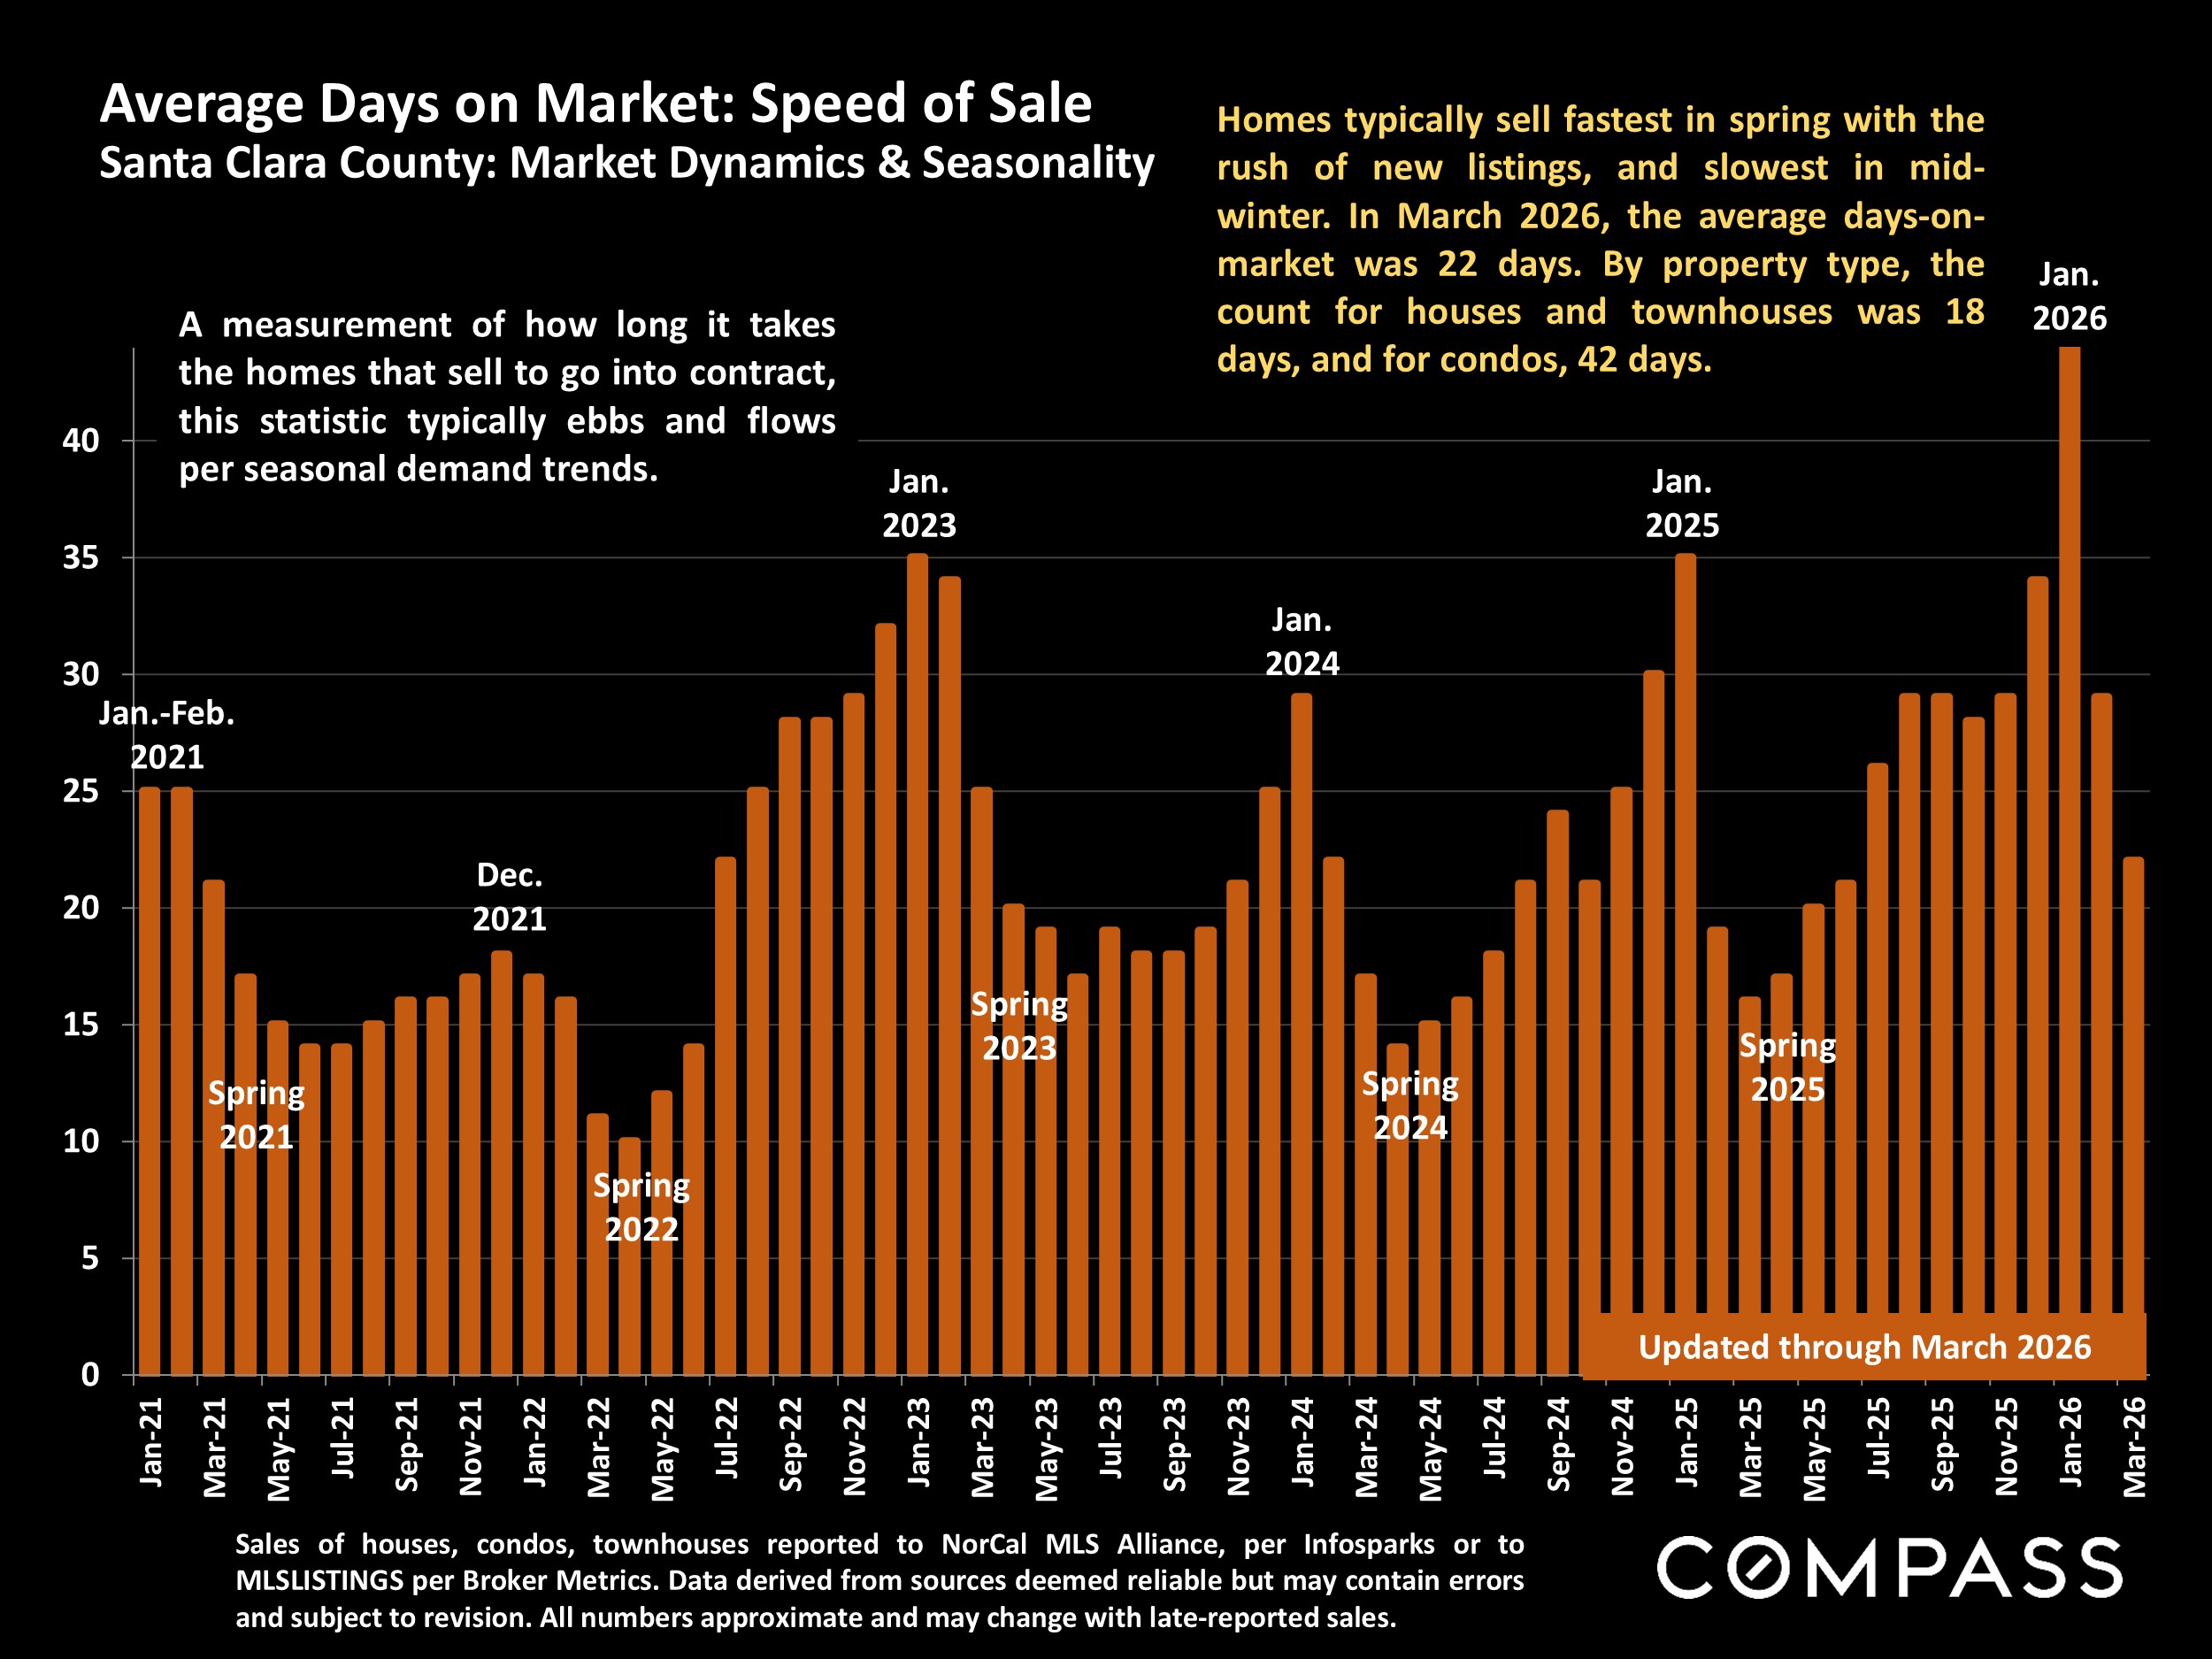
The numbers of new listings, listings for sale and listings going into contract in March climbed substantially from February. Overbidding increased and listings sold faster. The second quarter is usually the most active of the year, often seeing the highest median sales prices.
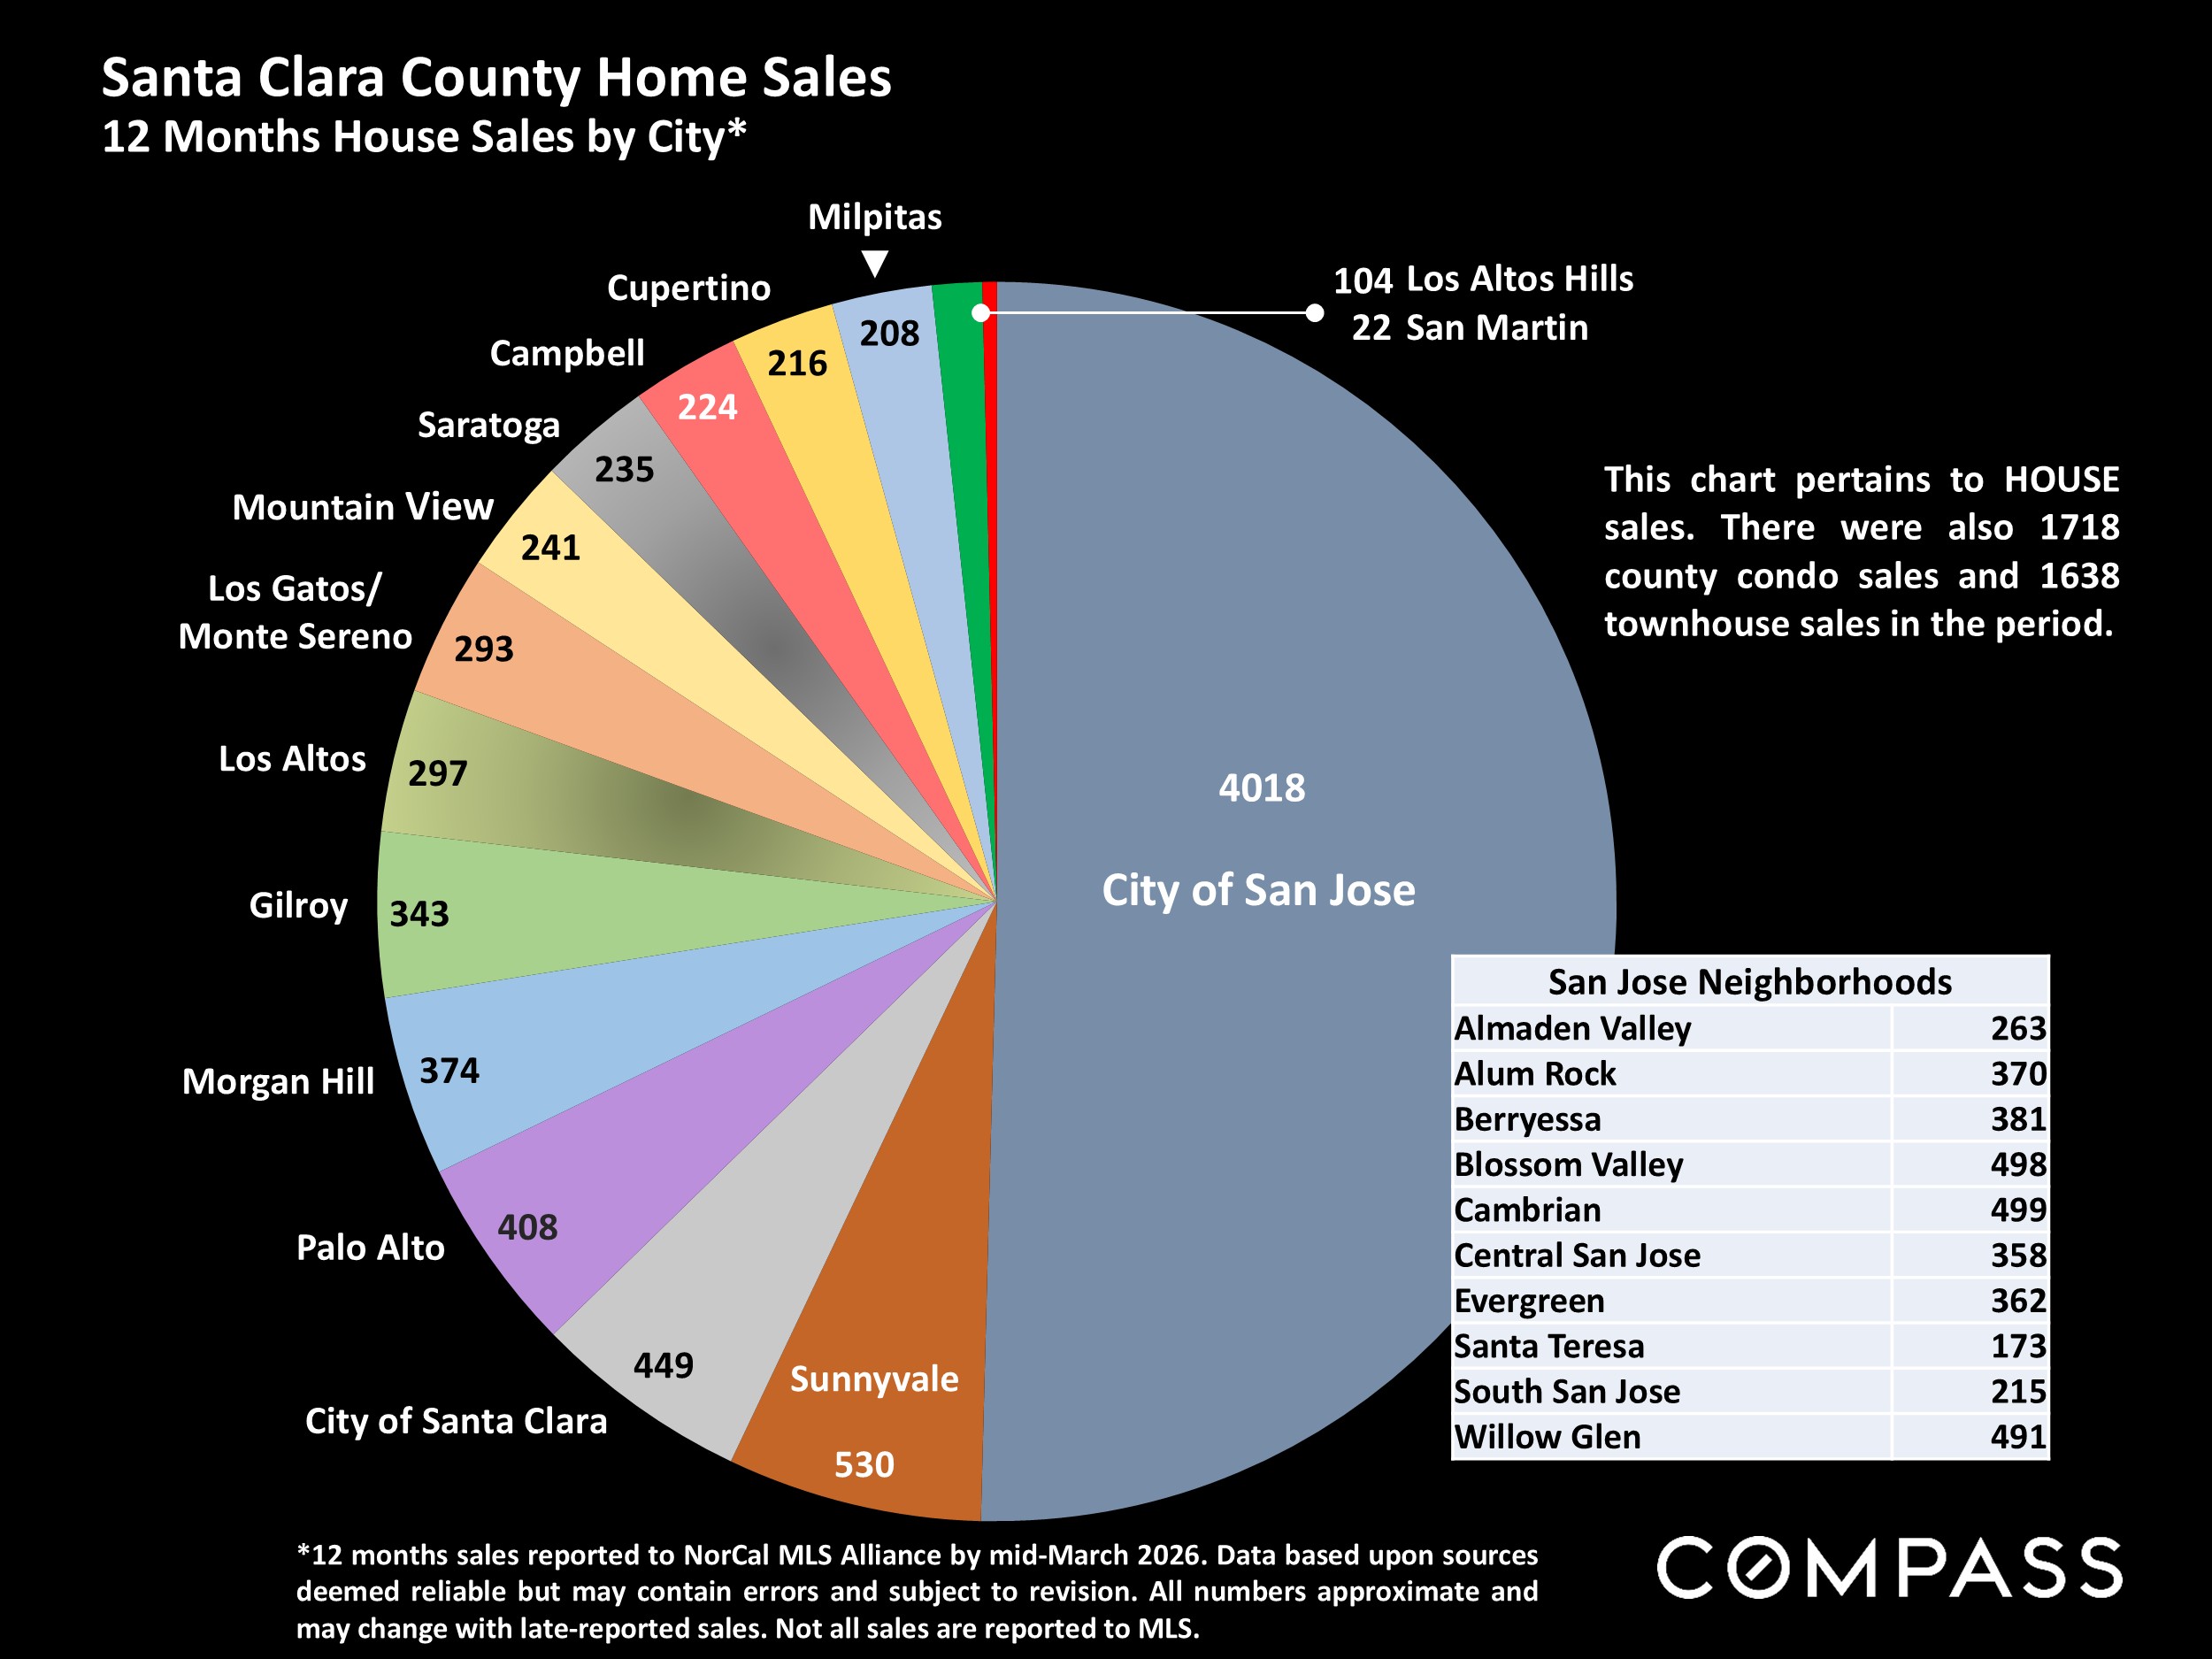
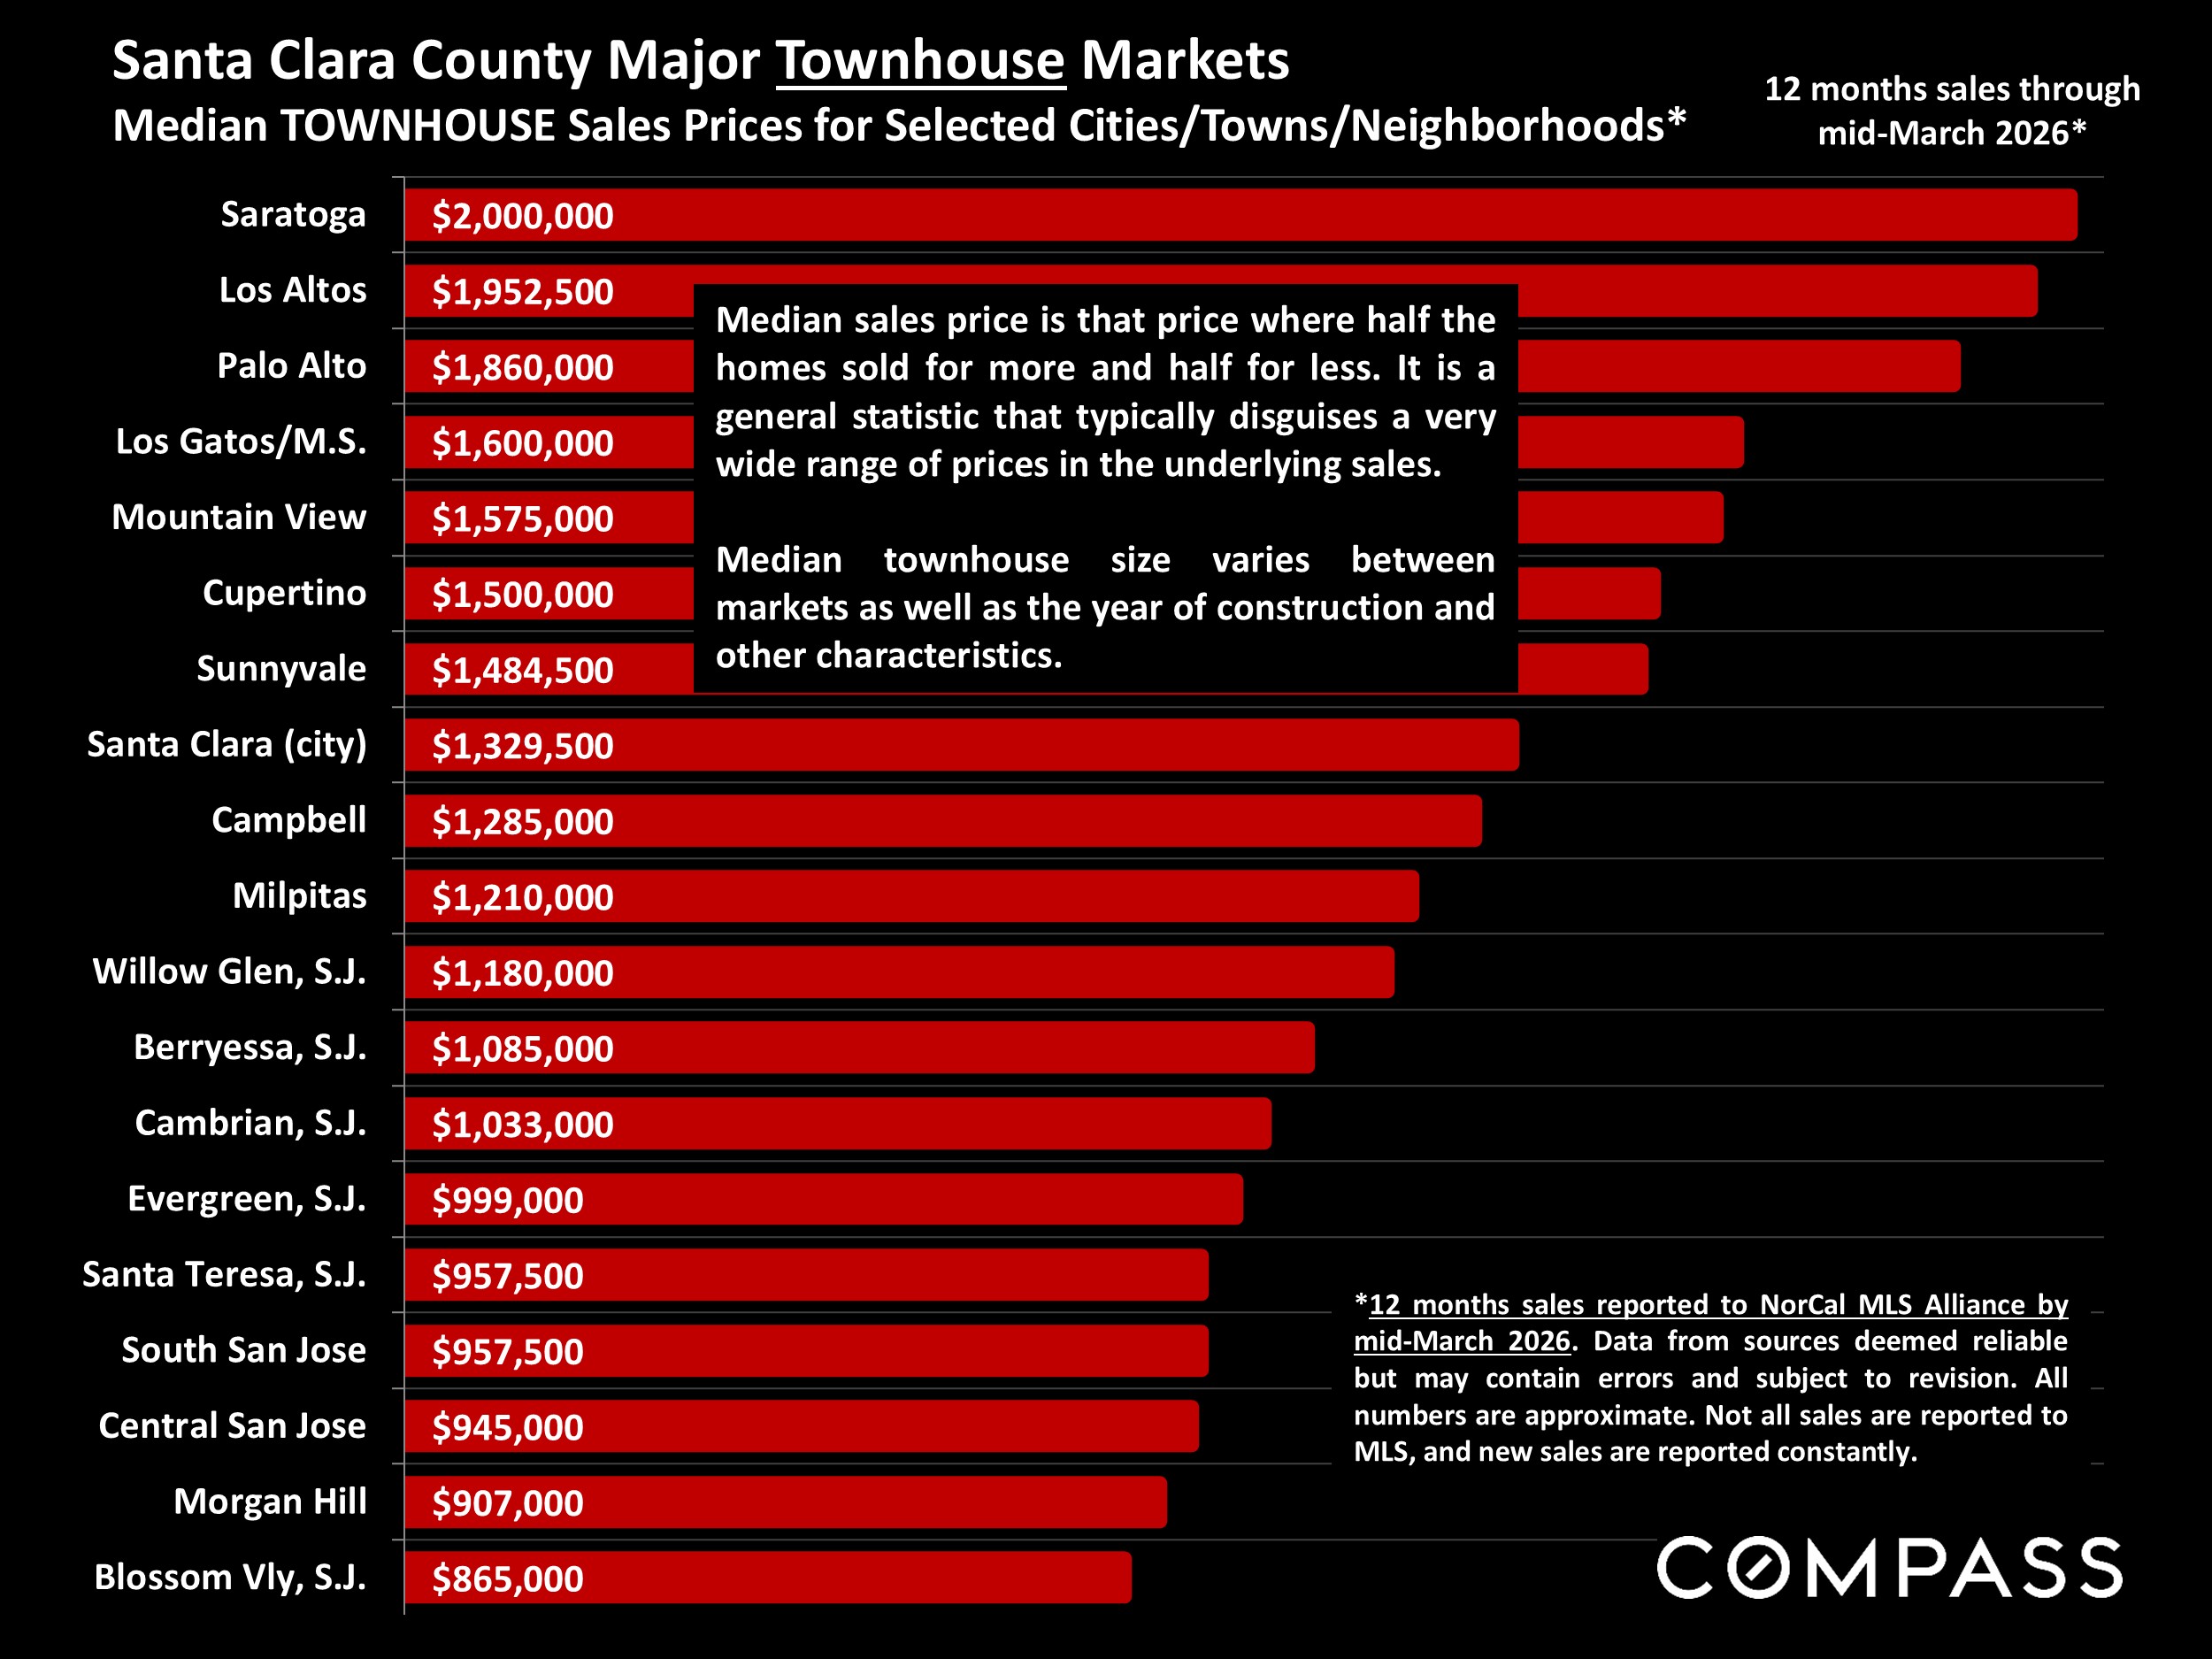
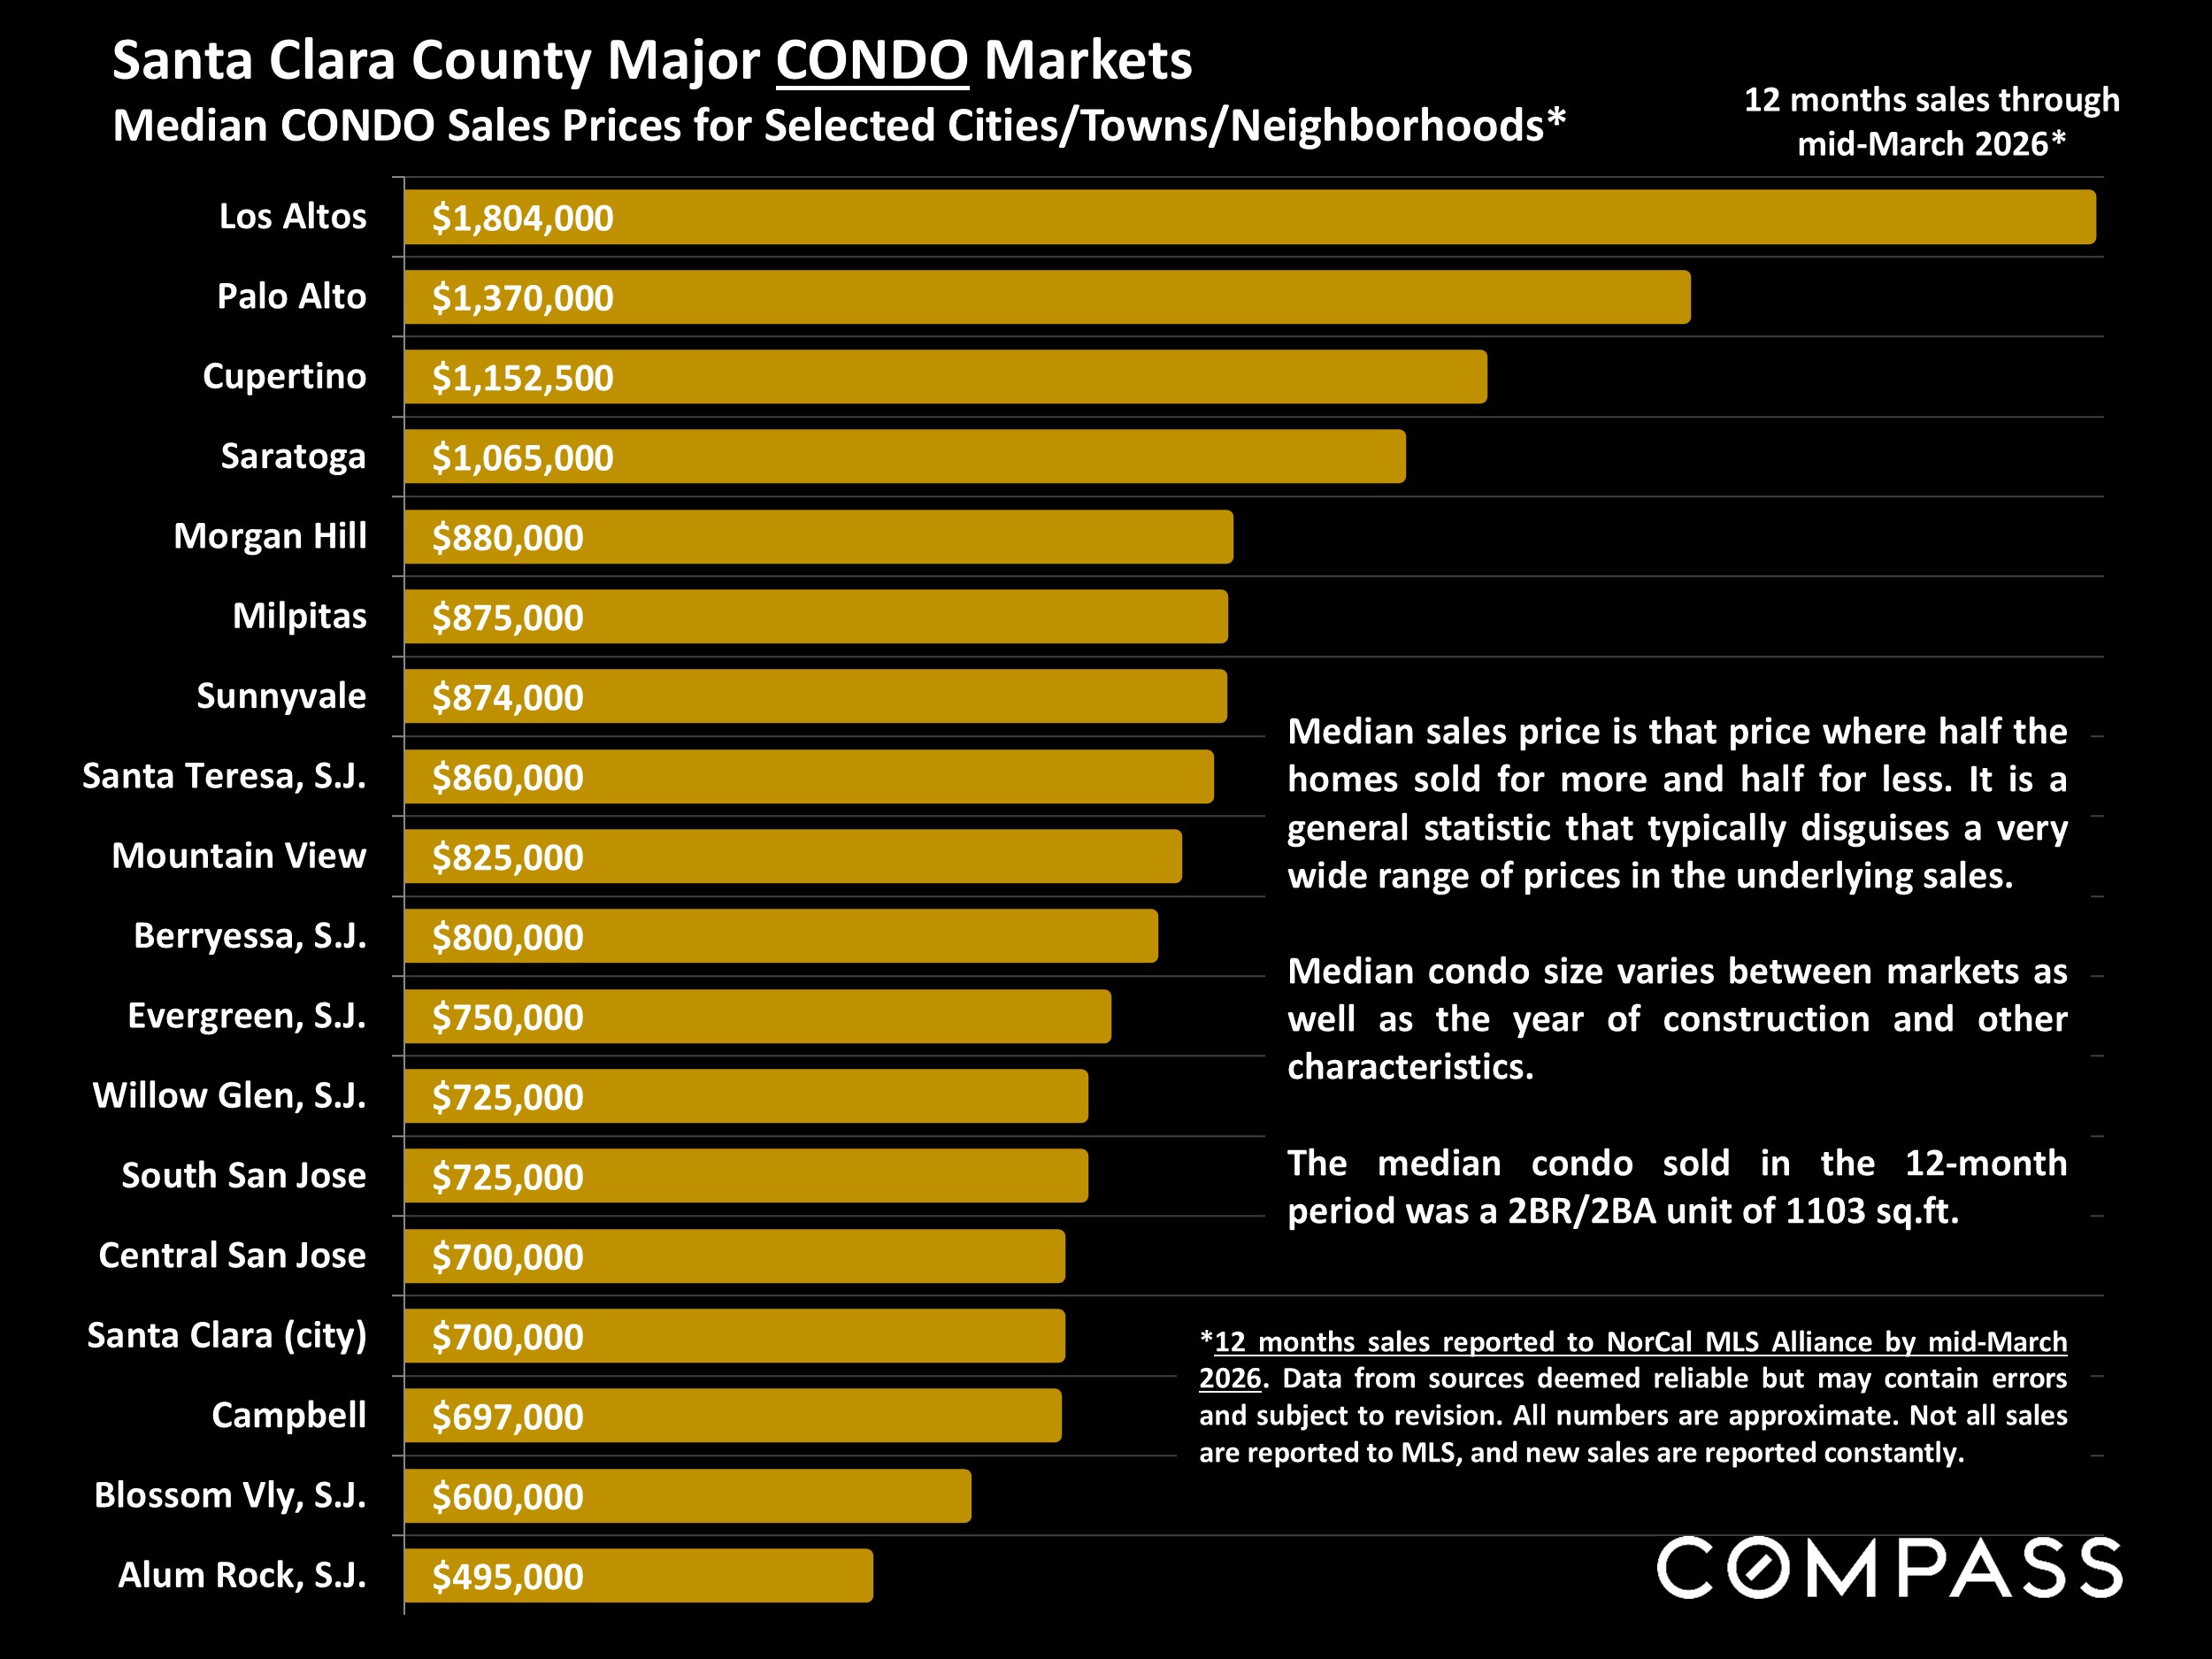
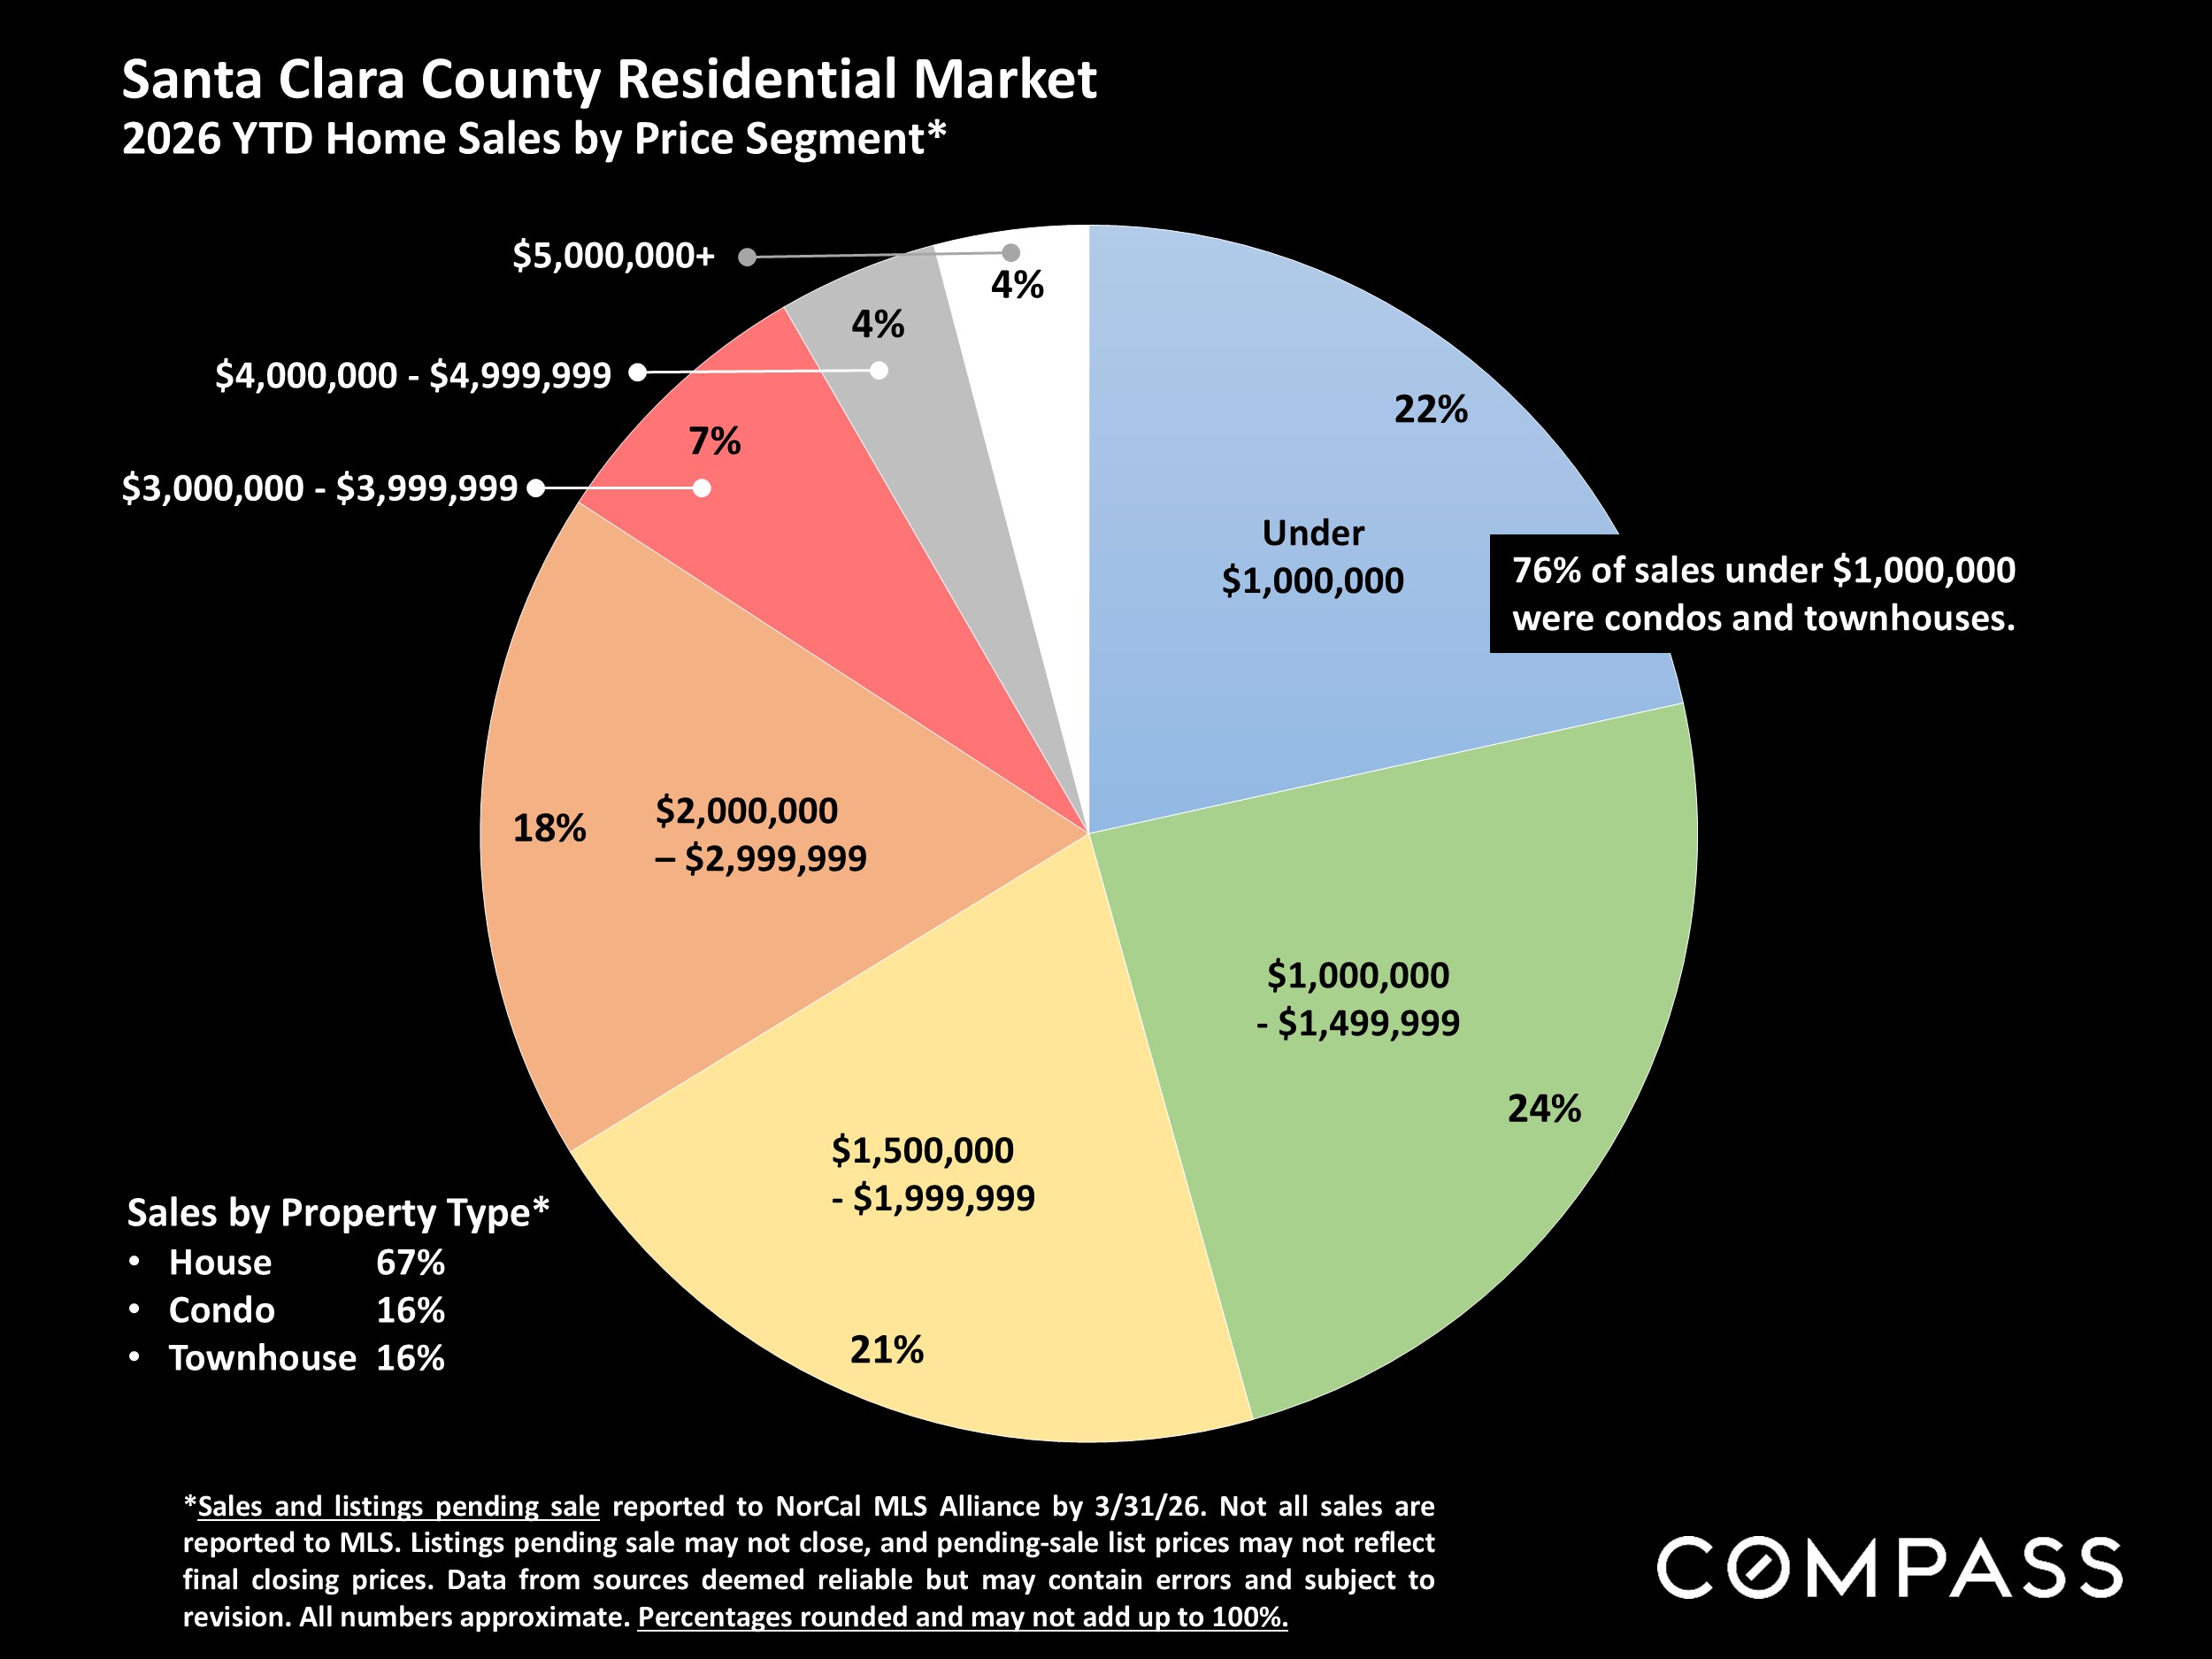
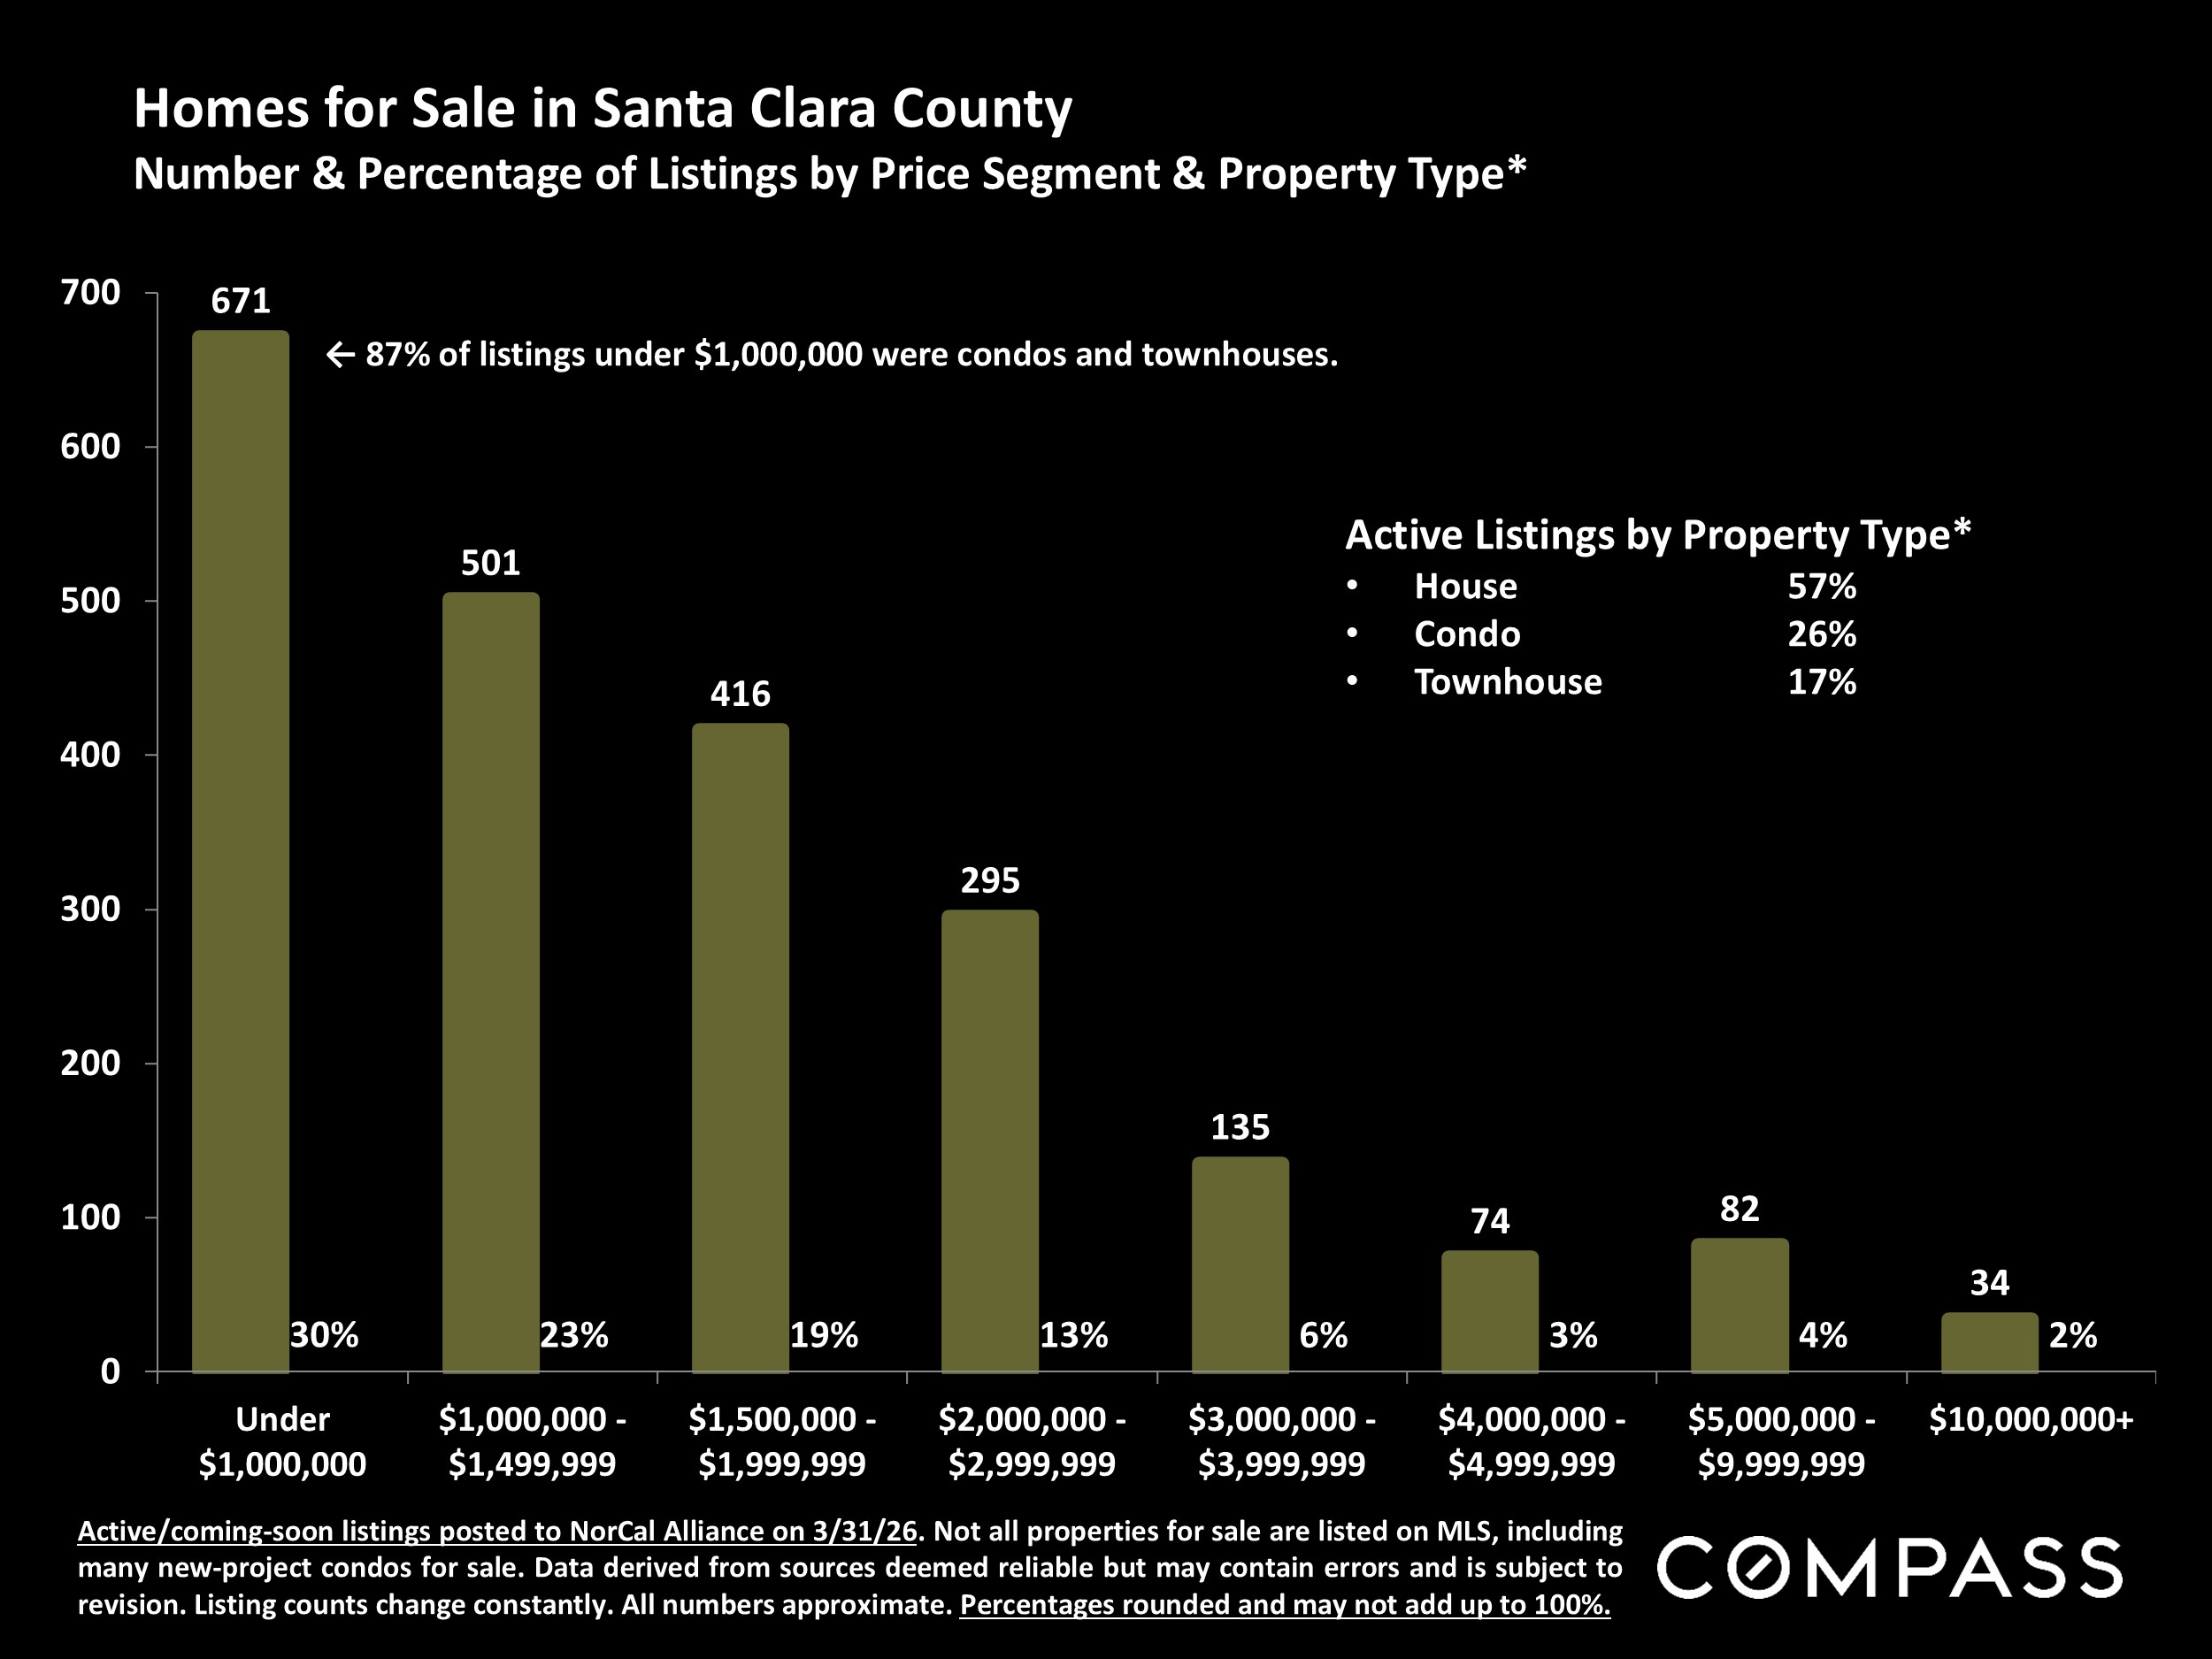
As has been the case for the last 2 years, affluent markets typically remained more heated than less expensive markets, and house and townhouse markets considerably stronger than condo markets.

Statistics are generalities, essentially summaries of widely disparate data generated by dozens, hundreds or thousands of unique, individual sales occurring within different time periods. They are best seen not as precise measurements, but as broad, comparative indicators, with reasonable margins of error. Anomalous fluctuations in statistics are not uncommon, especially in smaller, expensive market segments. Last period data should be considered estimates that may change with late-reported data. Different analytics programs sometimes define statistics – such as “active listings,” “days on market,” and “months supply of inventory” – differently: what is most meaningful are not specific calculations but the trends they illustrate. Most listing and sales data derives from the local or regional multi-listing service (MLS) of the area specified in the analysis, but not all listings or sales are reported to MLS and these won’t be reflected in the data. “Homes” signifies real-property, single-household housing units: houses, condos, co-ops, townhouses, duets and TICs (but not mobile homes), as applicable to each market. City/town names refer specifically to the named cities and towns, unless otherwise delineated. Multi-county metro areas will be specified as such. Data from sources deemed reliable but may contain errors and subject to revision. All numbers to be considered approximate.
Many aspects of value cannot be adequately reflected in median and average statistics: curb appeal, age, condition, amenities, views, lot size, quality of outdoor space, “bonus” rooms, additional parking, quality of location within the neighborhood, and so on. How any of these statistics apply to any particular home is unknown without a specific comparative market analysis.
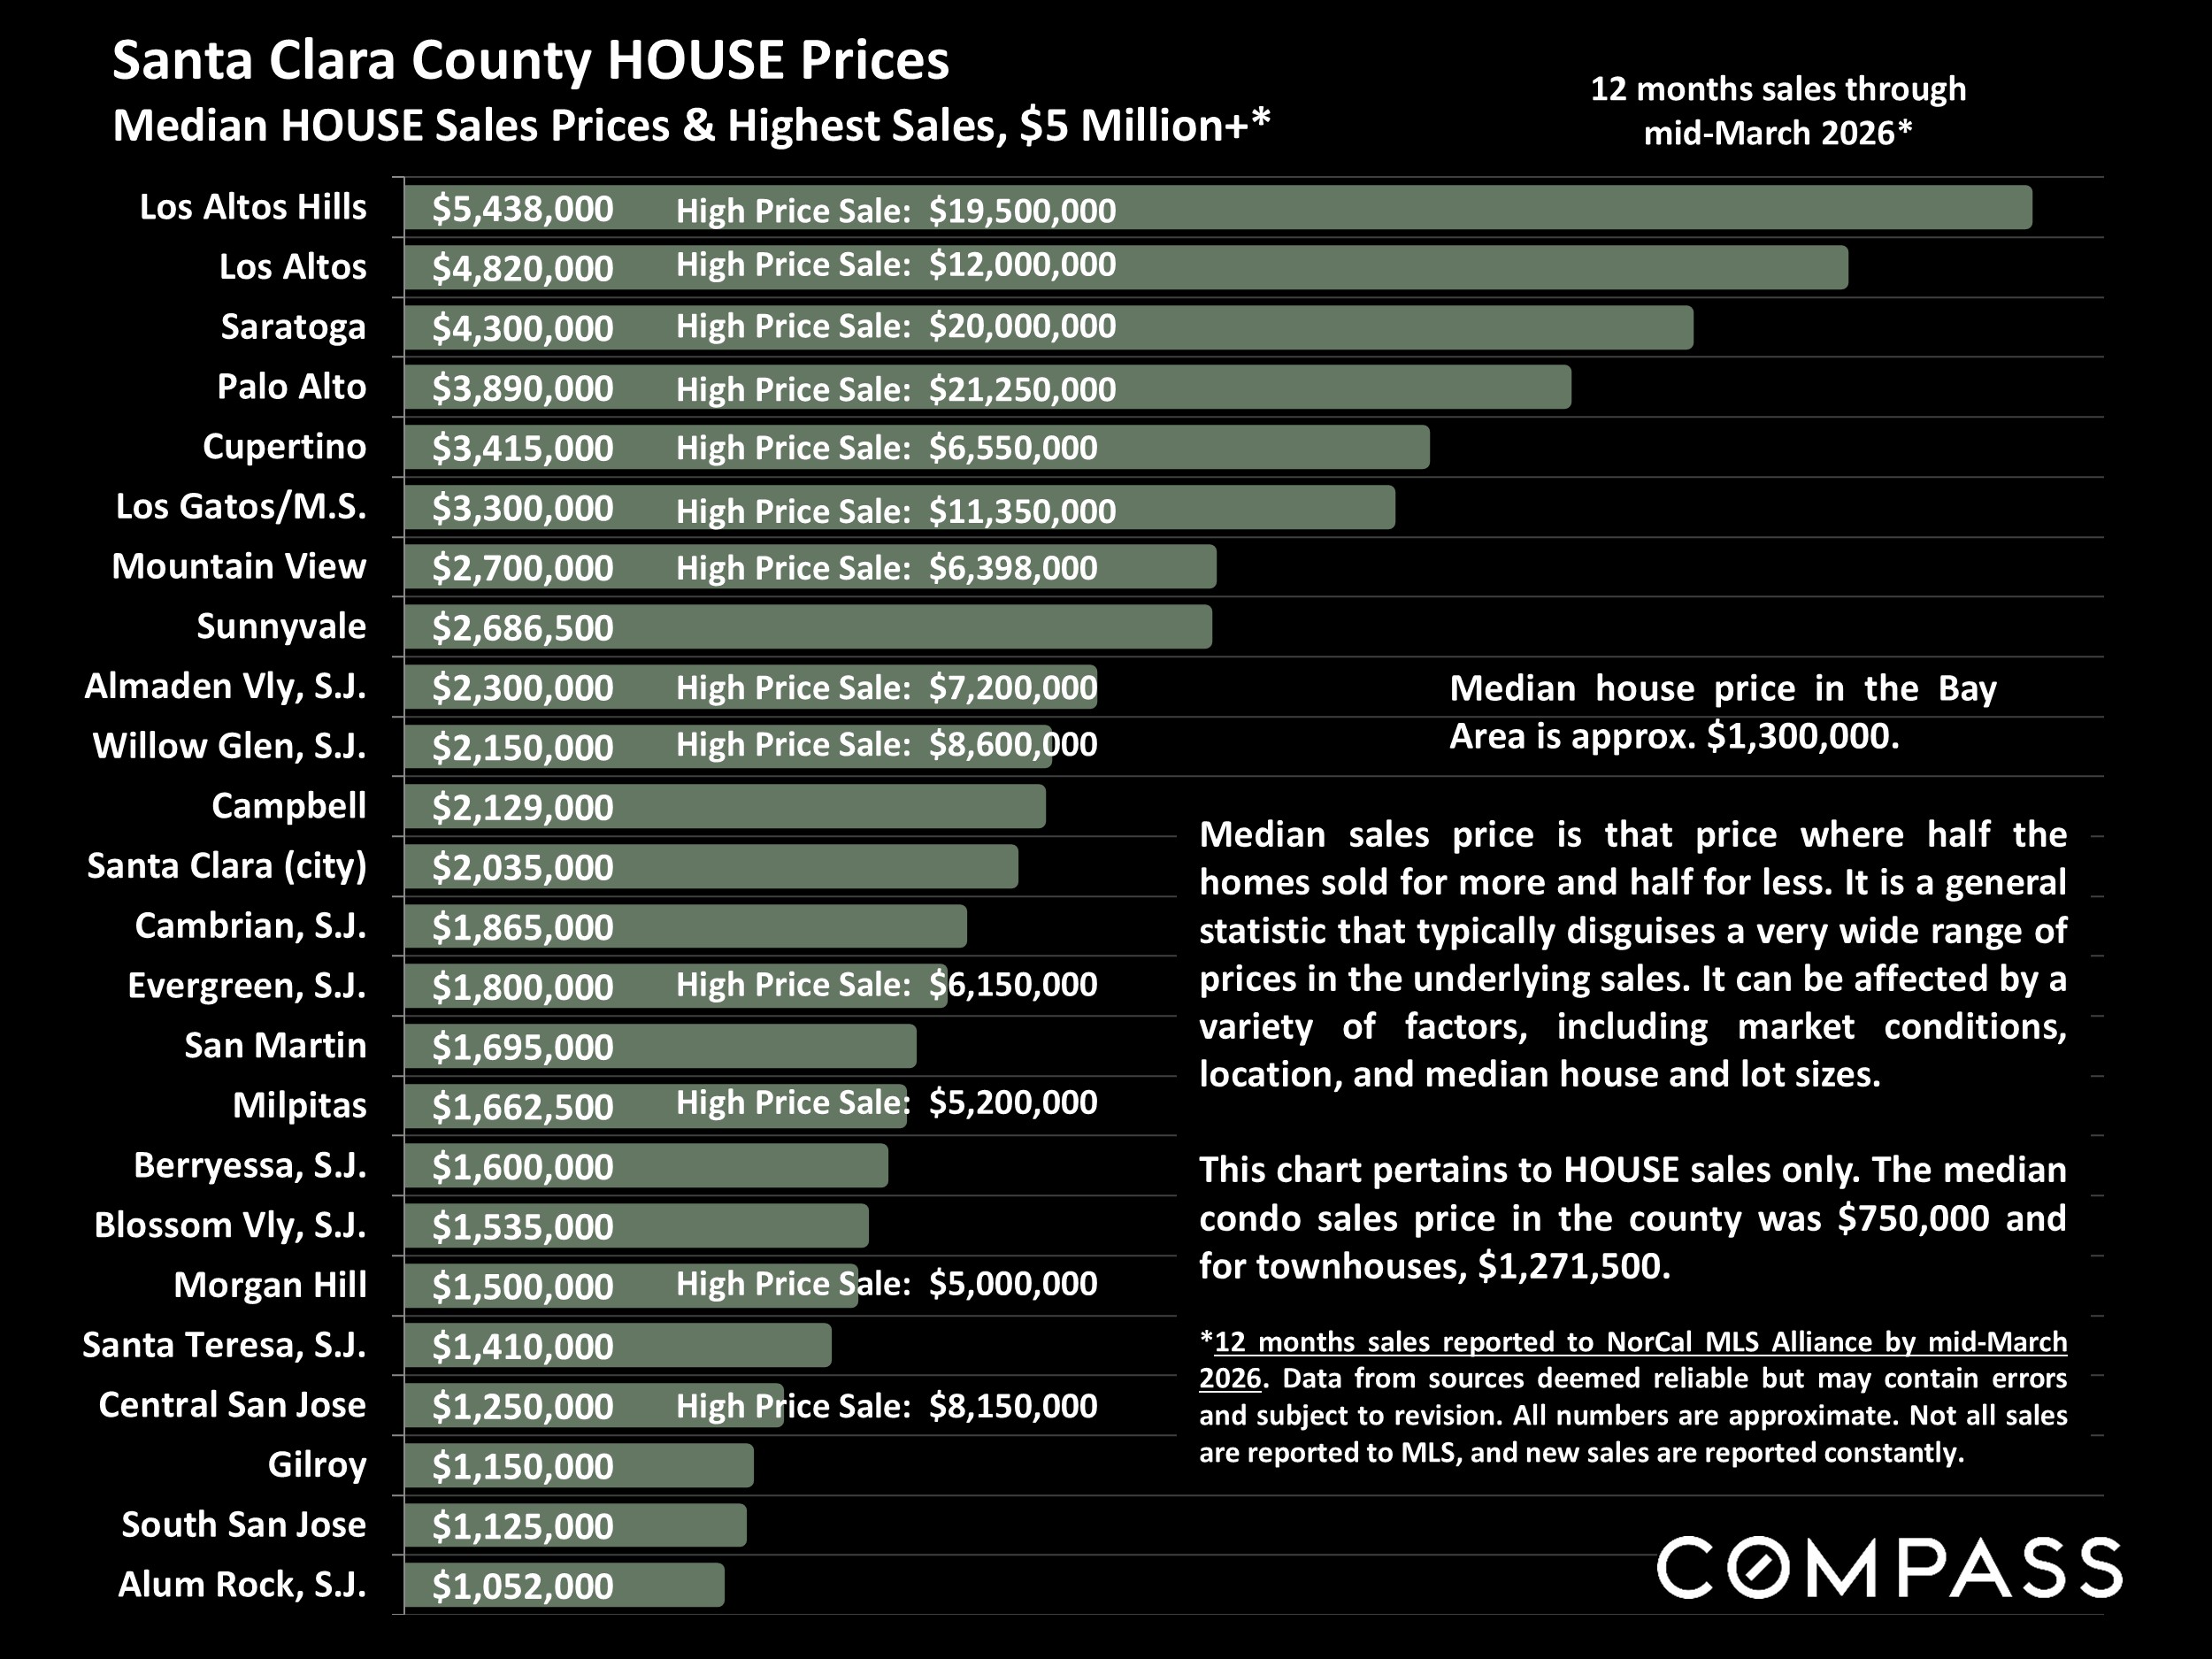
Median Sales Price is that price at which half the properties sold for more and half for less. It may be affected by seasonality, “unusual” events, or changes in inventory and buying trends, as well as by changes in fair market value. The median sales price for an area will often conceal an enormous variety of sales prices in the underlying individual sales.
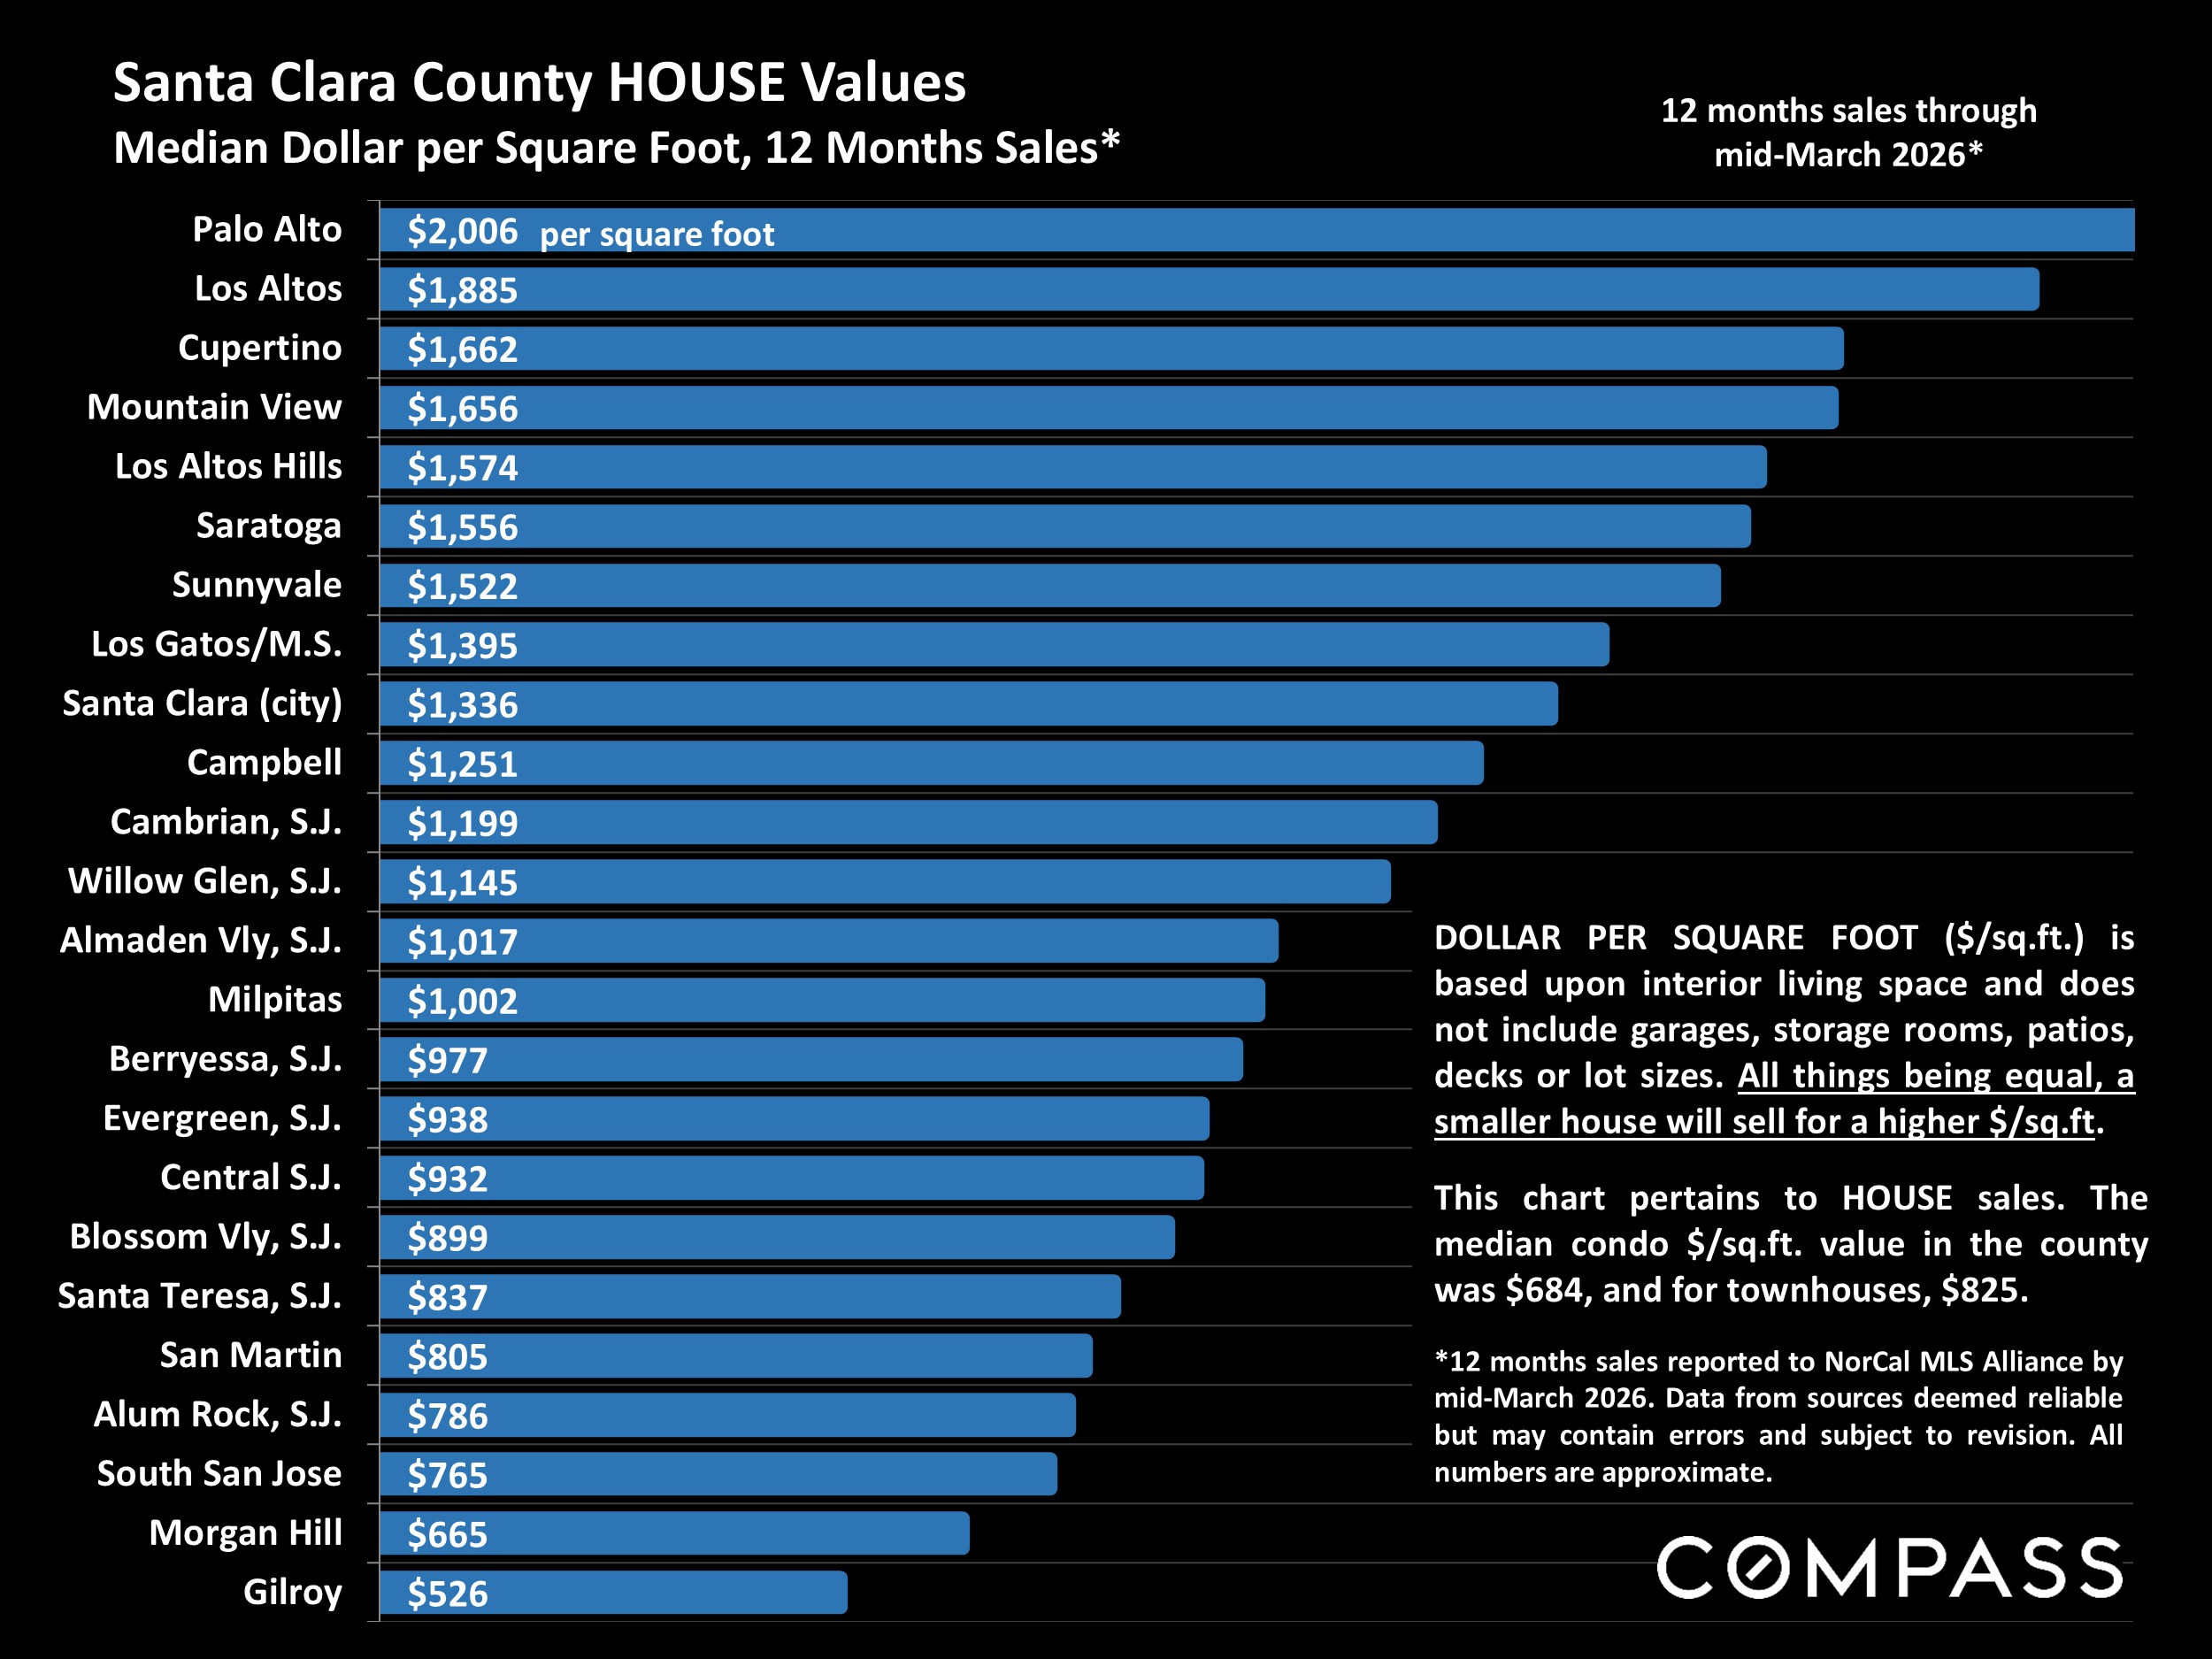
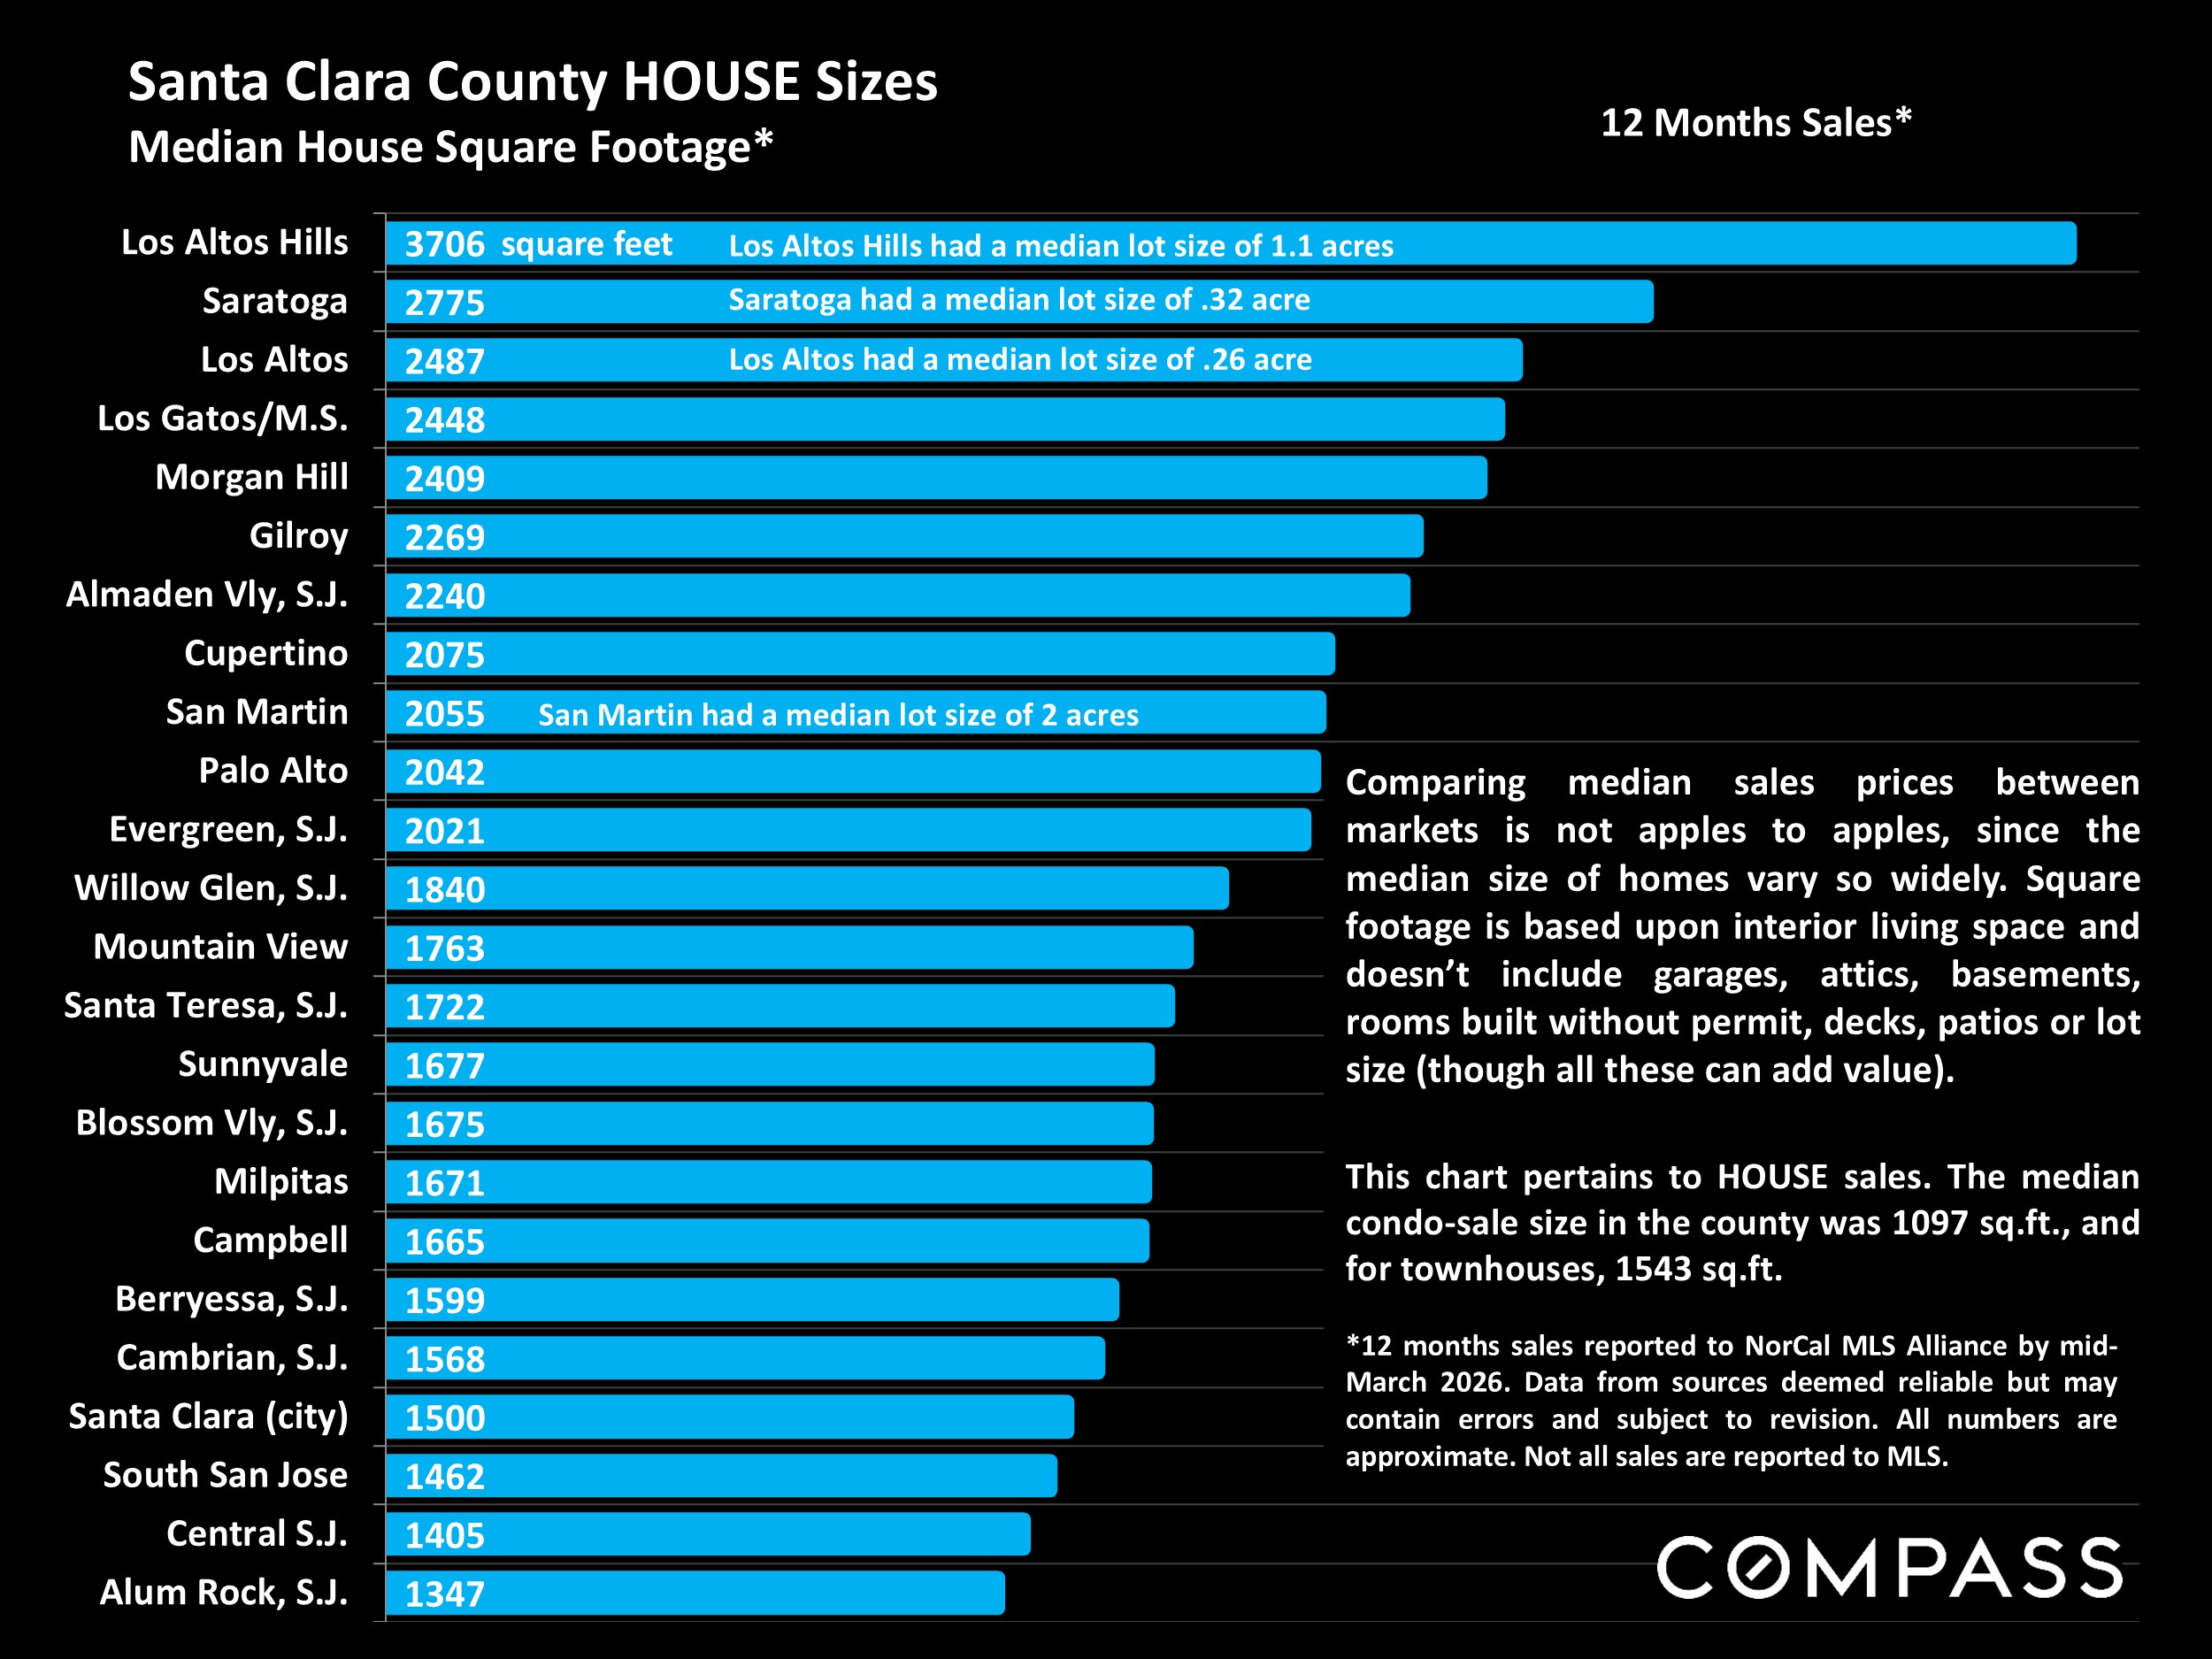
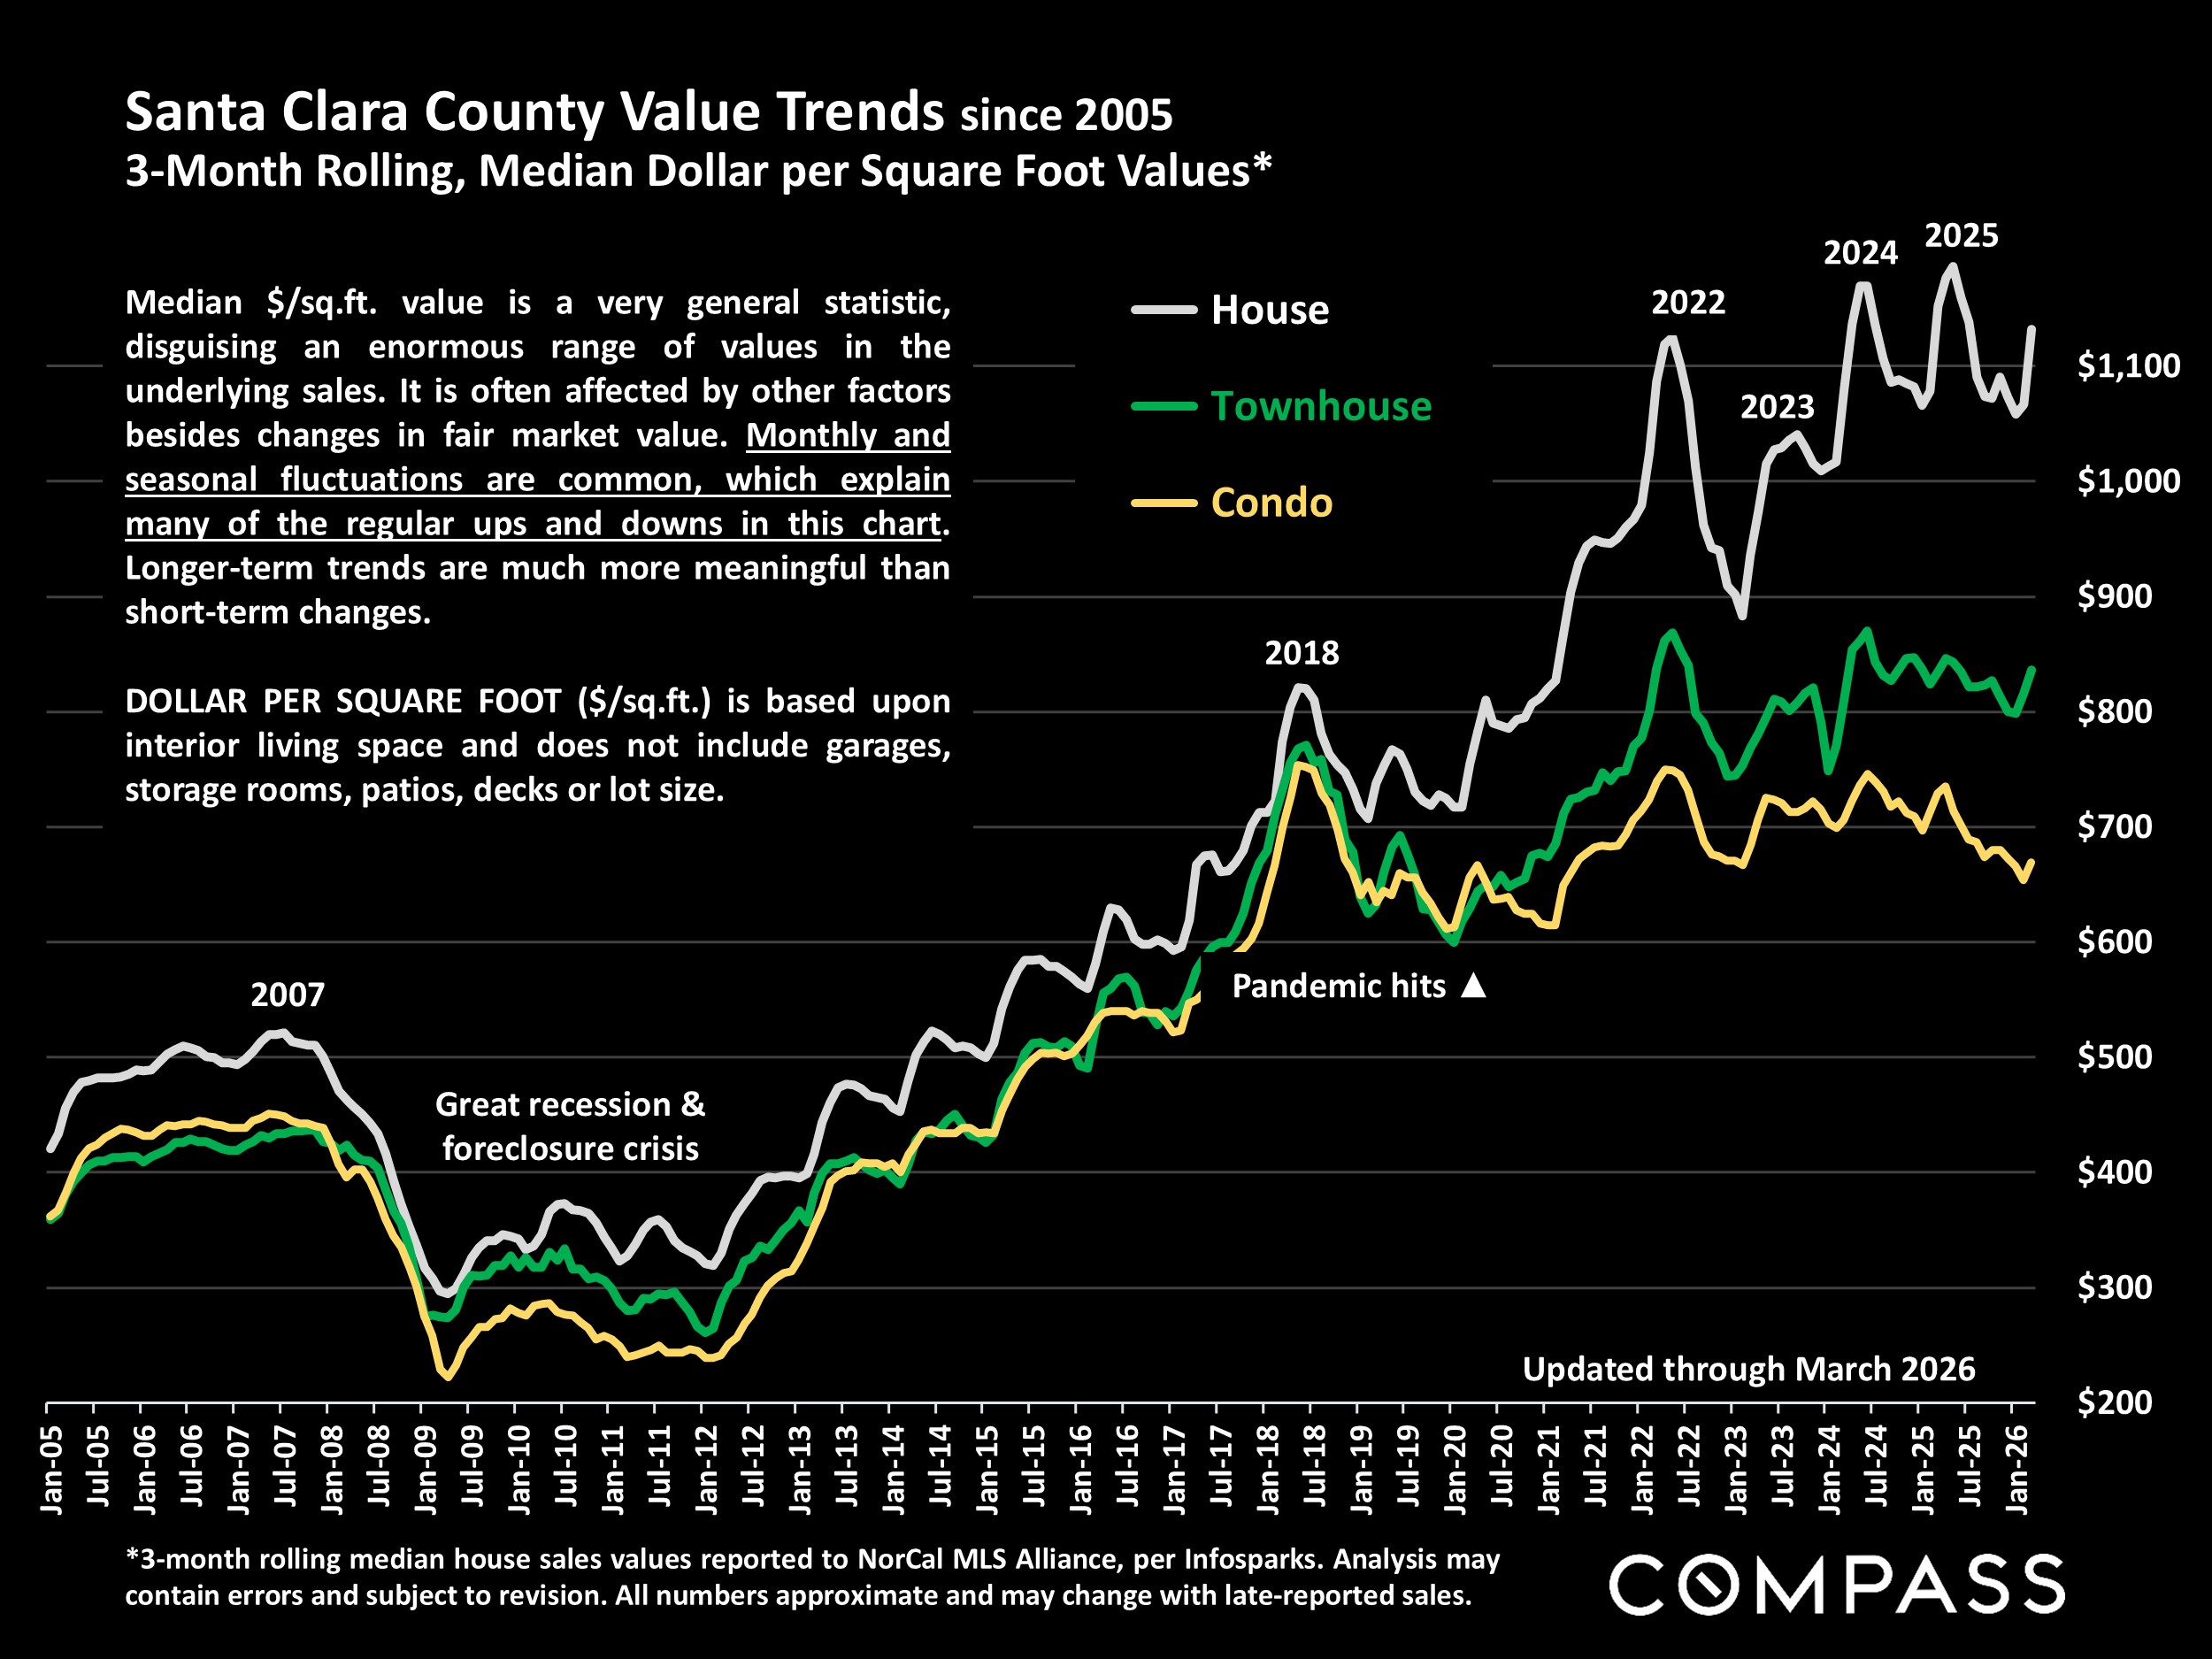
Dollar per Square Foot is based upon the home’s interior living space and does not include garages, unfinished attics and basements, rooms built without permit, patios, decks or yards (though all those can add value to a home). These figures are usually derived from appraisals or tax records, but are sometimes unreliable (especially for older homes) or unreported altogether. The calculation can only be made on those home sales that reported square footage.