All San Francisco Bay Area markets see significant seasonal ebbs and flows in supply and demand, though trends can vary according to local market dynamics.
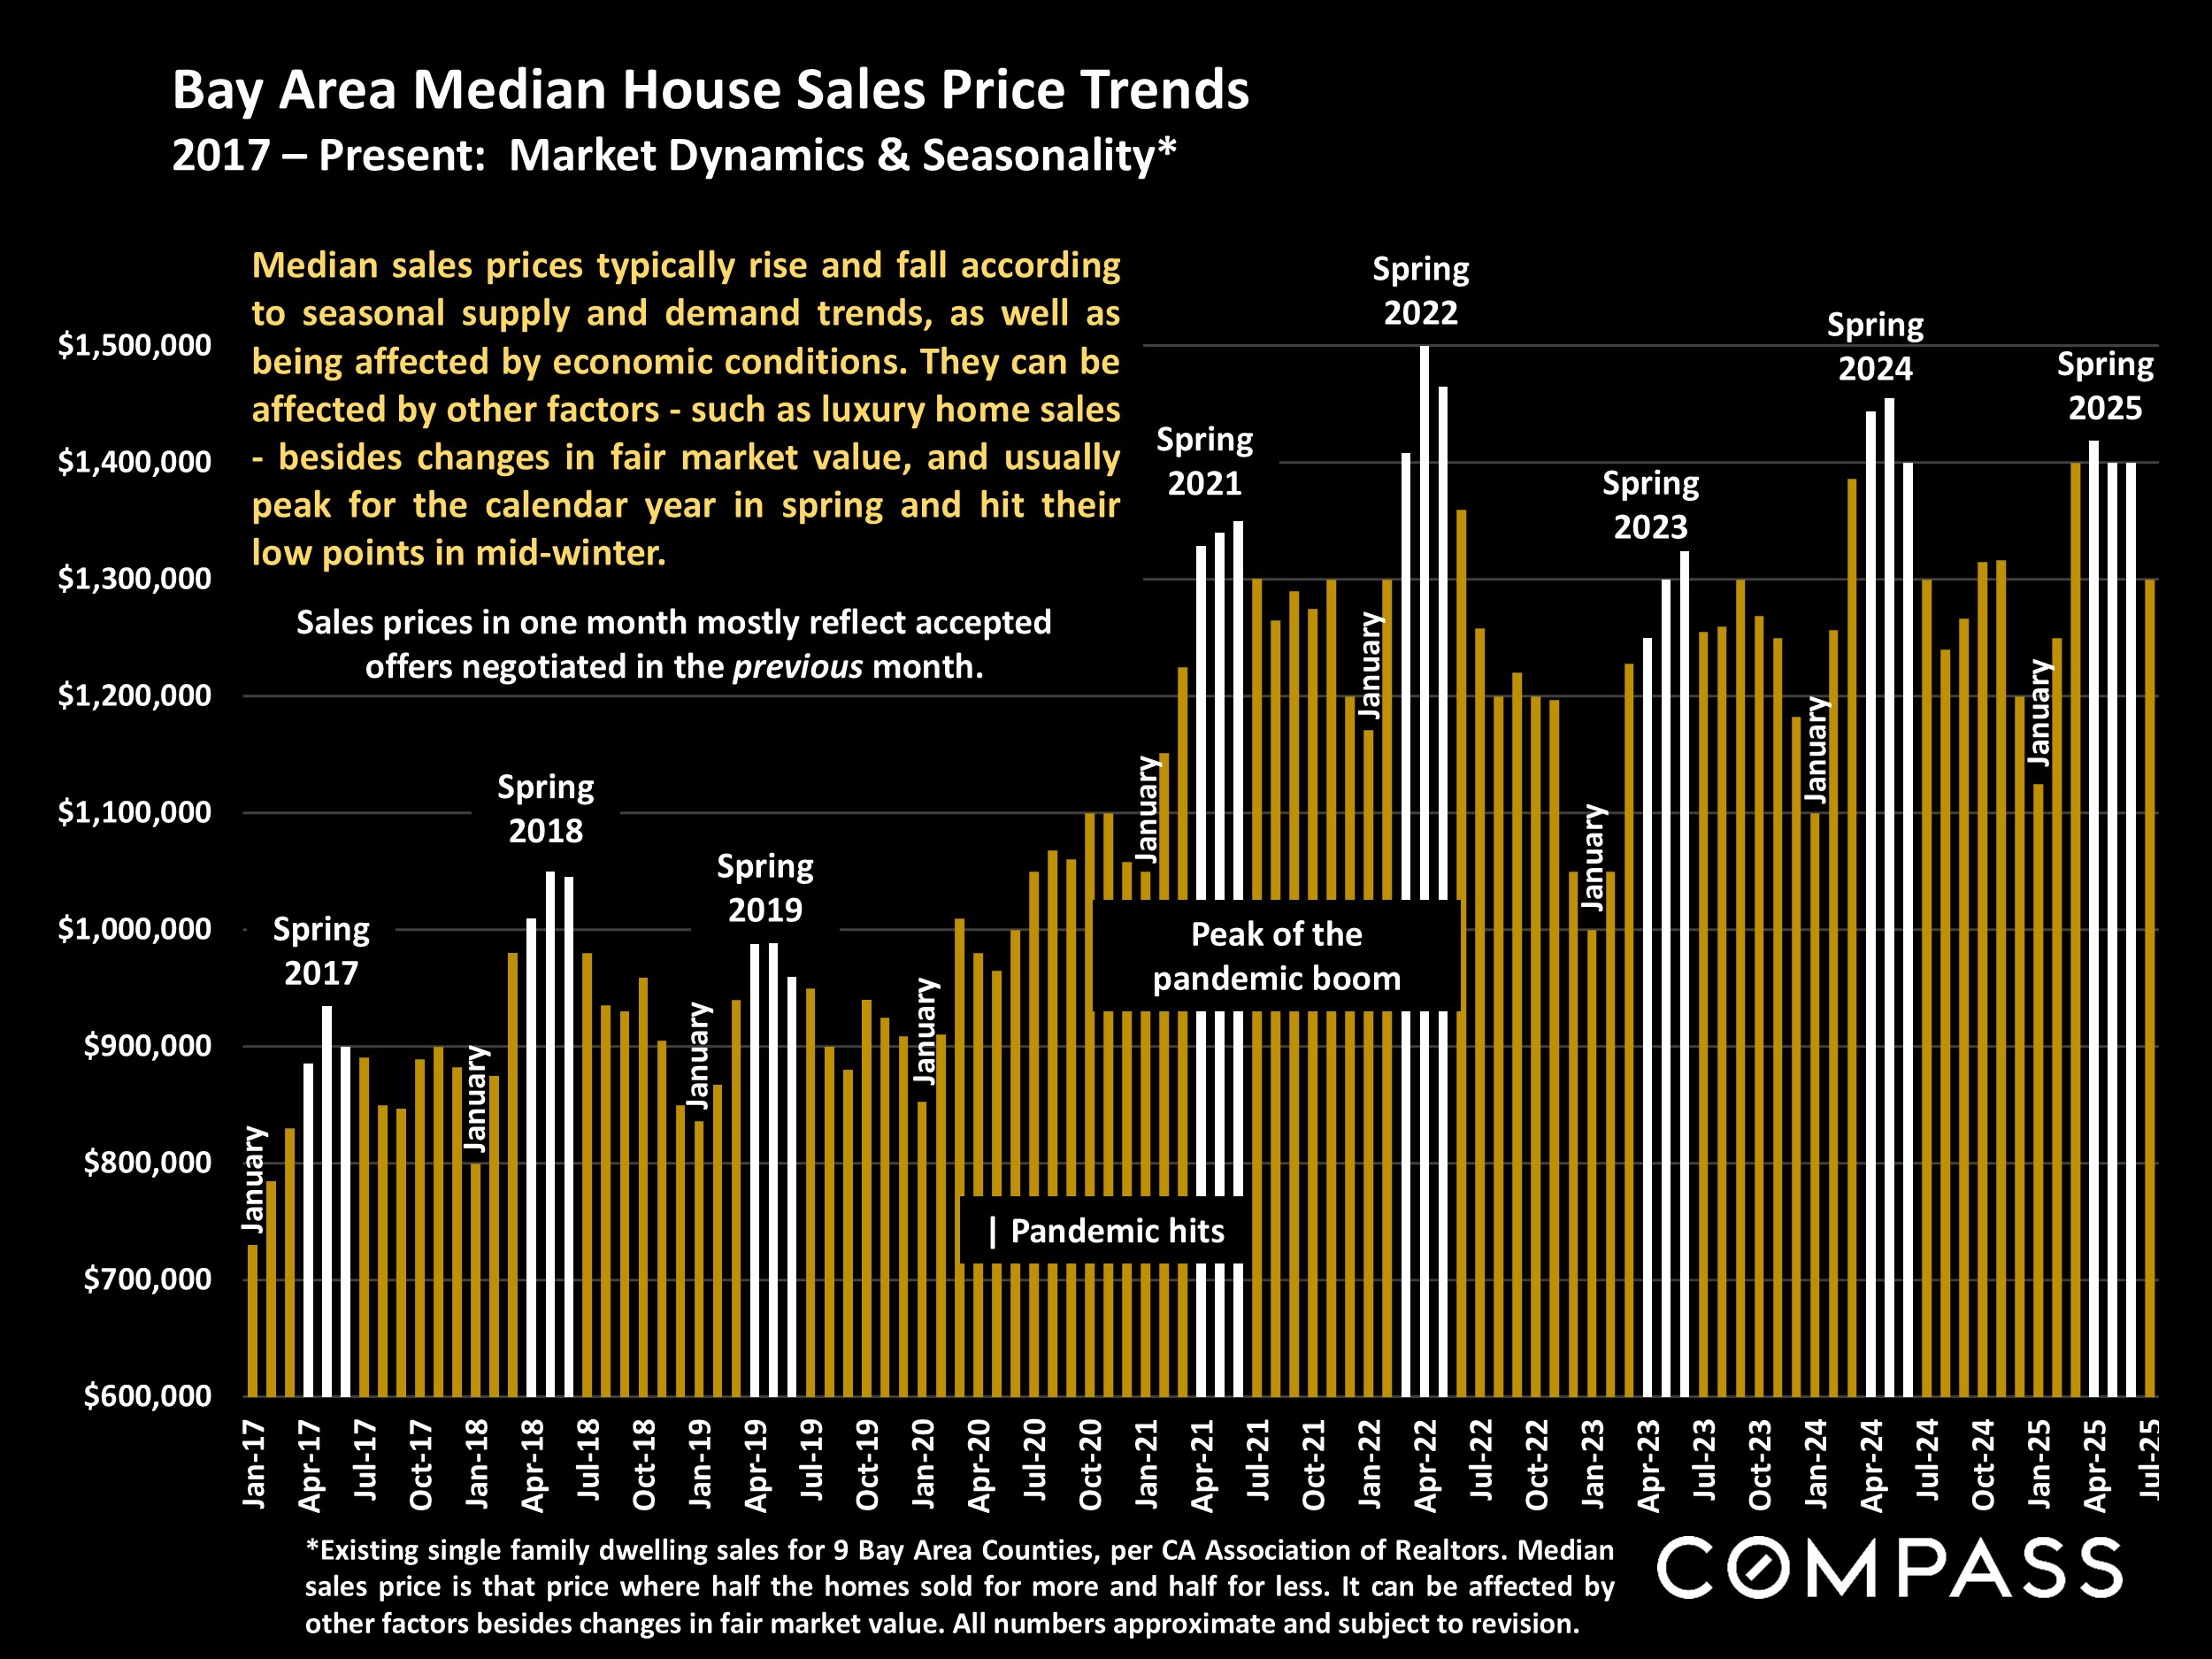
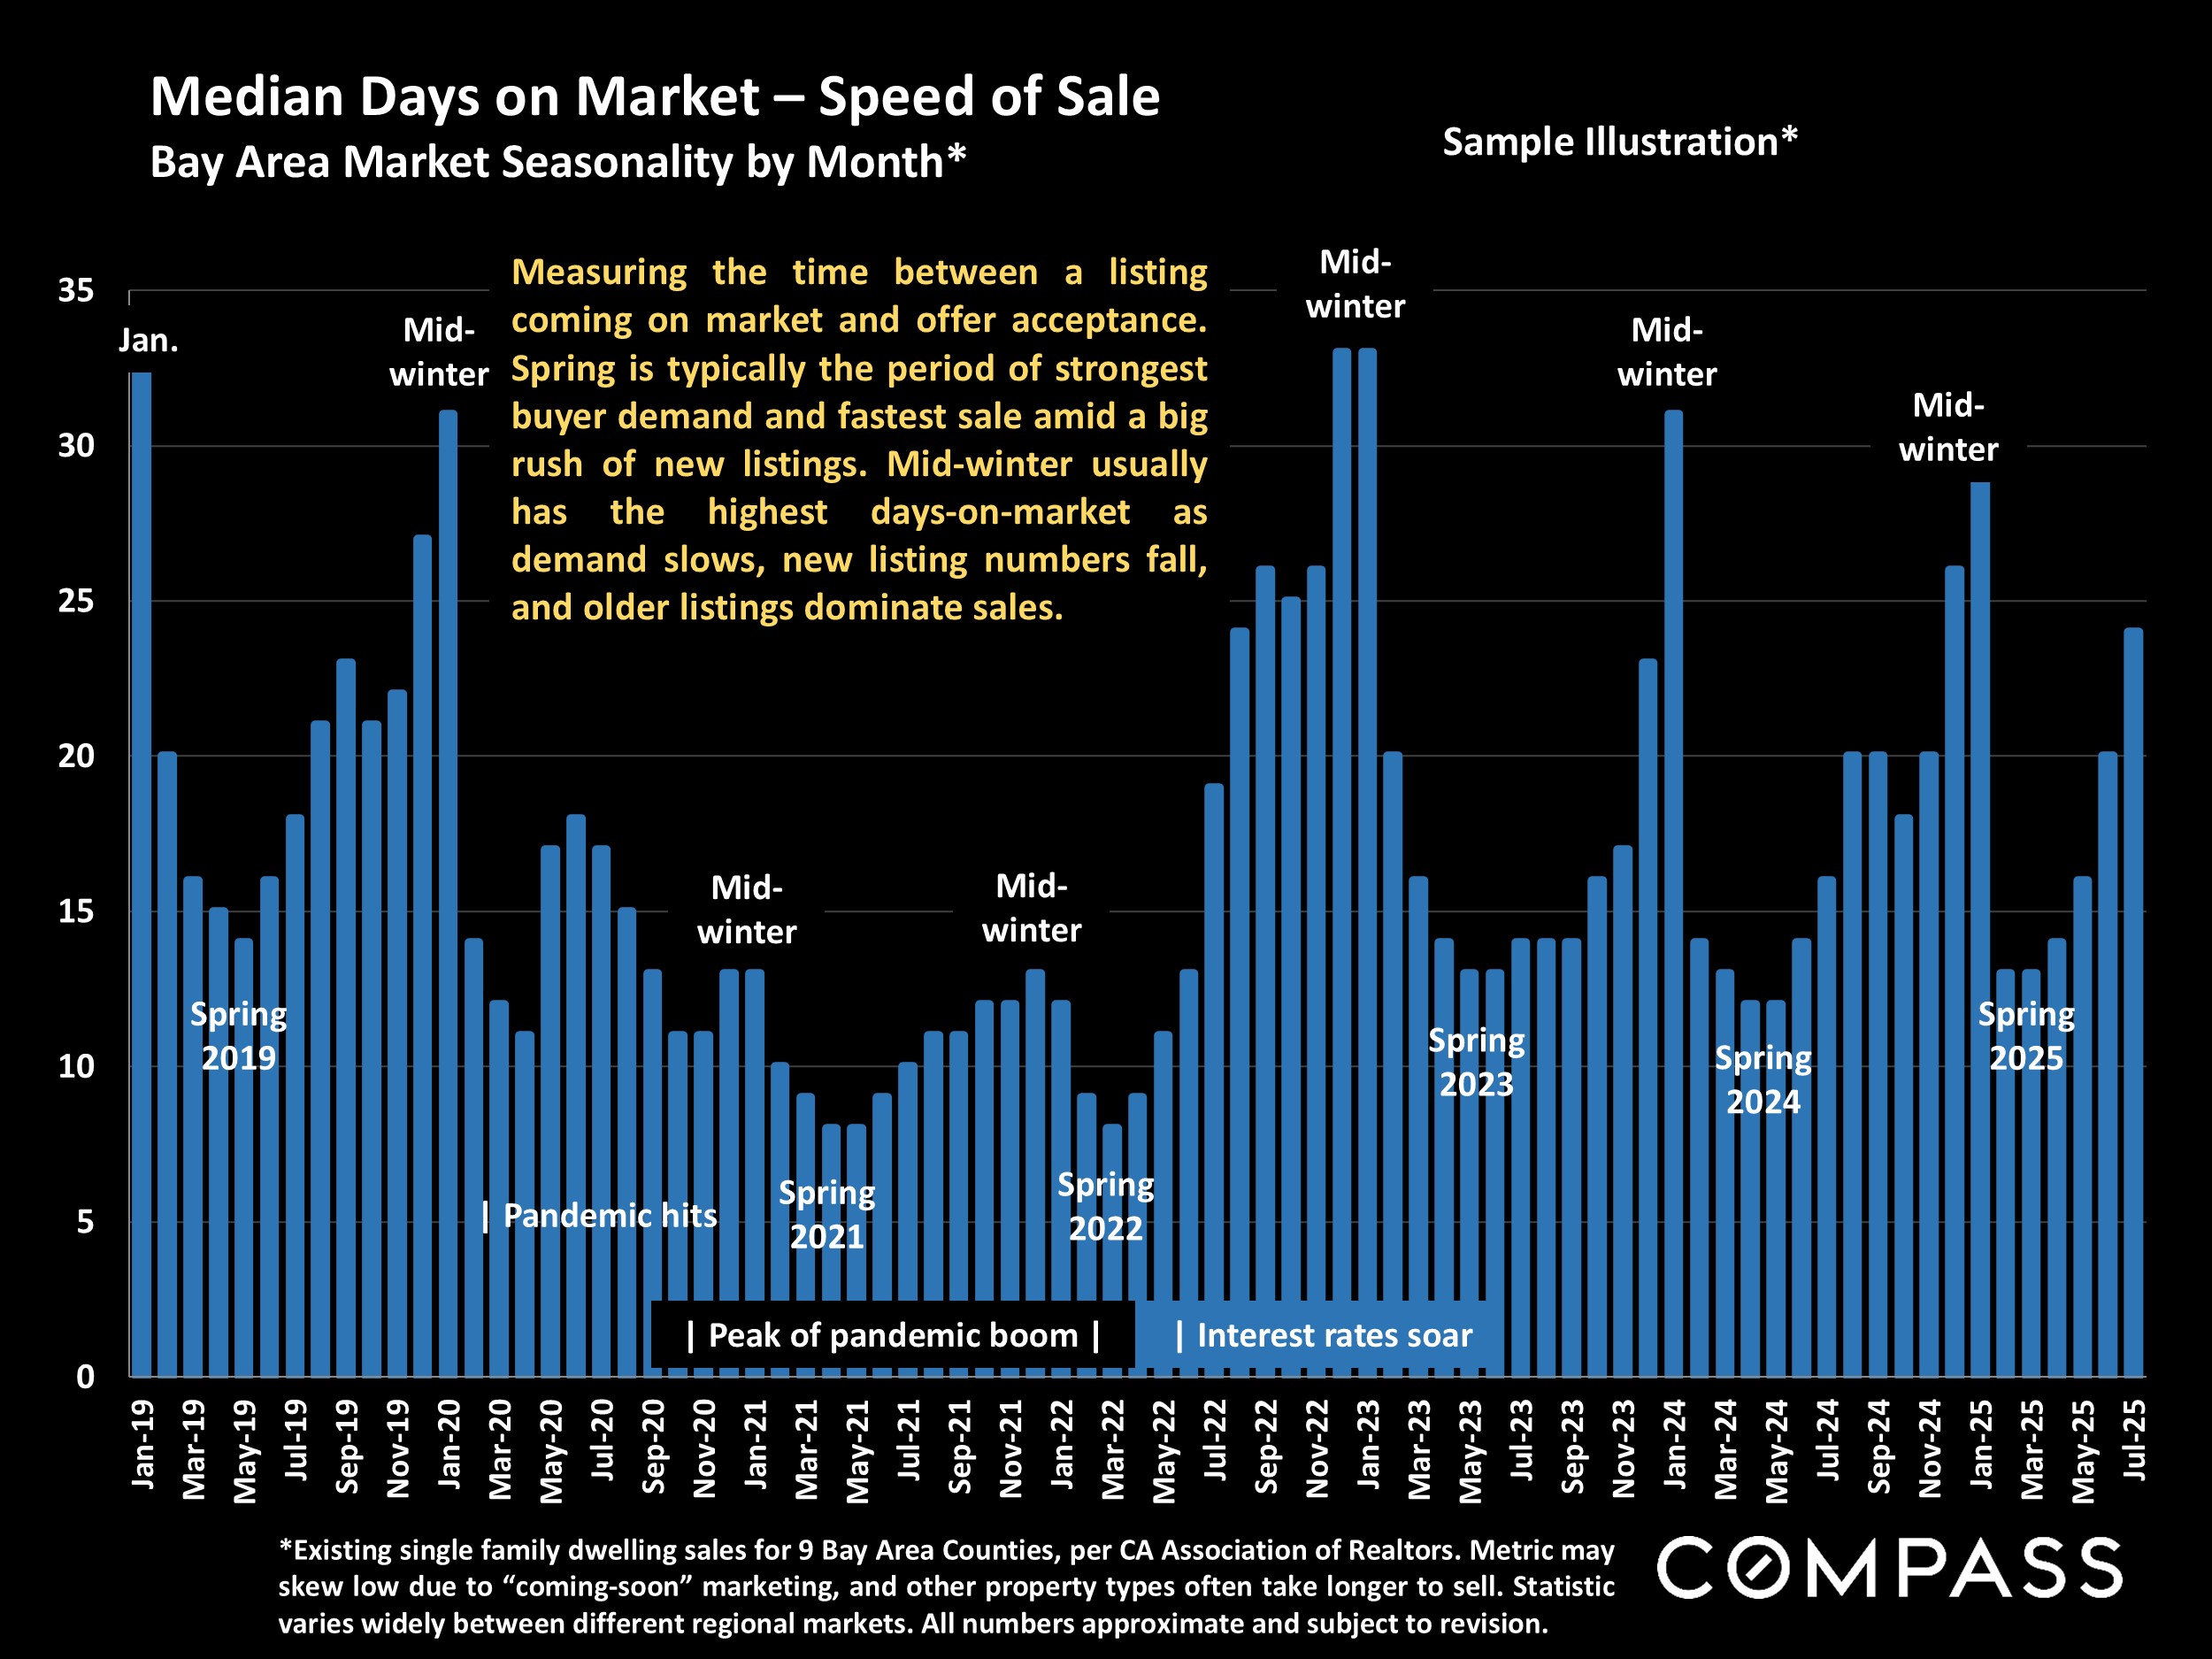
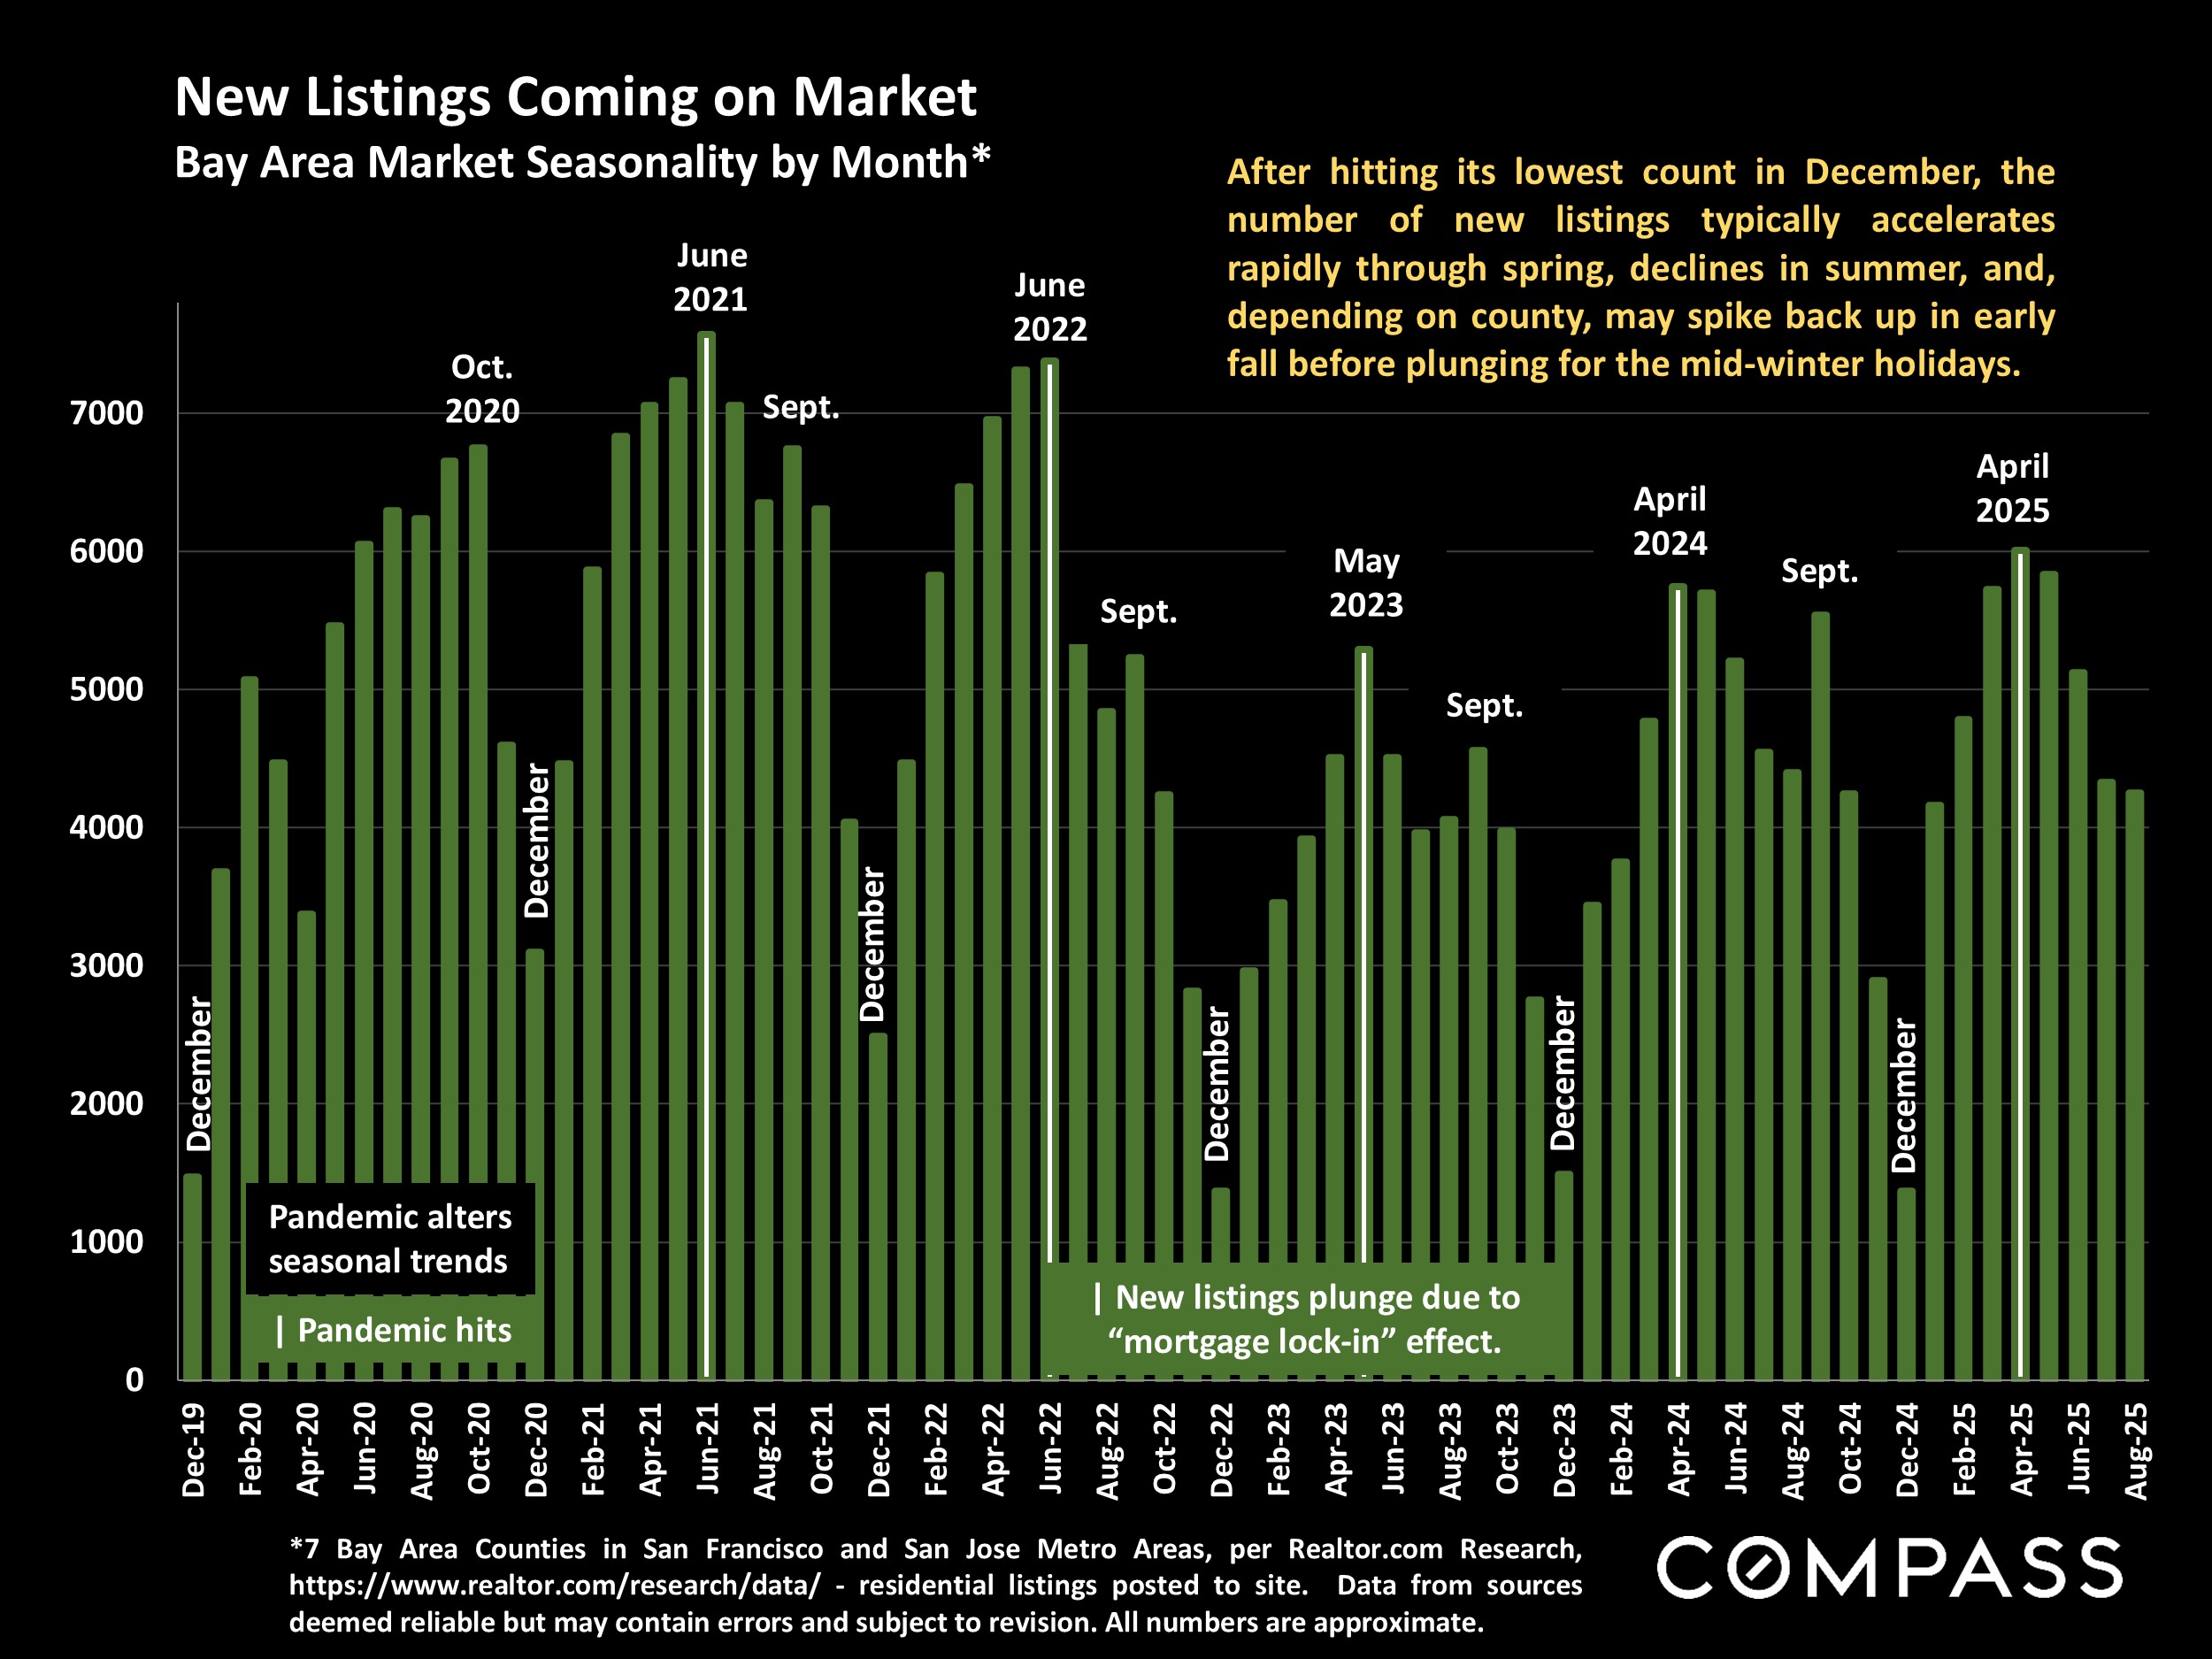
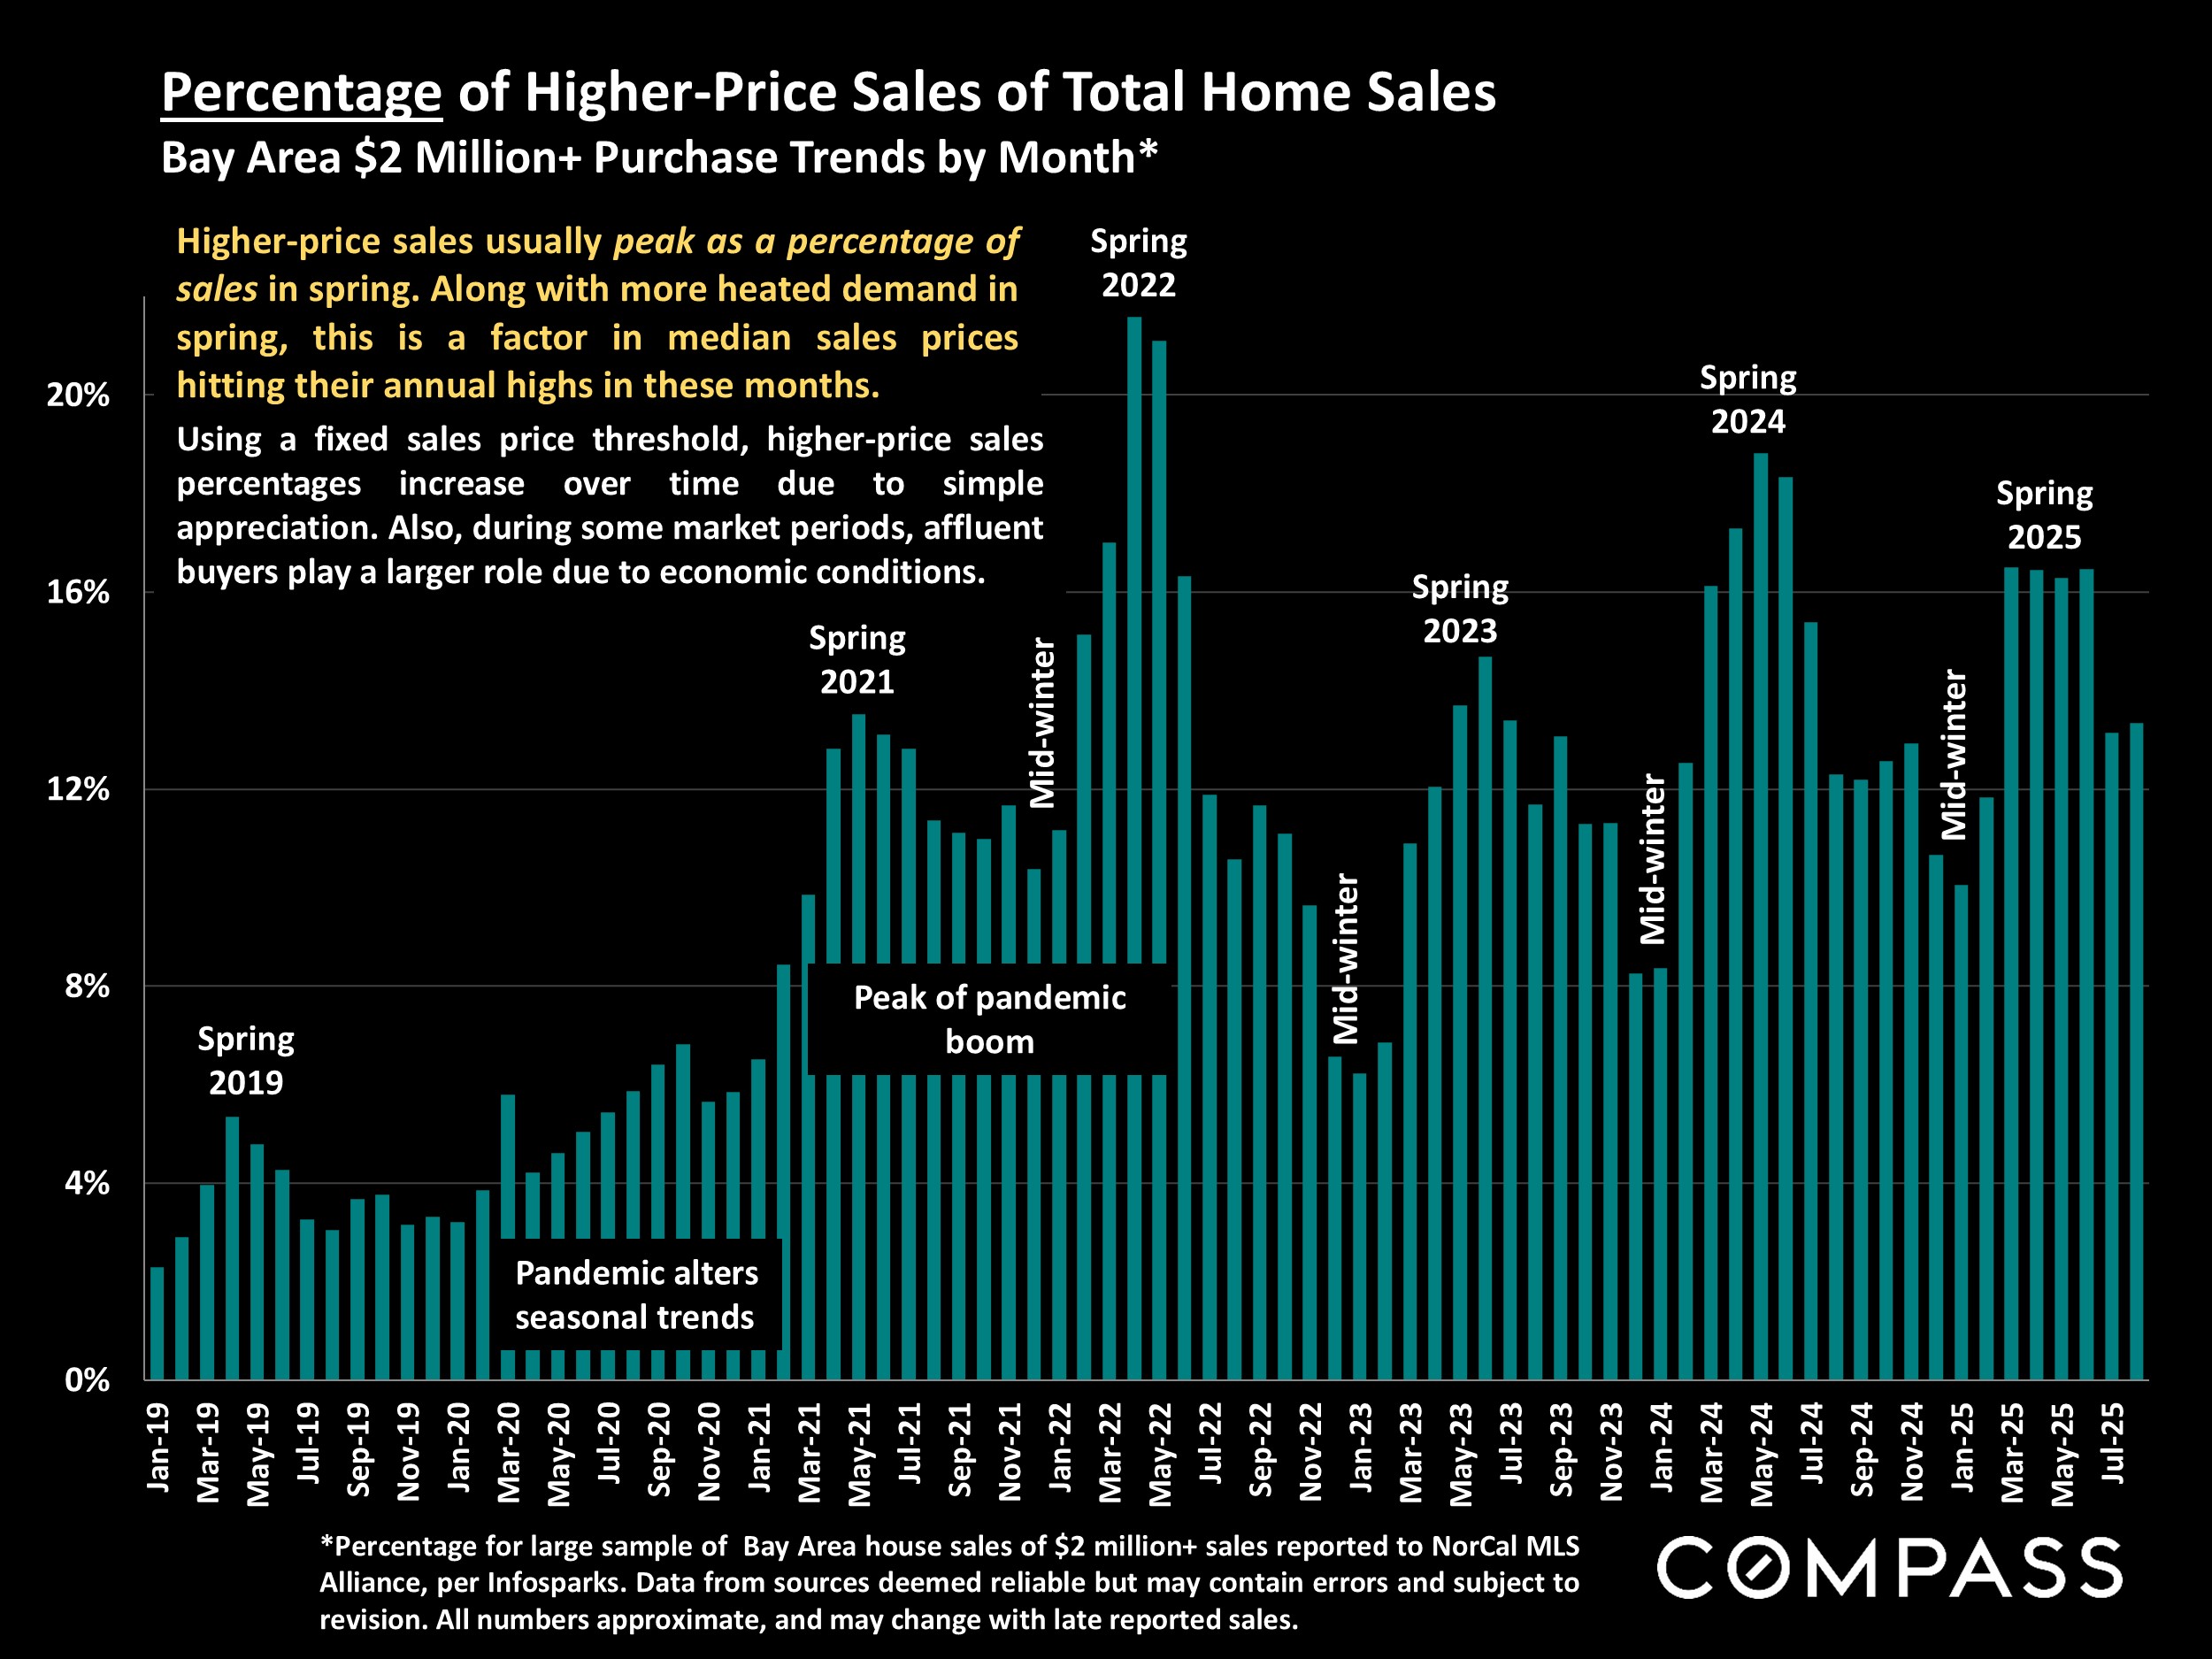
A common dynamic early in the new year is that buyers jump back into the market faster than sellers with new listings. This disparity of increasing demand versus an inadequate supply of listings often runs all the way through the spring, often making these months the most heated selling season of the year – with median sales prices often peaking in spring. When summer begins, demand usually softens with vacations and school holidays, just as the number of active listings normally hits its annual high point. However, markets with large second-home markets can see strong demand during their main tourism seasons. Some local regions see a short, sharp increase in autumn activity, before listing and sales activity plummet during the mid-winter holidays.
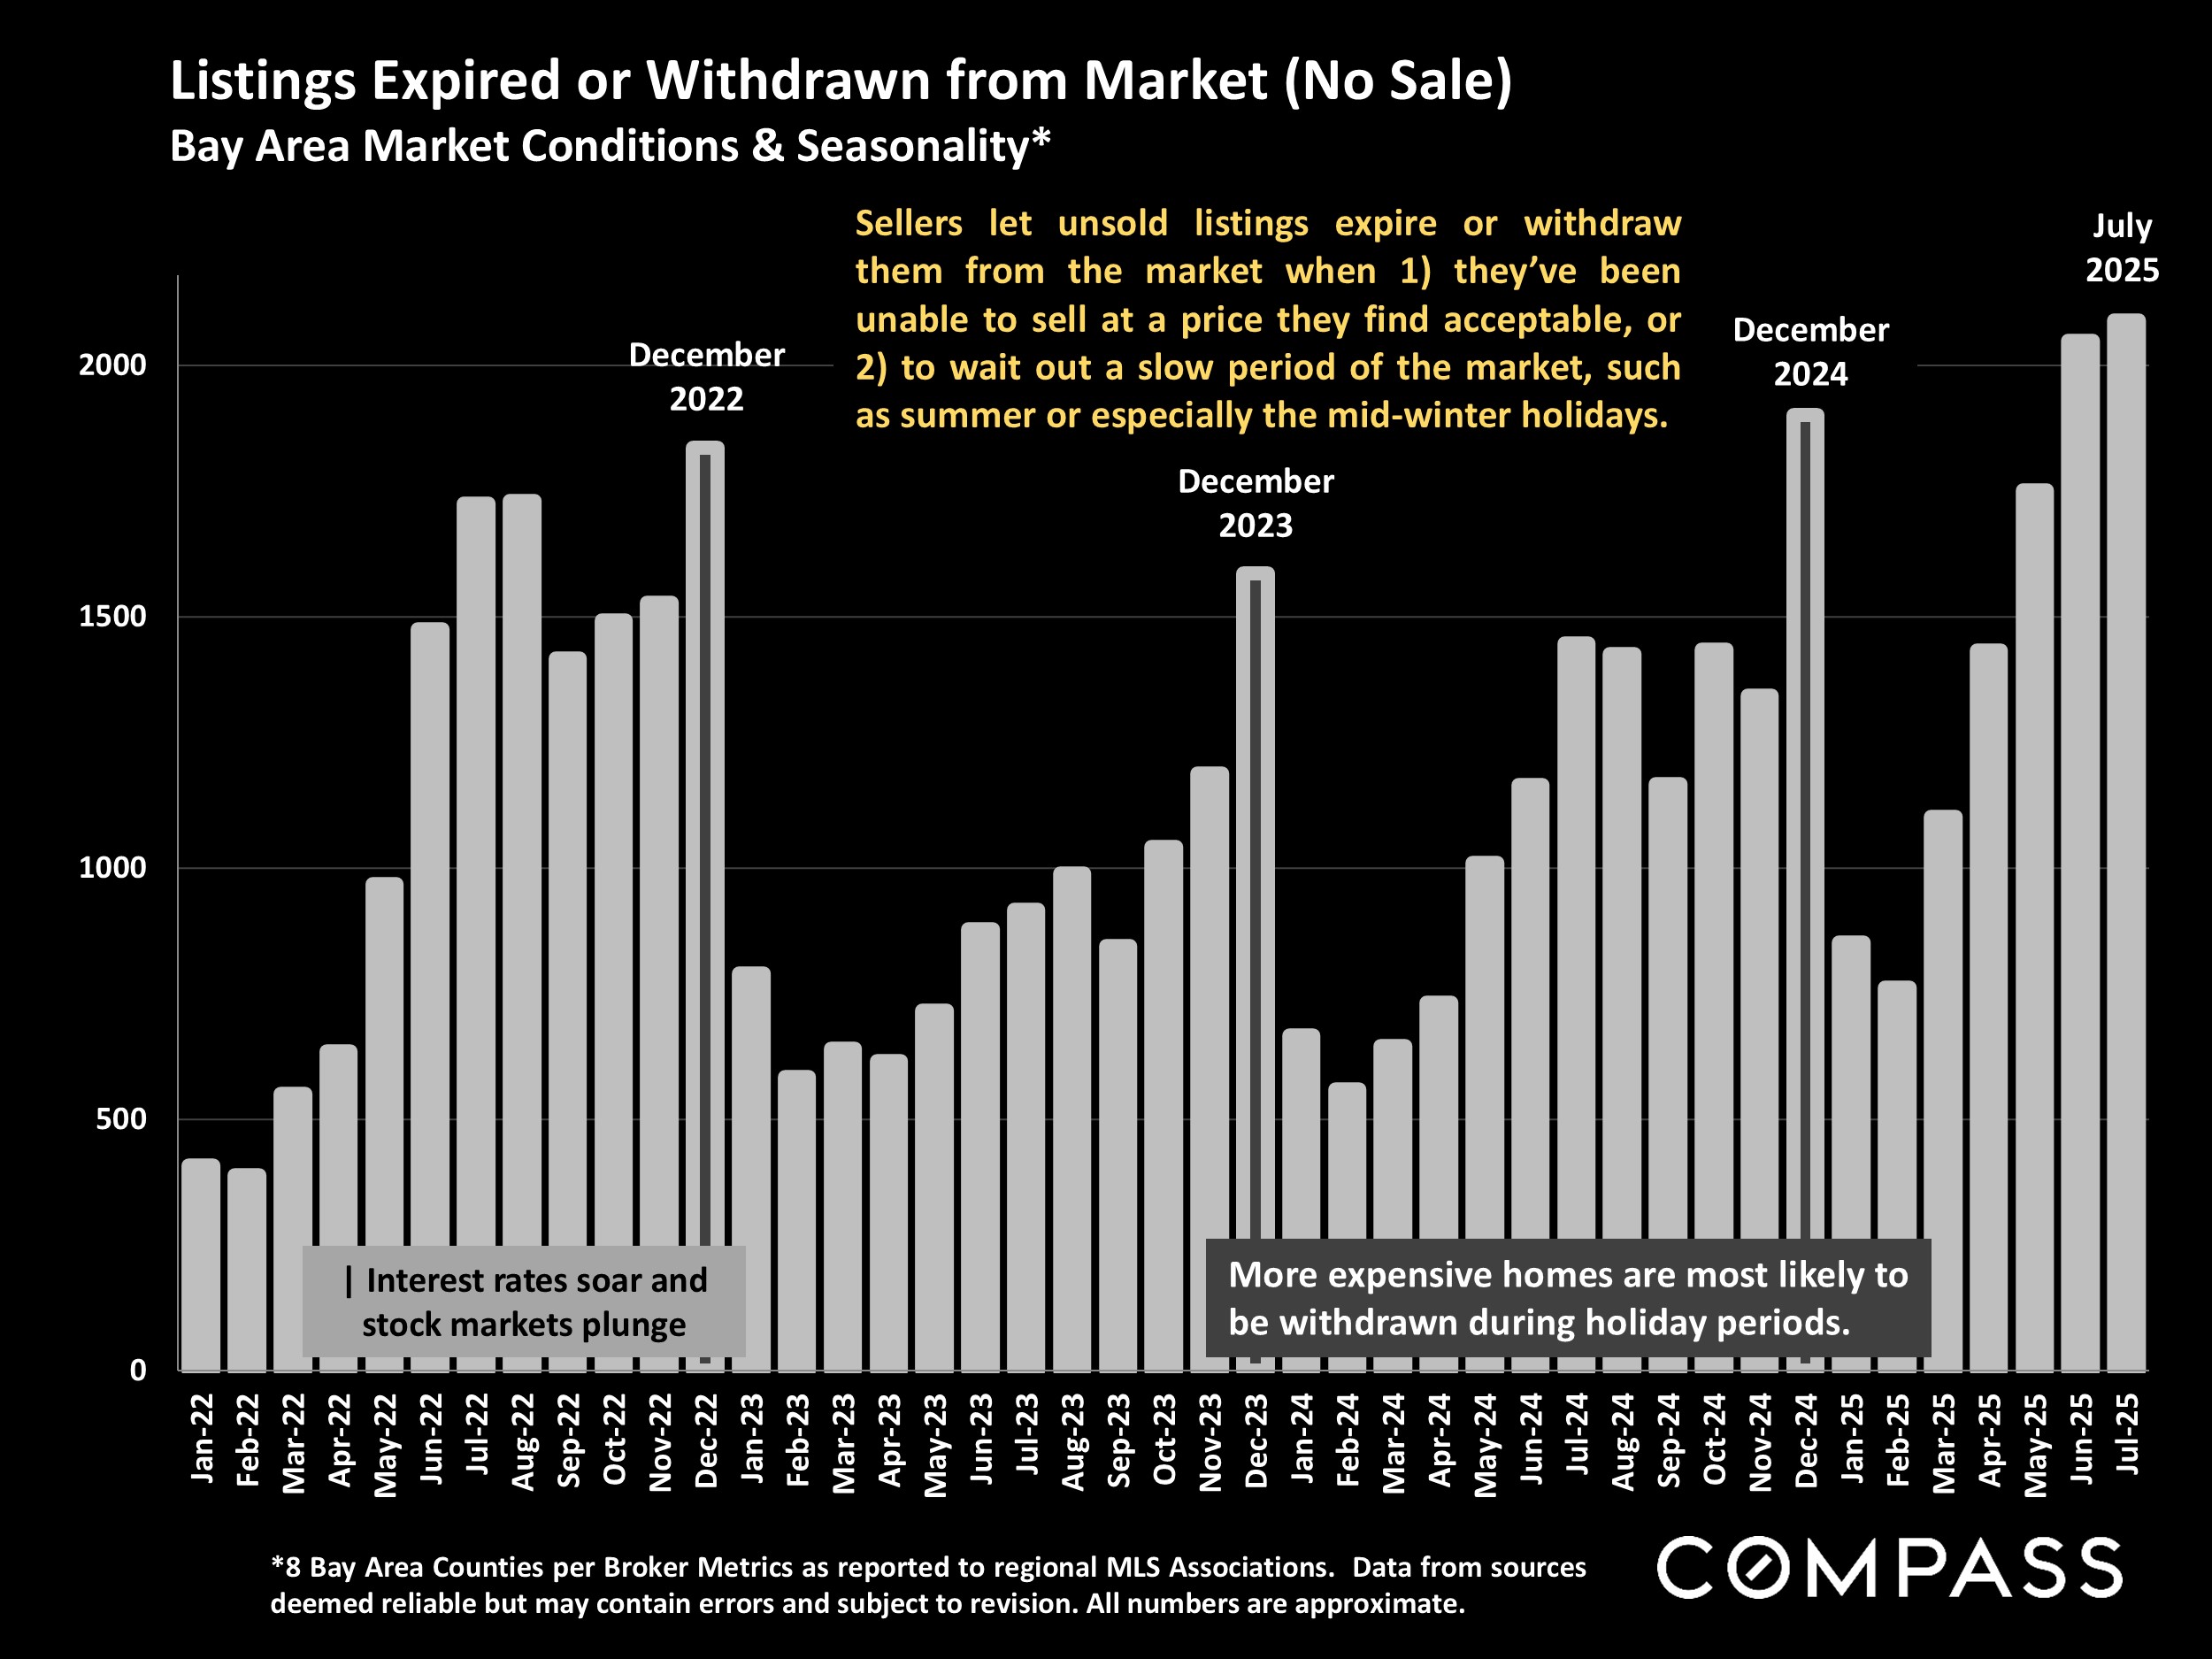
Of course, homes are listed and sell in every month of the year, and “slow activity” months (like December) can offer buyers opportunities to negotiate more aggressively. Even with the effects of seasonality, homes that are well-prepared, priced correctly, and marketed effectively can sell quickly with multiple offers at any time, and overpriced, poorly prepared listings may be ignored by buyers even in an overheated market. And economic conditions can override or super-charge seasonal effects. Each sale reflects a unique combination of the condition and circumstances of the home, local market dynamics, and the specific period in which it is listed. This report focuses on the broad effects of seasonality on San Francisco Bay Area supply and demand dynamics, as illustrated by a wide range of standard indicators.
Supply & Demand Defines the Market
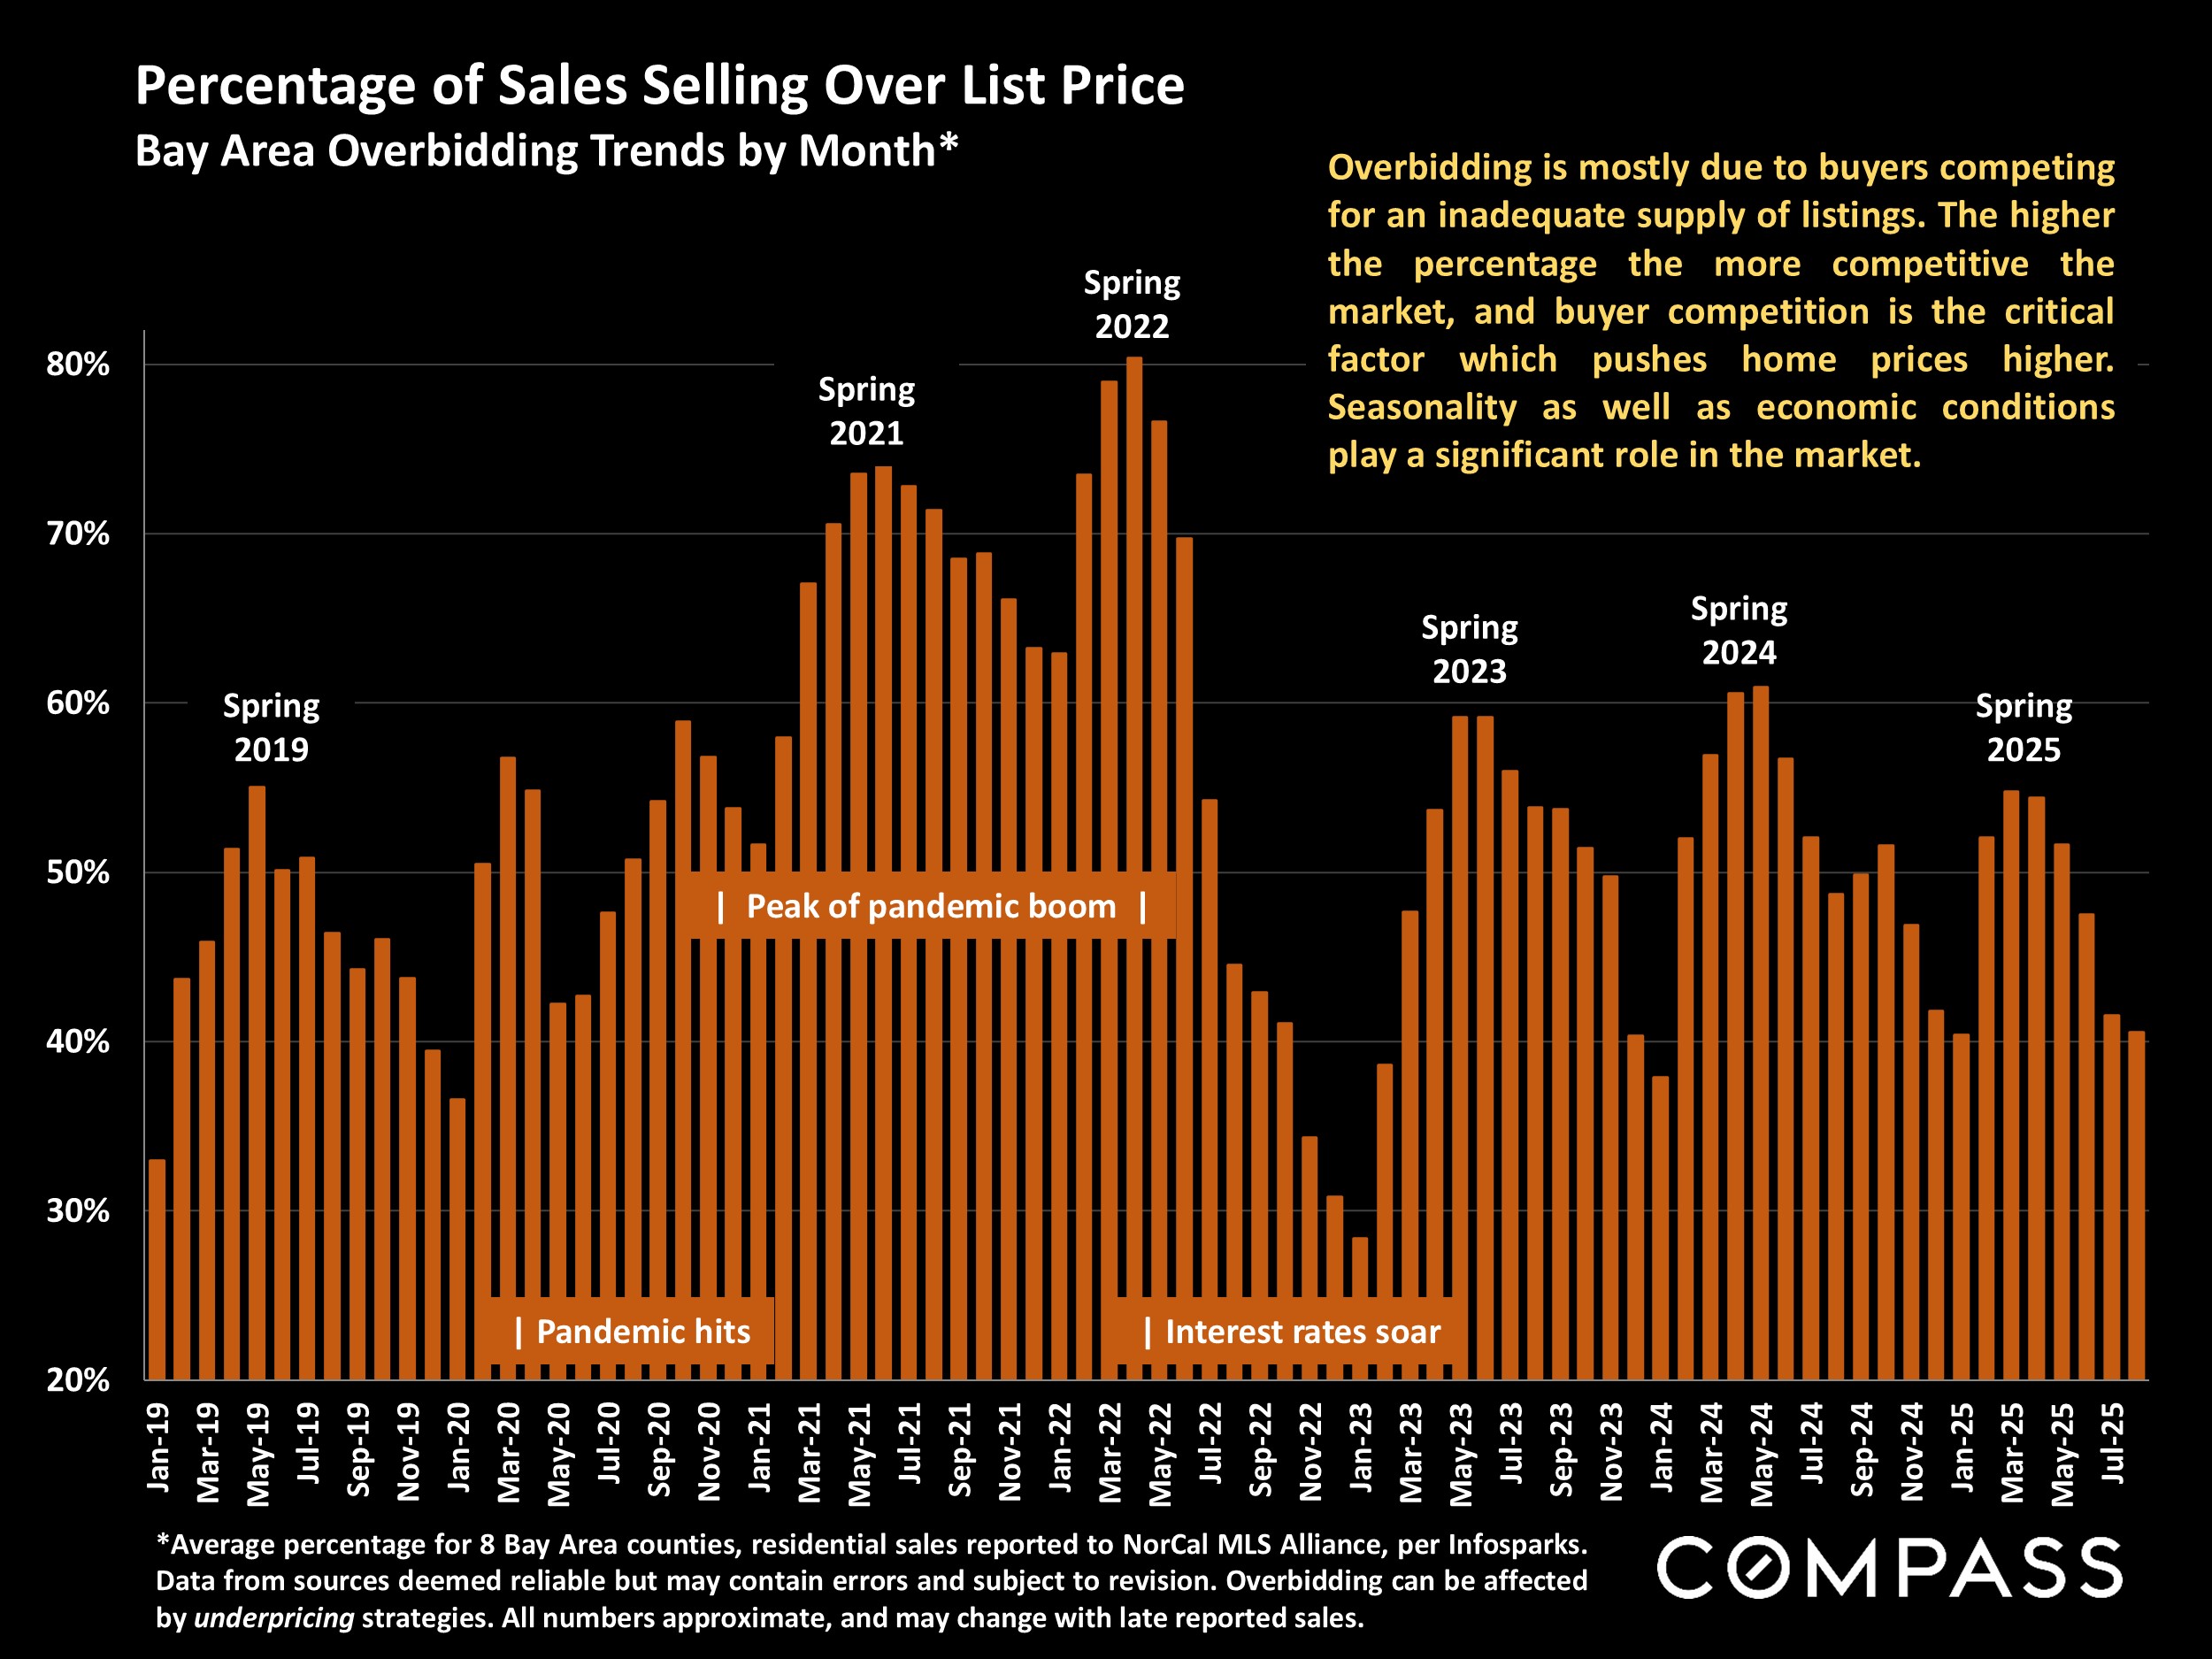
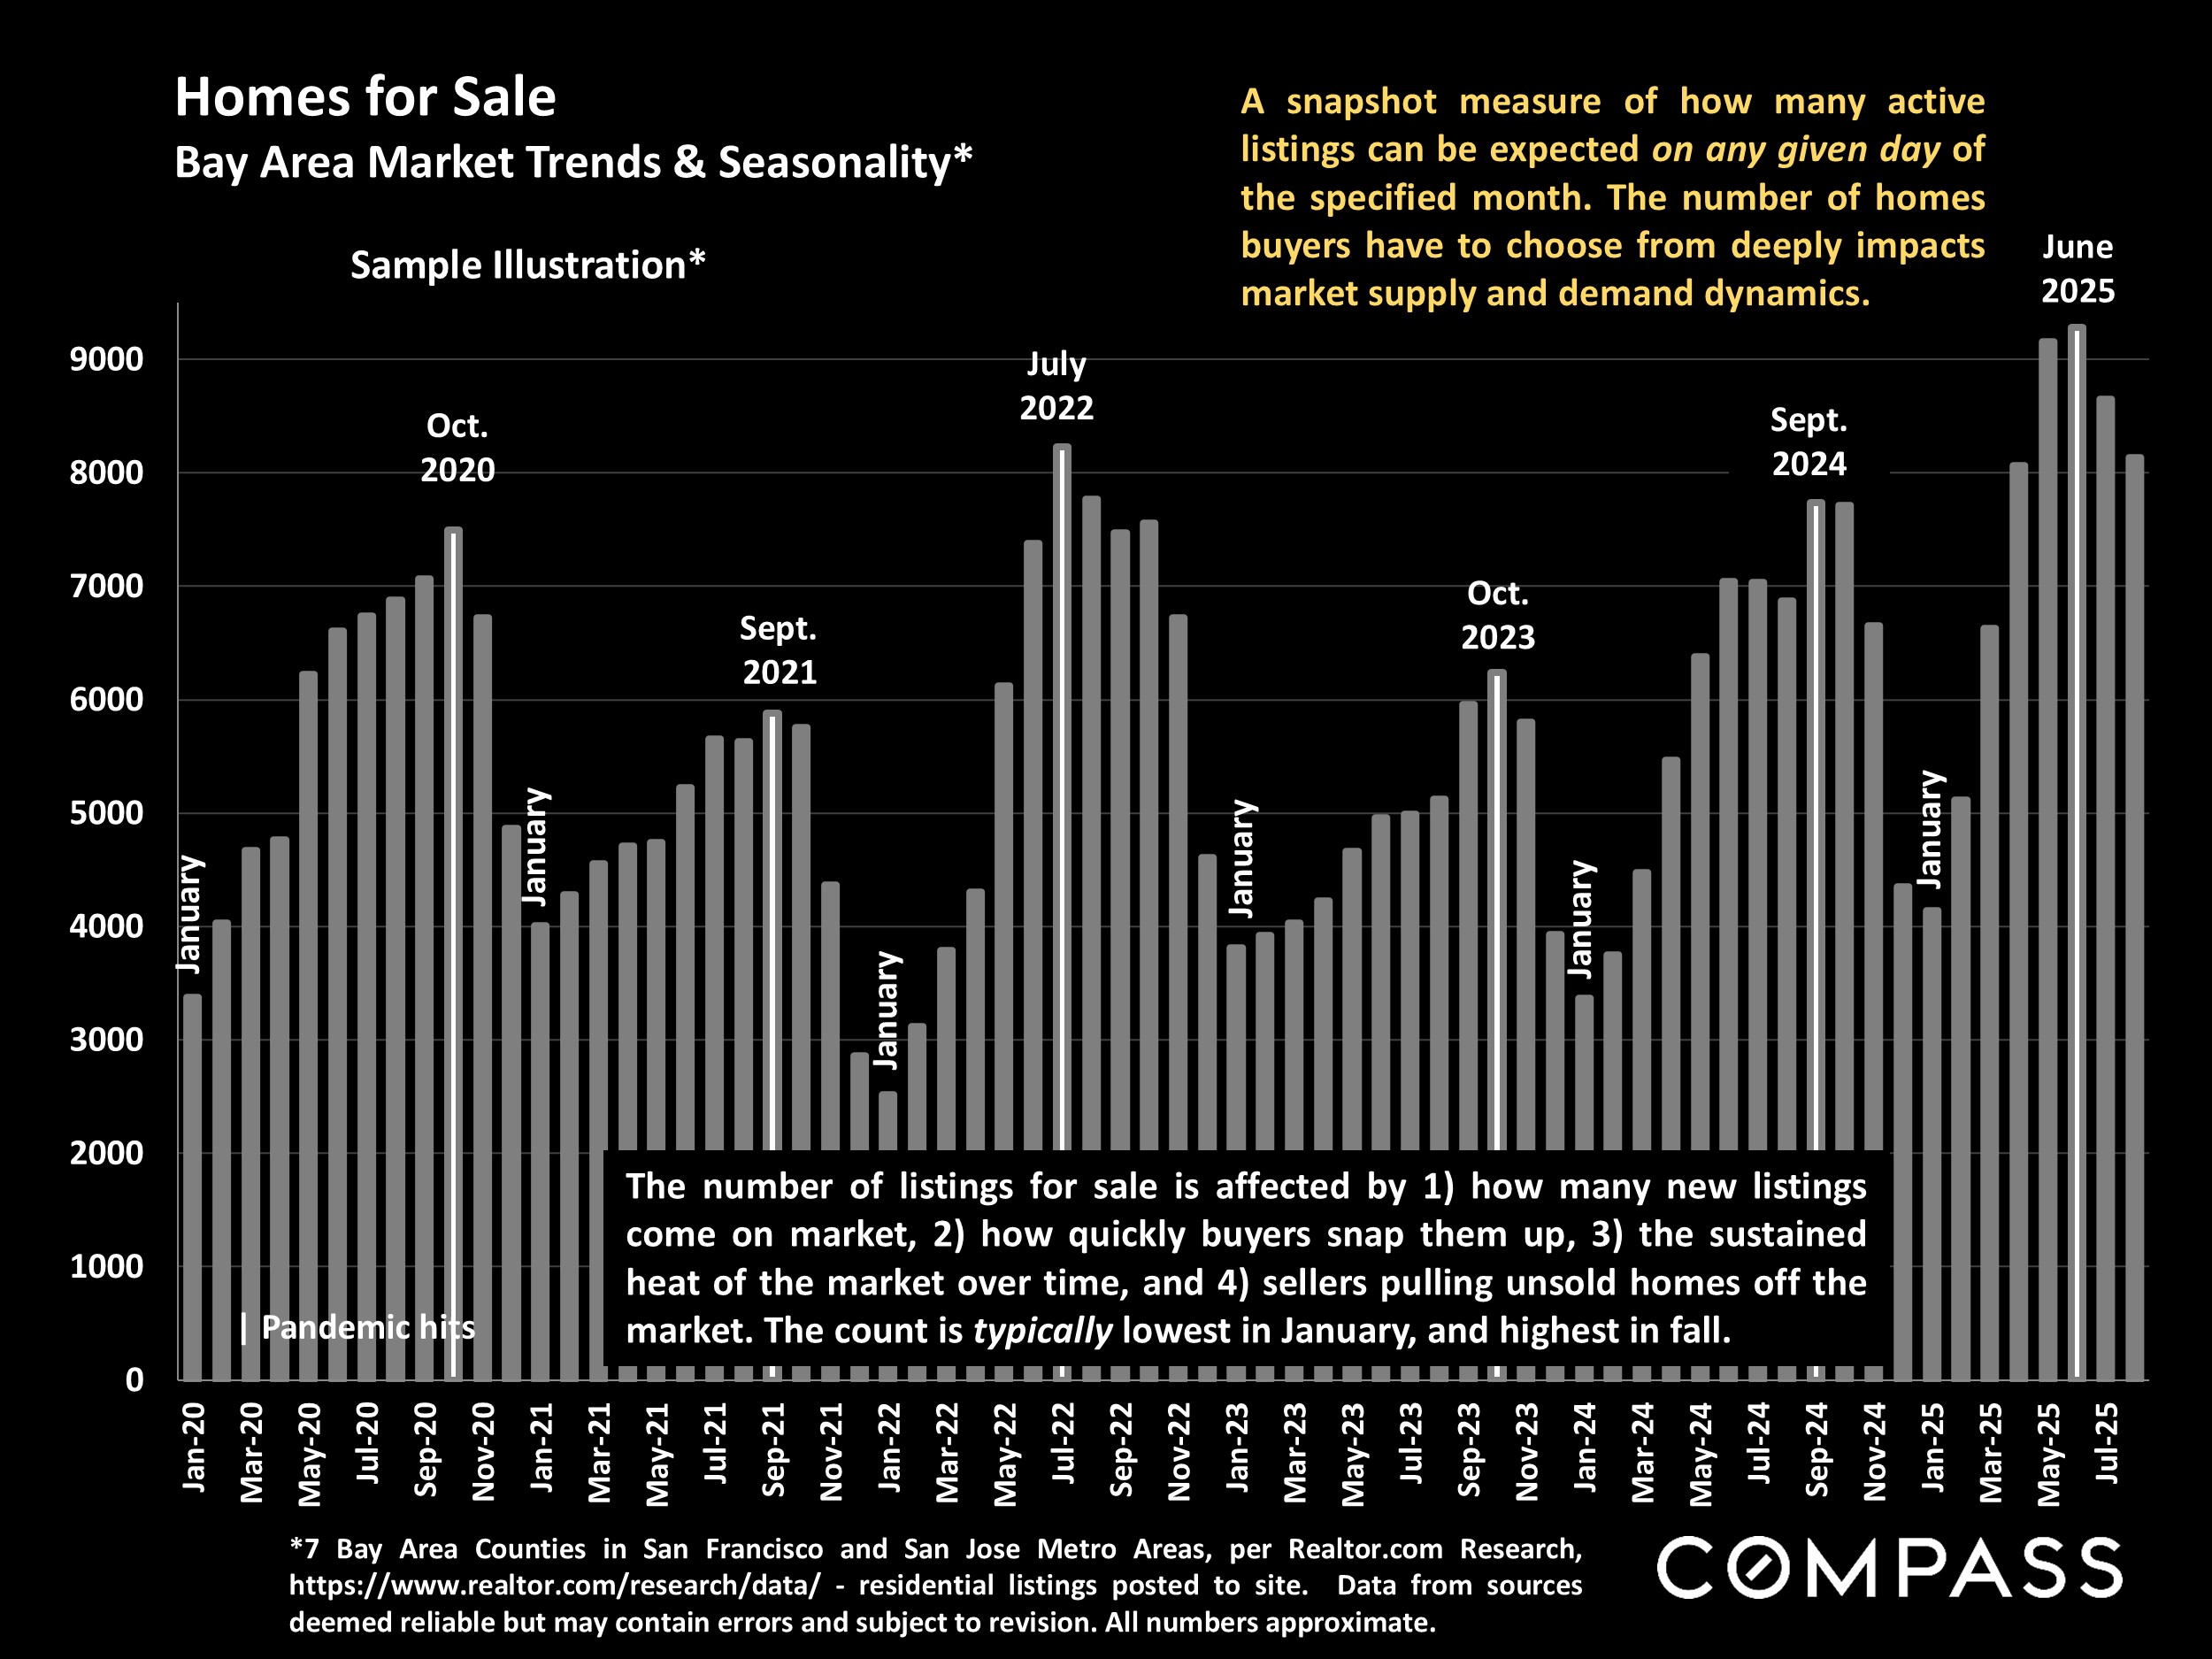
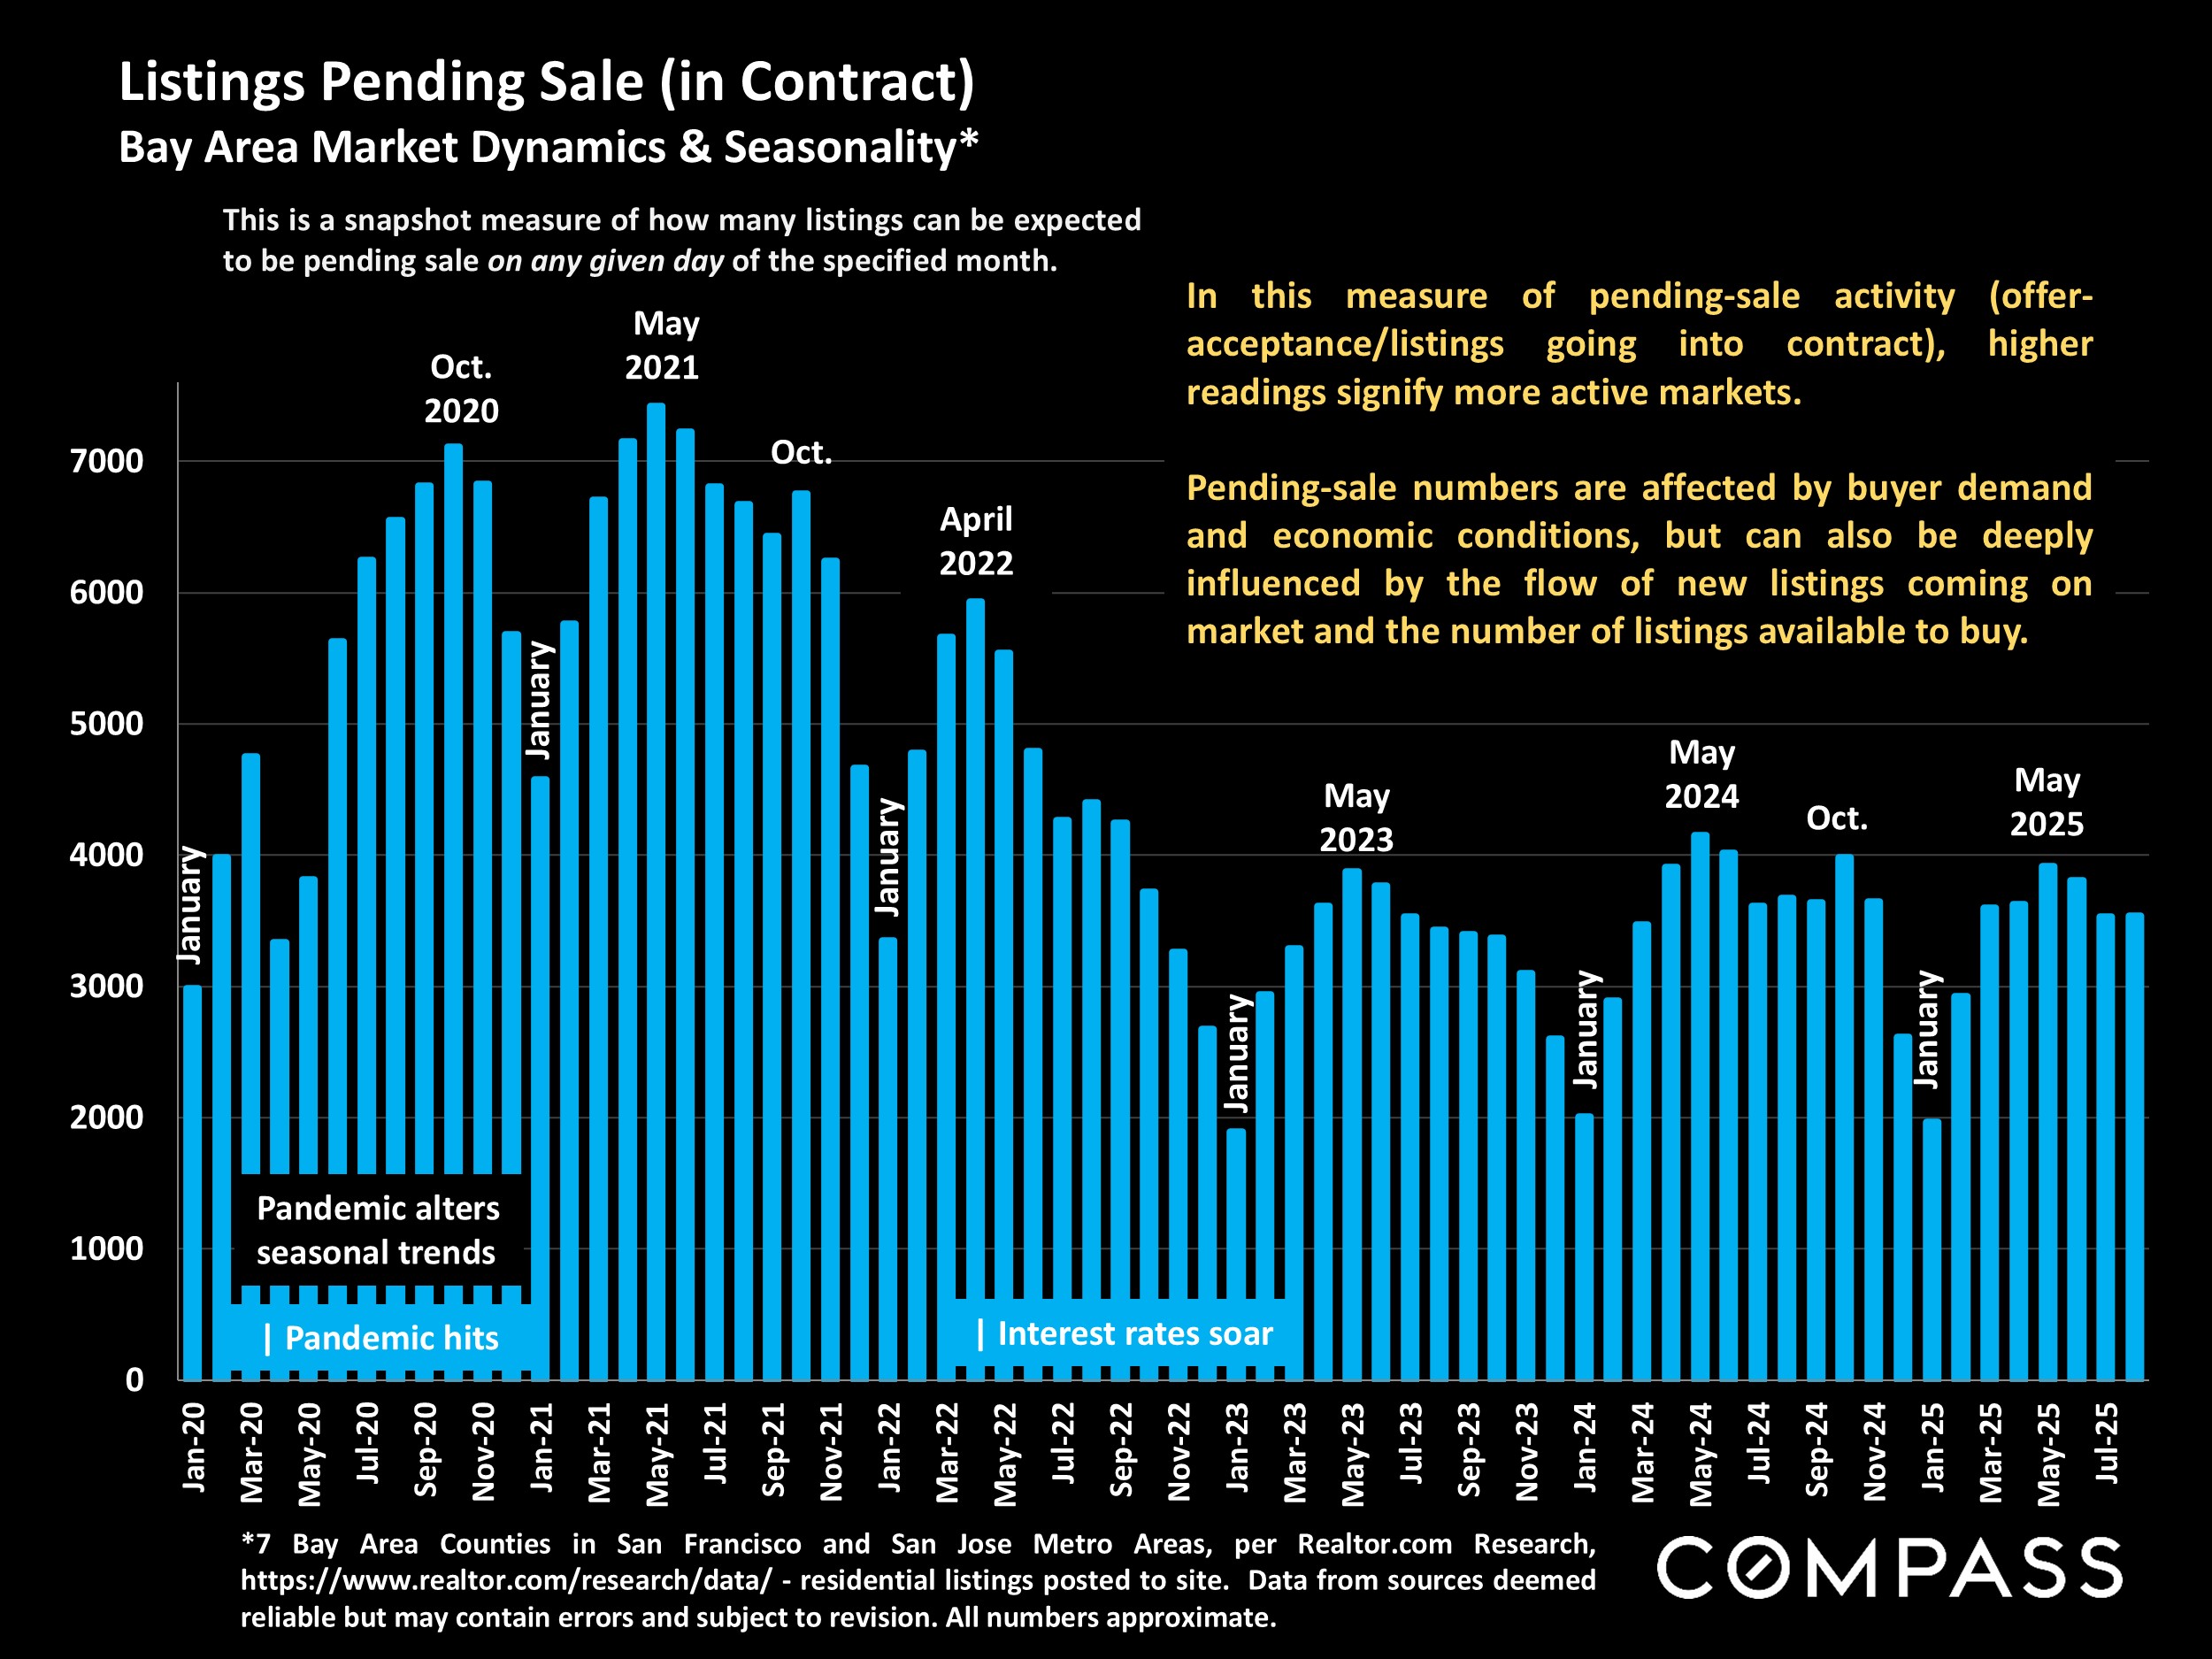
Market conditions are determined by the balance (or imbalance) between buyer demand and the supply of homes for sale. When demand exceeds supply, buyers compete for listings, and the market heats up: Homes sell faster, and multiple offers and bidding wars become common, pushing prices higher. When the supply of listings exceeds demand, sellers compete for buyers, and market conditions cool: Time on market lengthens, overbidding plunges, buyers negotiate more aggressively, and prices flatten or decline. The balance between supply and demand is continually shifting, sometimes subtly and sometimes dramatically, due to a number of considerations, including market seasonality.
There are many factors underlying the dynamics of supply and demand: Interest rates, financial markets, employment, inflation, consumer confidence, housing affordability, population migration and changing demographics, the frequency at which homeowners sell, the impact of investors buying up homes, new-home construction, tax law, local and national politics, economic booms and crashes, international conflict, natural disasters, the cost of insurance, and so on. These factors can change slowly and gradually or suddenly and dramatically, swinging the market in either positive or negative directions for shorter or longer periods.
————————–
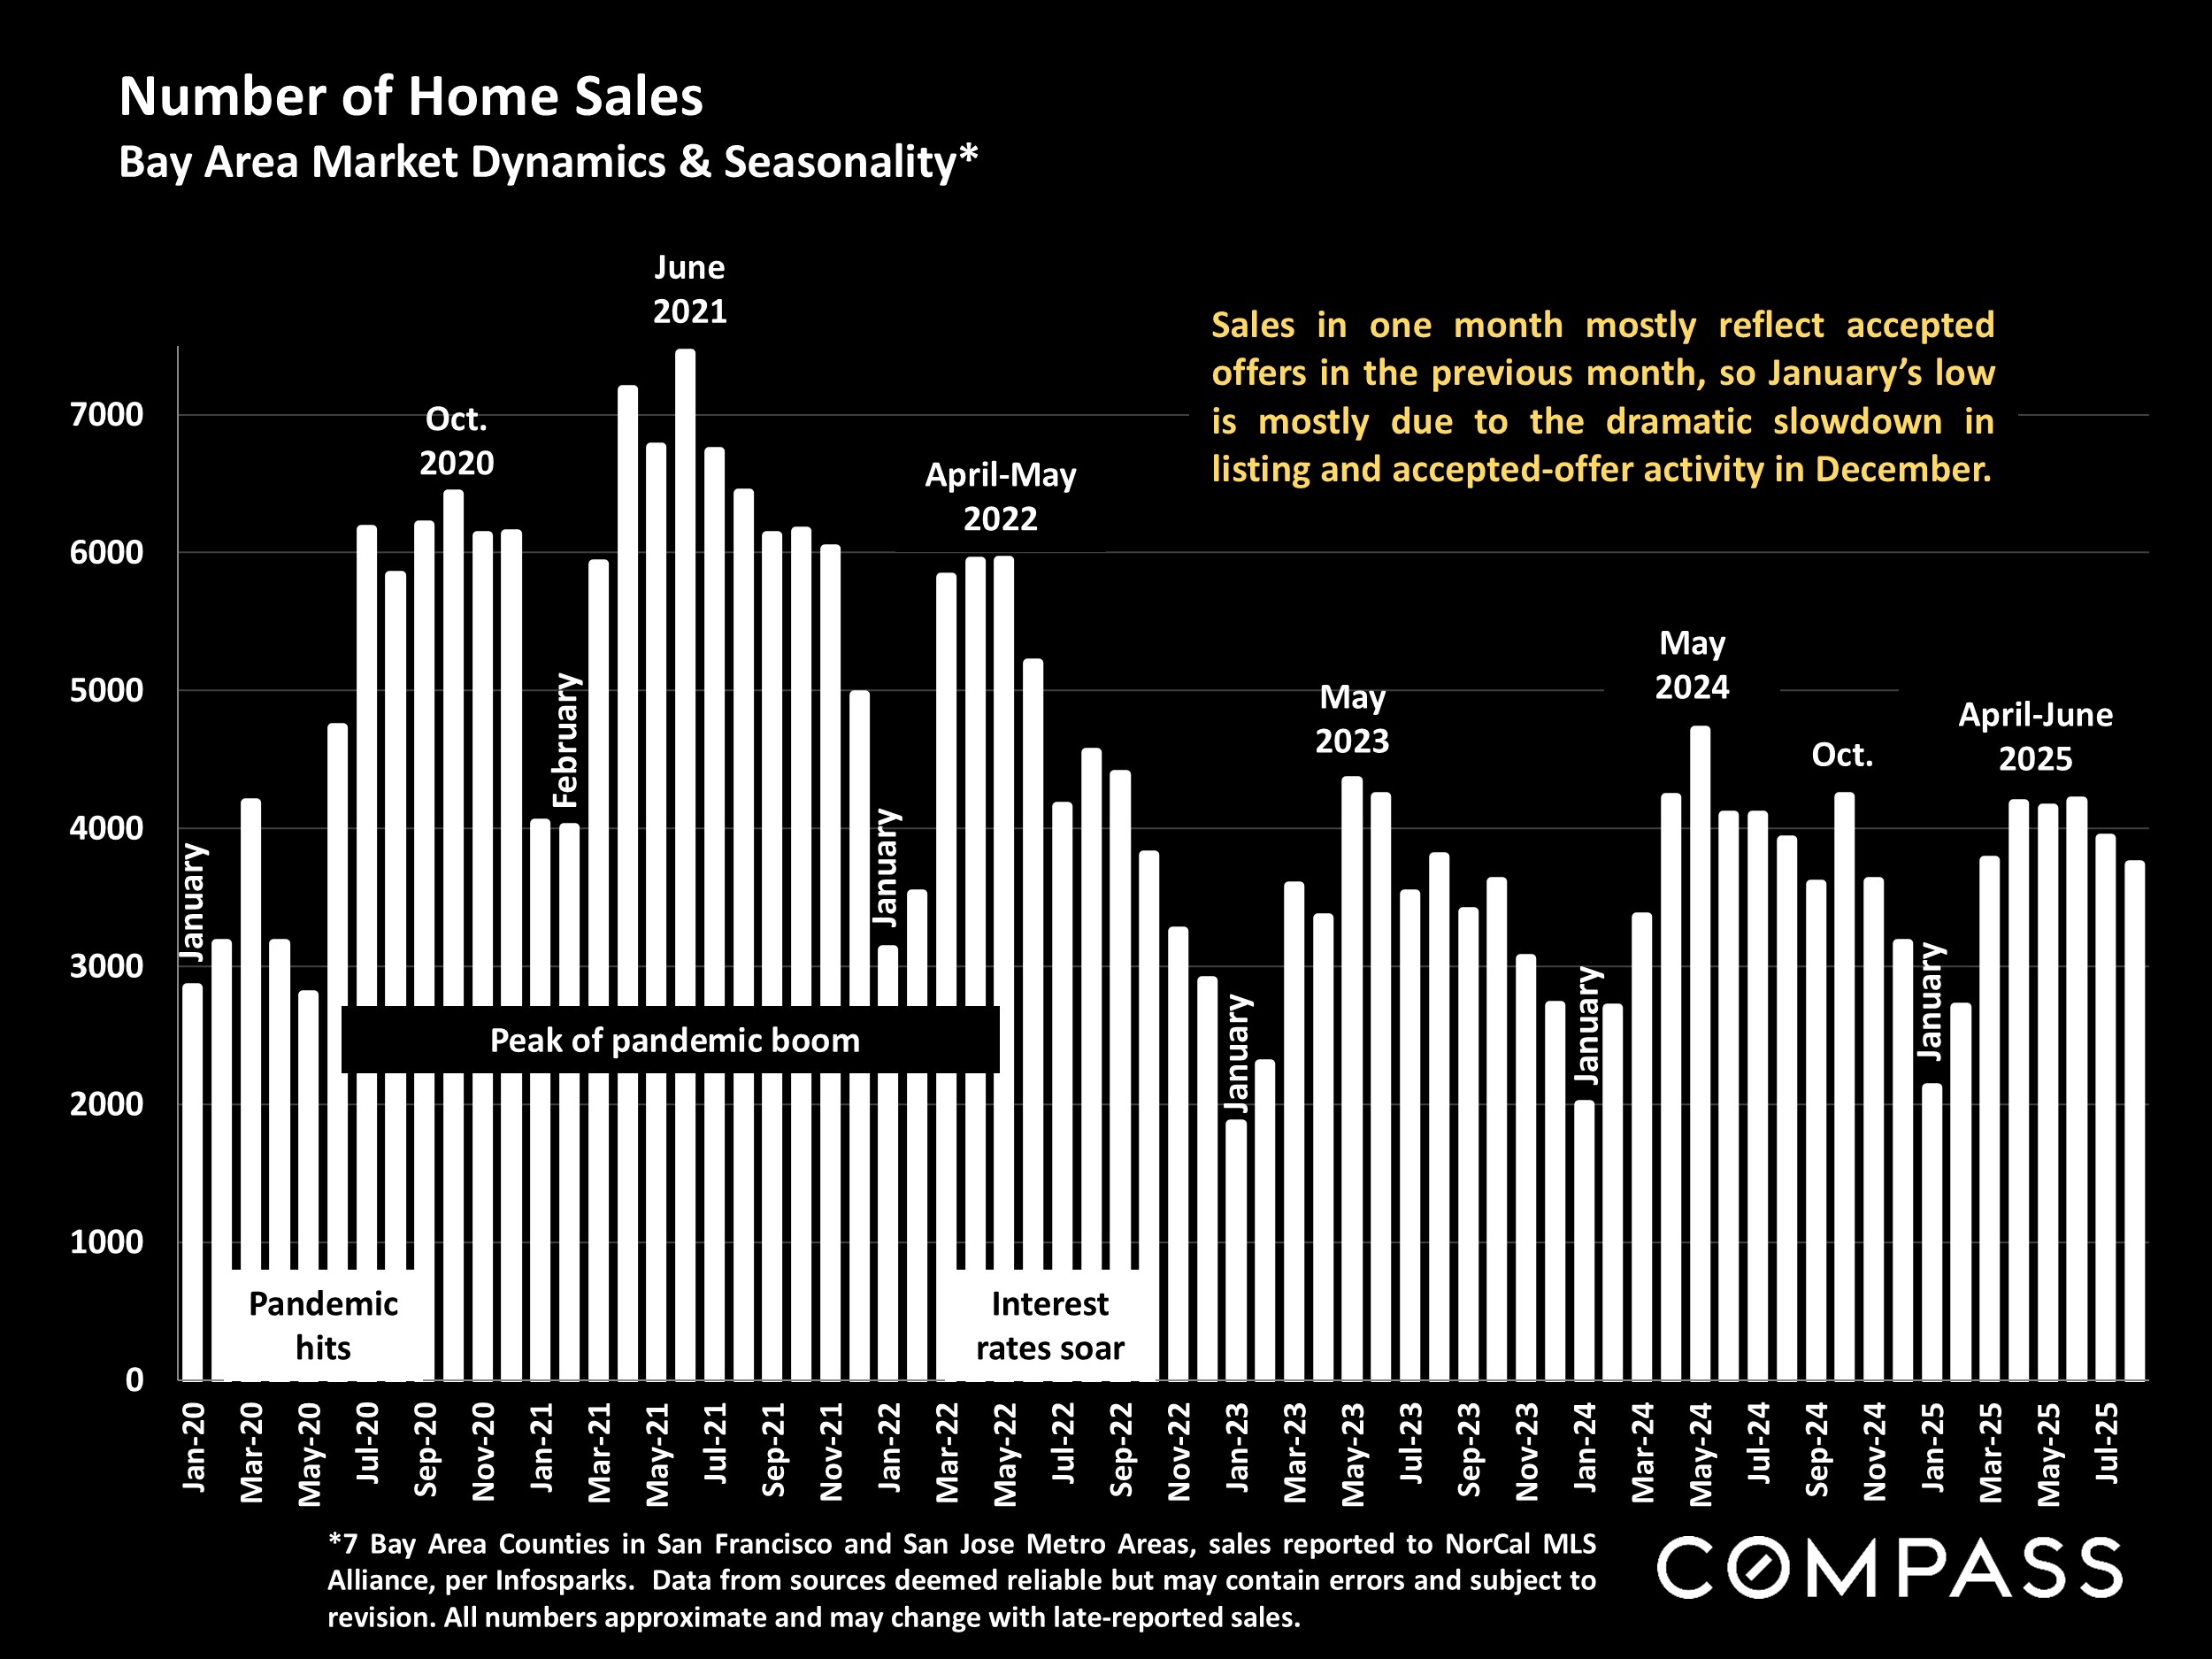
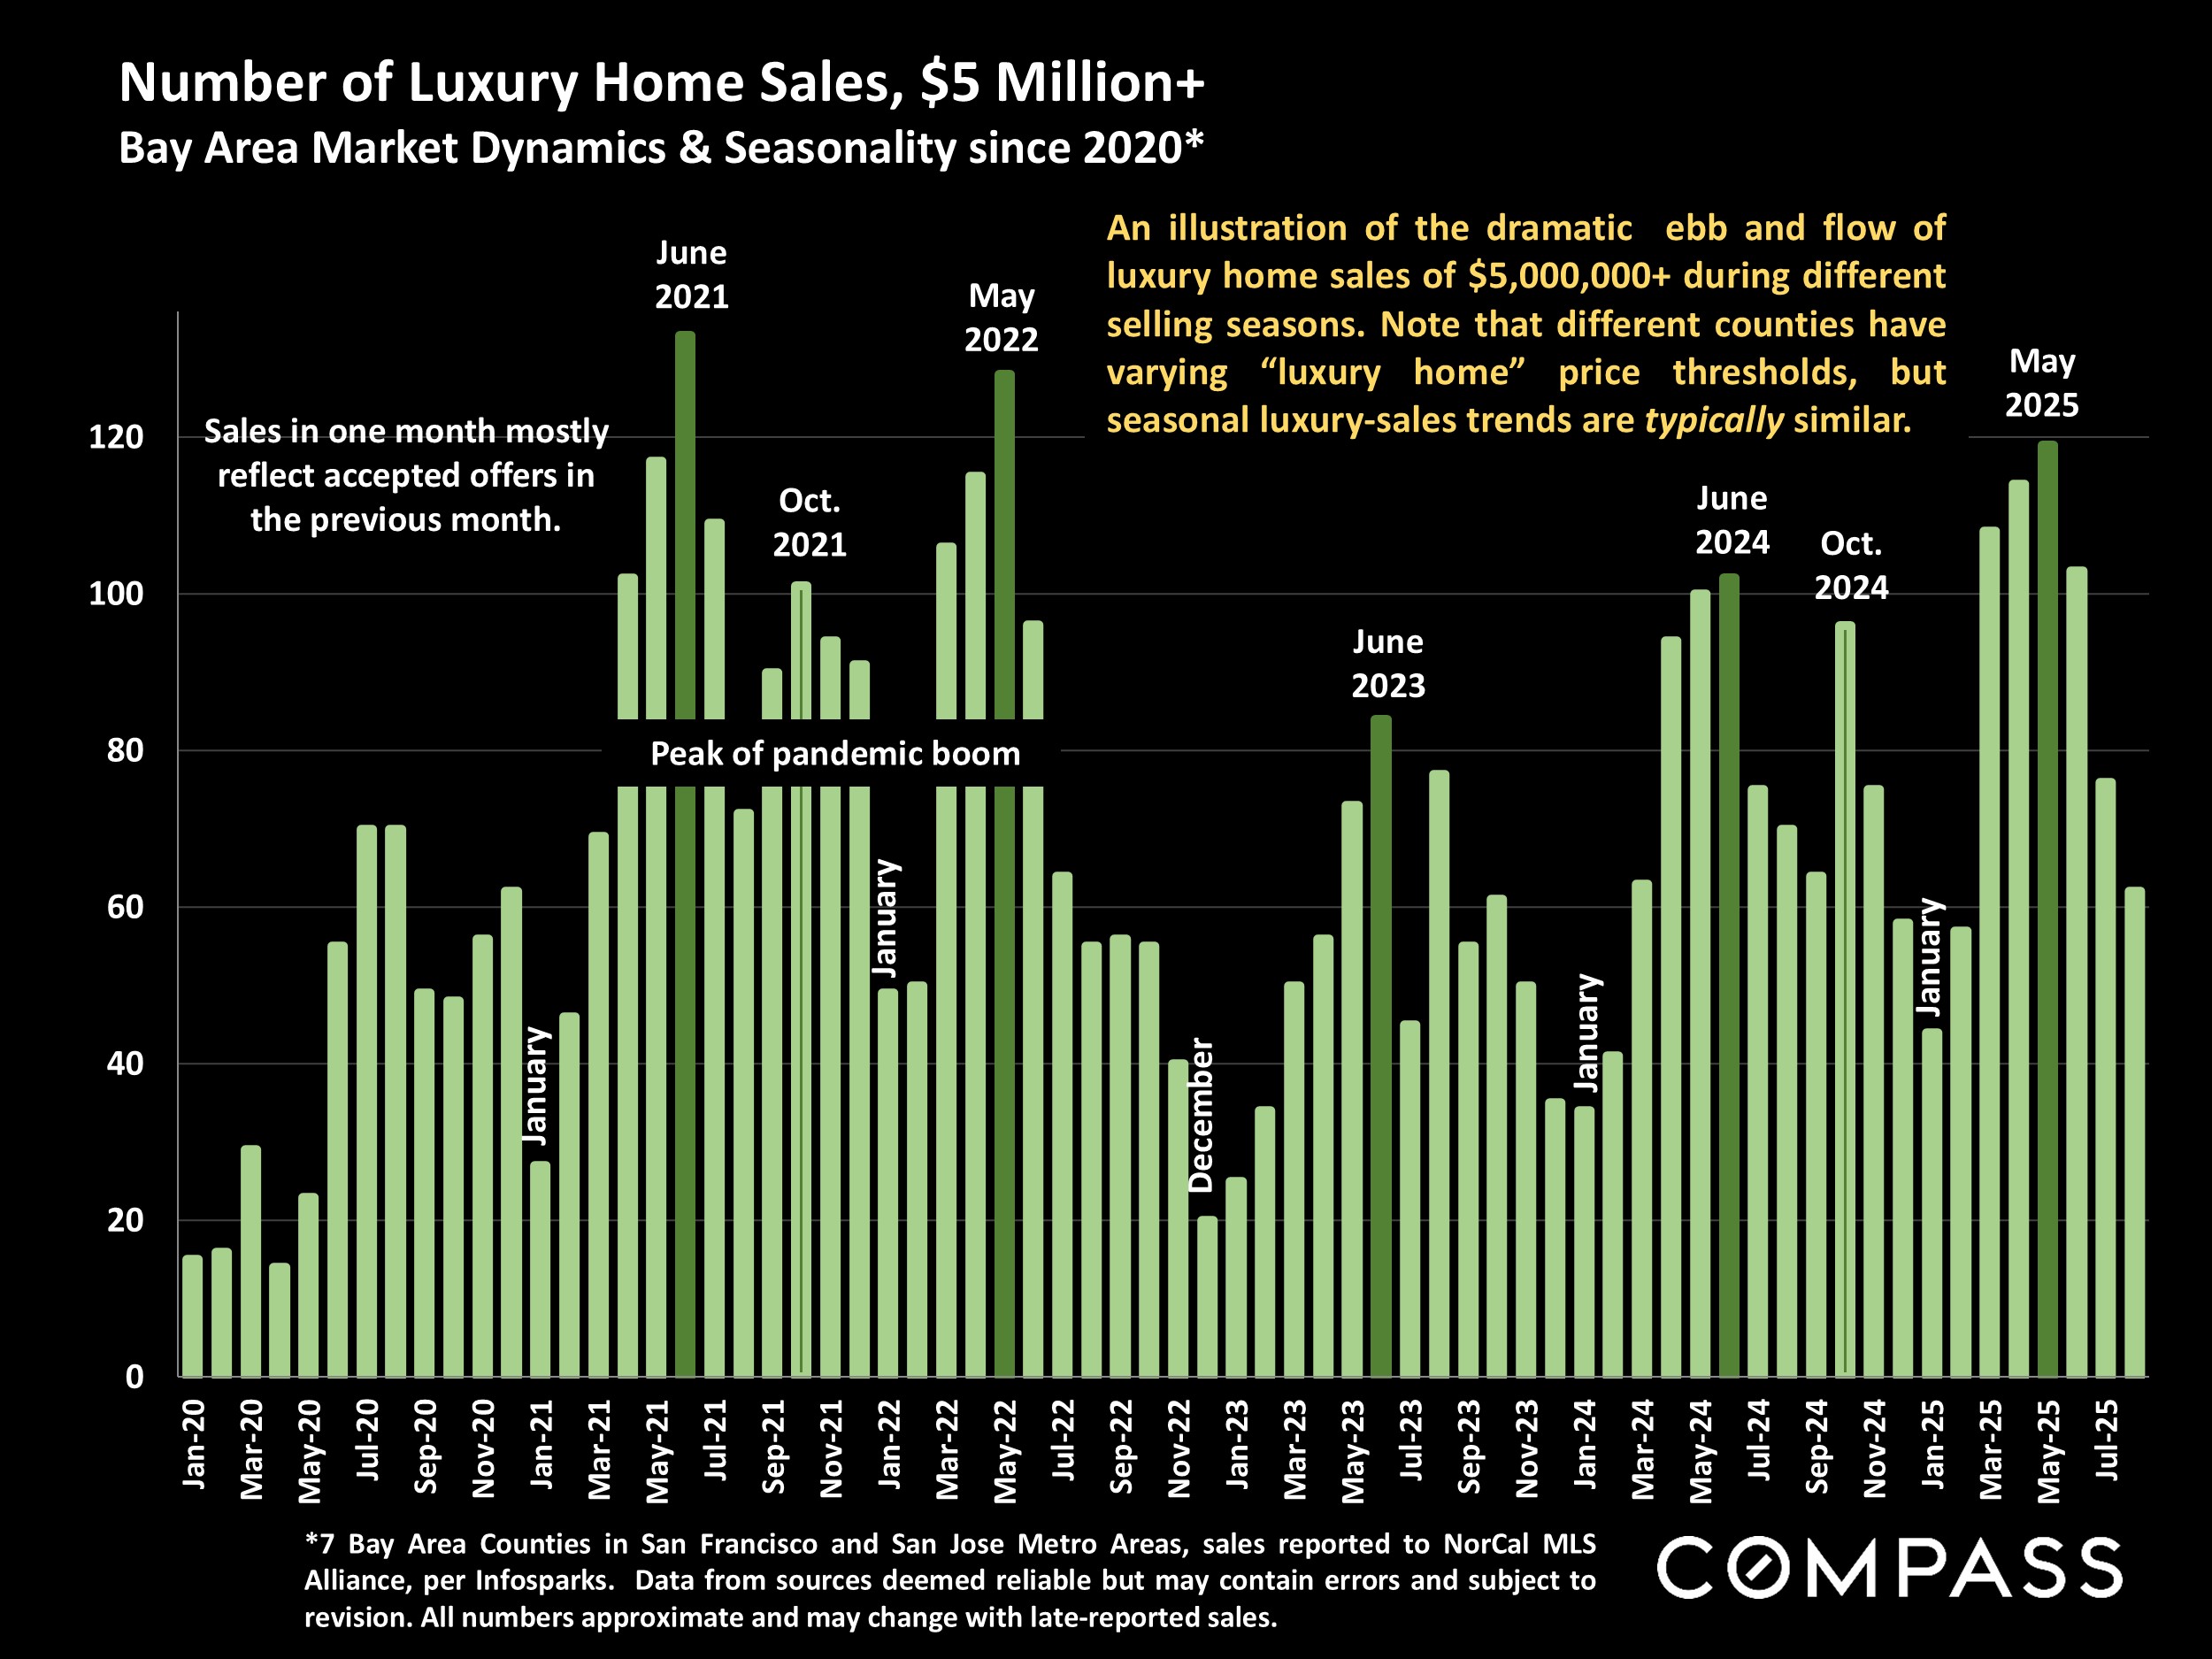
A note about transactional time and market indicators: After new listings first come on market, there is typically at least a 1 to 3 week interval before they go into contract to allow for the marketing and showing period. After an offer is negotiated and accepted, 3 to 6 weeks normally pass before the sale closes due to the escrow, due diligence and financing processes. Closed sales, and the statistics based on closed sales, mostly reflect market conditions in the previous month.
Statistics are generalities, essentially summaries of widely disparate data generated by hundreds or thousands of relatively unique, individual sales occurring within different time periods. They are best seen not as precise measurements, but as broad, comparative indicators, with reasonable margins of error. Anomalous fluctuations in statistics are not uncommon, especially in smaller, expensive market segments. Last period data should be considered estimates that may change with late-reported data. Different analytics programs sometimes define statistics – such as “active listings,” “days on market,” and “months supply of inventory” – differently: what is most meaningful are not specific calculations but the trends they illustrate. Most listing and sales data derives from the local or regional multi-listing services (MLS) of the area specified in the analysis, but not all listings or sales are reported to MLS and these won’t be reflected in the data. “Homes” signify real-property, single-household housing units: houses, condos, co-ops, townhouses, duets and TICs (but not mobile homes), as applicable to each market. Multi-county metro areas will be specified as such. Data from sources deemed reliable, but may contain errors and subject to revision. All numbers to be considered approximate.
Median Sales Price is that price at which half the properties sold for more and half for less. It may be affected by seasonality, “unusual” events, or changes in inventory and buying trends, as well as by changes in fair market value. The median sales price for an area will often conceal an enormous variety of sales prices in the underlying individual sales.
Compass is a real estate broker licensed by the State of California, DRE 01527235. Equal Housing Opportunity. This report has been prepared solely for information purposes. The information herein is based on or derived from information generally available to the public and/or from sources believed to be reliable. No representation or warranty can be given with respect to the accuracy or completeness of the information. Compass disclaims any and all liability relating to this report, including without limitation any express or implied representations or warranties for statements contained in, and omissions from, the report. Nothing contained herein is intended to be or should be read as any regulatory, legal, tax, accounting or other advice and Compass does not provide such advice. All opinions are subject to change without notice. Compass makes no representation regarding the accuracy of any statements regarding any references to the laws, statutes or regulations of any state are those of the author(s). Past performance is no guarantee of future results.