San Francisco Real Estate: Coronavirus Update, May 2020

San Francisco Real Estate Market – Begins to Slowly Recover


Source: Compass

It is impossible to know how median and average value statistics apply to any particular home without a specific comparative market analysis. Many factors affect sales prices besides neighborhood/ bedroom count: quality of location within the neighborhood, condition, size, architecture, views, amenities, parking, outdoor space, etc.

These analyses were made in good faith with data from sources deemed reliable, but may contain errors and are subject to revision. It is not our intent to convince you of a particular position,but to attempt to provide straightforward data and analysis, so you can make your own informed decisions. Median and average statistics are enormous generalities: There are hundreds of different markets in San Francisco and the Bay Area, each with its own unique dynamics. Median prices and average dollar per square foot values can be and often are affected by other factors besides changes in fair market value. Longer term trends are much more meaningful than short-term.

Compass is a real estate broker licensed by the State of California, DRE 01527235. Equal Housing Opportunity. This report has been prepared solely for information purposes. The information herein is based on or derived from information generally available to the public and/or from sources believed to be reliable. No representation or warranty can be given with respect to the accuracy or completeness of the information. Compass disclaims any and all liability relating to this report, including without limitation any express or implied representations or warranties for statements contained in, and omissions from, the report. Nothing contained herein is intended to be or should be read as any regulatory, legal, tax, accounting or other advice and Compass does not provide such advice. All opinions are subject to change without notice. Compass makes no representation regarding the accuracy of any statements  regarding  any references to the laws, statutes or regulations  of any state are those of  the author(s).  Past performance is no guarantee  of future  results.


San Mateo County Real Estate Market Begins to Bounce Back, May 2020

Market activity begins to tick up after severe shelter-in-place plunge. No decline in median home prices. Interest rates hit new low.
May 2020 Crisis Update
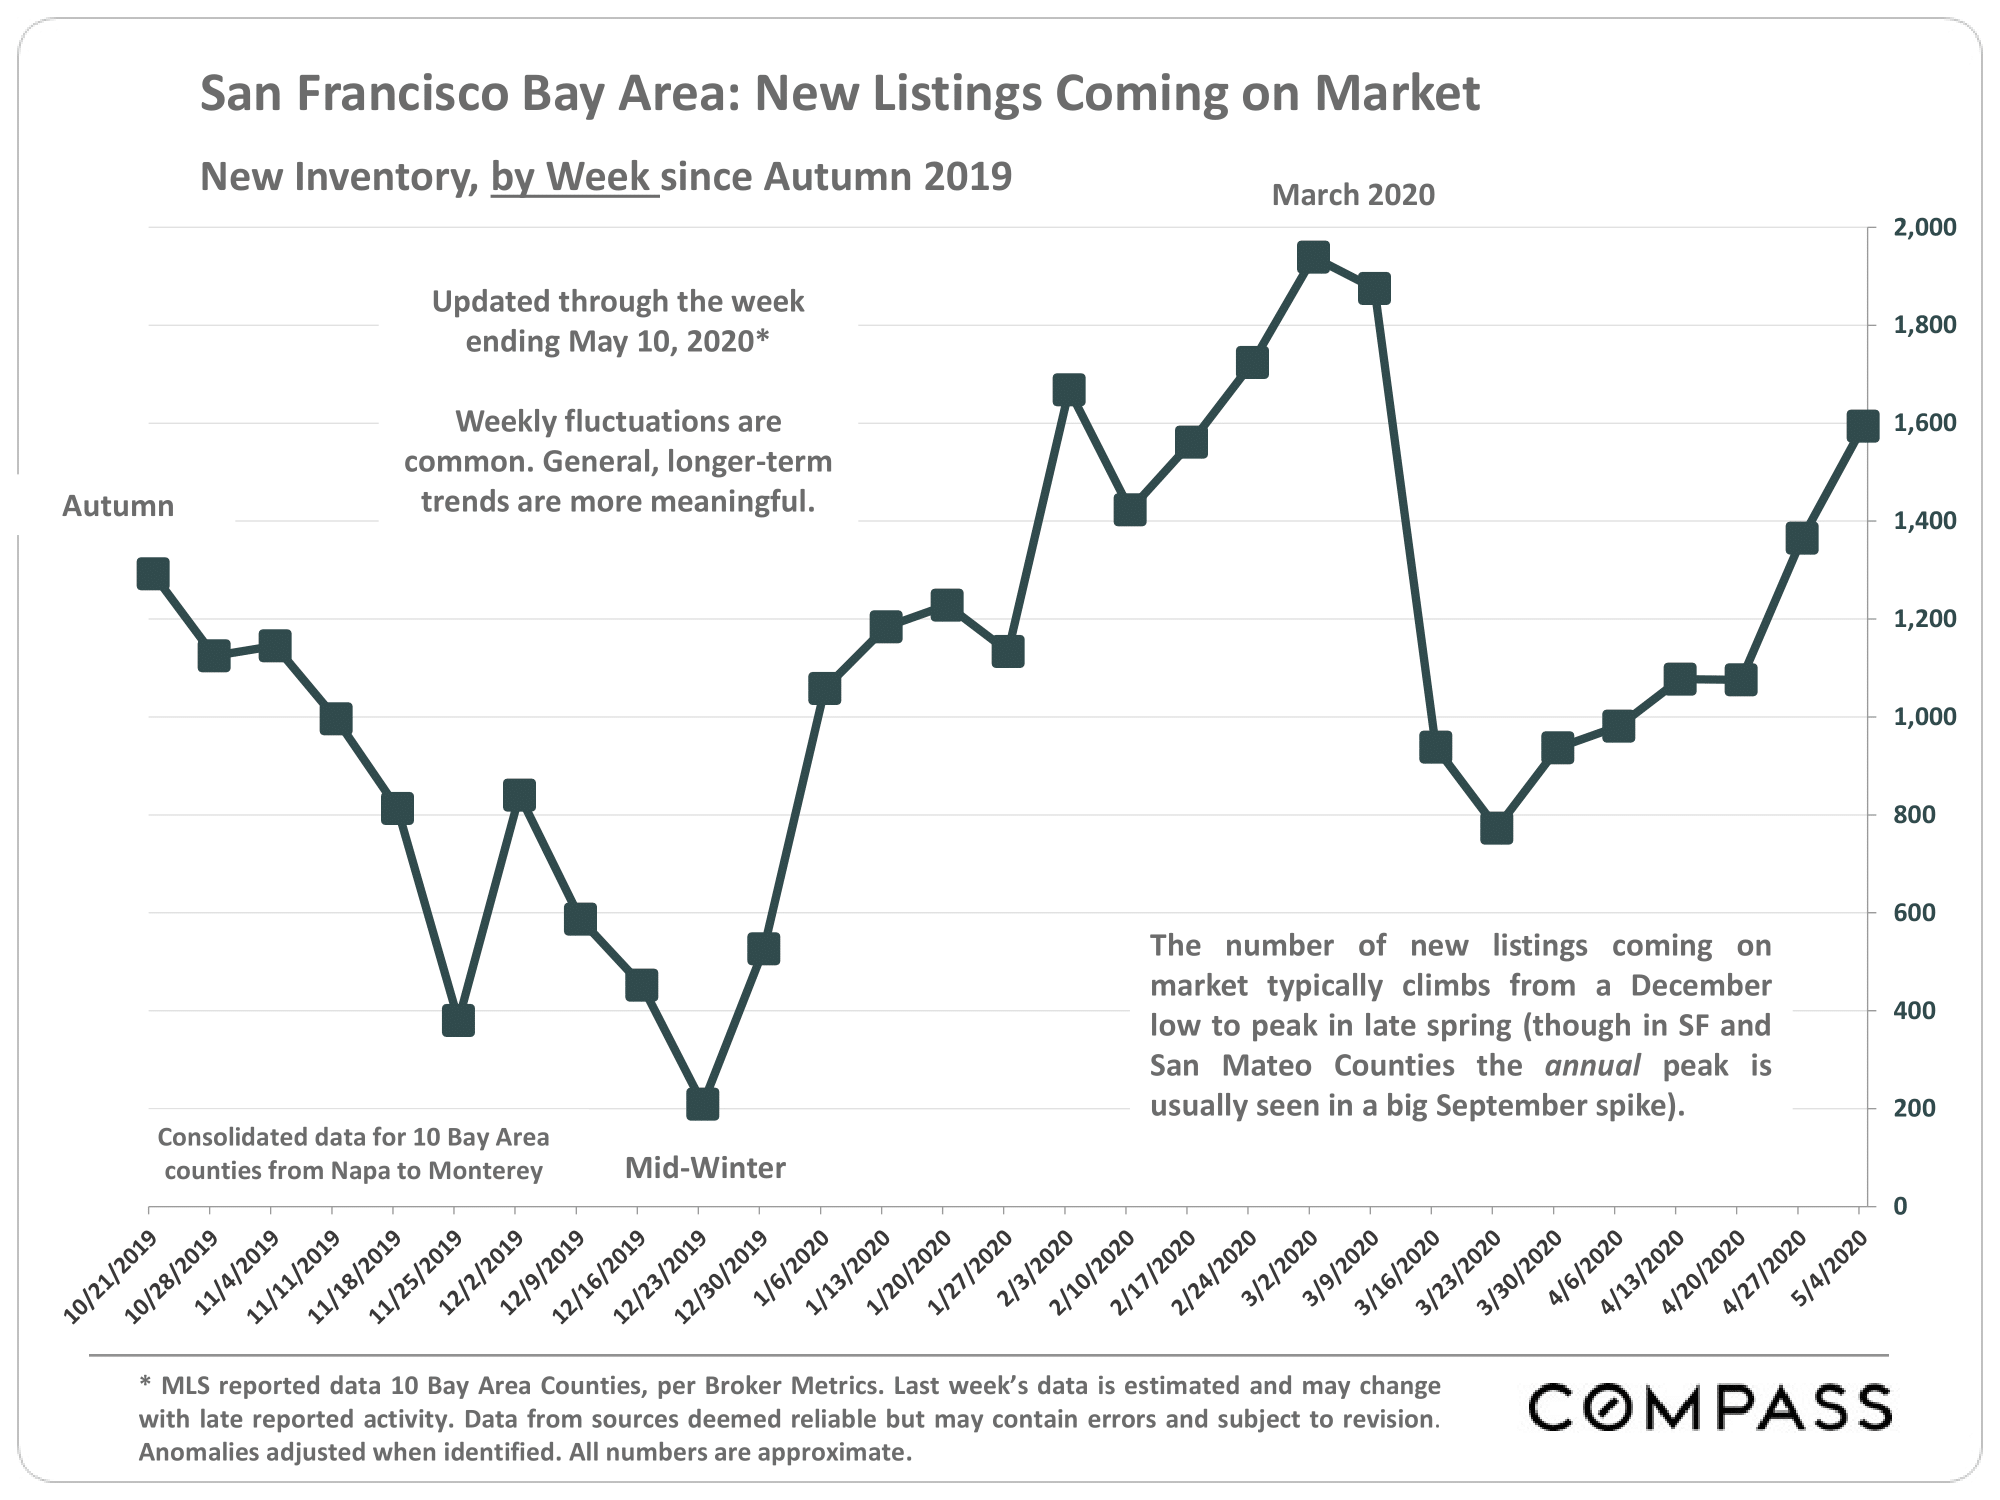
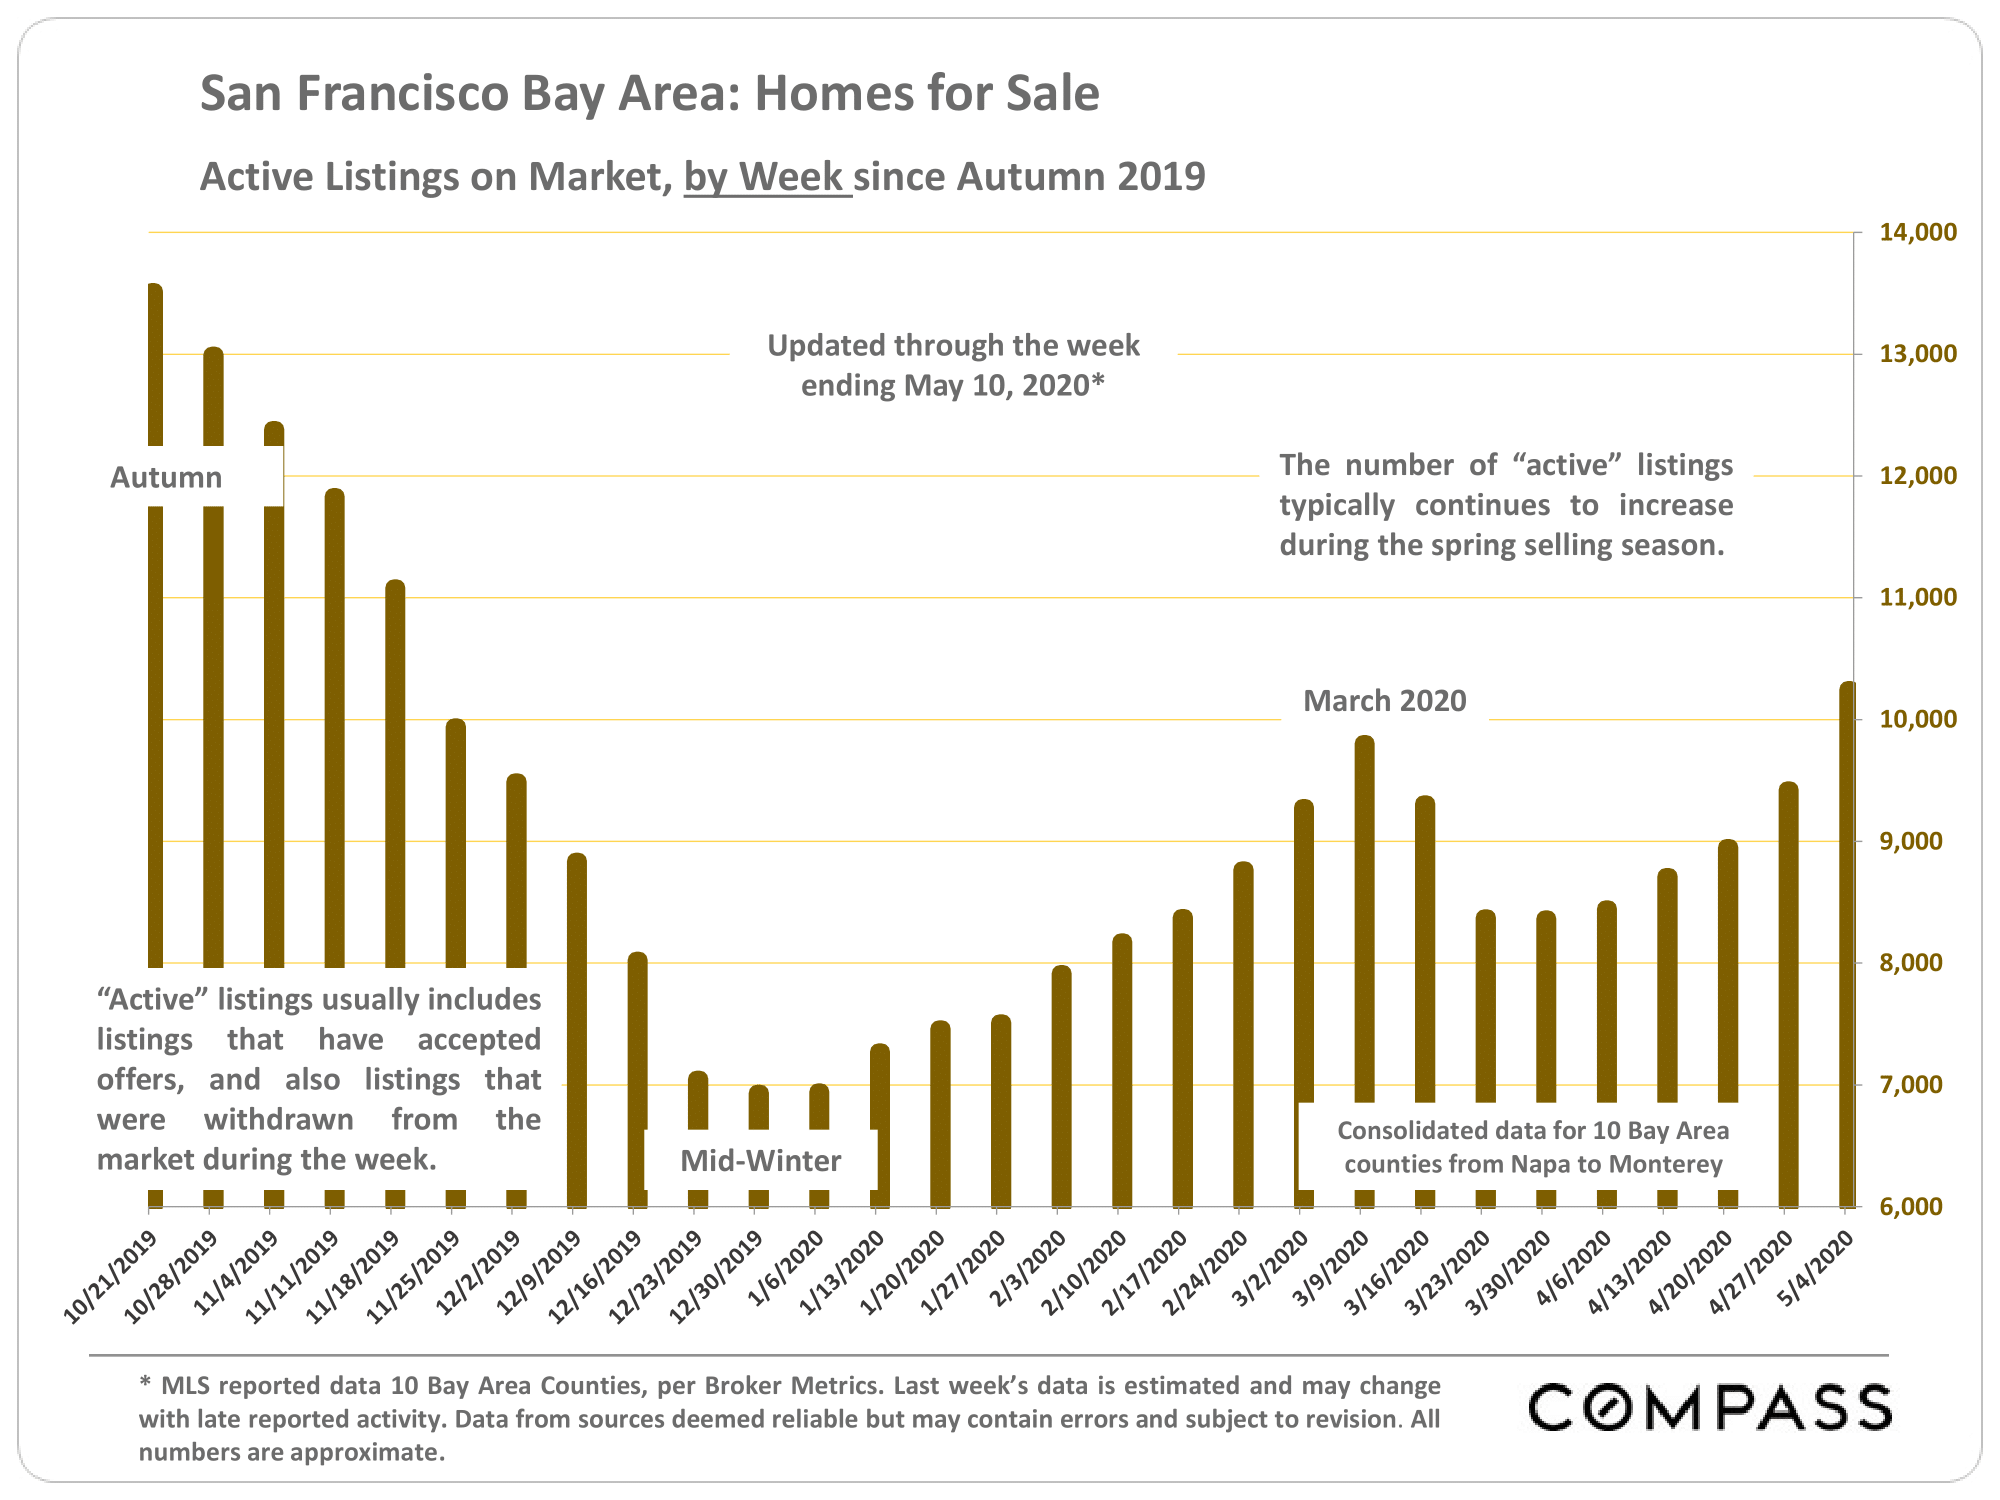
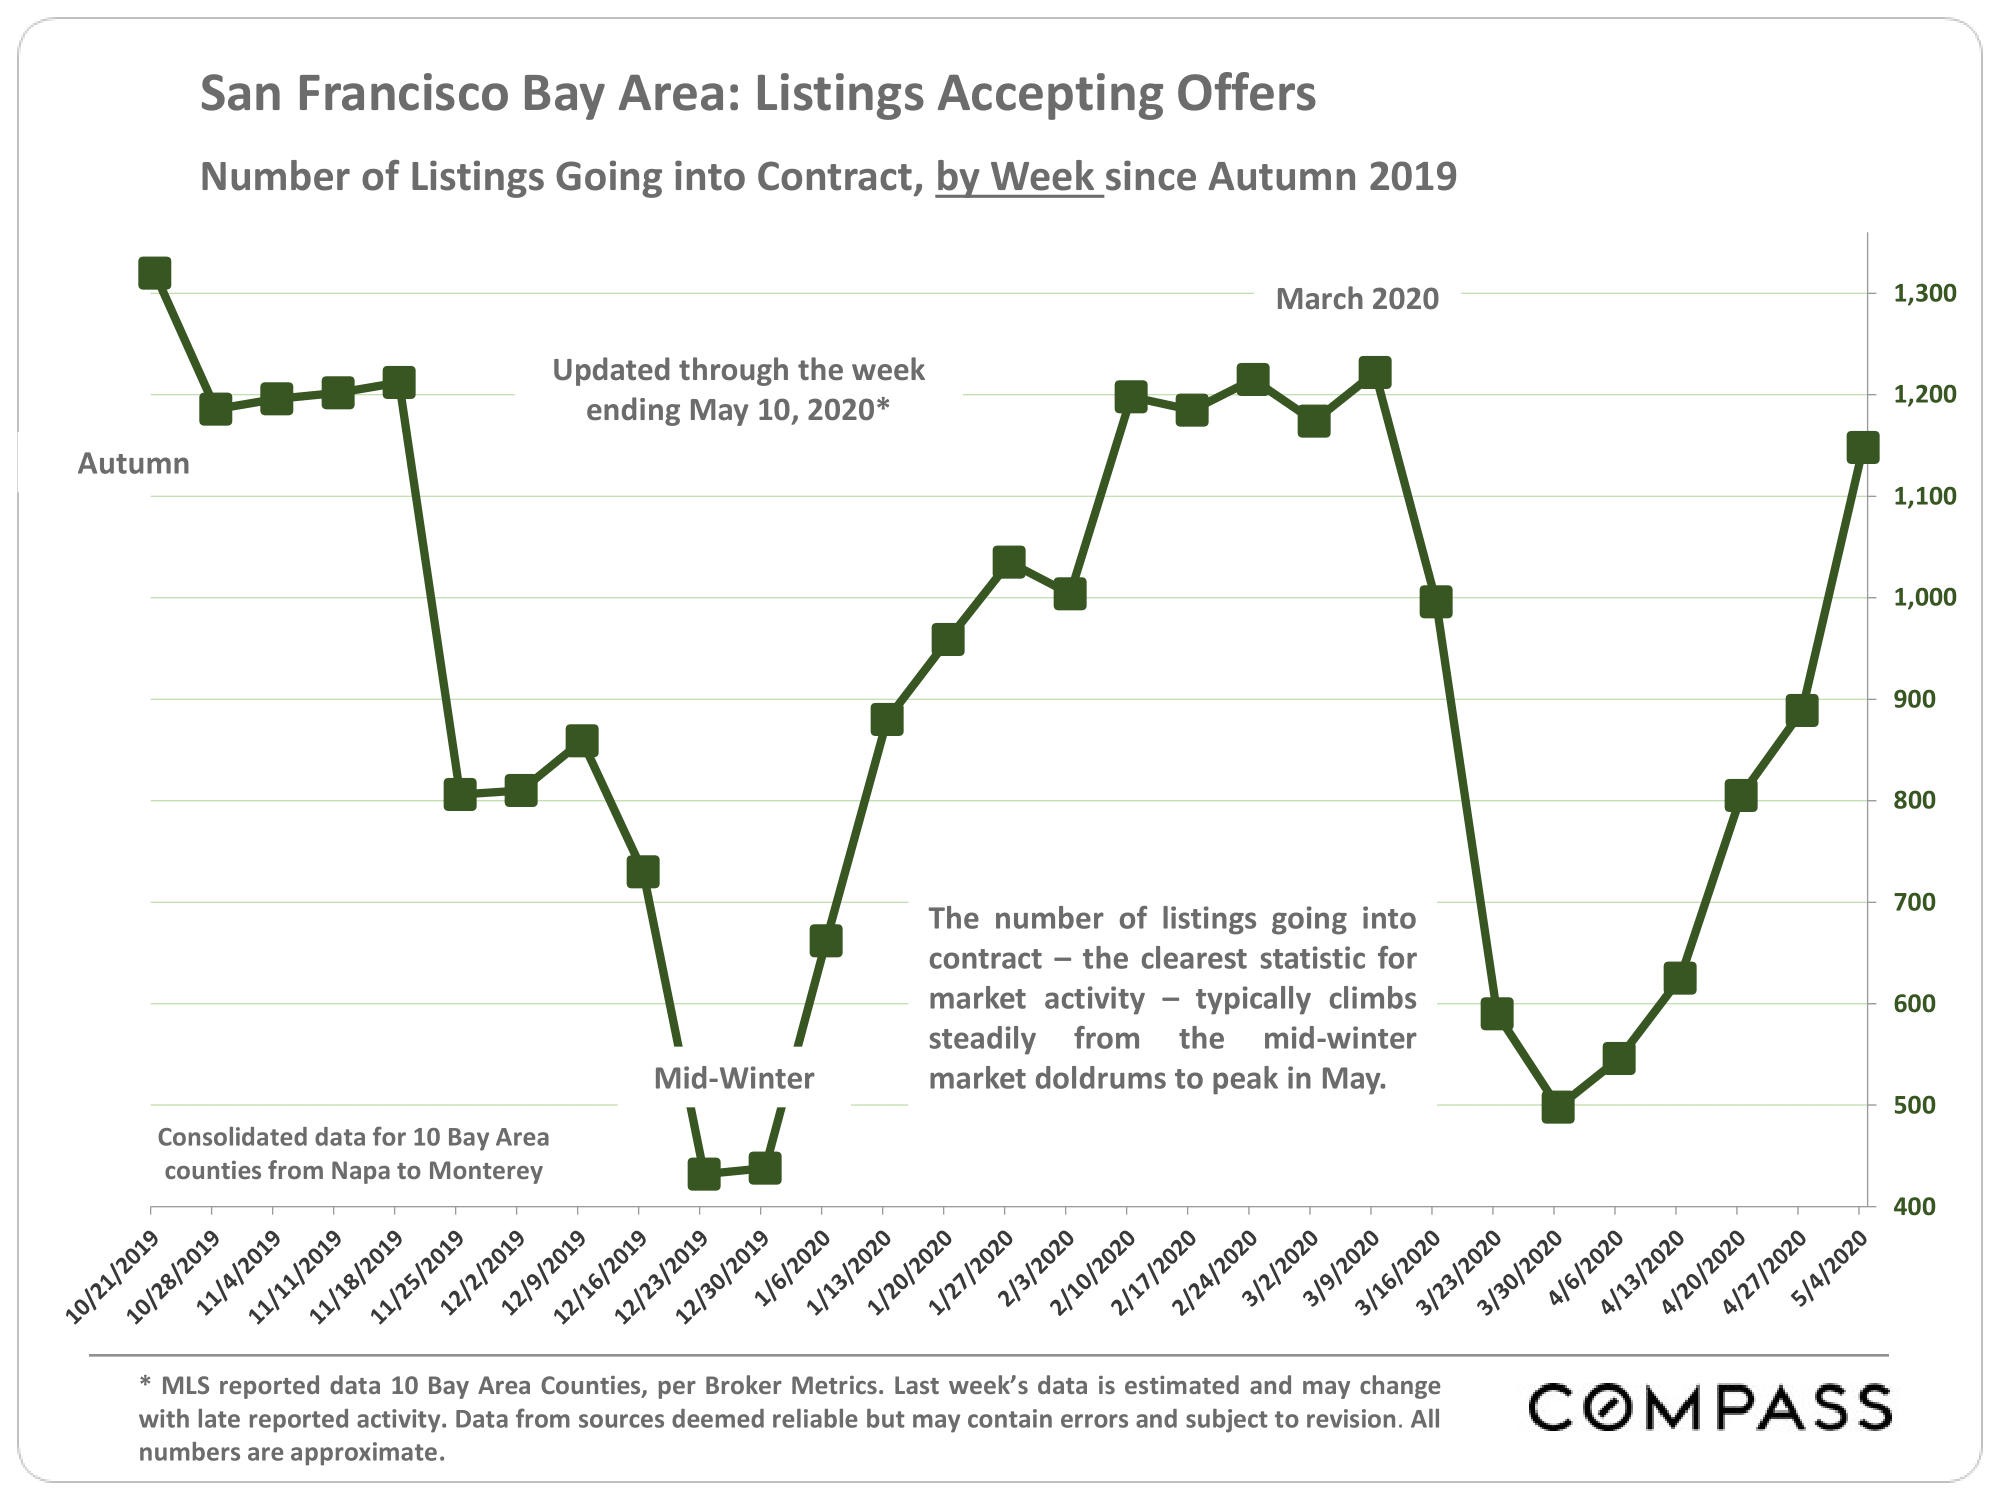
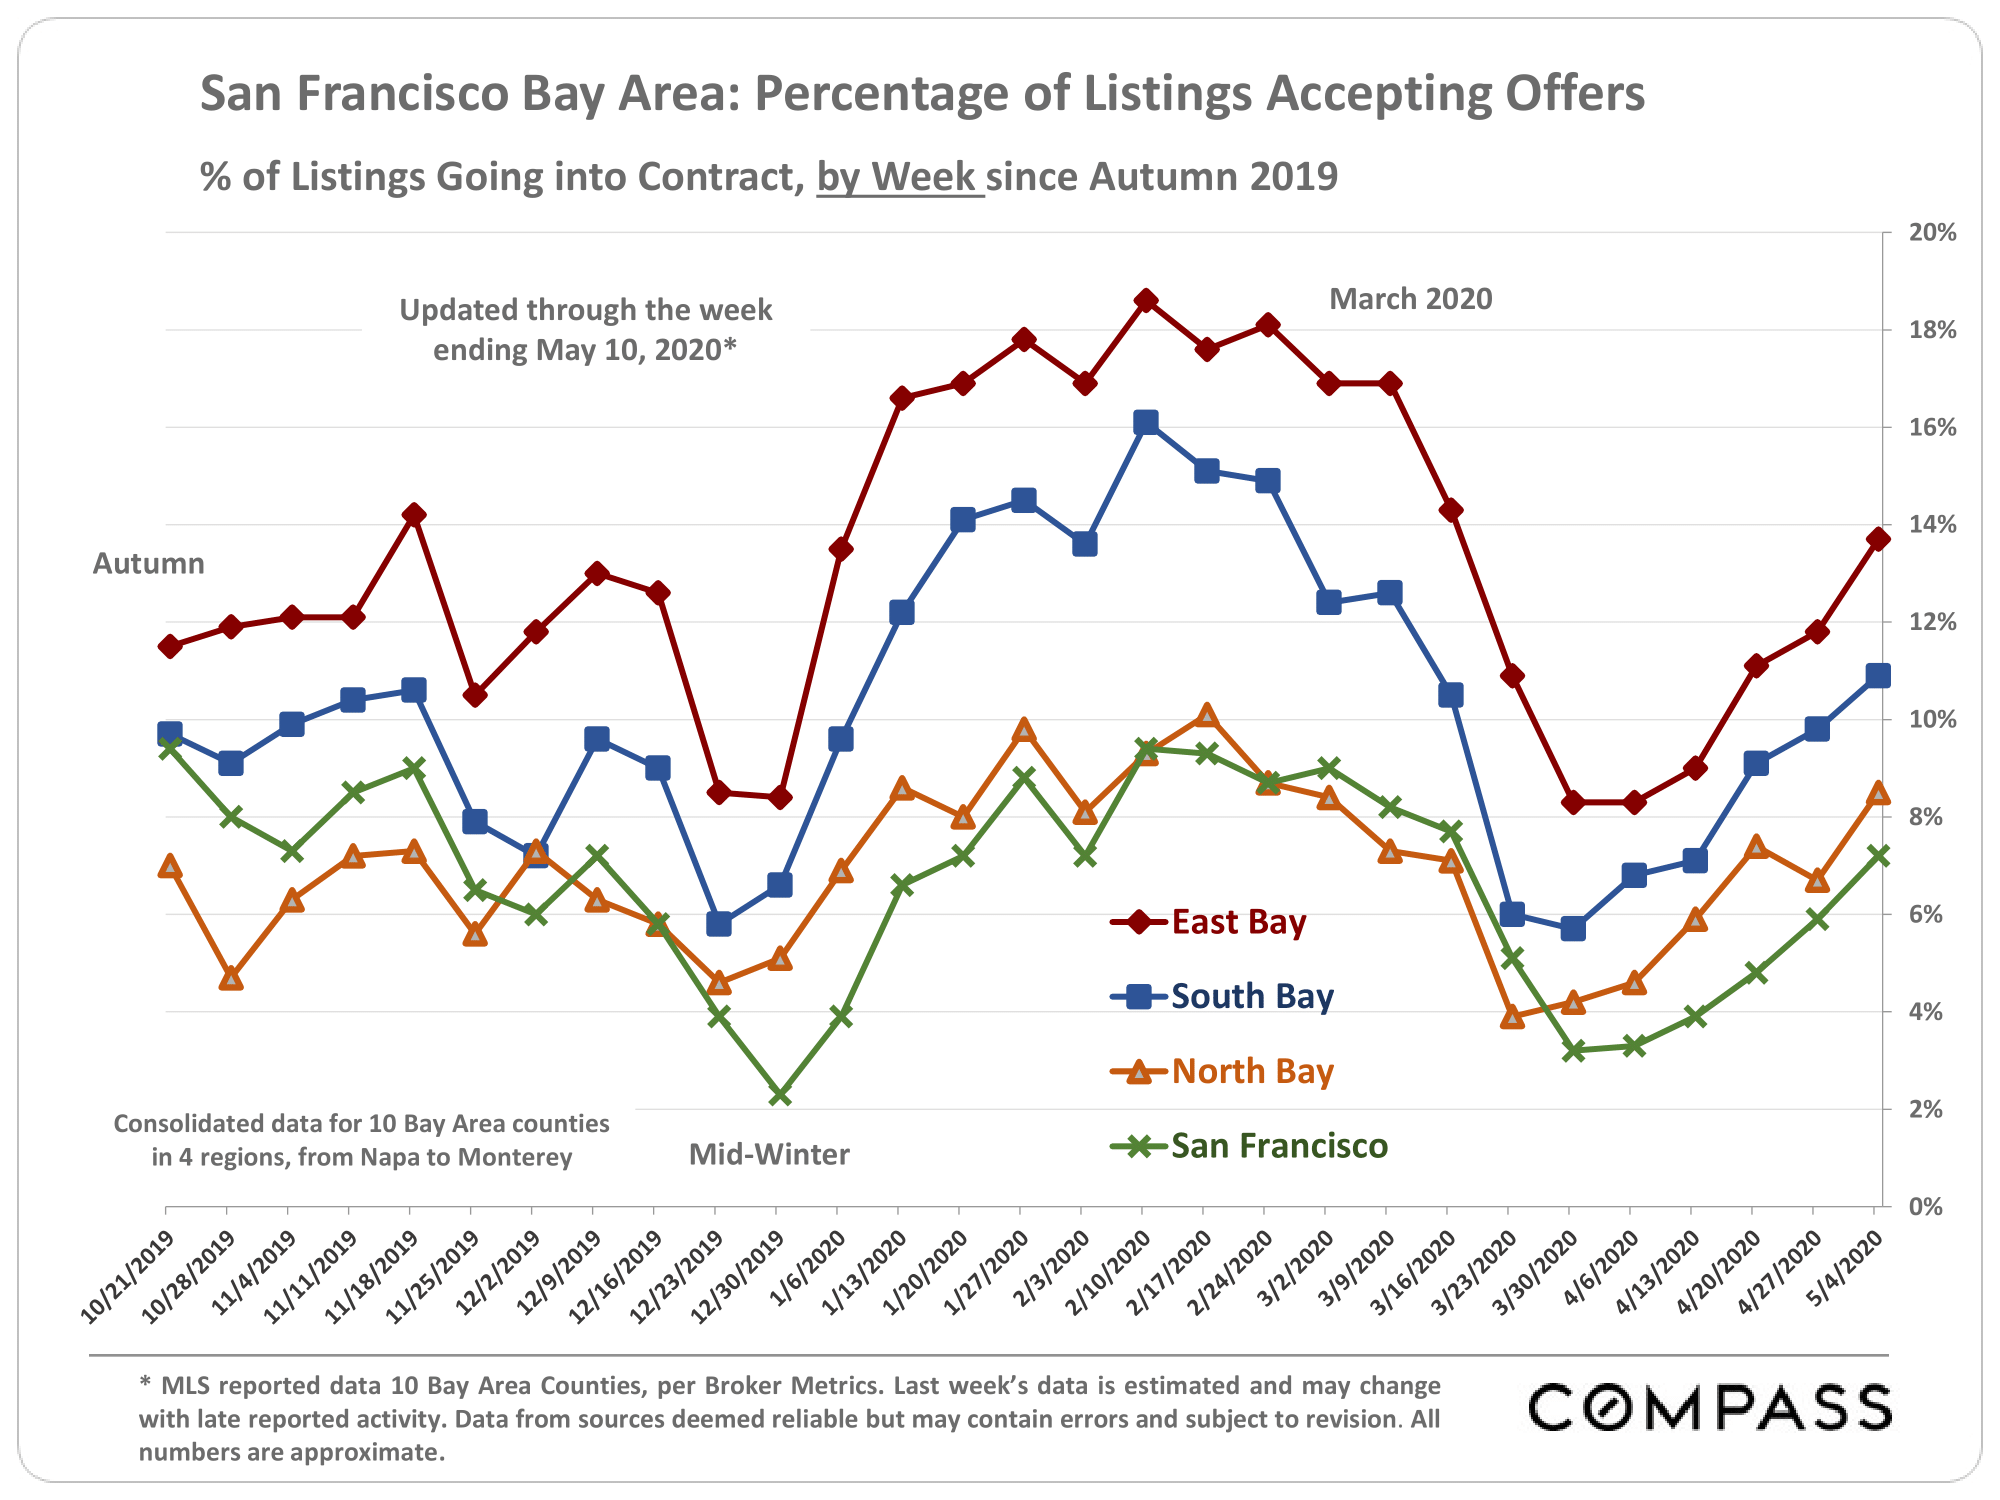
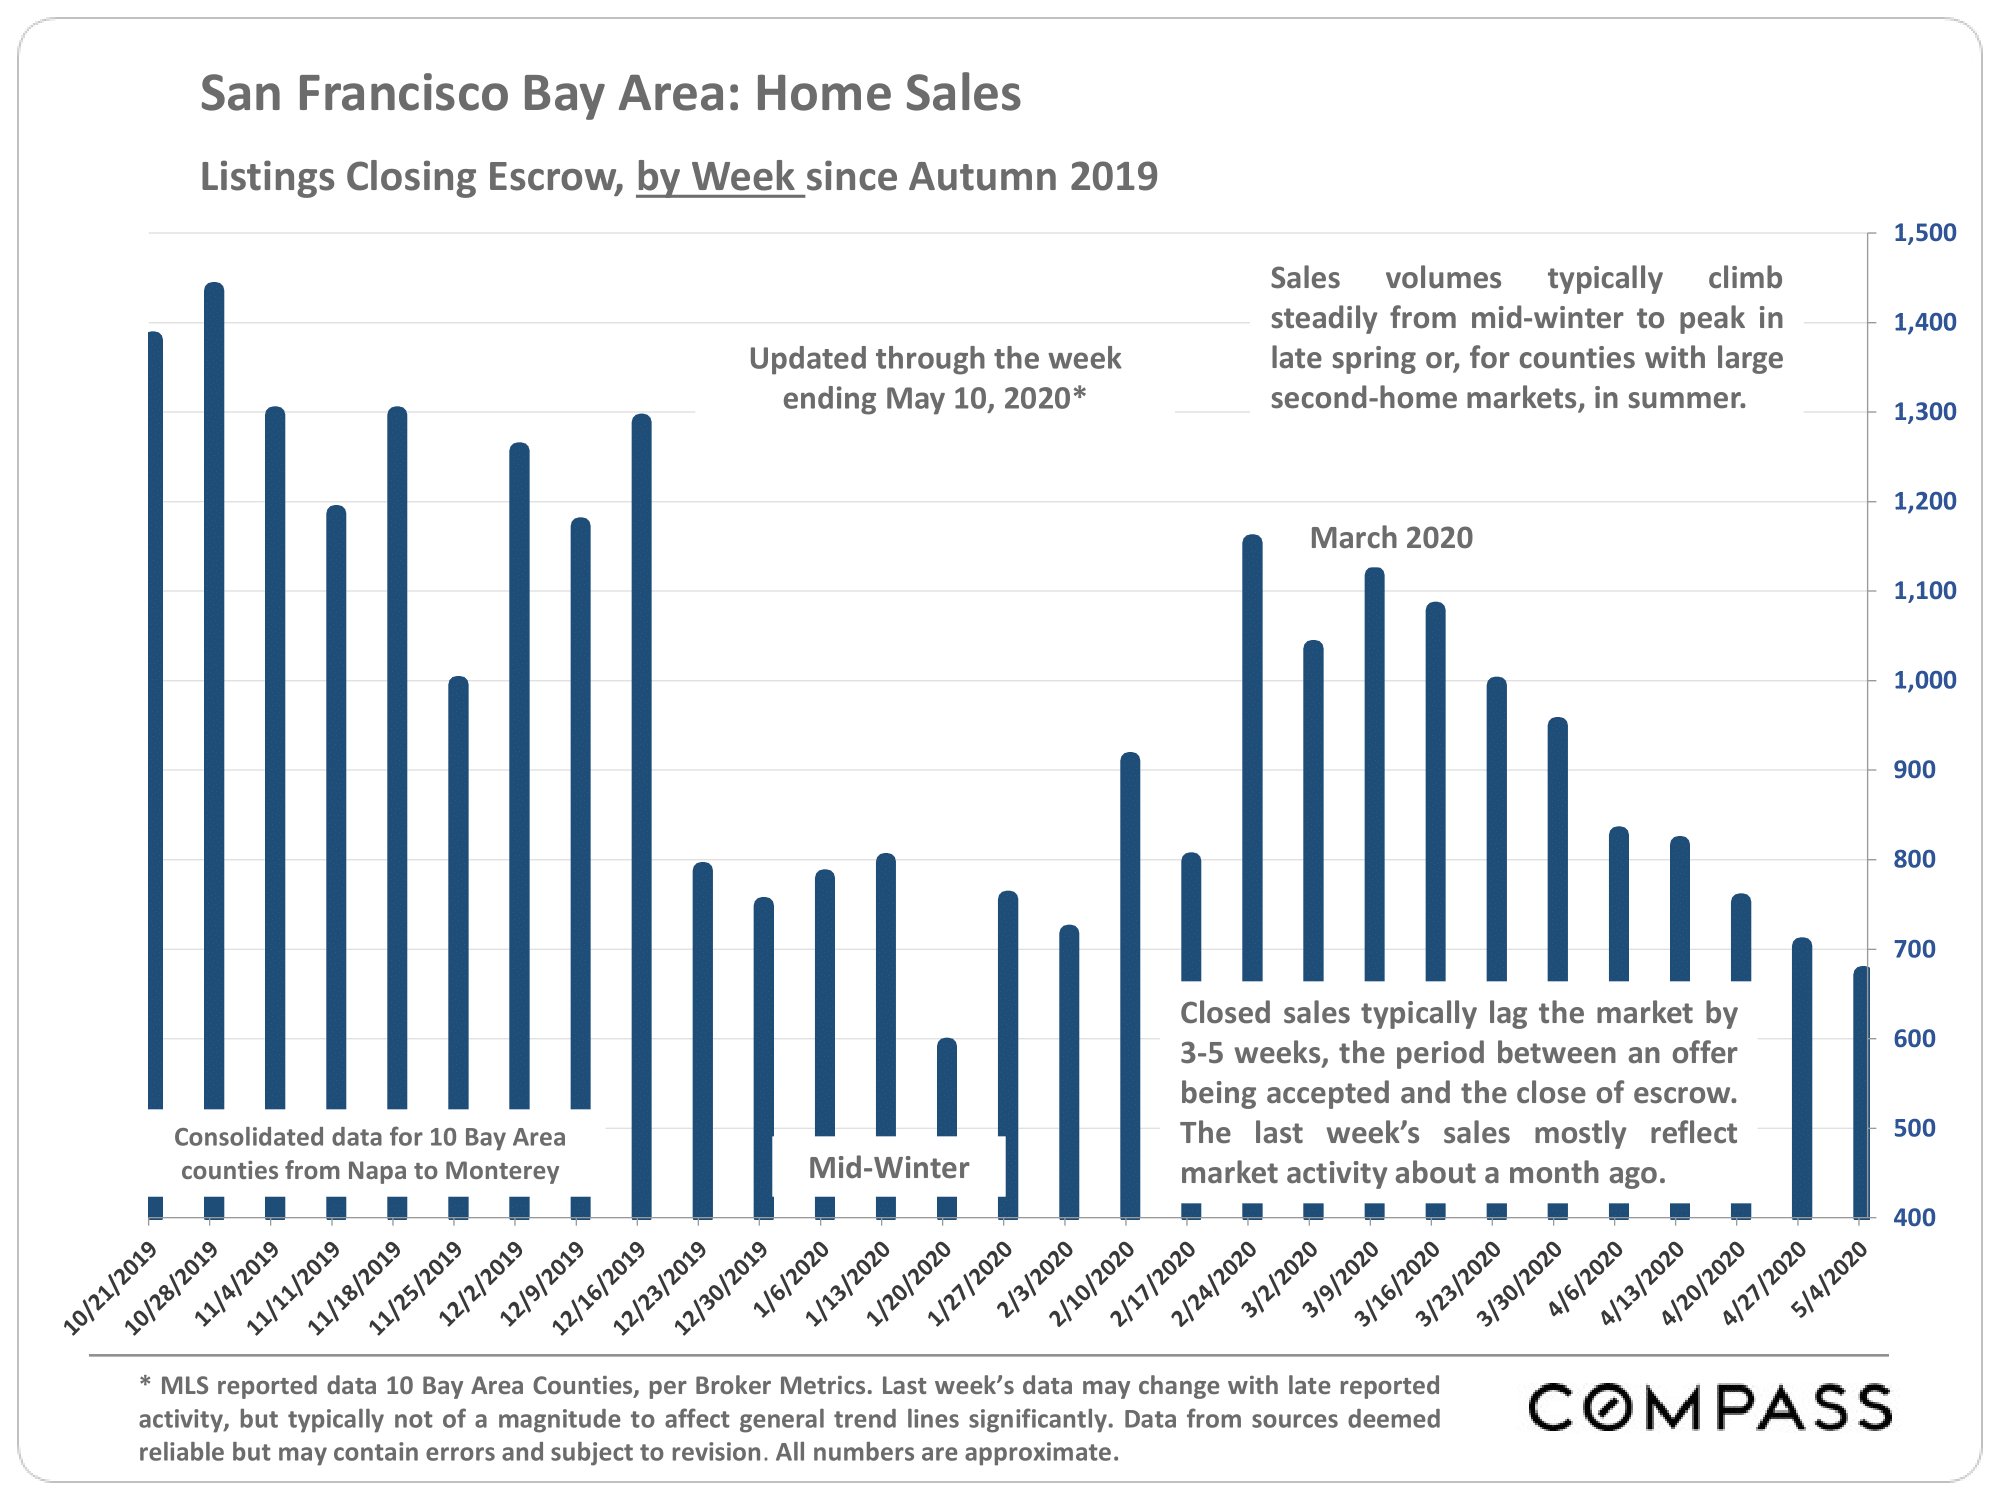
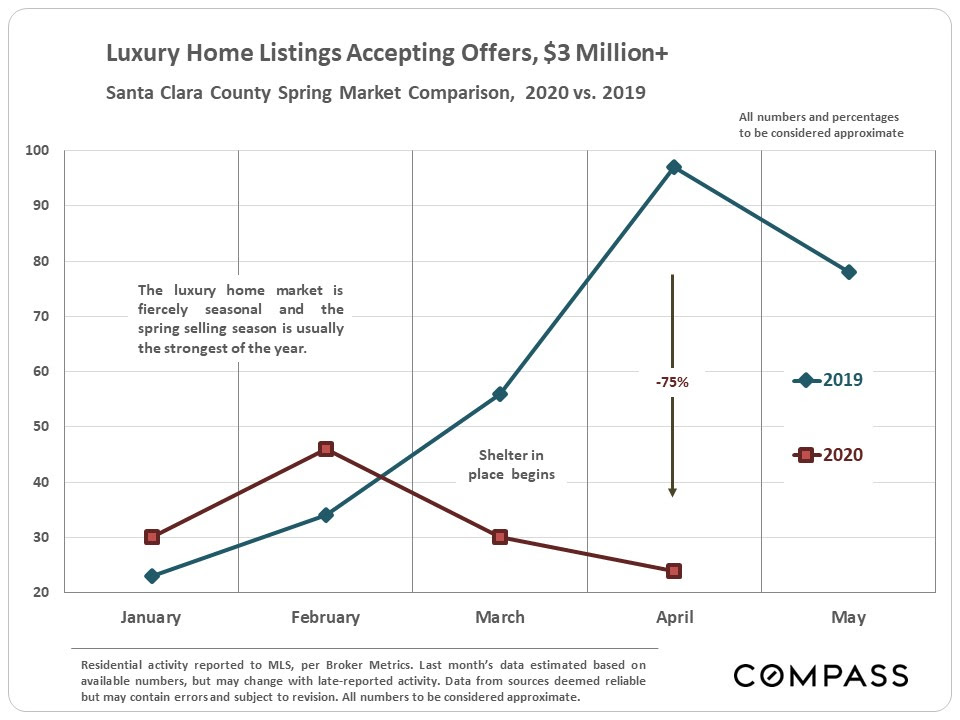
Shelter-in-place caused steep drops in activity across the board in what is typically the busiest selling season of the year. However, though still far below normal levels, activity has been slowly picking up since bottoming out in late March/early April, and will presumably continue to do so with the easing of both shelter-in-place and property-showing rules. 
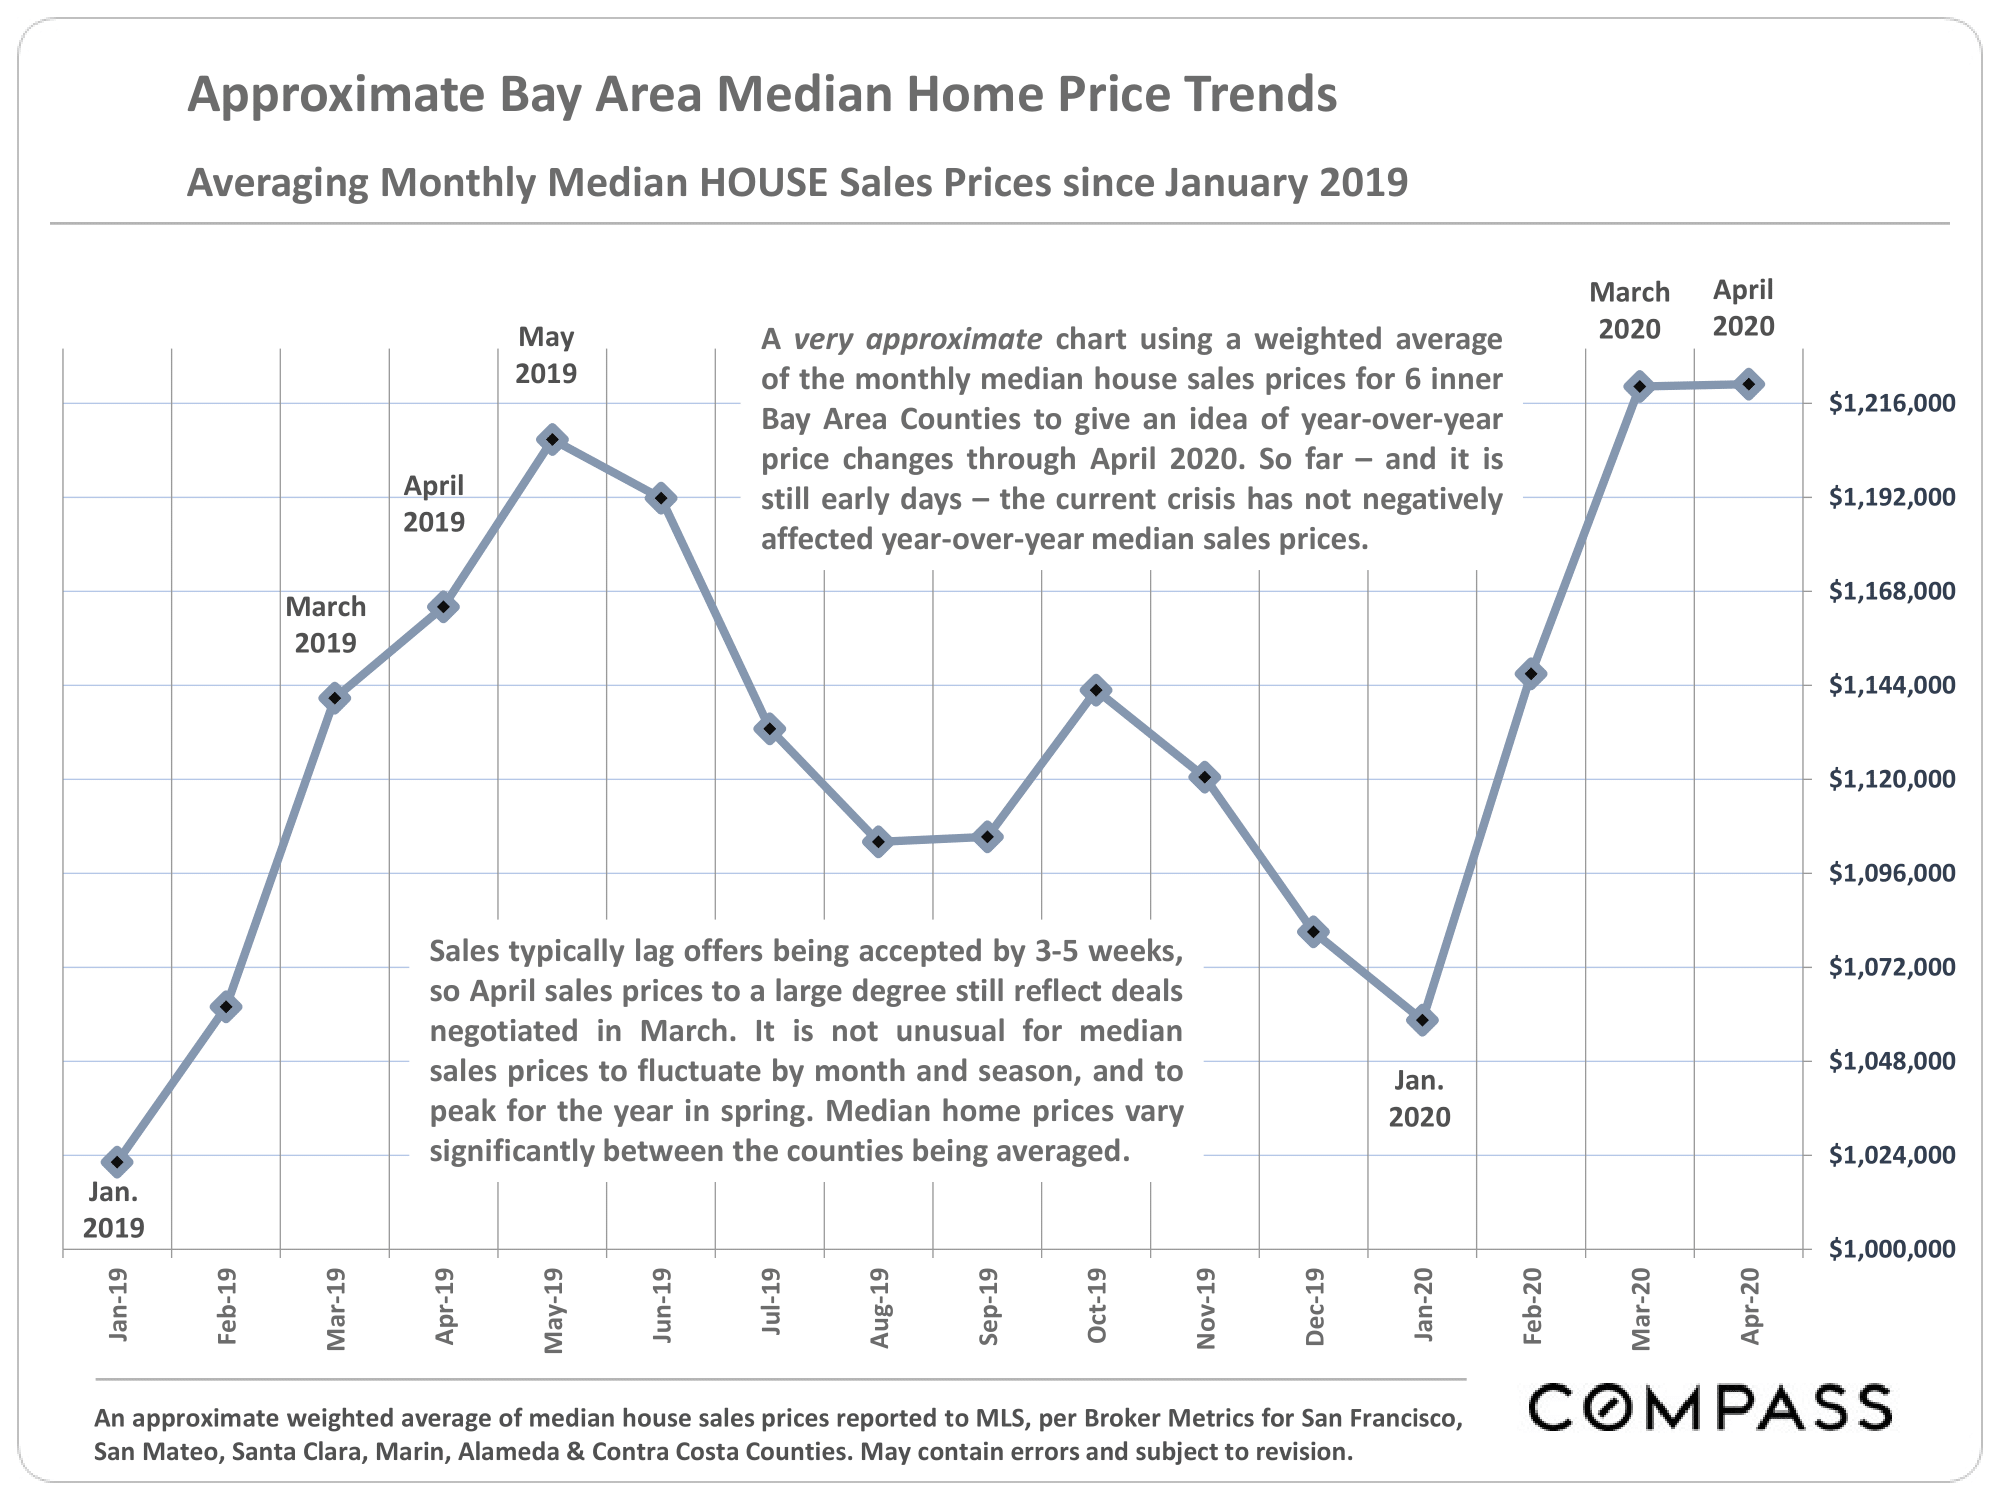
So far, home prices have seen no declines. In fact, there have been substantial year-over-year gains, but a fair proportion of the sales behind April median sales prices still reflects offers accepted prior to shelter in place. 
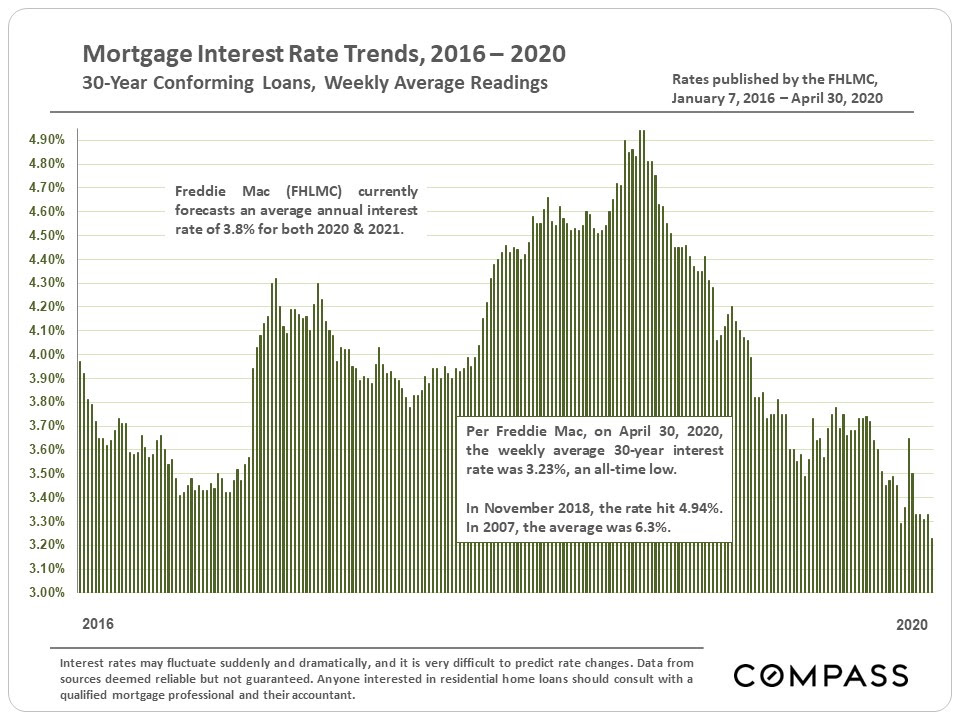
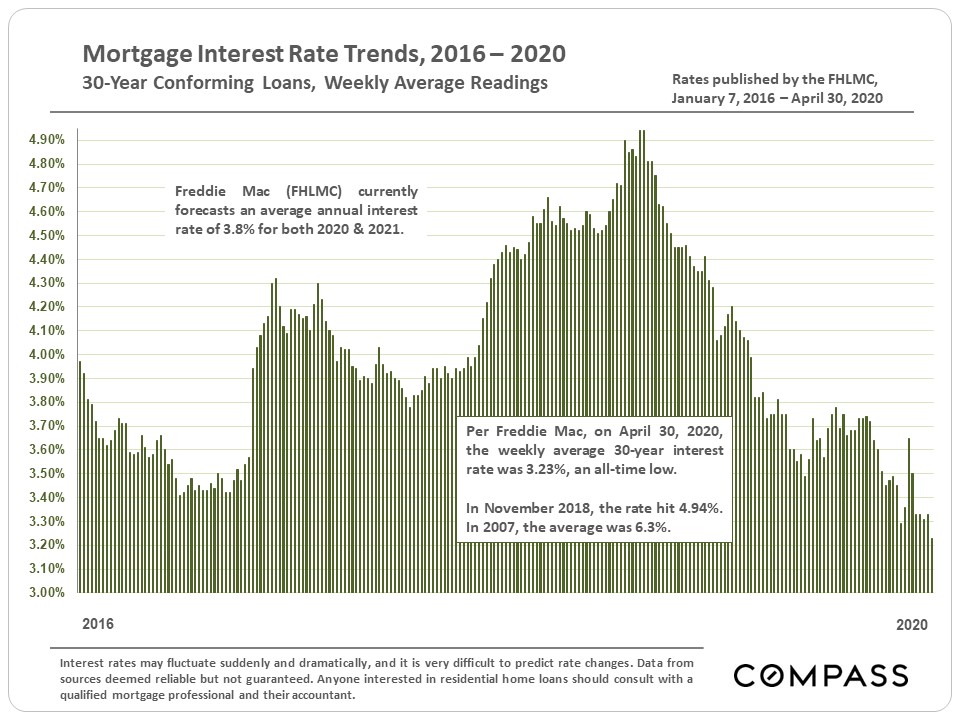
Interest rates hit a new historic low in the last week of April. 
Week by Week Supply & Demand Trends
The only way to clearly perceive the recent changes in the market – sudden plunge and the beginning of recovery – is by looking at WEEKLY trends in buyer and seller activity. These are illustrated in this first chart below.
Year-over-Year Changes in Median Home Sales Prices 
Generally speaking, the first months of 2020 have been characterized by often substantial year-over-year increases in median home sales prices across the Bay Area.
Long-Term Trends in Median House Prices
– 12-Month Rolling Illustration
Monthly Supply & Demand, Year-over-Year Comparisons
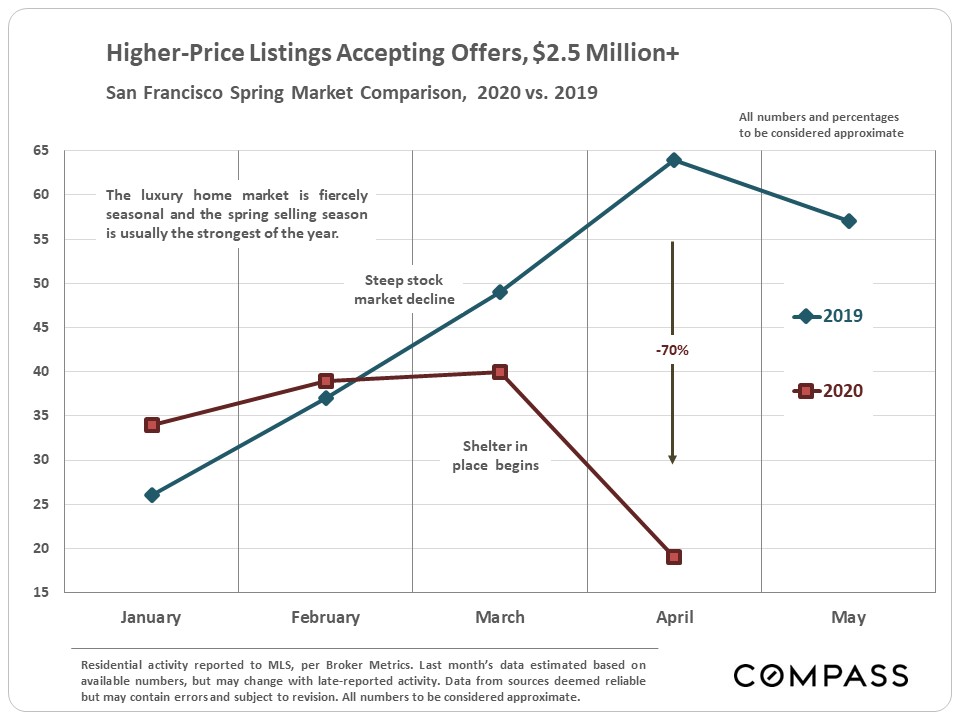
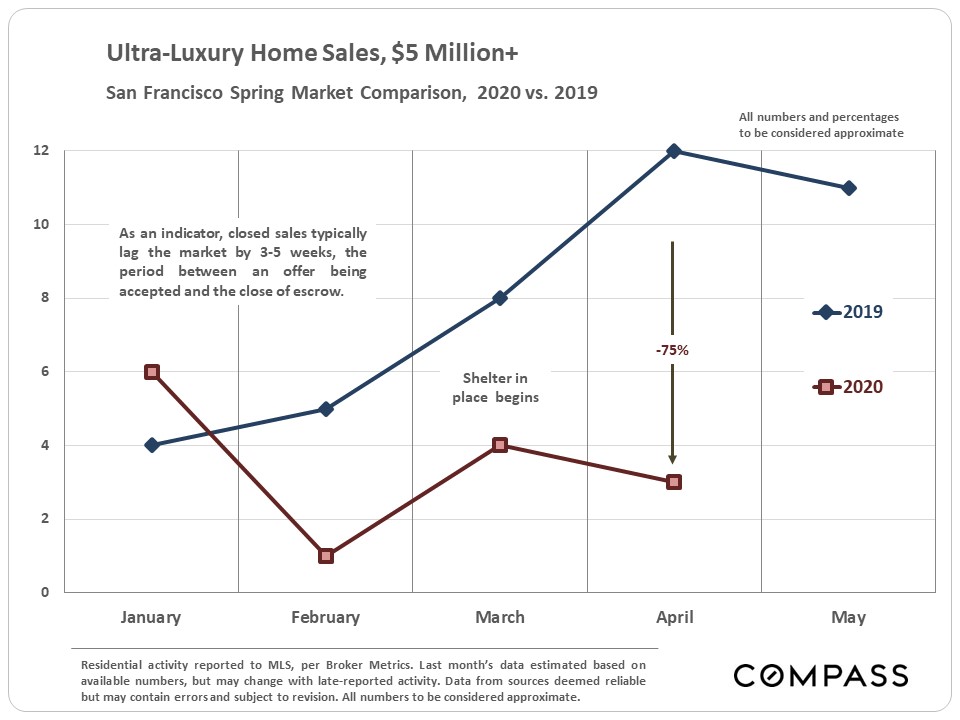
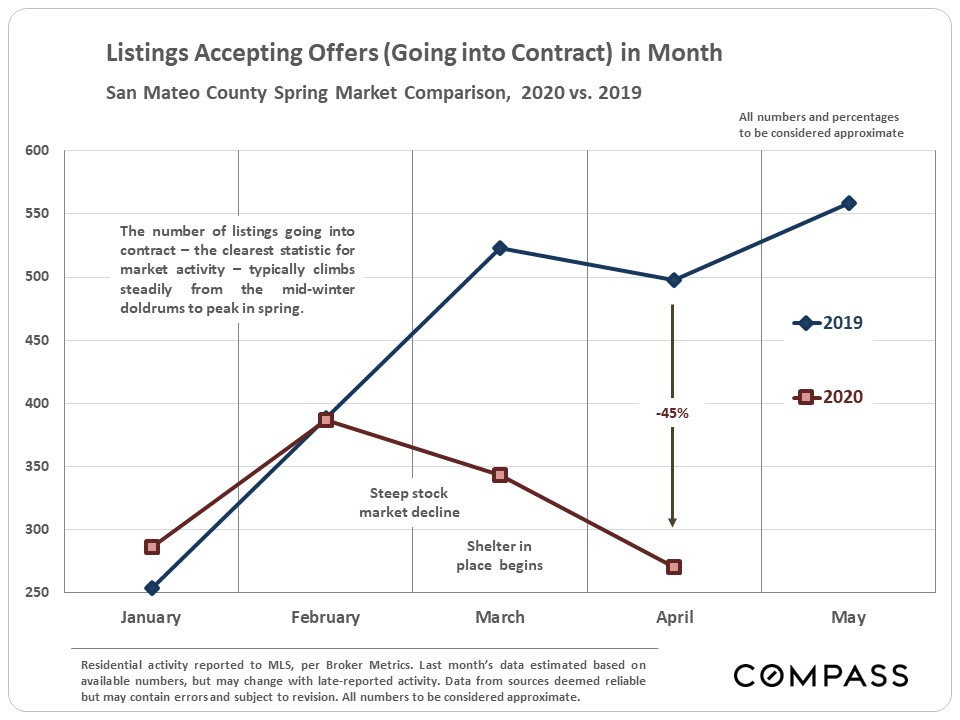
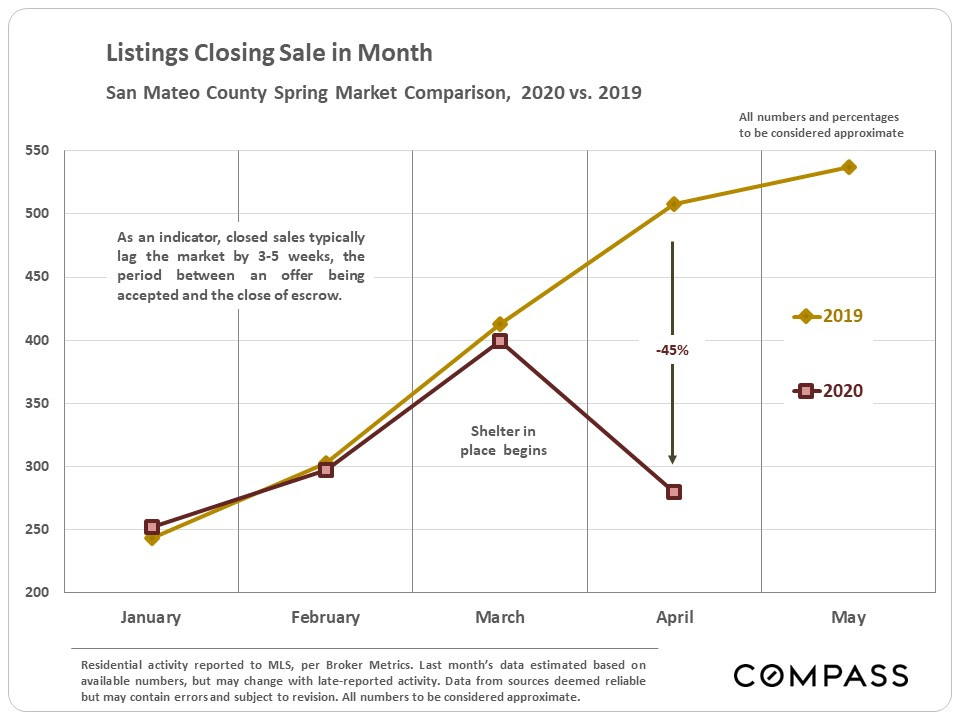
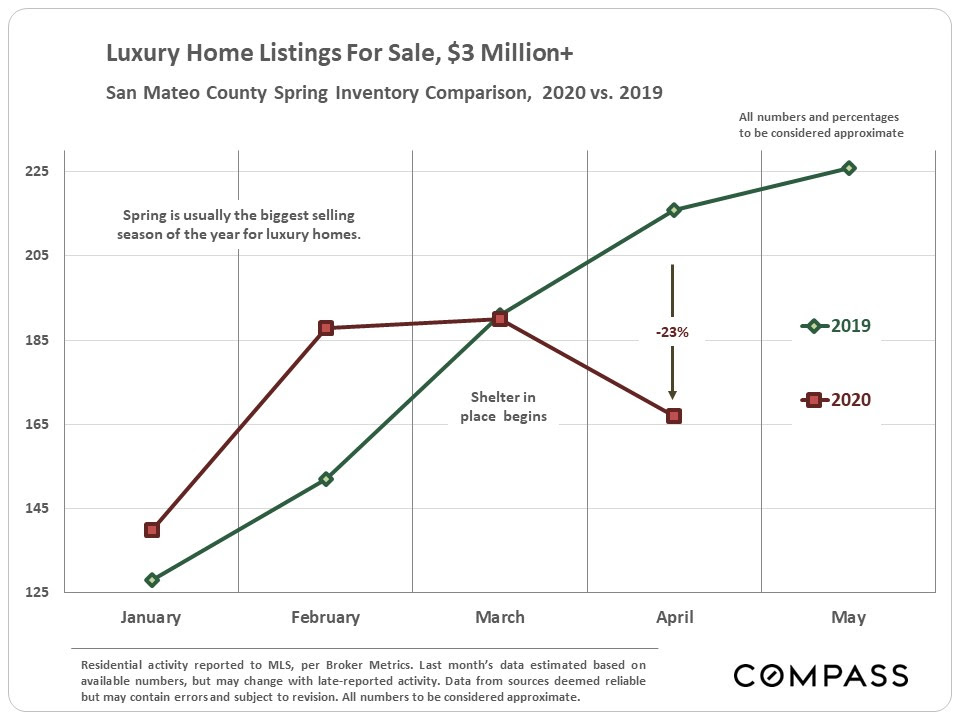
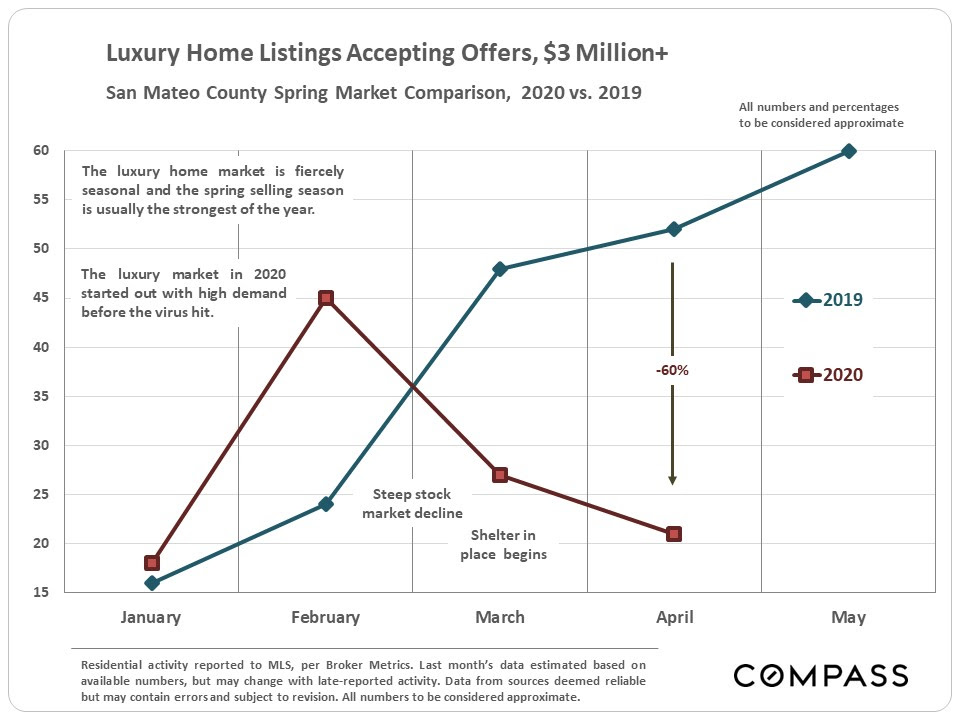
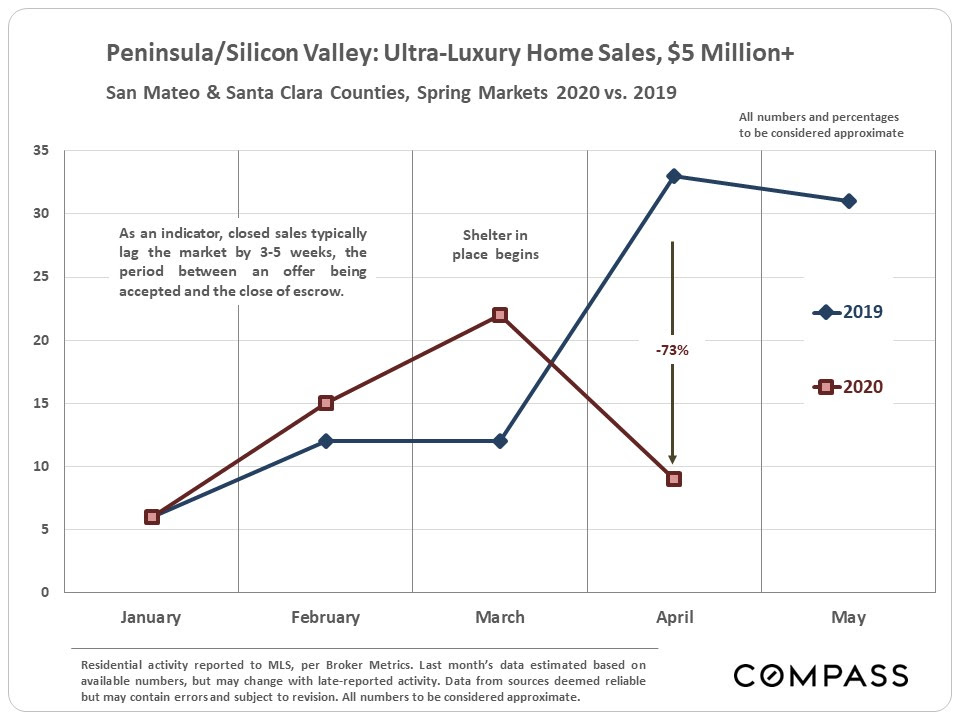
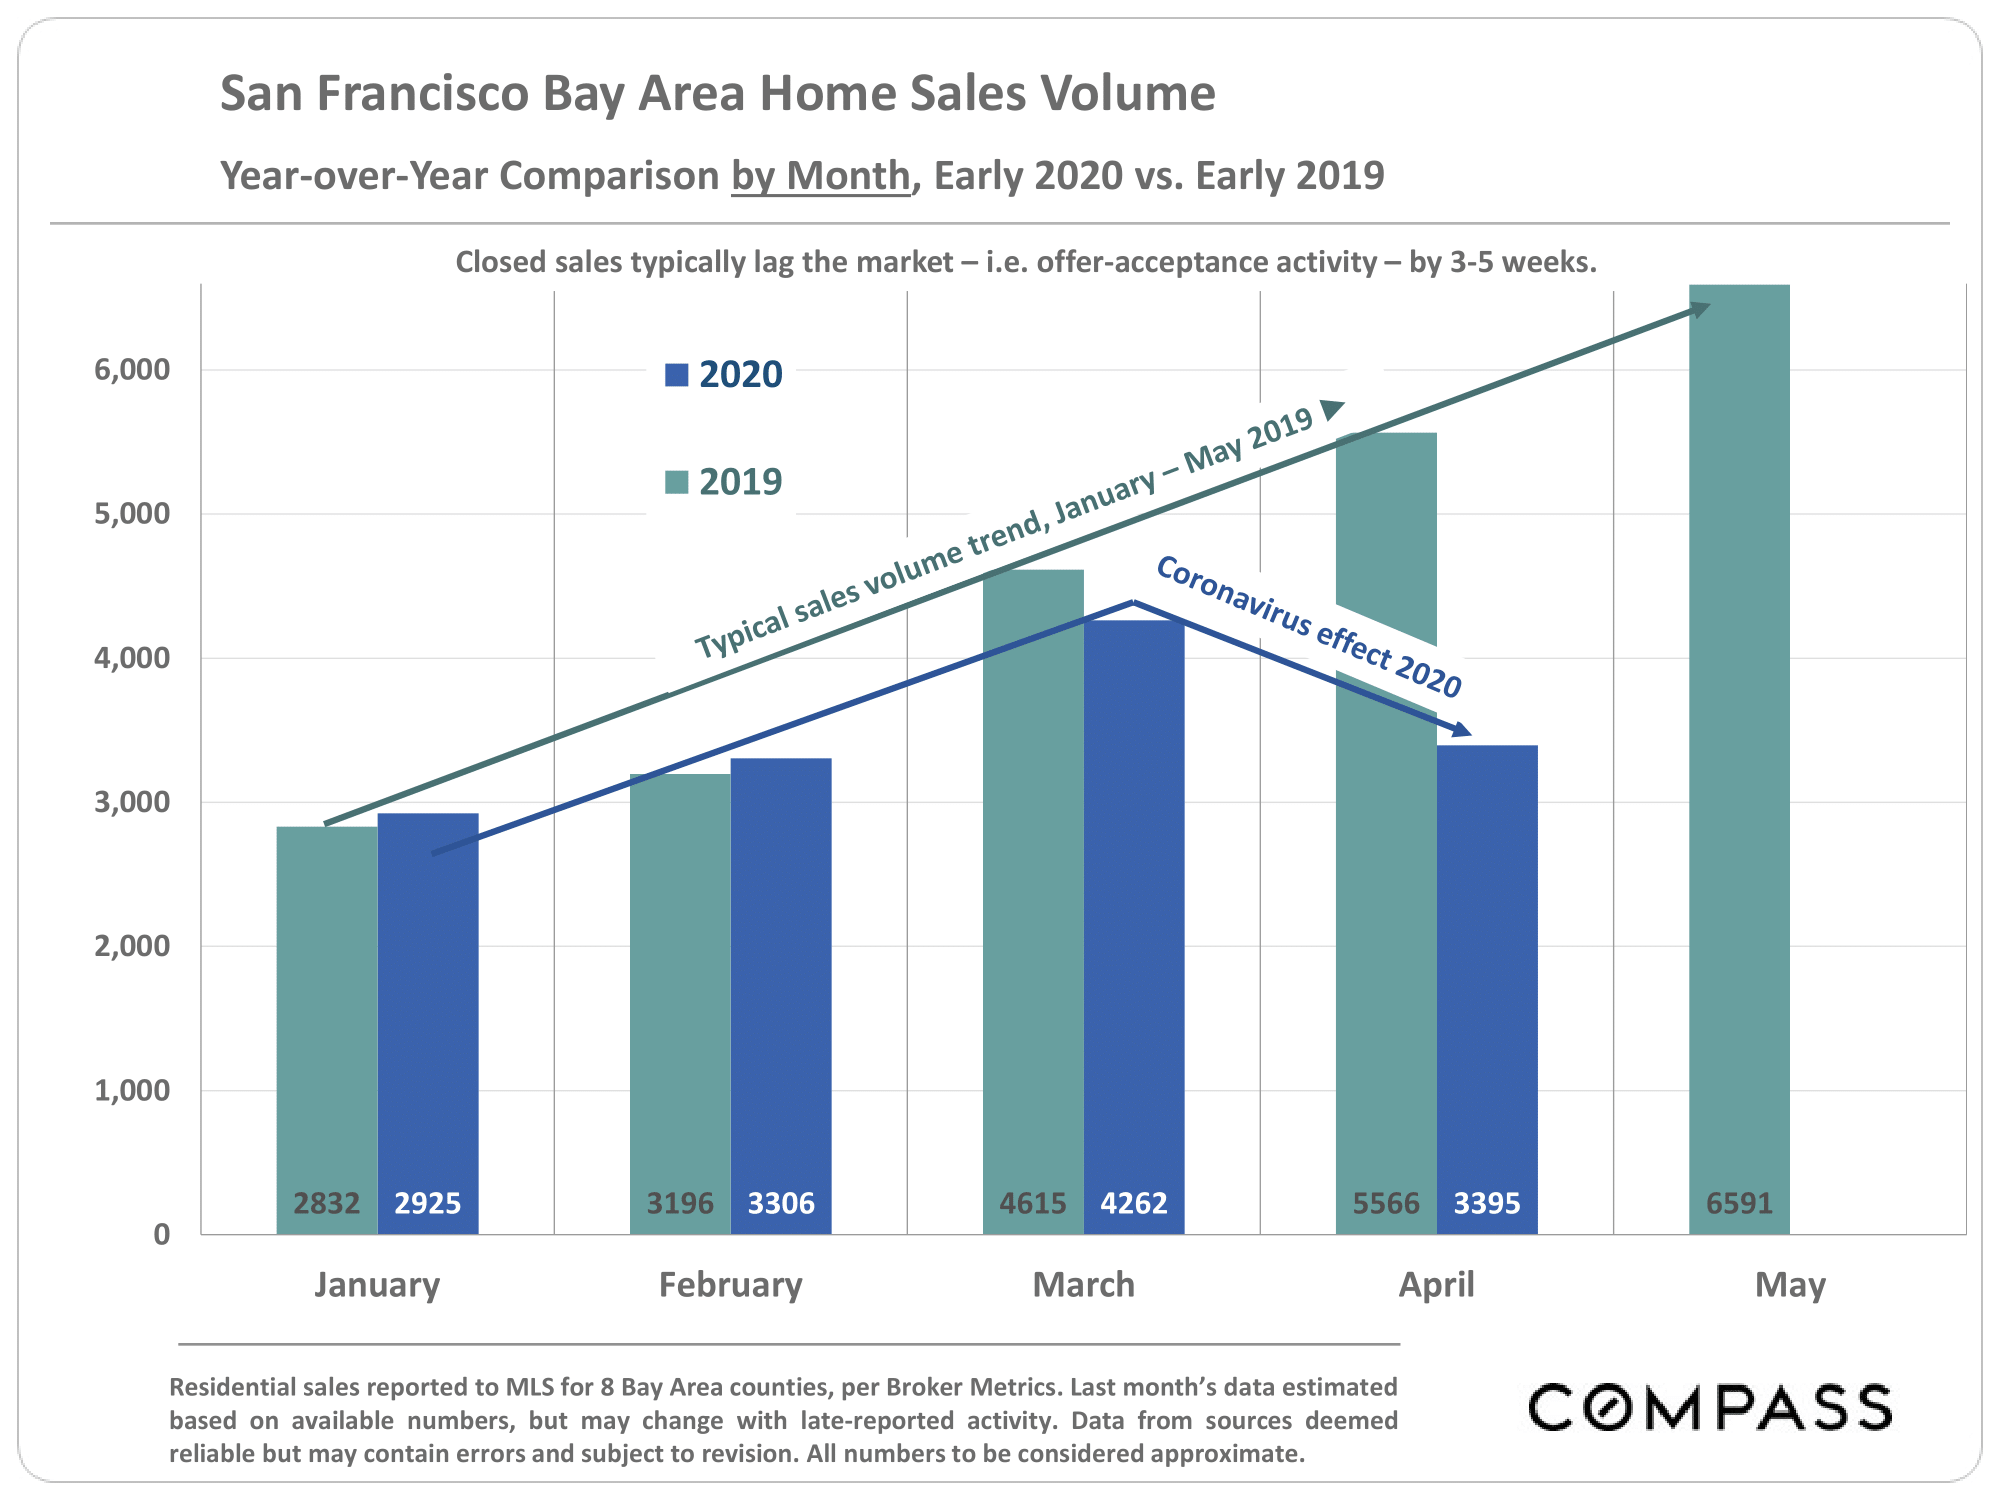
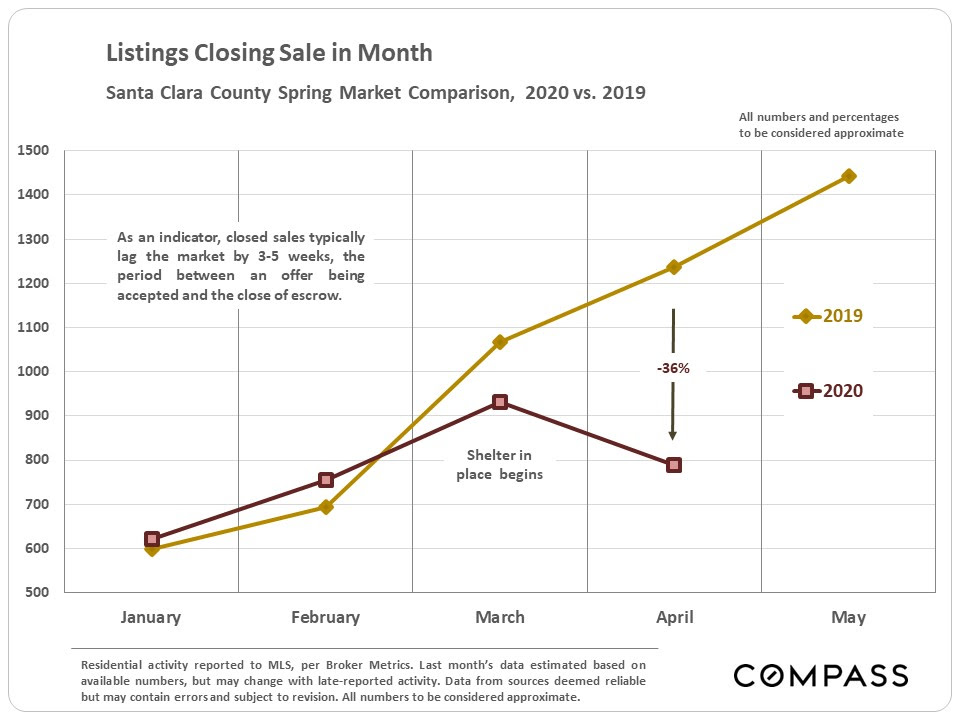
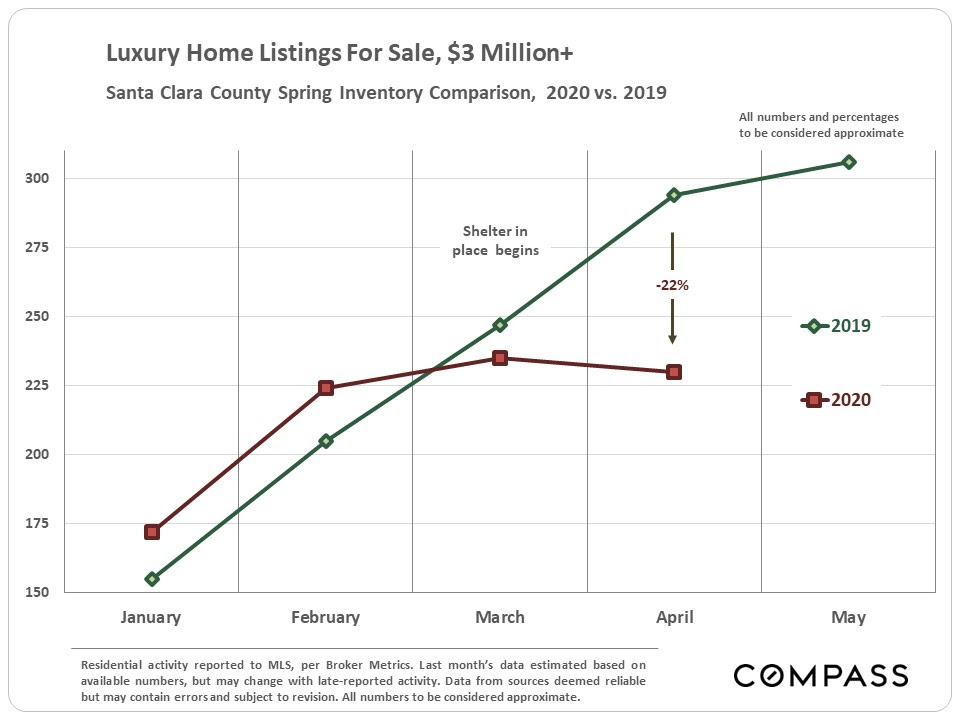
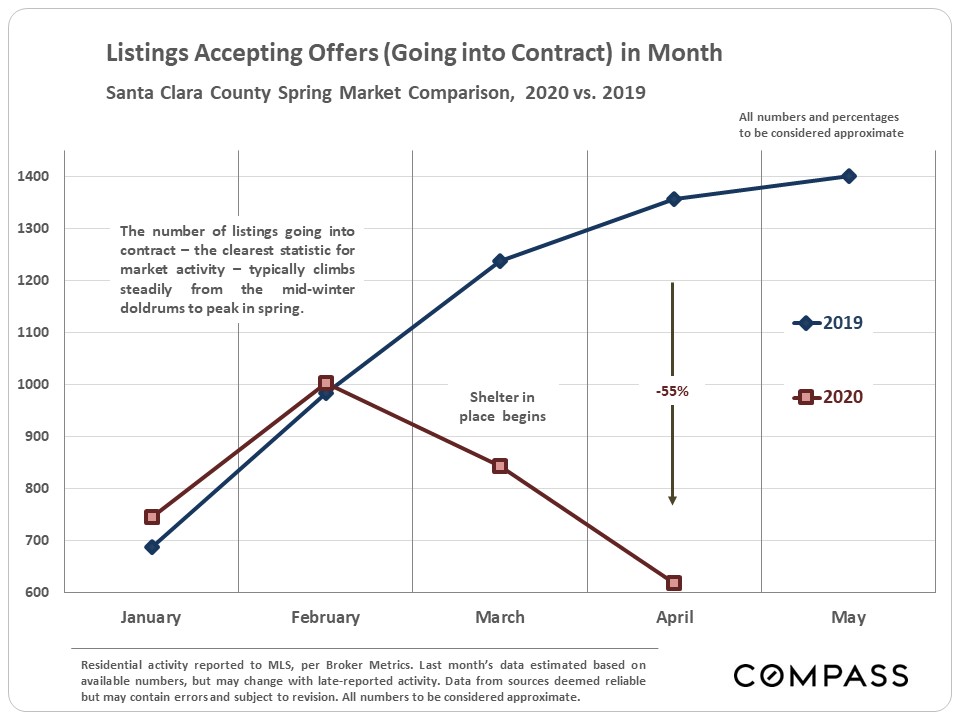
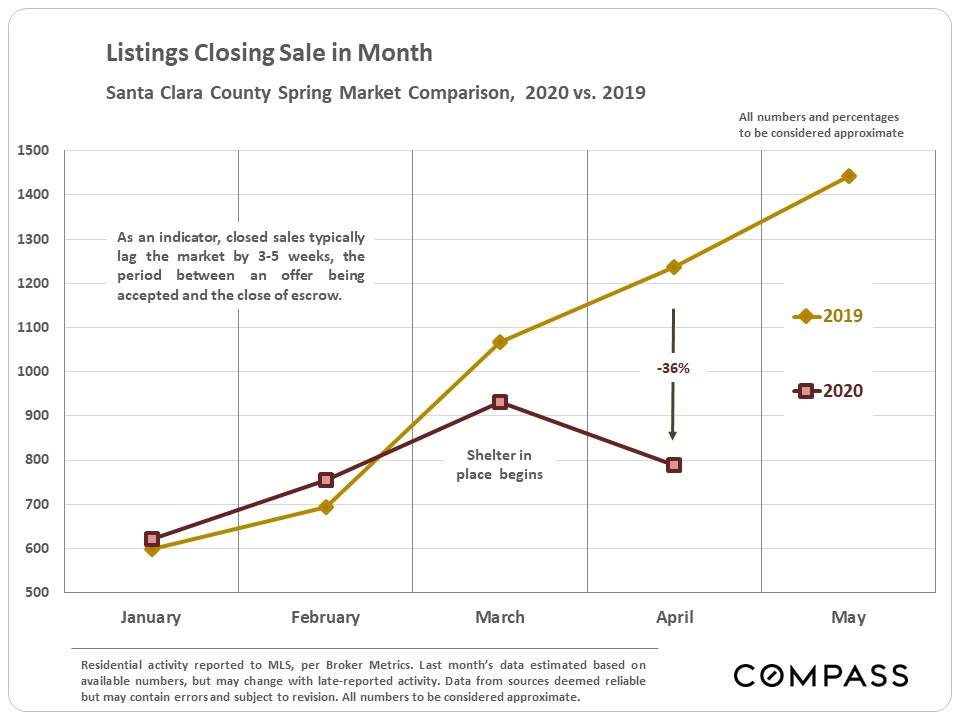
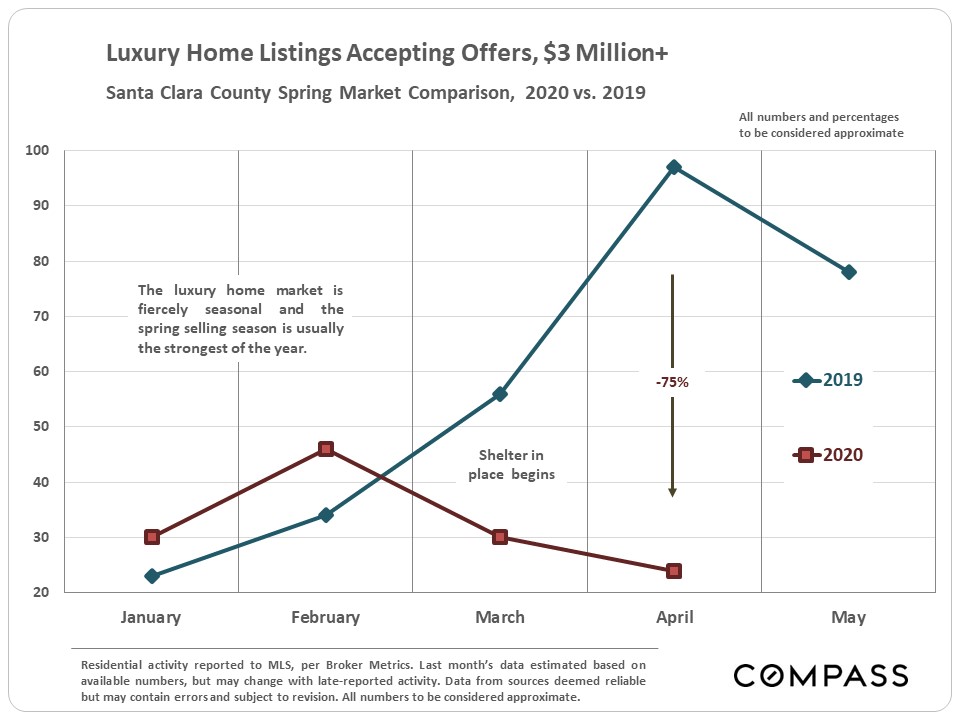
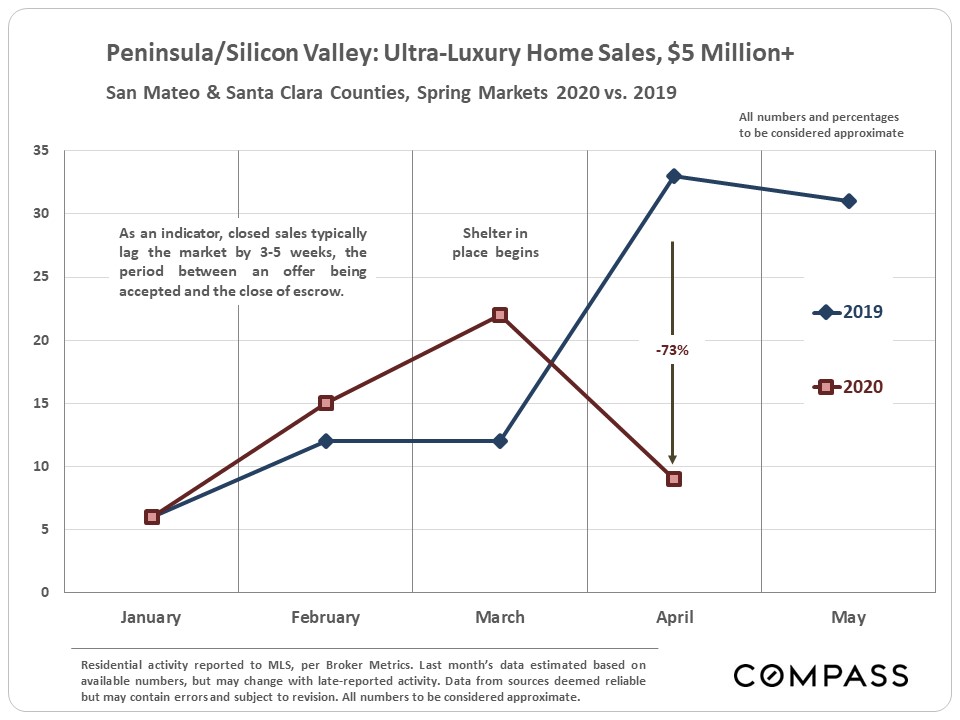
The next series of charts reflects the dramatic changes in seller and buyer dynamics by MONTH as compared to spring 2019. 
Mortgage Interest Rates
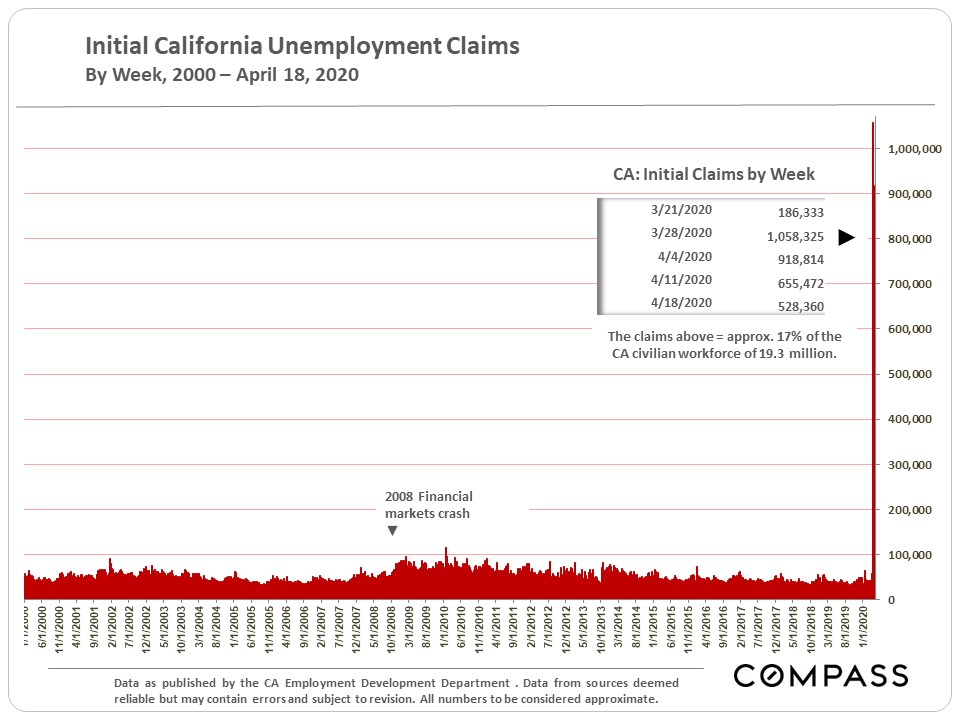
Unemployment
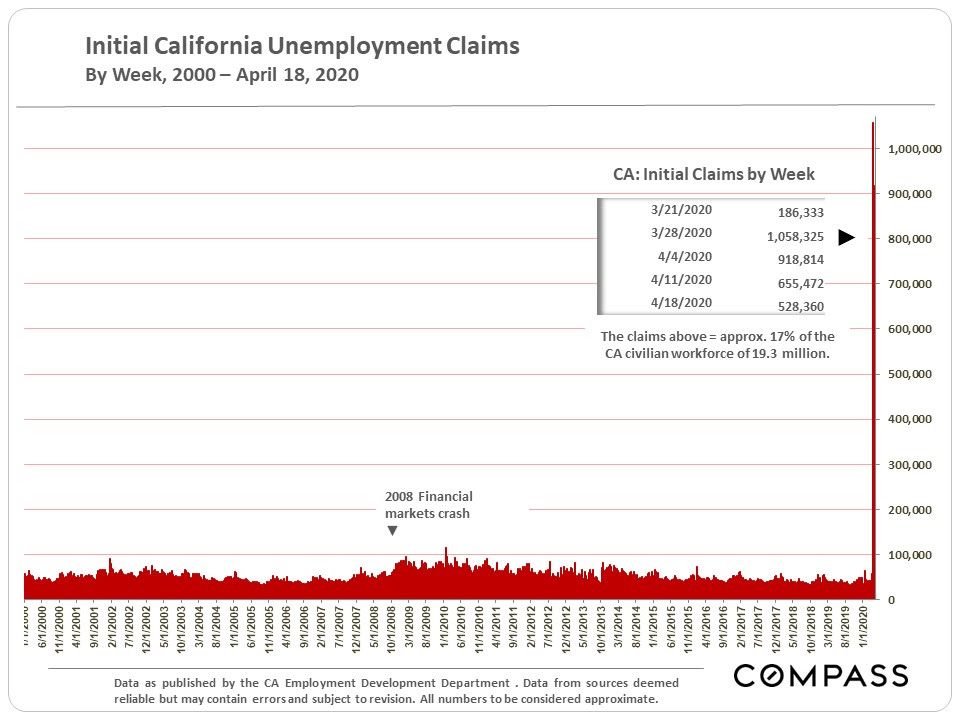
We are not going to review the economic news already extensively covered in the media, except for this stark illustration of the unparalleled rise in unemployment. How quickly this horrifying trend can be reversed will probably be the single largest factor behind an economic recovery.

Source: Compass

It is impossible to know how median and average value statistics apply to any particular home without a specific comparative market analysis. Many factors affect sales prices besides neighborhood/ bedroom count: quality of location within the neighborhood, condition, size,architecture,views, amenities,parking,outdoor space, etc.

These analyses were made in good faith with data from sources deemed reliable, but may contain errors and are subject to revision. It is not our intent to convince you of a particular position,but to attempt to provide straightforward data and analysis, so you can make your own informed decisions. Median and average statistics are enormous generalities: There are hundreds of different markets in San Francisco and the Bay Area, each with its own unique dynamics. Median prices and average dollar per square foot values can be and often are affected by other factors besides changes in fair market value. Longer term trends are much more meaningful than short-term.

Compass is a real estate broker licensed by the State of California, DRE 01527235. Equal Housing Opportunity. This report has been prepared solely for information purposes. The information herein is based on or derived from information generally available to the public and/or from sources believed to be reliable. No representation or warranty can be given with respect to the accuracy or completeness of the information. Compass disclaims any and all liability relating to this report, including without limitation any express or implied representations or warranties for statements contained in, and omissions from, the report. Nothing contained herein is intended to be or should be read as any regulatory, legal, tax, accounting or other advice and Compass does not provide such advice. All opinions are subject to change without notice. Compass makes no representation regarding the accuracy of any statements regarding any references to the laws, statutes or regulations of any state are those of the author(s). Past performance is no guarantee of future results.

Bay Area Weekly Market Activity Continues to Bounce Back, Mid-May 2020 Update

Source: Compass

It is impossible to know how median and average value statistics apply to any particular home without a specific comparative market analysis. Many factors affect sales prices besides neighborhood/ bedroom count: quality of location within the neighborhood, condition, size, architecture, views, amenities, parking, outdoor space, etc.

These analyses were made in good faith with data from sources deemed reliable, but may contain errors and are subject to revision. It is not our intent to convince you of a particular position,but to attempt to provide straightforward data and analysis, so you can make your own informed decisions. Median and average statistics are enormous generalities: There are hundreds of different markets in San Francisco and the Bay Area, each with its own unique dynamics. Median prices and average dollar per square foot values can be and often are affected by other factors besides changes in fair market value. Longer term trends are much more meaningful than short-term.

Compass is a real estate broker licensed by the State of California, DRE 01527235. Equal Housing Opportunity. This report has been prepared solely for information purposes. The information herein is based on or derived from information generally available to the public and/or from sources believed to be reliable. No representation or warranty can be given with respect to the accuracy or completeness of the information. Compass disclaims any and all liability relating to this report, including without limitation any express or implied representations or warranties for statements contained in, and omissions from, the report. Nothing contained herein is intended to be or should be read as any regulatory, legal, tax, accounting or other advice and Compass does not provide such advice. All opinions are subject to change without notice. Compass makes no representation regarding the accuracy of any statements  regarding  any references to the laws, statutes or regulations  of any state are those of  the author(s).  Past performance is no guarantee  of future  results.


Santa Clara County Real Estate Market Begins to Bounce Back – Slowly, May 2020

Market activity begins to tick up after severe shelter-in-place plunge. Median house sales prices are up. Interest rates hit new low.
May 2020 Crisis Update
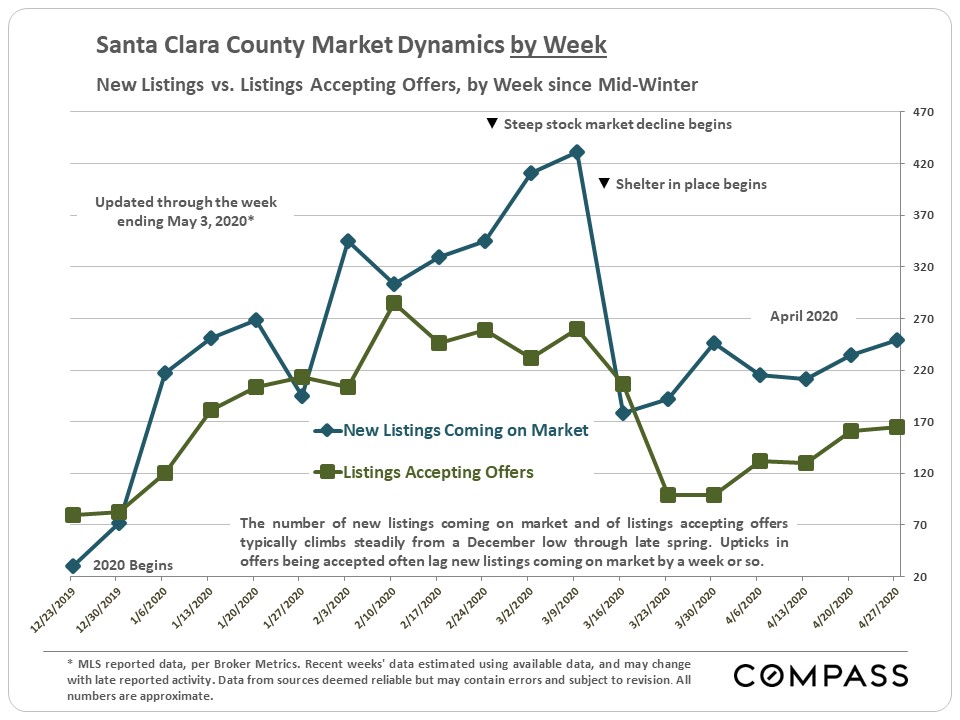
Shelter-in-place caused steep drops in activity across the board in what is typically the busiest selling season of the year. However, though still far below normal levels, activity has been slowly picking up since bottoming out in late March/early April, and will presumably continue to do so with the easing of both shelter-in-place and property-showing rules. 
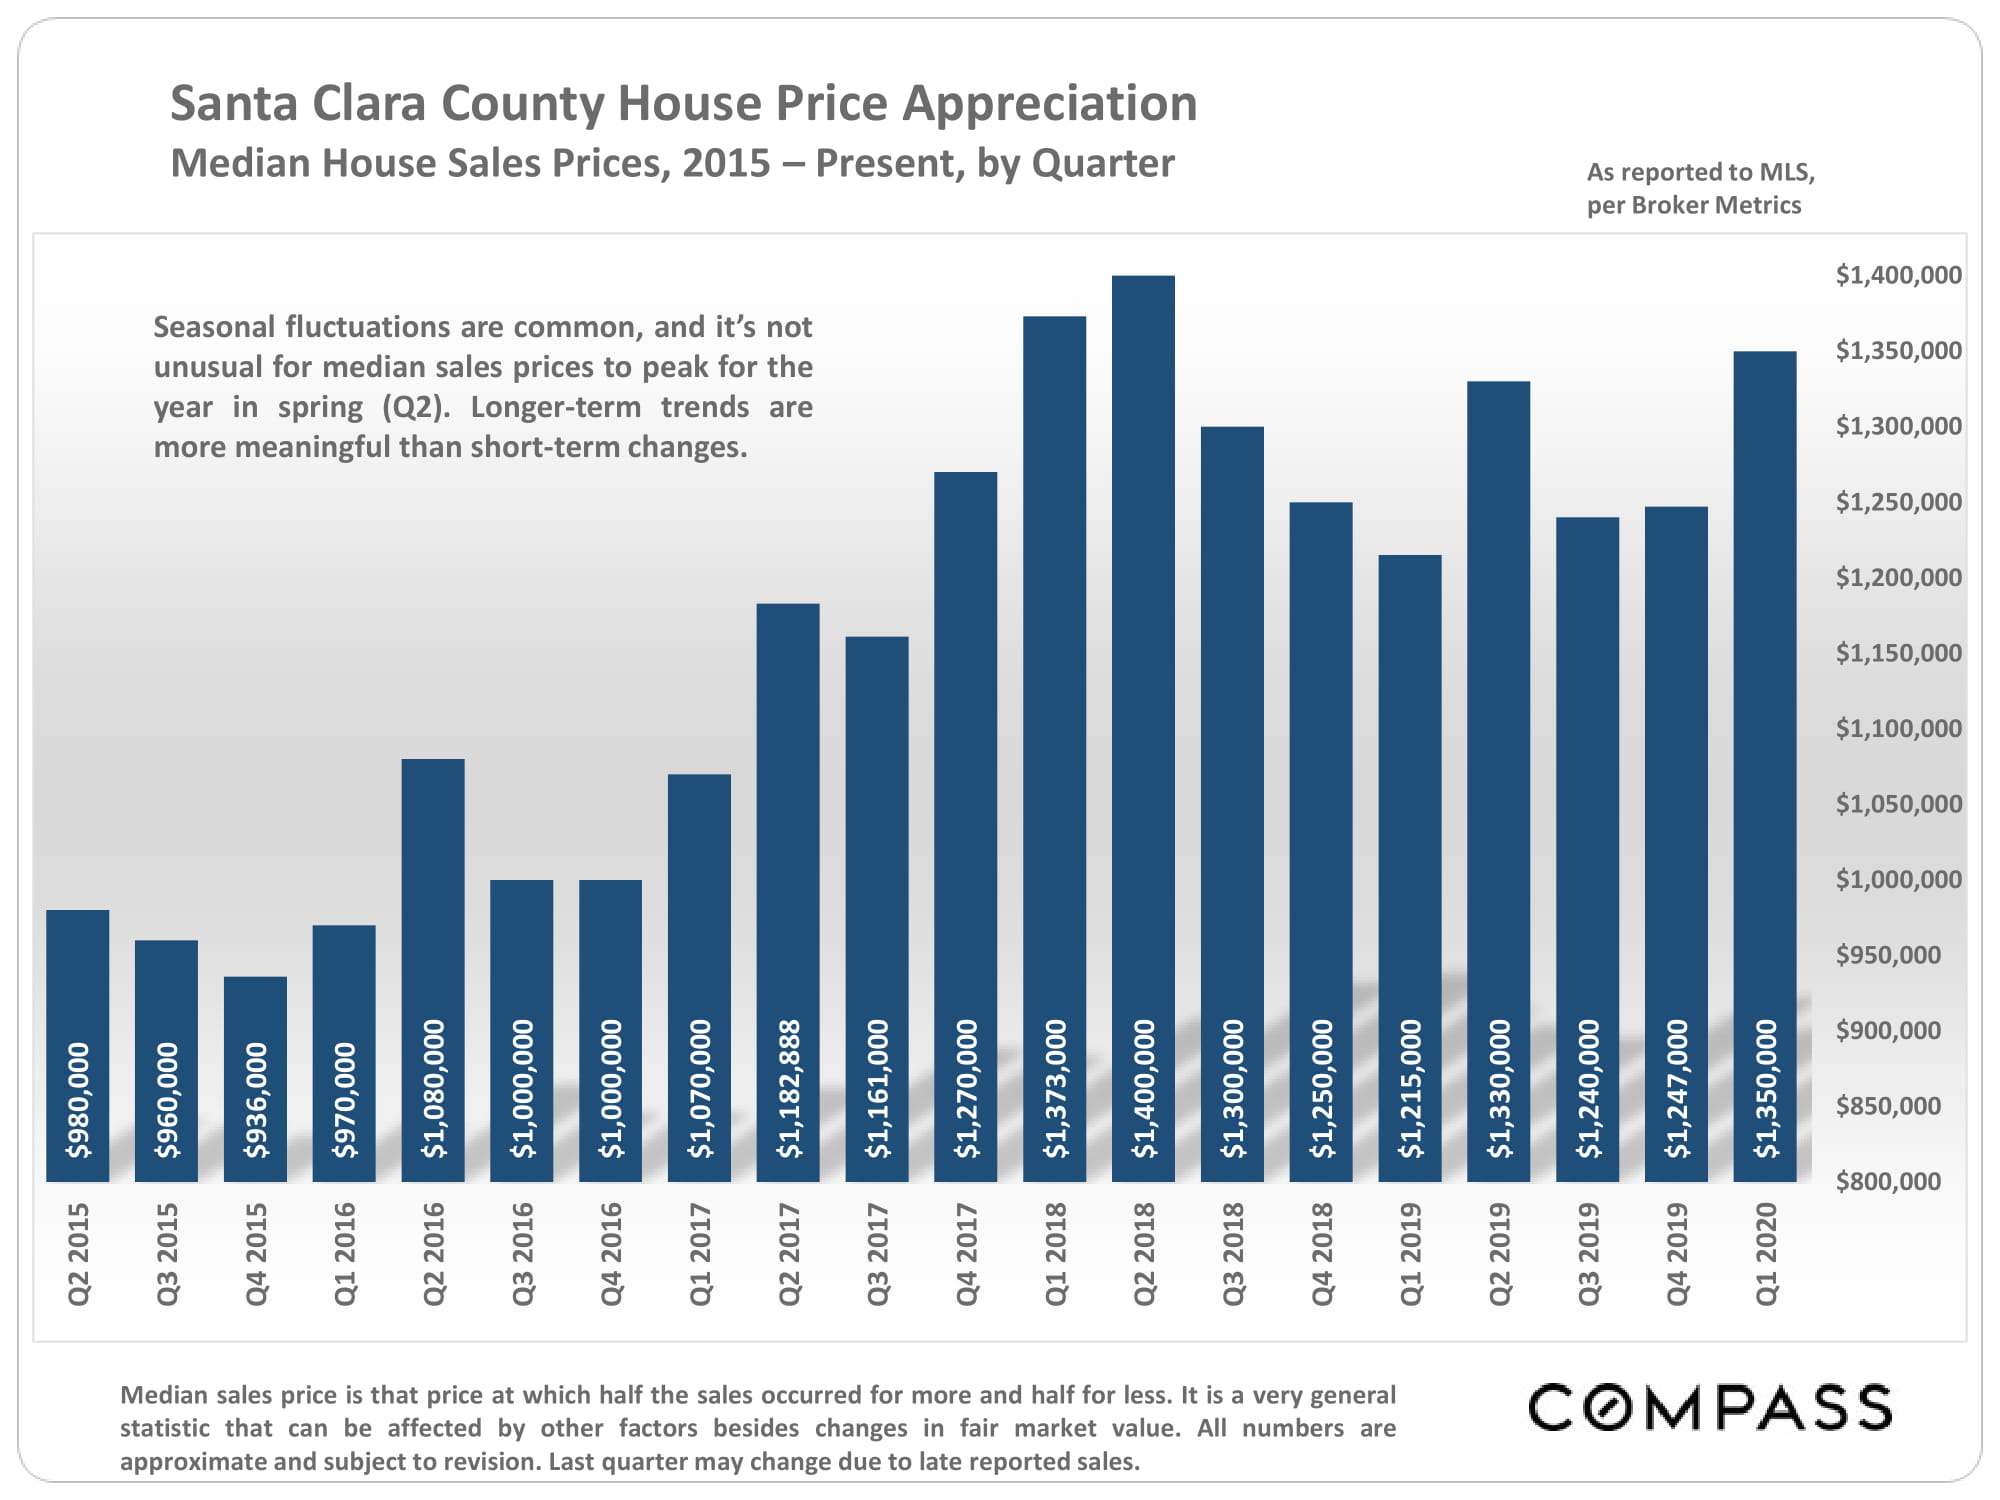
So far, median house prices have seen no declines – in fact, quite the contrary – but a fair proportion of the sales behind the April median sales price still reflects offers accepted prior to shelter in place. 
Interest rates hit a new historic low in the last week of April. 
Week by Week Supply & Demand Trends
The only way to clearly perceive the recent changes in the market – sudden plunge and the beginning of recovery – is by looking at WEEKLY trends in buyer and seller activity. These are illustrated in this first chart below. 
Year-over-Year Changes in Median House Sales Price 
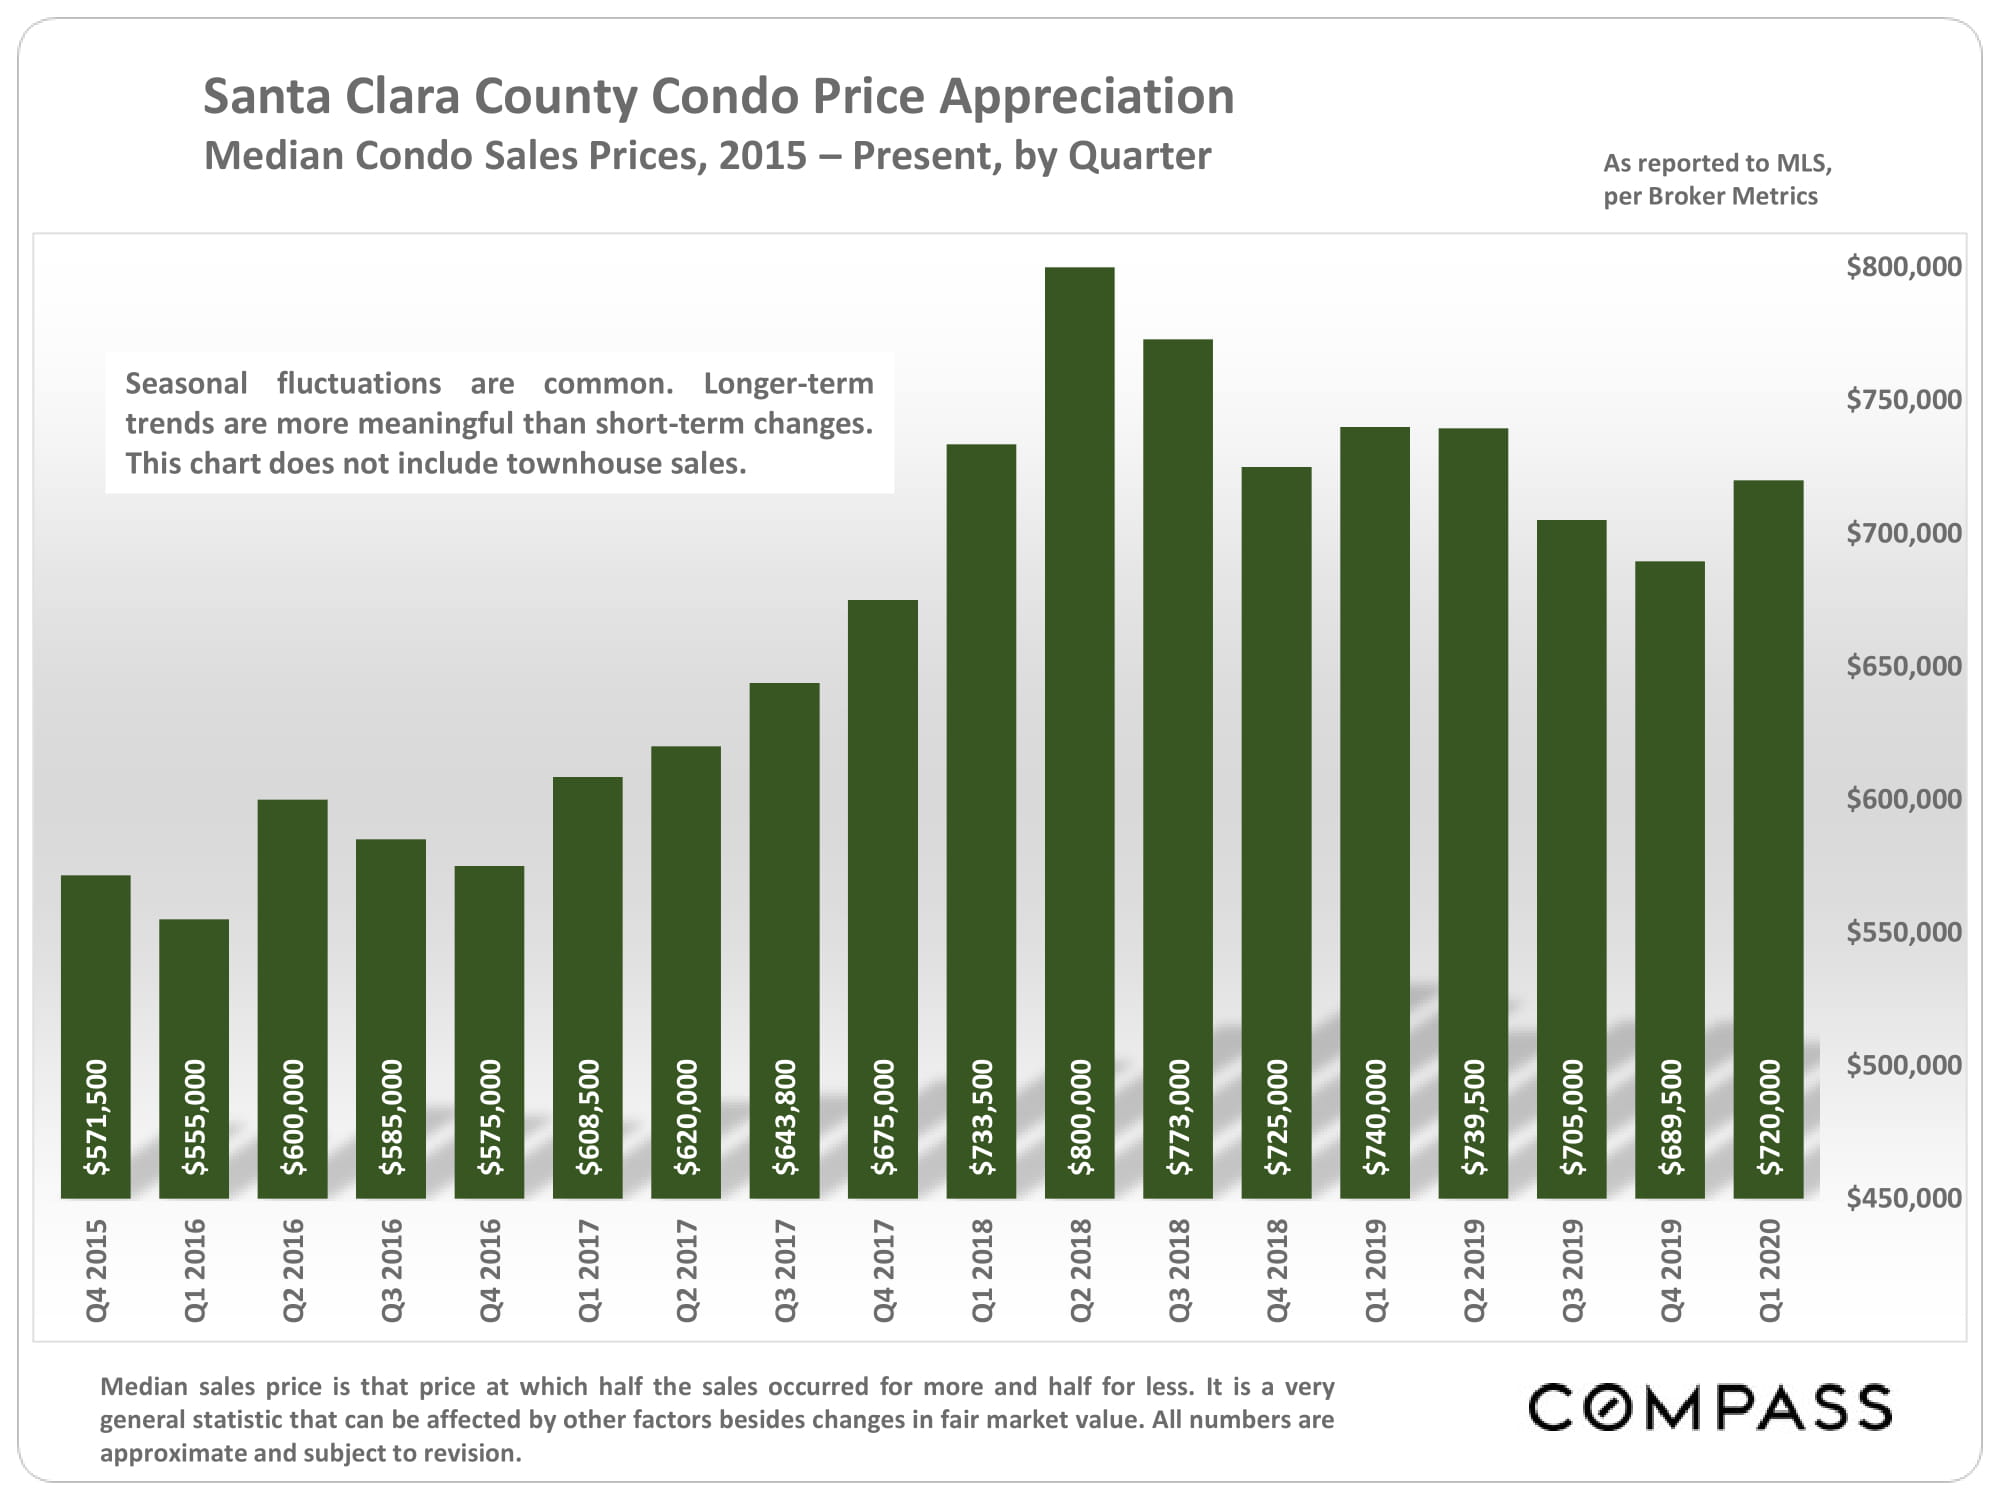
Generally speaking, the first months of 2020 have been characterized by year-over-year increases, sometimes quite substantial, in median house sales prices across the Bay Area. (Median condo sales prices in Santa Clara County – not illustrated below – have dropped somewhat on a year-over-year basis.)
Medium-Term Monthly Median House Sales Price
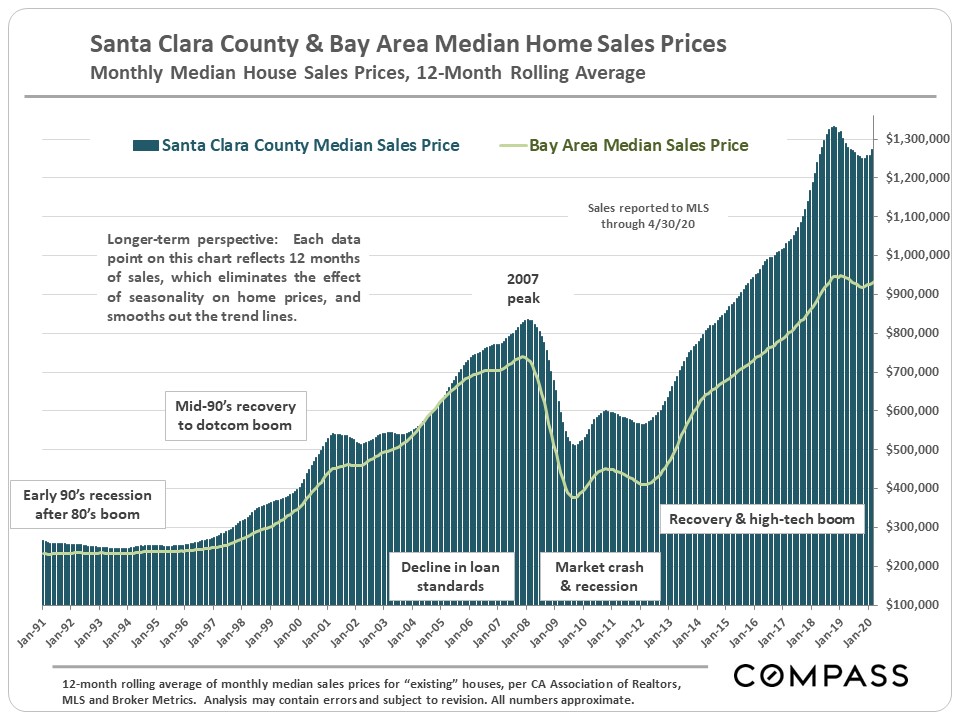
Long-Term Trends in Median House Prices
– 12-Month Rolling Illustration
Remember that sales are a slightly lagging indicator of market activity.
Year-over-Year Changes in Luxury Home Markets
Mortgage Interest Rates
Unemployment 
We are not going to review the economic news already extensively covered in the media, except for this stark illustration of the unparalleled rise in unemployment. How quickly this horrifying trend can be reversed will probably be the single largest factor behind an economic recovery (after the discovery of a vaccine).

Source: Compass

It is impossible to know how median and average value statistics apply to any particular home without a specific comparative market analysis. Many factors affect sales prices besides neighborhood/ bedroom count: quality of location within the neighborhood, condition, size,architecture,views, amenities,parking,outdoor space, etc.

These analyses were made in good faith with data from sources deemed reliable, but may contain errors and are subject to revision. It is not our intent to convince you of a particular position,but to attempt to provide straightforward data and analysis, so you can make your own informed decisions. Median and average statistics are enormous generalities: There are hundreds of different markets in San Francisco and the Bay Area, each with its own unique dynamics. Median prices and average dollar per square foot values can be and often are affected by other factors besides changes in fair market value. Longer term trends are much more meaningful than short-term.

Compass is a real estate broker licensed by the State of California, DRE 01527235. Equal Housing Opportunity. This report has been prepared solely for information purposes. The information herein is based on or derived from information generally available to the public and/or from sources believed to be reliable. No representation or warranty can be given with respect to the accuracy or completeness of the information. Compass disclaims any and all liability relating to this report, including without limitation any express or implied representations or warranties for statements contained in, and omissions from, the report. Nothing contained herein is intended to be or should be read as any regulatory, legal, tax, accounting or other advice and Compass does not provide such advice. All opinions are subject to change without notice. Compass makes no representation regarding the accuracy of any statements regarding any references to the laws, statutes or regulations of any state are those of the author(s). Past performance is no guarantee of future results.

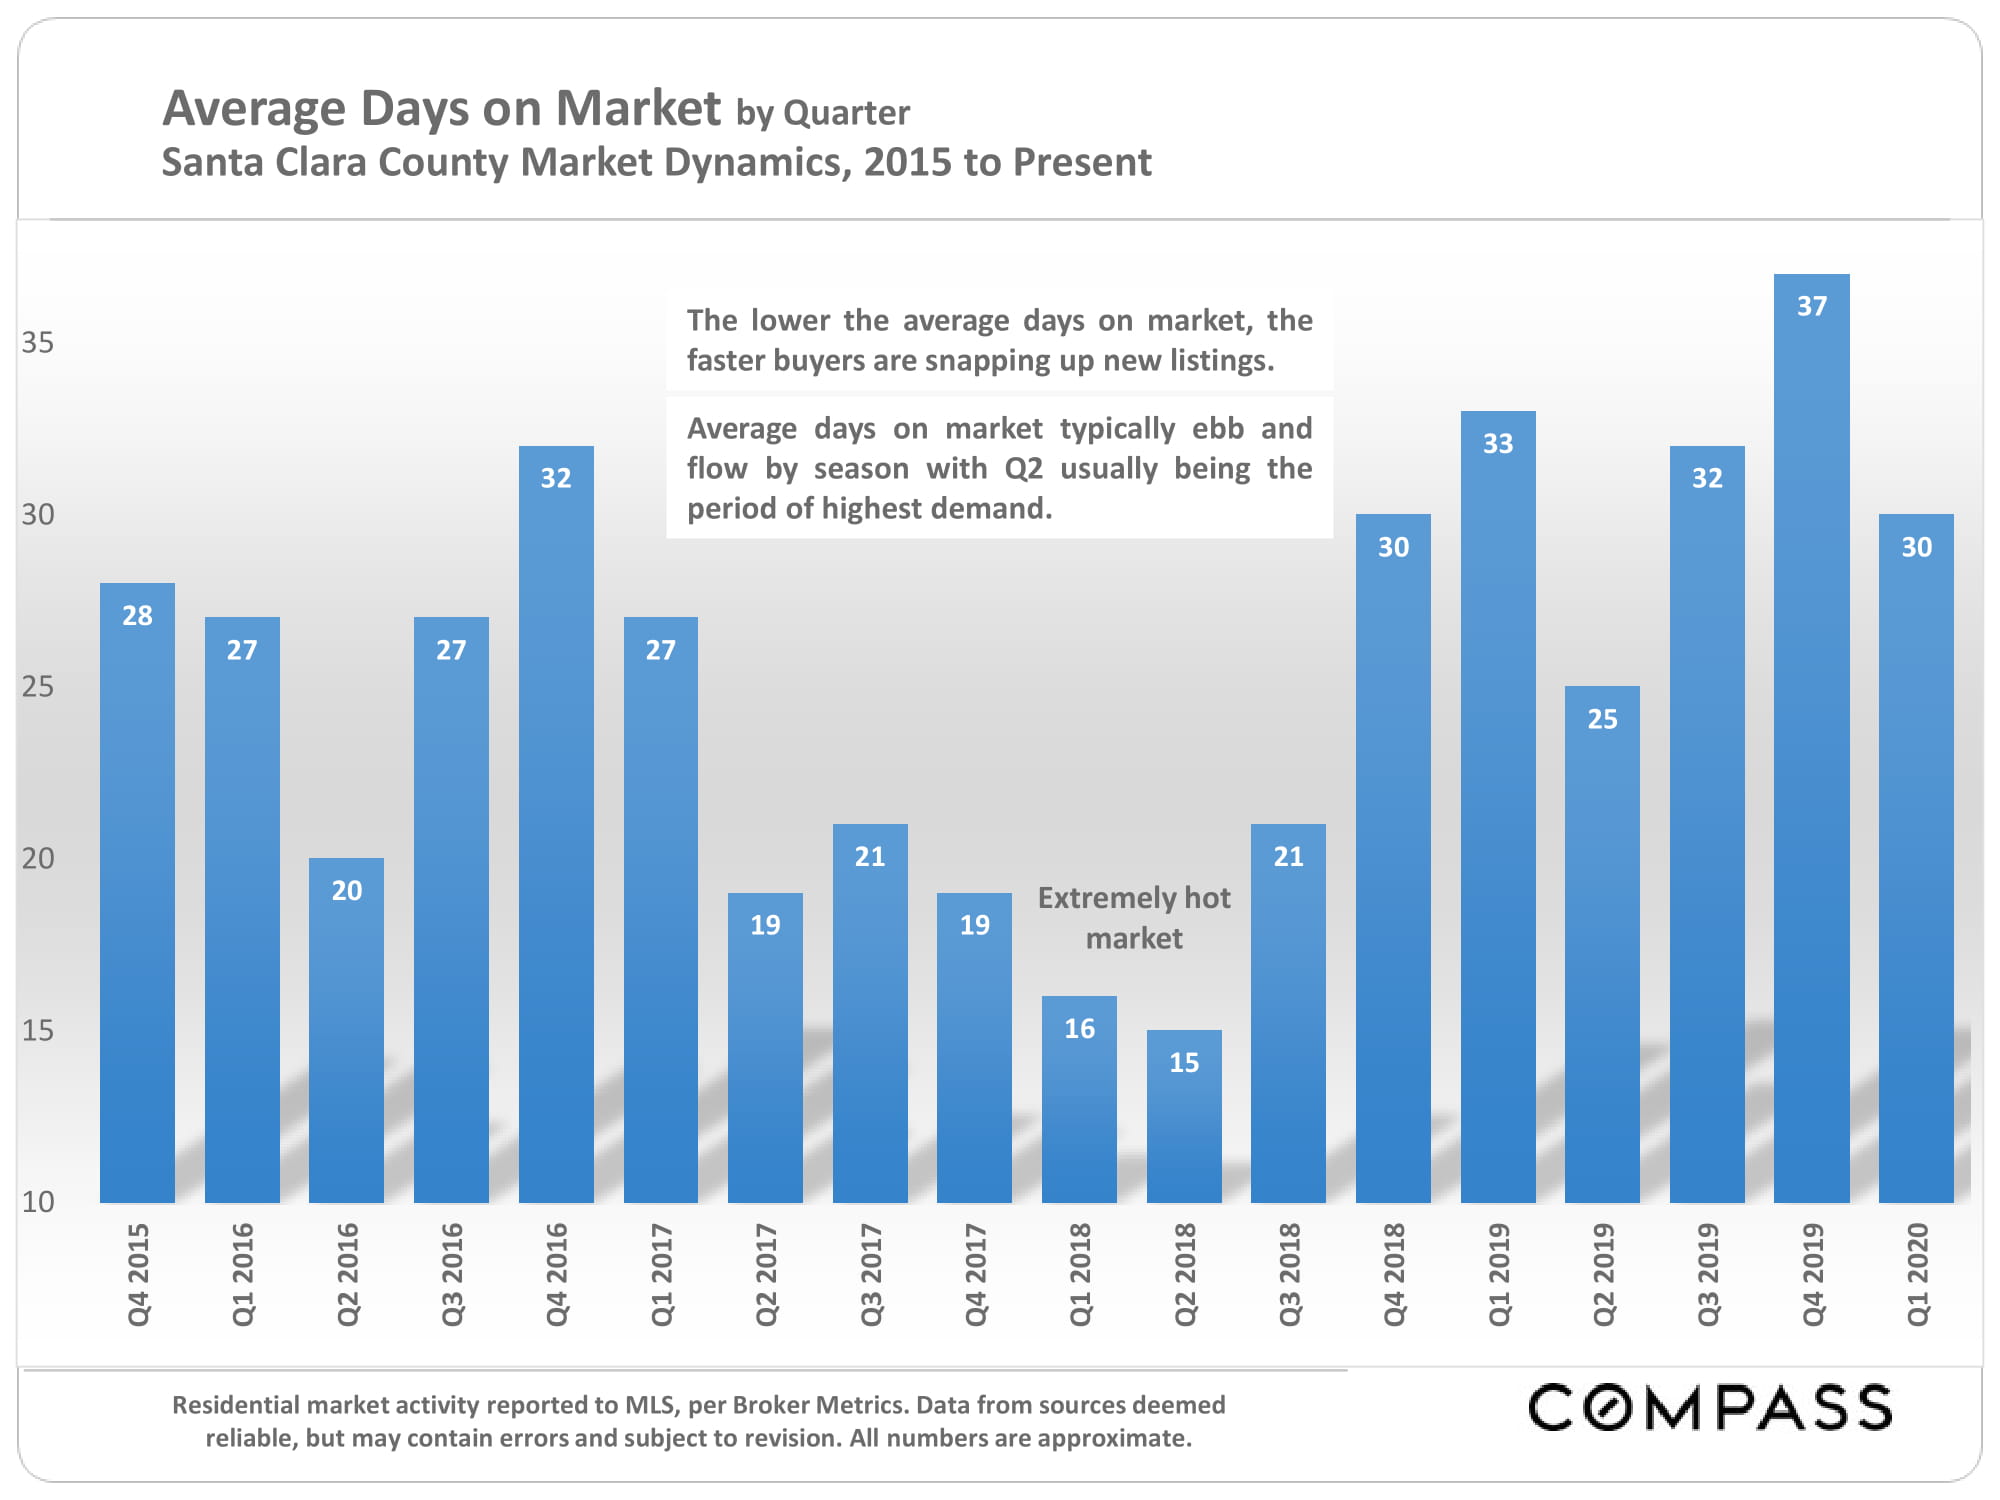
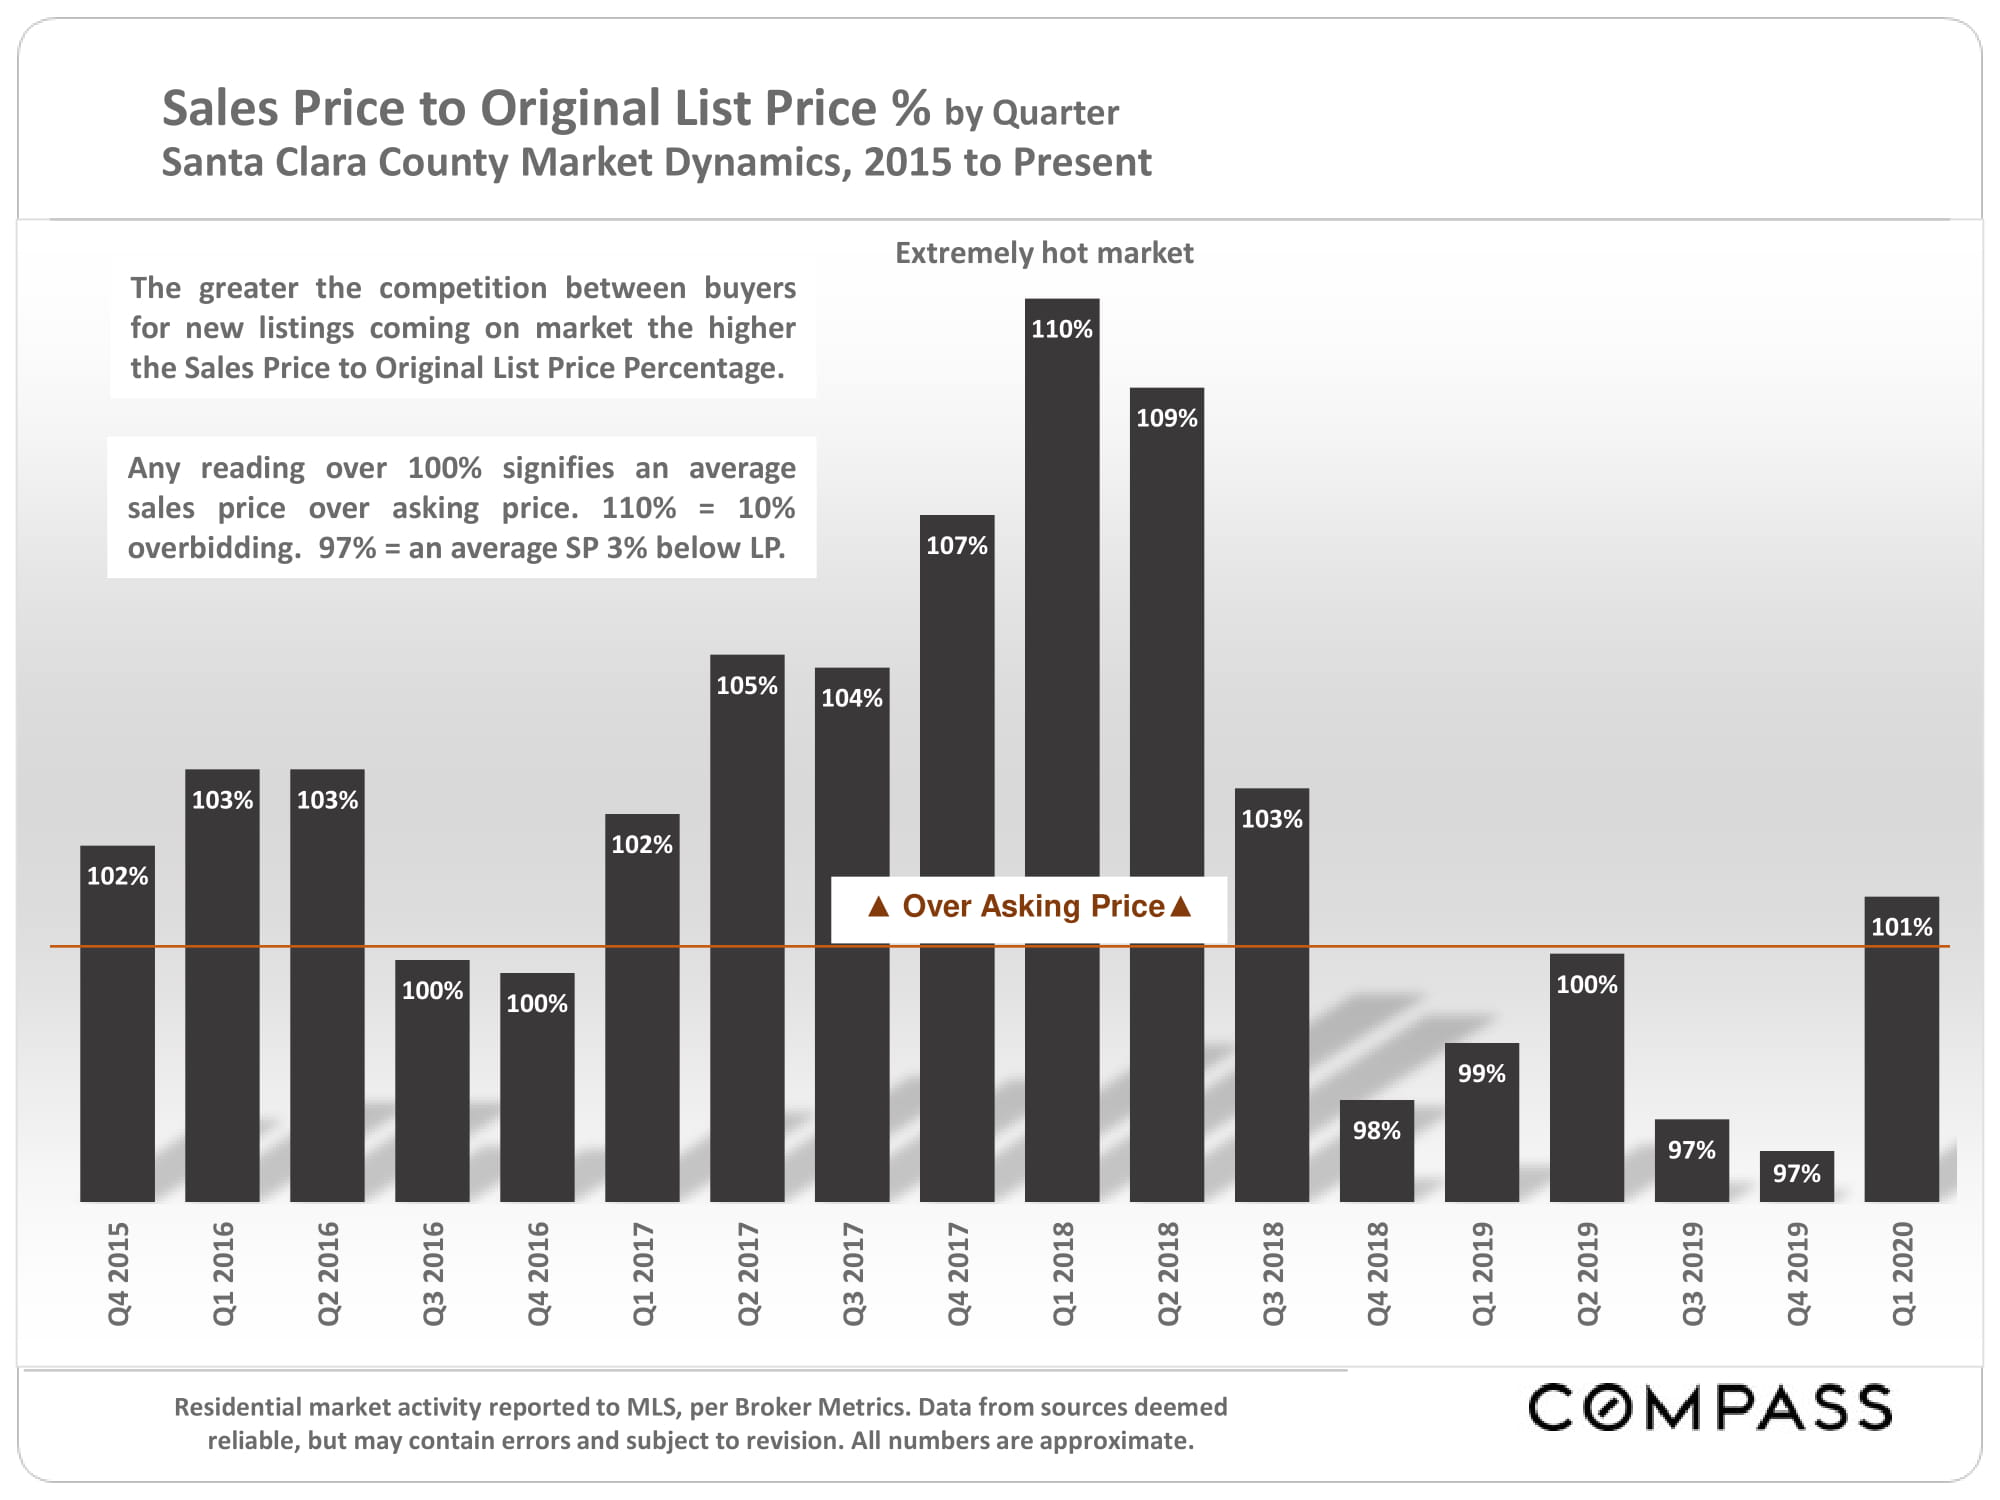
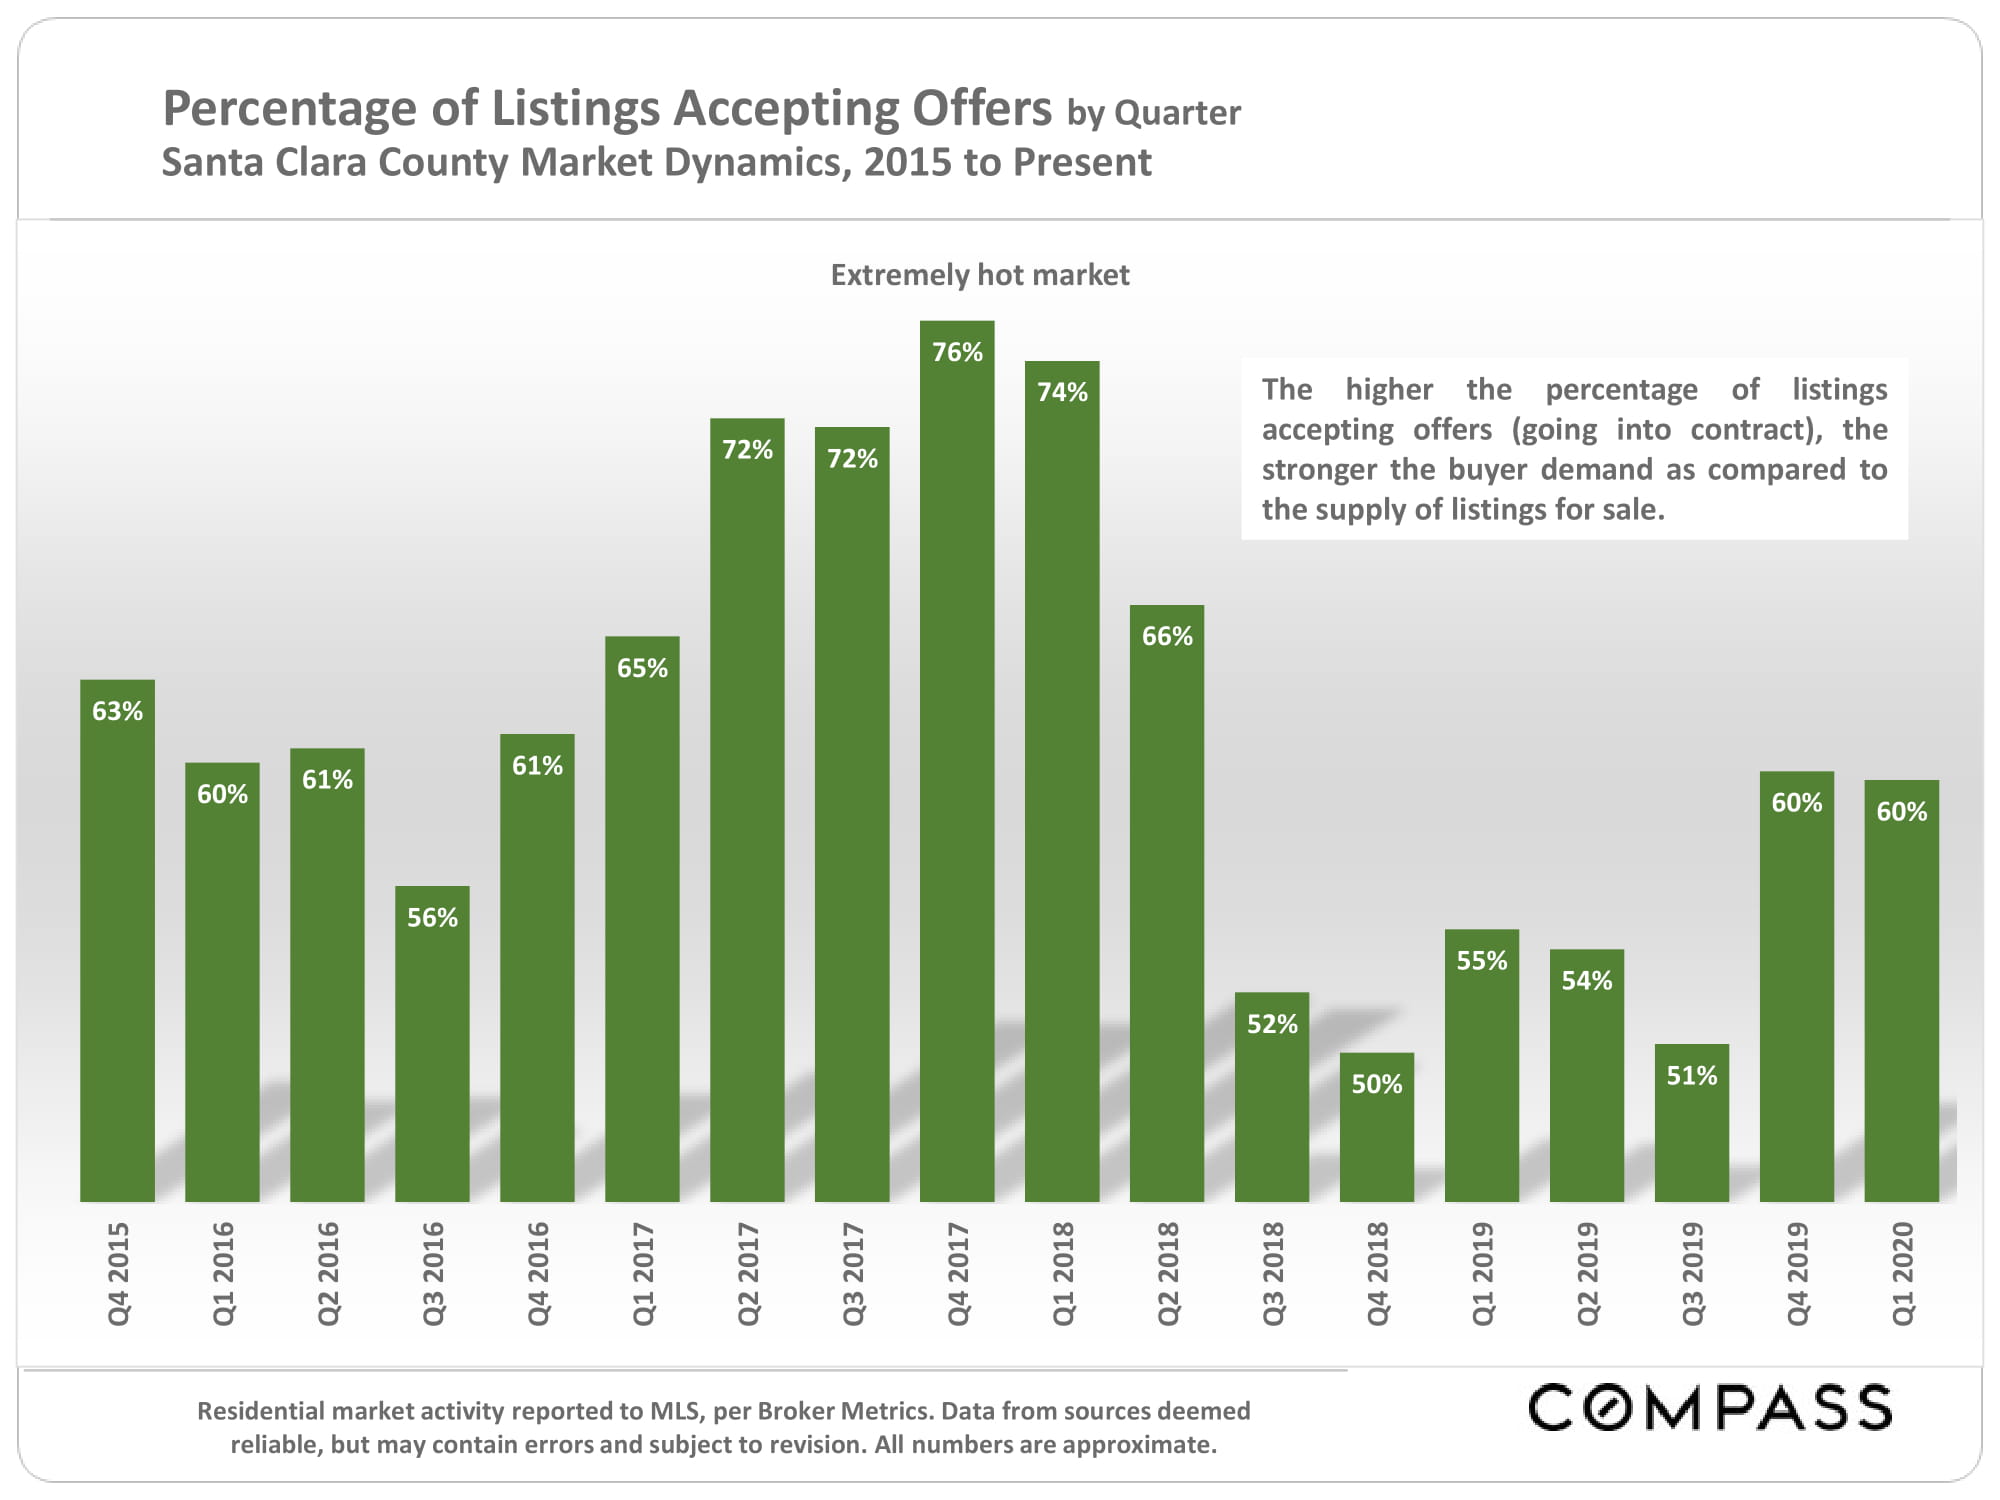
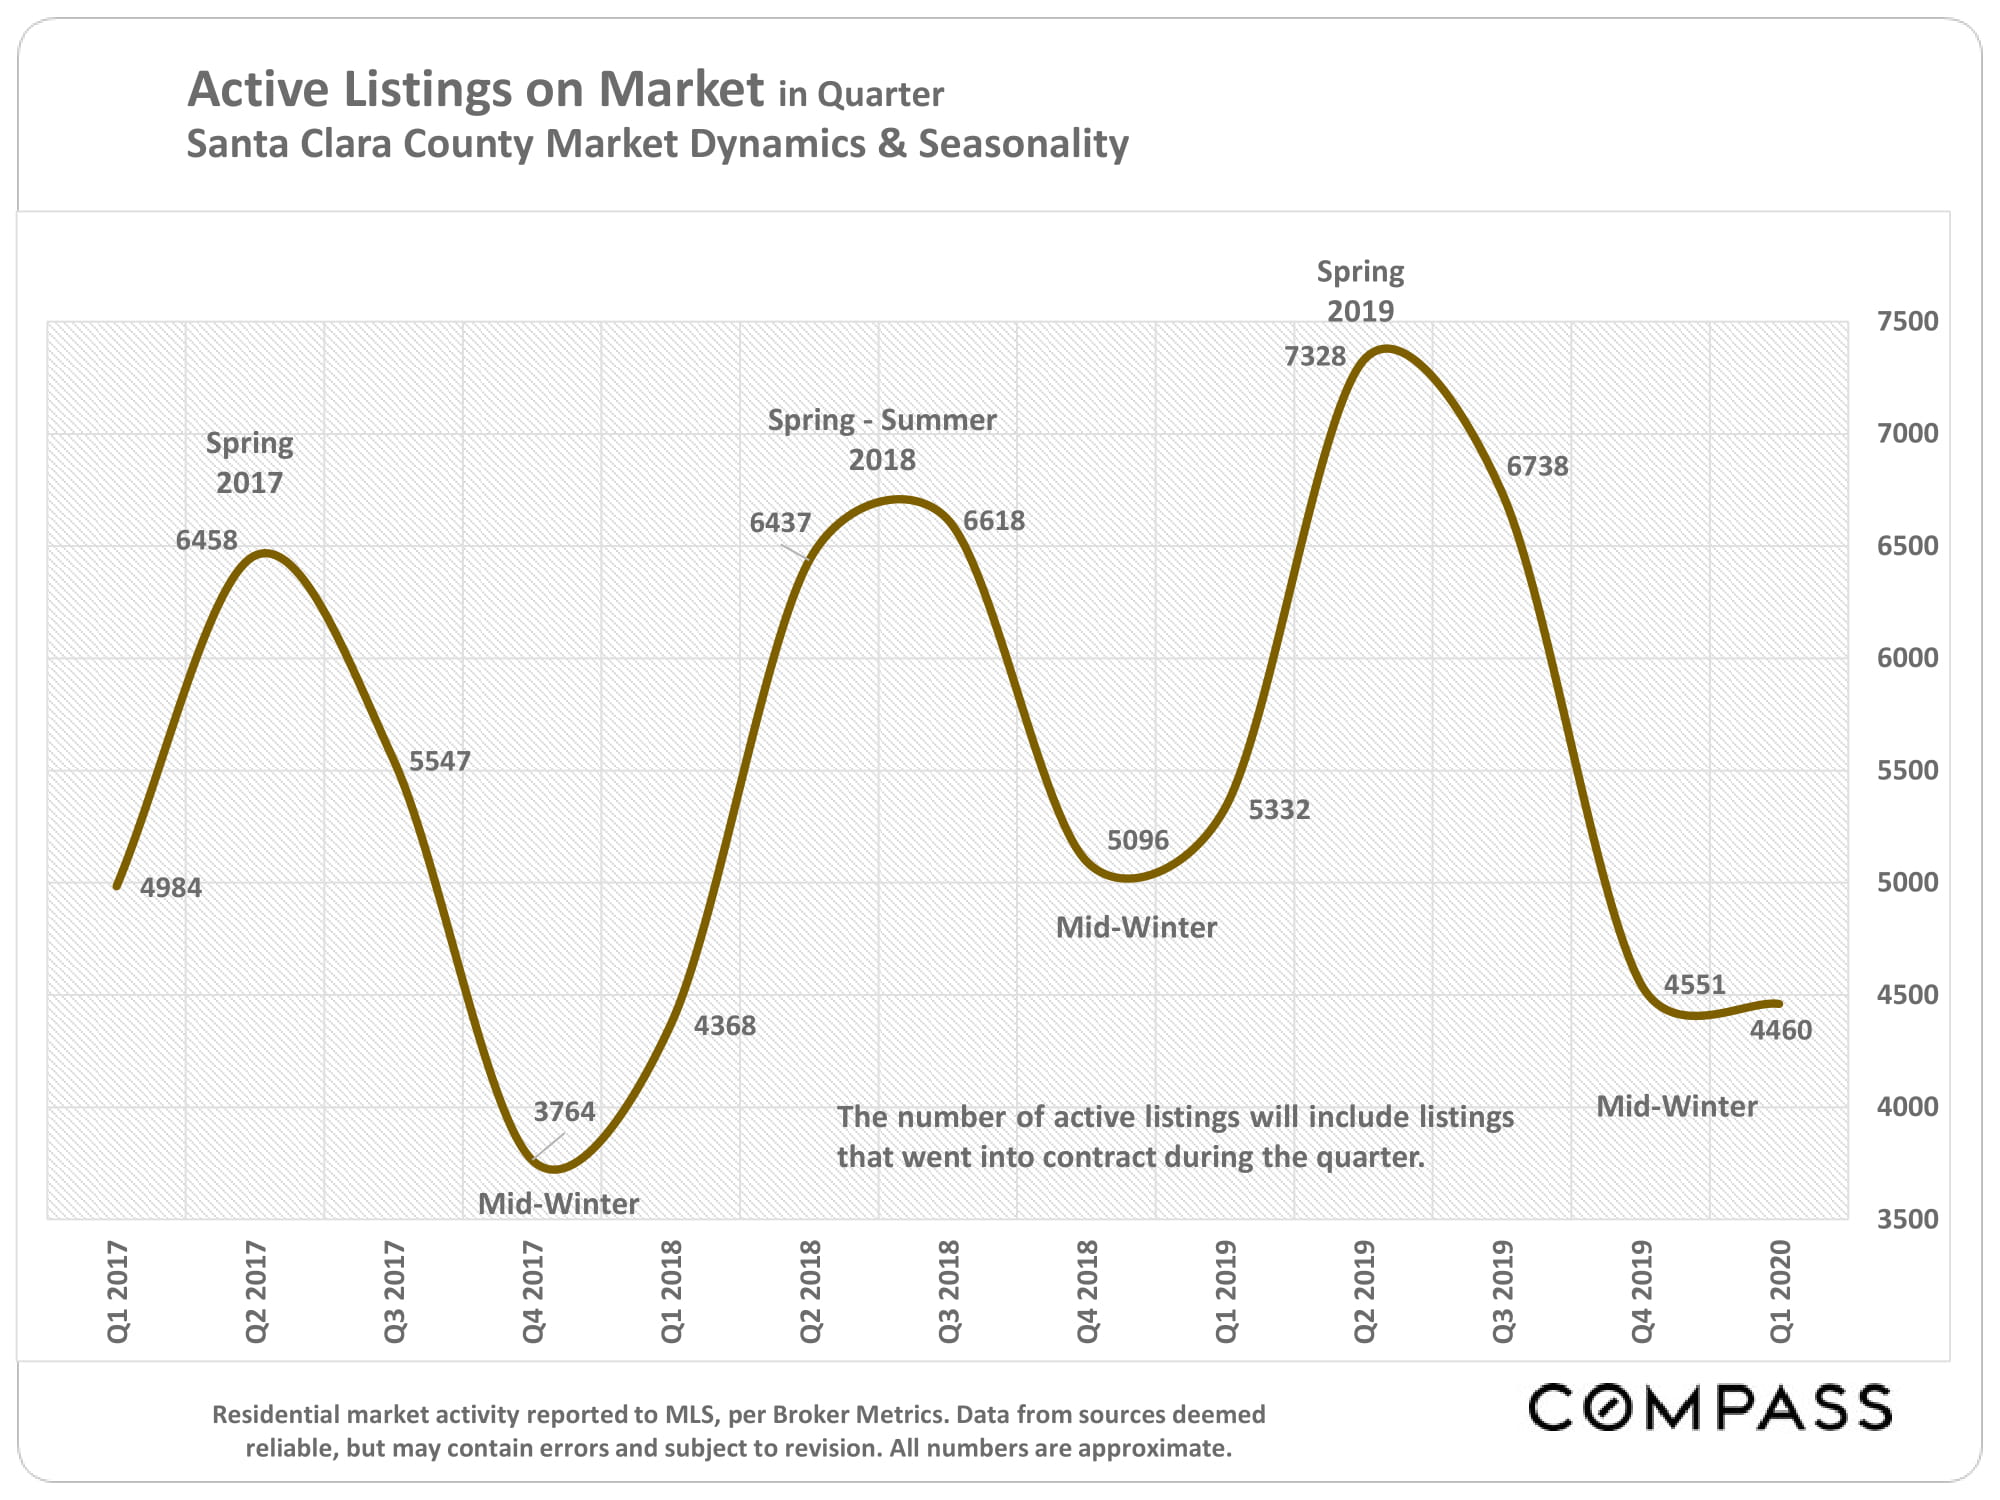
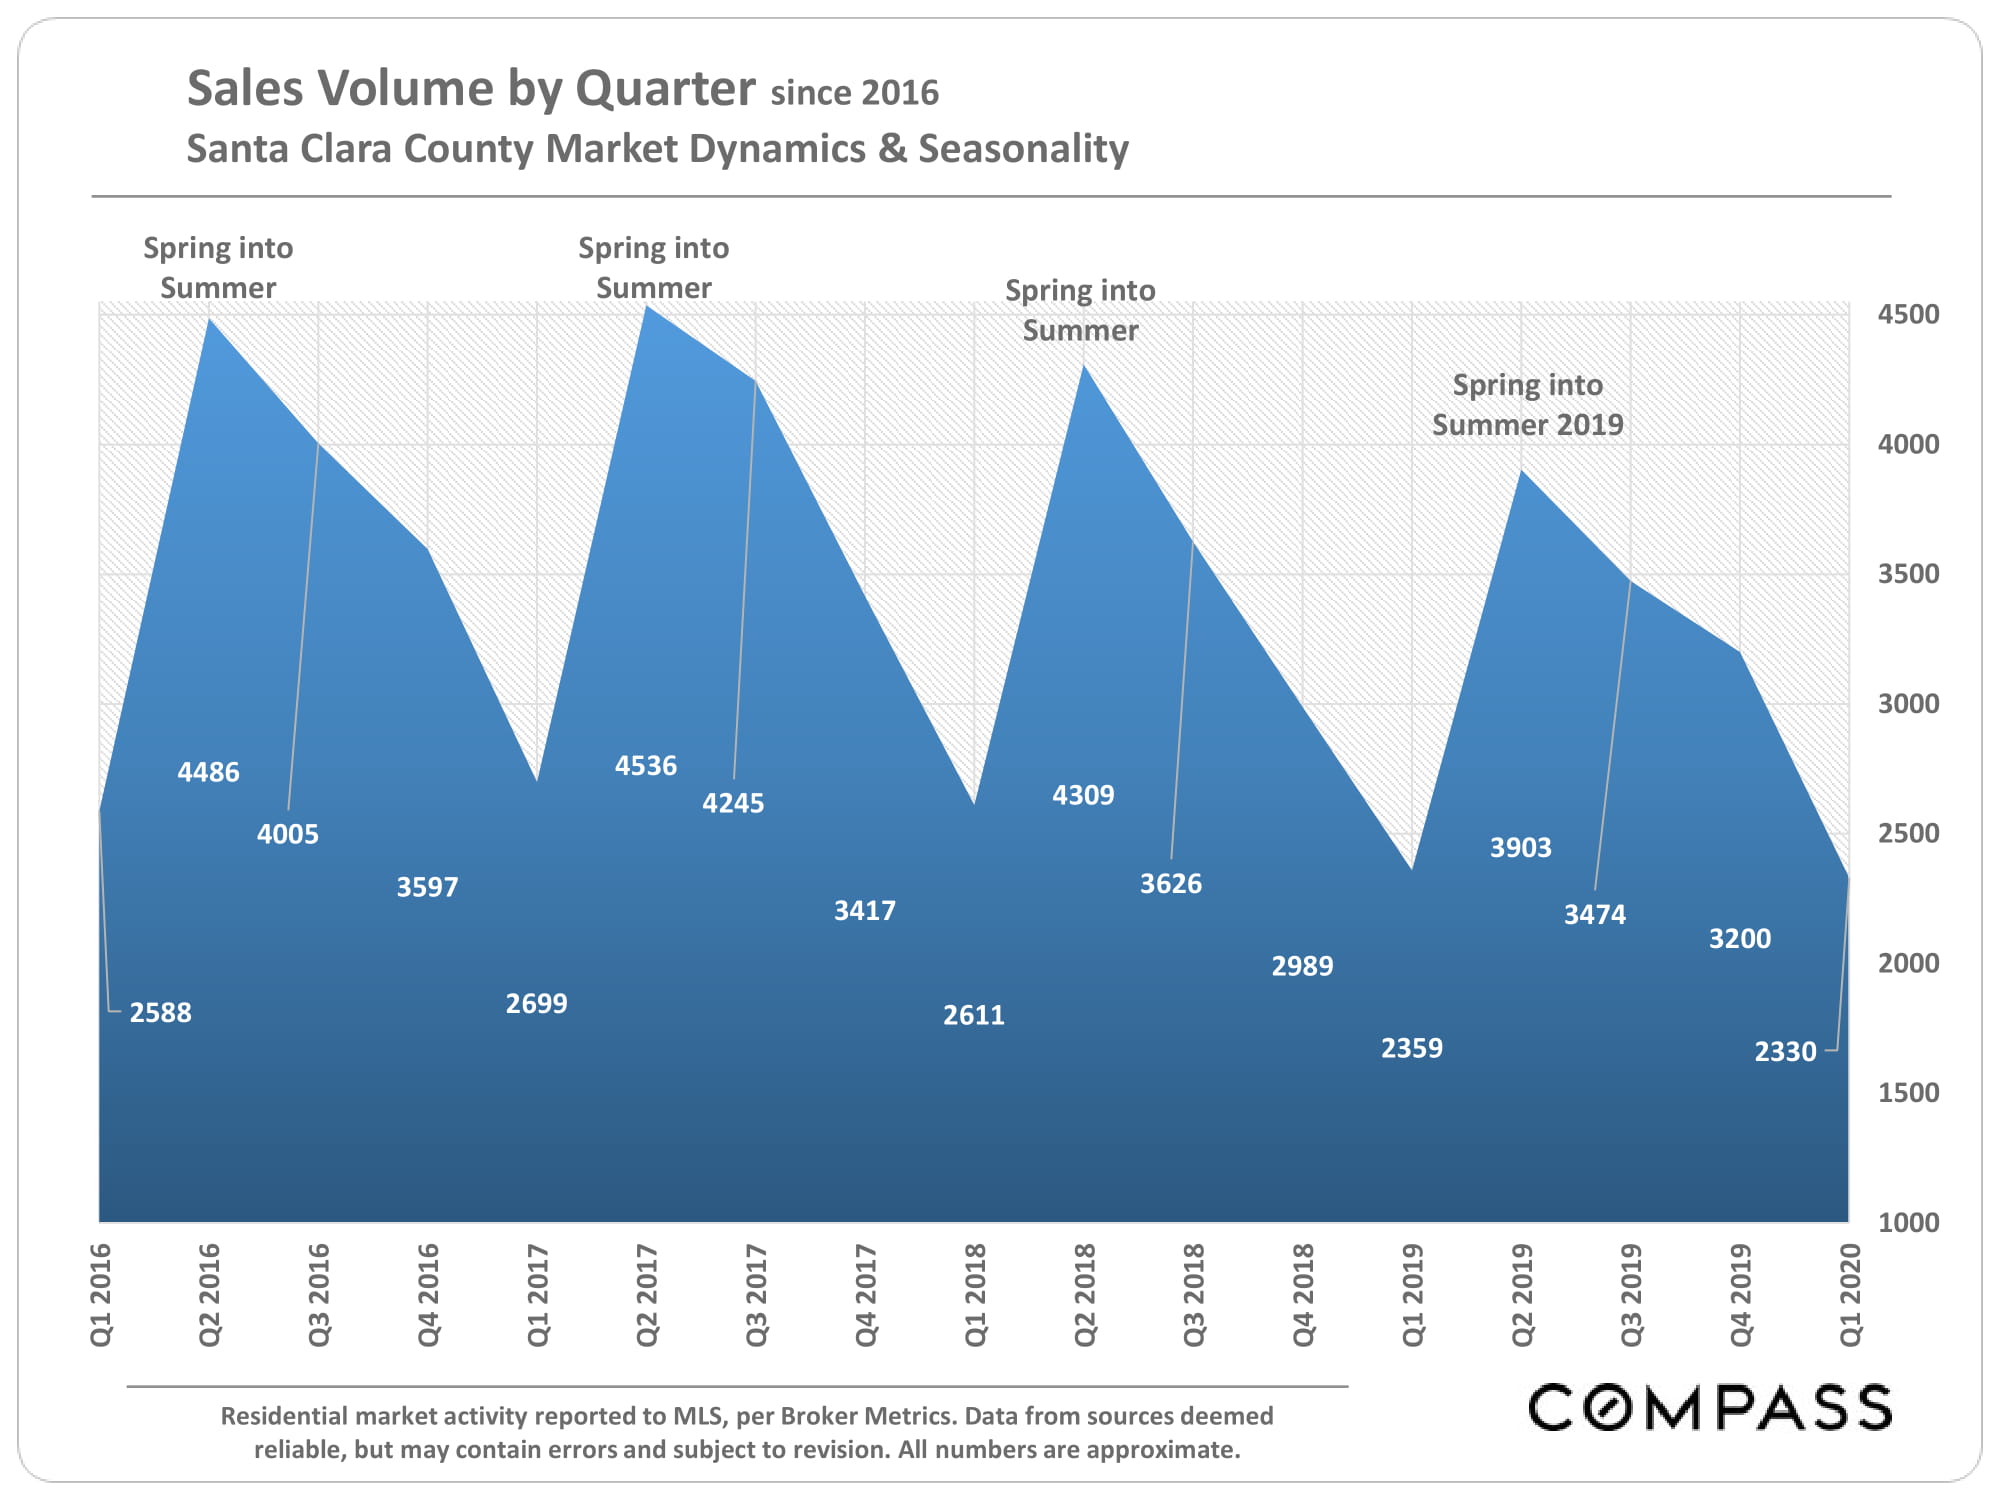
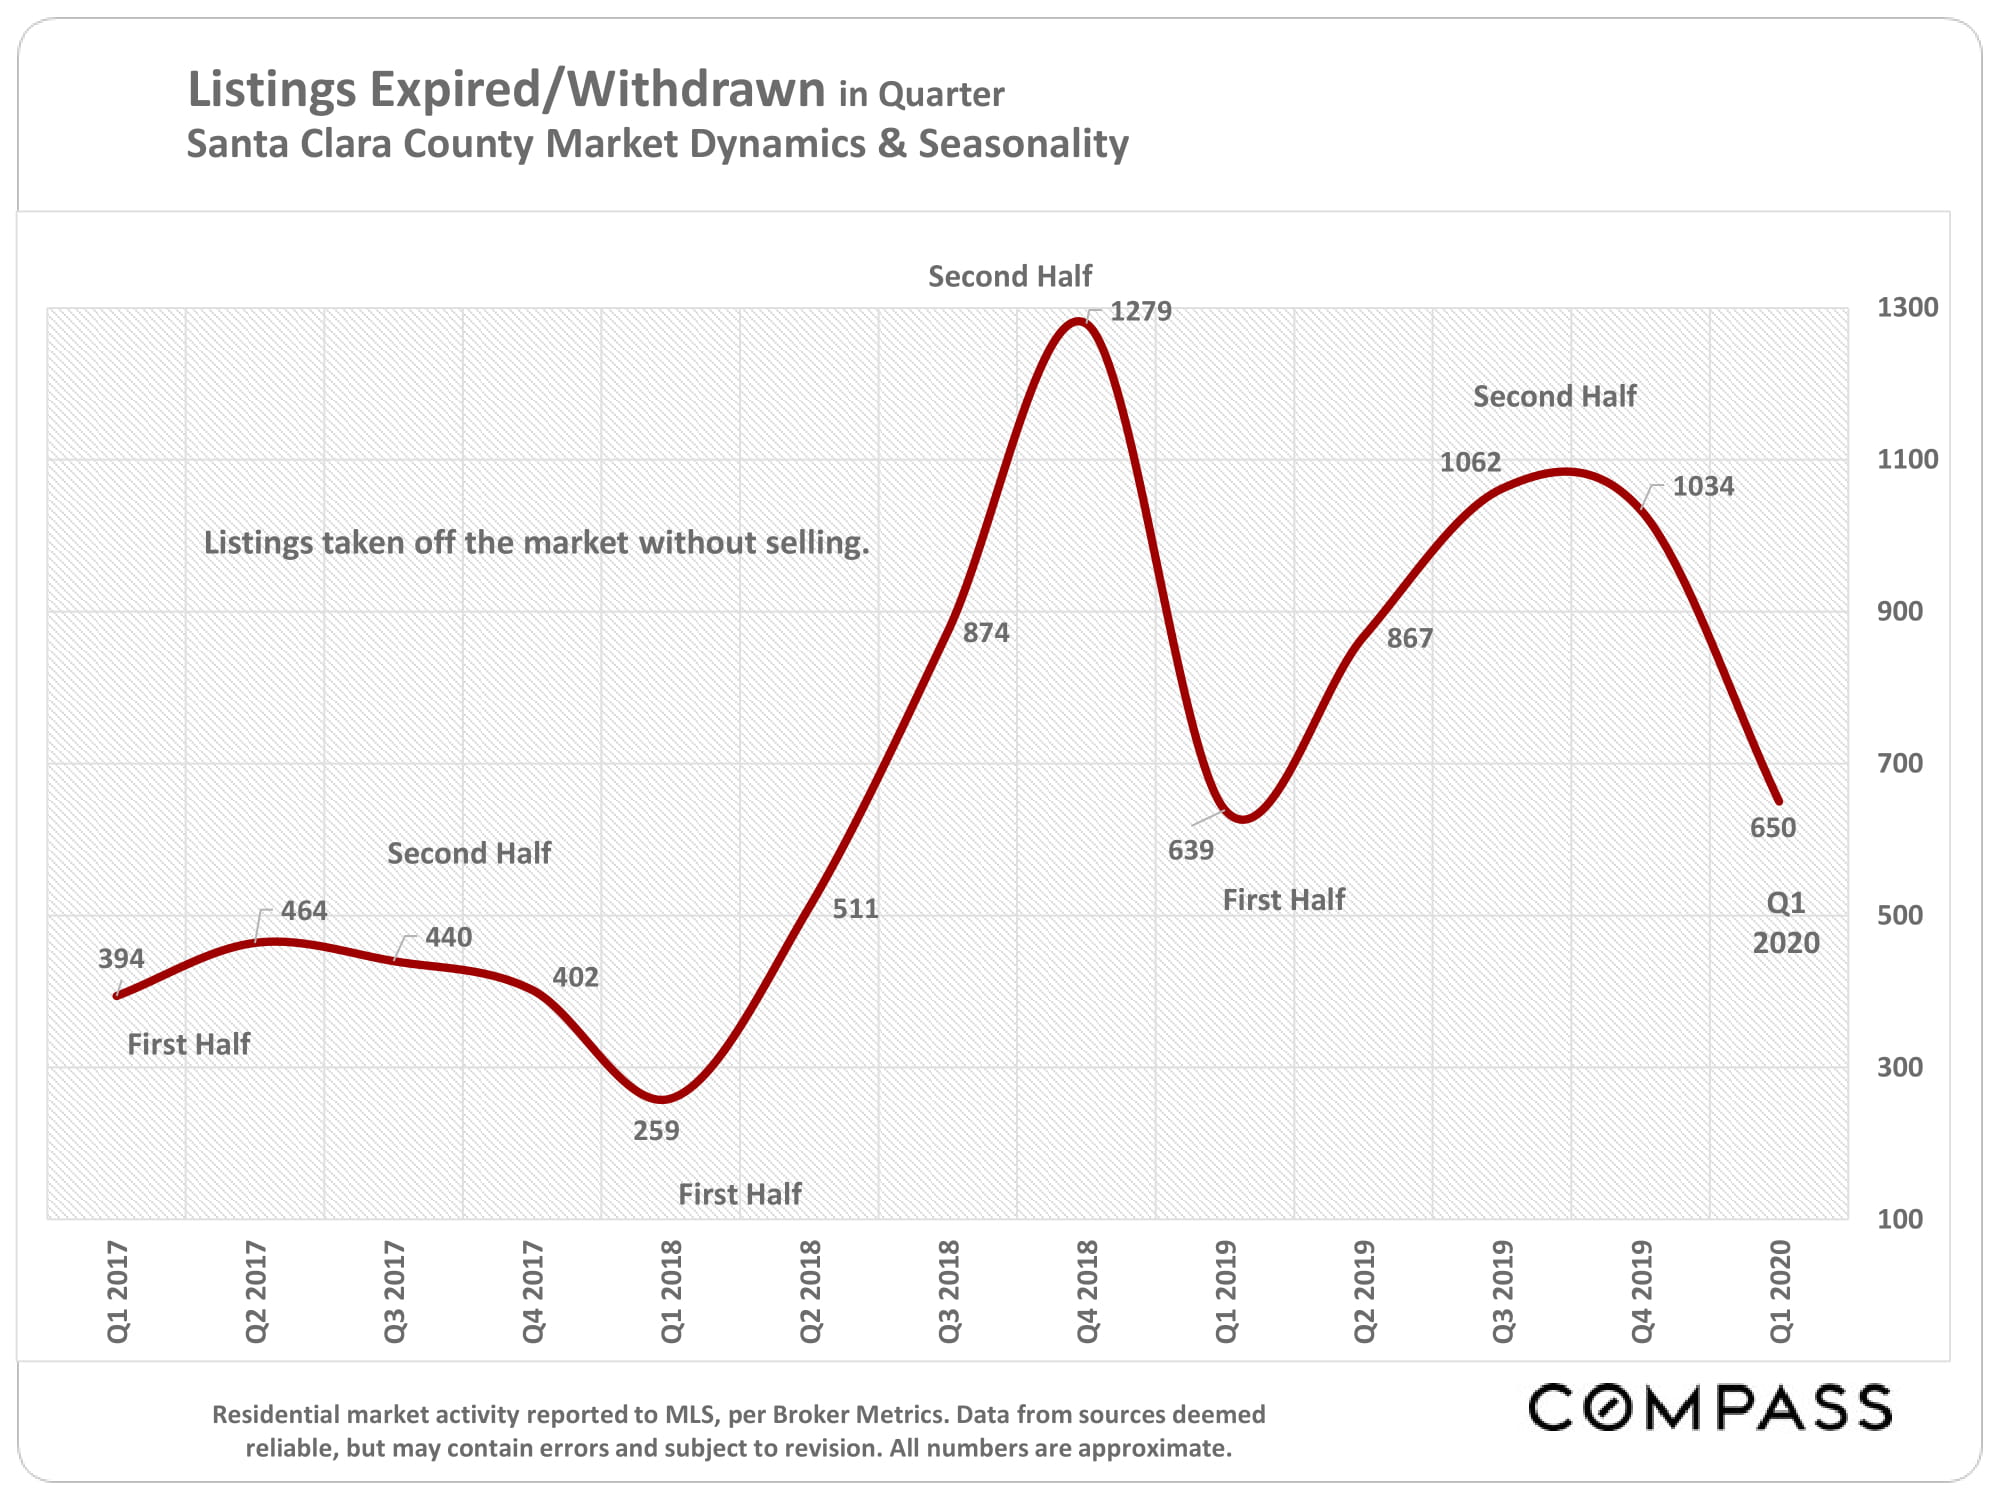
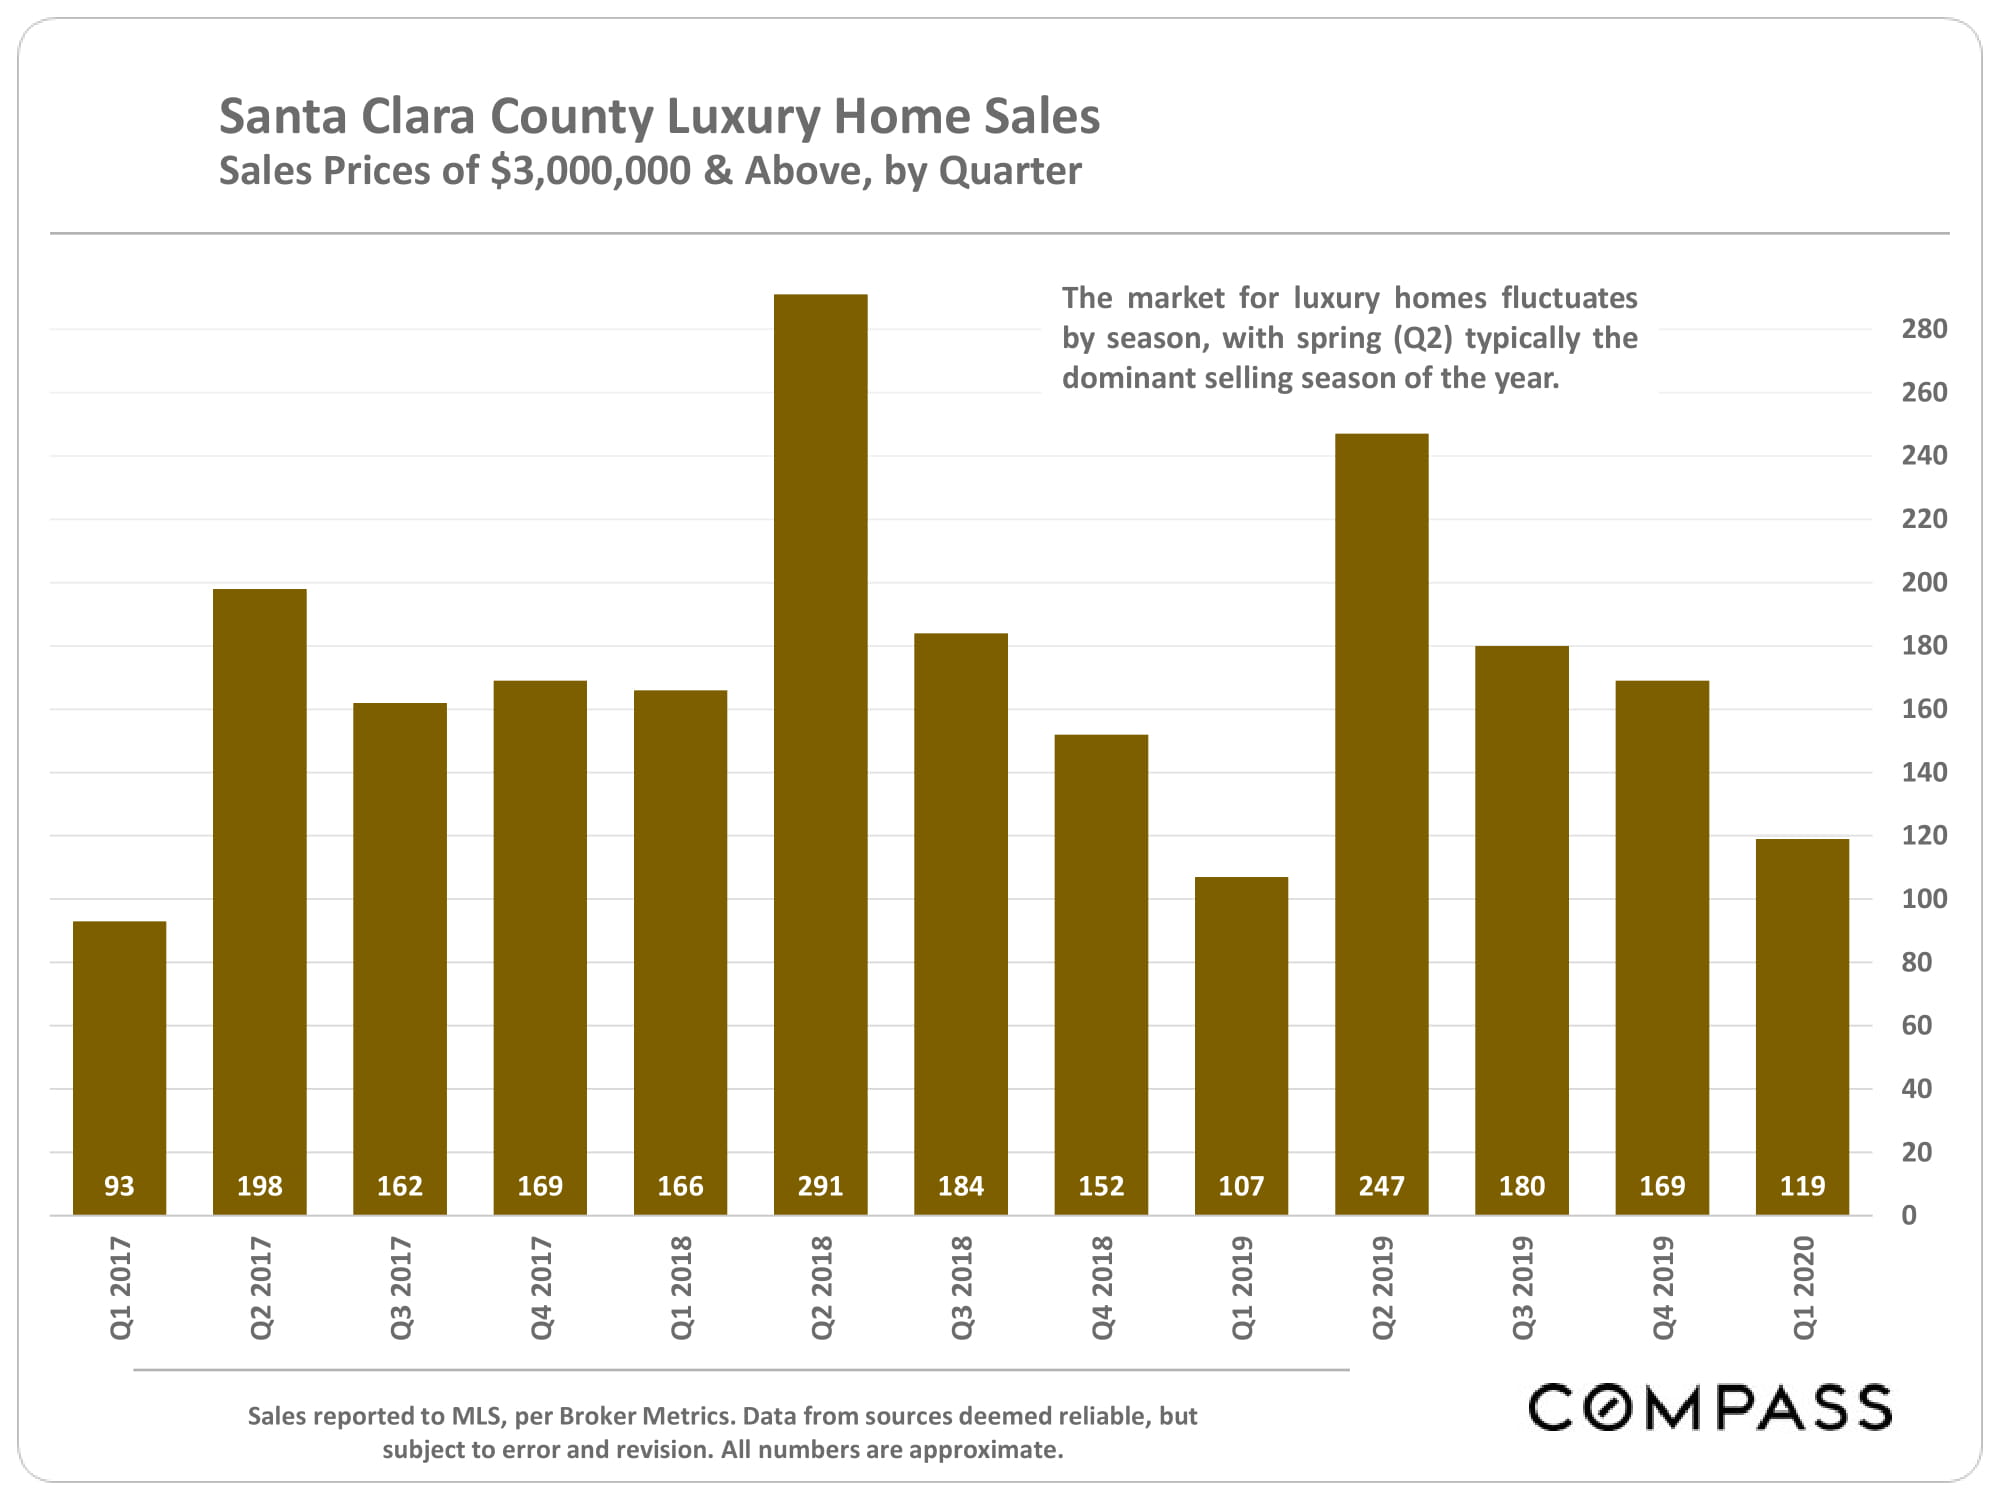
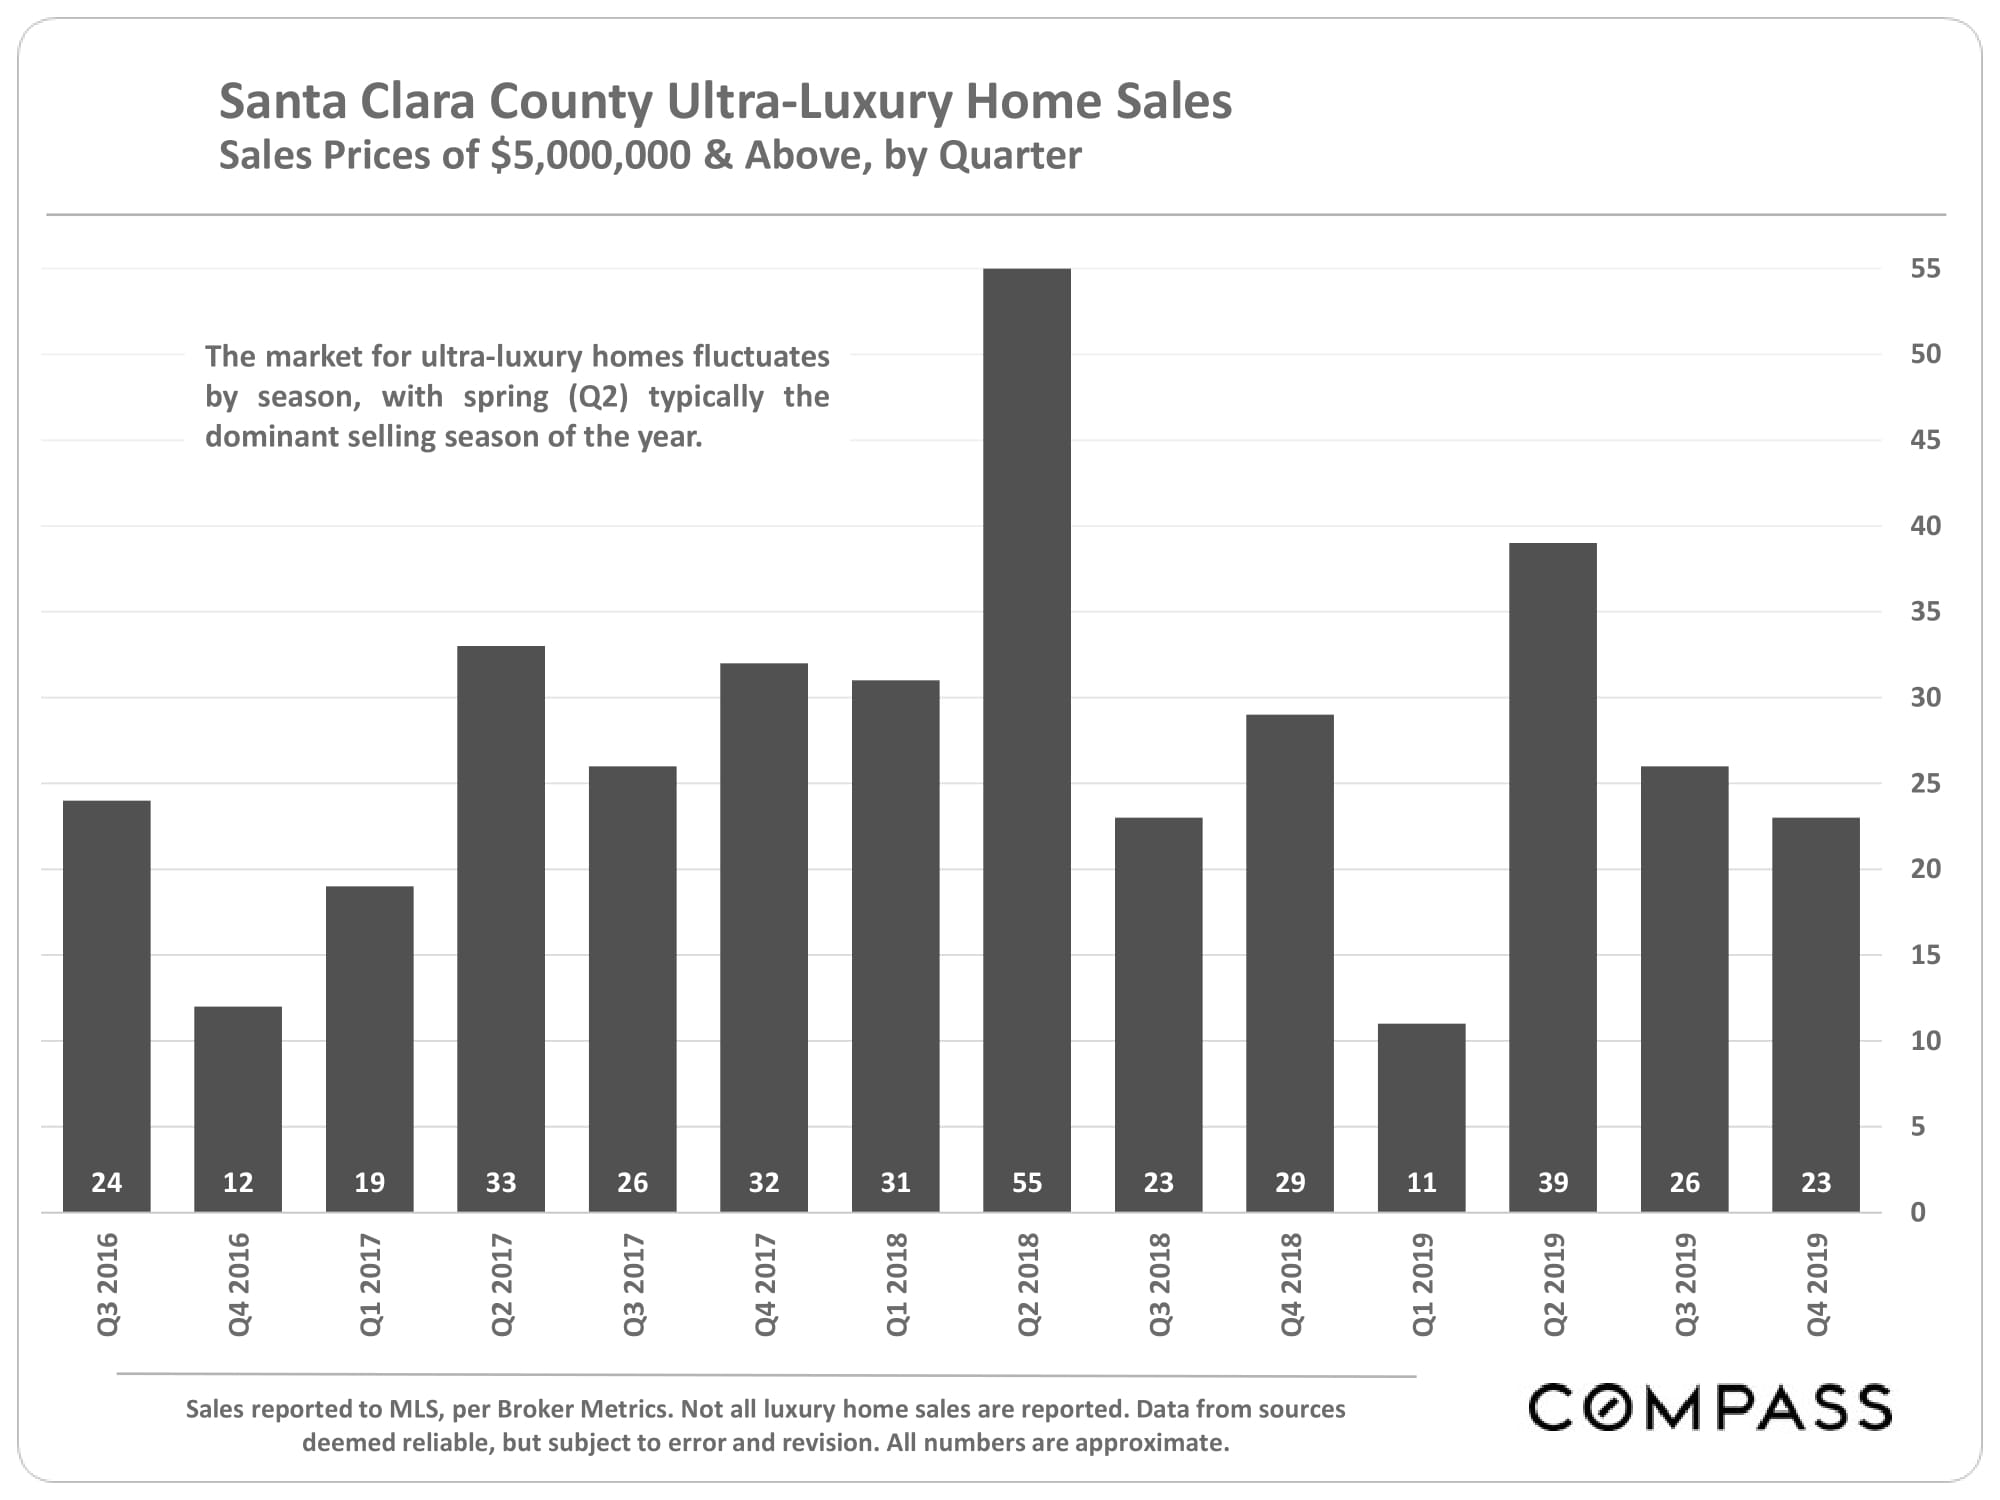
Santa Clara County Quarterly Statistics, May 2020

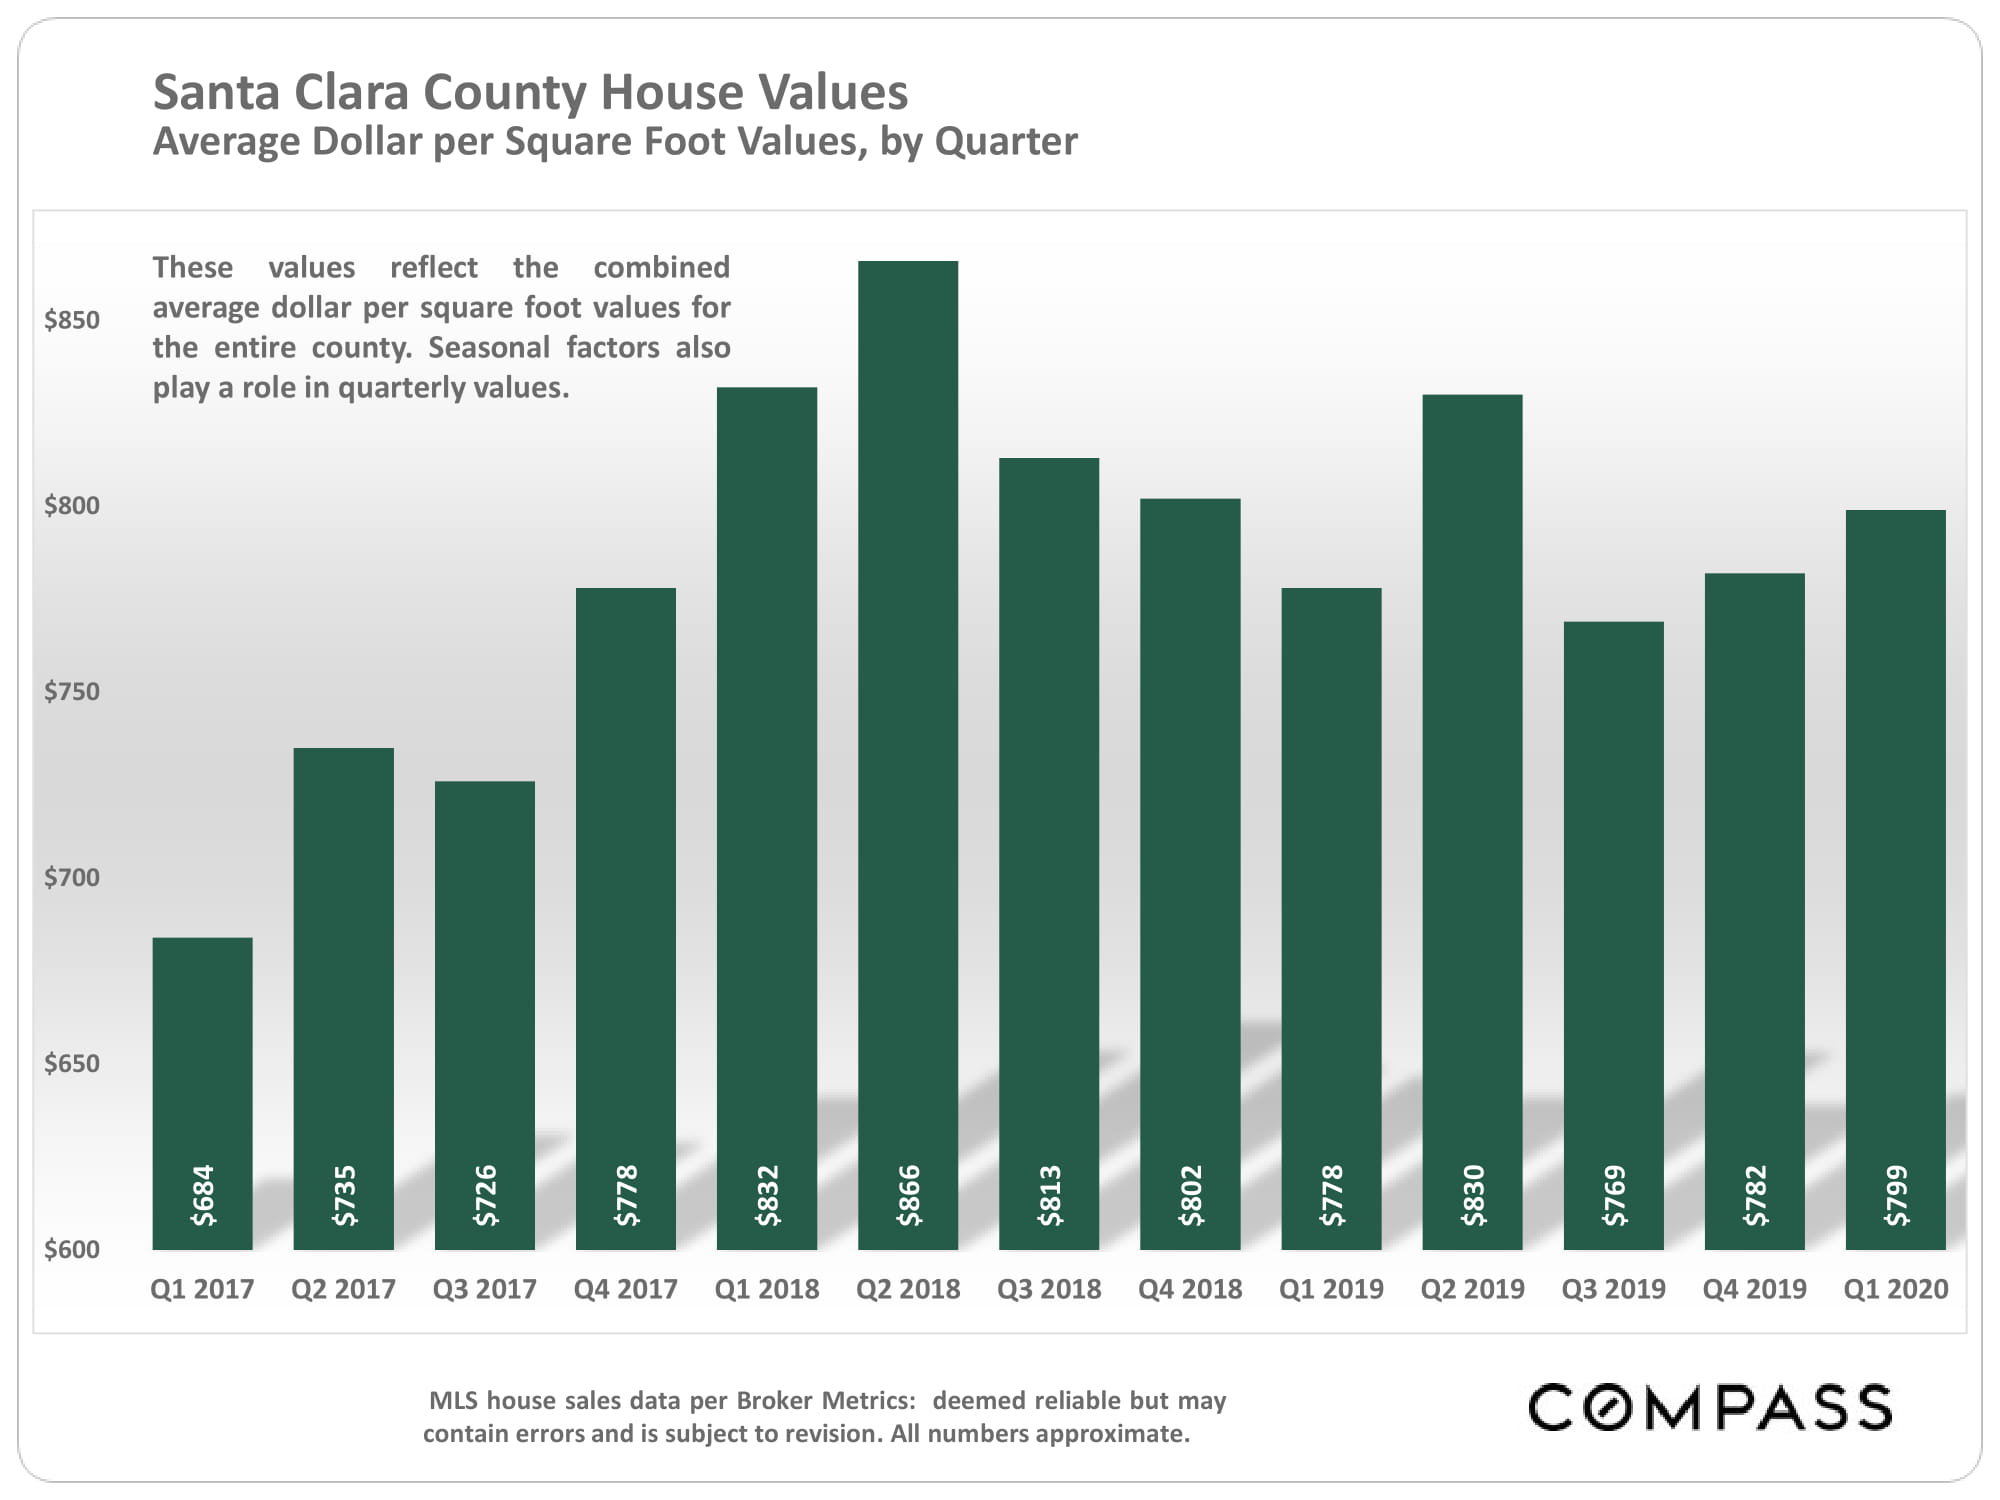
Market indicators are often seasonal in nature, with Q2 typically being the period of highest demand, and the mid-winter holiday period being the period of lowest activity.

Since the coronavirus didn’t really start impacting most markets until early-mid March, and because of the lag time between an offer being accepted on a listing and it closing escrow, the effect of the crisis on Q1 2020 statistics was limited. For more insight into how the crisis is affecting our real estate market, see our weekly trends report.

Data from sources deemed reliable, but may contain errors and subject to revision. All numbers to be considered approximate.


Source: Compass

It is impossible to know how median and average value statistics apply to any particular home without a specific comparative market analysis. Many factors affect sales prices besides neighborhood/ bedroom count: quality of location within the neighborhood, condition, size,architecture,views, amenities,parking,outdoor space, etc.

These analyses were made in good faith with data from sources deemed reliable, but may contain errors and are subject to revision. It is not our intent to convince you of a particular position,but to attempt to provide straightforward data and analysis, so you can make your own informed decisions. Median and average statistics are enormous generalities: There are hundreds of different markets in San Francisco and the Bay Area, each with its own unique dynamics. Median prices and average dollar per square foot values can be and often are affected by other factors besides changes in fair market value. Longer term trends are much more meaningful than short-term.

Compass is a real estate broker licensed by the State of California, DRE 01527235. Equal Housing Opportunity. This report has been prepared solely for information purposes. The information herein is based on or derived from information generally available to the public and/or from sources believed to be reliable. No representation or warranty can be given with respect to the accuracy or completeness of the information. Compass disclaims any and all liability relating to this report, including without limitation any express or implied representations or warranties for statements contained in, and omissions from, the report. Nothing contained herein is intended to be or should be read as any regulatory, legal, tax, accounting or other advice and Compass does not provide such advice. All opinions are subject to change without notice. Compass makes no representation regarding the accuracy of any statements regarding any references to the laws, statutes or regulations of any state are those of the author(s). Past performance is no guarantee of future results.

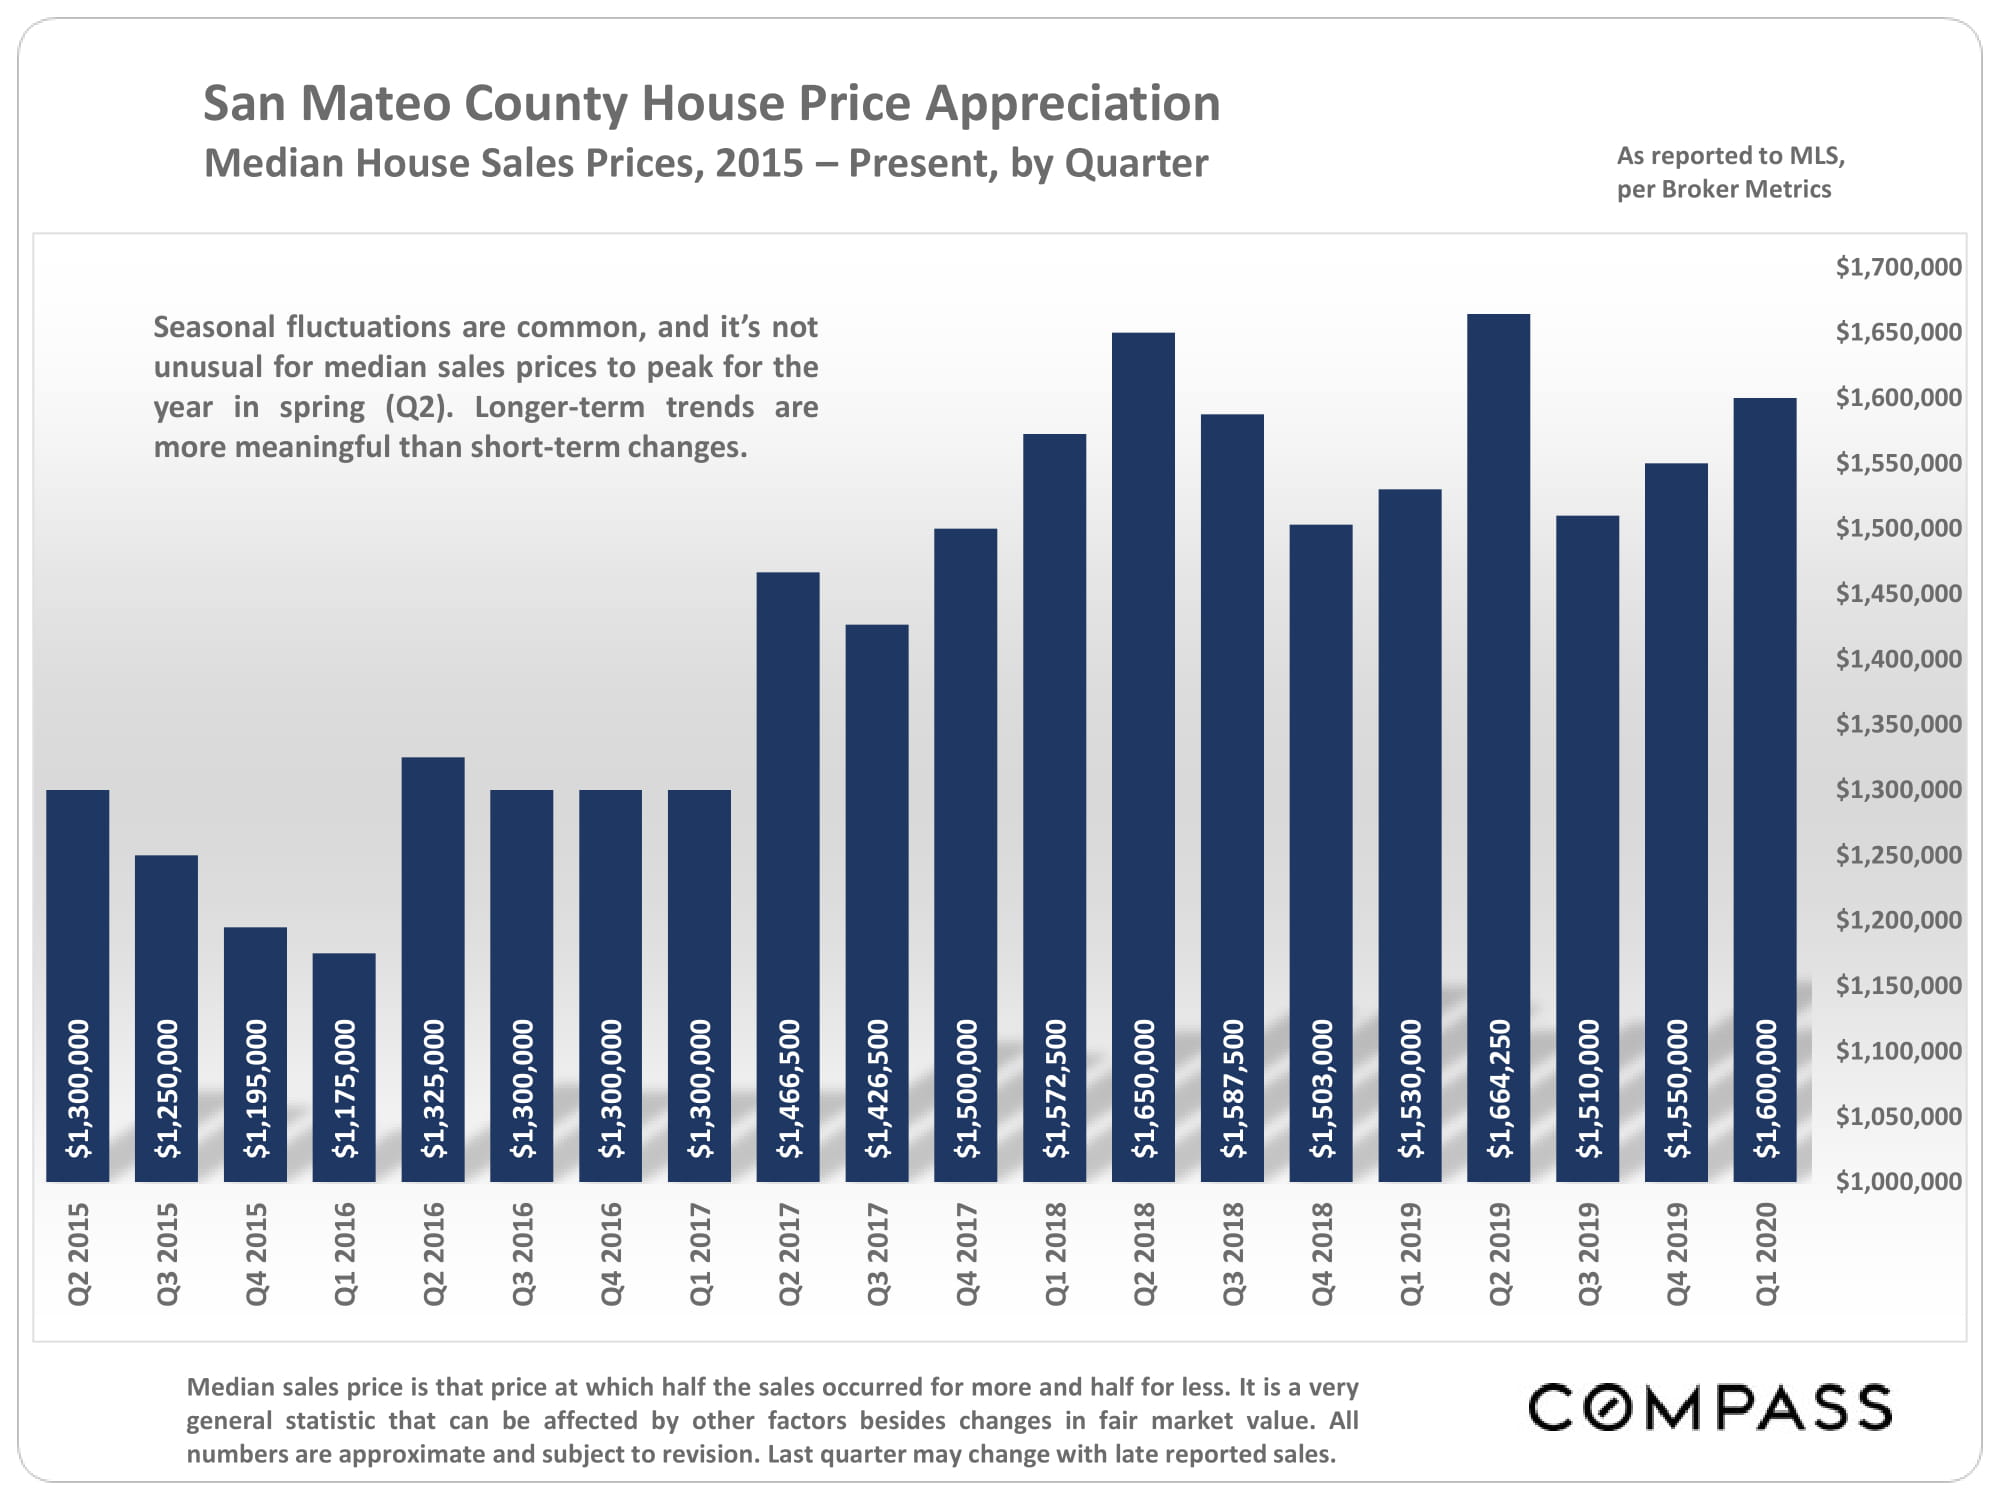
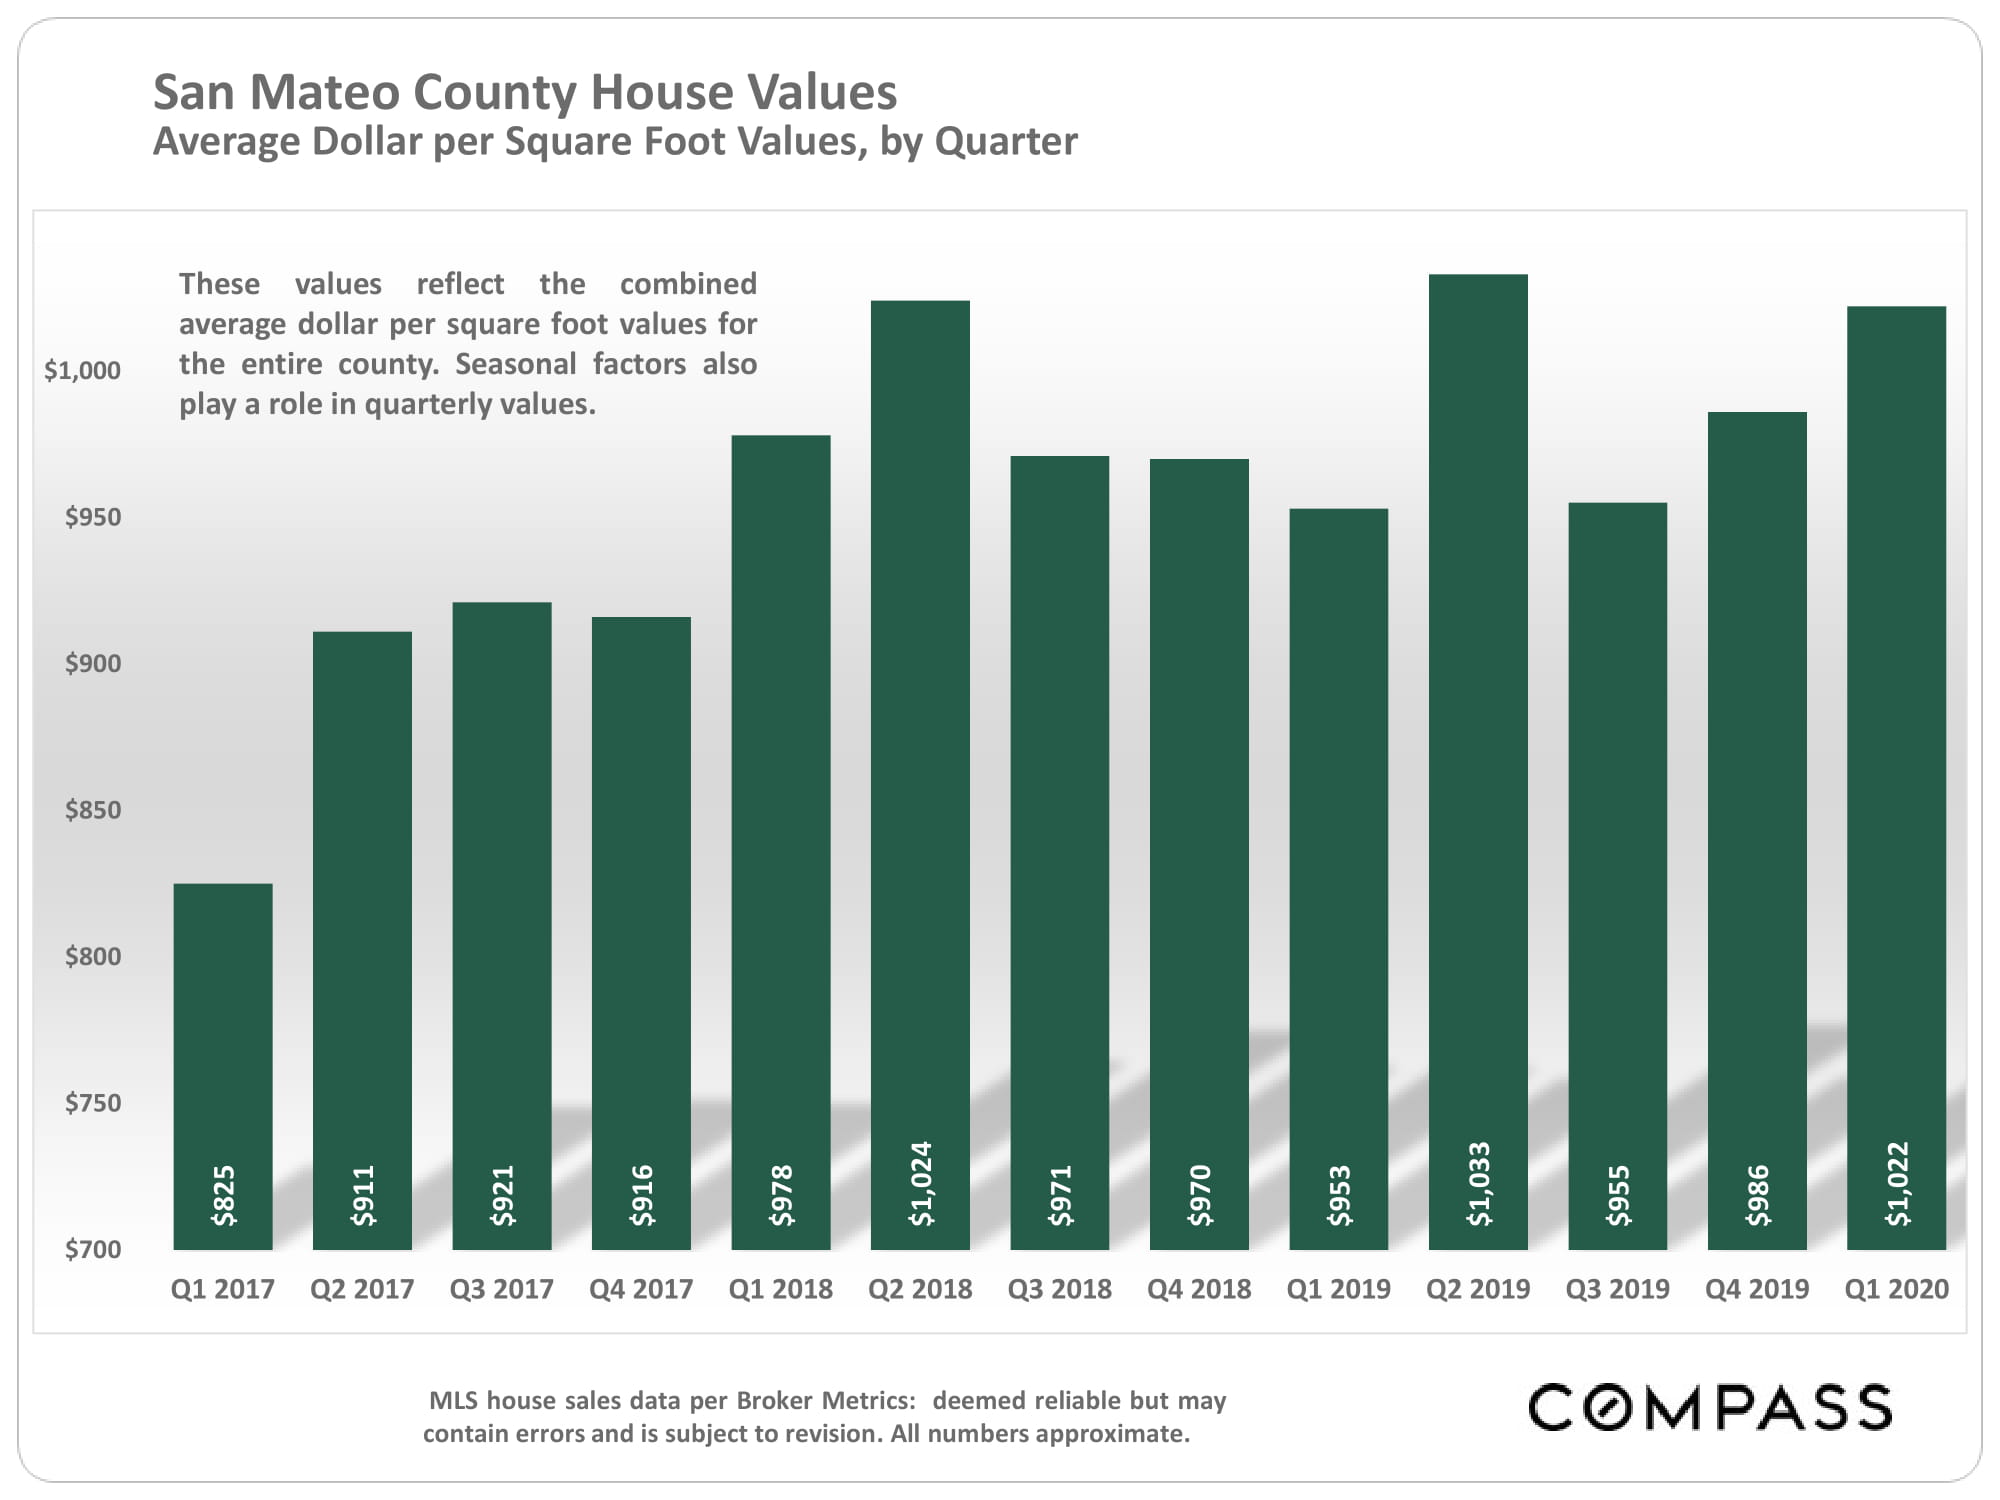
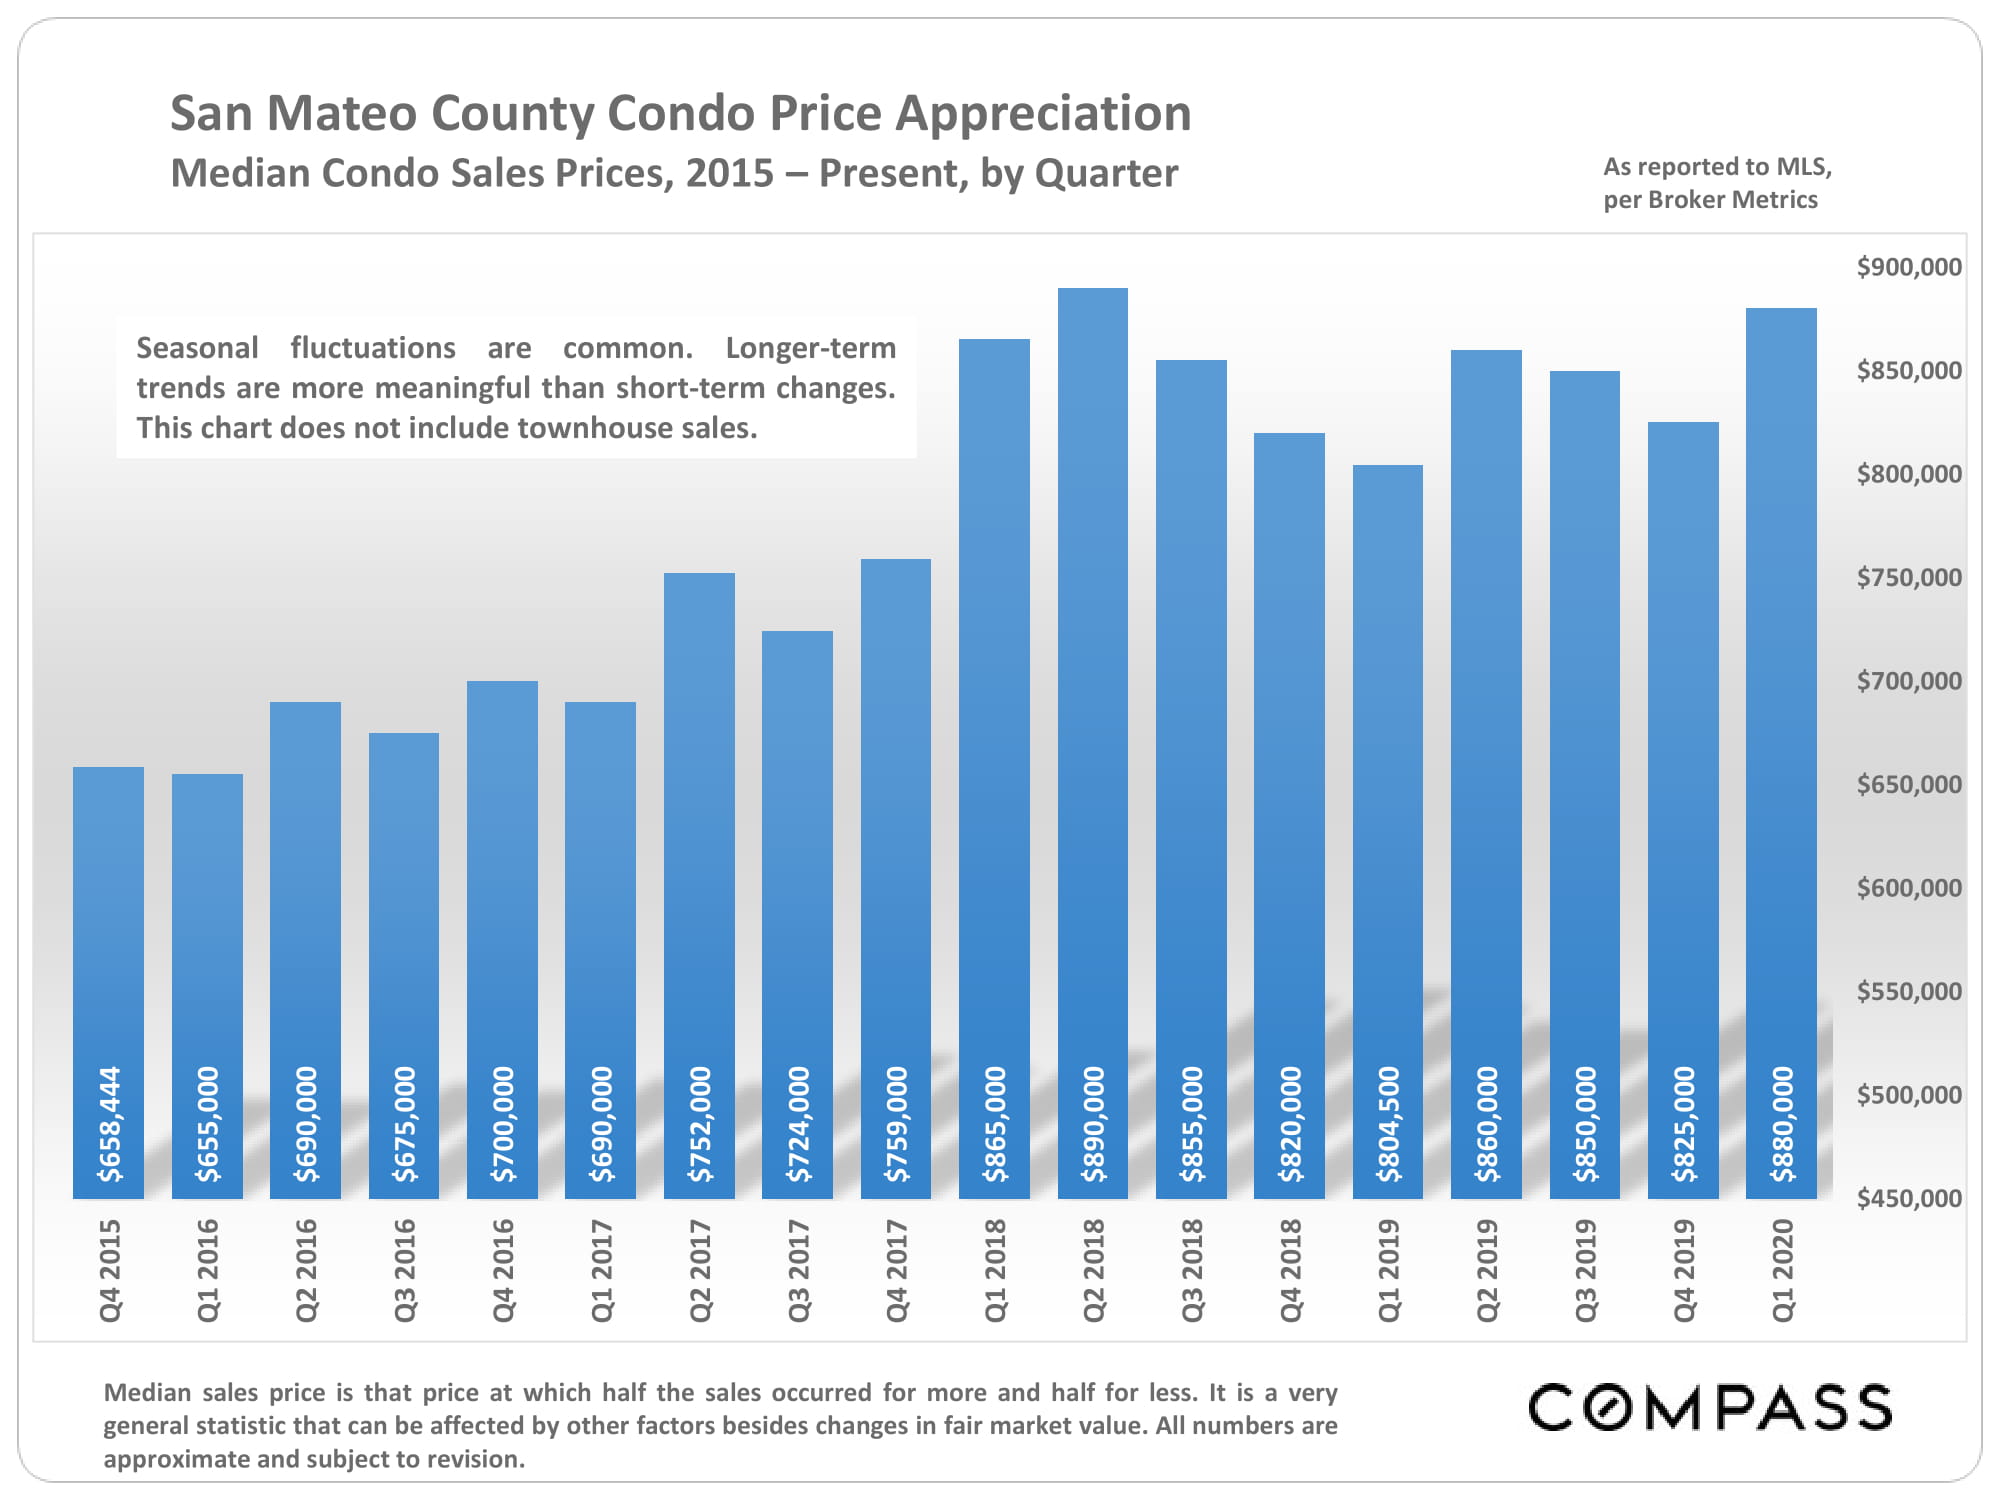
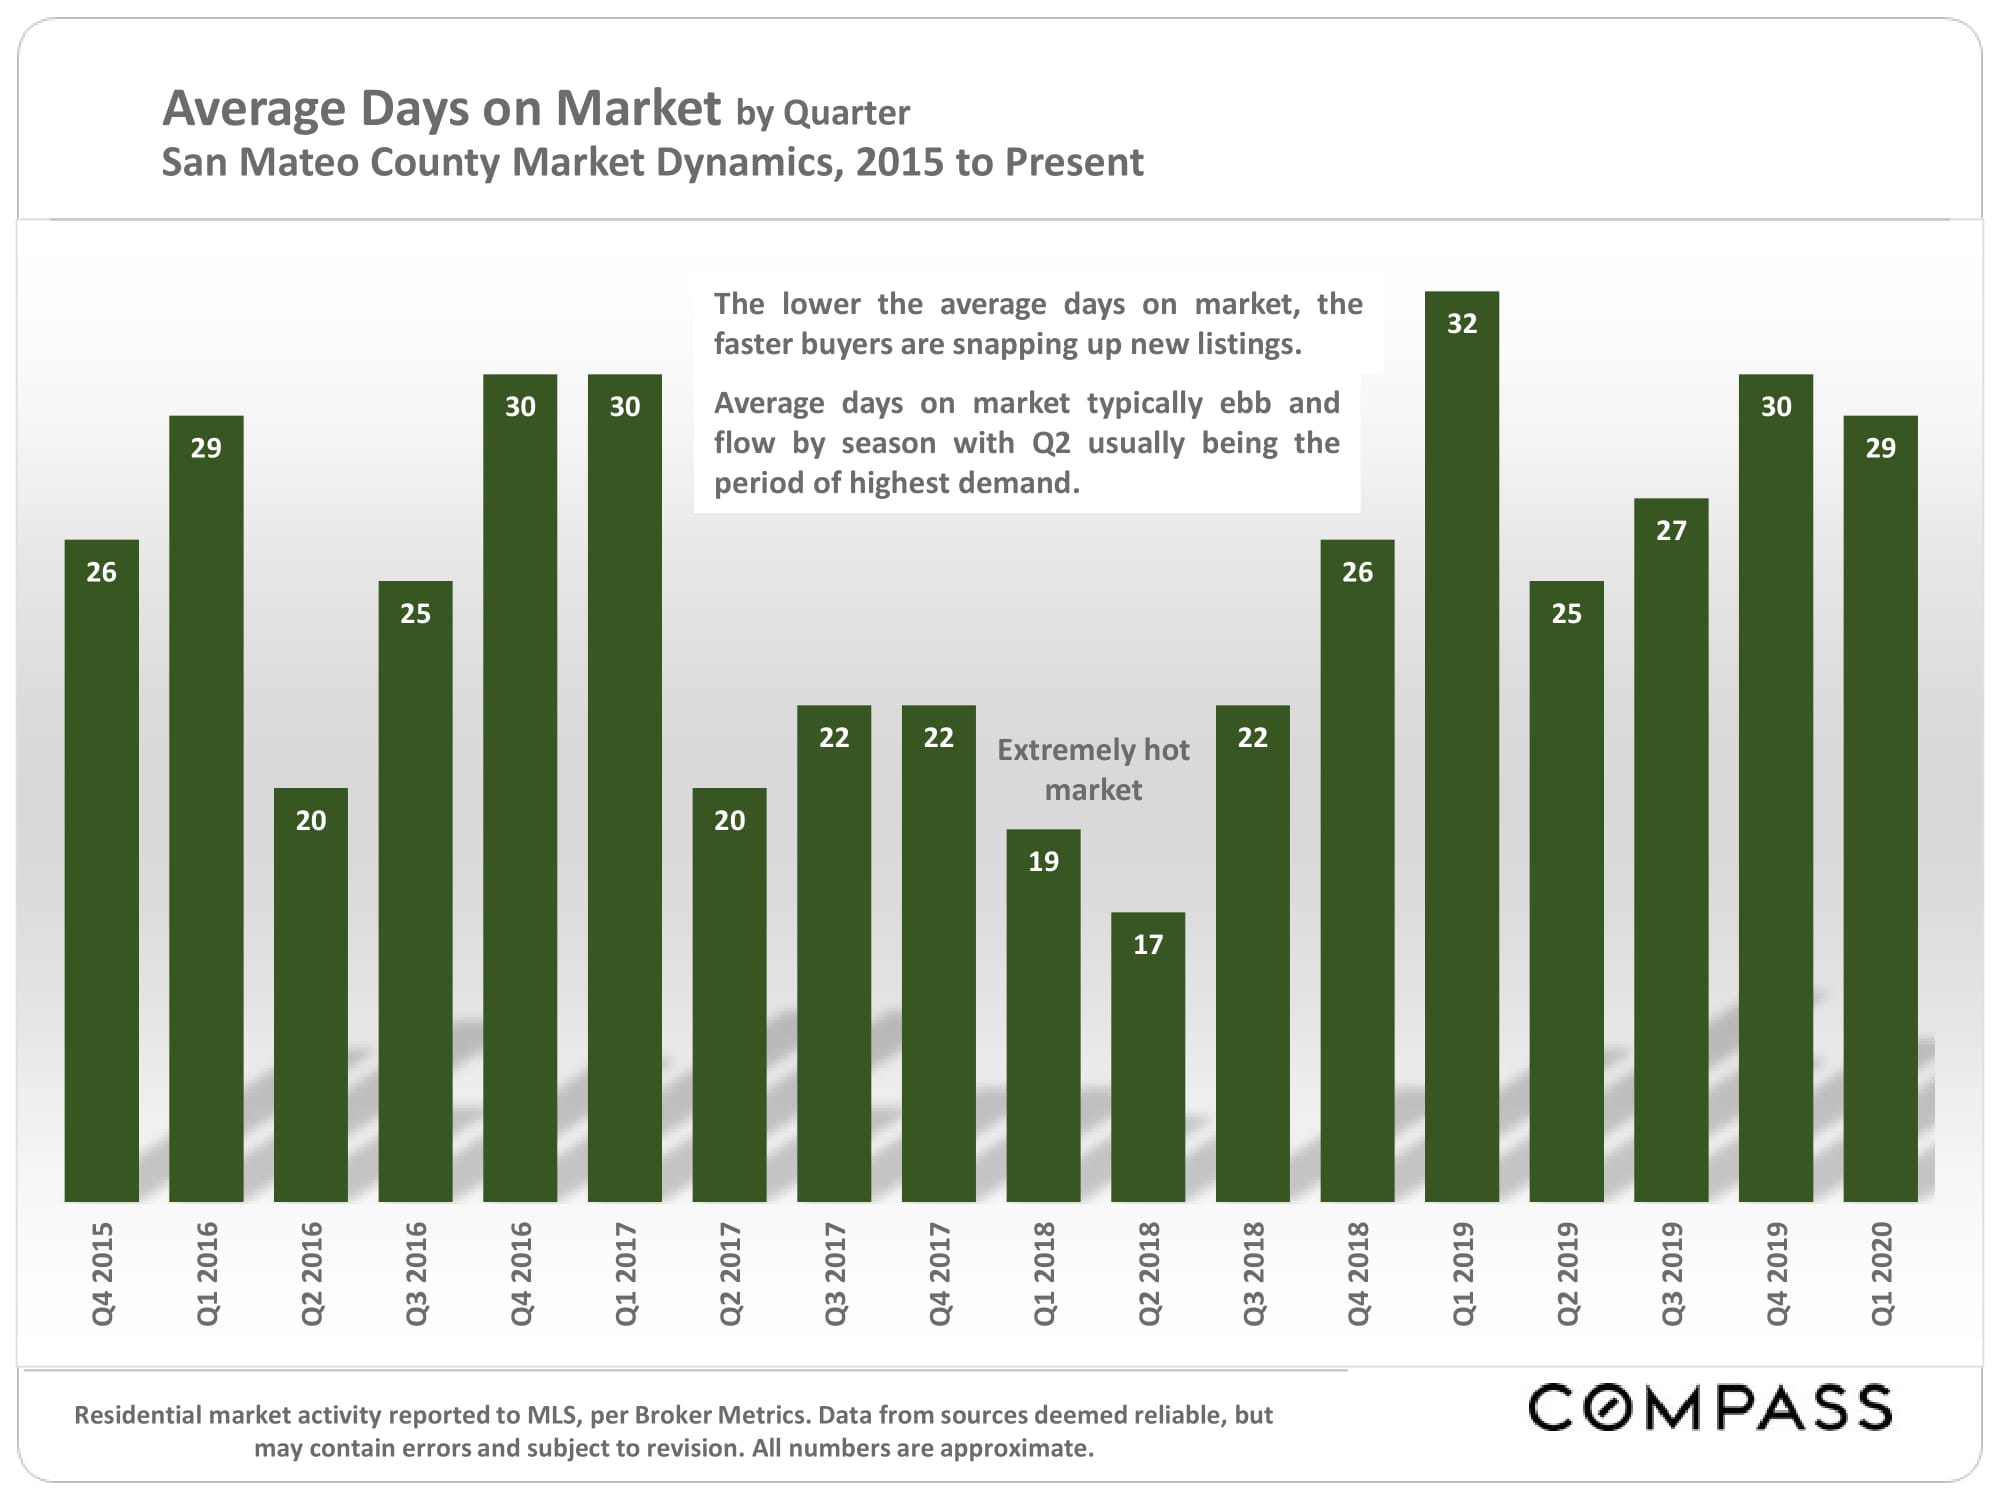
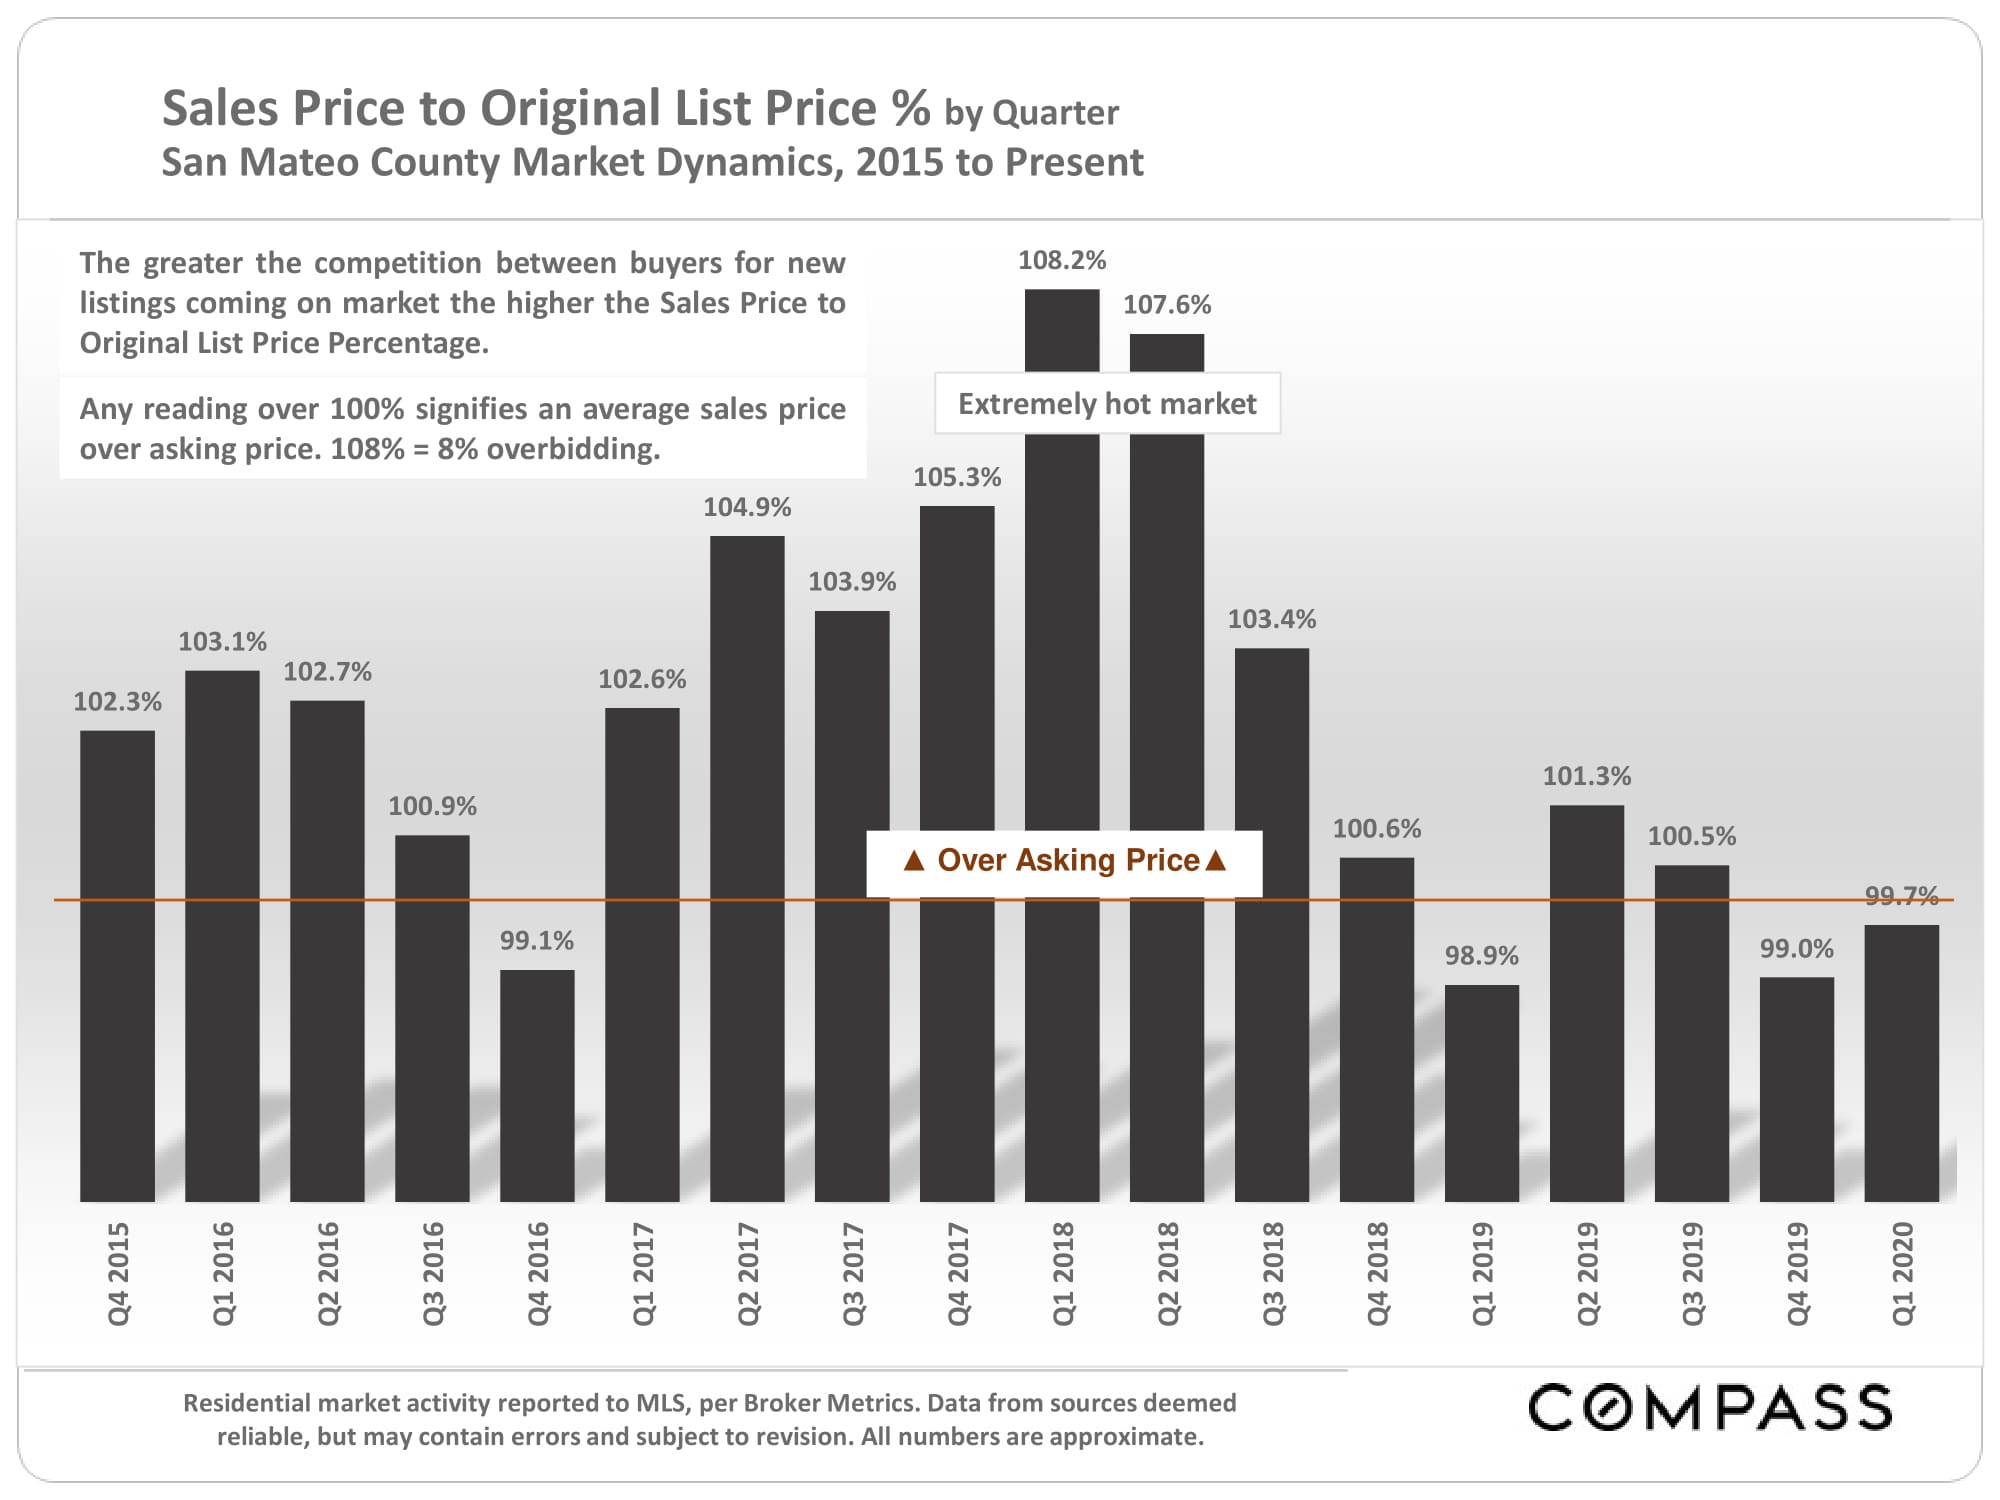
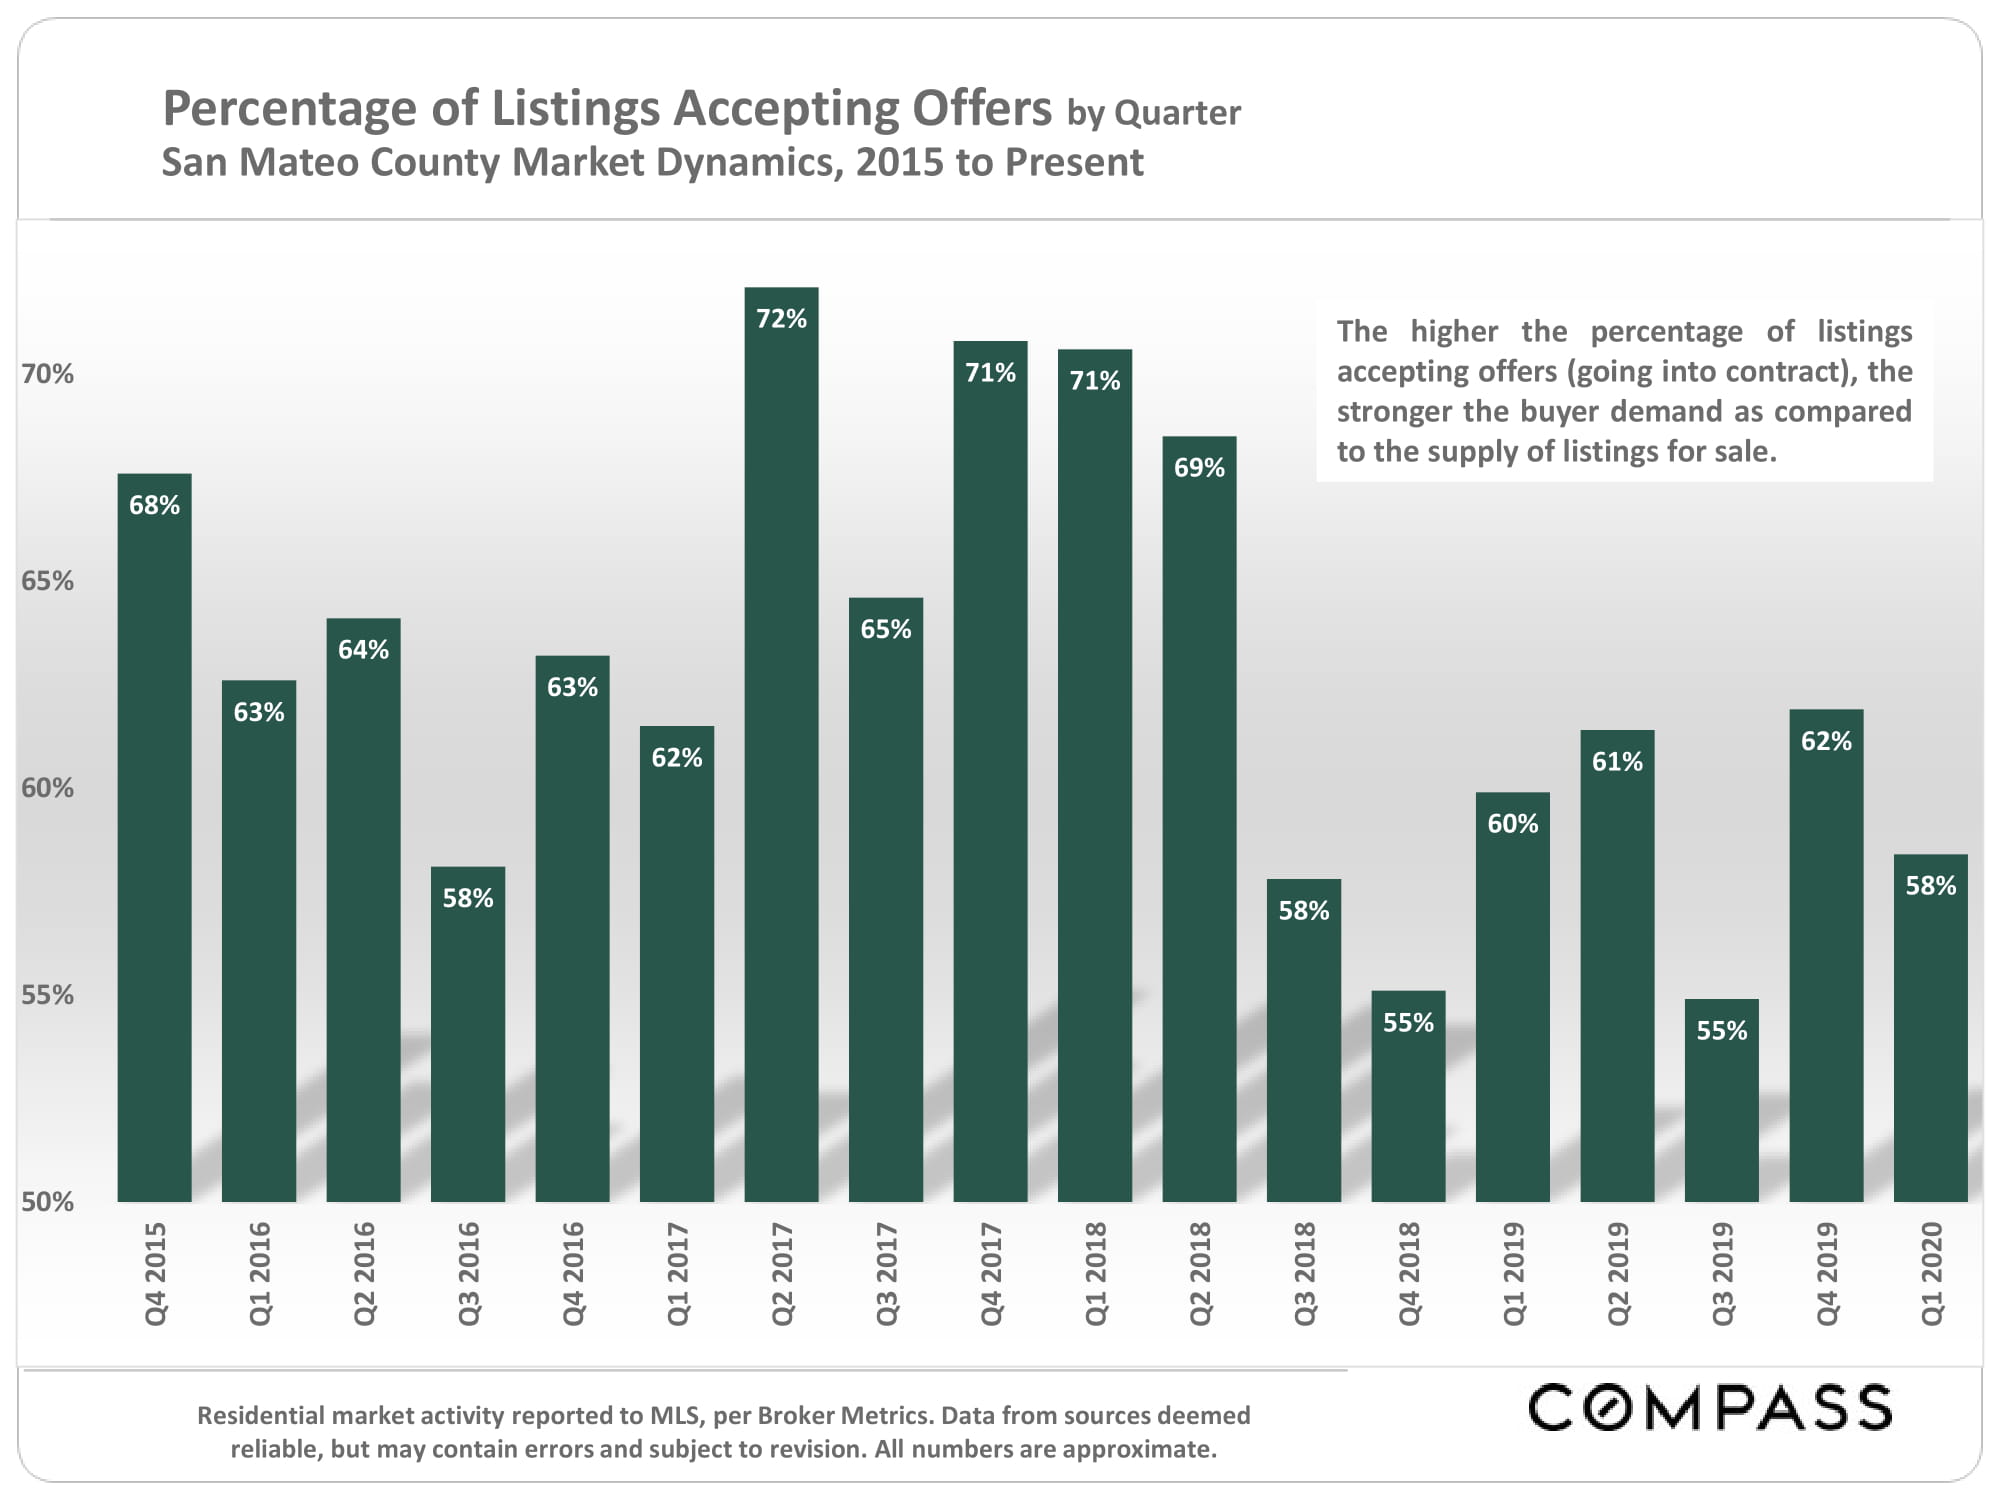
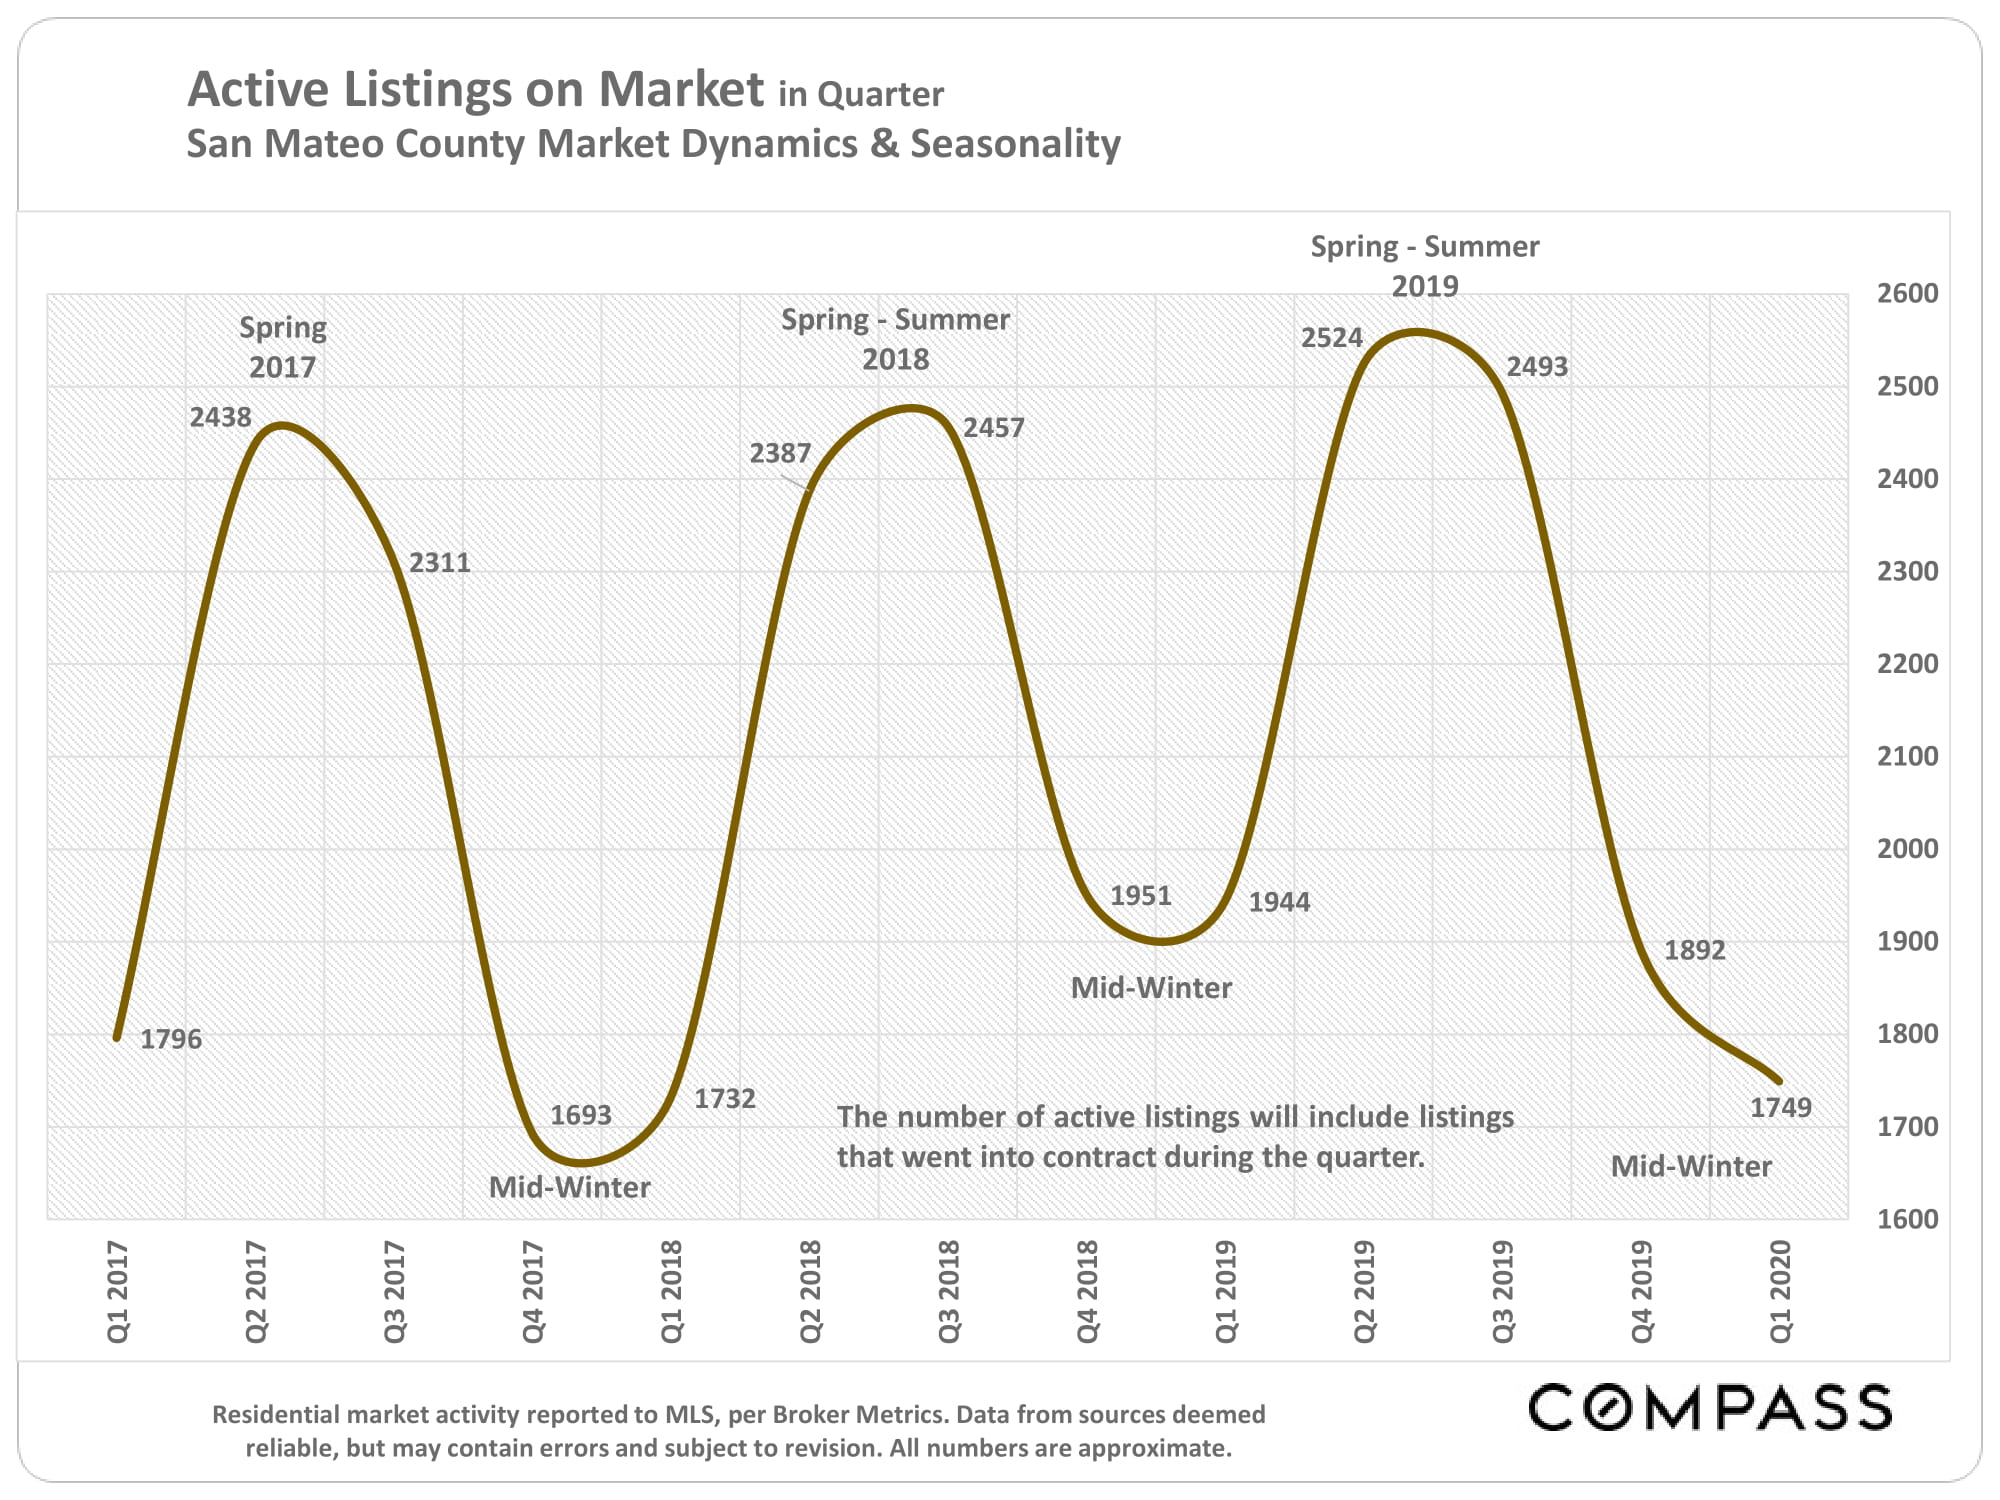
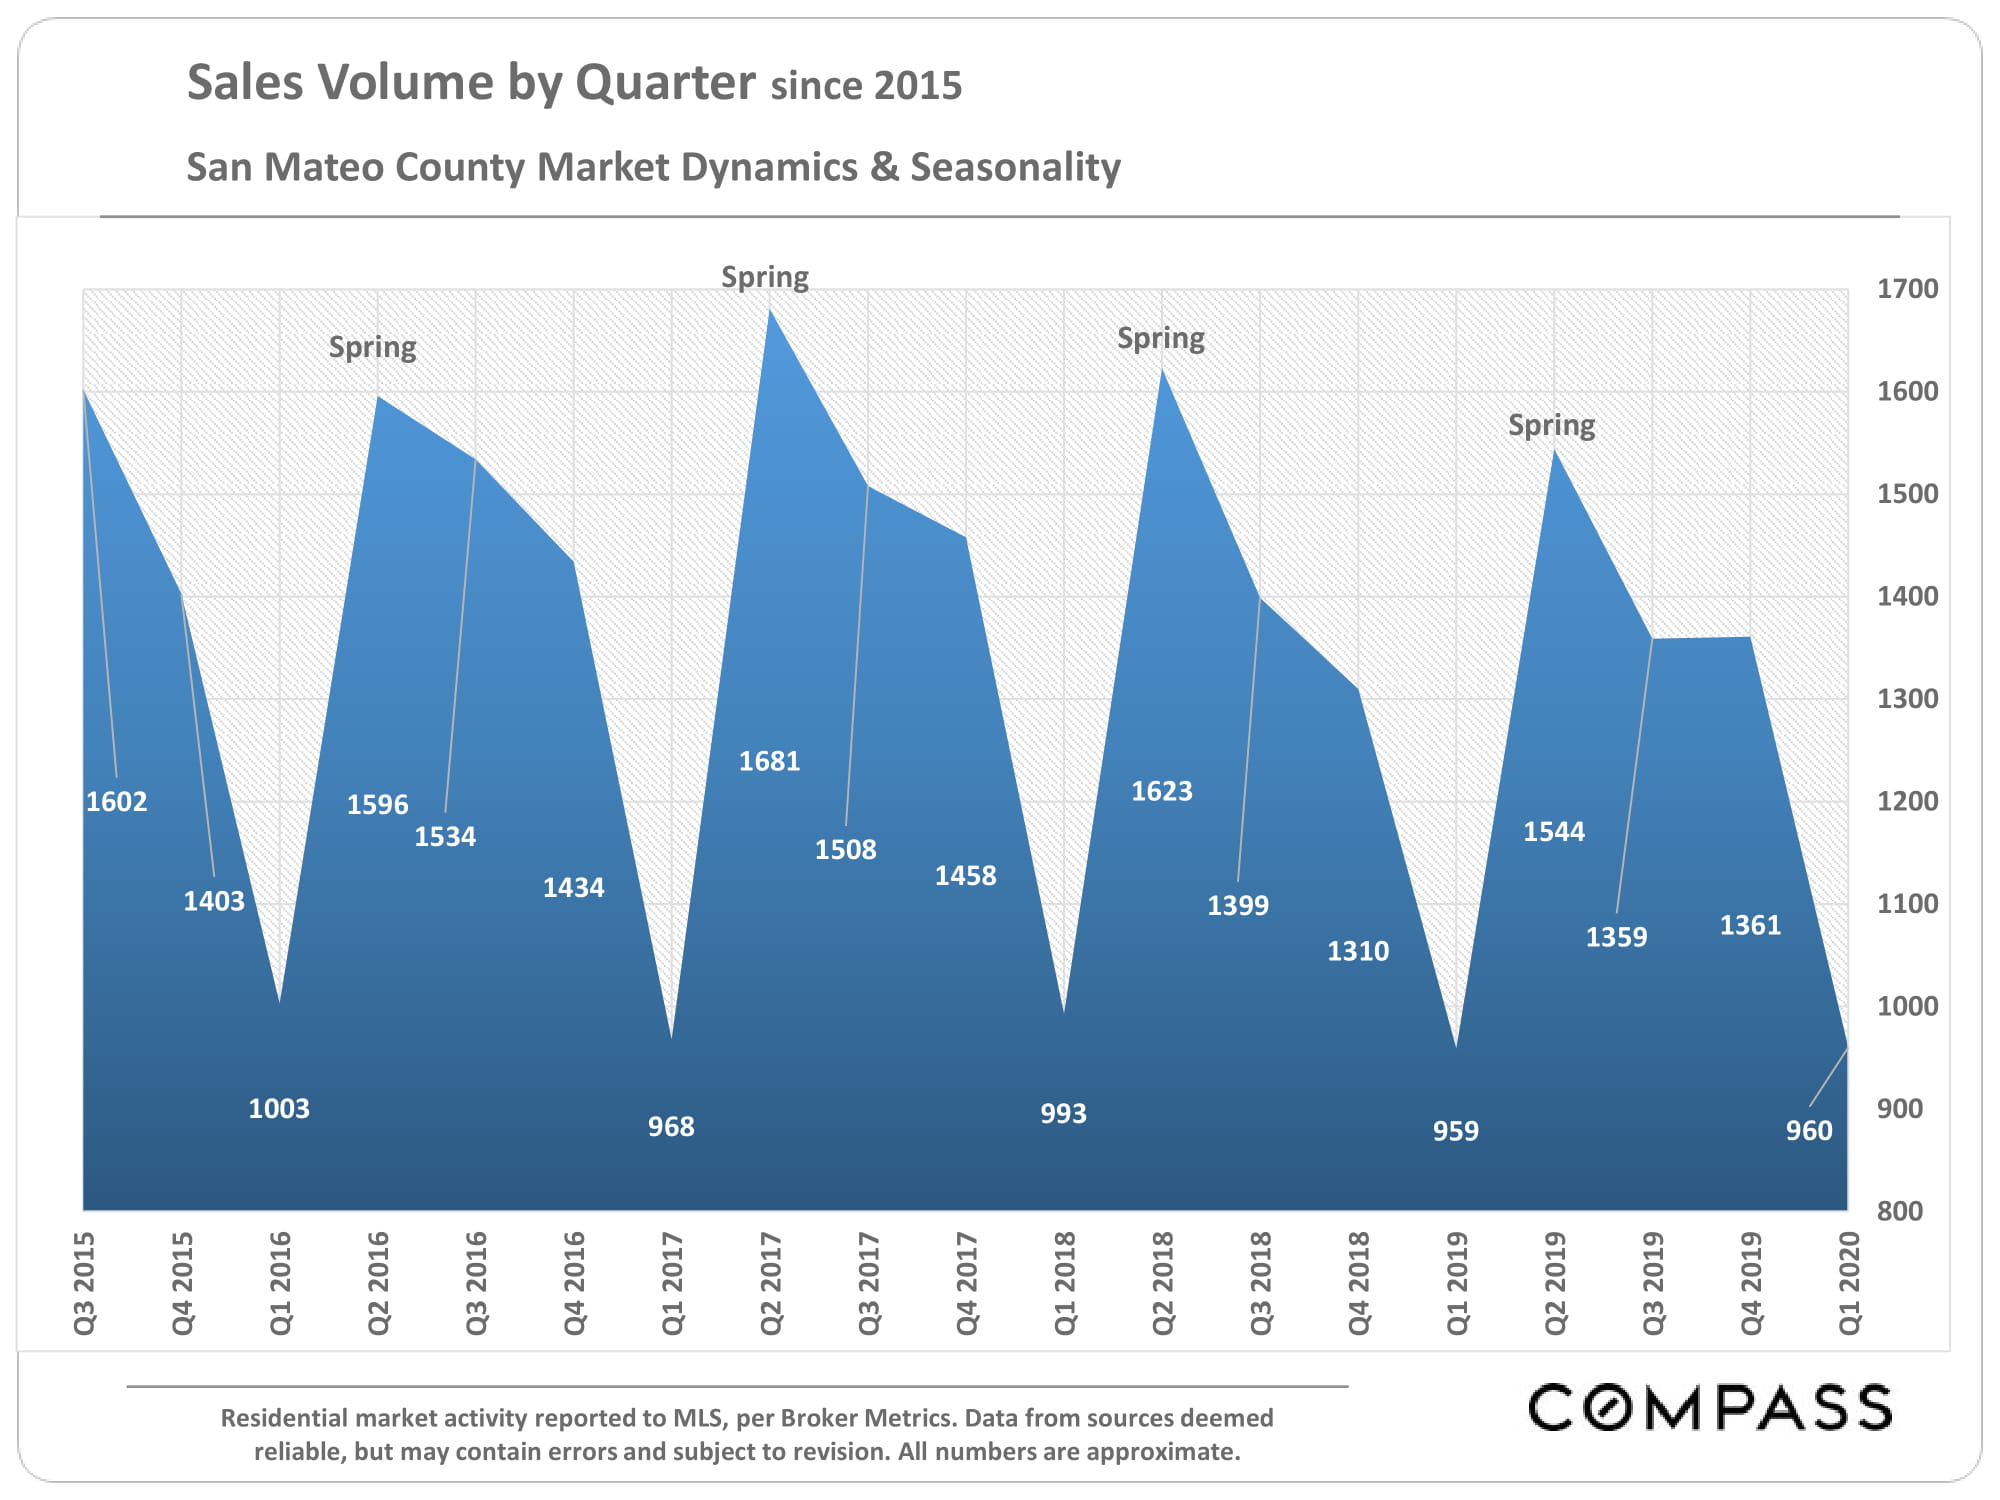
San Mateo County Quarterly Statistics, May 2020

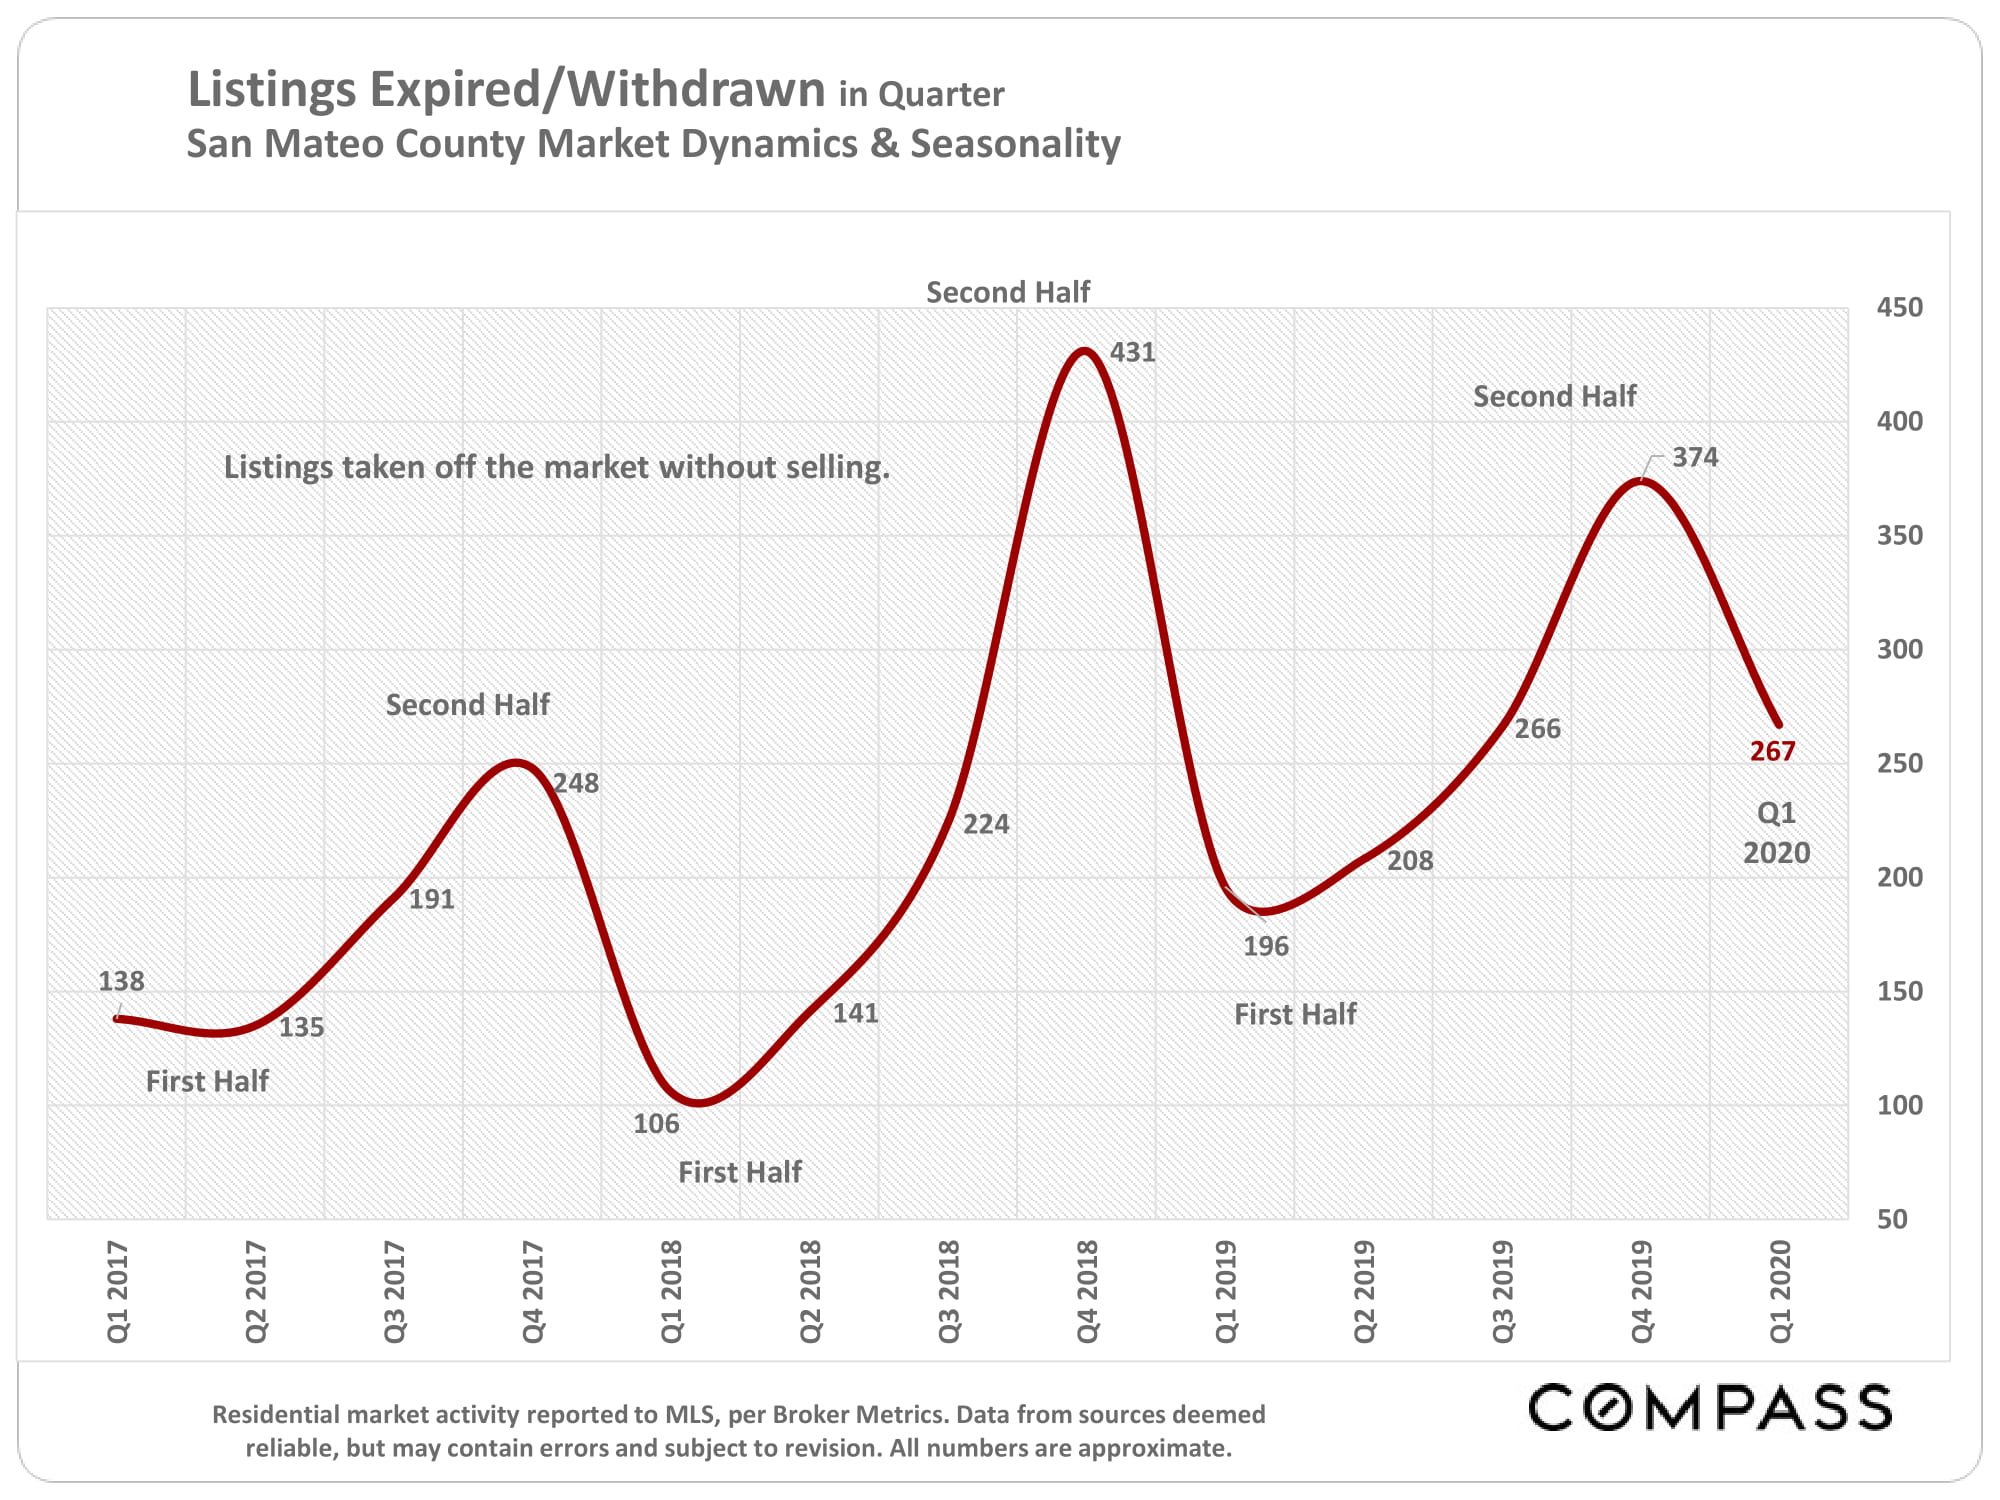
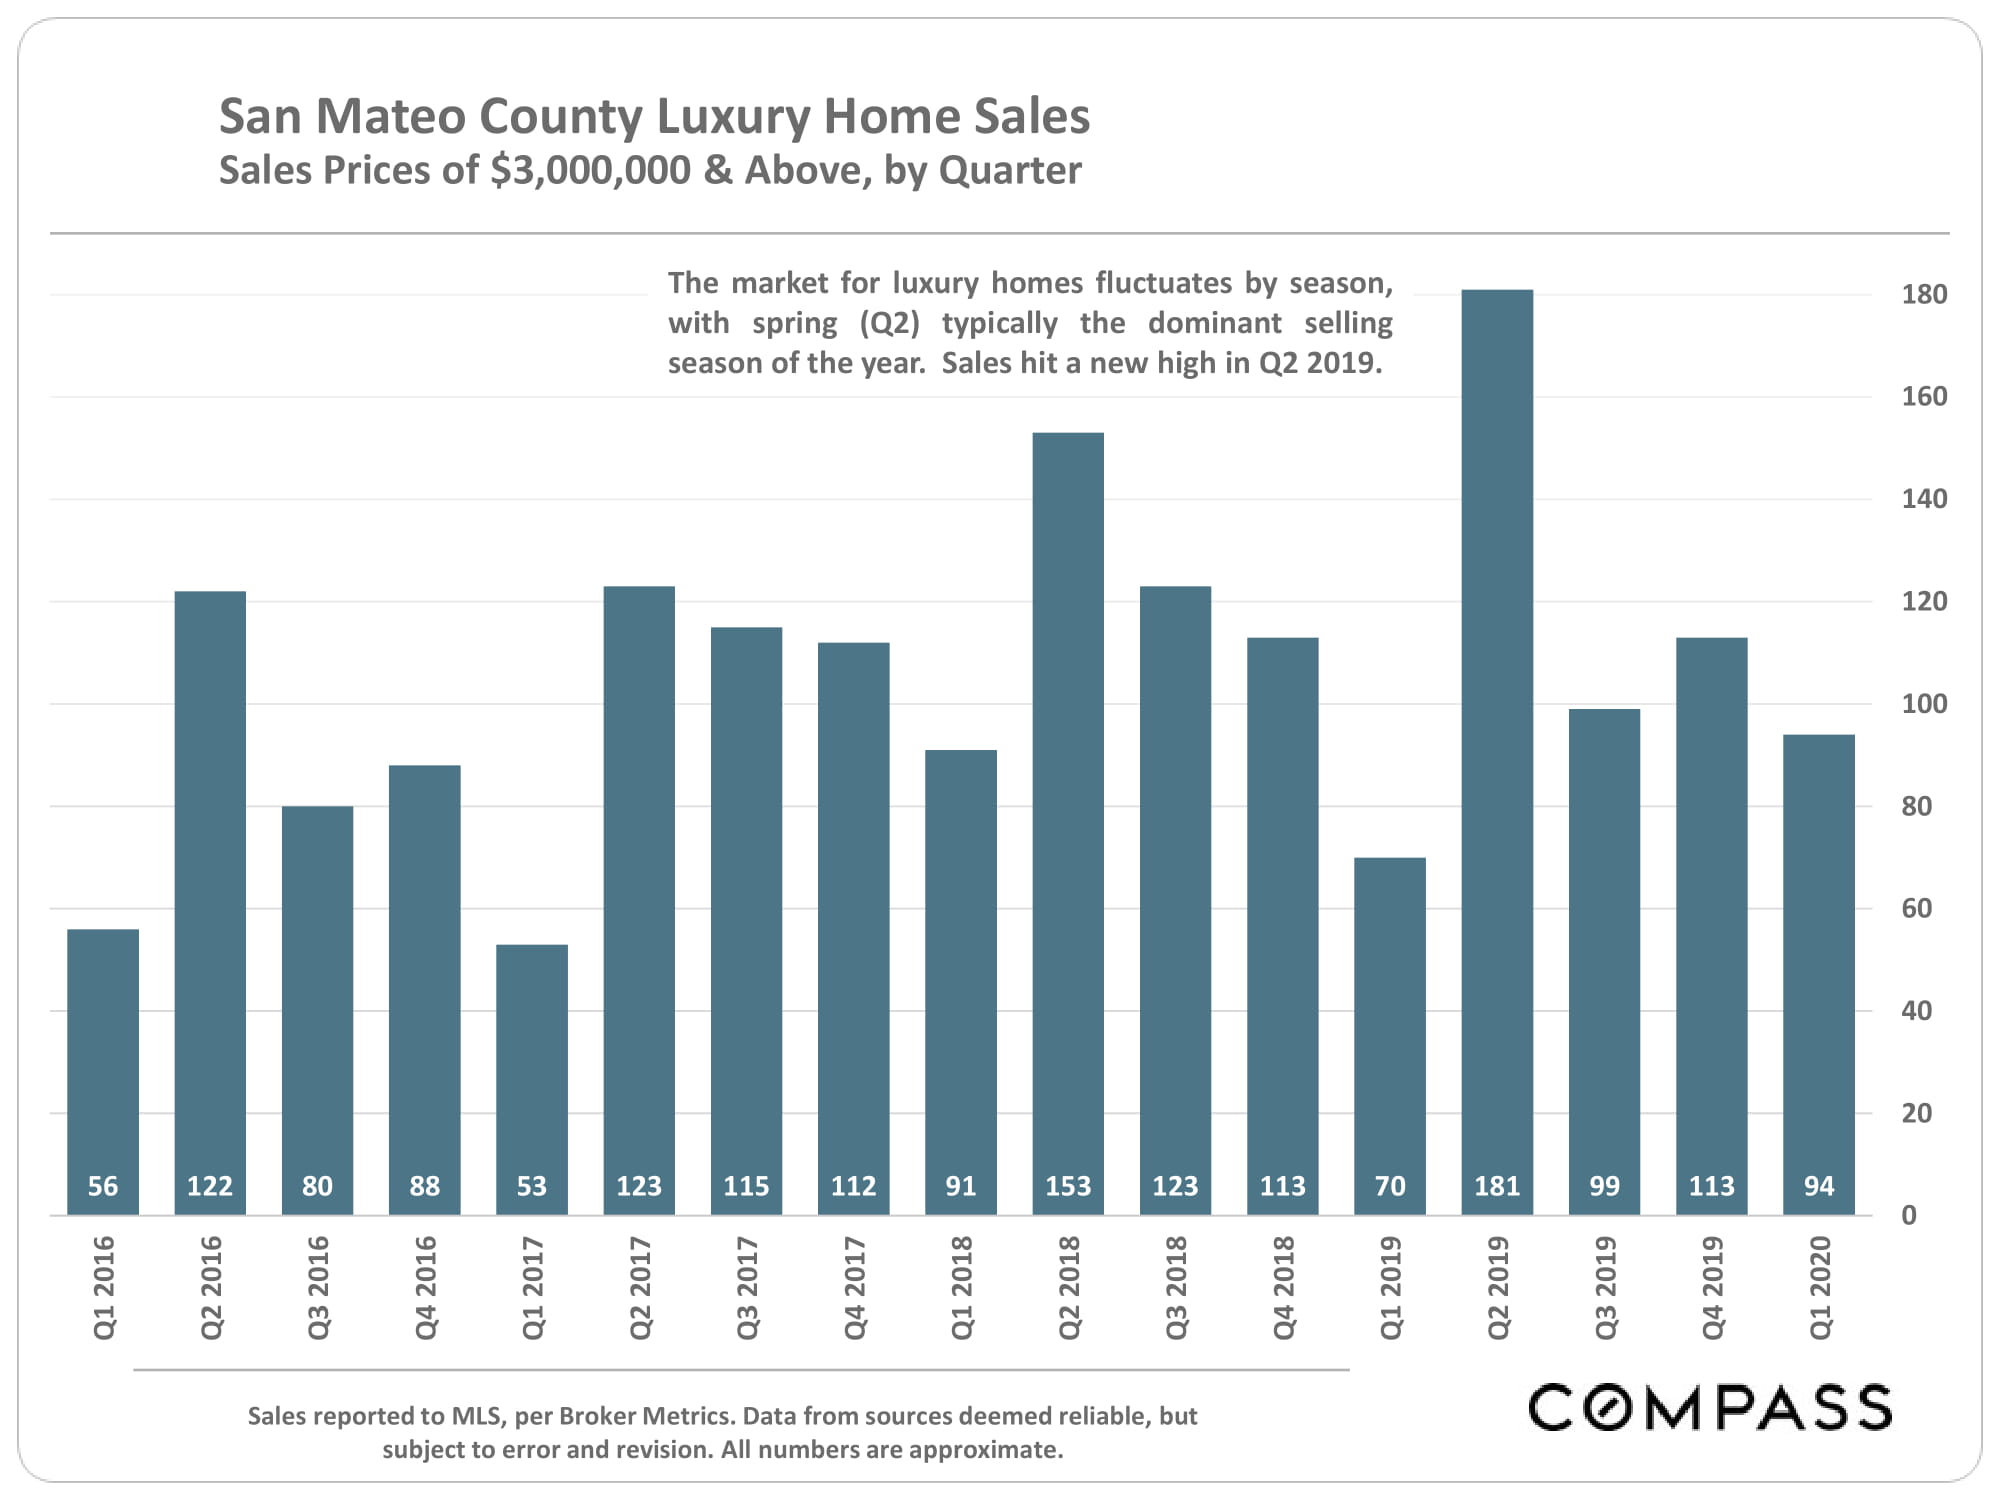
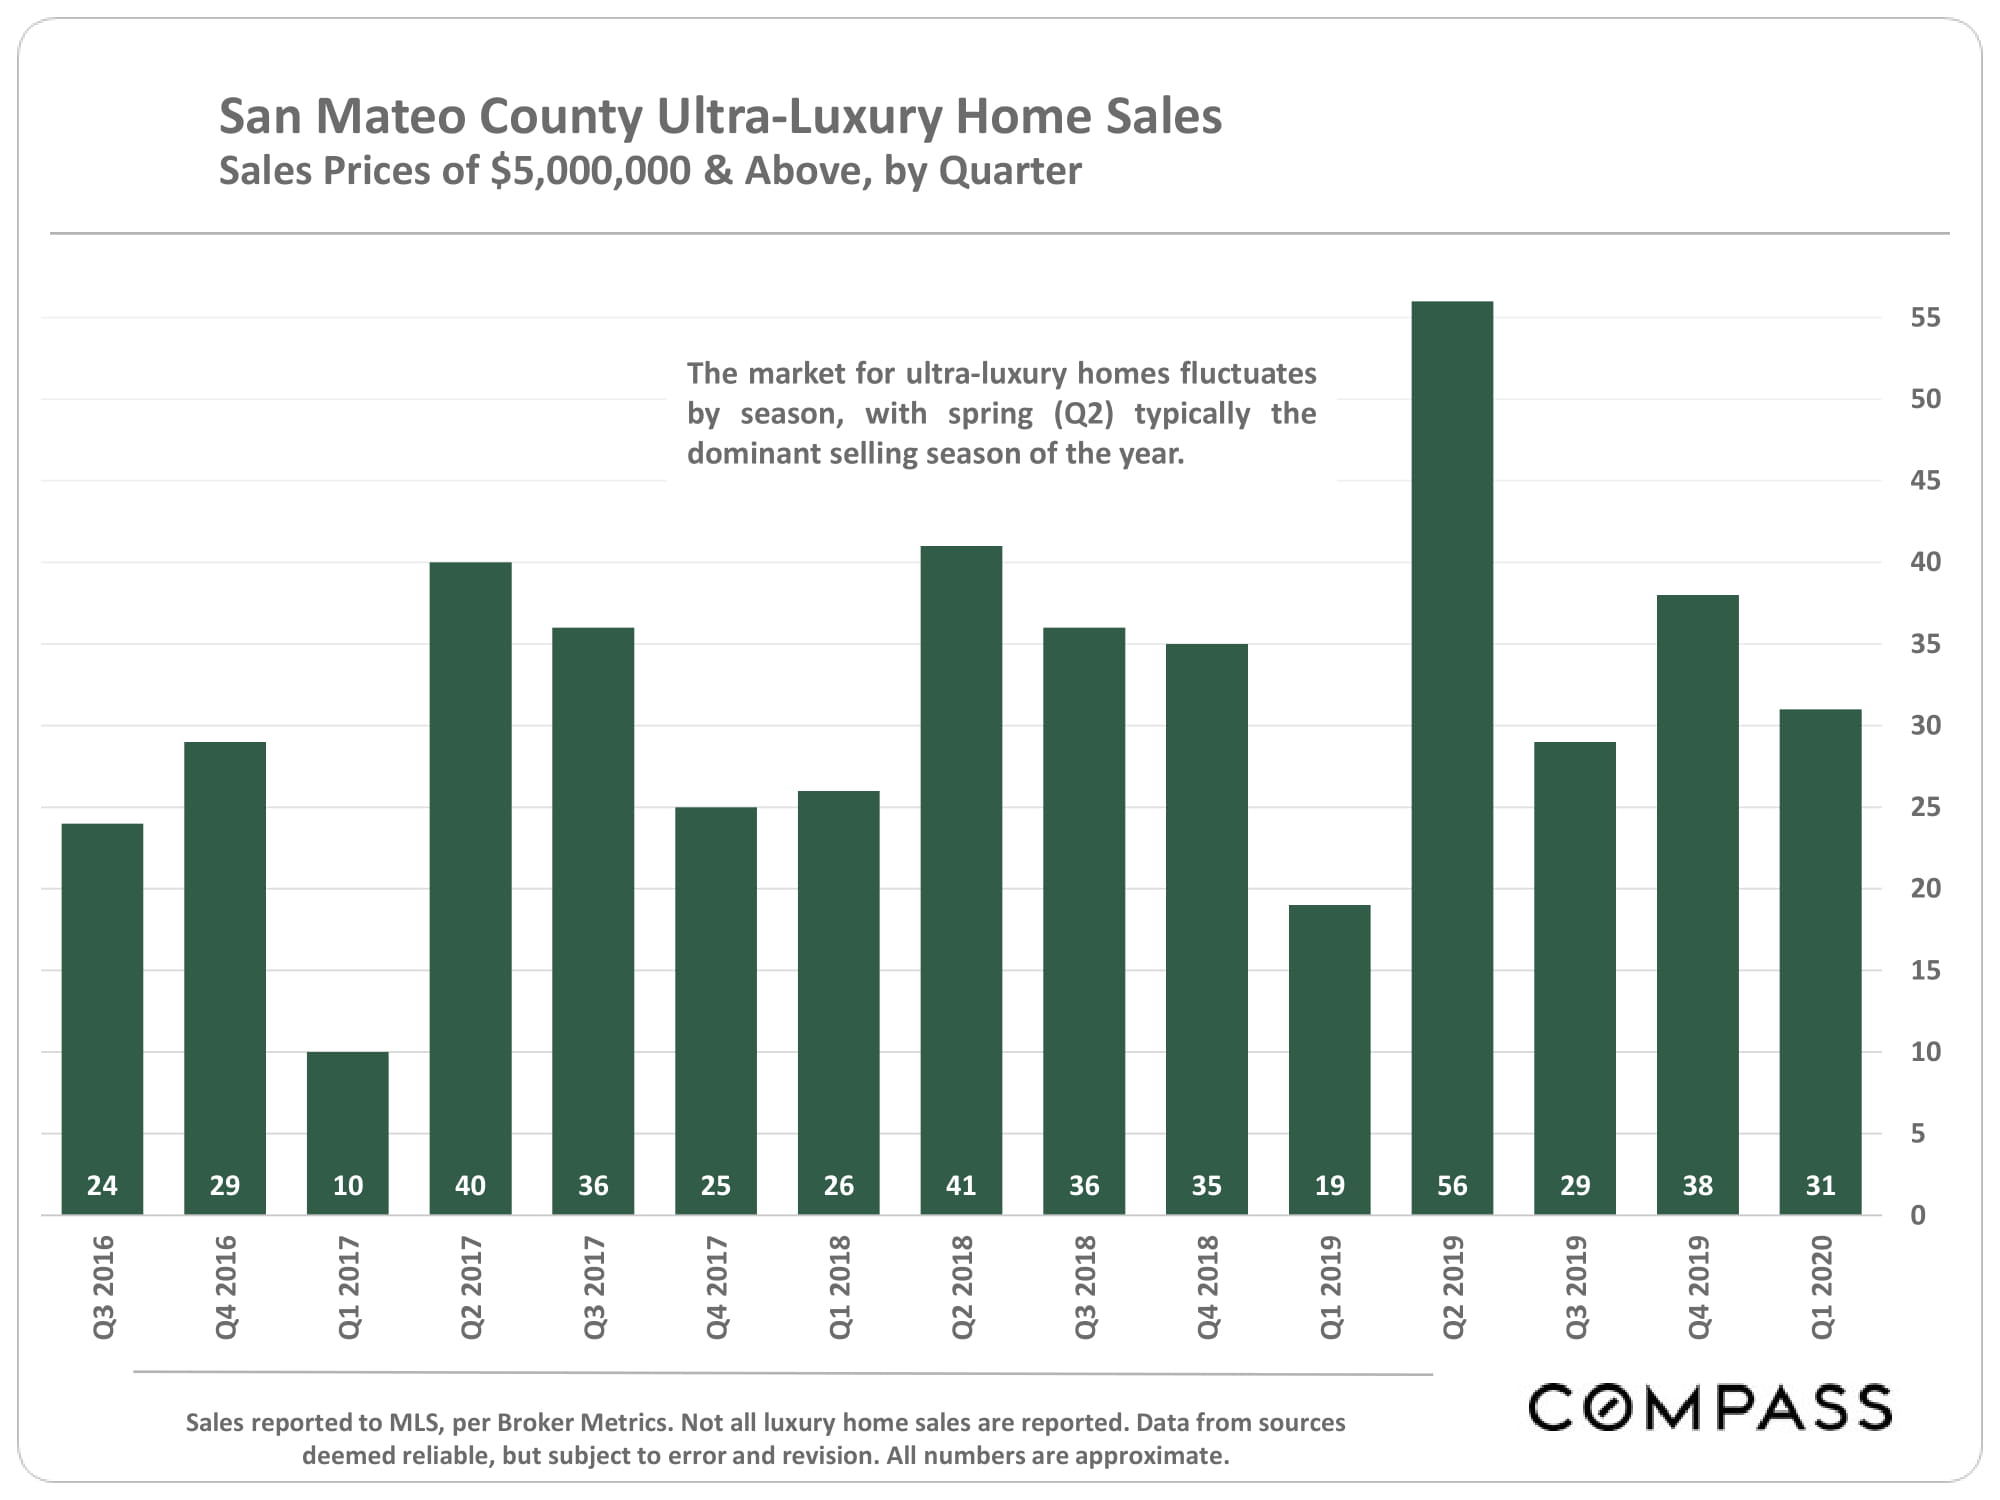
Market indicators are often seasonal in nature, with Q2 typically being the period of highest demand, and the mid-winter holiday period being the period of lowest activity.

Since the coronavirus didn’t really start impacting most markets until early-mid March, and because of the lag time between an offer being accepted on a listing and it closing escrow, the effect of the crisis on Q1 2020 statistics was limited. For more insight into how the crisis is affecting our real estate market, see our weekly trends report.

Data from sources deemed reliable, but may contain errors and subject to revision. All numbers to be considered approximate.

Source: Compass

It is impossible to know how median and average value statistics apply to any particular home without a specific comparative market analysis. Many factors affect sales prices besides neighborhood/ bedroom count: quality of location within the neighborhood, condition, size,architecture,views, amenities,parking,outdoor space, etc.

These analyses were made in good faith with data from sources deemed reliable, but may contain errors and are subject to revision. It is not our intent to convince you of a particular position,but to attempt to provide straightforward data and analysis, so you can make your own informed decisions. Median and average statistics are enormous generalities: There are hundreds of different markets in San Francisco and the Bay Area, each with its own unique dynamics. Median prices and average dollar per square foot values can be and often are affected by other factors besides changes in fair market value. Longer term trends are much more meaningful than short-term.

Compass is a real estate broker licensed by the State of California, DRE 01527235. Equal Housing Opportunity. This report has been prepared solely for information purposes. The information herein is based on or derived from information generally available to the public and/or from sources believed to be reliable. No representation or warranty can be given with respect to the accuracy or completeness of the information. Compass disclaims any and all liability relating to this report, including without limitation any express or implied representations or warranties for statements contained in, and omissions from, the report. Nothing contained herein is intended to be or should be read as any regulatory, legal, tax, accounting or other advice and Compass does not provide such advice. All opinions are subject to change without notice. Compass makes no representation regarding the accuracy of any statements regarding any references to the laws, statutes or regulations of any state are those of the author(s). Past performance is no guarantee of future results.

Santa Clara County Real Estate, April 2020

Source: Compass

It is impossible to know how median and average value statistics apply to any particular home without a specific comparative market analysis. These analyses were made in good faith with data from sources deemed reliable, but may contain errors and are subject to revision. It is not our intent to convince you of a particular position, but to attempt to provide straightforward data and analysis, so you can make your own informed decisions. Median and average statistics are enormous generalities: There are hundreds of different markets in San Francisco and the Bay Area, each with its own unique dynamics. Median prices and average dollar per square foot values can be and often are affected by other factors besides changes in fair market value. Longer term trends are much more meaningful than short-term.

Compass is a real estate broker licensed by the State of California, DRE 01527235. Equal Housing Opportunity. This report has been prepared solely for information purposes. The information herein is based on or derived from information generally available to the public and/or from sources believed to be reliable. No representation or warranty can be given with respect to the accuracy or completeness of the information. Compass disclaims any and all liability relating to this report, including without limitation any express or implied representations or warranties for statements contained in, and omissions from, the report. Nothing contained herein is intended to be or should be read as any regulatory, legal, tax, accounting or other advice and Compass does not provide such advice. All opinions are subject to change without notice. Compass makes no representation regarding the accuracy of any statements regarding any references to the laws, statutes or regulations of any state are those of the author(s). Past performance is no guarantee of future results.

Skip to content