 |
 |
 |
 |
 |
 |
 |
 |
 |
 |
 |
 |
 |
 |
 |
 |
 |
 |
 |
 |
 |
 |
 |
 |
 |
 |
 |
 |
 |
 |
 |
 |
 |
 |
|
It is impossible to know how median and average value statistics apply to any particular home without a specific comparative market analysis. These analyses were made in good faith with data from sources deemed reliable, but may contain errors and are subject to revision. It is not our intent to convince you of a particular position, but to attempt to provide straightforward data and analysis, so you can make your own informed decisions. Median and average statistics are enormous generalities: There are hundreds of different markets in San Francisco and the Bay Area, each with its own unique dynamics. Median prices and average dollar per square foot values can be and often are affected by other factors besides changes in fair market value. Longer term trends are much more meaningful than short-term.
Compass is a real estate broker licensed by the State of California, DRE 01527235. Equal Housing Opportunity. This report has been prepared solely for information purposes. The information herein is based on or derived from information generally available to the public and/or from sources believed to be reliable. No representation or warranty can be given with respect to the accuracy or completeness of the information. Compass disclaims any and all liability relating to this report, including without limitation any express or implied representations or warranties for statements contained in, and omissions from, the report. Nothing contained herein is intended to be or should be read as any regulatory, legal, tax, accounting or other advice and Compass does not provide such advice. All opinions are subject to change without notice. Compass makes no representation regarding the accuracy of any statements regarding any references to the laws, statutes or regulations of any state are those of the author(s). Past performance is no guarantee of future results.
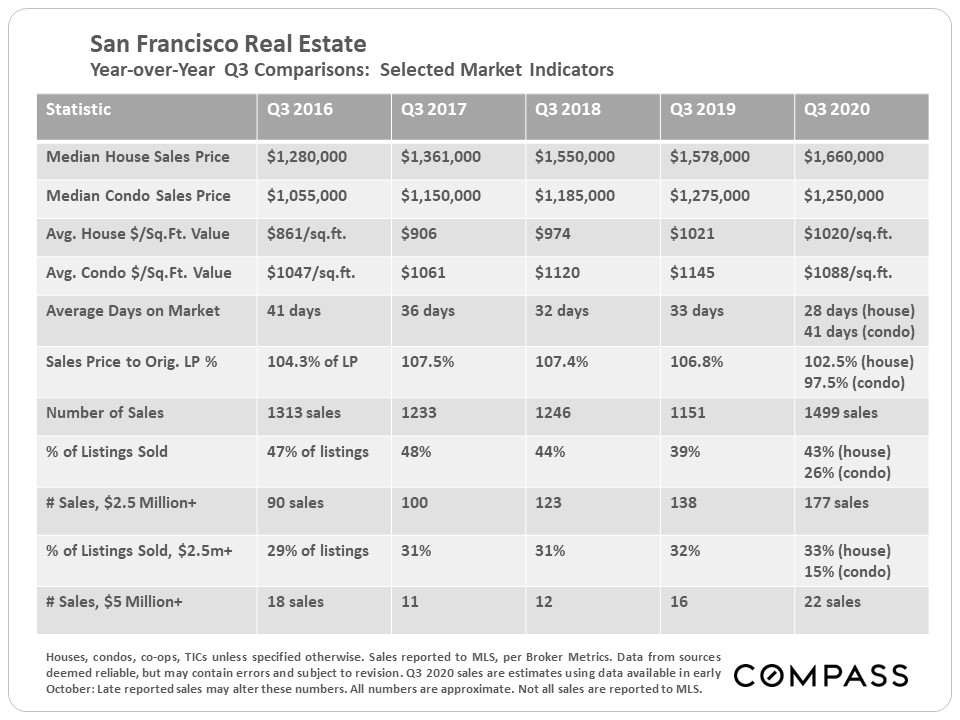
| The table below compares Q3 statistics across 5 years. Since the dynamics of the SF house and condo markets have significantly diverged since the pandemic struck – the condo market has been weaker – we broke some of the 2020 stats out separately in the table, and then in some of the charts following.
|
 |
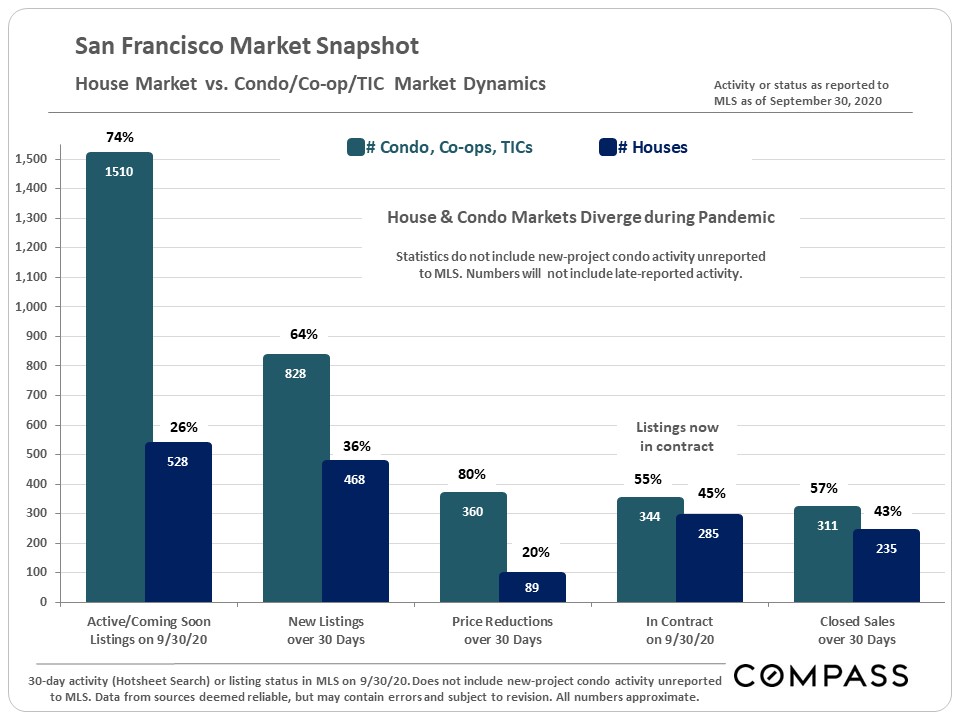
The inventory of condo listings on the market has been soaring, and price reductions are heavily concentrated in the condo market. Hundreds are still selling each month and that number has been rebounding in the last couple months – but increases in supply continue to outpace demand. Within the condo market, the high-rise segment appears to be the weakest, almost certainly due to pandemic-related reasons.
|
 |
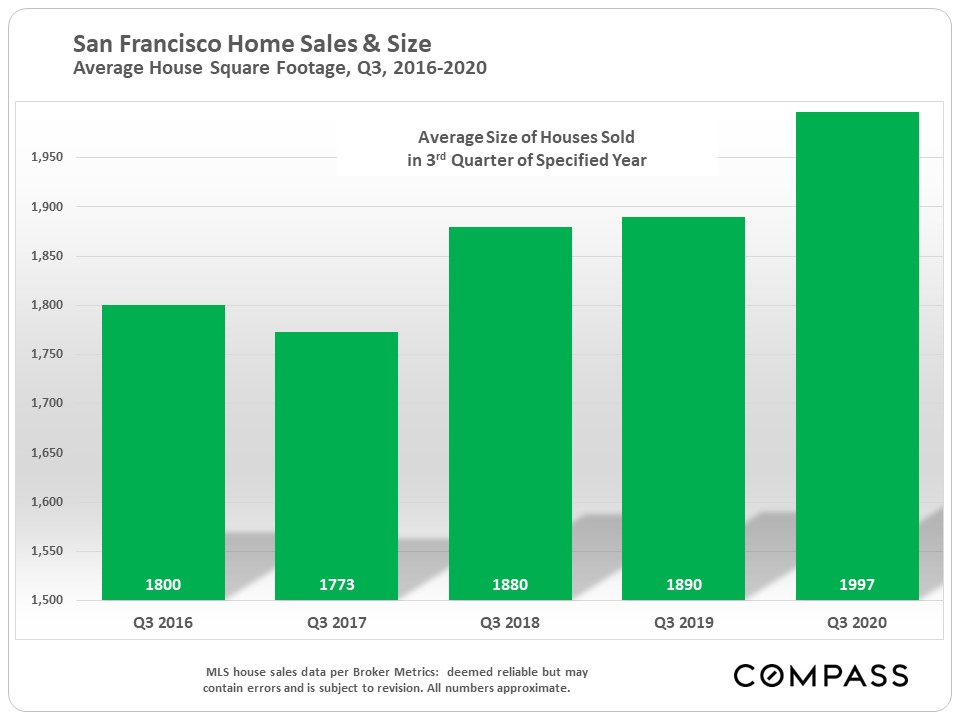
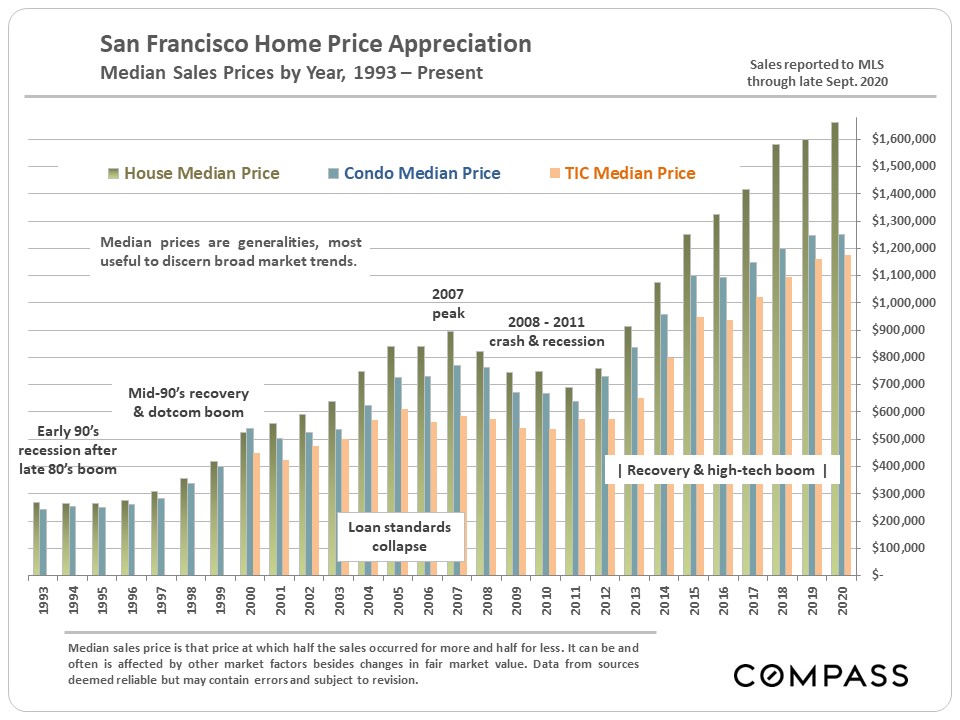
Median sales prices can rise because of increases in fair market value – i.e. buyers are paying more money for the same home (supply and demand) – and/or because buyers are purchasing larger or more expensive houses. Affluent and very affluent buyers are an increasing percentage of the total market throughout the Bay Area. In San Francisco, the average size of houses sold in Q3 jumped almost 6% year over year.
|
 |
Long-Term Trends in Median Sales Prices through YTD 2020
|
 |
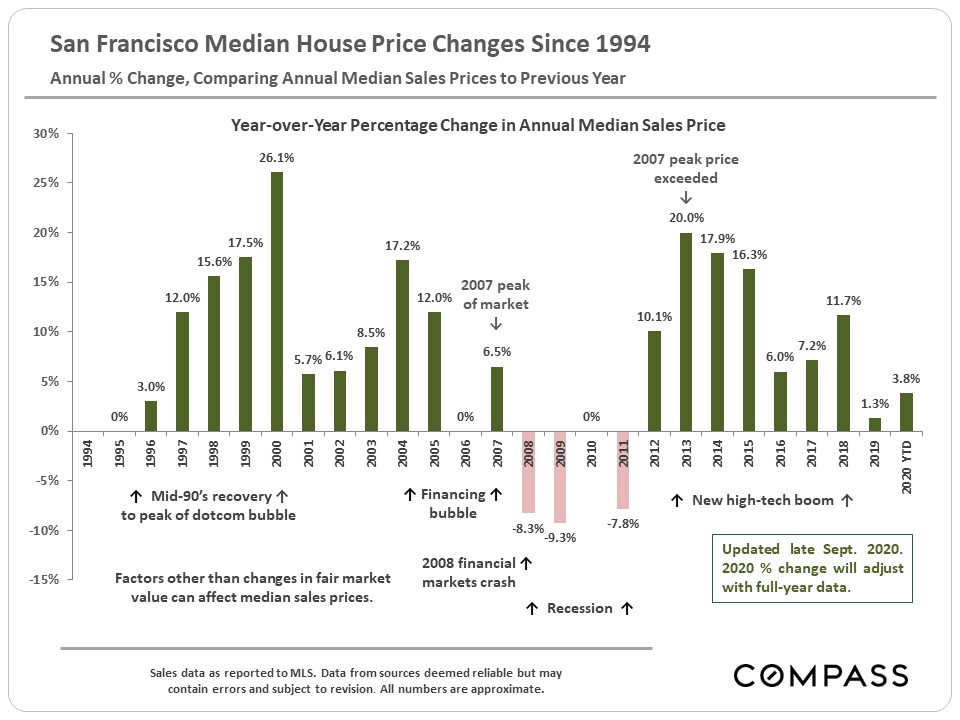
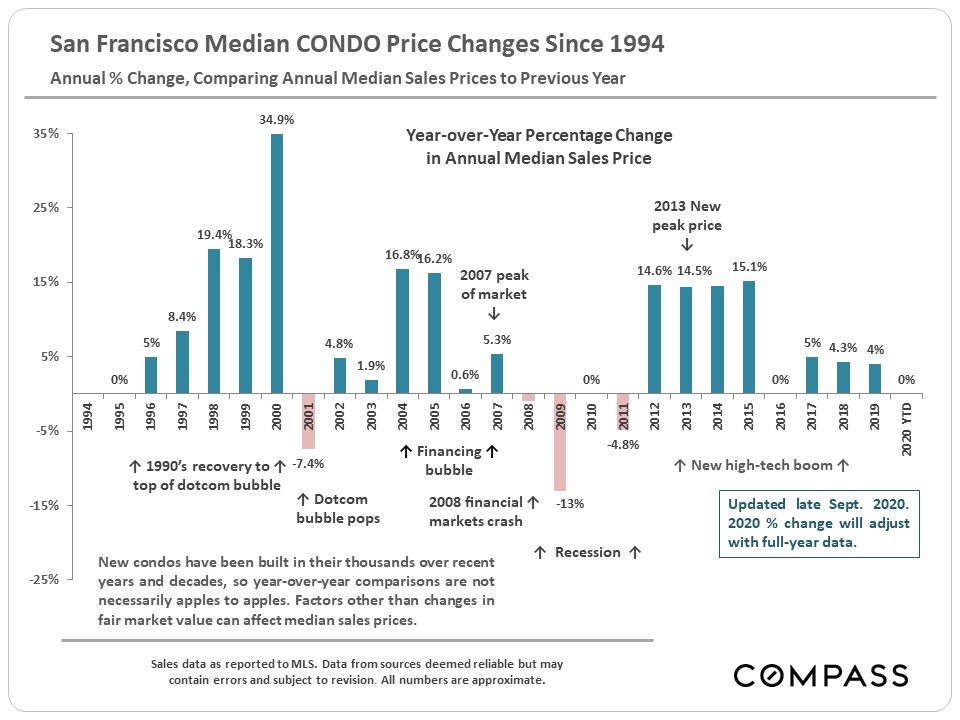
Annual Percentage Changes in Median Sales Prices through YTD 2020
|
We have been getting many questions on annual percentages up and down in median sales prices, so we updated the following 2 charts. The 2020 YTD percentage will almost certainly change, one way or another, by the time full-year sales data is in.
|
 |
 |
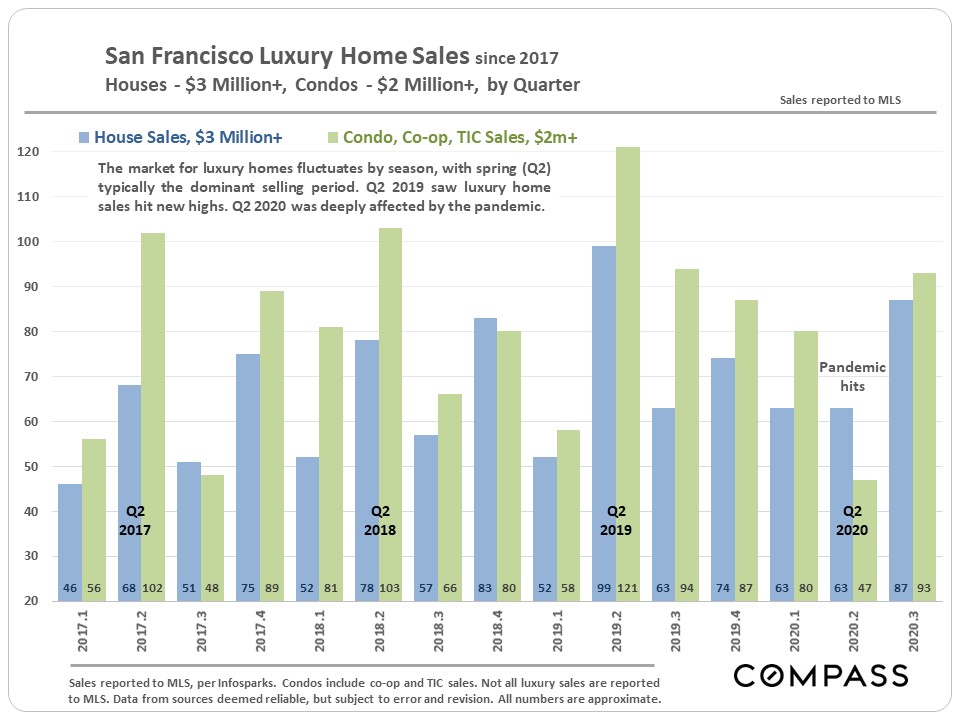
Luxury Home Sales by Quarter
|
Q2 is typically the strongest selling season for luxury homes, but the pandemic changed that dynamic in 2020. Though the SF luxury segment recovered in Q3, in many other counties around the Bay, luxury home sales have soared to all-time highs.
|
 |
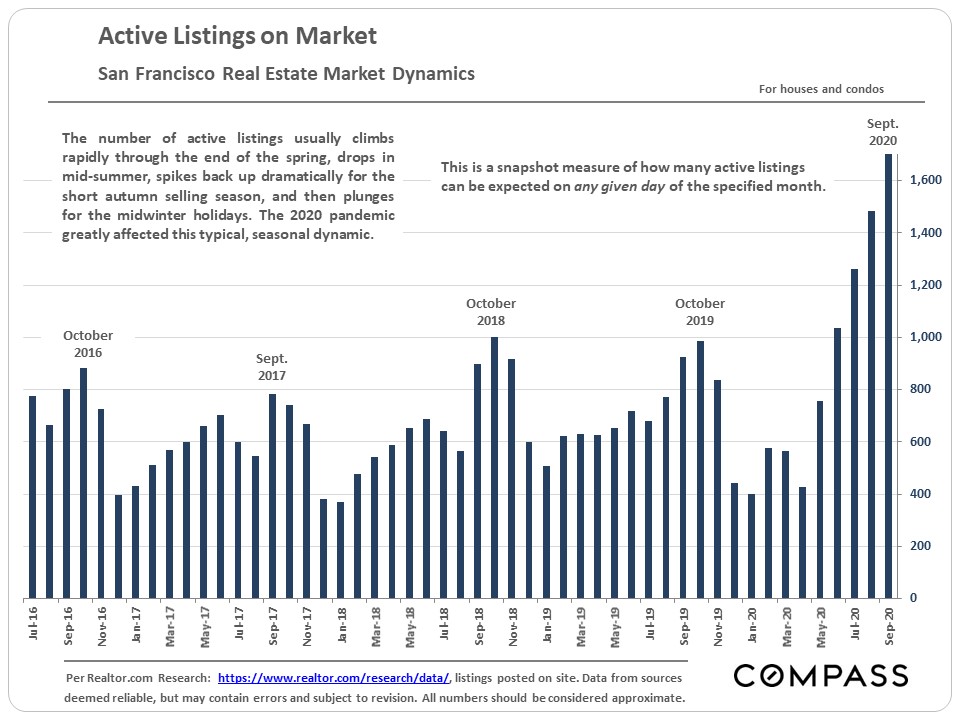
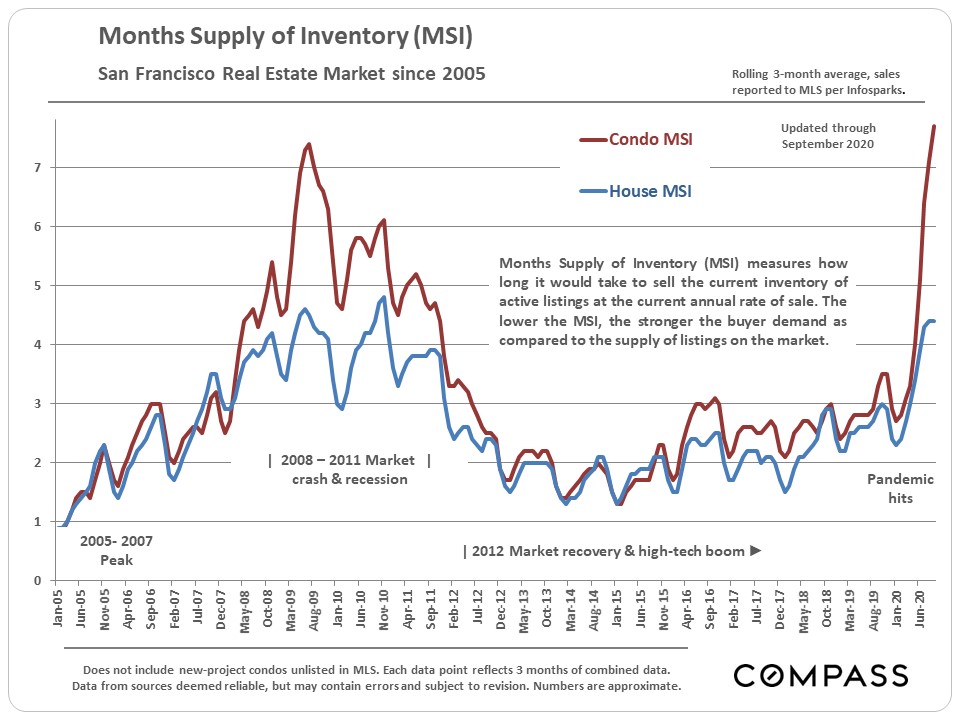
Active inventory has been surging in recent months (first chart below), as has the months supply of inventory (second chart). As mentioned before, the supply of condos for sale is currently dominating SF inventory.
|
 |
 |
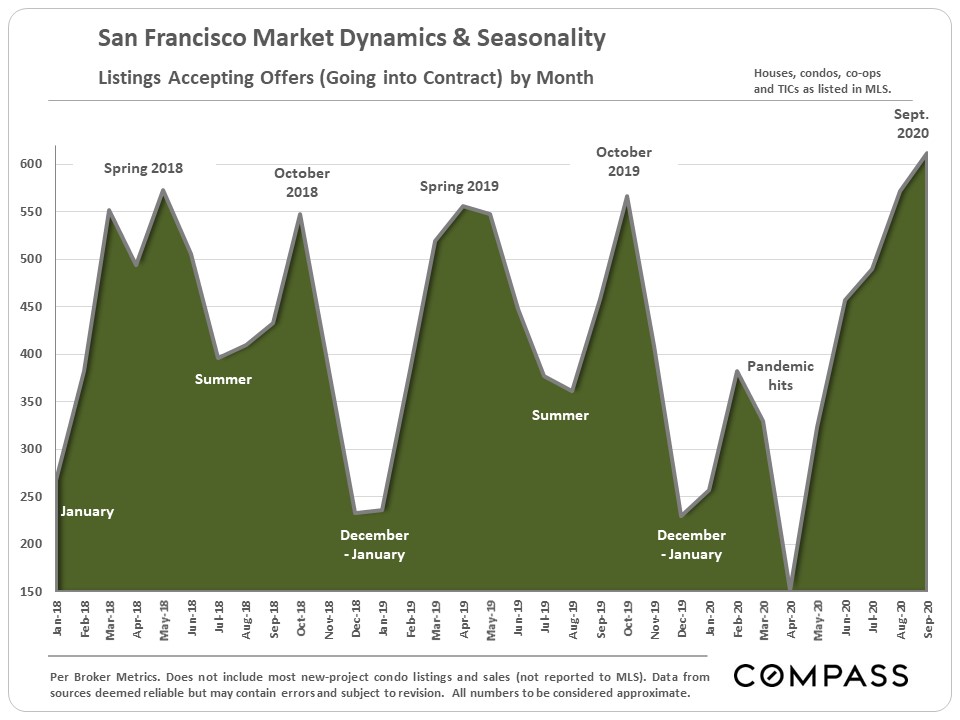
Even if supply is outpacing demand, more listings went into contract in September than in any month in the last 2 years.
|
 |
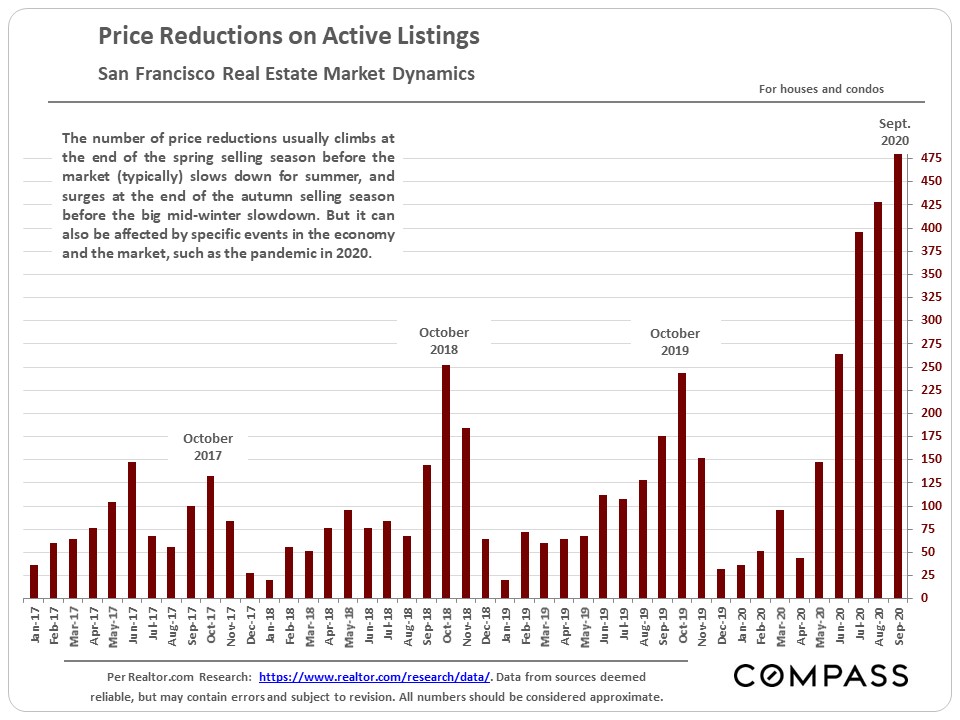
But the number of price reductions – again heavily concentrated in the condo market – has jumped to its highest point in many years. In certain segments, sellers are now competing for buyers, instead of buyers competing for listings.
|
 |
Median House & Condo Sales Price Trends by District
|
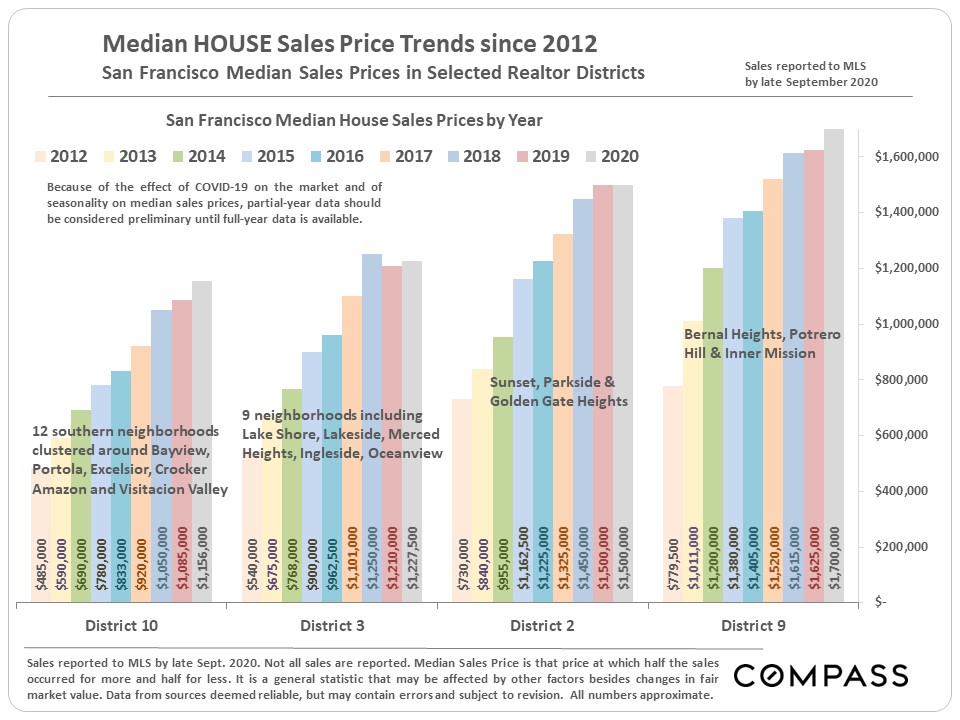
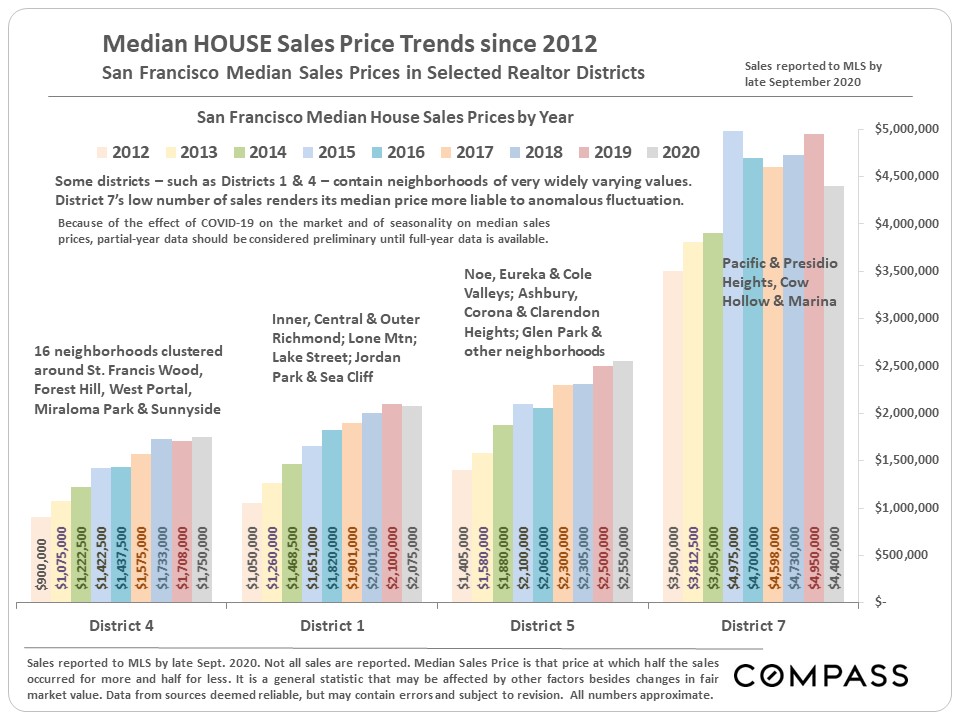
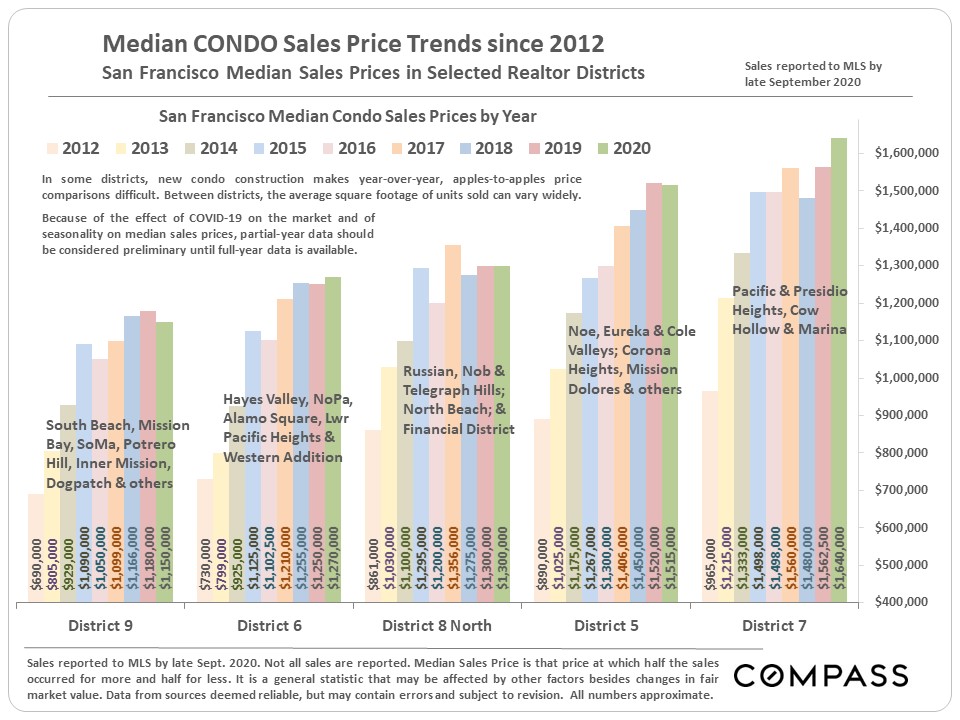
The 3 charts below are focused on the districts in which the greatest number of house or condo sales occur. The first 2 refer to house sales and the third to condo sales.
|
 |
 |
 |
In September, we also updated our semi-annual Survey of Bay Area markets.
|
It is impossible to know how median and average value statistics apply to any particular home without a specific comparative market analysis. These analyses were made in good faith with data from sources deemed reliable, but may contain errors and are subject to revision. It is not our intent to convince you of a particular position, but to attempt to provide straightforward data and analysis, so you can make your own informed decisions. Median and average statistics are enormous generalities: There are hundreds of different markets in San Francisco and the Bay Area, each with its own unique dynamics. Median prices and average dollar per square foot values can be and often are affected by other factors besides changes in fair market value. Longer term trends are much more meaningful than short-term.
Compass is a real estate broker licensed by the State of California, DRE 01527235. Equal Housing Opportunity. This report has been prepared solely for information purposes. The information herein is based on or derived from information generally available to the public and/or from sources believed to be reliable. No representation or warranty can be given with respect to the accuracy or completeness of the information. Compass disclaims any and all liability relating to this report, including without limitation any express or implied representations or warranties for statements contained in, and omissions from, the report. Nothing contained herein is intended to be or should be read as any regulatory, legal, tax, accounting or other advice and Compass does not provide such advice. All opinions are subject to change without notice. Compass makes no representation regarding the accuracy of any statements regarding any references to the laws, statutes or regulations of any state are those of the author(s). Past performance is no guarantee of future results.
|
San Francisco Real Estate Market Rebounds Dramatically |
|
Median house sales price hits new monthly high July 2020 report |
|
Despite the ongoing health and economic crisis precipitated by COVID-19, the SF real estate market made a large recovery from the steep declines in March and April. The SF median house price hit a new monthly high in June ($1,800,000), and high-end houses, in particular, have seen very strong demand – this applies to virtually every market in the Bay Area. More affluent buyers – the demographic least affected by COVID-19, unemployment, and also having the greatest financial resources – have been jumping back into the market to a greater degree than other segments. The condo market has been weaker than the house market, as measured by both supply and demand metrics and median sales price. It may be that prospective condo buyers – often younger and less affluent than house owners – have been more affected by the huge jump in unemployment. The first chart below illustrates the big rebound in buyer demand, as the number of listings accepting offers in June 2020 rose slightly higher on a year-over-year basis. Of course, closed-sales volume – a lagging indicator – was hammered in Q2 by shelter in place.
|
 |
|
High-end sales staged a particularly strong recovery, reaching a new high as a percentage of total sales. This is one of the factors behind the median house sales price hitting a new peak in June. |
 |
 |
|
As illustrated below, the house market (blue line) has performed much better than the condo market (purple line). |
 |
|
Three angles on median home sales price movements – annual, monthly and quarterly. While the median house price has hit a new peak, the median condo price has declined from its 2019 high. |
 |
 |
 |
|
Average days on market remained relatively low in Q2, though higher than Q2 in 2018 and 2019. |
 |
|
The average overbidding percentage declined to zero in Q2 as showing procedures and the offer-making process have been severely affected by shelter in place. |
 |
|
The Bay Area markets with the largest year-over-year increases in the number of listings accepting offers in June 2020 were the 4 outer Bay Area counties of Monterey (up 61%), Santa Cruz (58%), Sonoma (47%) and Napa (37%). They also have among the lowest population densities in the Bay Area. The more urban counties saw more modest y-o-y increases: San Francisco (6%) and Alameda (7%). Other factors may play a role in this: length/strictness of shelter-in-place rules, home price differences, second-home buying patterns, and so on.
|
 |
|
A review of annual and 2020 YTD median home sales prices in some of the largest districts in San Francisco. Changes in median sales price are not perfect indicators of changes in fair market value, as it can be affected by a number of other factors. |
 |
 |
 |
It is impossible to know how median and average value statistics apply to any particular home without a specific comparative market analysis. These analyses were made in good faith with data from sources deemed reliable, but may contain errors and are subject to revision. It is not our intent to convince you of a particular position, but to attempt to provide straightforward data and analysis, so you can make your own informed decisions. Median and average statistics are enormous generalities: There are hundreds of different markets in San Francisco and the Bay Area, each with its own unique dynamics. Median prices and average dollar per square foot values can be and often are affected by other factors besides changes in fair market value. Longer term trends are much more meaningful than short-term.
Compass is a real estate broker licensed by the State of California, DRE 01527235. Equal Housing Opportunity. This report has been prepared solely for information purposes. The information herein is based on or derived from information generally available to the public and/or from sources believed to be reliable. No representation or warranty can be given with respect to the accuracy or completeness of the information. Compass disclaims any and all liability relating to this report, including without limitation any express or implied representations or warranties for statements contained in, and omissions from, the report. Nothing contained herein is intended to be or should be read as any regulatory, legal, tax, accounting or other advice and Compass does not provide such advice. All opinions are subject to change without notice. Compass makes no representation regarding the accuracy of any statements regarding any references to the laws, statutes or regulations of any state are those of the author(s). Past performance is no guarantee of future results.
A Compass Review for the San Francisco Metro Area, June 30, 2020
The Index is published 2 months after the month delineated – the new April 2020 index was released 6/30/20 – and reflects a 3-month rolling calculation,and one month’s sales generally reflect accepted-offer activity in the previous month. Thus, the Index is looking into a rear-view mirror at the market 3 to 5 months ago. So far, the Index is not showing any negative effects on home prices from the COVID-19 crisis that began to seriously affect Bay Area home markets in mid-March with the imposition of shelter in place rules.
The Corelogic S&P Case-Shiller Home Price Index does not evaluate median sales price changes, but employs its own proprietary algorithm to measure home price appreciation over time. Since its indices cover large areas with hundreds of communities of widely varying home values, the C-S chart numbers do not refer to specific prices, but instead reflect prices as compared to those prevailing in January 2000, all designated as having a consistent value of 1 00. A reading of 250 signifies that home prices in the area and segment being measured have appreciated 150% above the price prevailing in January 2000.
The 5 counties in the Case-Shiller San Francisco Metro Statistical Area are San Francisco, Marin, San Mateo, Alameda and Contra Costa. (Alameda and Contra Costa have by far the greatest numbers of house sales being analyzed.) The Index trend lines, in their ups and downs, generally apply well to other Bay Area counties, such as Santa Clara and Sonoma. In northern California, Case-Shiller only tracks prices for the 5 counties of the SF Metro Area. C-S calculations are huge generalities.
Case-Shiller divides all the house sales into thirds, or tiers:The third of sales with the lowest prices is the low-price tier; the third of sales with the highest sales prices is the high-price tier; and the third in between is the mid-price. The price ranges of these tiers change as the market changes. The 3 price tiers experienced dramatically different bubbles, crashes and recoveries over the past 18+ years, to a large degree determined by how badly the tier was affected by the subprime financing crisis. The low price tier was worst affected – huge bubble, huge crash, most dramatic recovery – and the high-price least affected (but still significantly so). However, in the last 4 years, the low- and mid-price tiers have seen appreciation rates accelerating above that of the high-price tier.
Most house sales in the more affluent Bay Areas communities are in the “high price tier,” and many would qualify for an “ultra-high price tier,” if such existed. However,all counties, to varying degrees,have sales in all 3 price tiers.
There are hundreds of unique real estate markets and segments in such a broad region, with different dynamics, moving at varying speeds, sometimes in different directions. How the C-S Index applies to any particular property is impossible to know without a specific
comparative market analysis. * https://my.spindices.com/index-family/sp-corelogic-case-shiller/sp-corel ogic-case-shiller-composite
Supply & demand statistics, median sales price trends, sales and values by city district, the luxury home market, and the ongoing effects of COVID-19
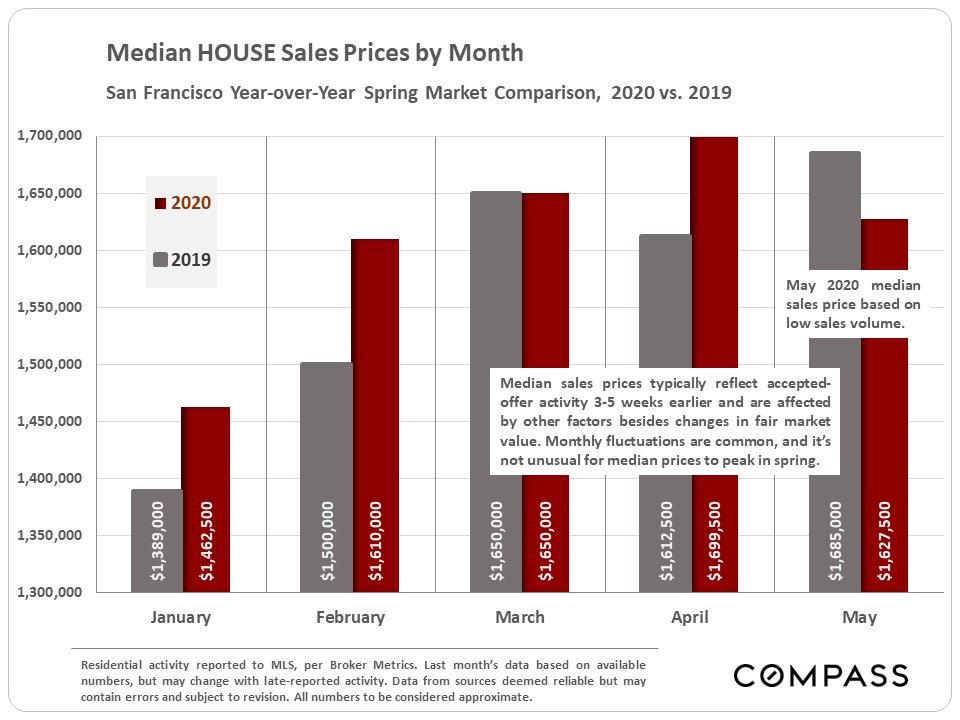
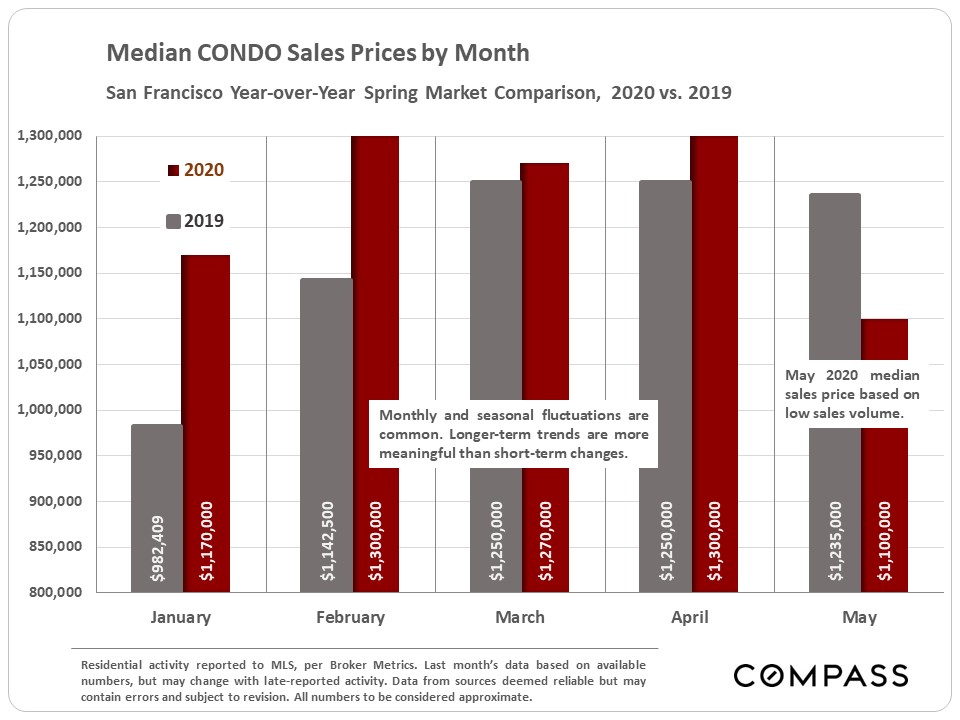
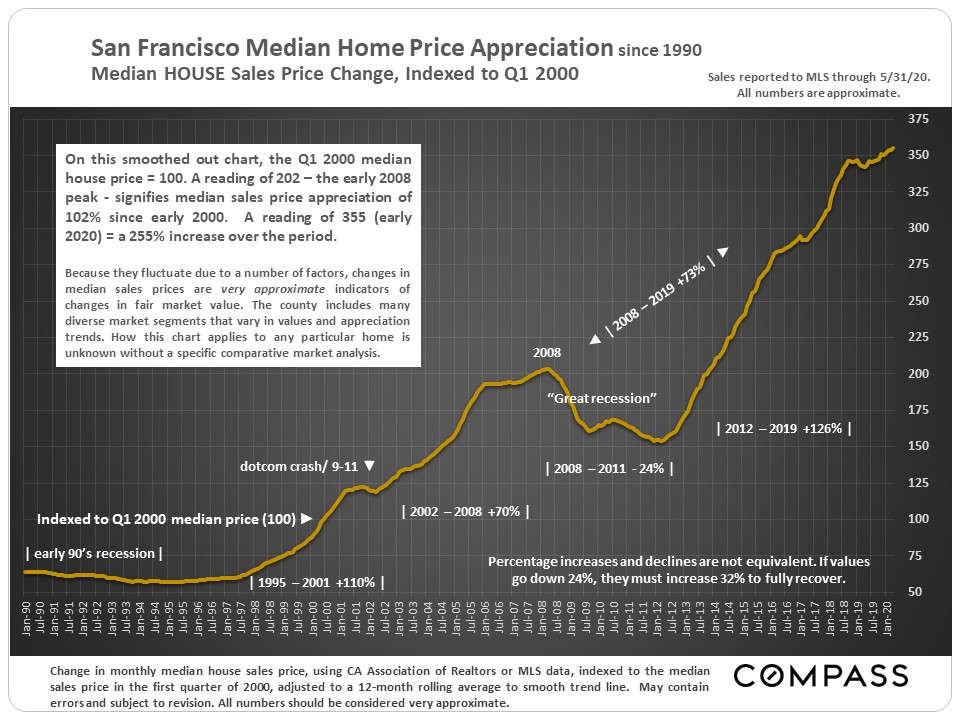
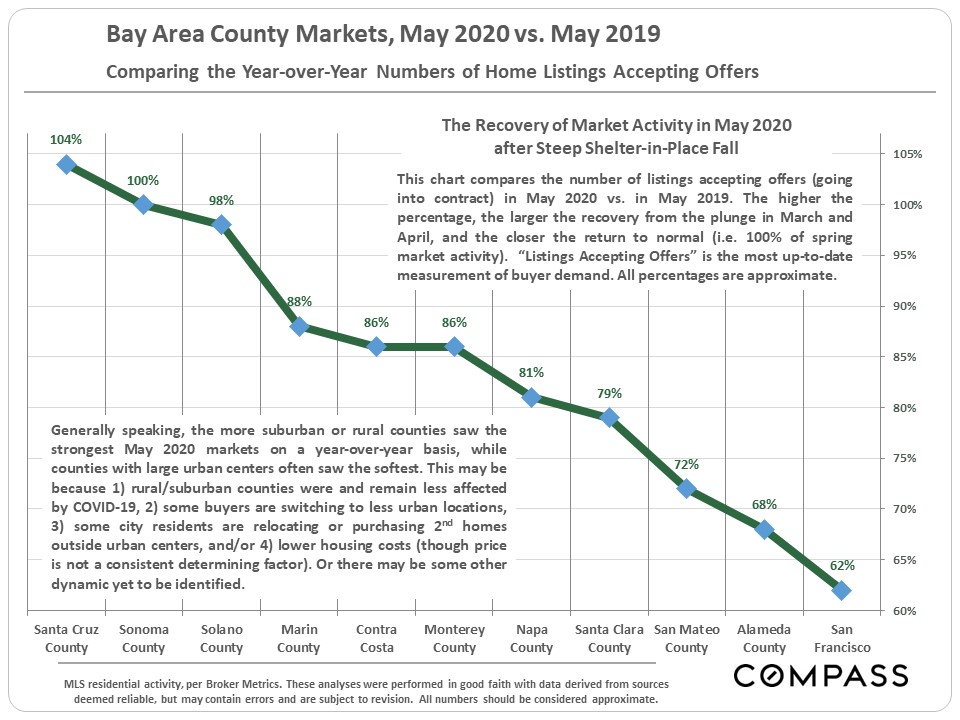
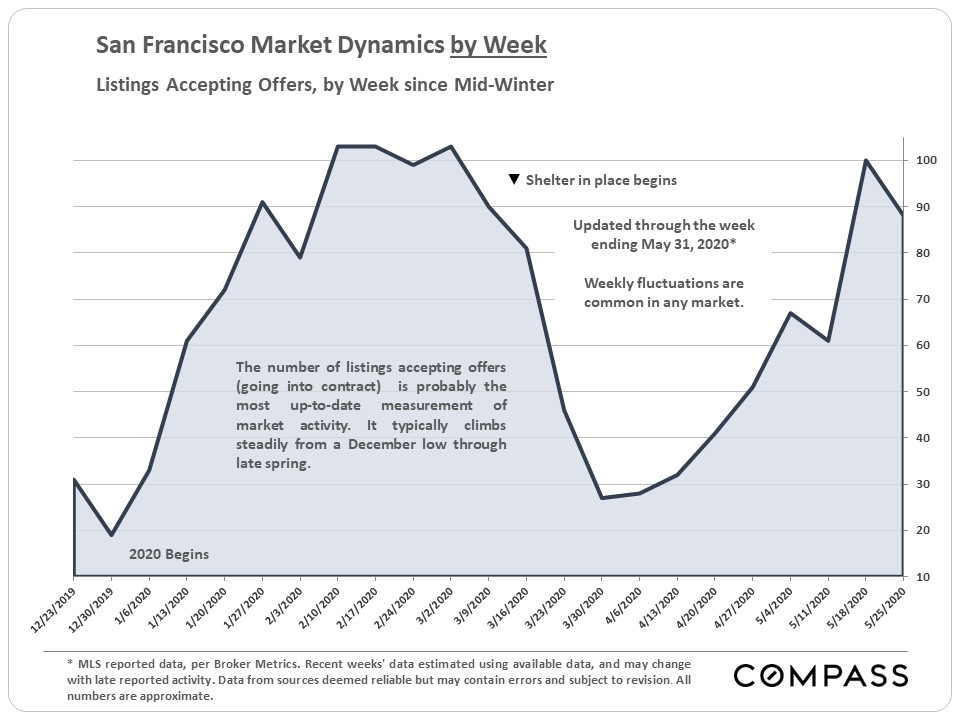
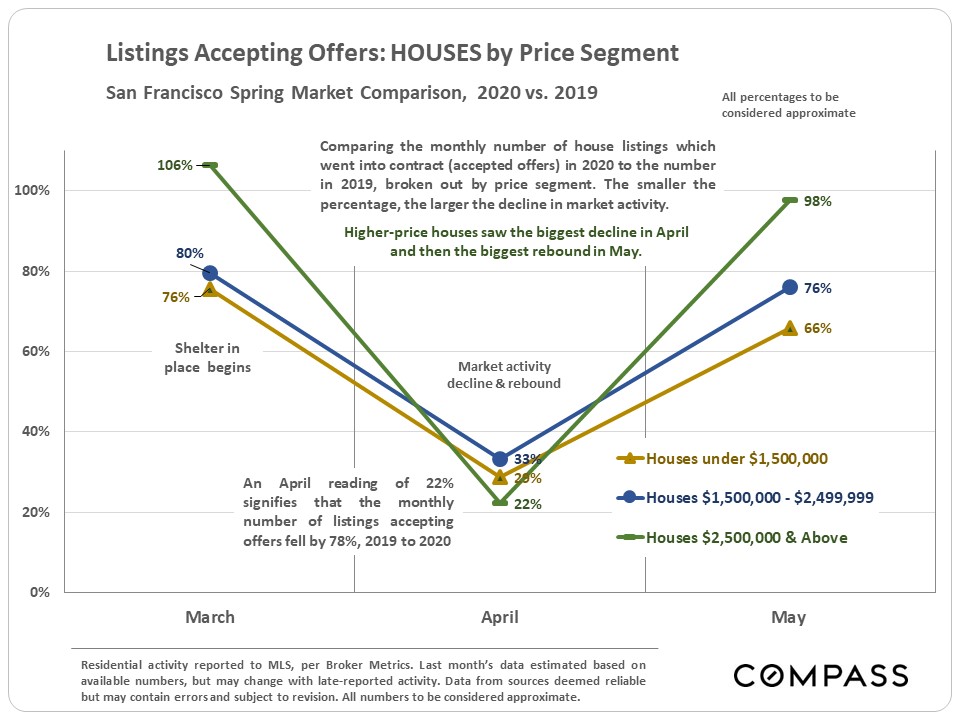
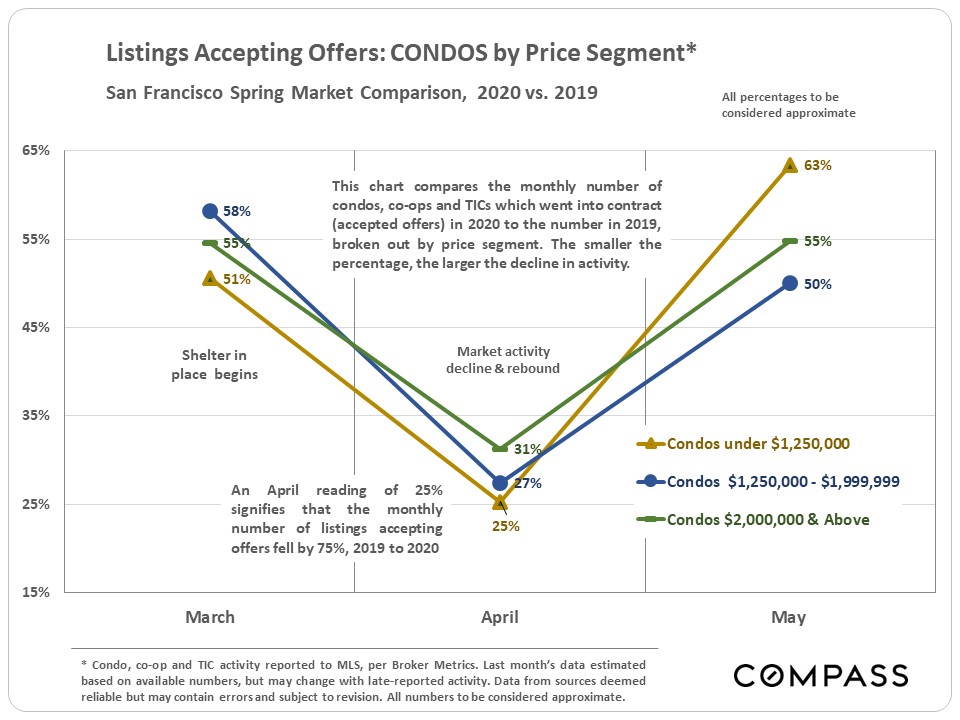
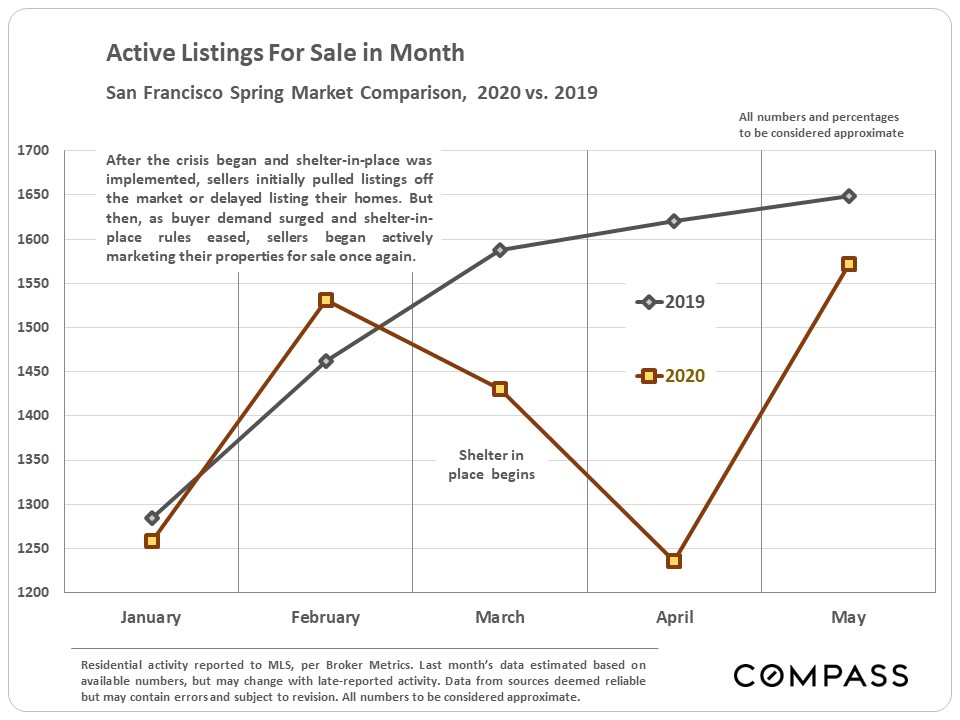
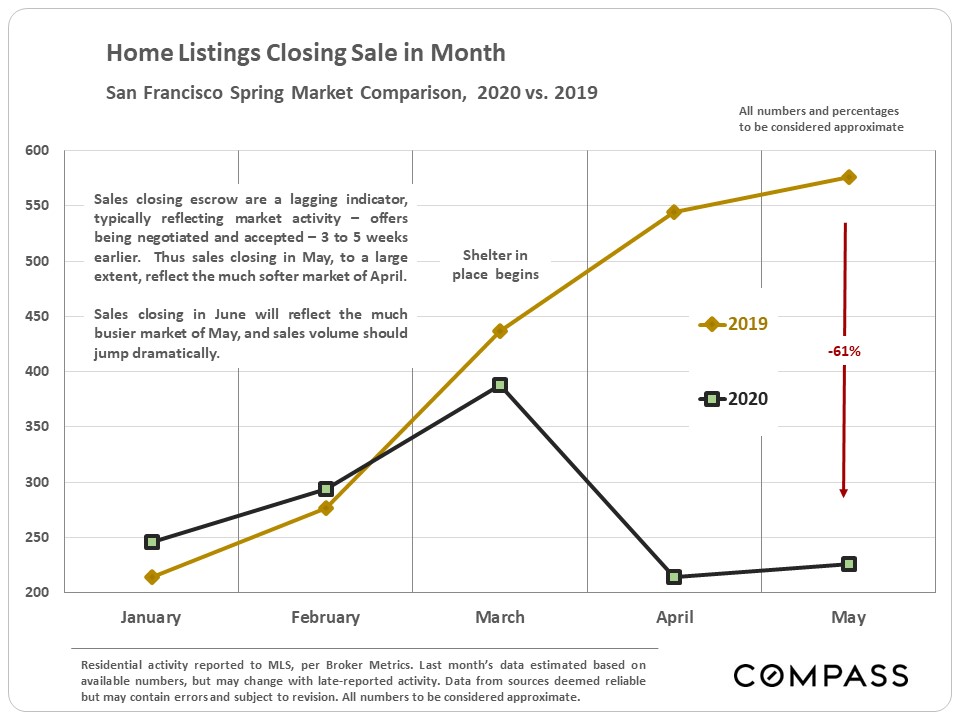
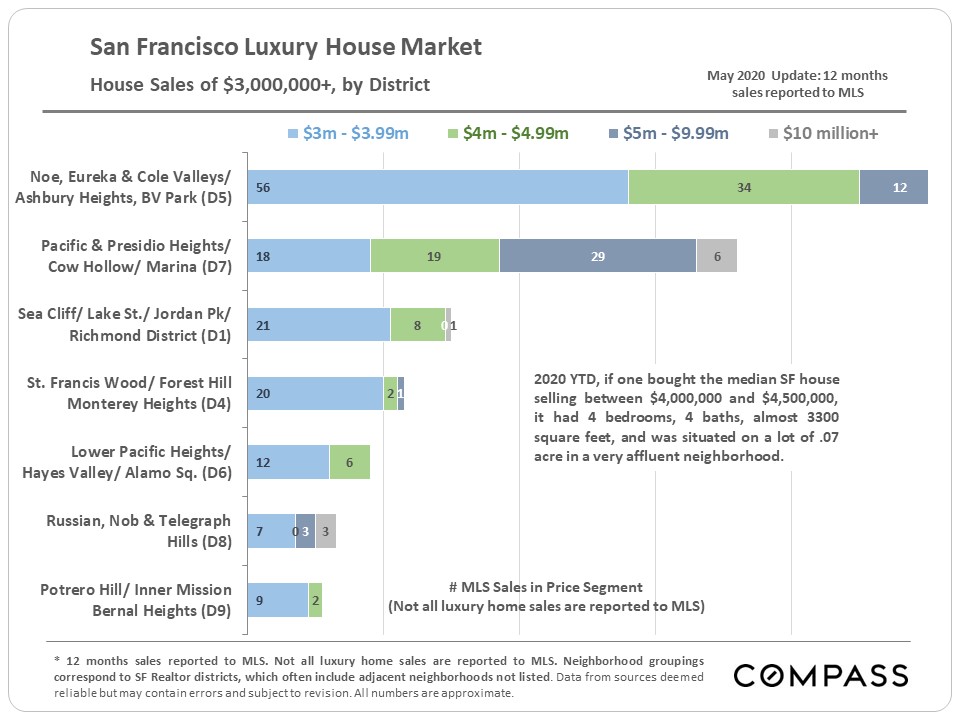
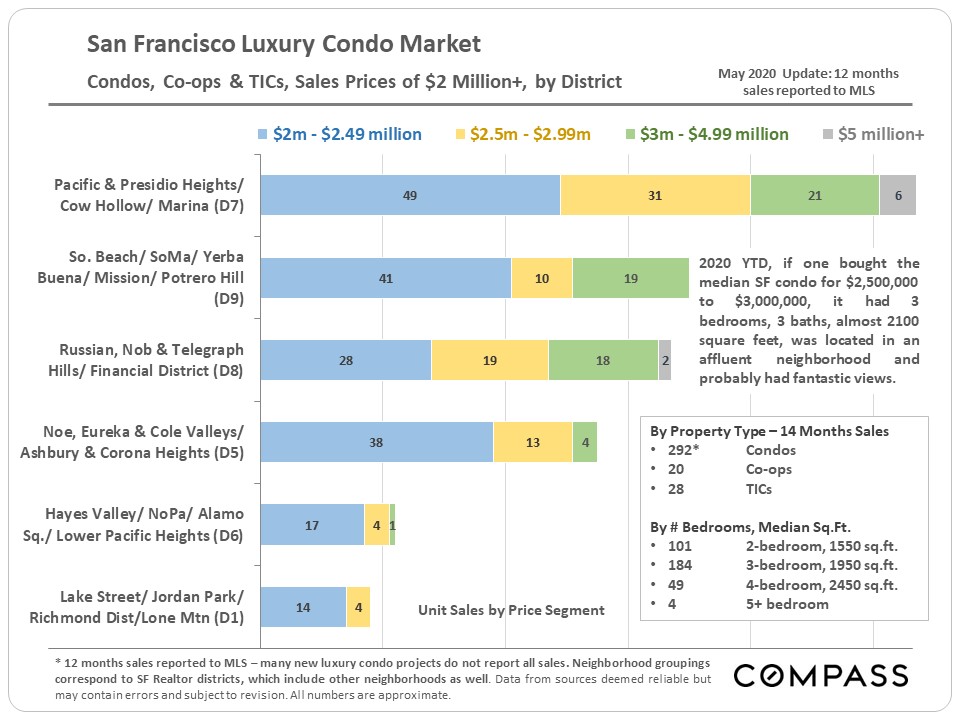
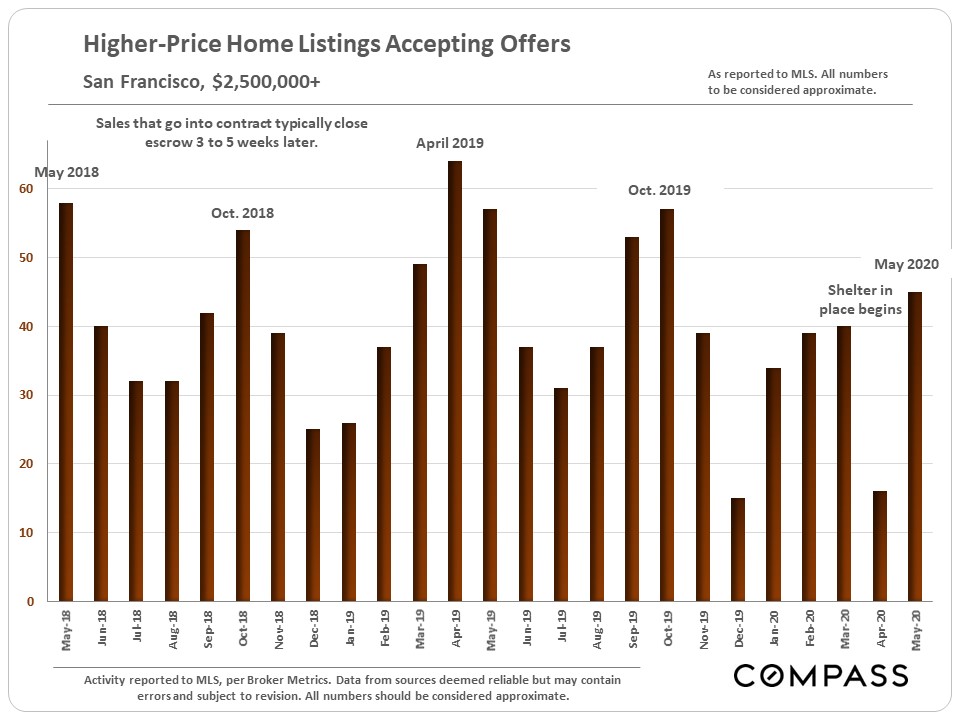
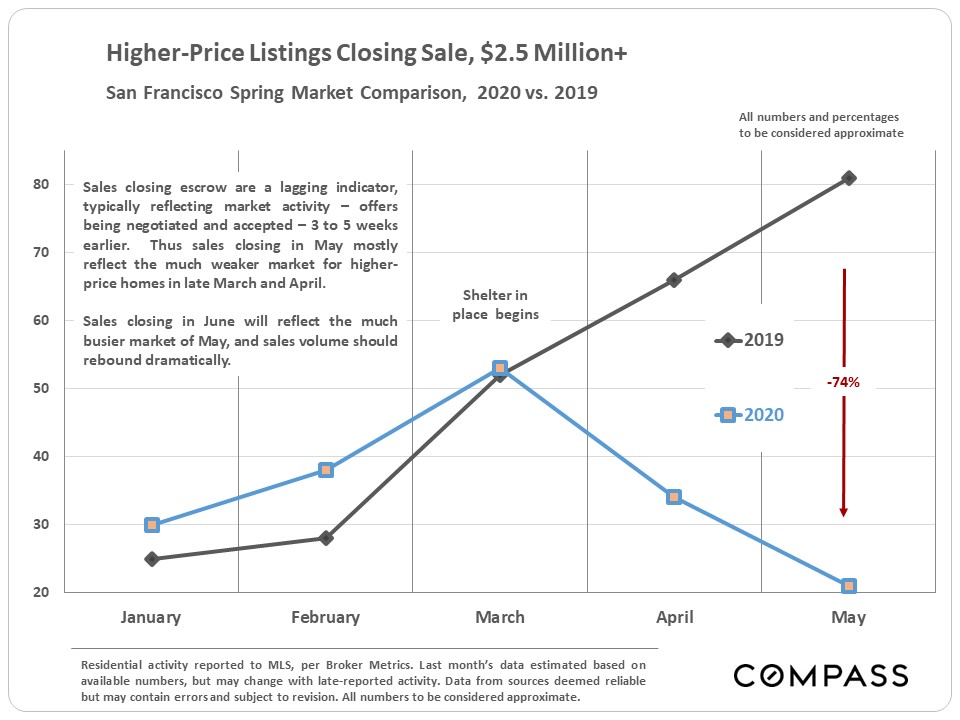
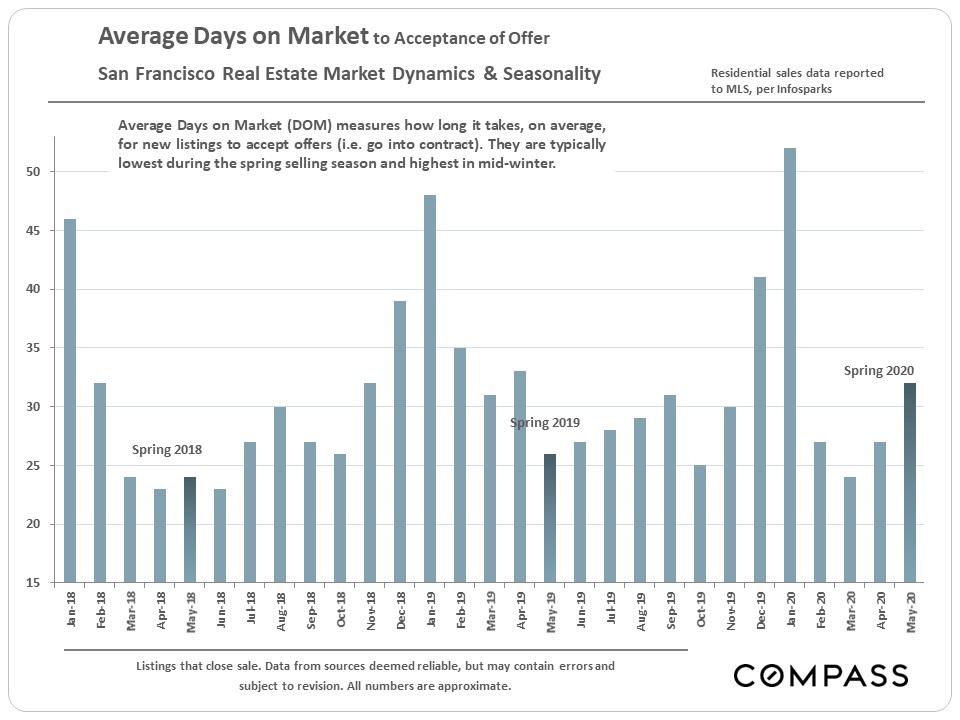
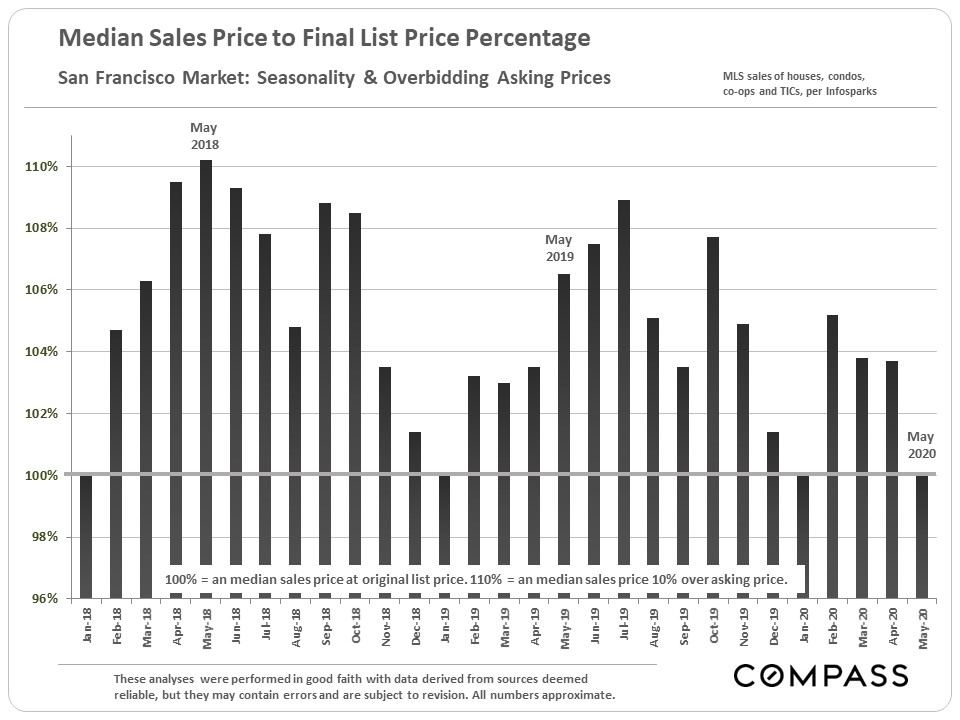
Generally speaking, market activity – as measured by the number of listings going into contract -continued to pick up rapidly in May, bouncing back from the steep plunge following the first shelter in place orders. However, activity in May, which is typically among the busiest selling months of the year, remained well below May 2019. Still, with the easing of shelter in place, as well as the market leaming to adjust to new circumstances, it is expected the recovery will continue to surge closer to normal. In fact, based on the strength of buyer demand, some analysts believe the coming months may be busier than in 2019, as sales activity that would have occurred in spring gets pushed into the summer instead. Interest rates hit yet another historic low at the end of May.
Note: Any statistics derived from closed sales – such as median sales prices, sales volume and days on market -reflect the state of the market 3·6 weeks ago when the offers were negotiated and accepted. They are lagging indicators, and May sales data to a large degree reflects the much softer market in April.
MLS reported data. last month’s data estimated using available data, and may change with late reported activity. Data from sources deemed reliable but may contain errors and subject to revision. All numbers are approximate.
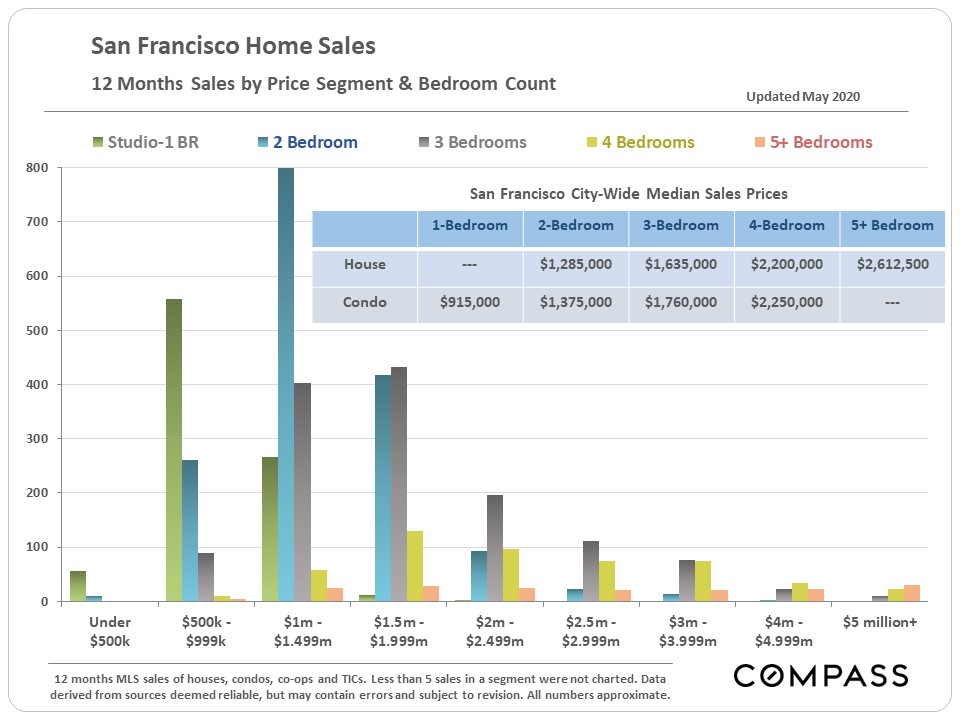
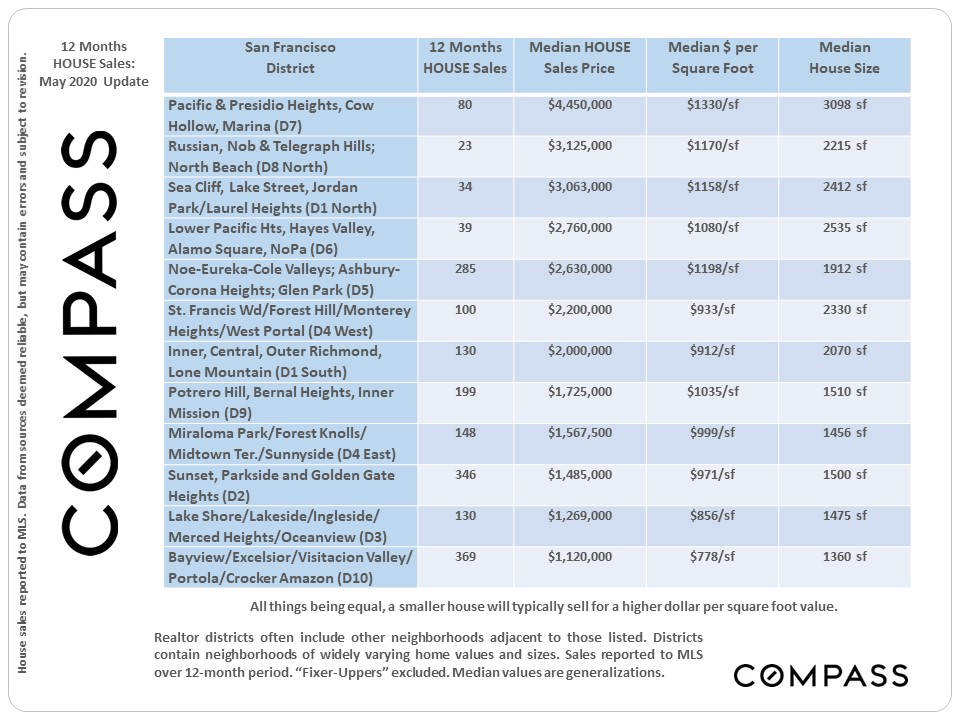
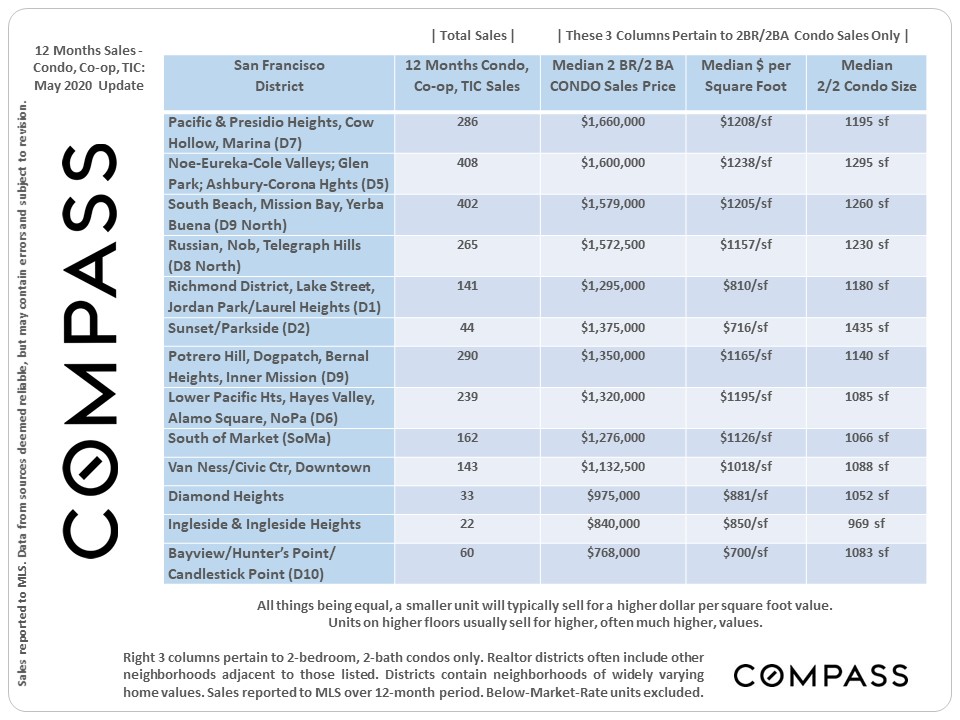
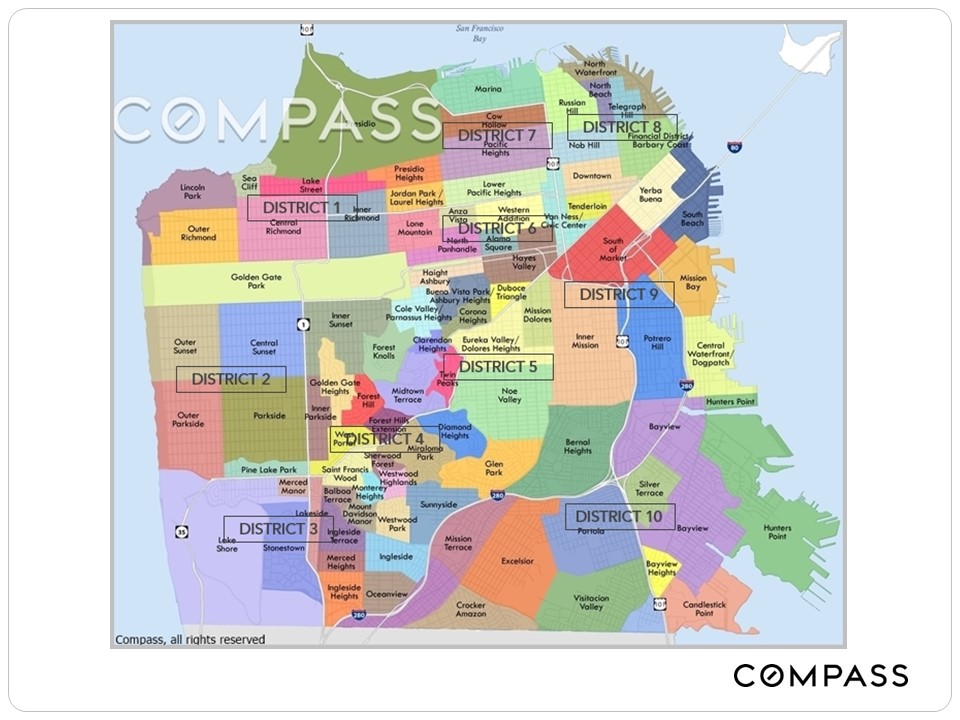
It is impossible to know how median and average value statistics apply to any particular home without a specific comparative market analysis. Many factors affect sales prices besides neighborhood/ bedroom count: quality of location within the neighborhood, condition, size, architecture, views, amenities, parking, outdoor space, etc.
These analyses were made in good faith with data from sources deemed reliable, but may contain errors and are subject to revision. It is not our intent to convince you of a particular position,but to attempt to provide straightforward data and analysis, so you can make your own informed decisions. Median and average statistics are enormous generalities: There are hundreds of different markets in San Francisco and the Bay Area, each with its own unique dynamics. Median prices and average dollar per square foot values can be and often are affected by other factors besides changes in fair market value. Longer term trends are much more meaningful than short-term.
Compass is a real estate broker licensed by the State of California, DRE 01527235. Equal Housing Opportunity. This report has been prepared solely for information purposes. The information herein is based on or derived from information generally available to the public and/or from sources believed to be reliable. No representation or warranty can be given with respect to the accuracy or completeness of the information. Compass disclaims any and all liability relating to this report, including without limitation any express or implied representations or warranties for statements contained in, and omissions from, the report. Nothing contained herein is intended to be or should be read as any regulatory, legal, tax, accounting or other advice and Compass does not provide such advice. All opinions are subject to change without notice. Compass makes no representation regarding the accuracy of any statements regarding any references to the laws, statutes or regulations of any state are those of the author(s). Past performance is no guarantee of future results.
San Francisco Real Estate Market – Begins to Slowly Recover
It is impossible to know how median and average value statistics apply to any particular home without a specific comparative market analysis. Many factors affect sales prices besides neighborhood/ bedroom count: quality of location within the neighborhood, condition, size, architecture, views, amenities, parking, outdoor space, etc.
These analyses were made in good faith with data from sources deemed reliable, but may contain errors and are subject to revision. It is not our intent to convince you of a particular position,but to attempt to provide straightforward data and analysis, so you can make your own informed decisions. Median and average statistics are enormous generalities: There are hundreds of different markets in San Francisco and the Bay Area, each with its own unique dynamics. Median prices and average dollar per square foot values can be and often are affected by other factors besides changes in fair market value. Longer term trends are much more meaningful than short-term.
Compass is a real estate broker licensed by the State of California, DRE 01527235. Equal Housing Opportunity. This report has been prepared solely for information purposes. The information herein is based on or derived from information generally available to the public and/or from sources believed to be reliable. No representation or warranty can be given with respect to the accuracy or completeness of the information. Compass disclaims any and all liability relating to this report, including without limitation any express or implied representations or warranties for statements contained in, and omissions from, the report. Nothing contained herein is intended to be or should be read as any regulatory, legal, tax, accounting or other advice and Compass does not provide such advice. All opinions are subject to change without notice. Compass makes no representation regarding the accuracy of any statements regarding any references to the laws, statutes or regulations of any state are those of the author(s). Past performance is no guarantee of future results.