7 Months after the Pandemic Struck
|
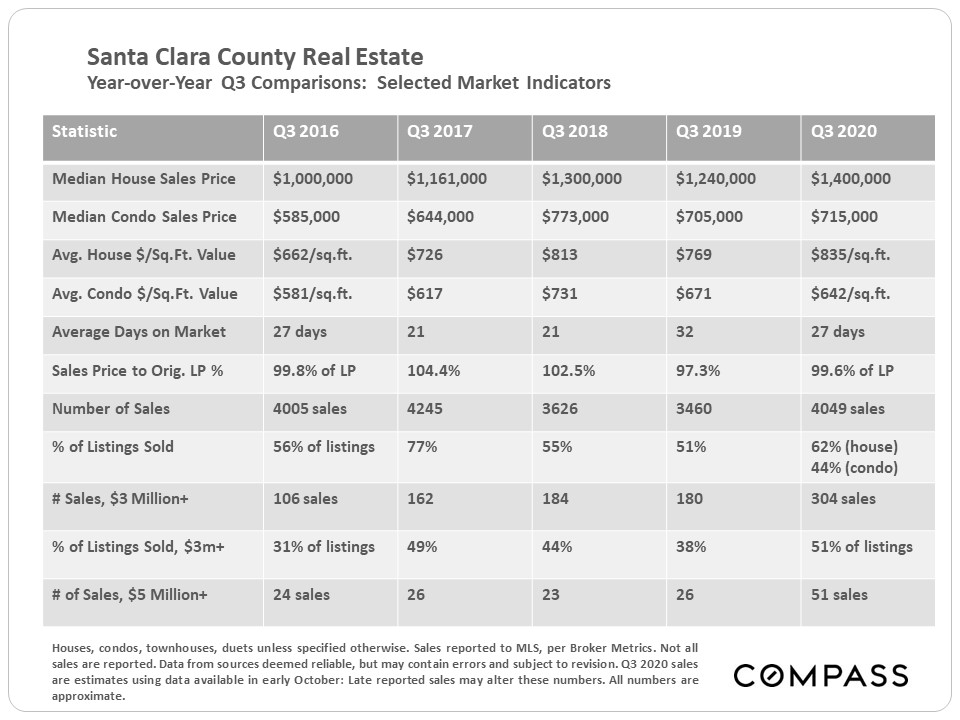
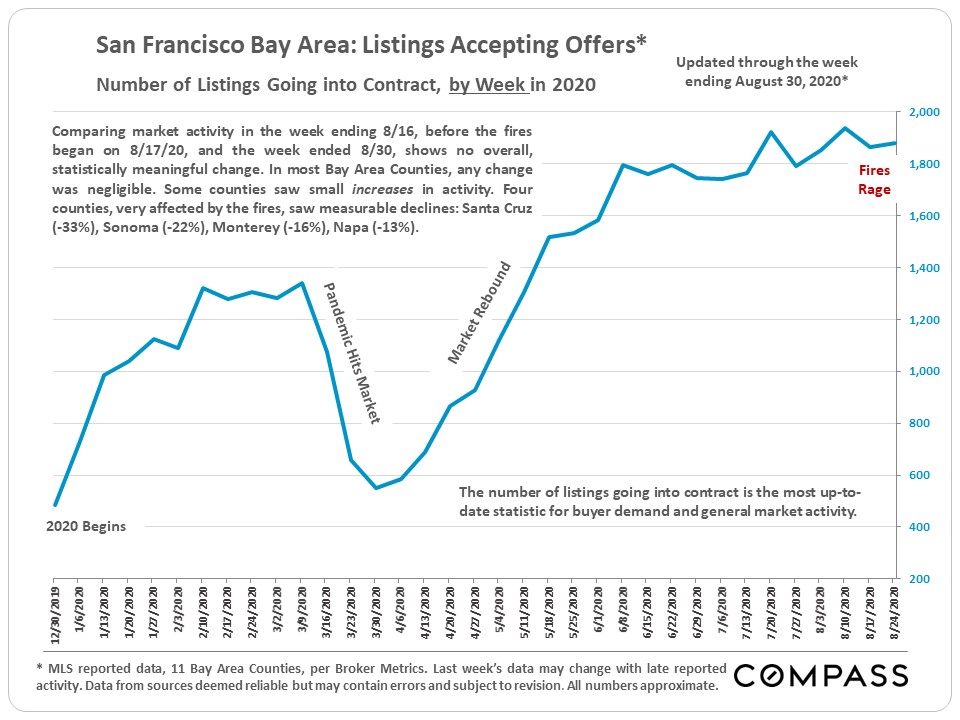
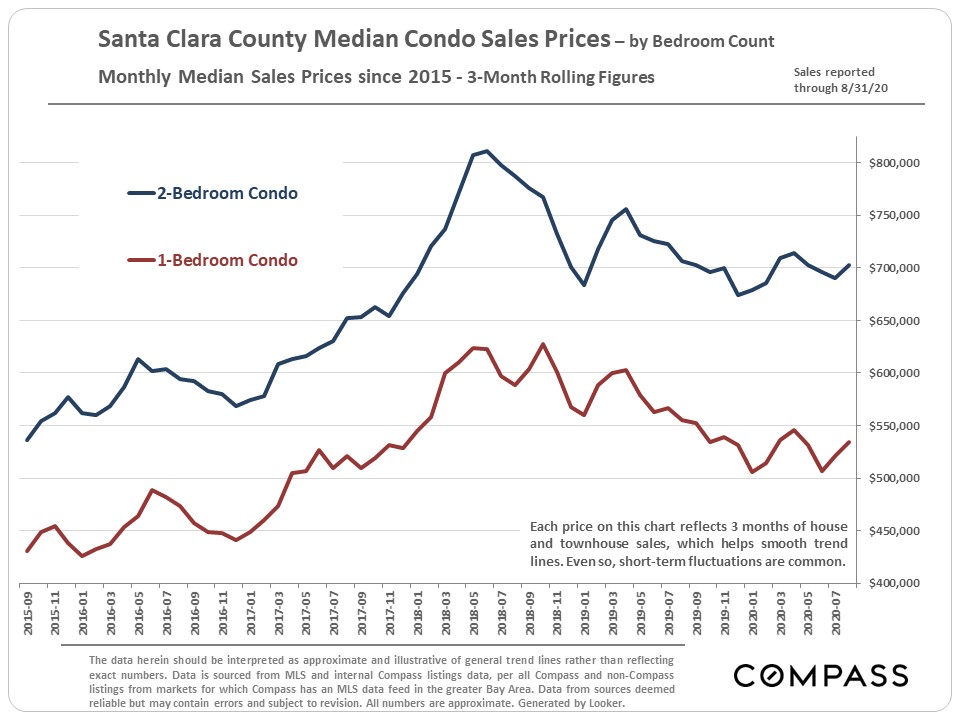
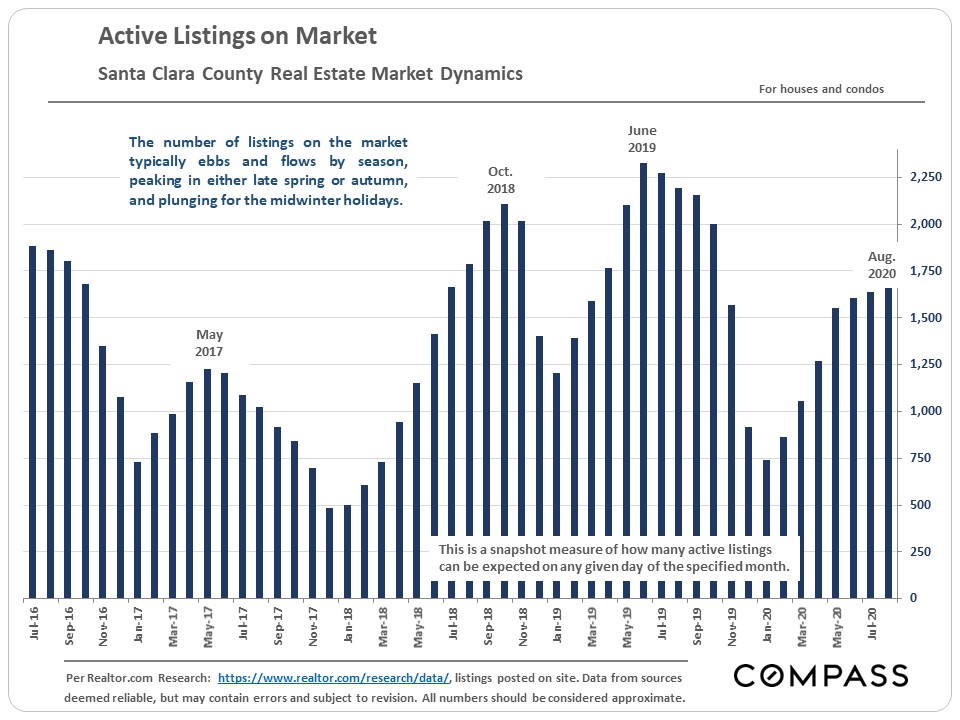
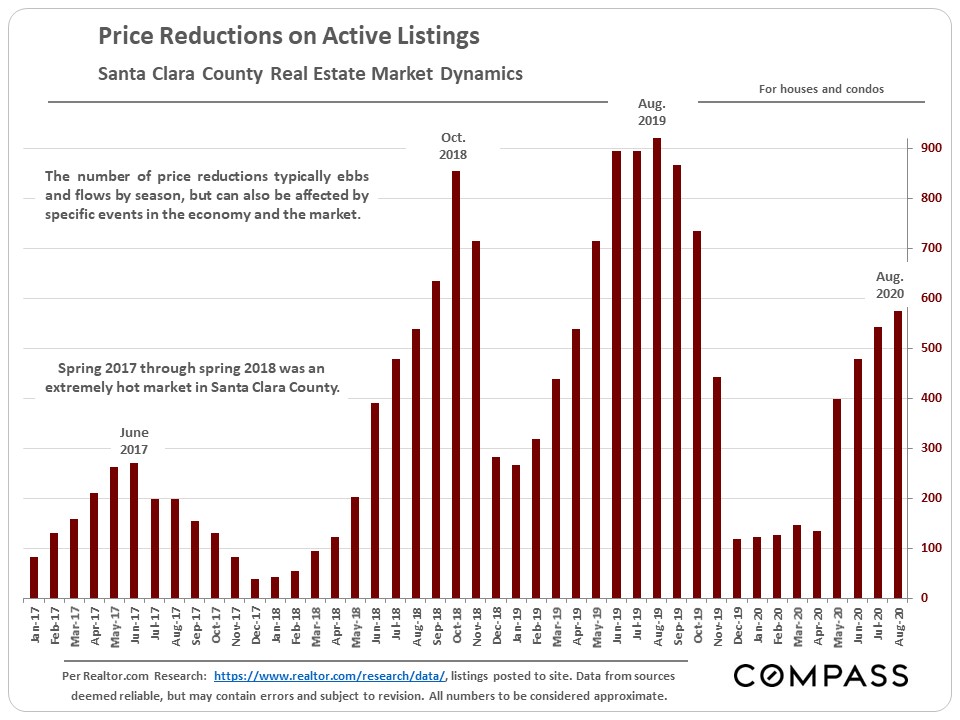
The table below compares Q3 statistics across 5 years. This year, the pandemic pushed the typical heat of the spring Q2 market to Q3. As mentioned in previous reports, the condo market has been softer than the house market, a common dynamic in most of the Bay Area.
|
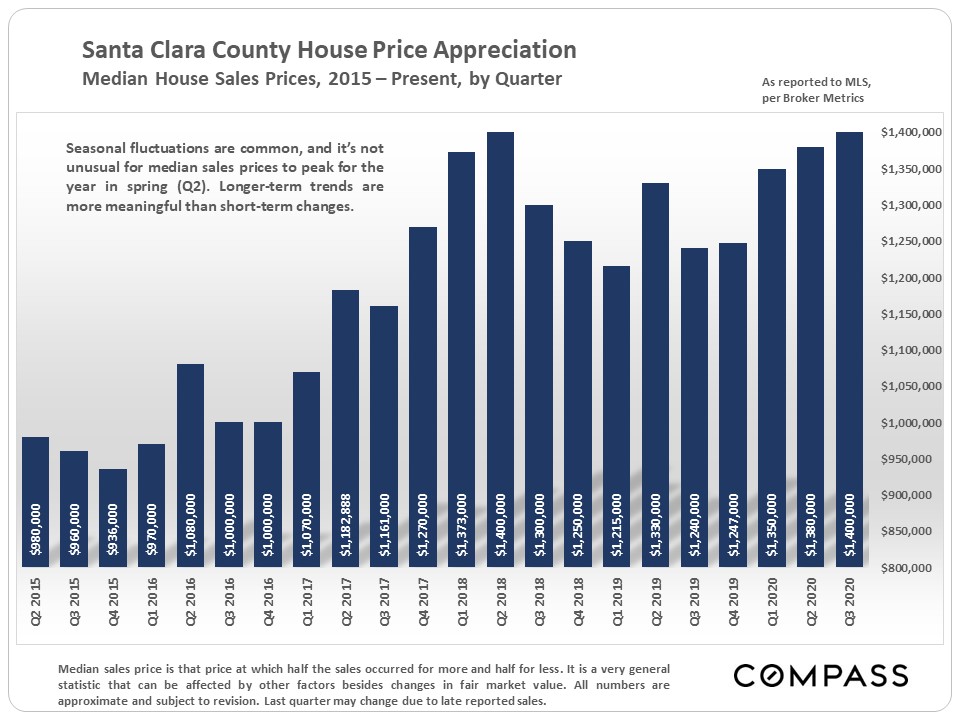
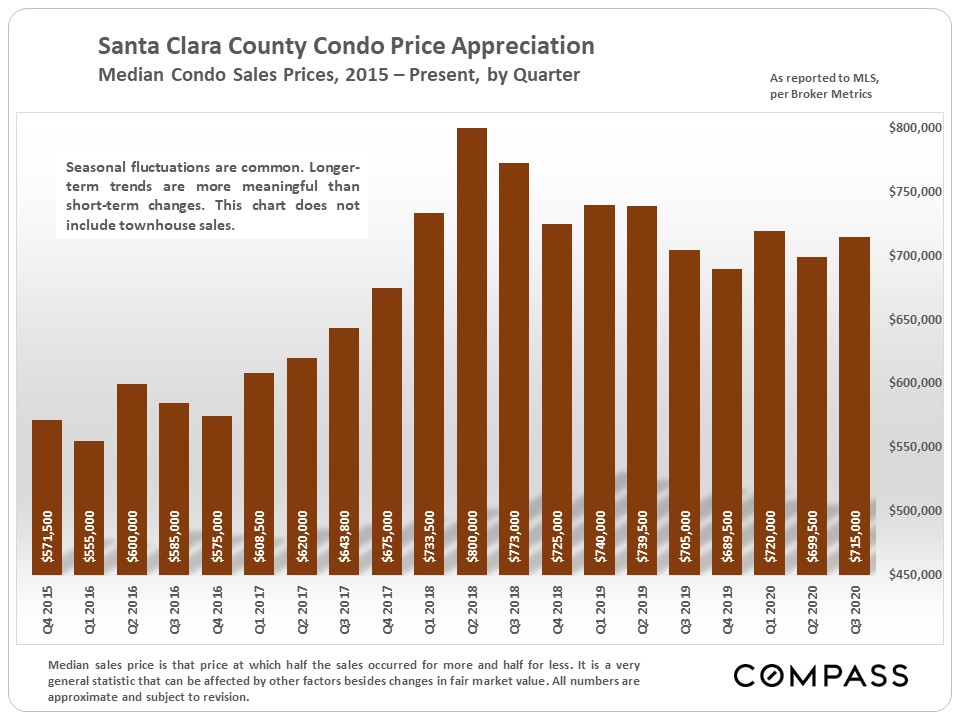
Median House & Condo Sales Price Trends
by Quarter
|
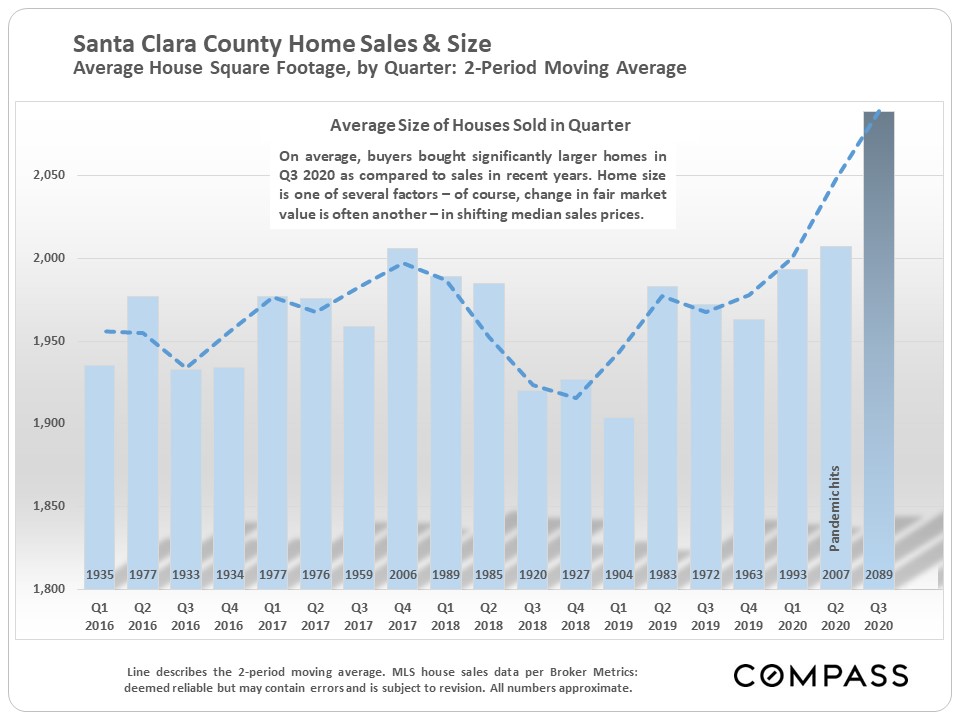
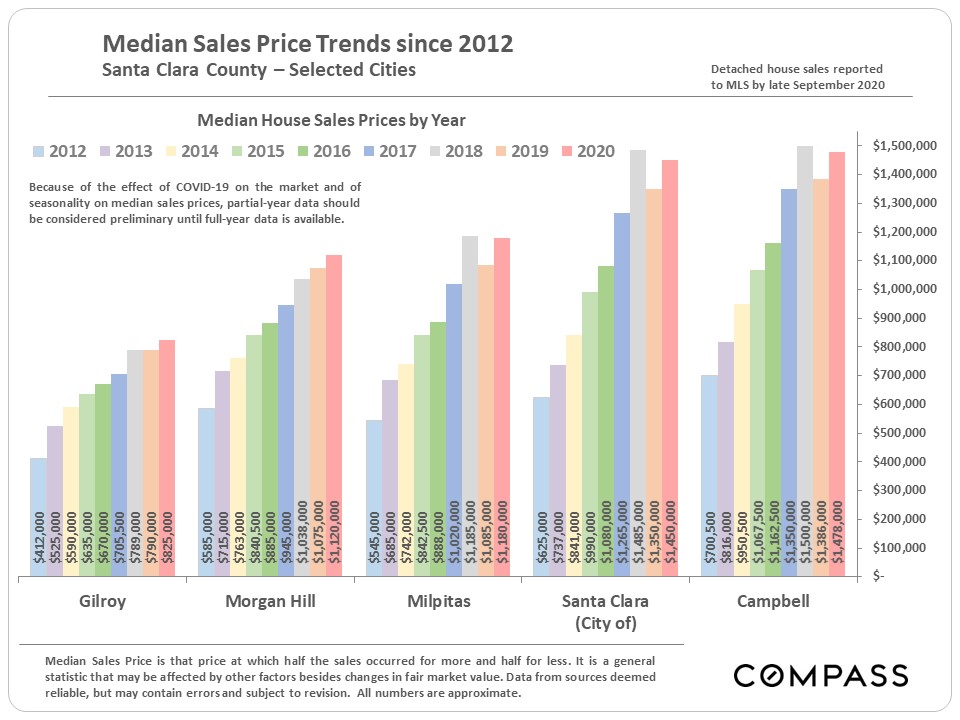
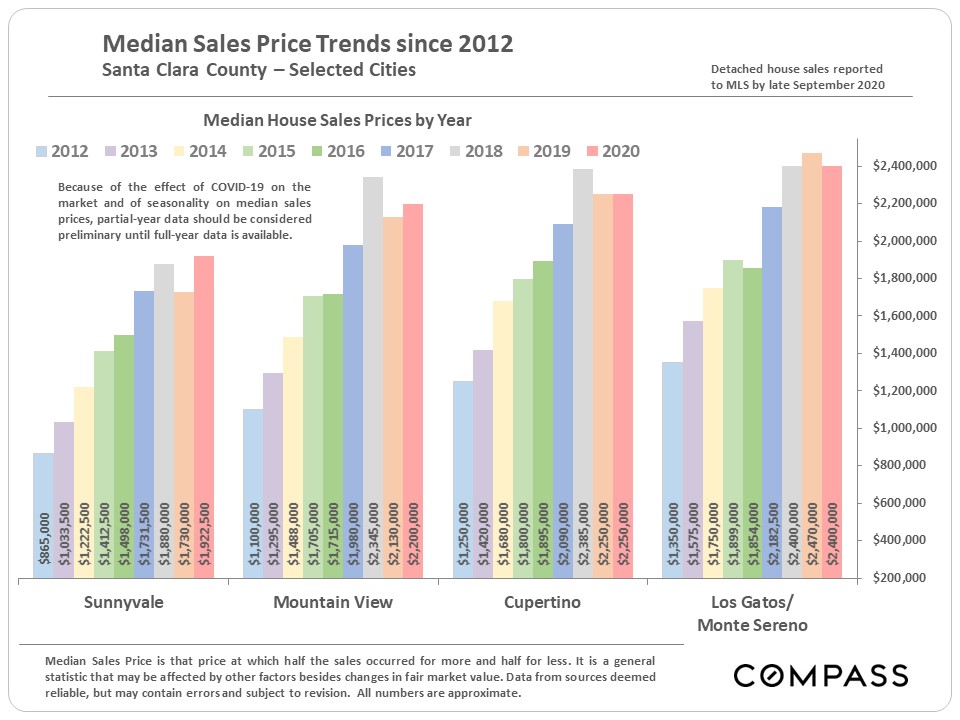
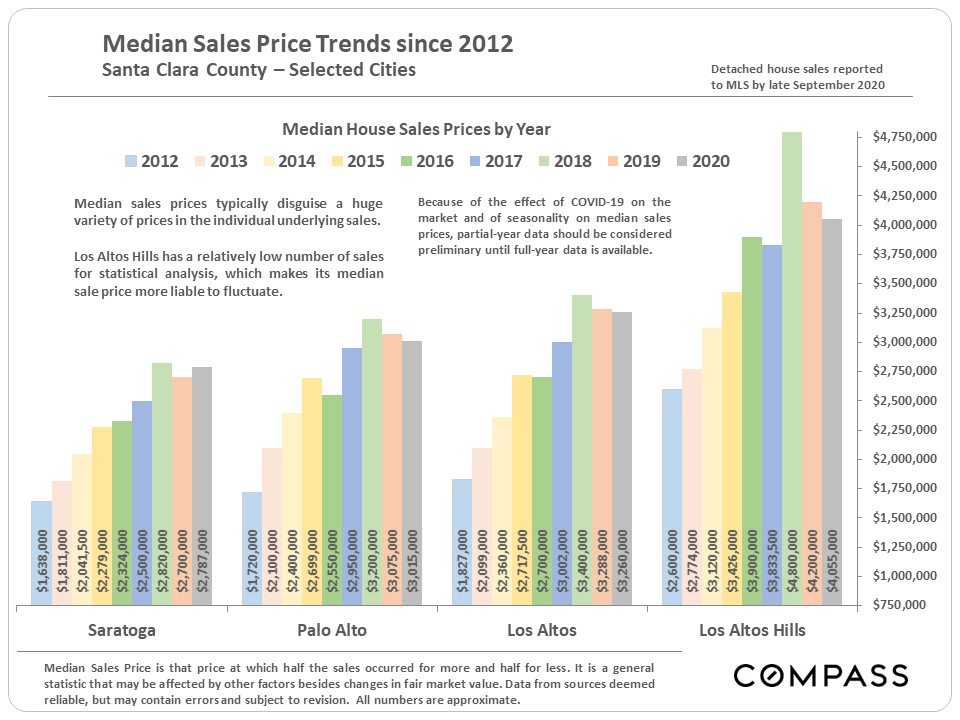
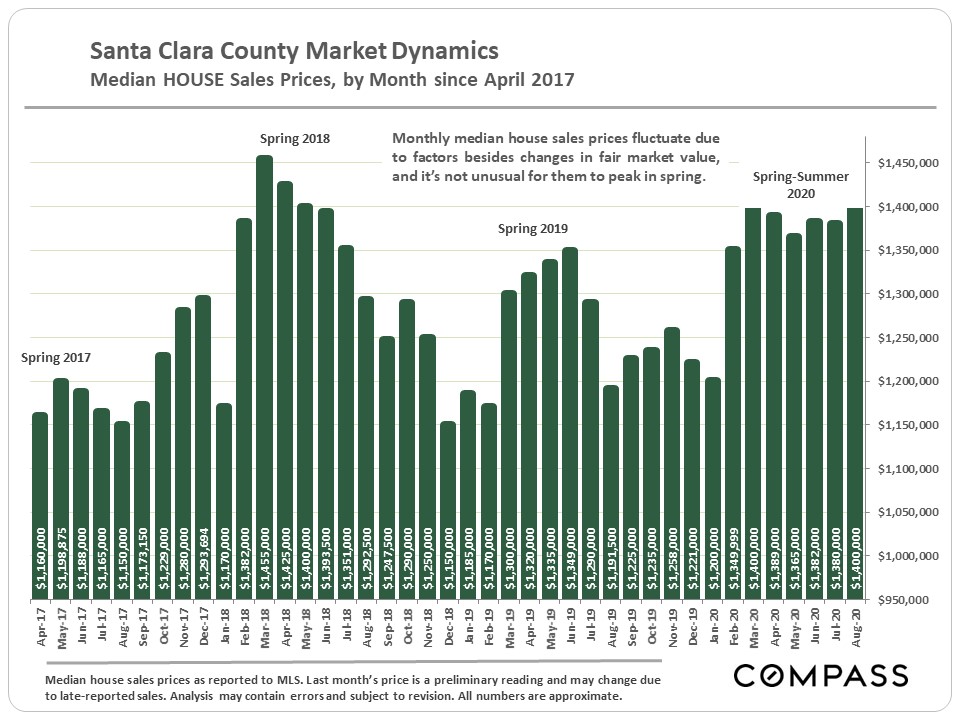
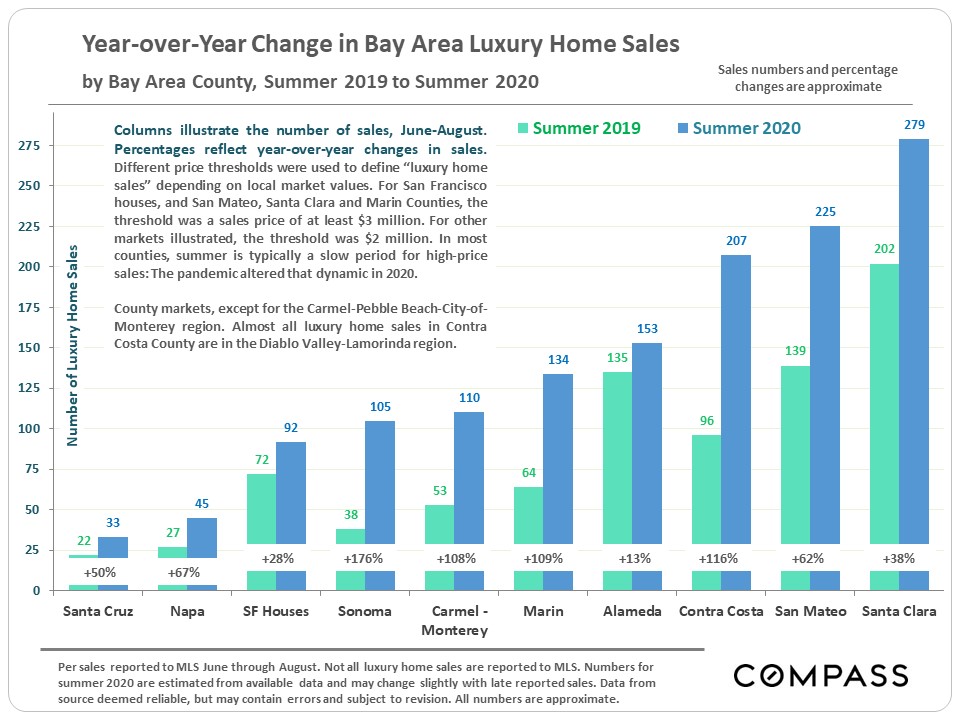
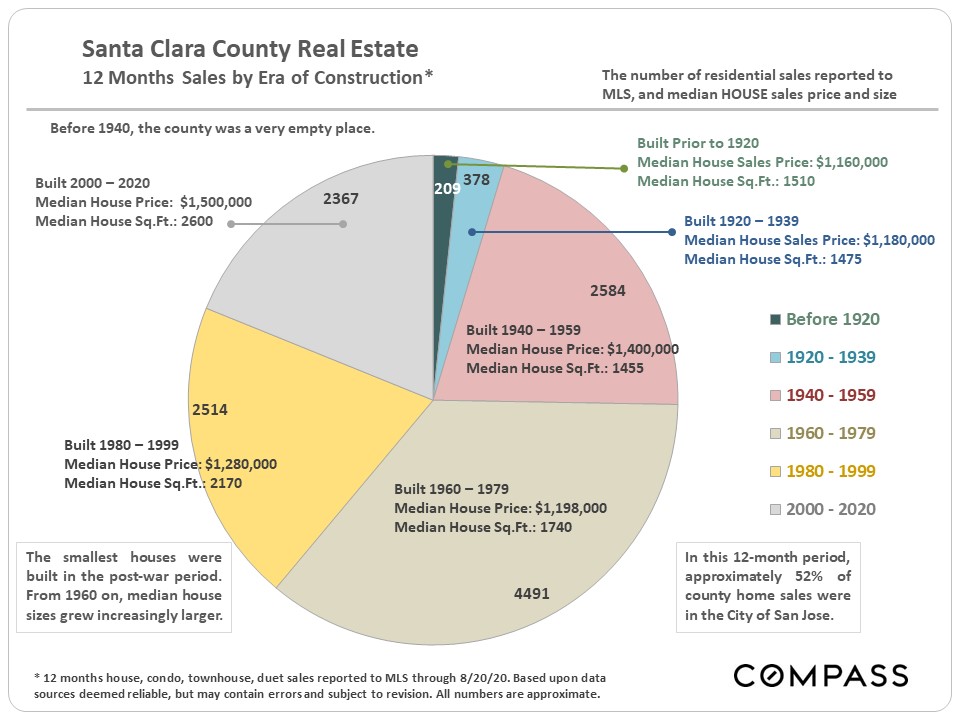
Median sales prices can rise because of increases in fair market value – i.e. buyers are paying more money for the same home (supply and demand) – and/or because buyers are purchasing larger, more expensive houses. Both dynamics are probably currently at play, but it is certain that affluent and very affluent buyers have made up a dramatically increasing percentage of the total market throughout the Bay Area. In Santa Clara County, the average size of houses sold in Q3 saw a large year-over-year jump.
|
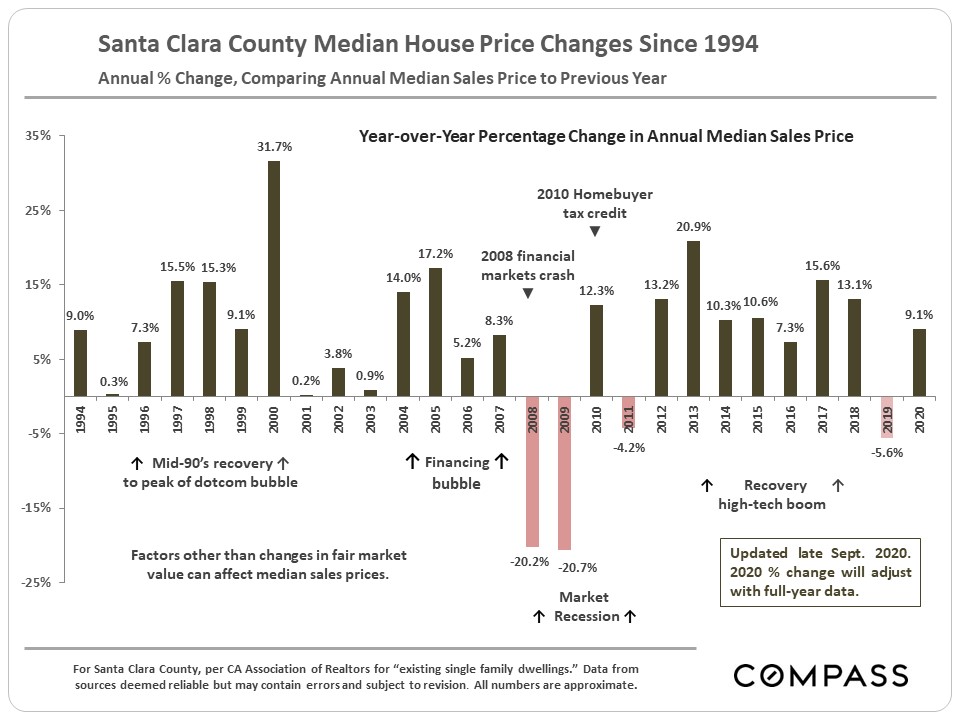
Annual percentage changes in median house sales price: The 2020 YTD percentage will almost certainly change, one way or another, by the time full-year sales data is in.
|
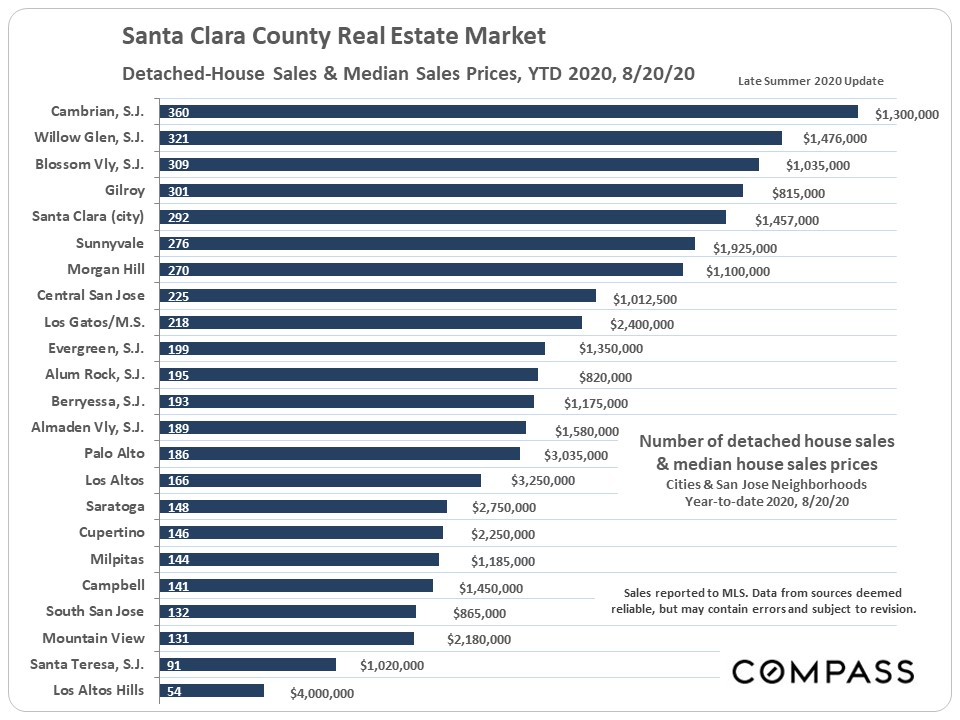
Median House Sales Price Trends by City
& by San Jose Neighborhood
|
7 Months after the Pandemic Struck
|
The table below compares Q3 statistics across 5 years. This year, the pandemic pushed the typical heat of the spring Q2 market to Q3. As mentioned in previous reports, the condo market has been softer than the house market, a common dynamic in most of the Bay Area.
|
Median House & Condo Sales Price Trends
by Quarter
|
Median sales prices can rise because of increases in fair market value – i.e. buyers are paying more money for the same home (supply and demand) – and/or because buyers are purchasing larger, more expensive houses. Both dynamics are probably currently at play, but it is certain that affluent and very affluent buyers have made up a dramatically increasing percentage of the total market throughout the Bay Area. In Santa Clara County, the average size of houses sold in Q3 saw a large year-over-year jump.
|
Annual percentage changes in median house sales price: The 2020 YTD percentage will almost certainly change, one way or another, by the time full-year sales data is in.
|
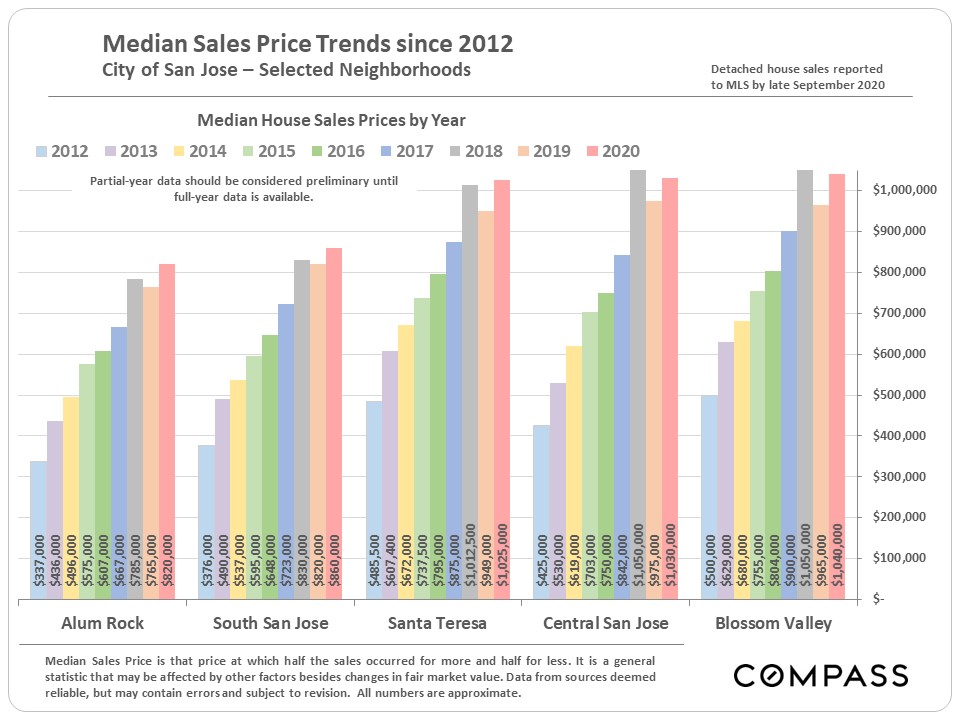
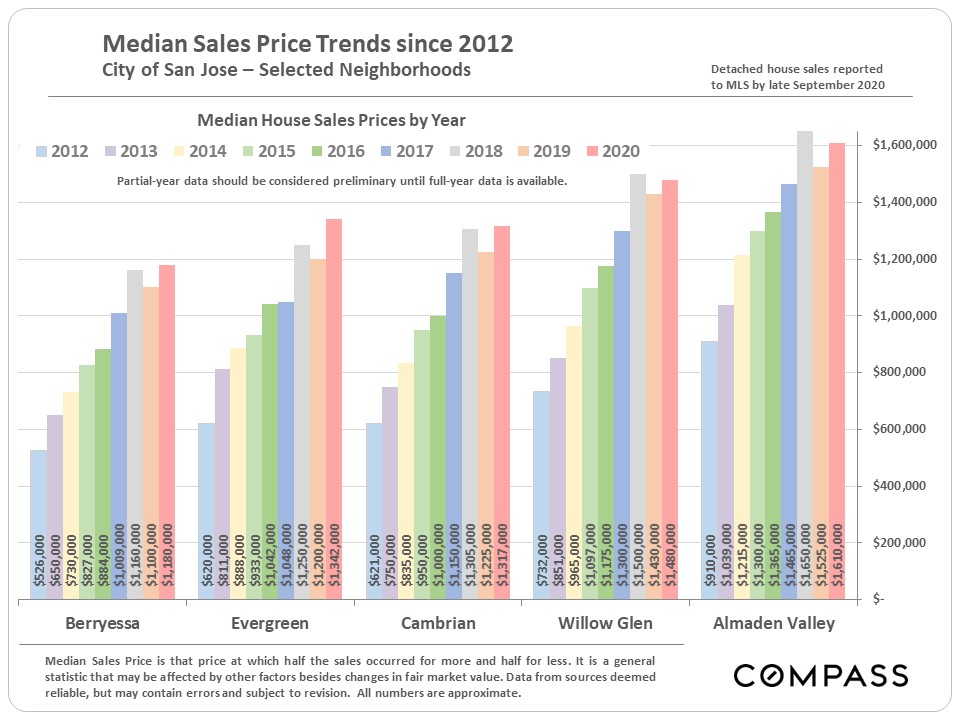
Median House Sales Price Trends by City
& by San Jose Neighborhood
|
Source: Compass
It is impossible to know how median and average value statistics apply to any particular home without a specific comparative market analysis. These analyses were made in good faith with data from sources deemed reliable, but may contain errors and are subject to revision. It is not our intent to convince you of a particular position, but to attempt to provide straightforward data and analysis, so you can make your own informed decisions. Median and average statistics are enormous generalities: There are hundreds of different markets in San Francisco and the Bay Area, each with its own unique dynamics. Median prices and average dollar per square foot values can be and often are affected by other factors besides changes in fair market value. Longer term trends are much more meaningful than short-term.
Compass is a real estate broker licensed by the State of California, DRE 01527235. Equal Housing Opportunity. This report has been prepared solely for information purposes. The information herein is based on or derived from information generally available to the public and/or from sources believed to be reliable. No representation or warranty can be given with respect to the accuracy or completeness of the information. Compass disclaims any and all liability relating to this report, including without limitation any express or implied representations or warranties for statements contained in, and omissions from, the report. Nothing contained herein is intended to be or should be read as any regulatory, legal, tax, accounting or other advice and Compass does not provide such advice. All opinions are subject to change without notice. Compass makes no representation regarding the accuracy of any statements regarding any references to the laws, statutes or regulations of any state are those of the author(s). Past performance is no guarantee of future results.