San Francisco Real Estate, August 2019

Sales & Values by District and Price Segment, Special Circumstance Sales, Market Seasonality, the Luxury Home Market & Foreign Buyers


The May Case-Shiller Home Price Index was released in late July for the 5-county SF metro area. This chart illustrates the difference in appreciation rates between the Bay Area (higher price markets) and the entire country. Case-Shiller does not use median sales prices but its own algorithm to calculate appreciation. January 2000 home price = 100; 250 = a home price 150% above that of Jan. 2000.

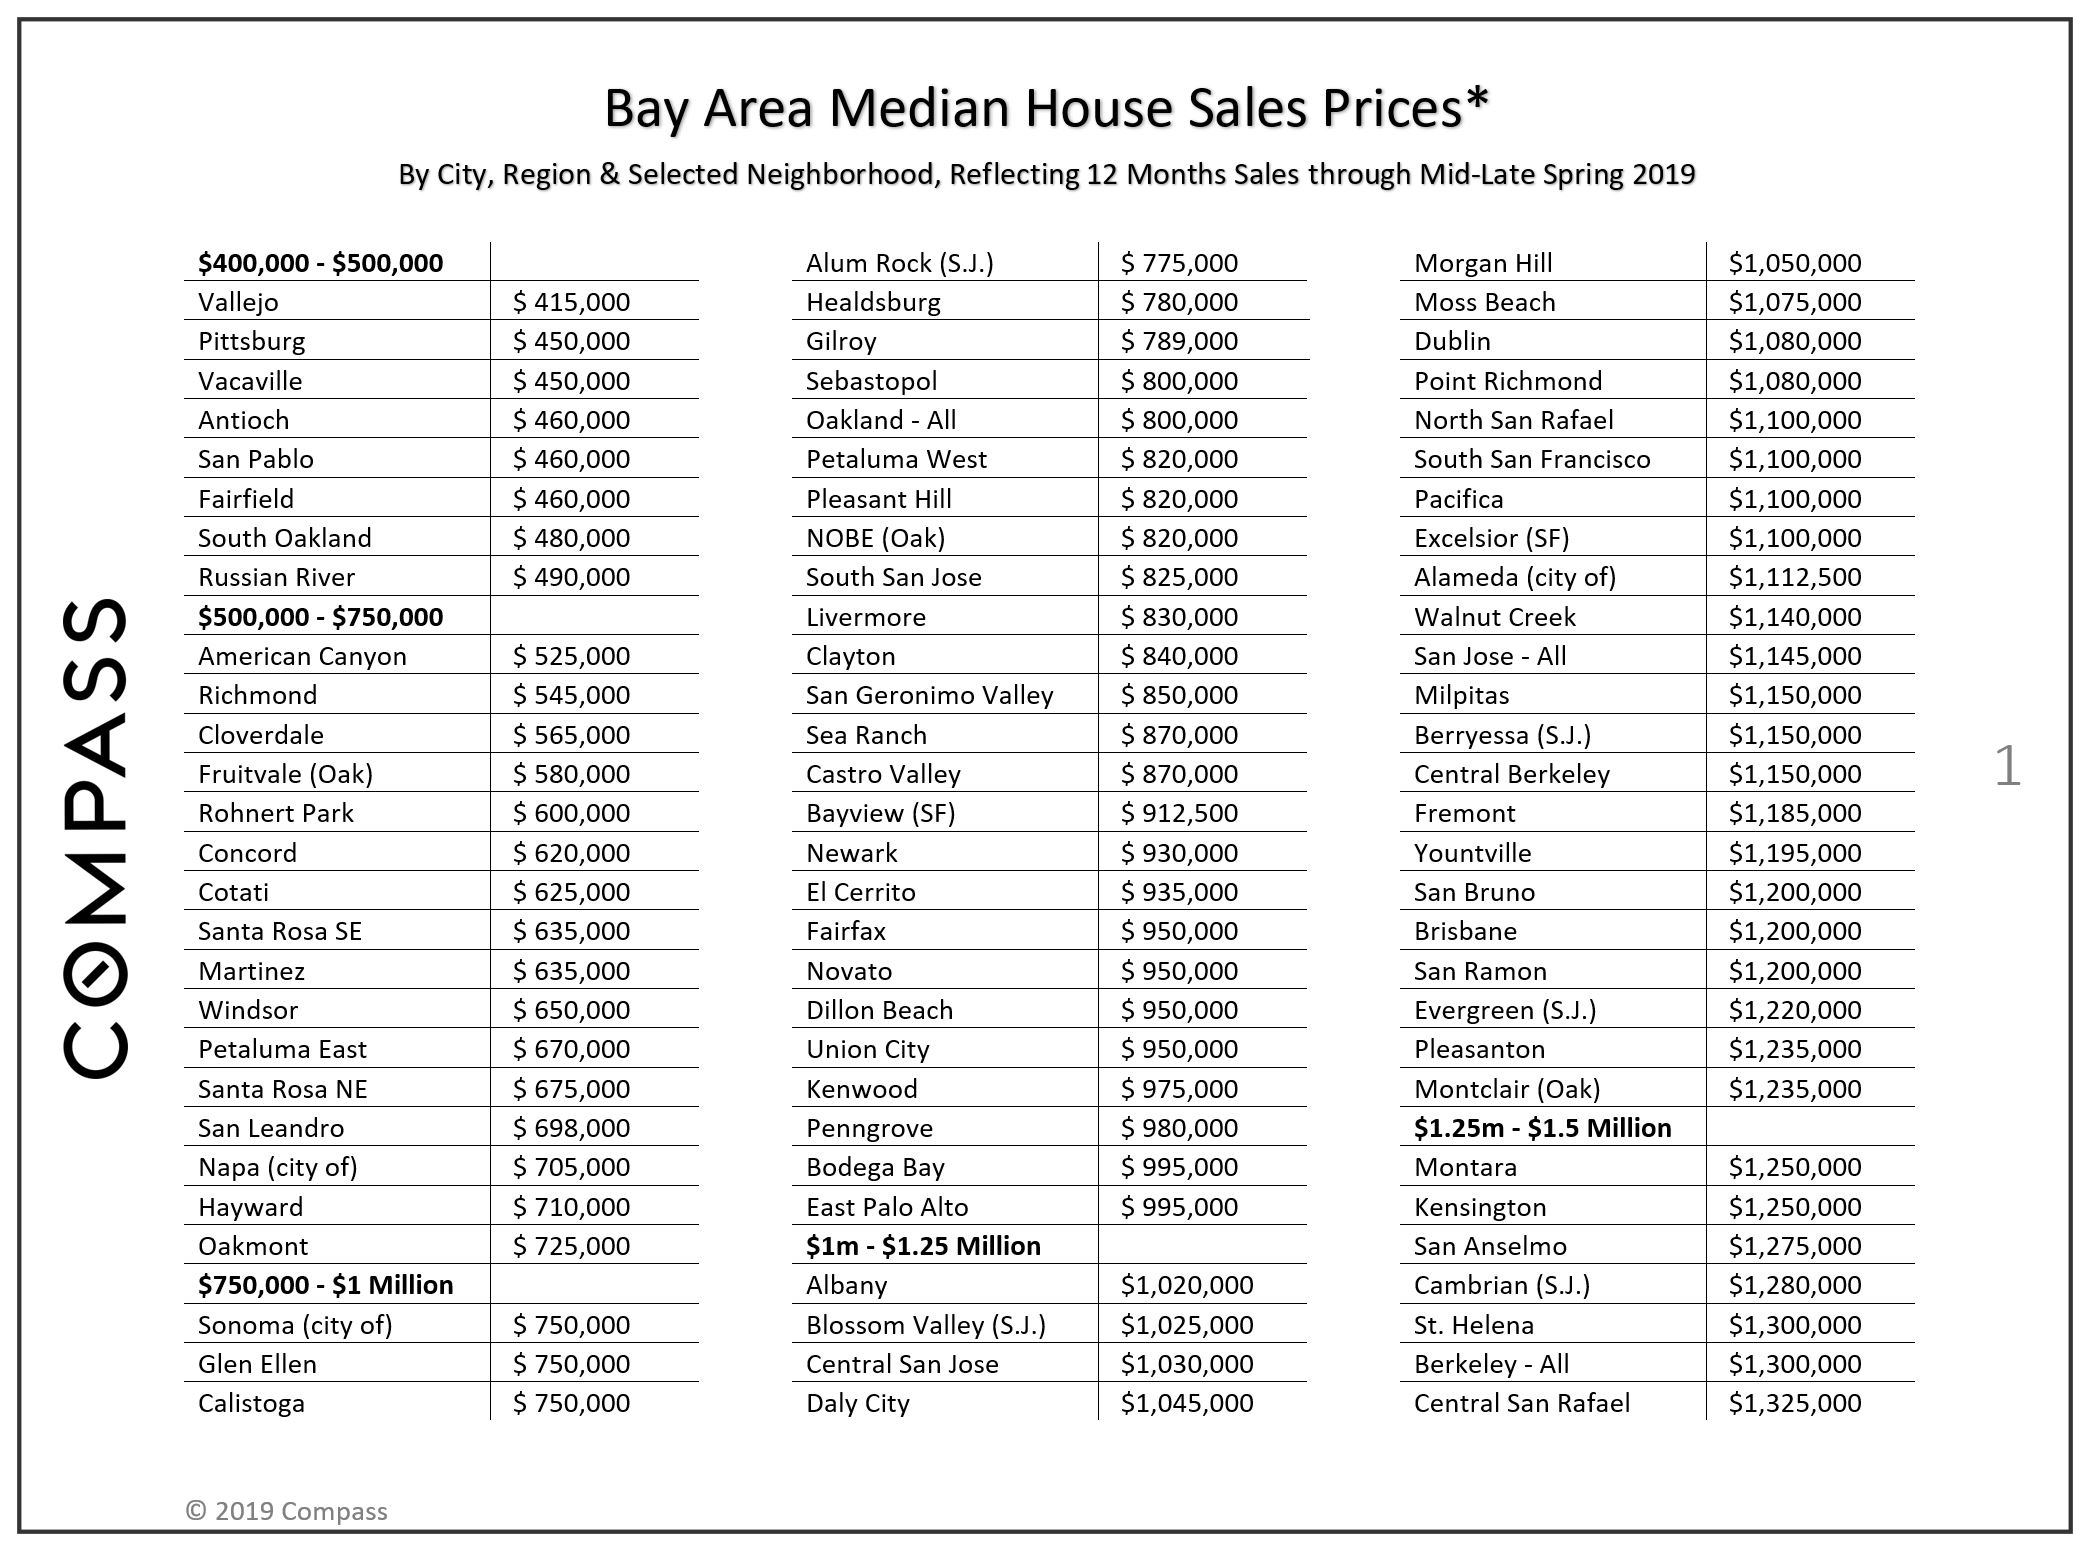
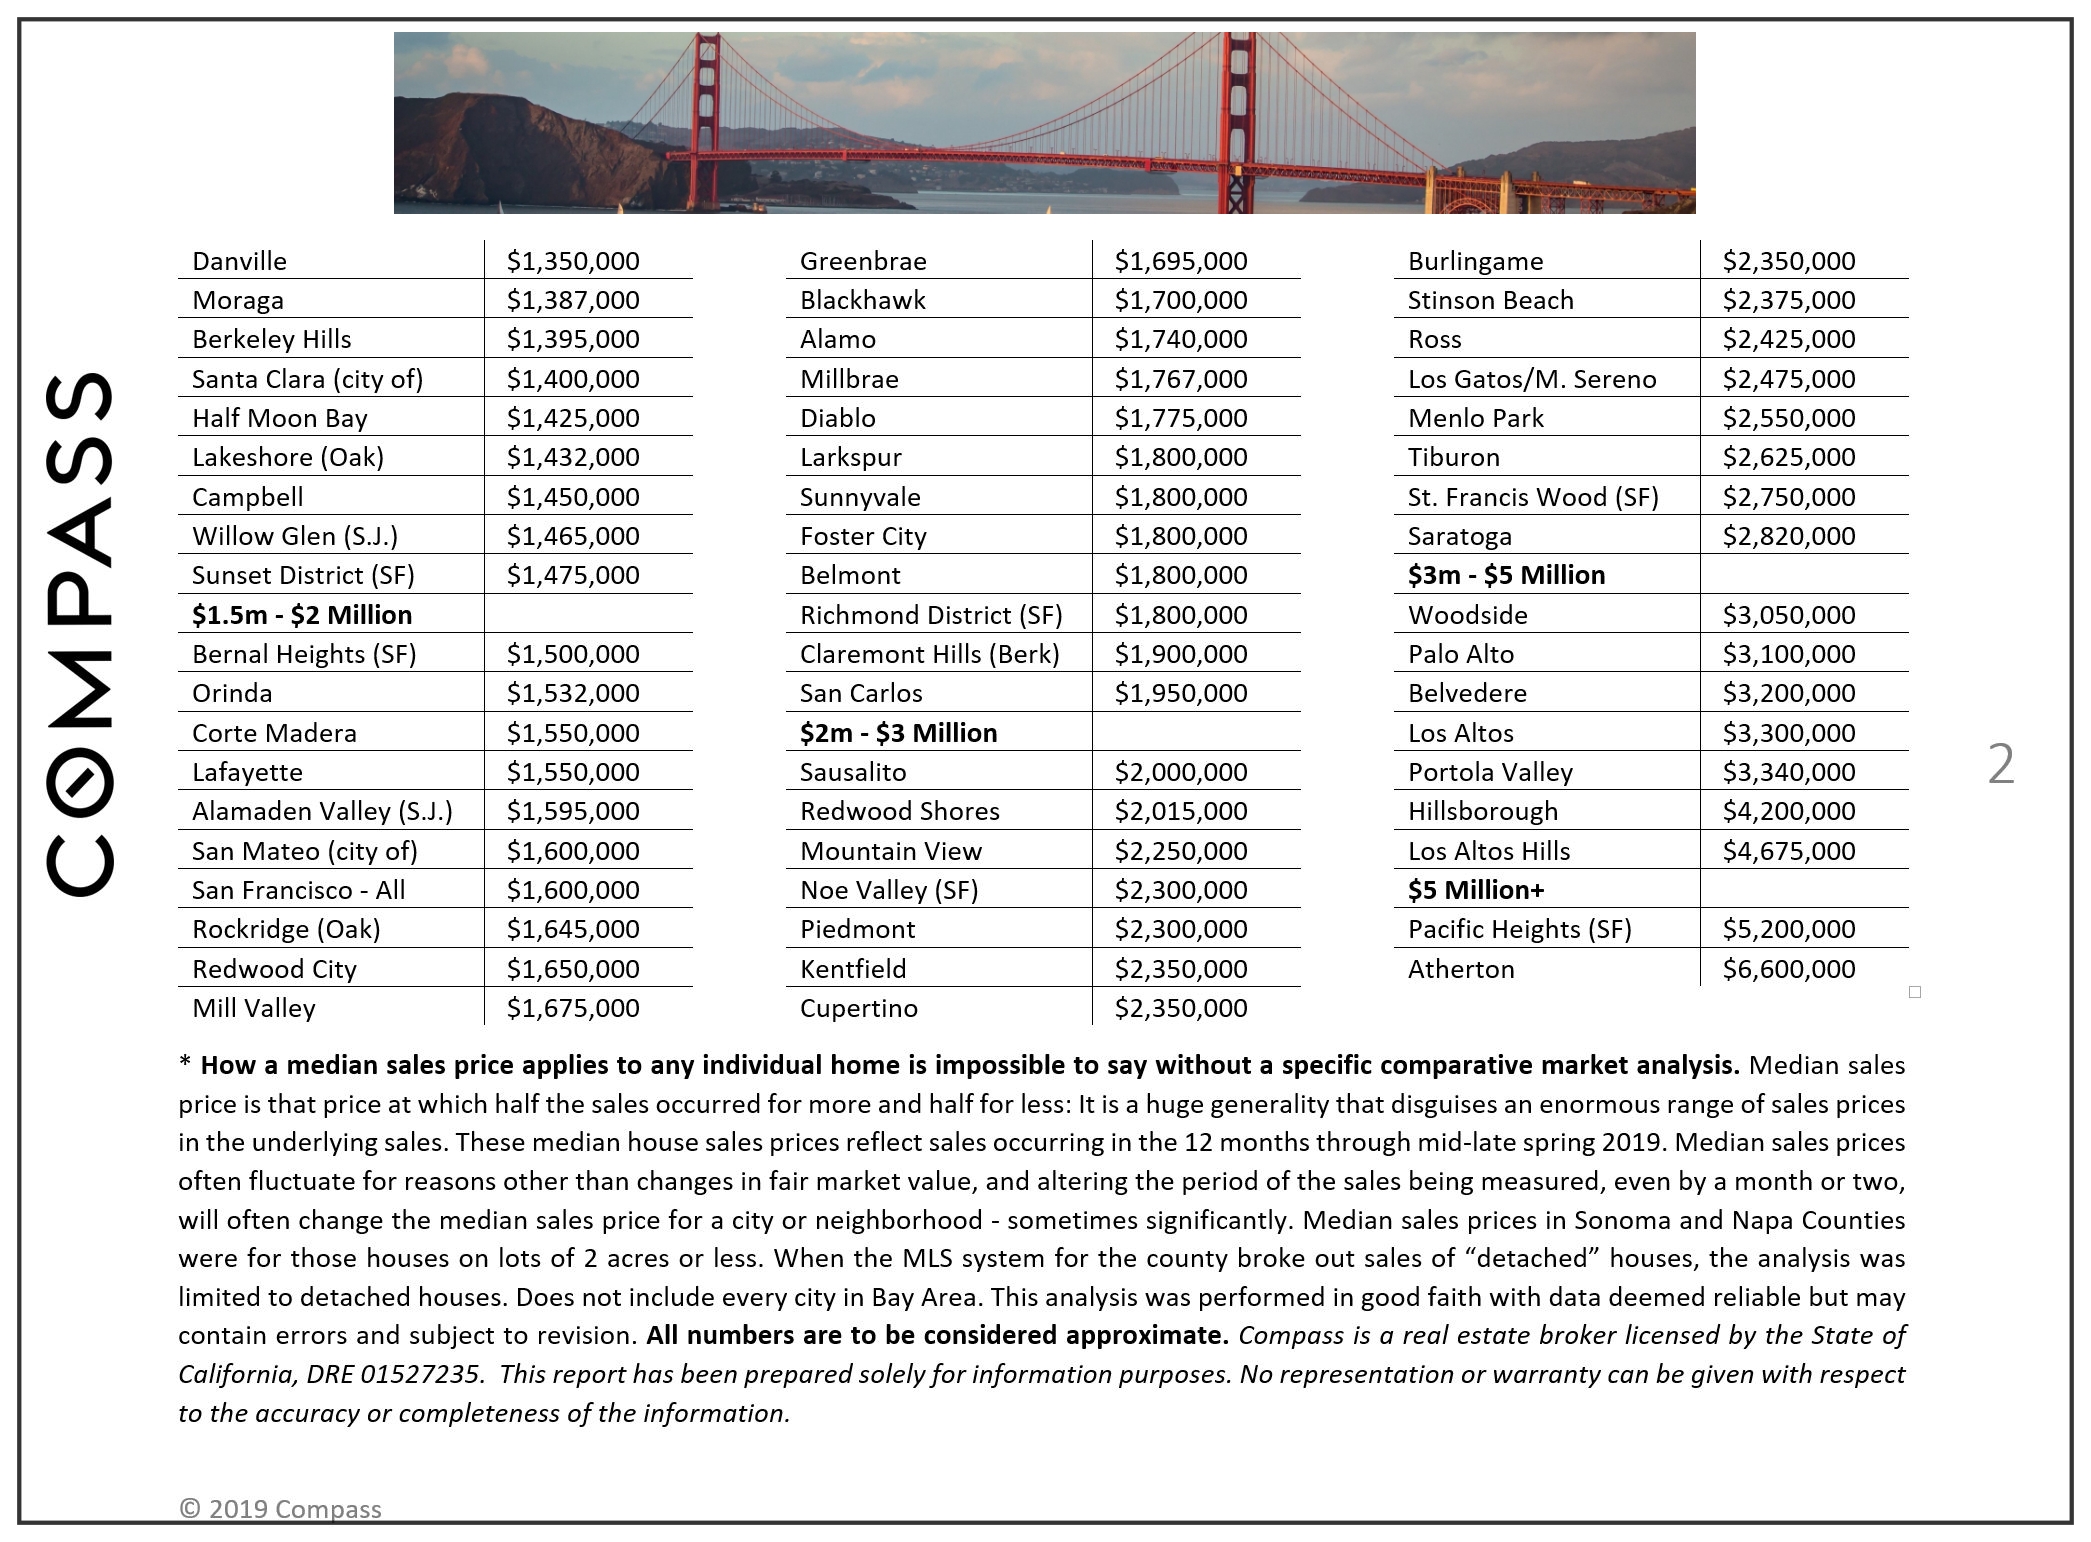
Needless to say, there are many factors behind home sales and values in different communities. Home size is one of them, and median sales prices are not apples to apples comparisons: For example, in Pacific Heights, the average house size is over 4000 square feet, while in Sunnyside, it runs about 1500 square feet.

Note that it is not uncommon for median sales prices to peak for the year in Q2.

Market Dynamics by Realtor District

Q2 is commonly the hottest market of the calendar year, and the statistics below generally reflect a very strong spring 2019 market.

Home Sales by Price Range

Of homes selling for under $1,000,000, over 80% were condos, co-ops and TICs, and most of those were smaller units.

Tenants, Fixer-Uppers, Homes without Parking, Homes with Golden Gate Bridge Views

Market Seasonality: The Autumn Spike,

Then the Winter Doldrums

Though spring is the biggest overall selling season in San Francisco, the single month with the highest number of new listings is typically September. This big surge fuels the relatively short autumn selling season – highlighted by the dramatic spike in sales in October. In November, activity begins to plunge for the mid-winter holidays – though homes continue to sell in every season.

Seasonality: New Listings by Month

New Listings – Long-Term Trends,
12-Month Rolling Figures

Seasonality: Listings Going into Contract
by Month

Higher-Price Home Sales

The central greater Noe-Eureka-Cole Valleys district now has the highest number of home sales over $2 million, but the northern Pacific Heights-Cow Hollow district dominates sales of $5 million and above.
The SF luxury home market is even more dramatically driven by seasonality than the general market. September often sees a tremendous burst of new listings. October is sometimes the single month with the most luxury house sales.

Long-Term Appreciation Trends by District

Though prices vary, appreciation trend lines since the recovery began in 2012 are often relatively similar.

In the next chart, we combine house sales across the swathe of older, prestige neighborhoods that run across the north of the city – generally speaking, a region of larger houses and higher prices. (Putting them on the chart above would flatten the other trend lines due to issues of scale.) None of these neighborhoods have that many sales – and some have very, very few – so we combine them to increase statistical reliability. Though they are all high-price, prices do vary considerably between them.

Median Two-Bedroom Condo Prices

by Realtor District

There is significantly less variation in condo prices in most of the neighborhoods of SF than there is with houses. Much of this has to do with all the new construction that has occurred in the last 20 years. Probably the greatest differences in condo values are between those on lower floors and those on higher floors of new luxury high-rises.

Percentage of Sales Selling for Over List Price
by Property Type

Median Percentage of Sales Price to List Price
by Property Type

Foreign National Home Buying Tumbles

According to a new report by the National Association of Realtors – based on a survey of its member agents – the purchase of U.S. homes by foreign nationals plunged in the 12 months through March 2019. The drop was particularly steep for Chinese nationals, for whom California (and the Bay Area, in particular) has been the top destination.

Stock Market Trends

The last 12 months have been an extremely dramatic time for financial markets as illustrated below. The alternating confidence and fear generated by its swings have been considerable factors in Bay Area real estate markets. A parallel dynamic has occurred with the swings in interest rates.

The spring burst in high-tech IPOs in San Francisco also played a role in the heat of the Q2 market.

Source: Compass

It is impossible to know how median and average value statistics apply to any particular home without a specific comparative market analysis. These analyses were made in good faith with data from sources deemed reliable, but may contain errors and are subject to revision. It is not our intent to convince you of a particular position, but to attempt to provide straightforward data and analysis, so you can make your own informed decisions. Median and average statistics are enormous generalities: There are hundreds of different markets in San Francisco and the Bay Area, each with its own unique dynamics. Median prices and average dollar per square foot values can be and often are affected by other factors besides changes in fair market value. Longer term trends are much more meaningful than short-term.

Compass is a real estate broker licensed by the State of California, DRE 01527235. Equal Housing Opportunity. This report has been prepared solely for information purposes. The information herein is based on or derived from information generally available to the public and/or from sources believed to be reliable. No representation or warranty can be given with respect to the accuracy or completeness of the information. Compass disclaims any and all liability relating to this report, including without limitation any express or implied representations or warranties for statements contained in, and omissions from, the report. Nothing contained herein is intended to be or should be read as any regulatory, legal, tax, accounting or other advice and Compass does not provide such advice. All opinions are subject to change without notice. Compass makes no representation regarding the accuracy of any statements regarding any references to the laws, statutes or regulations of any state are those of the author(s). Past performance is no guarantee of future results.

San Francisco Real Estate, July 2019


San Francisco Bay Area Home Prices
by City, Town & Selected City Neighborhoods

Source: Compass

It is impossible to know how median and average value statistics apply to any particular home without a specific comparative market analysis. These analyses were made in good faith with data from sources deemed reliable, but may contain errors and are subject to revision. It is not our intent to convince you of a particular position, but to attempt to provide straightforward data and analysis, so you can make your own informed decisions. Median and average statistics are enormous generalities: There are hundreds of different markets in San Francisco and the Bay Area, each with its own unique dynamics. Median prices and average dollar per square foot values can be and often are affected by other factors besides changes in fair market value. Longer term trends are much more meaningful than short-term.

Compass is a real estate broker licensed by the State of California, DRE 01527235. Equal Housing Opportunity. This report has been prepared solely for information purposes. The information herein is based on or derived from information generally available to the public and/or from sources believed to be reliable. No representation or warranty can be given with respect to the accuracy or completeness of the information. Compass disclaims any and all liability relating to this report, including without limitation any express or implied representations or warranties for statements contained in, and omissions from, the report. Nothing contained herein is intended to be or should be read as any regulatory, legal, tax, accounting or other advice and Compass does not provide such advice. All opinions are subject to change without notice. Compass makes no representation regarding the accuracy of any statements regarding any references to the laws, statutes or regulations of any state are those of the author(s). Past performance is no guarantee of future results.

San Francisco Real Estate, June 2019

Source: Compass

It is impossible to know how median and average value statistics apply to any particular home without a specific comparative market analysis. These analyses were made in good faith with data from sources deemed reliable, but may contain errors and are subject to revision. It is not our intent to convince you of a particular position, but to attempt to provide straightforward data and analysis, so you can make your own informed decisions. Median and average statistics are enormous generalities: There are hundreds of different markets in San Francisco and the Bay Area, each with its own unique dynamics. Median prices and average dollar per square foot values can be and often are affected by other factors besides changes in fair market value. Longer term trends are much more meaningful than short-term.

Compass is a real estate broker licensed by the State of California, DRE 01527235. Equal Housing Opportunity. This report has been prepared solely for information purposes. The information herein is based on or derived from information generally available to the public and/or from sources believed to be reliable. No representation or warranty can be given with respect to the accuracy or completeness of the information. Compass disclaims any and all liability relating to this report, including without limitation any express or implied representations or warranties for statements contained in, and omissions from, the report. Nothing contained herein is intended to be or should be read as any regulatory, legal, tax, accounting or other advice and Compass does not provide such advice. All opinions are subject to change without notice. Compass makes no representation regarding the accuracy of any statements regarding any references to the laws, statutes or regulations of any state are those of the author(s). Past performance is no guarantee of future results.

San Francisco Real Estate, May 2019

High-Demand Spring Market Slightly Below Last Year’s Home Price Peaks


With April’s end, we now have 2 months of spring season data unaffected by the end of 2018, when financial markets plunged. As of early May 2019, stock markets have recovered to hit new highs, interest rates are far lower than last year’s peak, and our local, unicorn IPOs have begun to roll out after a media frenzy of speculation on their potential effects on the market.

The market has heated up considerably from the slowdown in the second half of 2018, with strong buyer demand for a very limited inventory of listings. Median home sales prices have returned to highs close to those in spring 2018, but, so far, last year’s peaks have not been exceeded. This is a big change from the year-over-year appreciation rates of the past 6-7 years.

However, there are still 2 months of spring sales data to come in (before the typical summer slowdown), and word on the street is that some new listings are again generating feverish bidding wars between buyers.


Monthly Median House Sales Prices


Monthly median sales prices are often affected by other factors besides changes in fair market value – for example, the extreme seasonality of luxury home sales – but the above chart helps illustrate trends over the past 2 years: Spring 2018 was one of the hottest markets in history, with dramatic year-over-year price appreciation. The market then cooled, stock markets turned scary, and interest rates climbed. 2019 has heated up again, but, so far, 

without any y-o-y median price gains.

The most expensive housing market in the country has, for the time being, stopped becoming more expensive.


Year-over-Year Comparisons


The table below compares the March-April market statistics of 2018 and 2019. Prices were stable, overbidding was down, and luxury home sales were up, but most statistics were remarkably similar to last year’s. The SF and Oakland-Berkeley markets are currently the strongest in the Bay Area.


Home Sales by Price Range & Bedroom Count


Below is an illustration of sales of houses, condos, co-ops and TICs over the past 12 months, by price segment and by number of bedrooms.

Condos now constitute the biggest share of sales in San Francisco, which mostly explains the high columns for 1- and 2-bedroom sales in the $500,000 to $1.5 million range.


District Sales & Median Home Prices


The next 2 charts break down the last 12 months of sales by Realtor District (delineated on the map above). Some districts were split into 2 for these analyses, but all these areas contain neighborhoods of differing characteristics and home values.


House Sales, Median Prices & Median Sizes


The two biggest districts by volume of house sales – Bayview/ Excelsior/ Crocker Amazon (D10) and Sunset/ Parkside/ GG Heights (D2) – are also 2 of the 3 most affordable districts for purchasing a house in the city. Many of the older districts with bigger, more expensive houses are relatively small markets.


Condo Sales & Median 2-BR/2-BA Condo Prices


Condo sales in SF run across a wide range of eras and styles, from Victorian and Edwardian units in small buildings, through brand new, ultra-luxury high-rise penthouses. The breakout of median sales prices pertain to 2-bedroom, 2 bath condos only.


San Francisco Luxury Homes Markets by District


We typically define the SF luxury house market as houses selling for $3 million+, and the luxury condo, co-op and TIC market as those selling for $2 million+.


SF Luxury House Sales by District


The central Noe, Eureka and Cole Valleys district (D5) dominates the market for houses selling from $3 to $4.99 million. The northern Pacific Heights-Cow Hollow district (D7) dominates the $5 million+ ultra-luxury segment. But high-end home sales are scattered across the city.


Luxury Condo, Co-op & TIC Sales by District


Luxury condo sales are concentrated in 3 districts: District 9, where most of the newer, high-rise, luxury projects are found in the South Beach/Yerba Buena area (which 30 years ago was filled with parking lots and auto-stereo shops), and in the old-prestige, northern neighborhoods of Districts 7 & 8, which include Pacific Heights and Russian Hill. (This is also where the city’s high-price co-op units are clustered).


Q1 2019 “Ultra-Luxury” Homes Markets


We start the “ultra-luxury” segments at $5 million for houses, and $3 million for condos and co-ops. There has been a large (and continuing) surge in the construction of very expensive condo projects over the last 15 years, which makes for a greatly increased inventory of high-price condos for sale – and softer market dynamics.


House Size & Era of Construction


Many factors influence home construction size during any particular period: Affluence, economic conditions, household size, buyer age, land costs, population growth, natural disasters, etc. Generally speaking, the median size of houses was larger during the Victorian-Edwardian era, and declined through the 1940’s – when enormous swathes of the city were built out in the south and southwest districts. Home sizes then began increasing again, and are now larger than ever – however, few new houses are currently built in the city.

The sizes of houses built in earlier periods have increased over the years due to renovations: Adding that 2nd bathroom, or a 3rd bedroom behind the garage.

Condos have become the major alternative for people purchasing homes of smaller size.


Selected Demographic & Economic Factors


Population Growth


SF has seen a dramatic population increase over the past 10 years, and by percentage growth, SF had the 2nd highest rate in the Bay Area after Alameda County. But new census data indicates the rate of growth is rapidly dropping.

Our latest burst of growth – an increase of about 78,000 or 10% – with all its social and economic effects, looks paltry compared to the 1940’s, when the city’s population soared by 140,000, a jump of 22% that began with WWII.


Commuting


Venture Capital Investment


In recent years, the Bay Area has been the biggest destination of venture capital investment dollars in the country – and probably the world. These tens of billions of dollars have constituted a massive factor in the local economy, supercharging the creation of new companies, hiring, and, eventually, IPOs. Venture capital is effectively seed money that has exploded into the creation of stupendous amounts of new wealth.


Source: Compass

It is impossible to know how median and average value statistics apply to any particular home without a specific comparative market analysis. These analyses were made in good faith with data from sources deemed reliable, but may contain errors and are subject to revision. It is not our intent to convince you of a particular position, but to attempt to provide straightforward data and analysis, so you can make your own informed decisions. Median and average statistics are enormous generalities: There are hundreds of different markets in San Francisco and the Bay Area, each with its own unique dynamics. Median prices and average dollar per square foot values can be and often are affected by other factors besides changes in fair market value. Longer term trends are much more meaningful than short-term.

Compass is a real estate broker licensed by the State of California, DRE 01527235. Equal Housing Opportunity. This report has been prepared solely for information purposes. The information herein is based on or derived from information generally available to the public and/or from sources believed to be reliable. No representation or warranty can be given with respect to the accuracy or completeness of the information. Compass disclaims any and all liability relating to this report, including without limitation any express or implied representations or warranties for statements contained in, and omissions from, the report. Nothing contained herein is intended to be or should be read as any regulatory, legal, tax, accounting or other advice and Compass does not provide such advice. All opinions are subject to change without notice. Compass makes no representation regarding the accuracy of any statements regarding any references to the laws, statutes or regulations of any state are those of the author(s). Past performance is no guarantee of future results.

Skip to content