Rising Interest Rates Continued to Impact Supply & Demand in October, But Early November Brings Big Shift in Economic Indicators
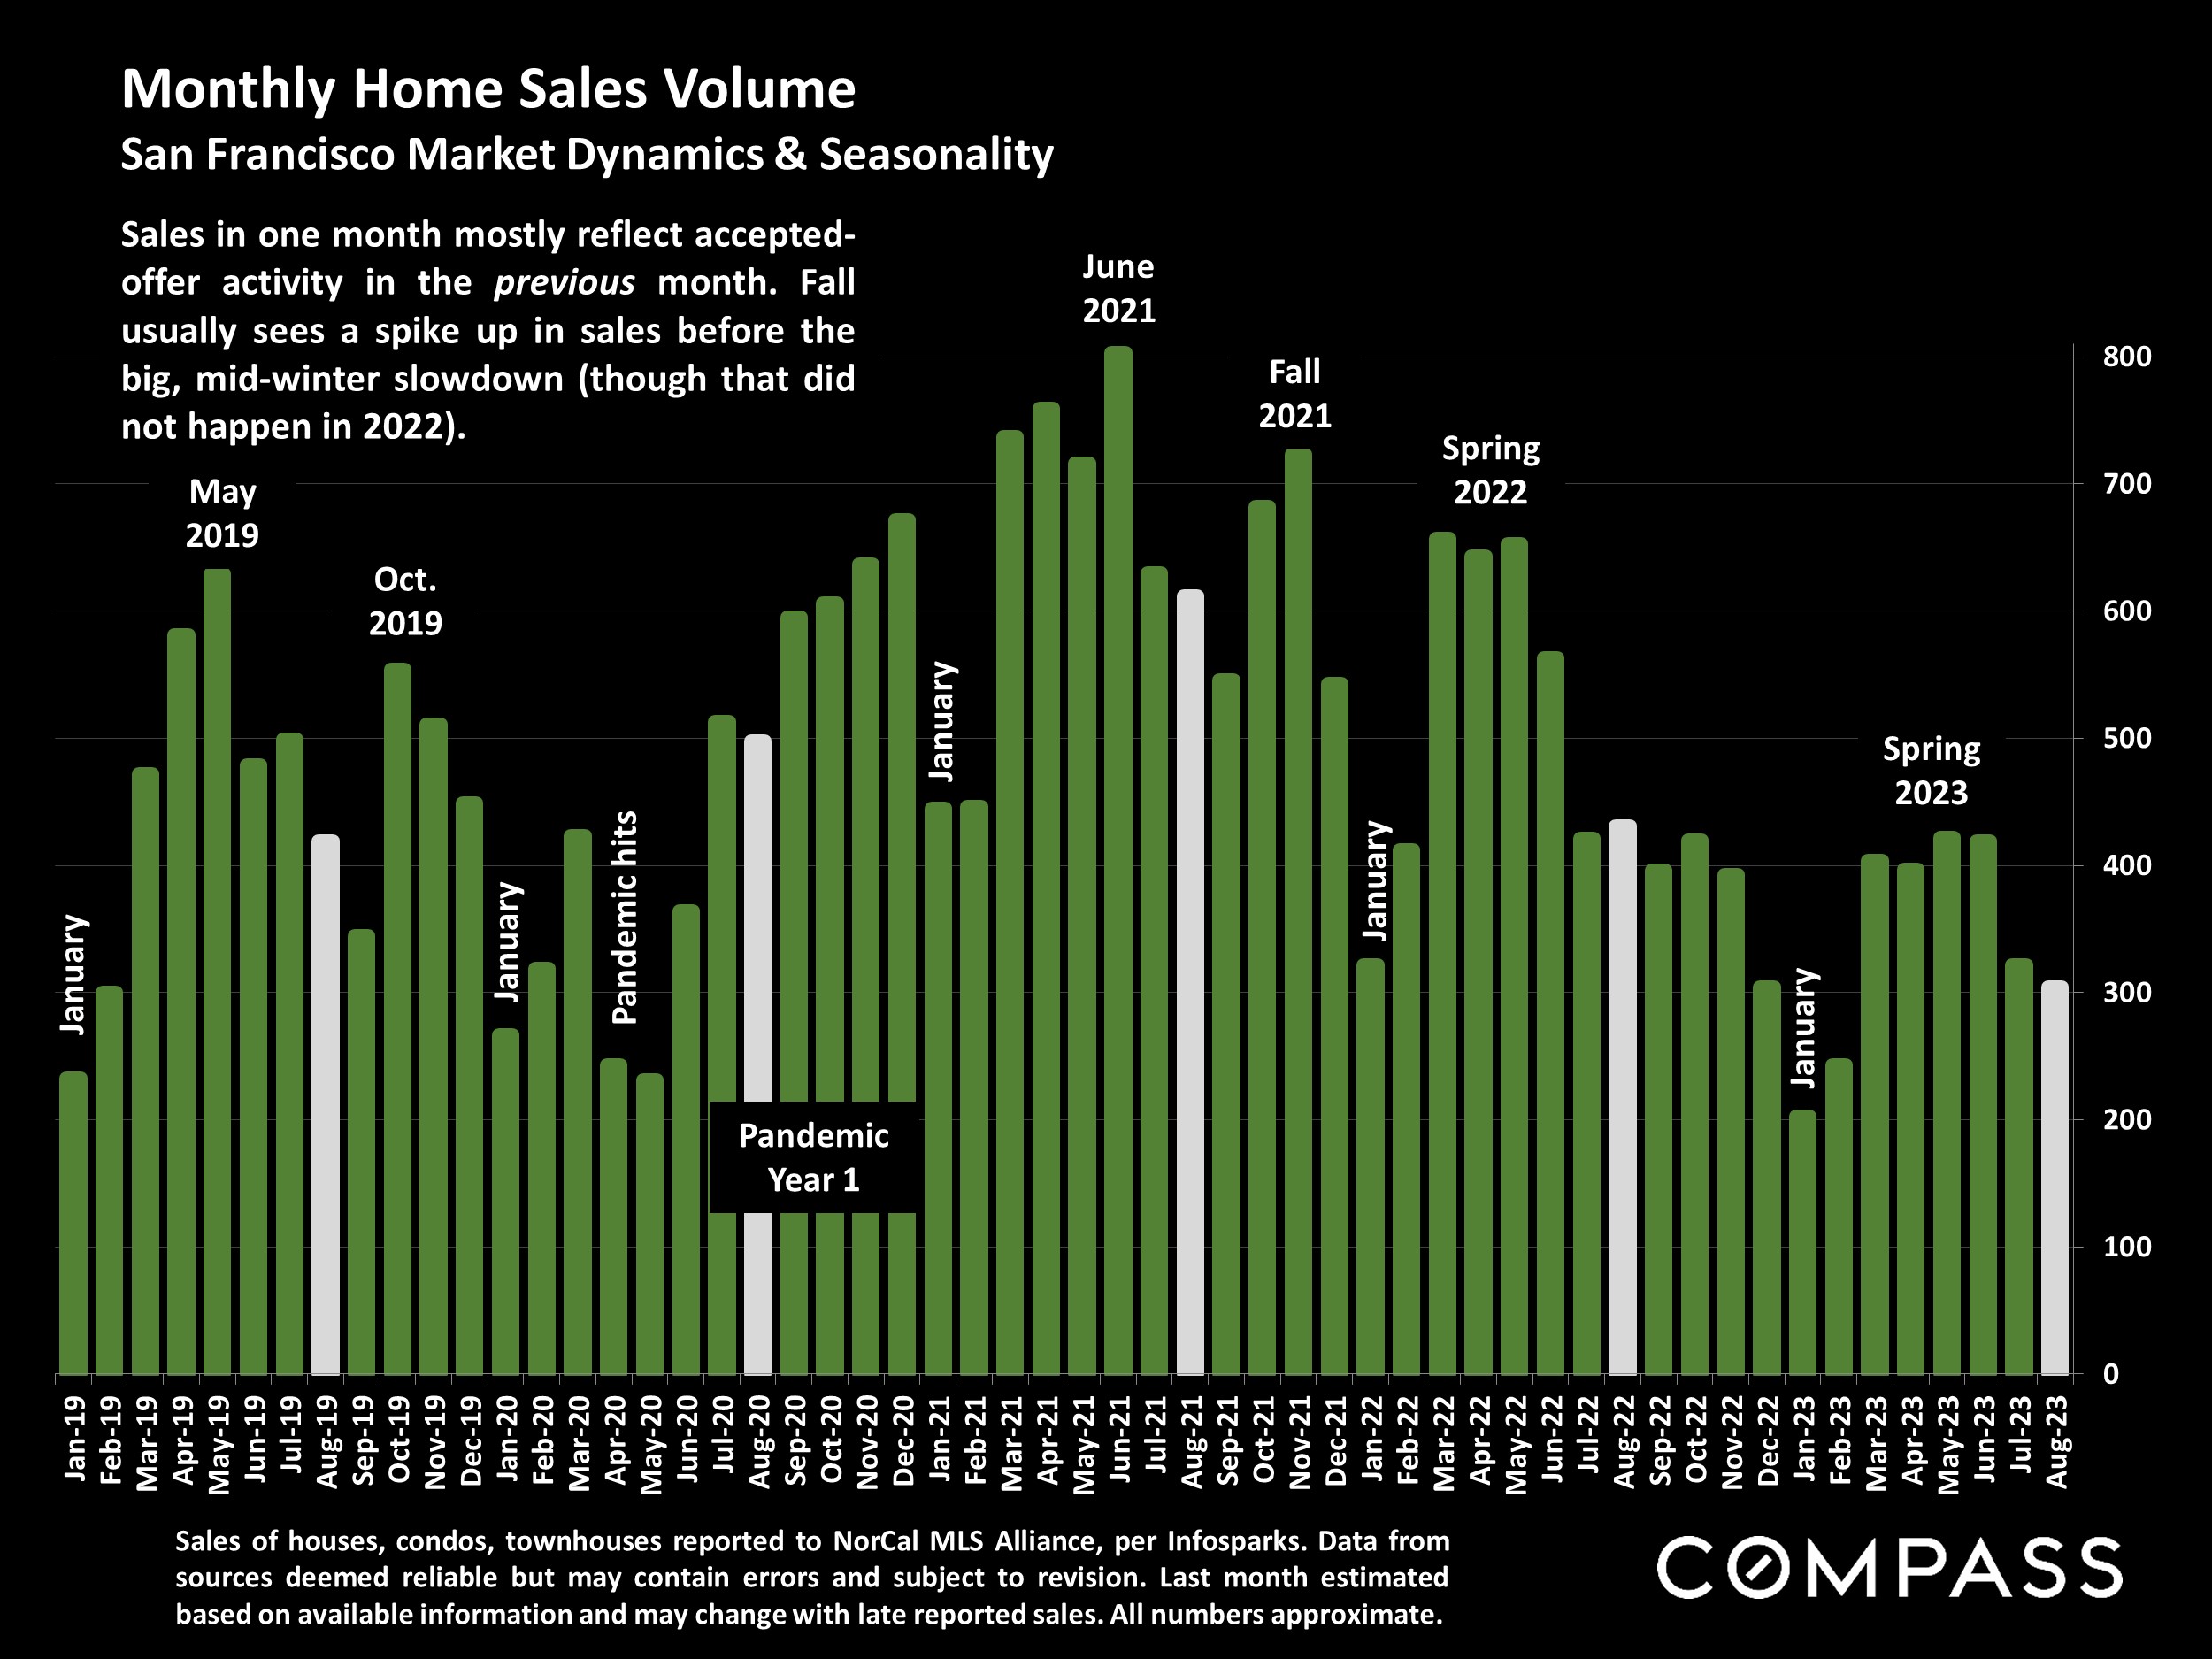
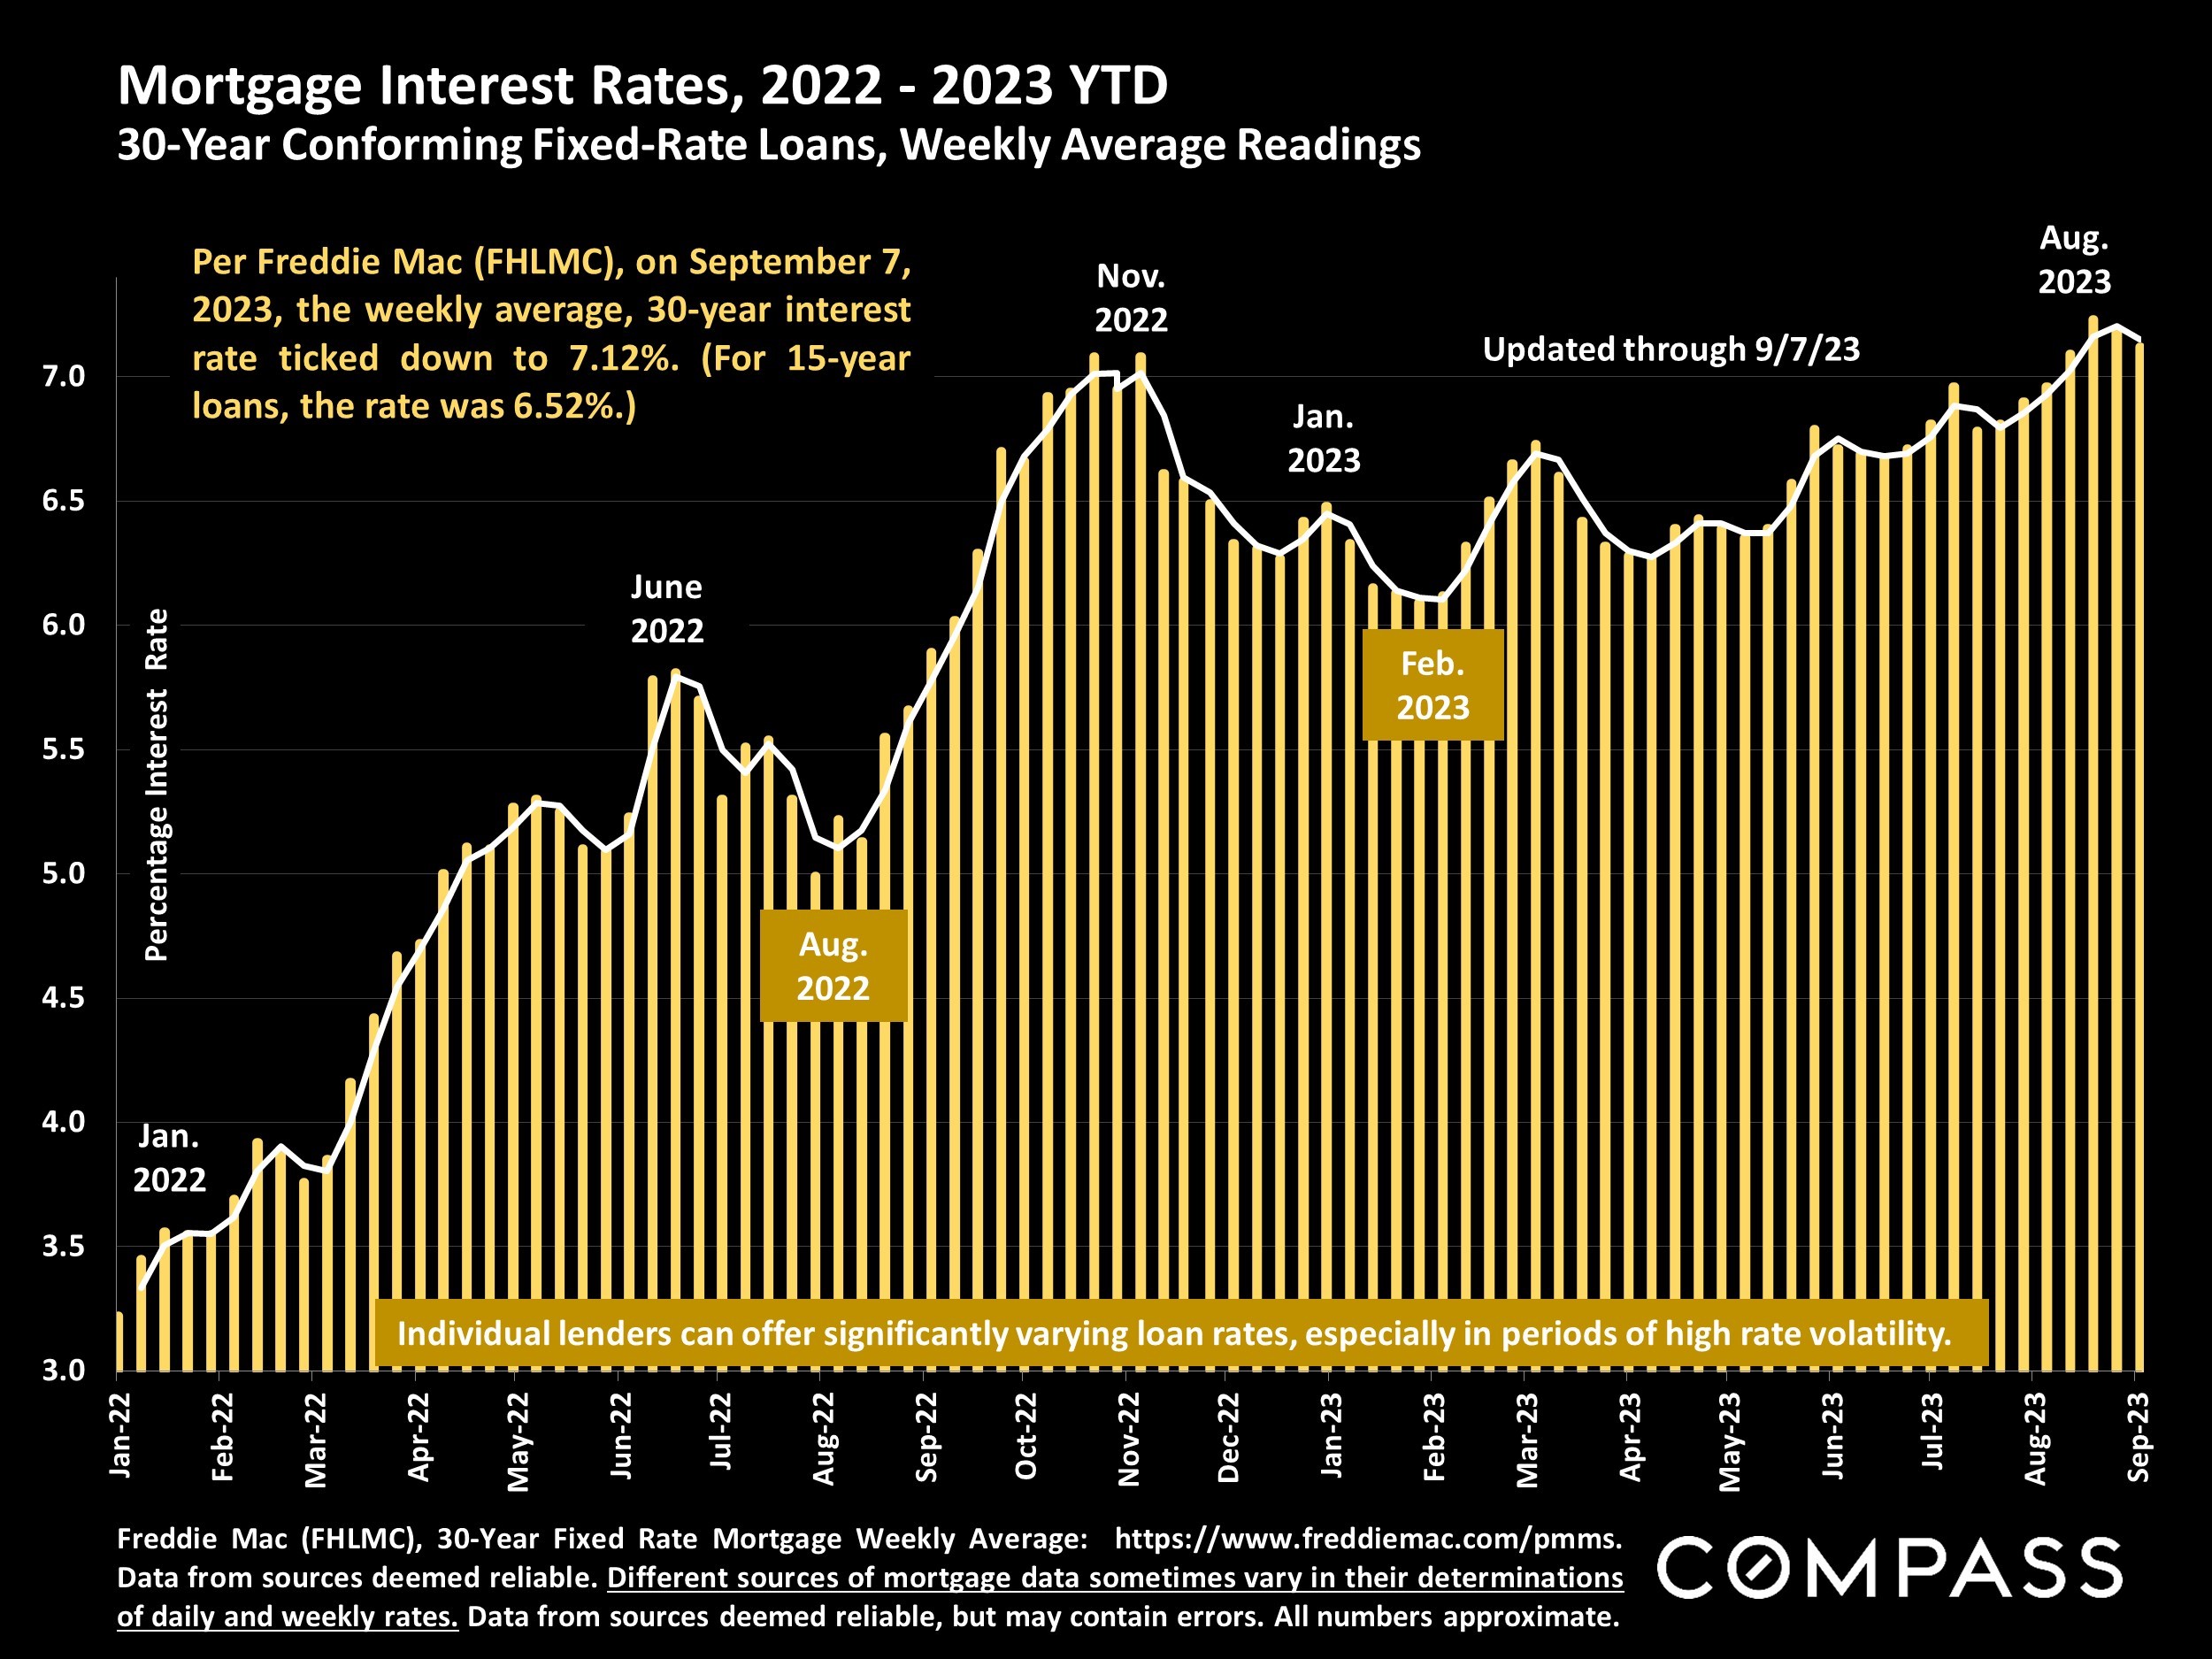
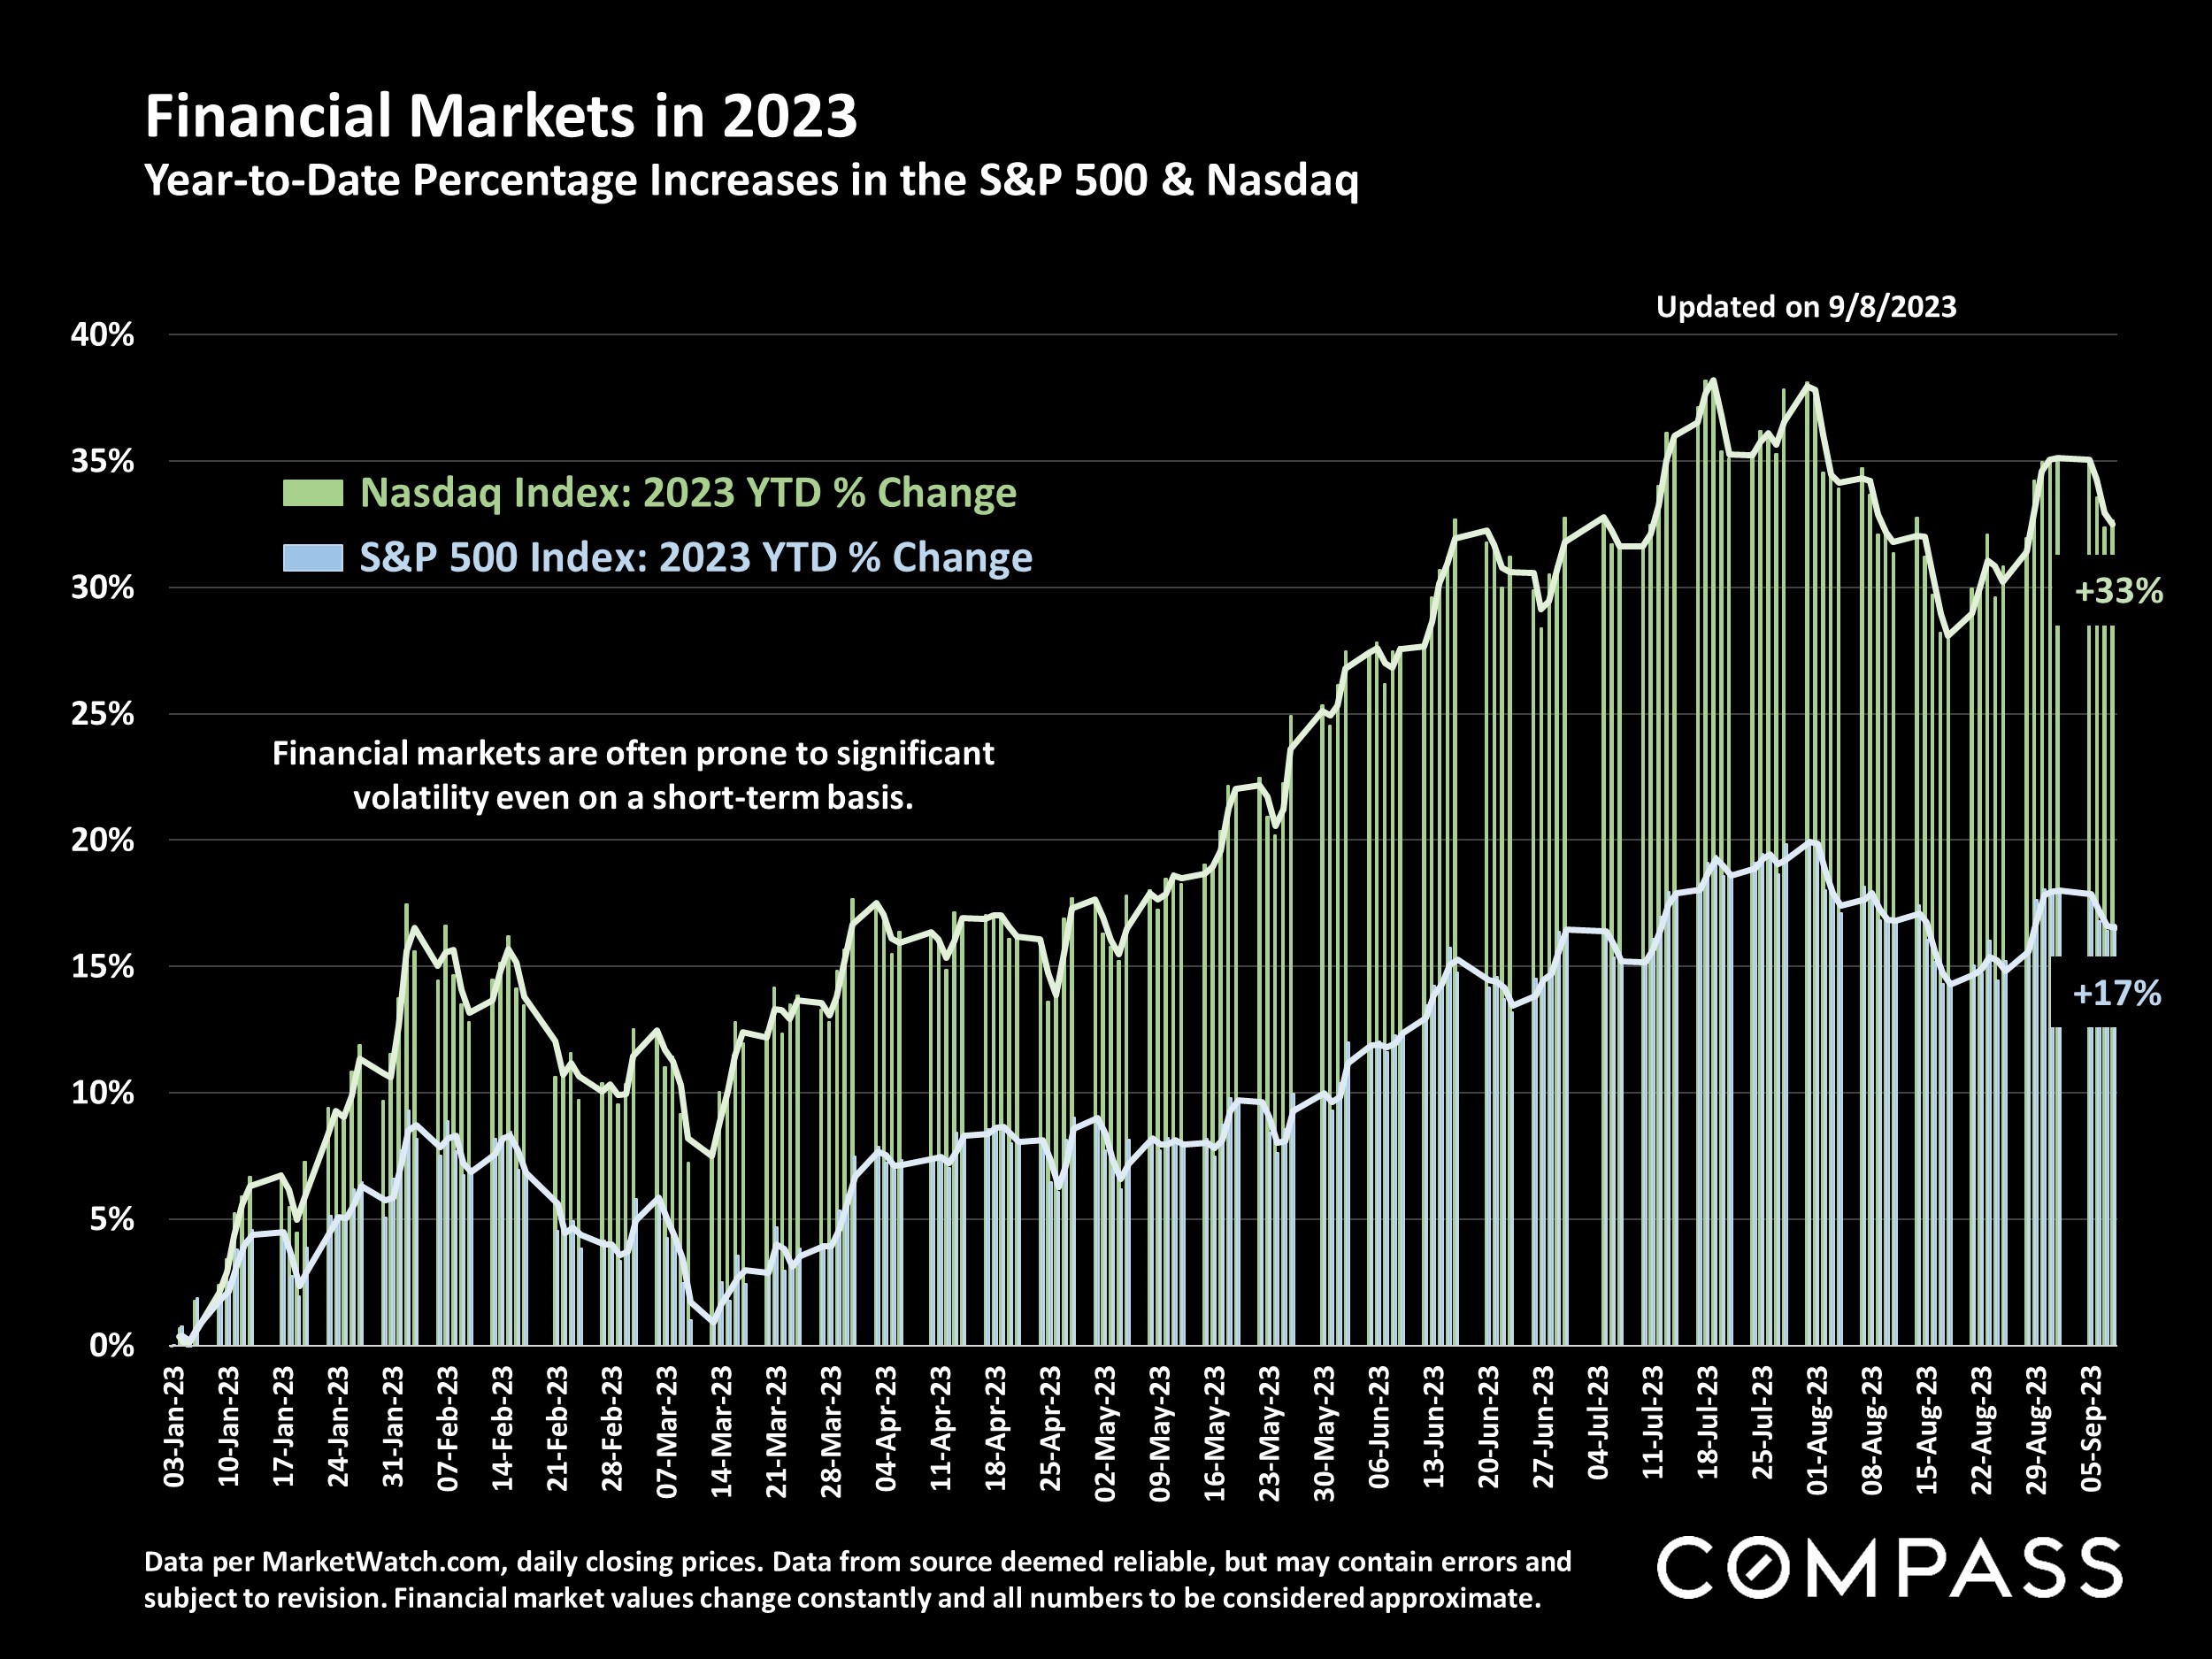
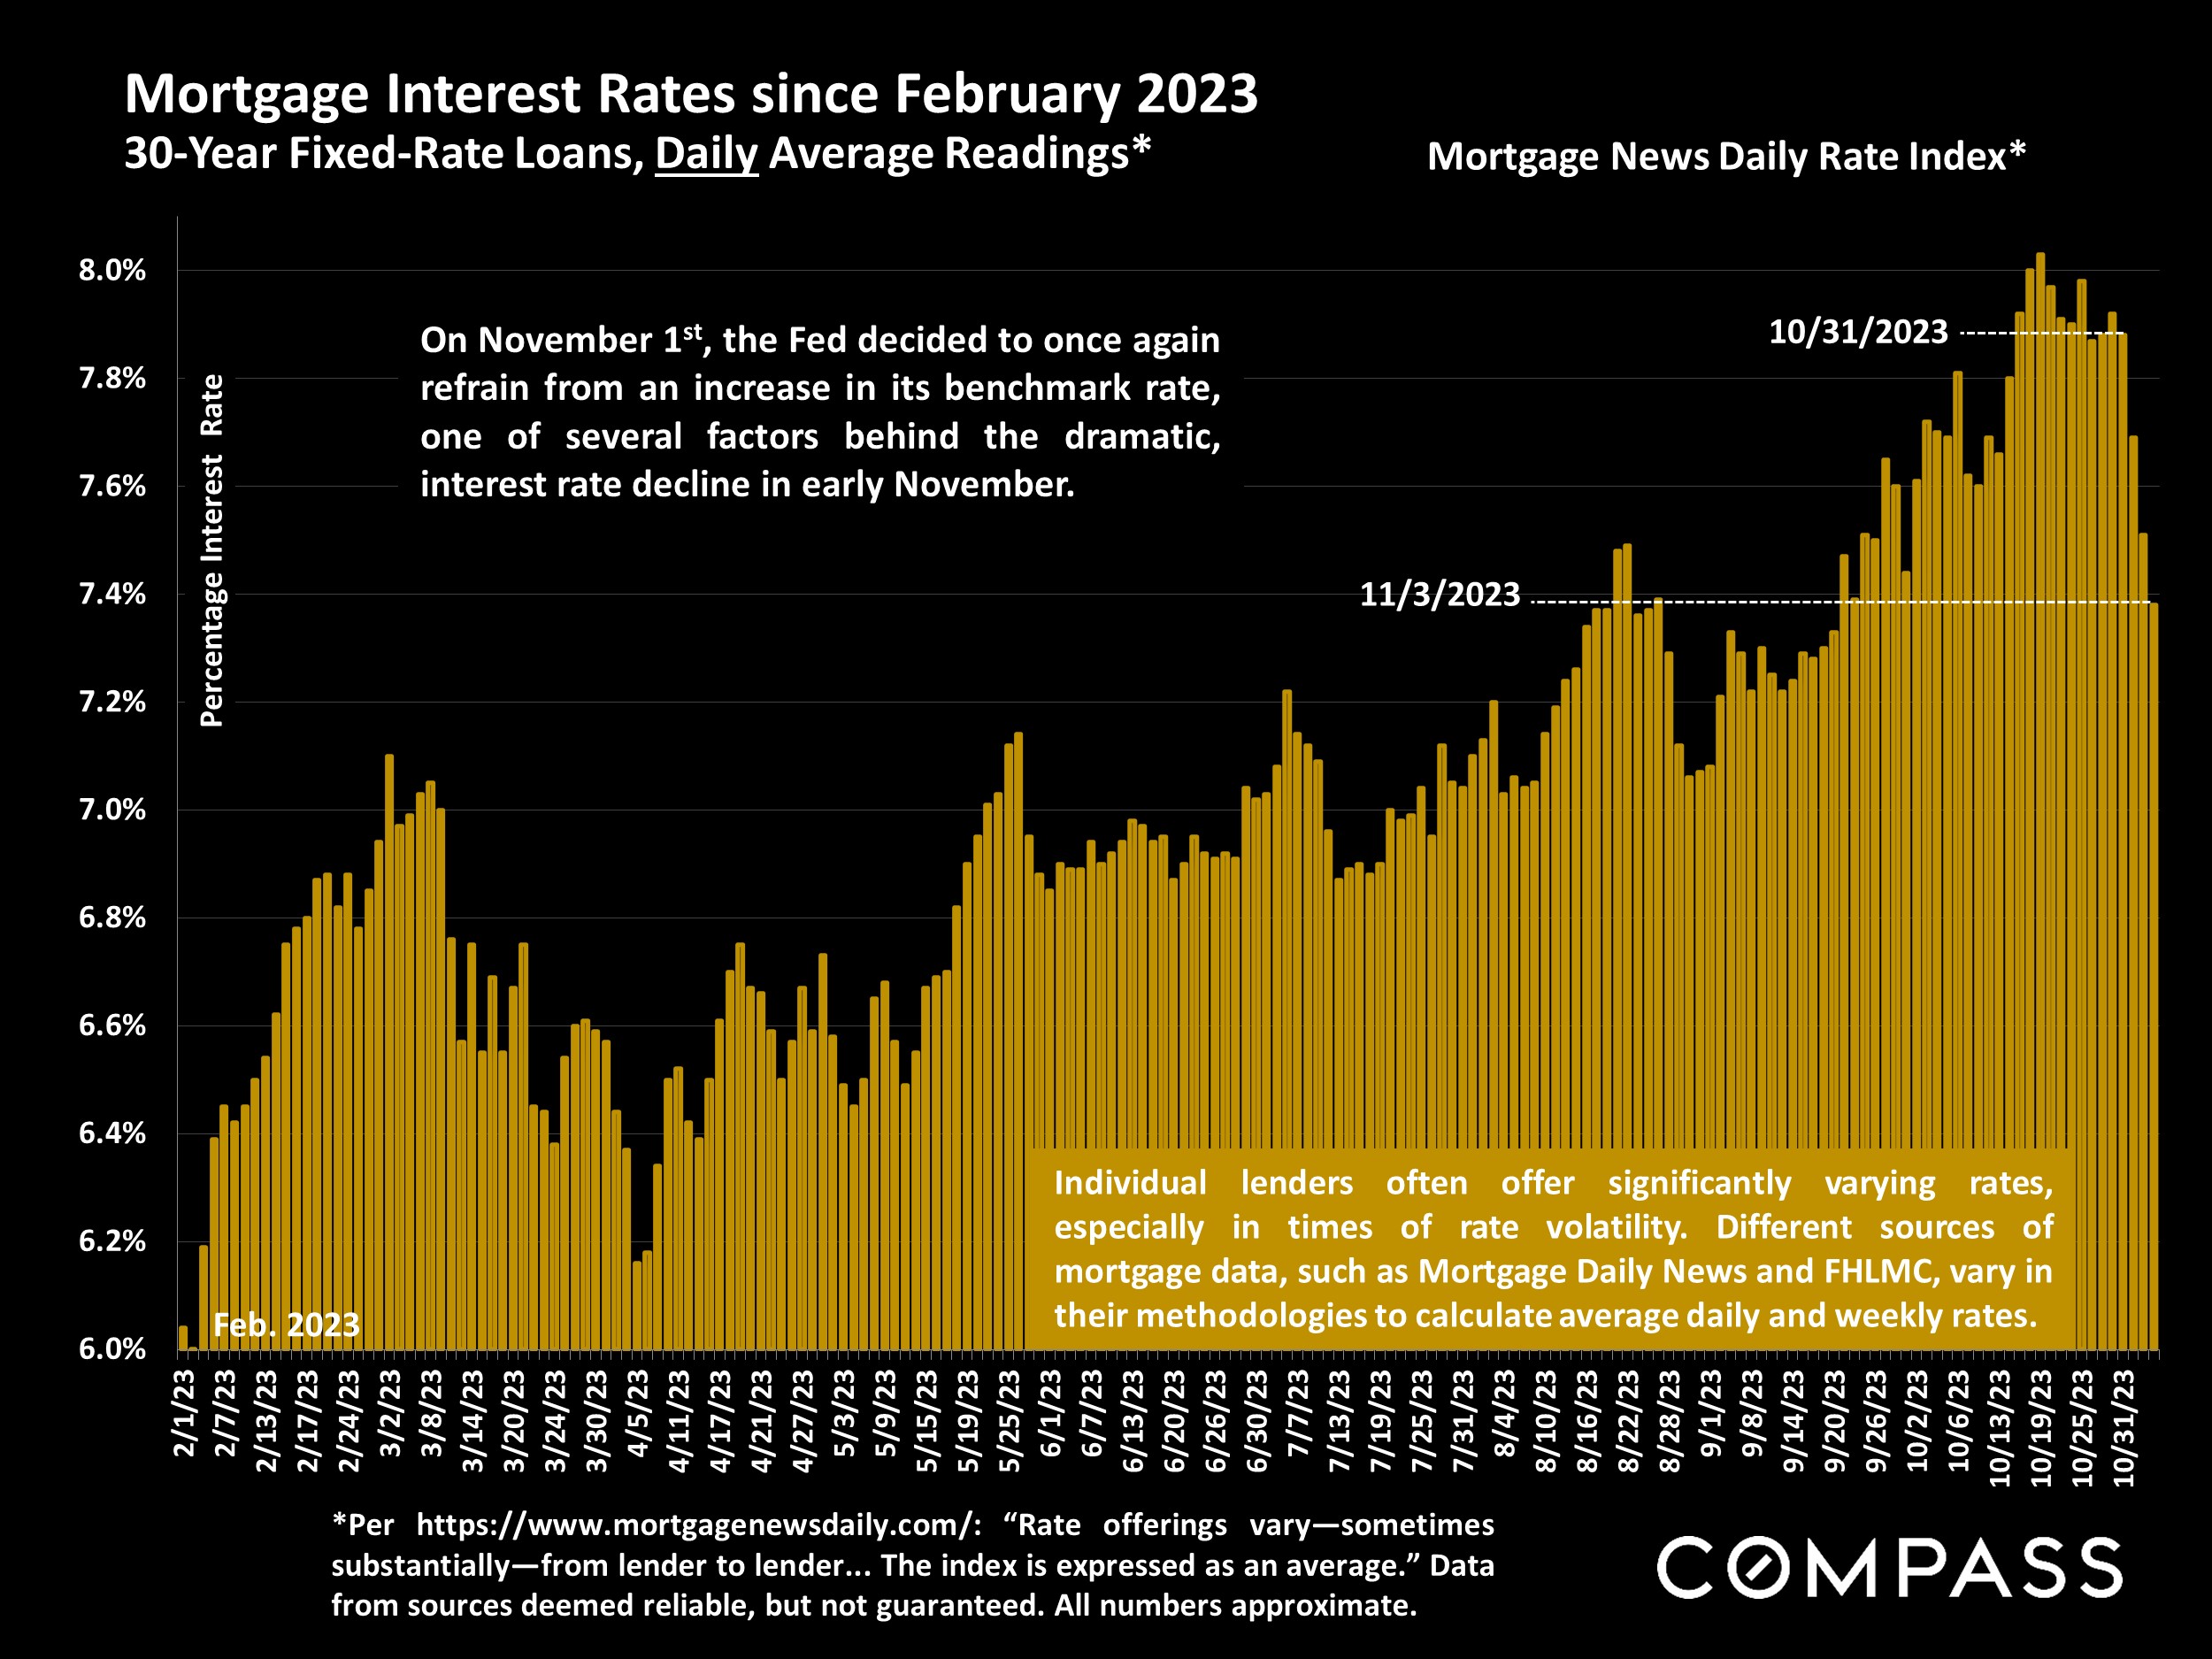
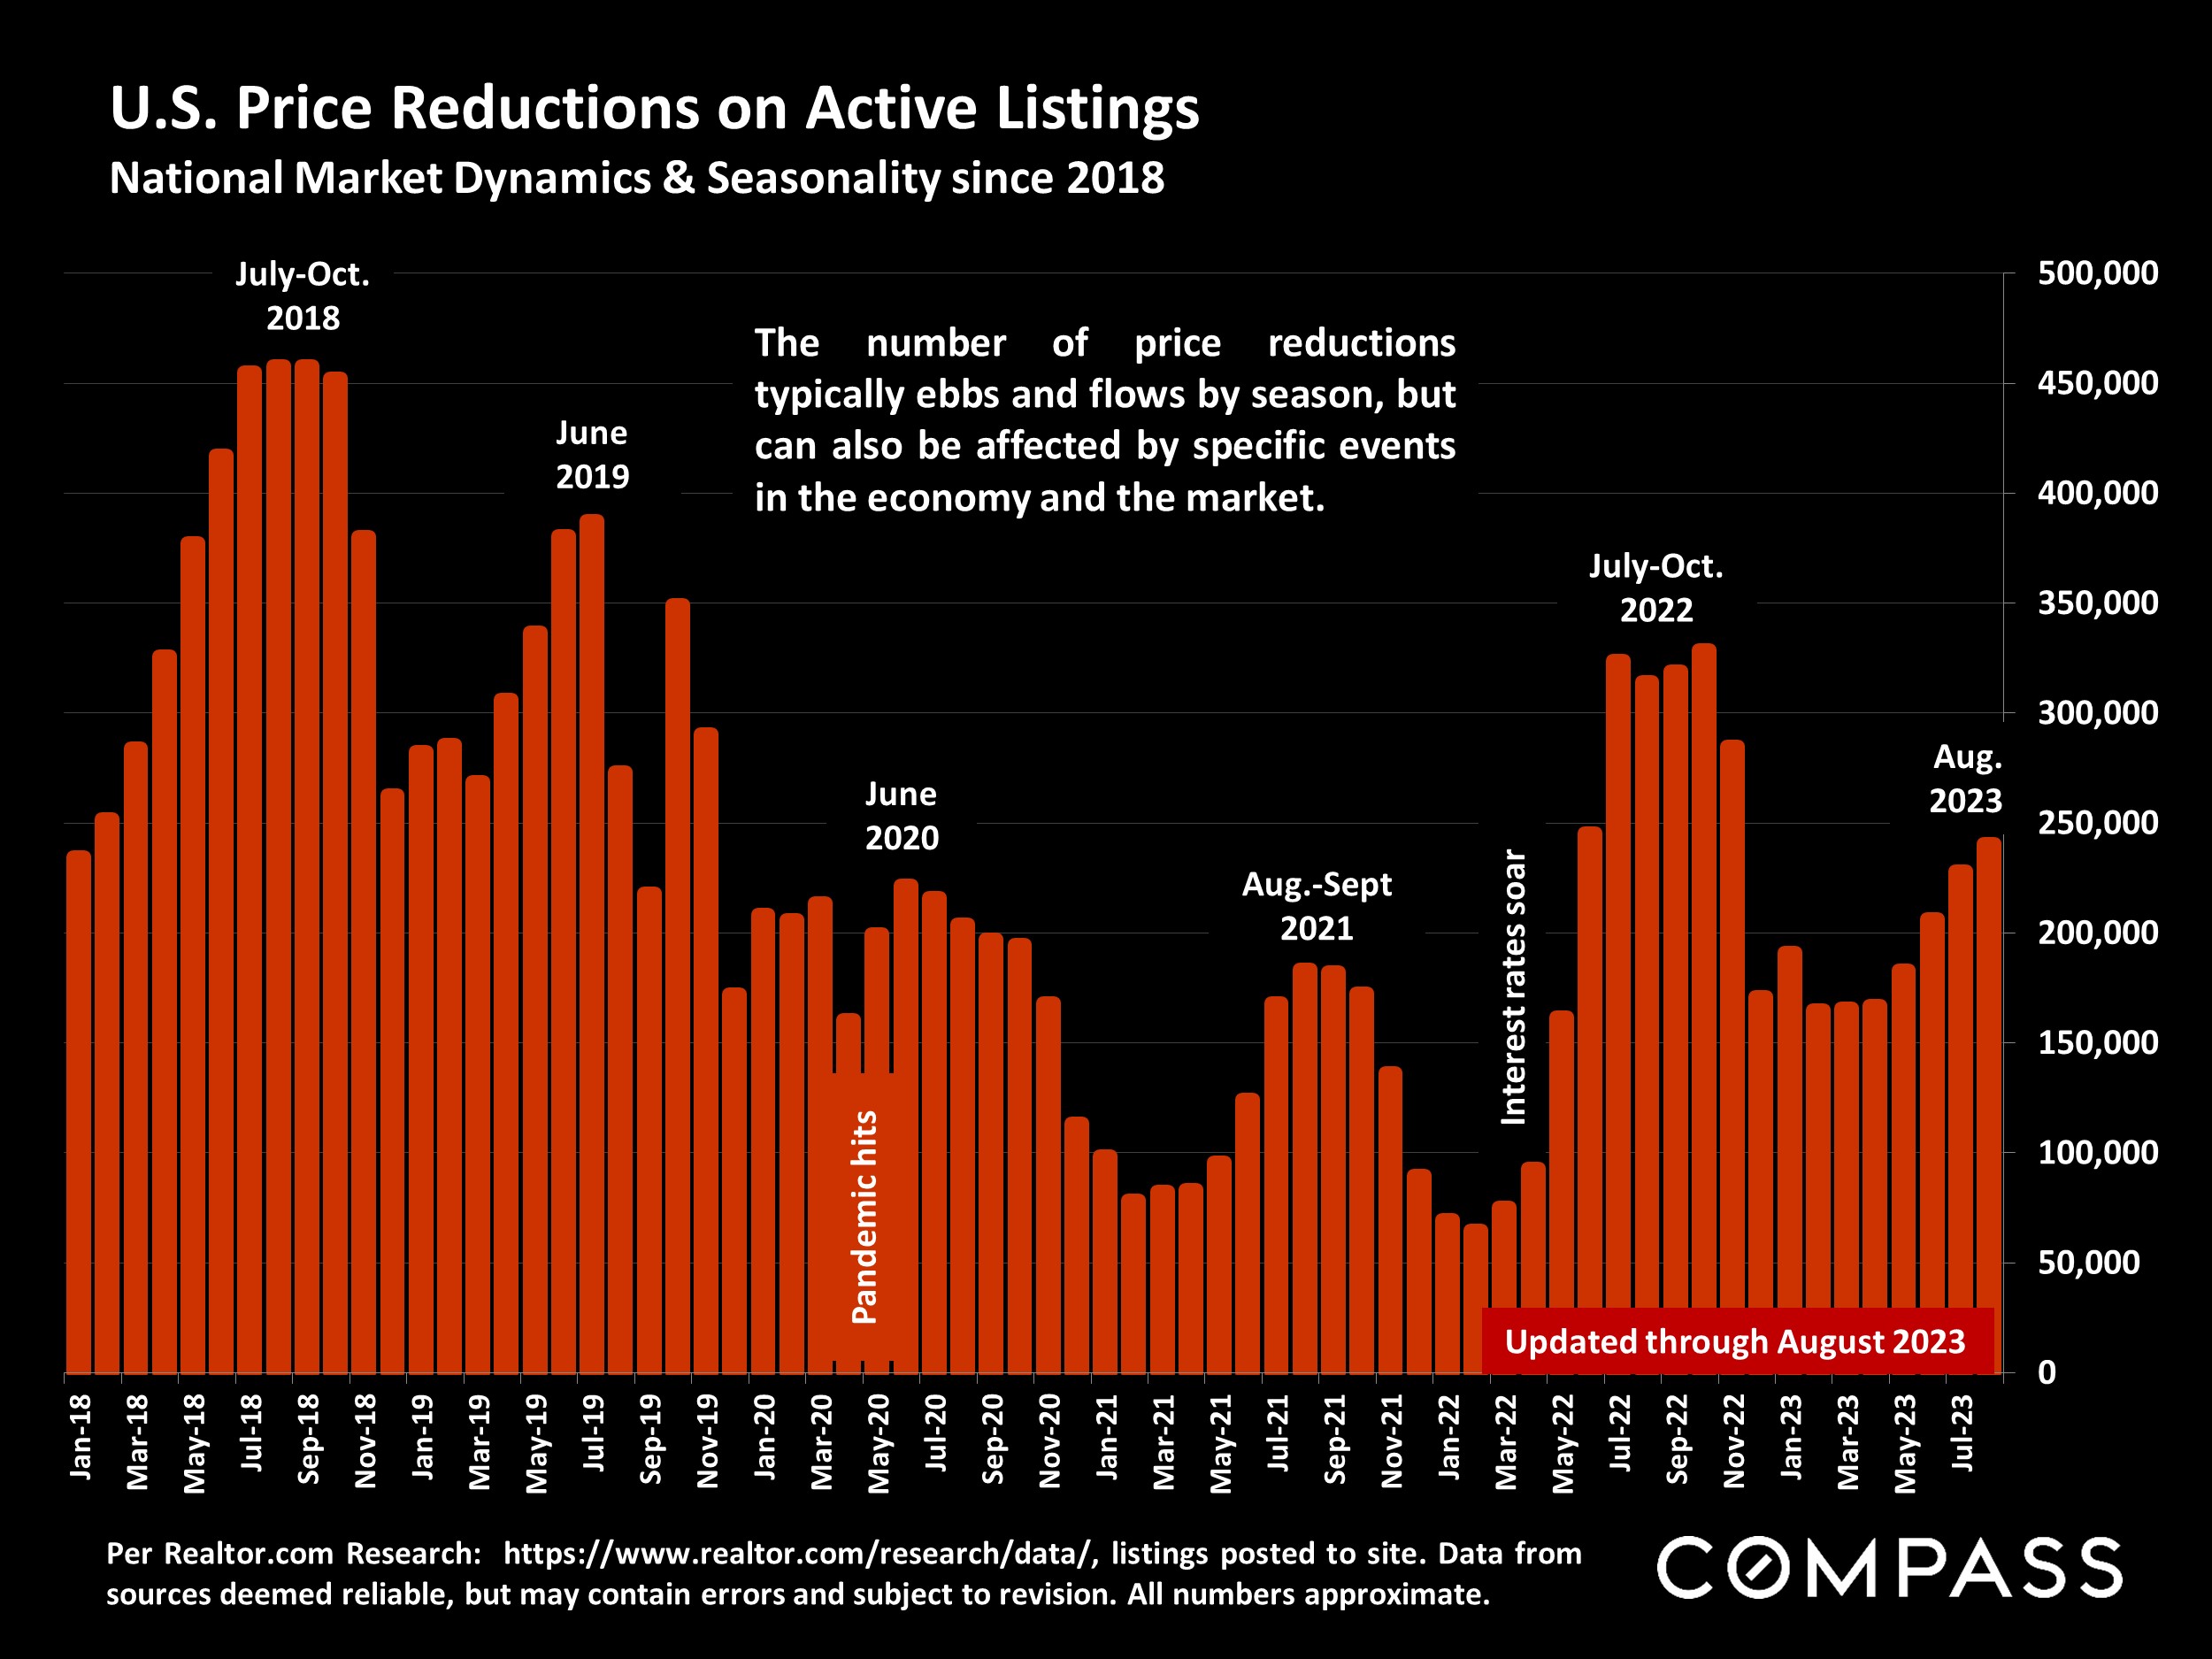
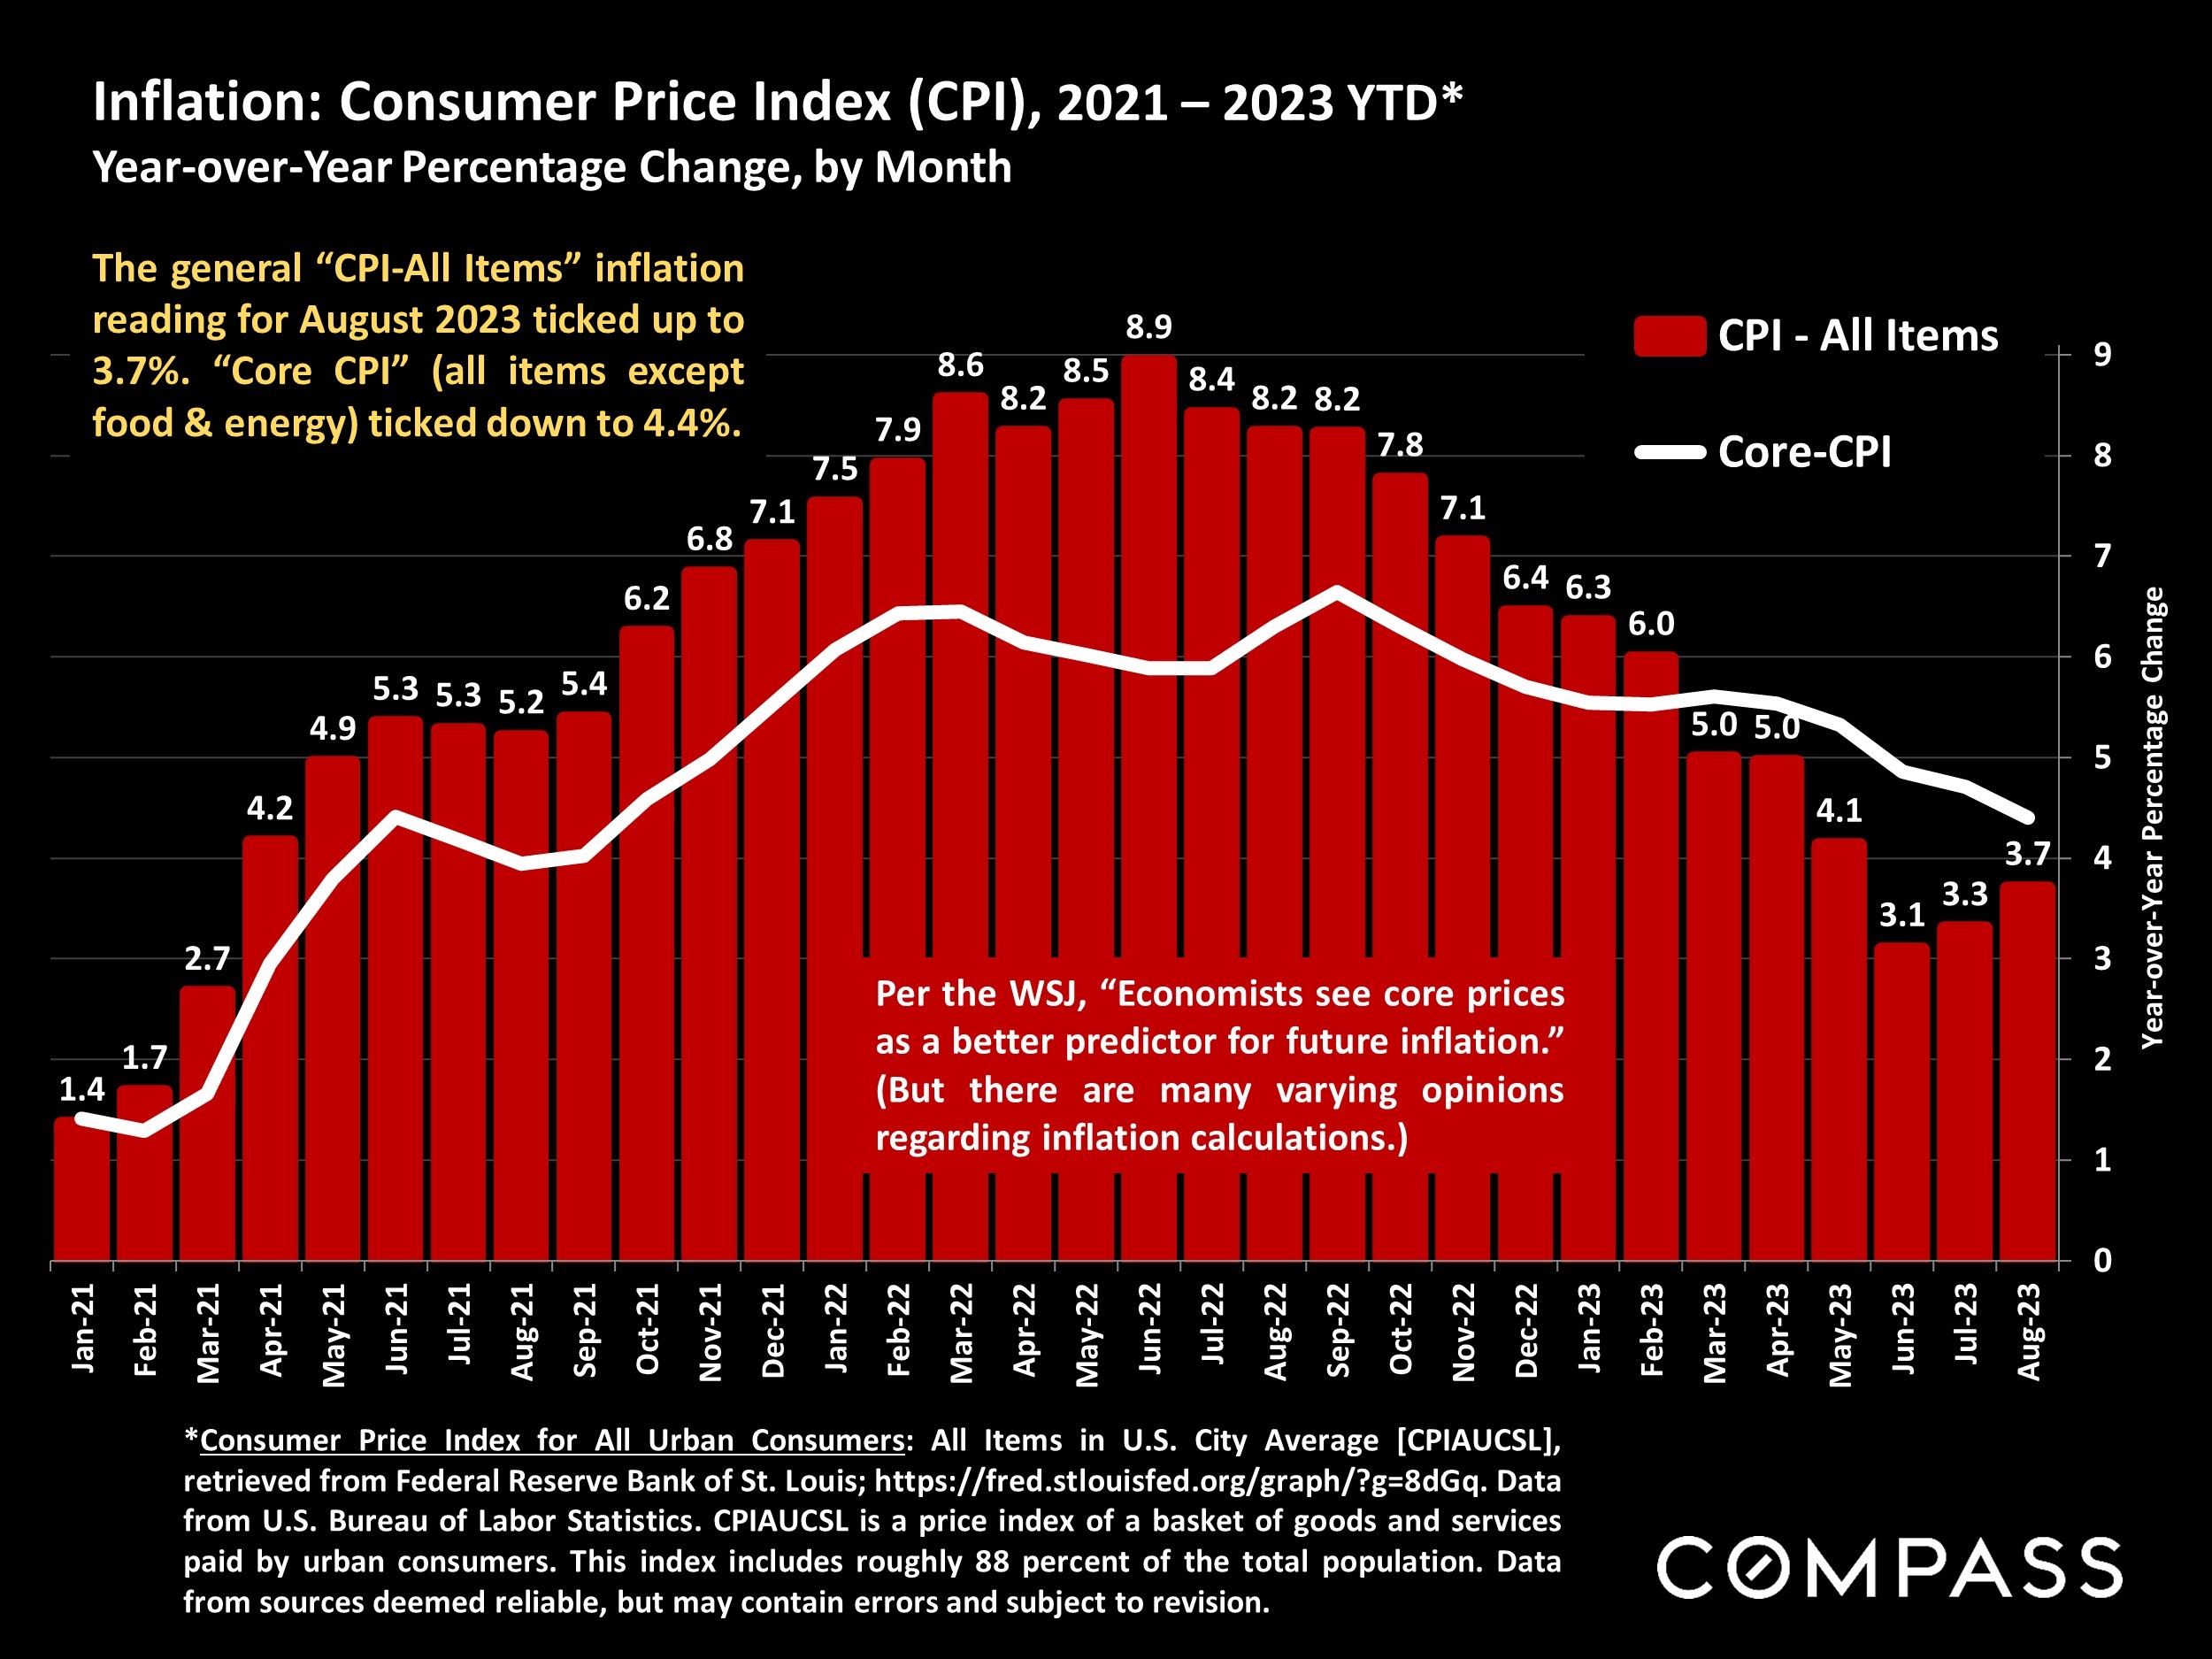
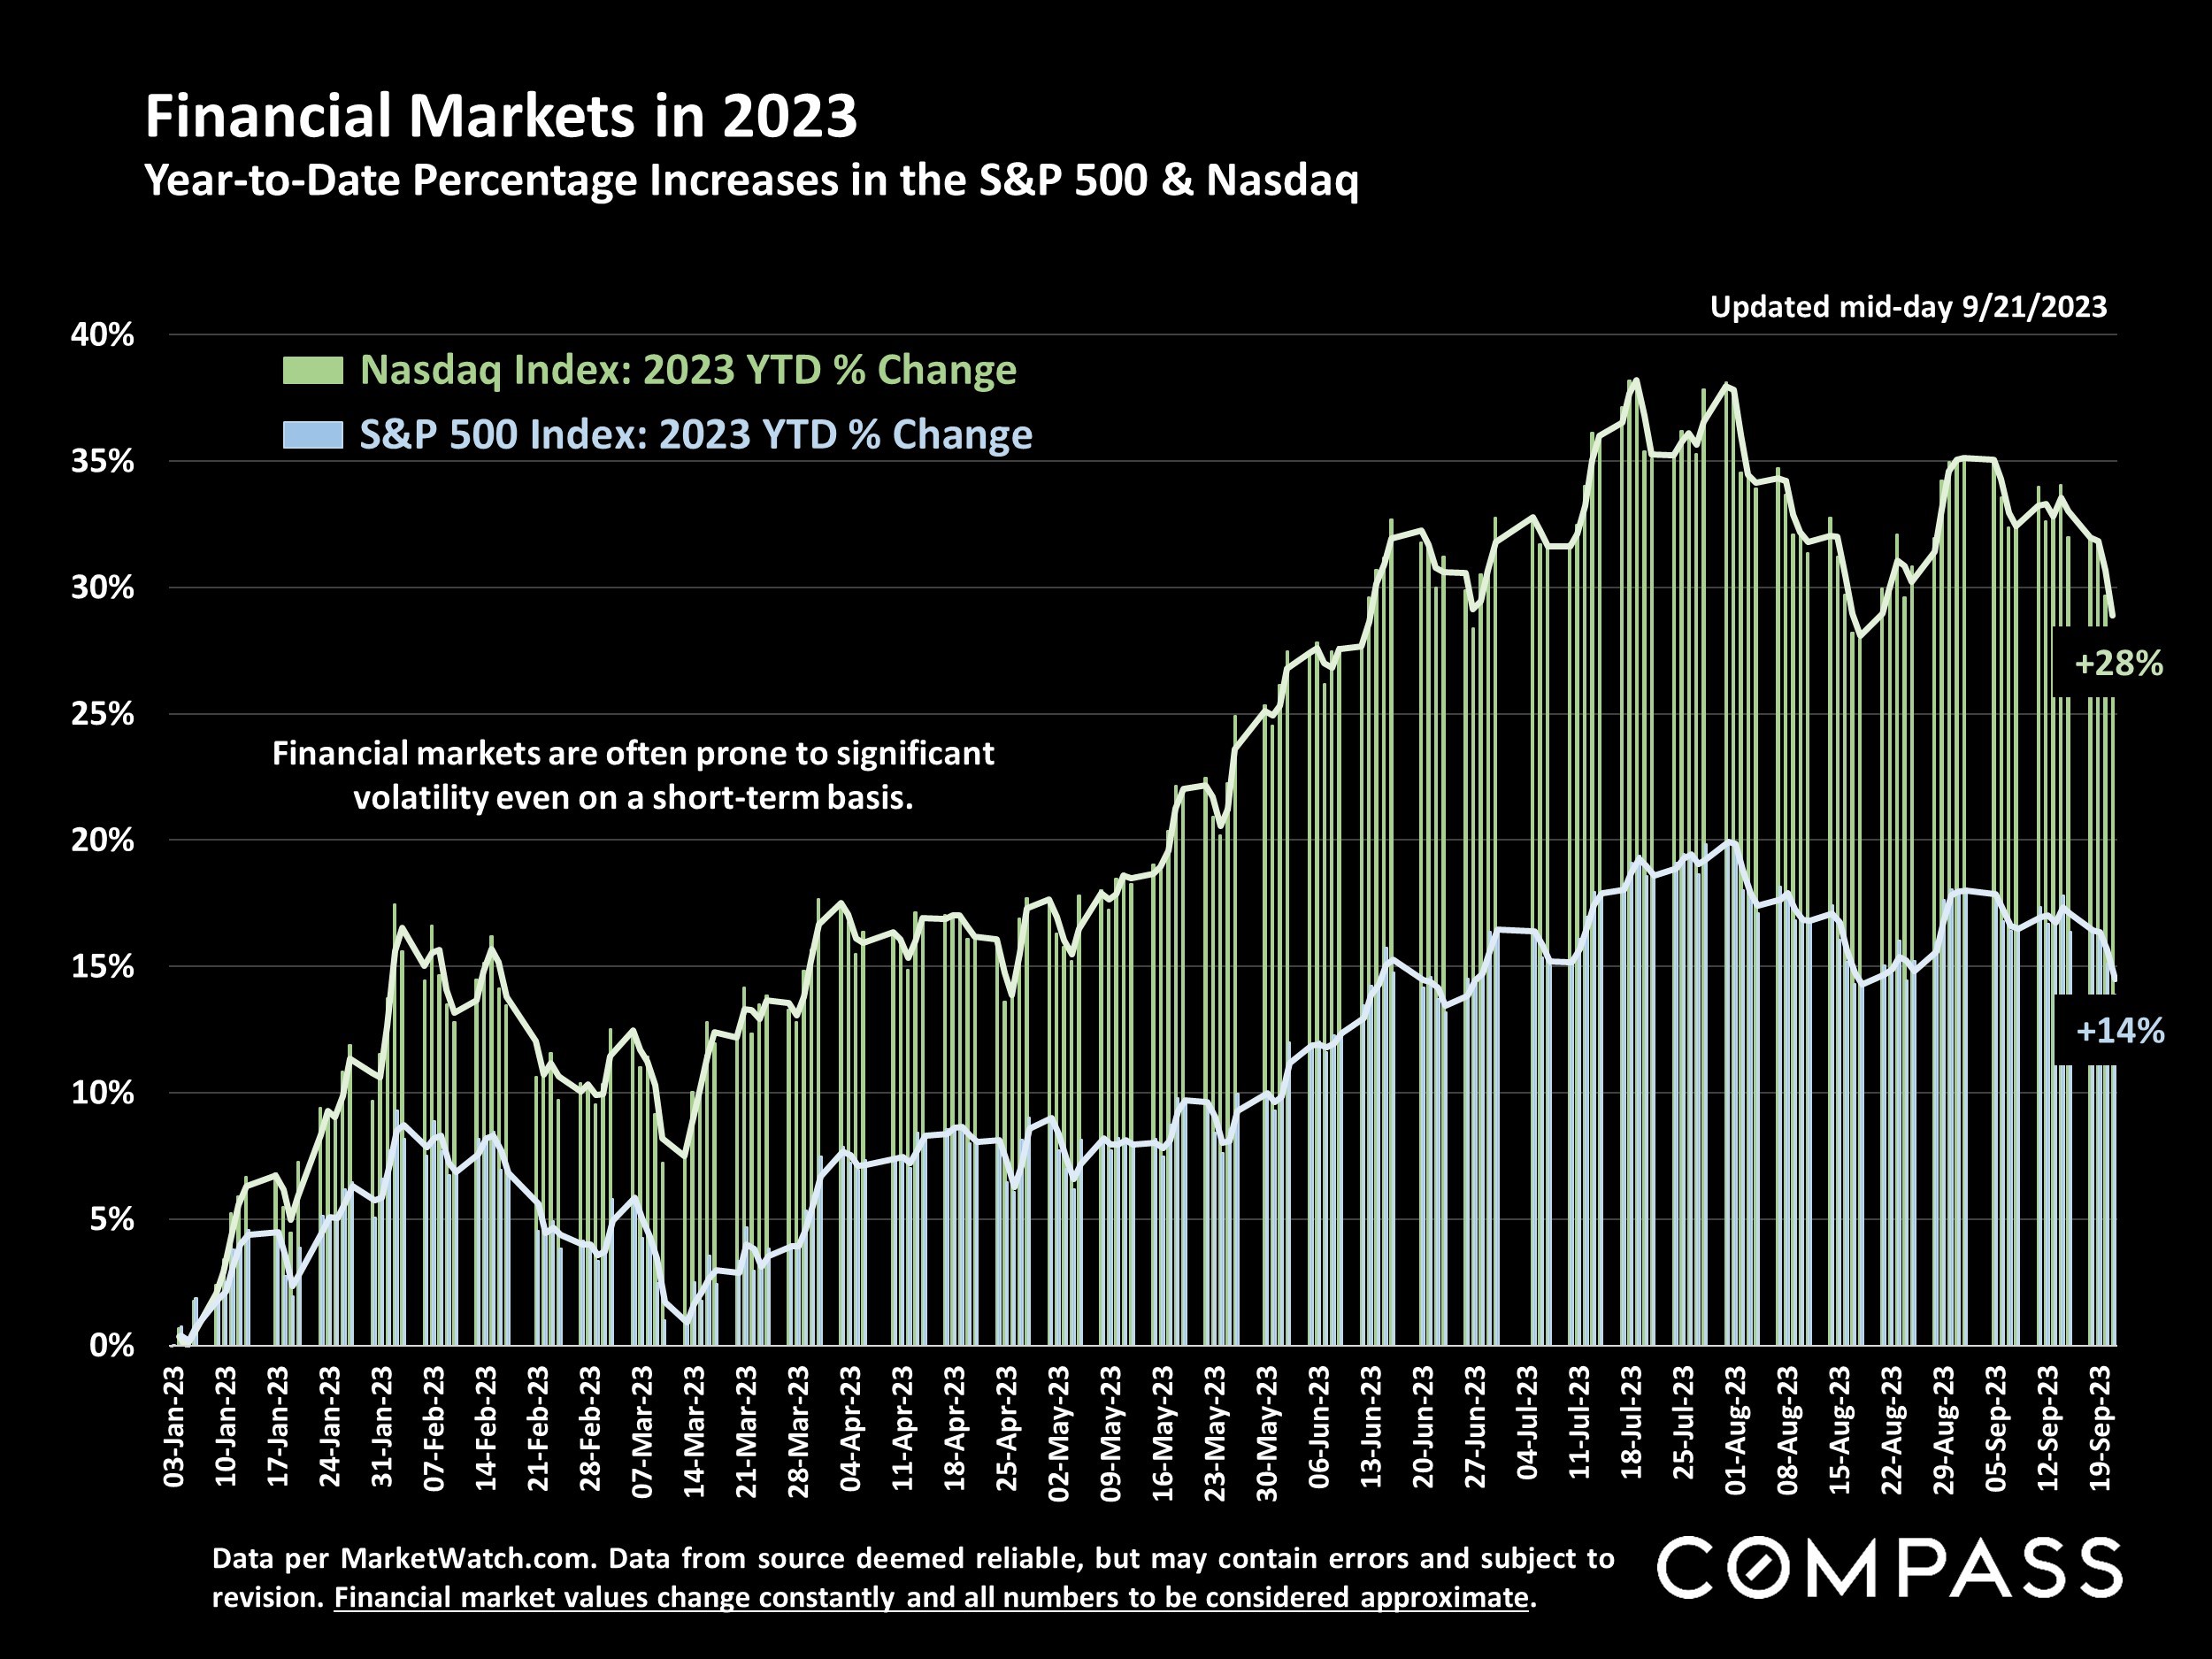
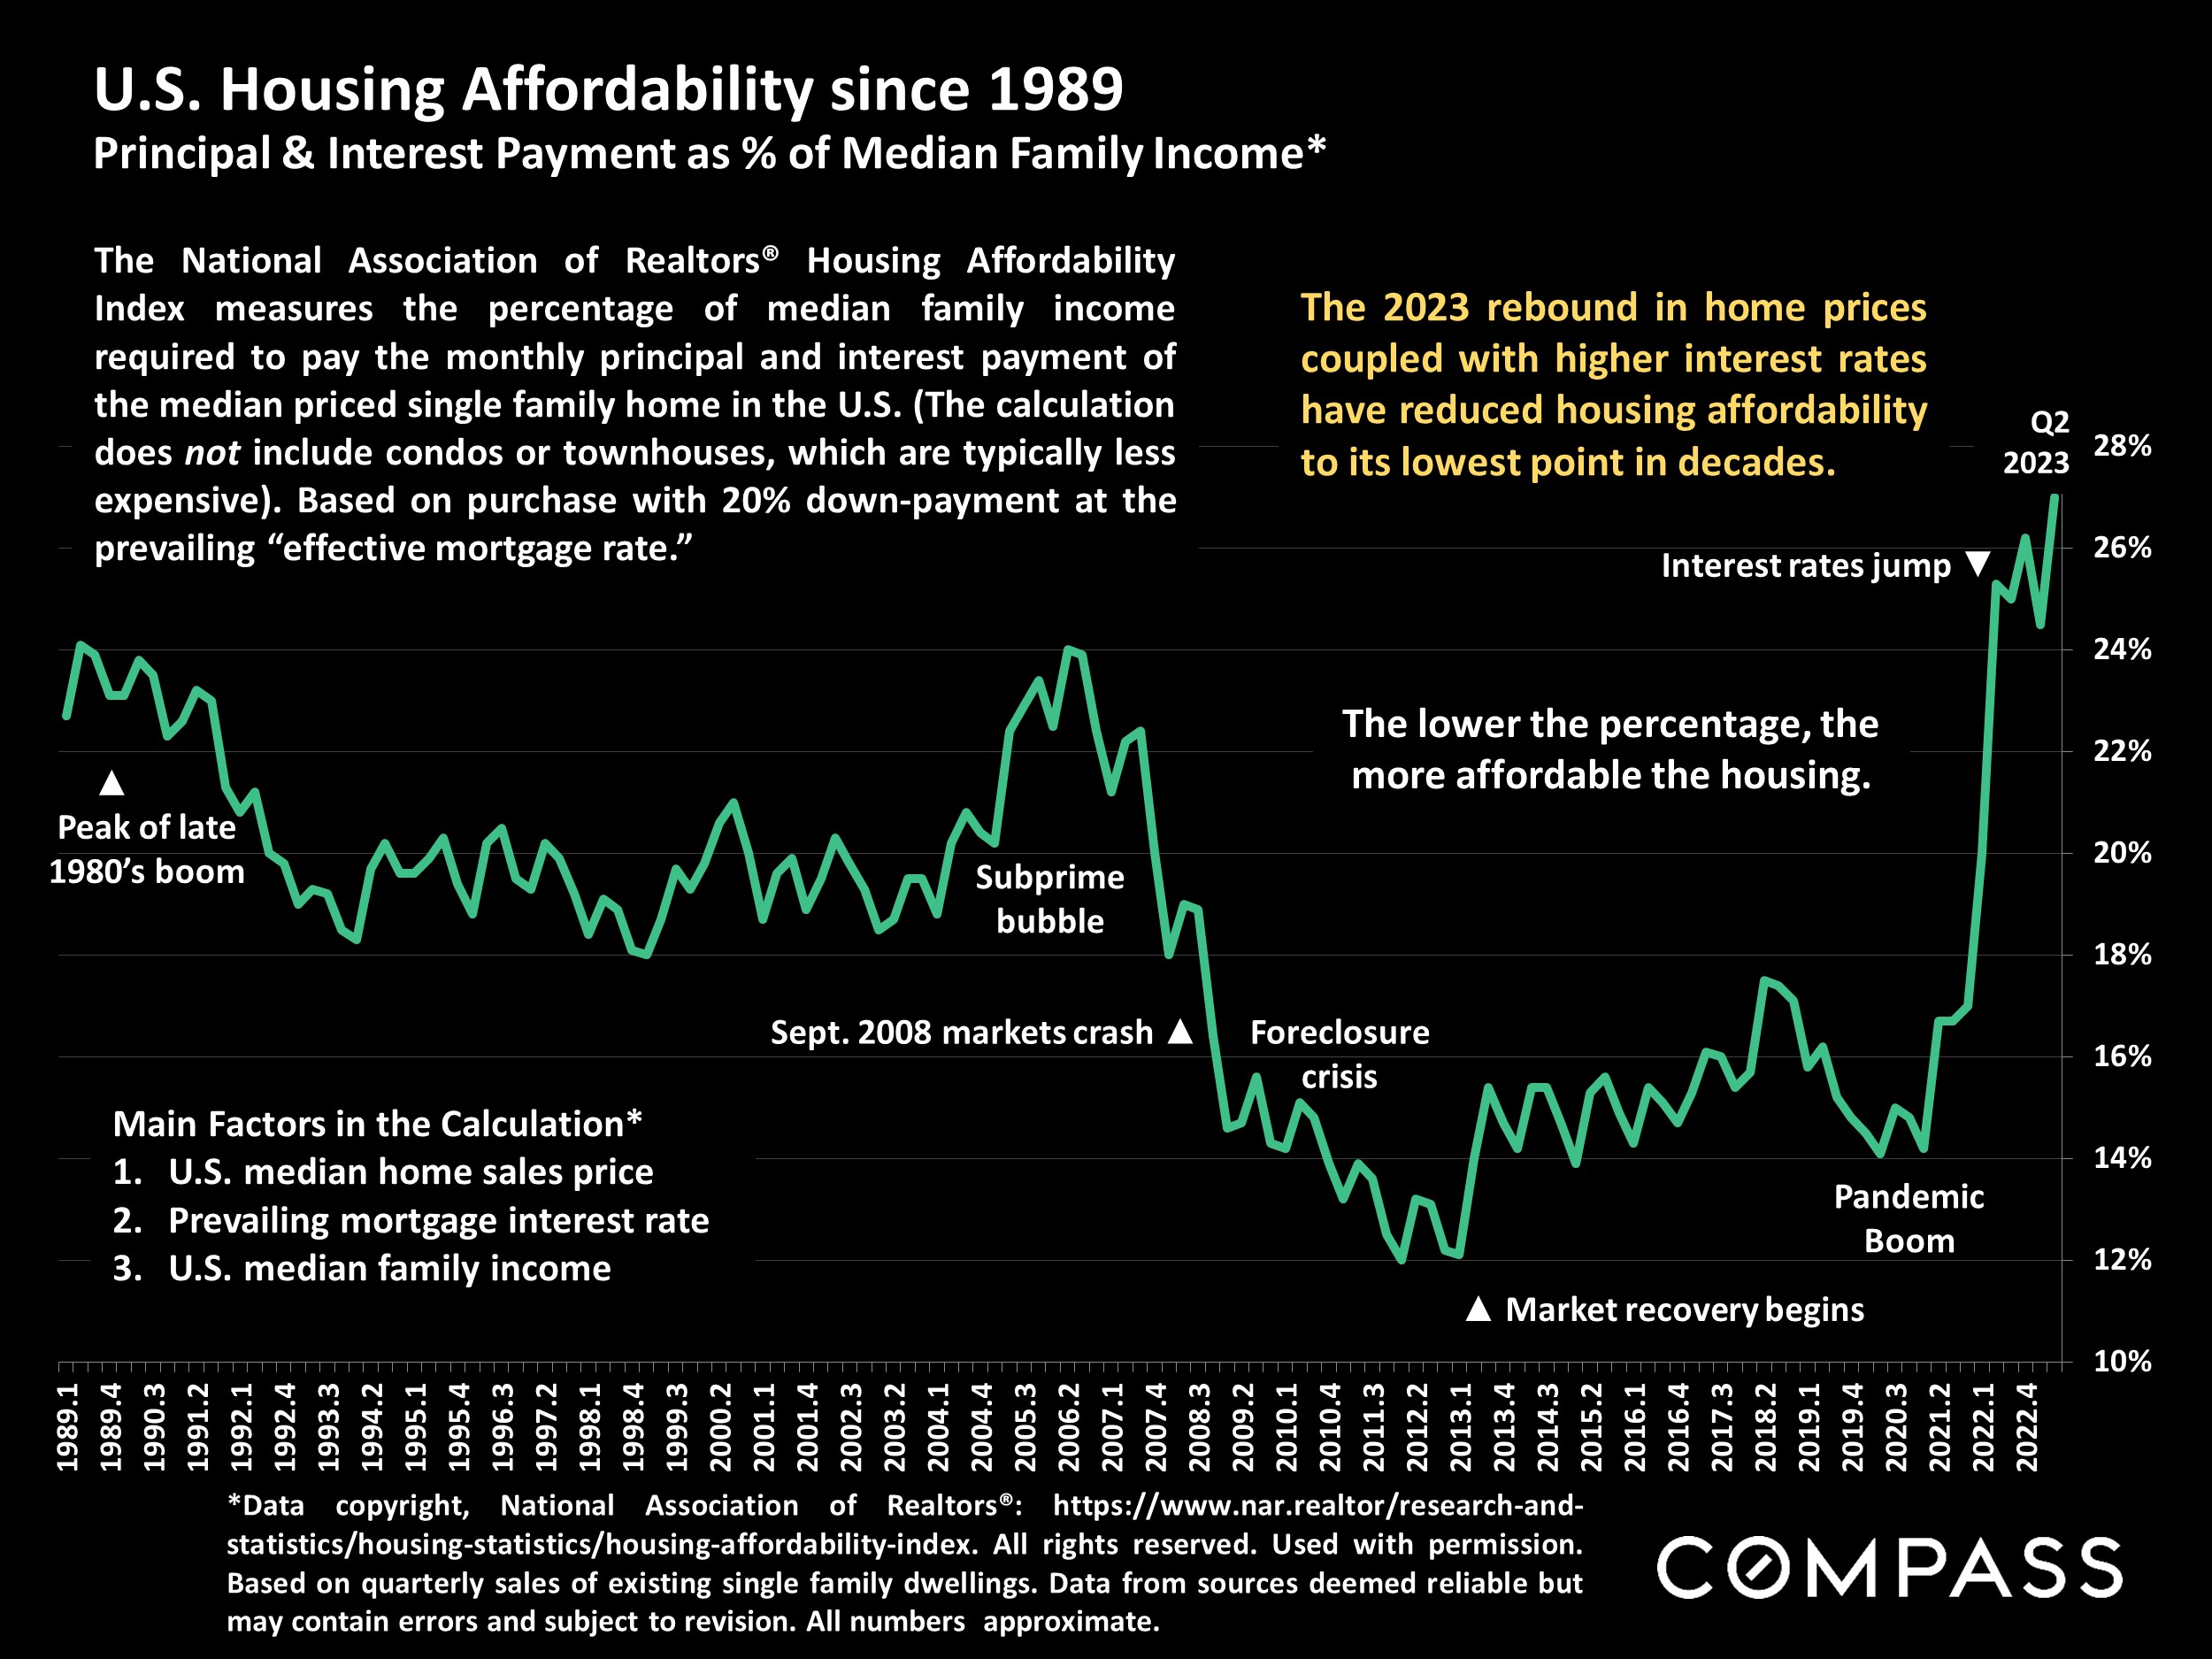
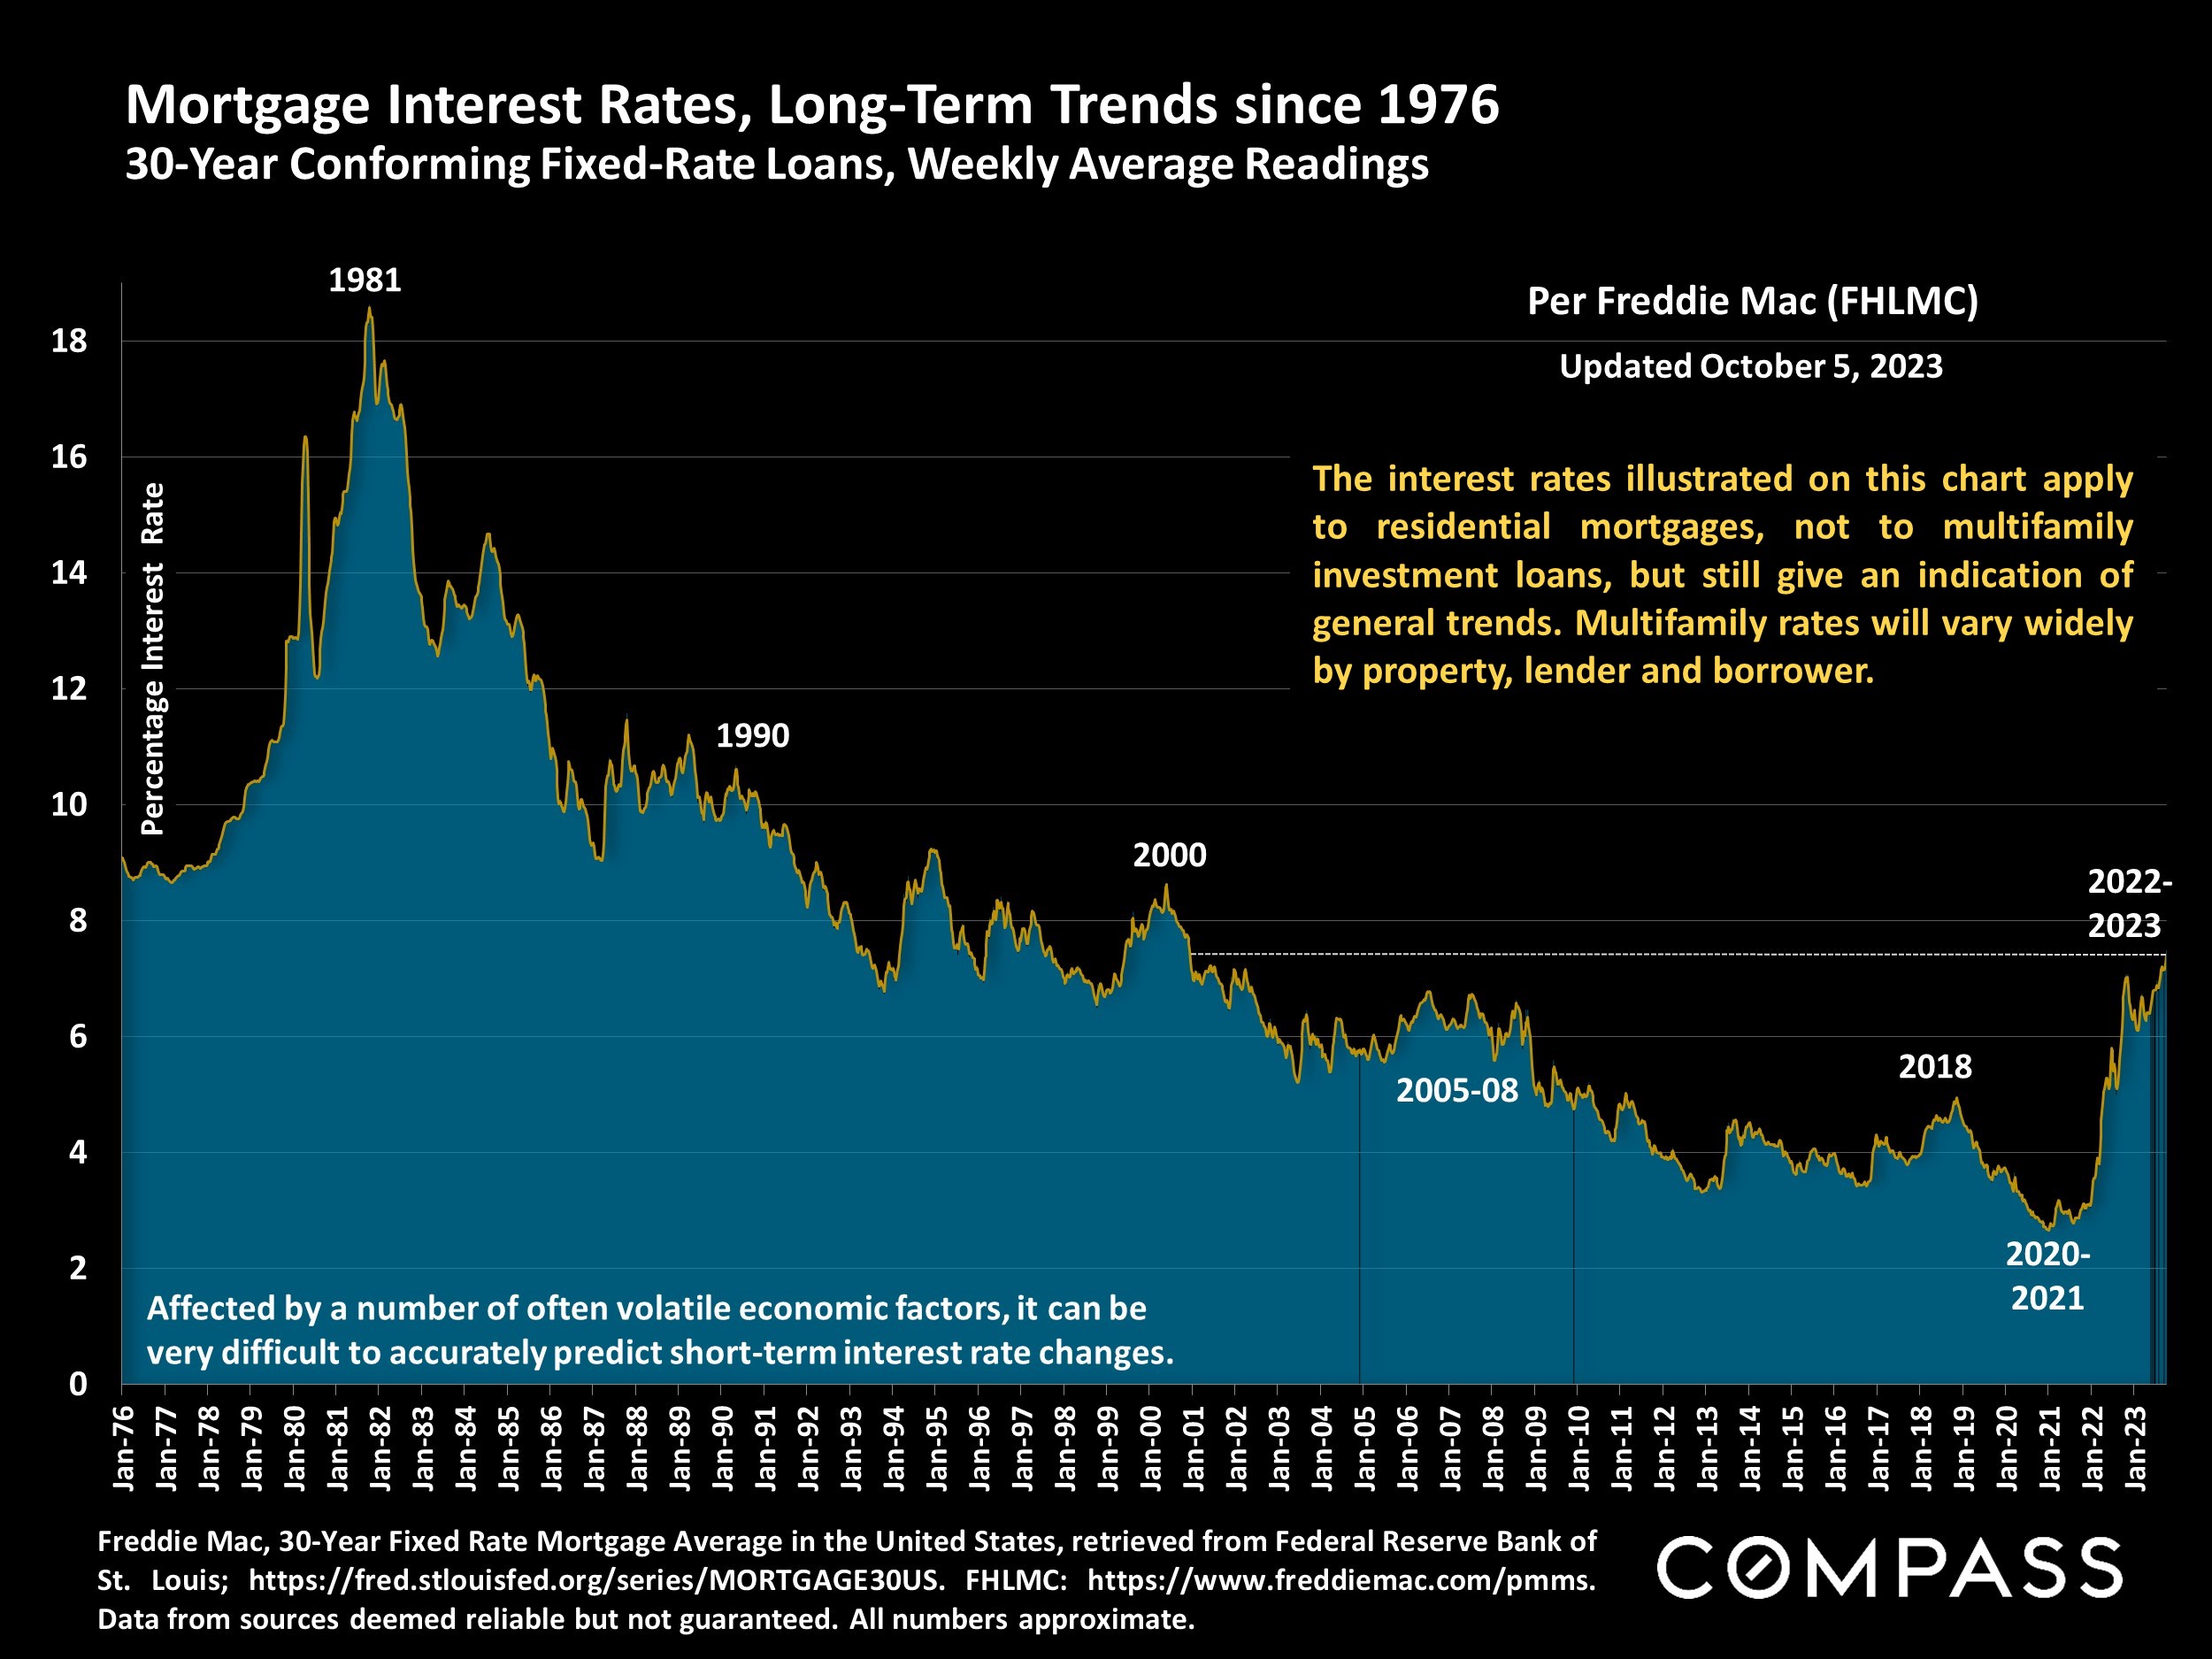
The heart of the autumn selling season was dominated by global conflict, falling stock markets – and interest rates jumping to their highest point in 23 years, further discouraging buyers who require financing, and prospective sellers reluctant to abandon their current loan terms. Then on November 1st, the October jobs report came out, the Fed extended their pause on raising its benchmark rate, and the Treasury Department issued revised guidance pertaining to upcoming bond sales – and by November 3rd, stock markets had logged their best week of the year, and interest rates had seen a near-record decline. The housing market typically begins its big, holiday slowdown in mid-November, with listing and sales activity declining to annual lows. Considering the volatility that has characterized economic and political conditions, it’s too early to speculate on how these shifts will play out in the coming days, weeks and months. Ideally, rates will continue to normalize and consumer confidence to recover into the new year, with significant improvements to both housing affordability and the equation for homeowners contemplating a sale.
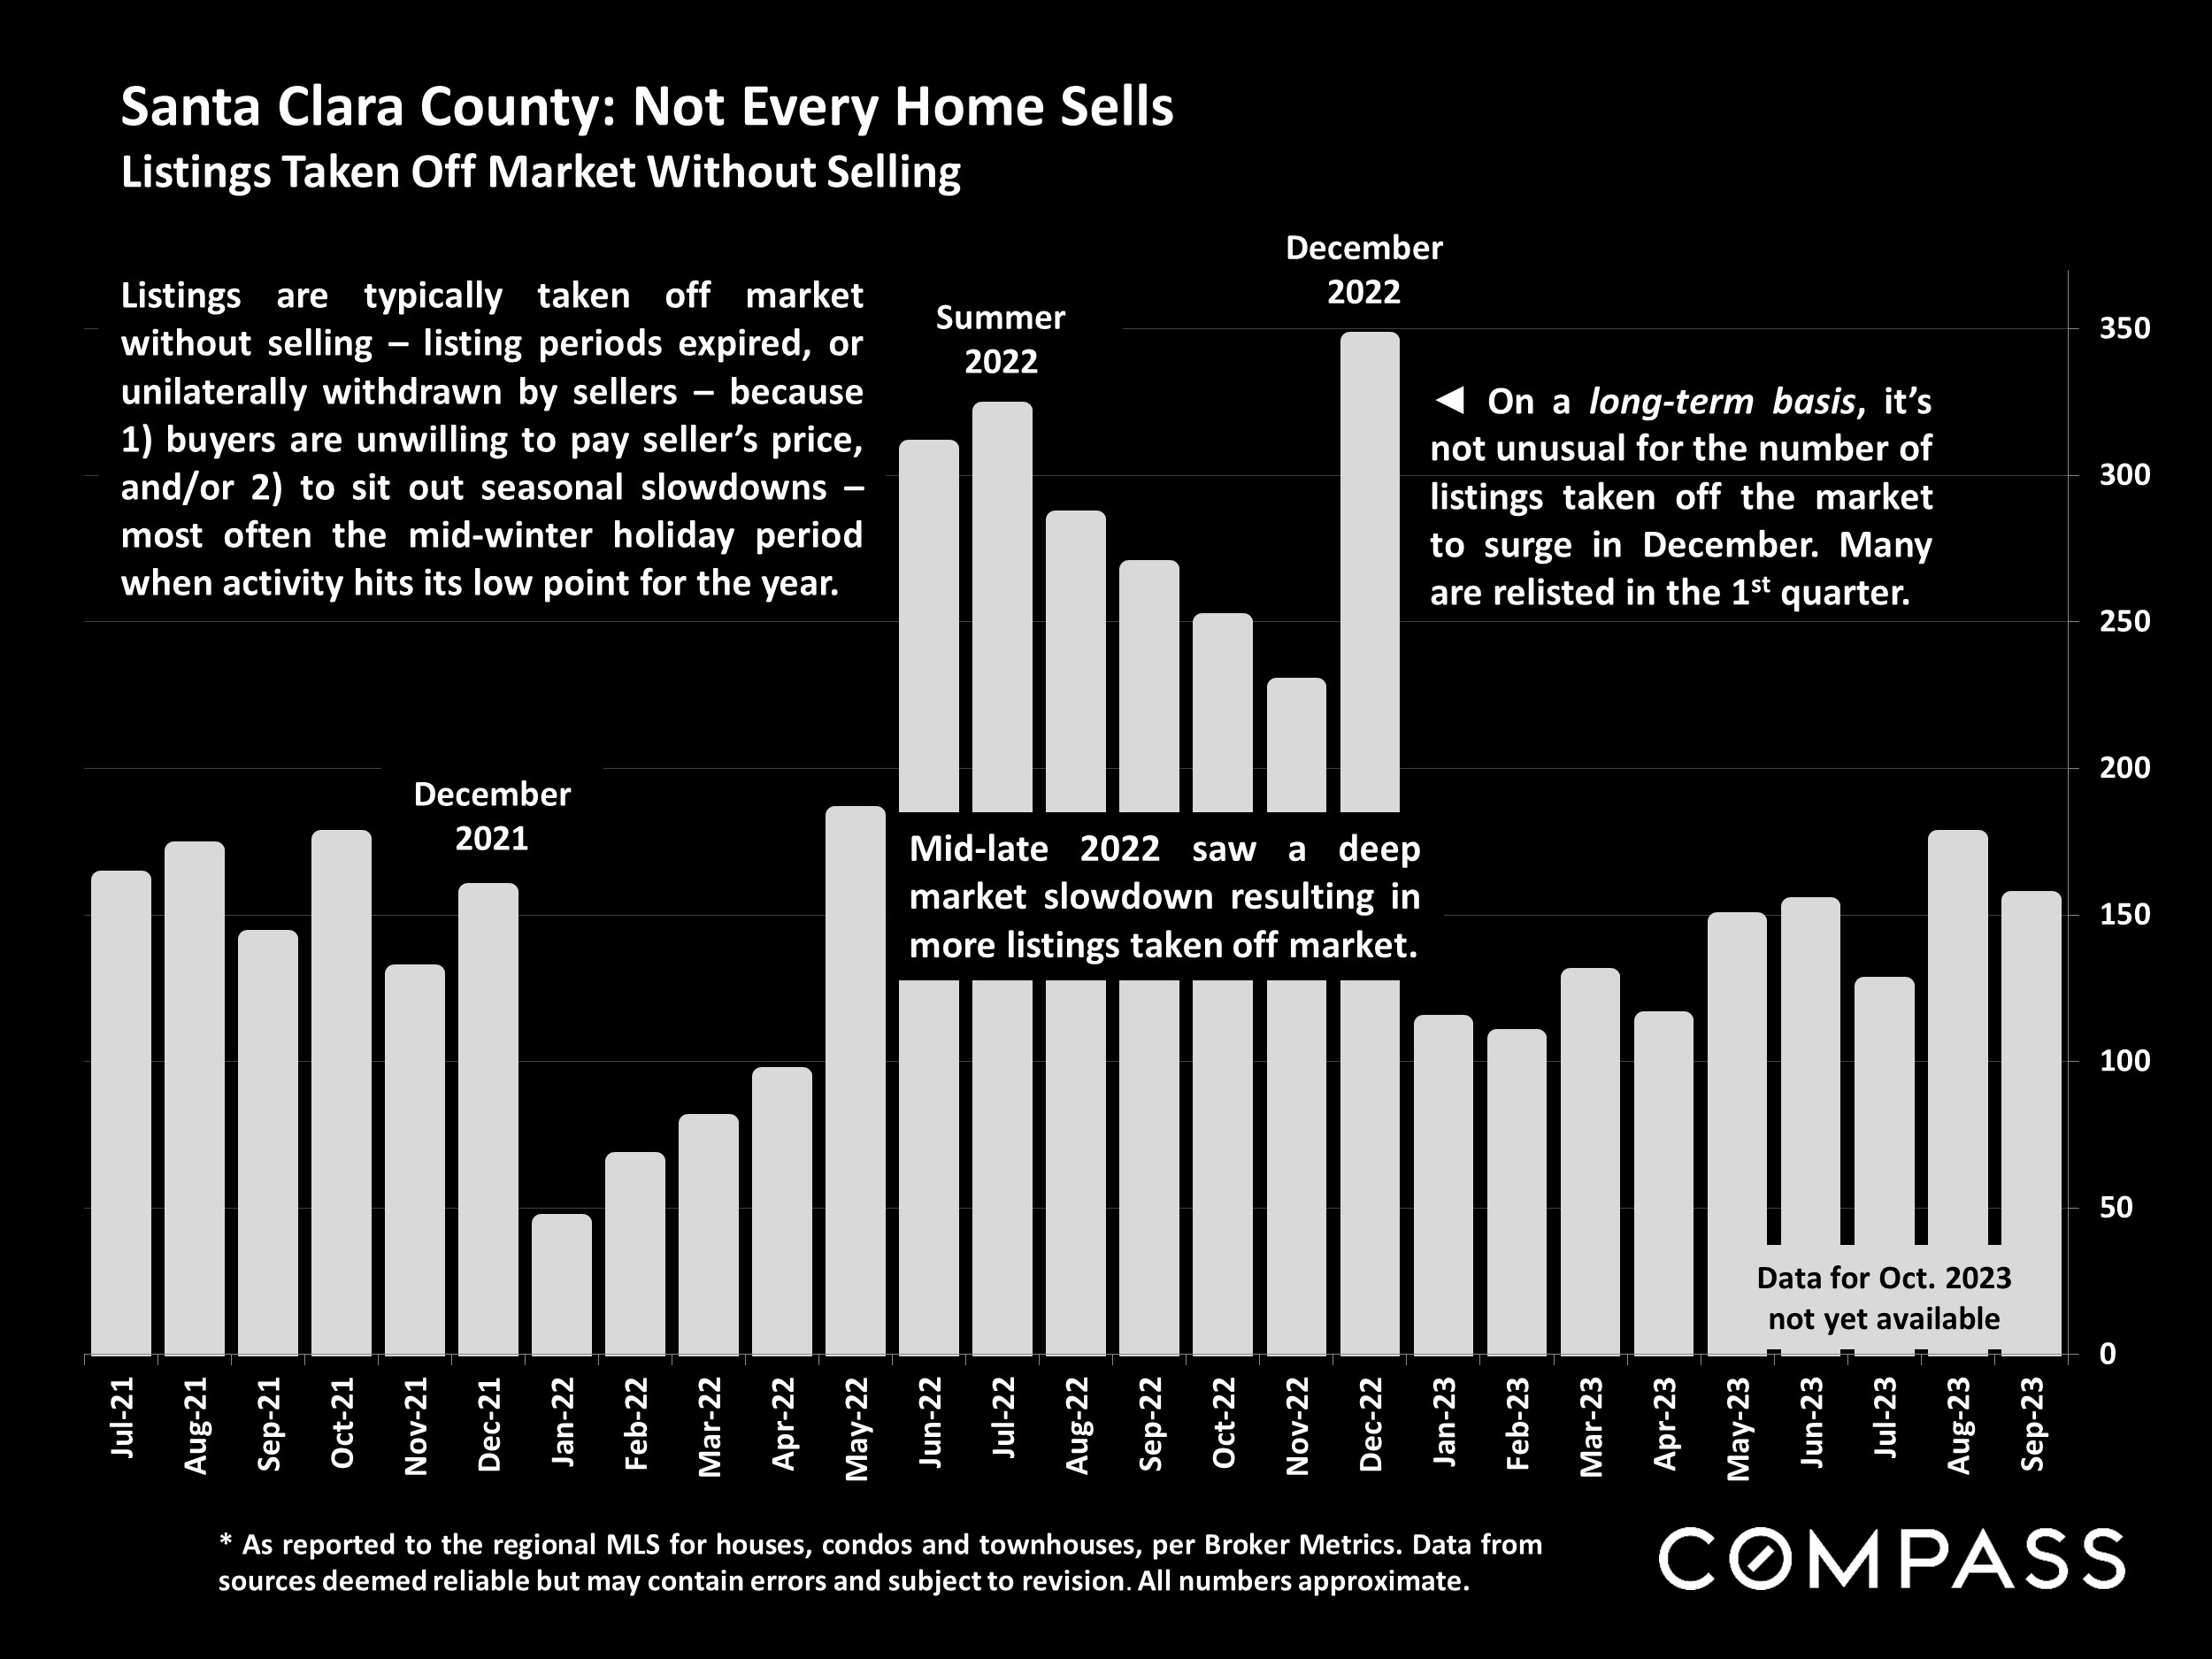
Even if the expected holiday slowdown occurs, sellers of appealing, well-prepared and well-priced homes may still see a quick sale with multiple offers: There are still qualified buyers actively looking to purchase (with financing or all cash). For buyers, mid-winter usually offers reduced competition for listings, and an enhanced ability to aggressively negotiate prices on unsold properties: It can be an excellent time to buy for those who stay in the game.
This report will review trends in home prices, new and active listings, speed of sale, overbidding, listings going into contract, and sales volumes in both the general market and the luxury segment. We have also updated our Bay Area home price tables and maps with detailed data on current values and market dynamics in the cities, towns and other submarkets within the region.
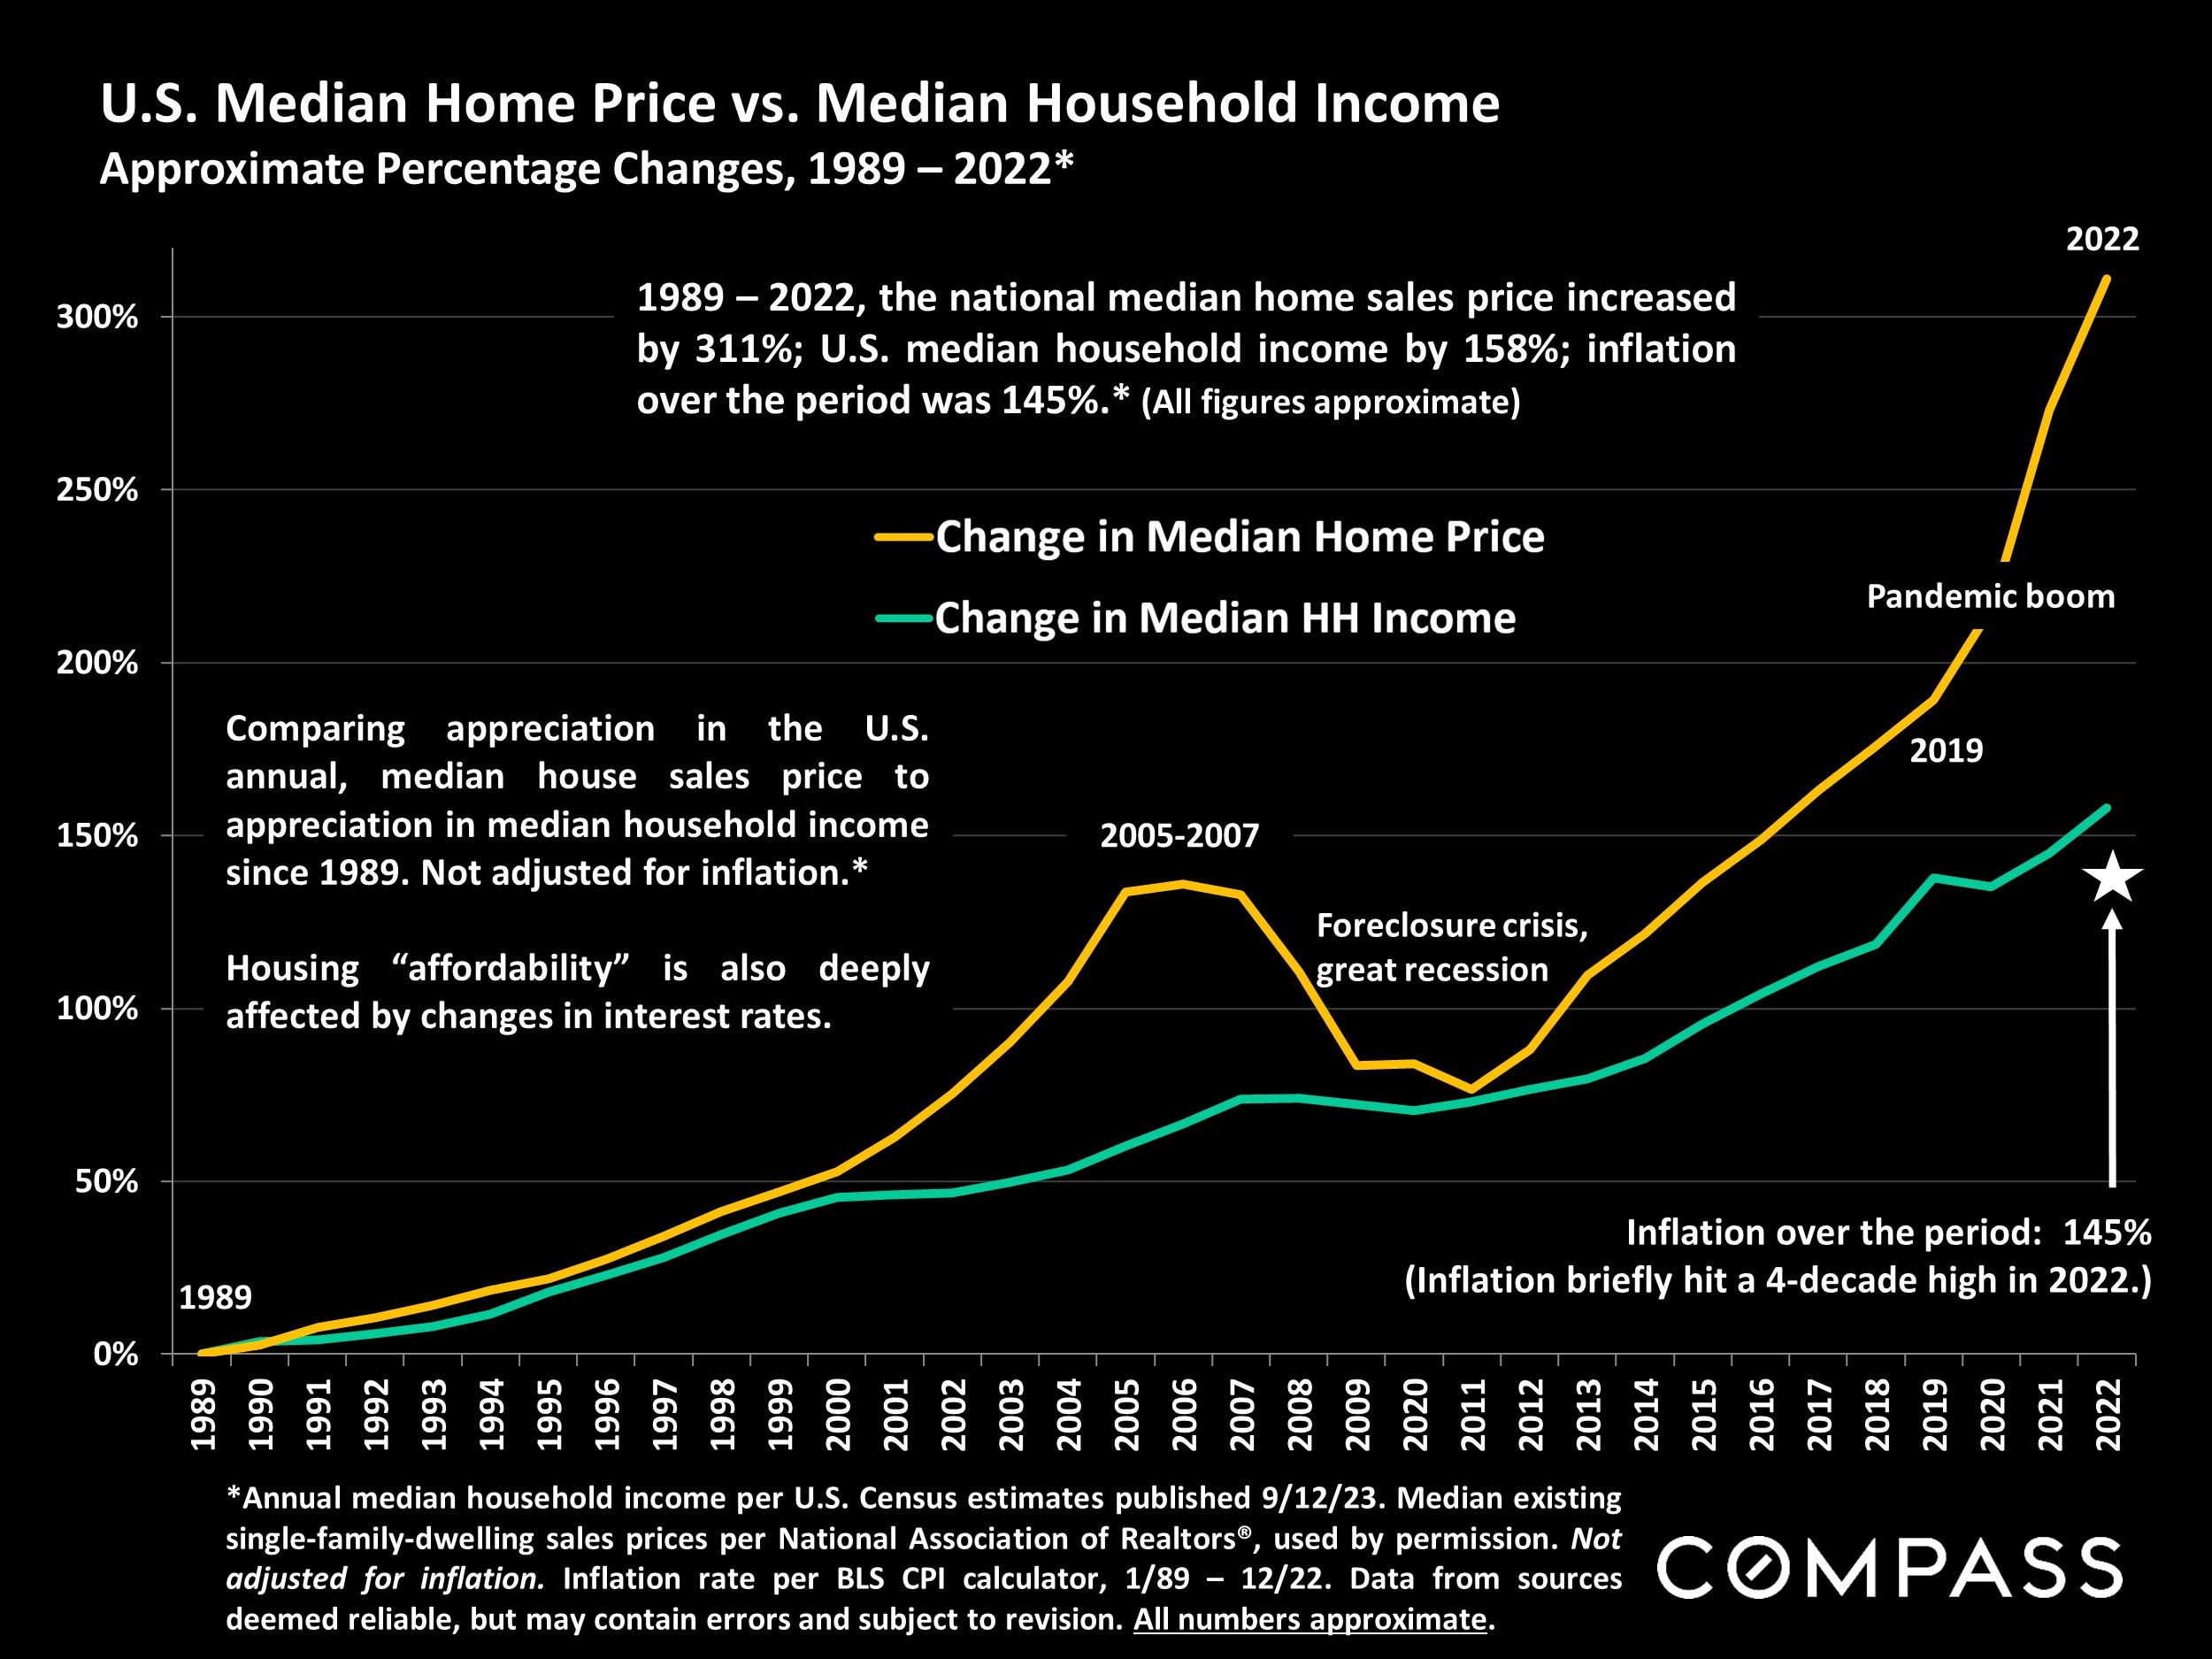
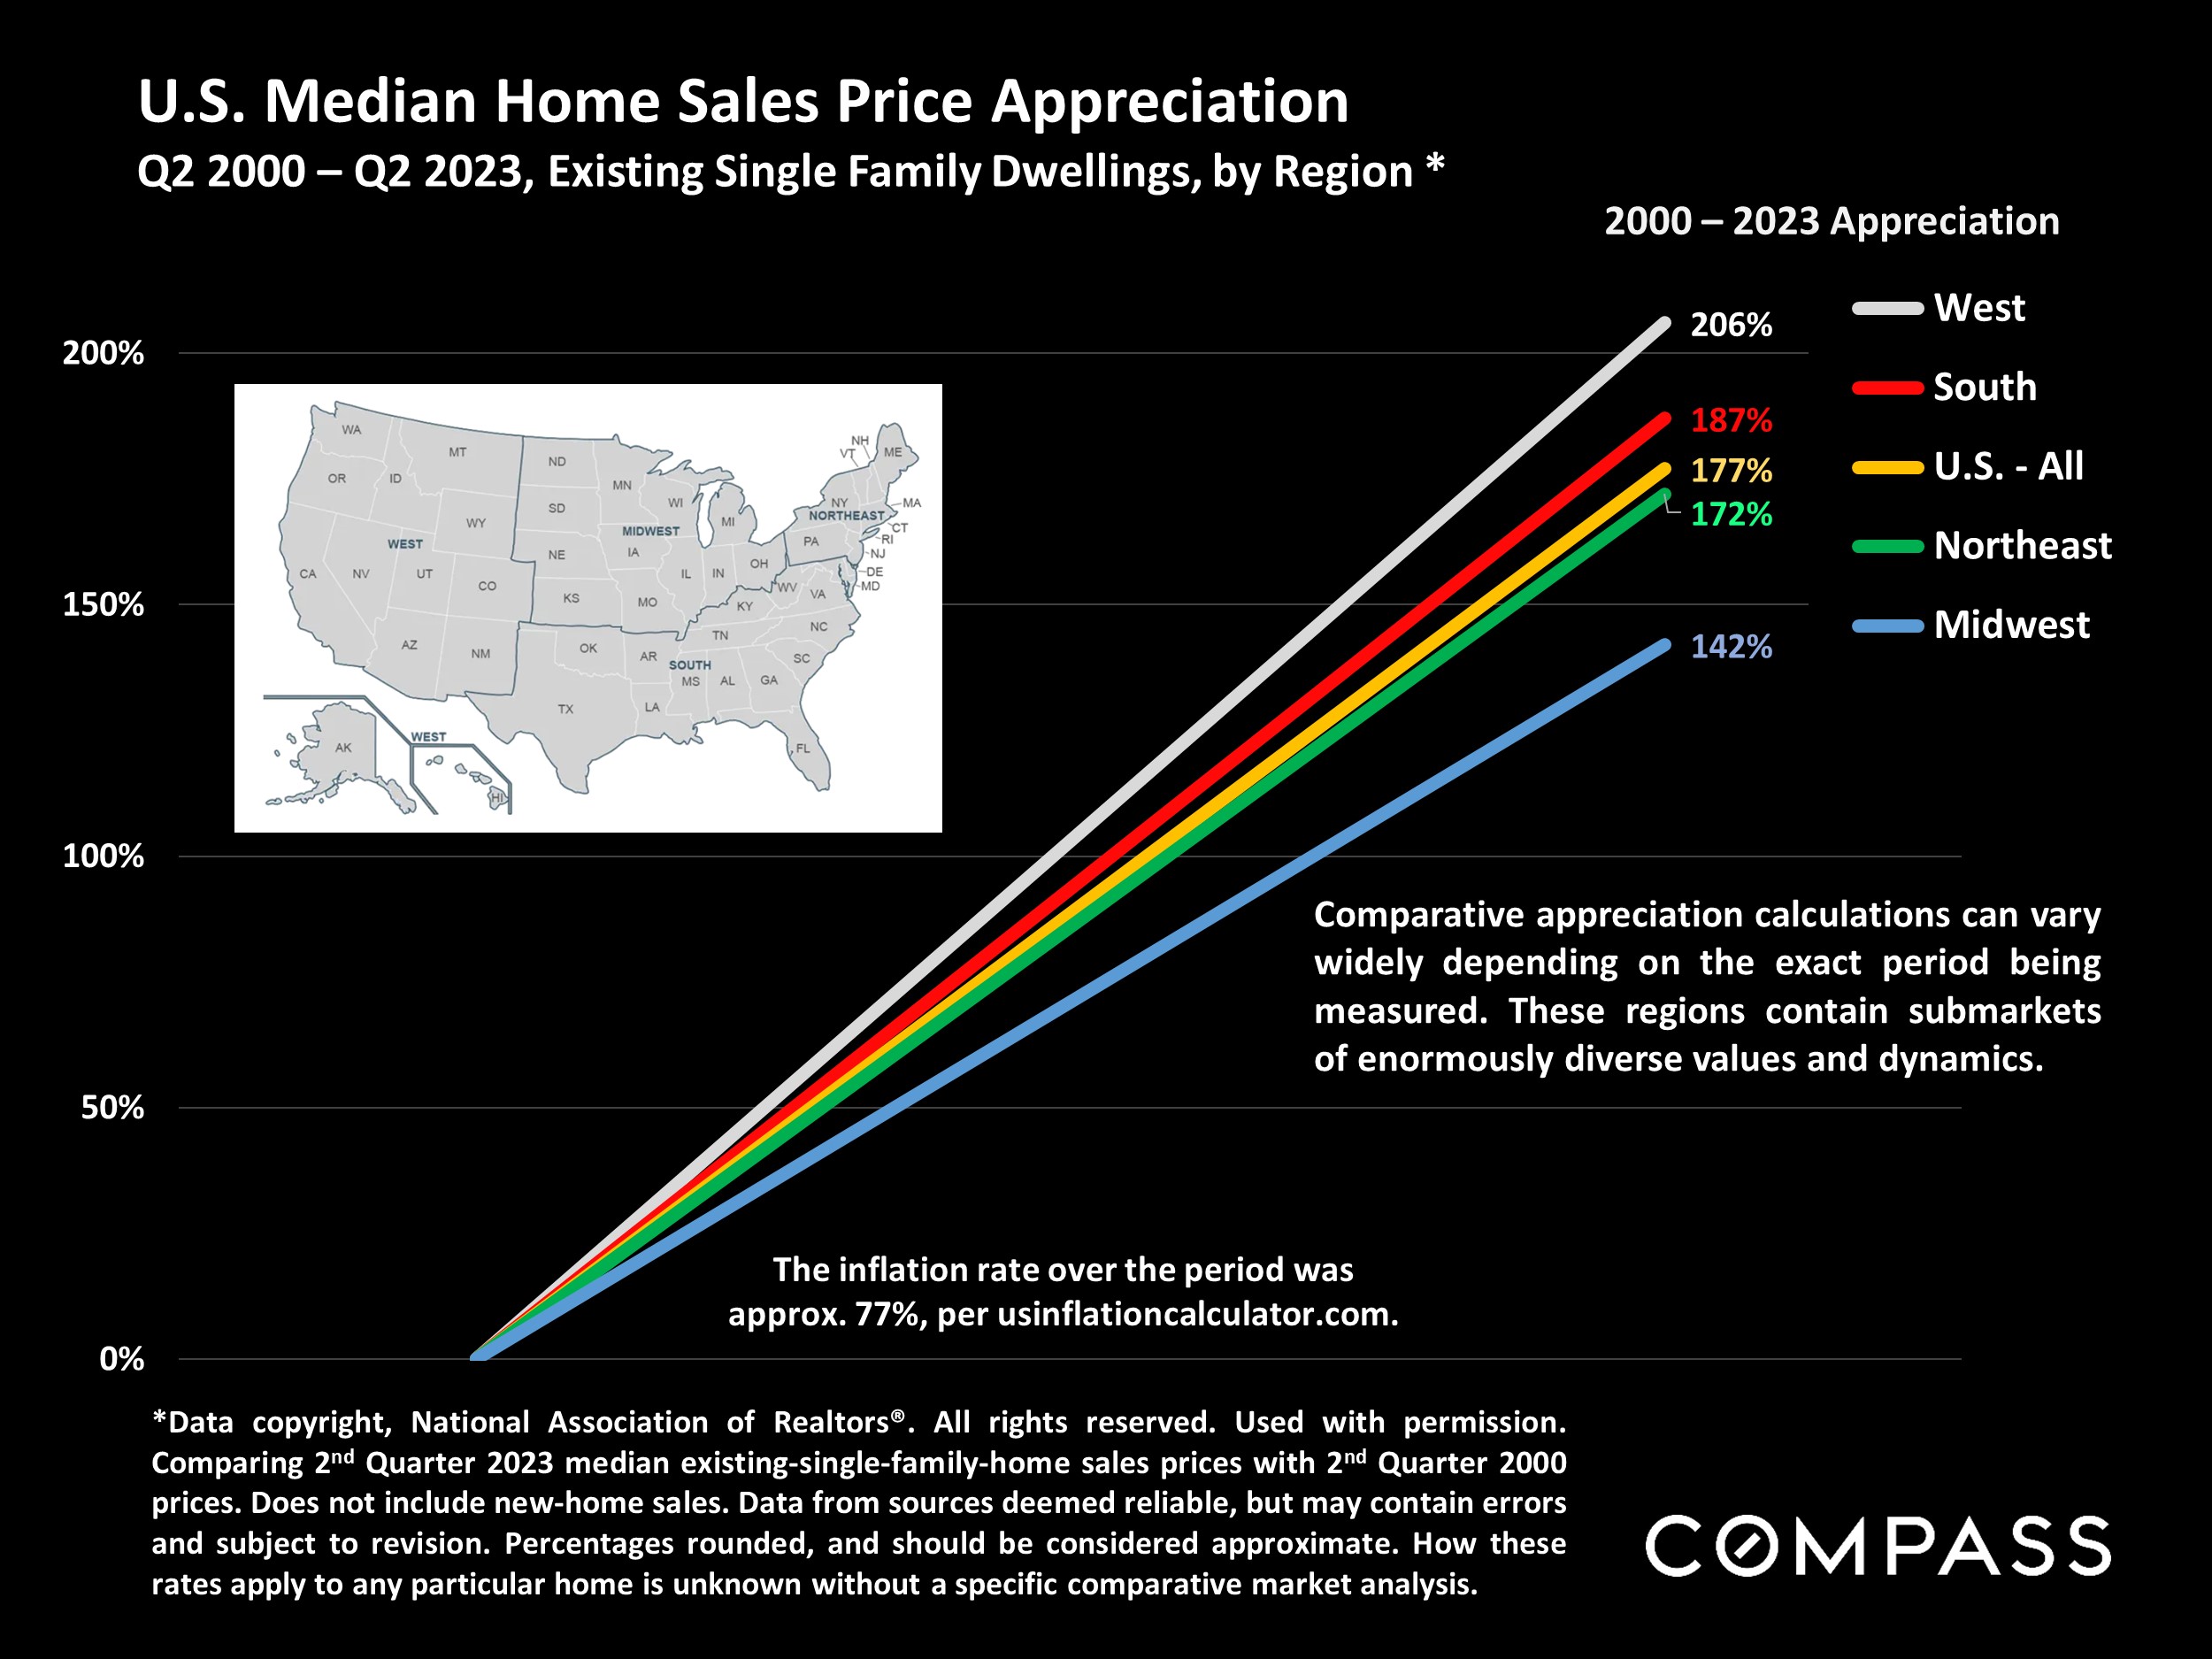
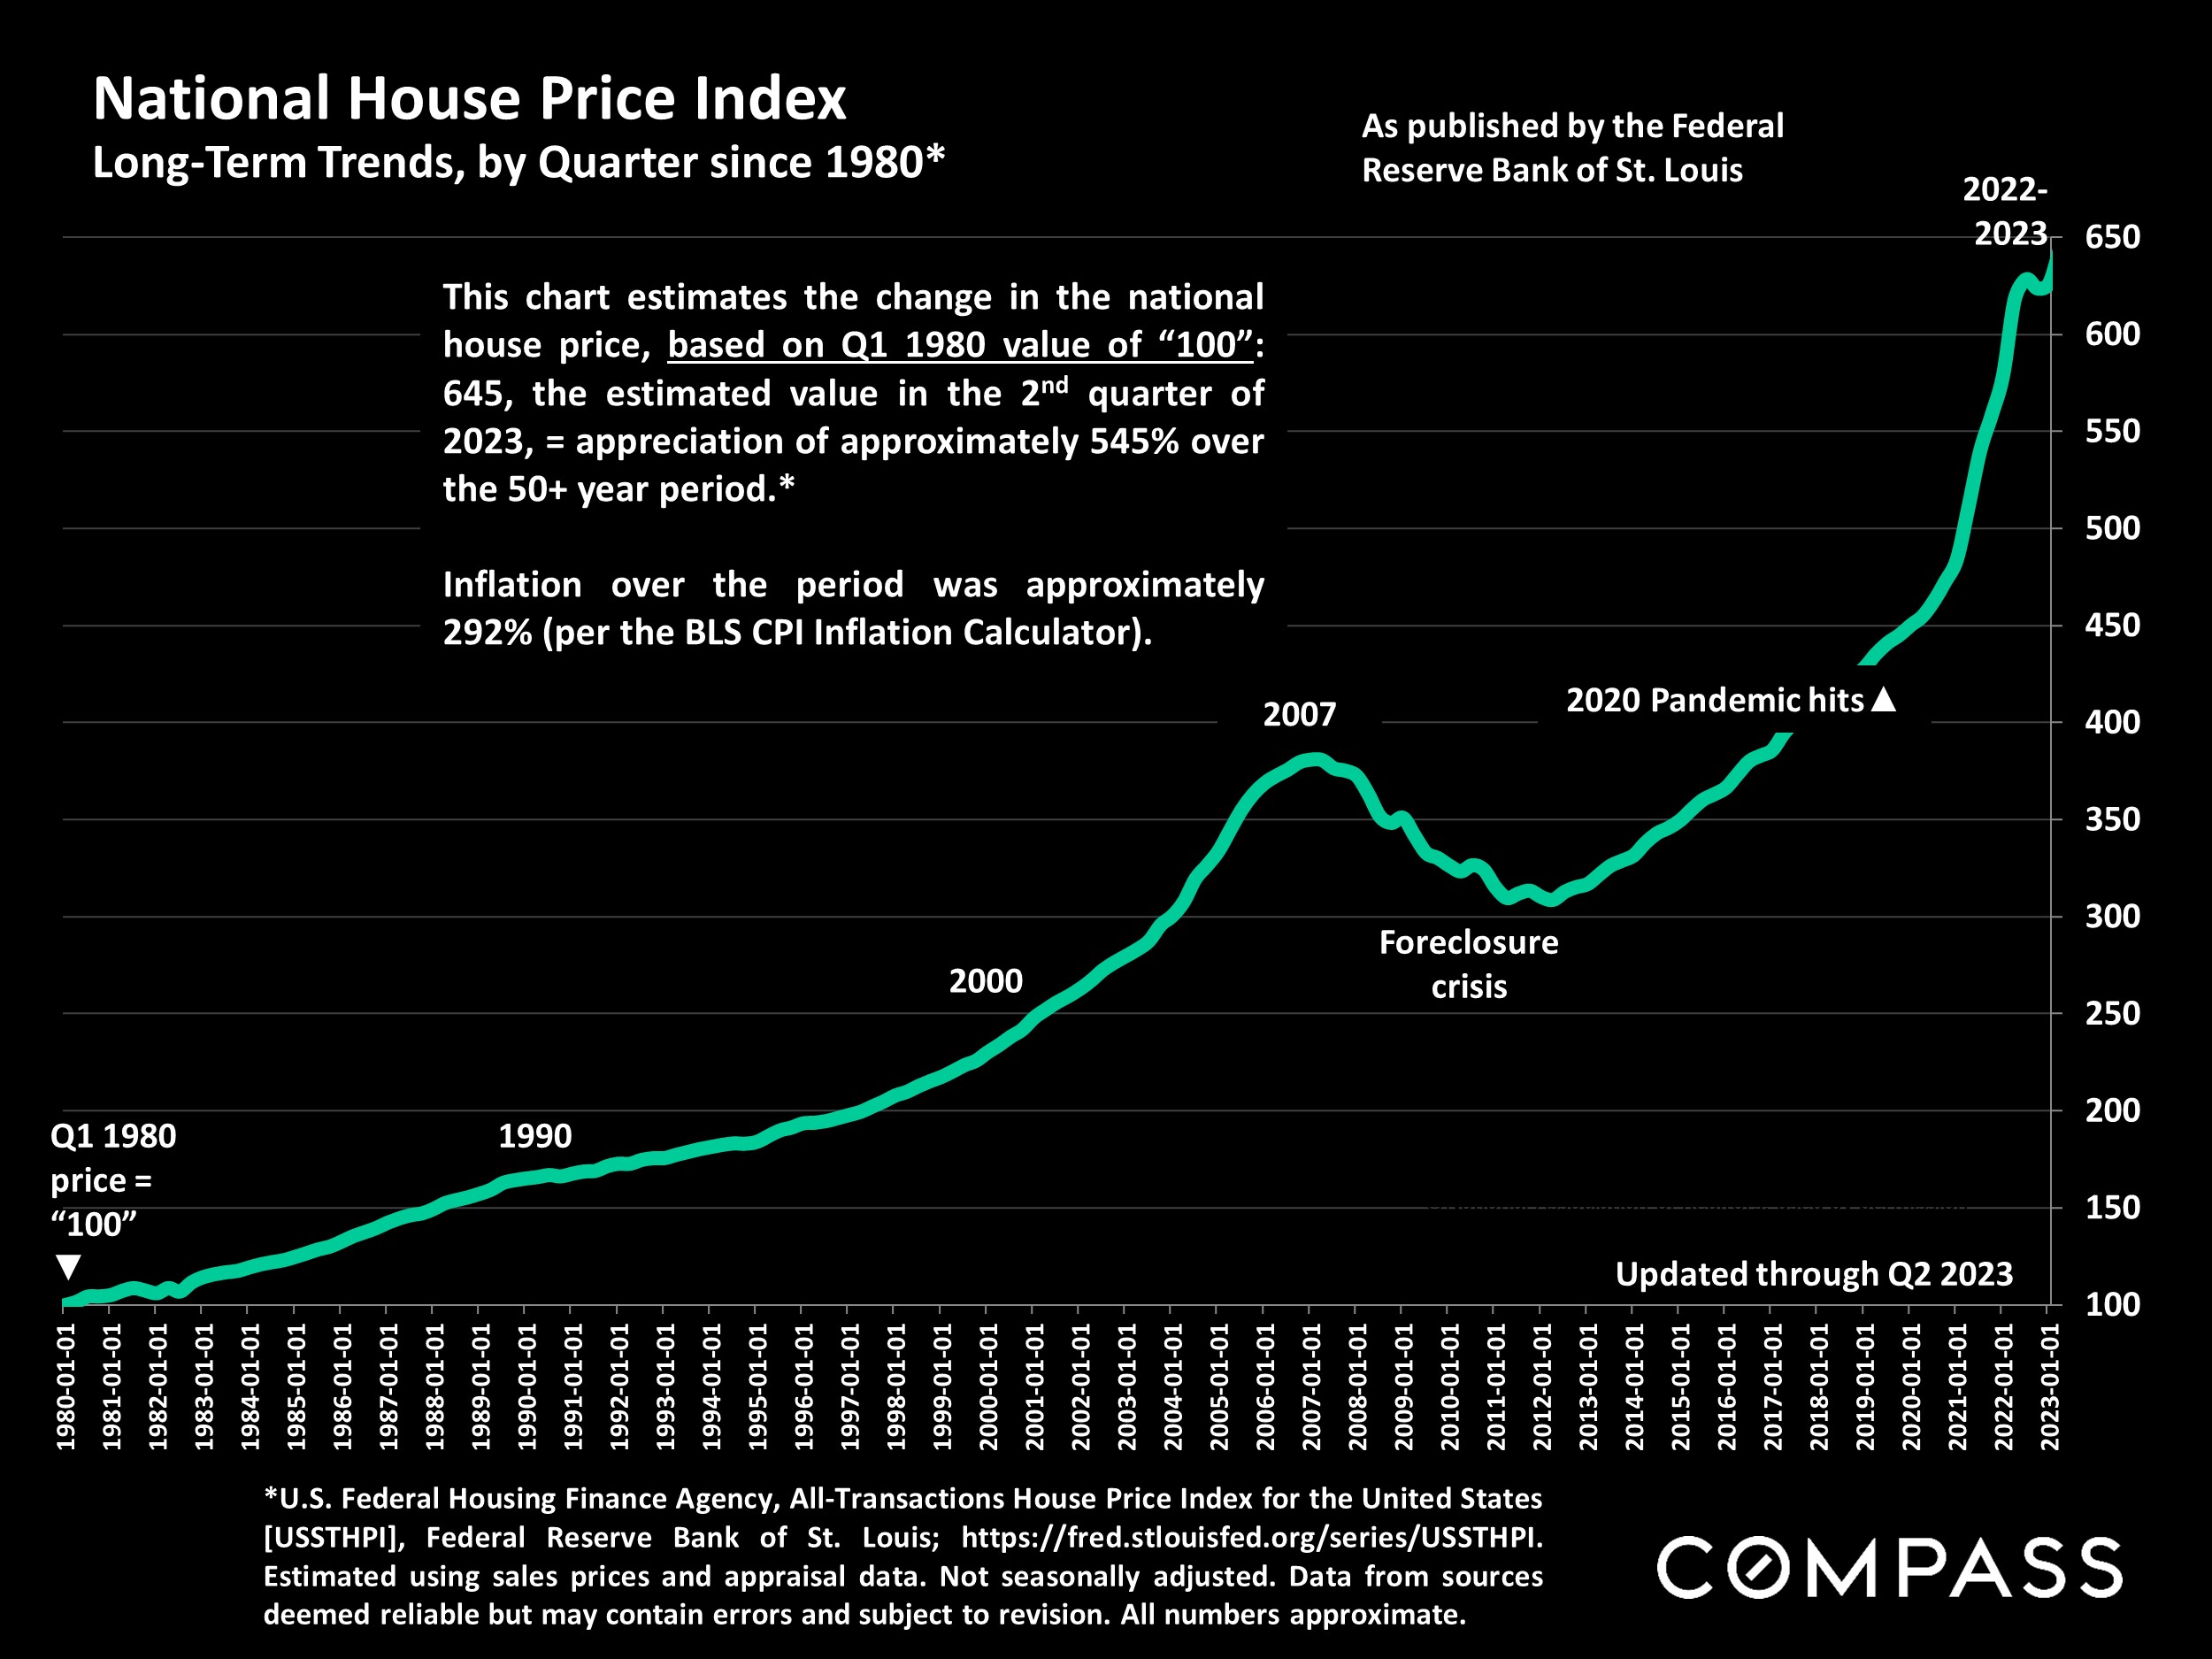
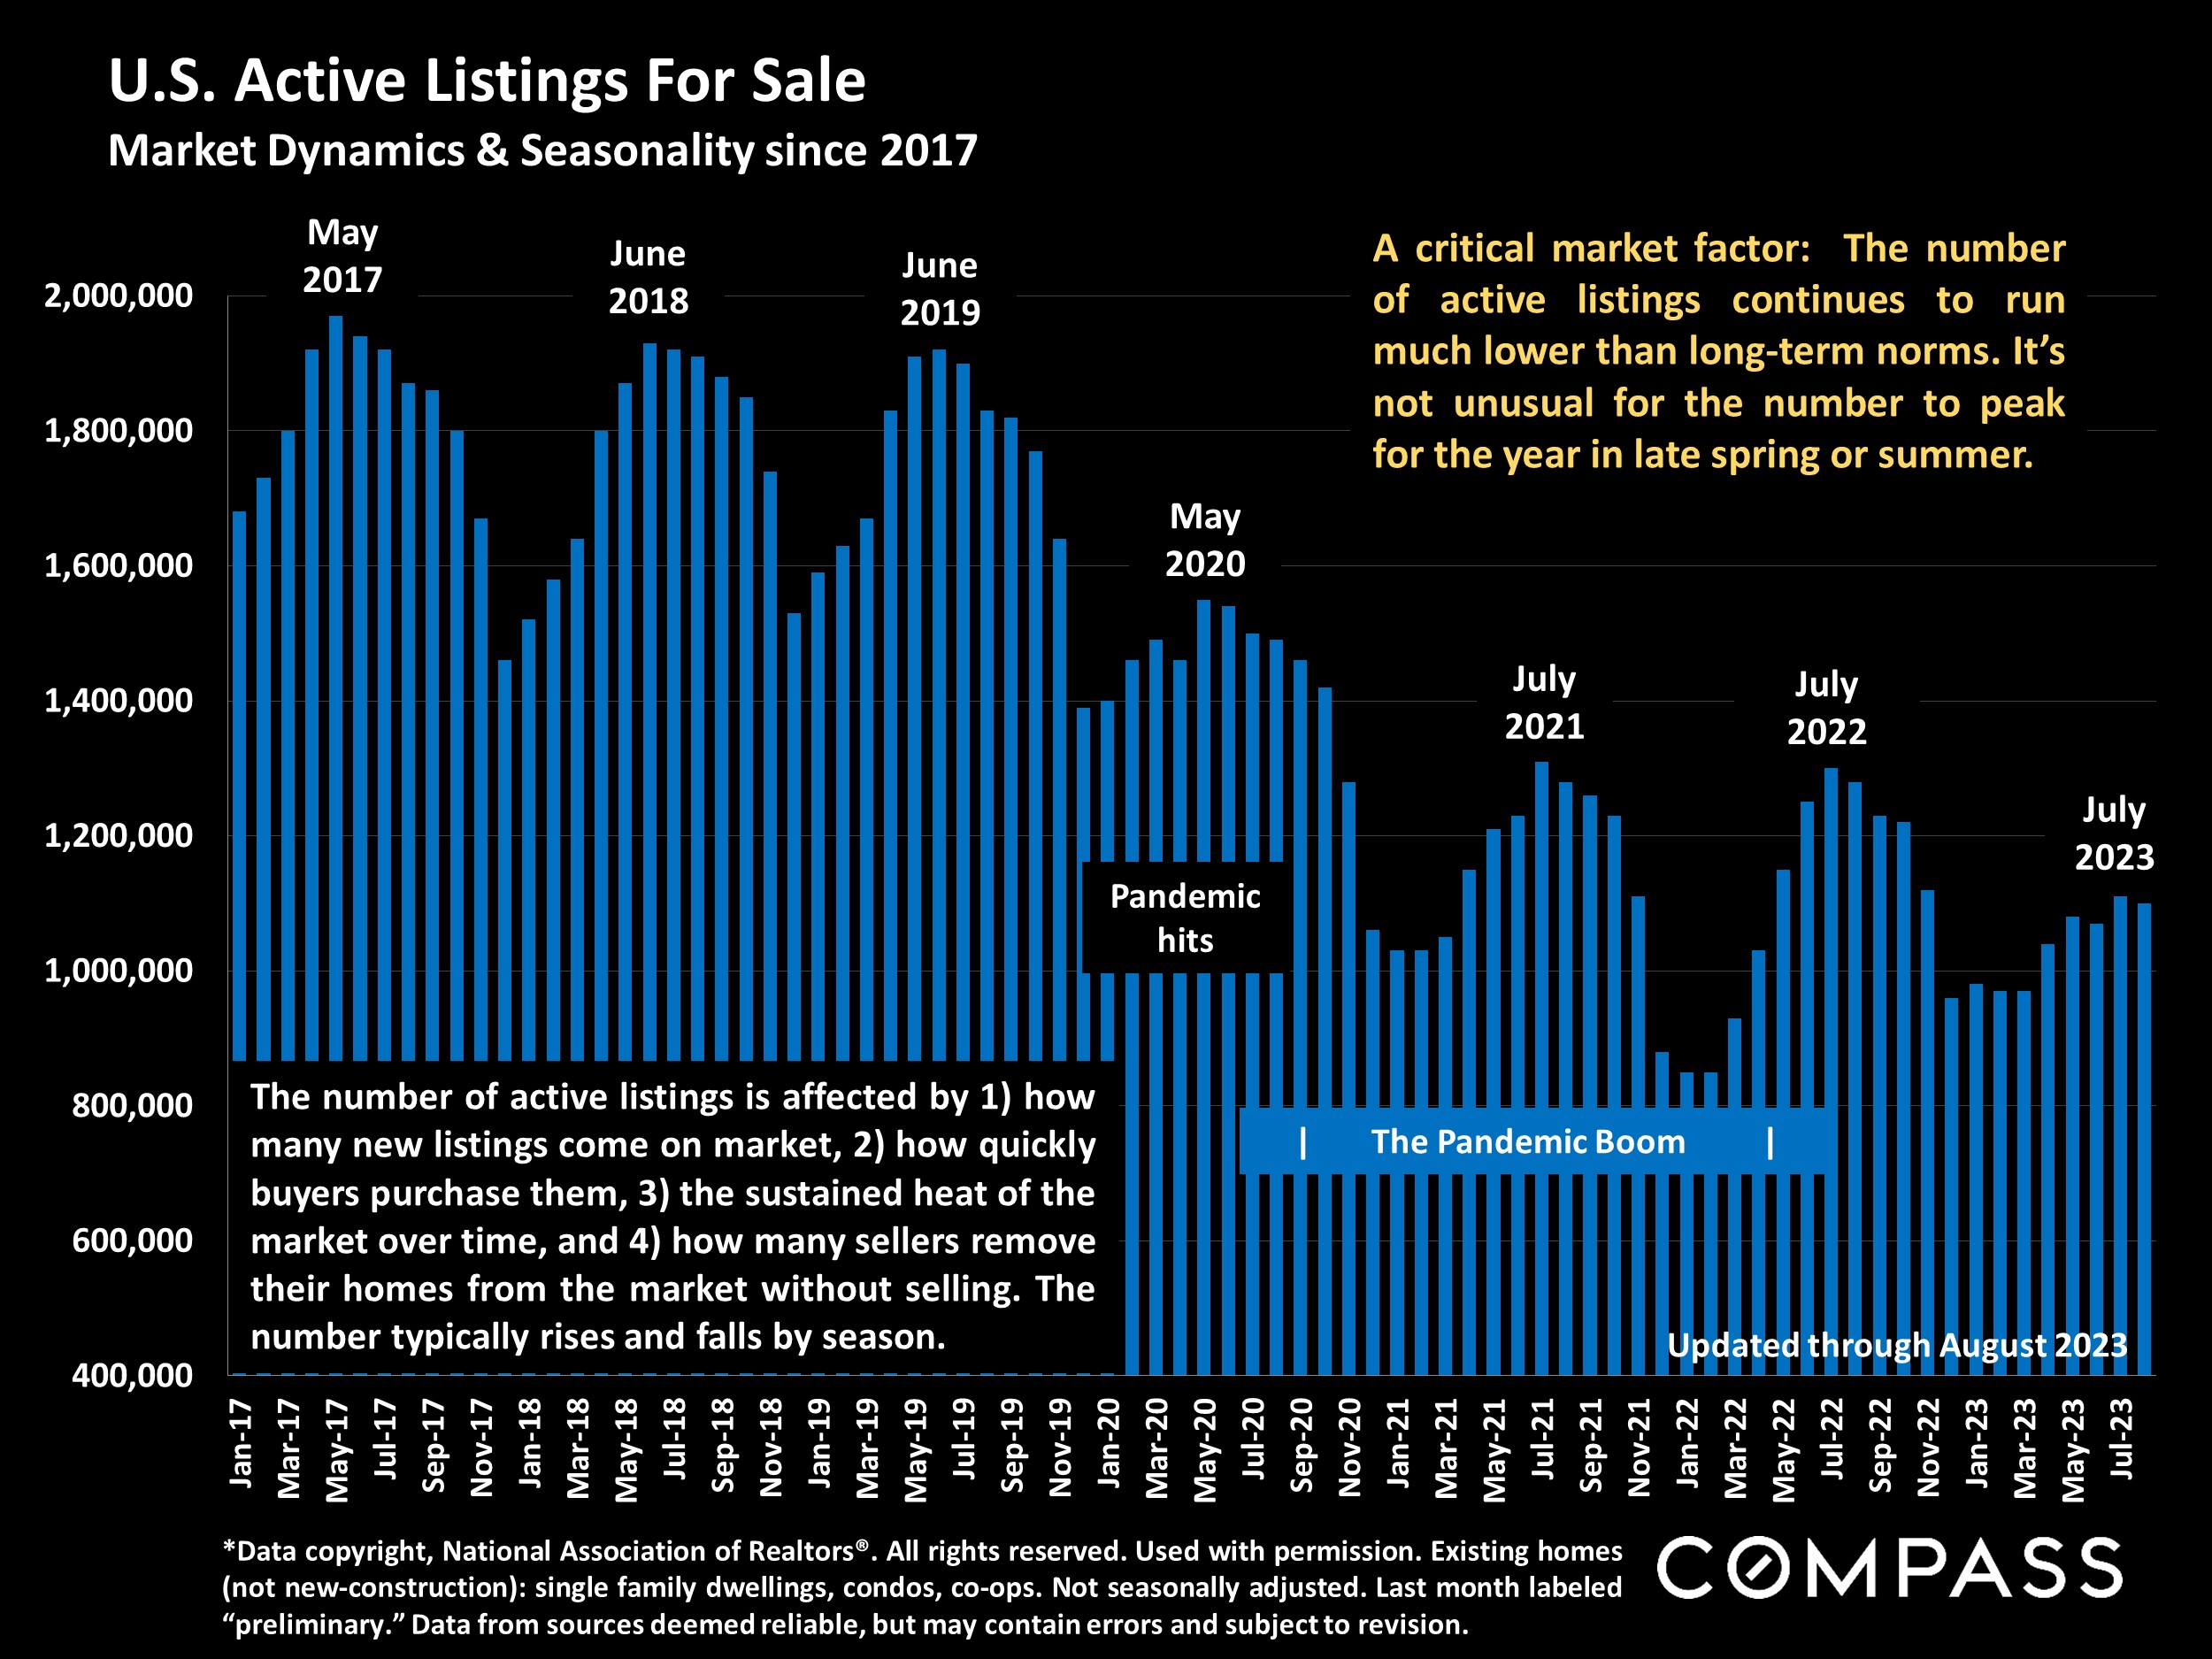
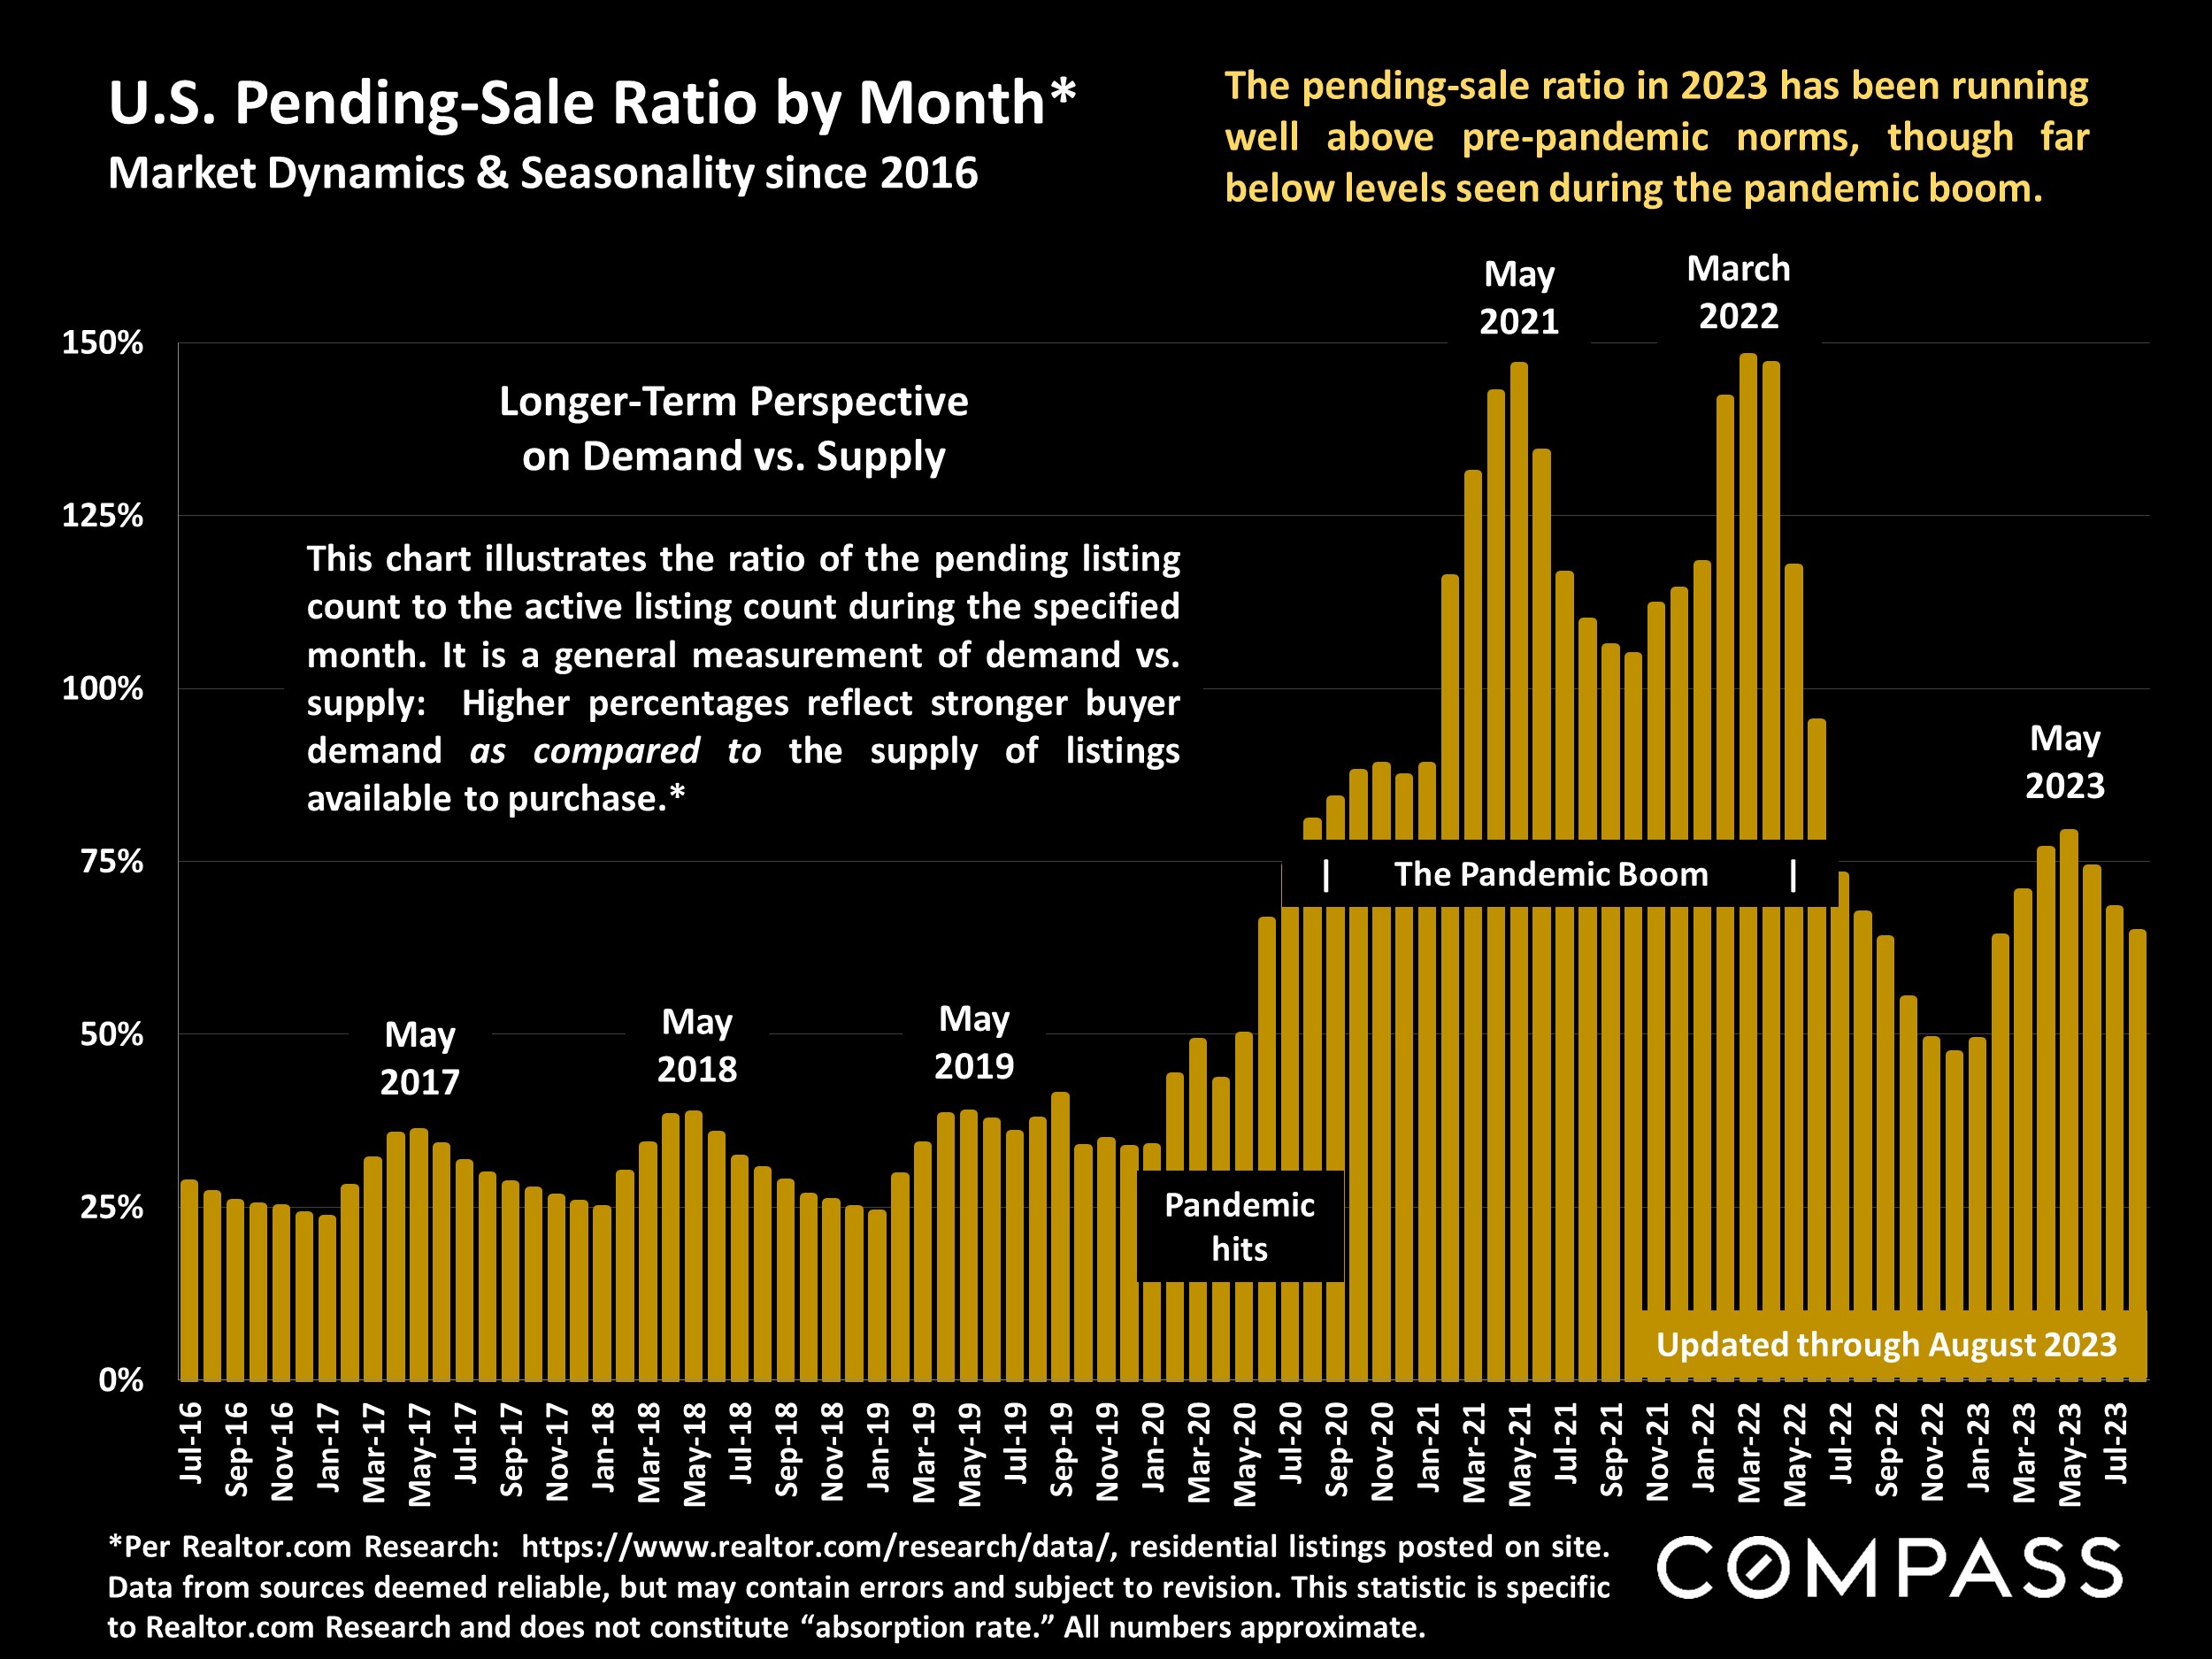
“The surprisingly quick recovery [of the housing market] suggests that the residential real-estate downturn is turning out to be shorter and shallower than many housing economists expected after mortgage rates soared last year…There still aren’t enough homes for sale to meet demand.” The Wall Street Journal, “The Fall in Home Prices May Already Be Over,” 9/8/23
“Though today’s housing market is decidedly challenging, the fall typically ushers in more favorable buying conditions relative to the rest of the year.” (Per historical trends in inventory and pricing.) Realtor.com Chief Economist, Weekly Housing Trends, 9/18/23
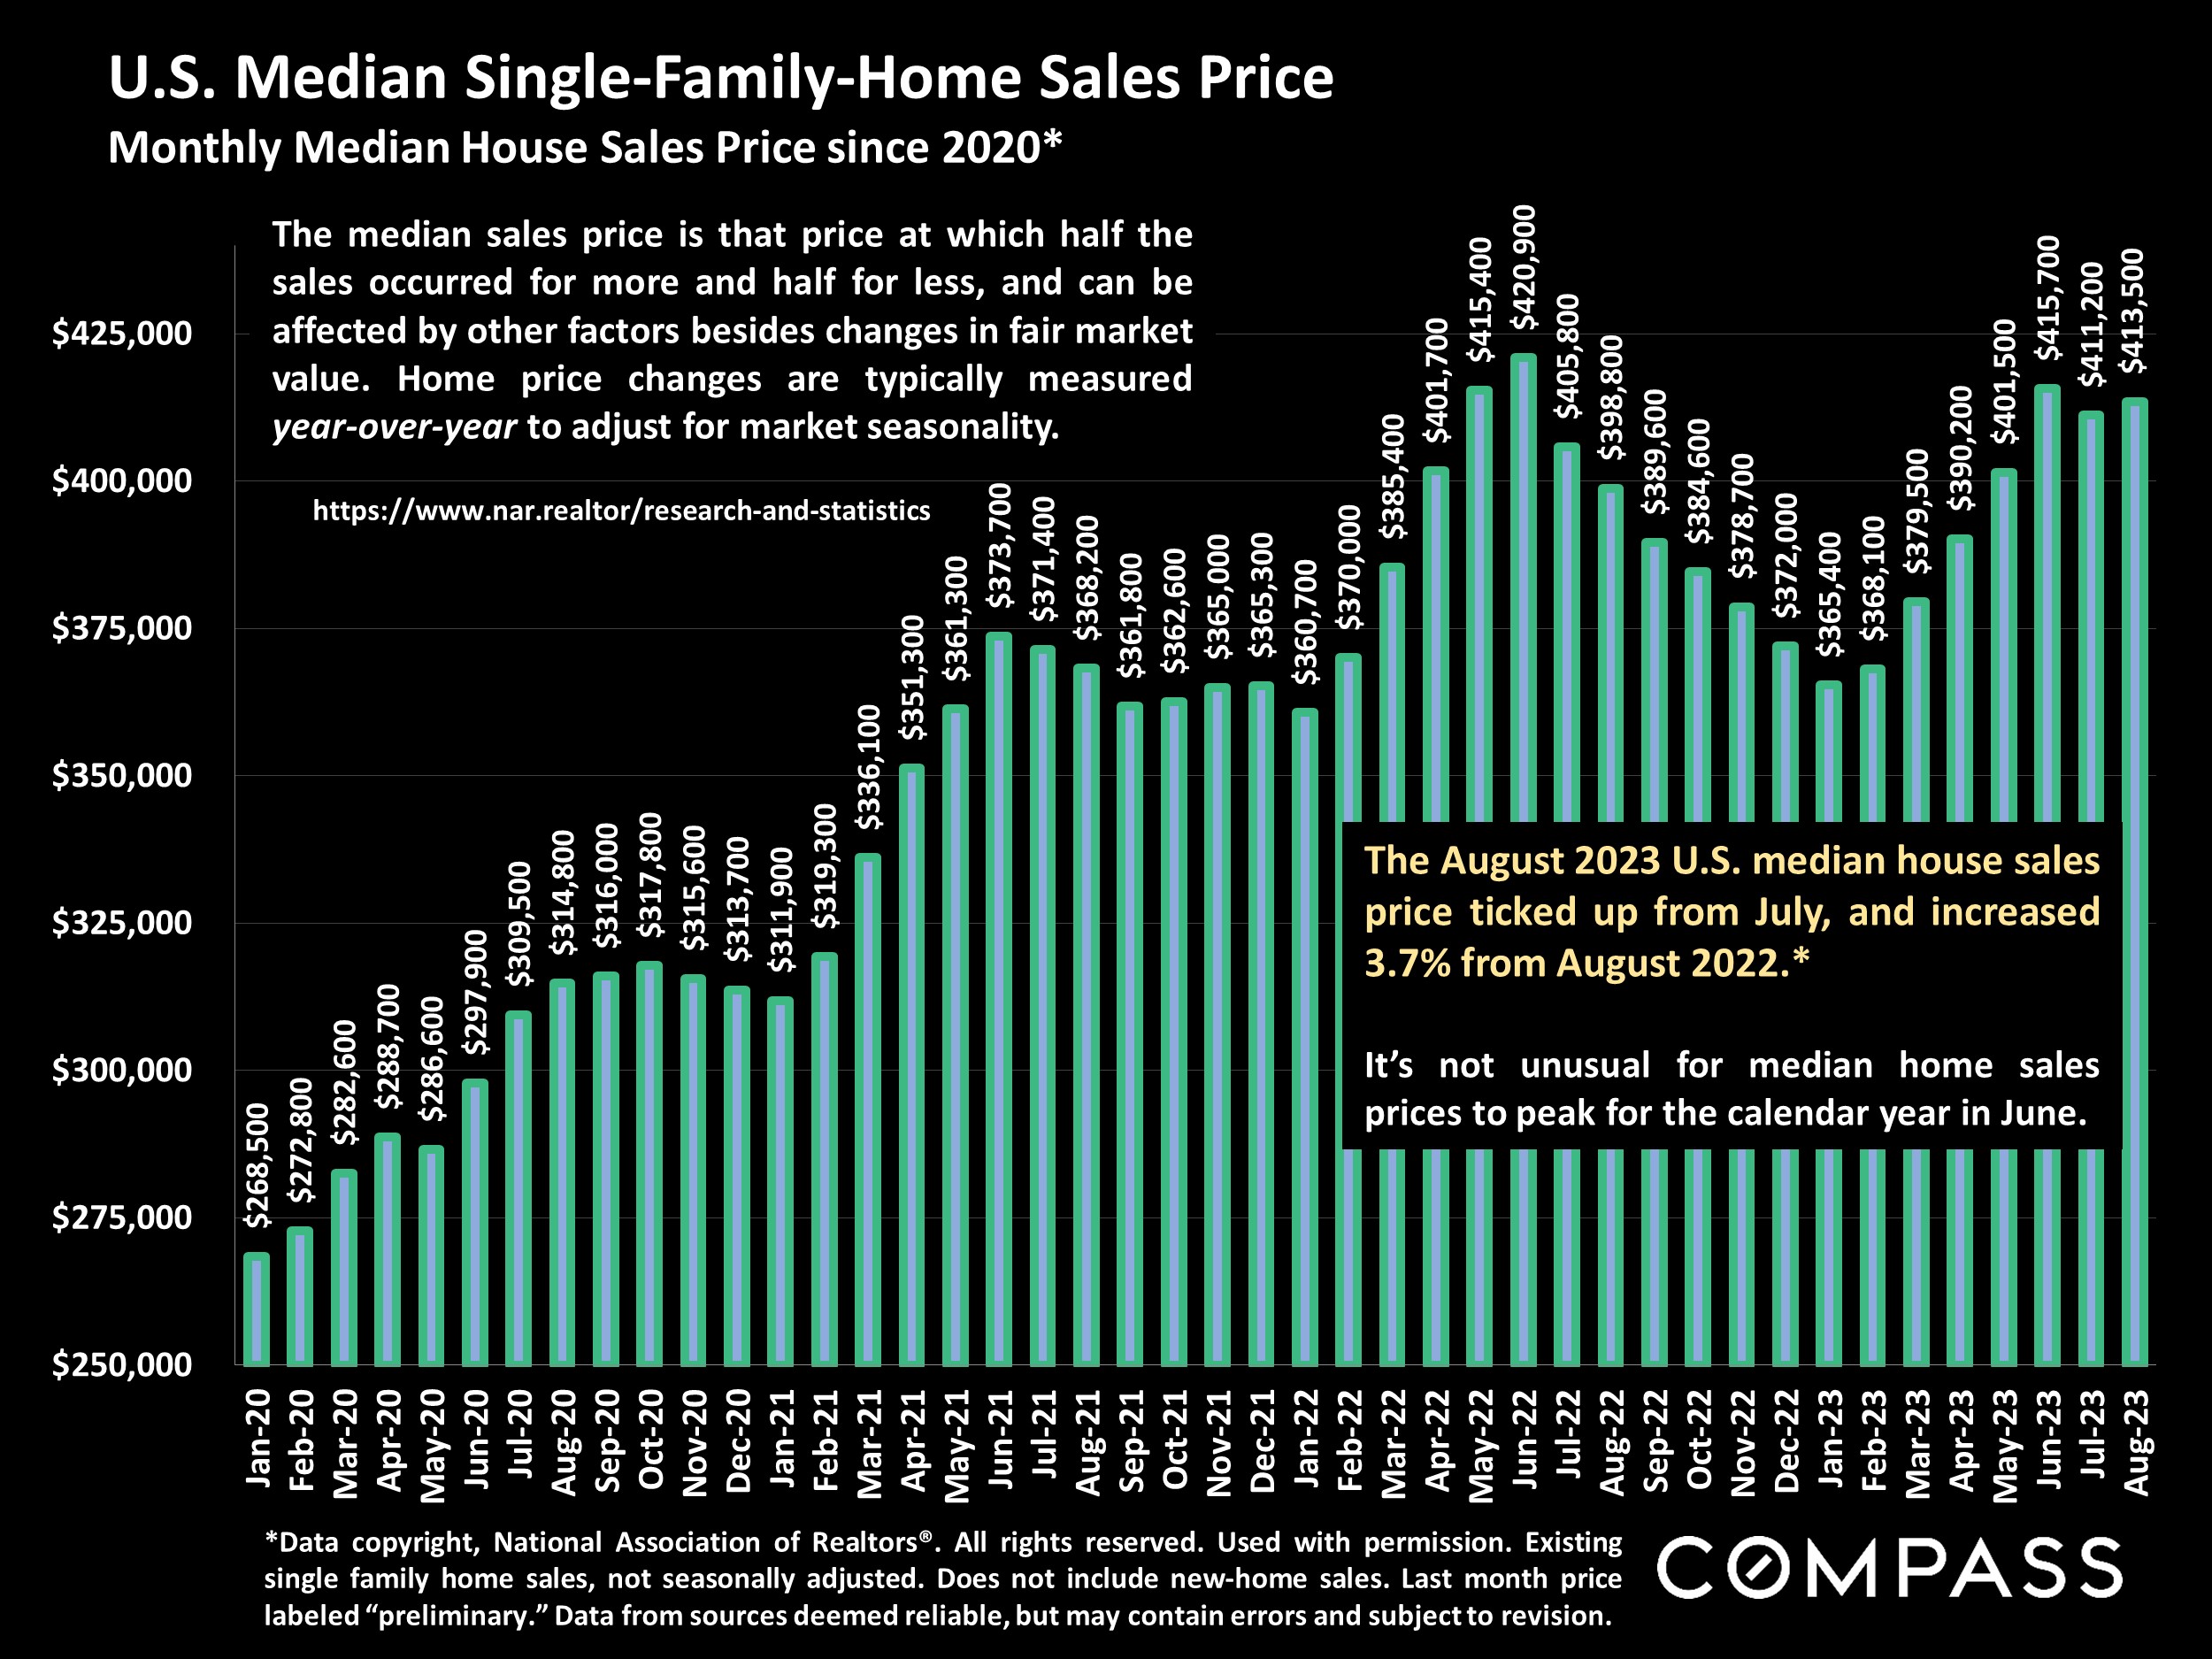
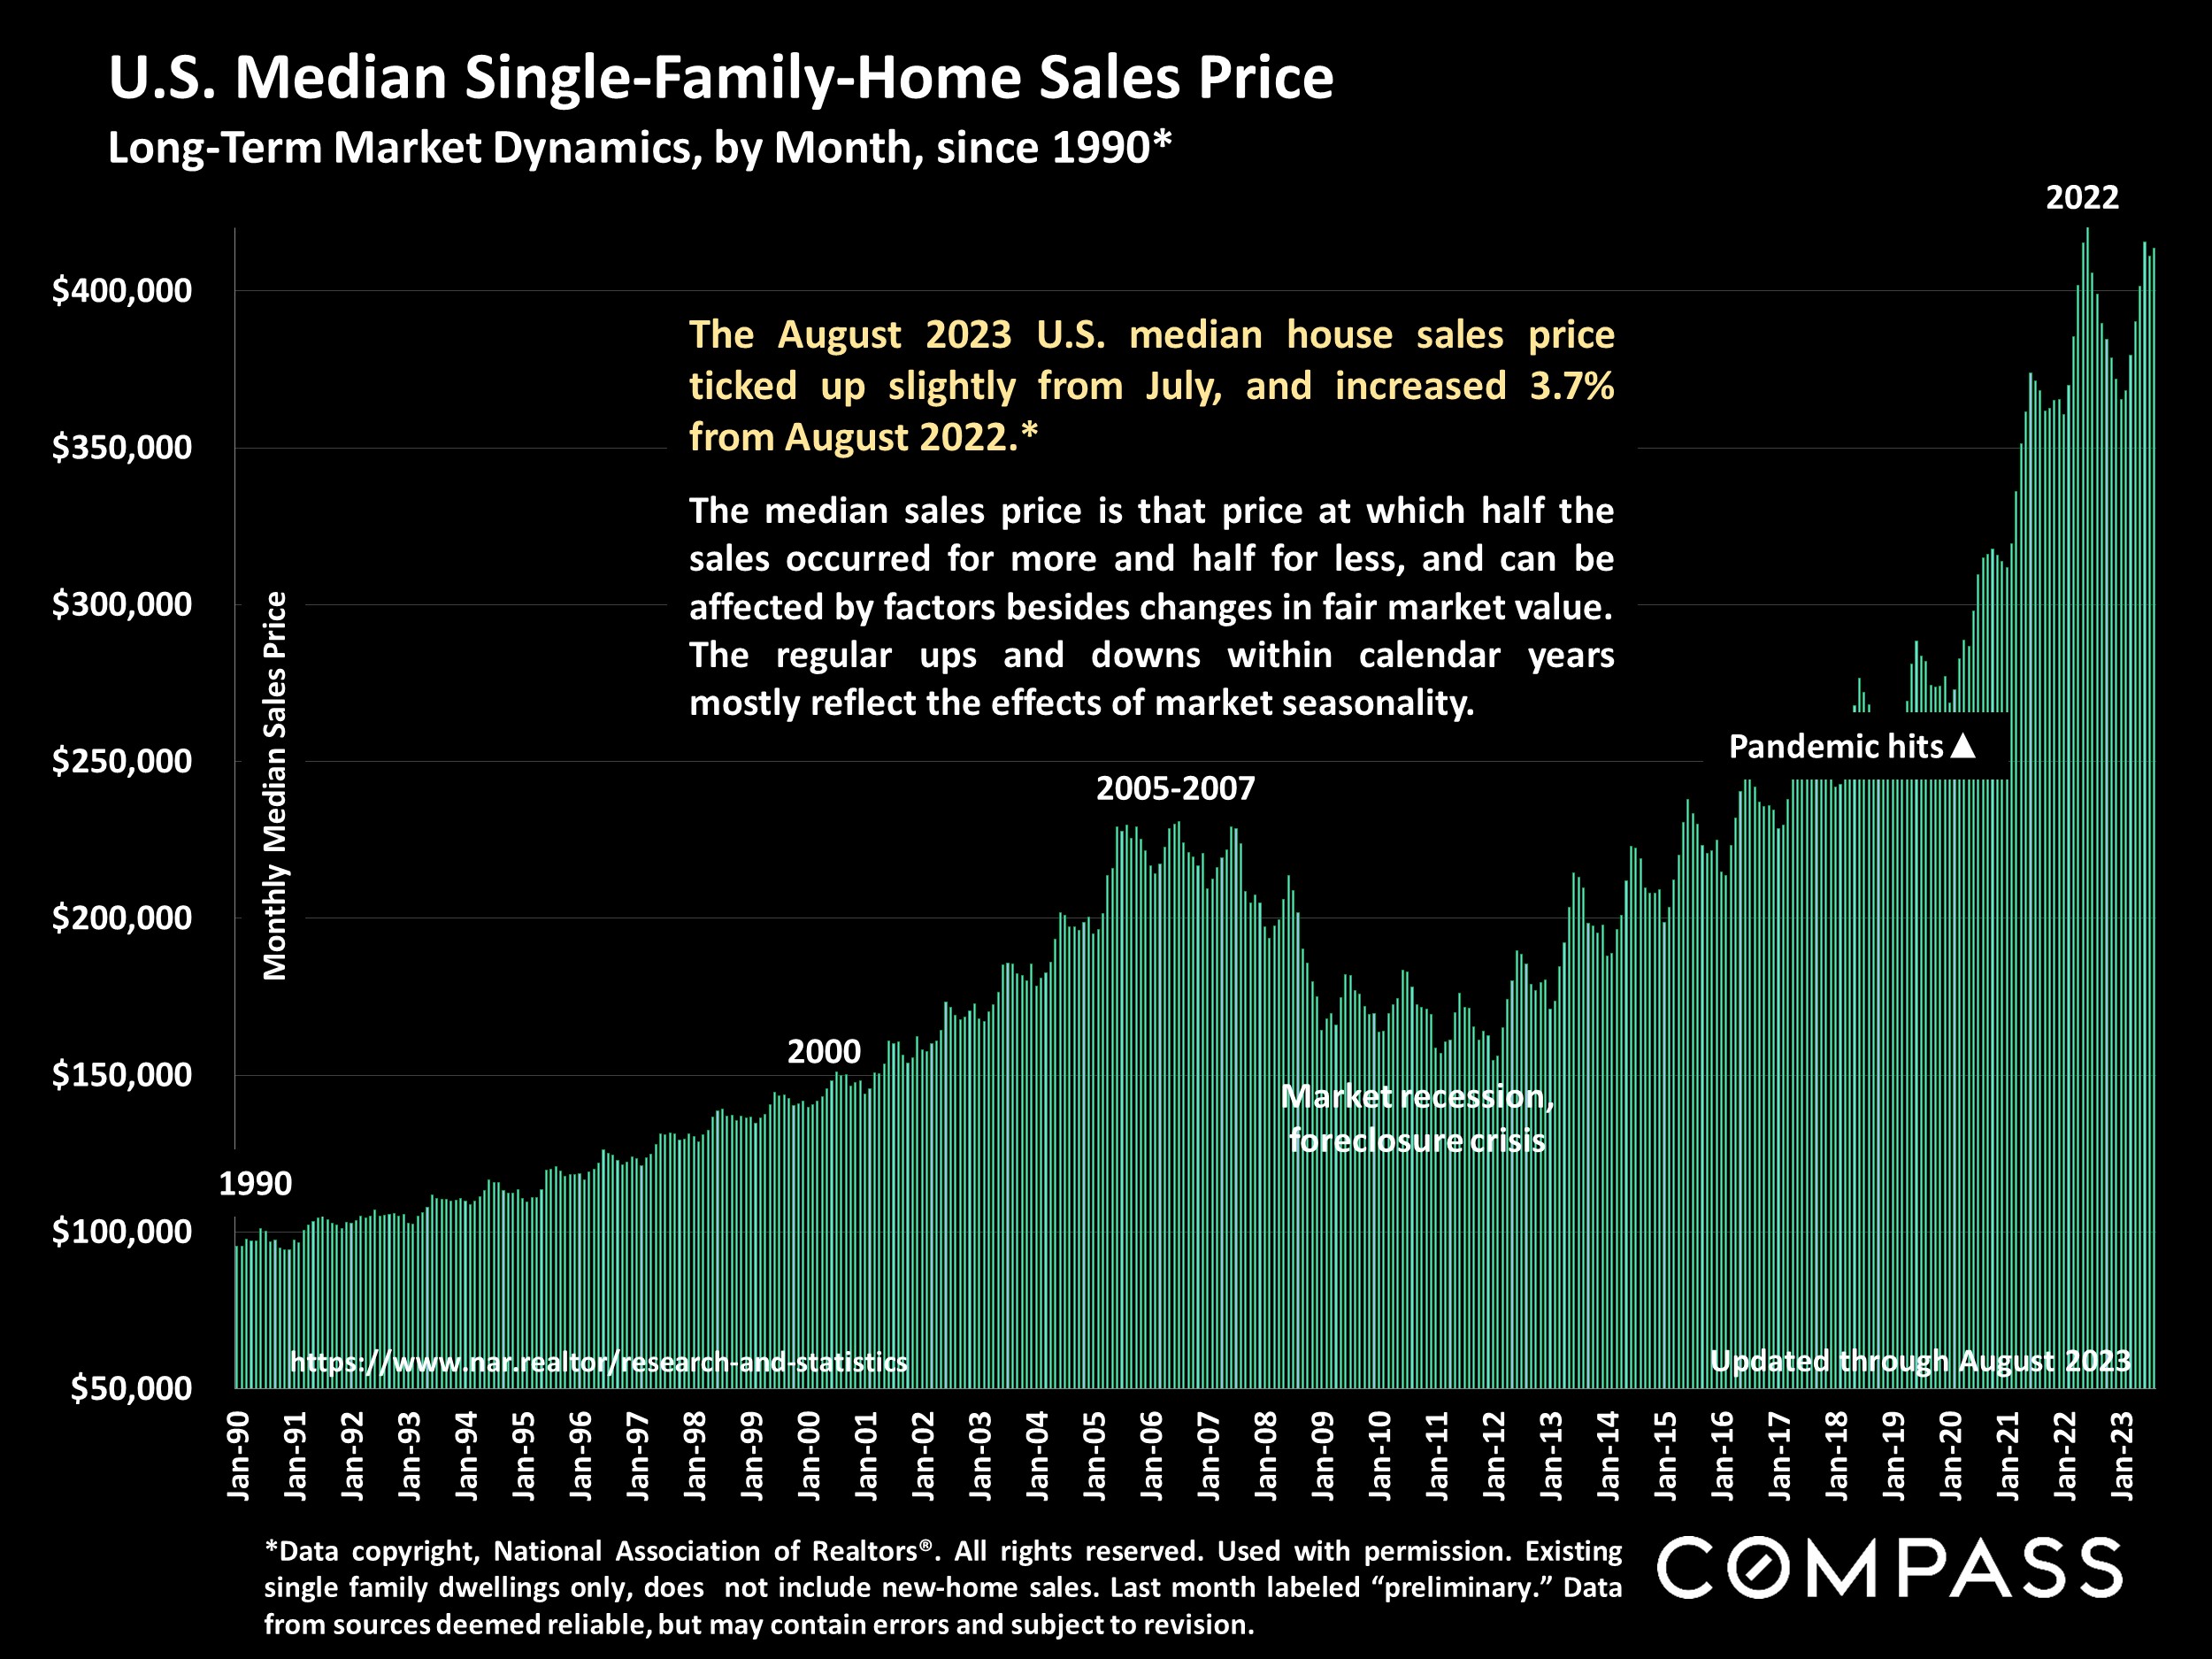
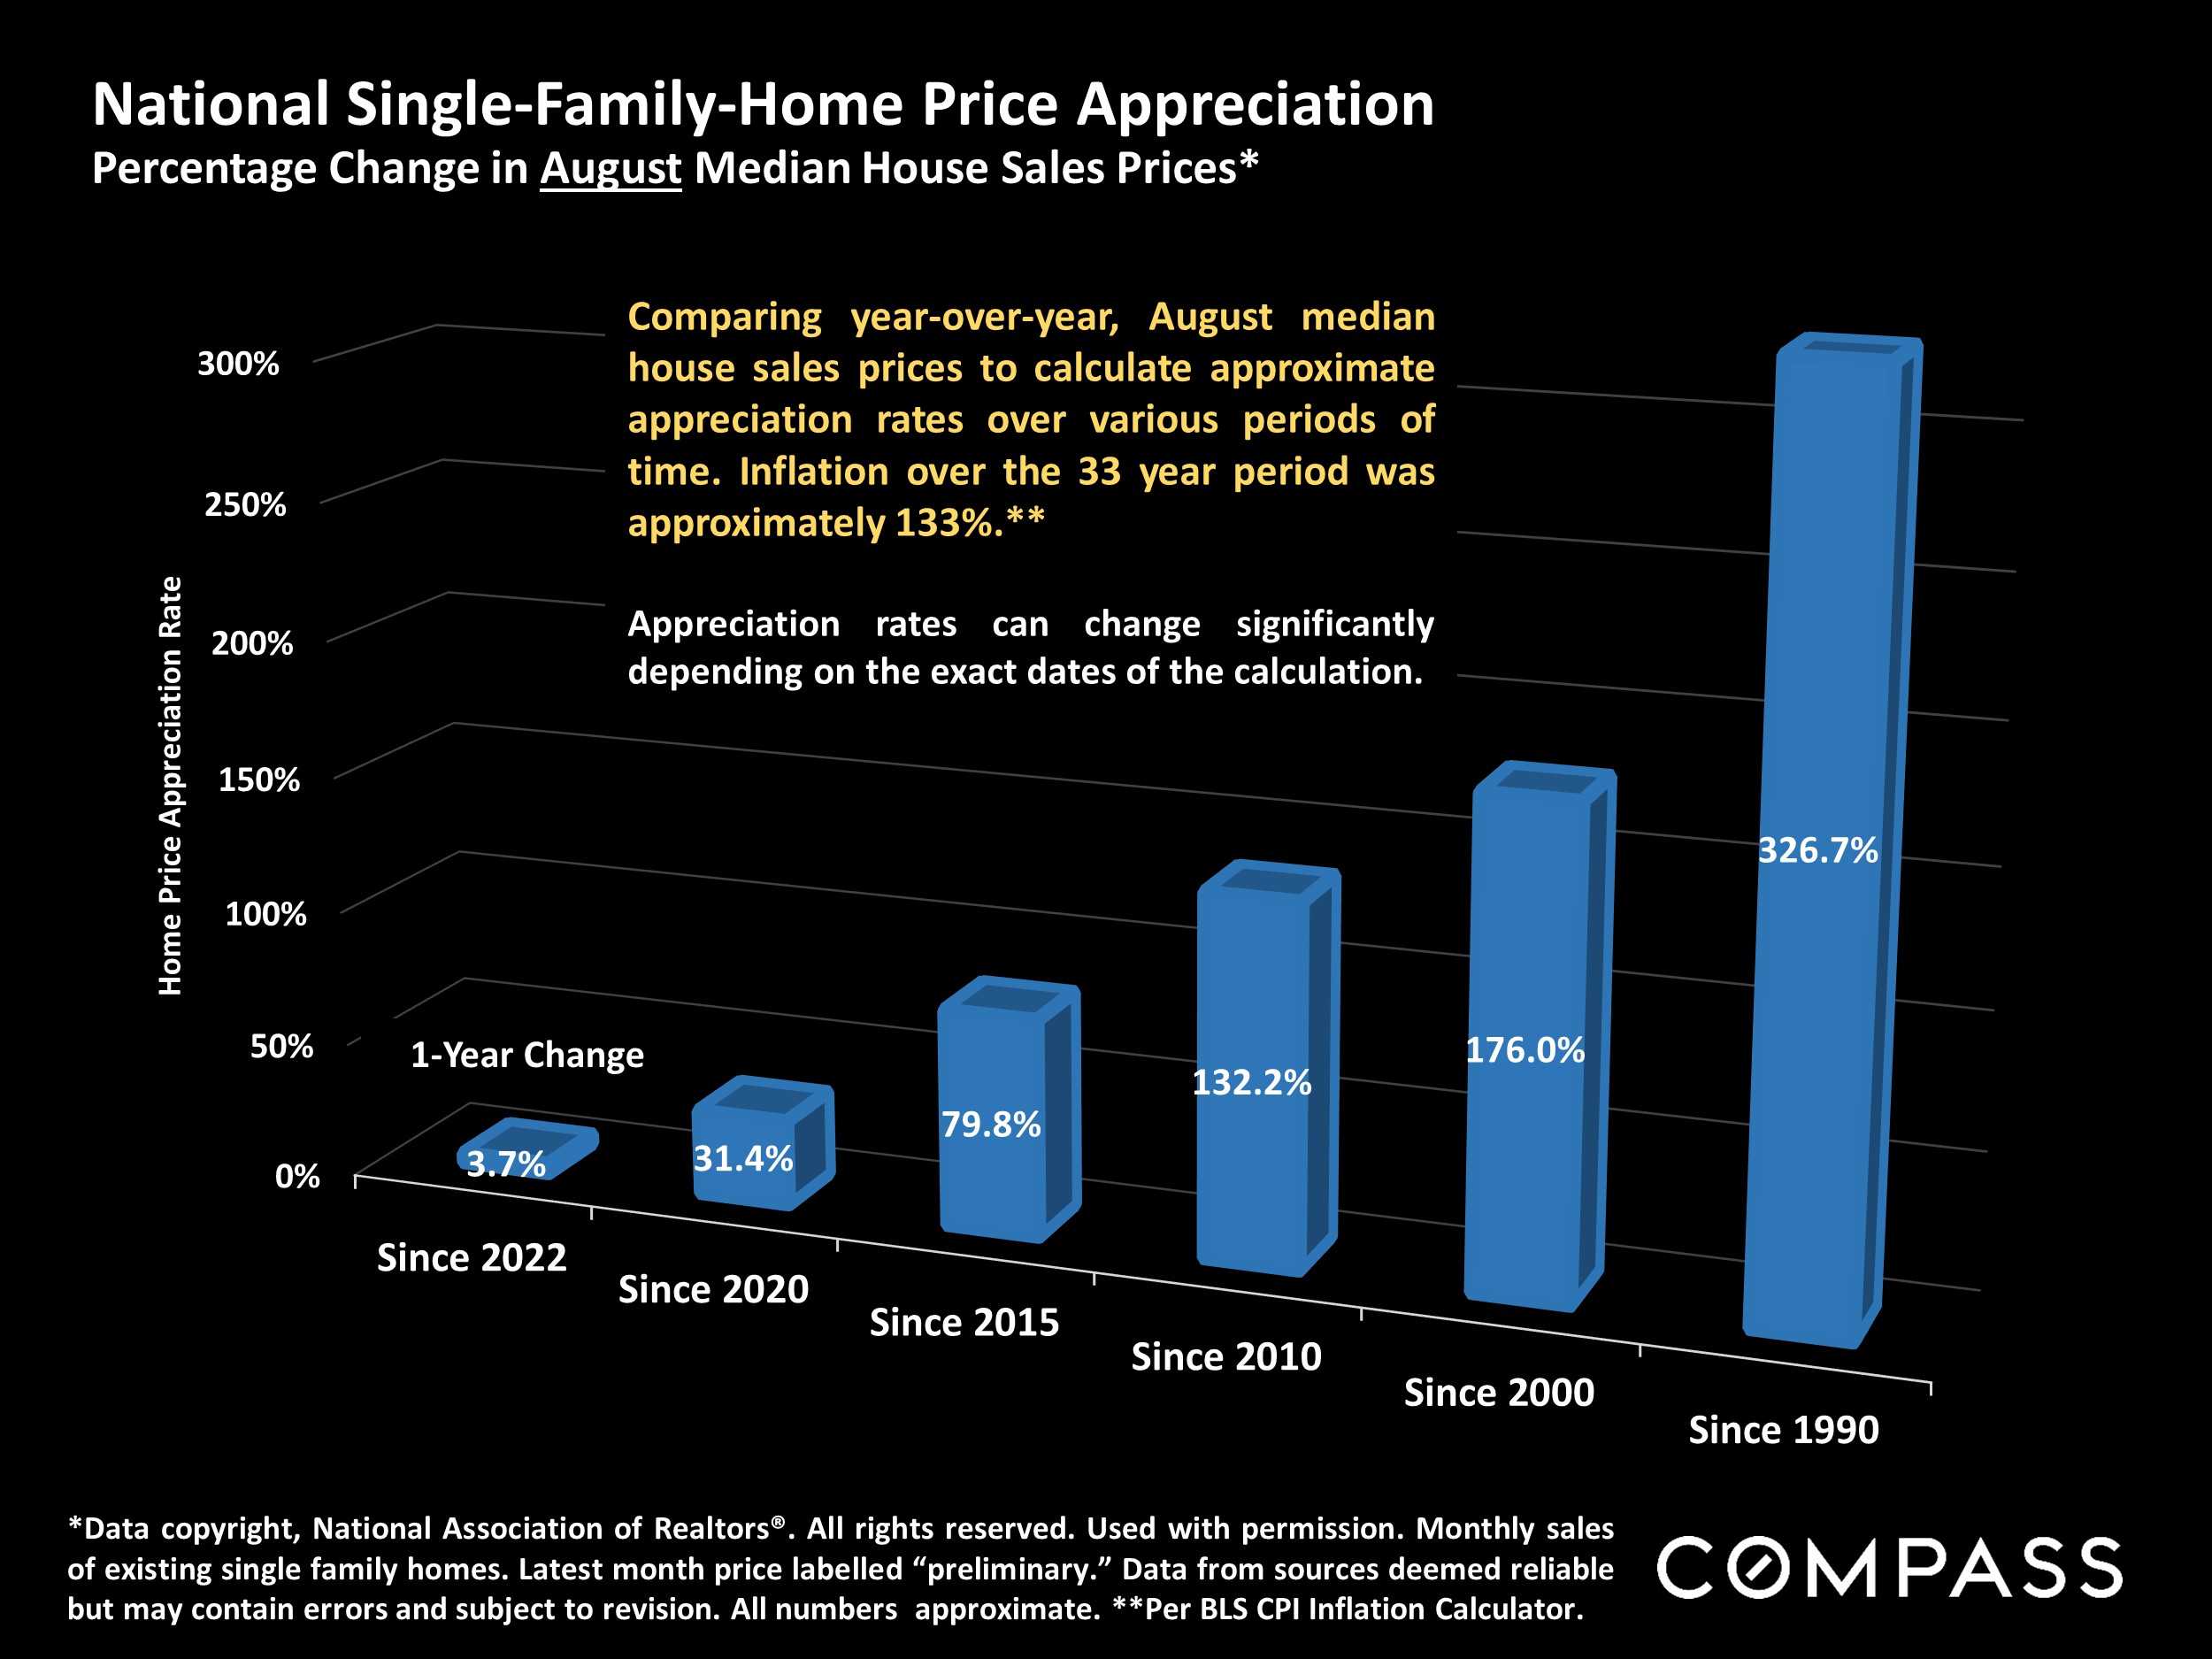
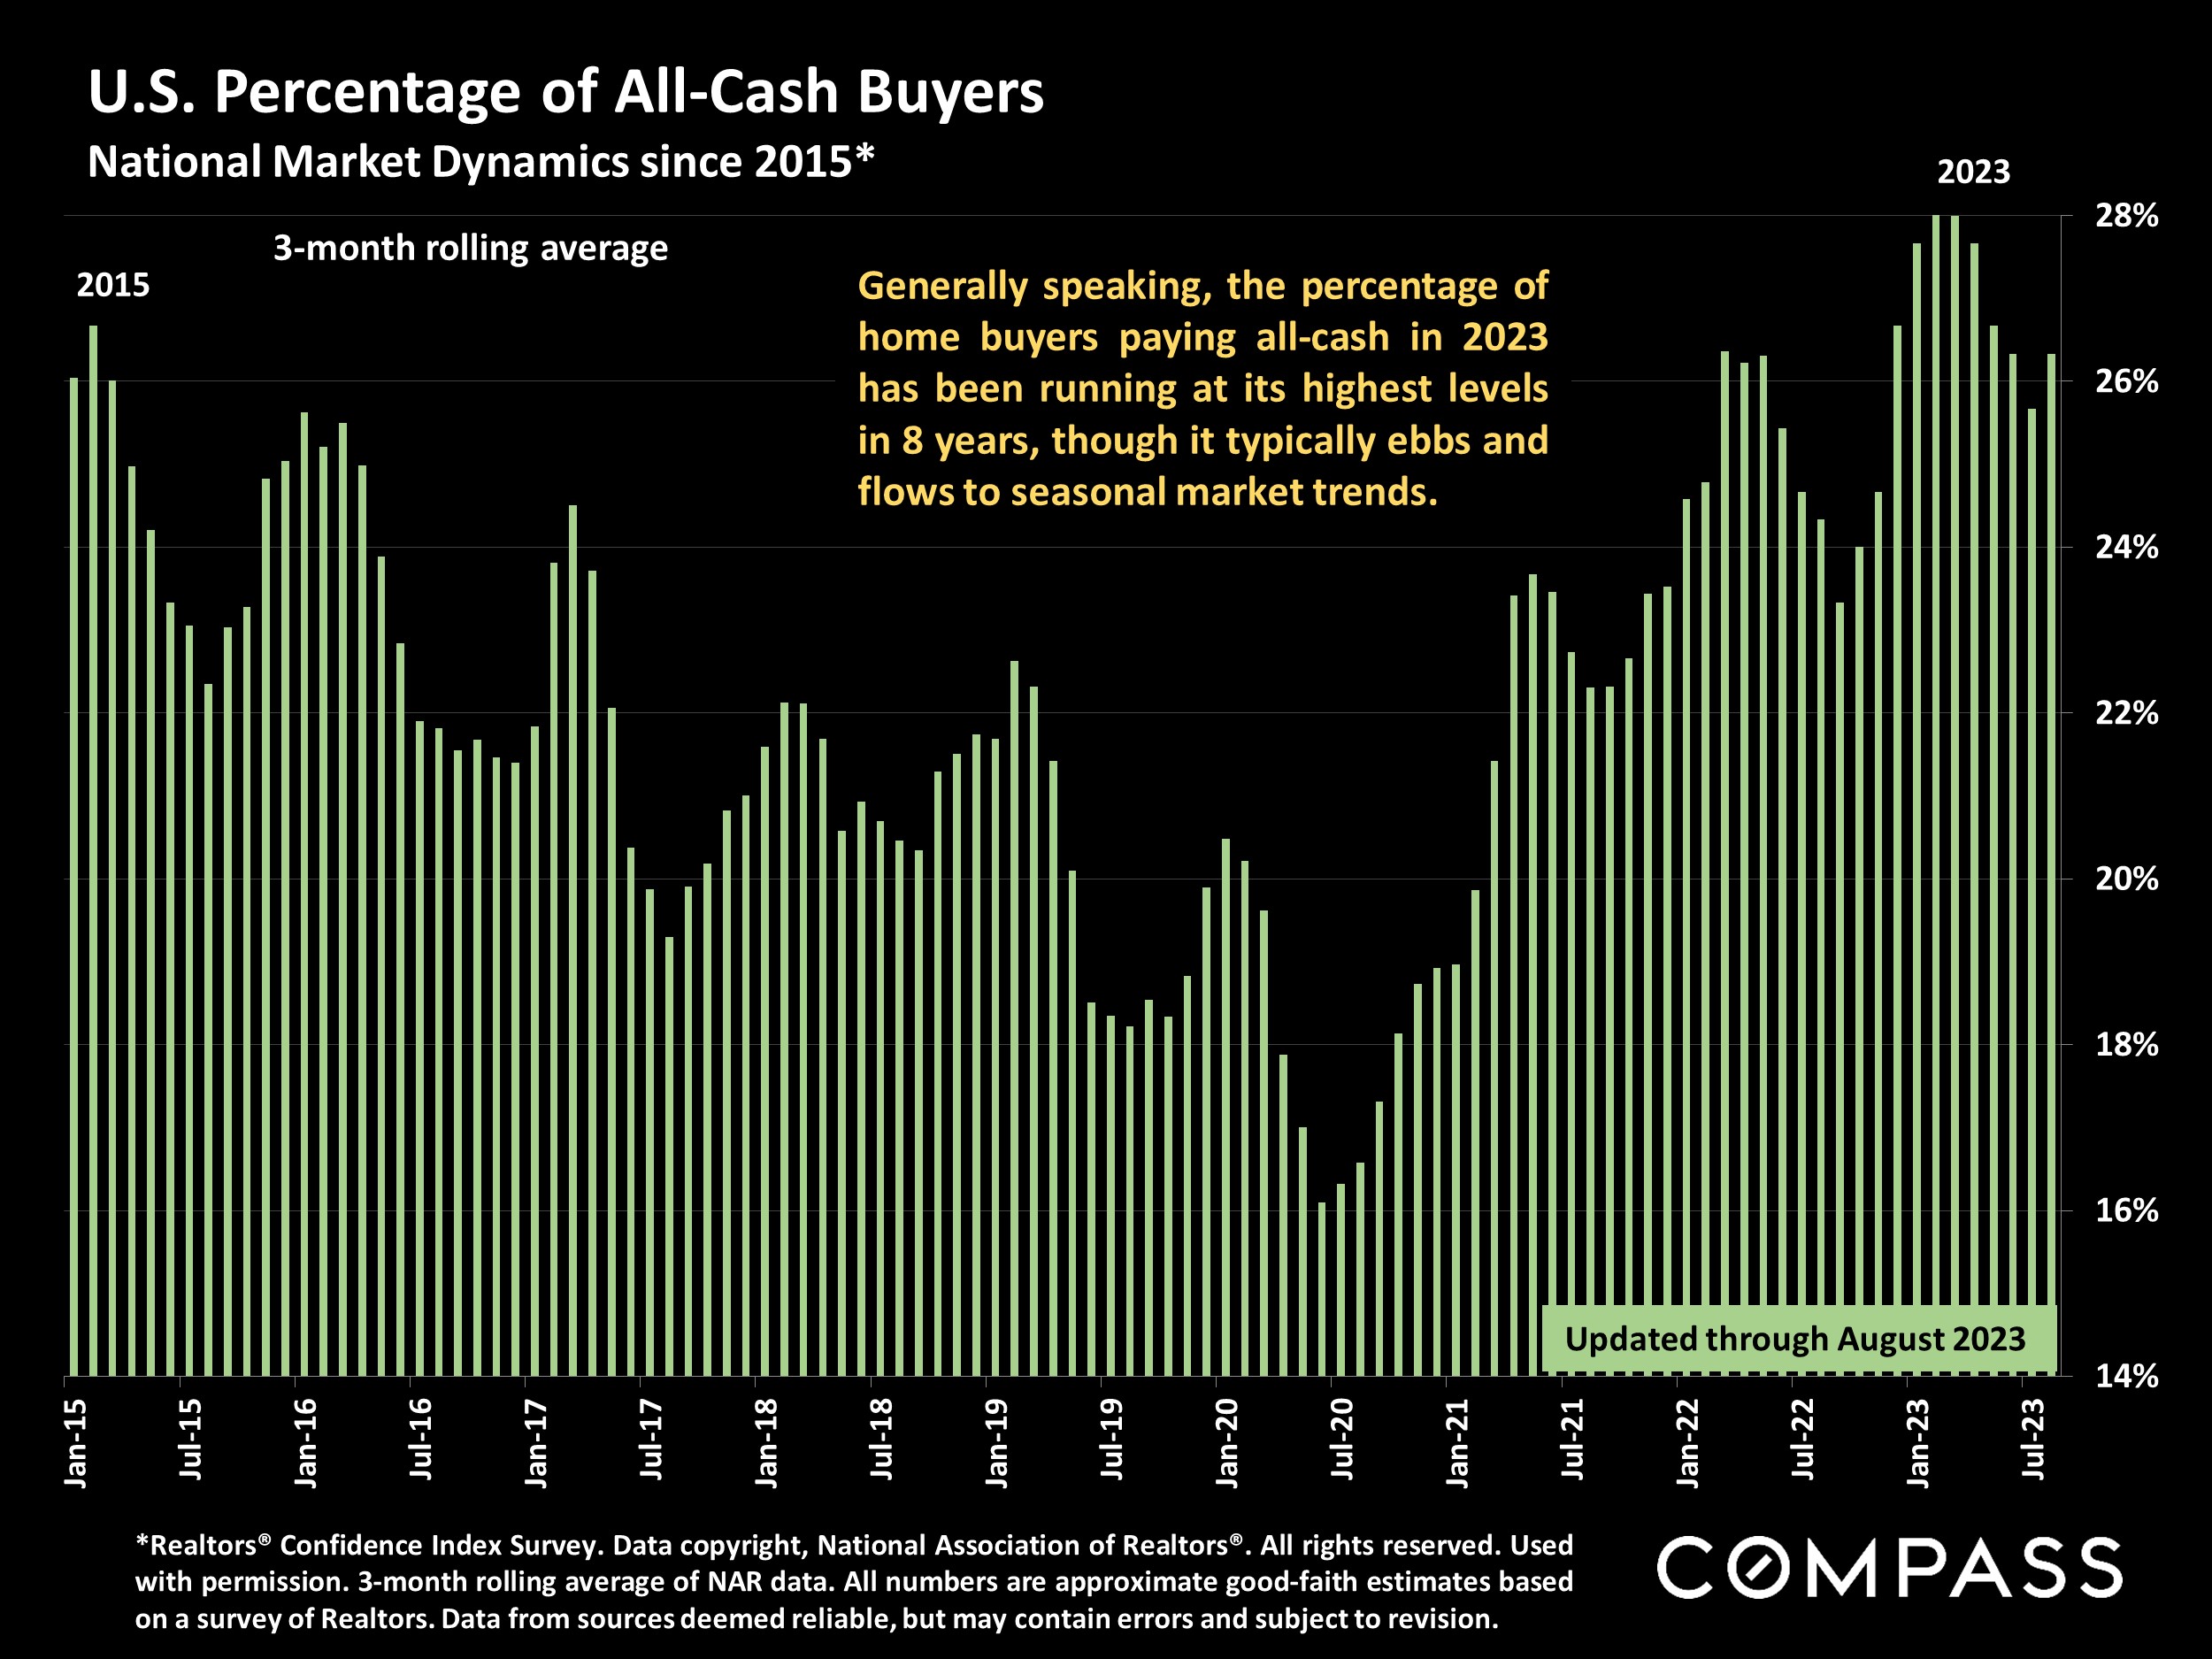
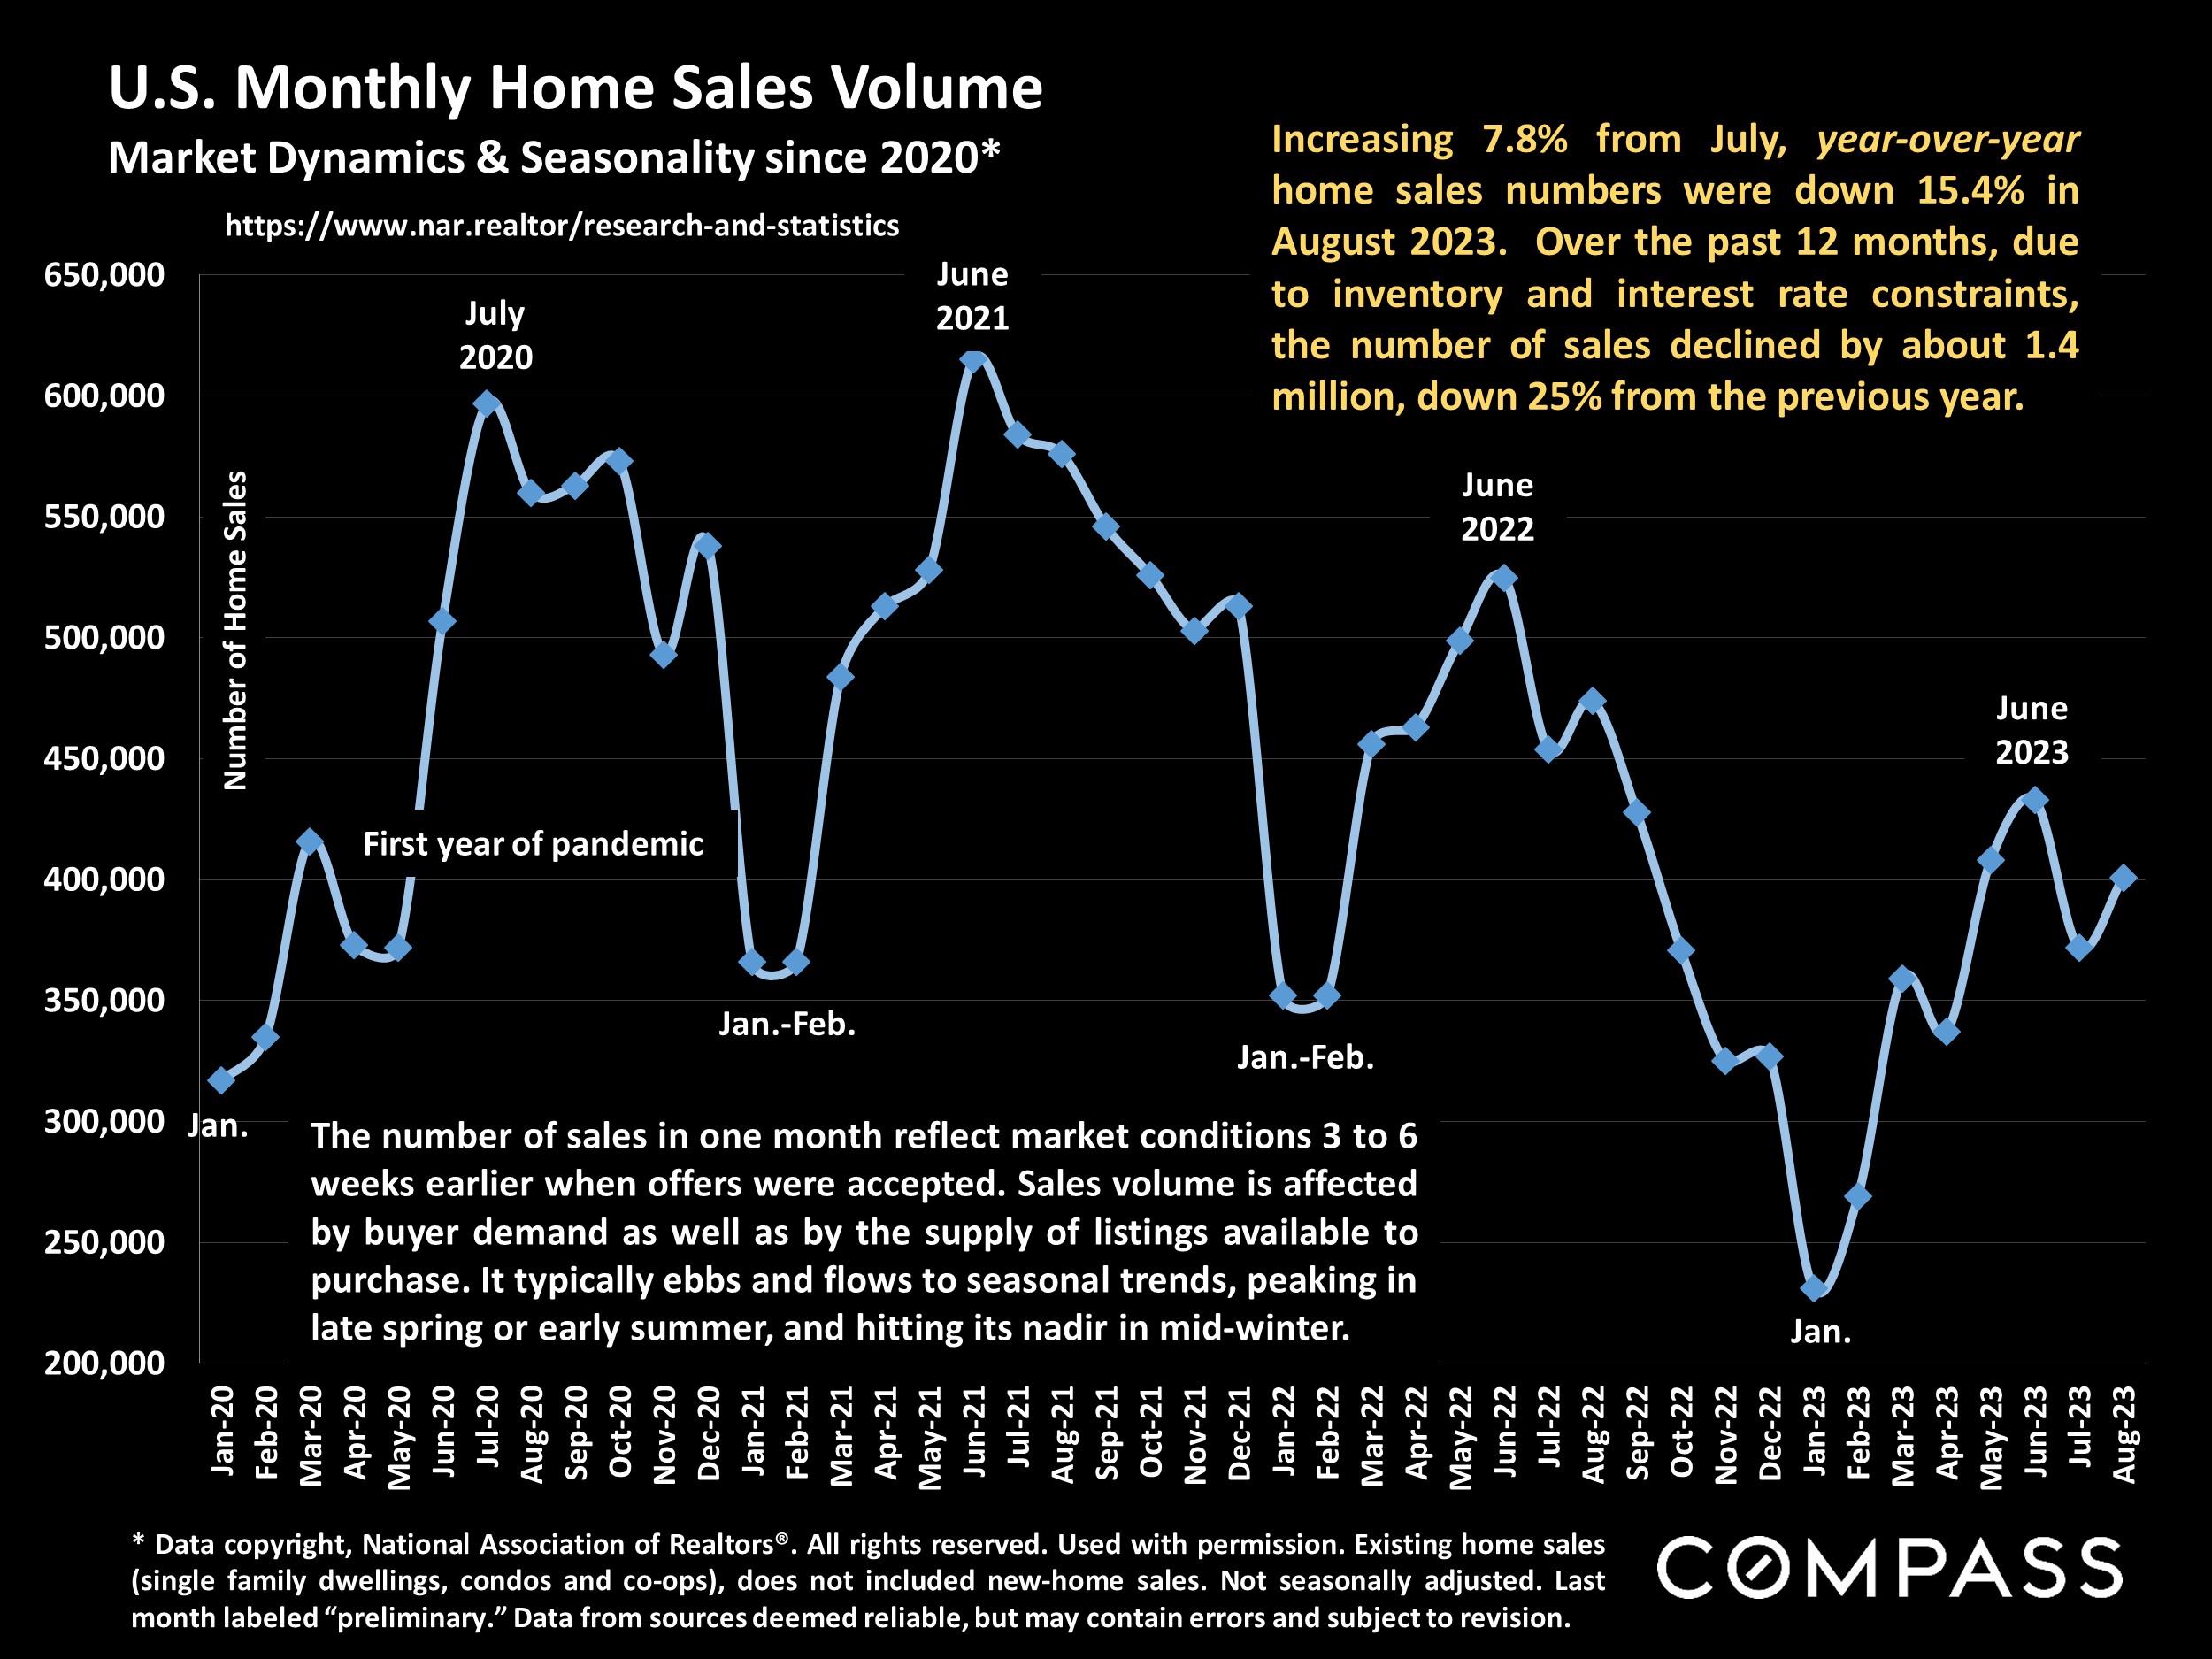
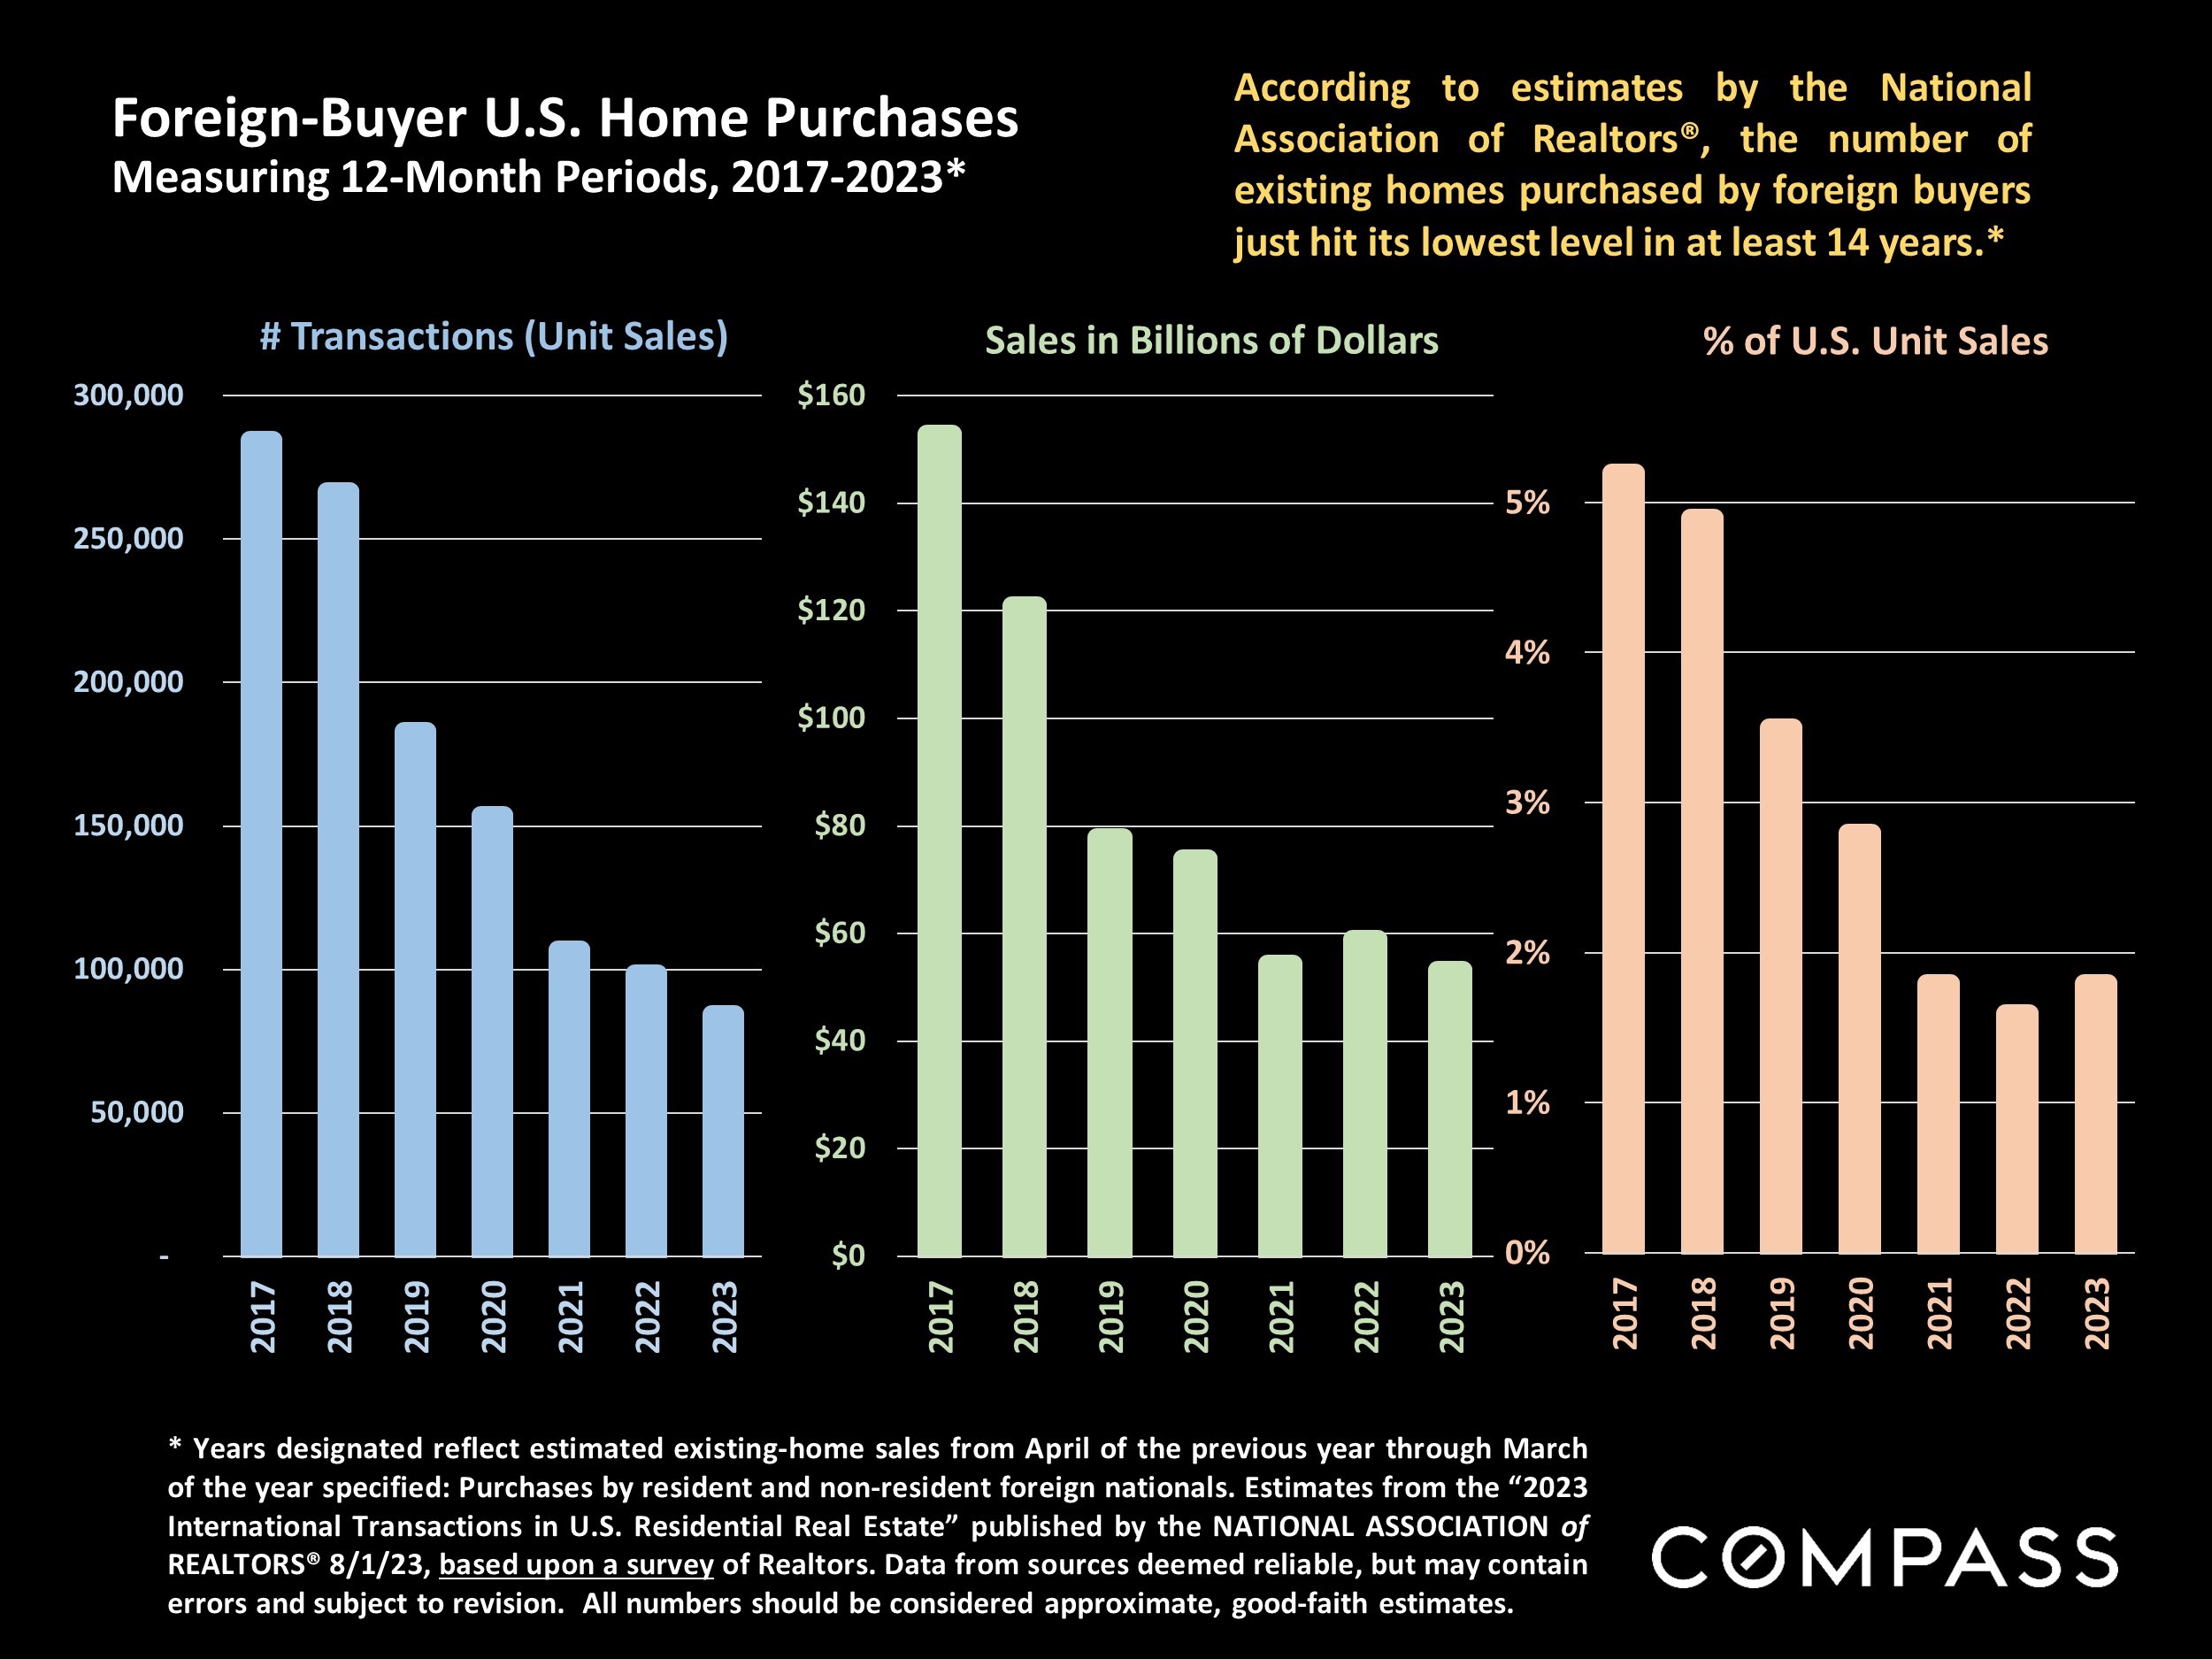
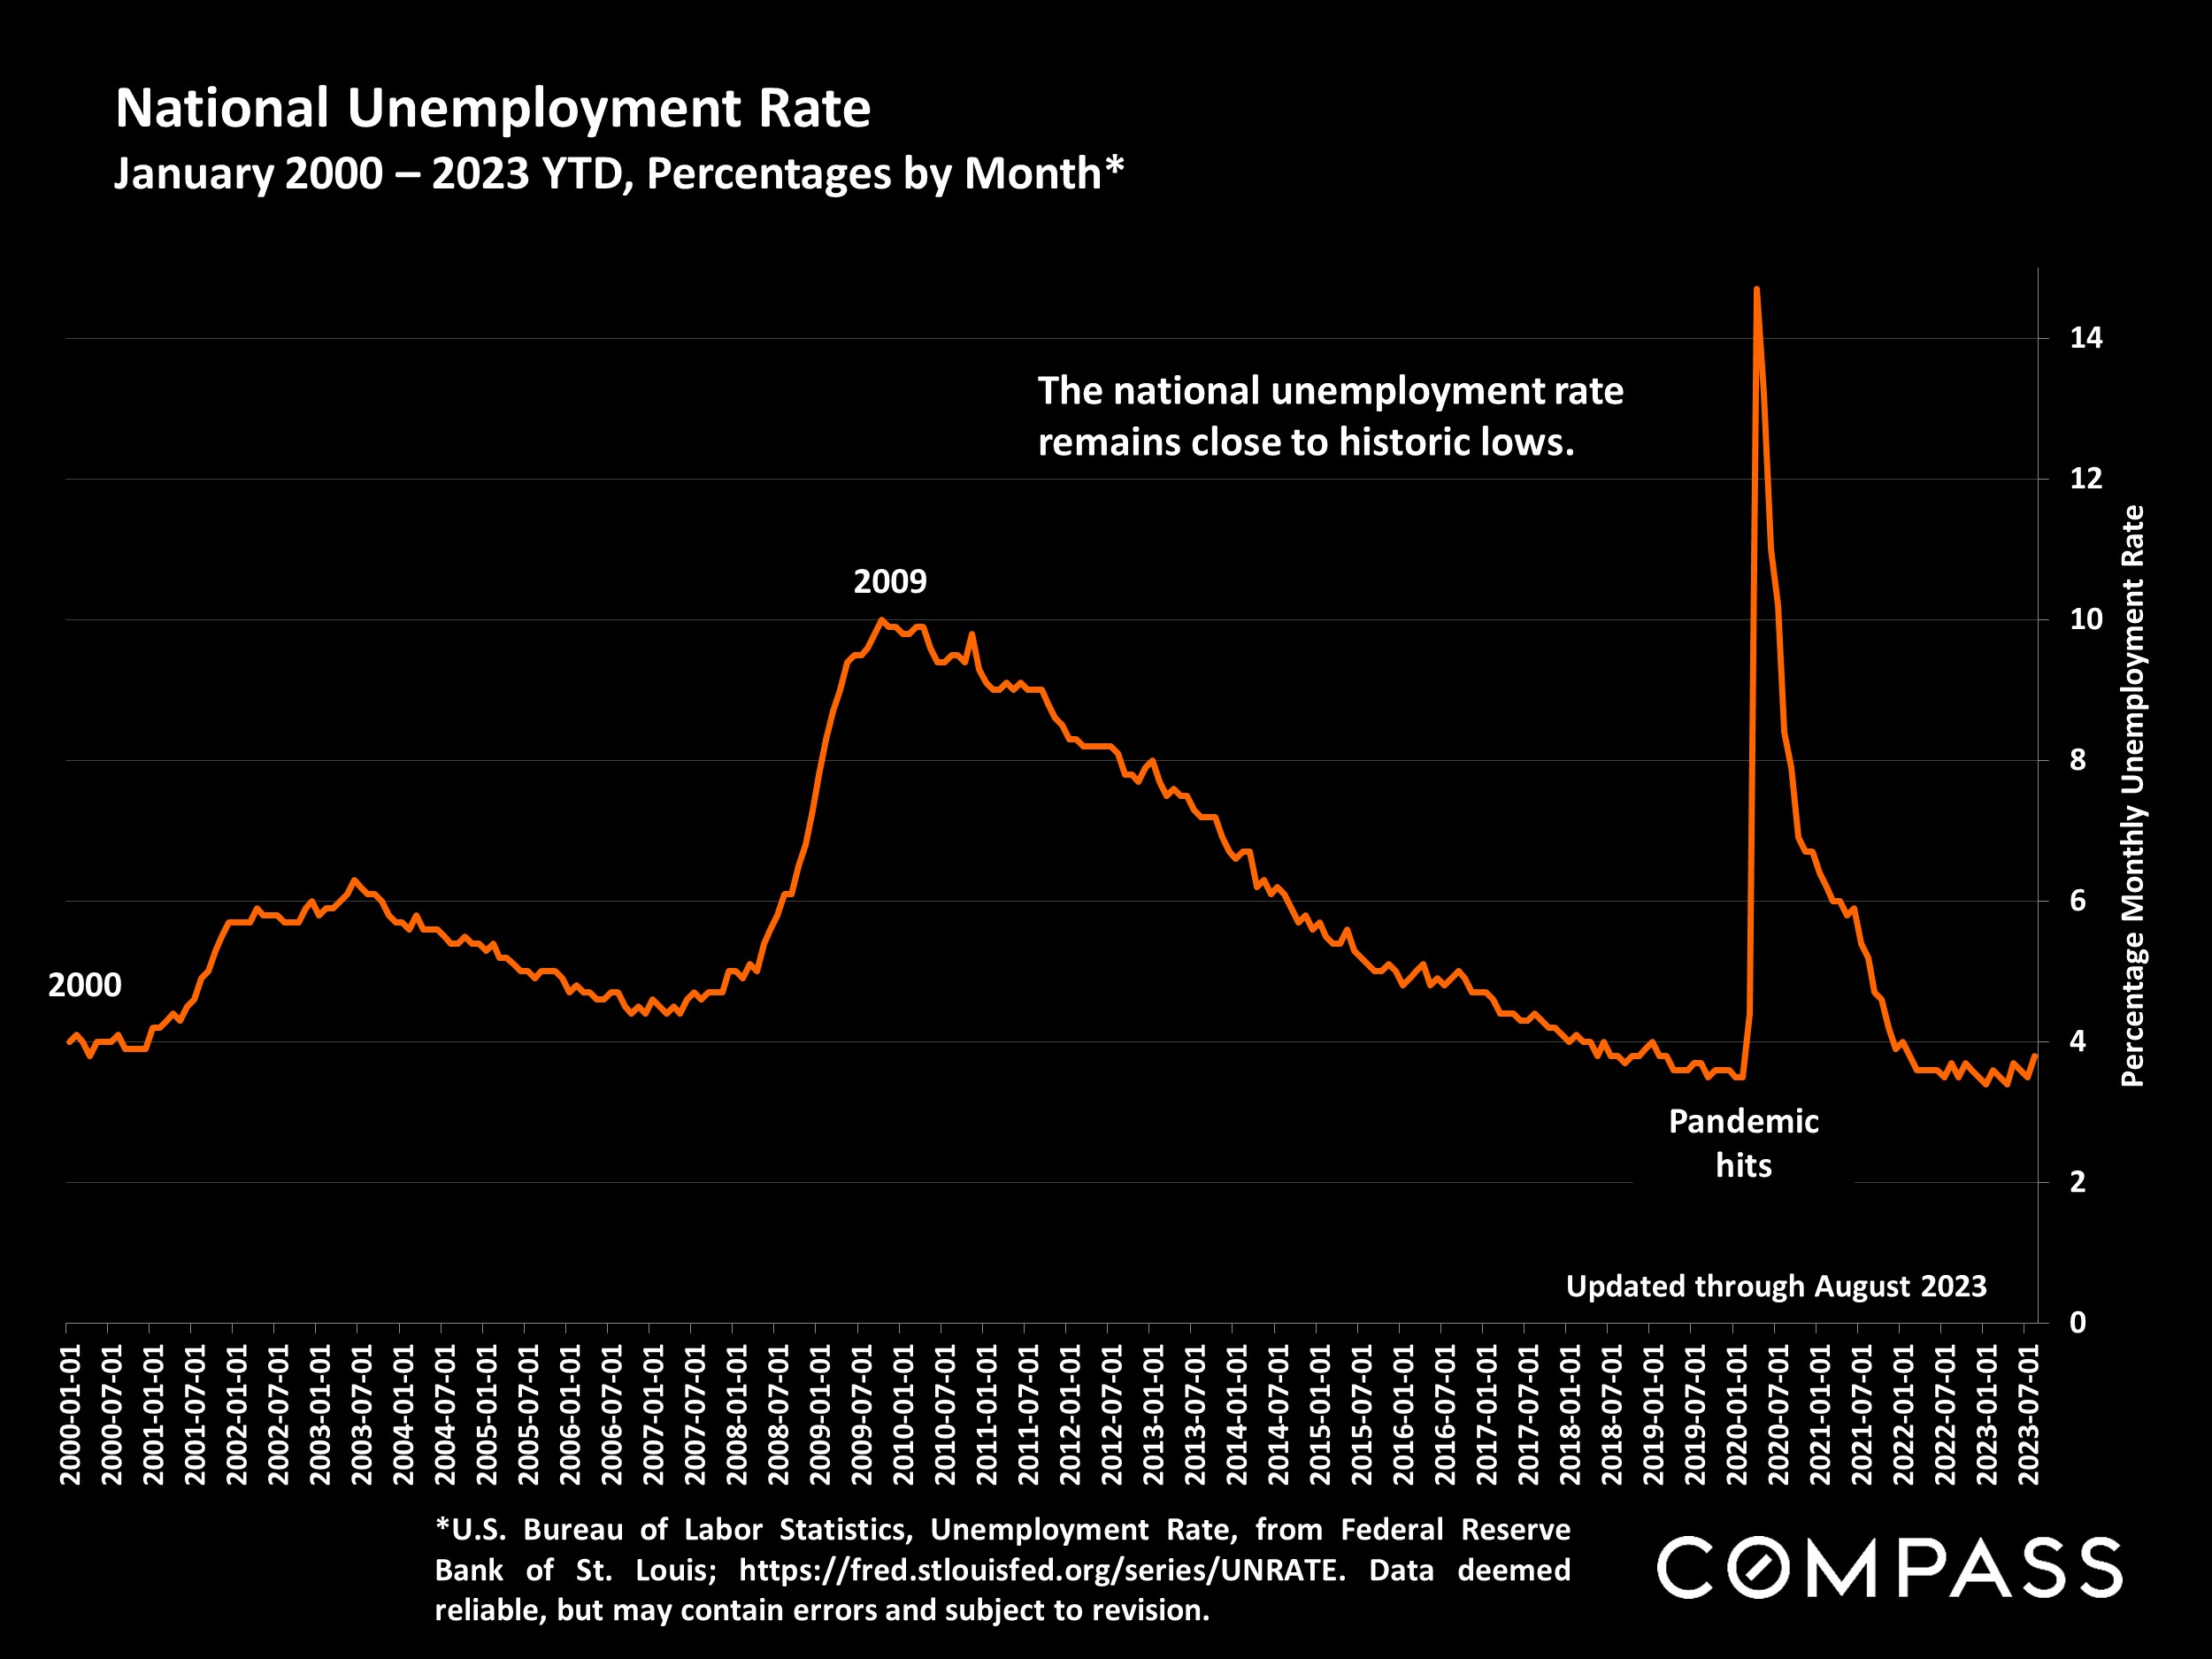
The August 2023 median single-family-home sales price climbed 3.7% from one year ago…31% of sales sold for over the asking price…27% were purchased all-cash…”Home sales have been stable for several months, neither rising nor falling in any meaningful way,” said NAR Chief Economist Lawrence Yun. “Mortgage rate changes will have a big impact over the short run, while job gains will have a steady, positive impact over the long run.” National Association of Realtors®, 9/21/23
——————————————
The autumn selling season began after Labor Day and generally runs until early-mid November, when the market typically begins its big, mid-winter, holiday slowdown. In many regions of the country, the fall market, though relatively short, is the second busiest after spring.
This report will review national trends in home prices, listing supply and buyer demand, and selected economic and demographic indicators. A national report is a huge generalization of broad trends across an enormous range of regional submarkets, whose values and market dynamics vary. National data on September sales should become available in the third week of October.
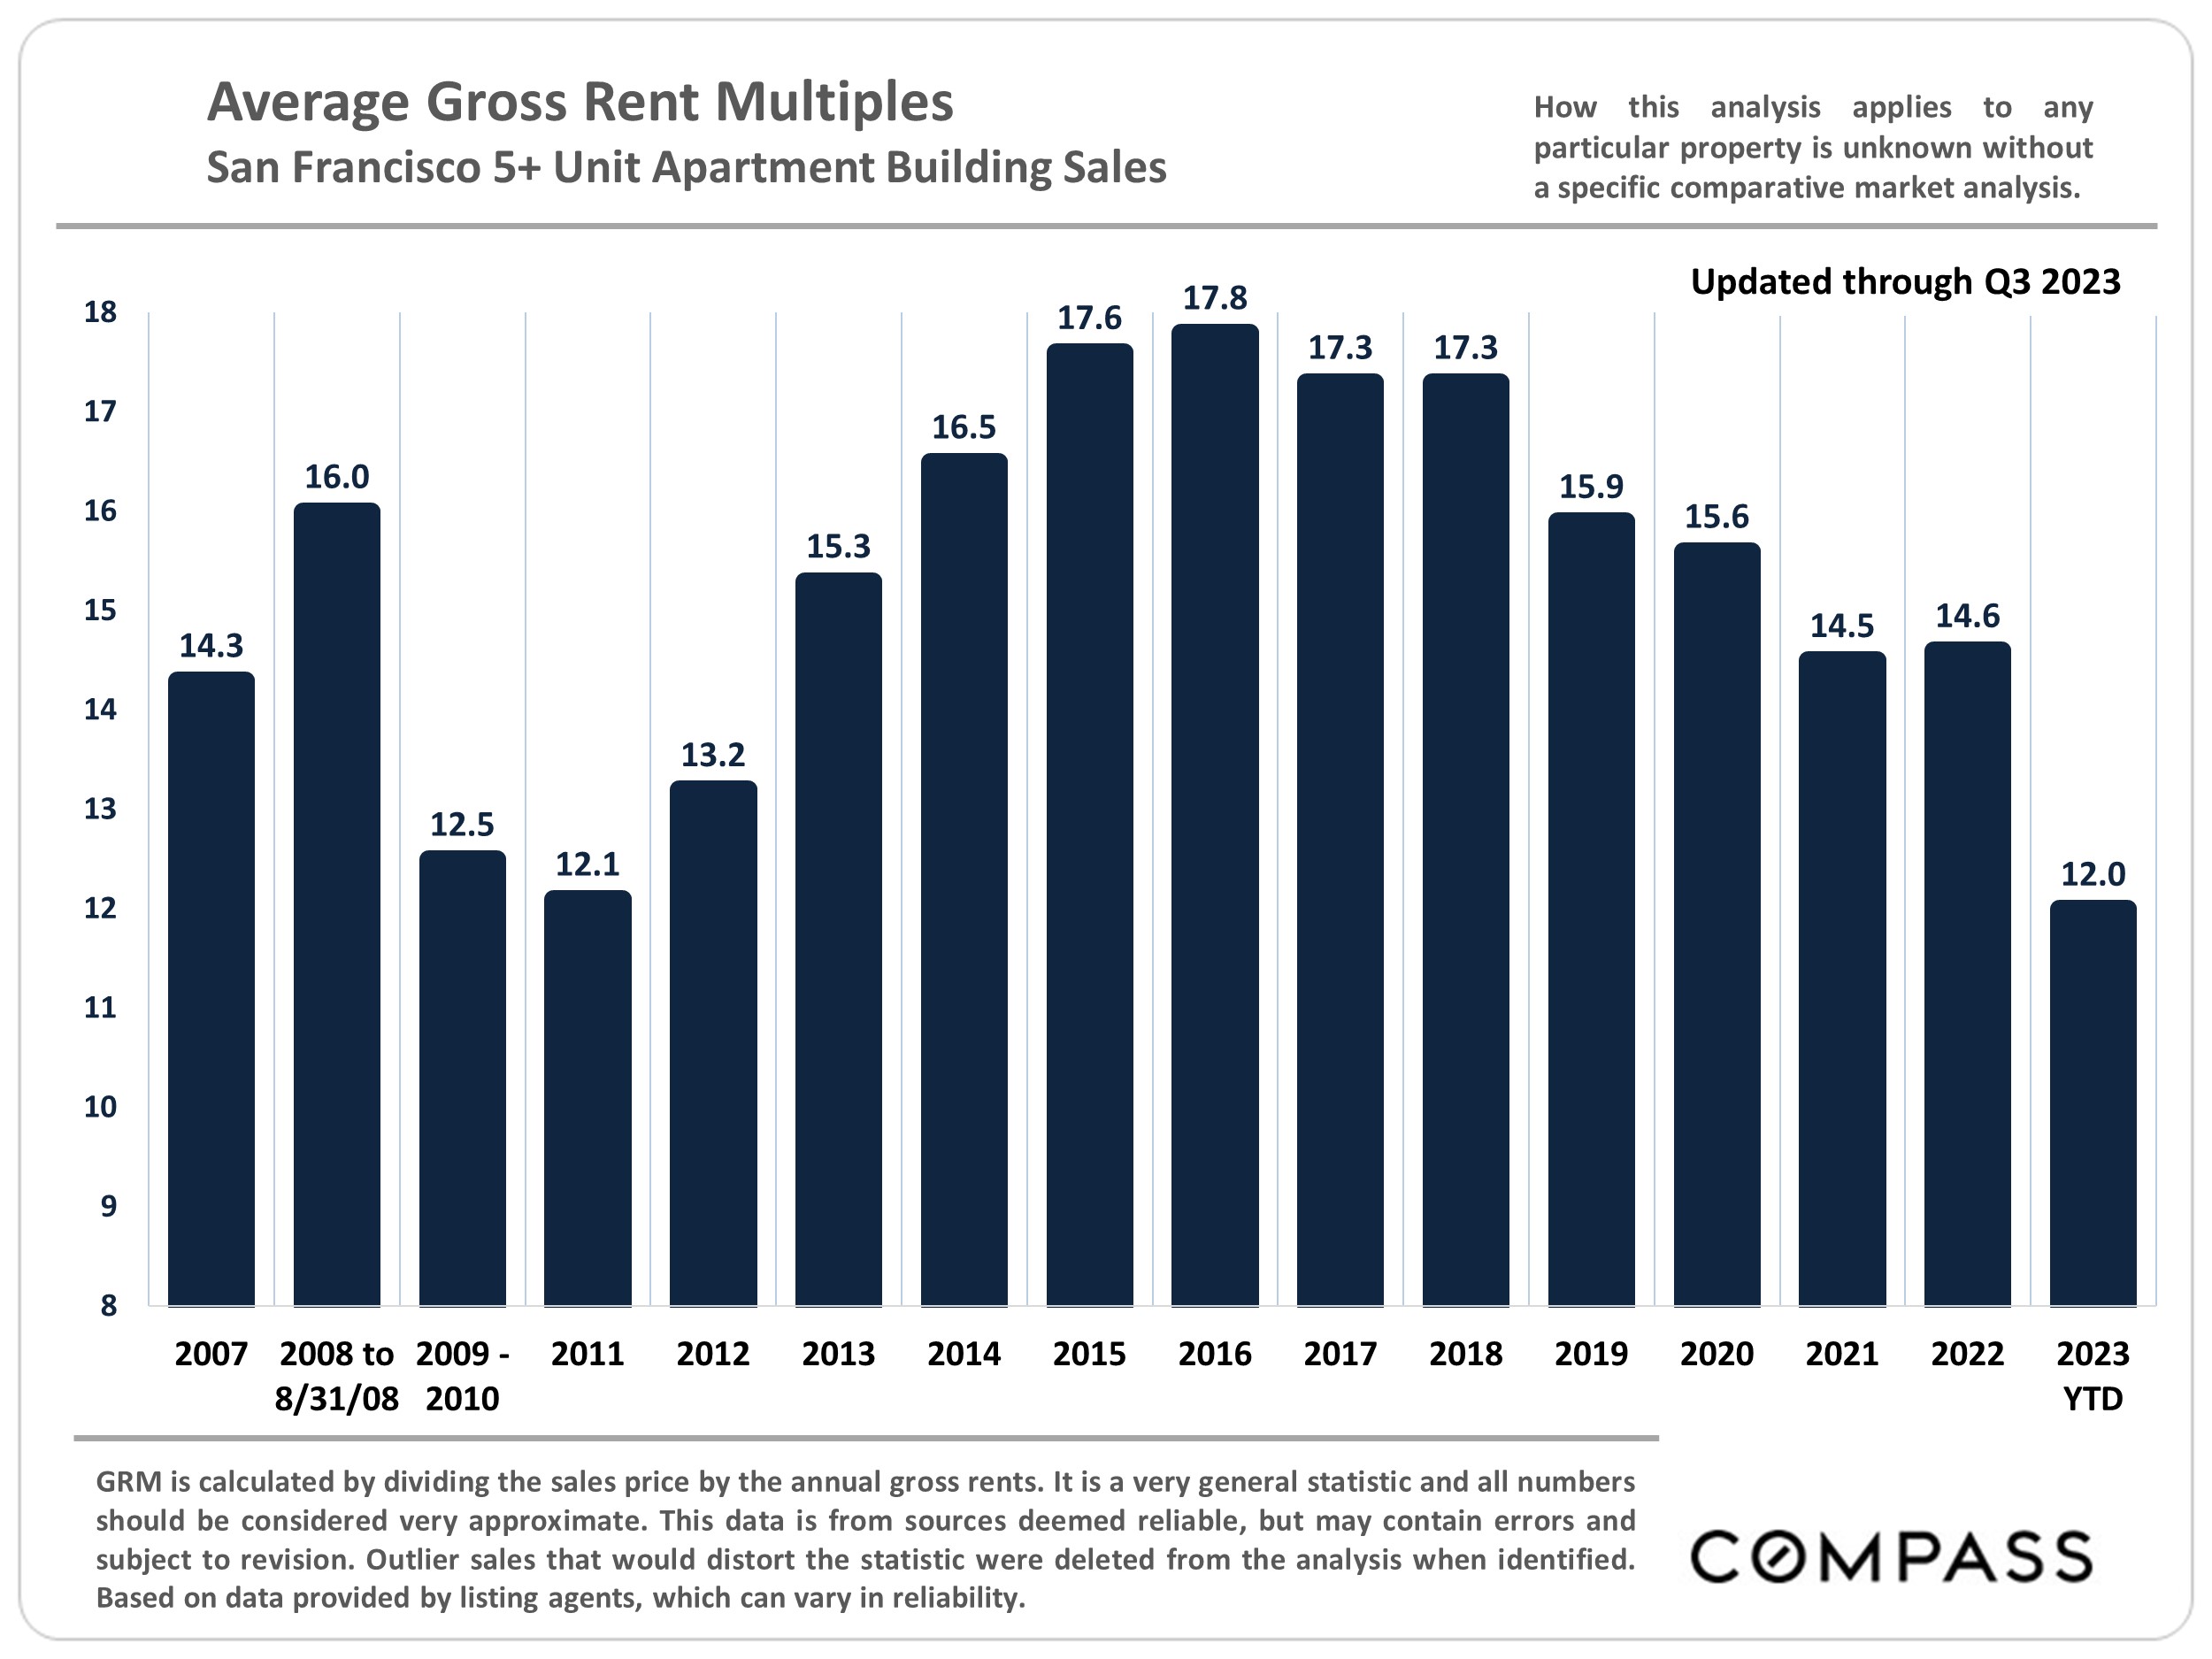
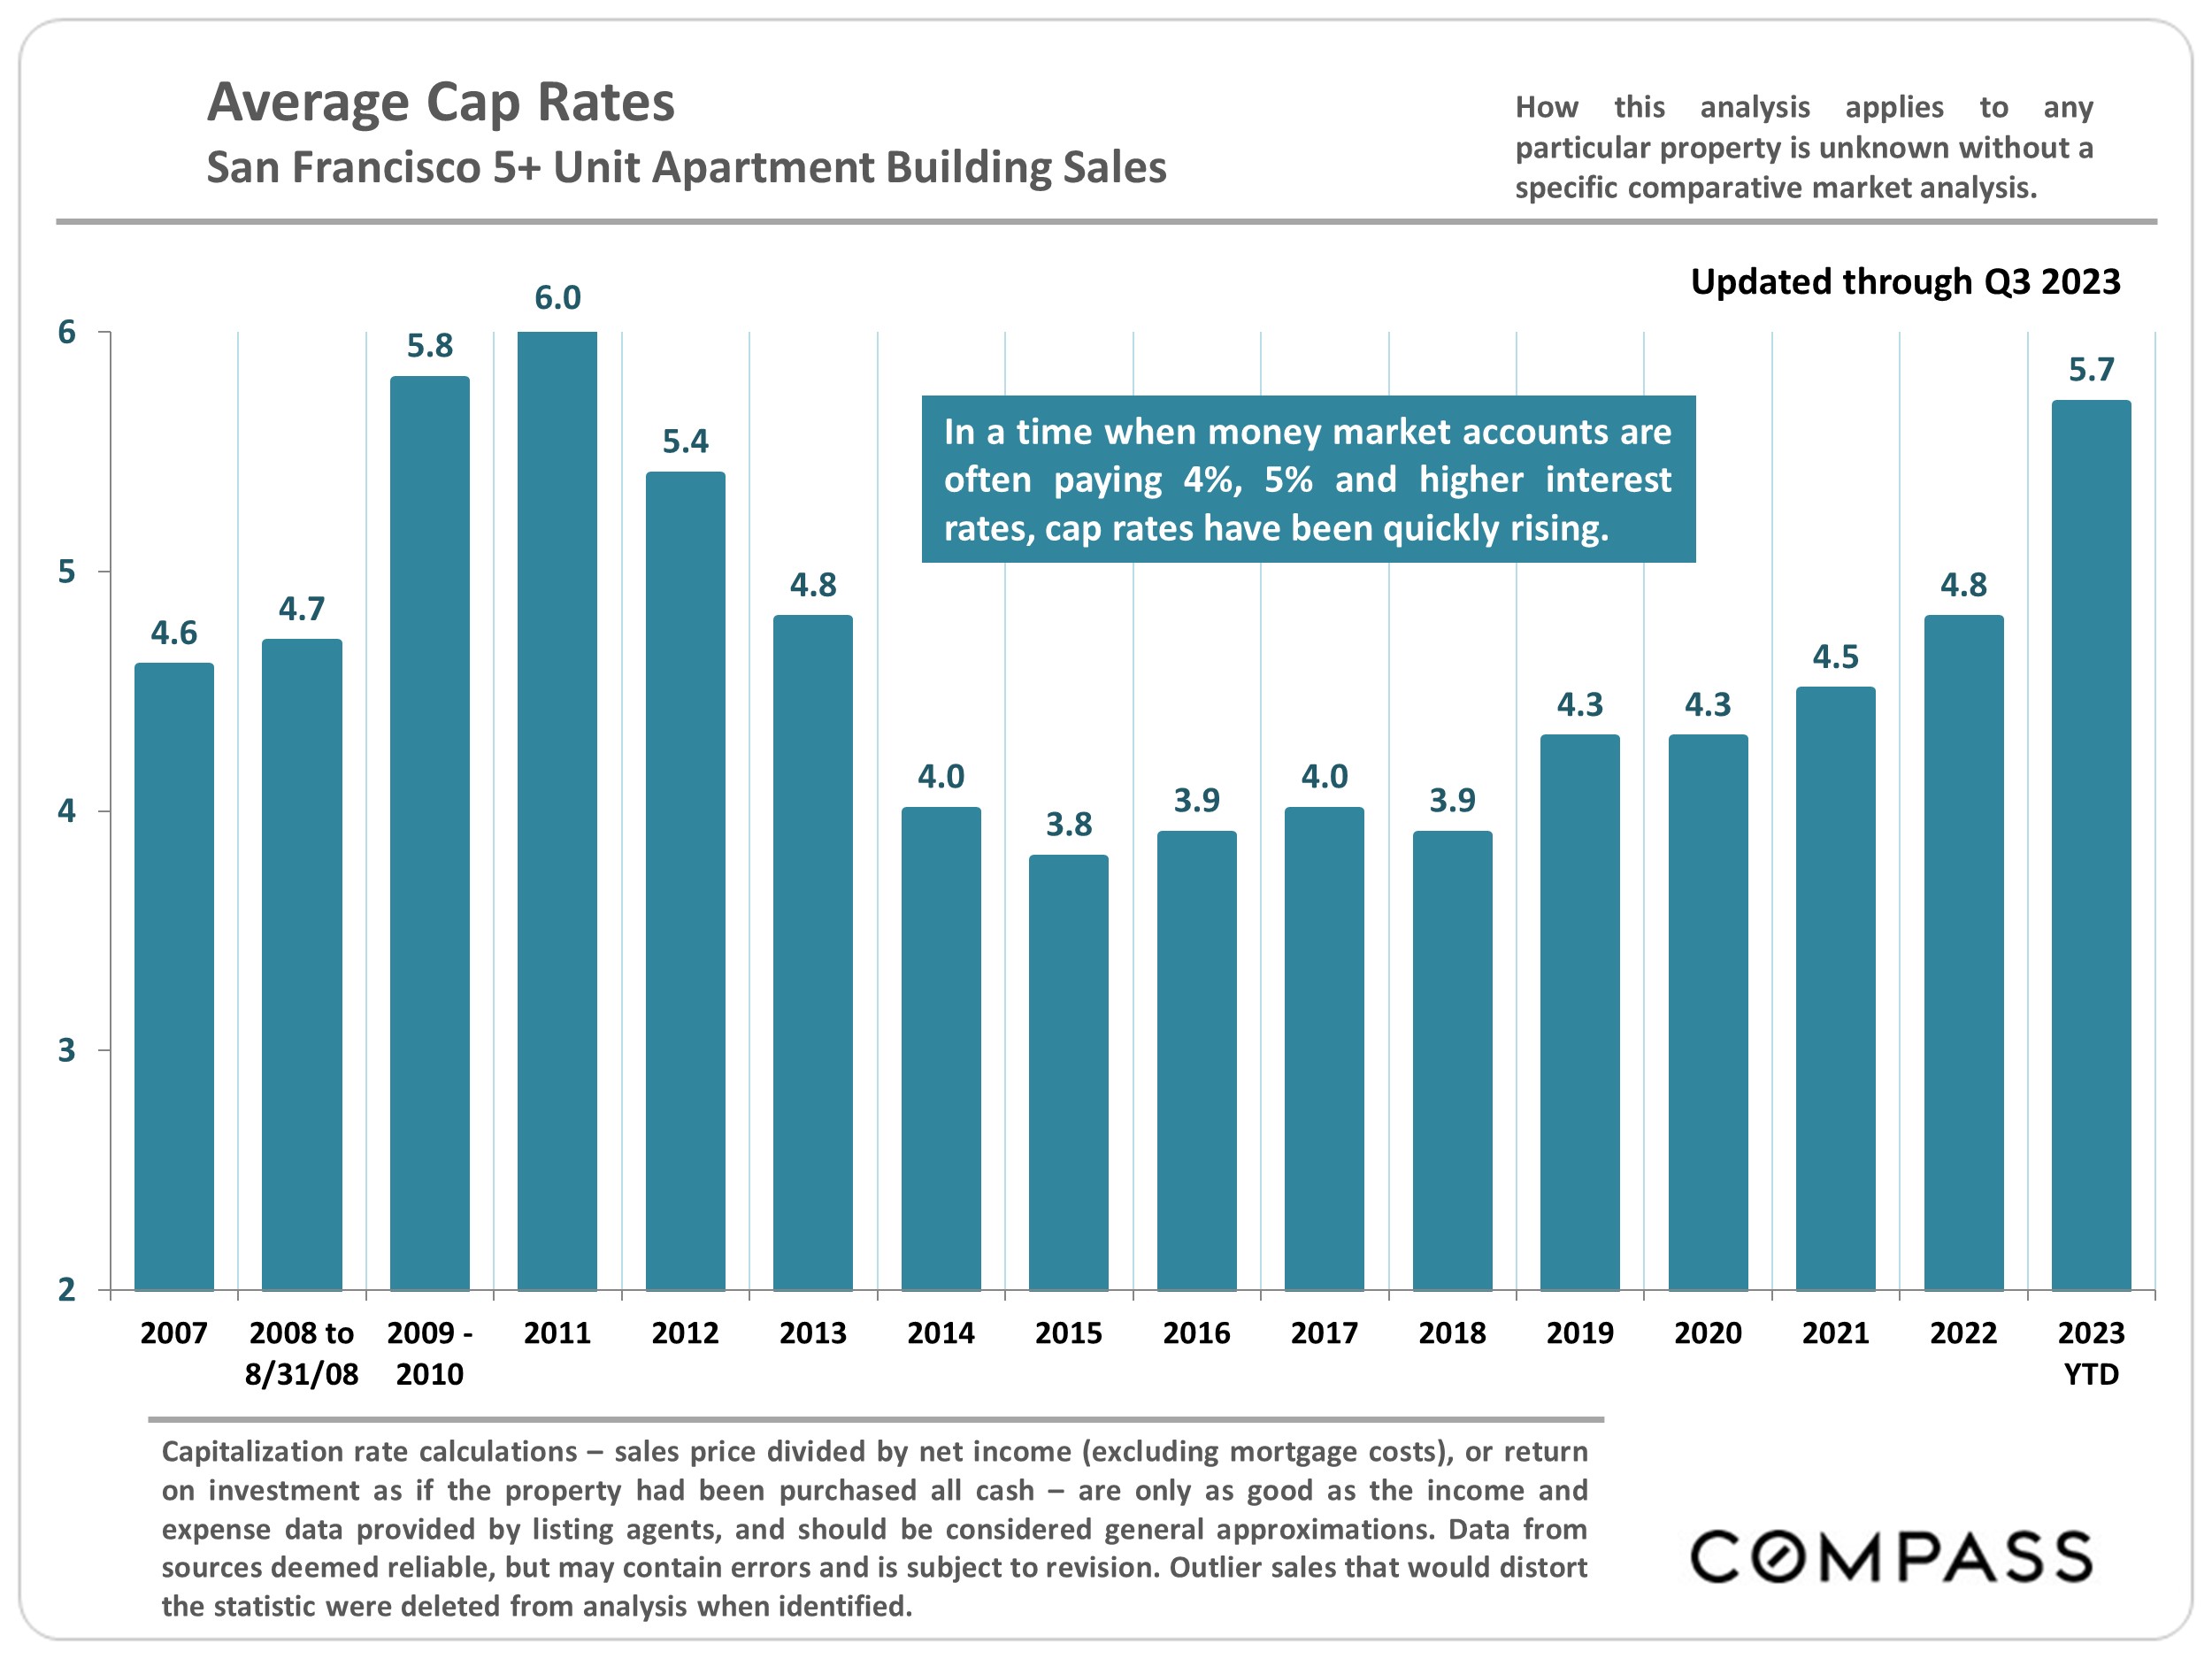
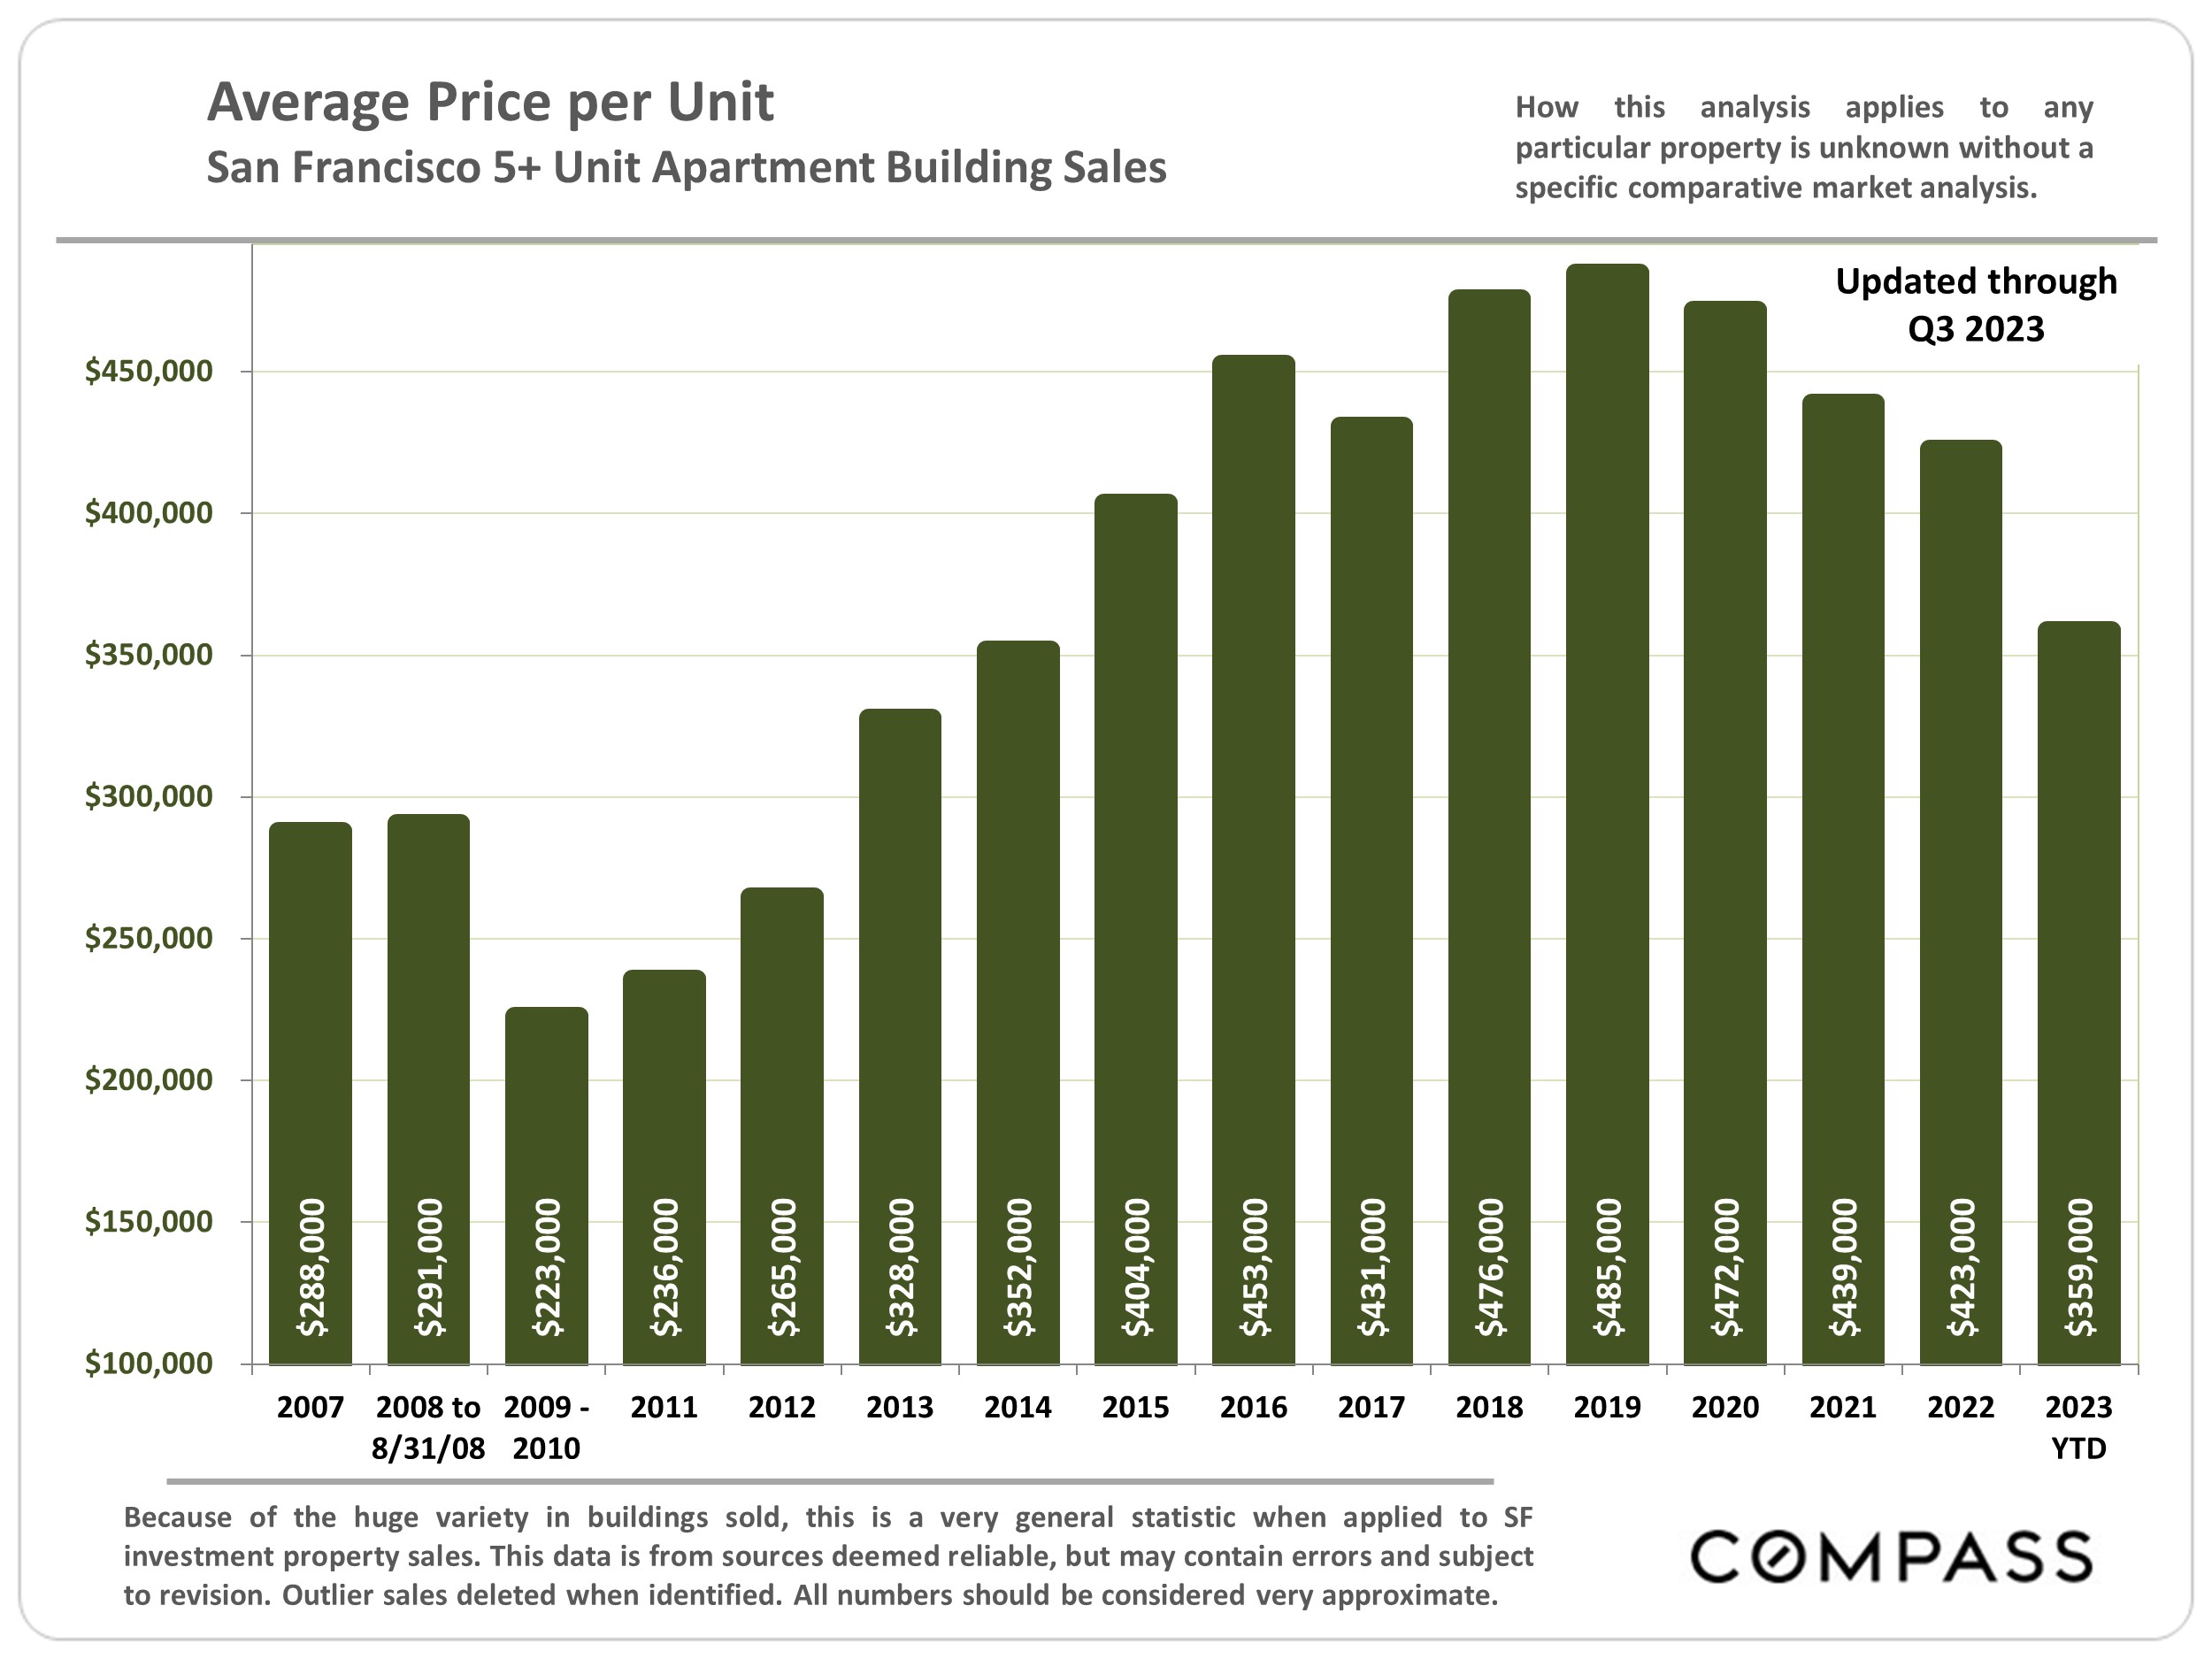
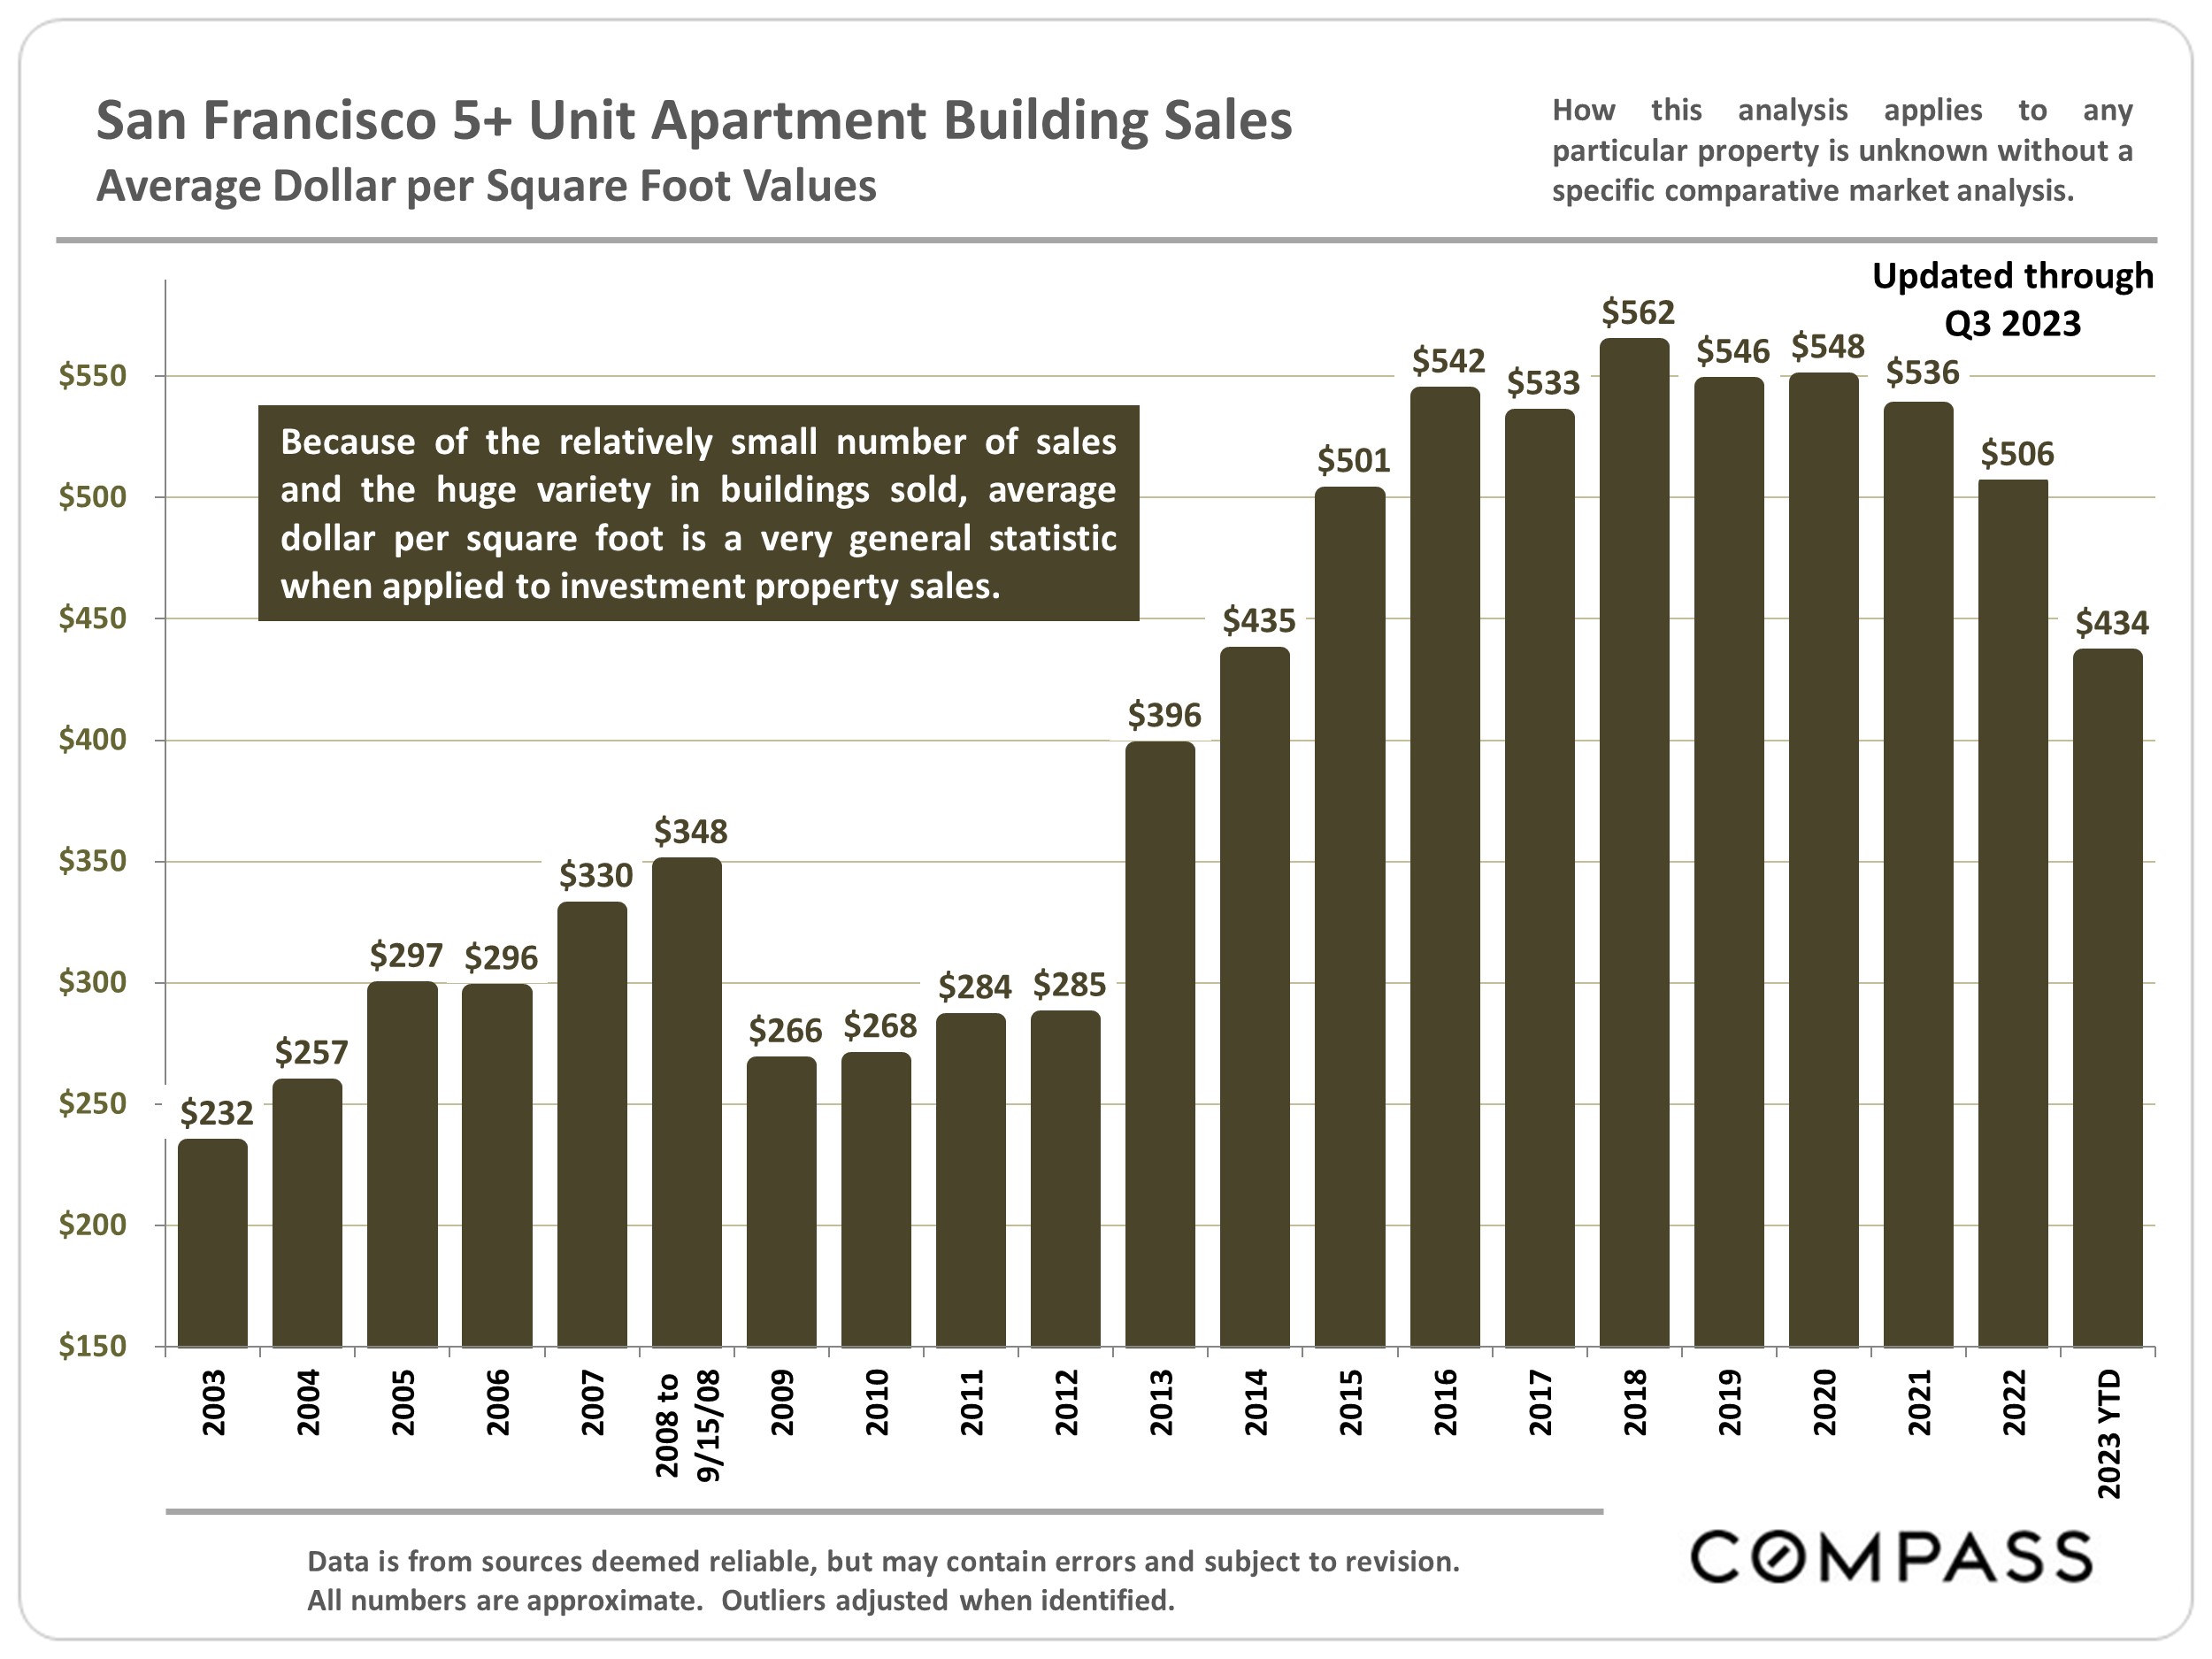
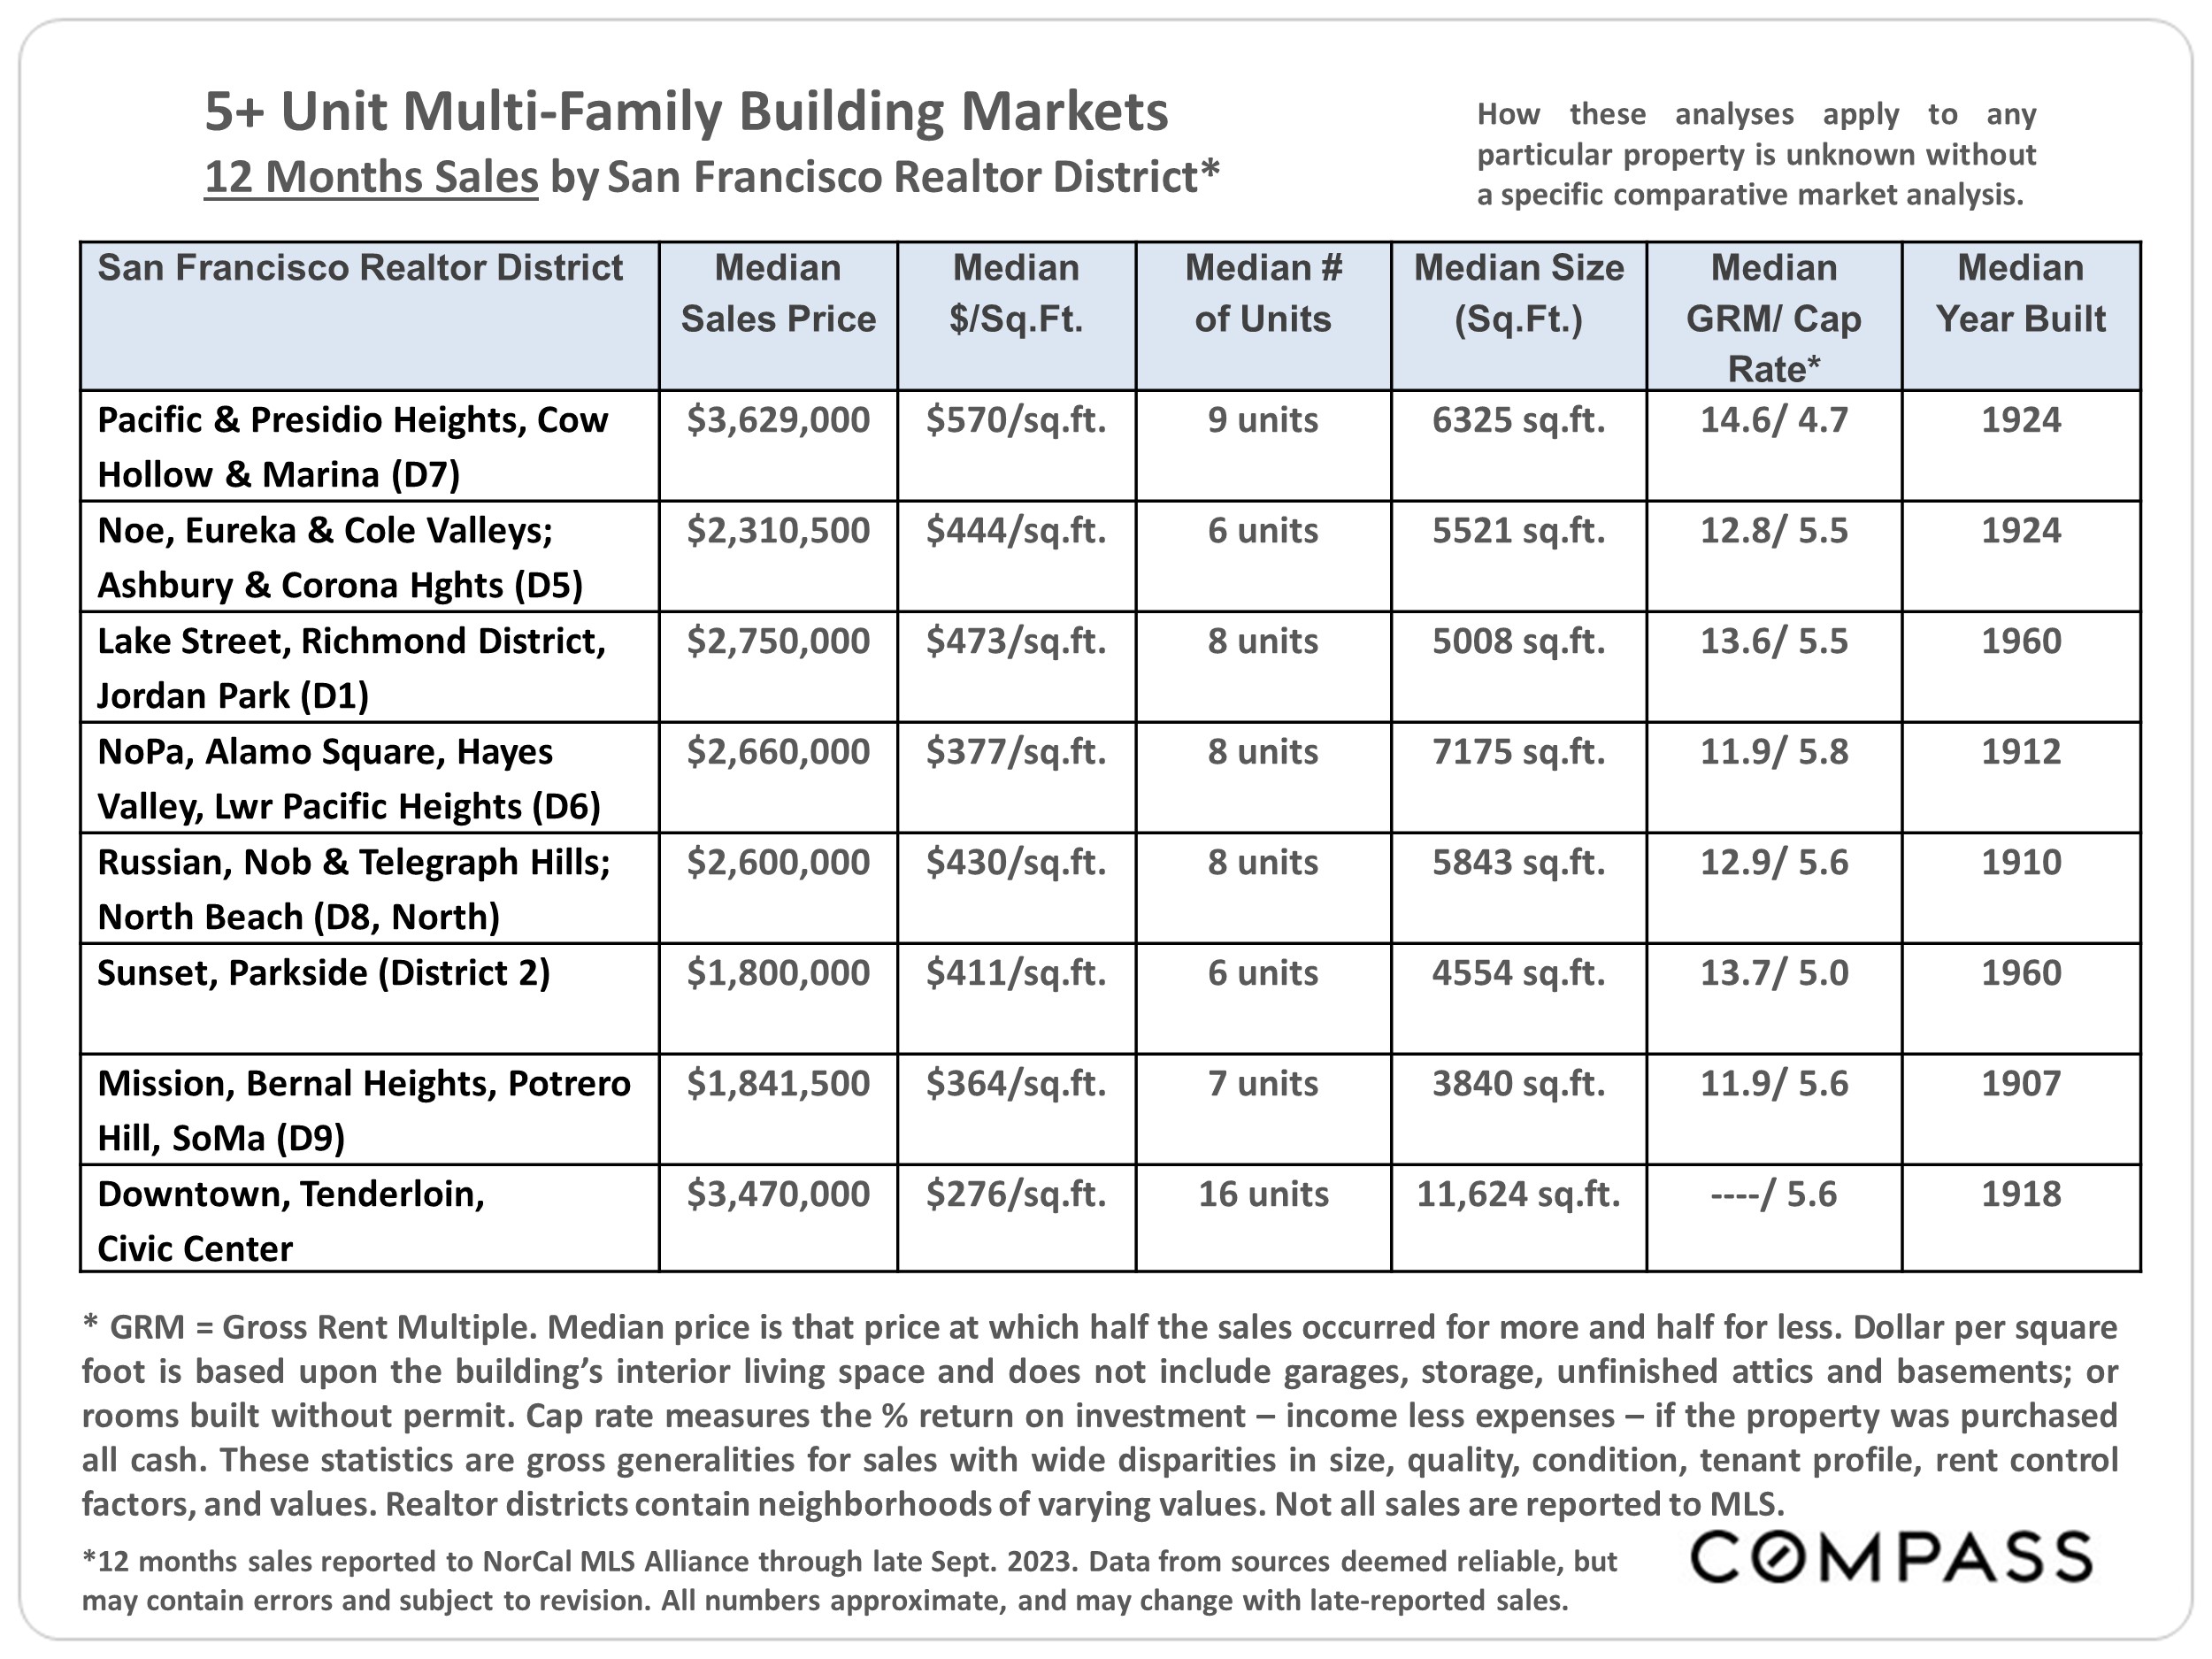
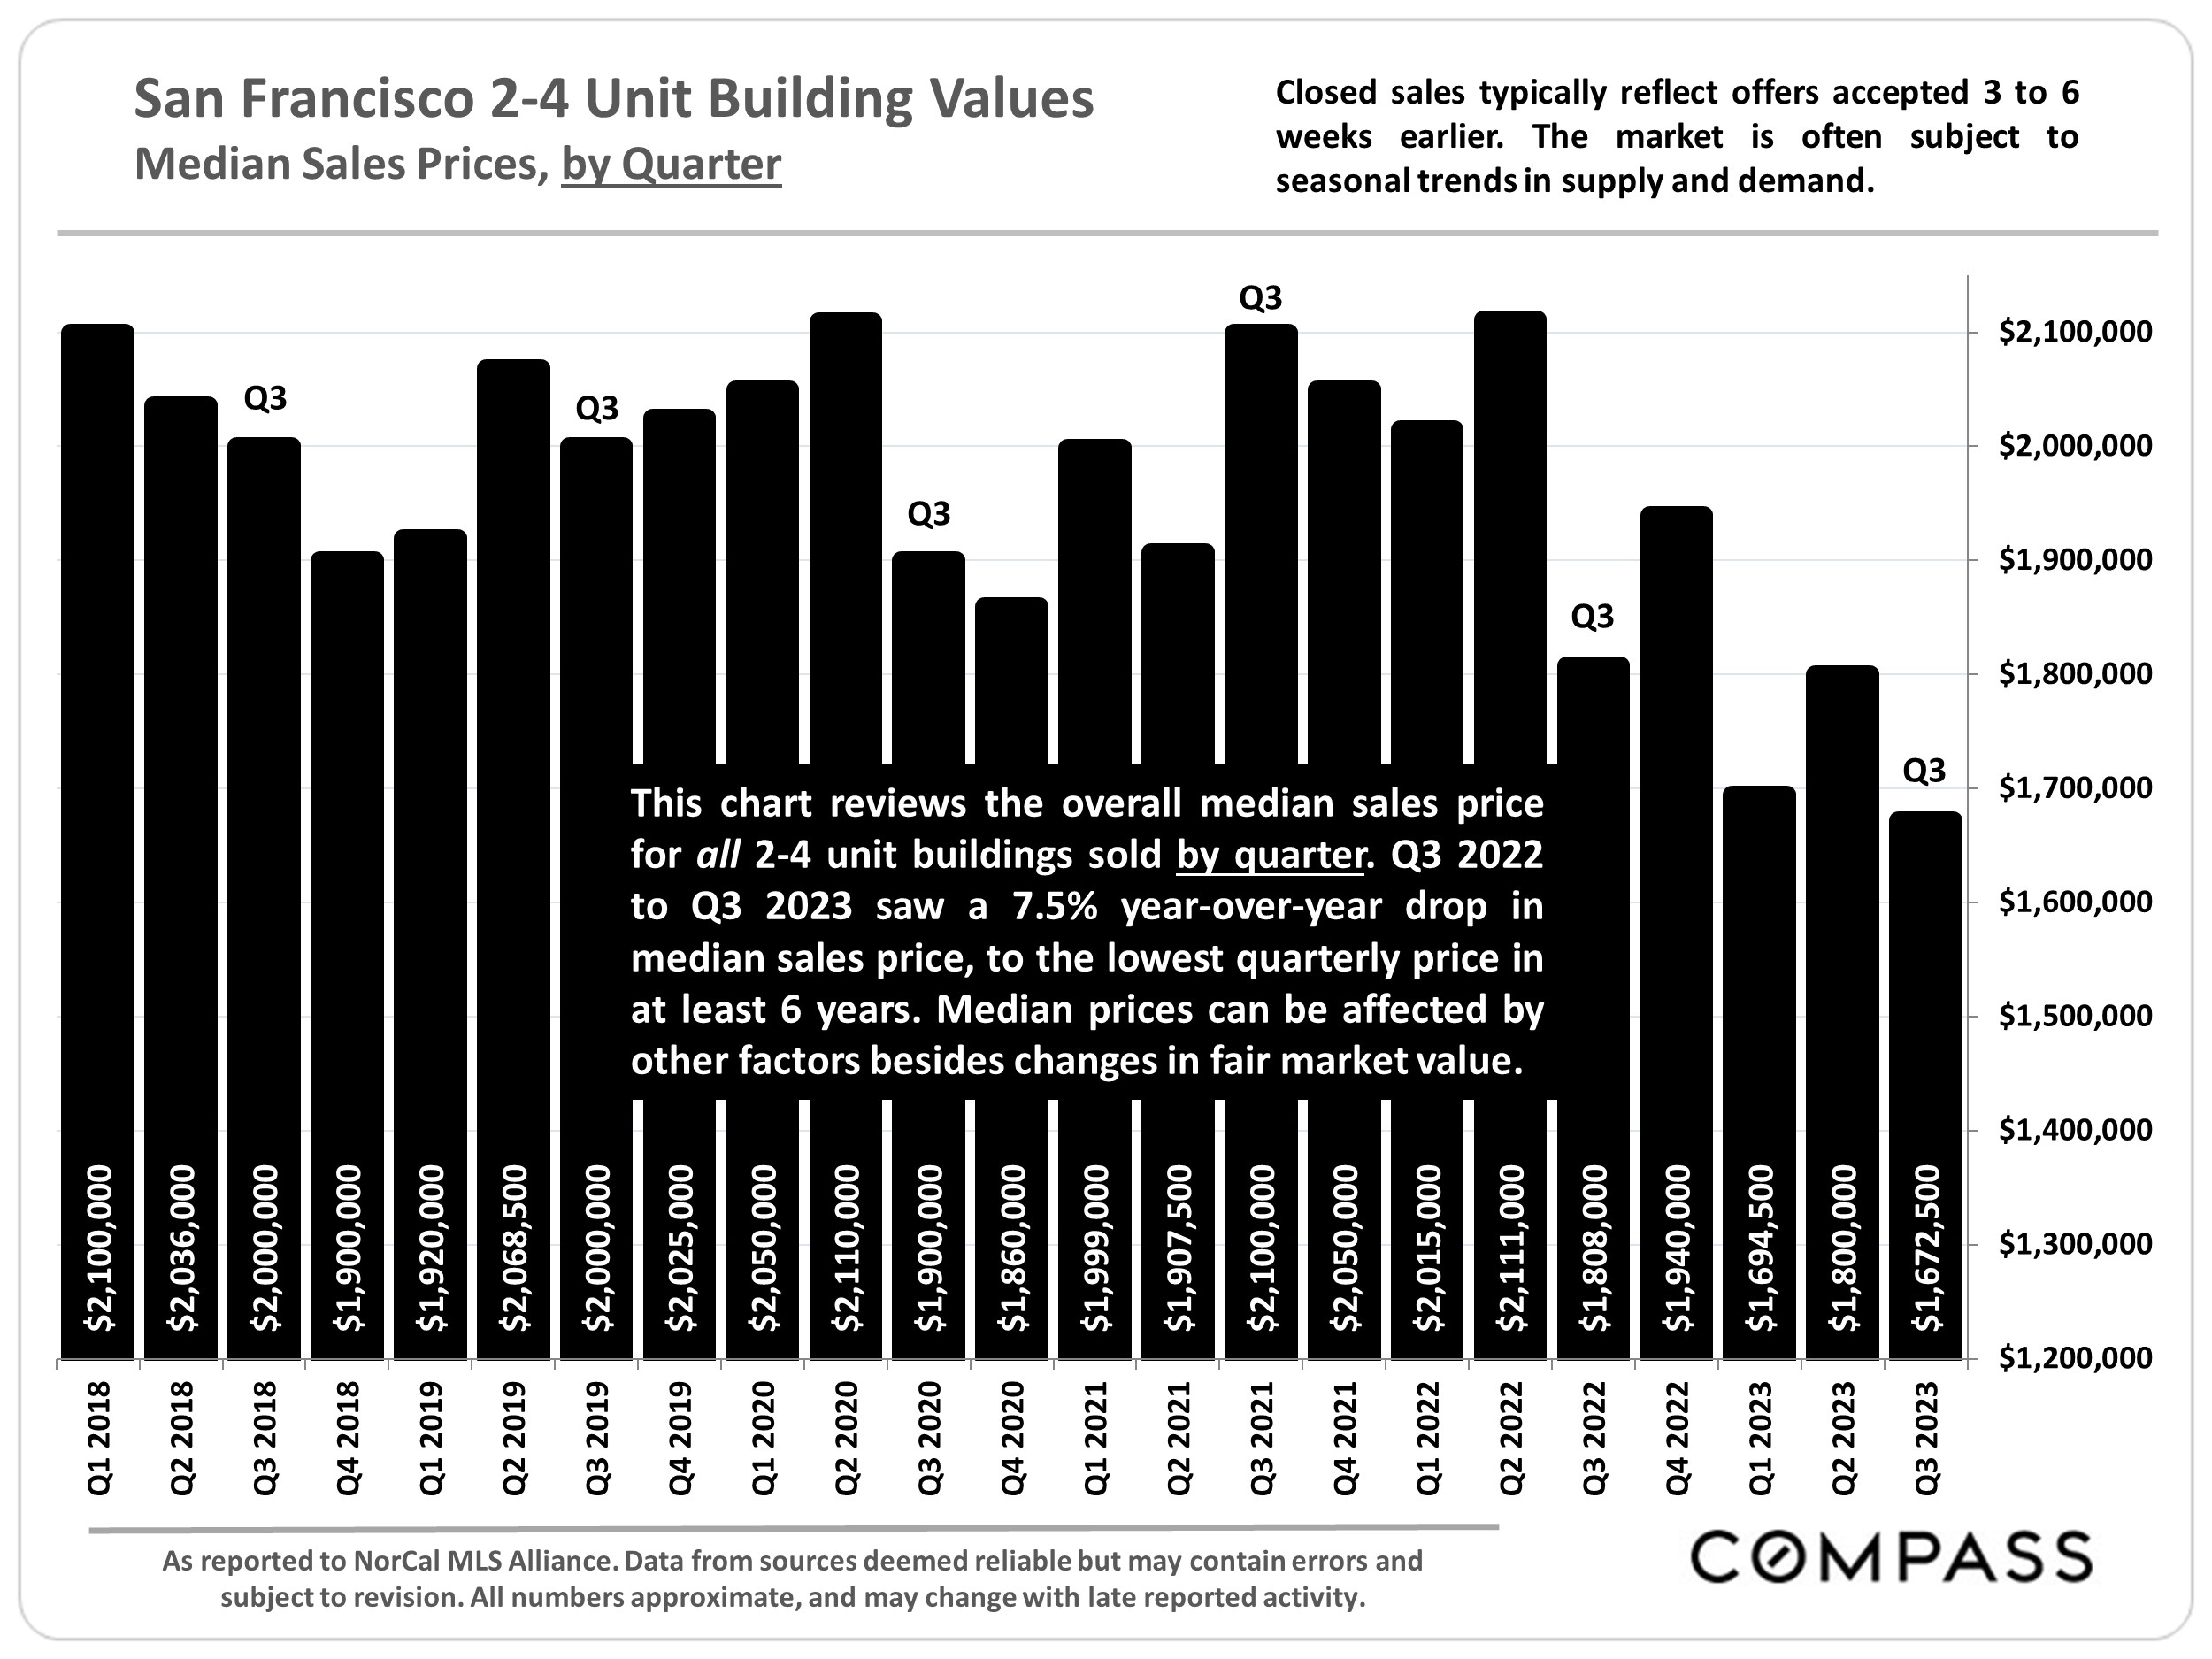
Note that the quantity of sales in any given local submarket is usually relatively small and/or the number of sales that report the necessary financial information can be limited. Buildings of different ages, qualities and sizes selling in different periods can cause these average and median figures to fluctuate significantly. Furthermore, the reliability of some of these calculations depends upon the quality of the income and expense figures provided by the listing agents, and sometimes instead of actual numbers, much less meaningful projected or scheduled figures are used. Late reported listings and sales may change these statistics. Therefore, the above statistics should be considered very general indicators, and how they apply to any particular property without a specific comparative market analysis is unknown.
These analyses were made in good faith with data from sources deemed reliable, but they may contain errors and are subject to revision. Statistics are generalities and all numbers should be considered approximate. Numbers may change with late-reported sales activity.
Compass is a real estate broker licensed by the State of California, DRE 01527235. Equal Housing Opportunity. This report has been prepared solely for information purposes. The information herein is based on or derived from information generally available to the public and/or from sources believed to be reliable. No representation or warranty can be given with respect to the accuracy or completeness of the information. Compass disclaims any and all liability relating to this report, including without limitation any express or implied representations or warranties for statements contained in, and omissions from, the report. Nothing contained herein is intended to be or should be read as any regulatory, legal, tax, accounting or other advice and Compass does not provide such advice. All opinions are subject to change without notice. Compass makes no representation regarding the accuracy of any statements regarding any references to the laws, statutes or regulations of any state are those of the author(s). Past performance is no guarantee of future results.
Note that the quantity of sales in any given local submarket is usually relatively small and/or the number of sales that report the necessary financial information can be limited. Buildings of different ages, qualities and sizes selling in different periods can cause these average and median figures to fluctuate significantly. Furthermore, the reliability of some of these calculations depends upon the quality of the income and expense figures provided by the listing agents, and sometimes instead of actual numbers, much less meaningful projected or scheduled figures are used. Therefore, the above statistics should be considered very general indicators, and how they apply to any particular property without a specific comparative market analysis is unknown.
These analyses were made in good faith with data from sources deemed reliable, but they may contain errors and are subject to revision. Statistics are generalities and all numbers should be considered approximate.
Compass is a real estate broker licensed by the State of California, DRE 01527235. Equal Housing Opportunity. This report has been prepared solely for information purposes. The information herein is based on or derived from information generally available to the public and/or from sources believed to be reliable. No representation or warranty can be given with respect to the accuracy or completeness of the information. Compass disclaims any and all liability relating to this report, including without limitation any express or implied representations or warranties for statements contained in, and omissions from, the report. Nothing contained herein is intended to be or should be read as any regulatory, legal, tax, accounting or other advice and Compass does not provide such advice. All opinions are subject to change without notice. Compass makes no representation regarding the accuracy of any statements regarding any references to the laws, statutes or regulations of any state are those of the author(s). Past performance is no guarantee of future results.
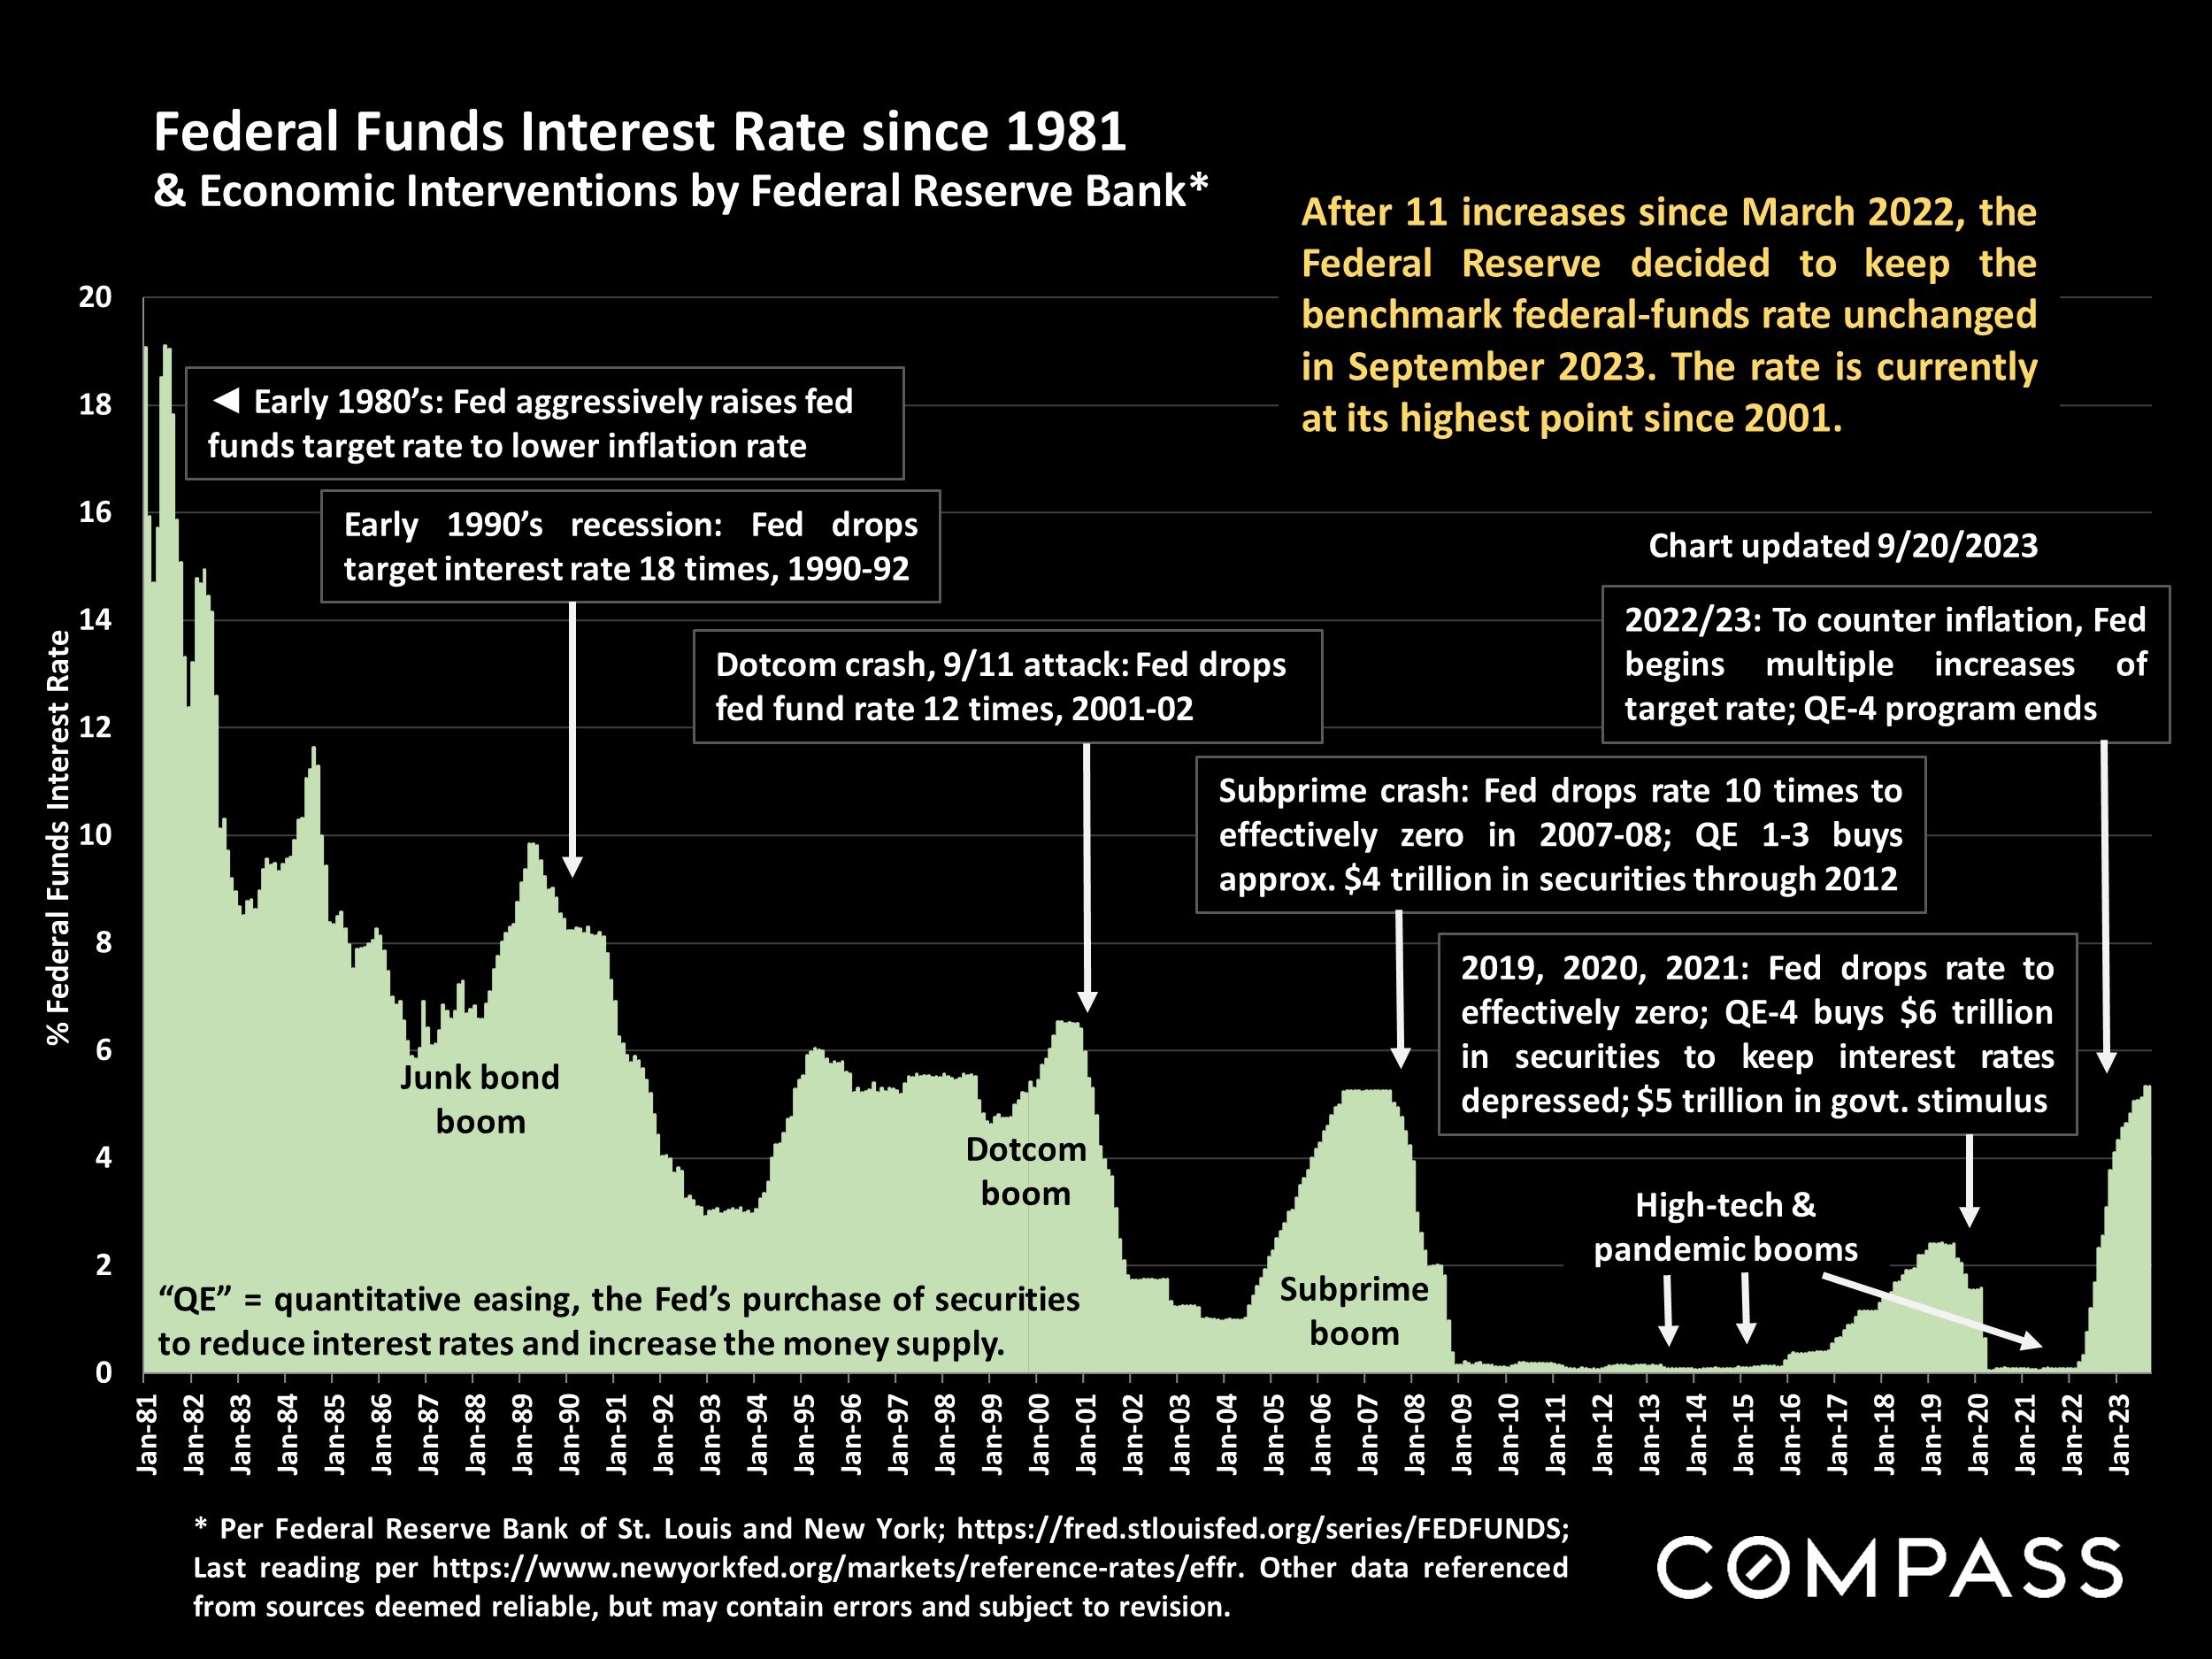
Economic indicators have been challenging since the fall selling season began: Interest rates continued to rise through early October and stock markets generally continued to fall from mid- summer, YTD highs. The country faced yet another threat of a federal government shutdown, which happily didn’t occur, but, unbelievably, another such crisis may soon confront us again. Markets remain volatile and hard to predict, often reacting negatively to positive economic news (such as strong employment statistics) as they wait for new inflation numbers and try to parse the possible reaction of the Fed. Any definitive impacts on real estate markets of these recent developments, should they continue, won’t substantially show up until Q4 data begins to become available, and, of course, volatility also means that indicators can turn around quickly.
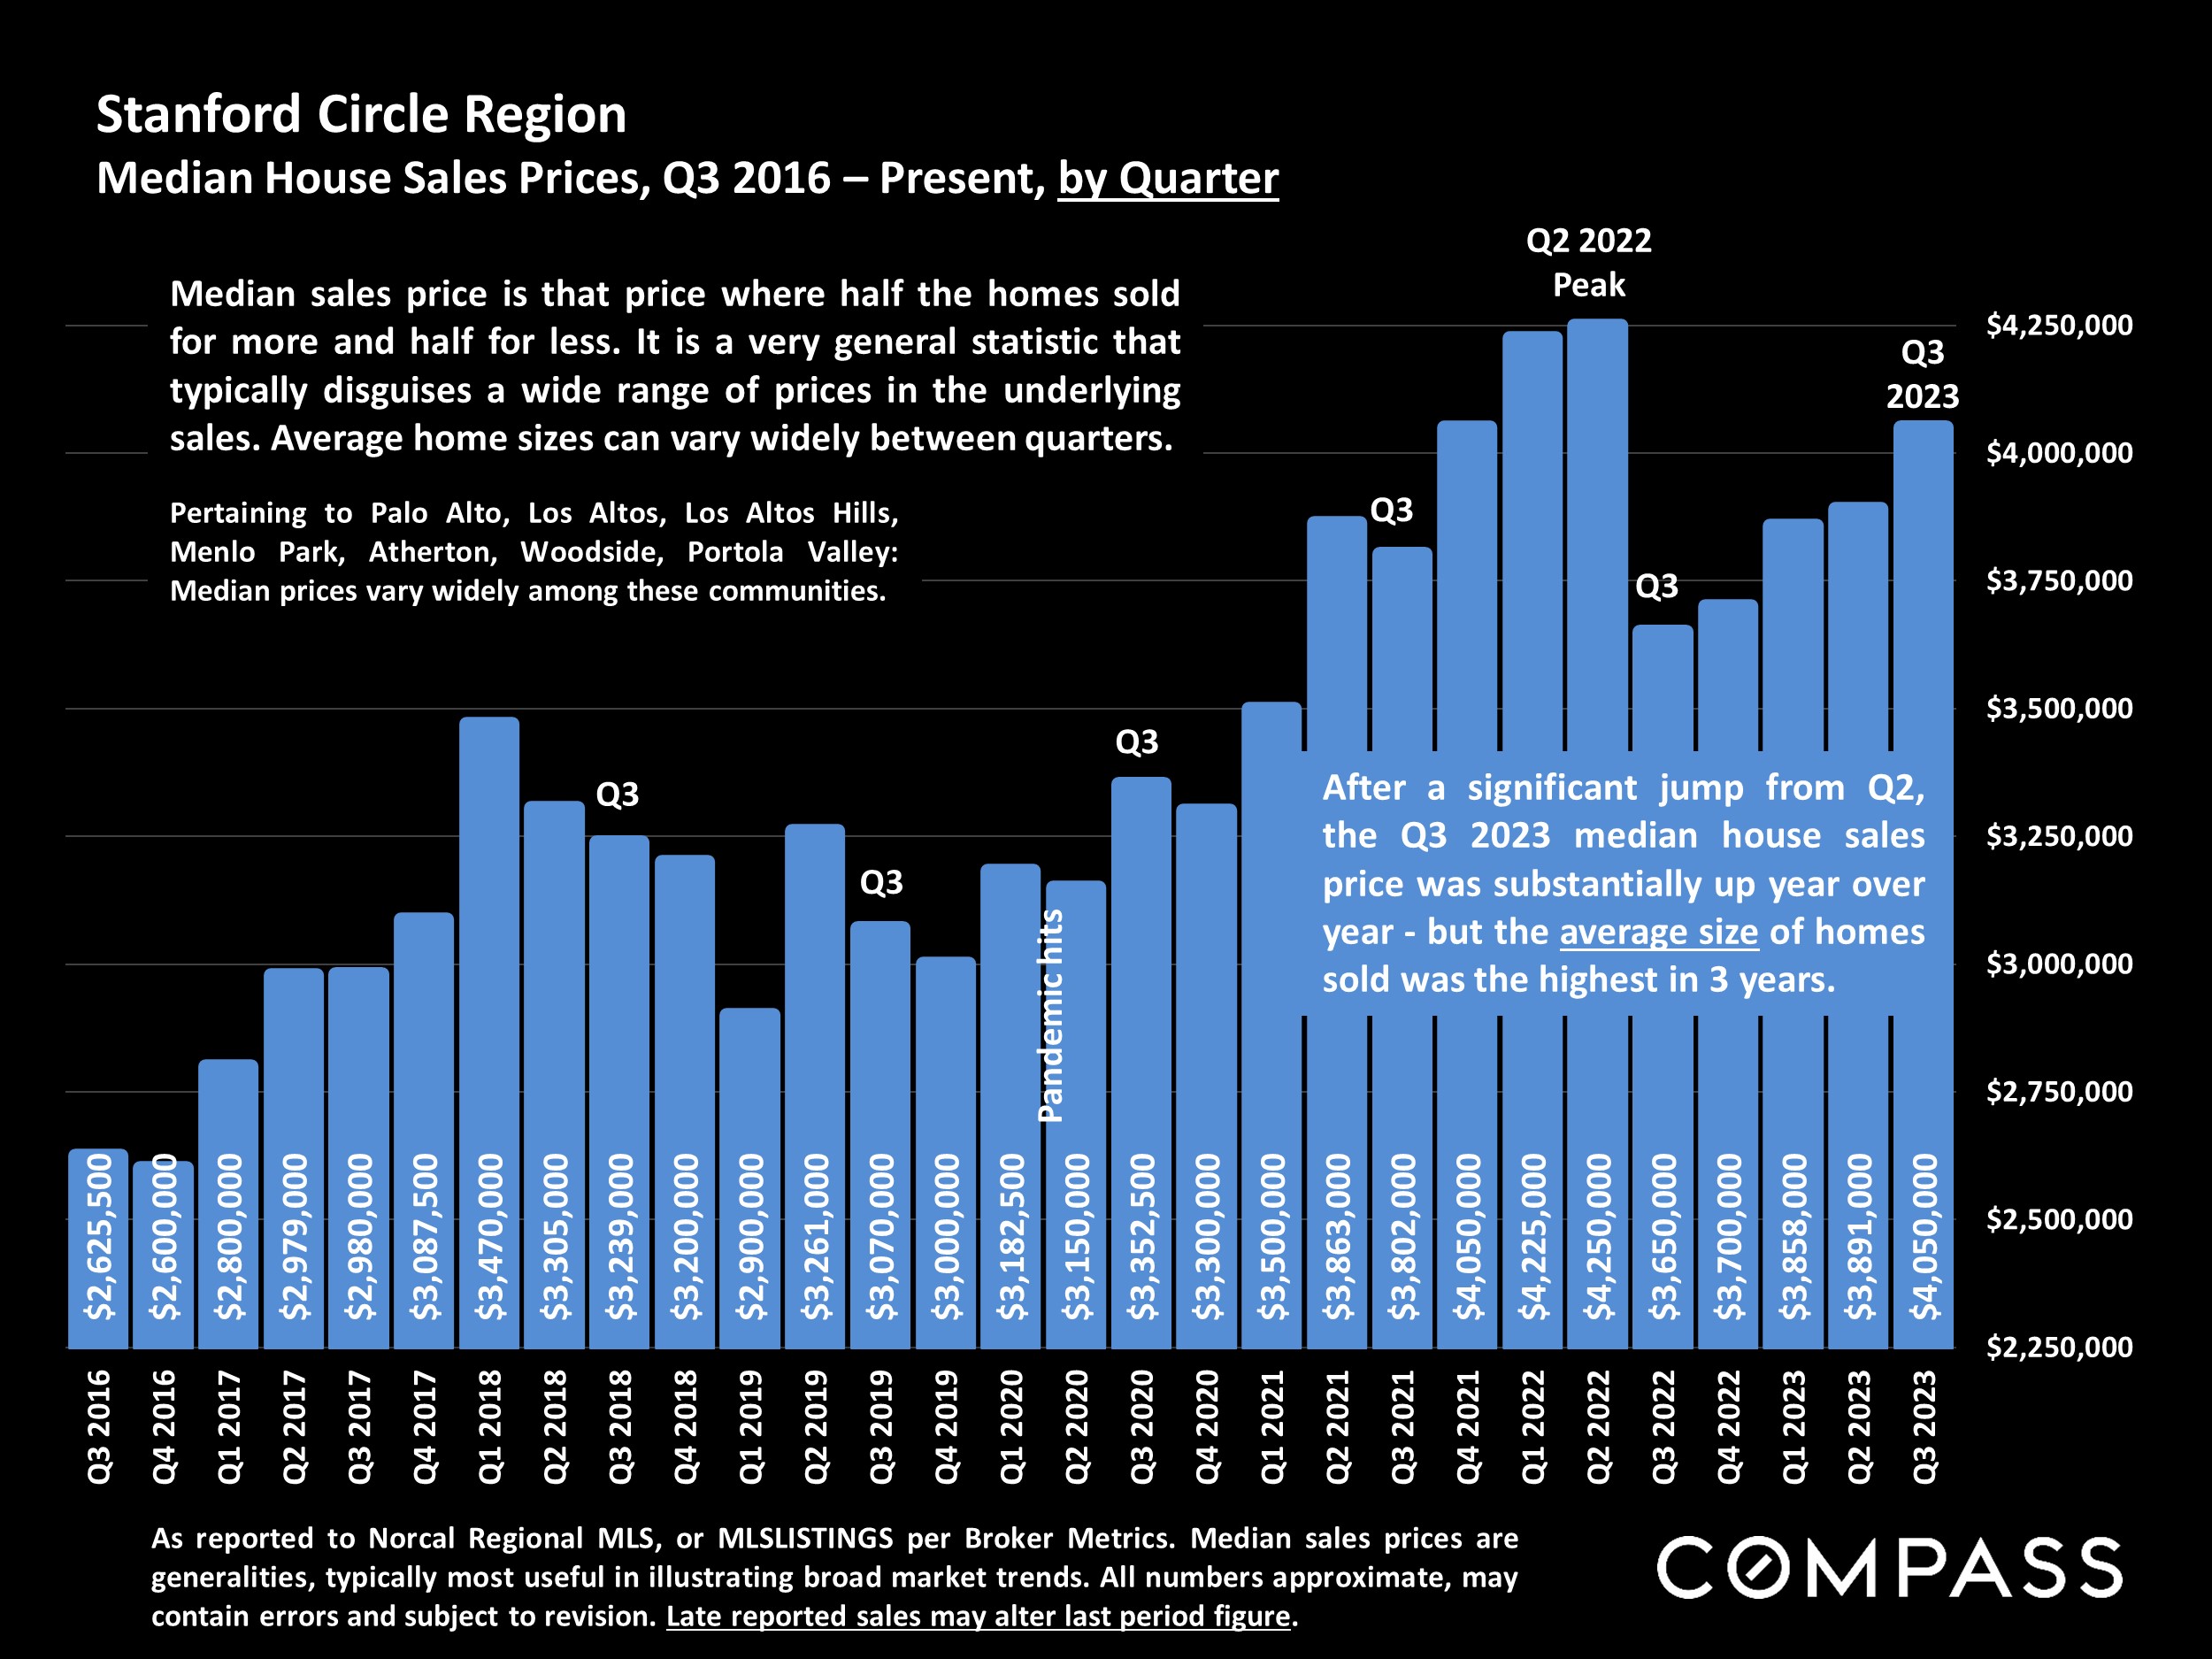
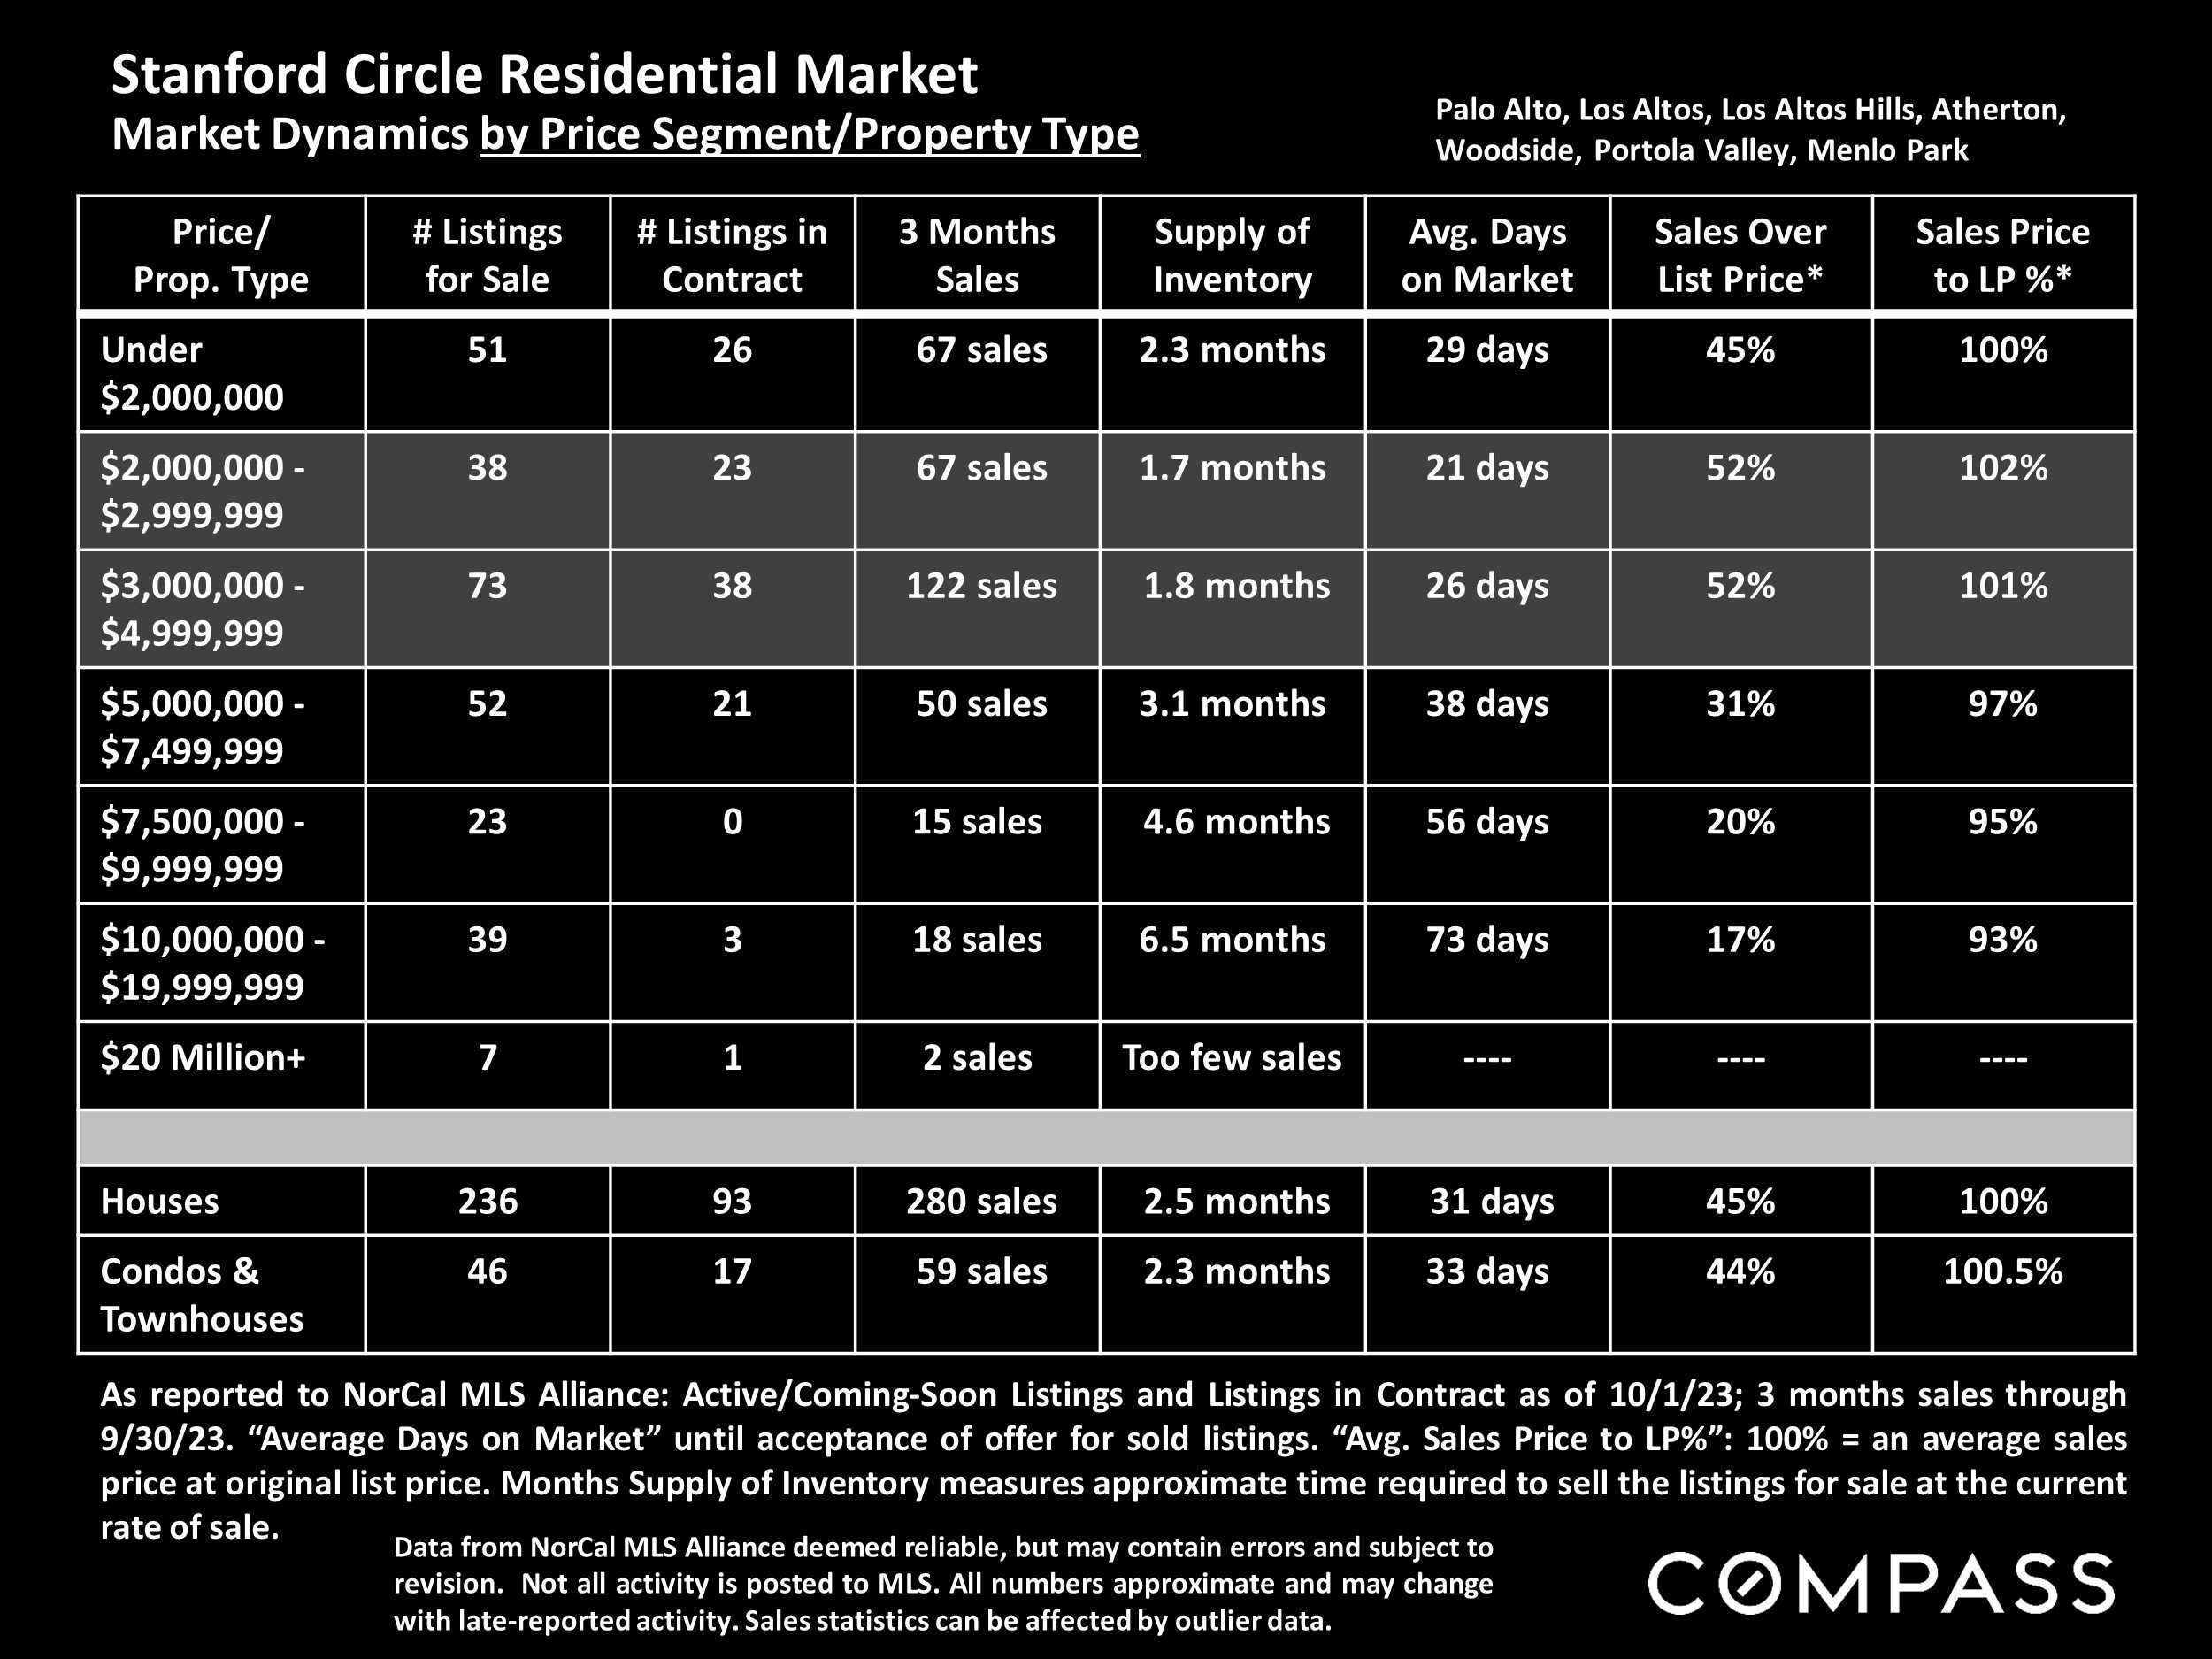
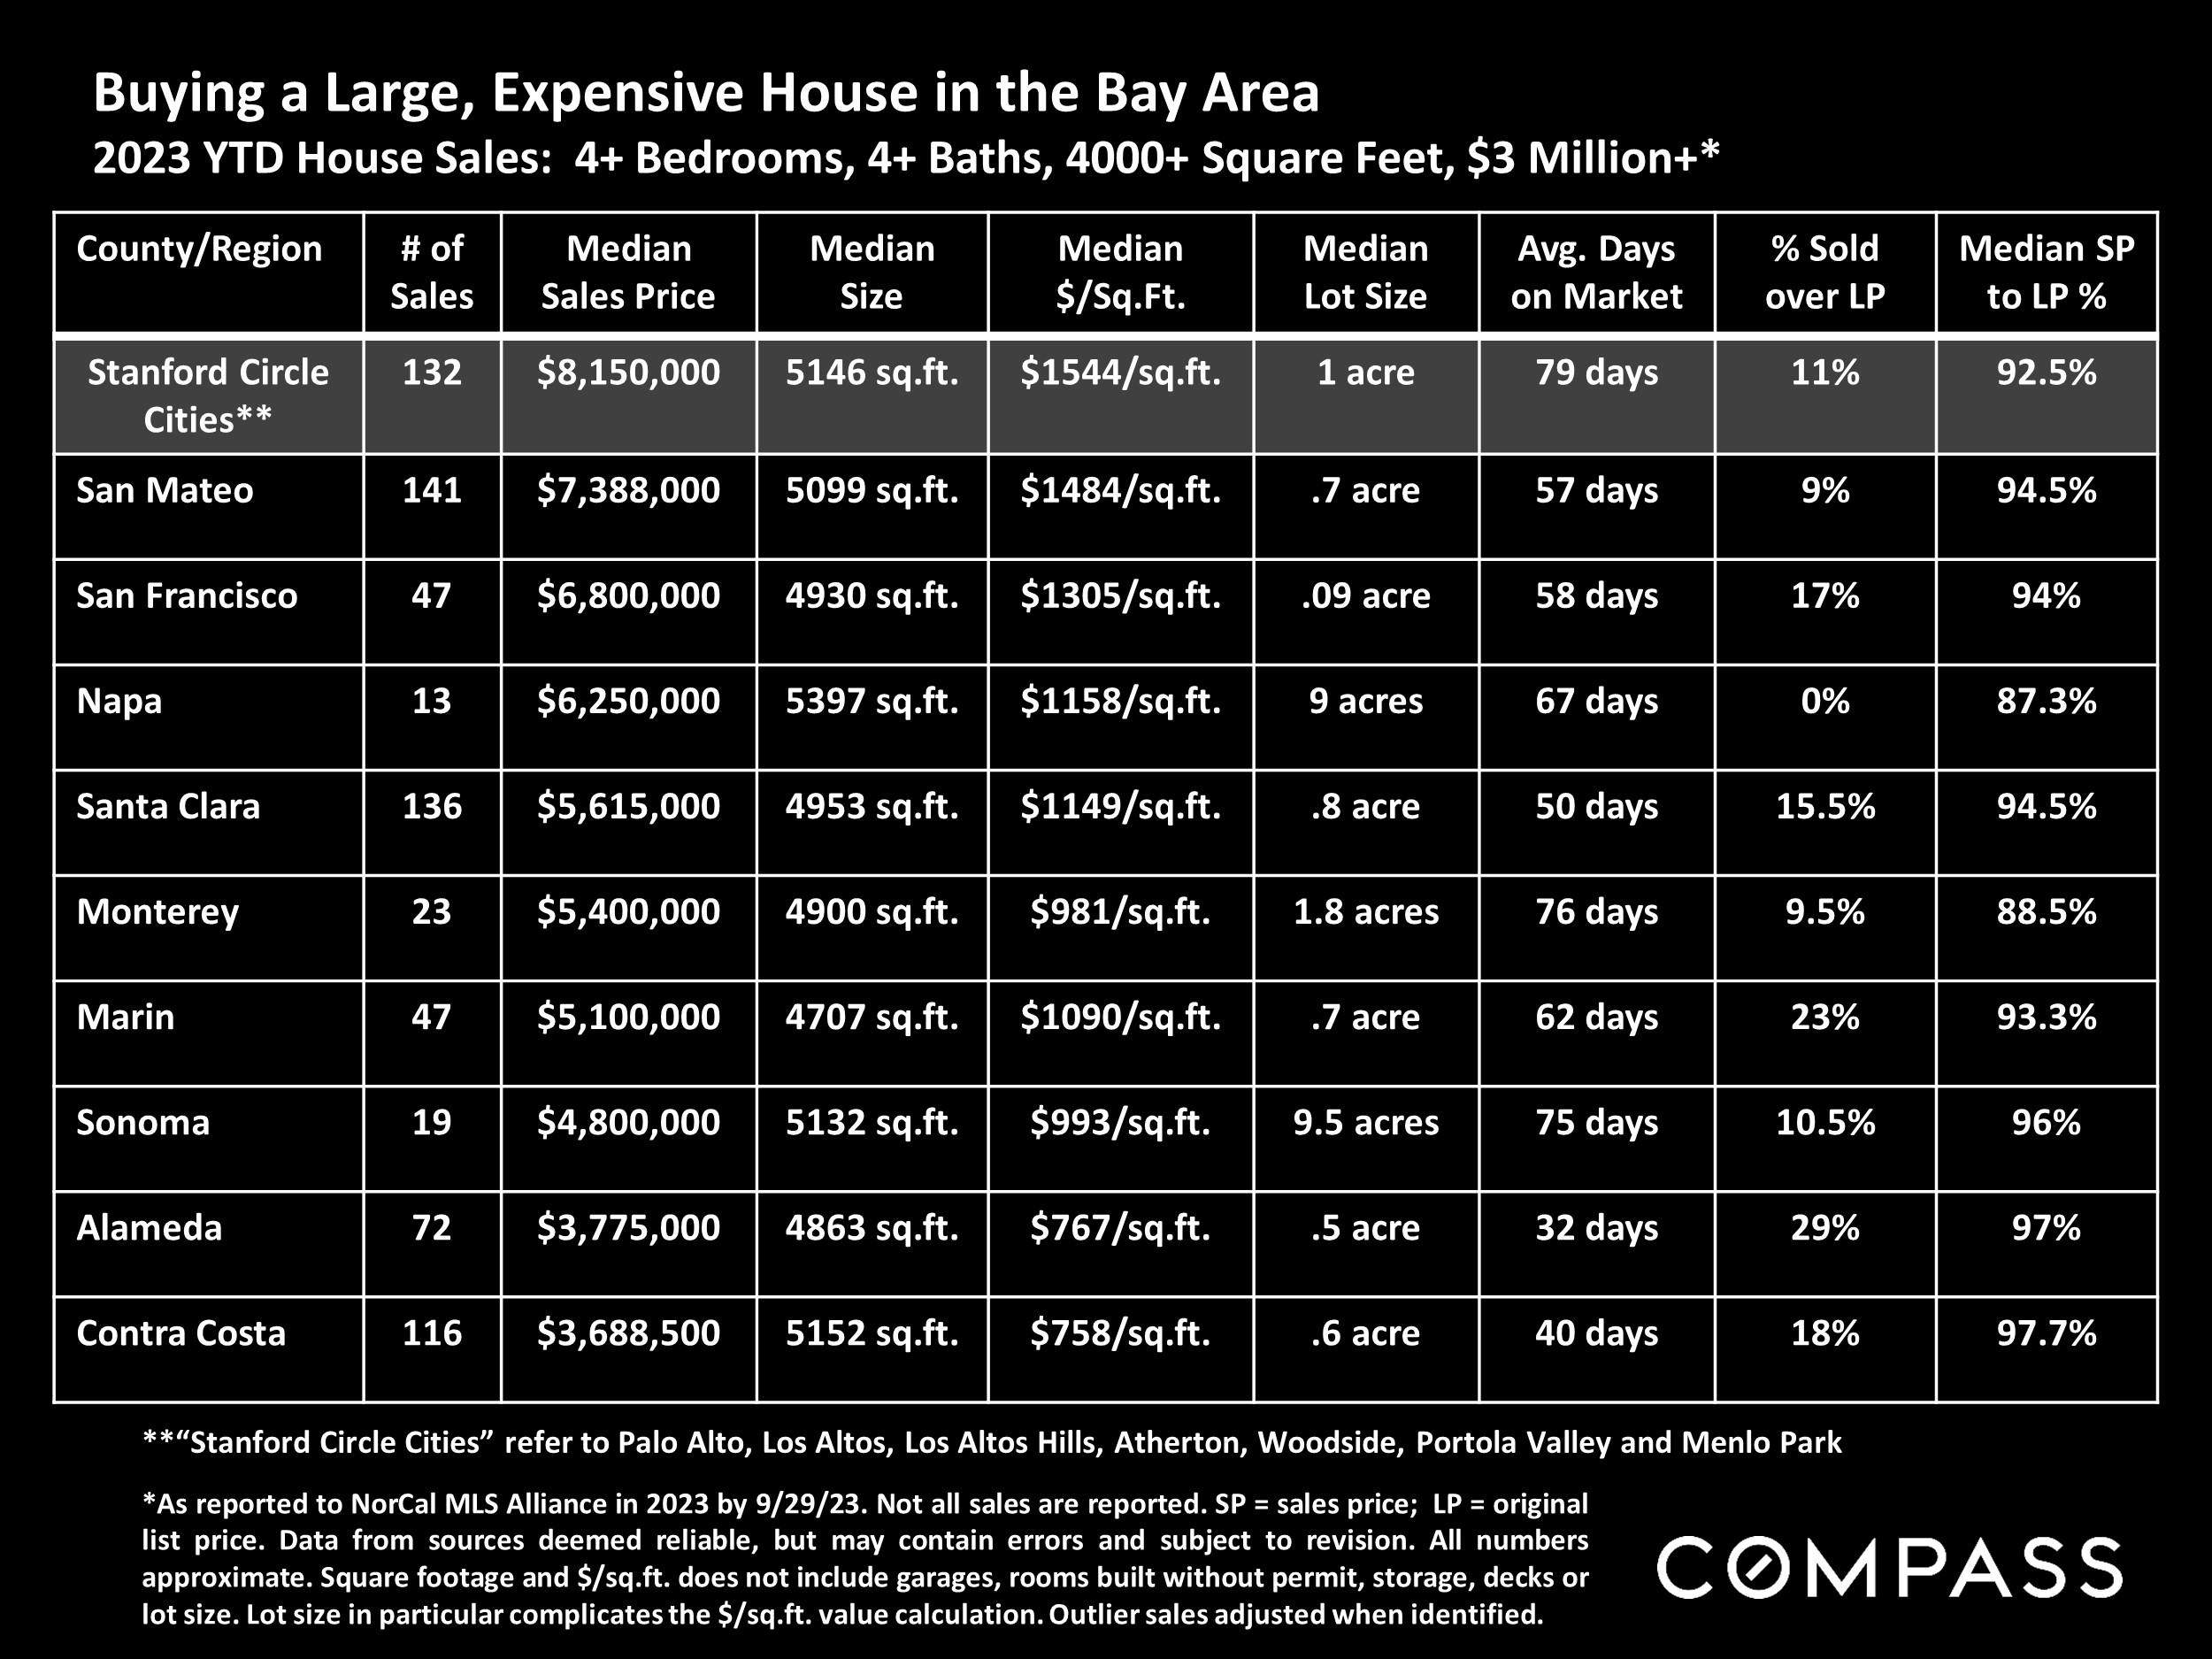
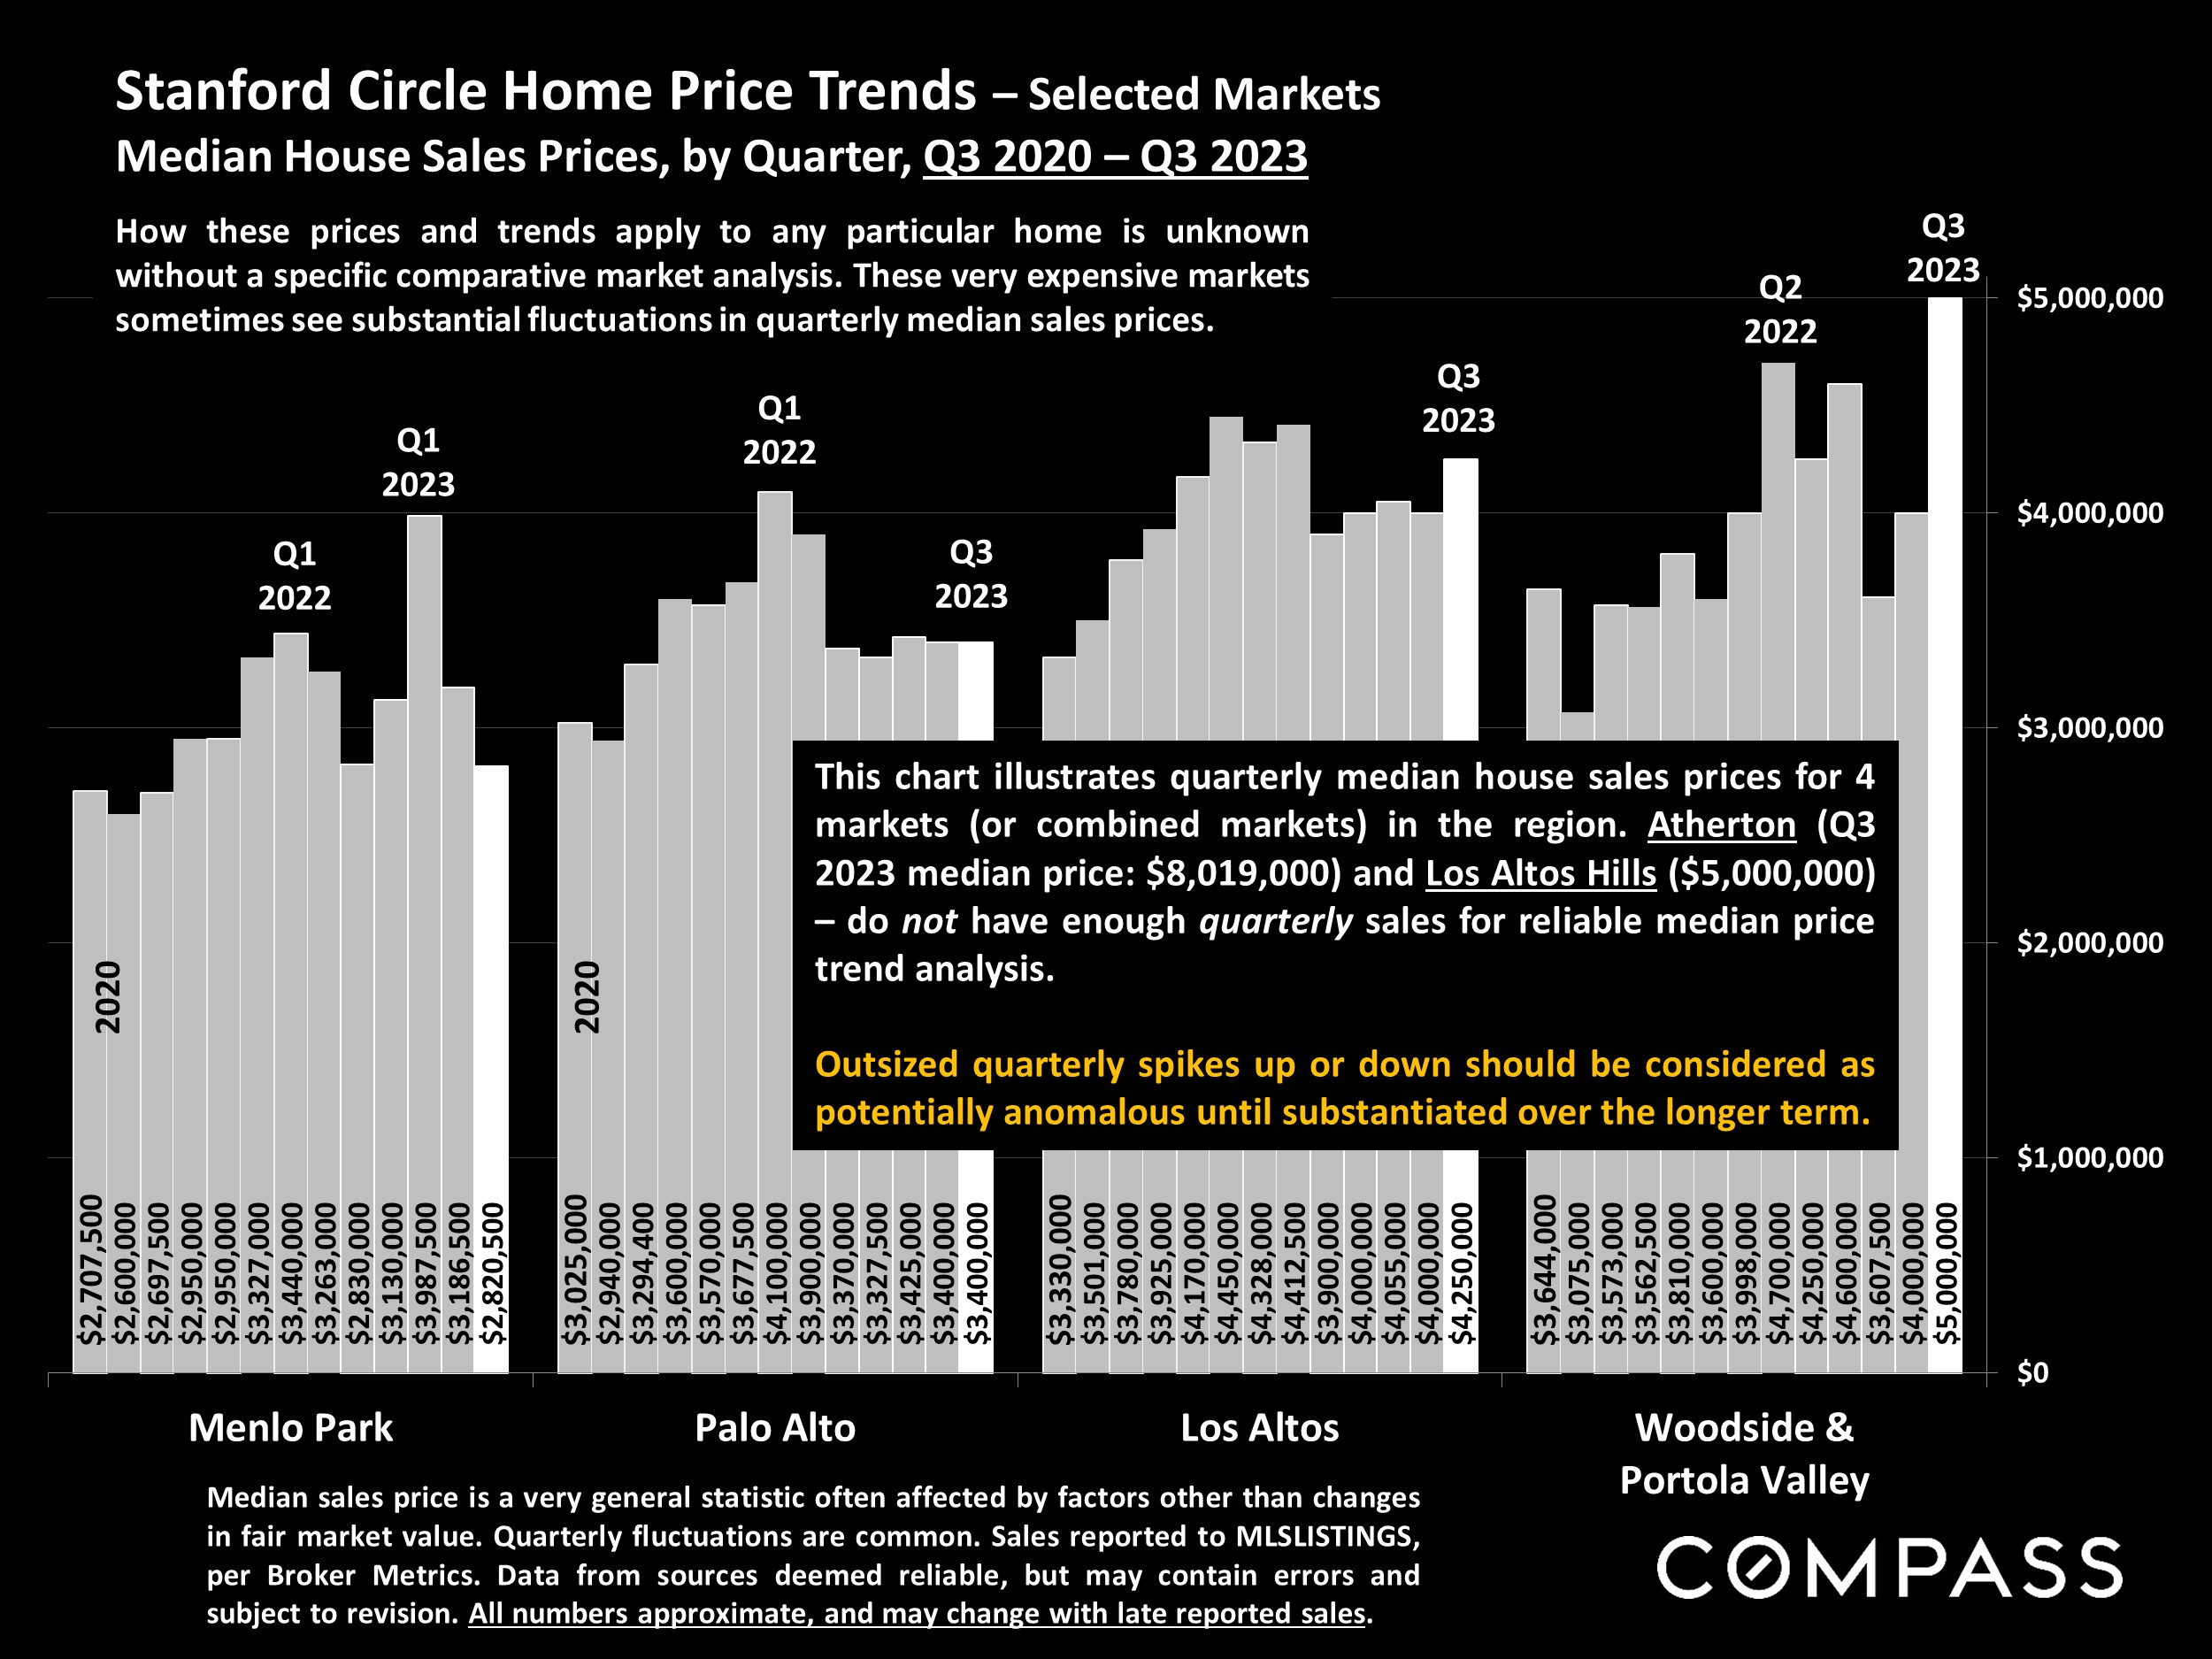
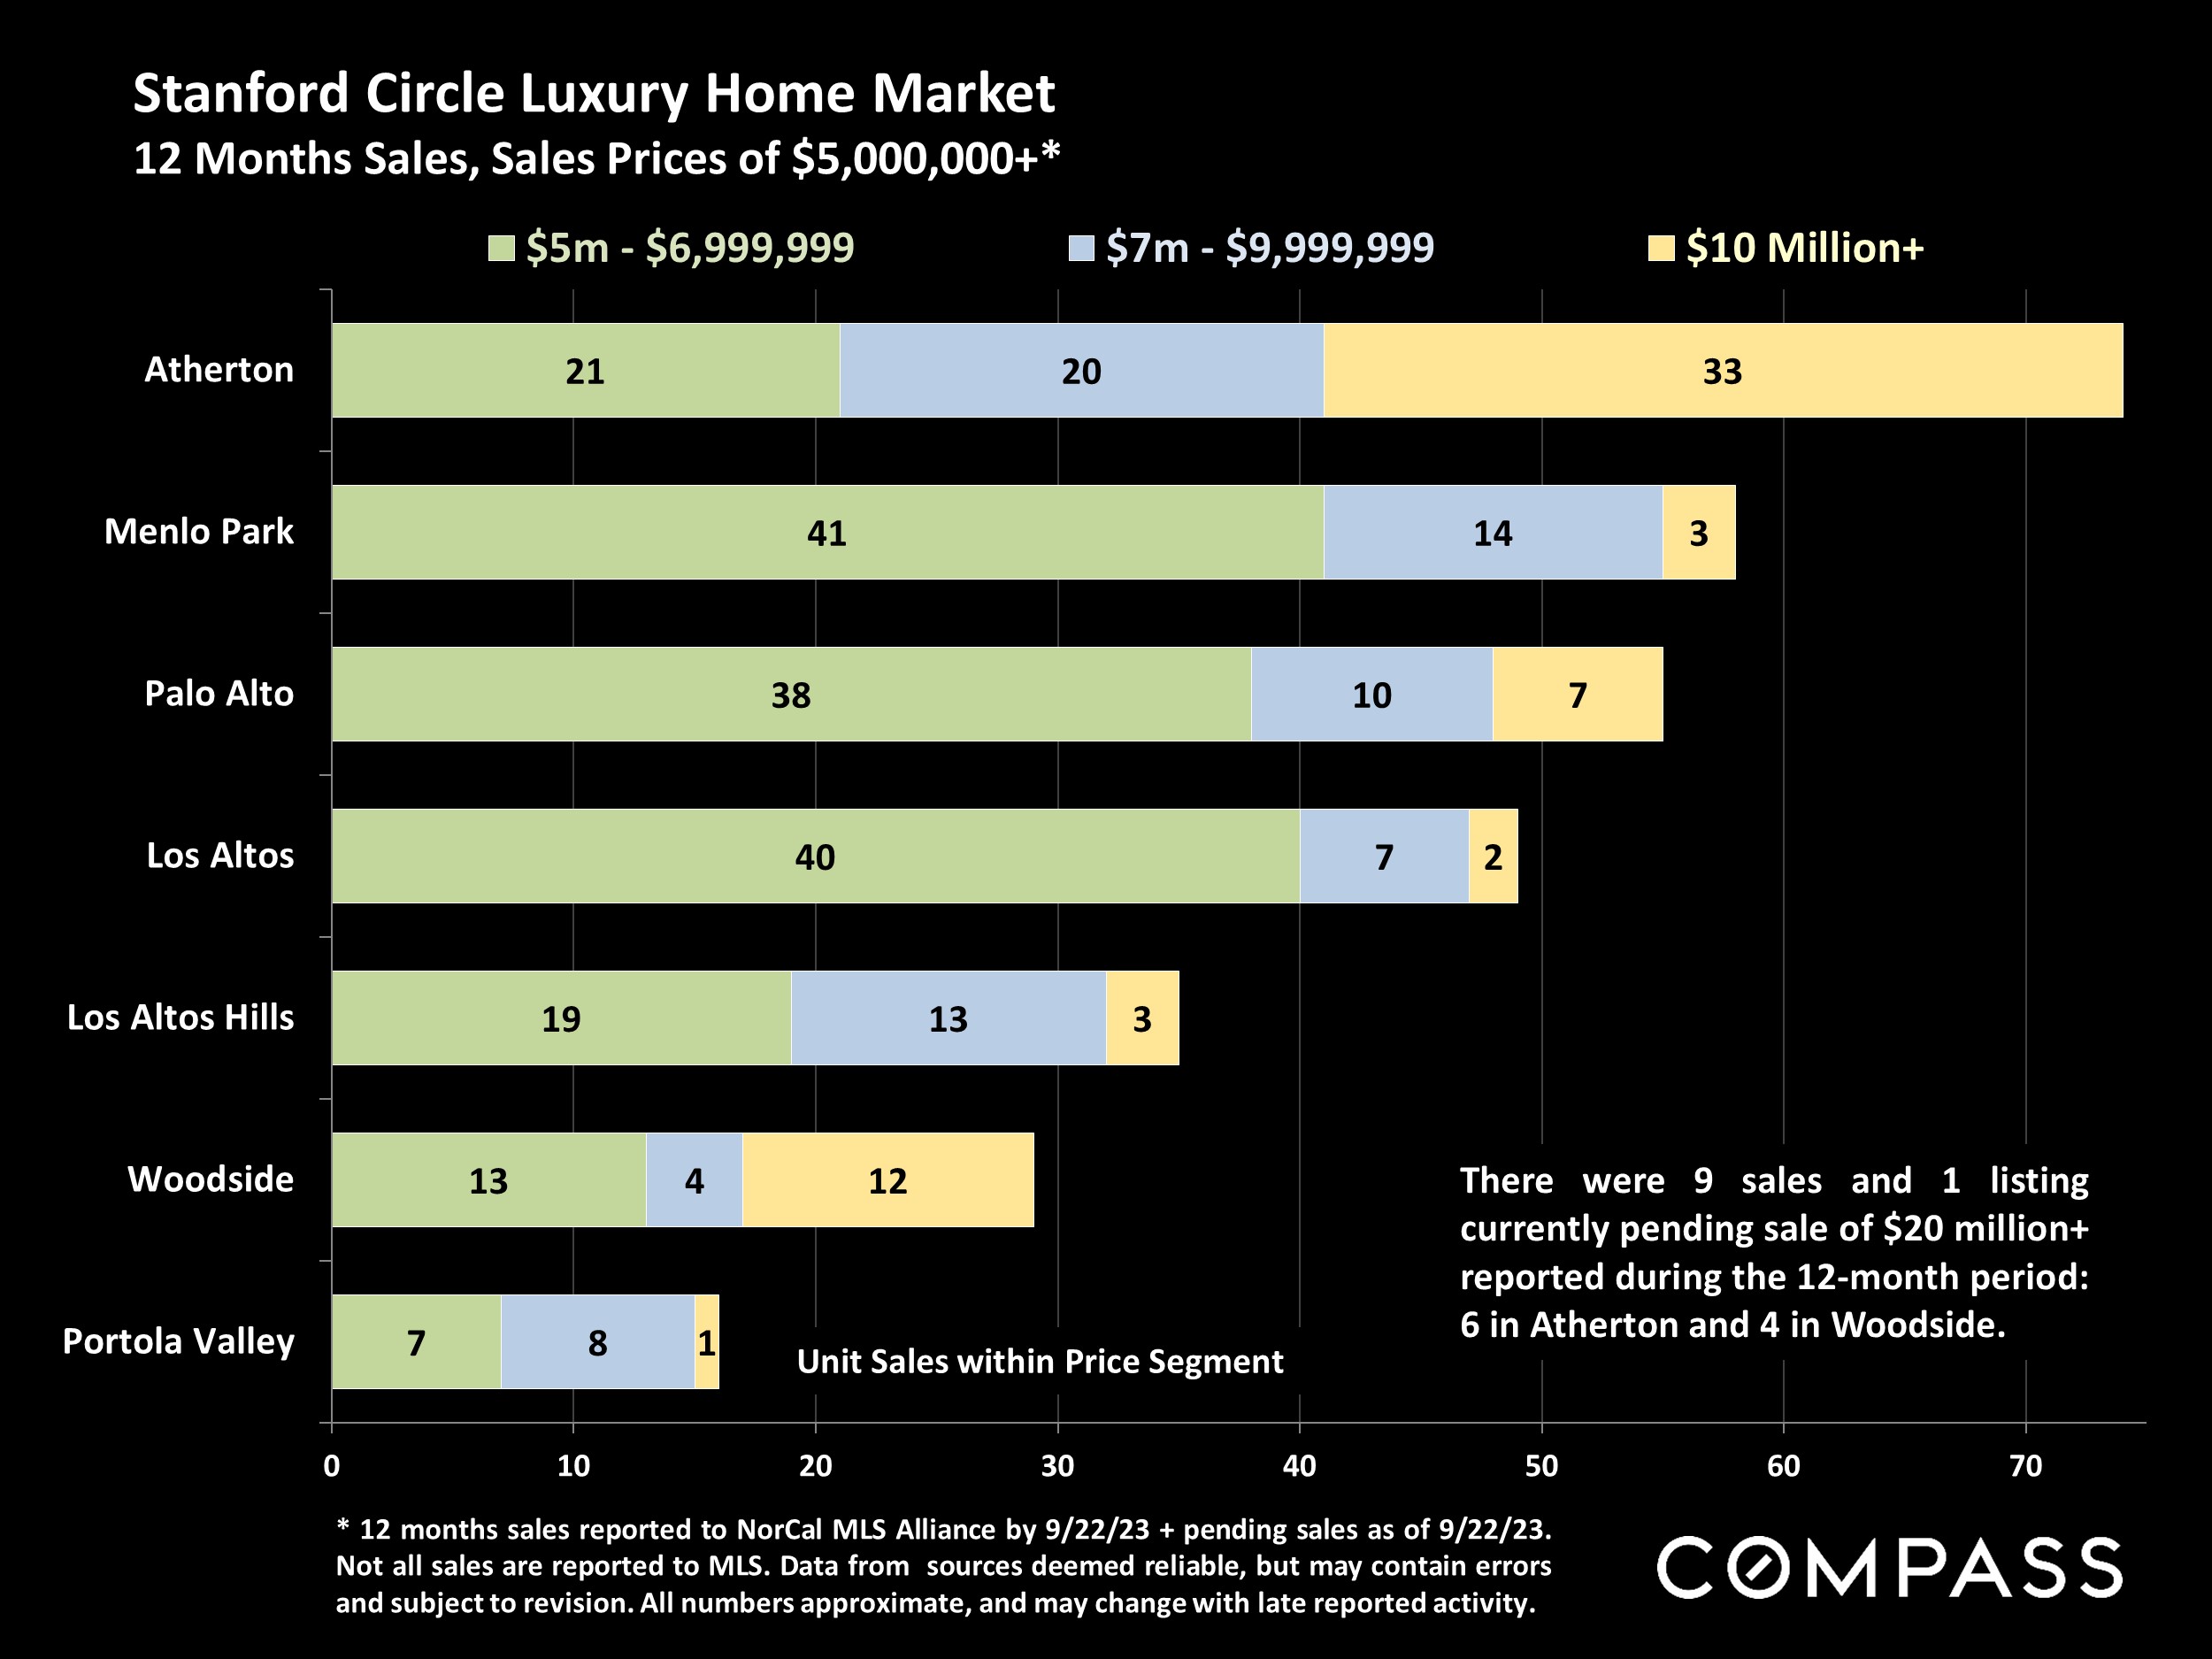
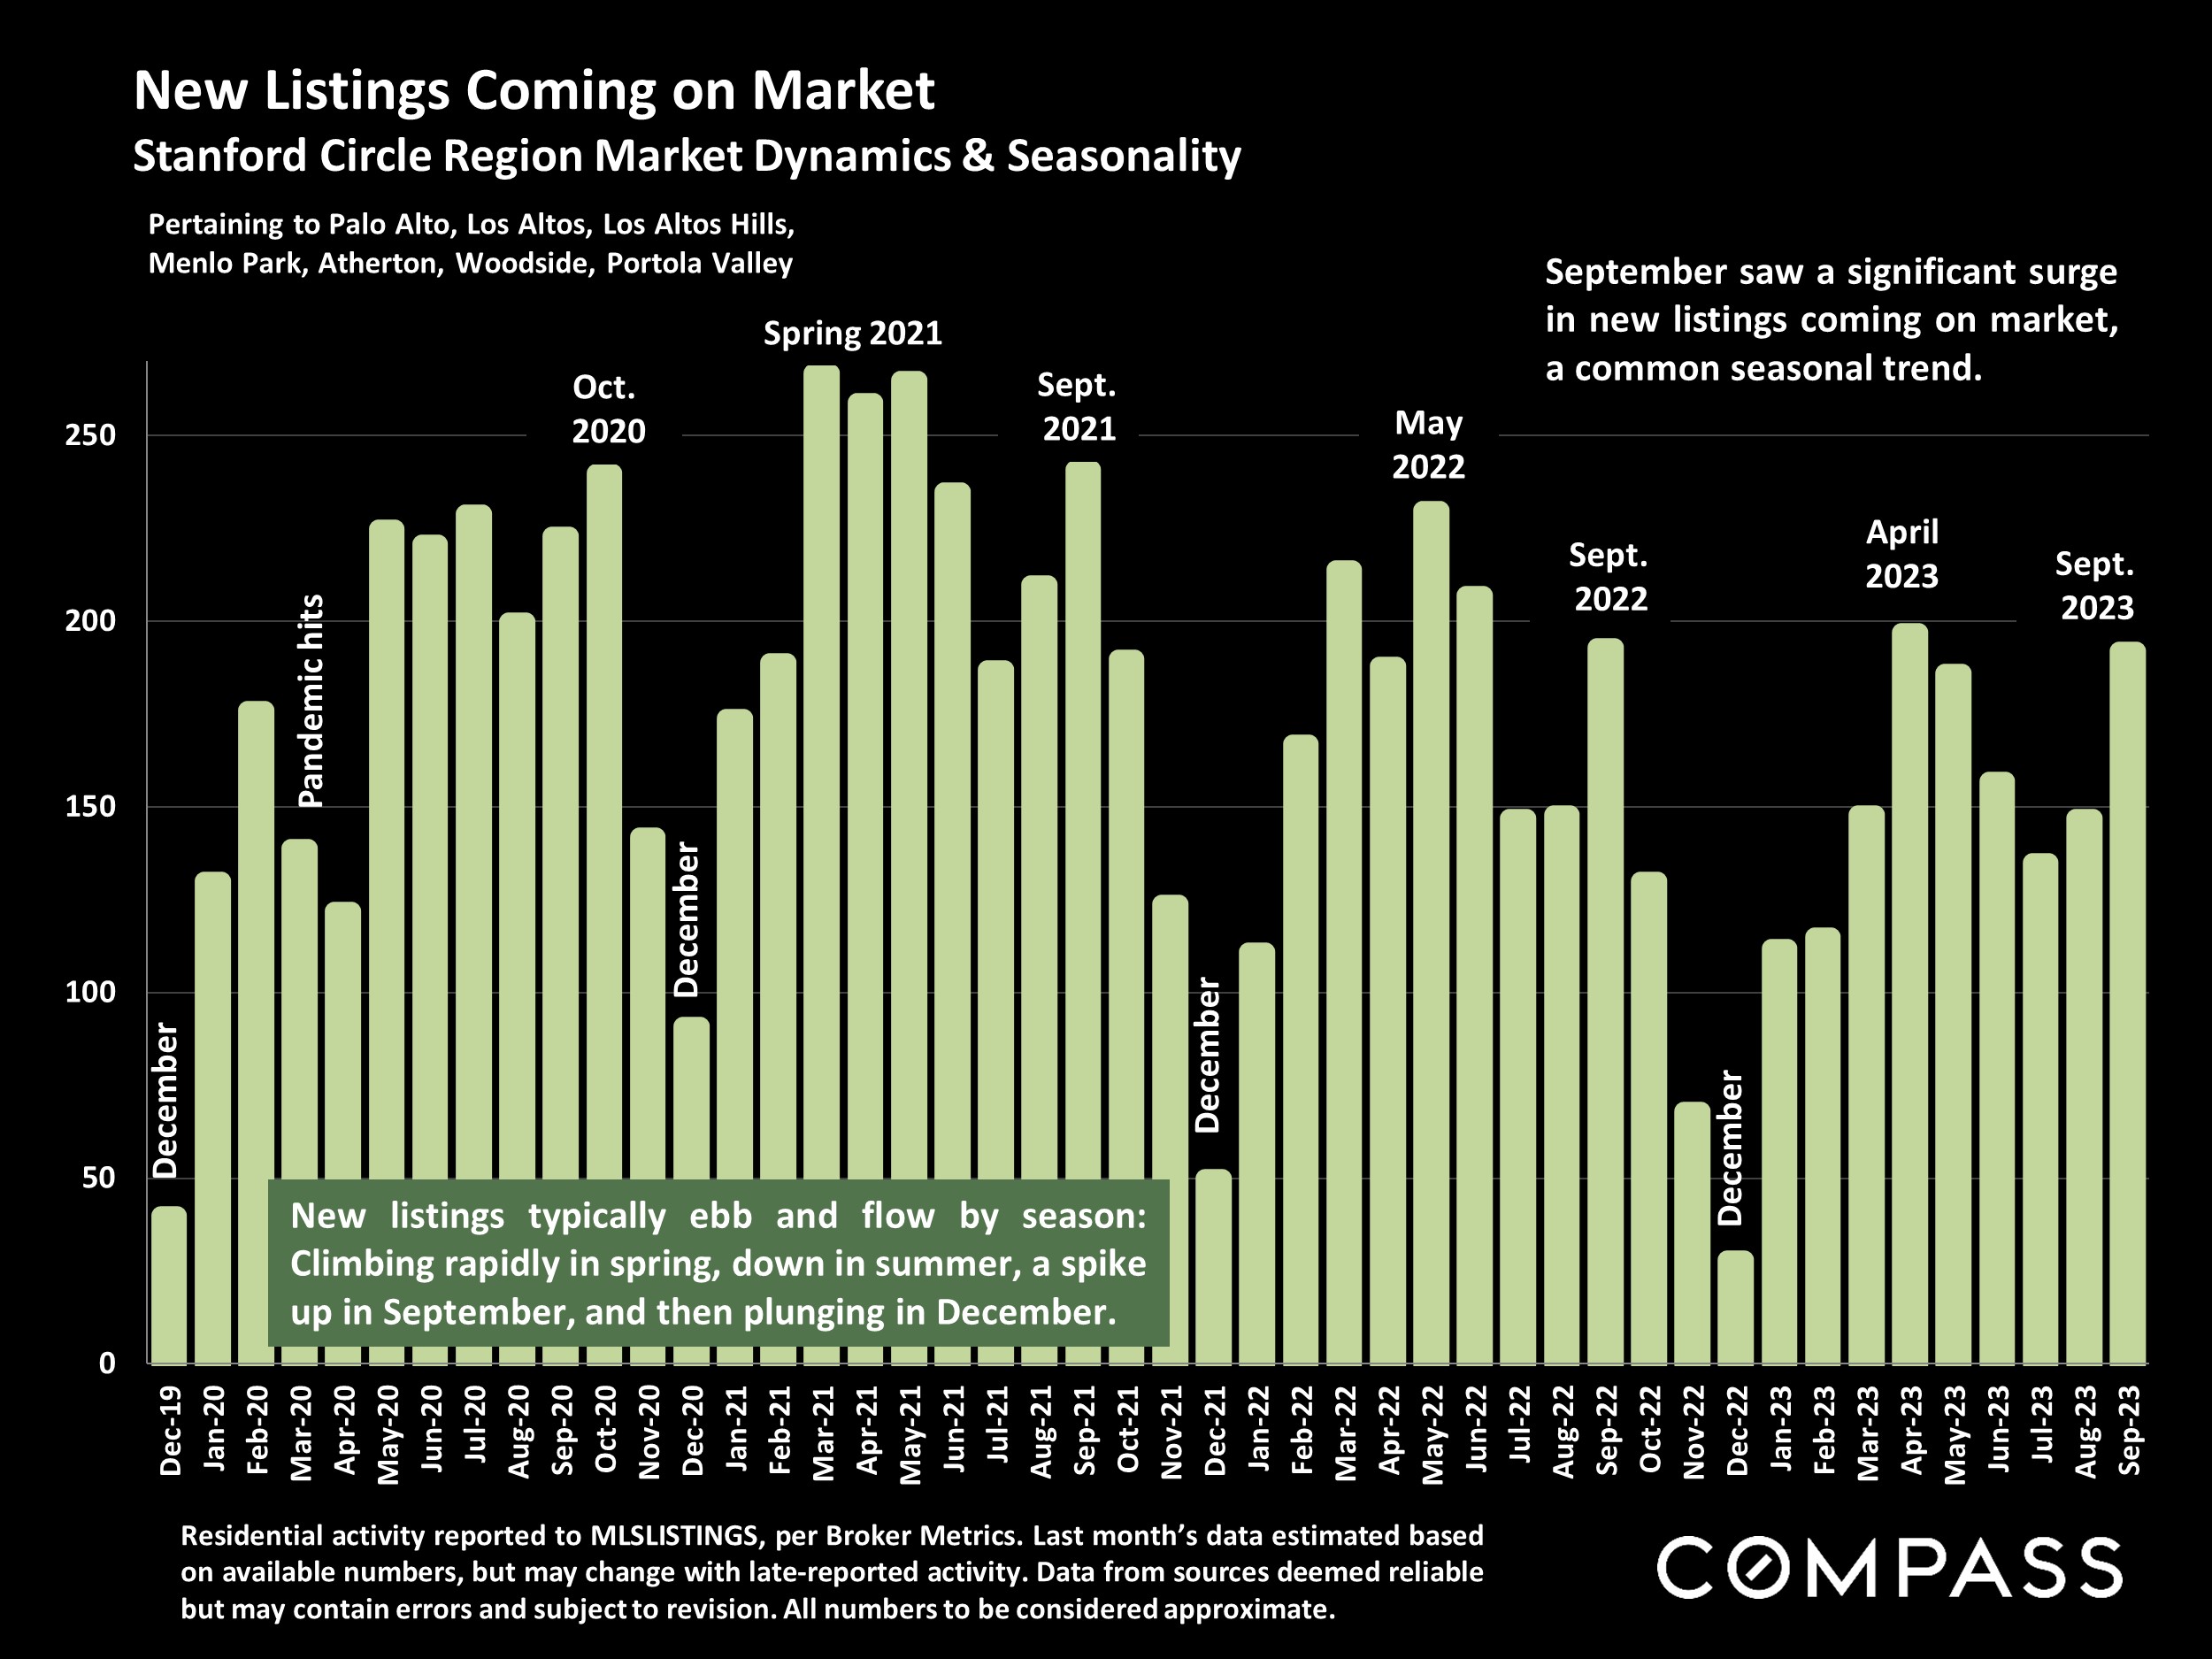
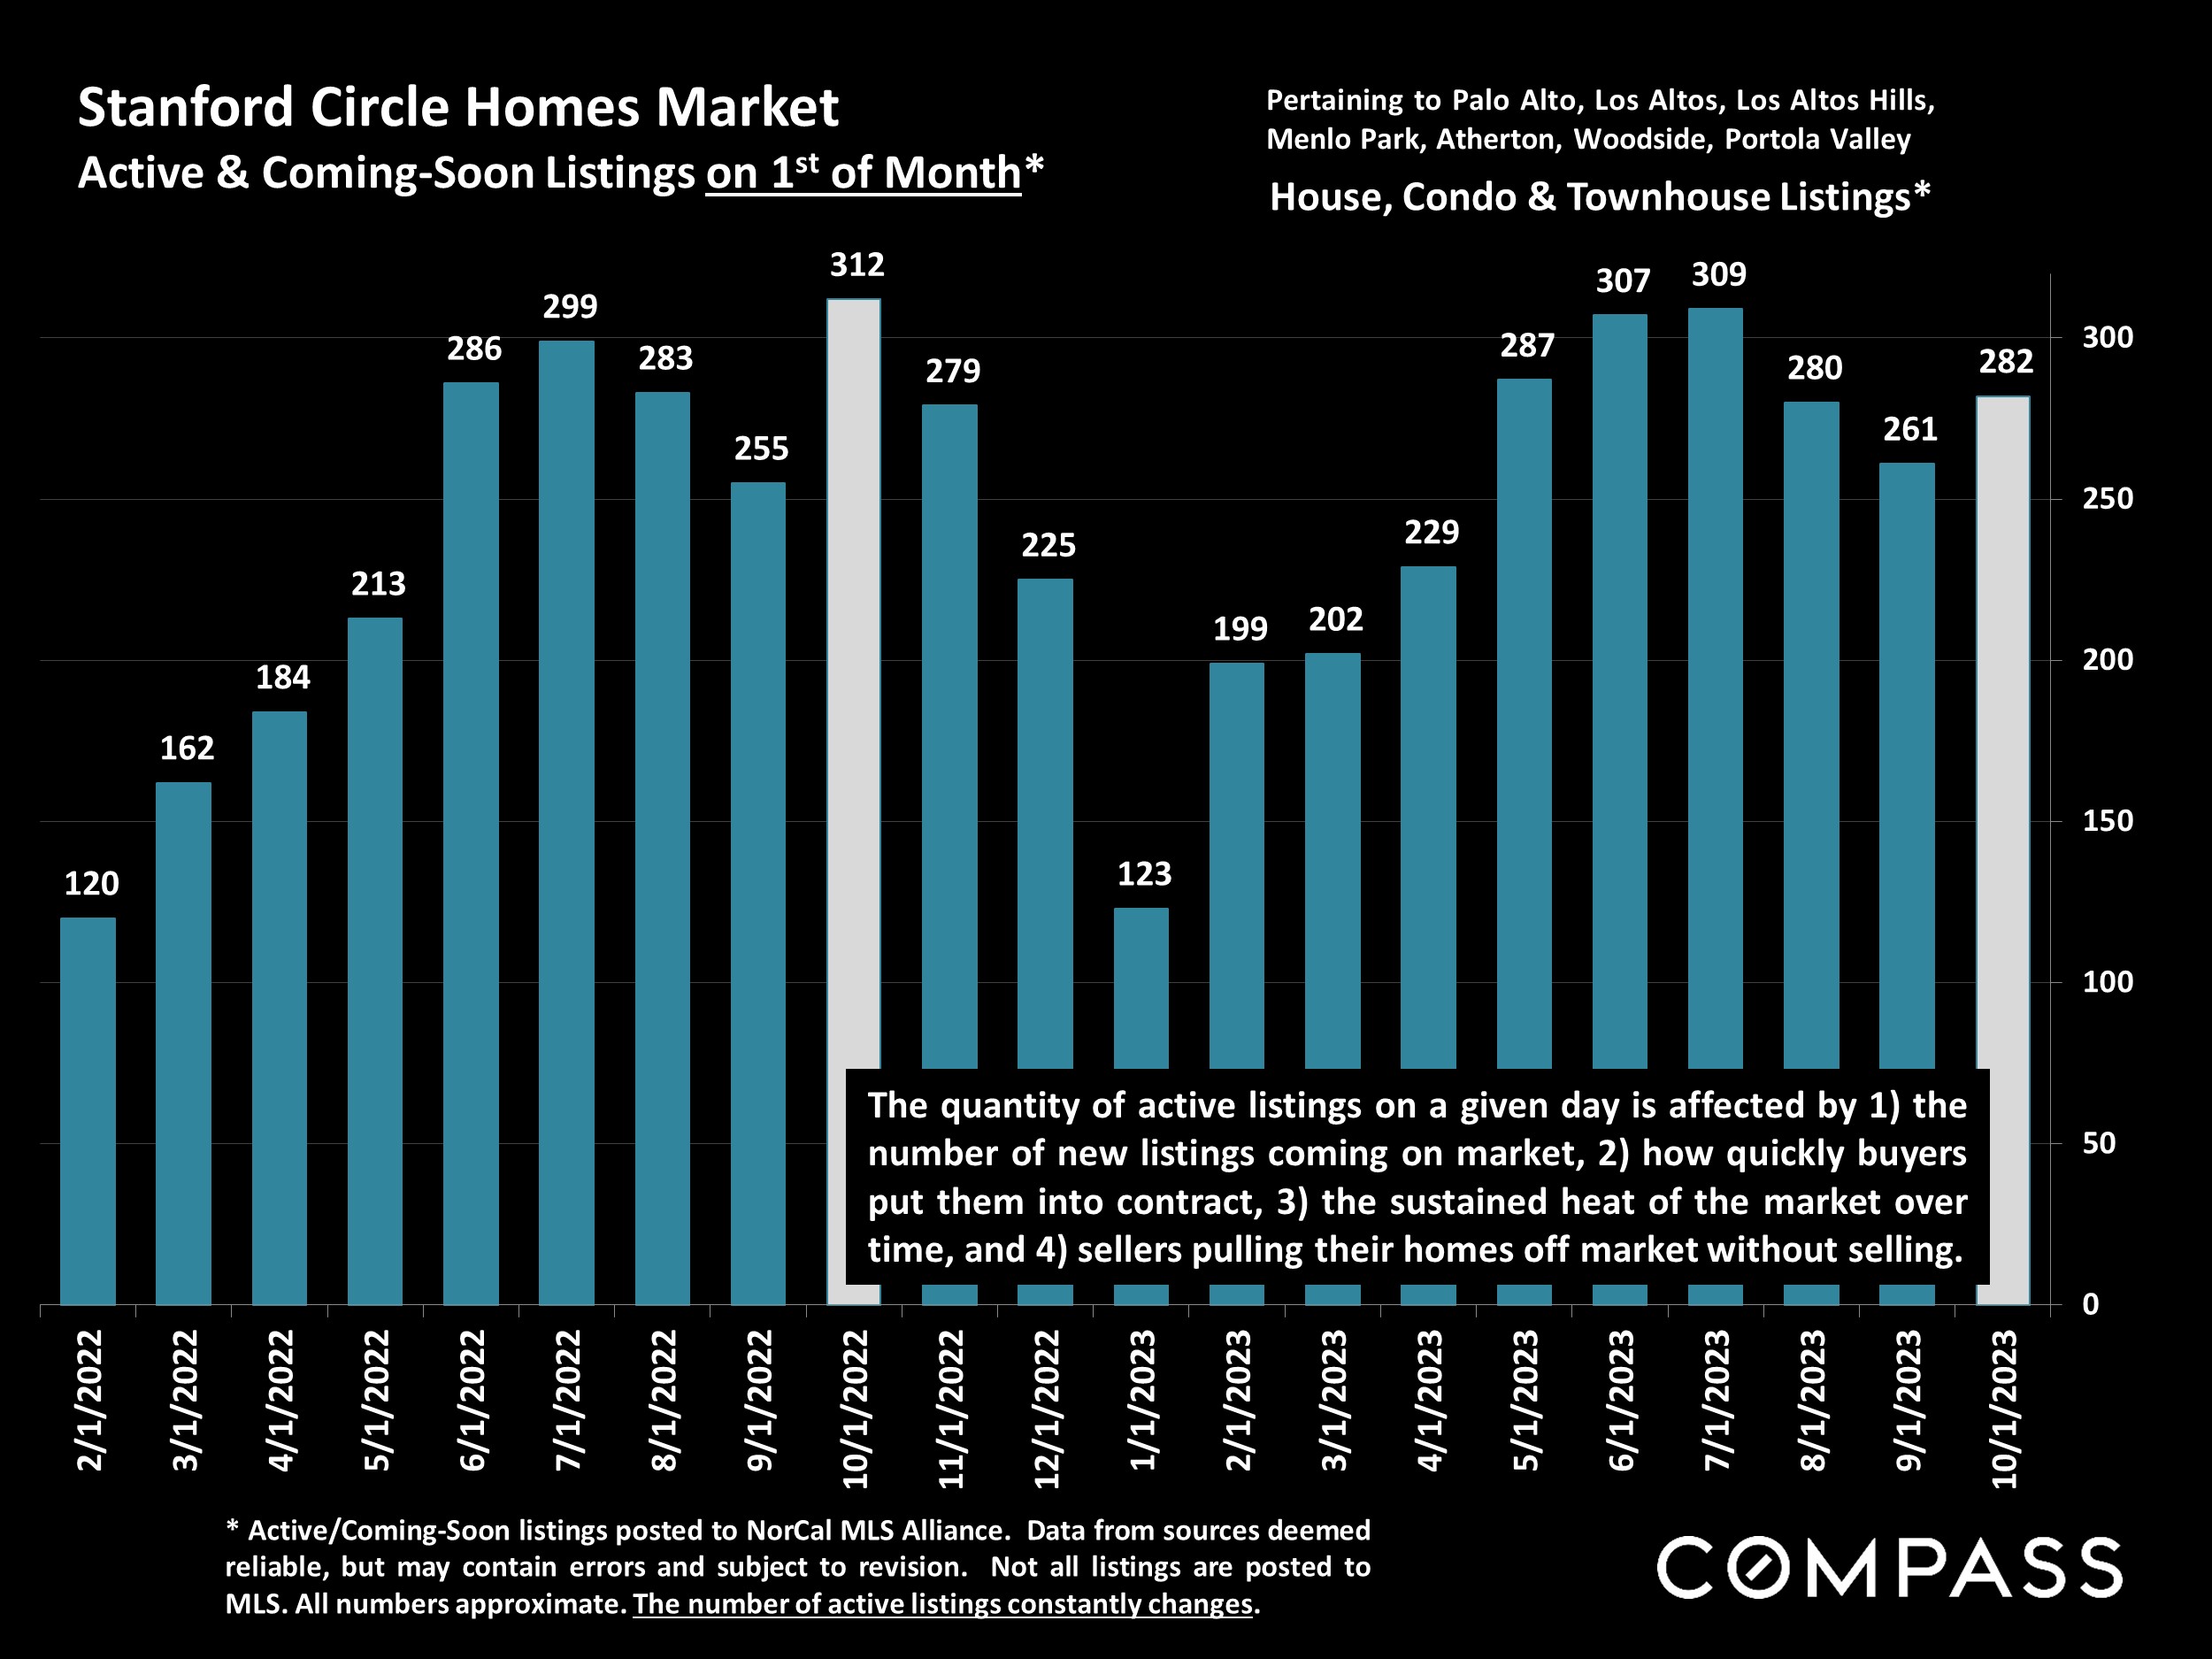
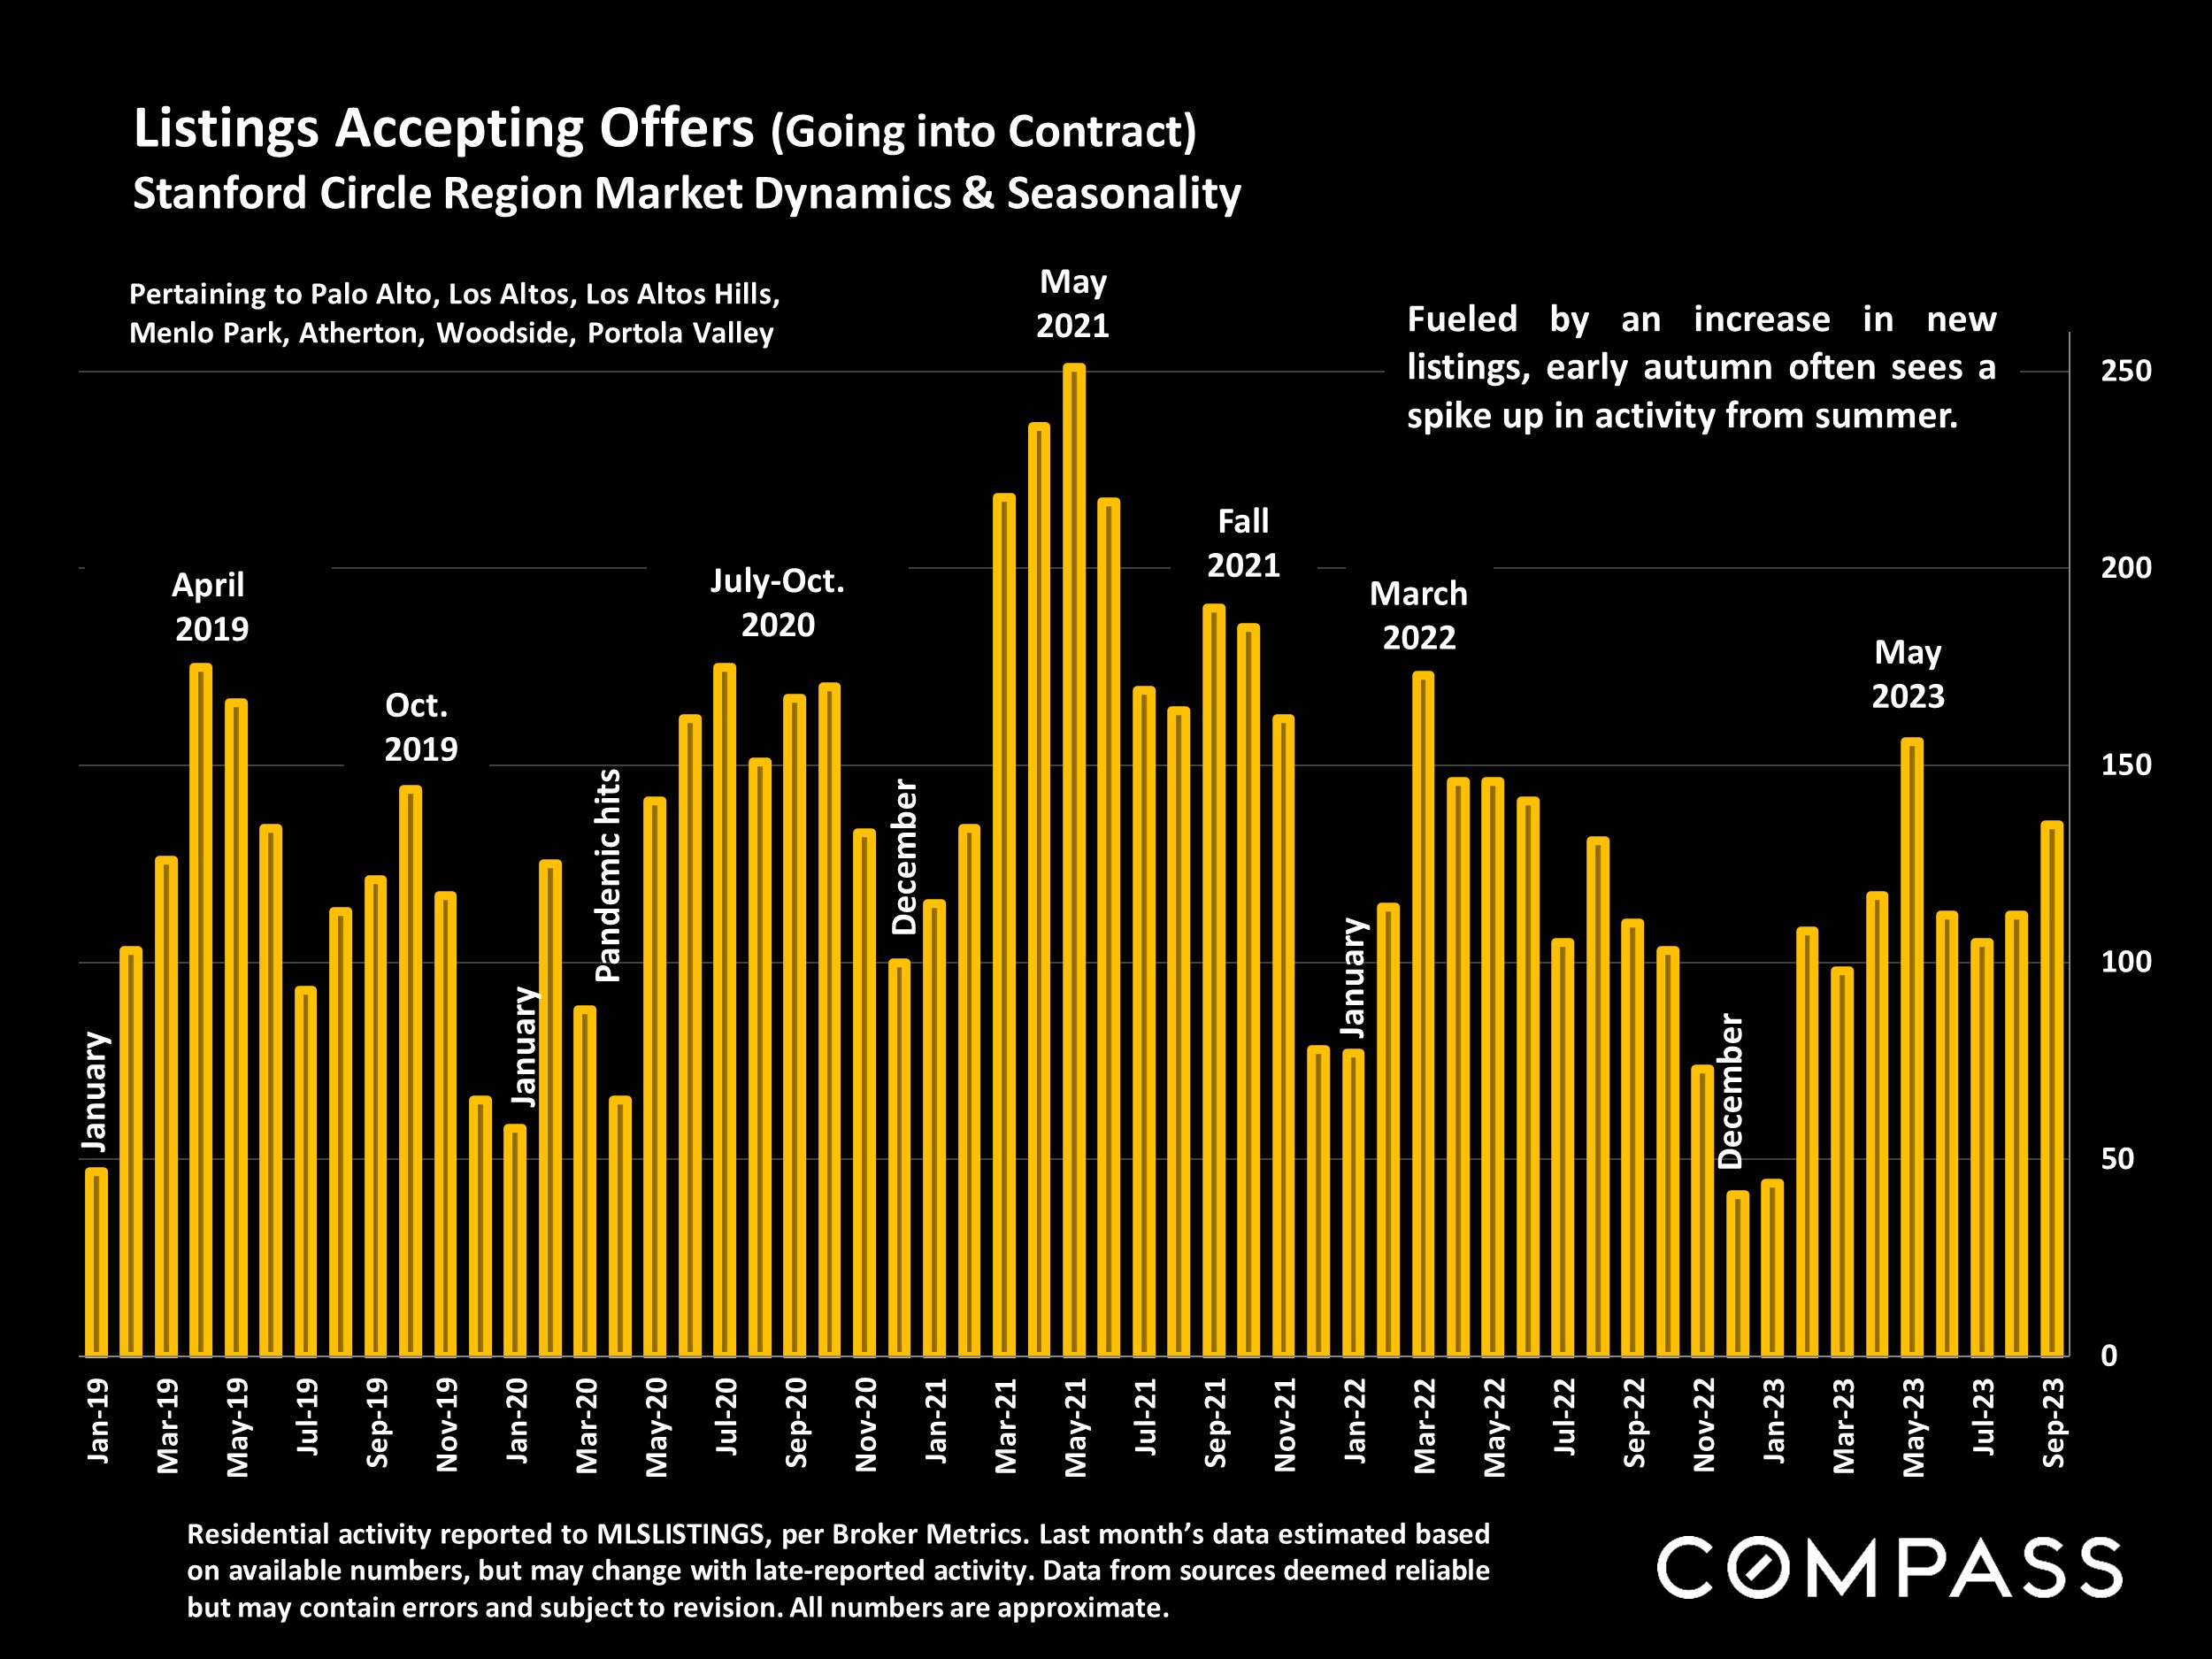
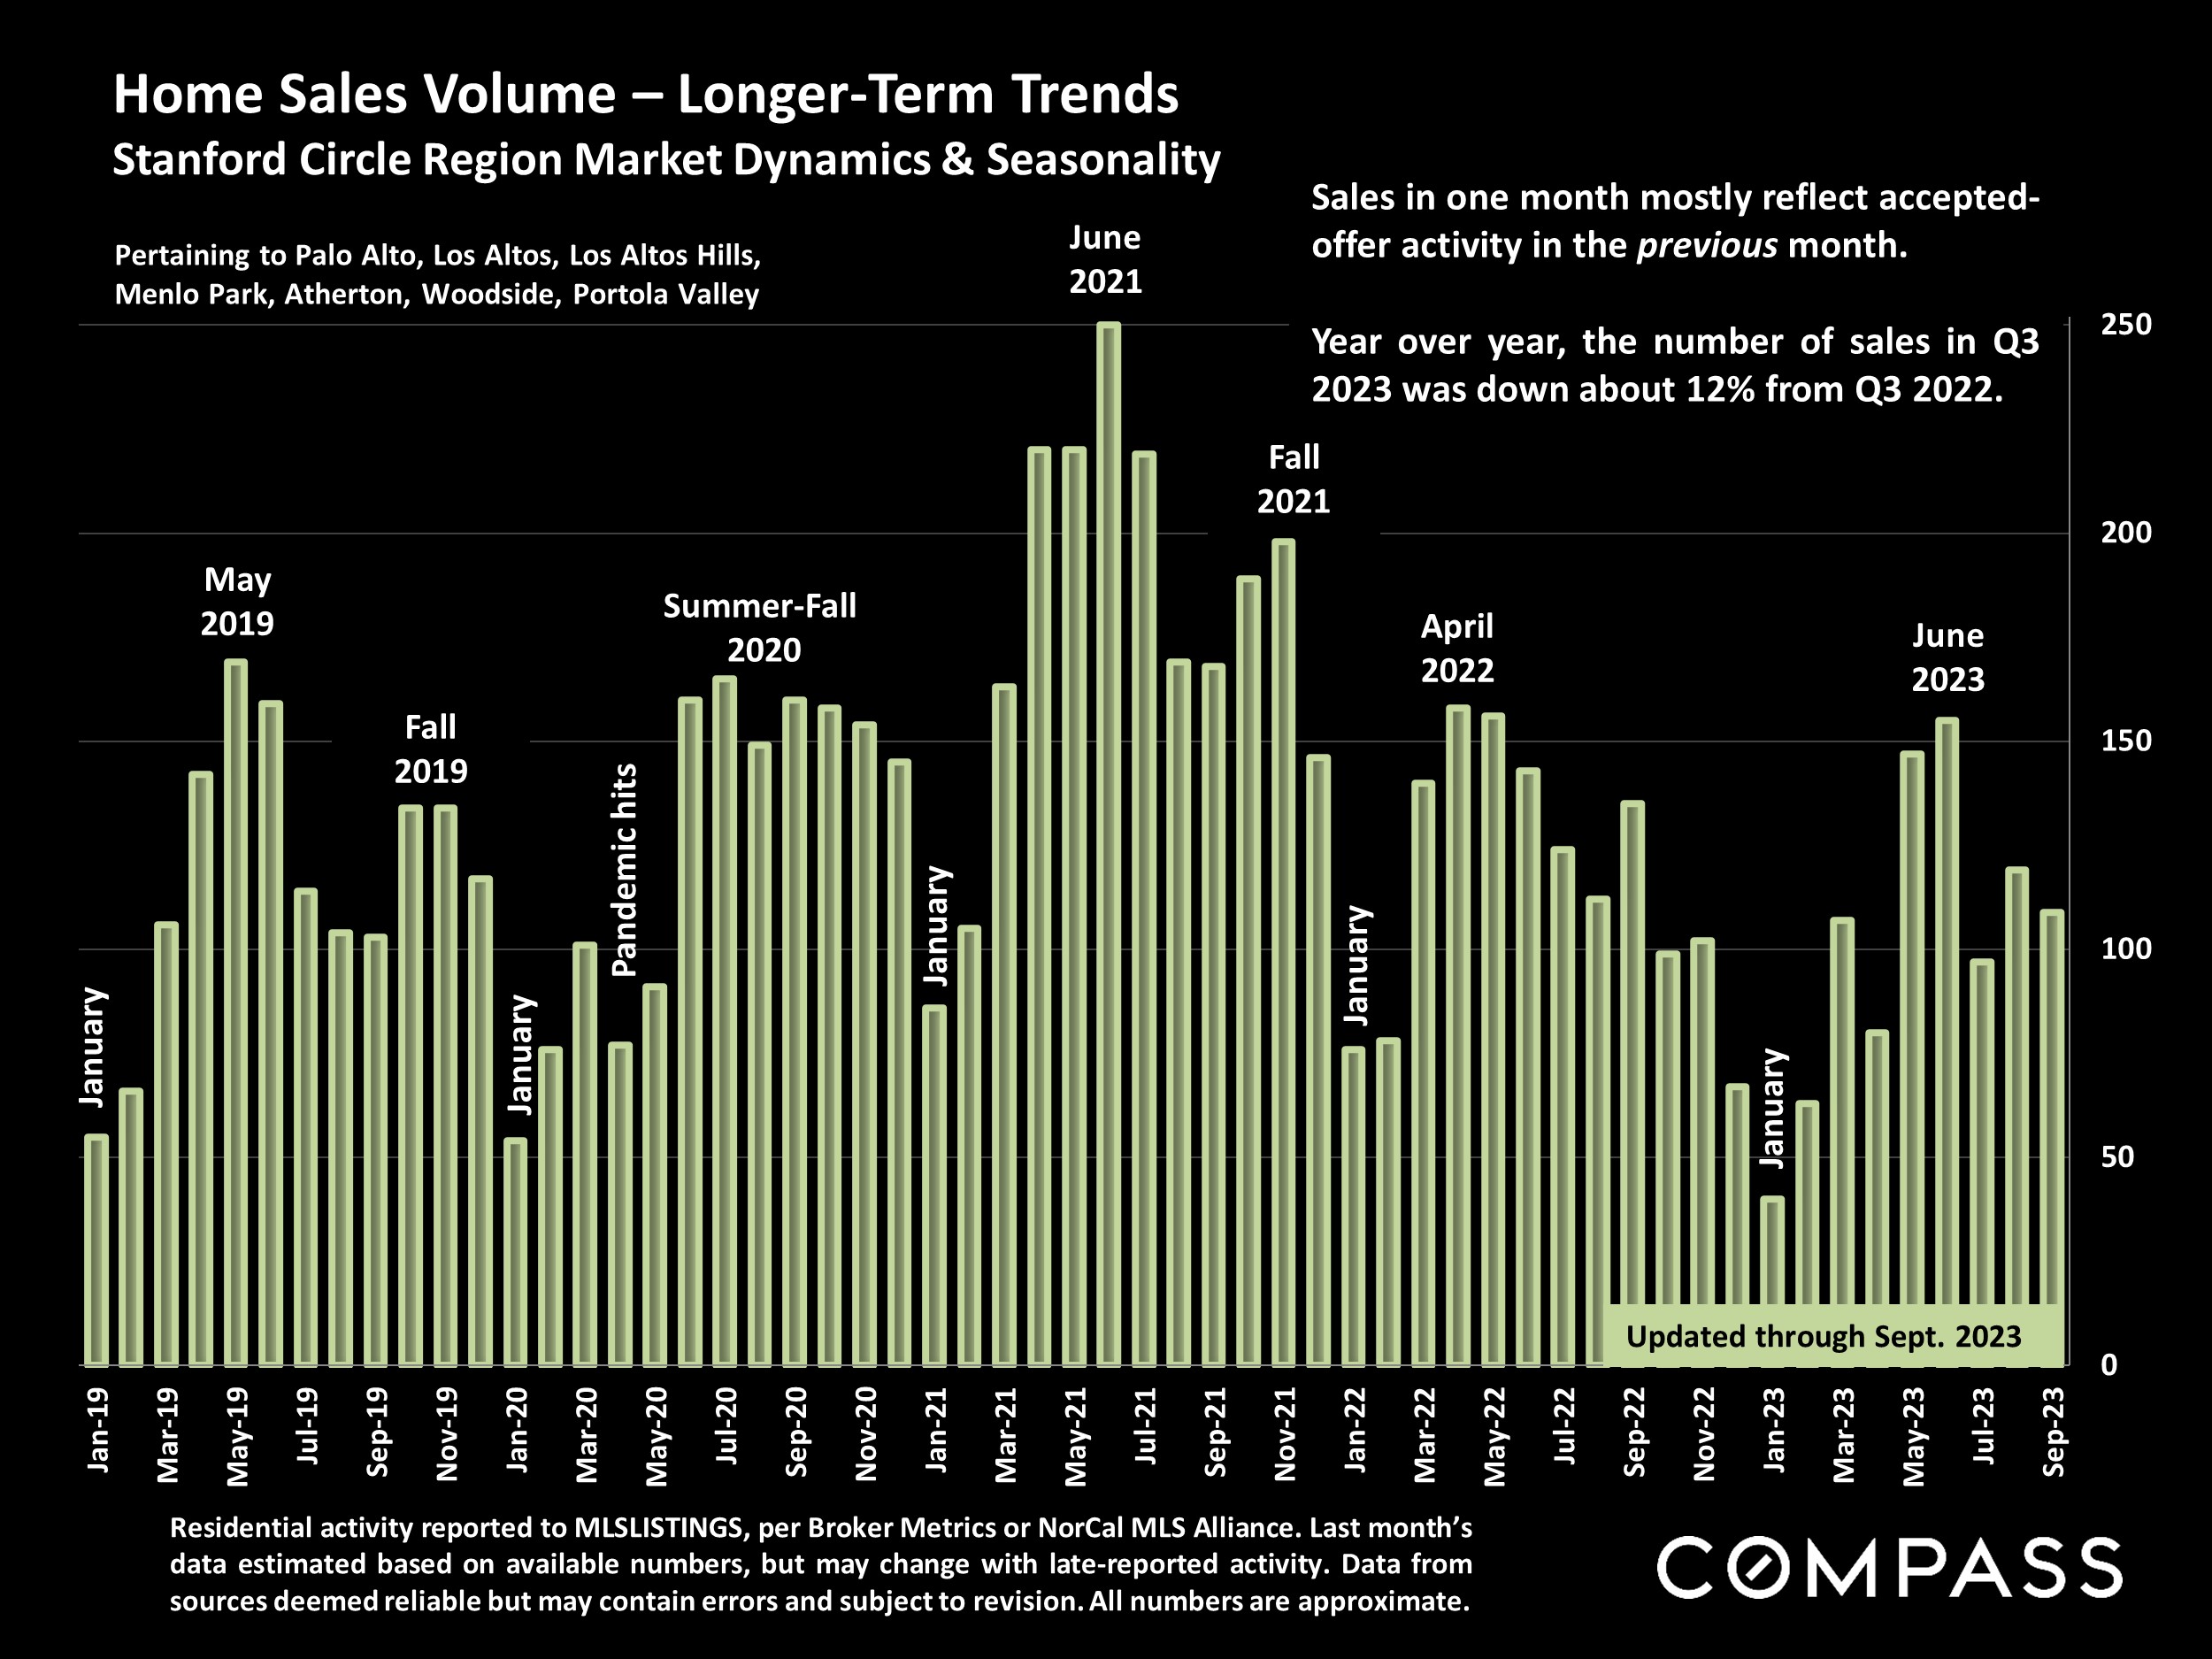
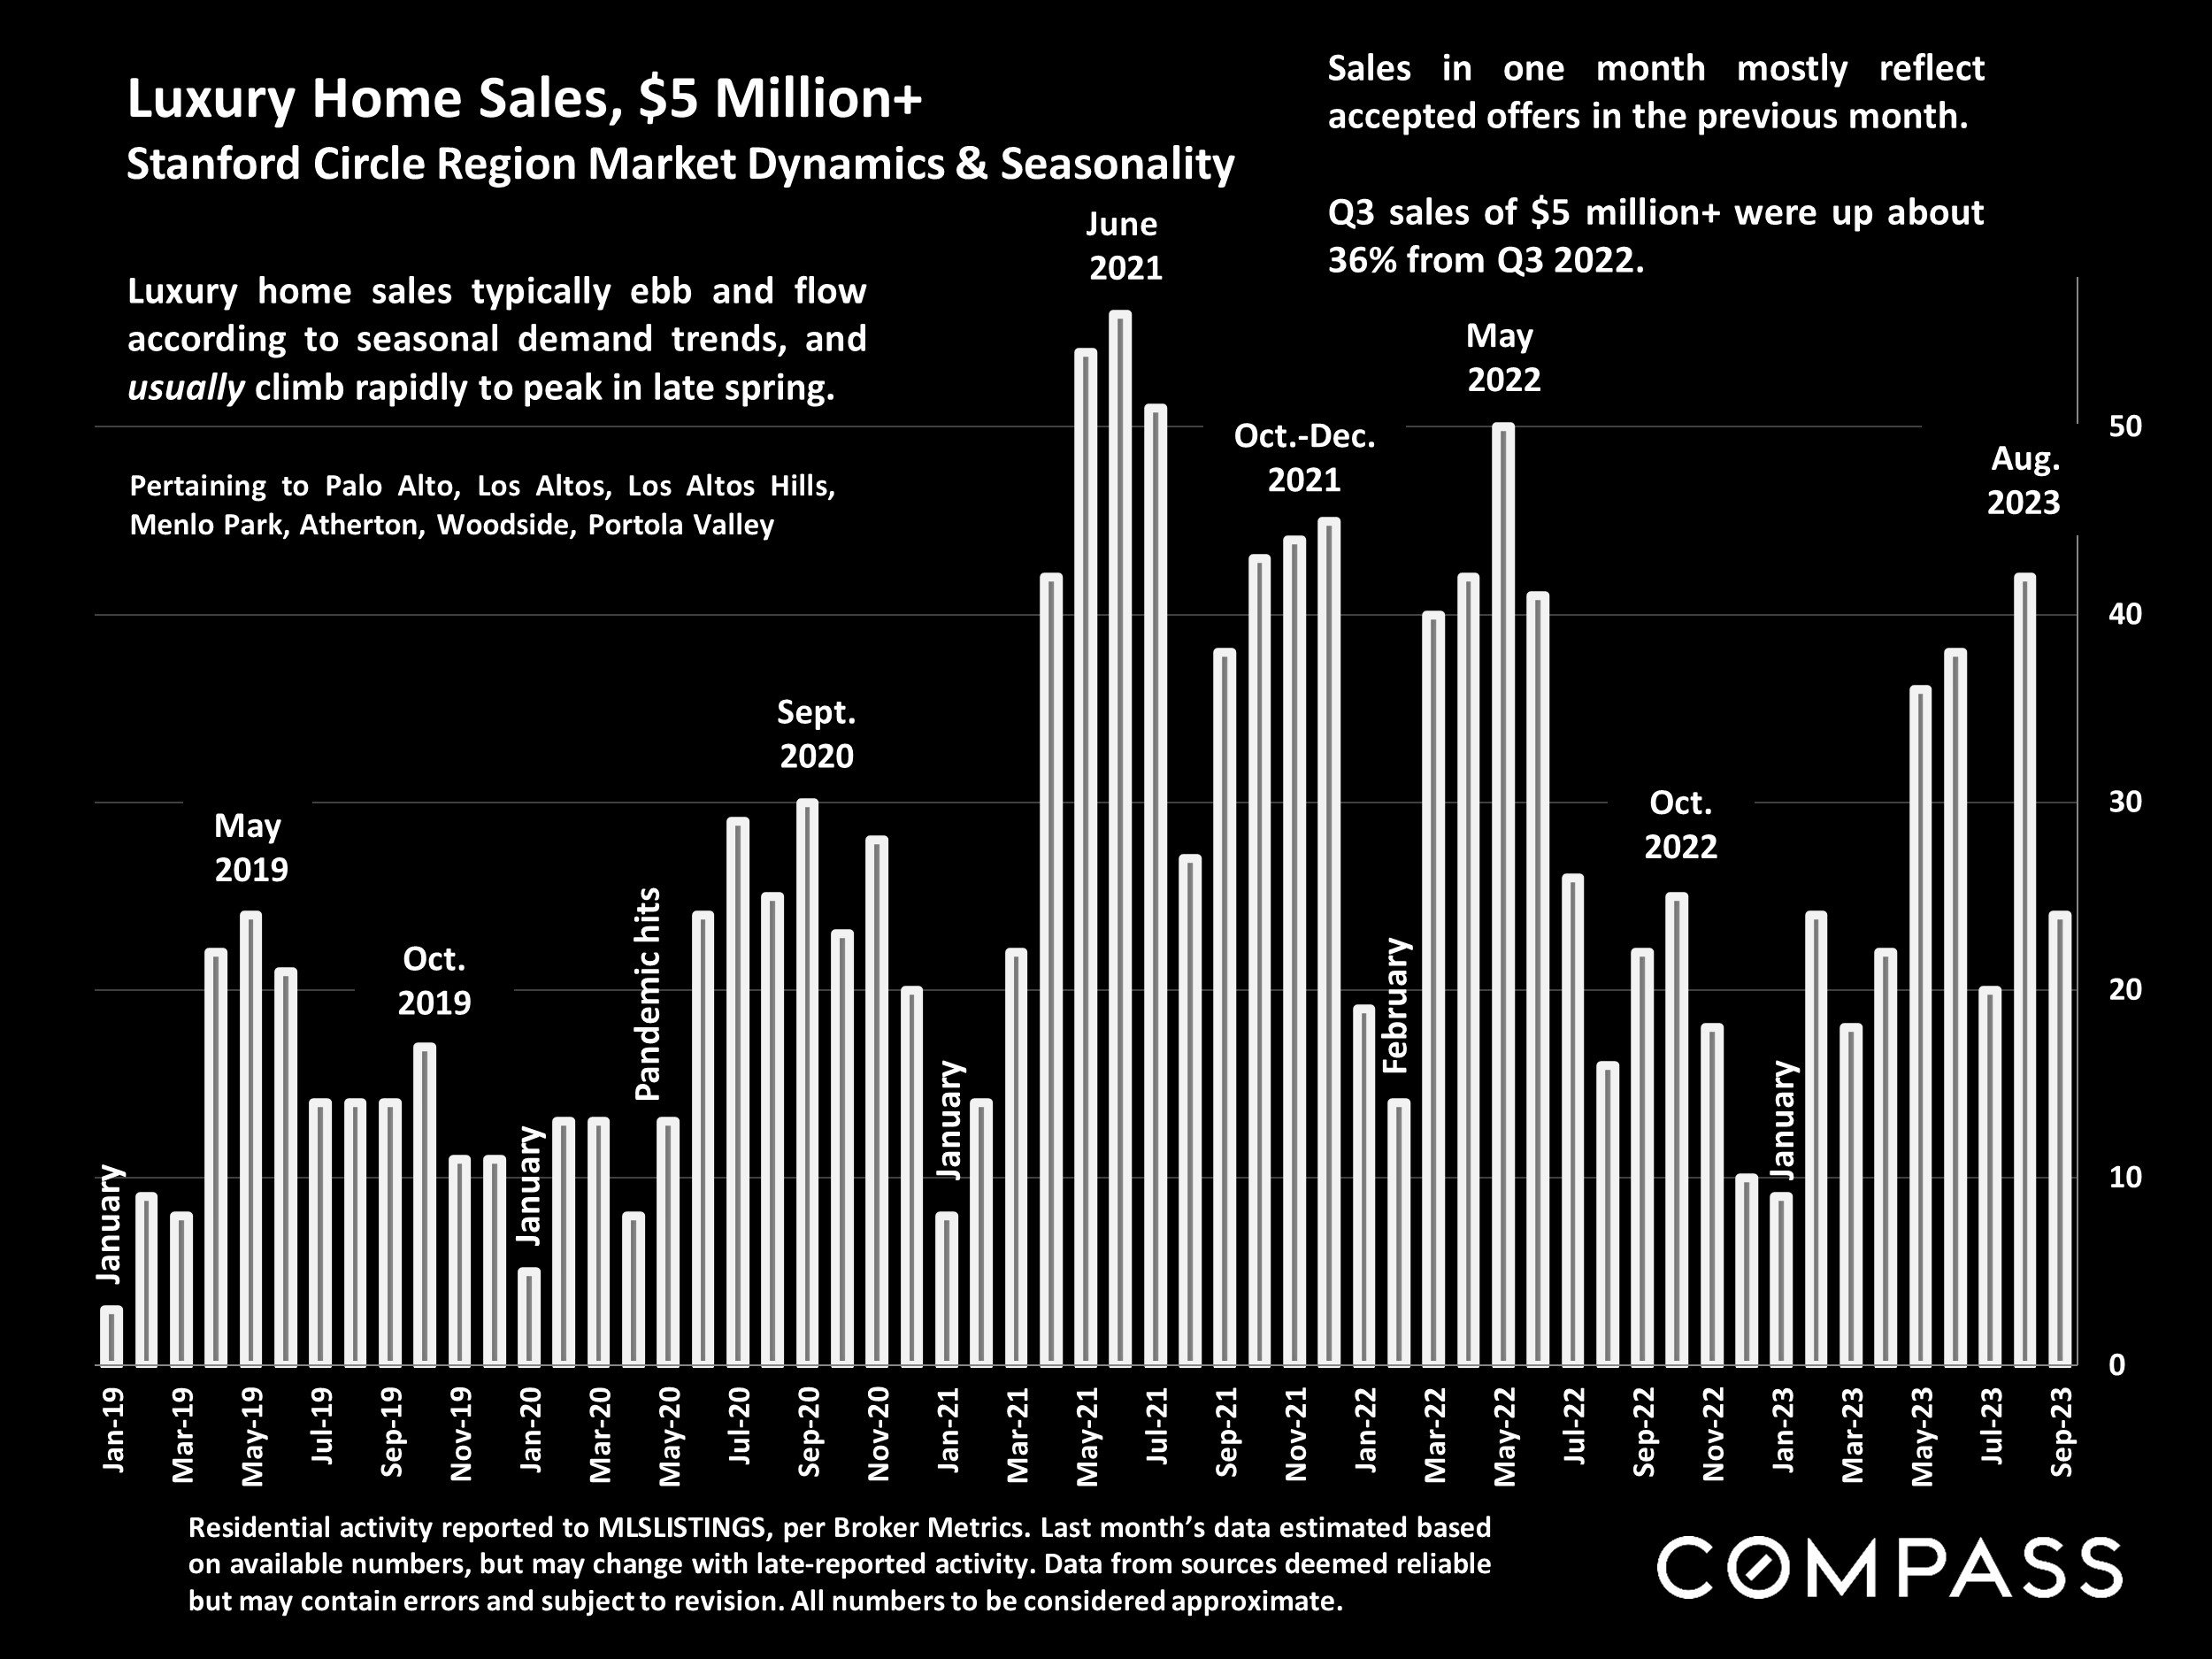
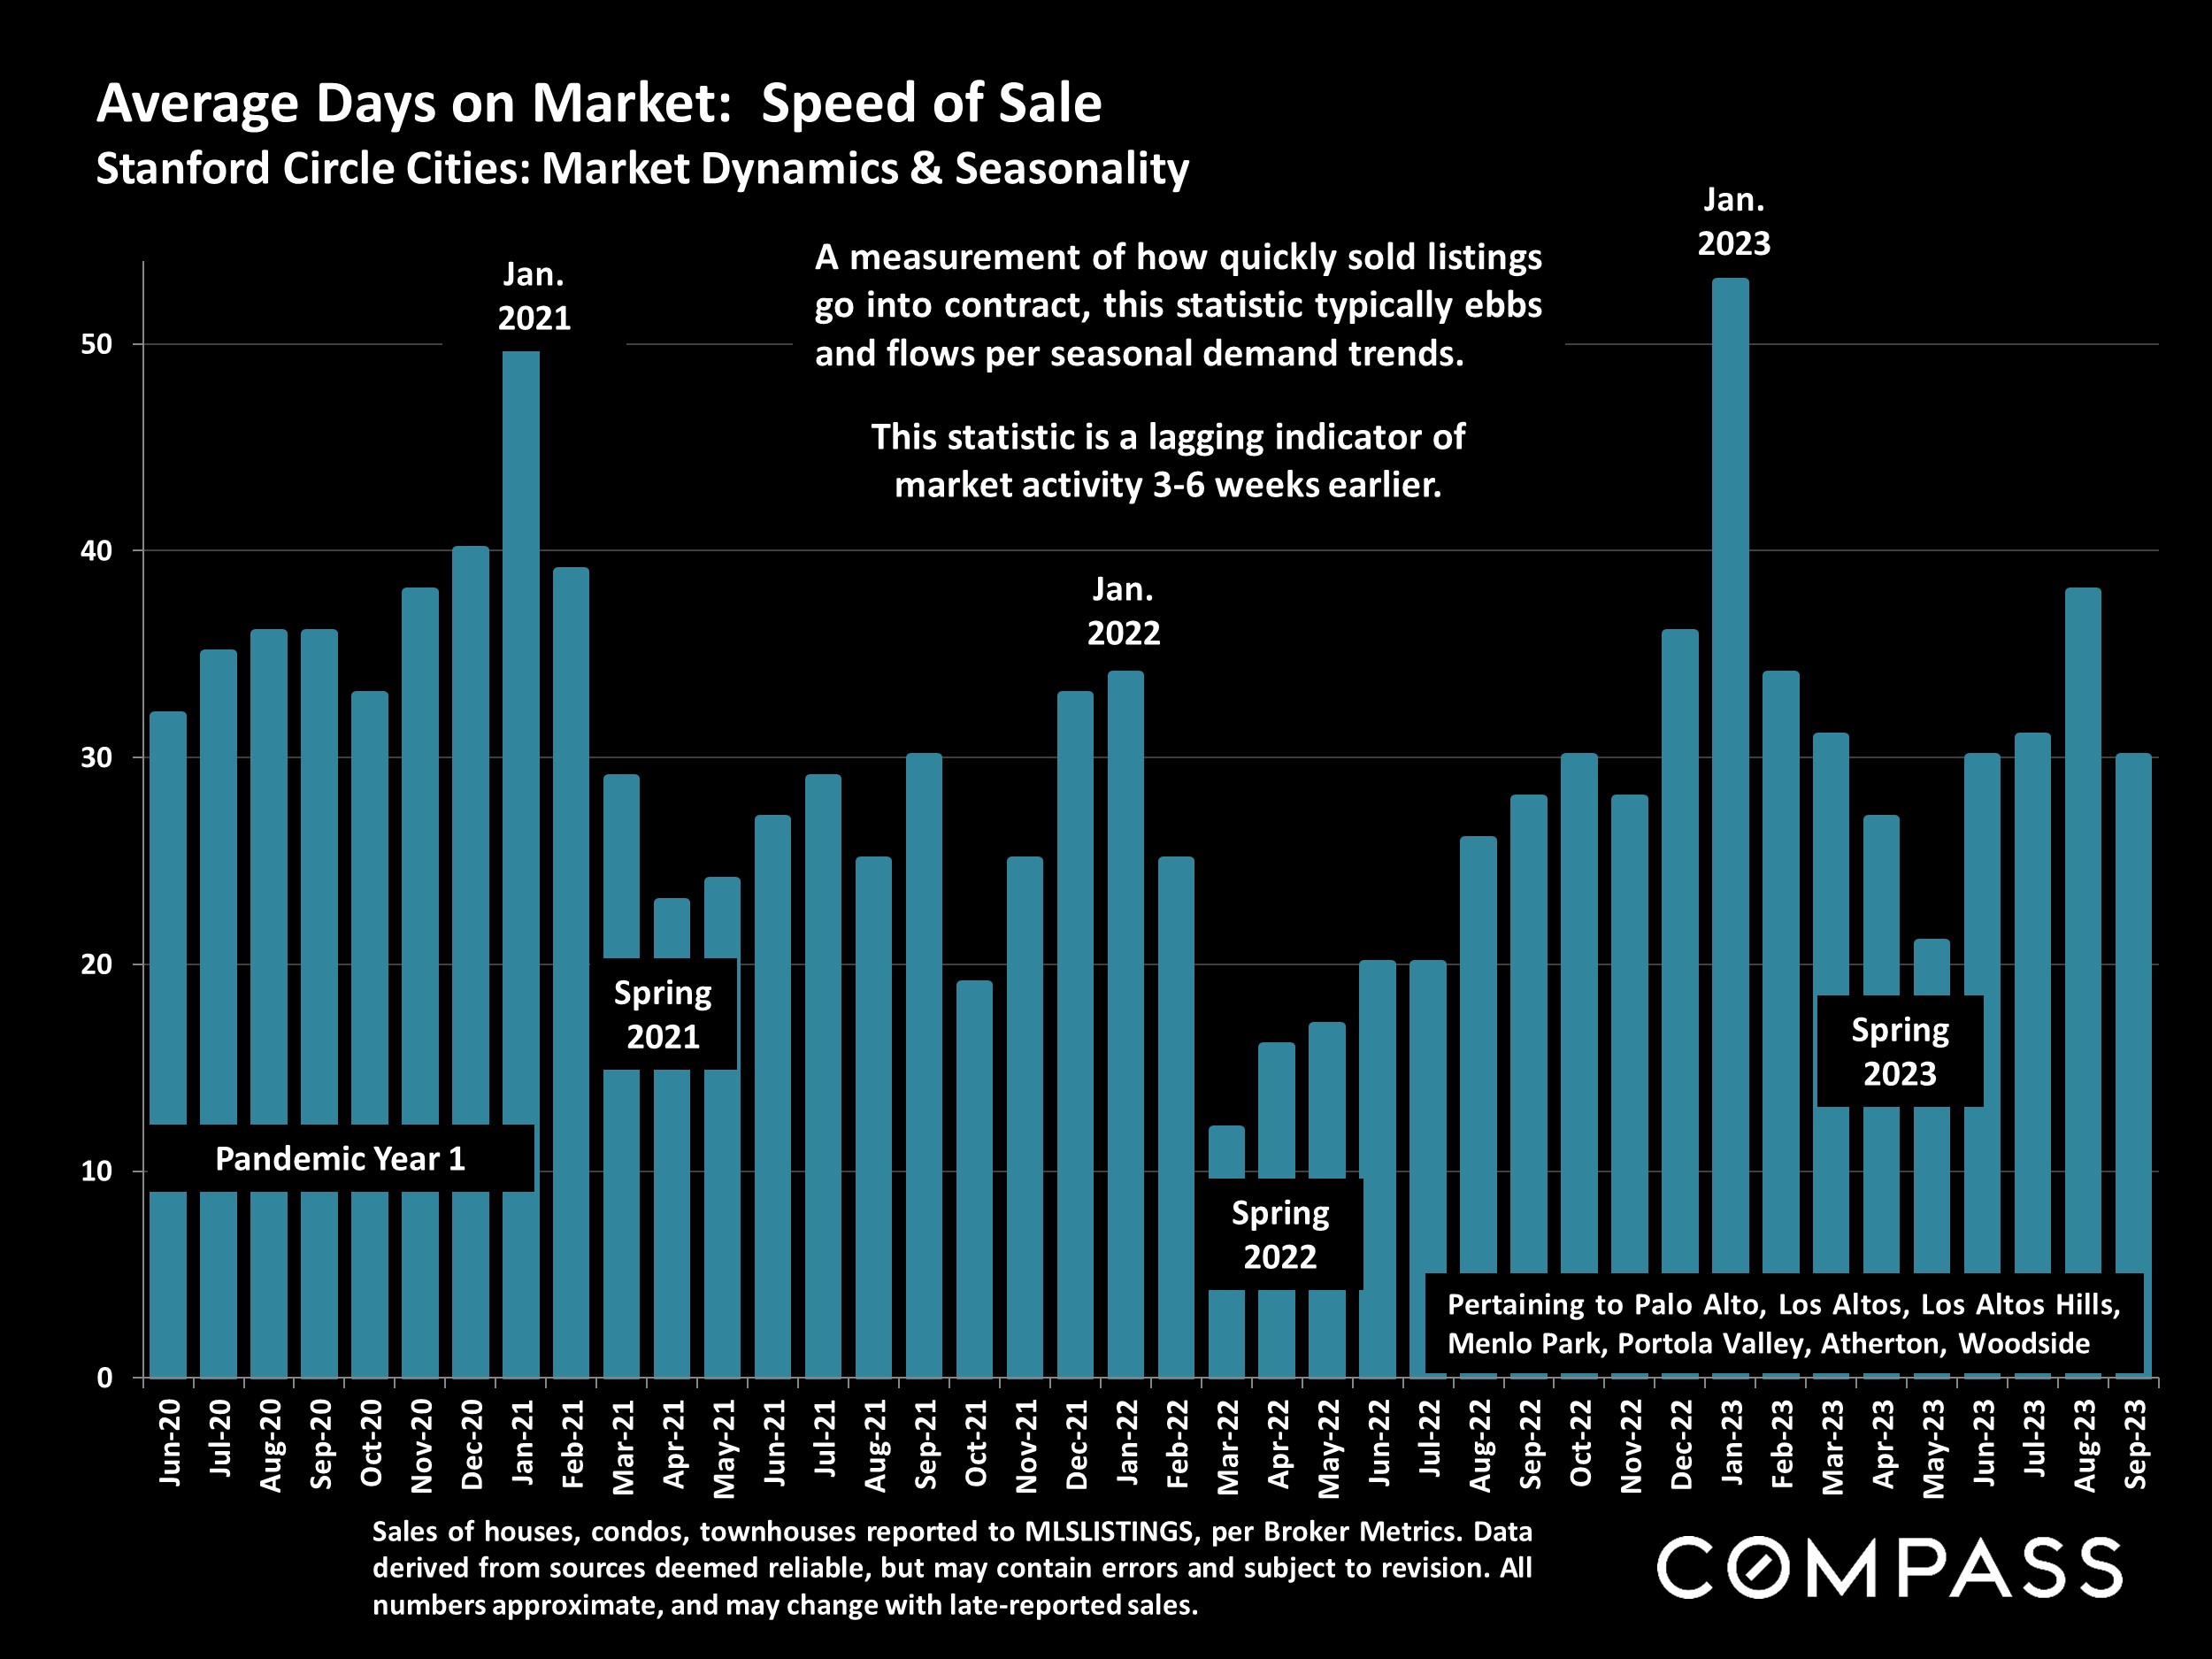
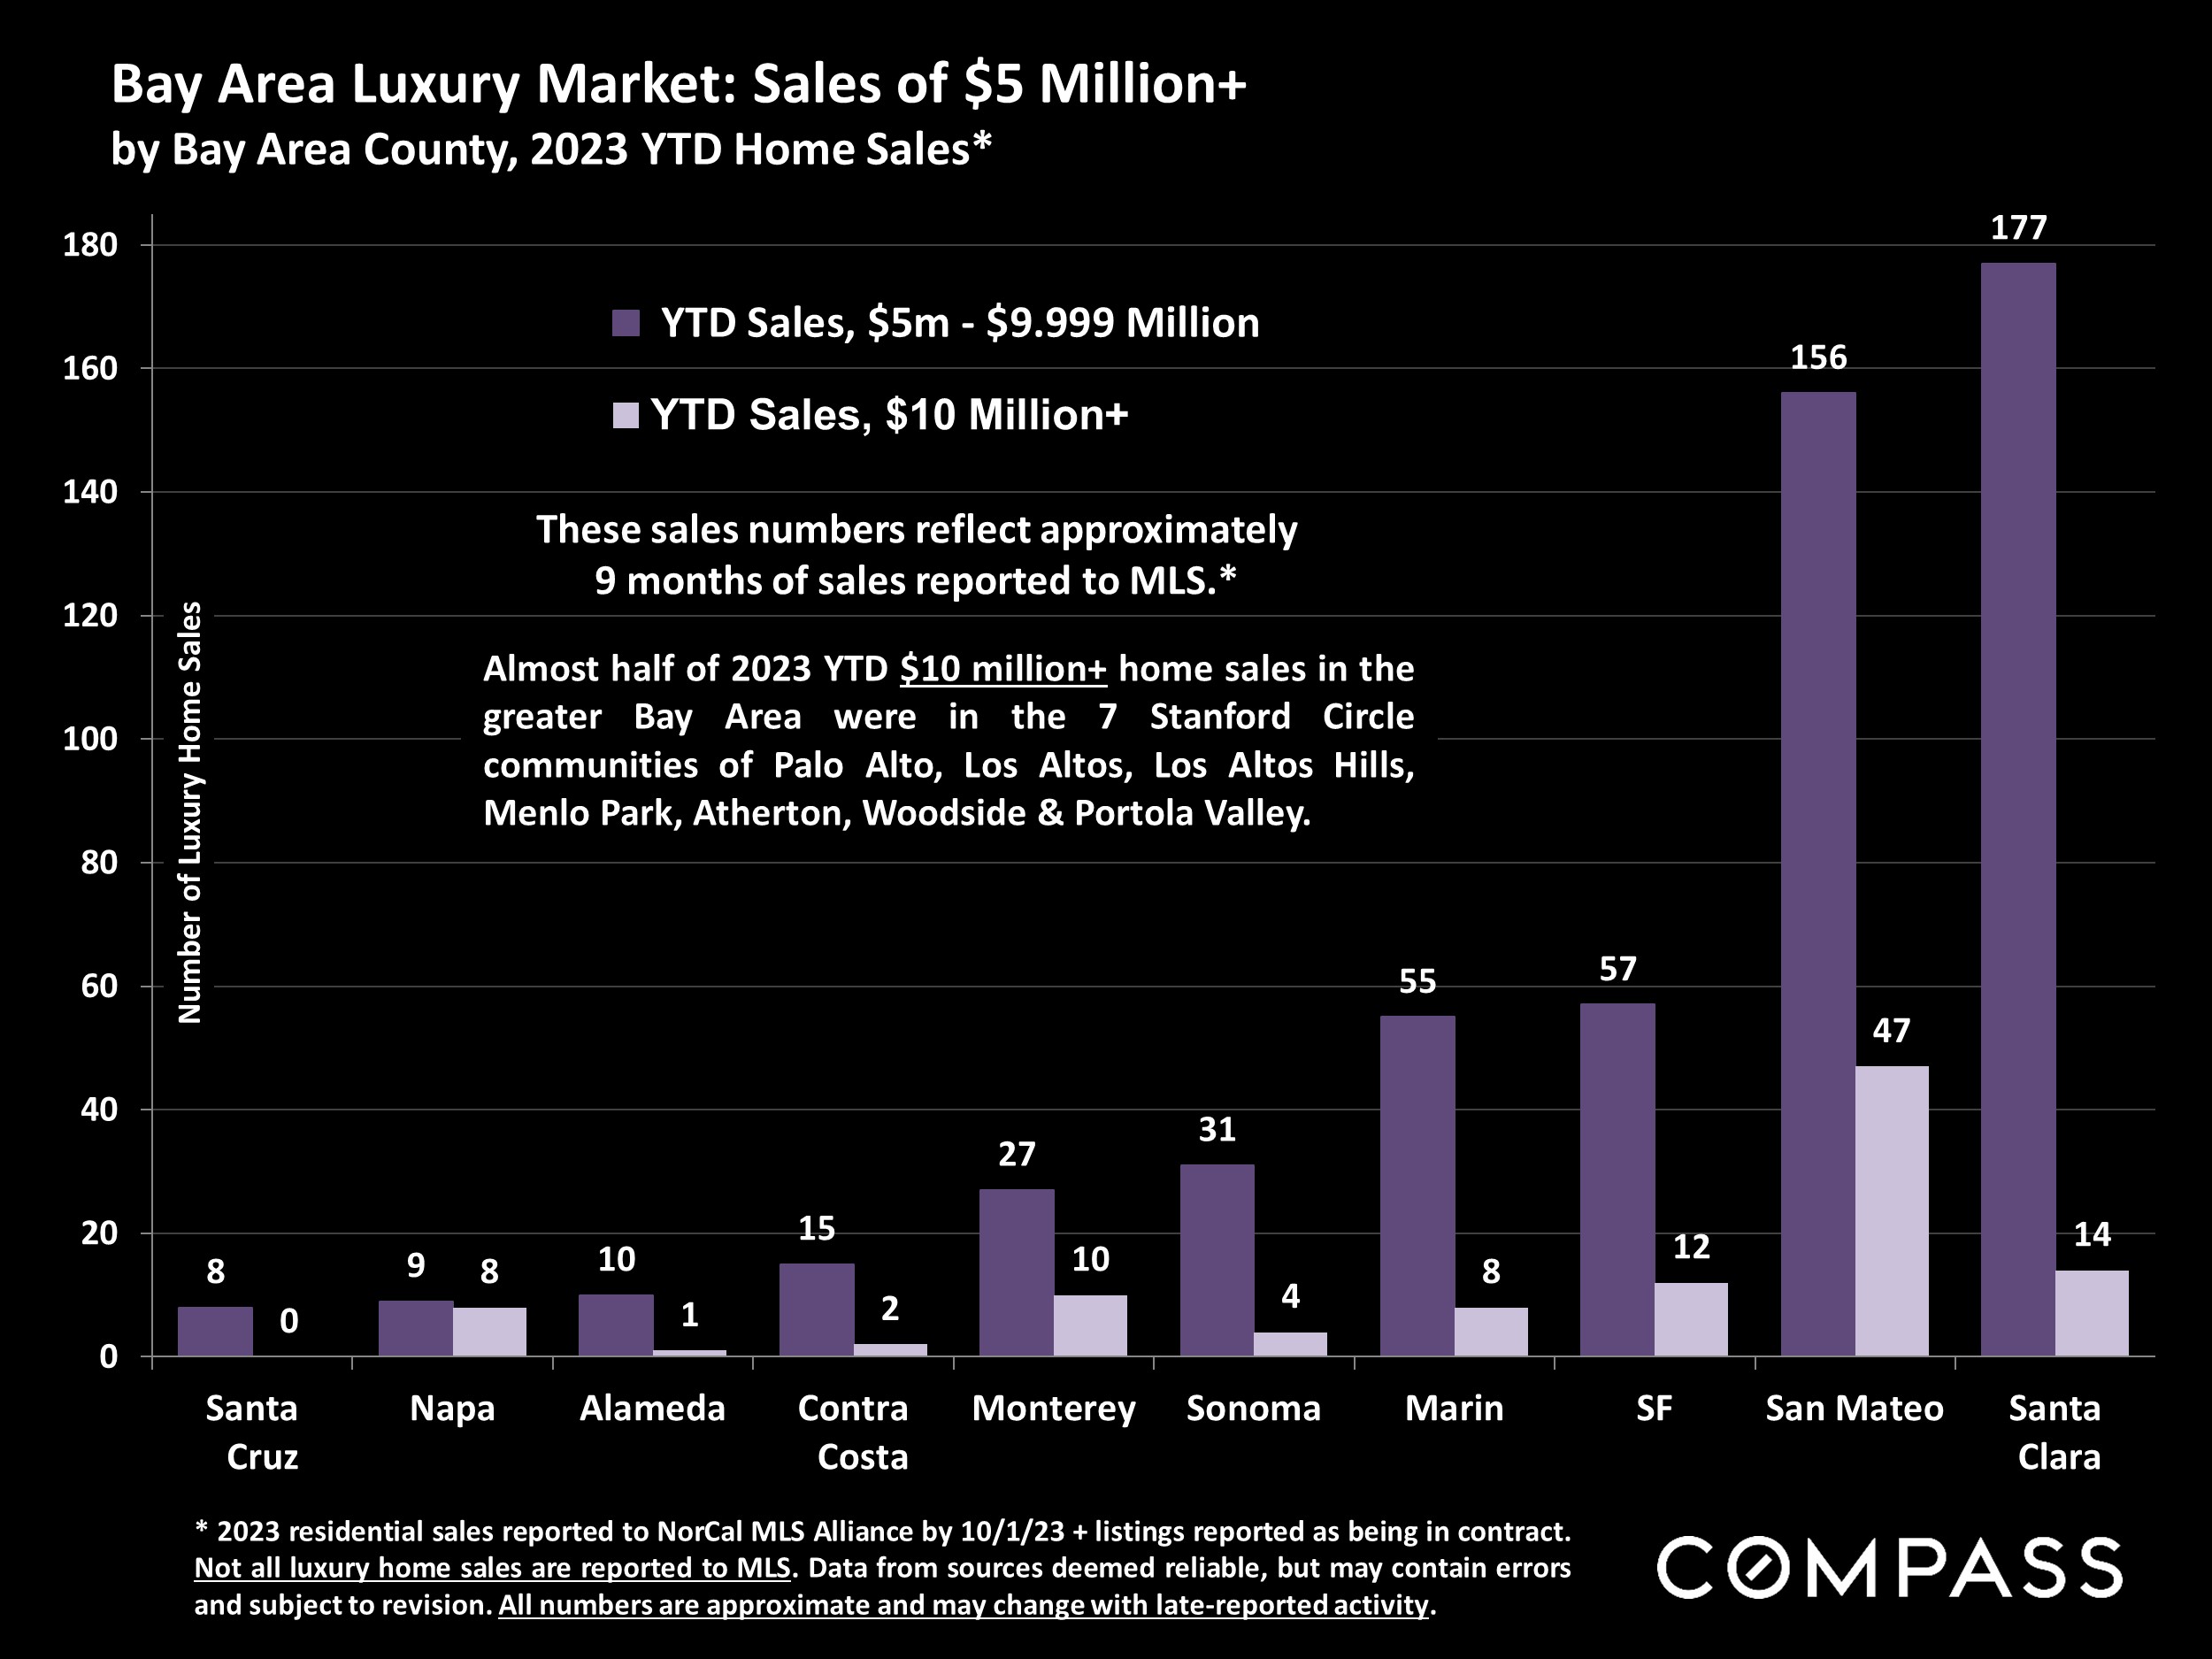
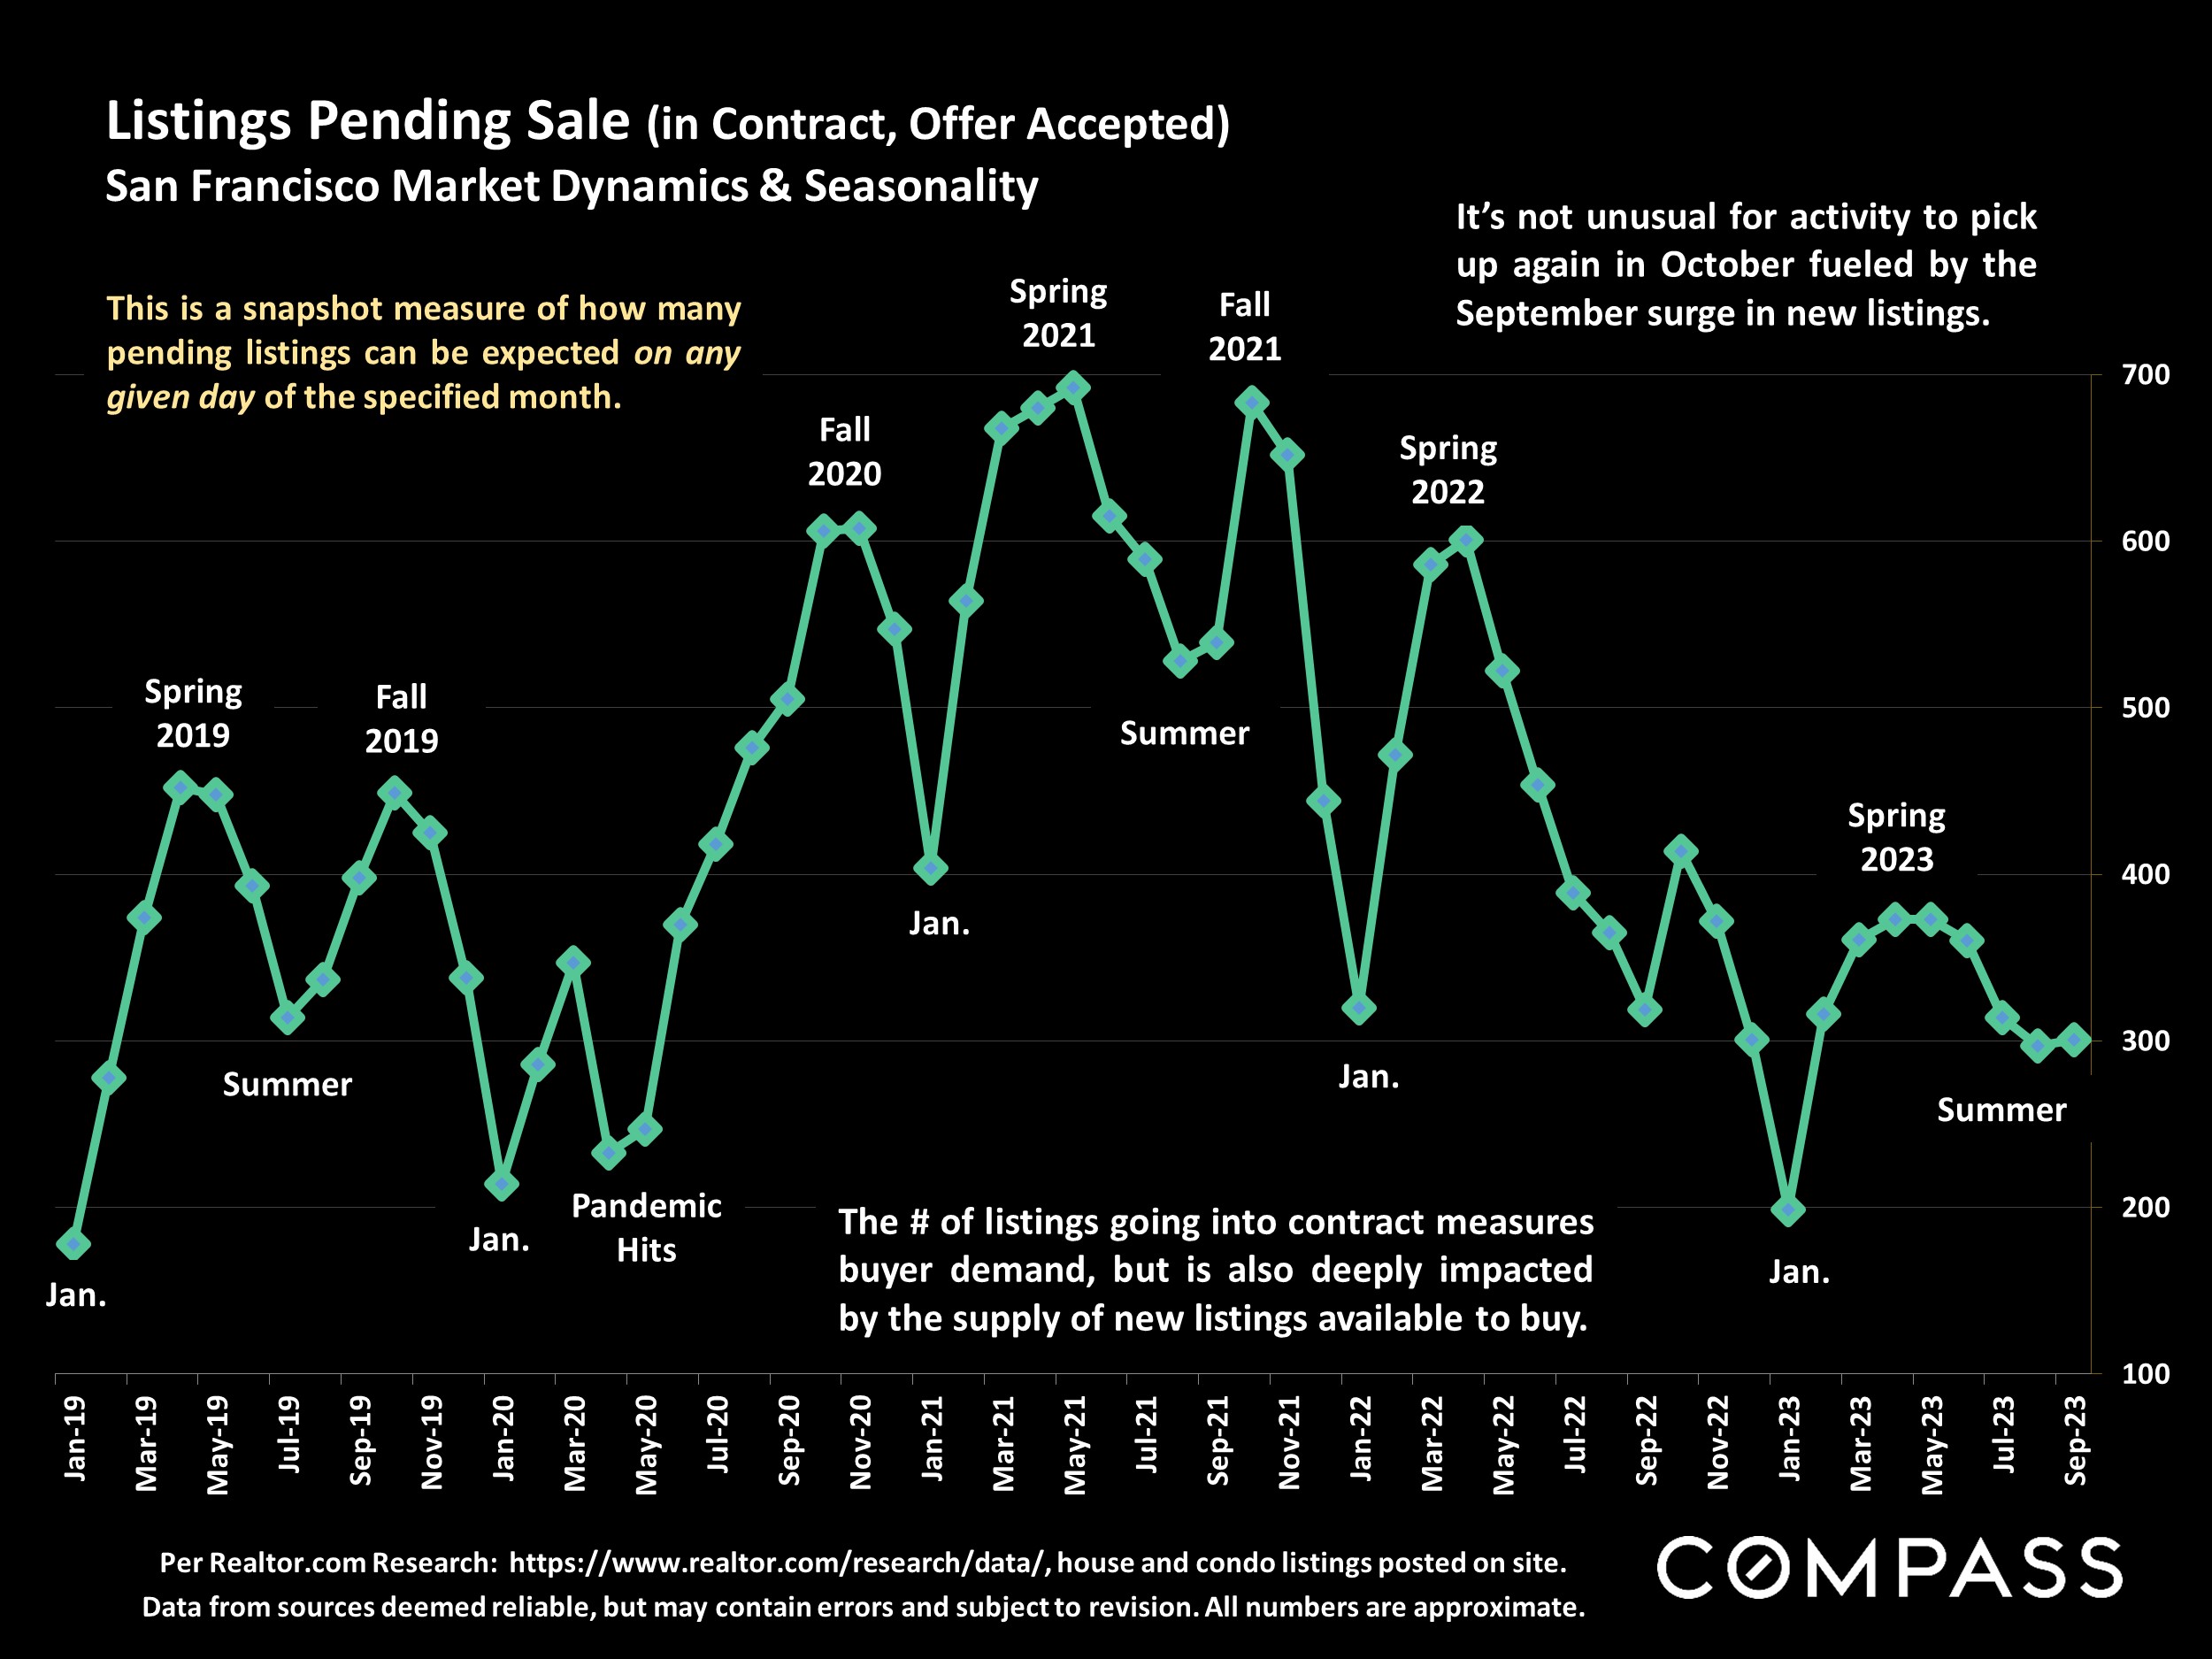
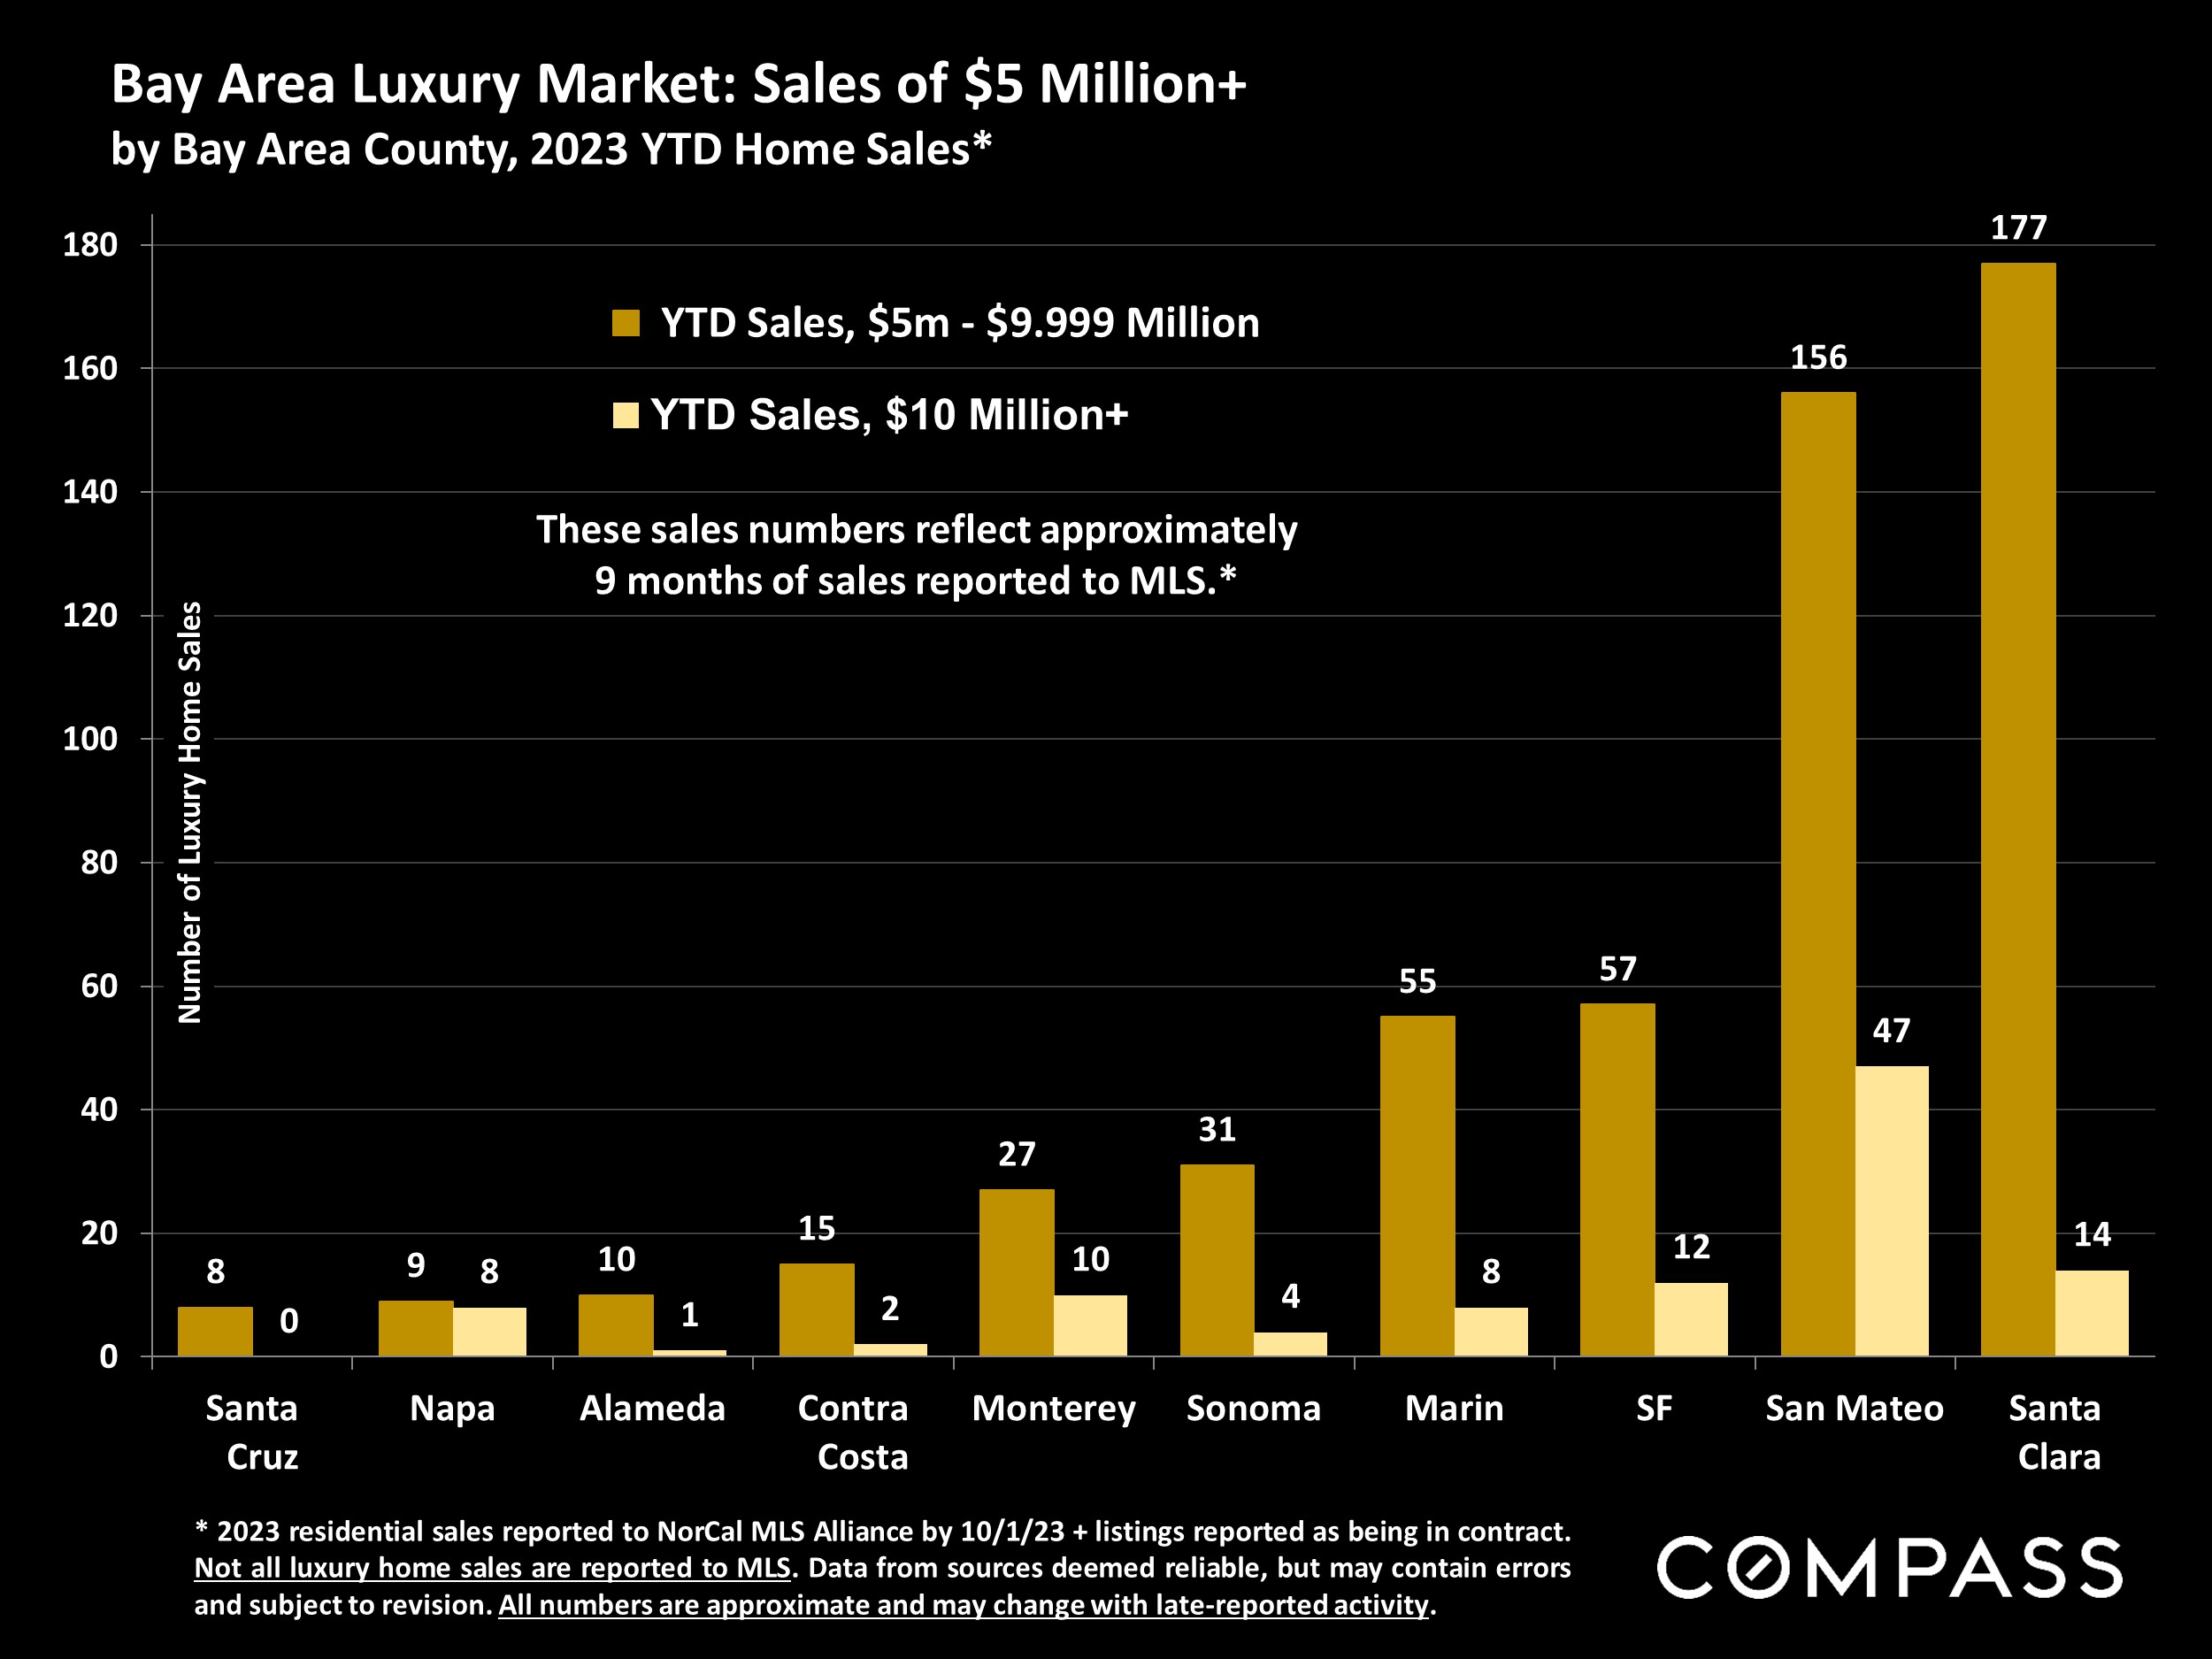
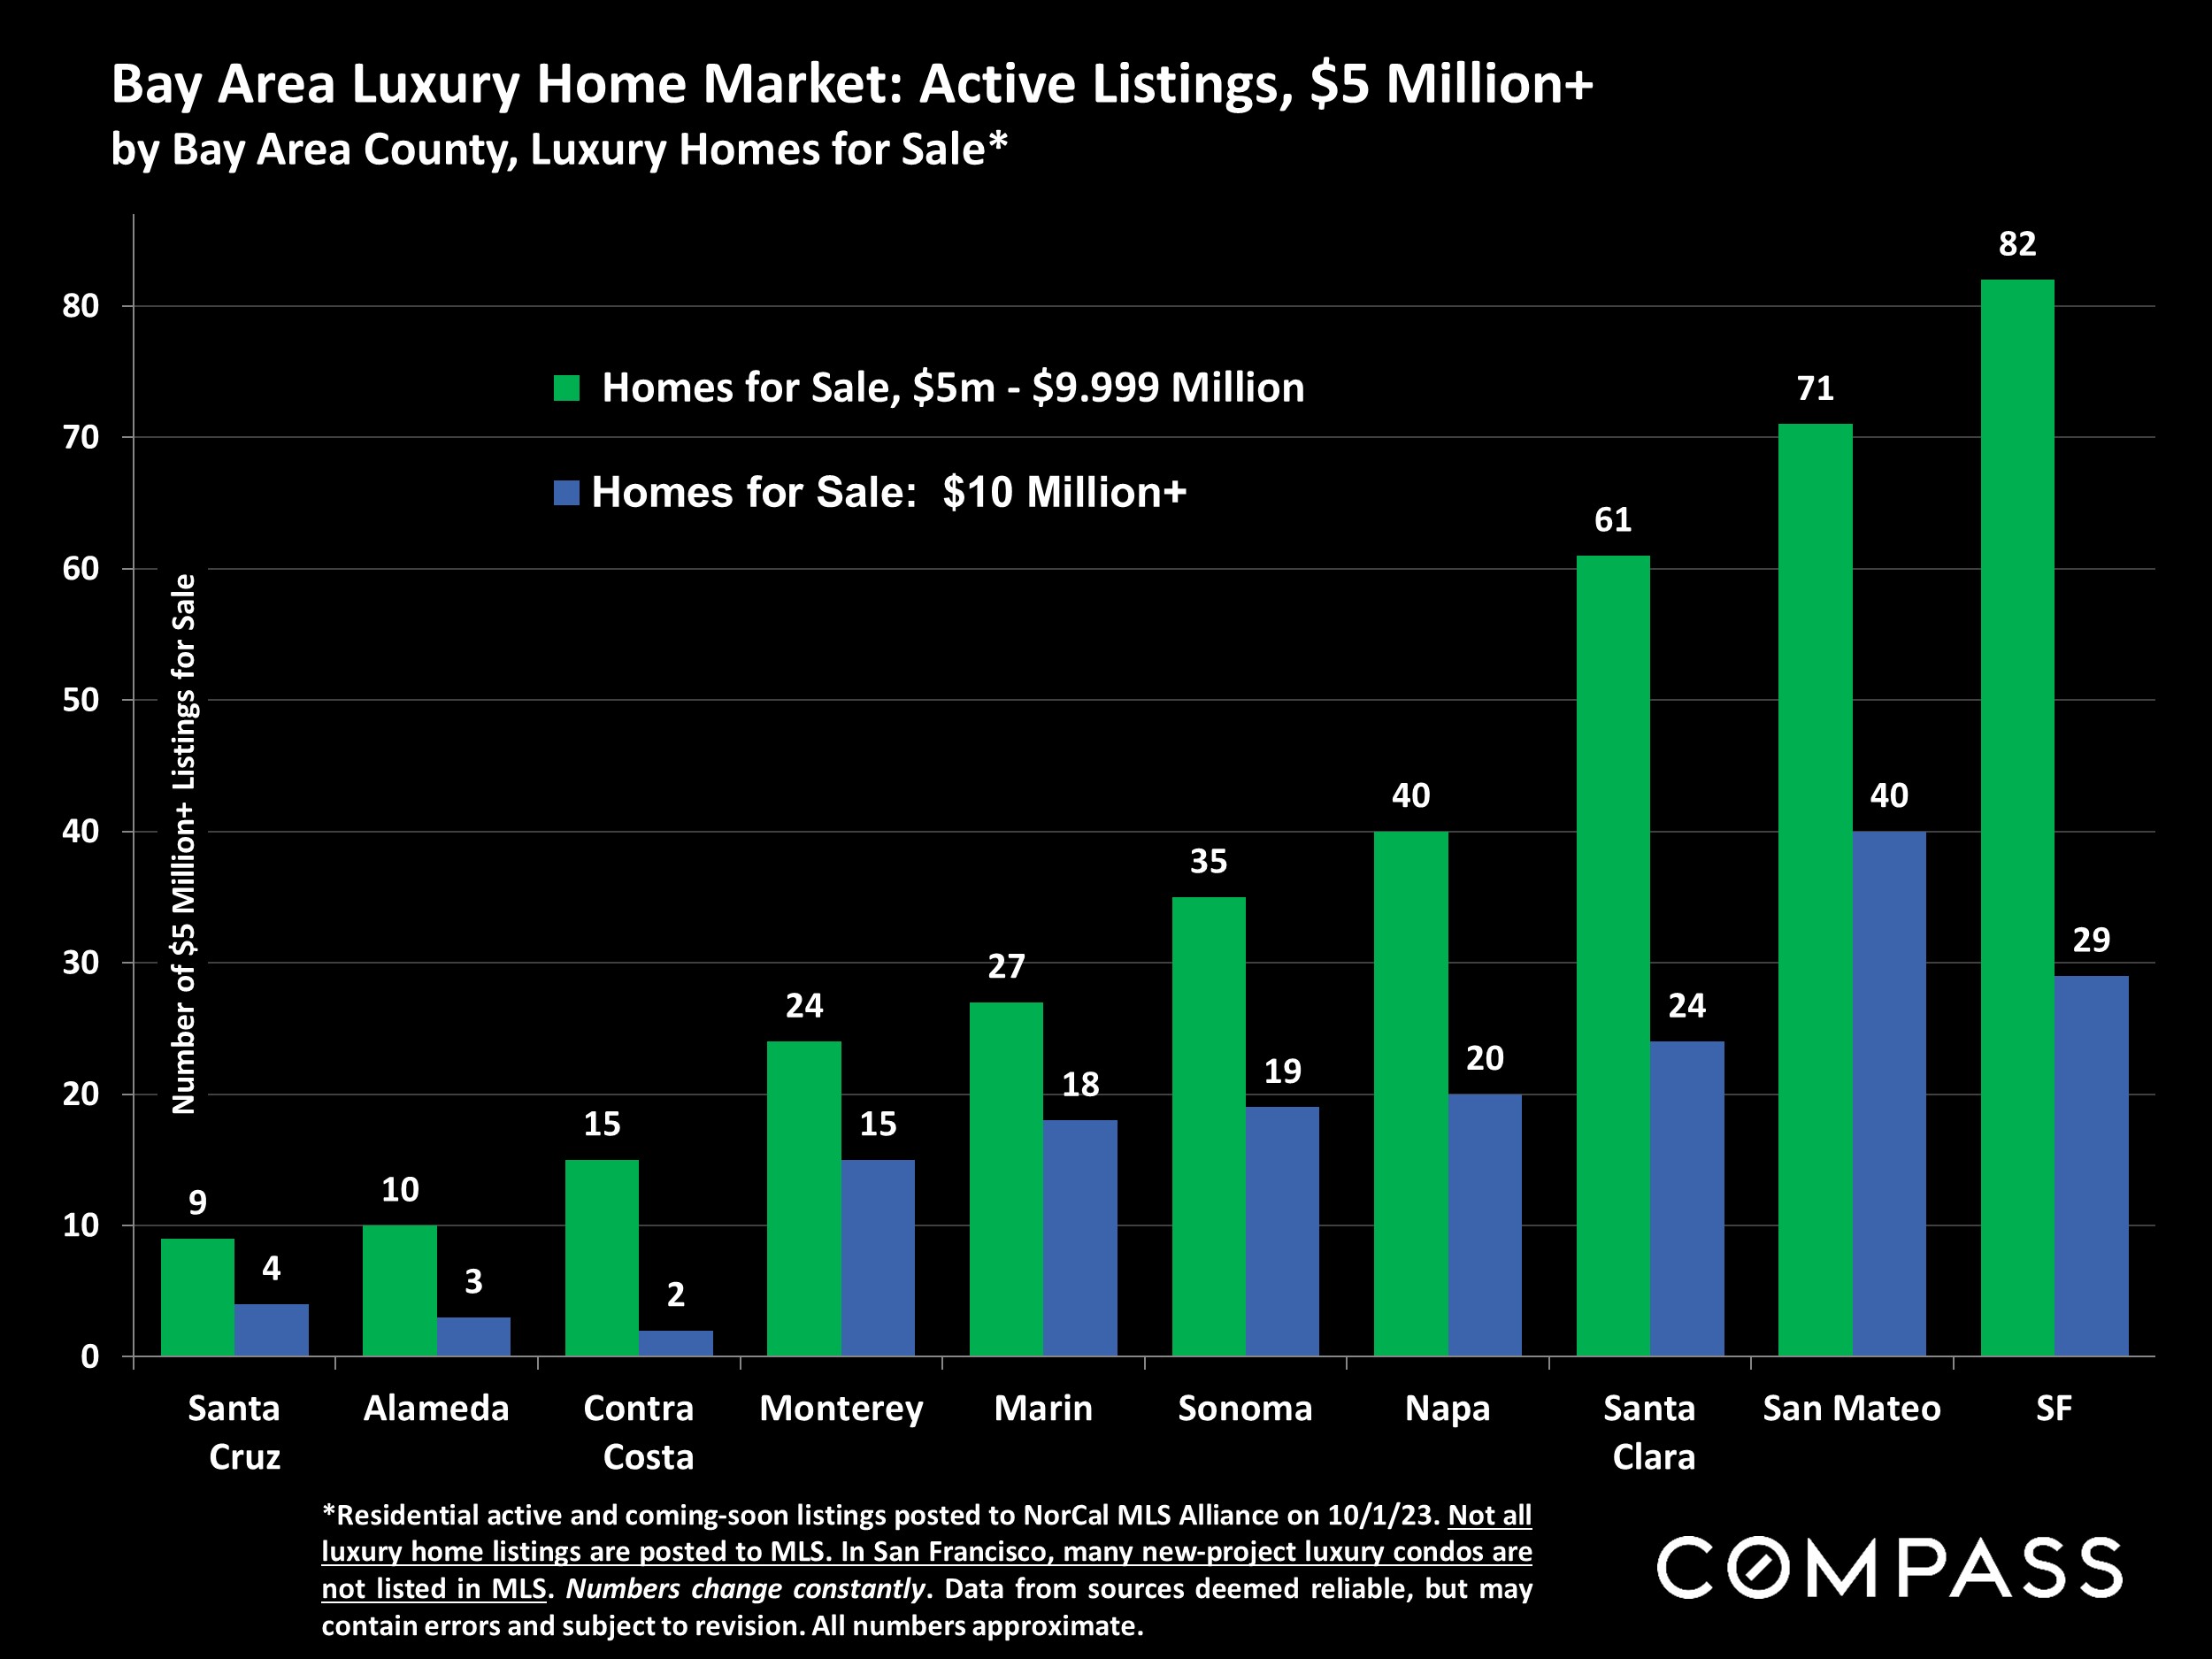
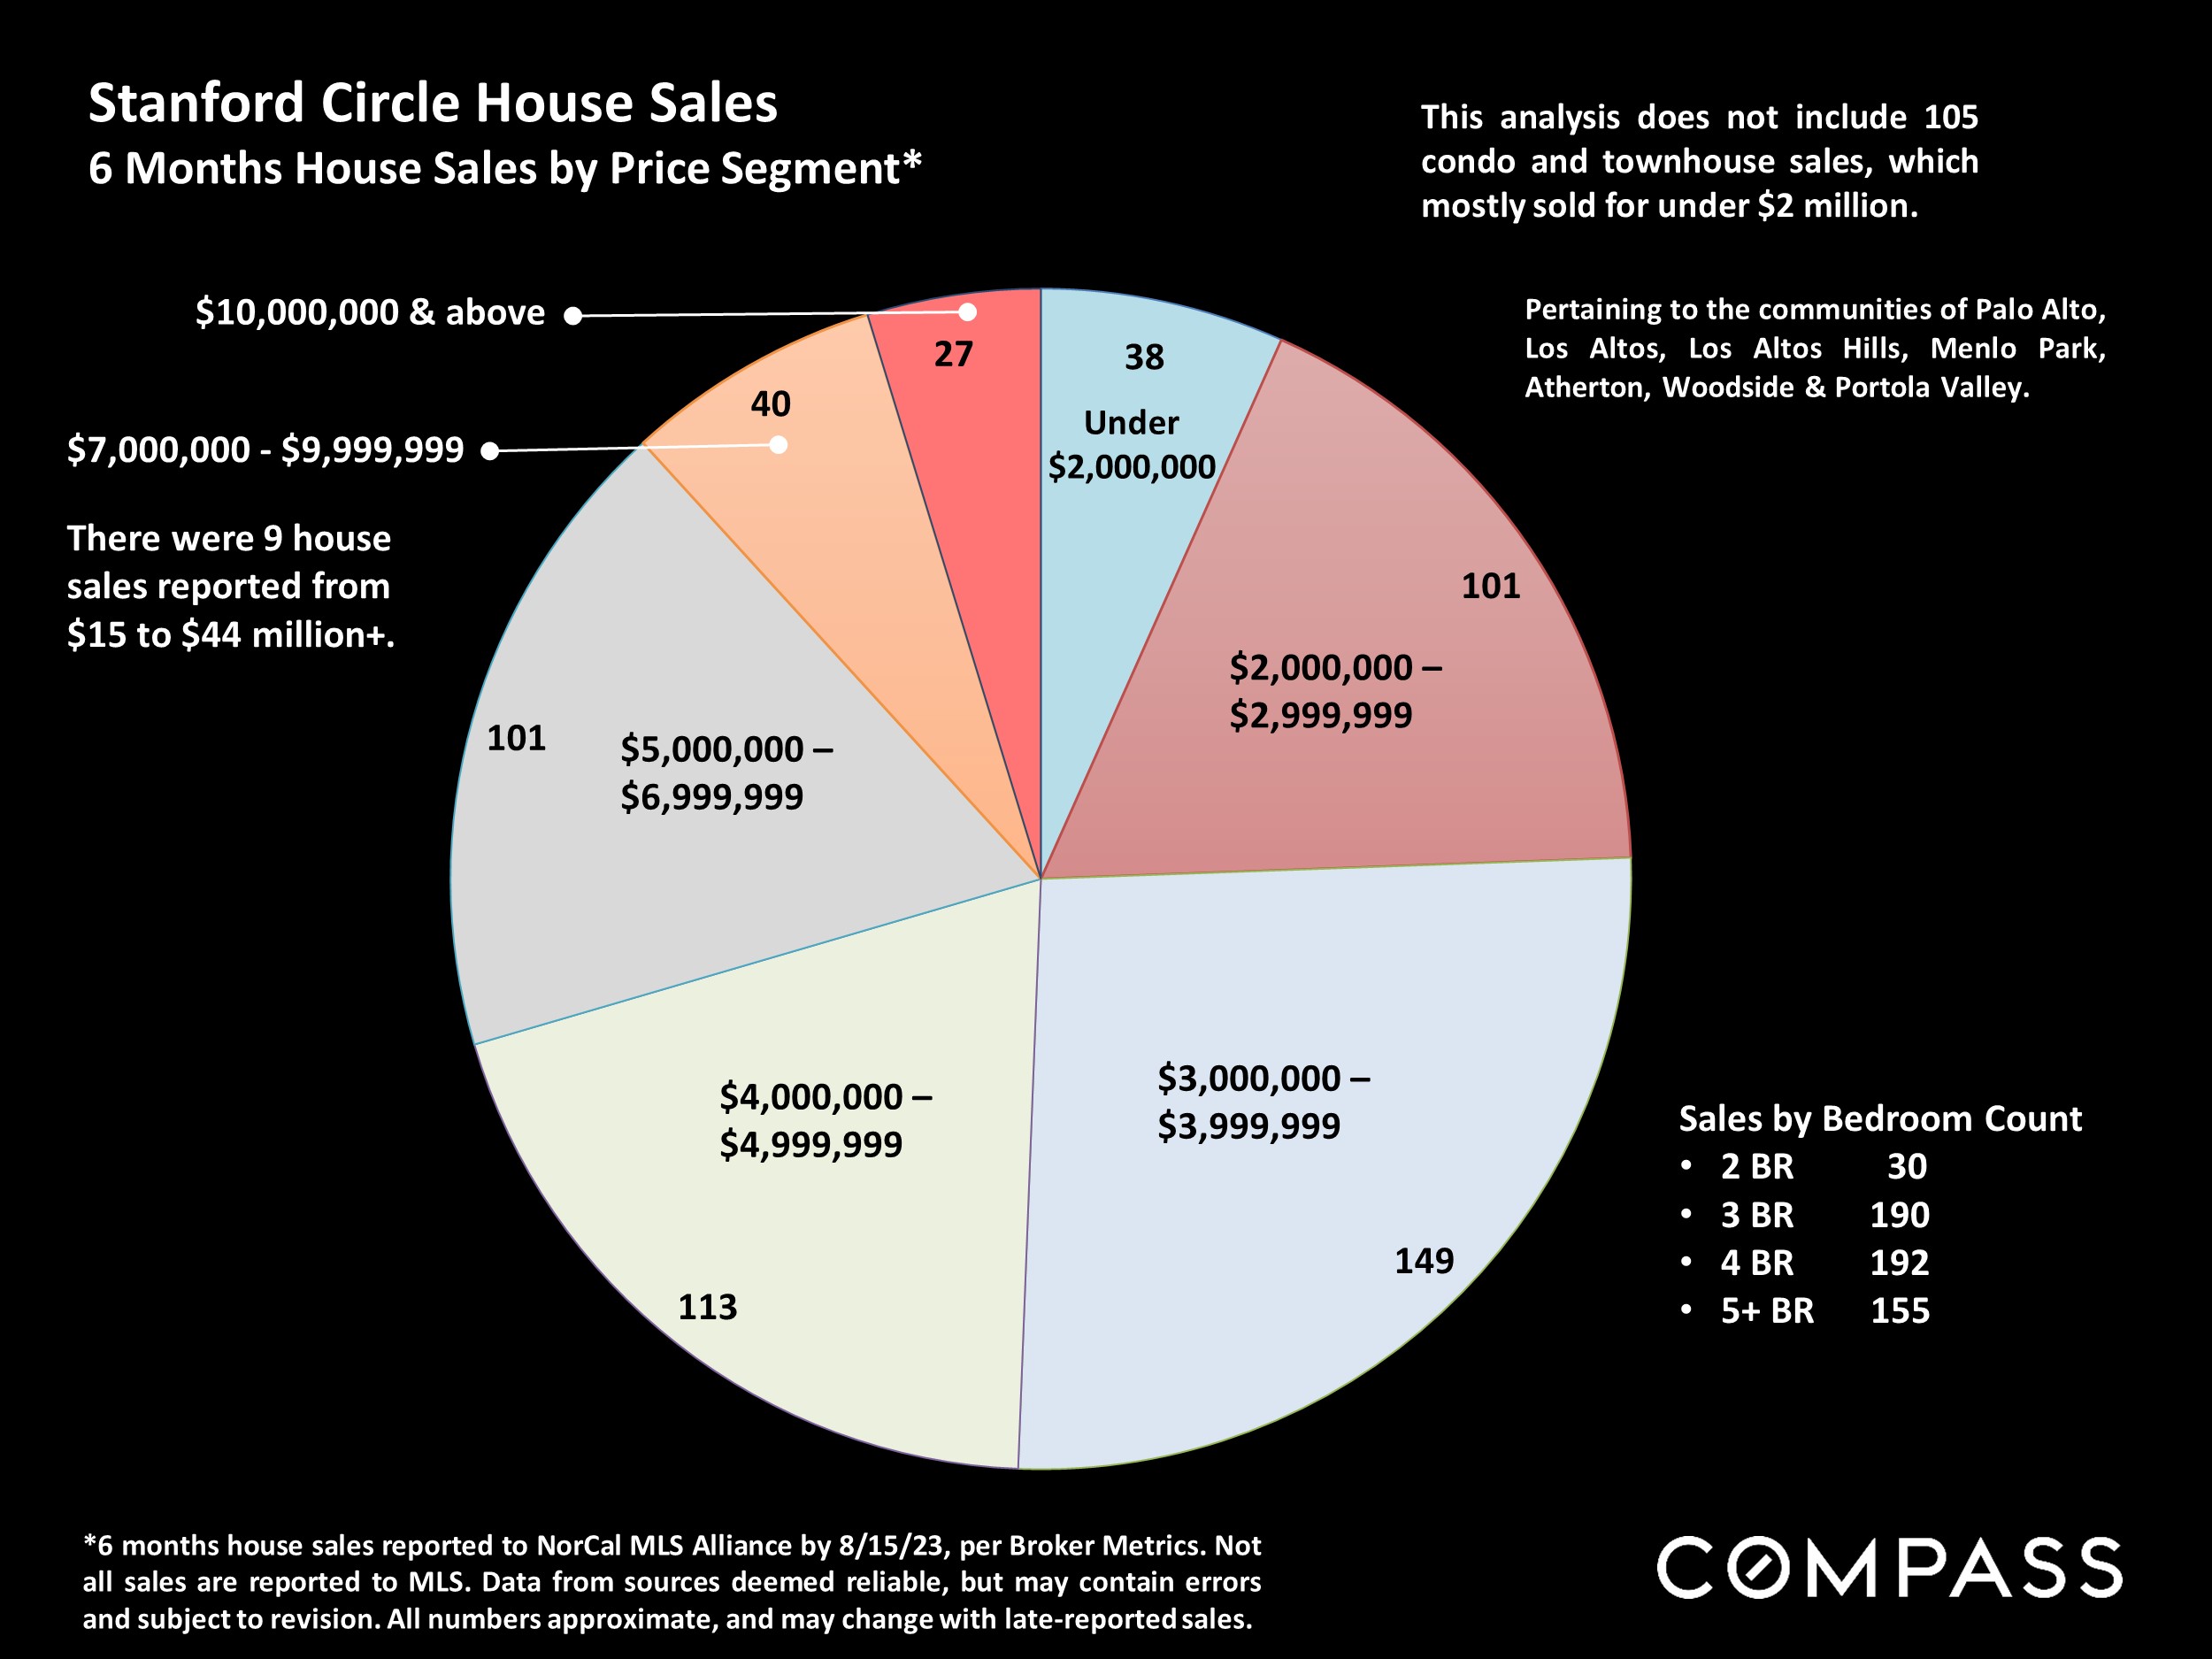
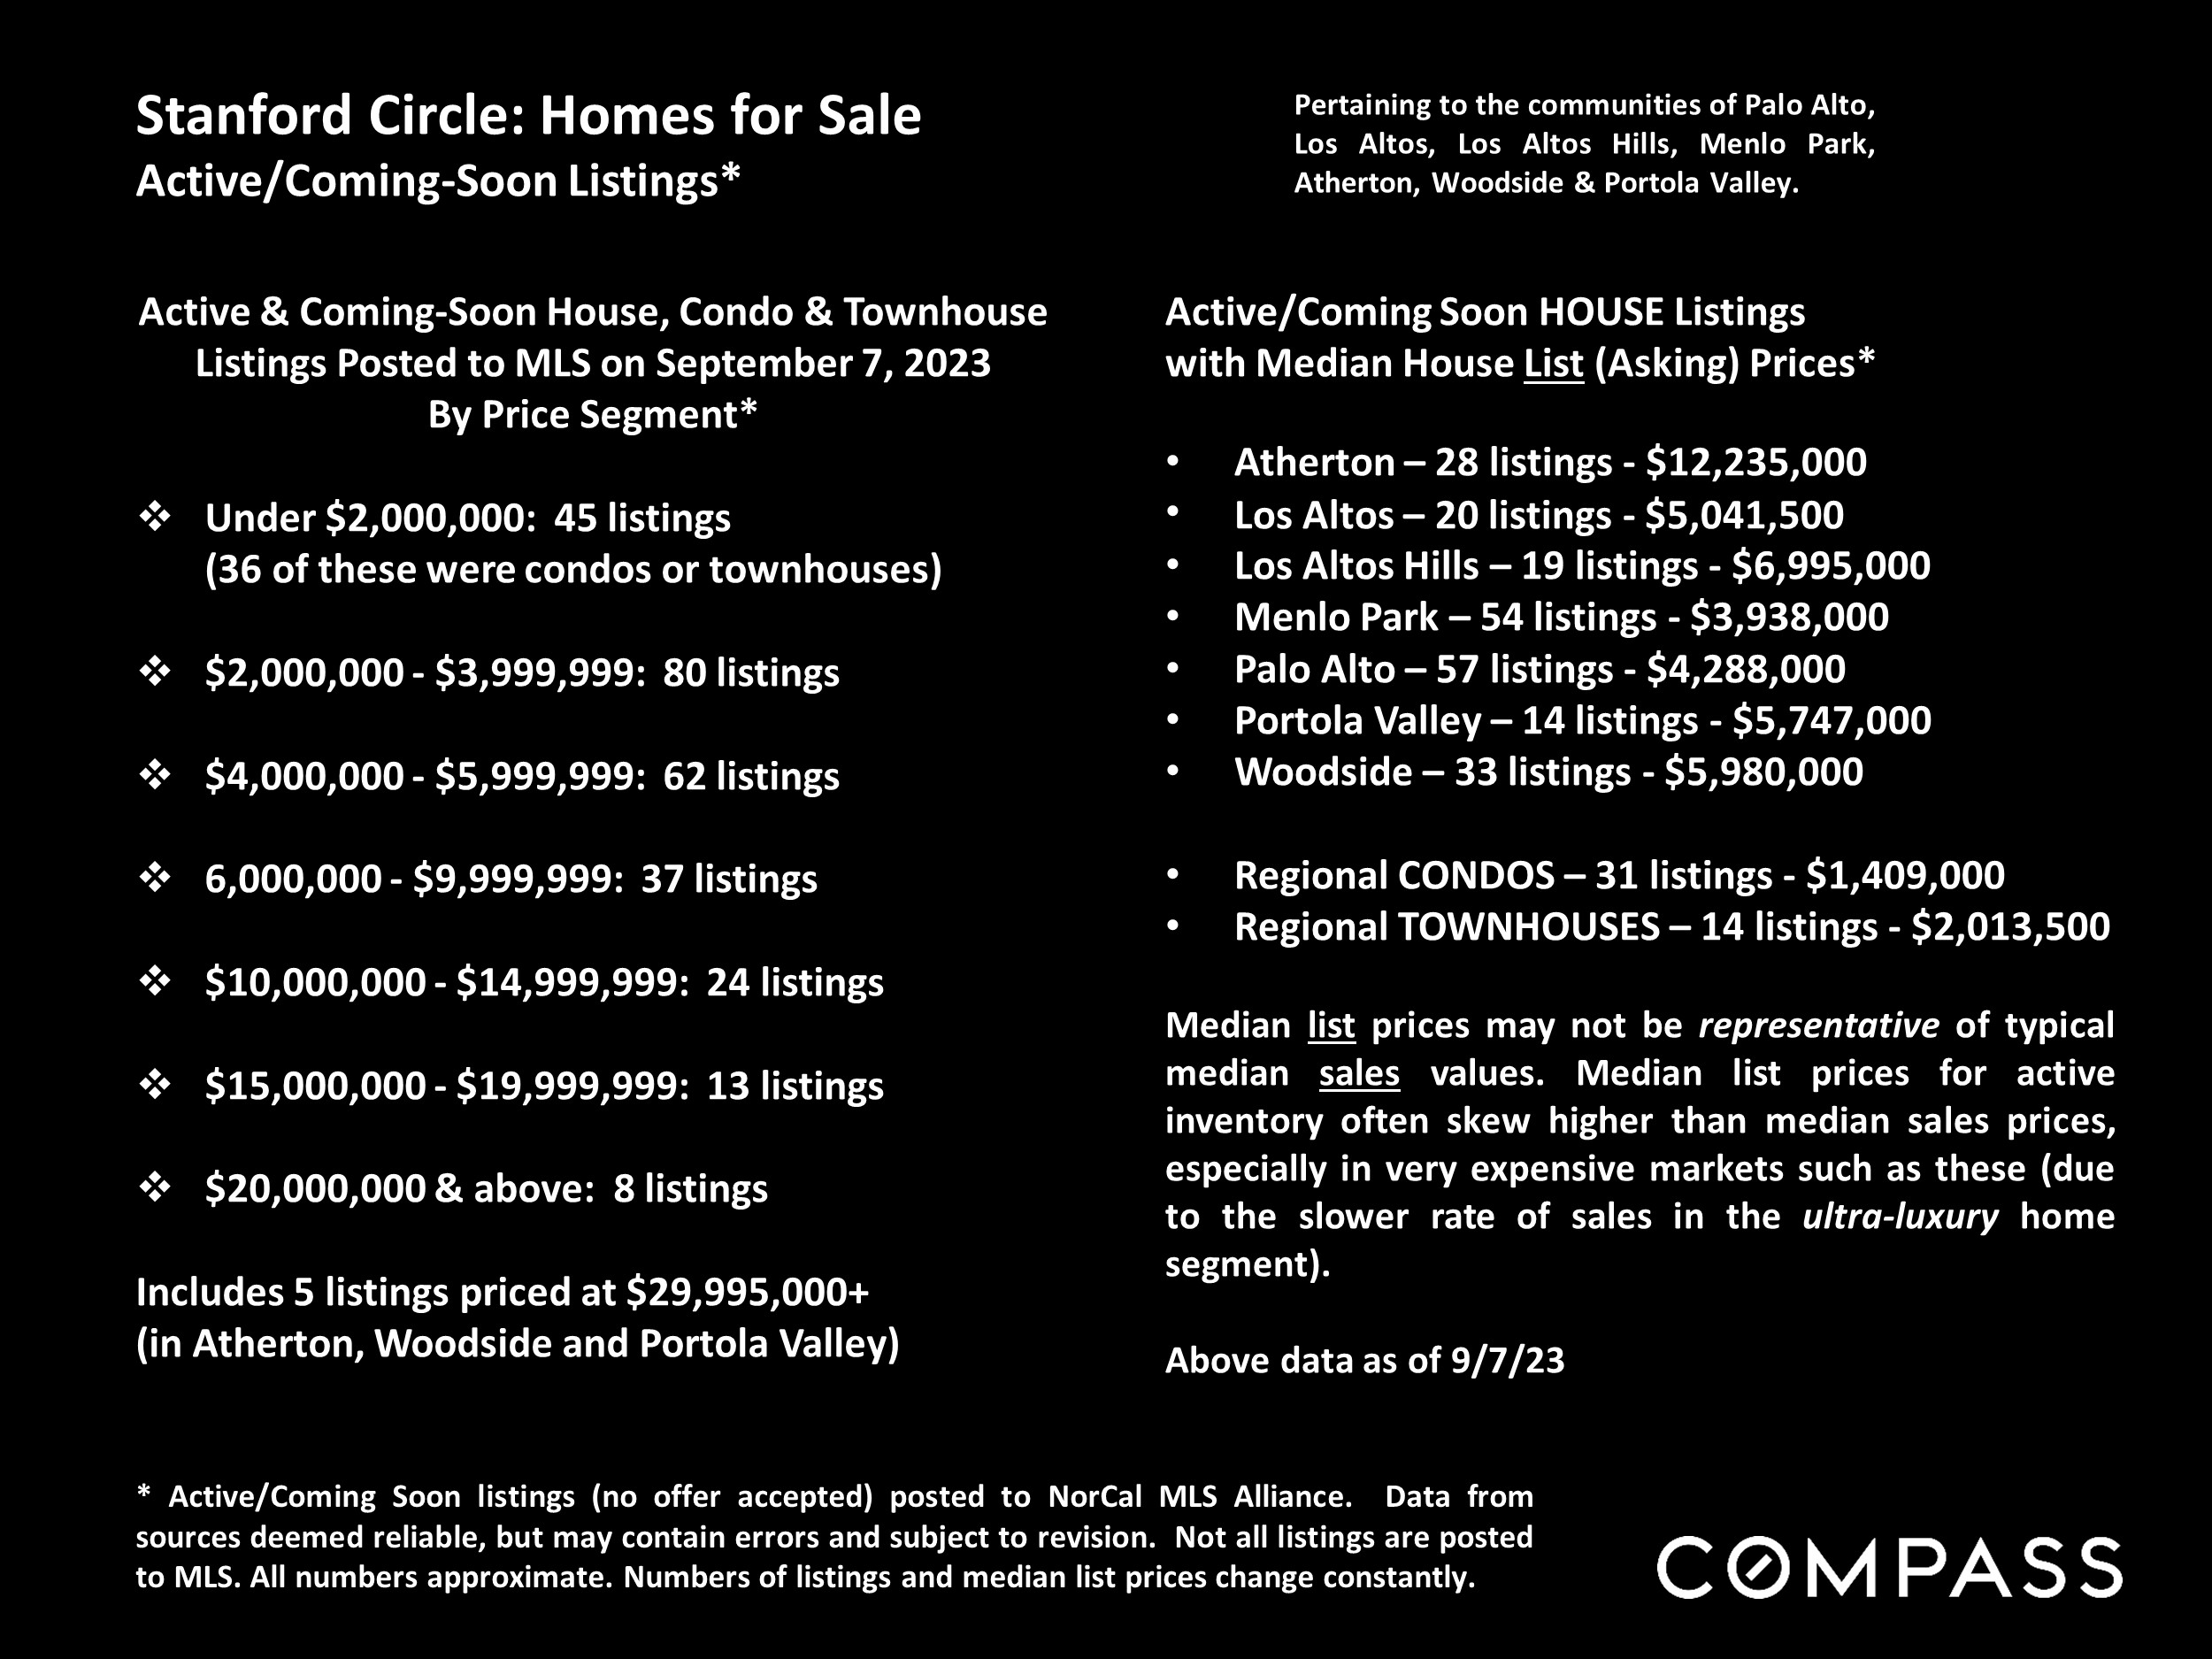
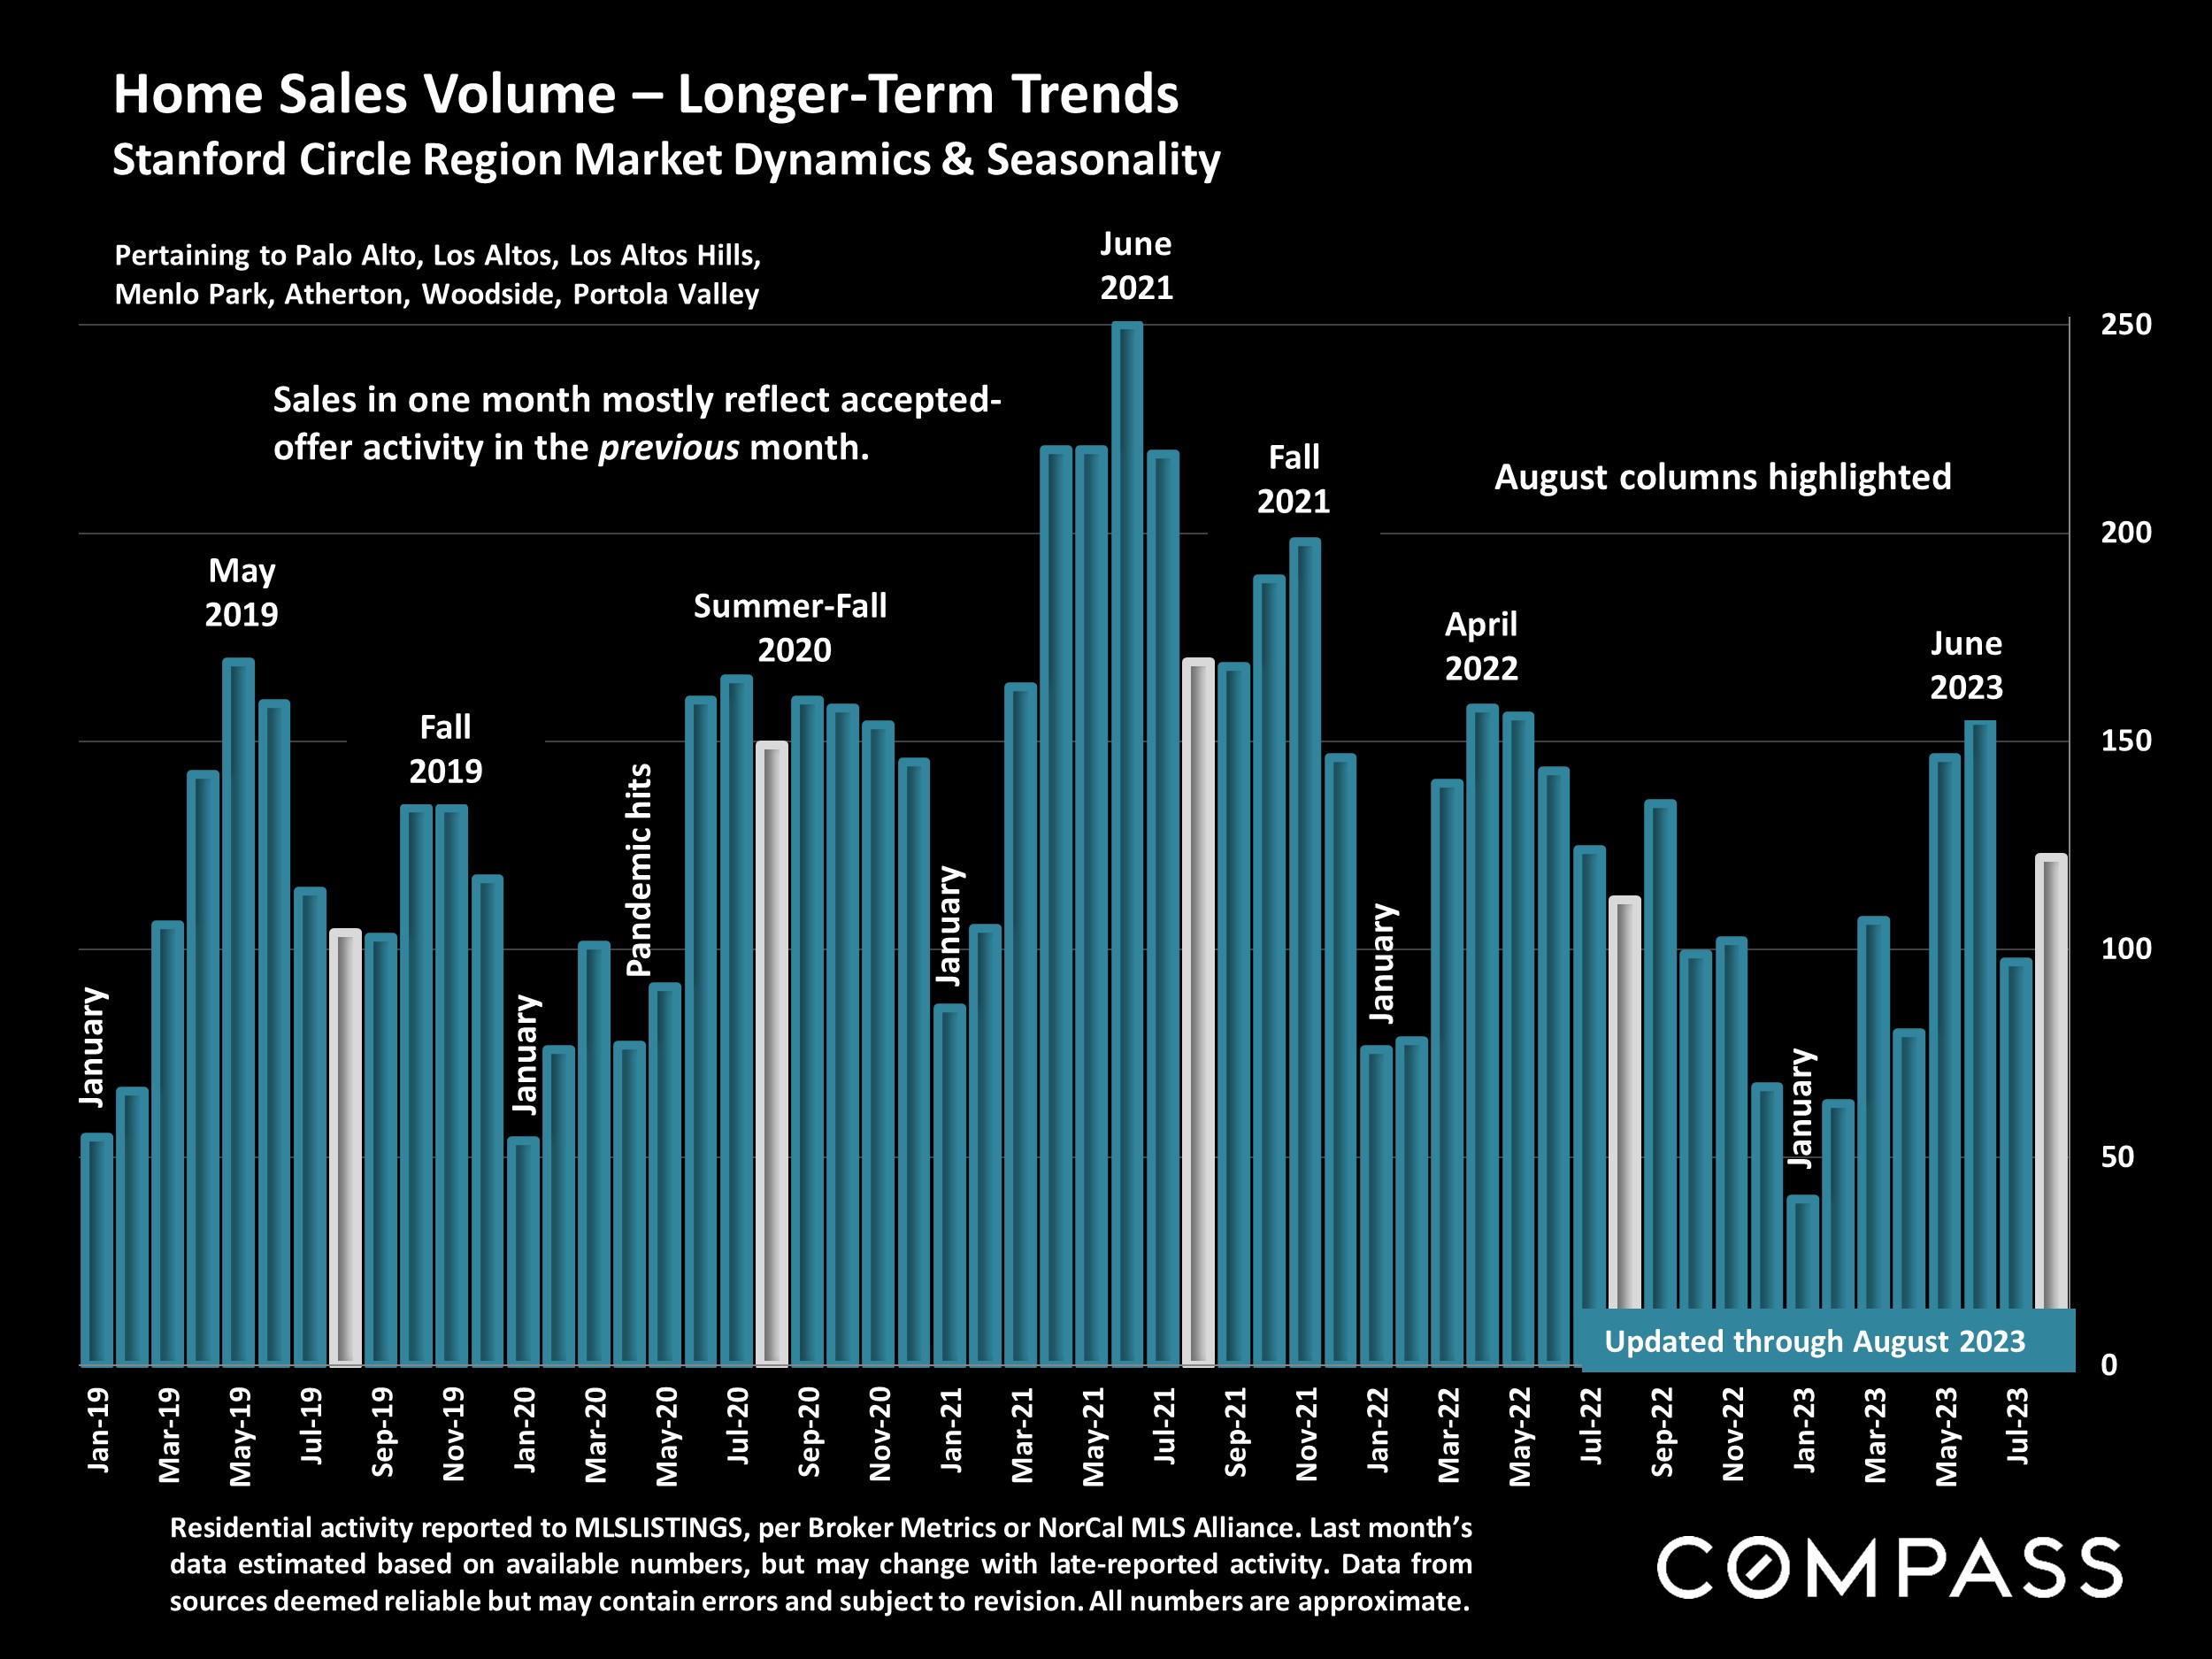
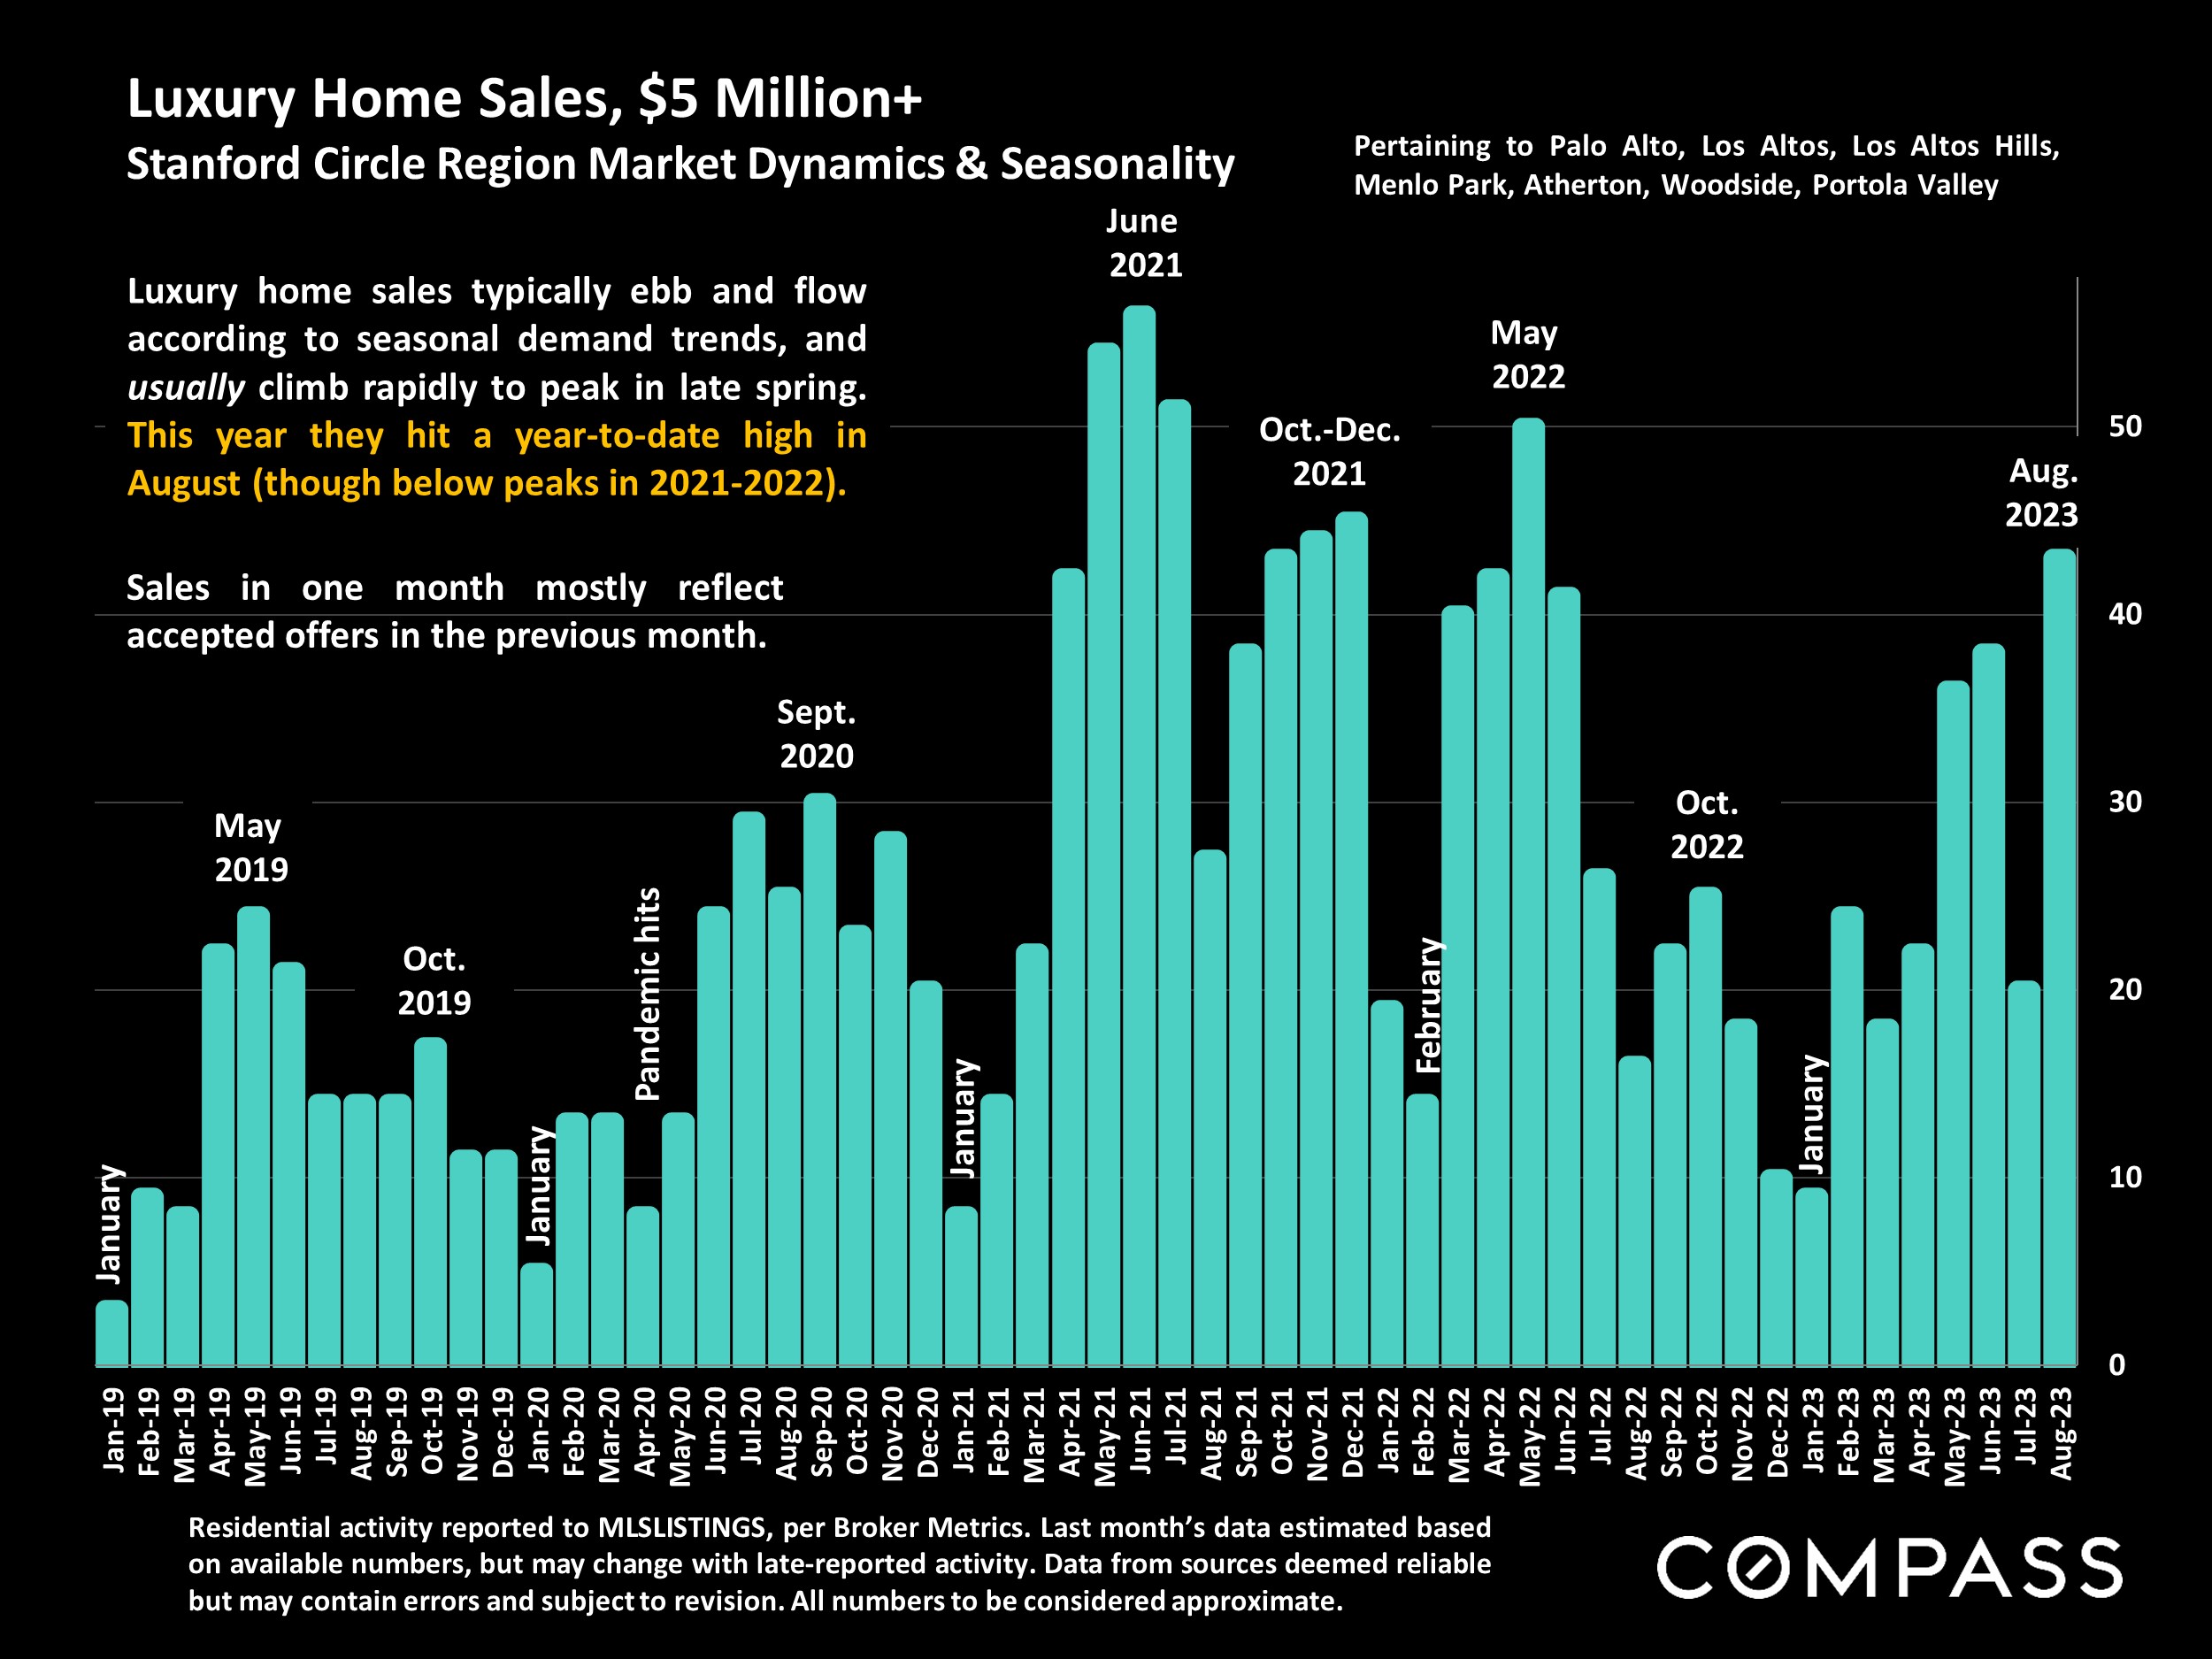
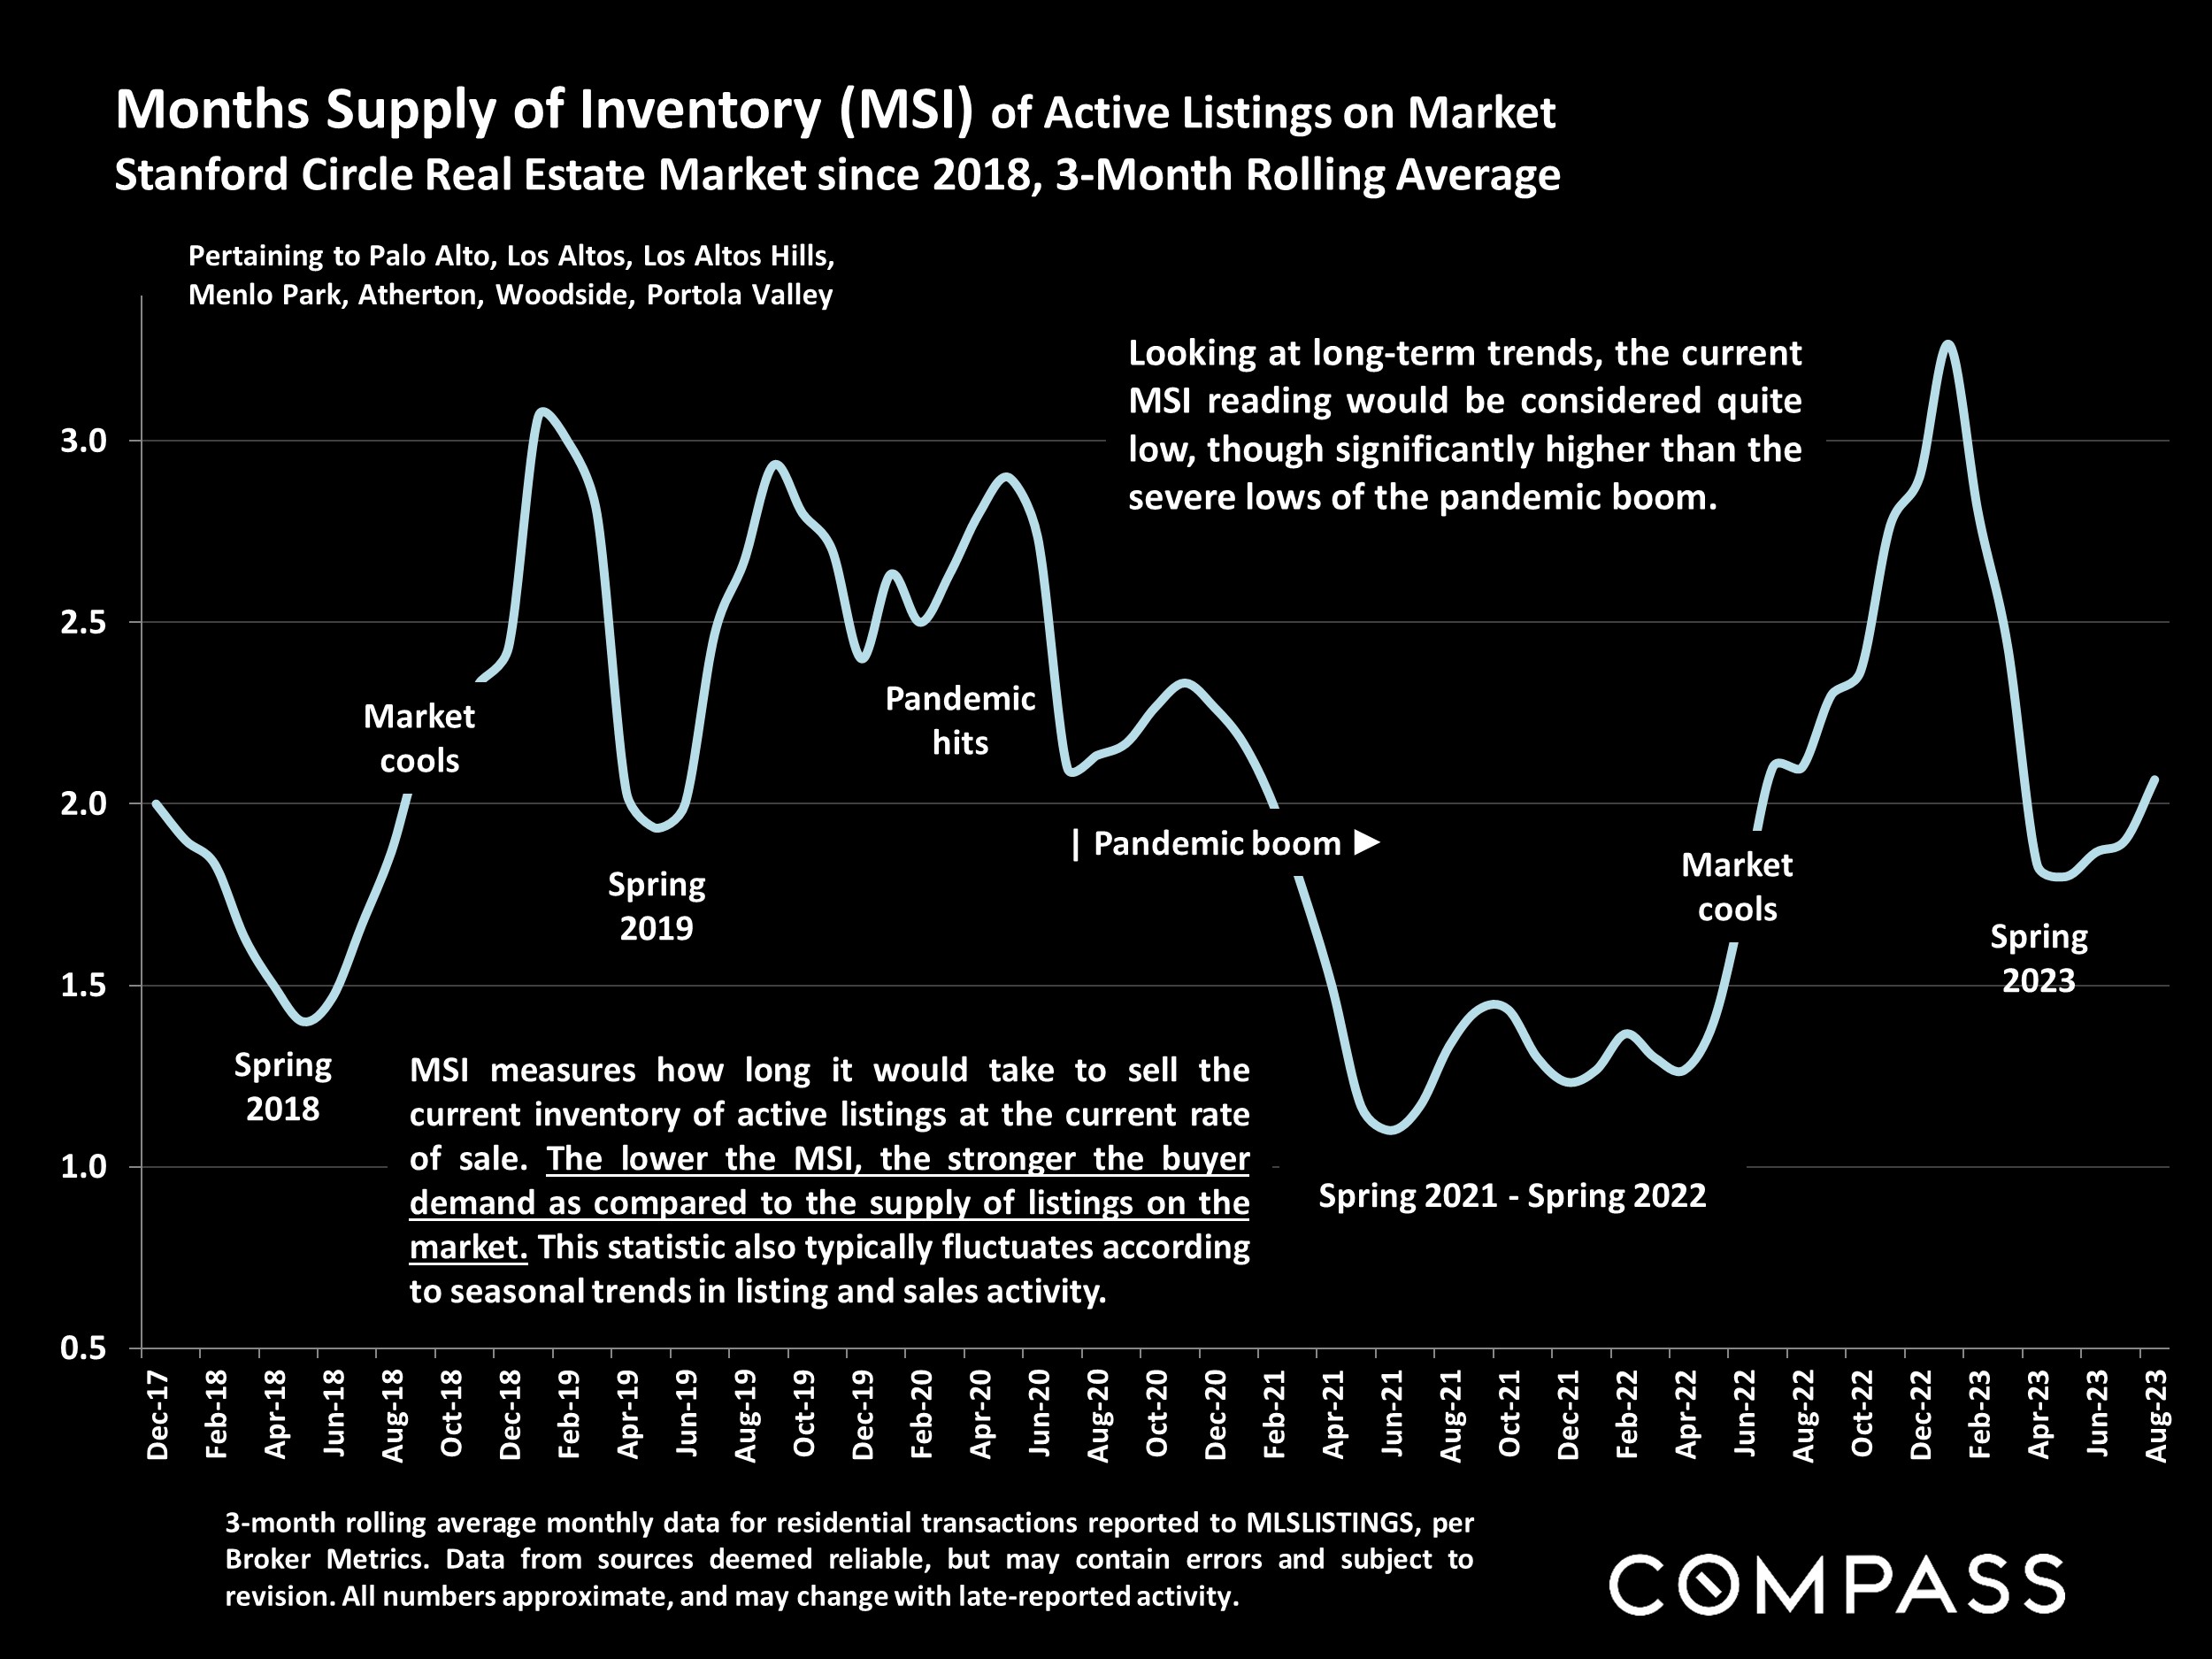
In the meantime, the Stanford Circle Q3 median house sales price was up about 11% from Q3 2022, but a major cause was a big jump in the average size of homes sold. New listings spiked up in September – a common seasonal trend – which resulted in a similar spike in listings going into contract. Year over year, the number of home sales in Q3 was down about 12%, but there was a 36% increase in the number of homes selling for $5 million+. Of total year-to-date Bay Area sales of $10m+, almost half occurred in the 7 Stanford Circle communities.
The CA Association of Realtors® (CAR) recently issued their initial 2024 market forecast:
“California housing market will rebound in 2024”
CAR forecast: Existing, single-family home sales will increase in 2024 by approximately 23 percent, and the CA median home price is expected to climb by 6.2%. The average 30-year, fixed mortgage interest rate is projected to decline to 6%. Housing supply will remain below normal despite a 10% to 20% increase in active listings, as market conditions and the lending environment continue to improve. [However] the percentage of CA households able to purchase a median-priced single family dwelling will remain very low by long-term standards. CAR Chief Economist, 9/20/23
Statistics are generalities, essentially summaries of widely disparate data generated by dozens, hundreds or thousands of unique, individual sales occurring within different time periods. They are best seen not as precise measurements, but as broad, comparative indicators, with reasonable margins of error. Anomalous fluctuations in statistics are not uncommon, especially in smaller, expensive market segments. Last period data should be considered estimates that may change with late-reported data. Different analytics programs sometimes define statistics – such as “active listings,” “days on market,” and “months supply of inventory” – differently: what is most meaningful are not specific calculations but the trends they illustrate. Most listing and sales data derives from the local or regional multi-listing service (MLS) of the area specified in the analysis, but not all listings or sales are reported to MLS and these won’t be reflected in the data. “Homes” signifies real-property, single-household housing units: houses, condos, co-ops, townhouses, duets and TICs (but not mobile homes), as applicable to each market. City/town names refer specifically to the named cities and towns, unless otherwise delineated. Multi-county metro areas will be specified as such. Data from sources deemed reliable, but may contain errors and subject to revision. All numbers to be considered approximate.
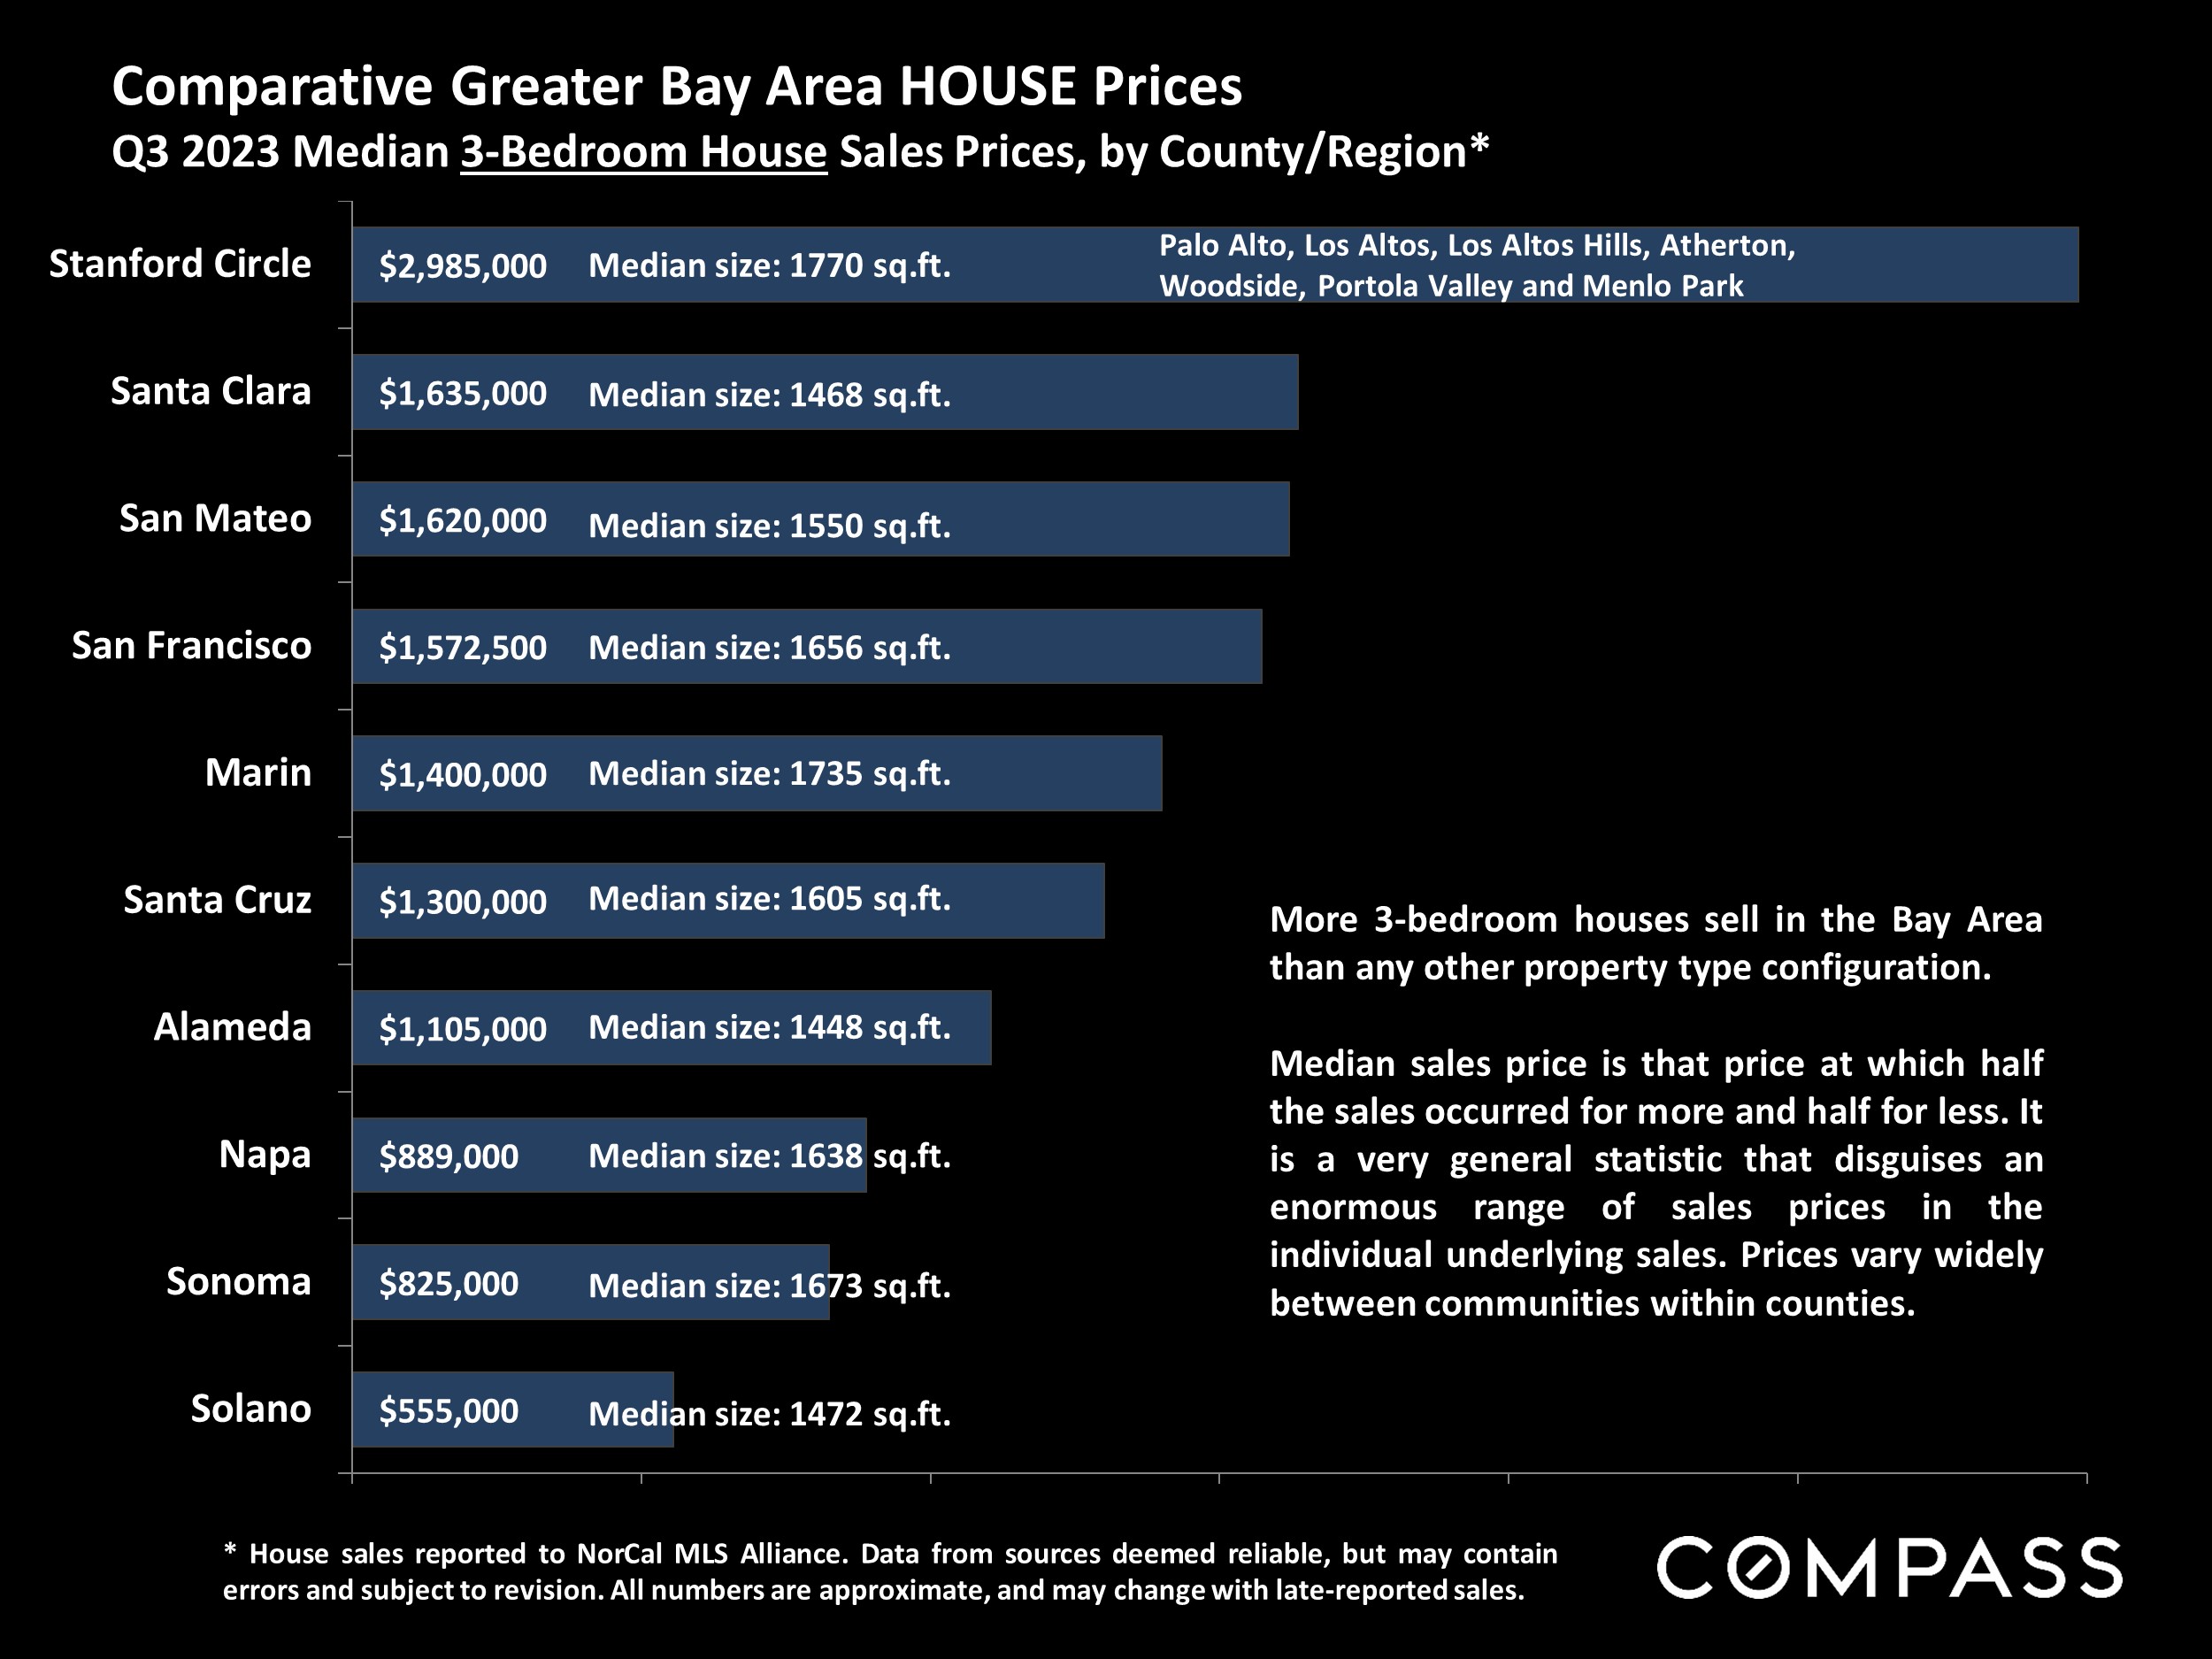
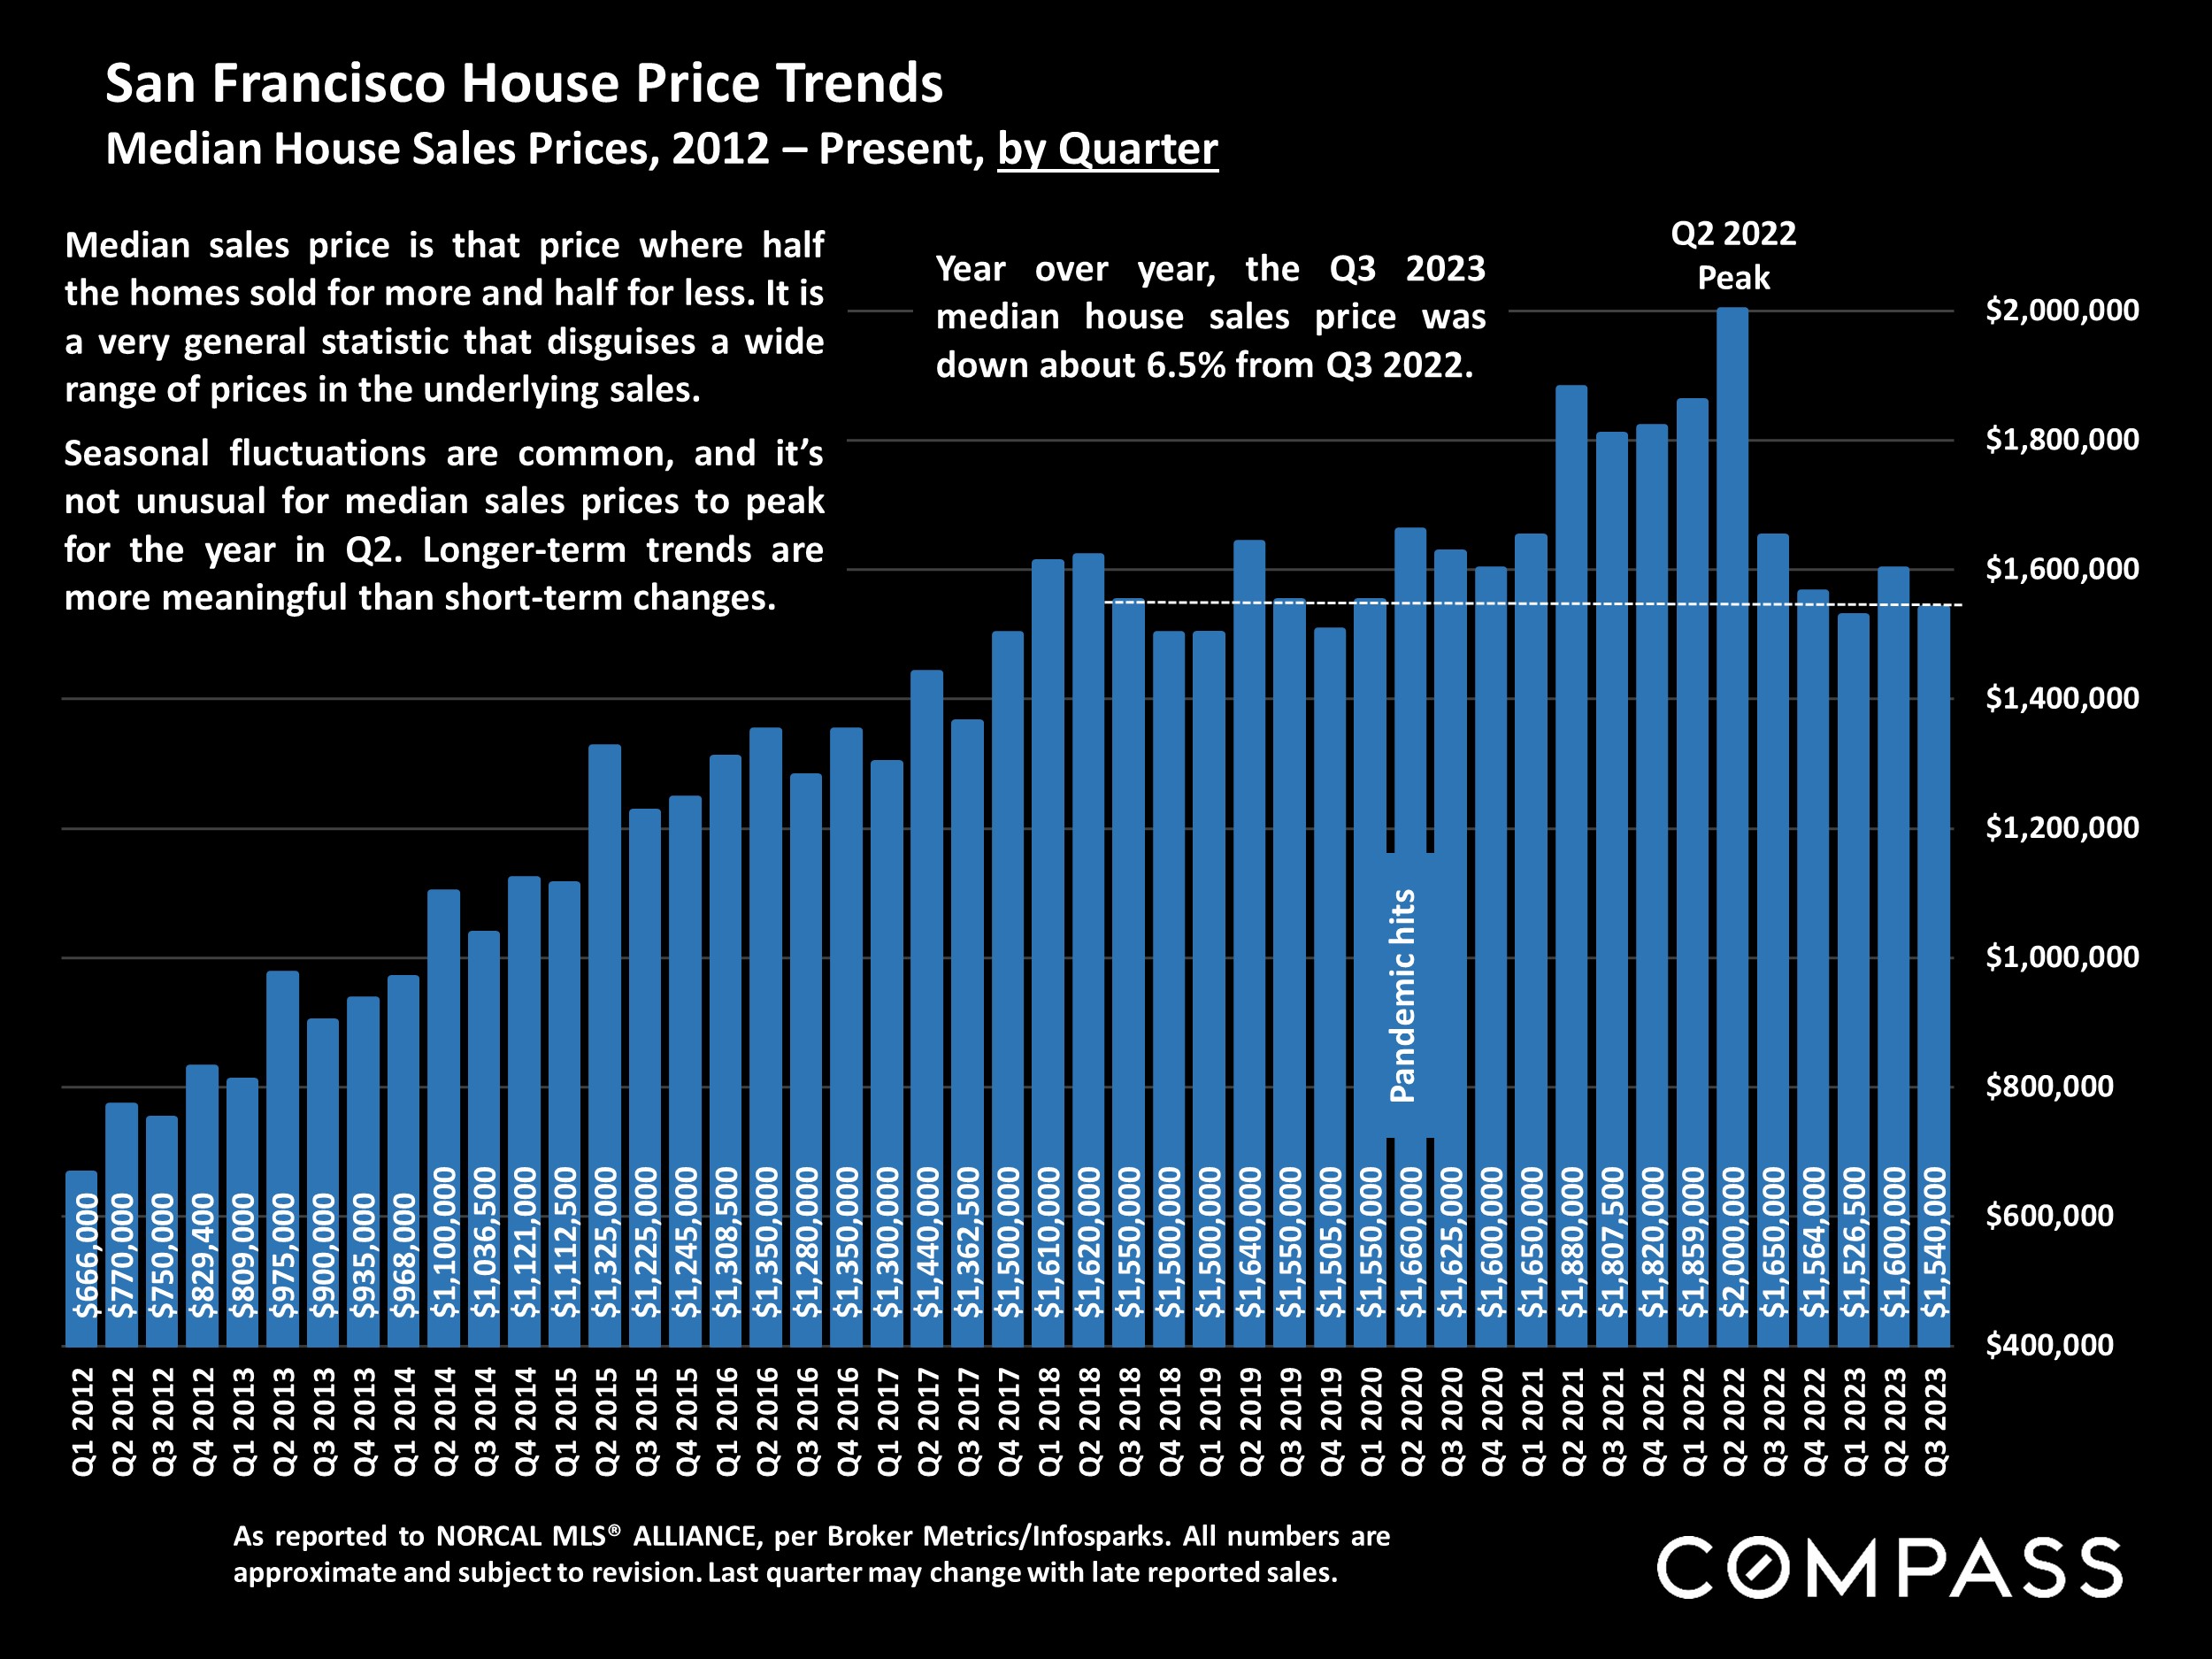
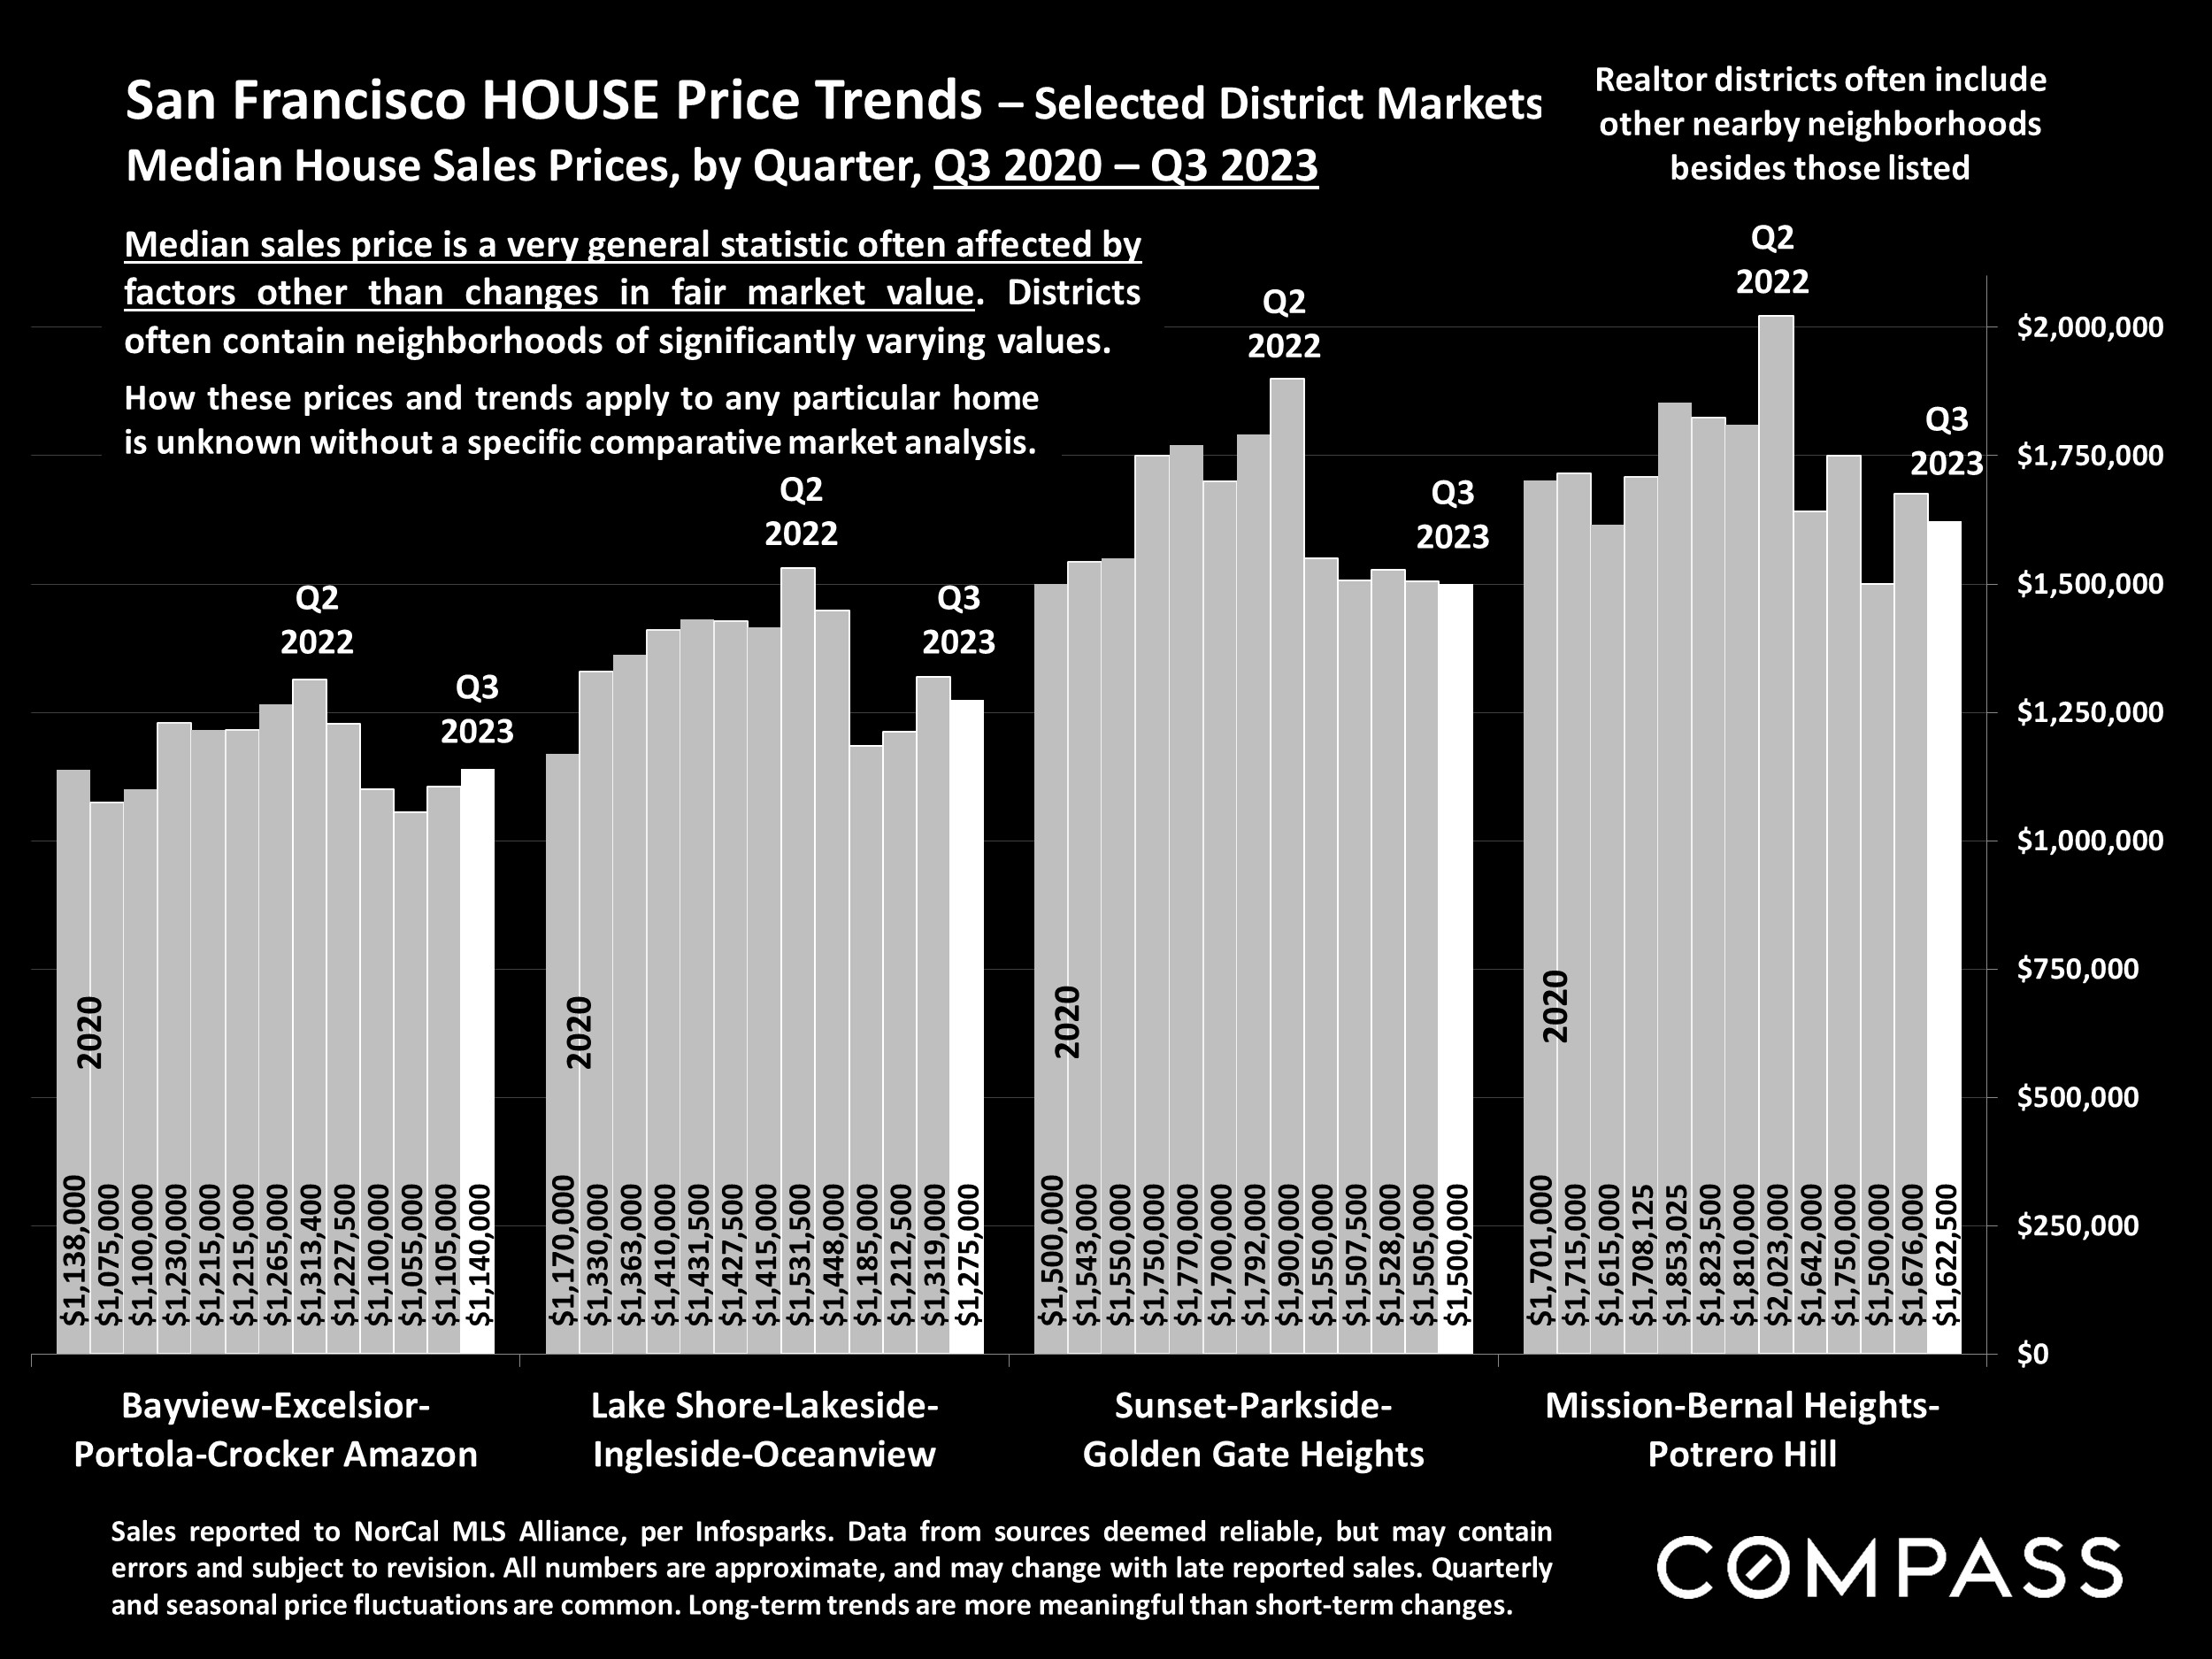
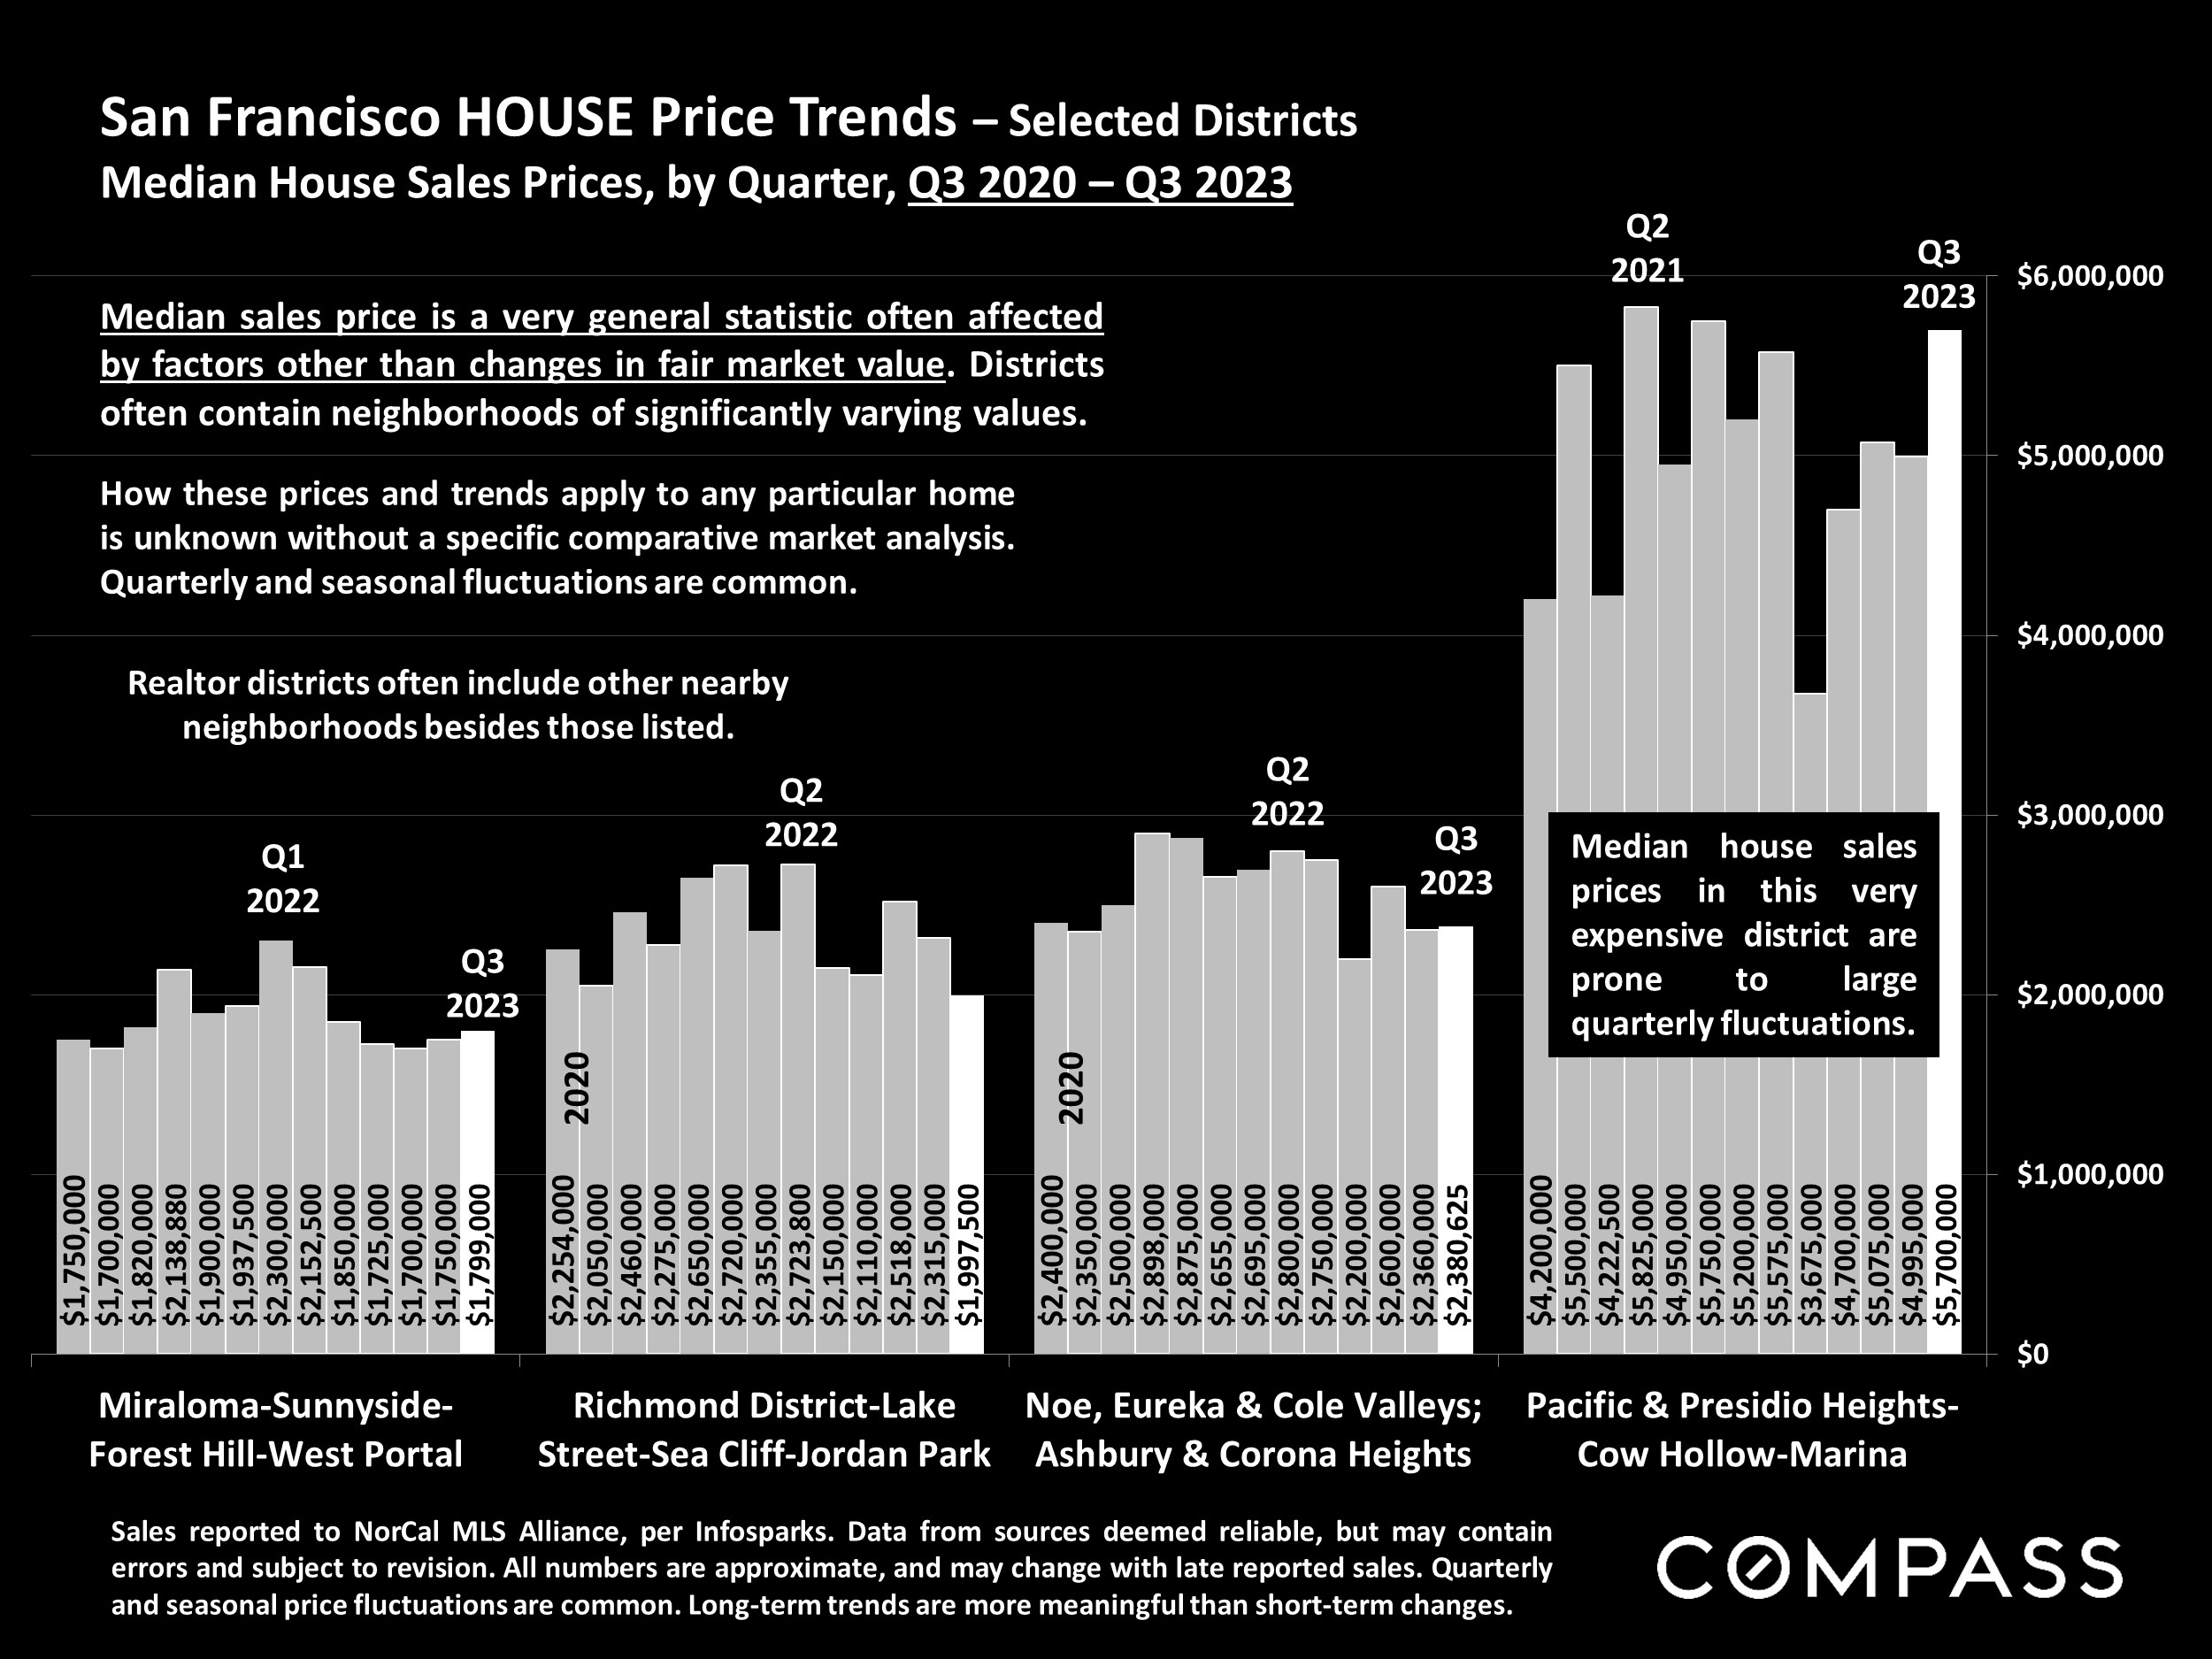
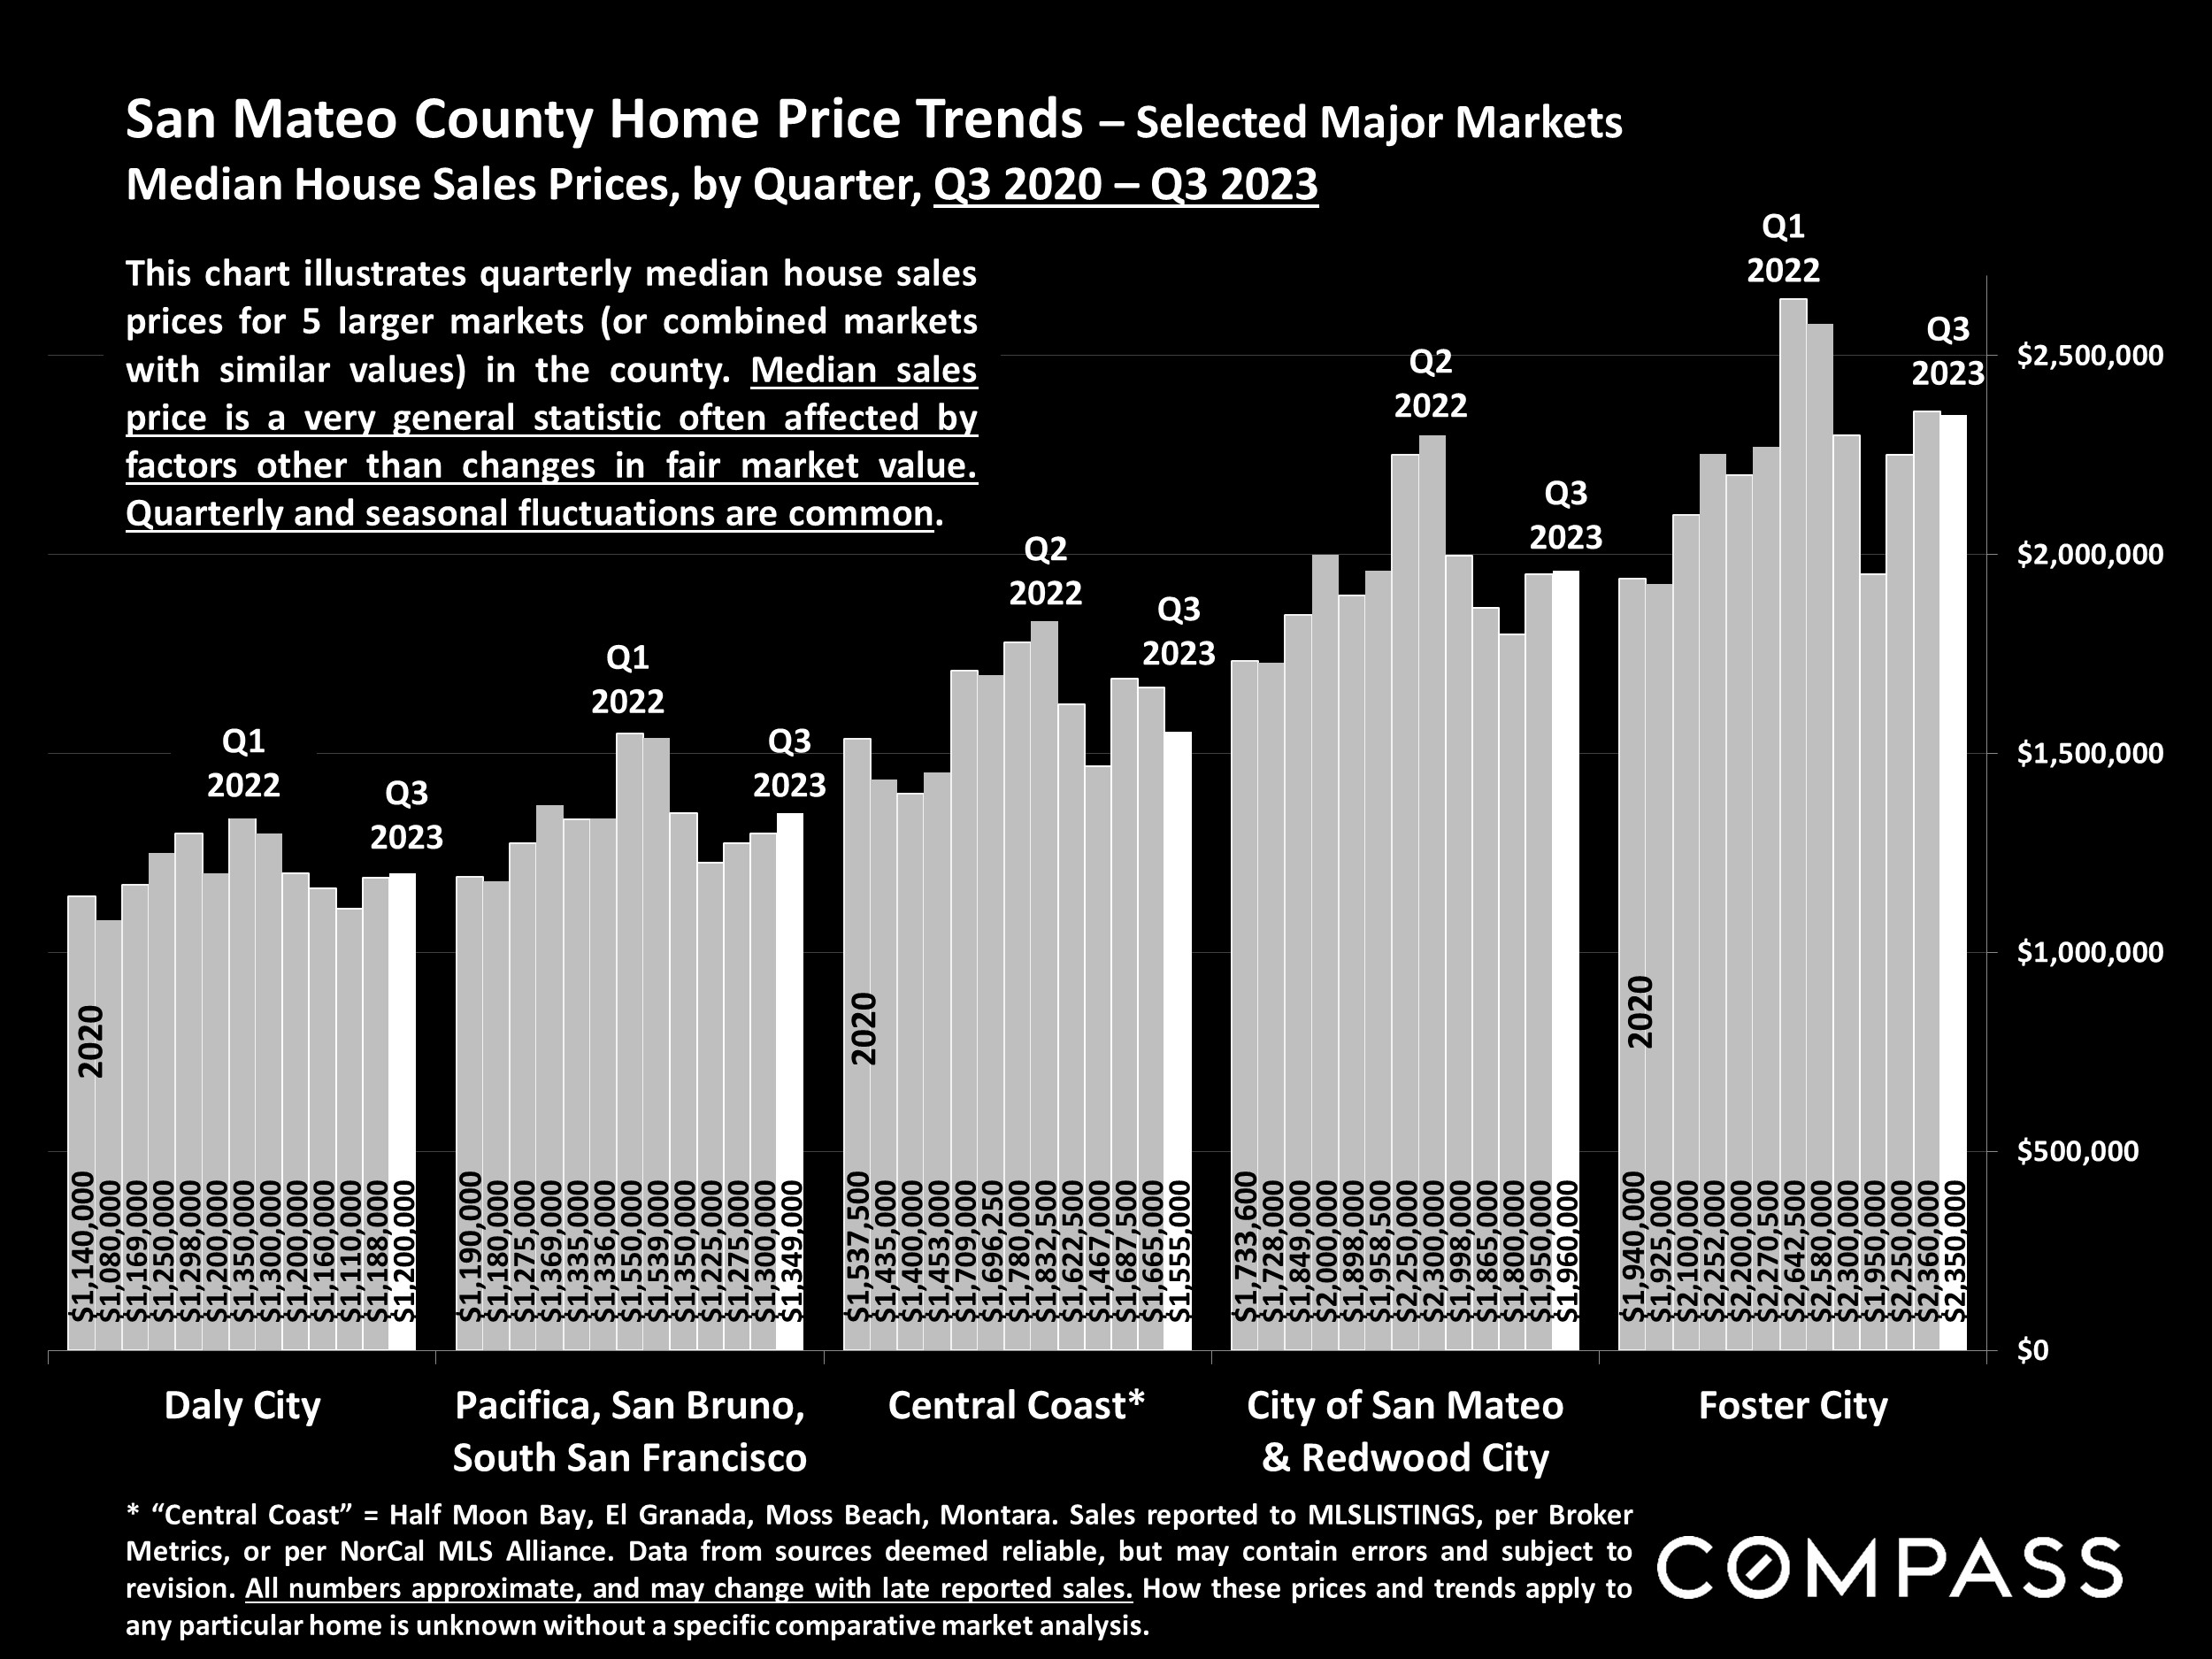
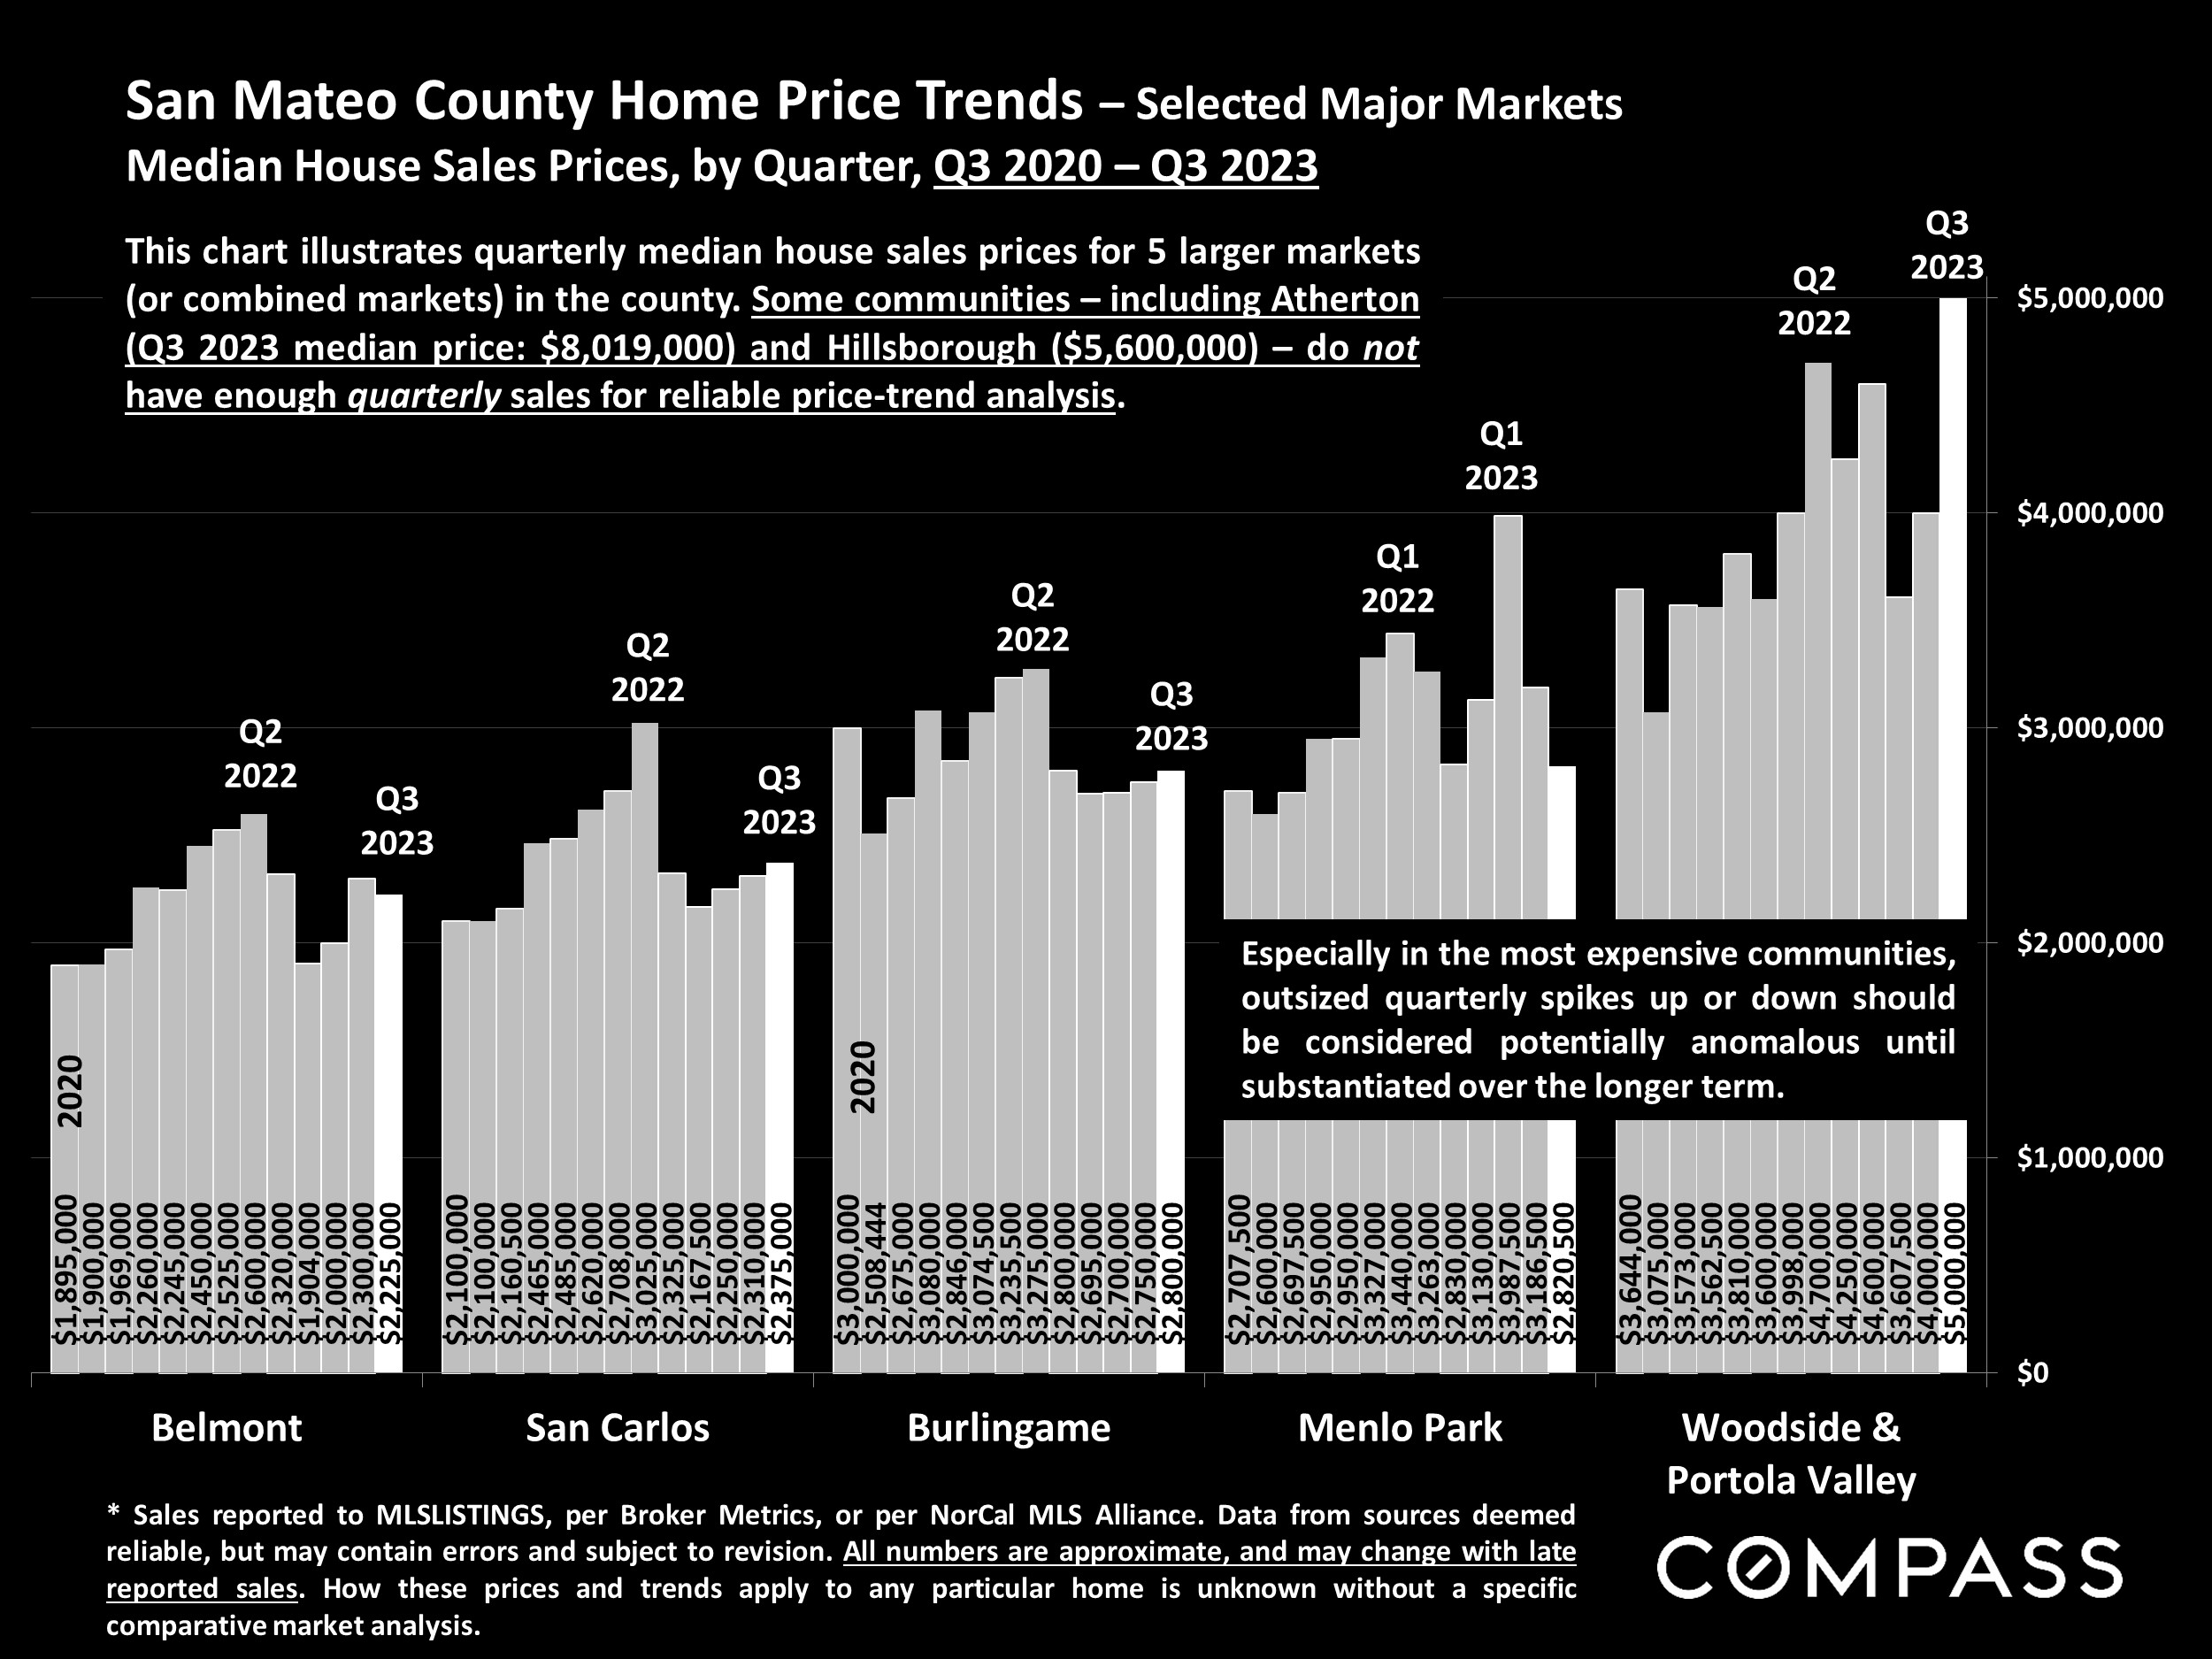
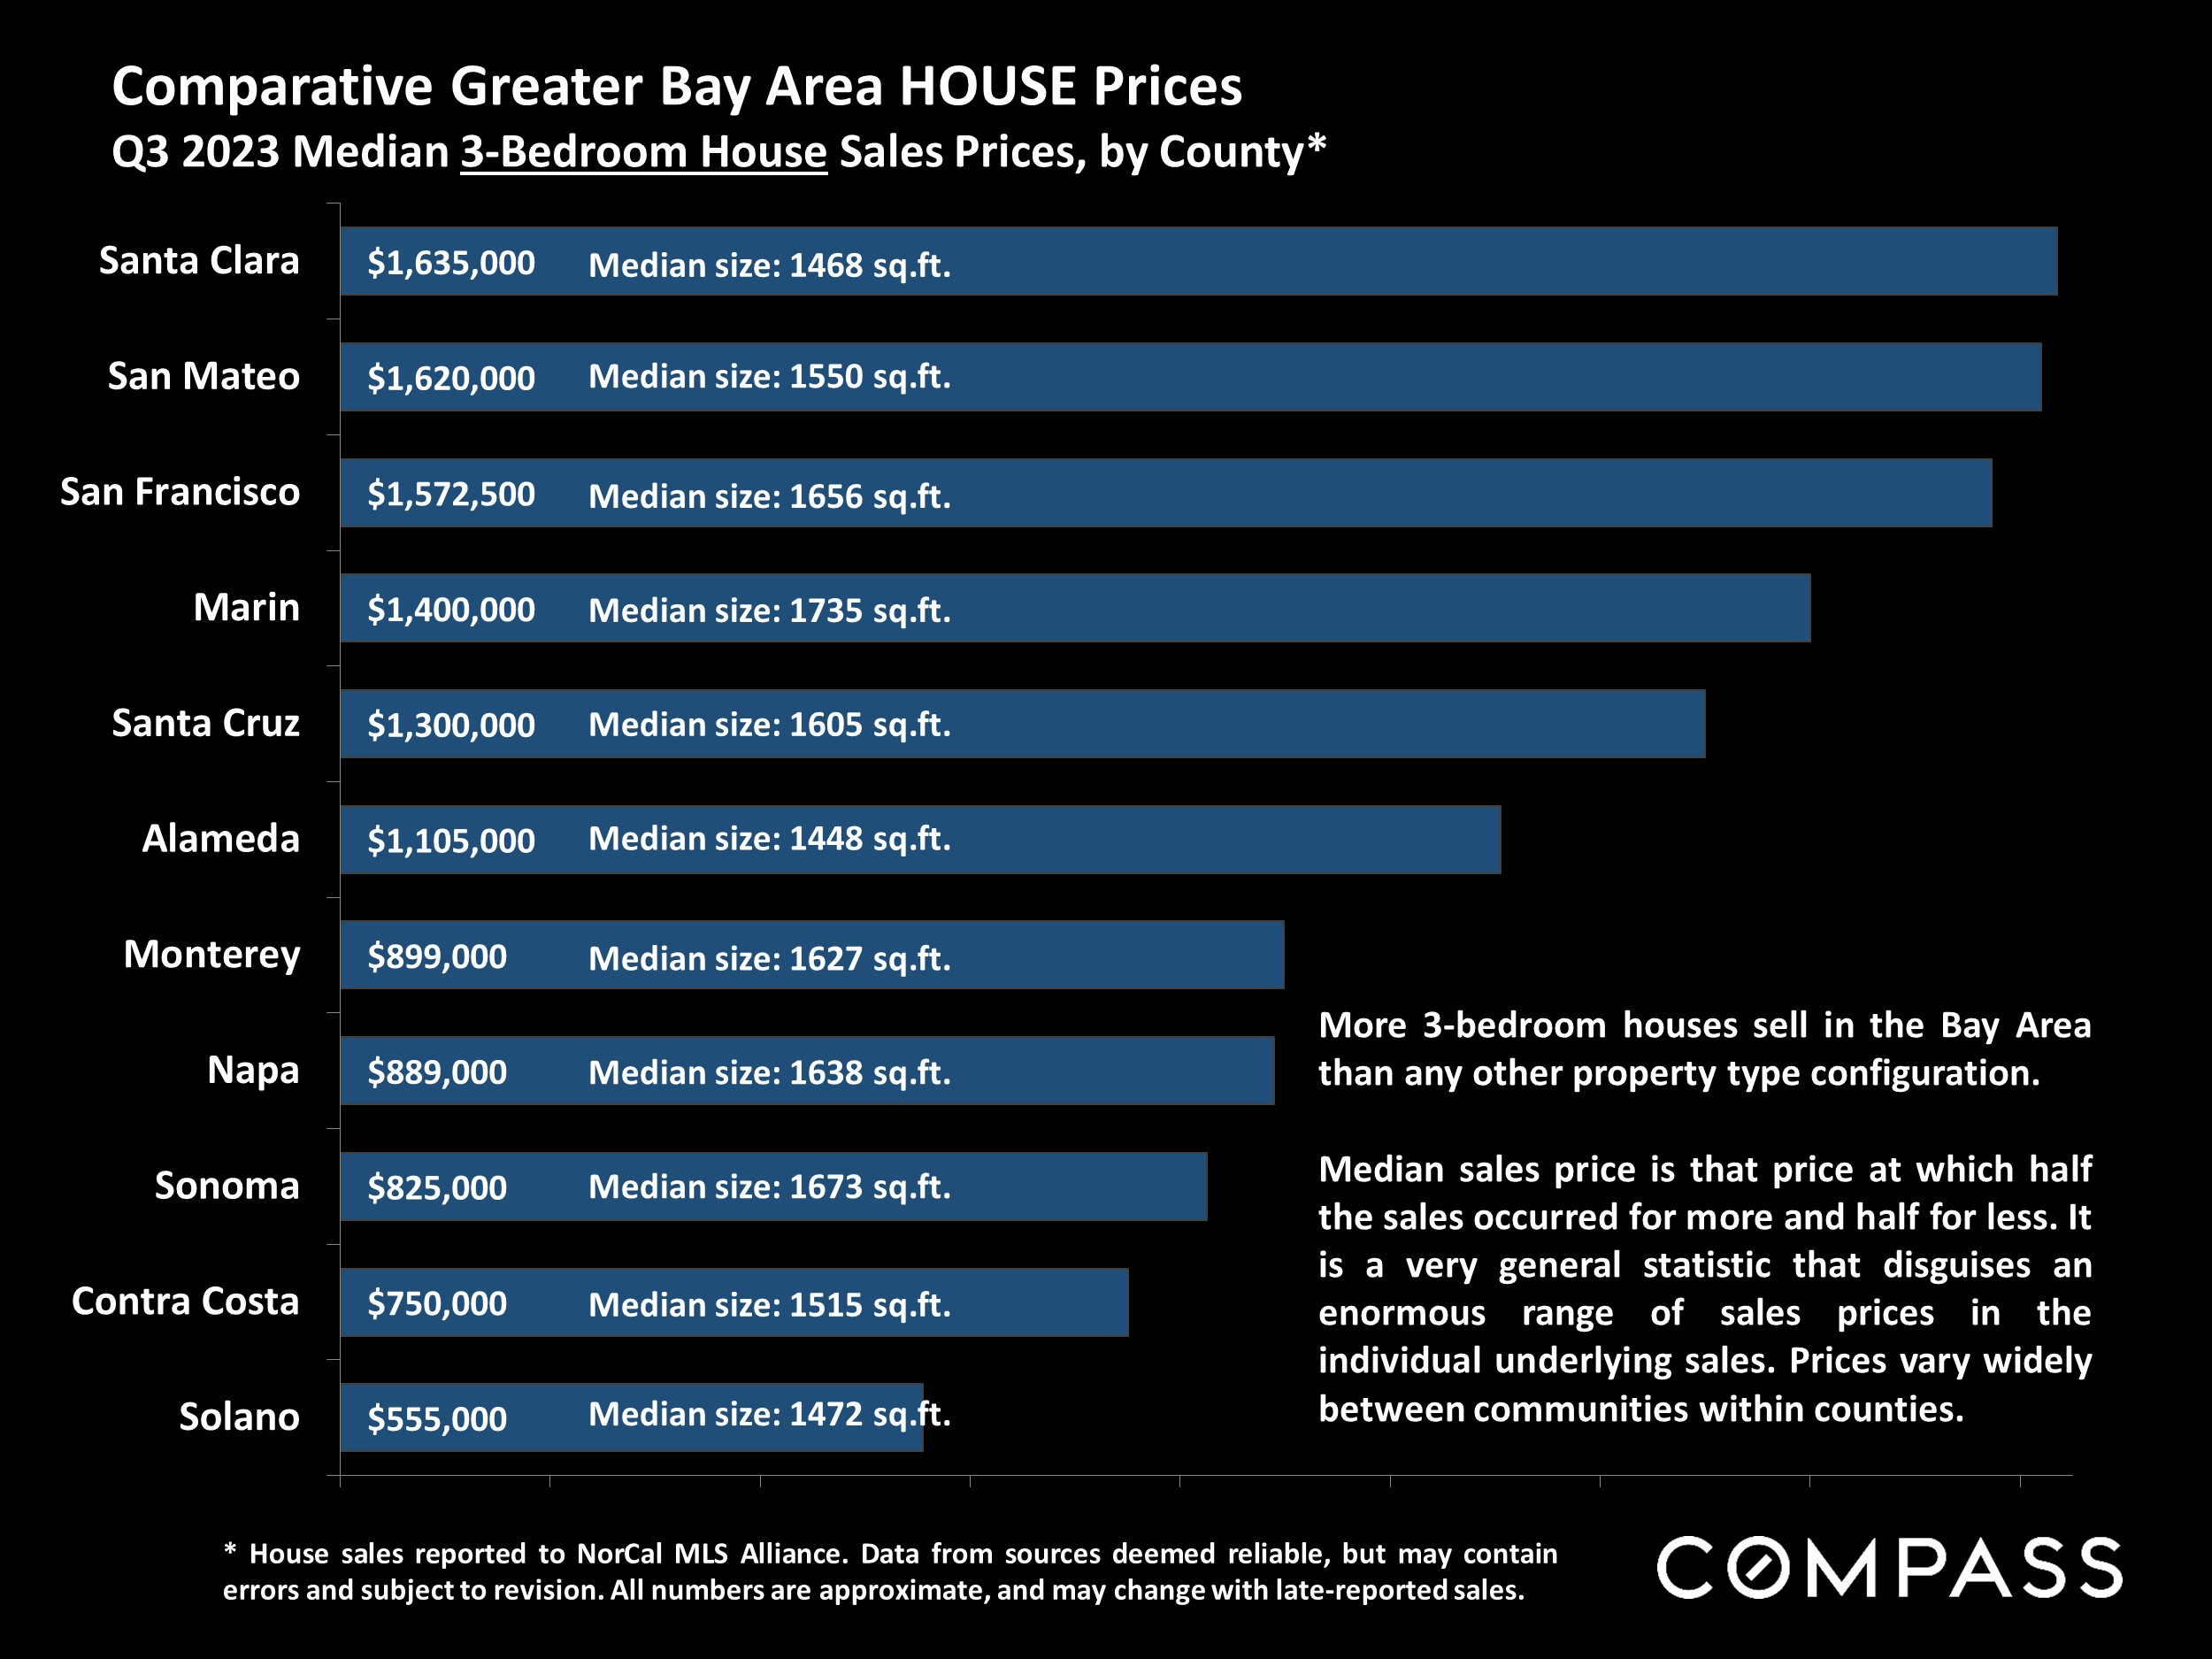
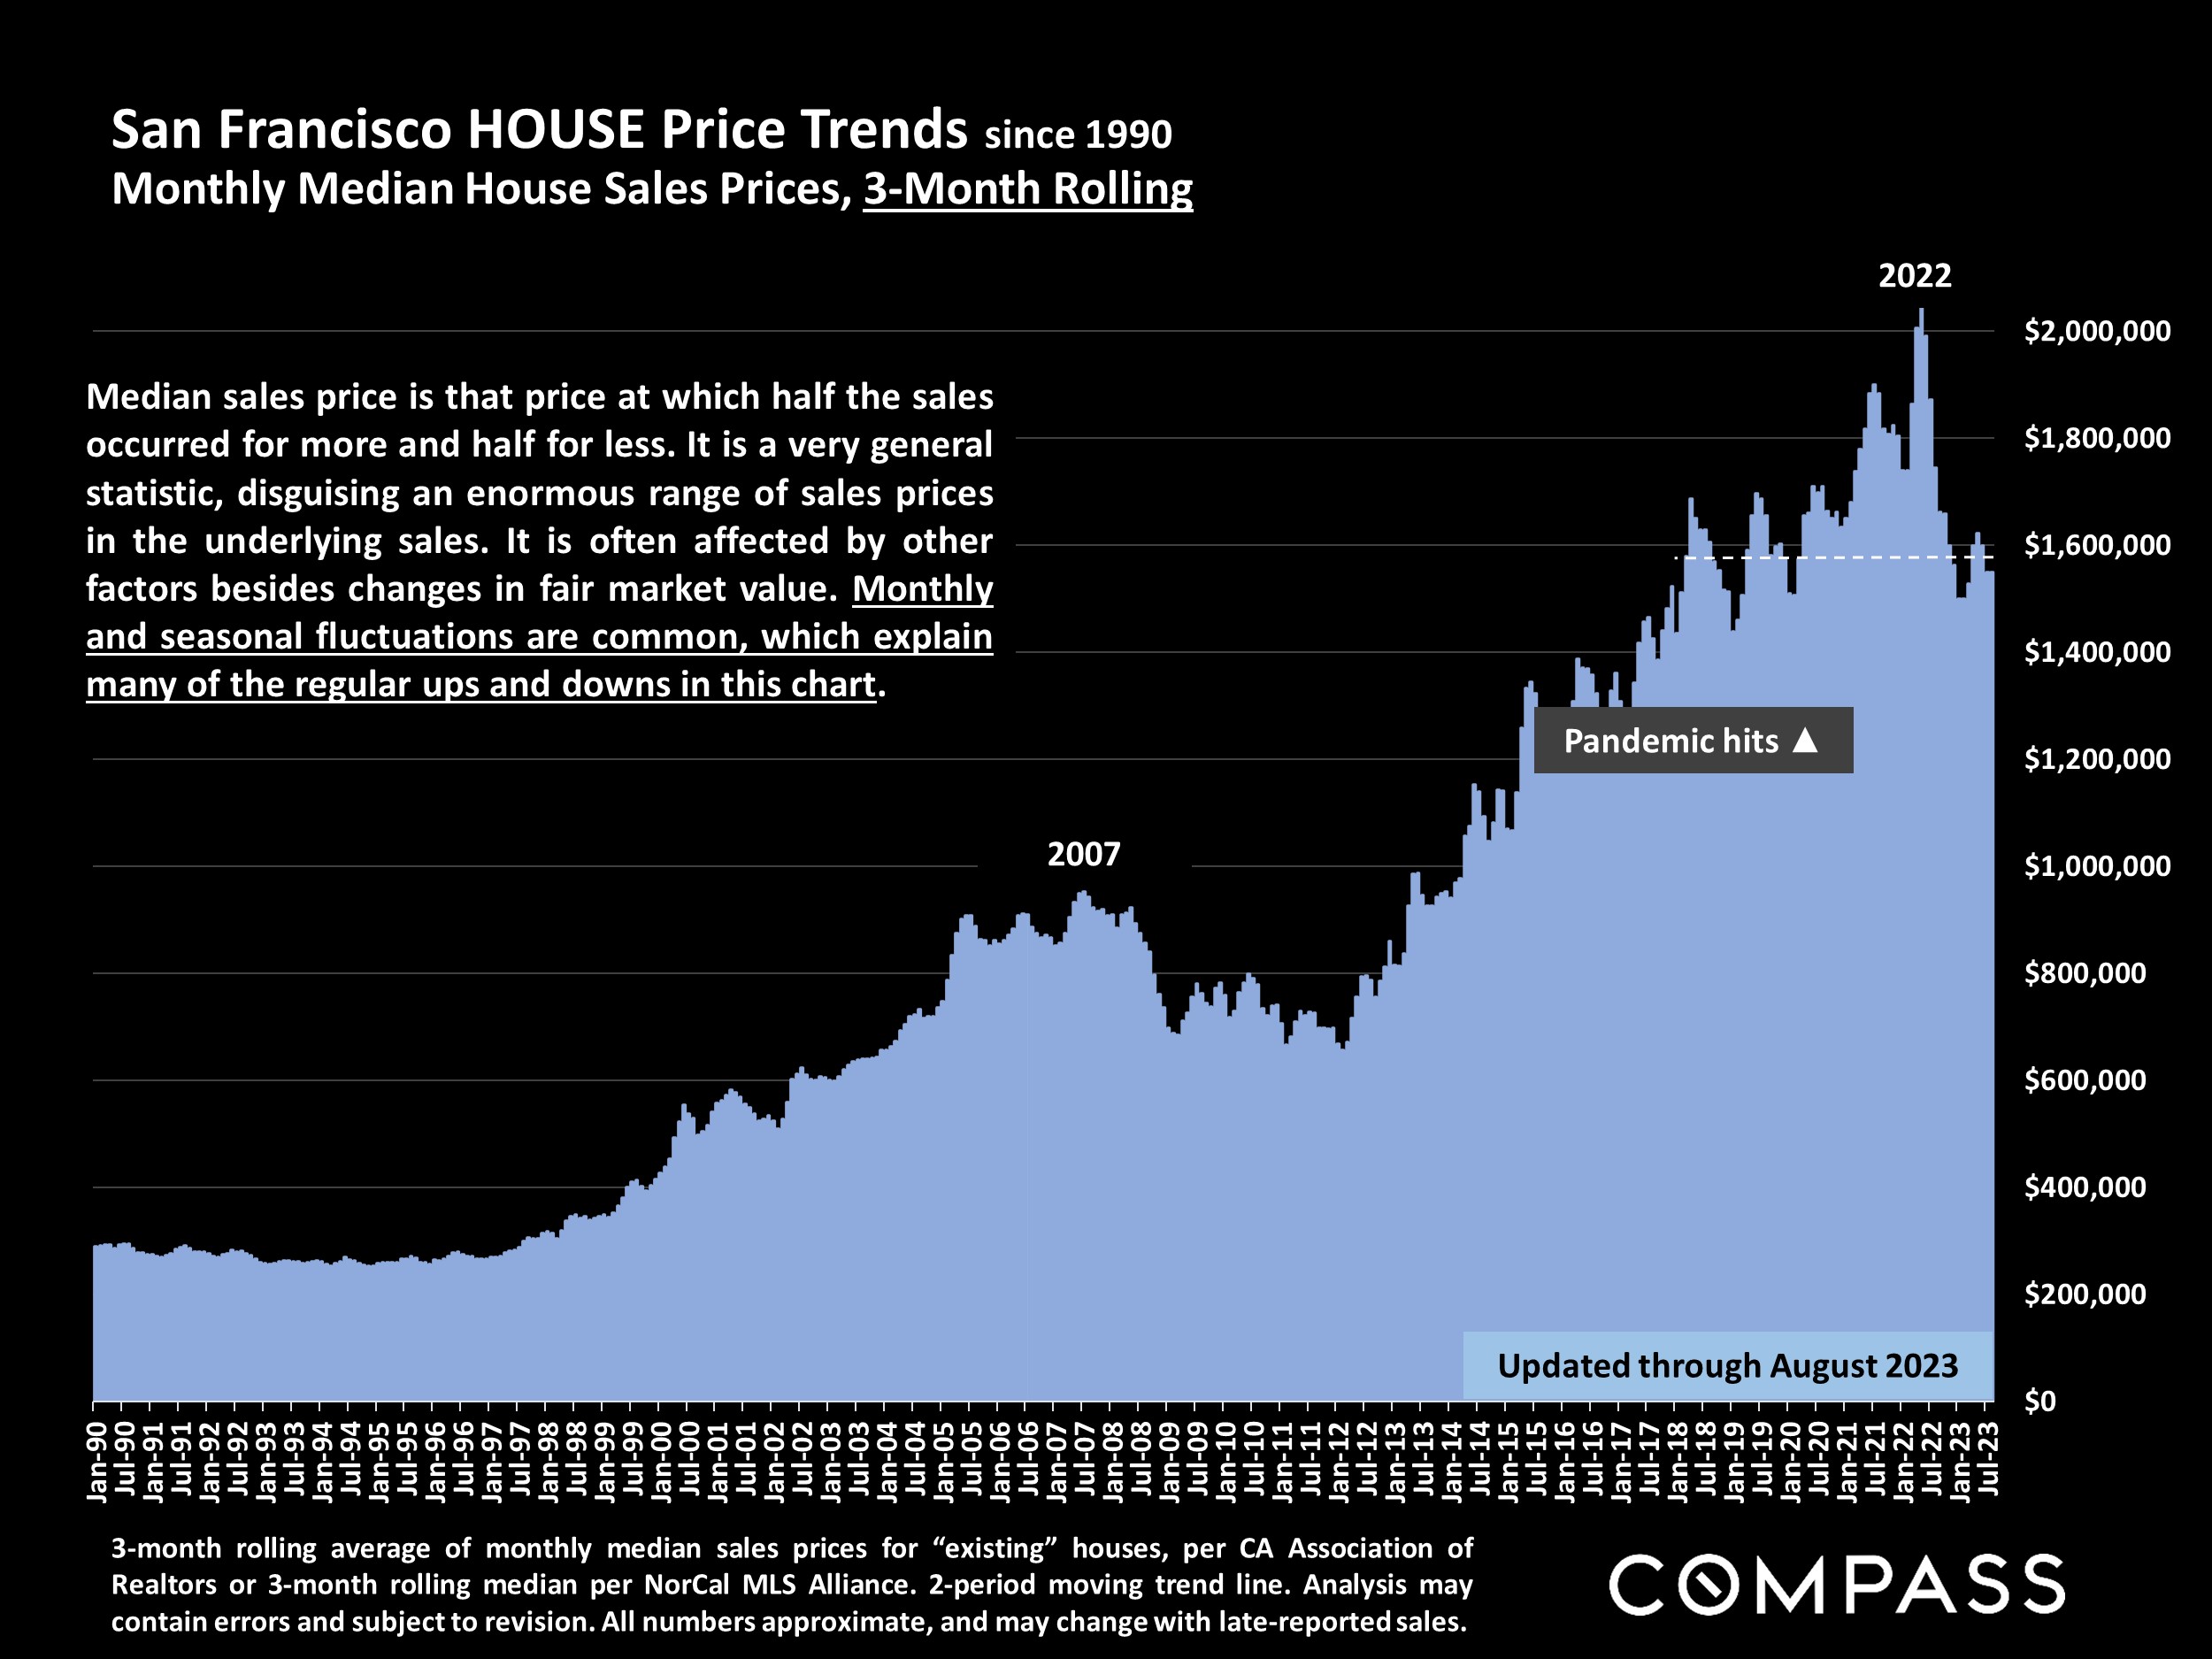
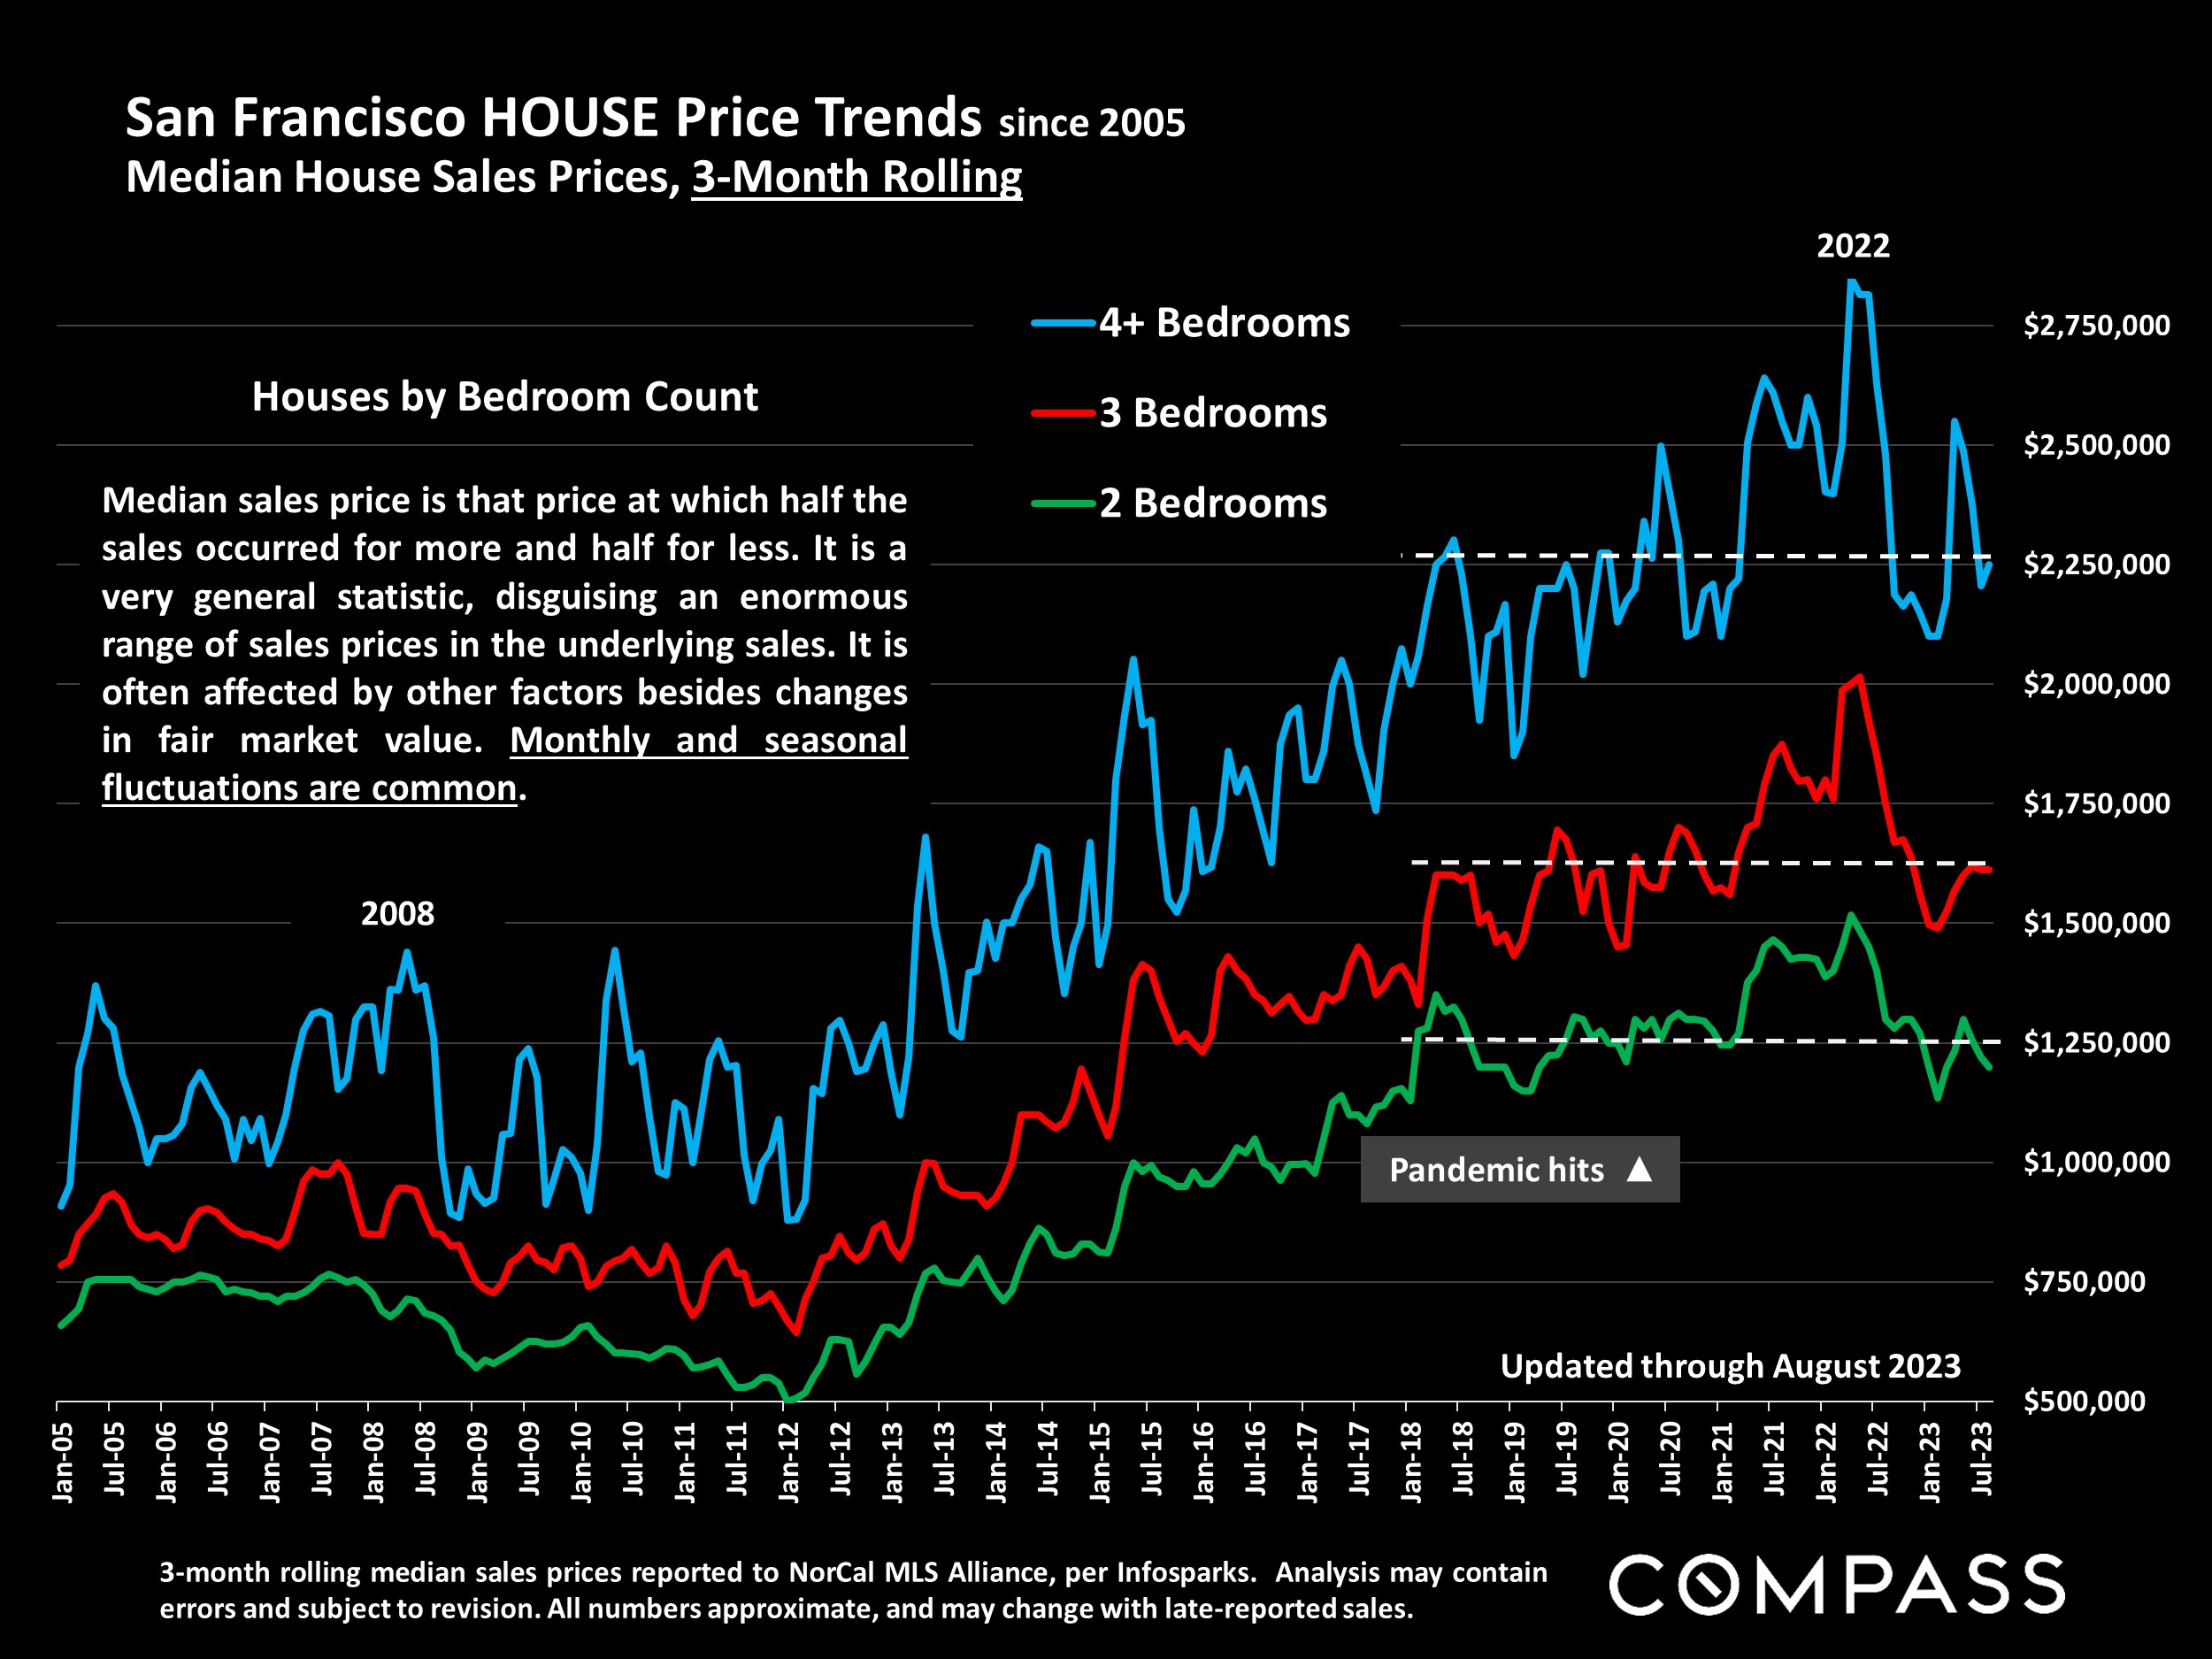
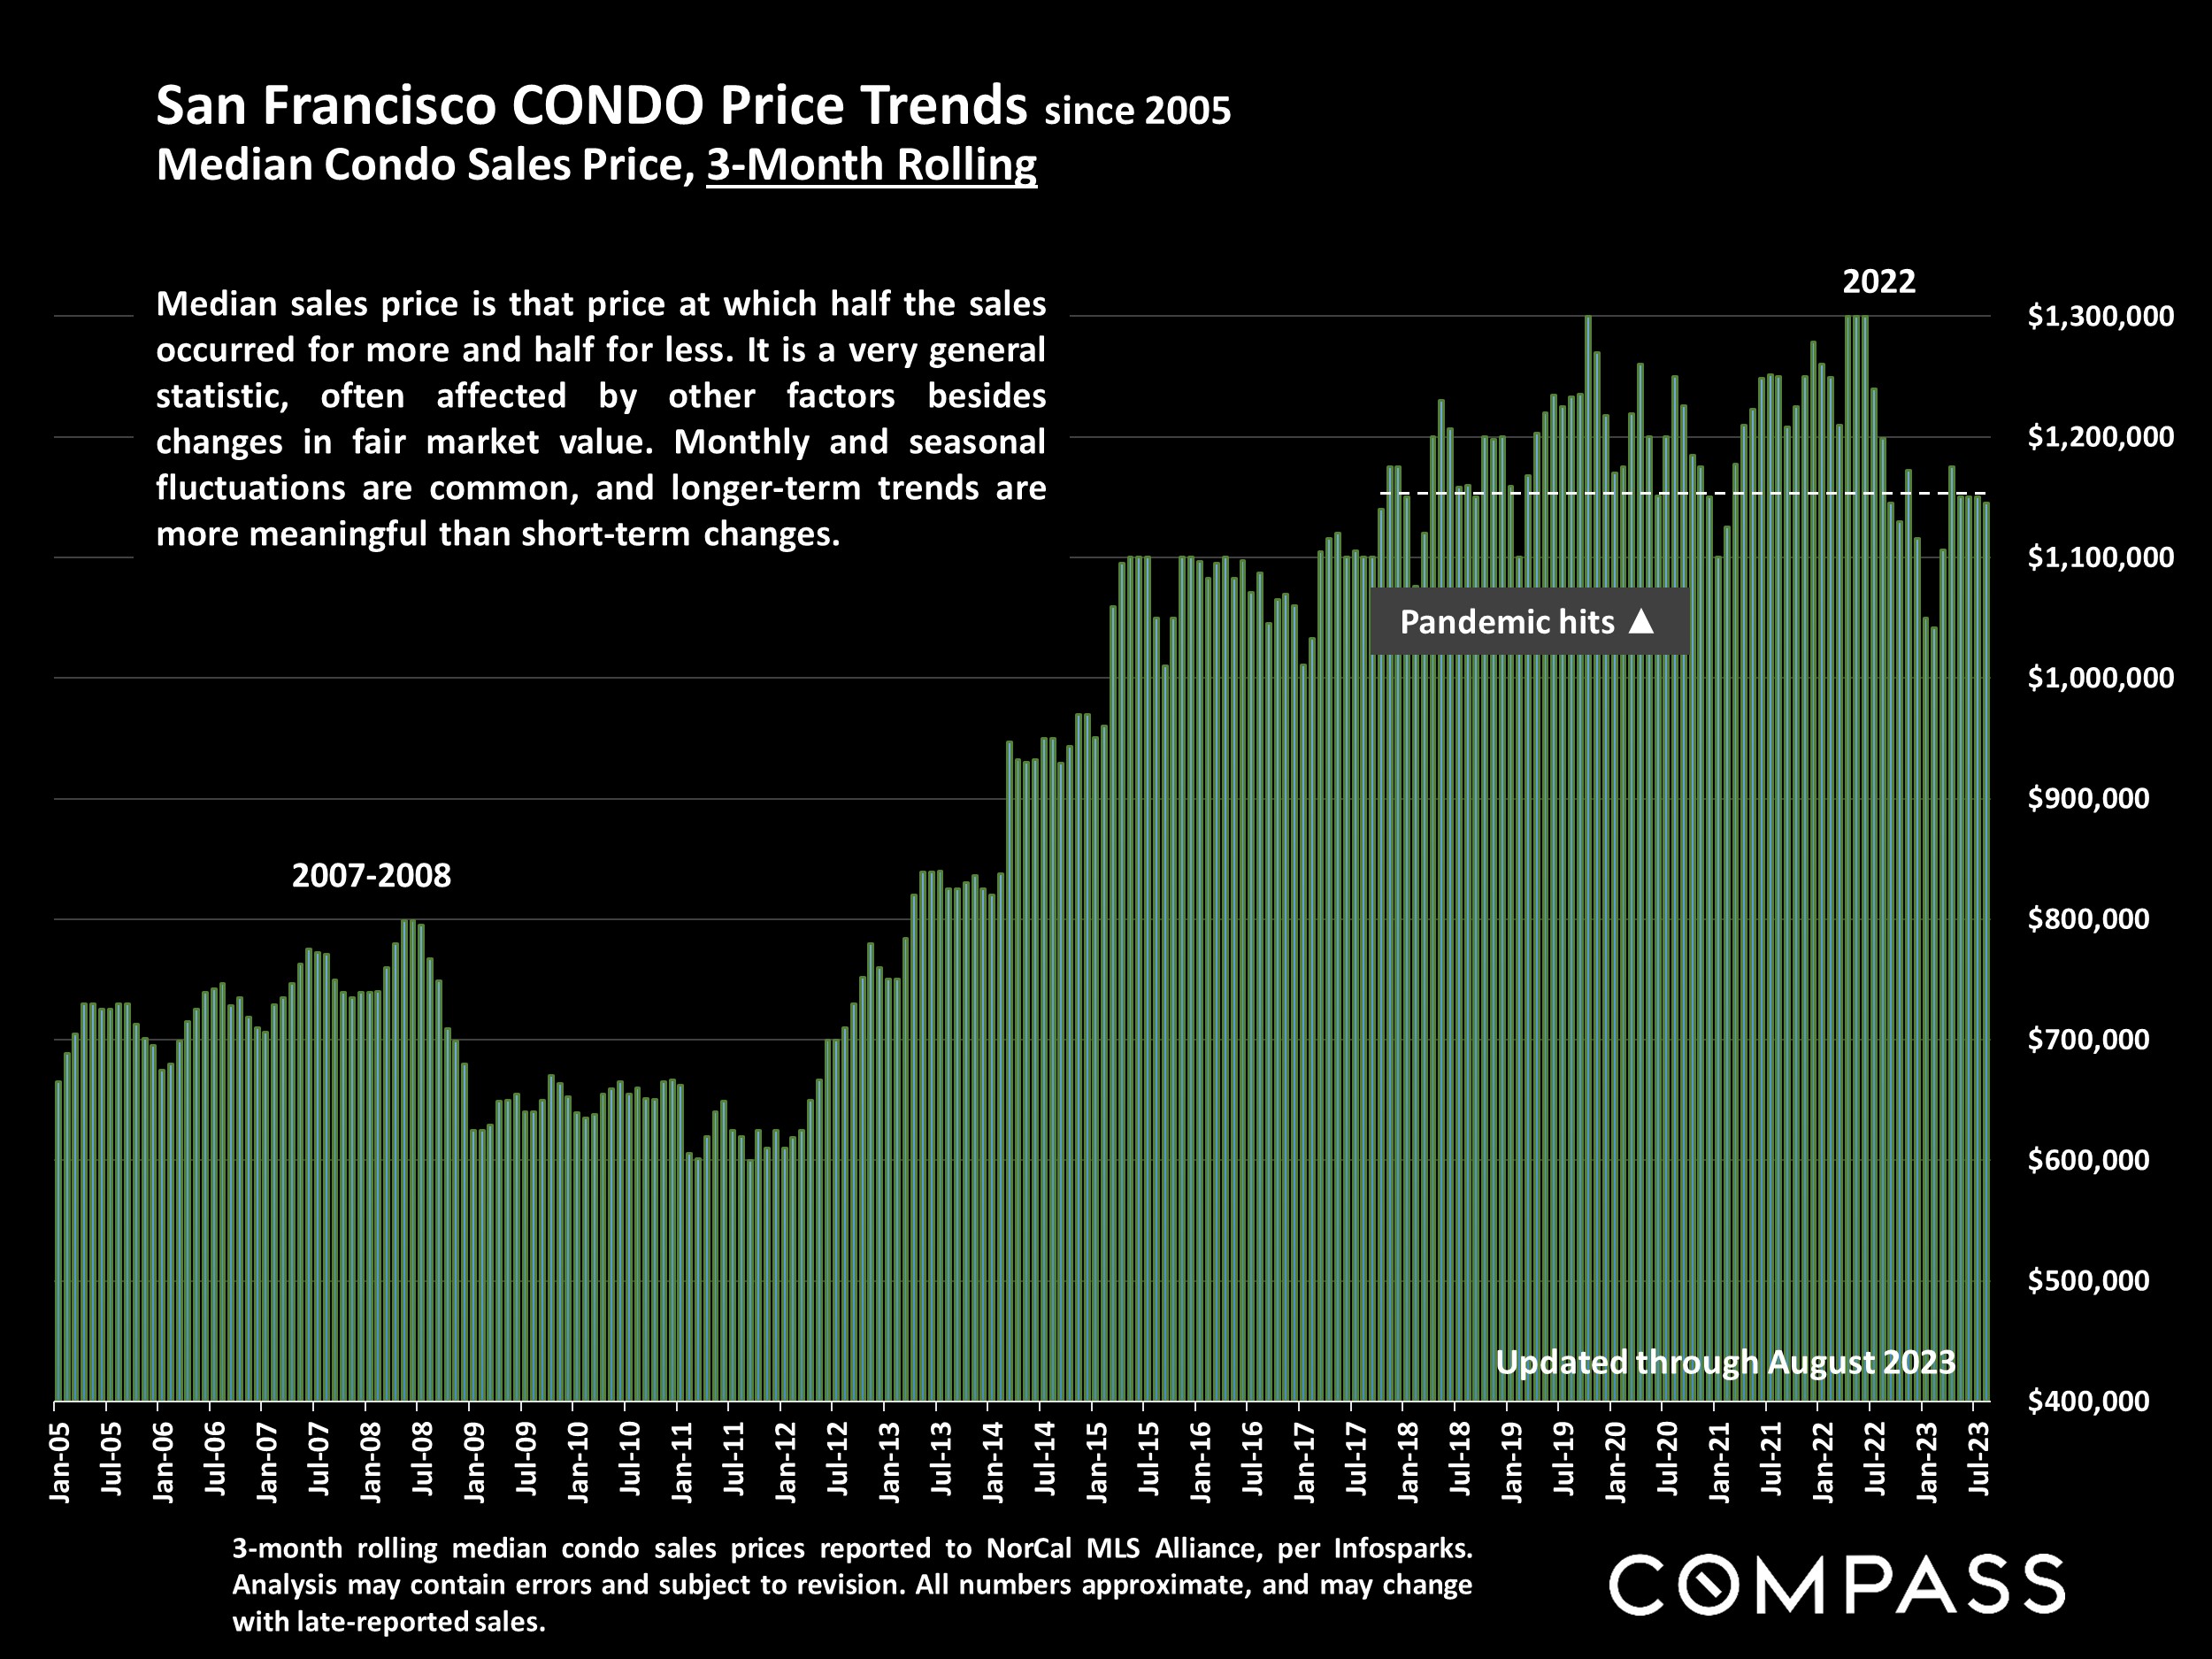
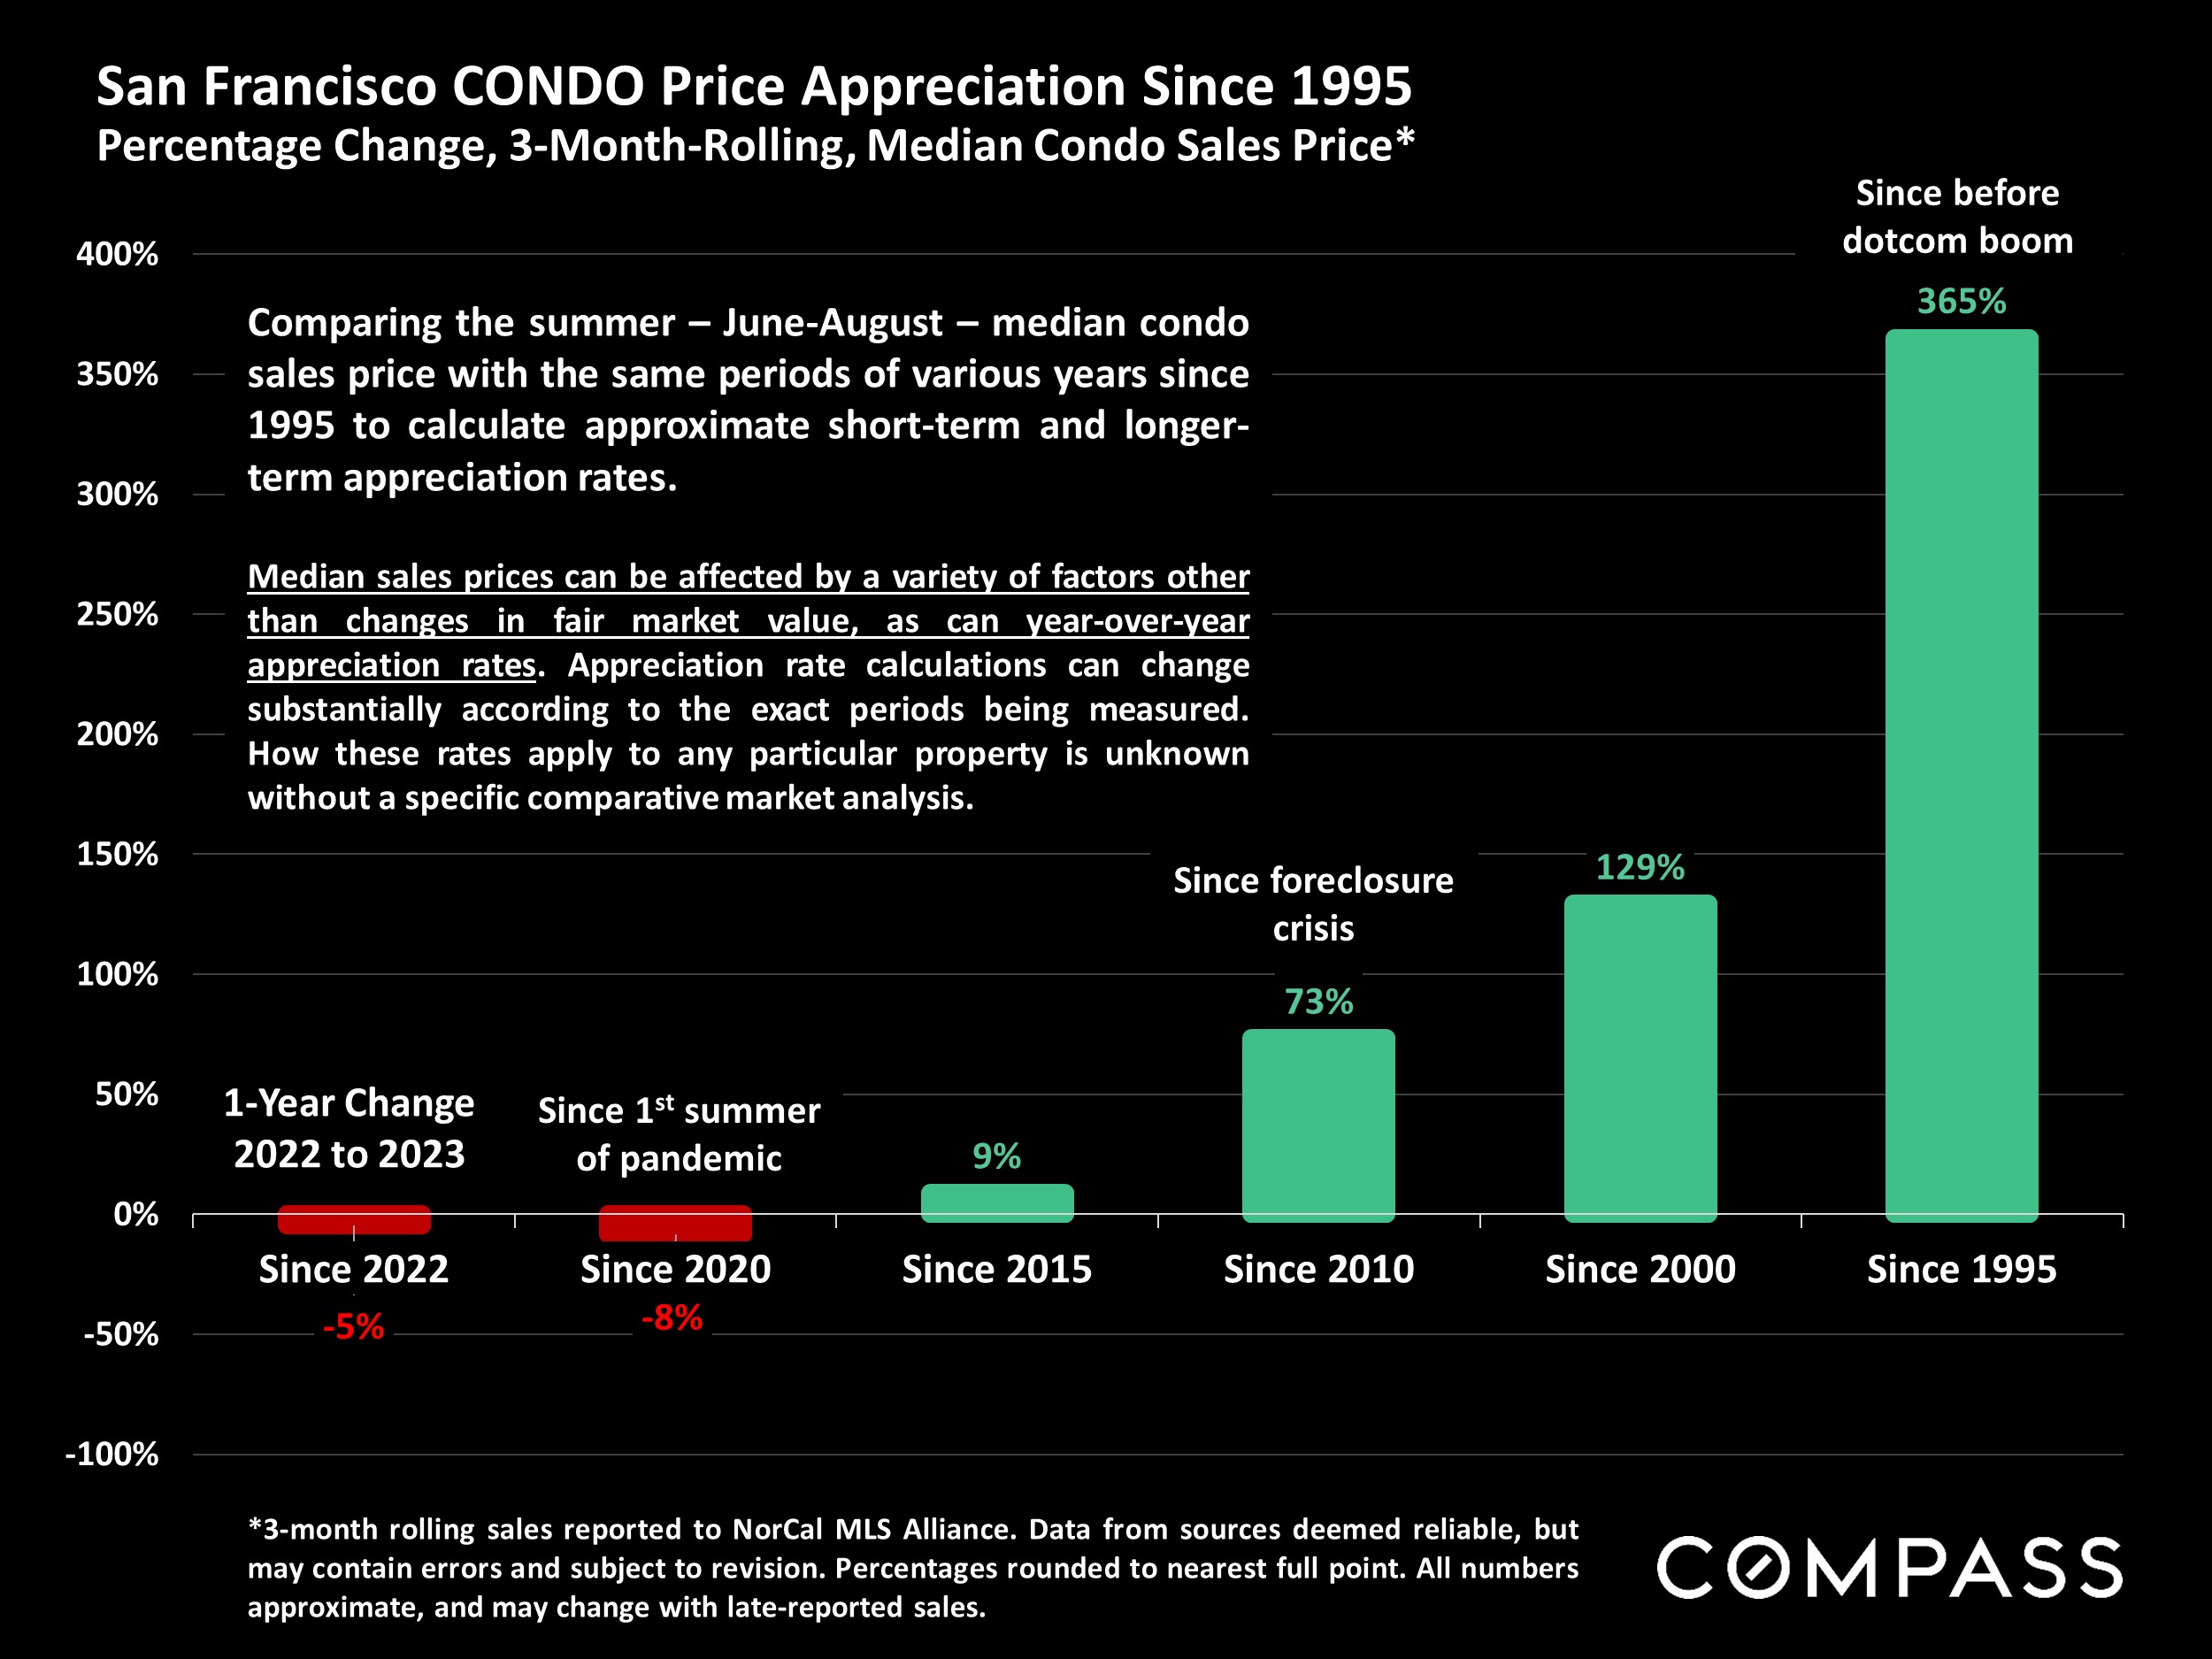
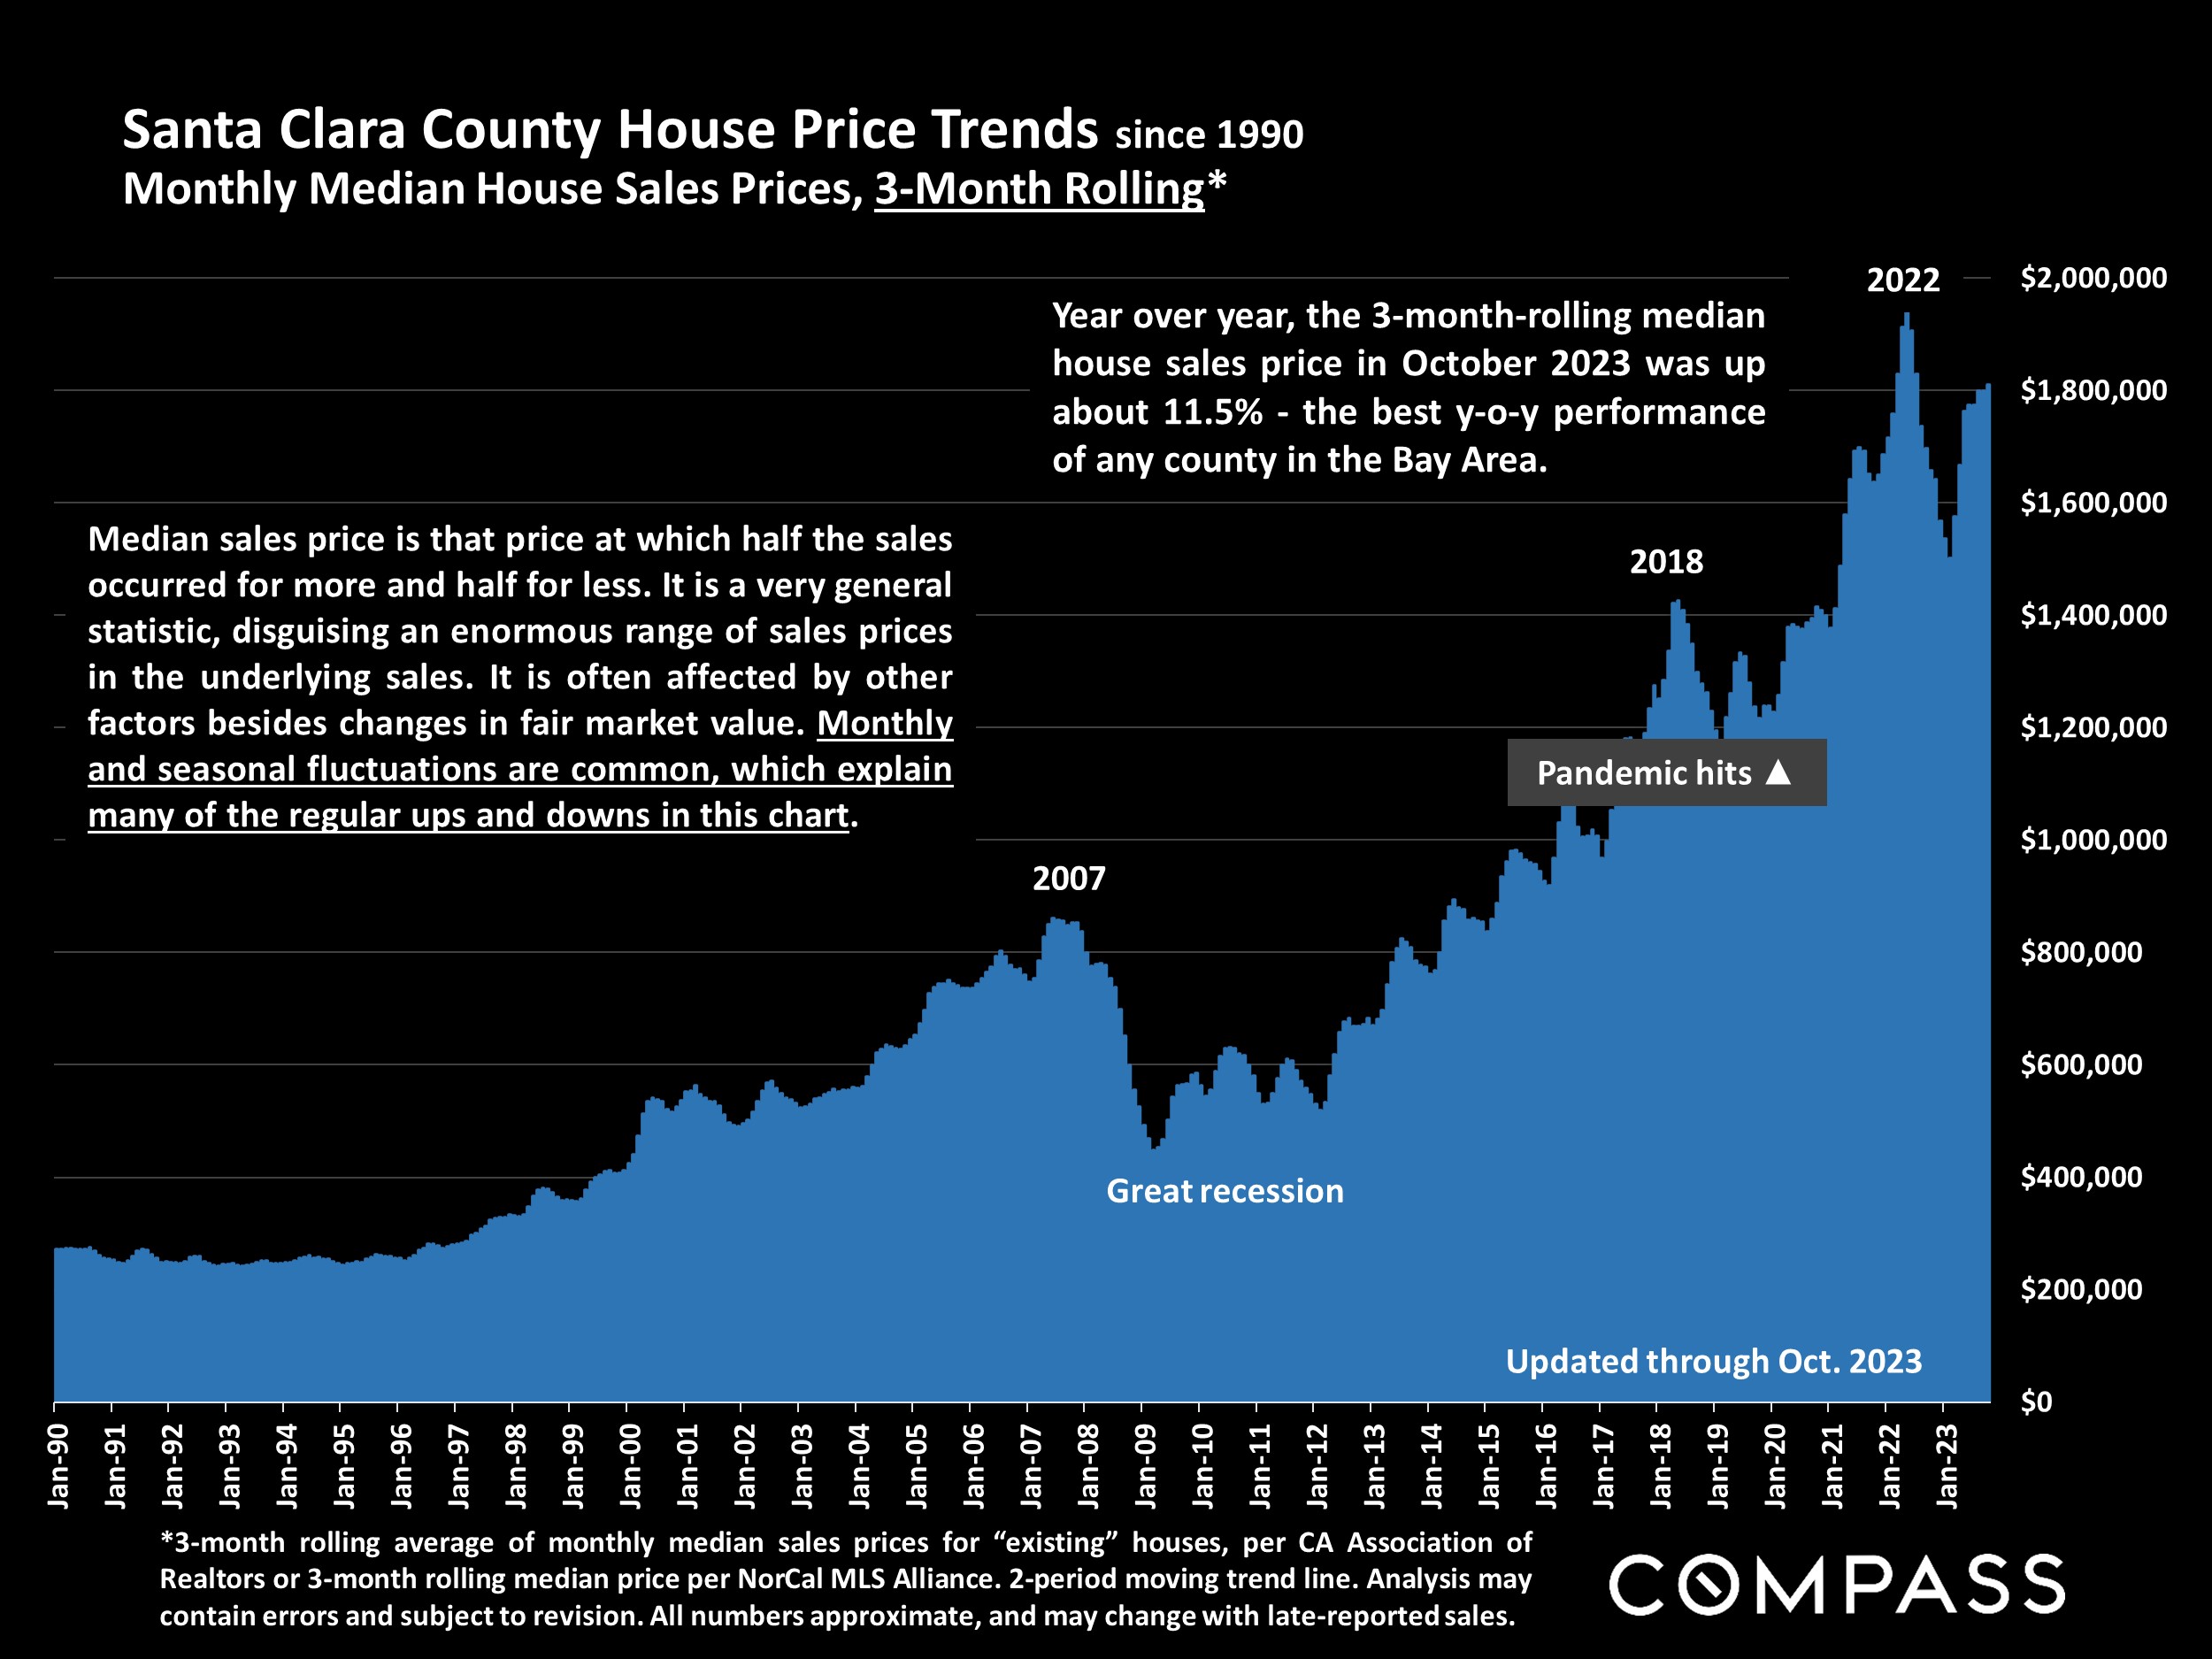
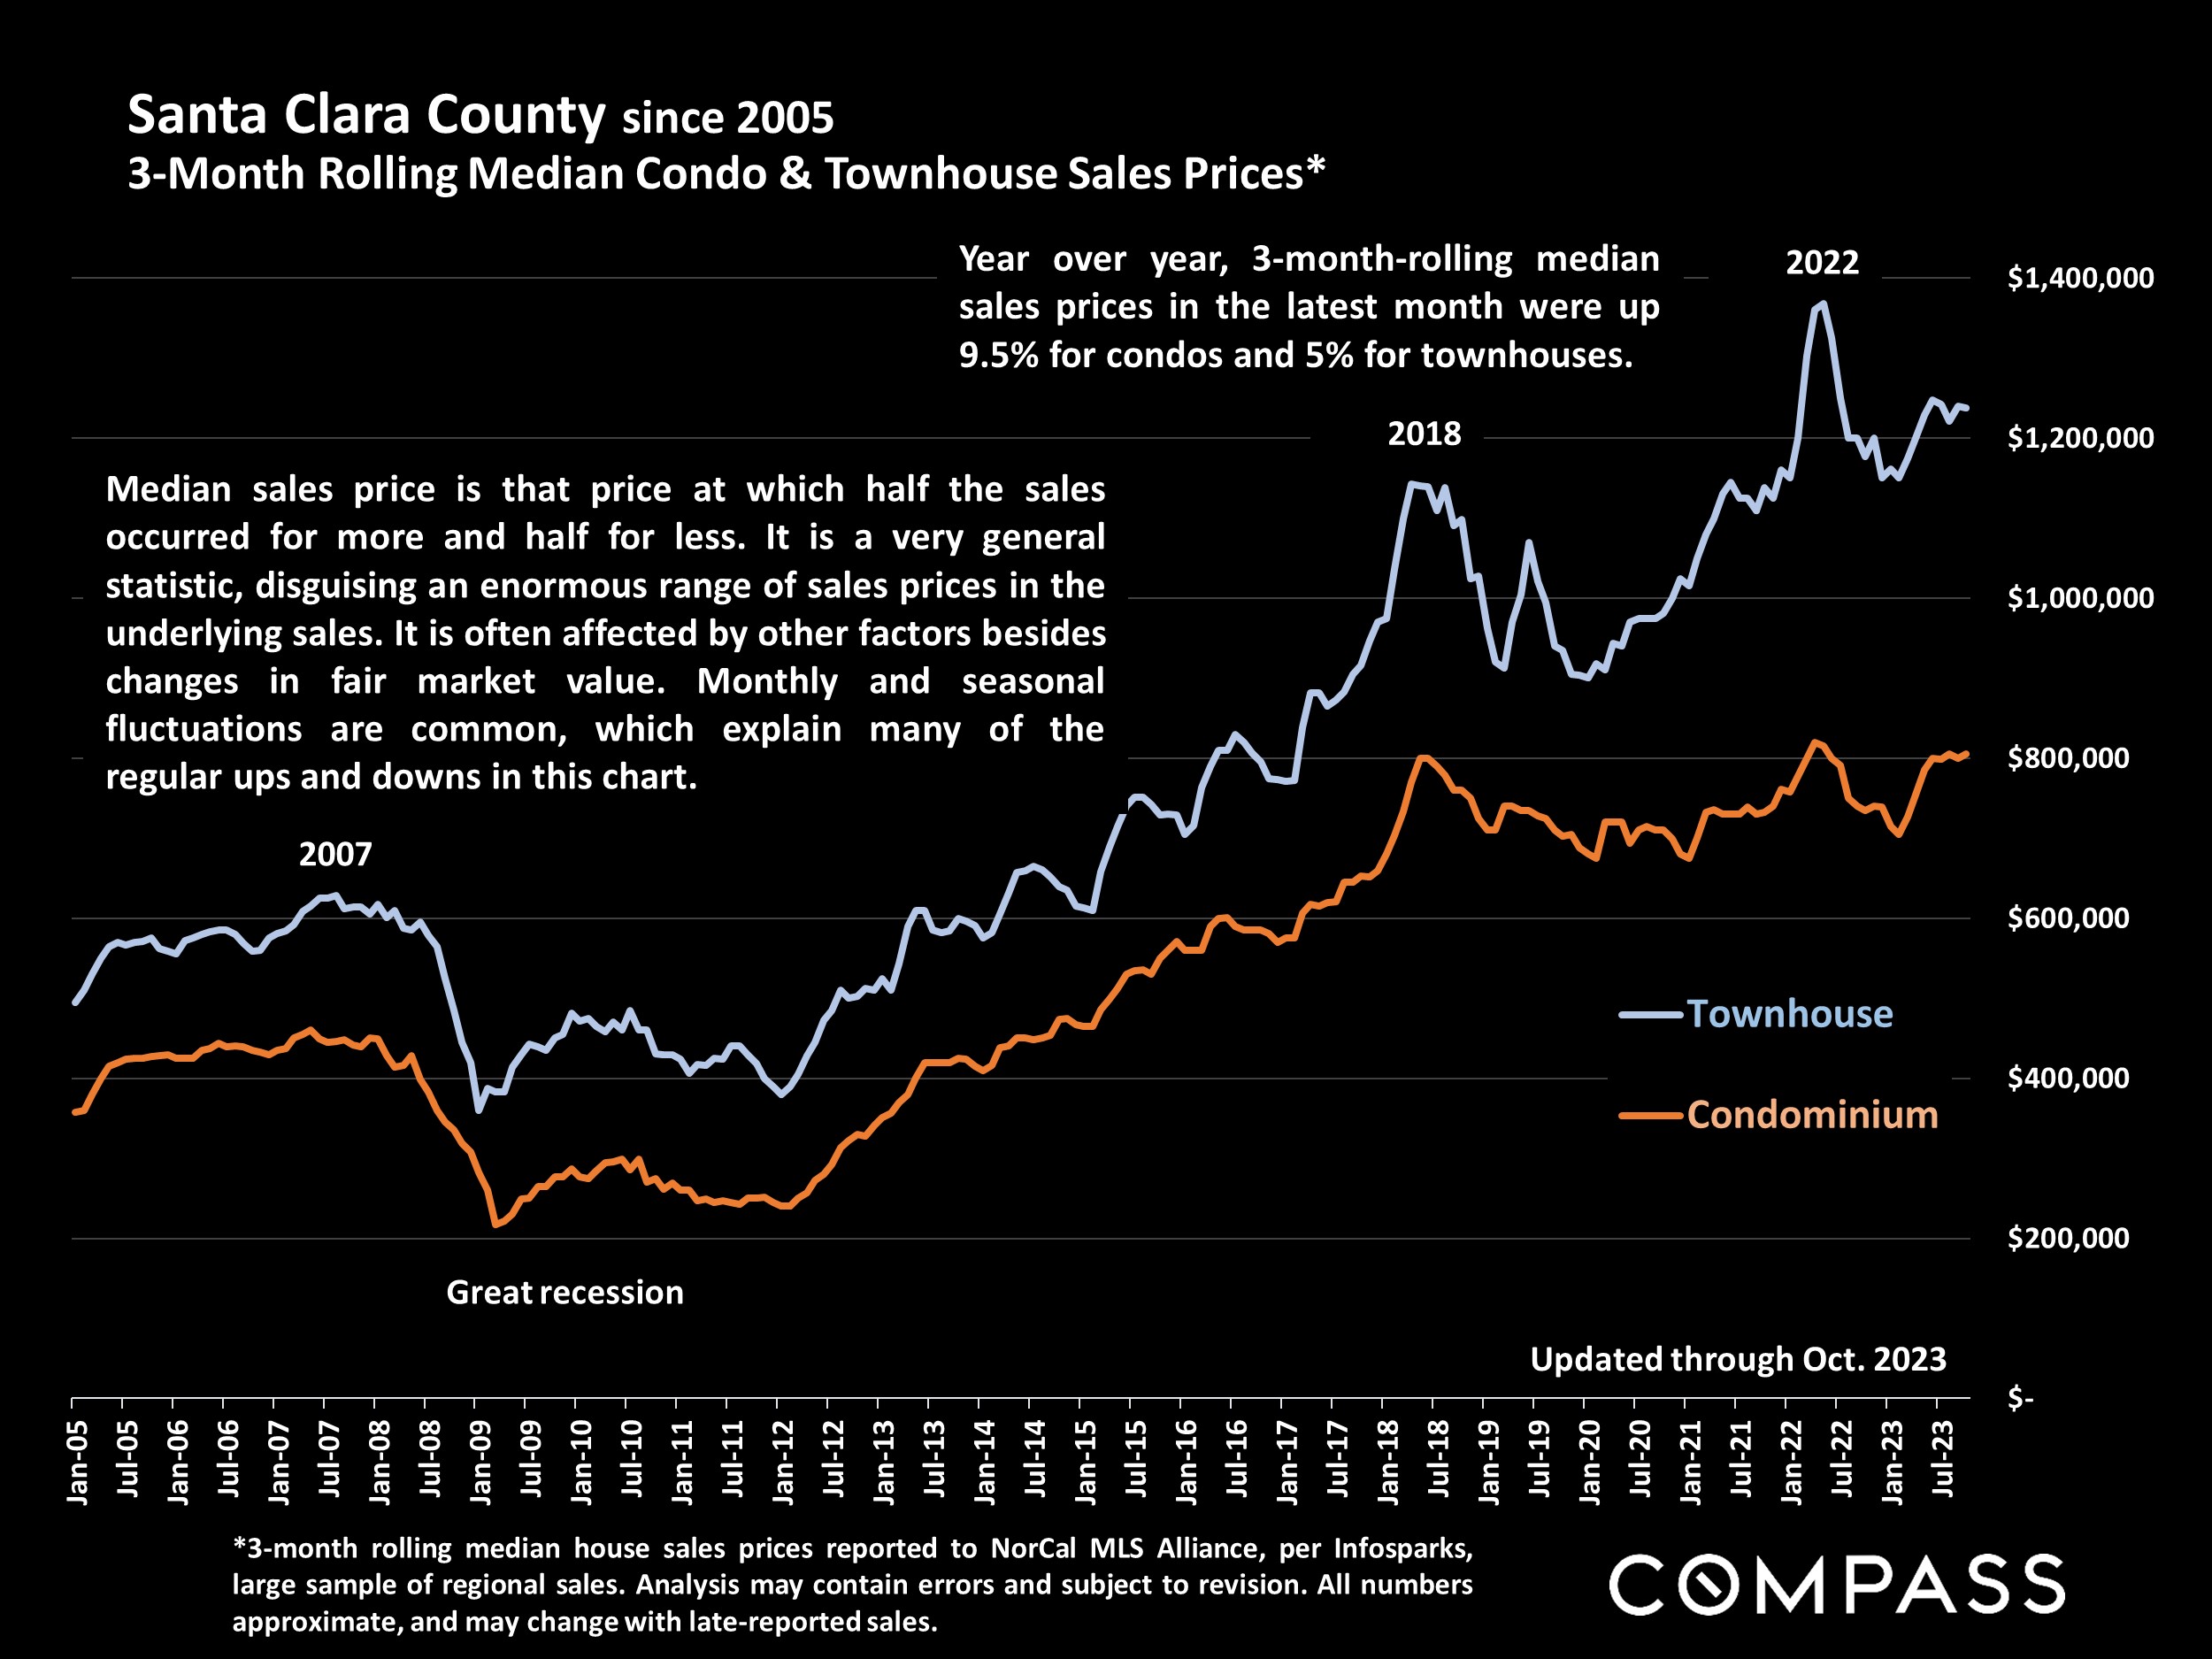
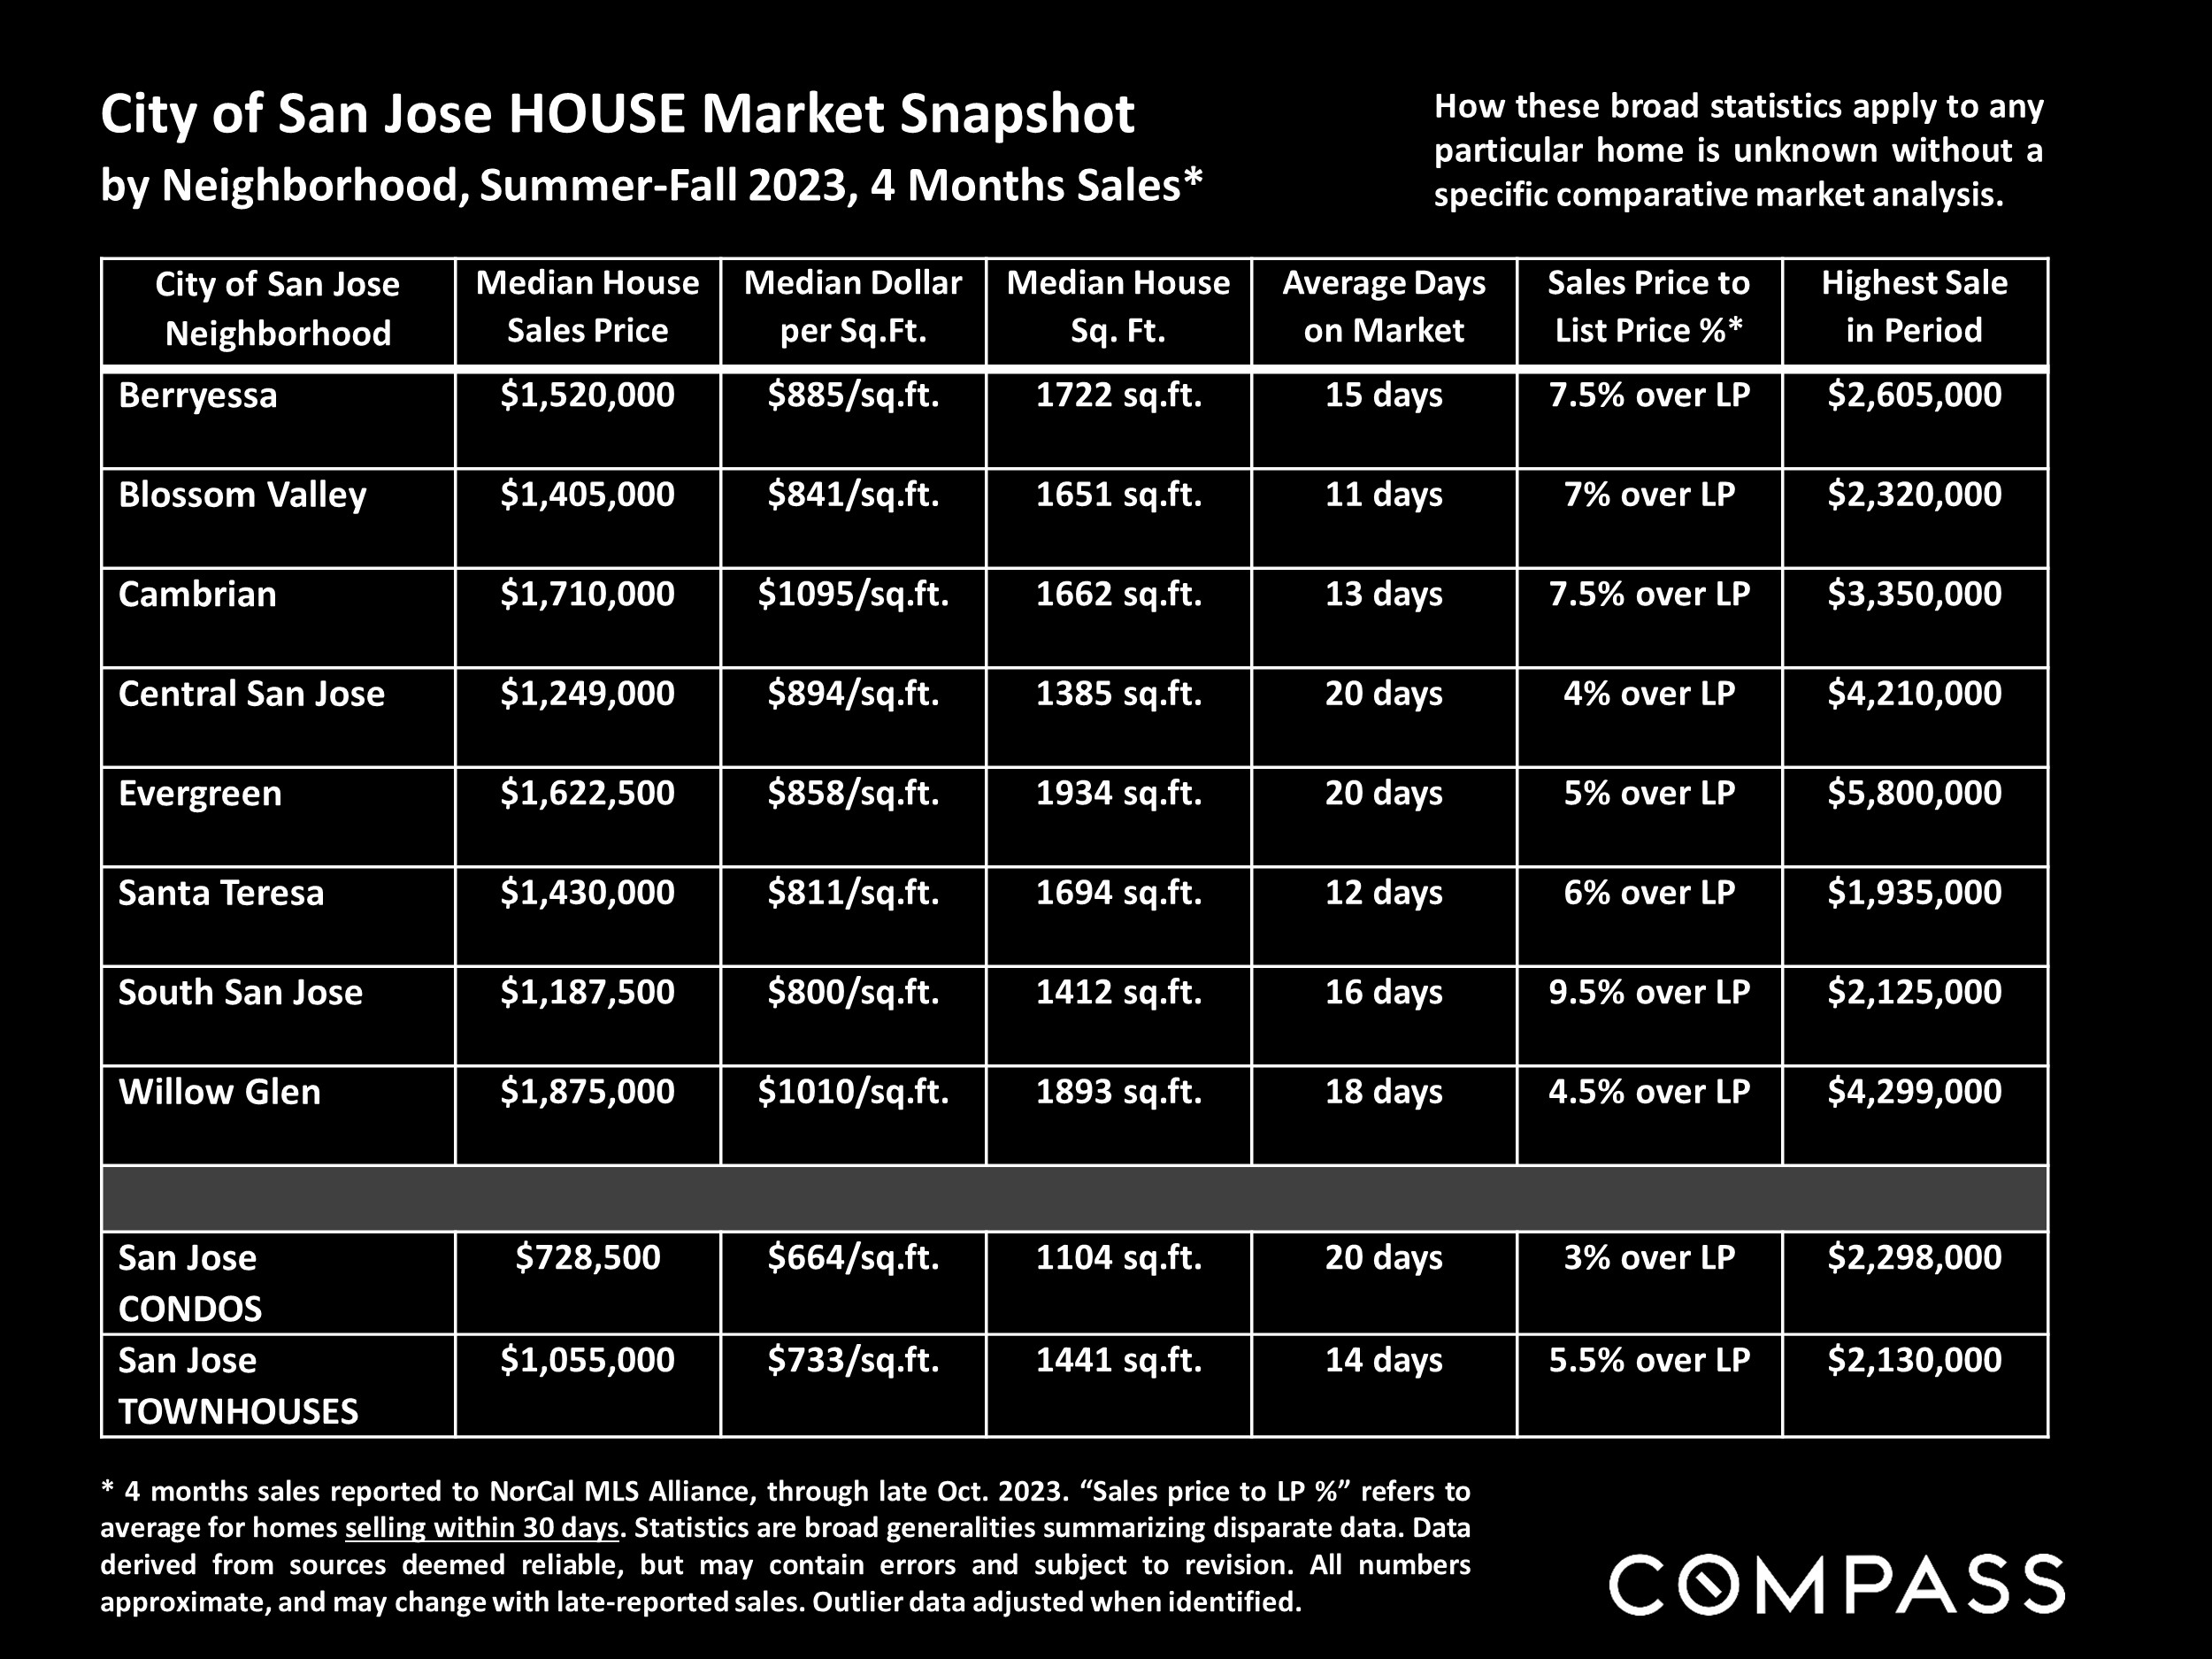
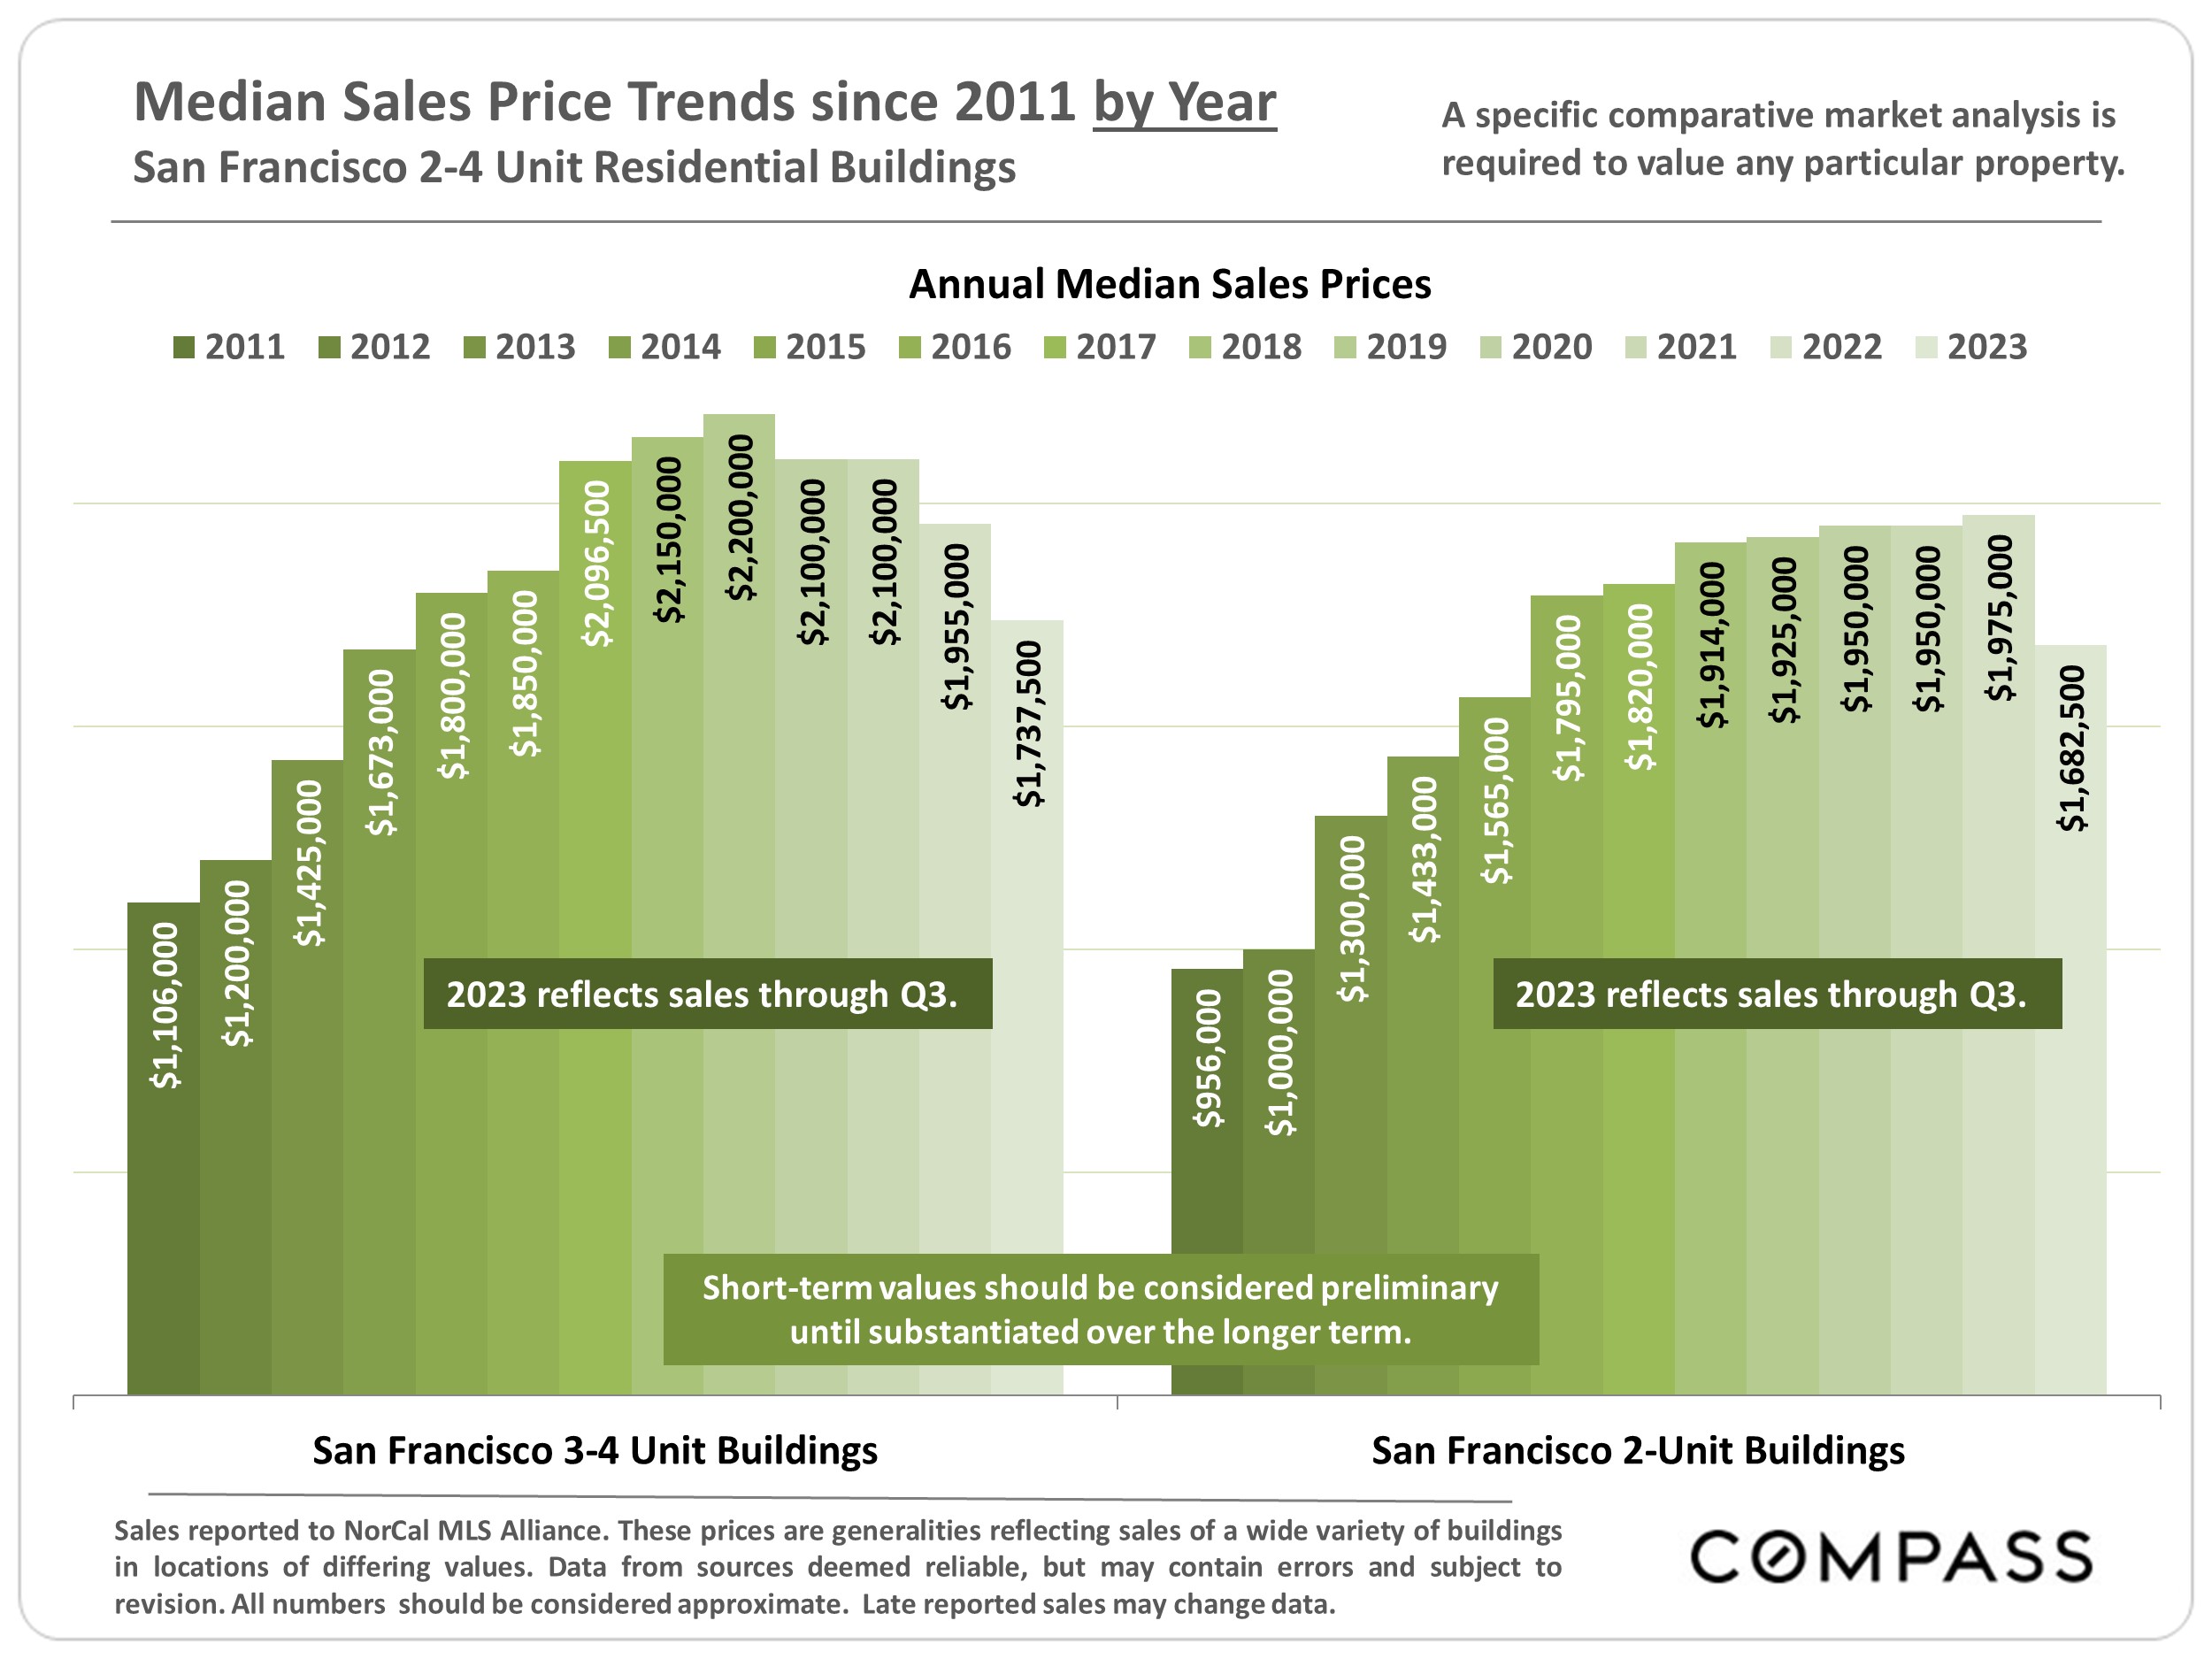
Many aspects of value cannot be adequately reflected in median and average statistics: curb appeal, age, condition, amenities, views, lot size, quality of outdoor space, “bonus” rooms, additional parking, quality of location within the neighborhood, and so on. How any of these statistics apply to any particular home is unknown without a specific comparative market analysis. Median Sales Price is that price at which half the properties sold for more and half for less. It may be affected by seasonality, “unusual” events, or changes in inventory and buying trends, as well as by changes in fair market value. The median sales price for an area will often conceal an enormous variety of sales prices in the underlying individual sales.
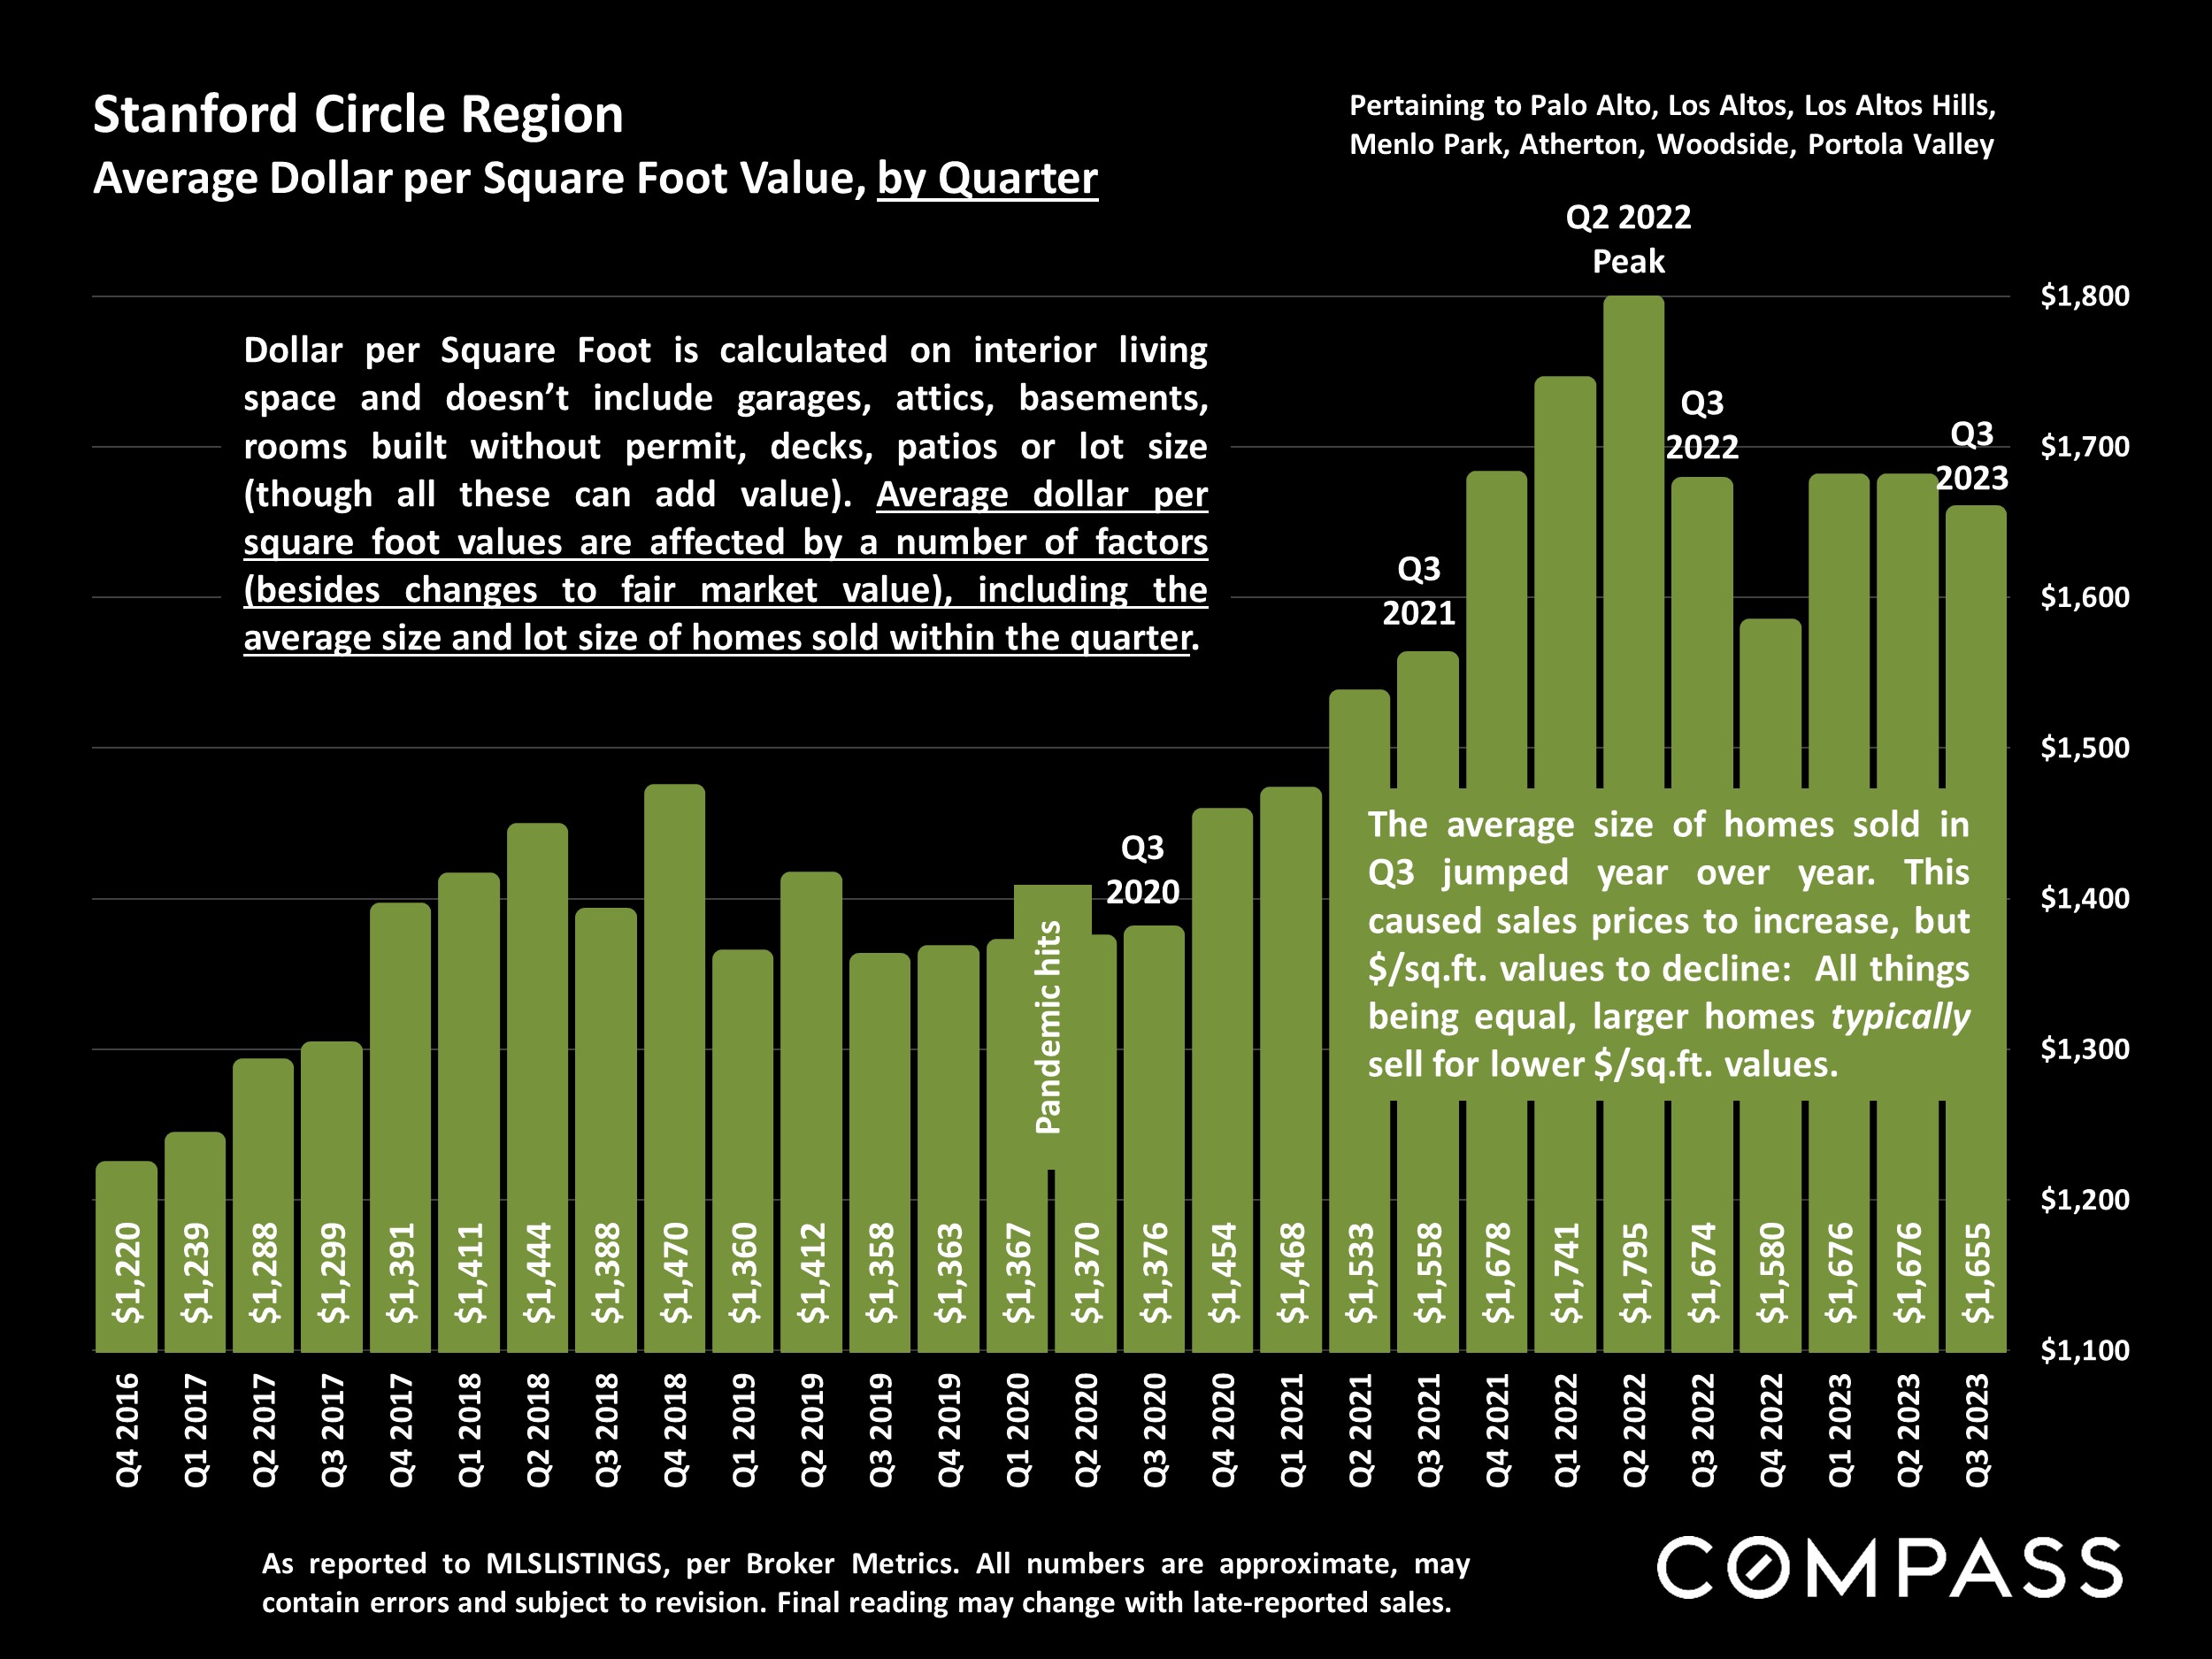
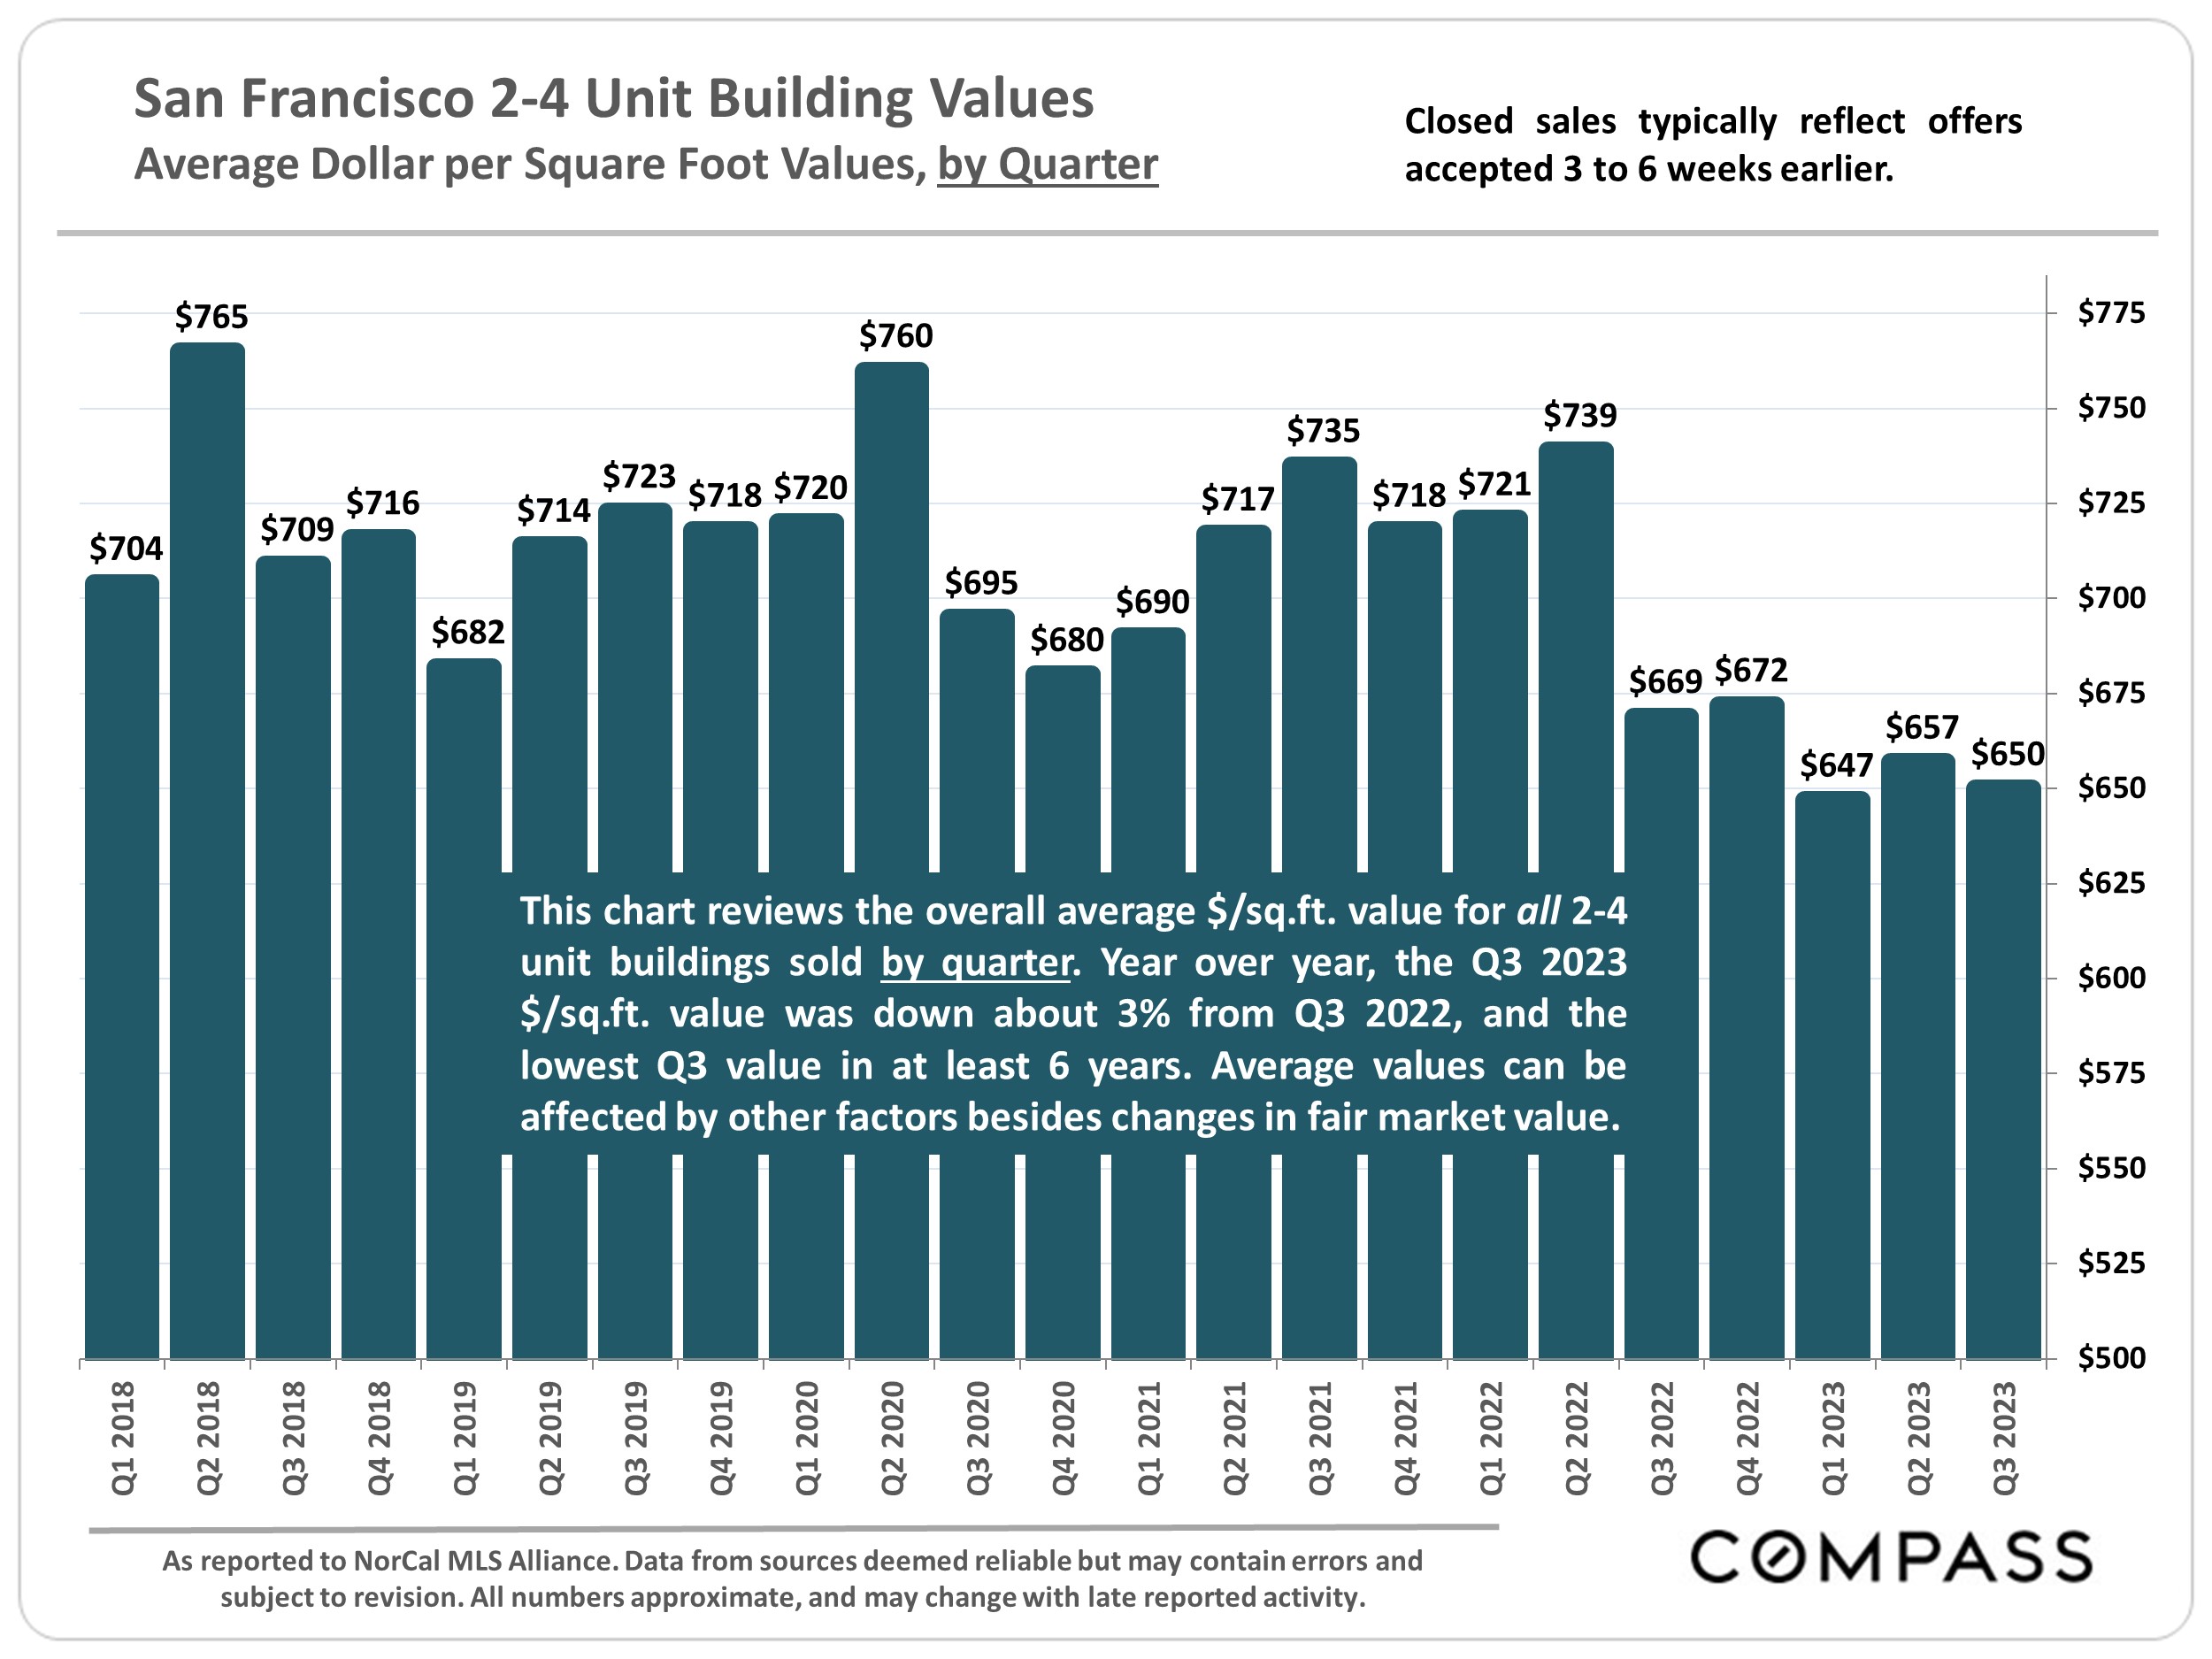
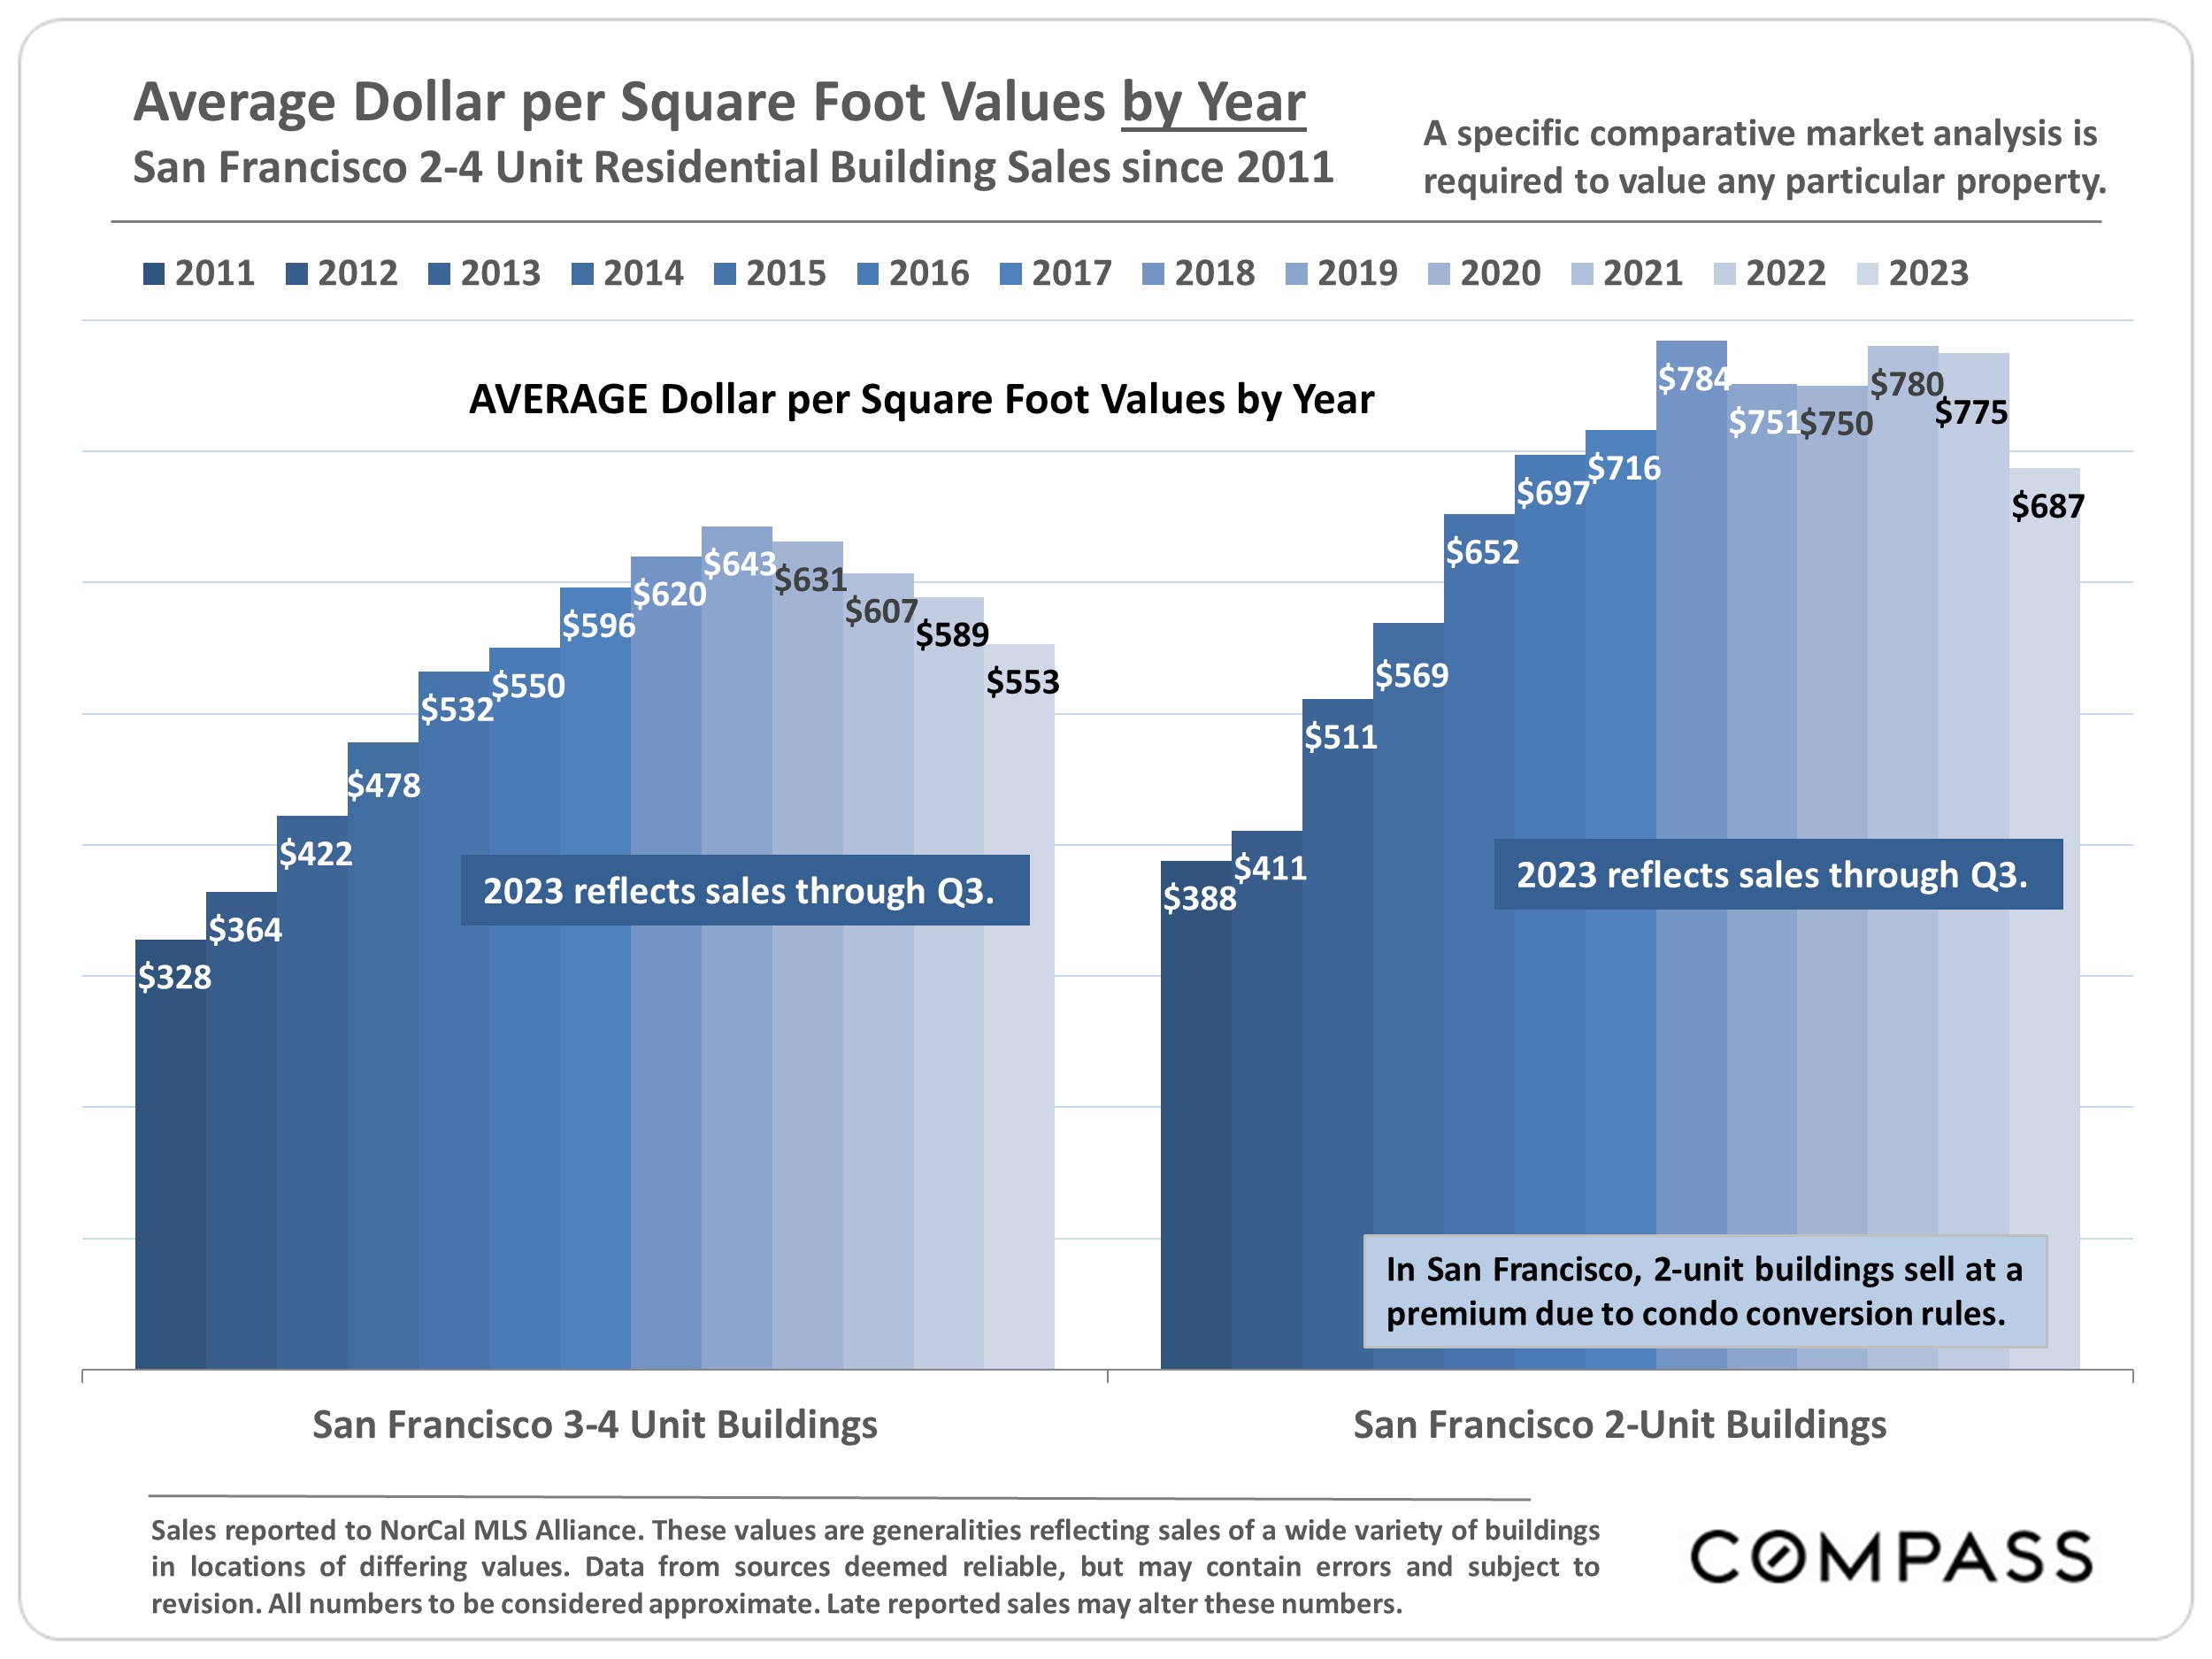
Dollar per Square Foot is based upon the home’s interior living space and does not include garages, unfinished attics and basements, rooms built without permit, patios, decks or yards (though all those can add value to a home). These figures are usually derived from appraisals or tax records, but are sometimes unreliable (especially for older homes) or unreported altogether. The calculation can only be made on those home sales that reported square footage.
Photo use under the Creative Commons License: https://creativecommons.org/licenses/by-sa/2.0/
Compass is a real estate broker licensed by the State of California, DRE 01527235. Equal Housing Opportunity. This report has been prepared solely for information purposes. The information herein is based on or derived from information generally available to the public and/or from sources believed to be reliable. No representation or warranty can be given with respect to the accuracy or completeness of the information. Compass disclaims any and all liability relating to this report, including without limitation any express or implied representations or warranties for statements contained in, and omissions from, the report. Nothing contained herein is intended to be or should be read as any regulatory, legal, tax, accounting or other advice and Compass does not provide such advice. All opinions are subject to change without notice. Compass makes no representation regarding the accuracy of any statements regarding any references to the laws, statutes or regulations of any state are those of the author(s). Past performance is no guarantee of future results.
Economic indicators have been challenging since the fall selling season began: Interest rates continued to rise through early October and stock markets generally continued to fall from mid- summer, YTD highs. Markets remain volatile and hard to predict, often reacting negatively to positive economic news (such as employment numbers) as they wait for new inflation numbers and try to parse the possible reaction of the Fed. Any definitive impacts on real estate of these recent developments, should they continue, won’t substantially show up until Q4 data begins to become available, and, of course, volatility also means that indicators can turn around quickly.
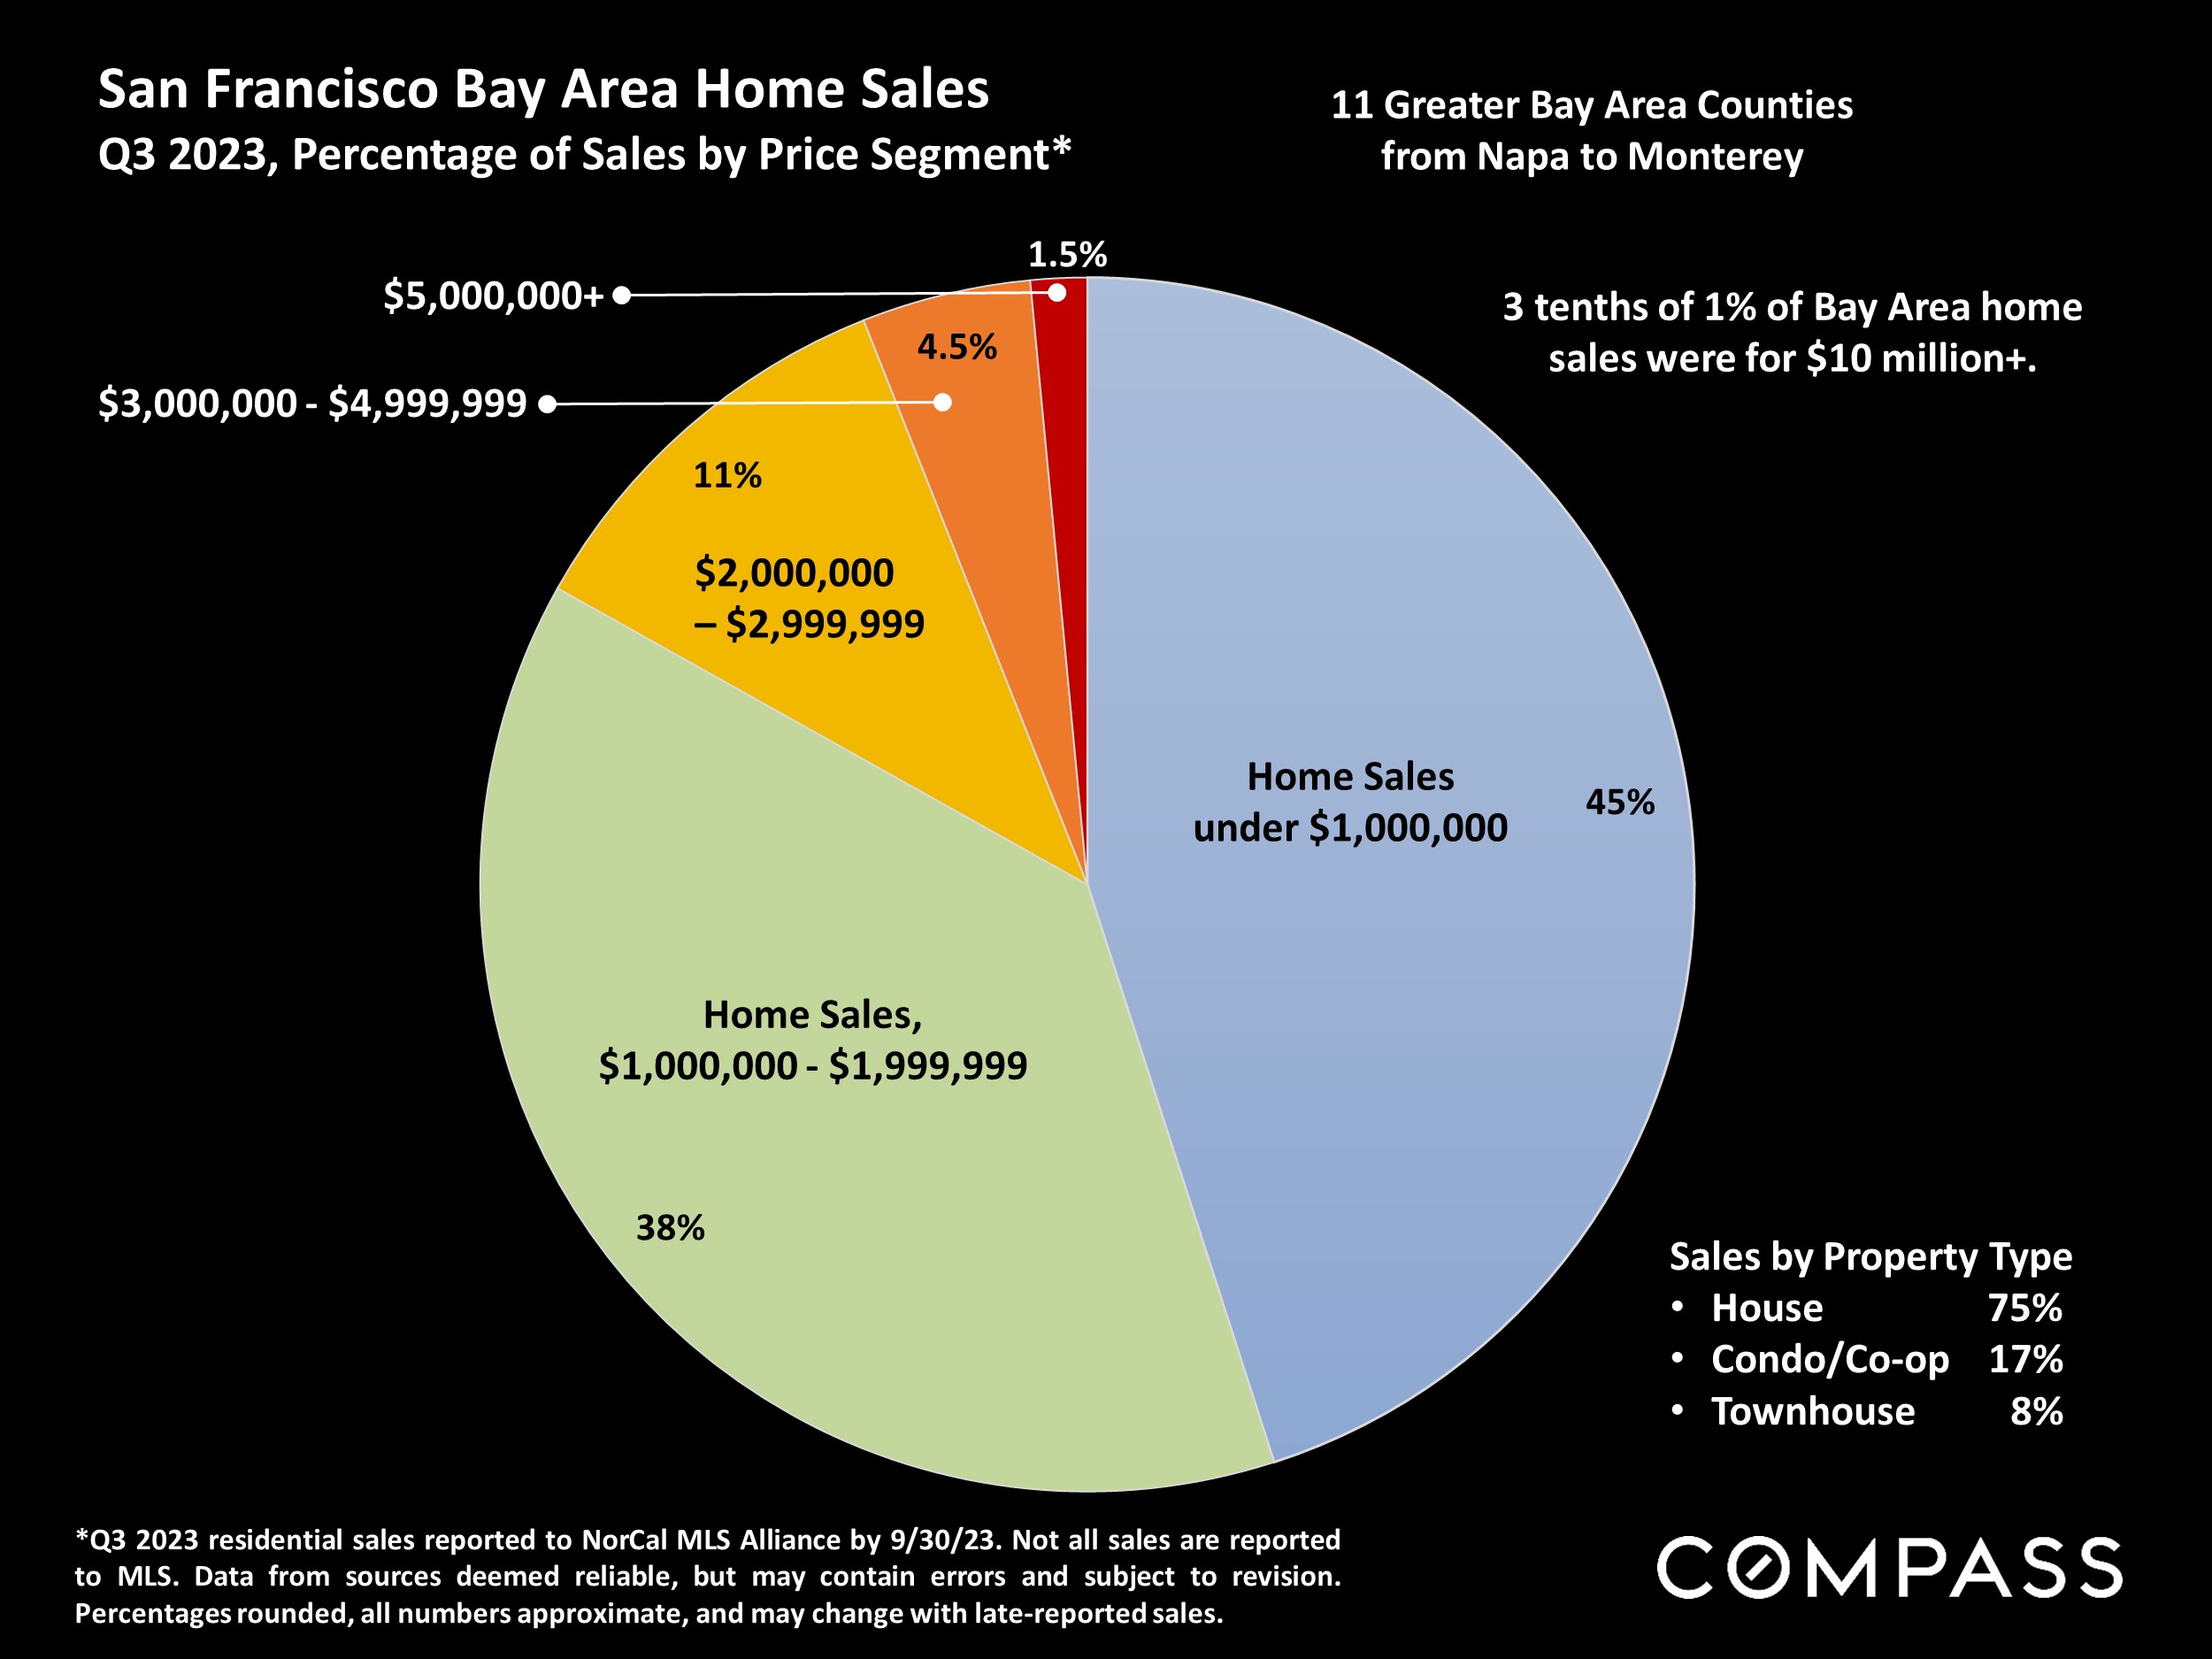
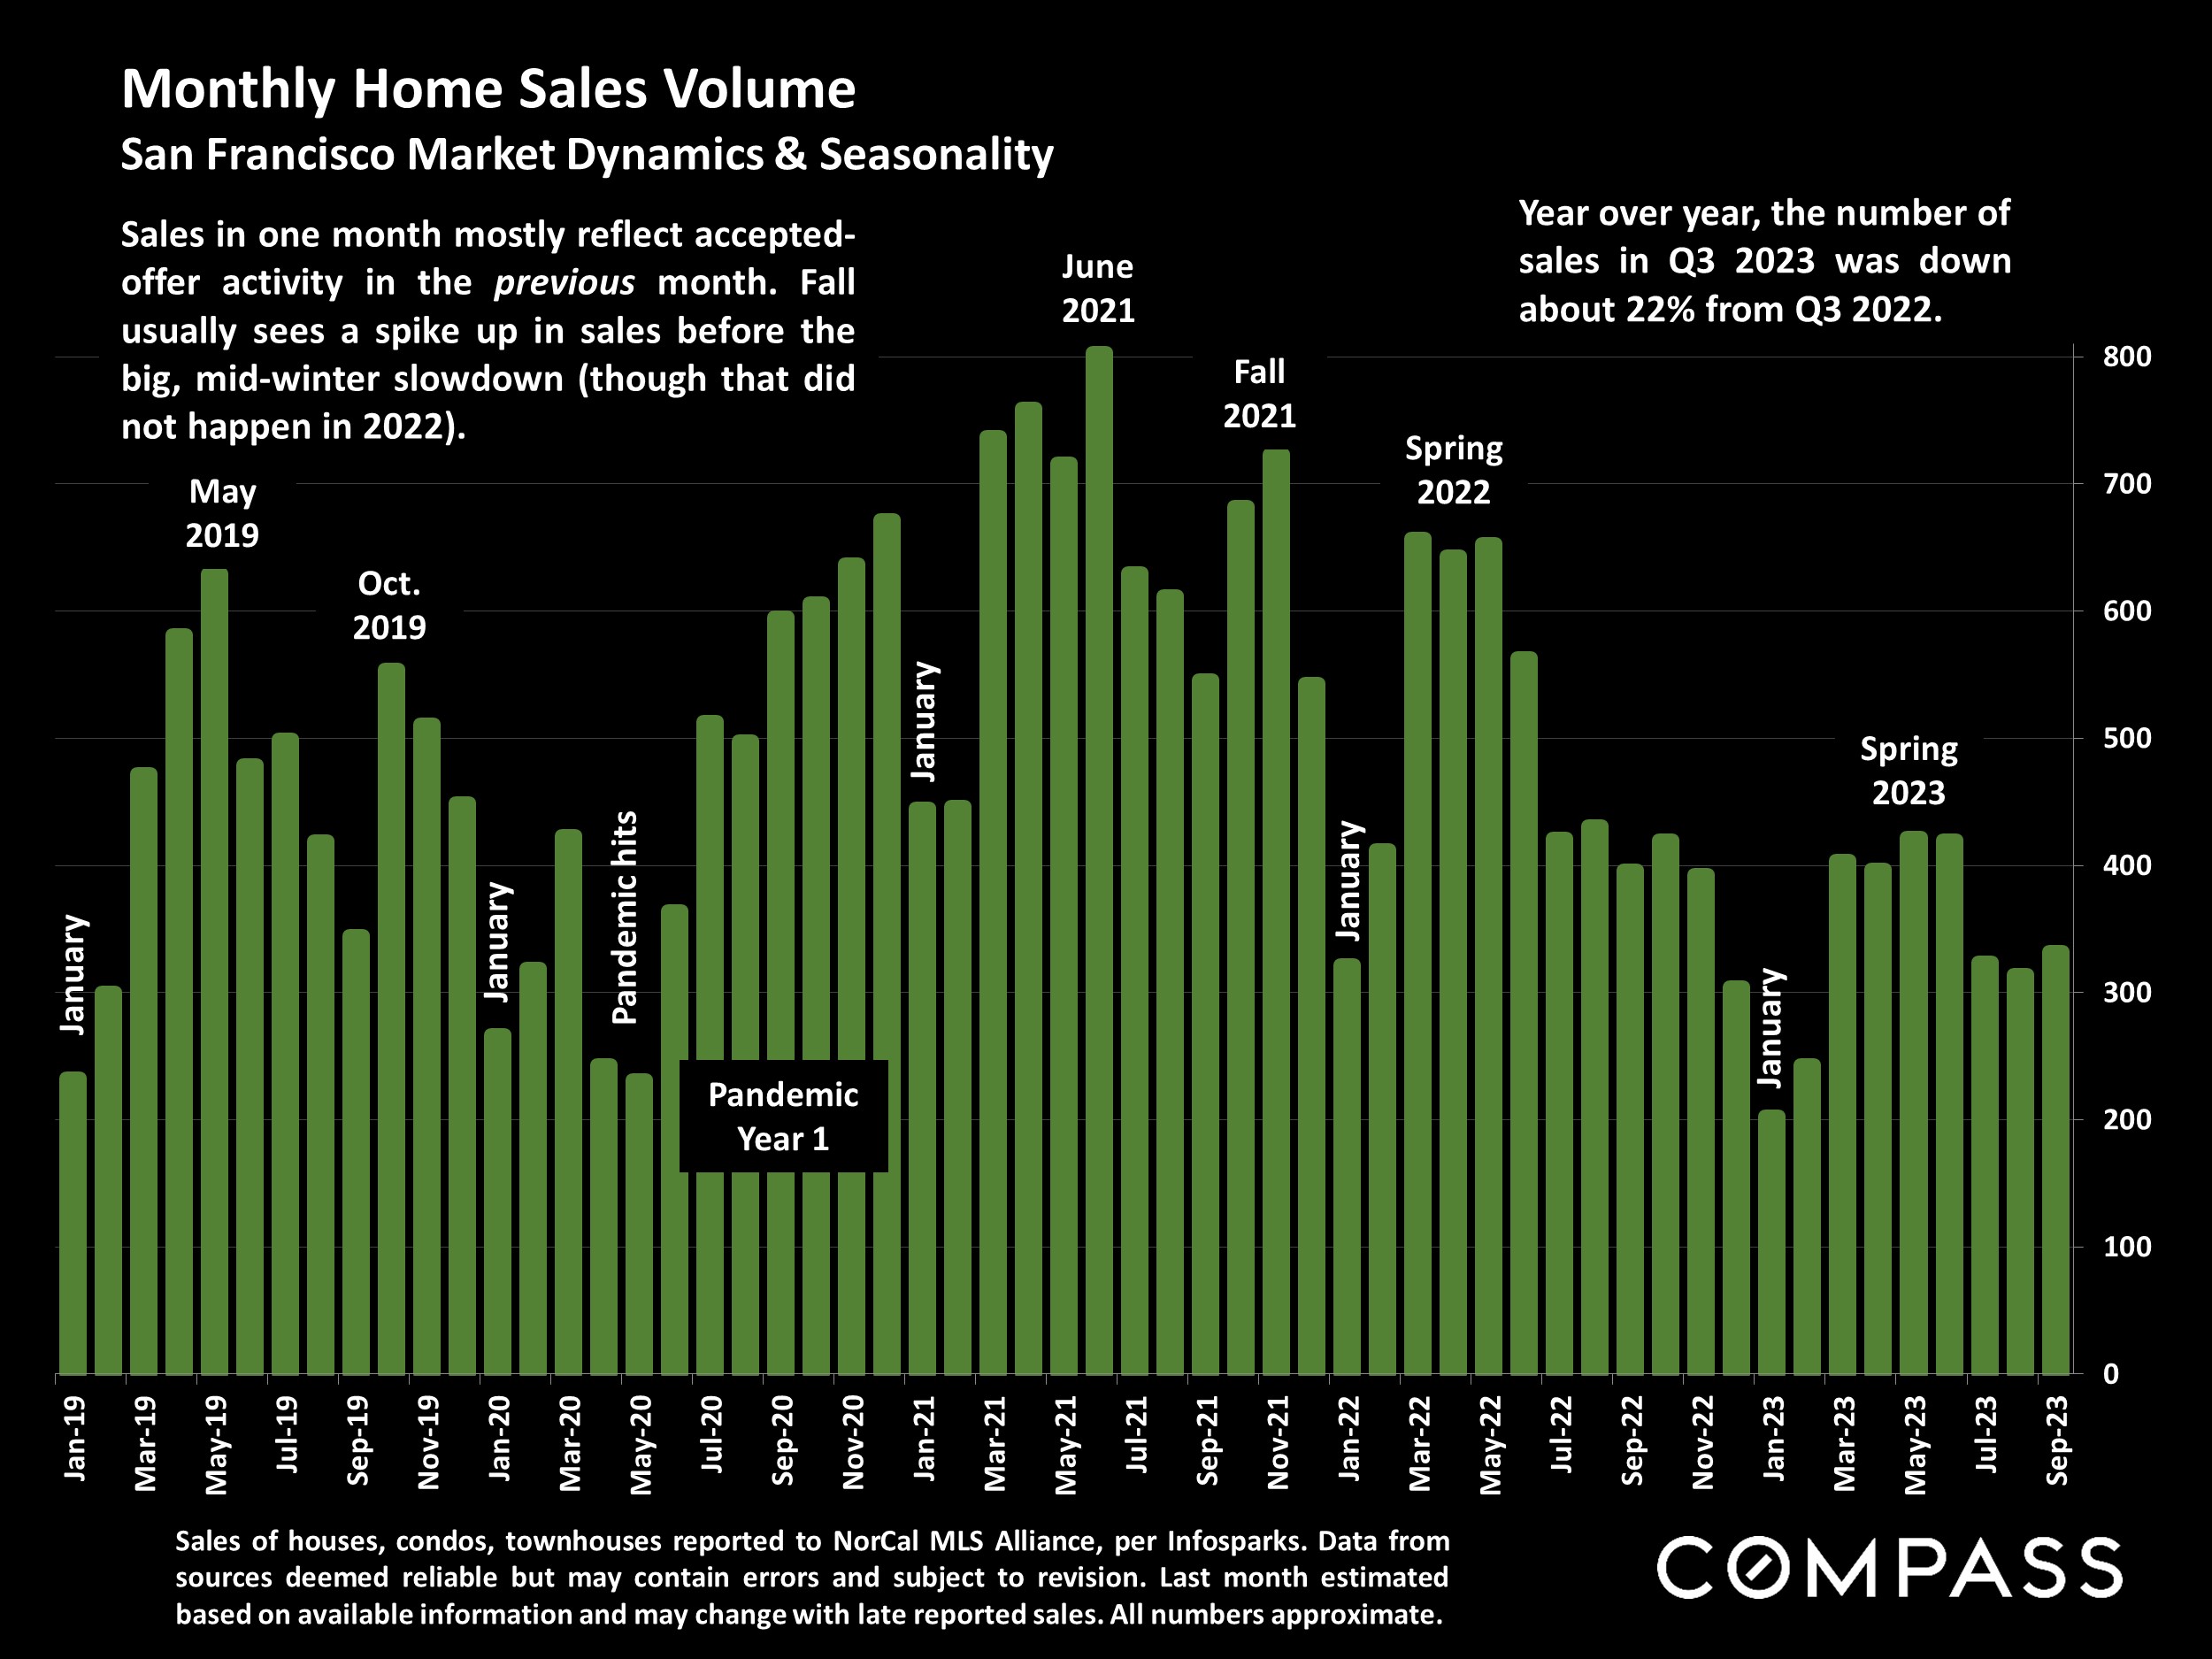
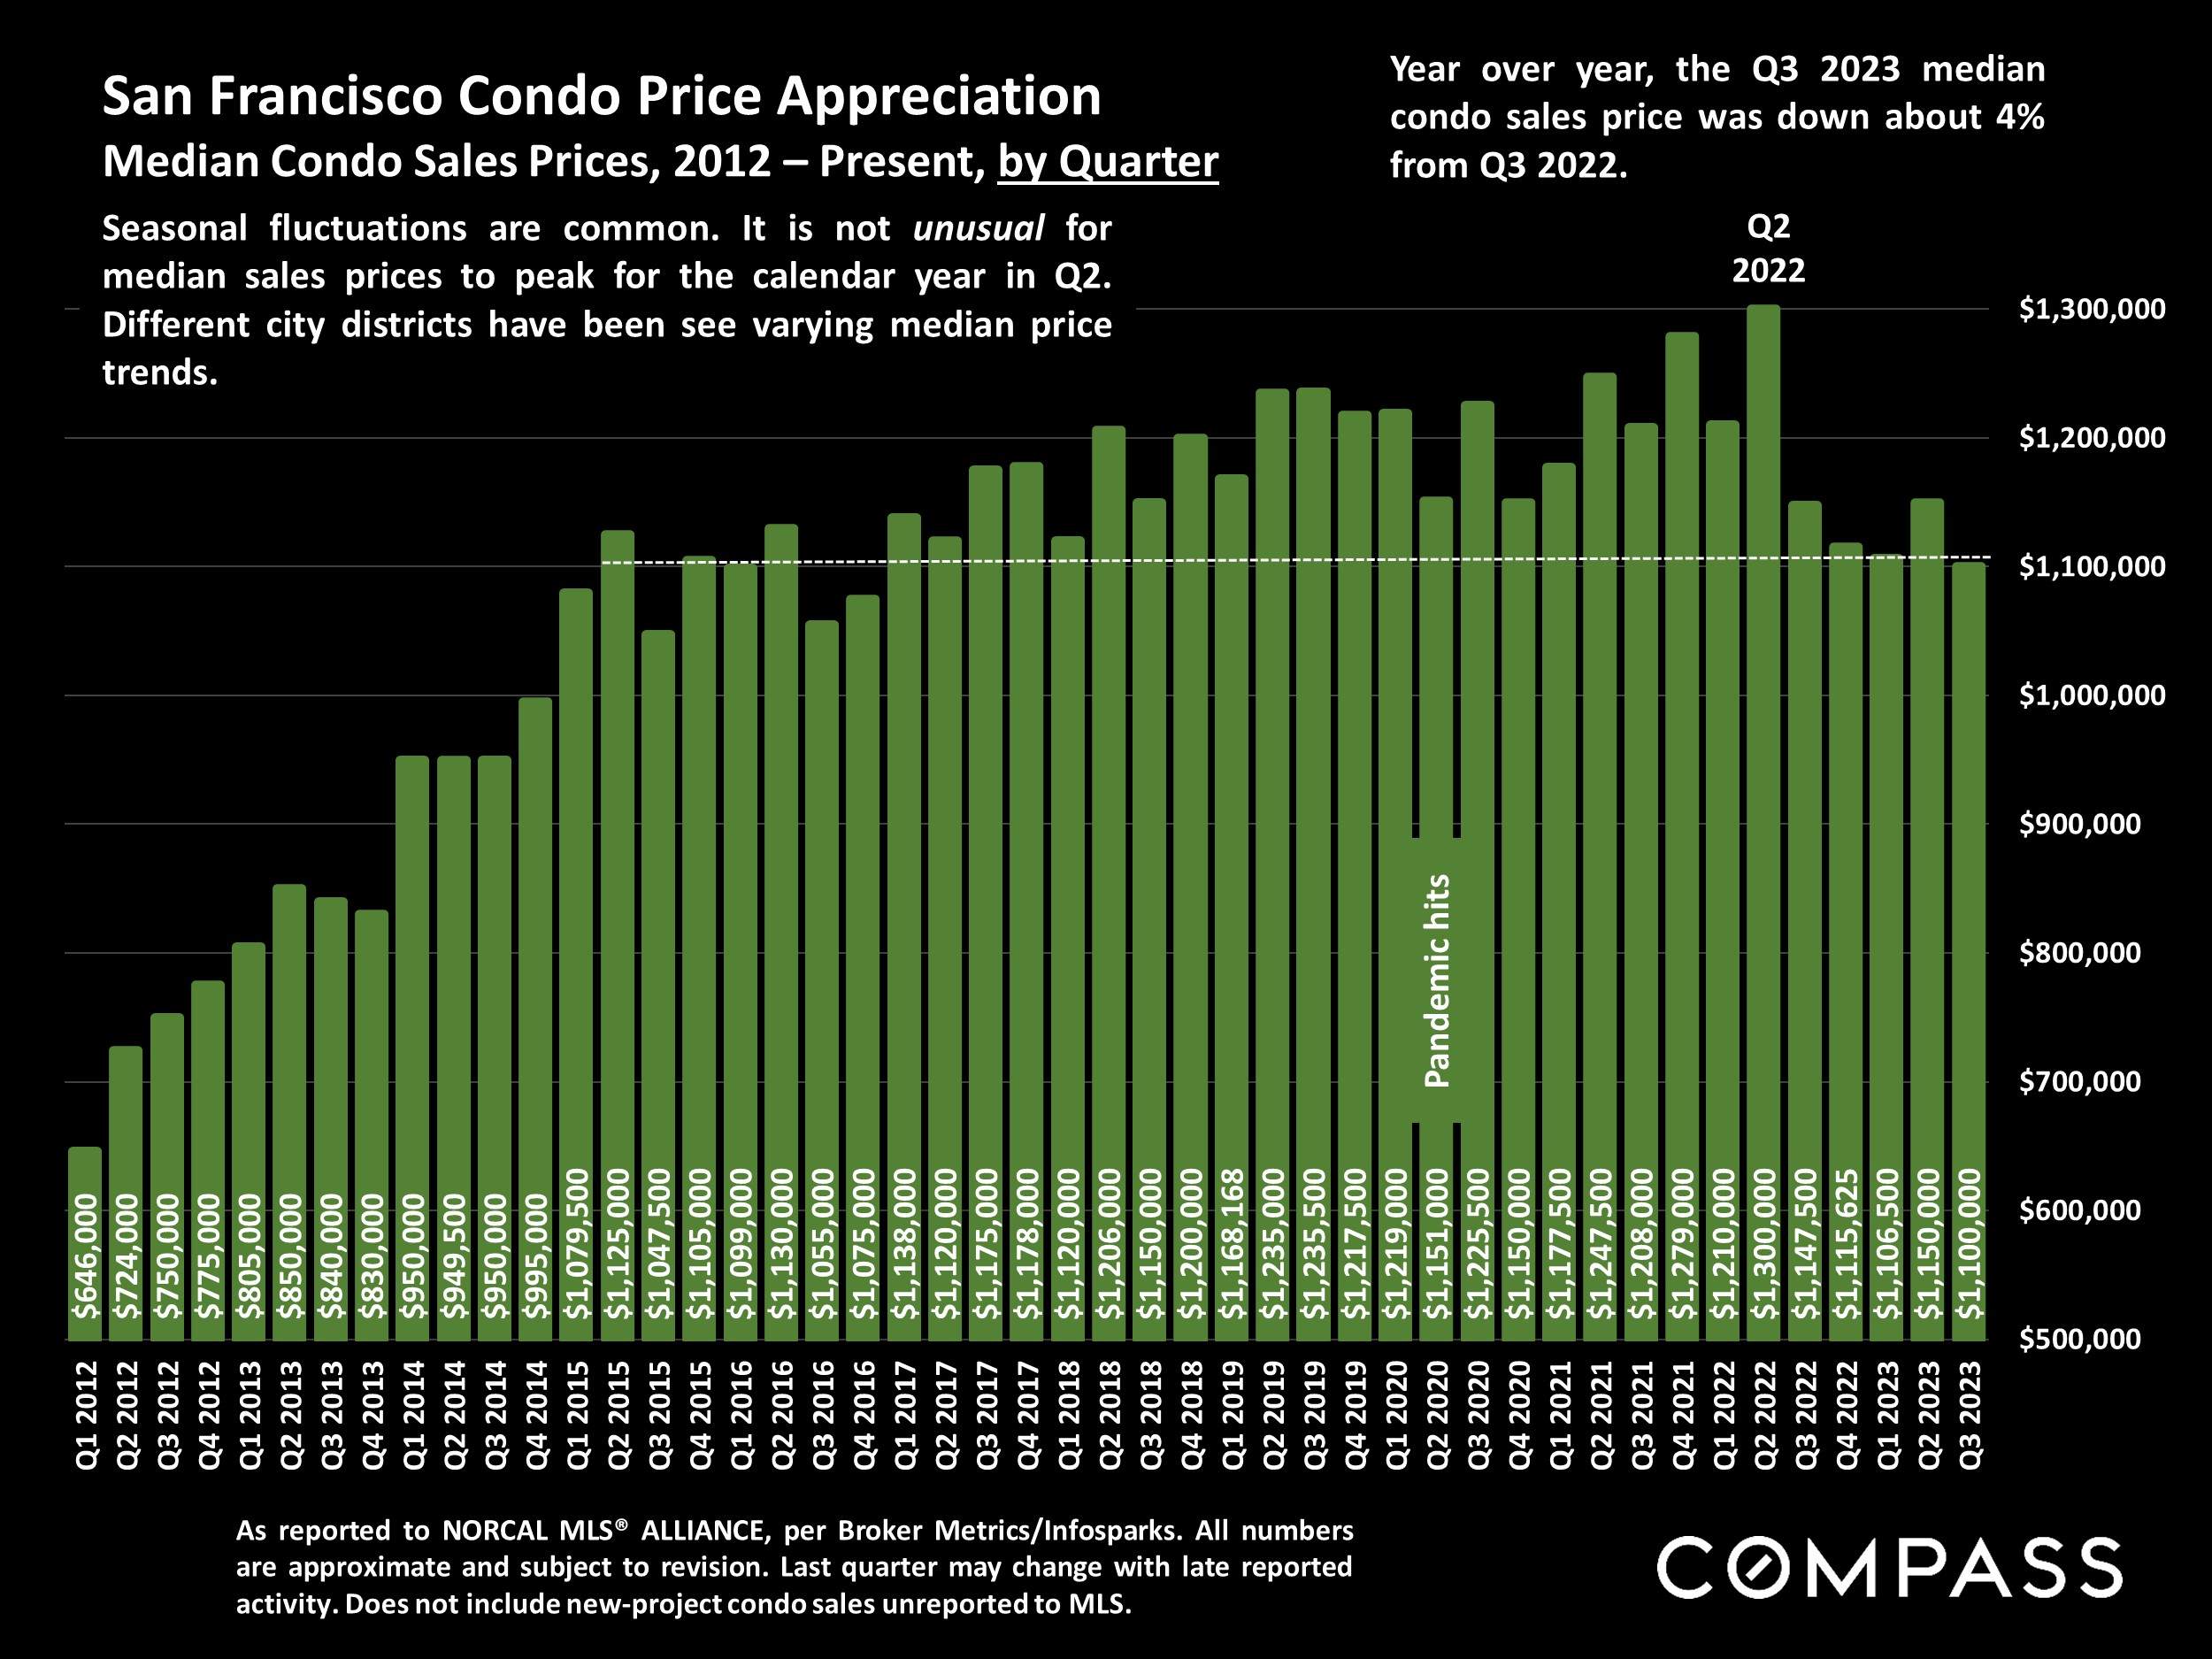
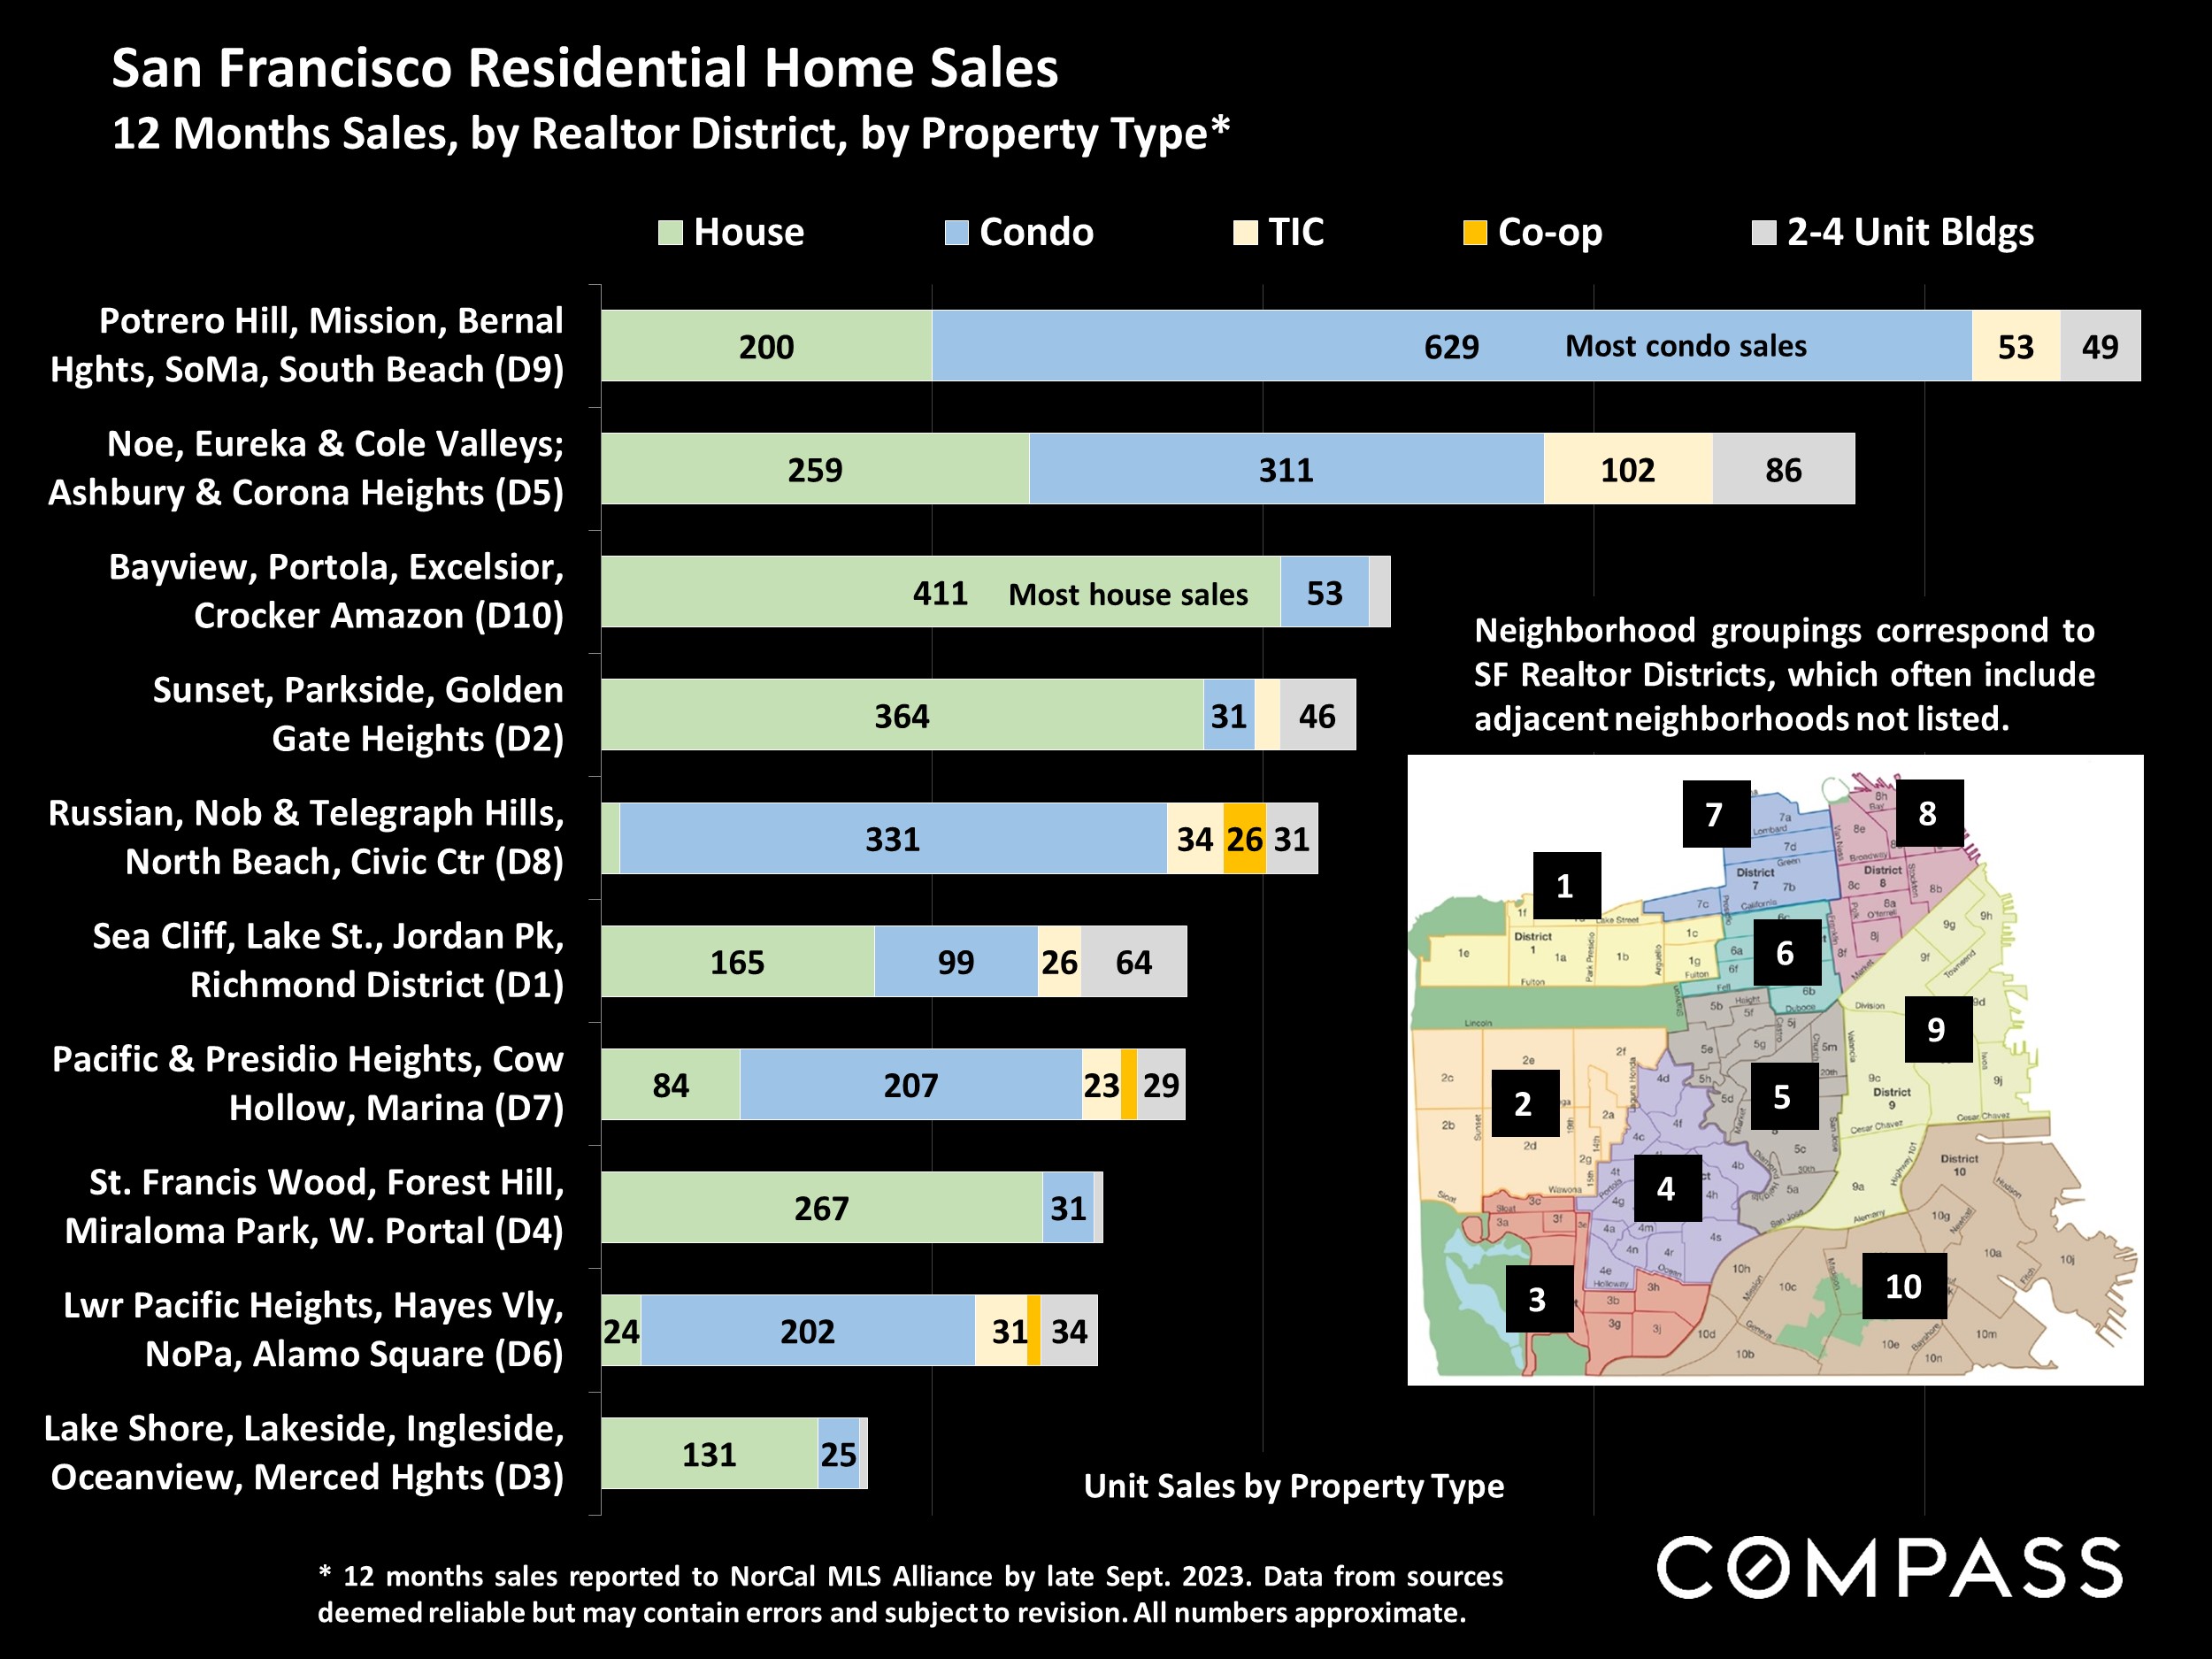
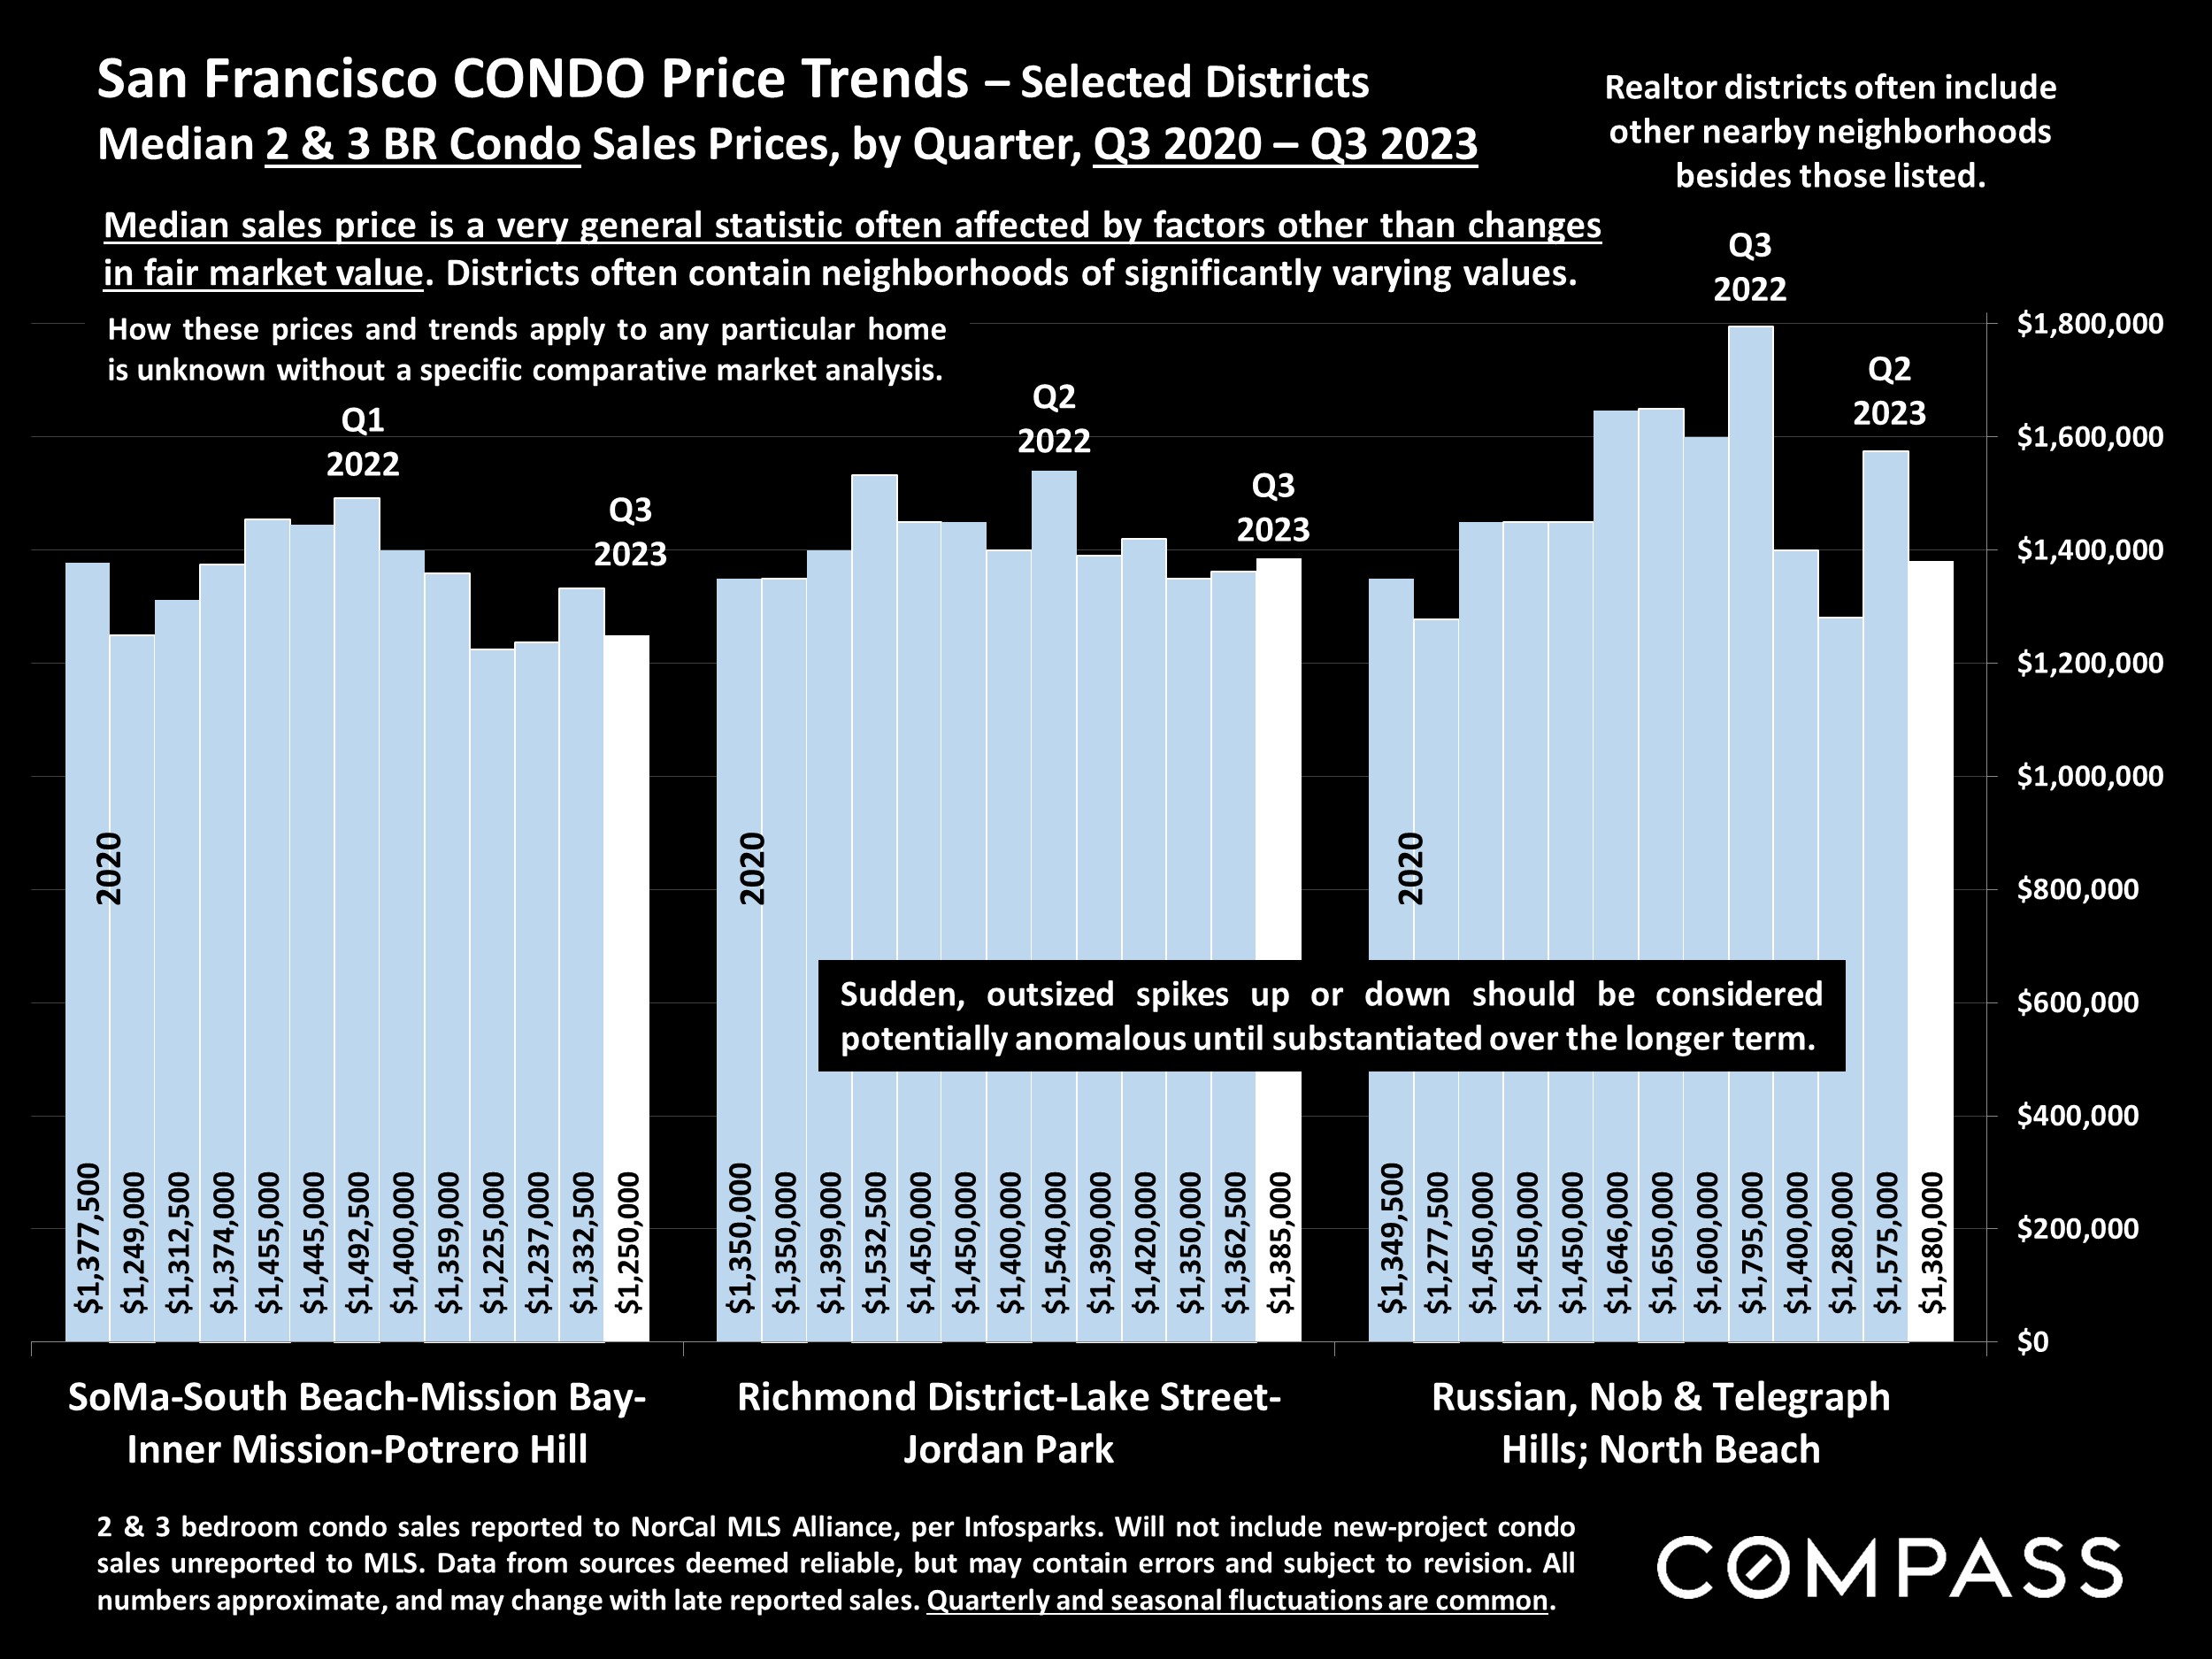
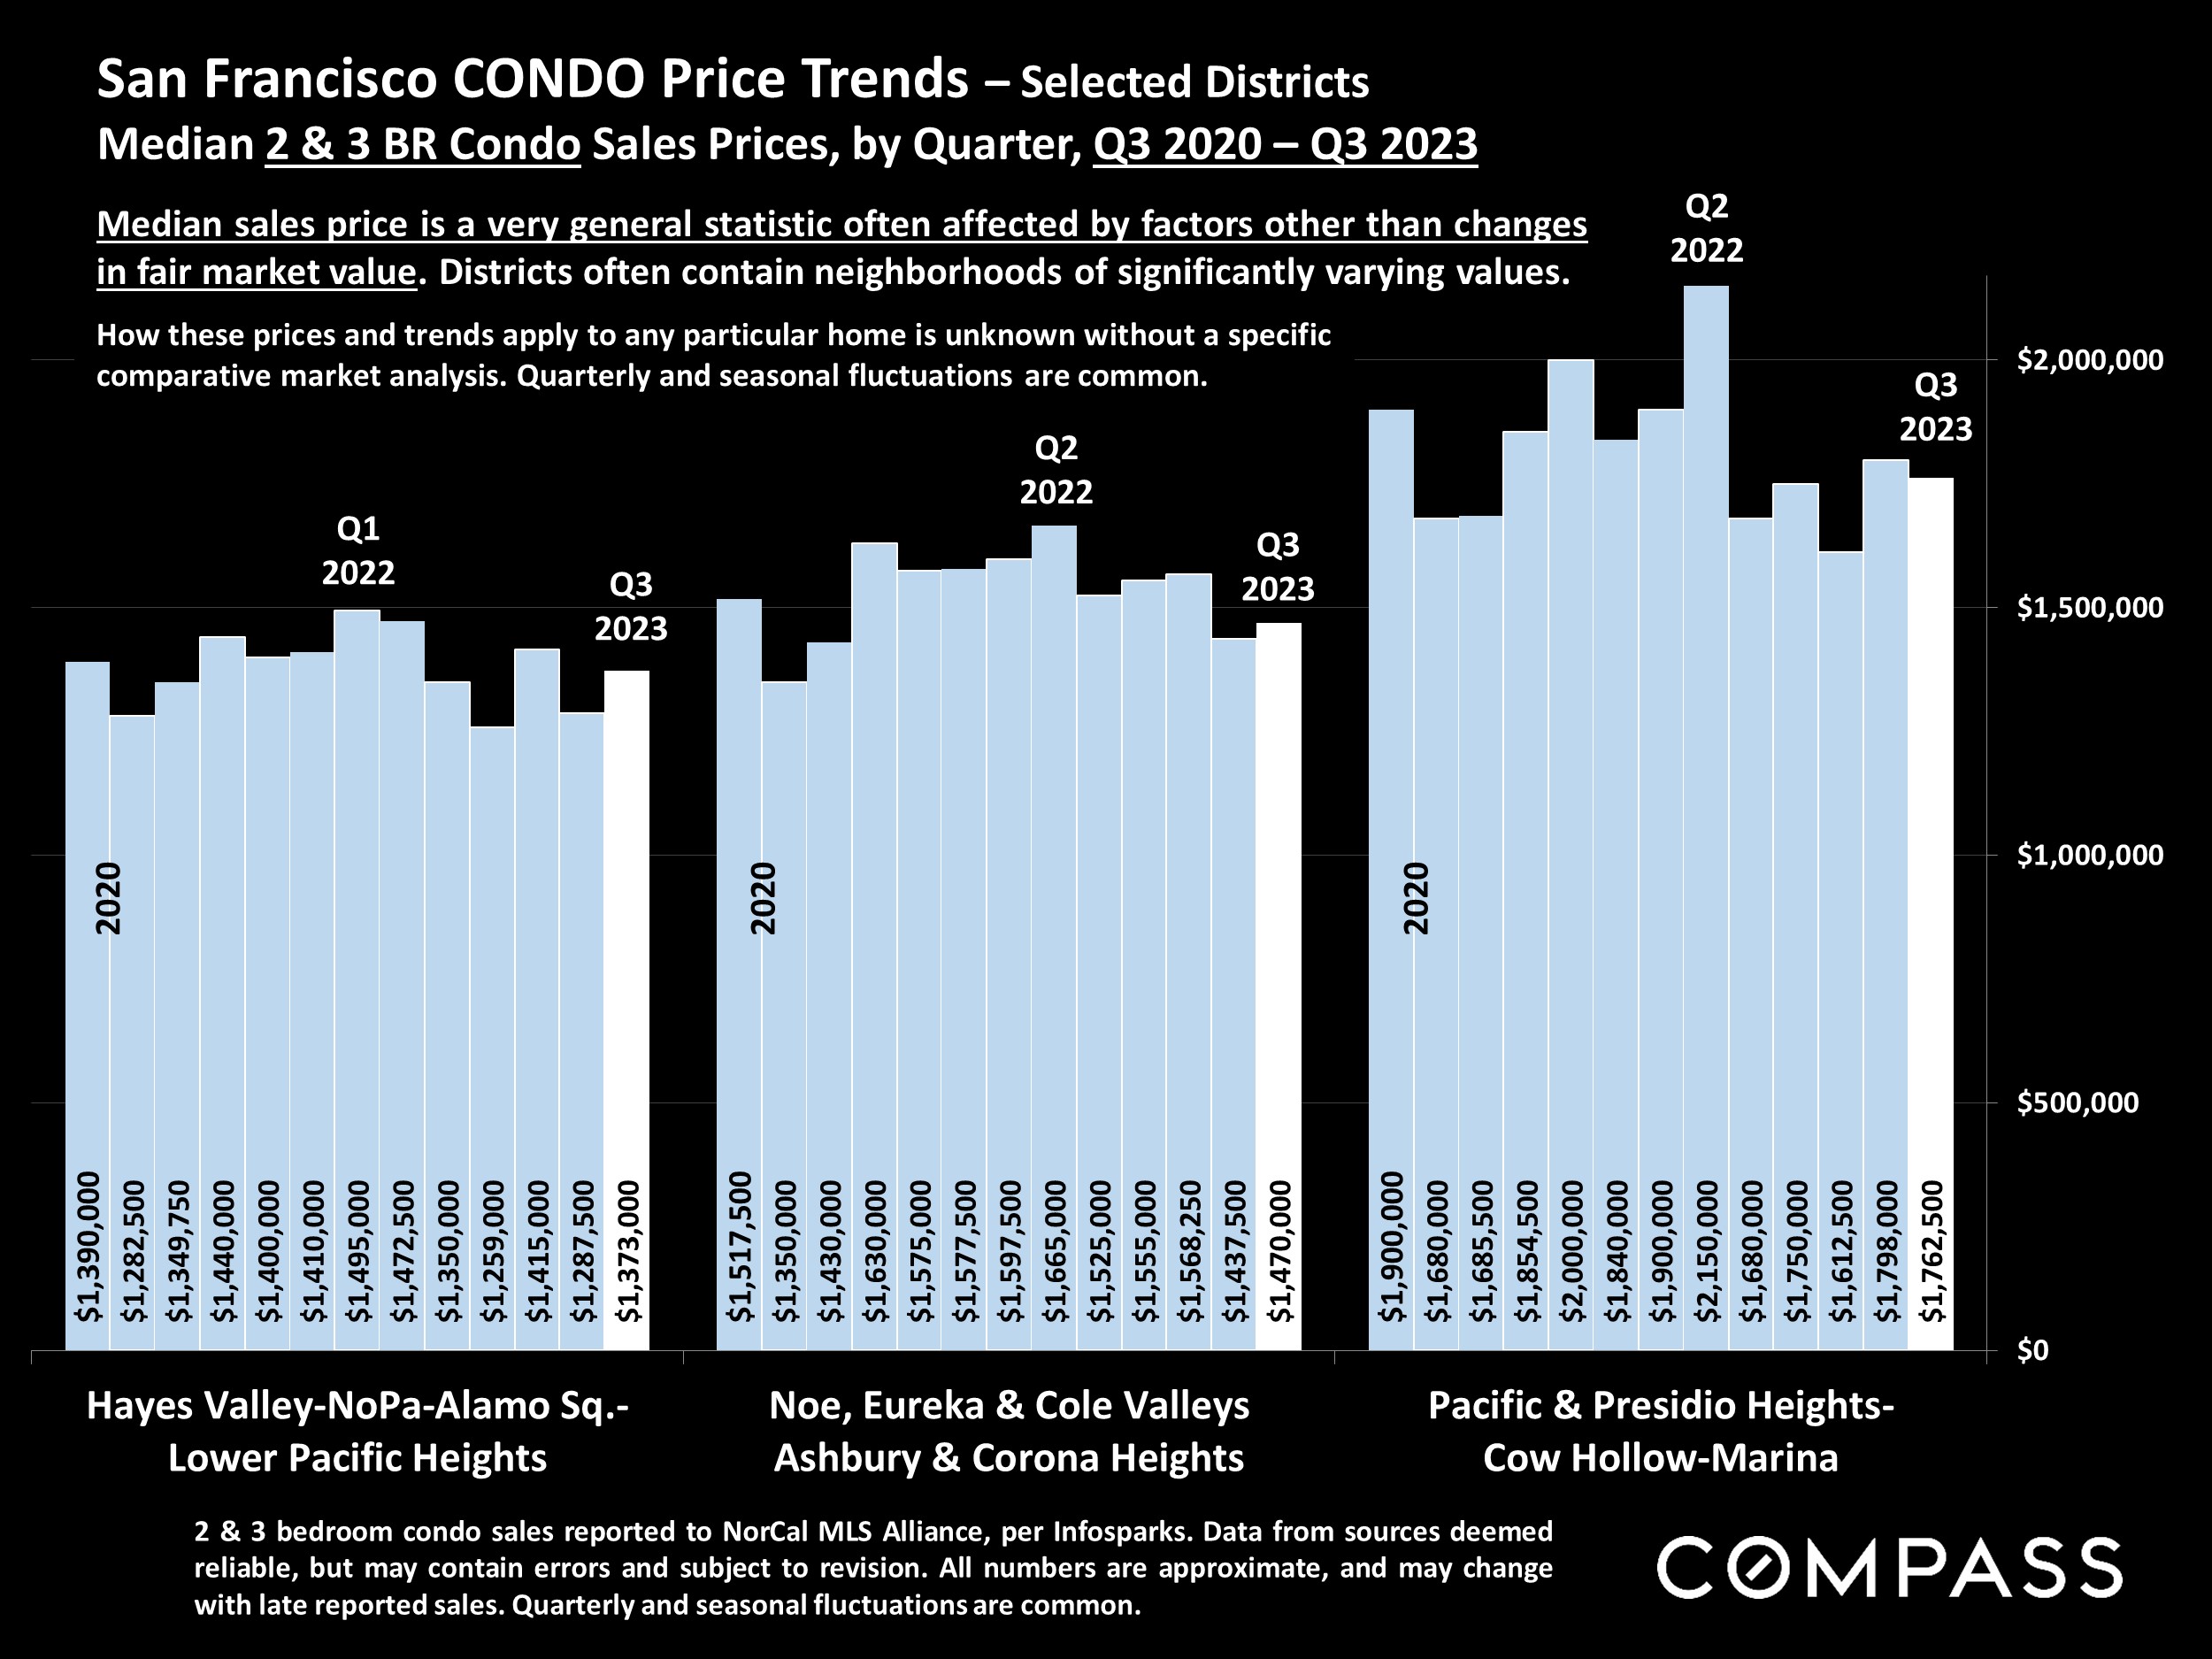
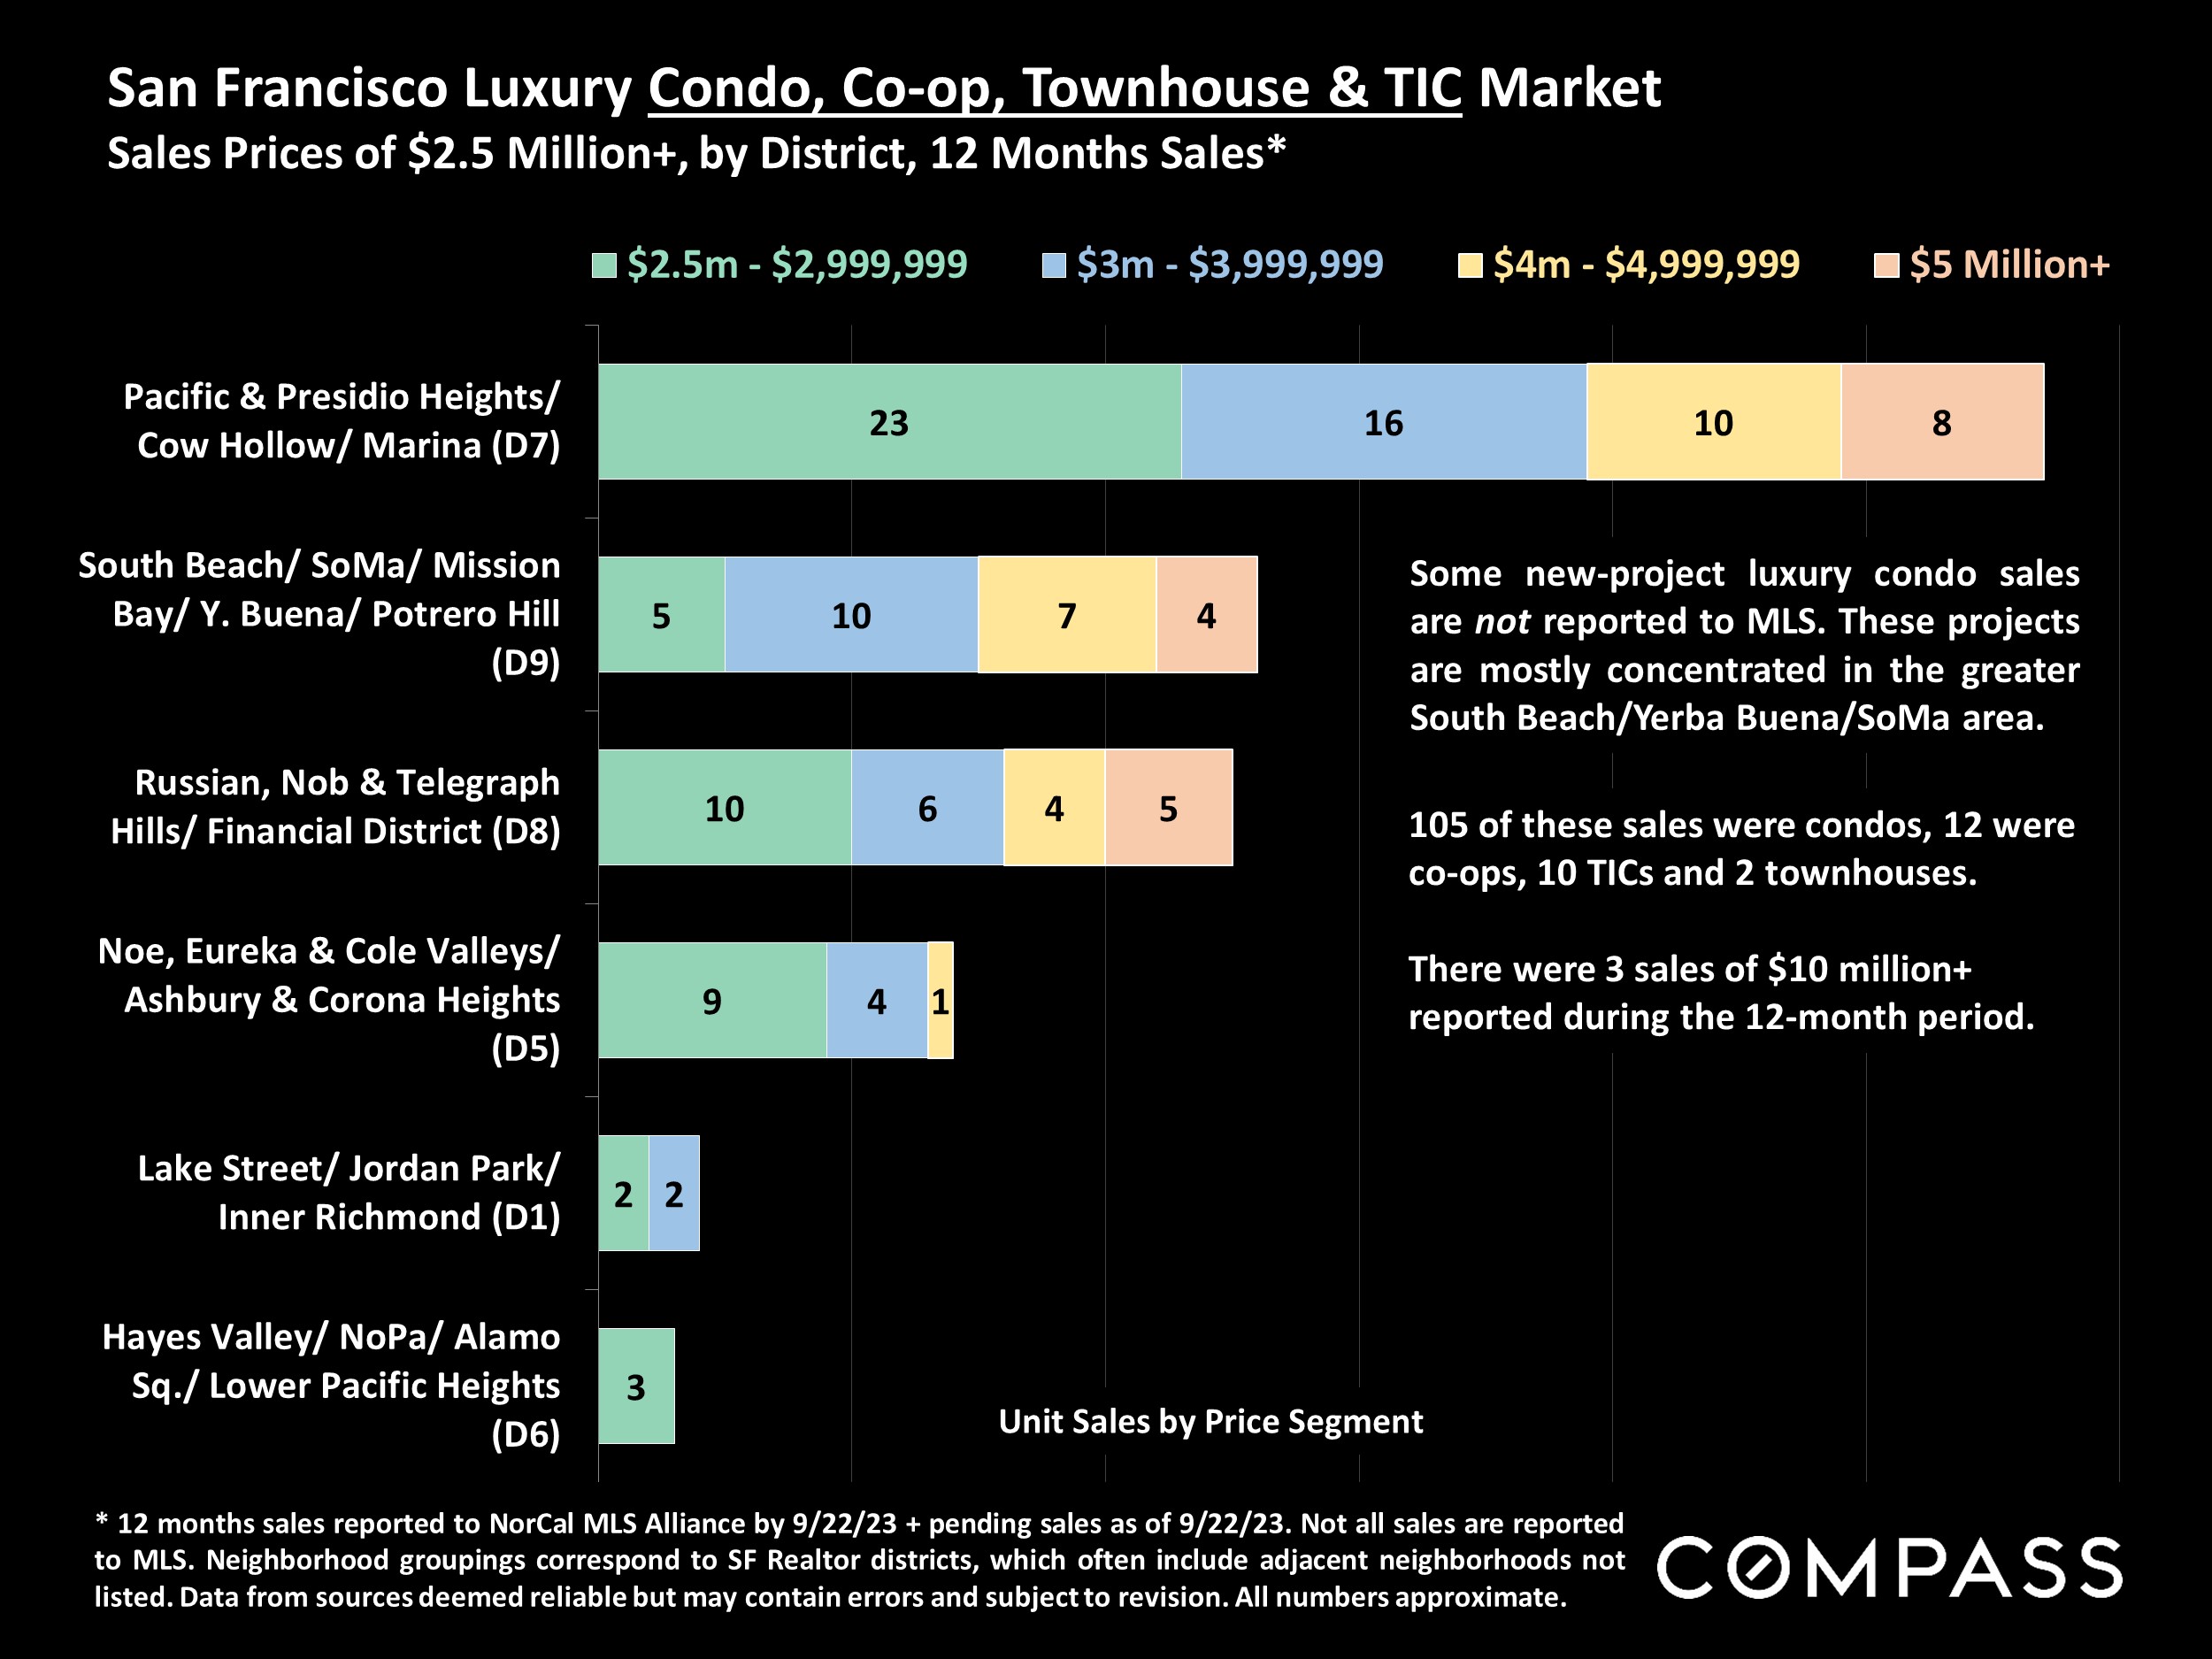
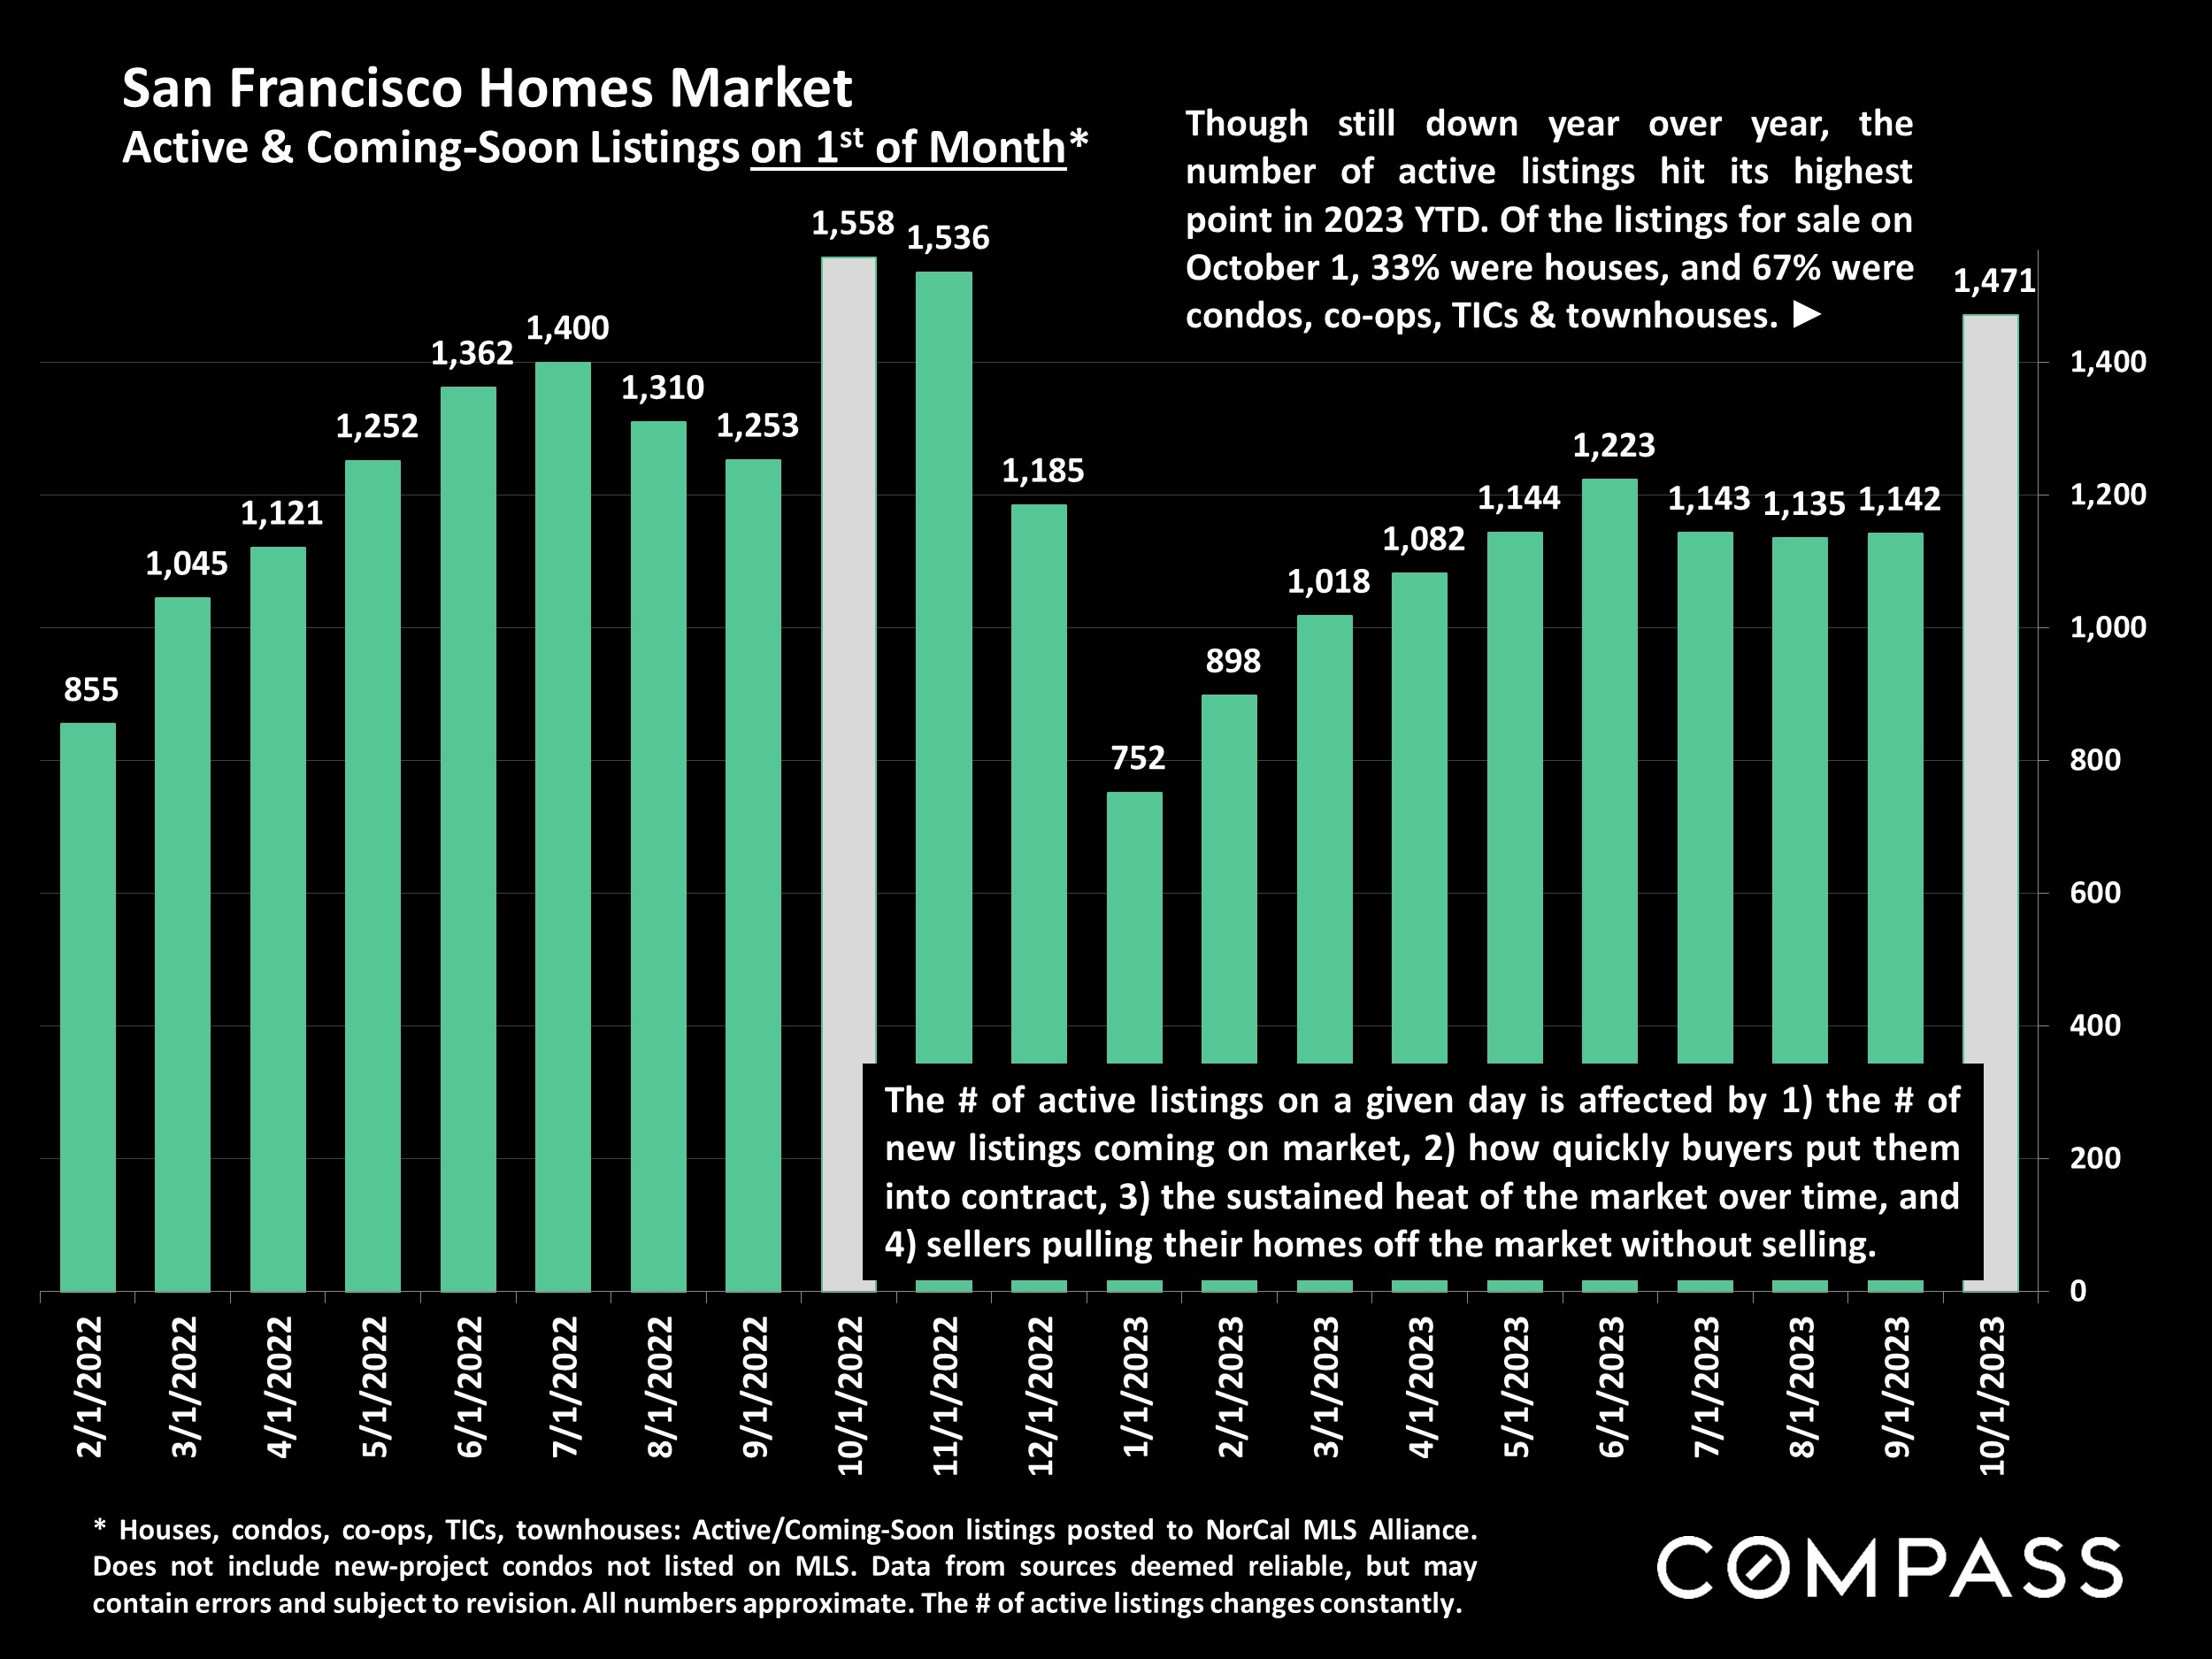
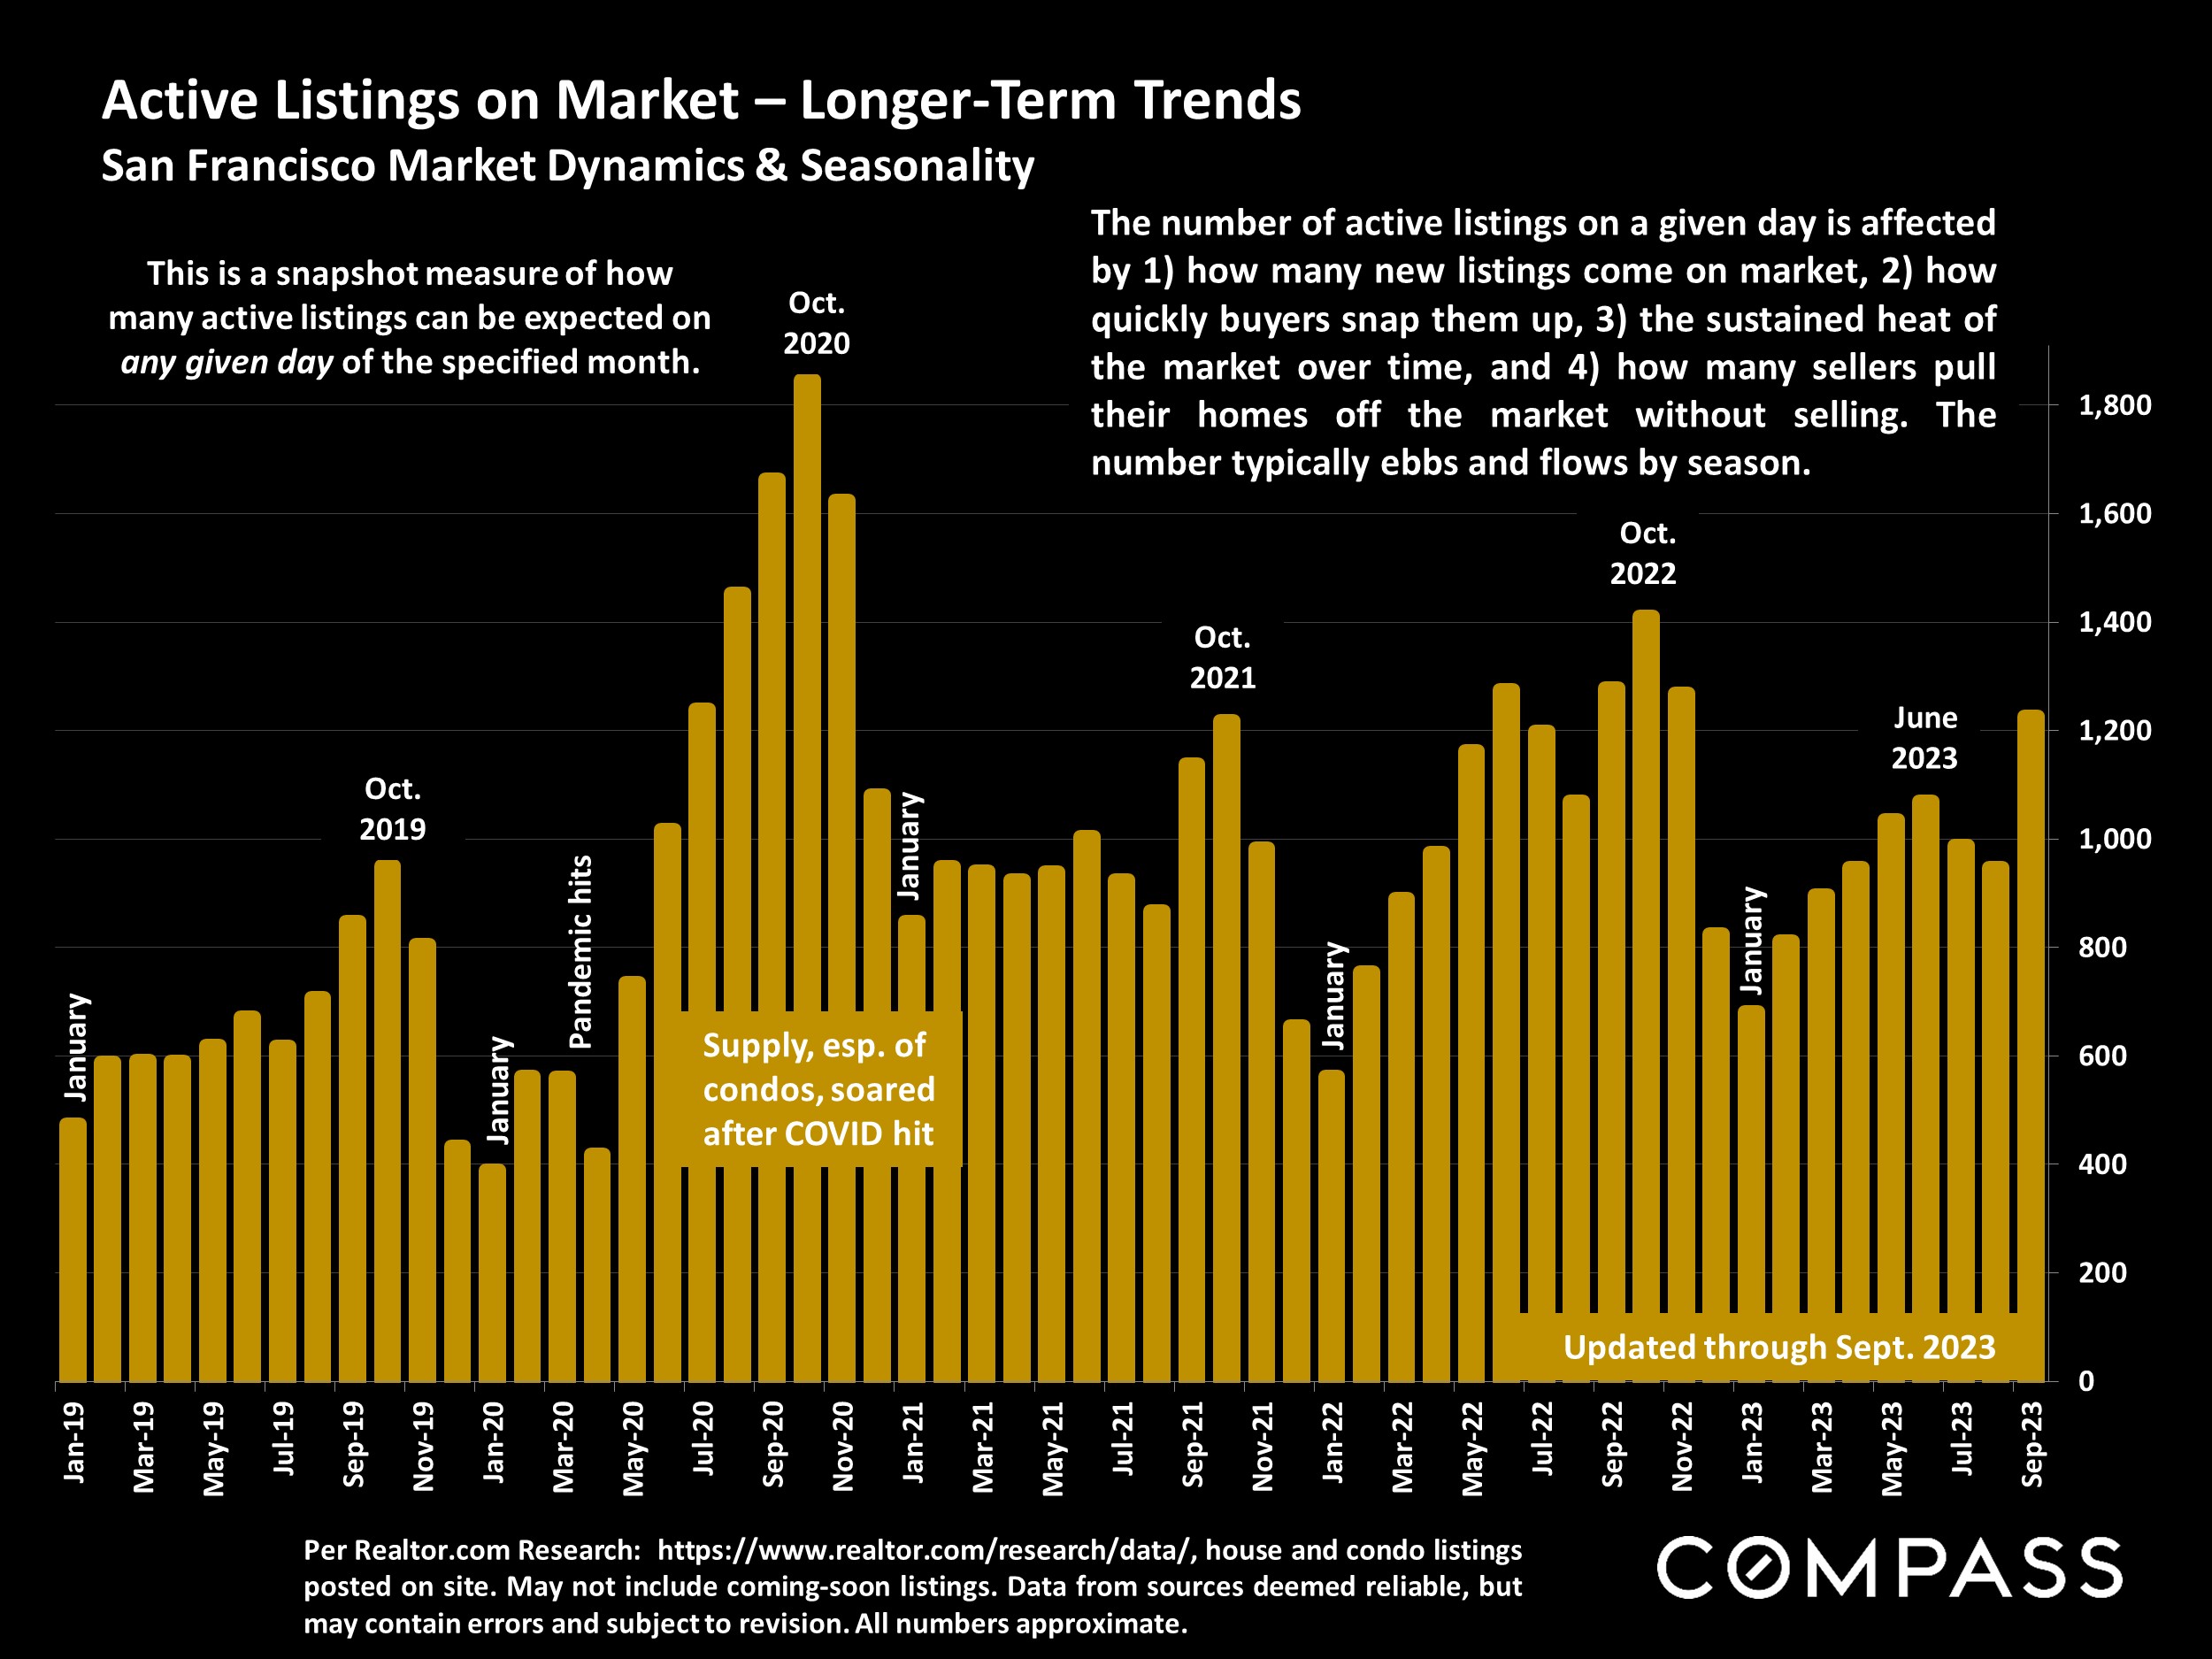
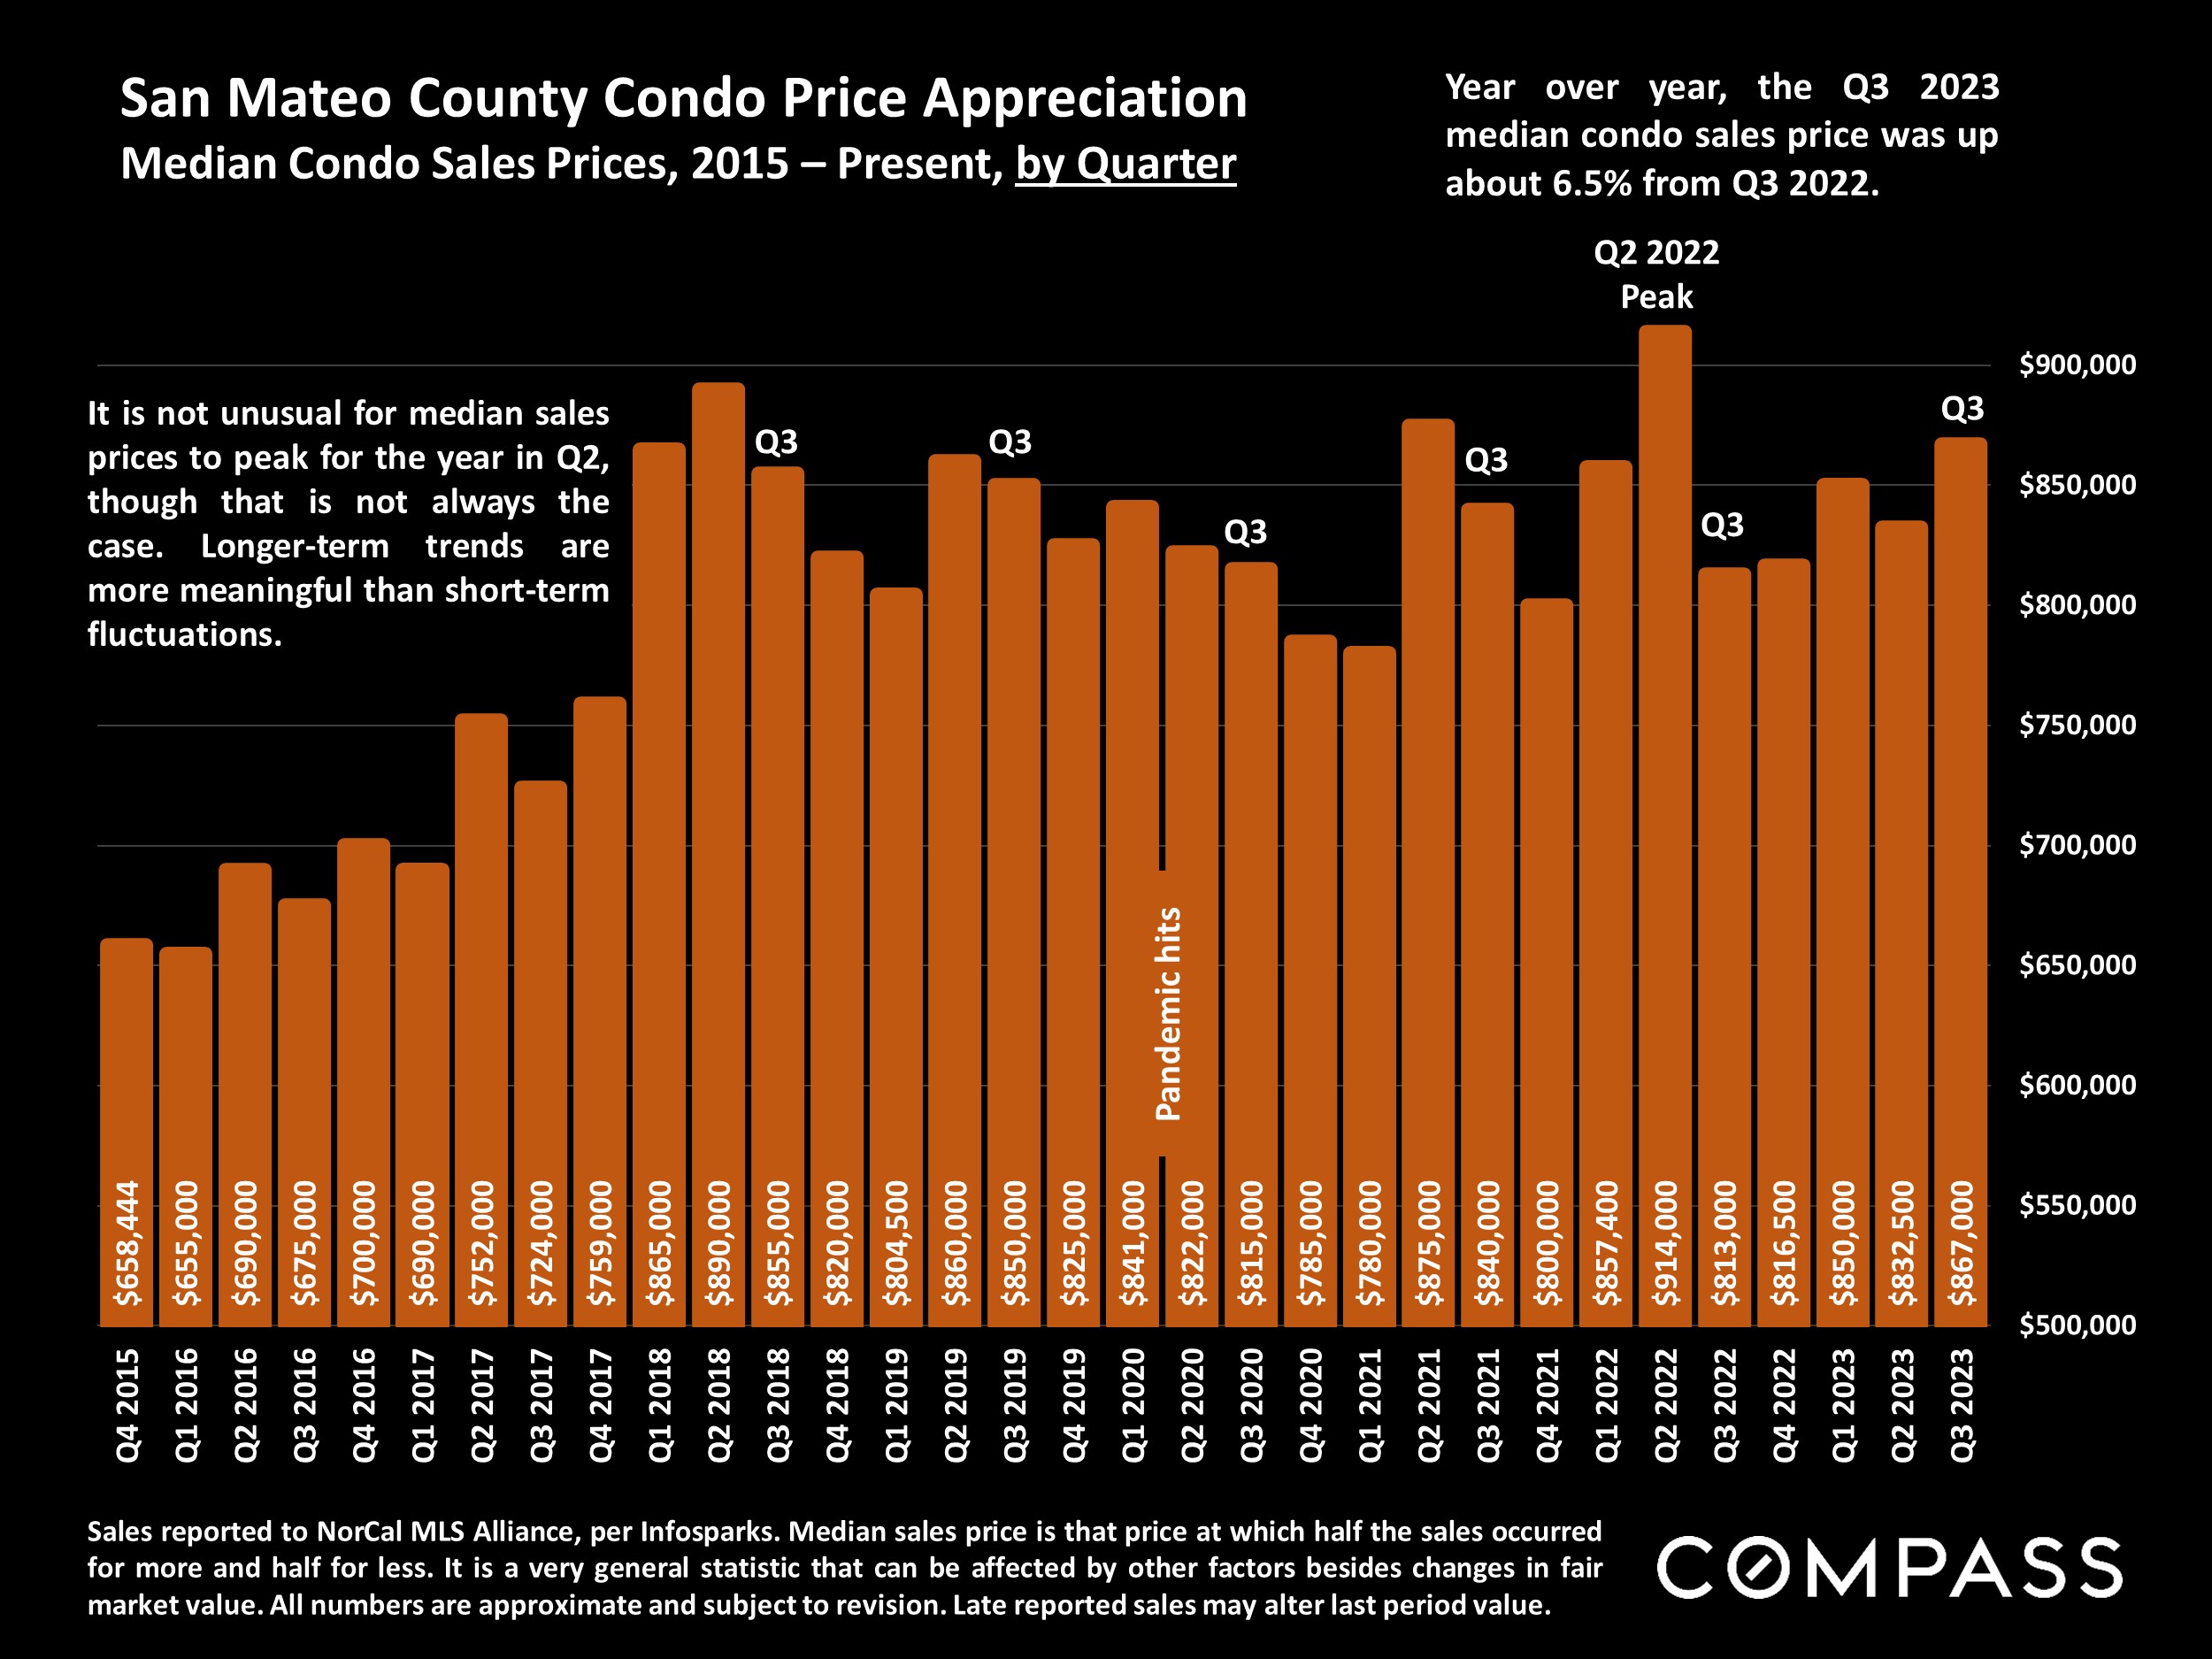
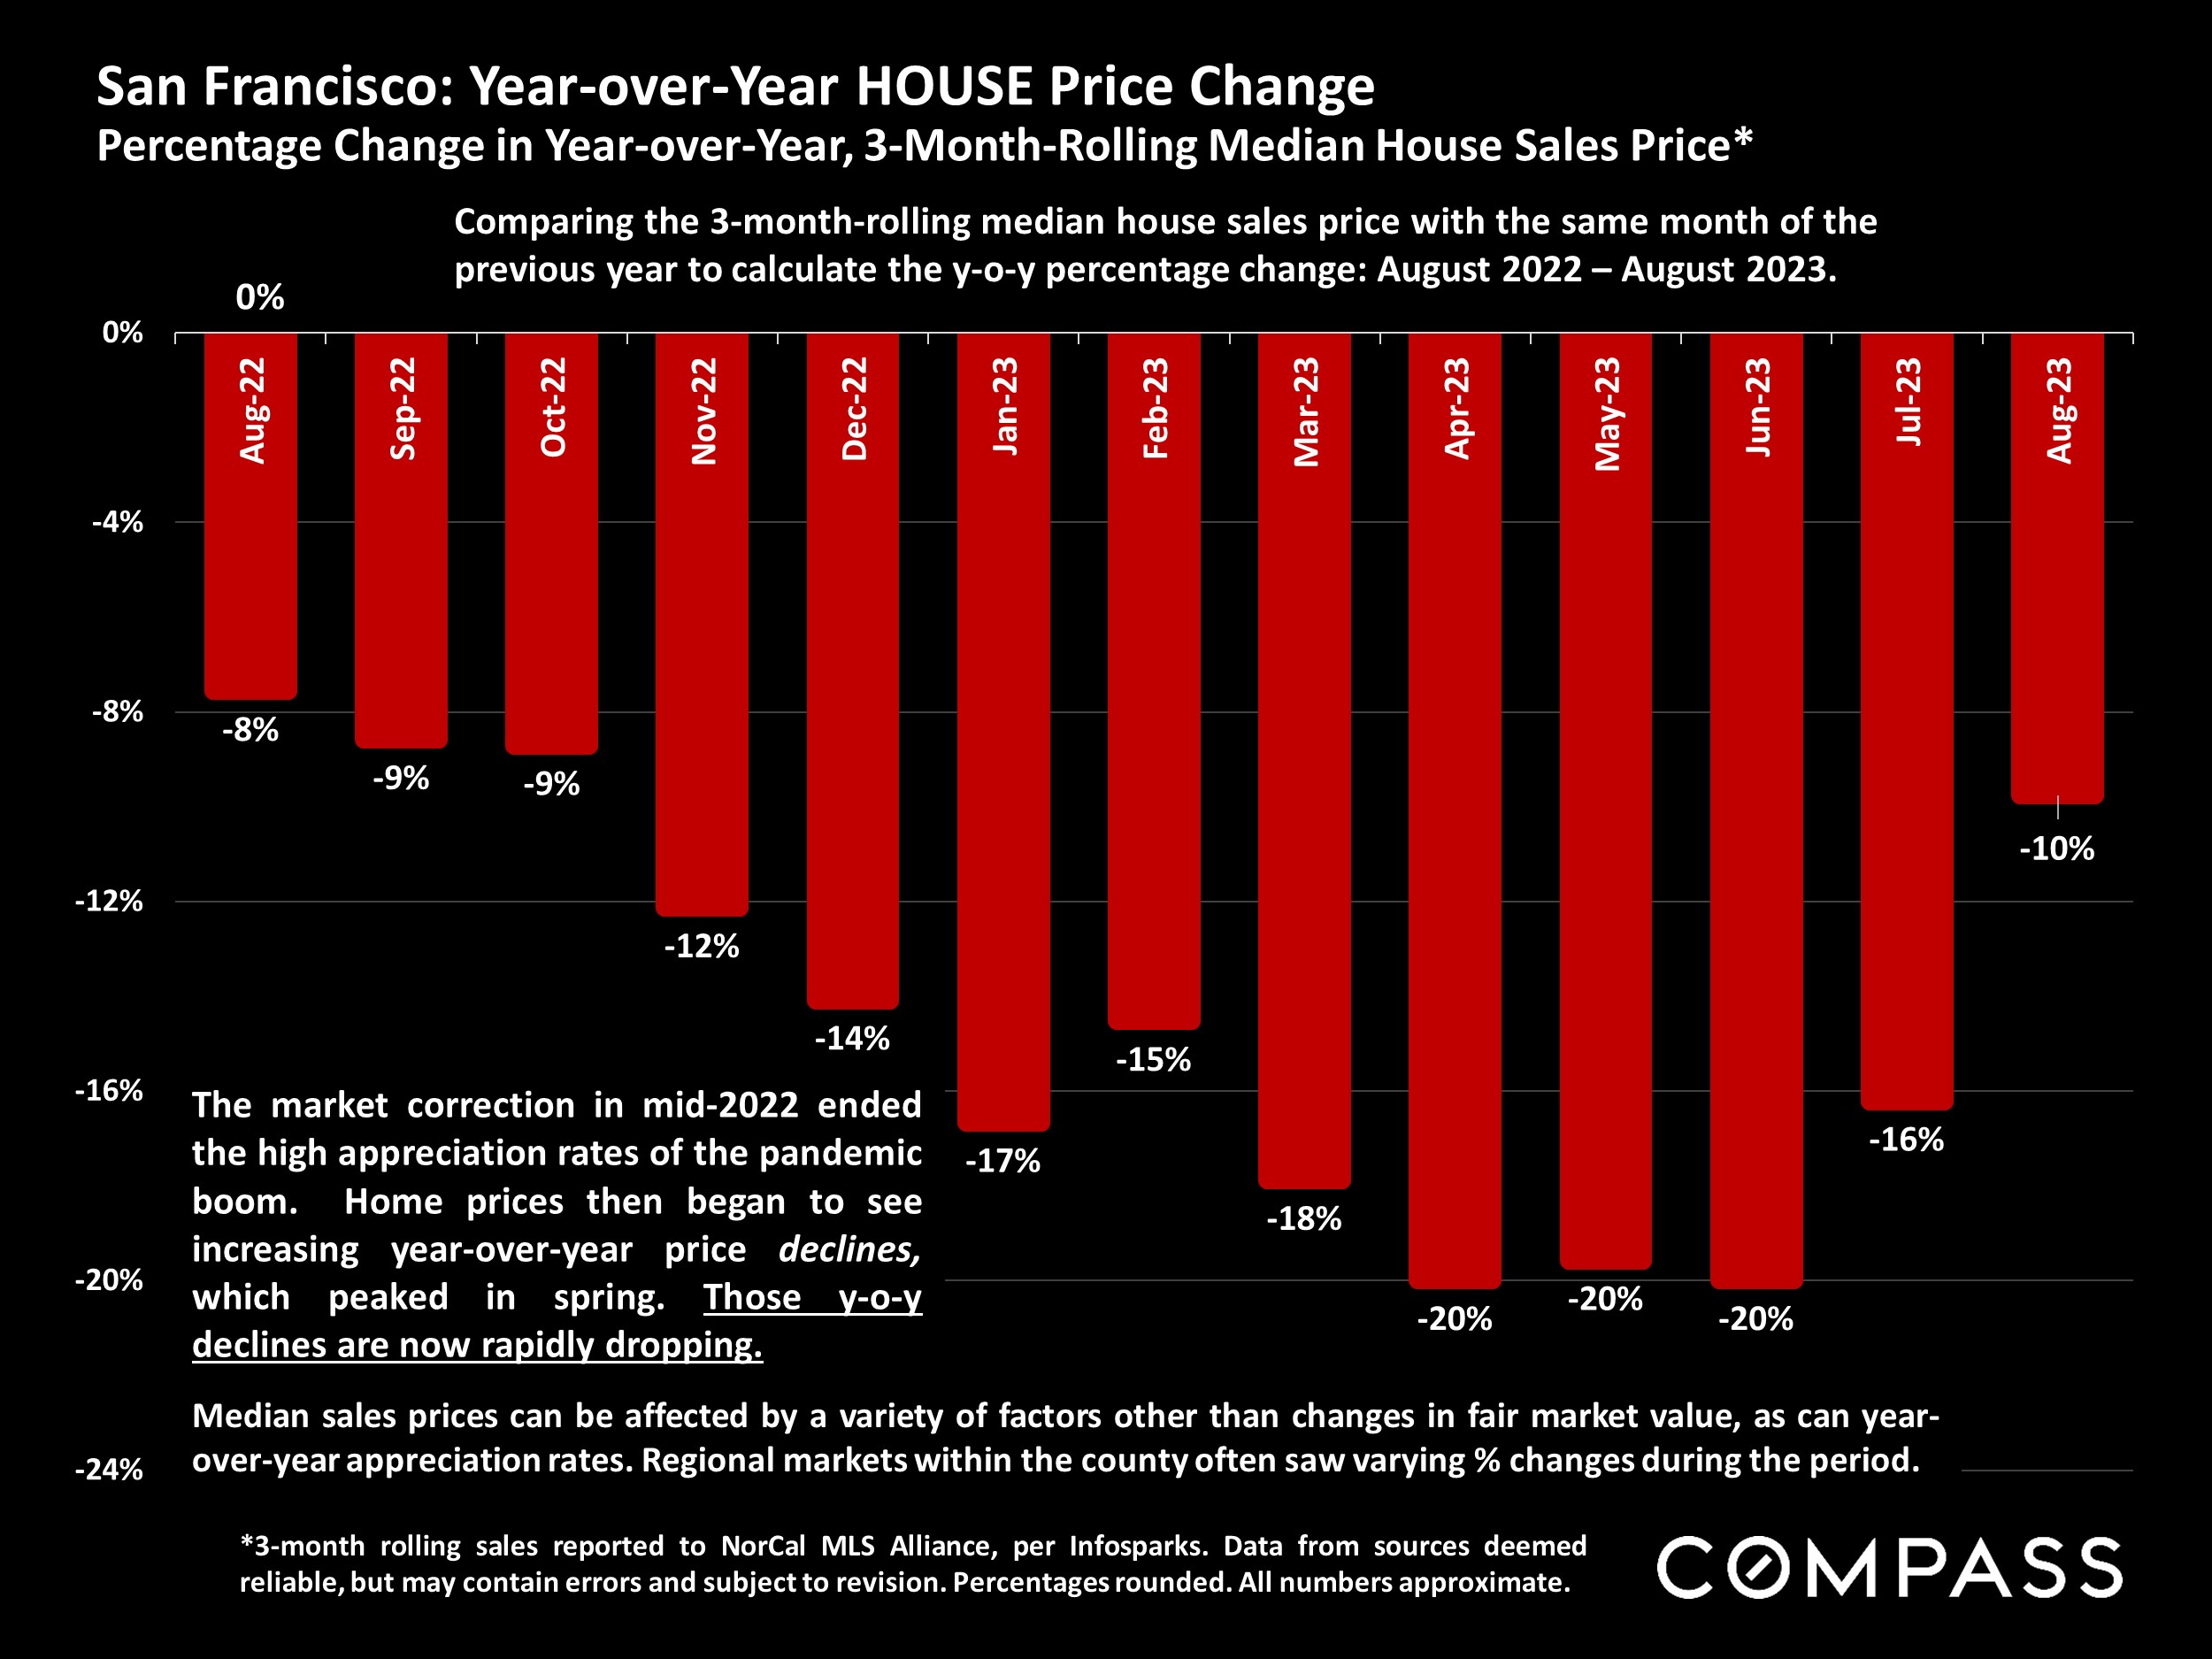
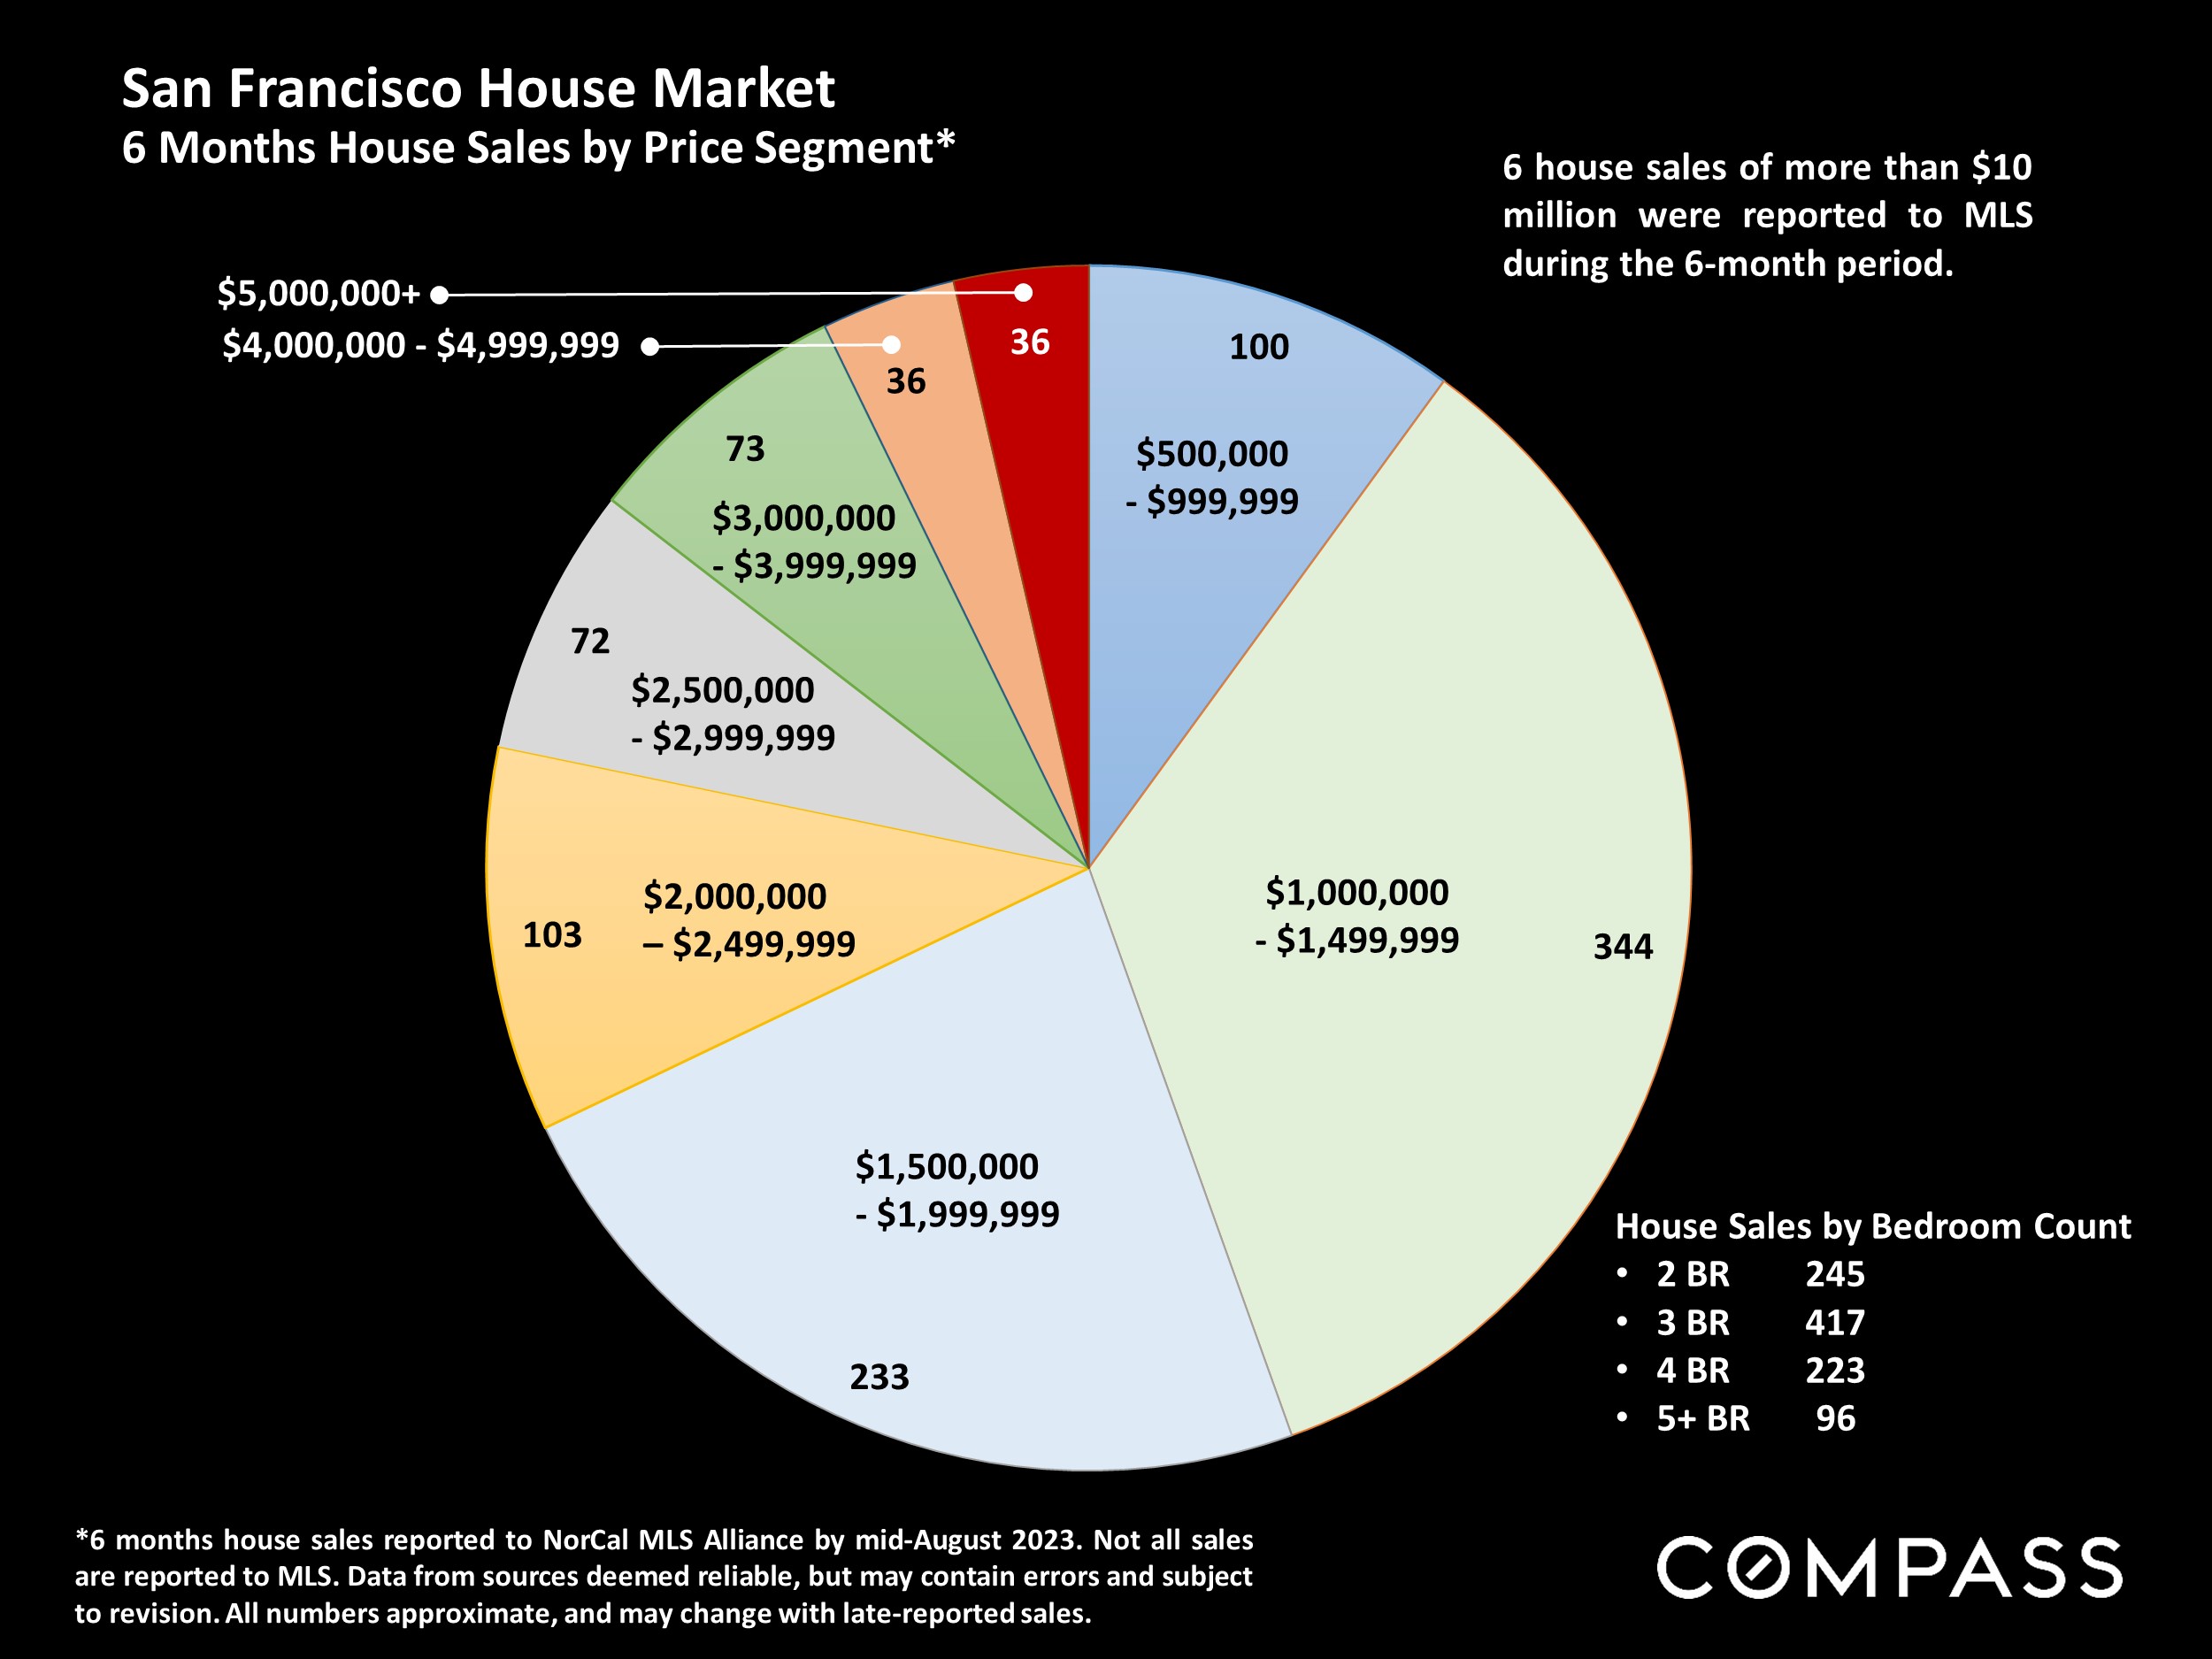
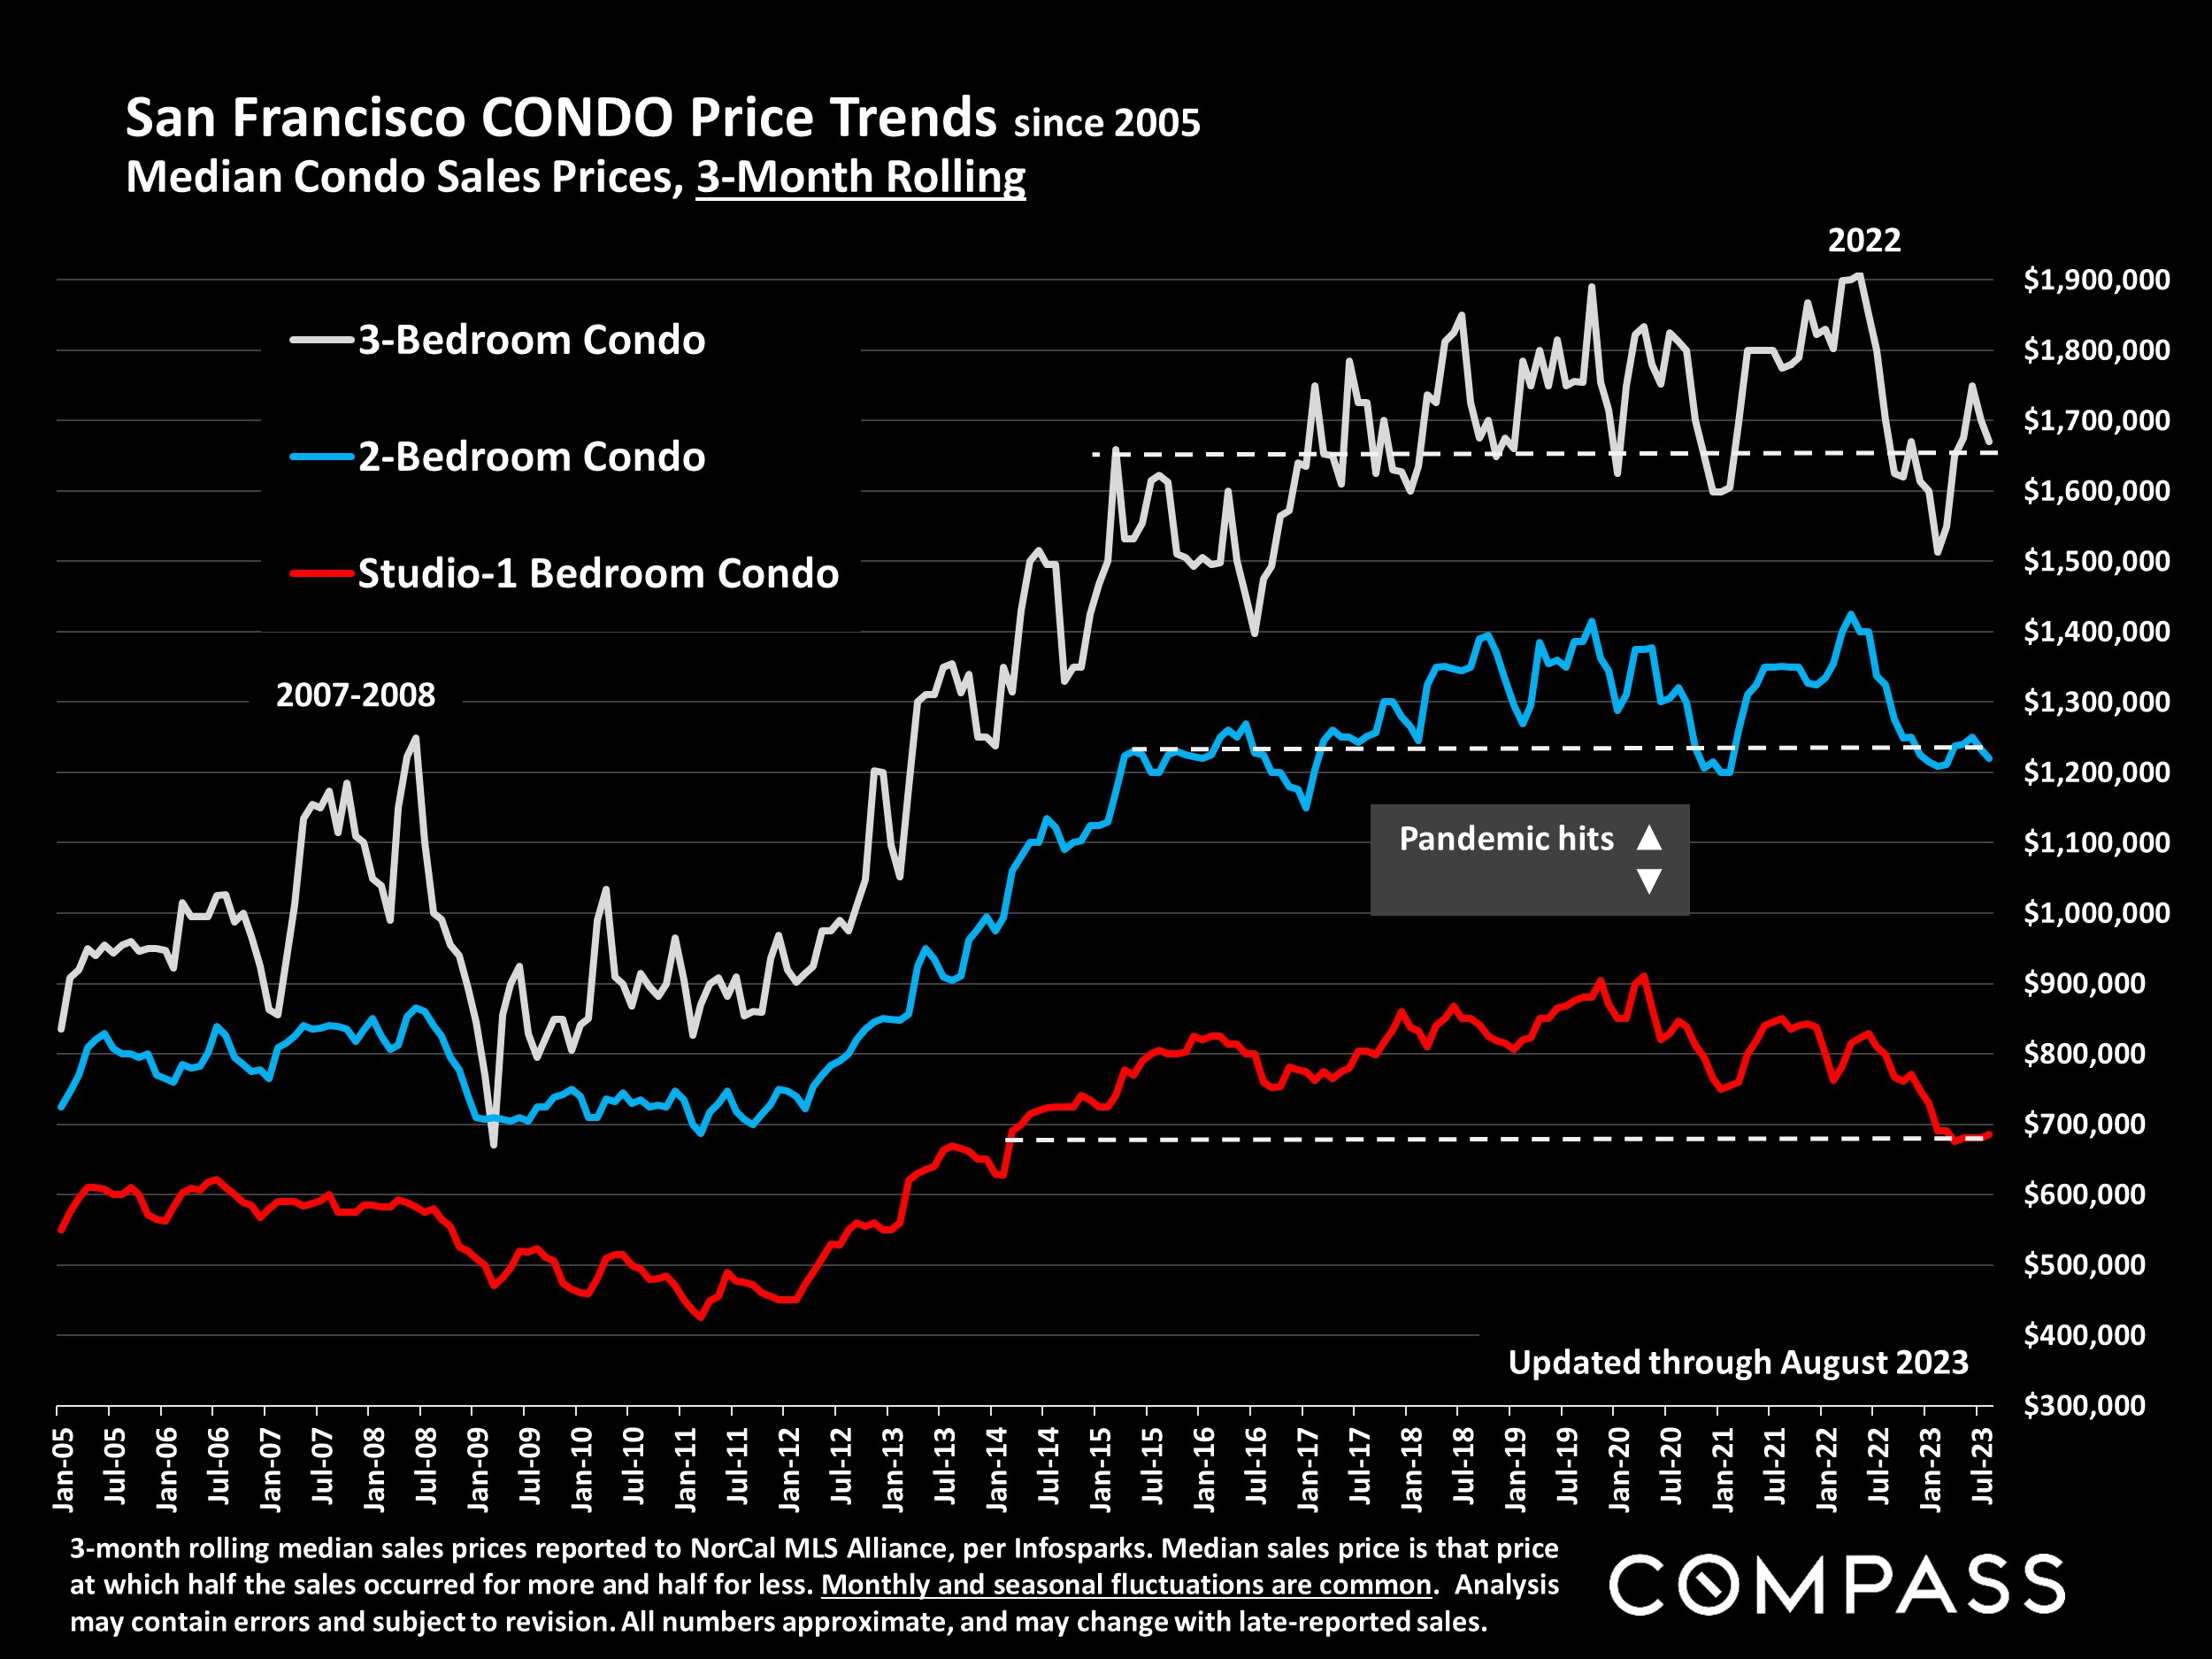
In the meantime, the Q3 median house sales price was down about 6.5% from Q3 2022, and the median condo price down about 4%, but we expect the year-over-year price declines to disappear in coming months. The number of new listings jumped dramatically in September and the total supply of listings for sale just hit a YTD high: This may lead to a substantial increase in sales in October. Supply and demand dynamics remains stronger for houses than for condos, and the downtown condo market is softer than condo markets in other districts of the city. Year over year, the number of home sales in Q3 was down about 22%.
The CA Association of Realtors® (CAR) recently issued their initial 2024 market forecast:
“California housing market will rebound in 2024”
CAR forecast: Existing, single-family home sales will increase in 2024 by approximately 23 percent, and the CA median home price is expected to climb by 6.2%. The average 30-year, fixed mortgage interest rate is projected to decline to 6%. Housing supply will remain below normal despite a 10% to 20% increase in active listings, as market conditions and the lending environment continue to improve. [However] the percentage of CA households able to purchase a median-priced single family dwelling will remain very low by long-term standards. CAR Chief Economist, 9/20/23
Statistics are generalities, essentially summaries of widely disparate data generated by dozens, hundreds or thousands of unique, individual sales occurring within different time periods. They are best seen not as precise measurements, but as broad, comparative indicators, with reasonable margins of error. Anomalous fluctuations in statistics are not uncommon, especially in smaller, expensive market segments. Last period data should be considered estimates that may change with late-reported data. Different analytics programs sometimes define statistics – such as “active listings,” “days on market,” and “months supply of inventory” – differently: what is most meaningful are not specific calculations but the trends they illustrate. Most listing and sales data derives from the local or regional multi-listing service (MLS) of the area specified in the analysis, but not all listings or sales are reported to MLS and these won’t be reflected in the data. “Homes” signifies real-property, single-household housing units: houses, condos, co-ops, townhouses, duets and TICs (but not mobile homes), as applicable to each market. City/town names refer specifically to the named cities and towns, unless otherwise delineated. Multi-county metro areas will be specified as such. Data from sources deemed reliable, but may contain errors and subject to revision. All numbers to be considered approximate.
Many aspects of value cannot be adequately reflected in median and average statistics: curb appeal, age, condition, amenities, views, lot size, quality of outdoor space, “bonus” rooms, additional parking, quality of location within the neighborhood, and so on. How any of these statistics apply to any particular home is unknown without a specific comparative market analysis. Median Sales Price is that price at which half the properties sold for more and half for less. It may be affected by seasonality, “unusual” events, or changes in inventory and buying trends, as well as by changes in fair market value. The median sales price for an area will often conceal an enormous variety of sales prices in the underlying individual sales.
Dollar per Square Foot is based upon the home’s interior living space and does not include garages, unfinished attics and basements, rooms built without permit, patios, decks or yards (though all those can add value to a home). These figures are usually derived from appraisals or tax records, but are sometimes unreliable (especially for older homes) or unreported altogether. The calculation can only be made on those home sales that reported square footage.
Photo use under the Creative Commons License: https://creativecommons.org/licenses/by-sa/2.0/
Compass is a real estate broker licensed by the State of California, DRE 01527235. Equal Housing Opportunity. This report has been prepared solely for information purposes. The information herein is based on or derived from information generally available to the public and/or from sources believed to be reliable. No representation or warranty can be given with respect to the accuracy or completeness of the information. Compass disclaims any and all liability relating to this report, including without limitation any express or implied representations or warranties for statements contained in, and omissions from, the report. Nothing contained herein is intended to be or should be read as any regulatory, legal, tax, accounting or other advice and Compass does not provide such advice. All opinions are subject to change without notice. Compass makes no representation regarding the accuracy of any statements regarding any references to the laws, statutes or regulations of any state are those of the author(s). Past performance is no guarantee of future results.
Economic indicators have been challenging since the fall selling season began: Interest rates continued to rise through early October and stock markets generally continued to fall from mid- summer, YTD highs. The country faced yet another threat of a federal government shutdown, which happily didn’t occur, but, unbelievably, another such crisis may soon confront us again. Markets remain volatile and hard to predict, often reacting negatively to positive economic news (such as employment numbers) as they wait for new inflation numbers and try to parse the possible reaction of the Fed. Any definitive impacts on real estate markets of these recent developments, should they continue, won’t substantially show up until Q4 data begins to become available, and, of course, volatility also means that indicators can turn around quickly.
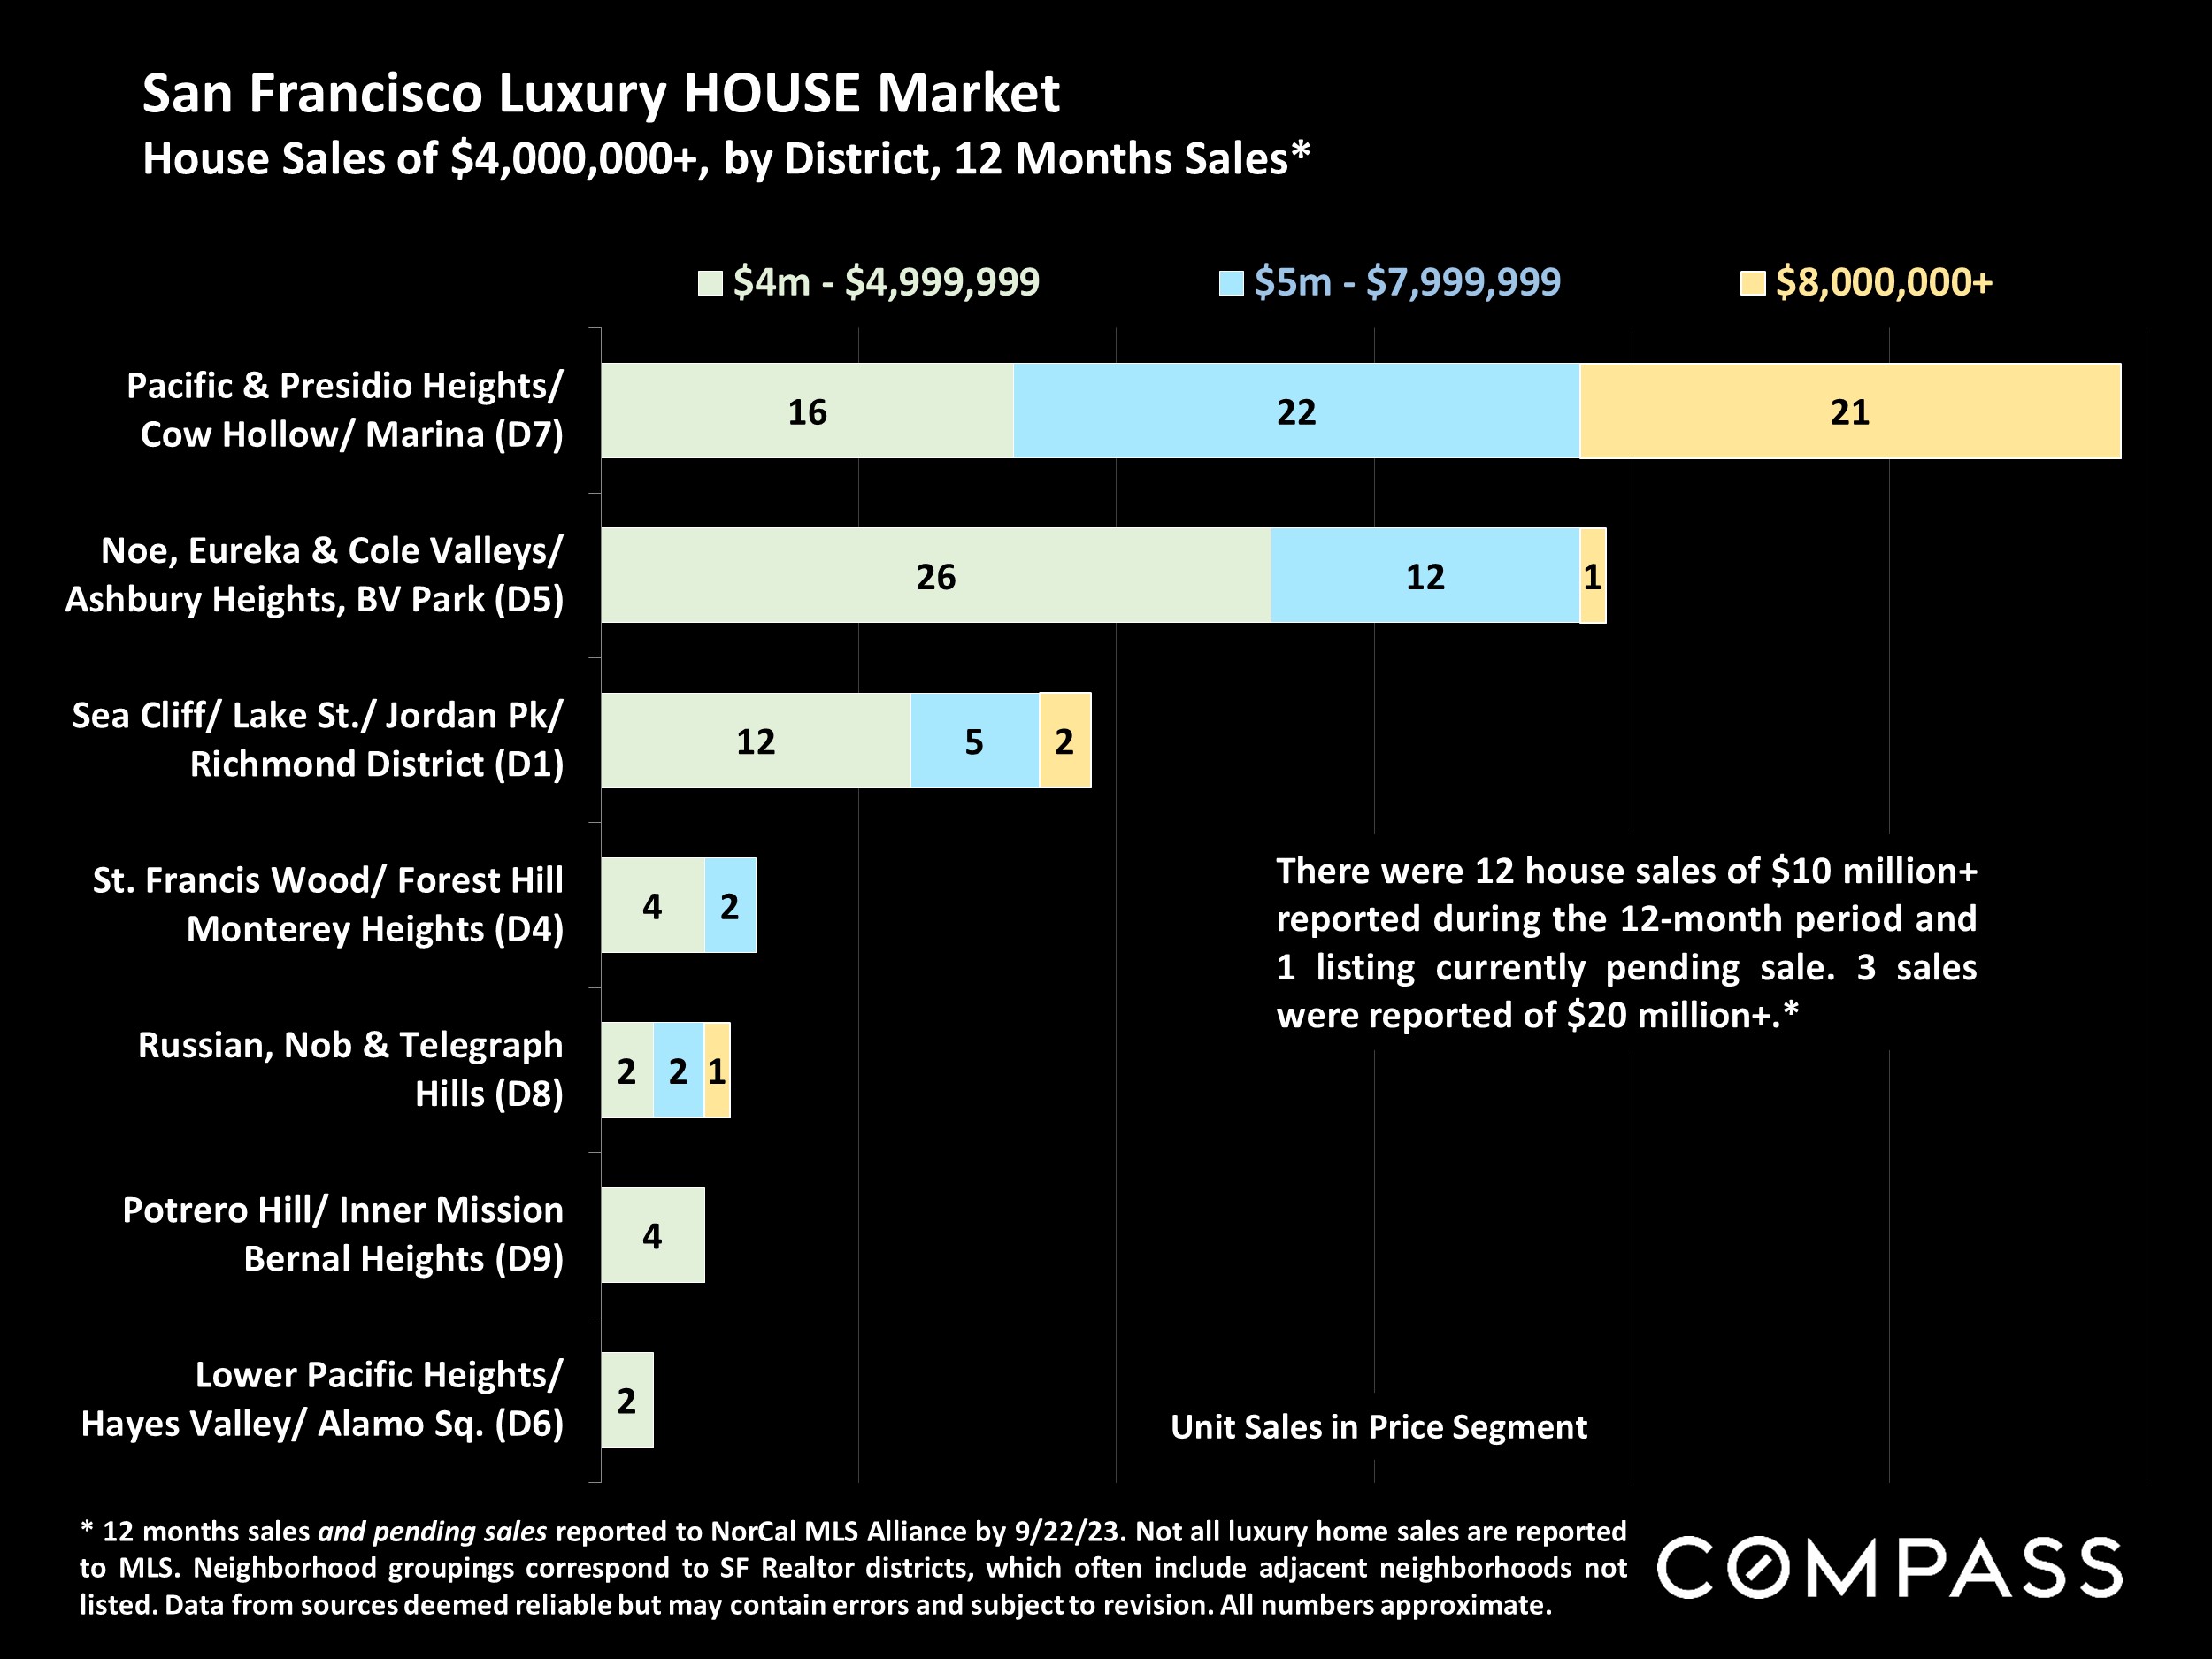
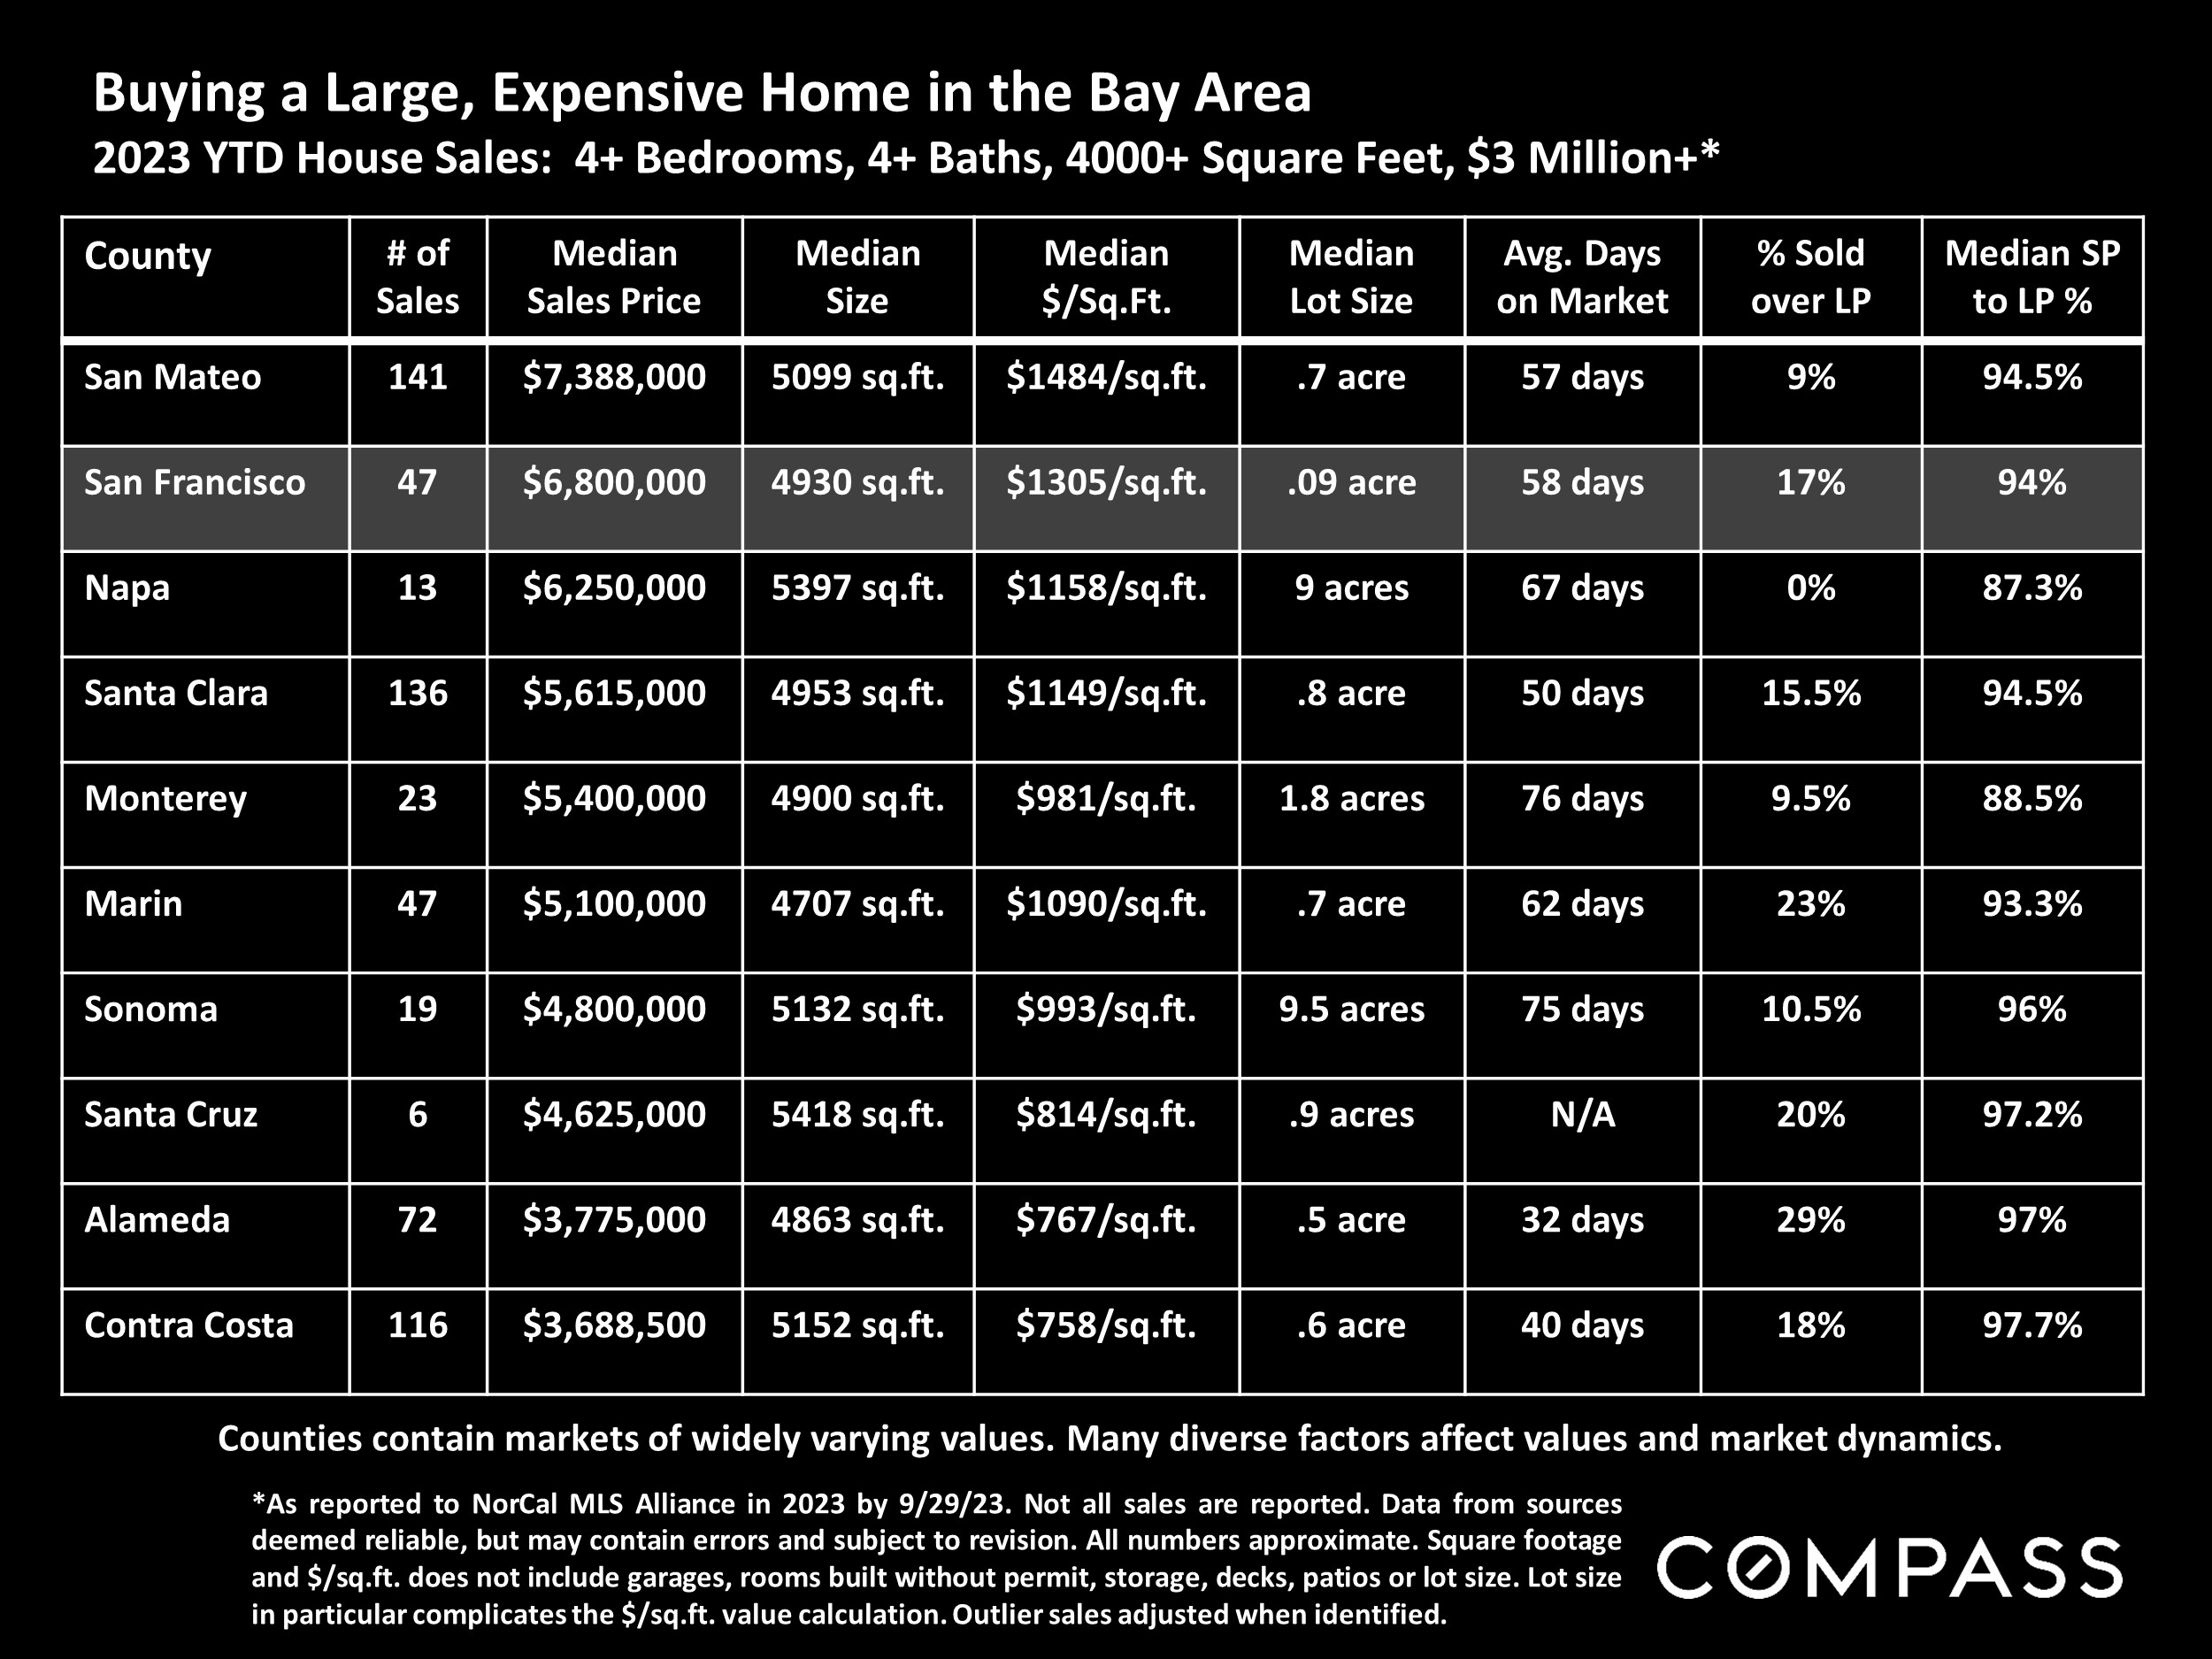
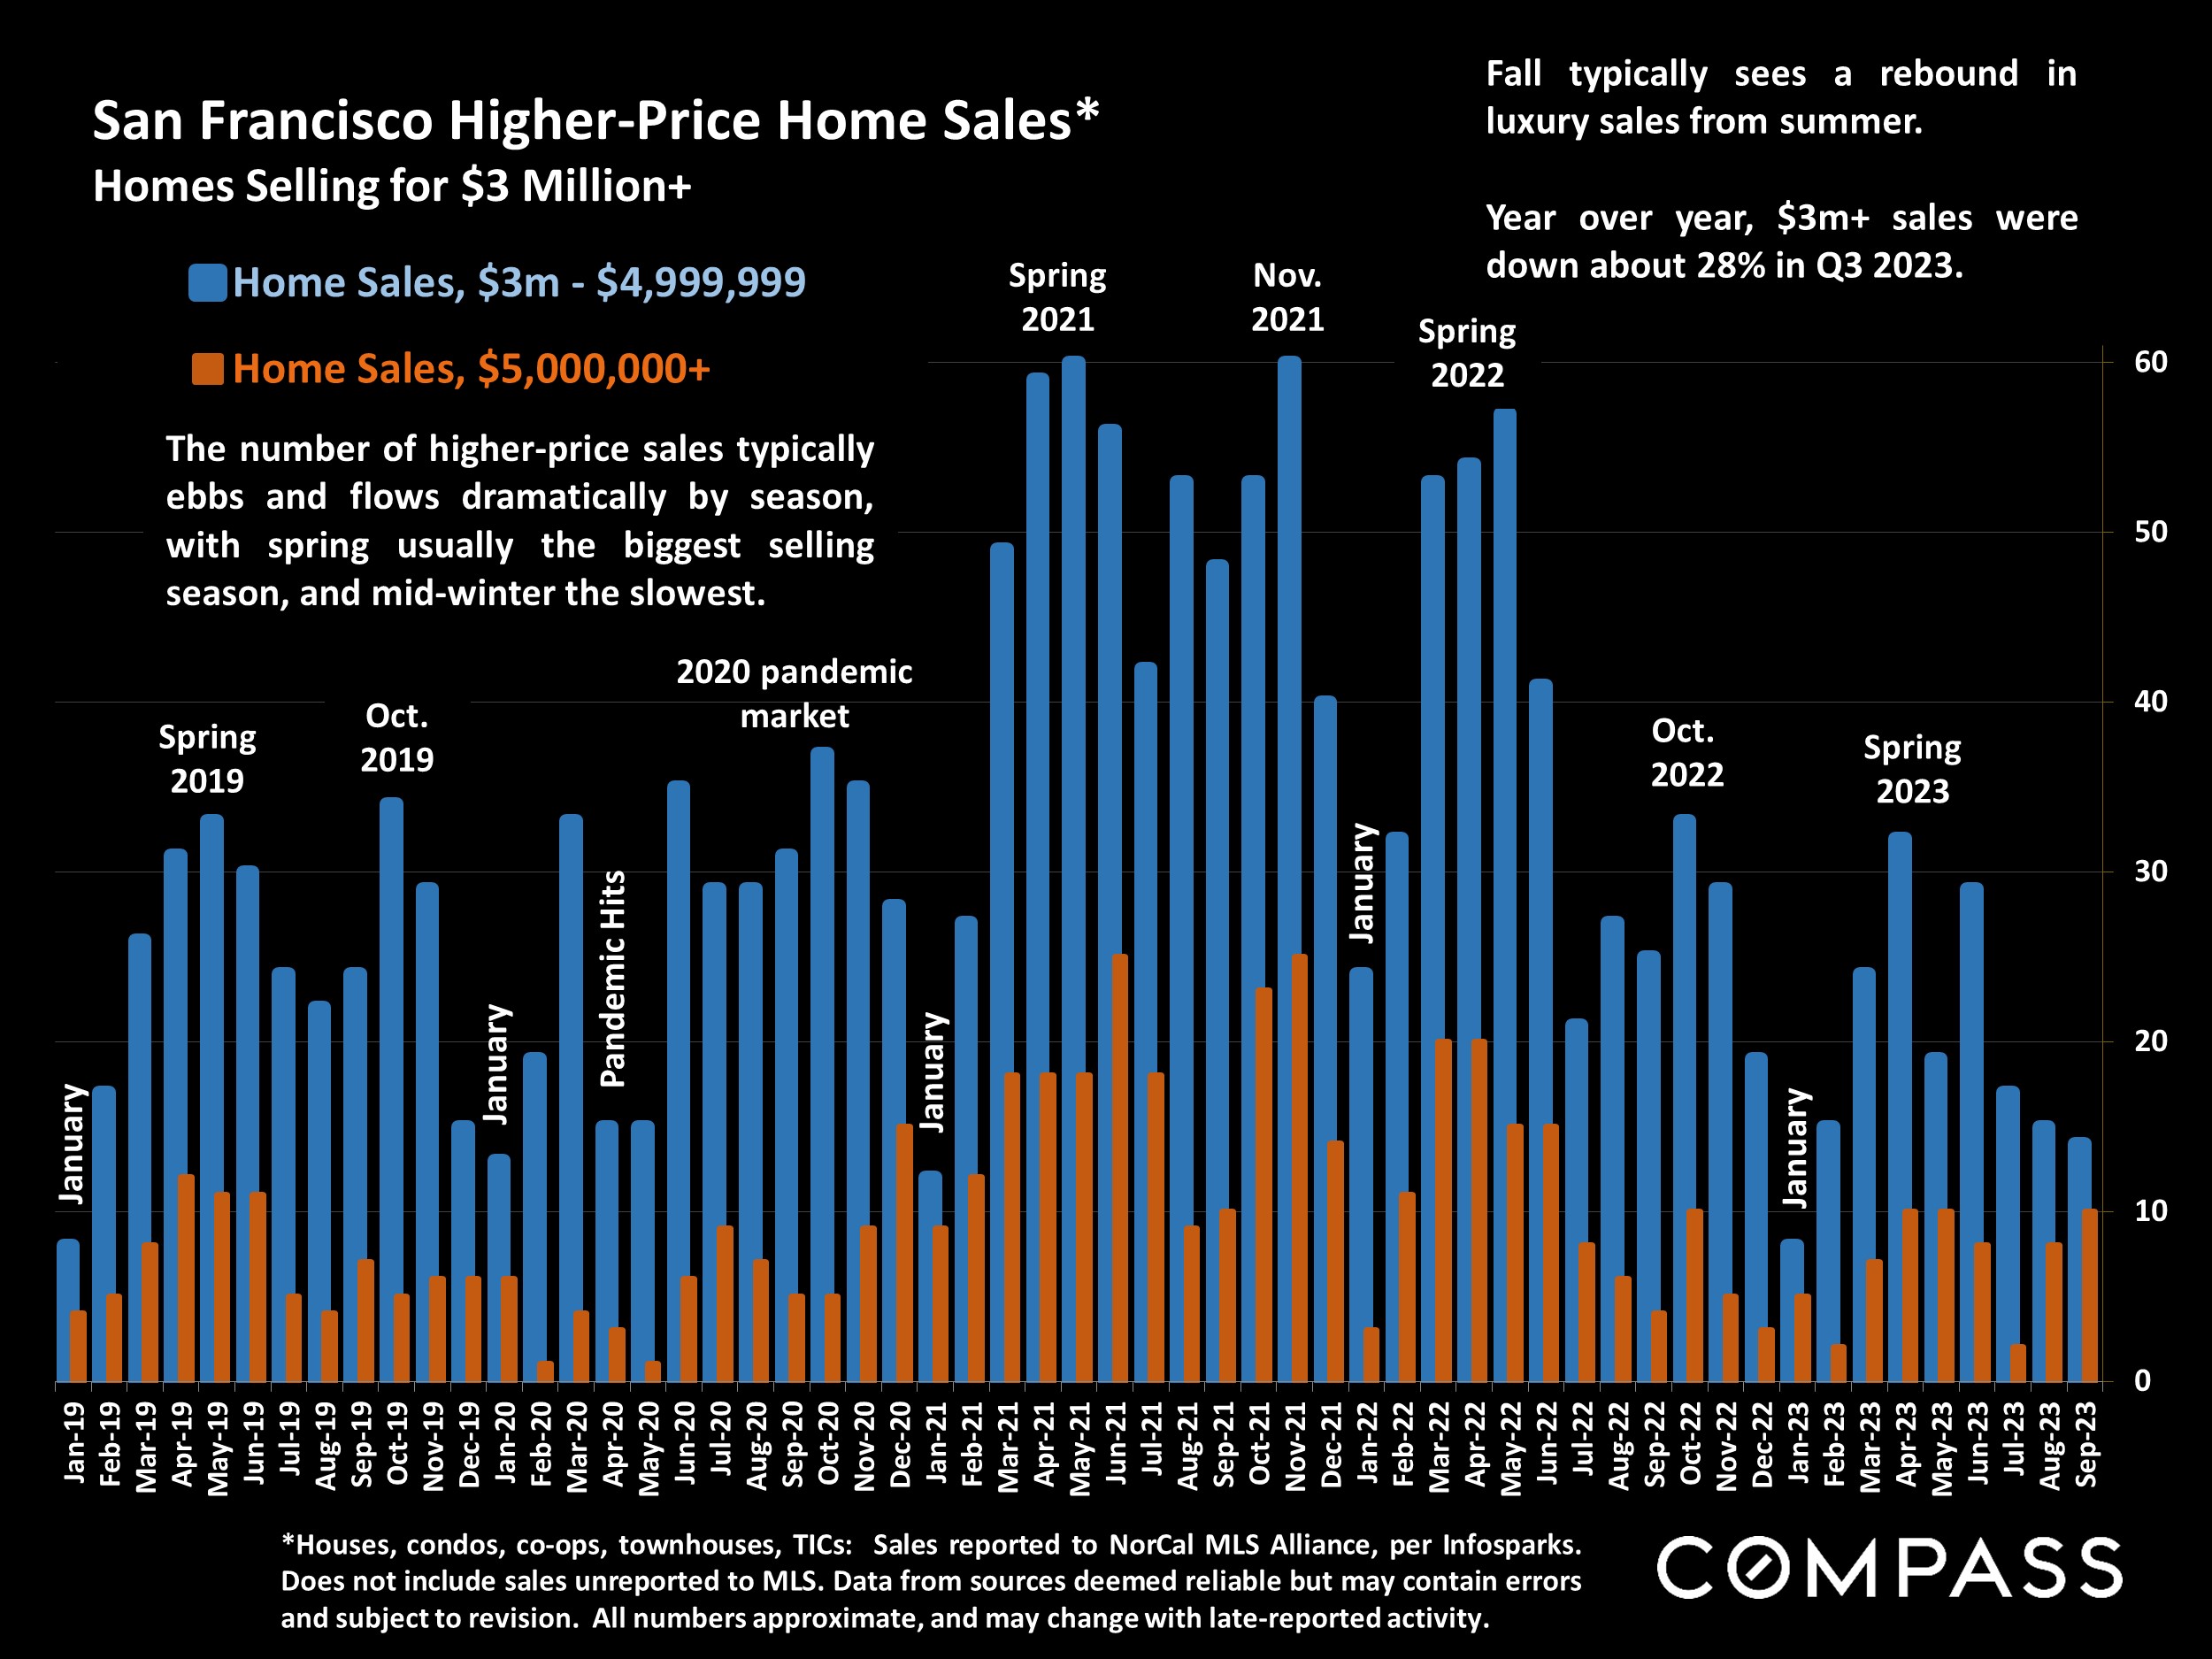
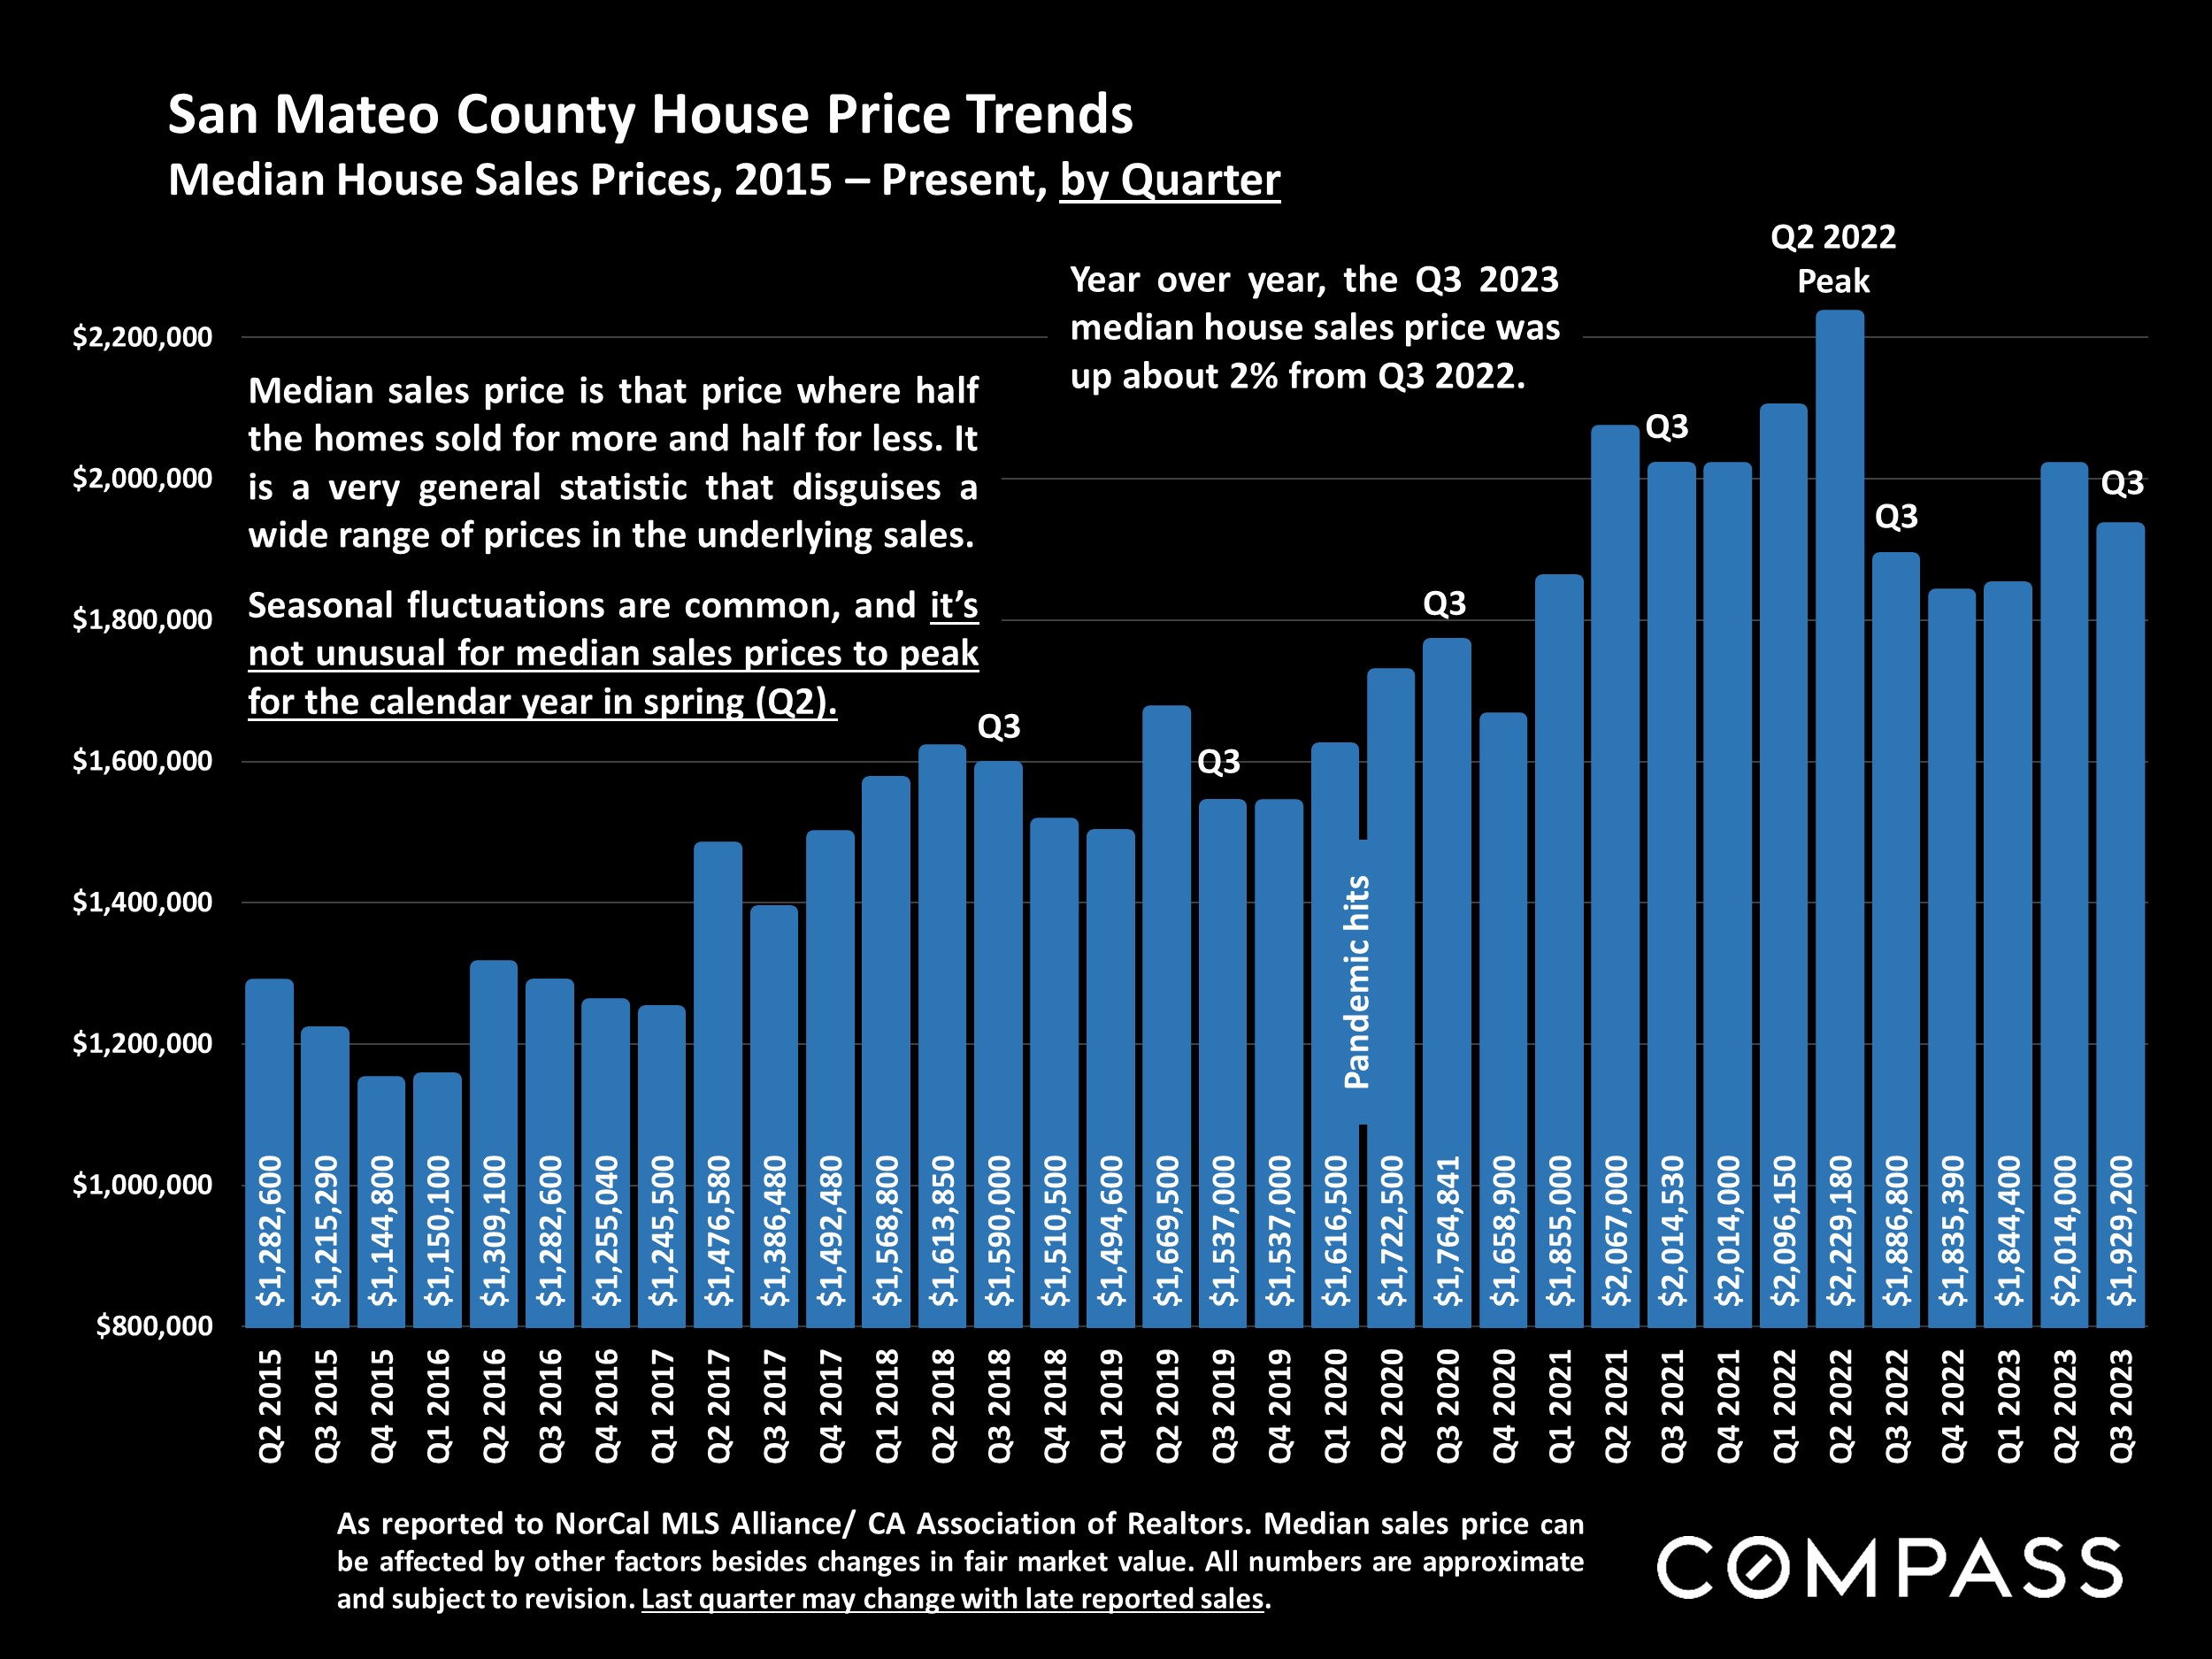
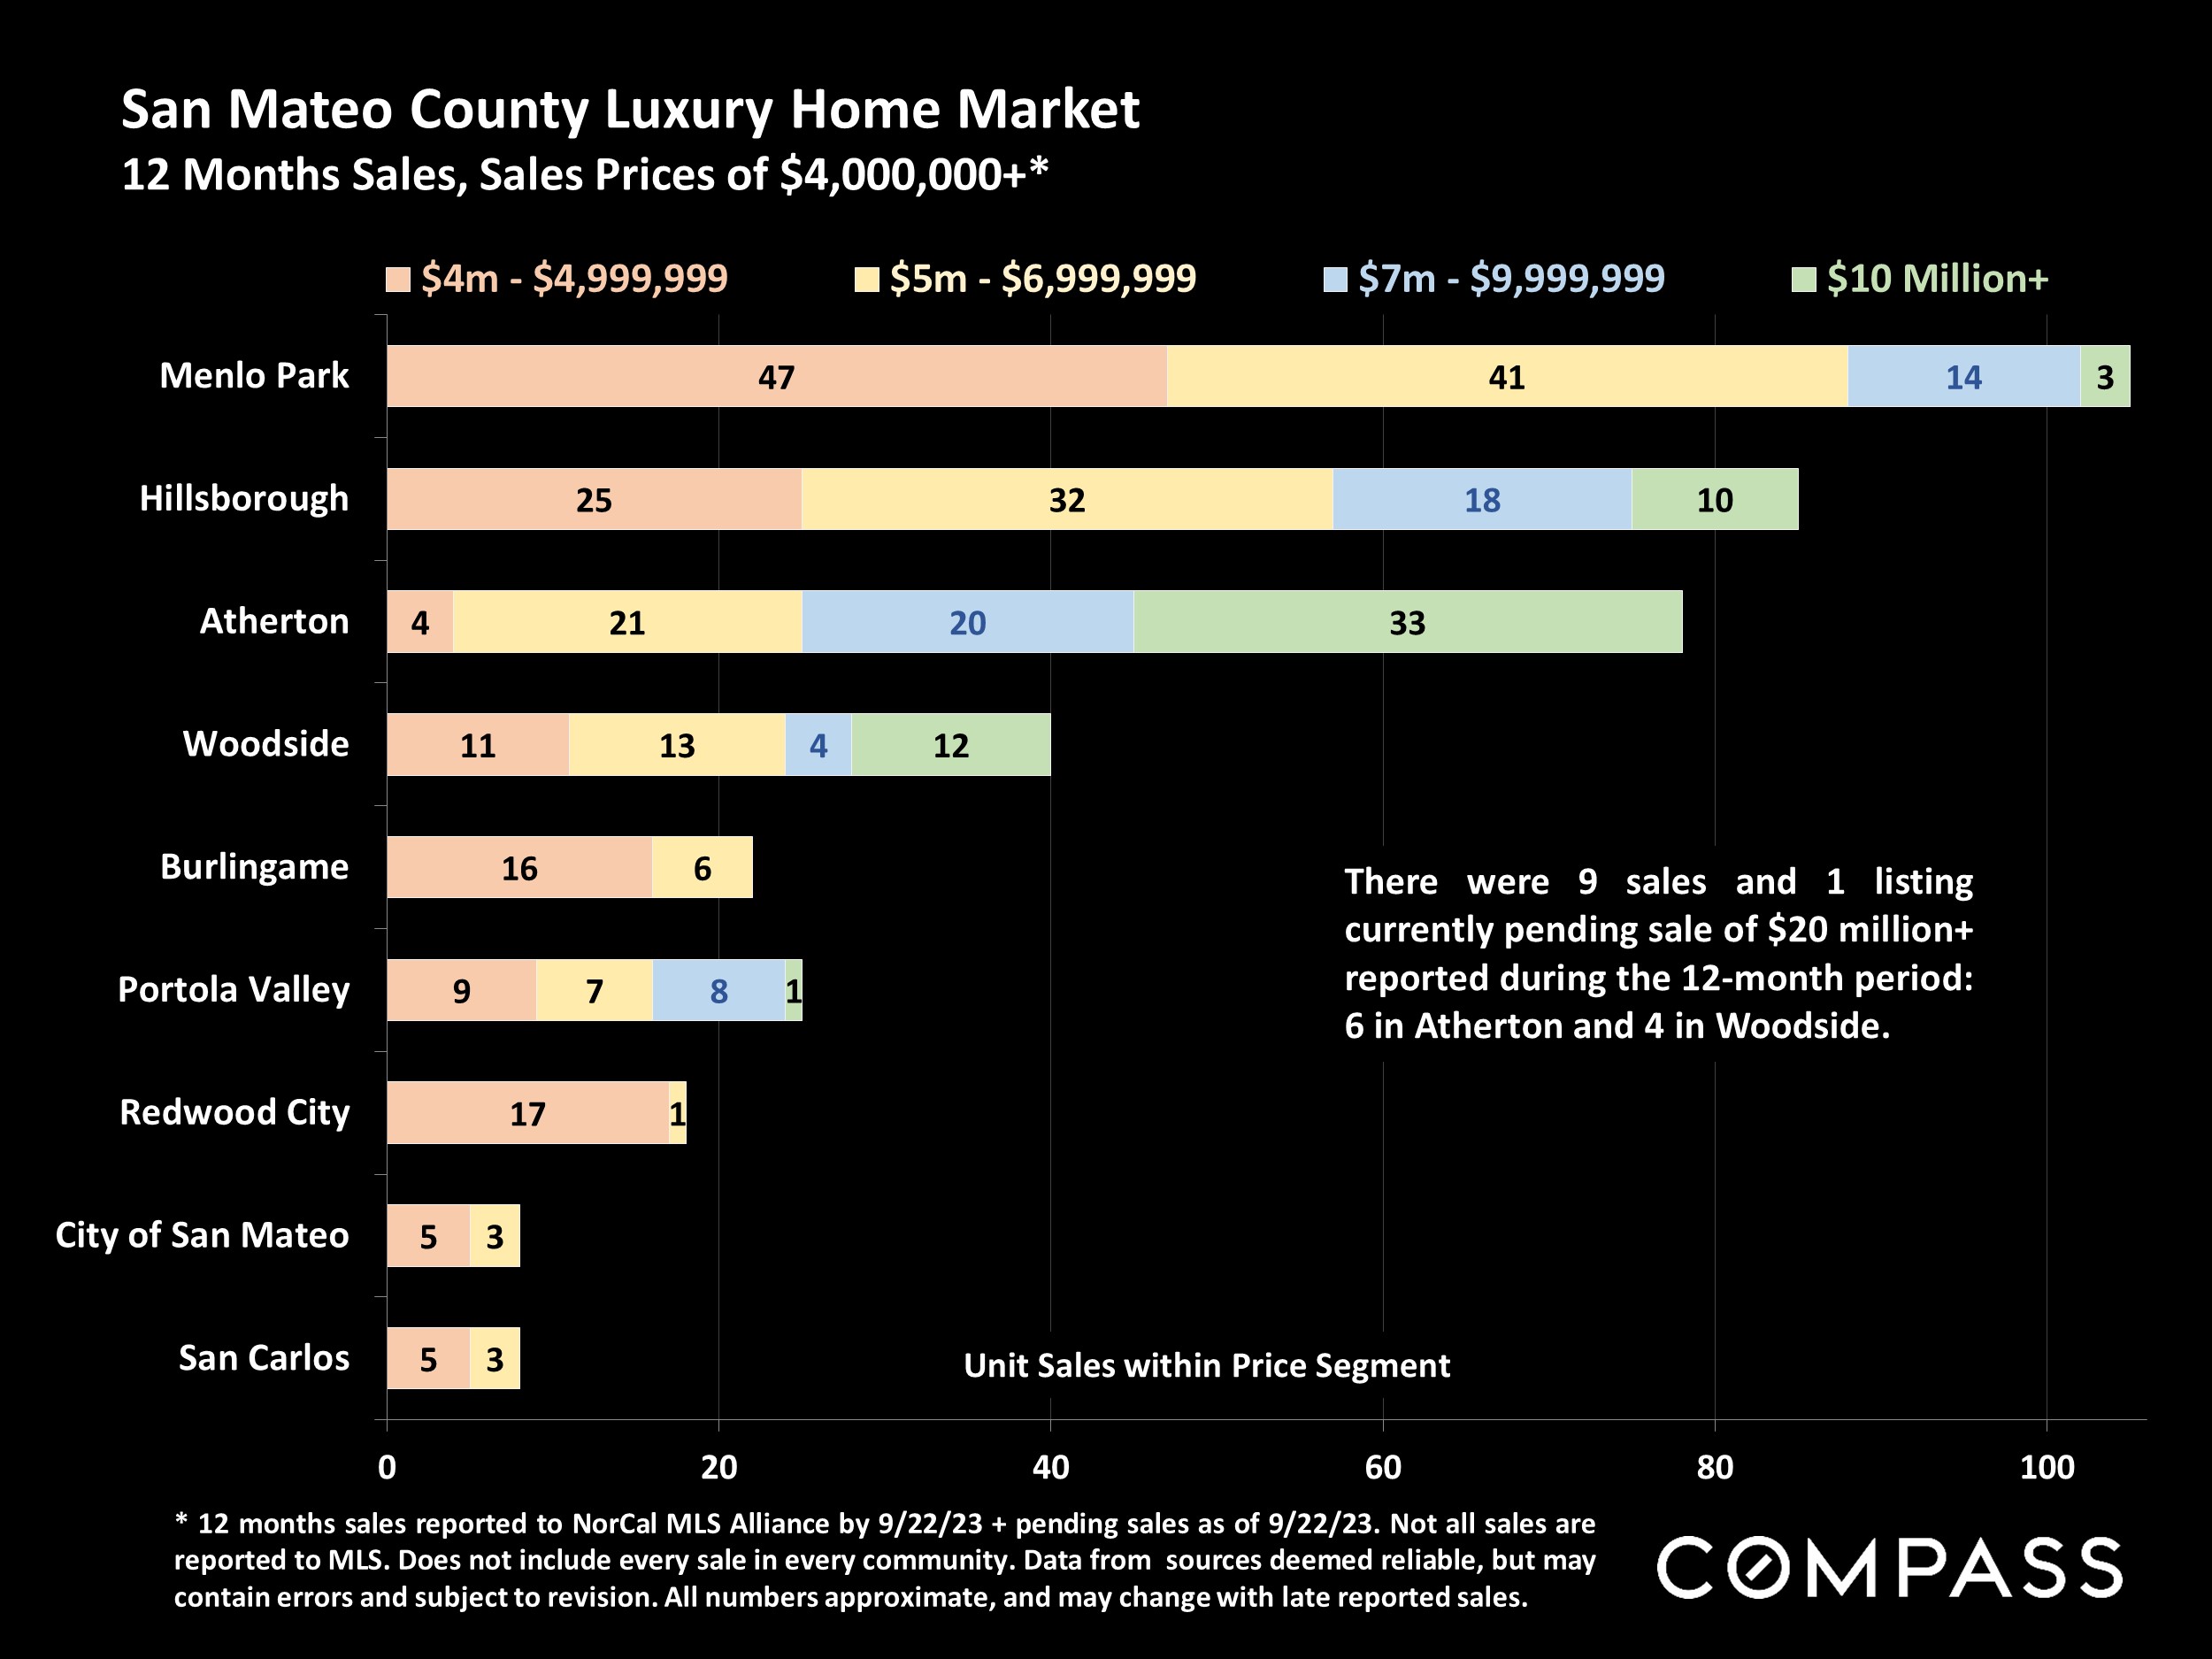
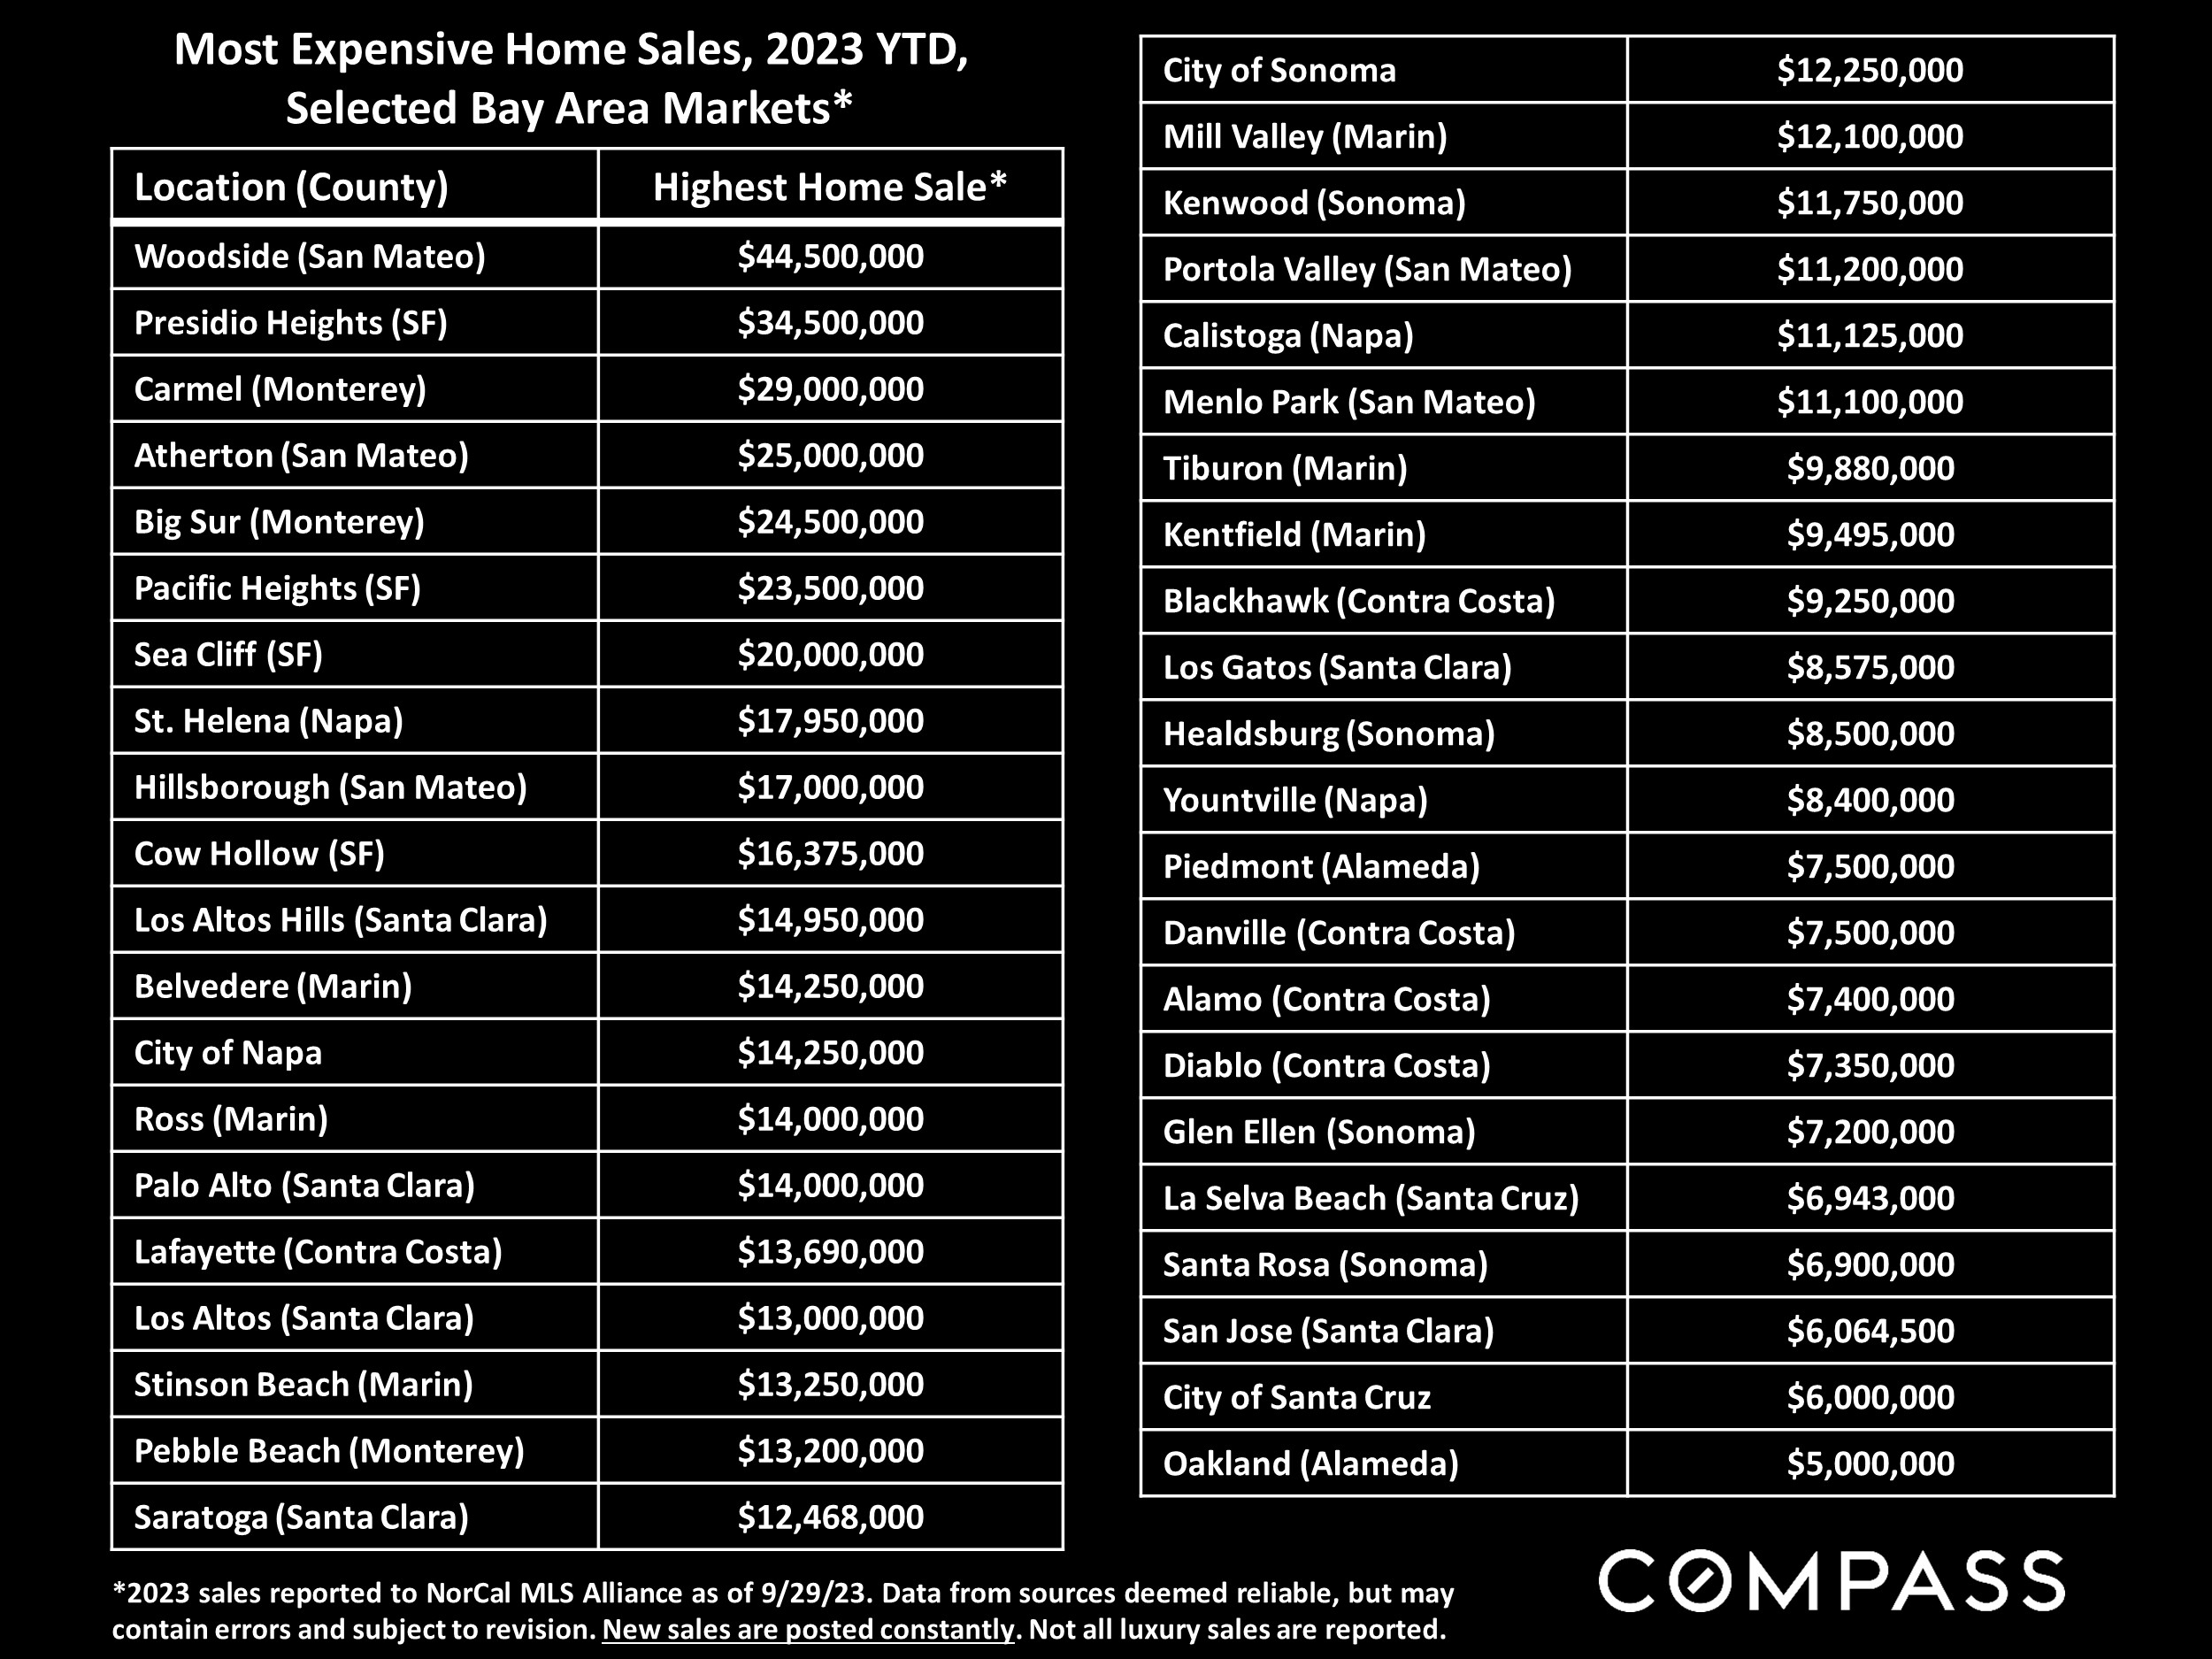
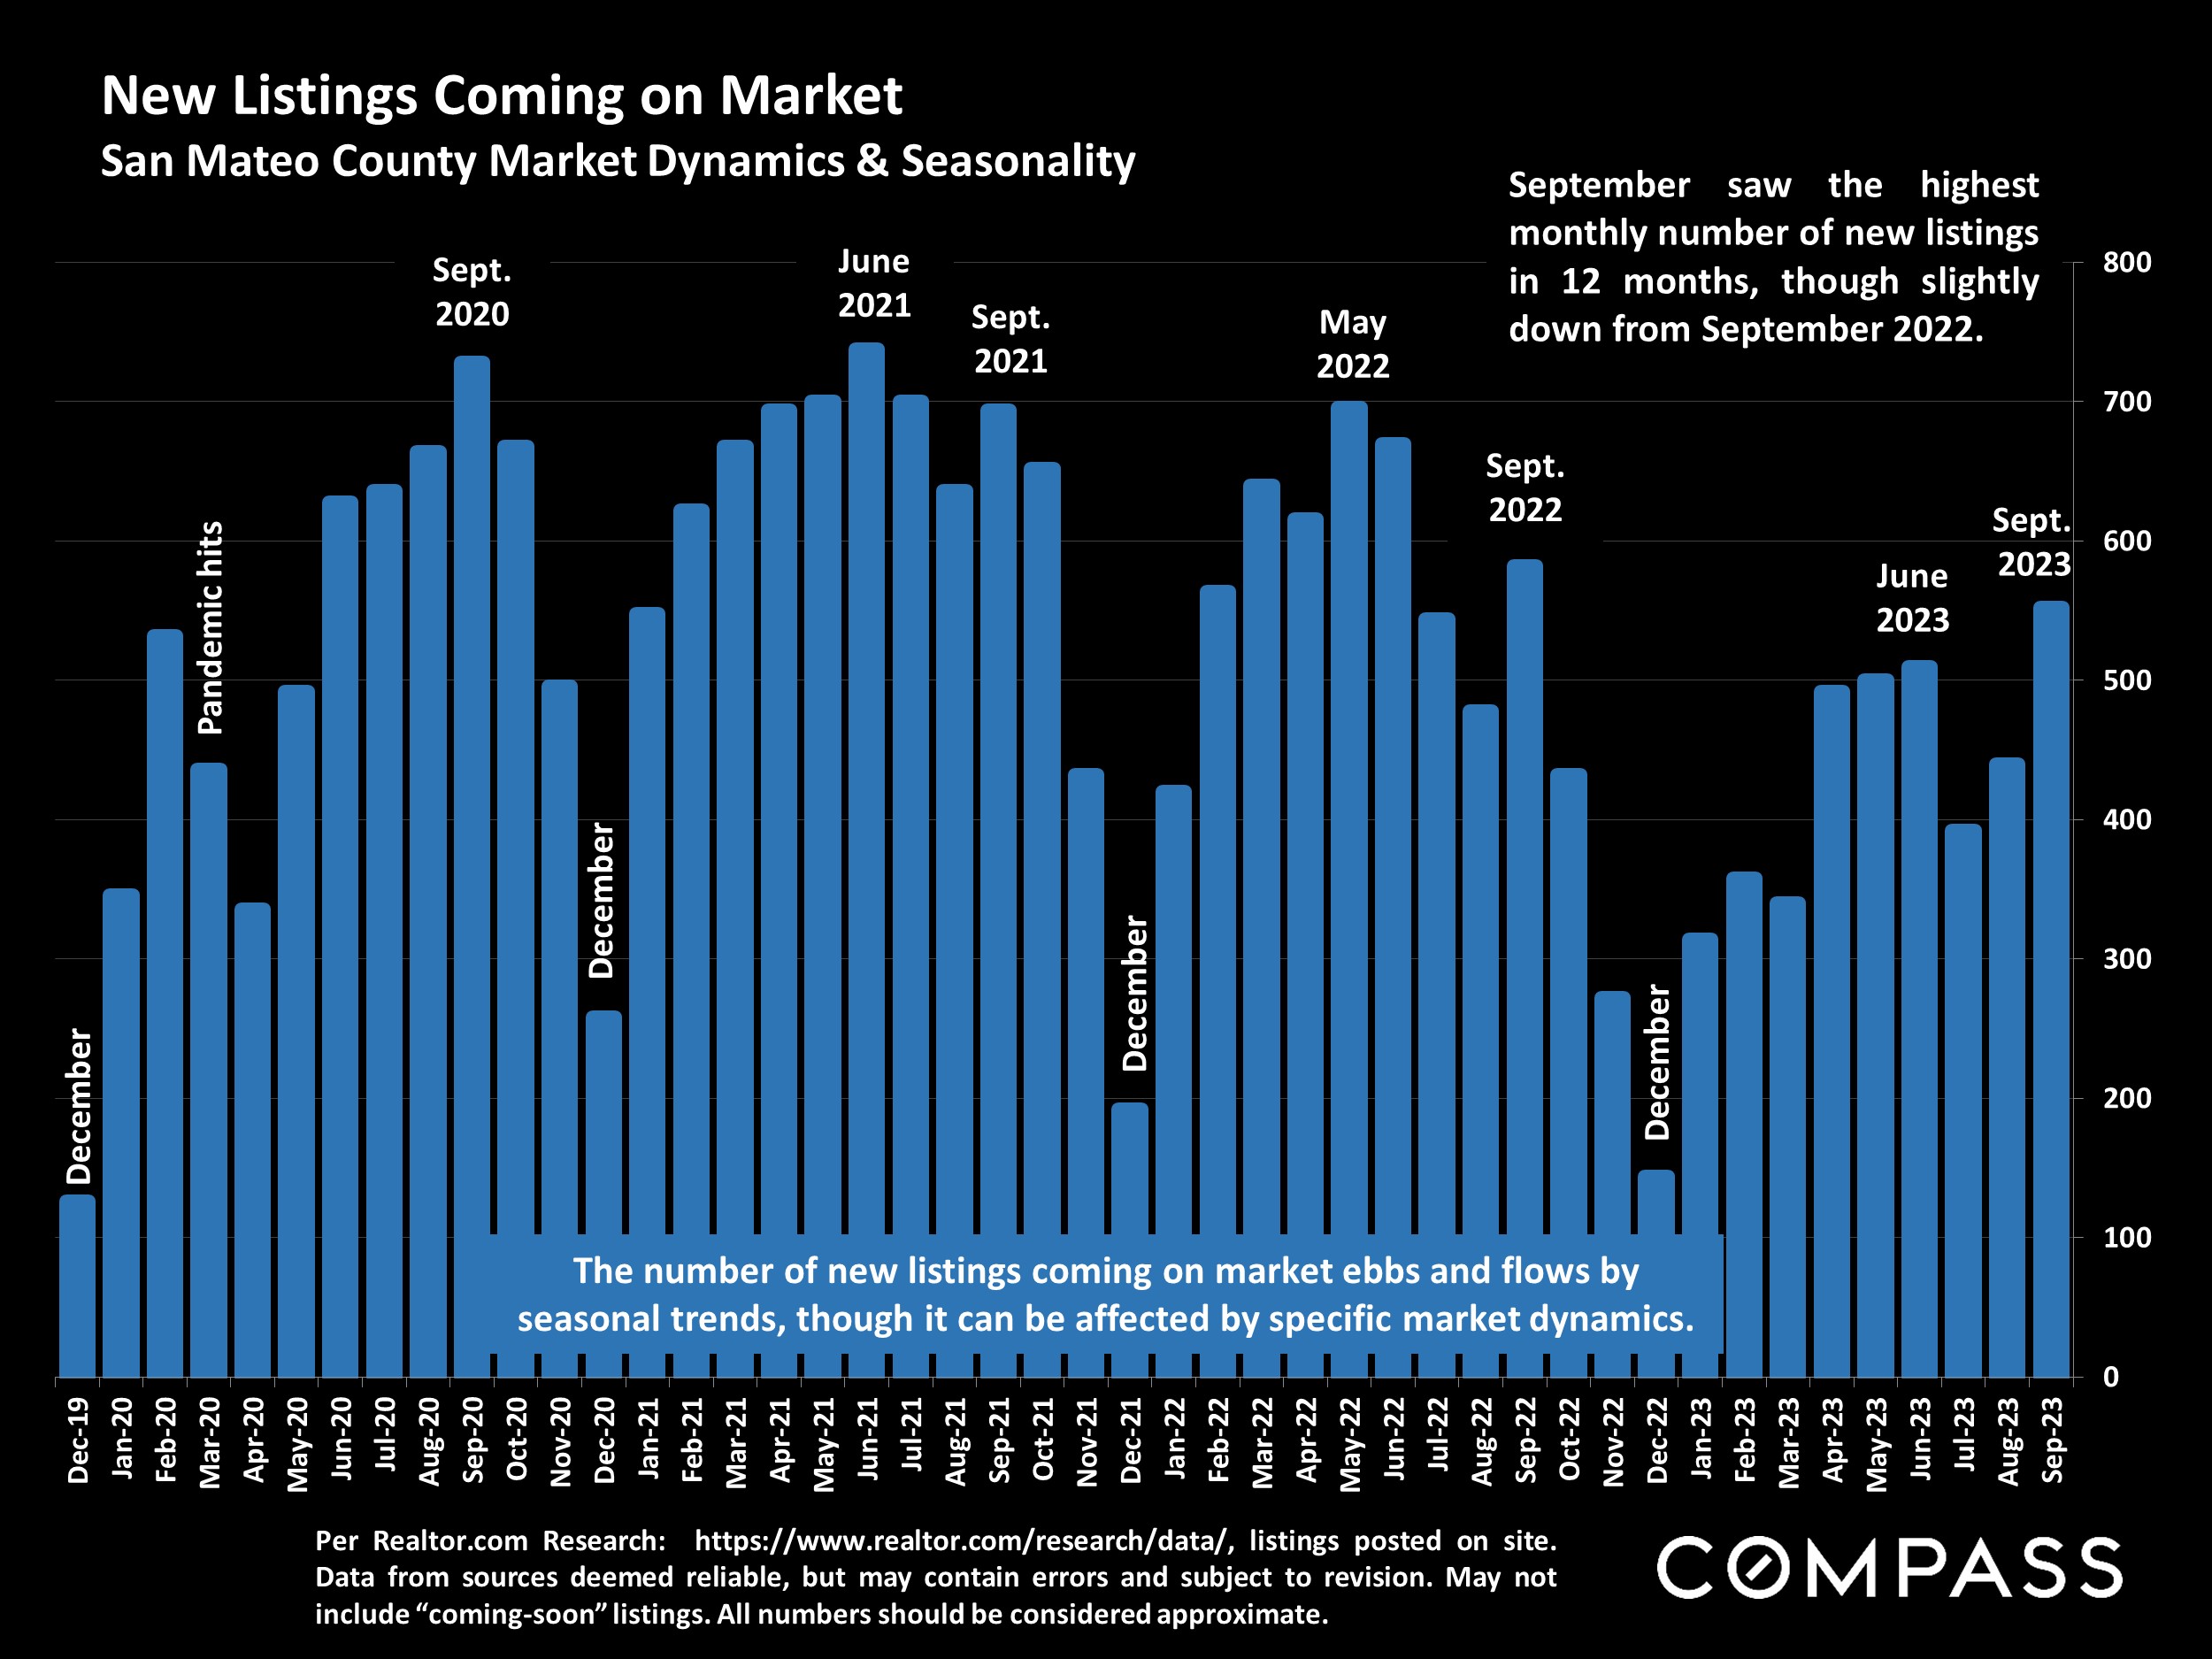
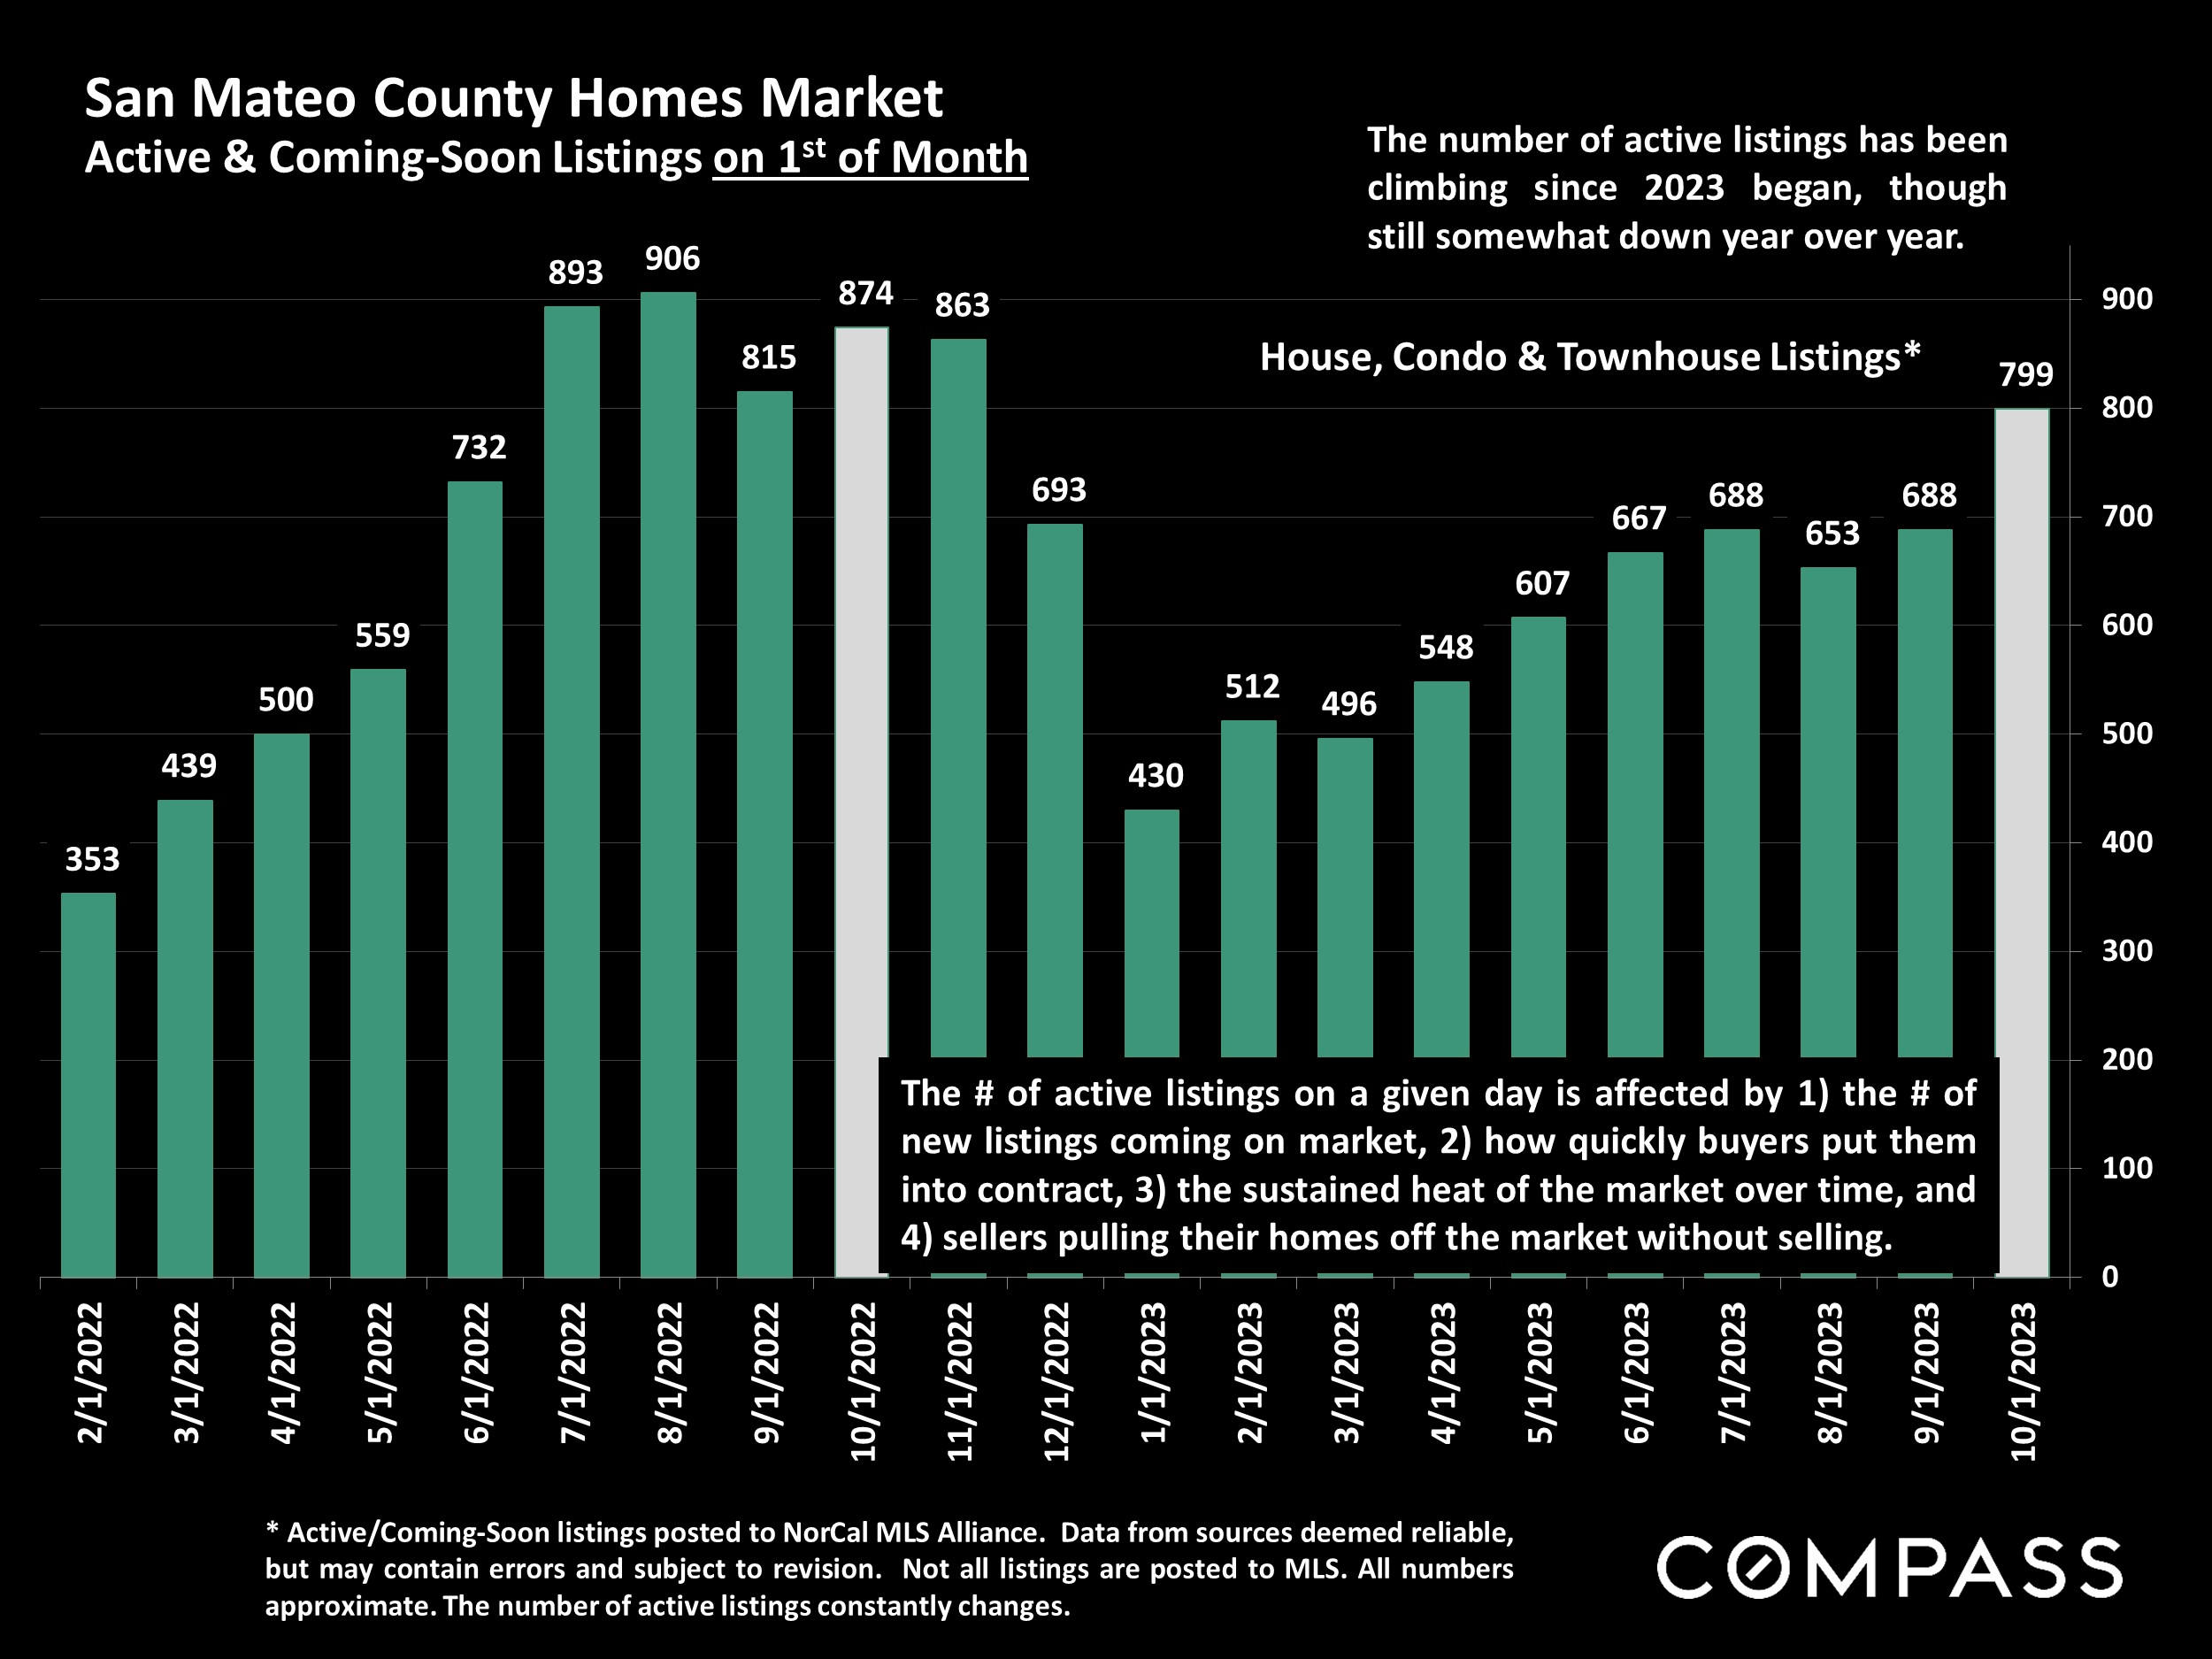
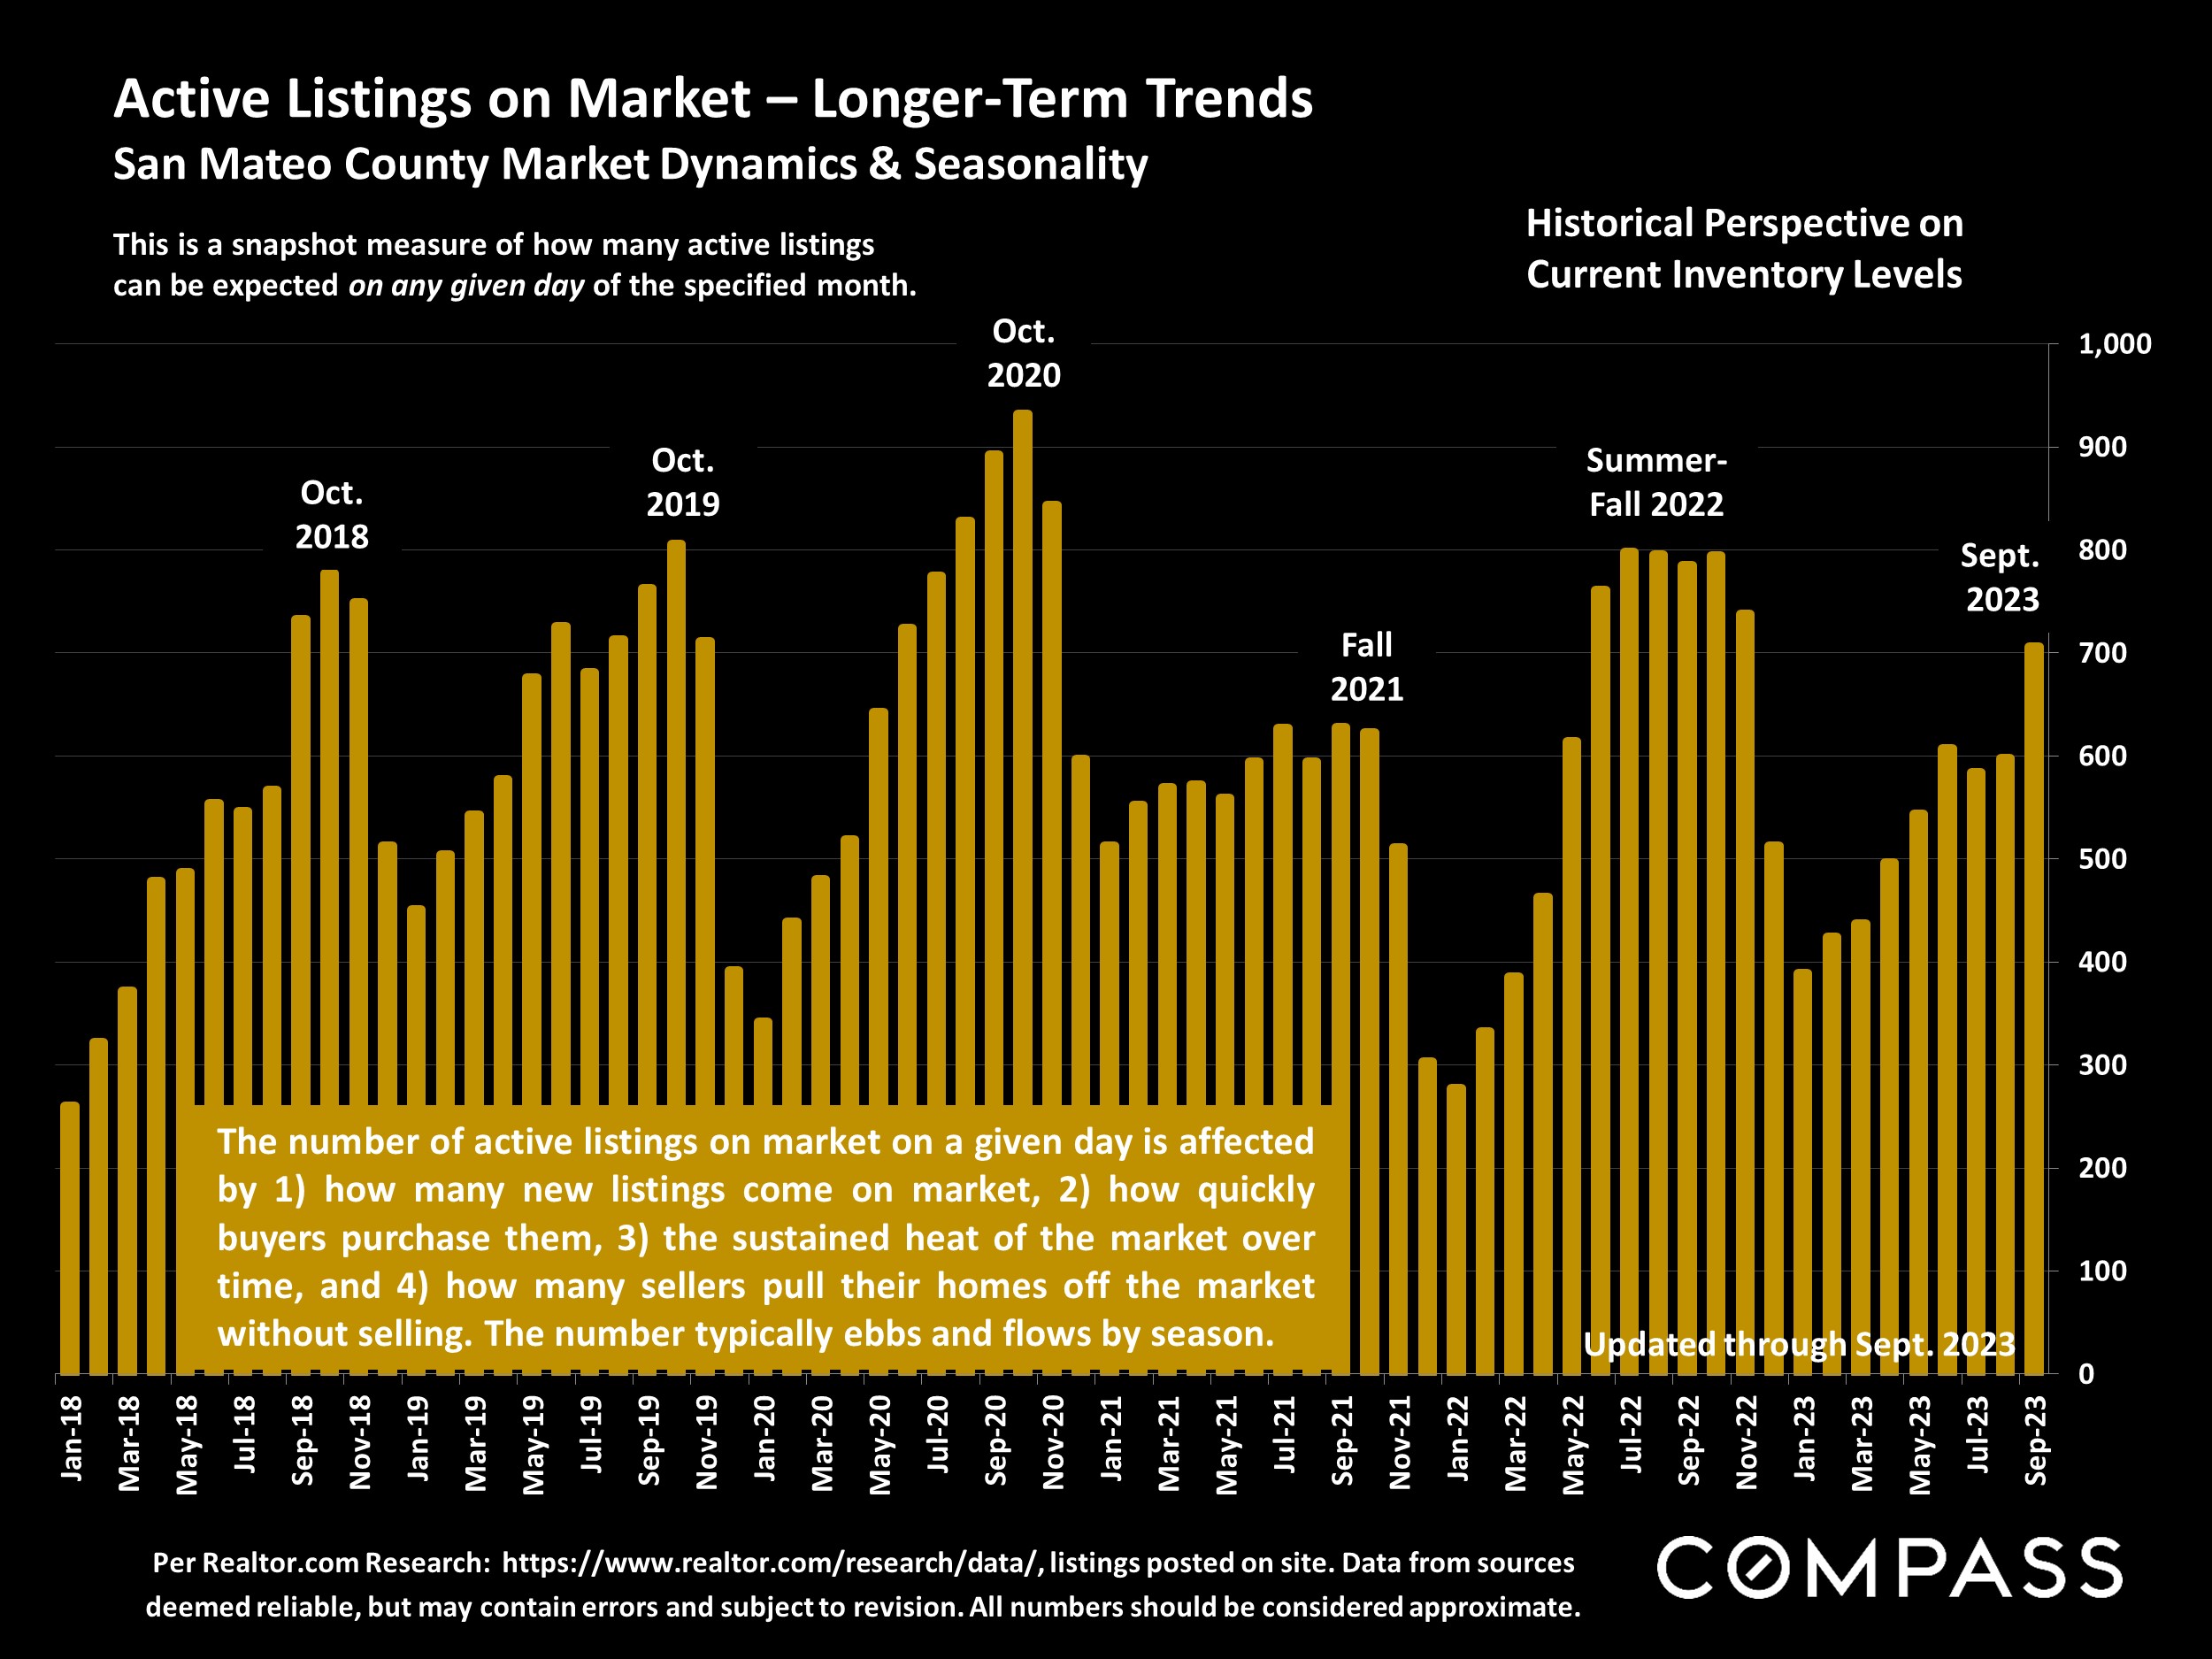
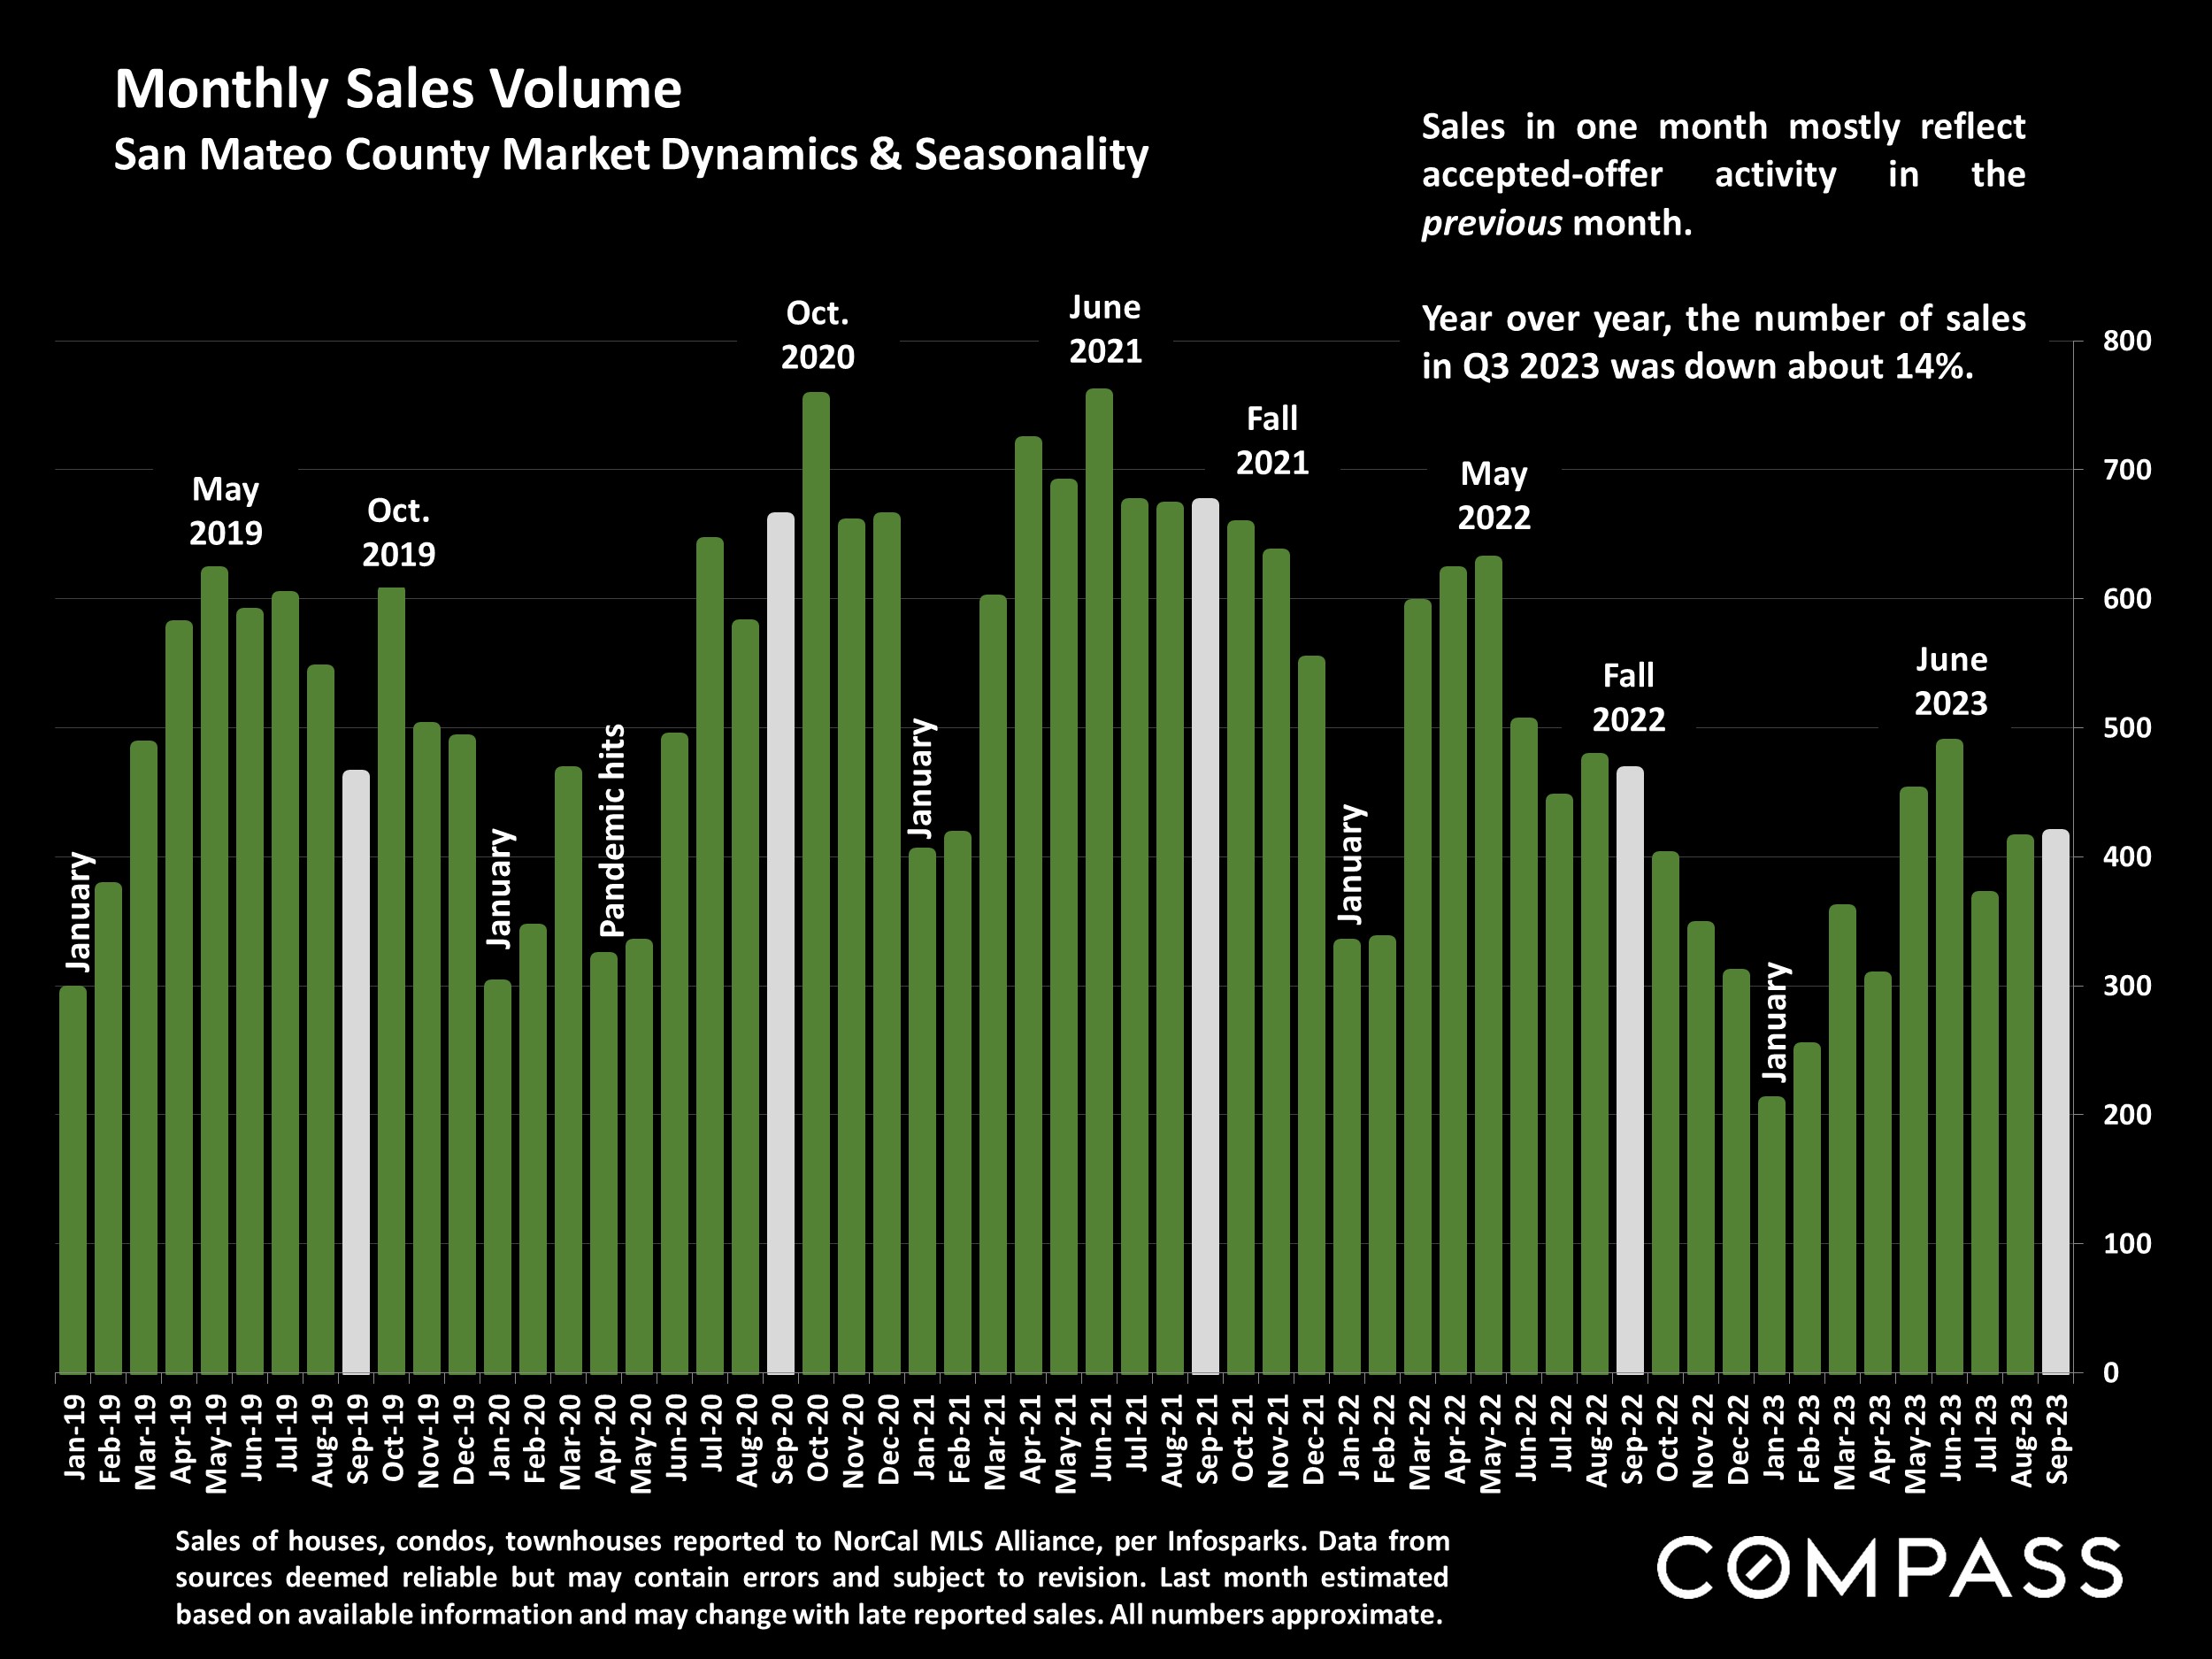
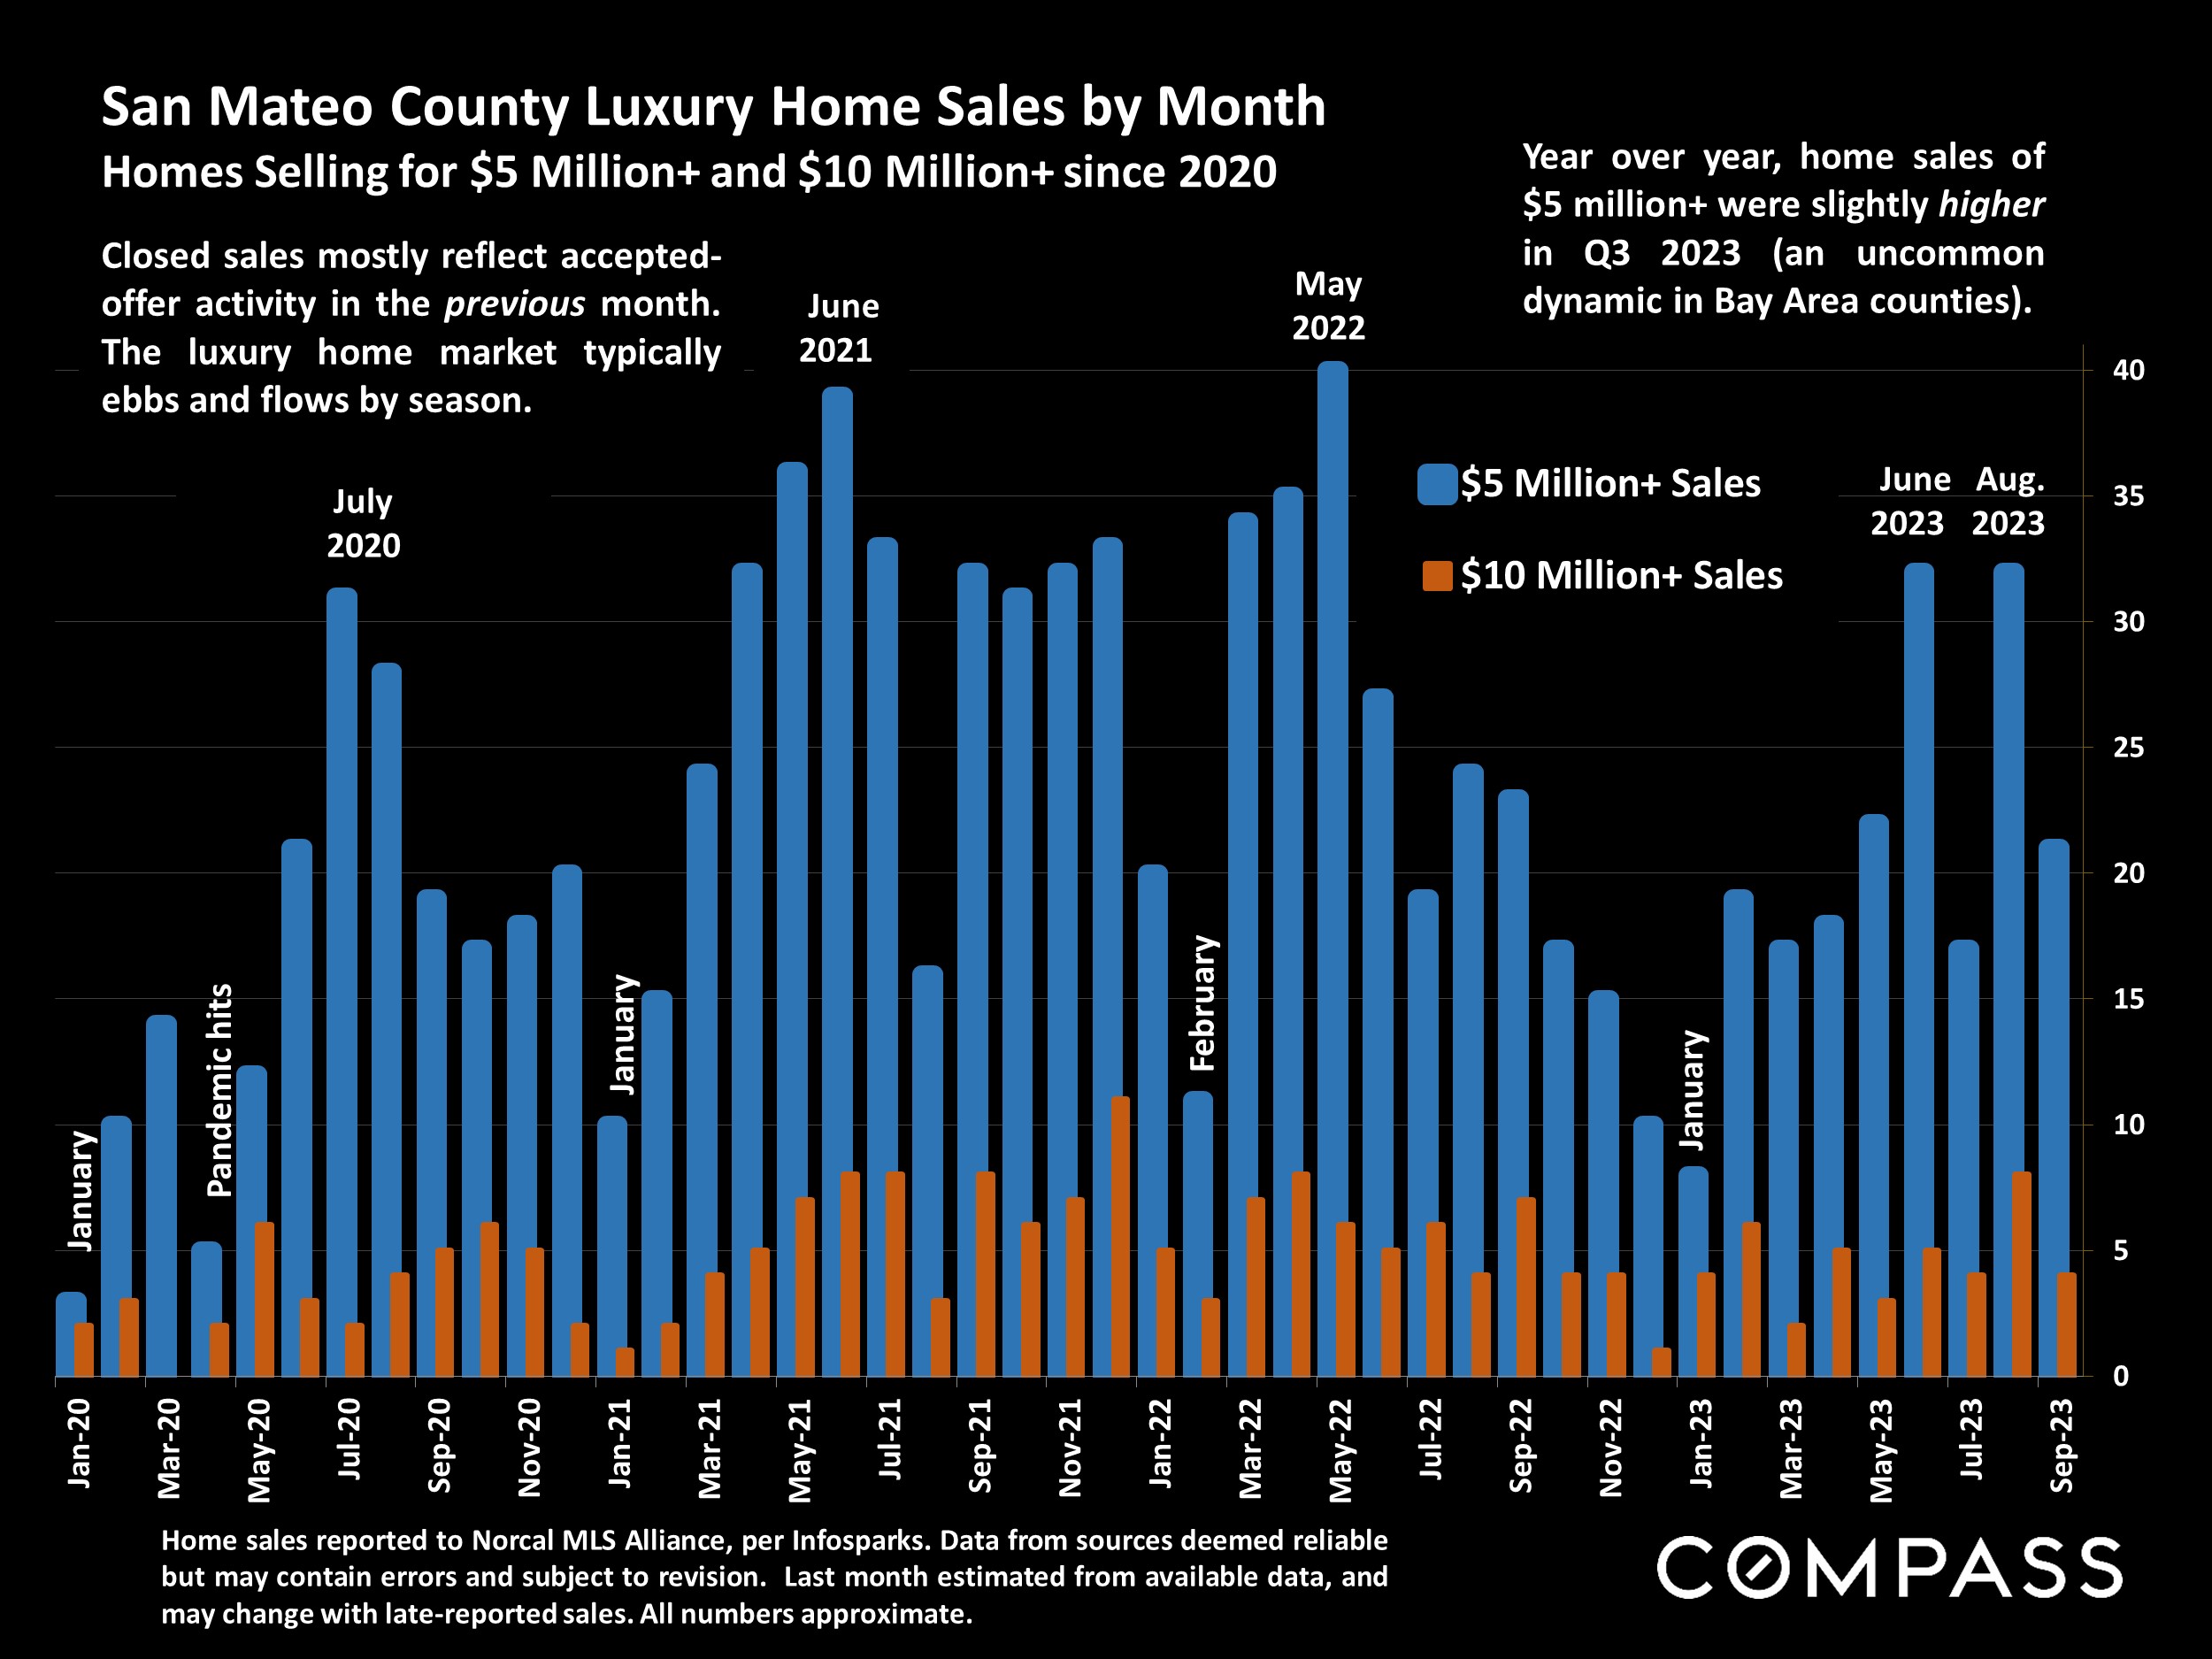
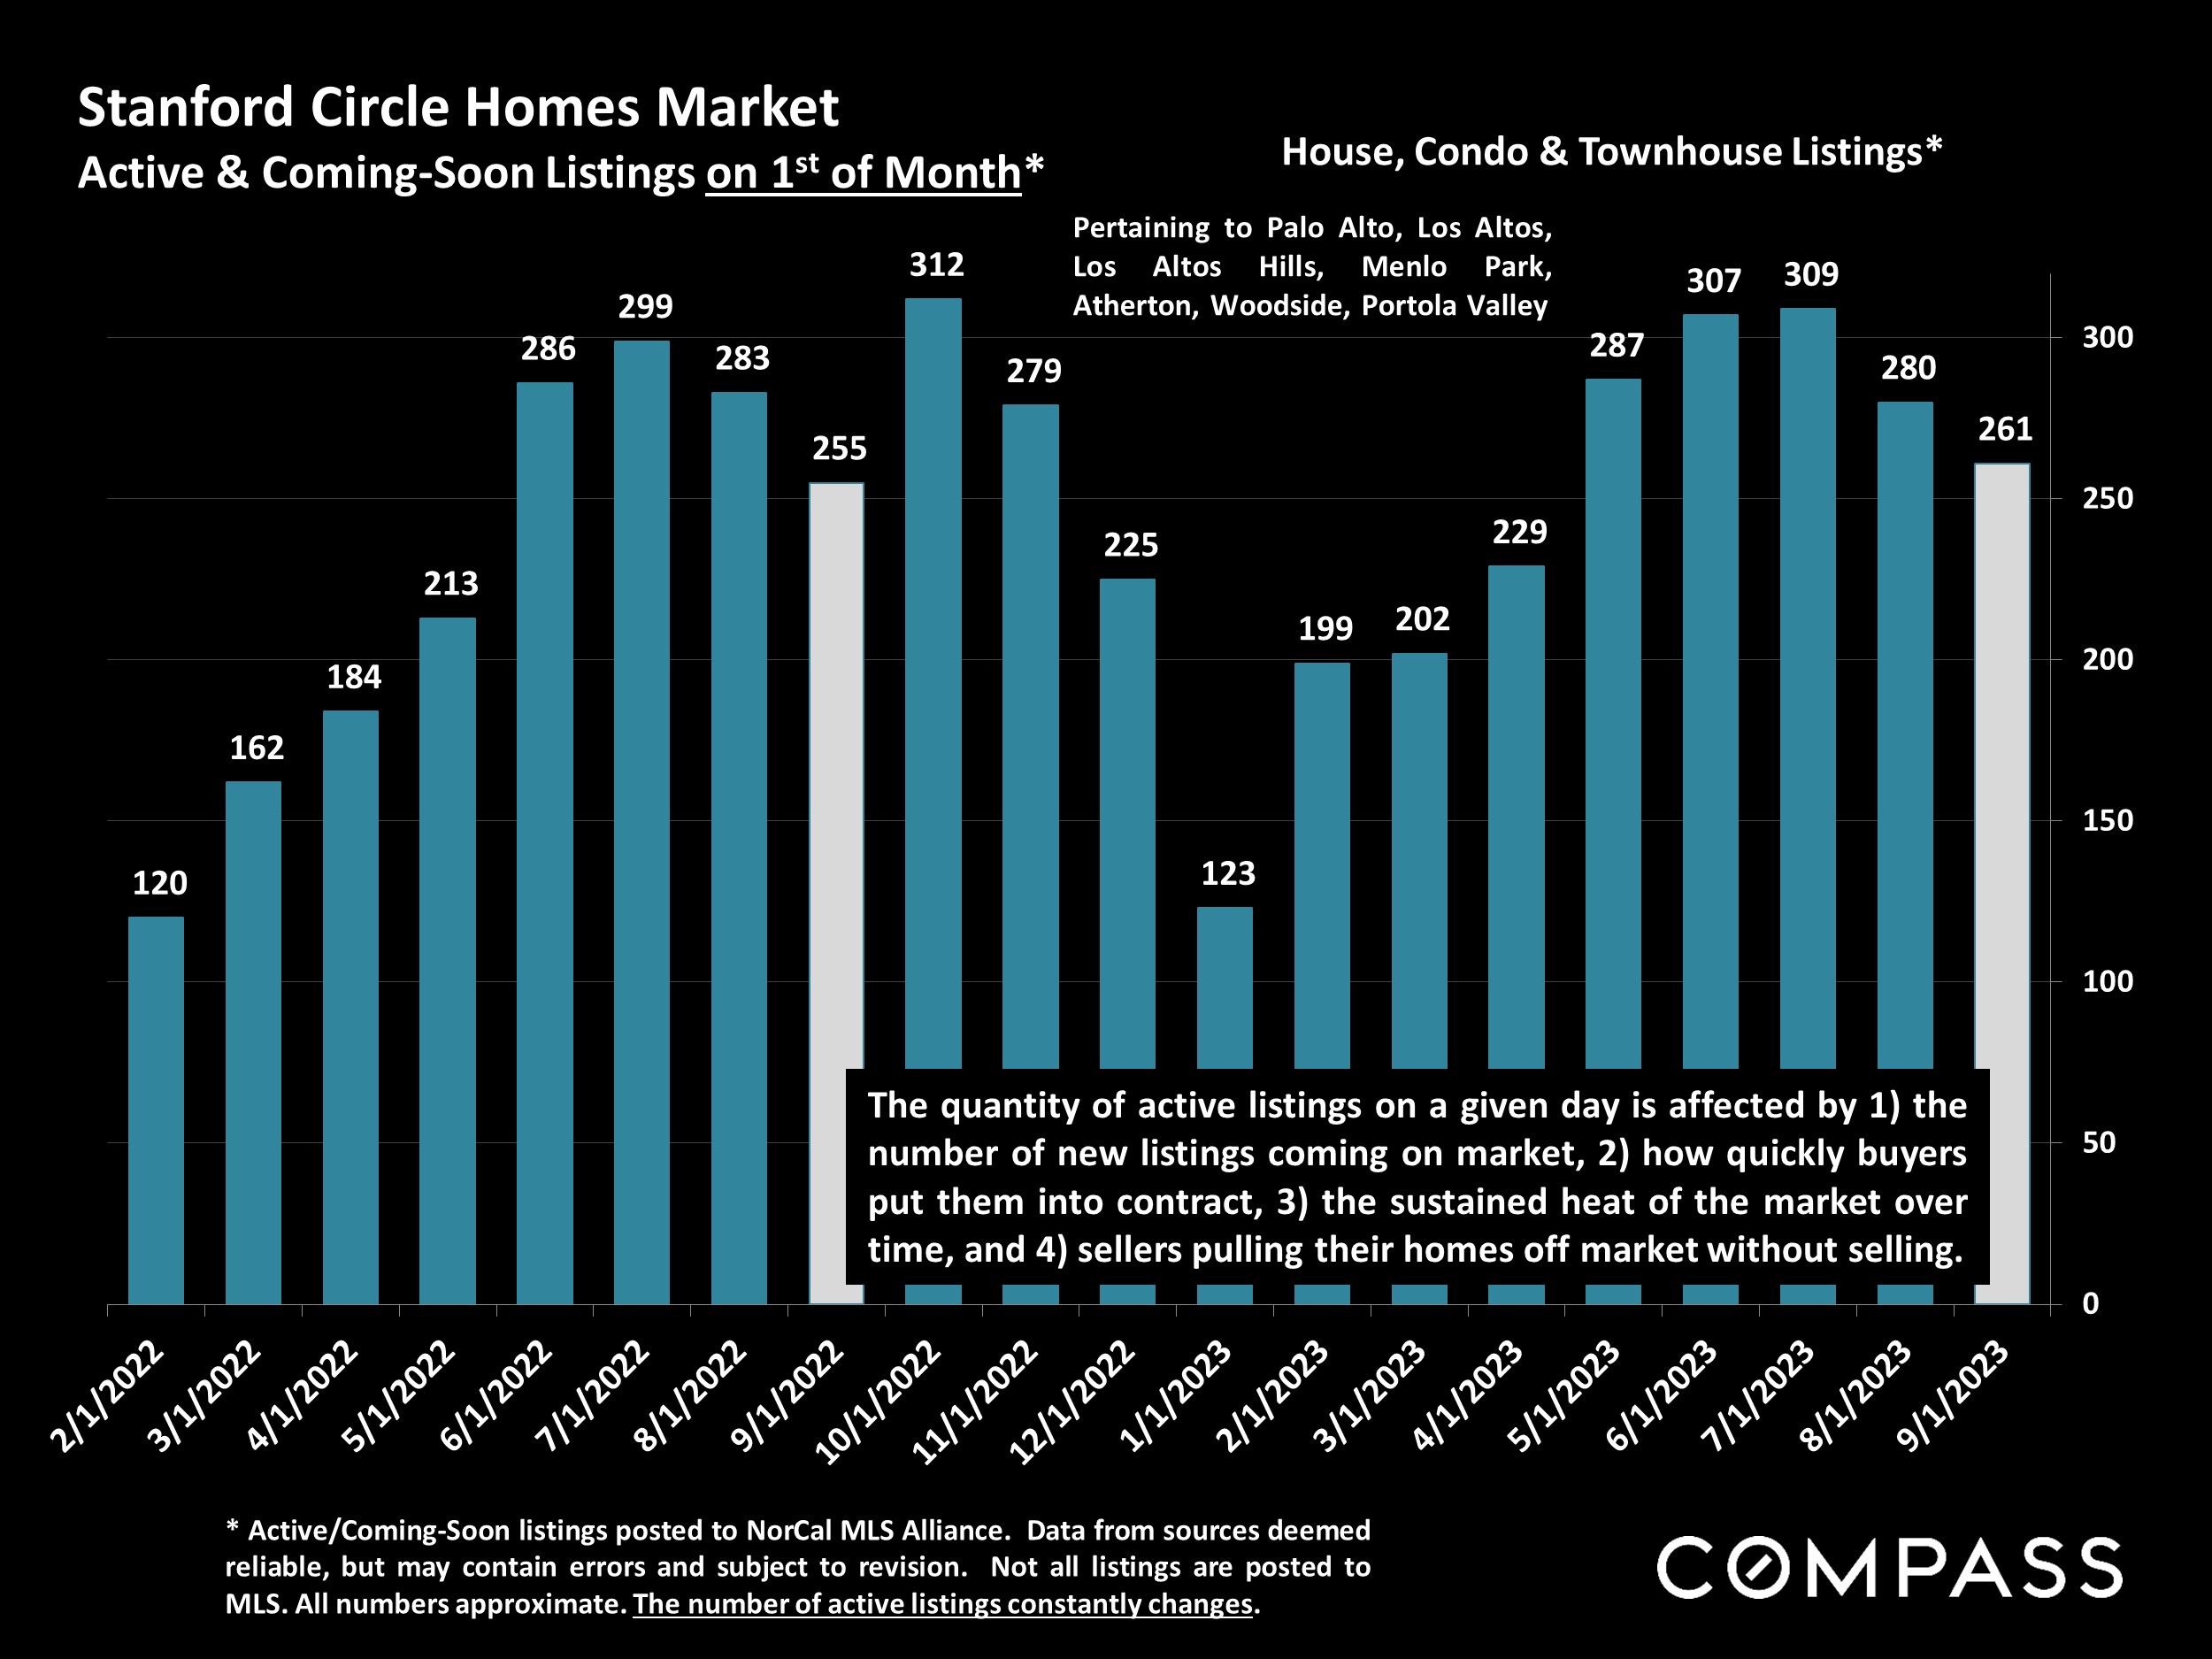
In the meantime, the Q3 median house sales price was up about 2% from Q3 2022, and with a September surge in new listings, the total supply of active listings just hit a YTD high, though still somewhat below this time last year. Year over year, the number of home sales in Q3 was down about 14%, mostly due to the comparatively low supply of listings for sale during most of the summer, though also affected by interest rates. Luxury home sales of $5 million+ increased in Q3 2023 on a year-over-year basis.
The CA Association of Realtors® (CAR) recently issued their initial 2024 market forecast:
“California housing market will rebound in 2024”
CAR forecast: Existing, single-family home sales will increase in 2024 by approximately 23 percent, and the CA median home price is expected to climb by 6.2%. The average 30-year, fixed mortgage interest rate is projected to decline to 6%. Housing supply will remain below normal despite a 10% to 20% increase in active listings, as market conditions and the lending environment continue to improve. [However] the percentage of CA households able to purchase a median-priced single family dwelling will remain very low by long-term standards. CAR Chief Economist, 9/20/23
Statistics are generalities, essentially summaries of widely disparate data generated by dozens, hundreds or thousands of unique, individual sales occurring within different time periods. They are best seen not as precise measurements, but as broad, comparative indicators, with reasonable margins of error. Anomalous fluctuations in statistics are not uncommon, especially in smaller, expensive market segments. Last period data should be considered estimates that may change with late-reported data. Different analytics programs sometimes define statistics – such as “active listings,” “days on market,” and “months supply of inventory” – differently: what is most meaningful are not specific calculations but the trends they illustrate. Most listing and sales data derives from the local or regional multi-listing service (MLS) of the area specified in the analysis, but not all listings or sales are reported to MLS and these won’t be reflected in the data. “Homes” signifies real-property, single-household housing units: houses, condos, co-ops, townhouses, duets and TICs (but not mobile homes), as applicable to each market. City/town names refer specifically to the named cities and towns, unless otherwise delineated. Multi-county metro areas will be specified as such. Data from sources deemed reliable, but may contain errors and subject to revision. All numbers to be considered approximate.
Many aspects of value cannot be adequately reflected in median and average statistics: curb appeal, age, condition, amenities, views, lot size, quality of outdoor space, “bonus” rooms, additional parking, quality of location within the neighborhood, and so on. How any of these statistics apply to any particular home is unknown without a specific comparative market analysis. Median Sales Price is that price at which half the properties sold for more and half for less. It may be affected by seasonality, “unusual” events, or changes in inventory and buying trends, as well as by changes in fair market value. The median sales price for an area will often conceal an enormous variety of sales prices in the underlying individual sales.
Dollar per Square Foot is based upon the home’s interior living space and does not include garages, unfinished attics and basements, rooms built without permit, patios, decks or yards (though all those can add value to a home). These figures are usually derived from appraisals or tax records, but are sometimes unreliable (especially for older homes) or unreported altogether. The calculation can only be made on those home sales that reported square footage.
Photo use under the Creative Commons License: https://creativecommons.org/licenses/by-sa/2.0/
Compass is a real estate broker licensed by the State of California, DRE 01527235. Equal Housing Opportunity. This report has been prepared solely for information purposes. The information herein is based on or derived from information generally available to the public and/or from sources believed to be reliable. No representation or warranty can be given with respect to the accuracy or completeness of the information. Compass disclaims any and all liability relating to this report, including without limitation any express or implied representations or warranties for statements contained in, and omissions from, the report. Nothing contained herein is intended to be or should be read as any regulatory, legal, tax, accounting or other advice and Compass does not provide such advice. All opinions are subject to change without notice. Compass makes no representation regarding the accuracy of any statements regarding any references to the laws, statutes or regulations of any state are those of the author(s). Past performance is no guarantee of future results.
Economic indicators have been challenging since the fall selling season began: Interest rates continued to rise through early October and stock markets generally continued to fall from mid- summer, YTD highs. The country faced yet another threat of a federal government shutdown, which happily didn’t occur, but, unbelievably, another such crisis may soon confront us again. Markets remain volatile and hard to predict, often reacting negatively to positive economic news (such as employment numbers) as they wait for new inflation numbers and try to parse the possible reaction of the Fed. Any definitive impacts on real estate markets of these recent developments, should they continue, won’t substantially show up until Q4 data begins to become available, and, of course, volatility also means that indicators can turn around quickly.
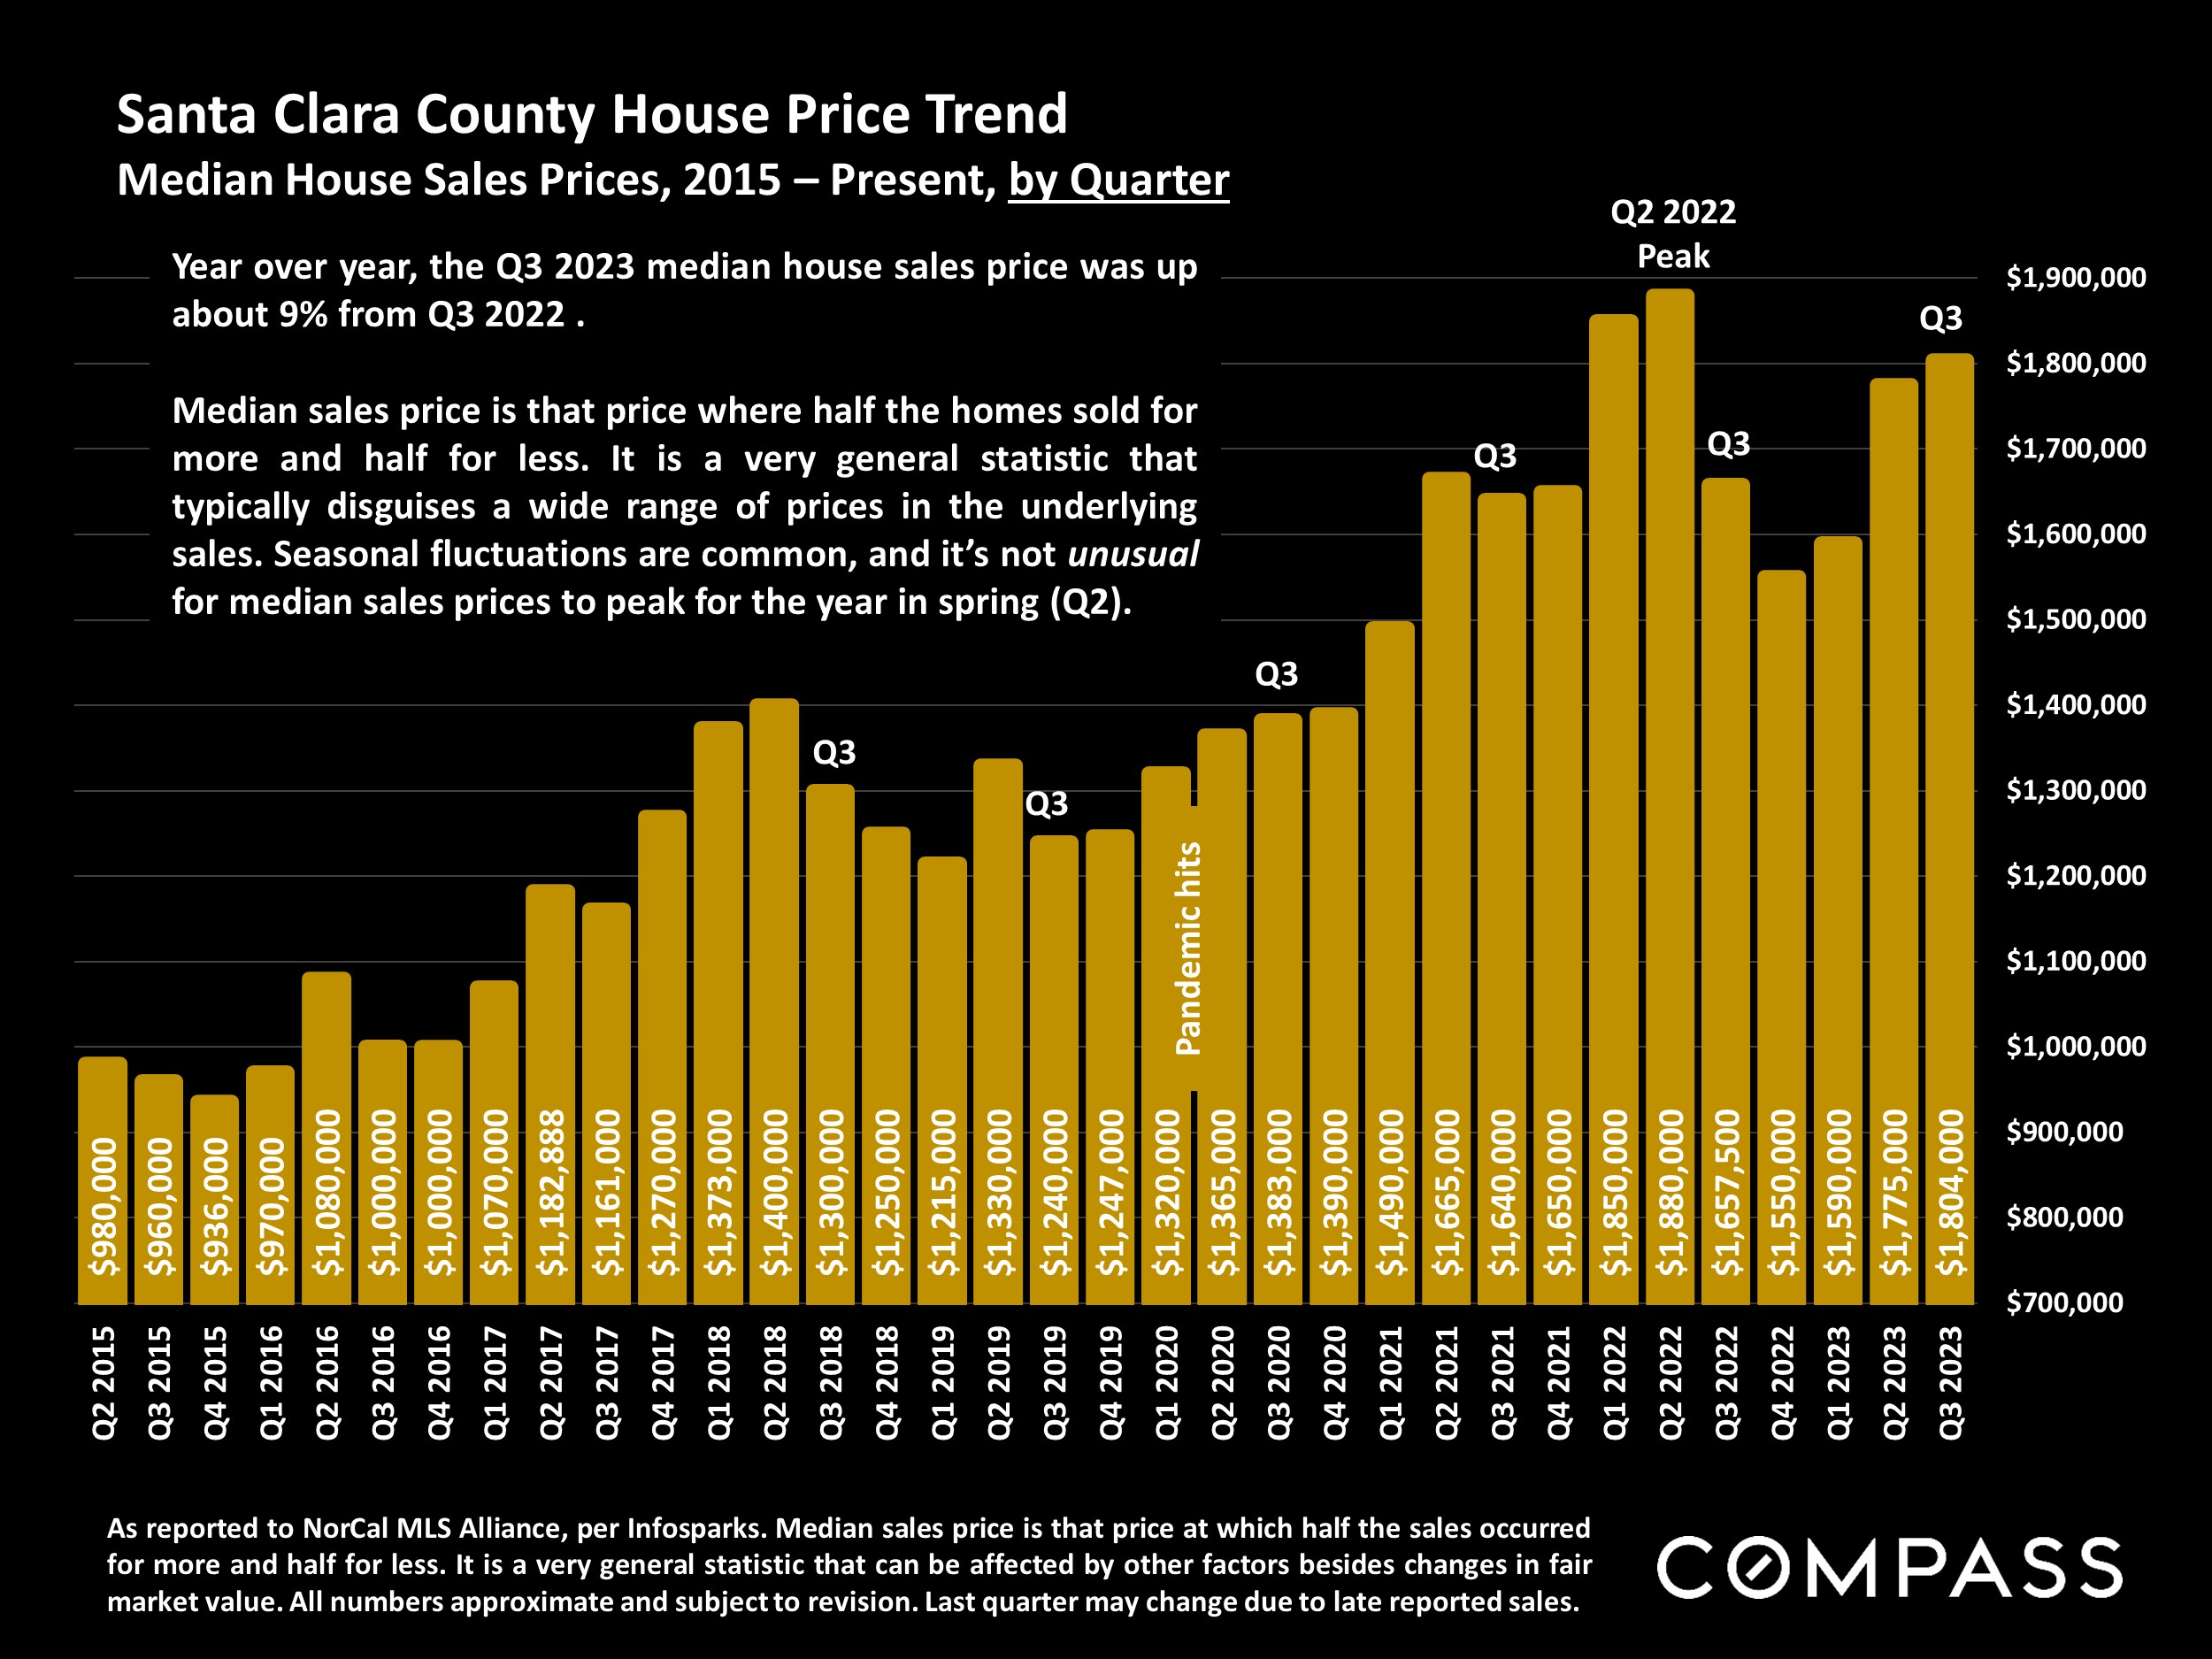
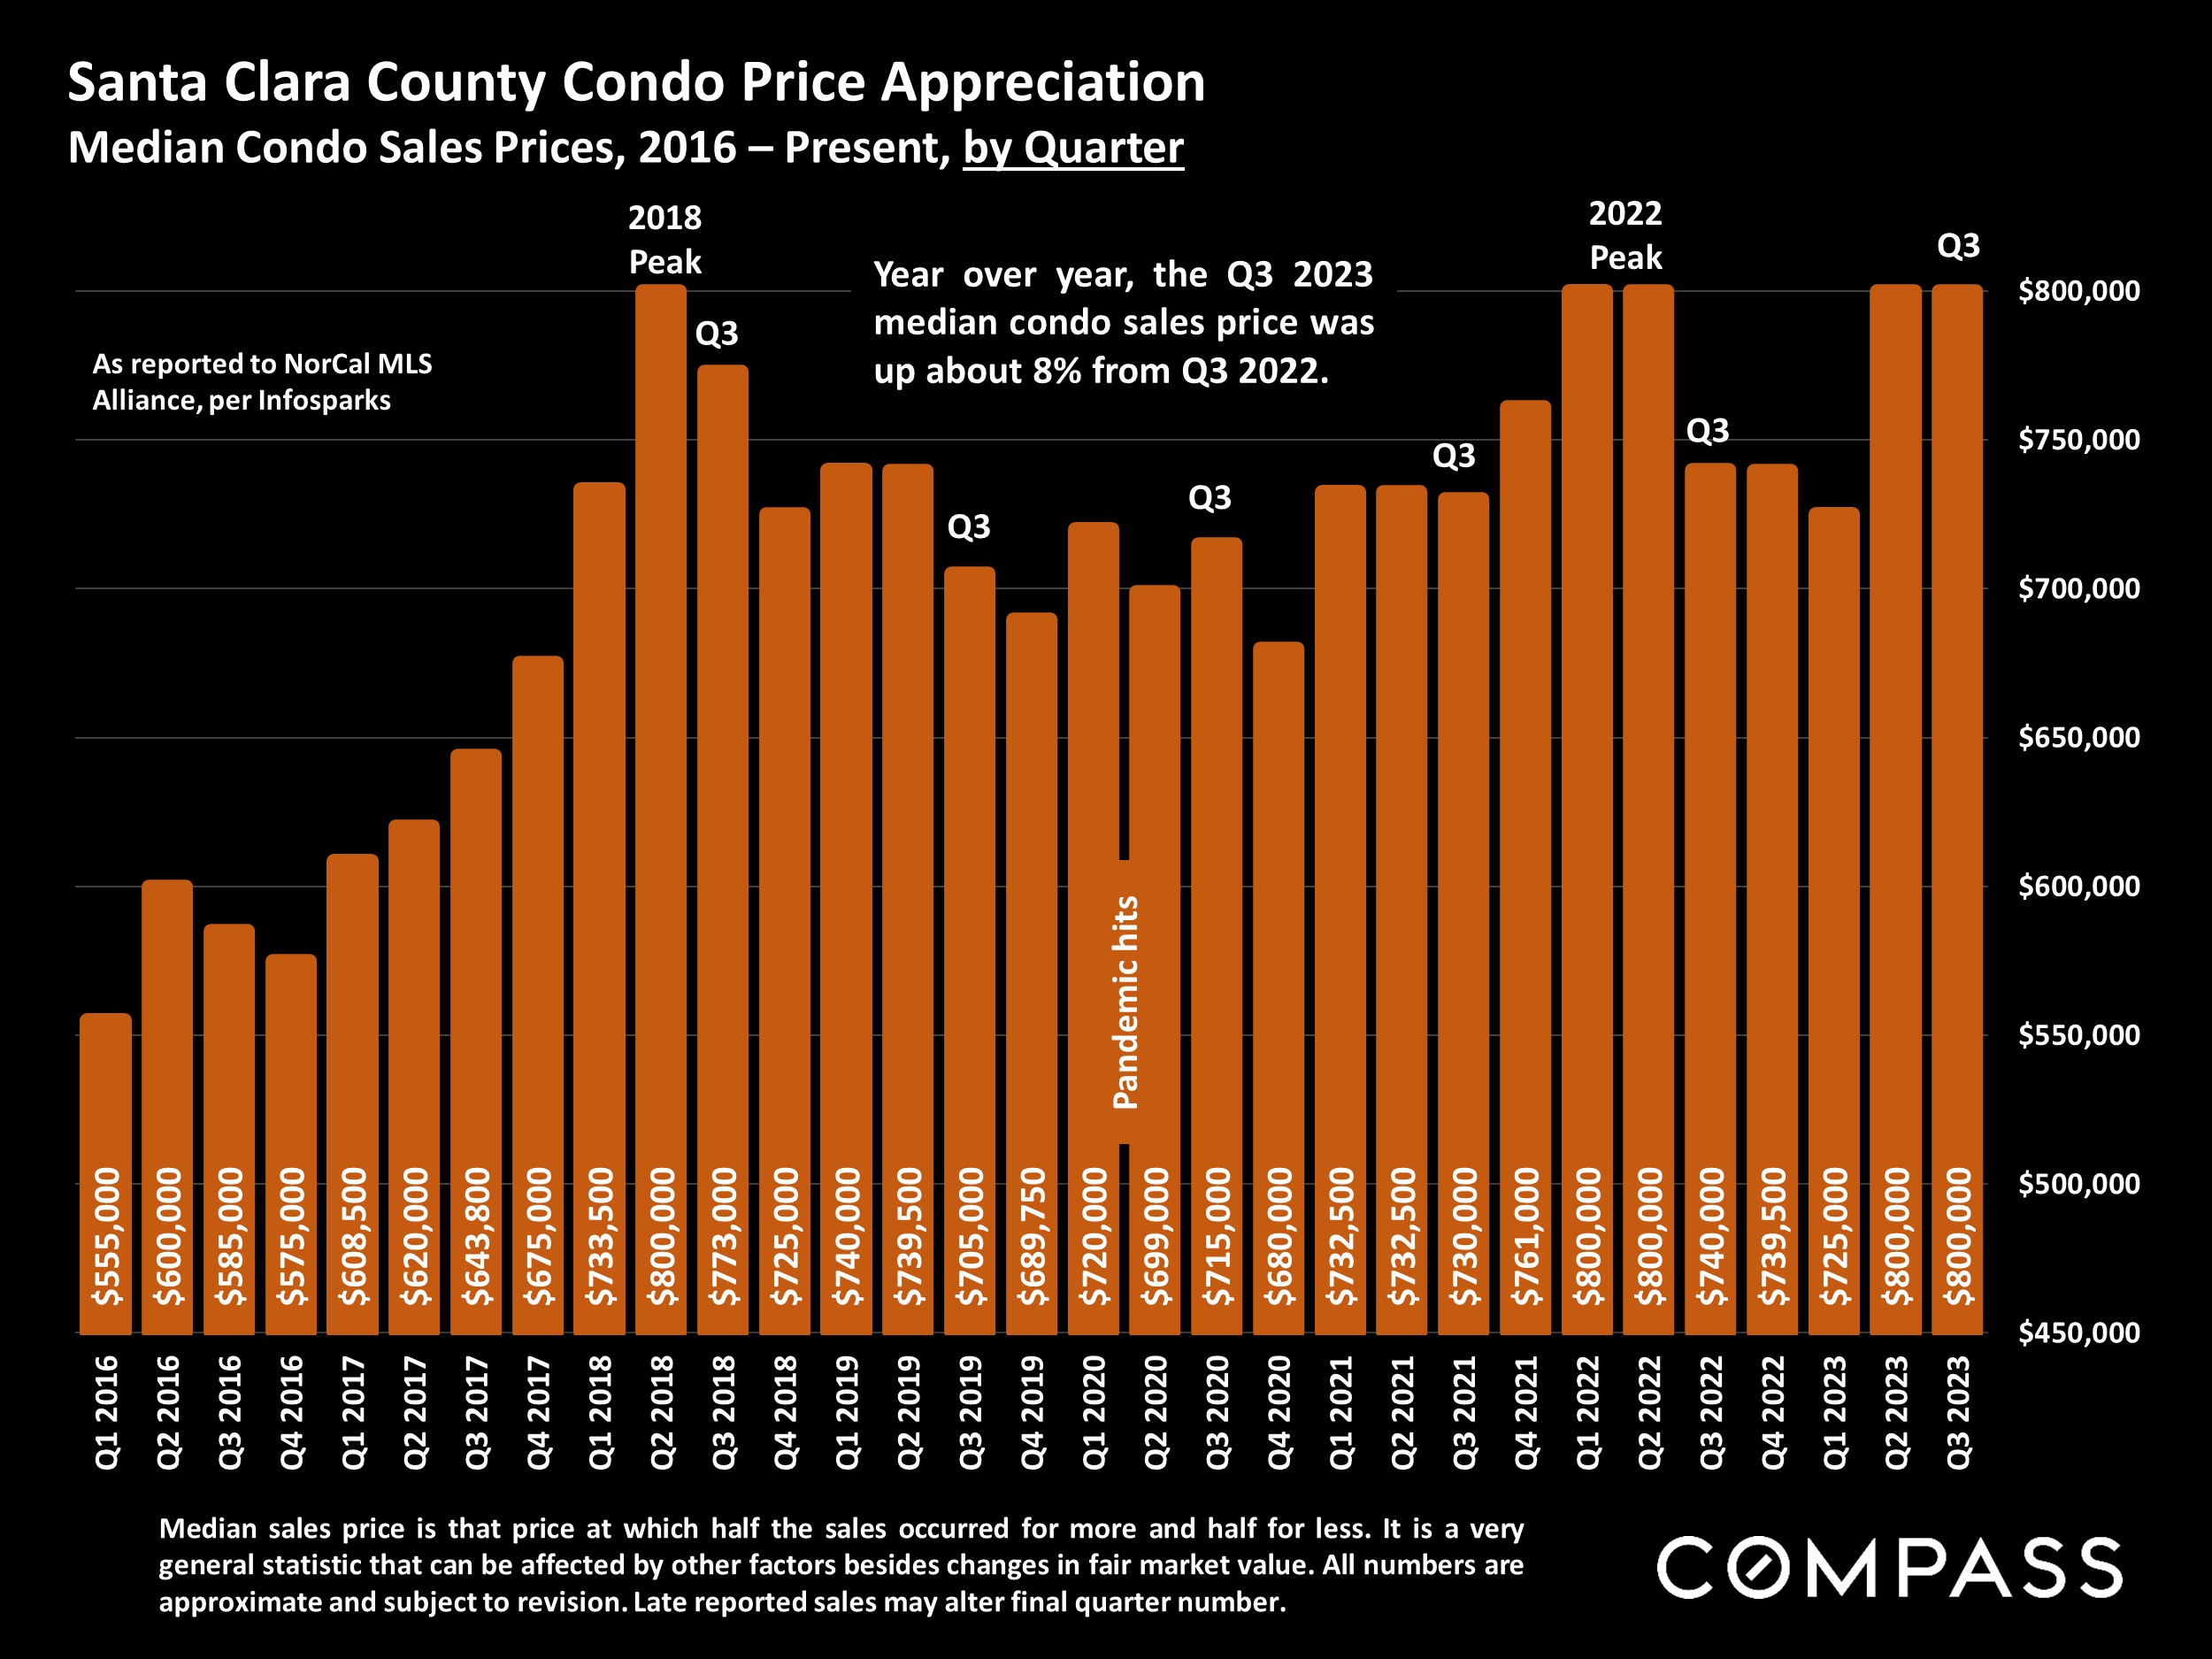
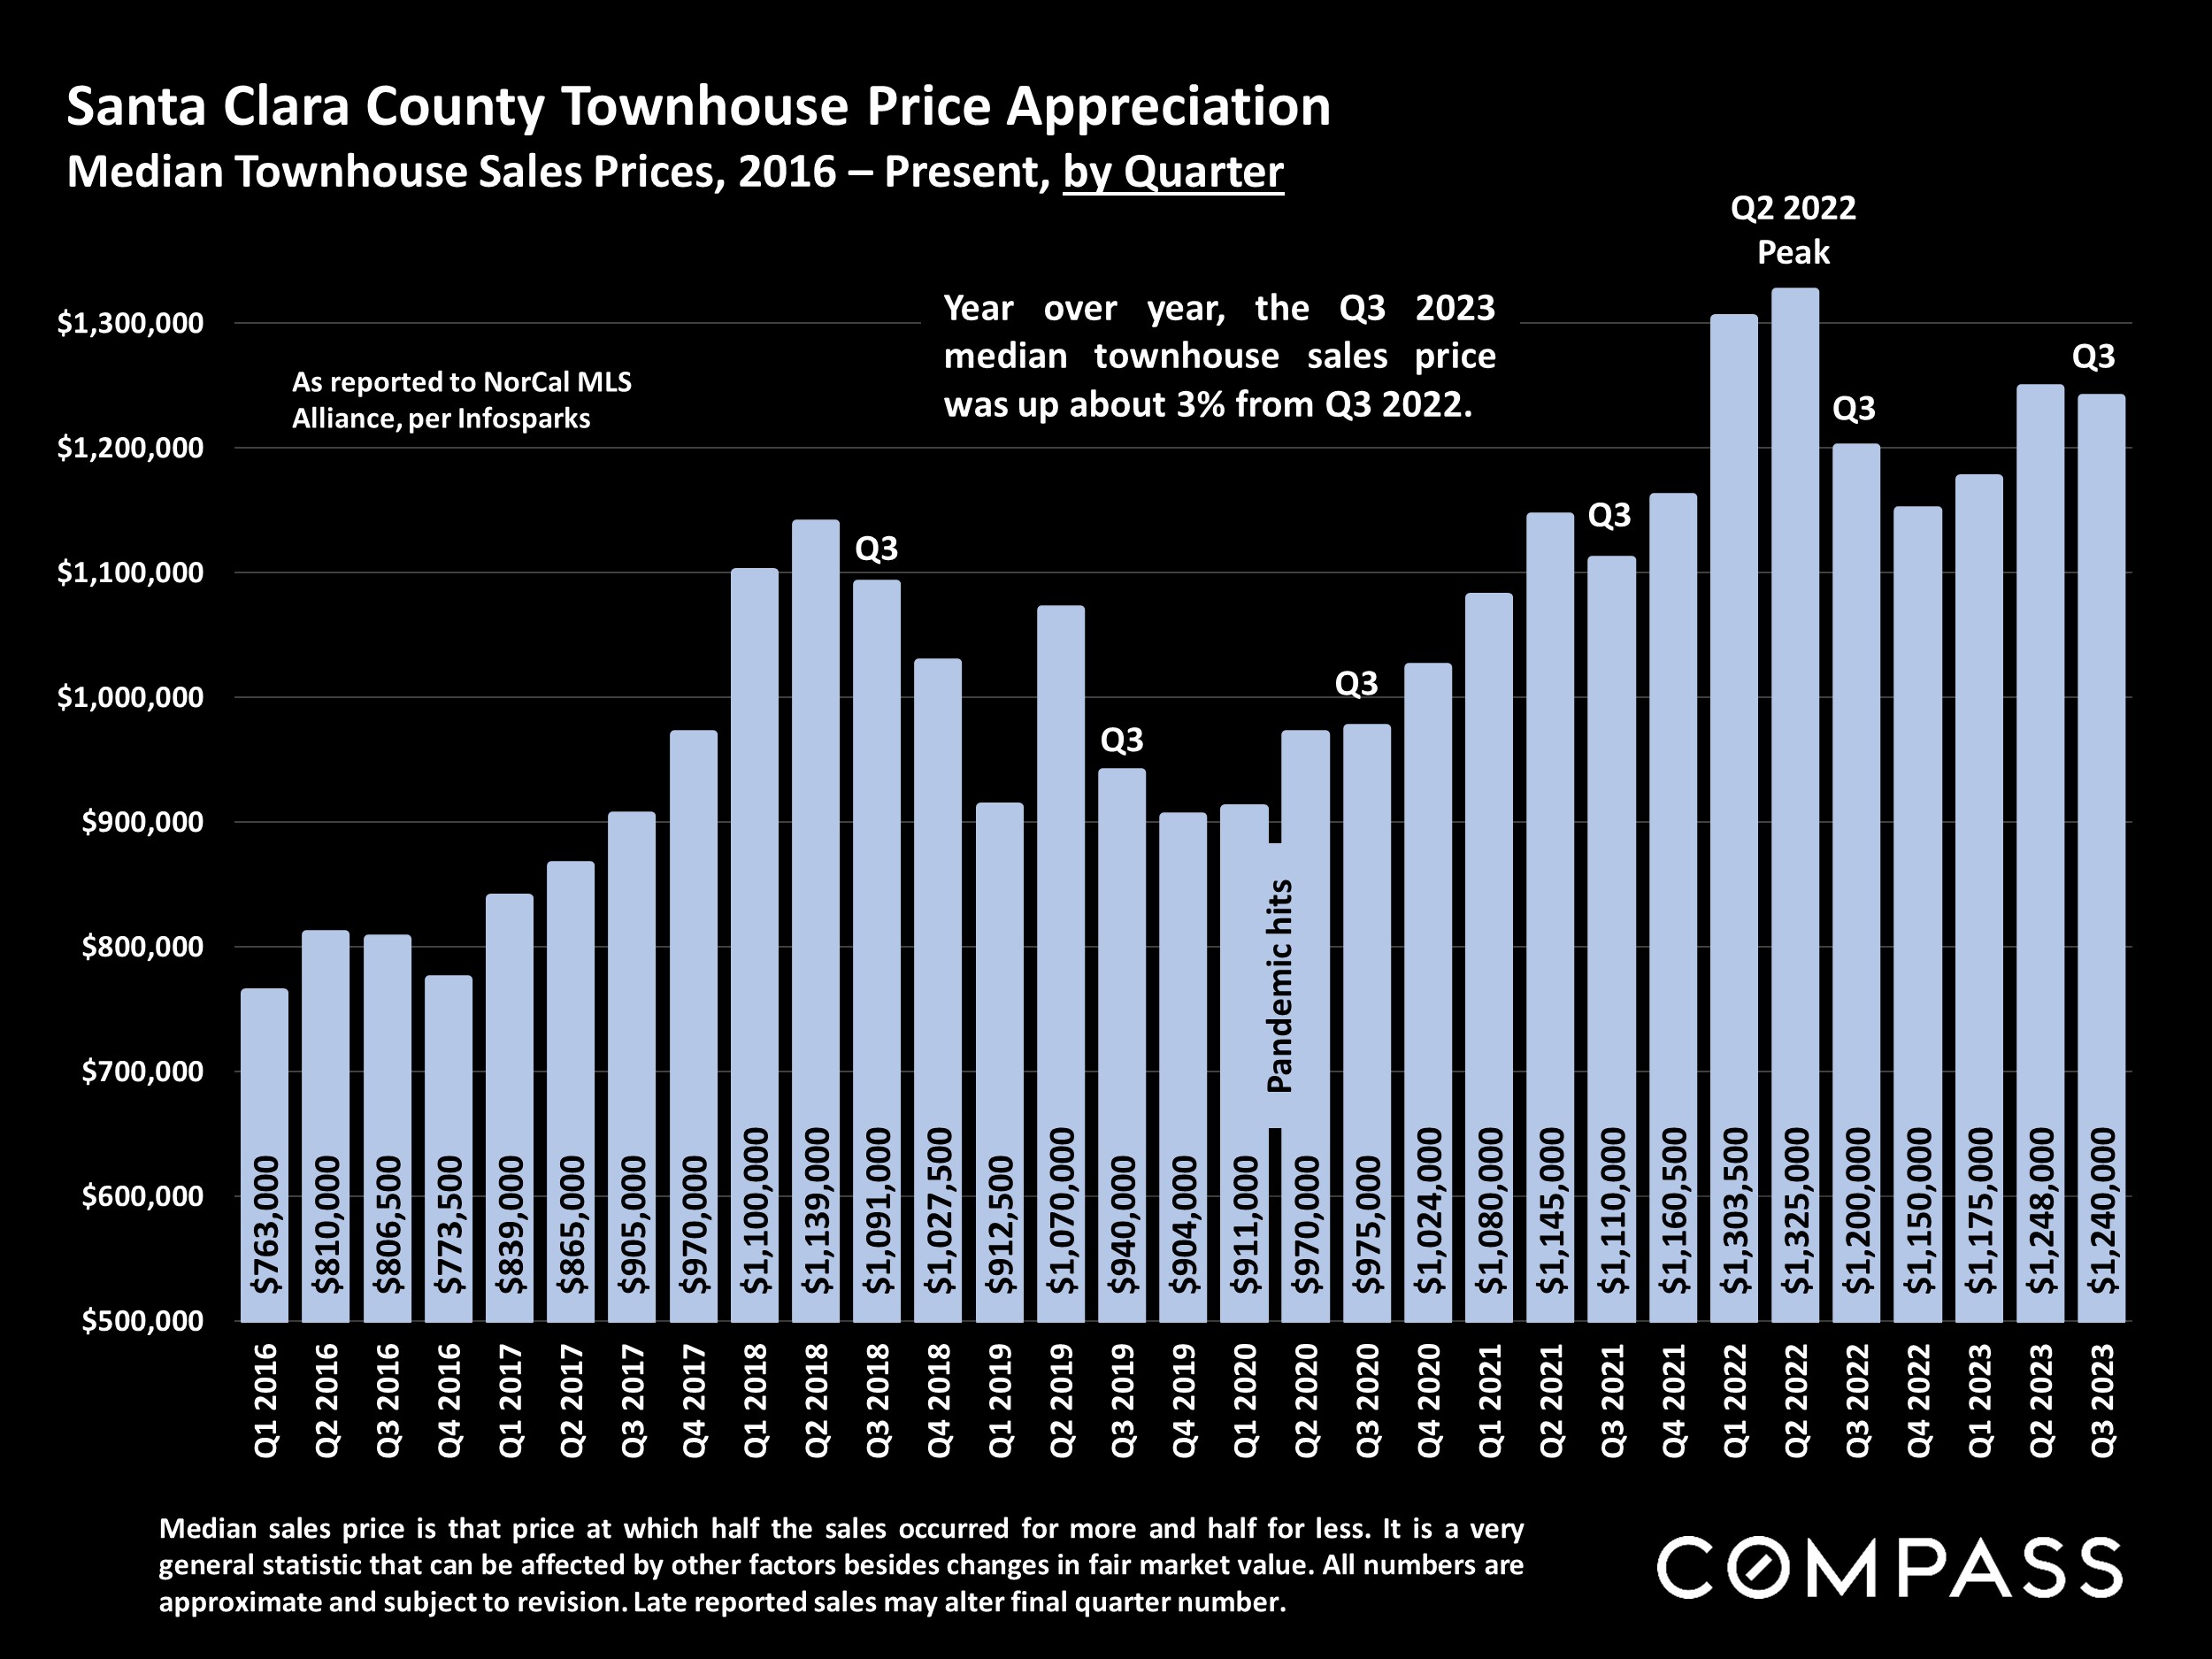
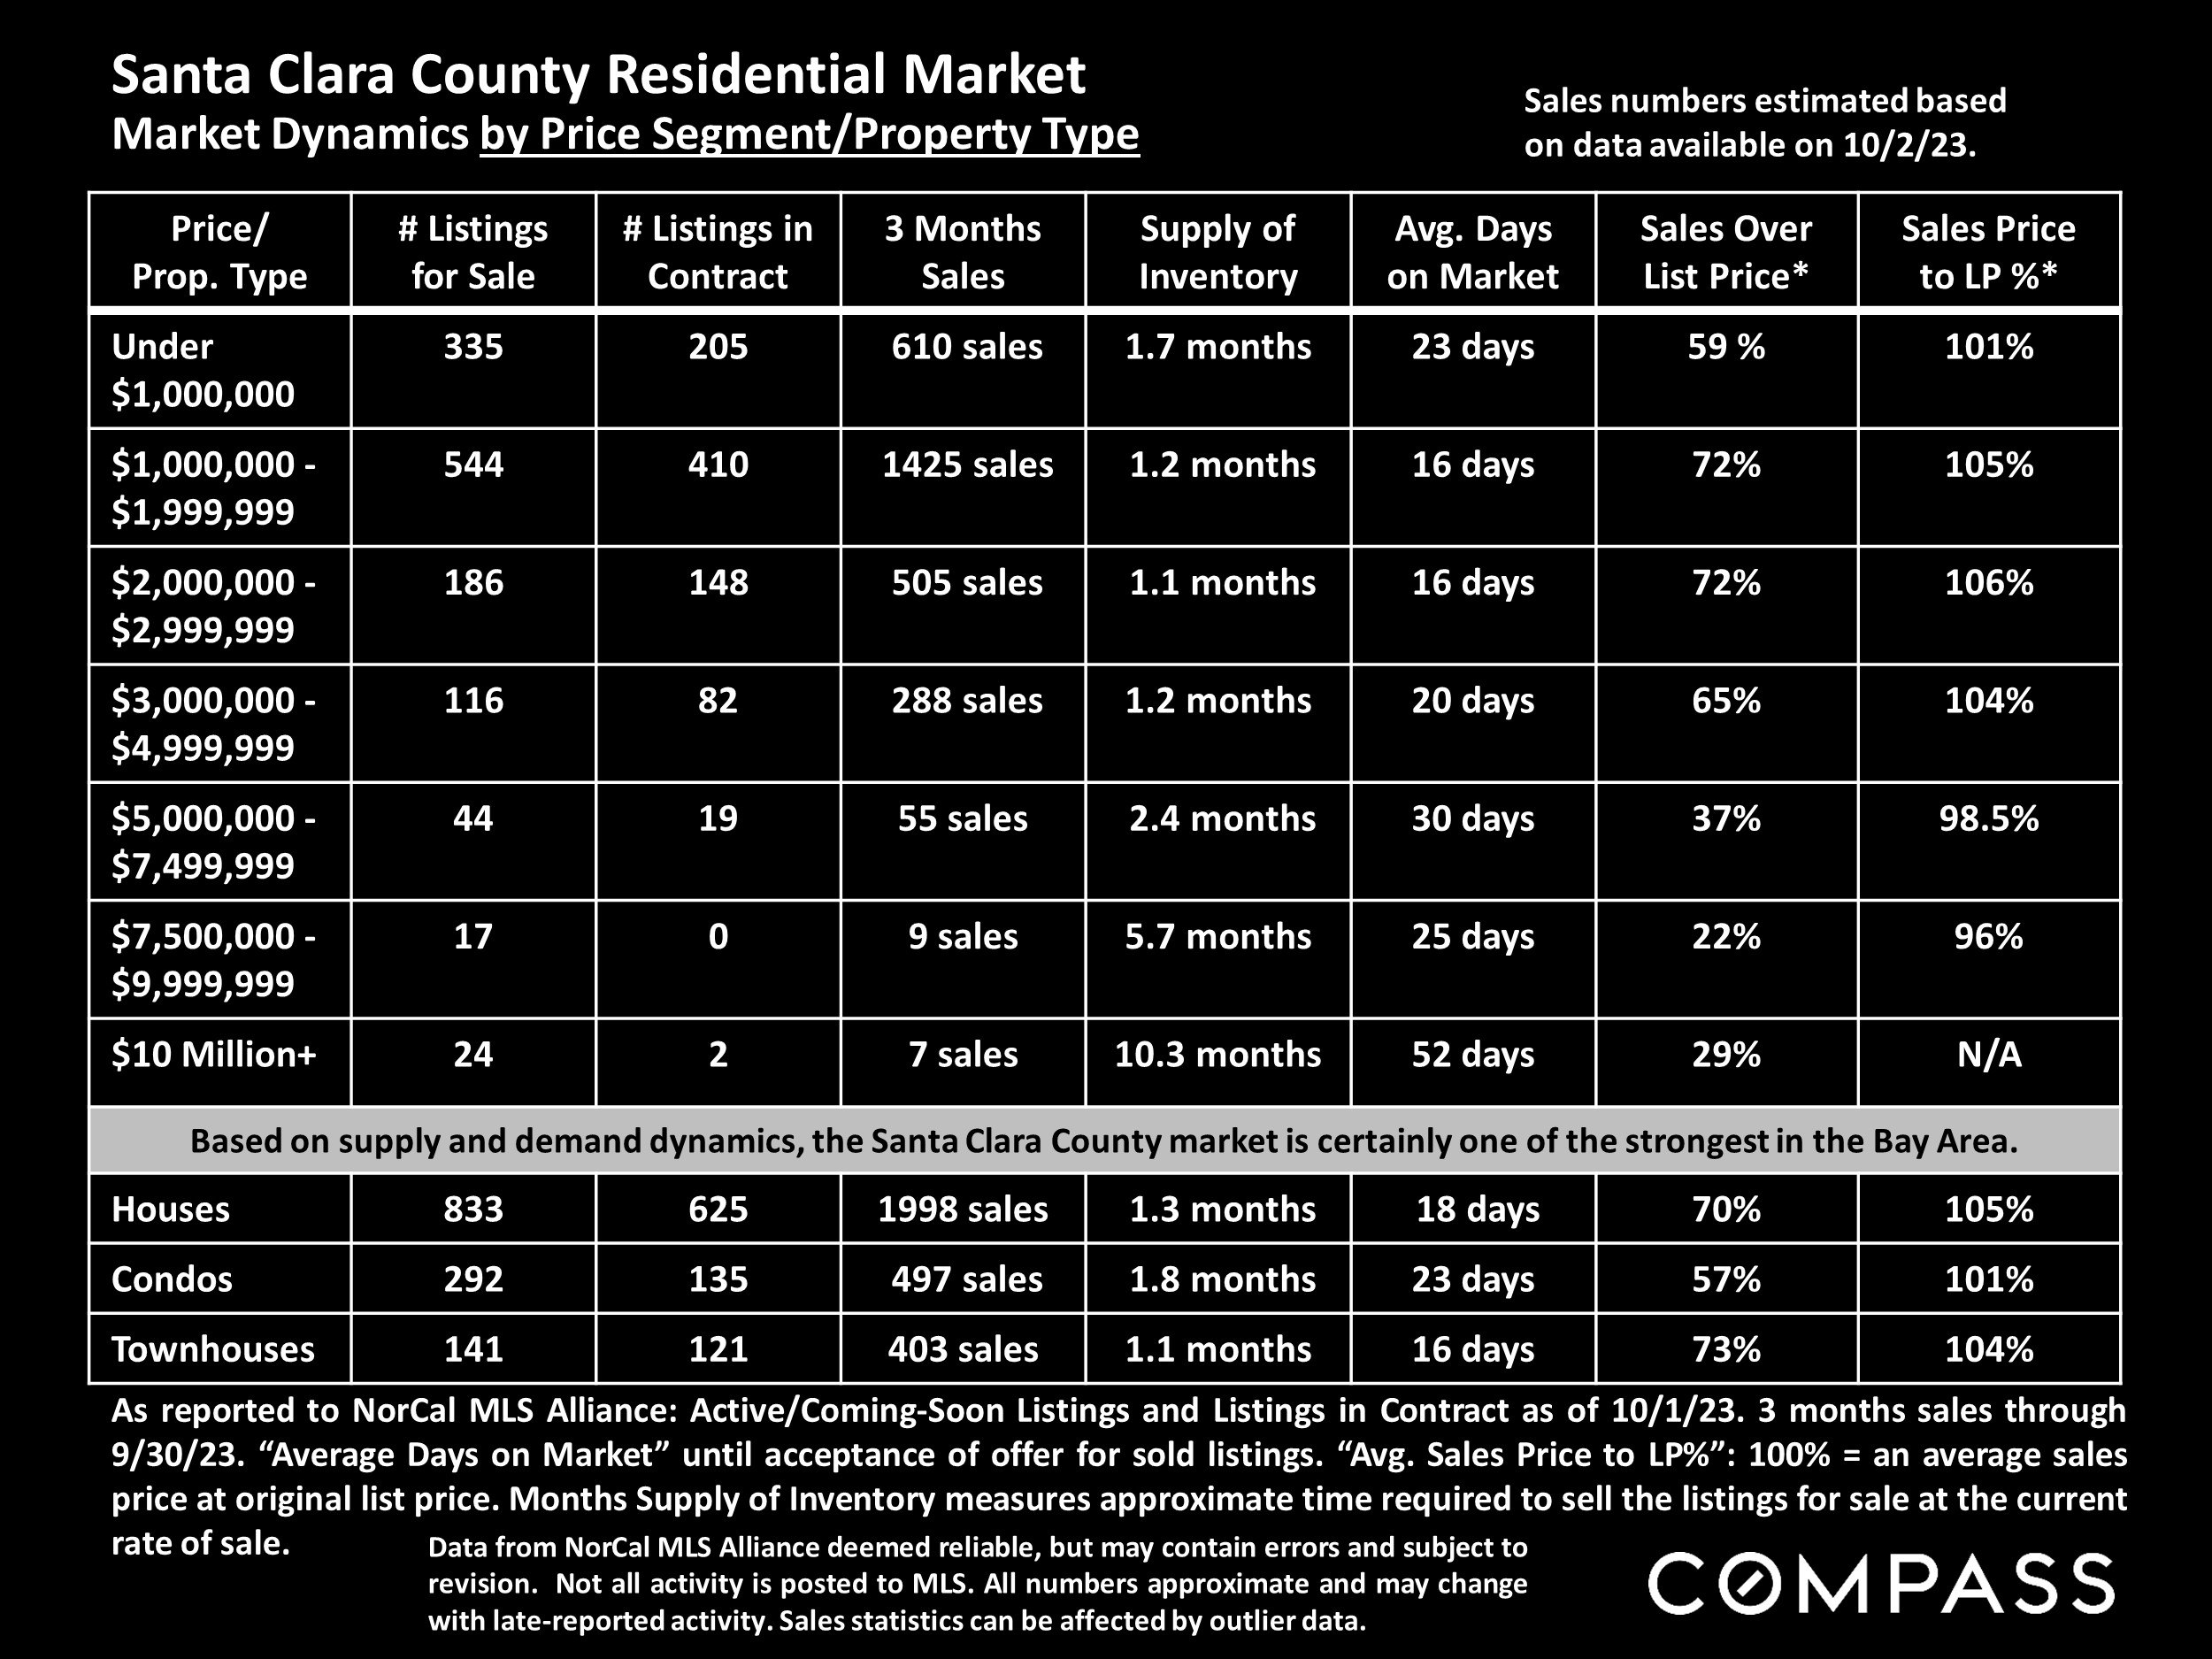
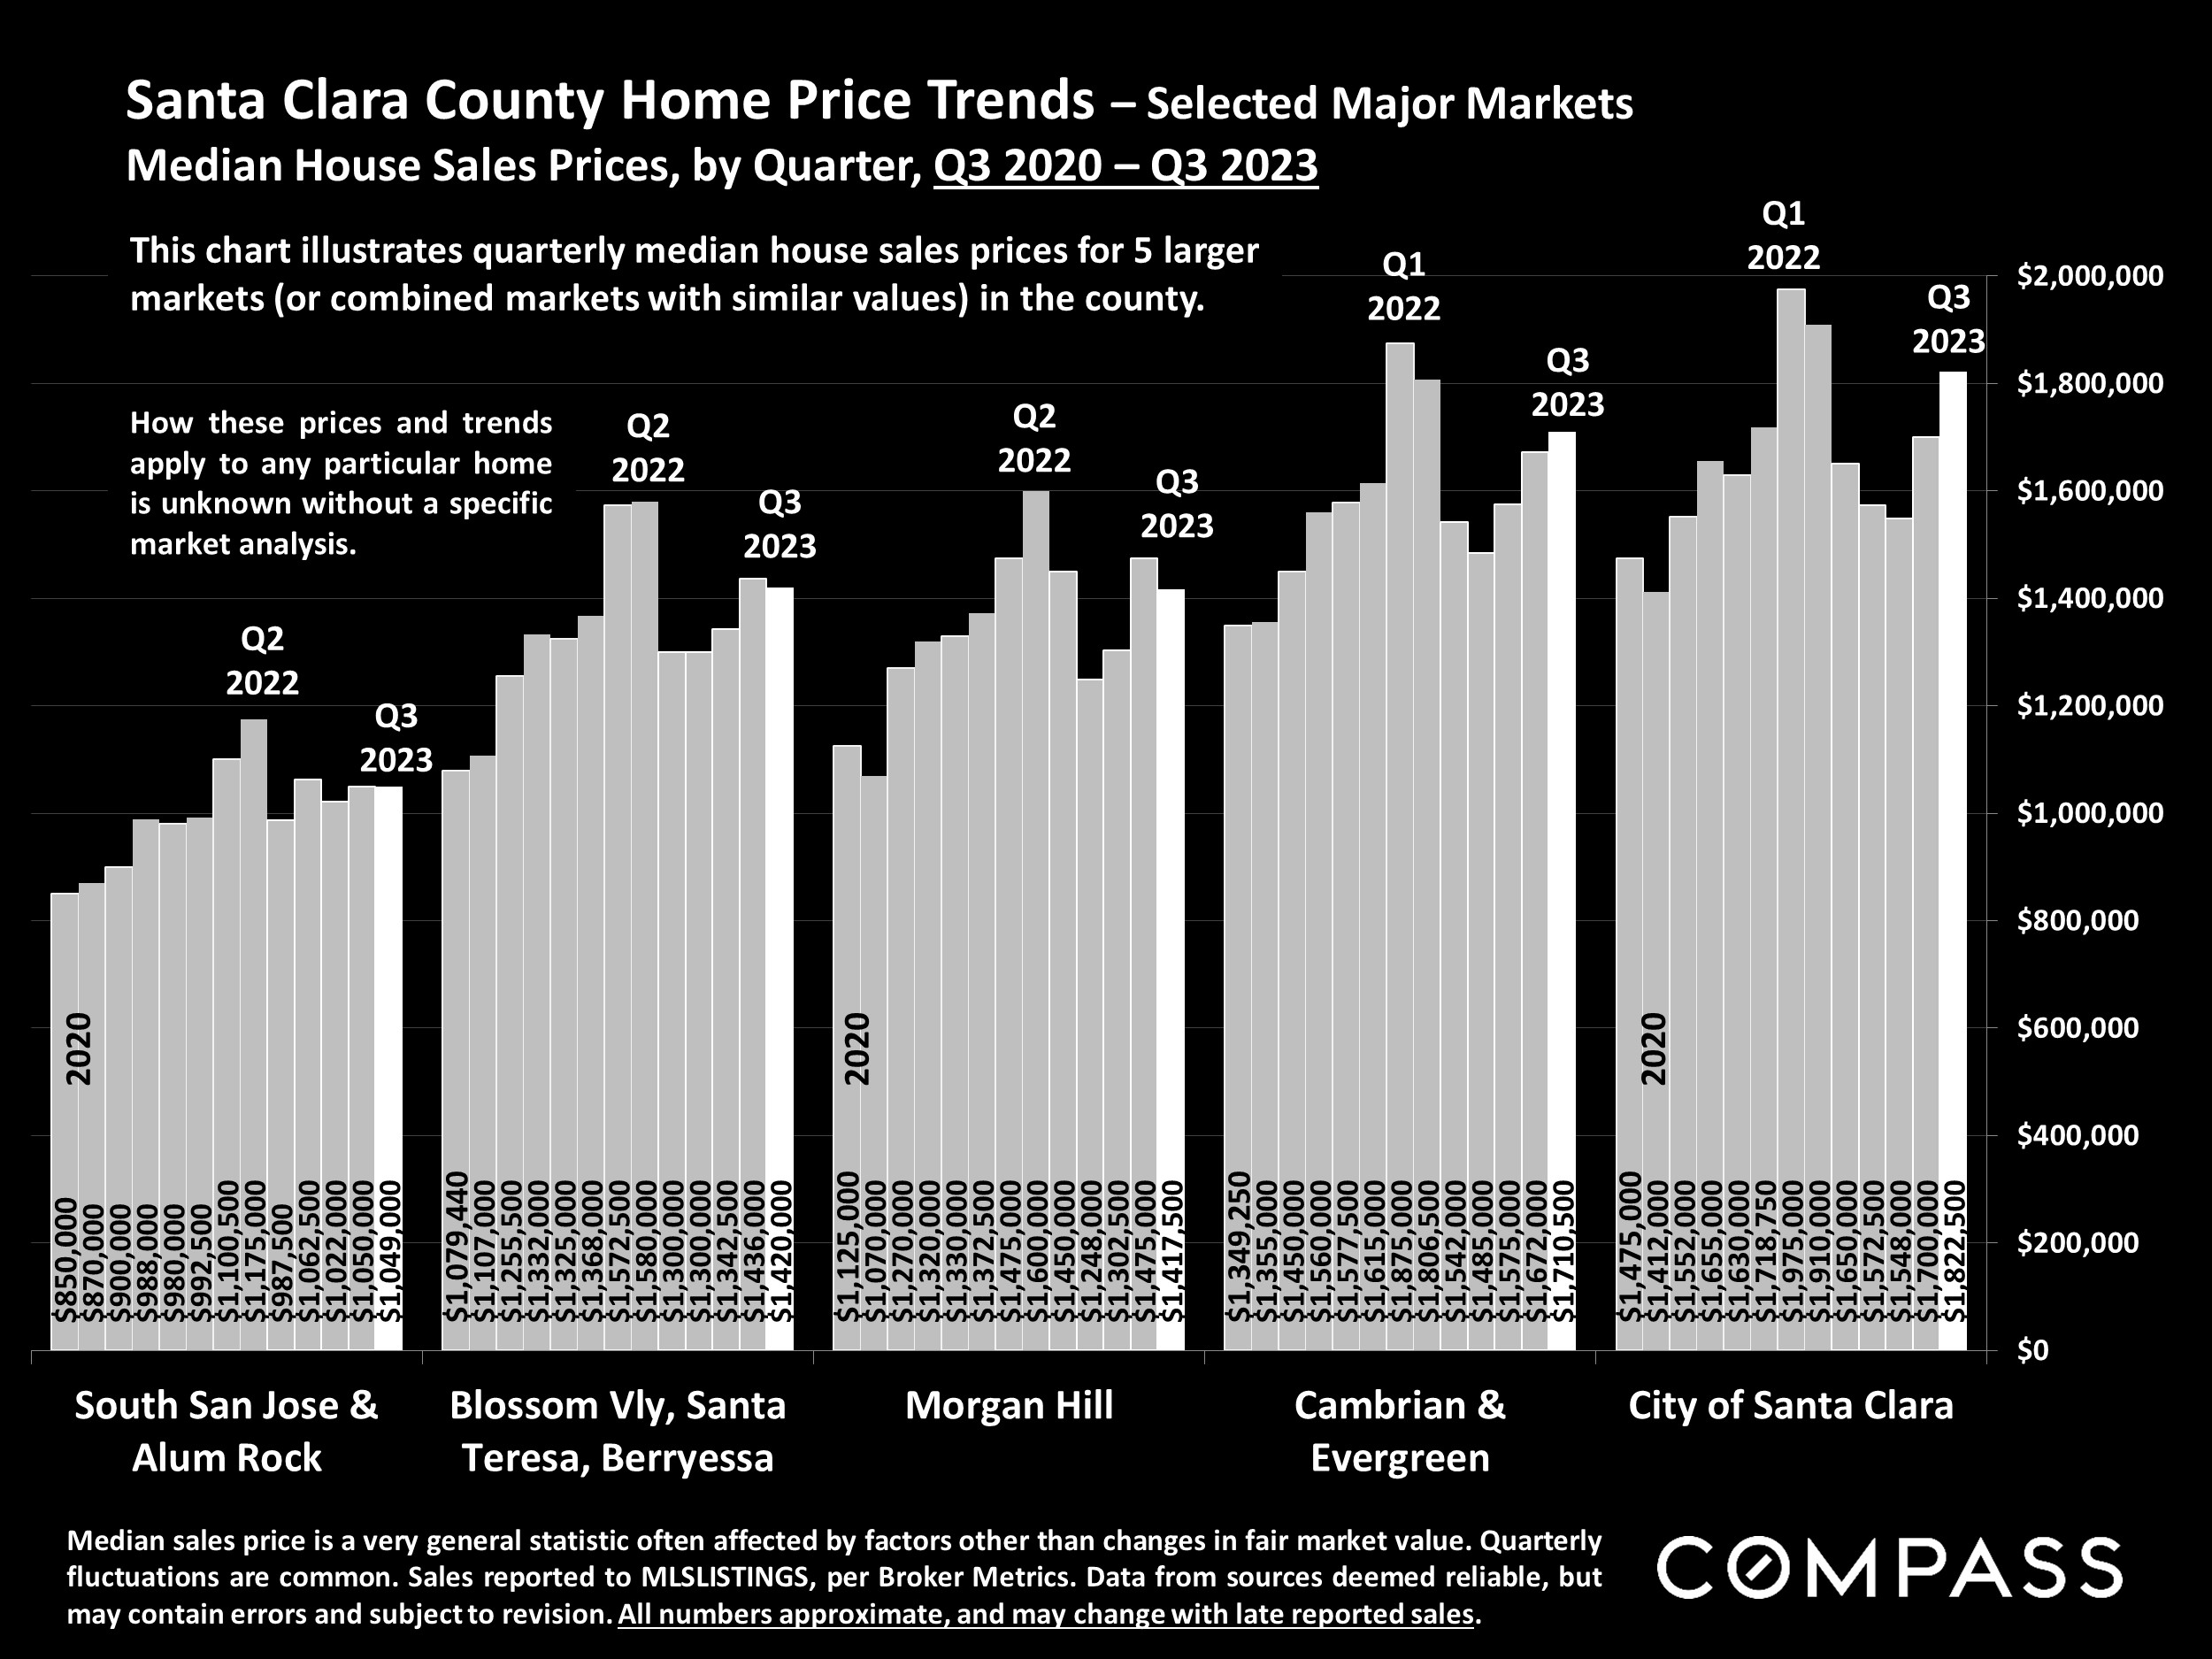
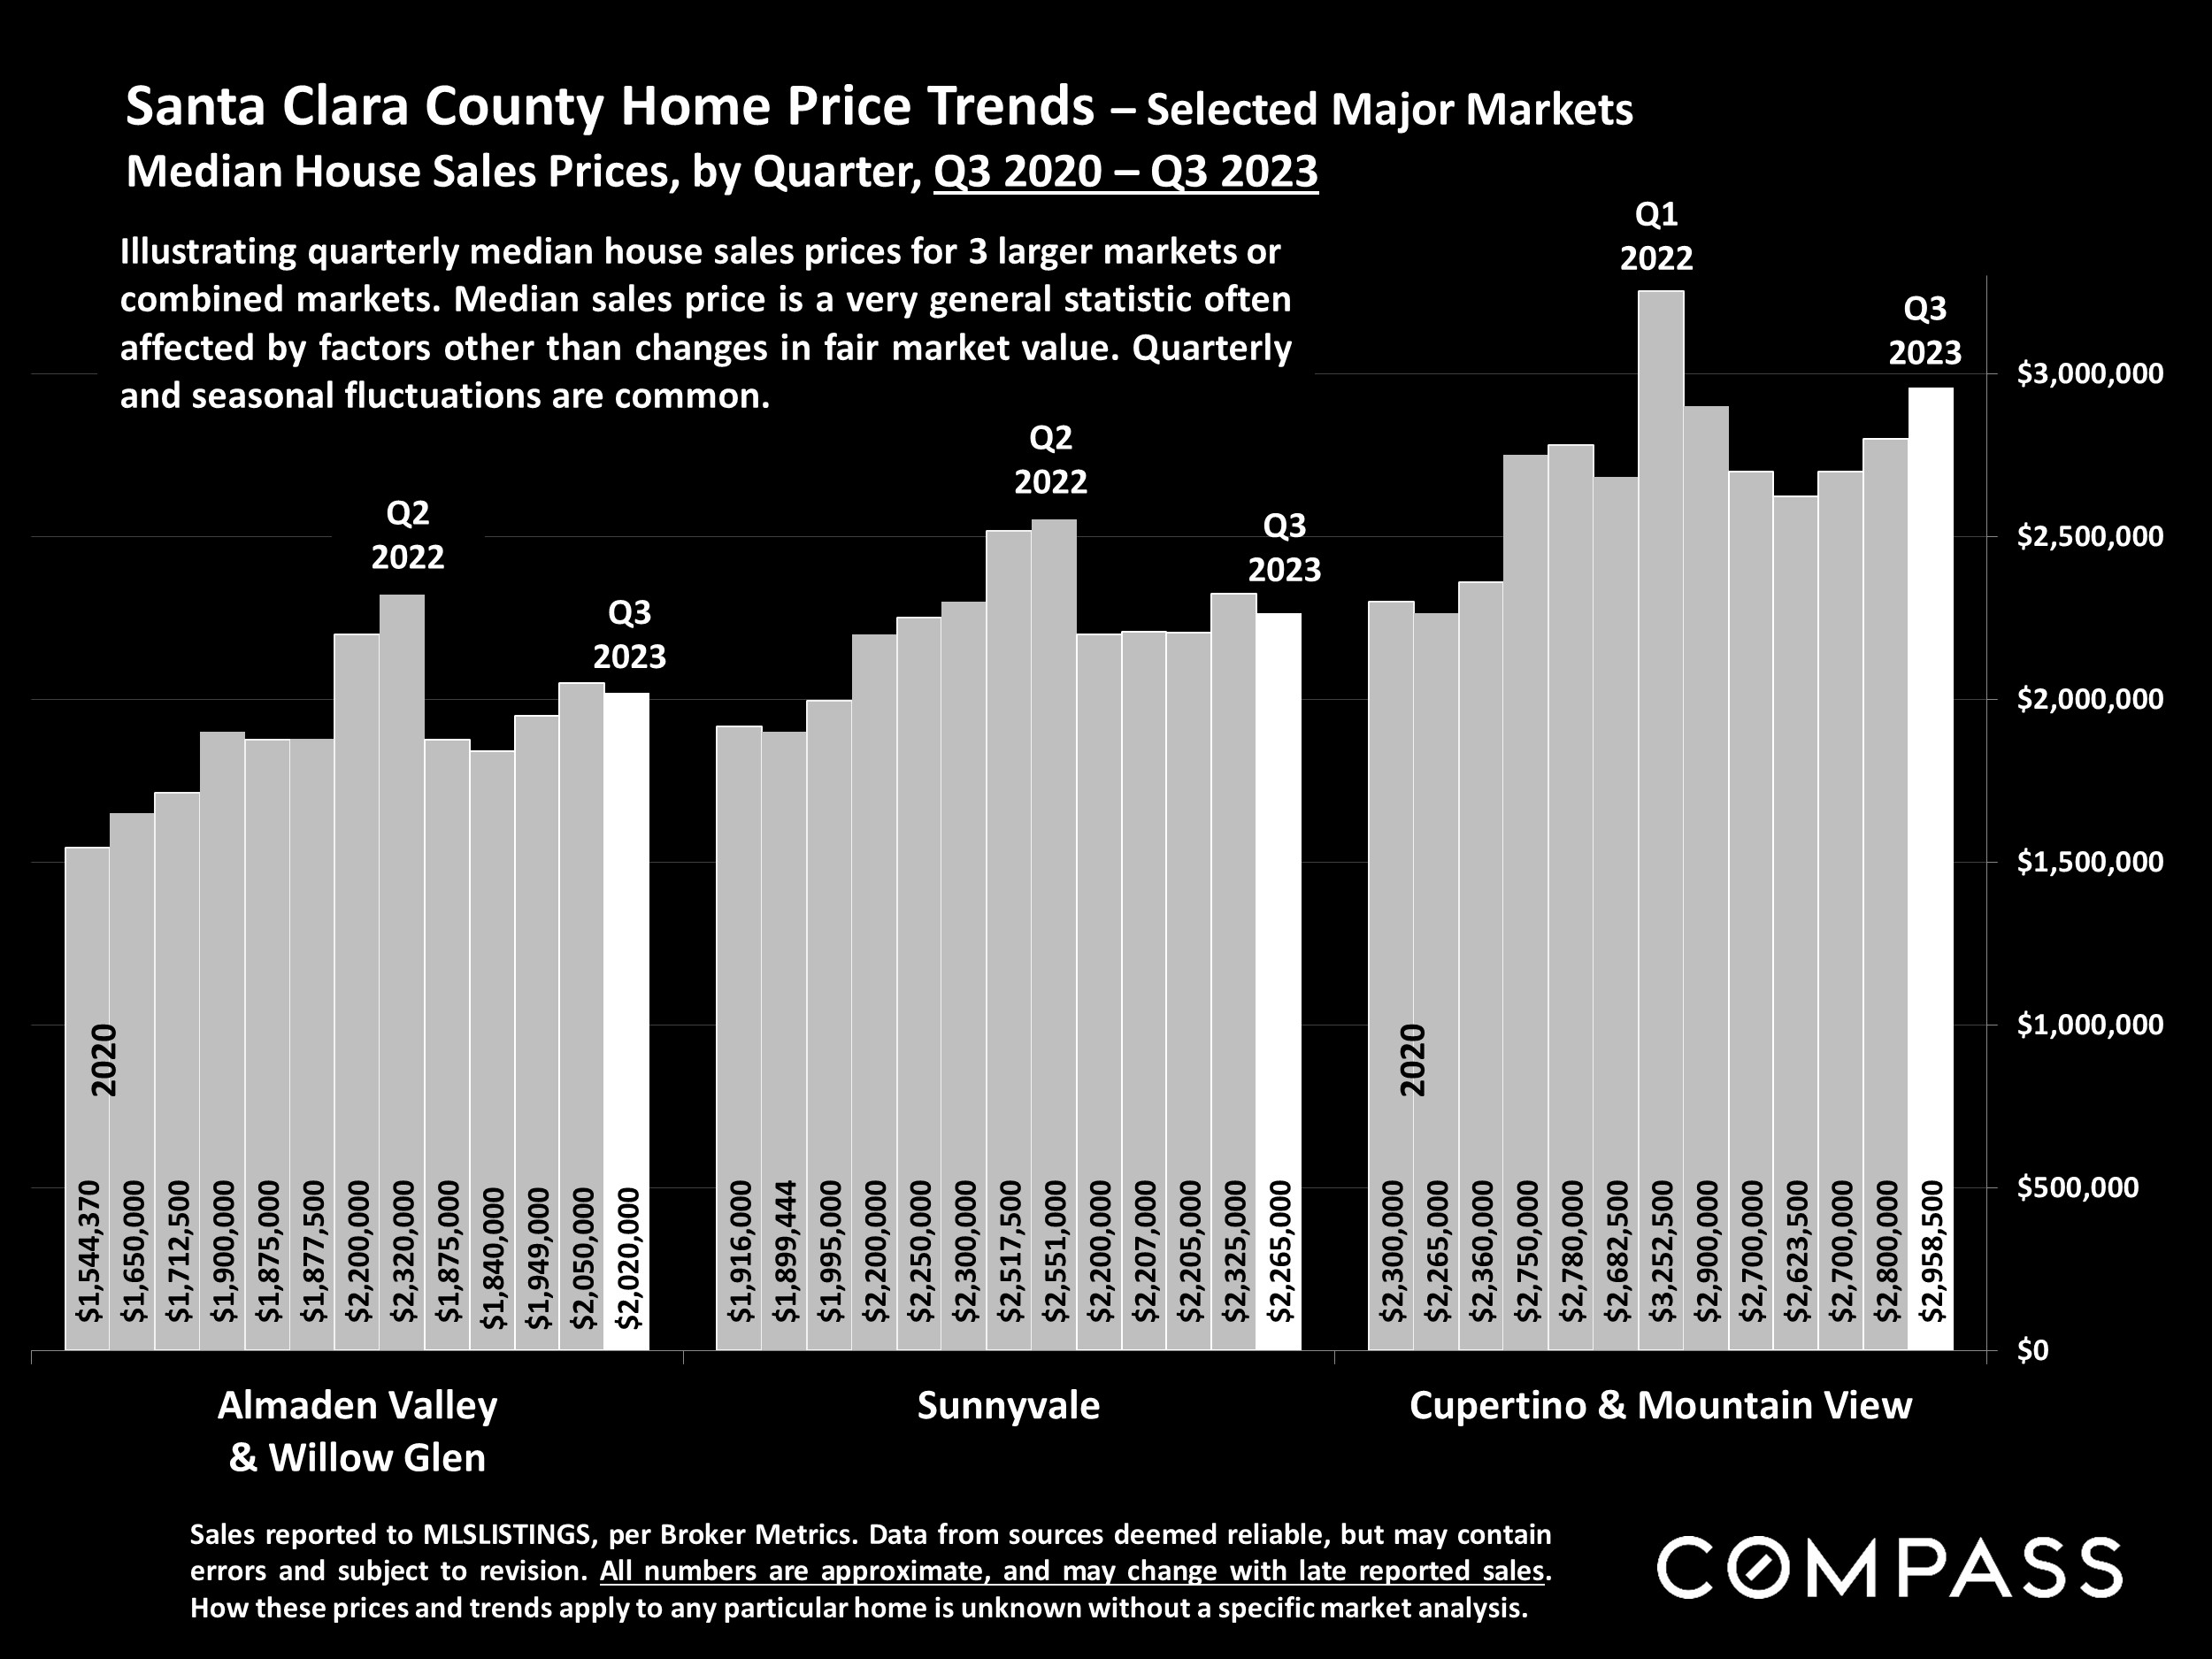
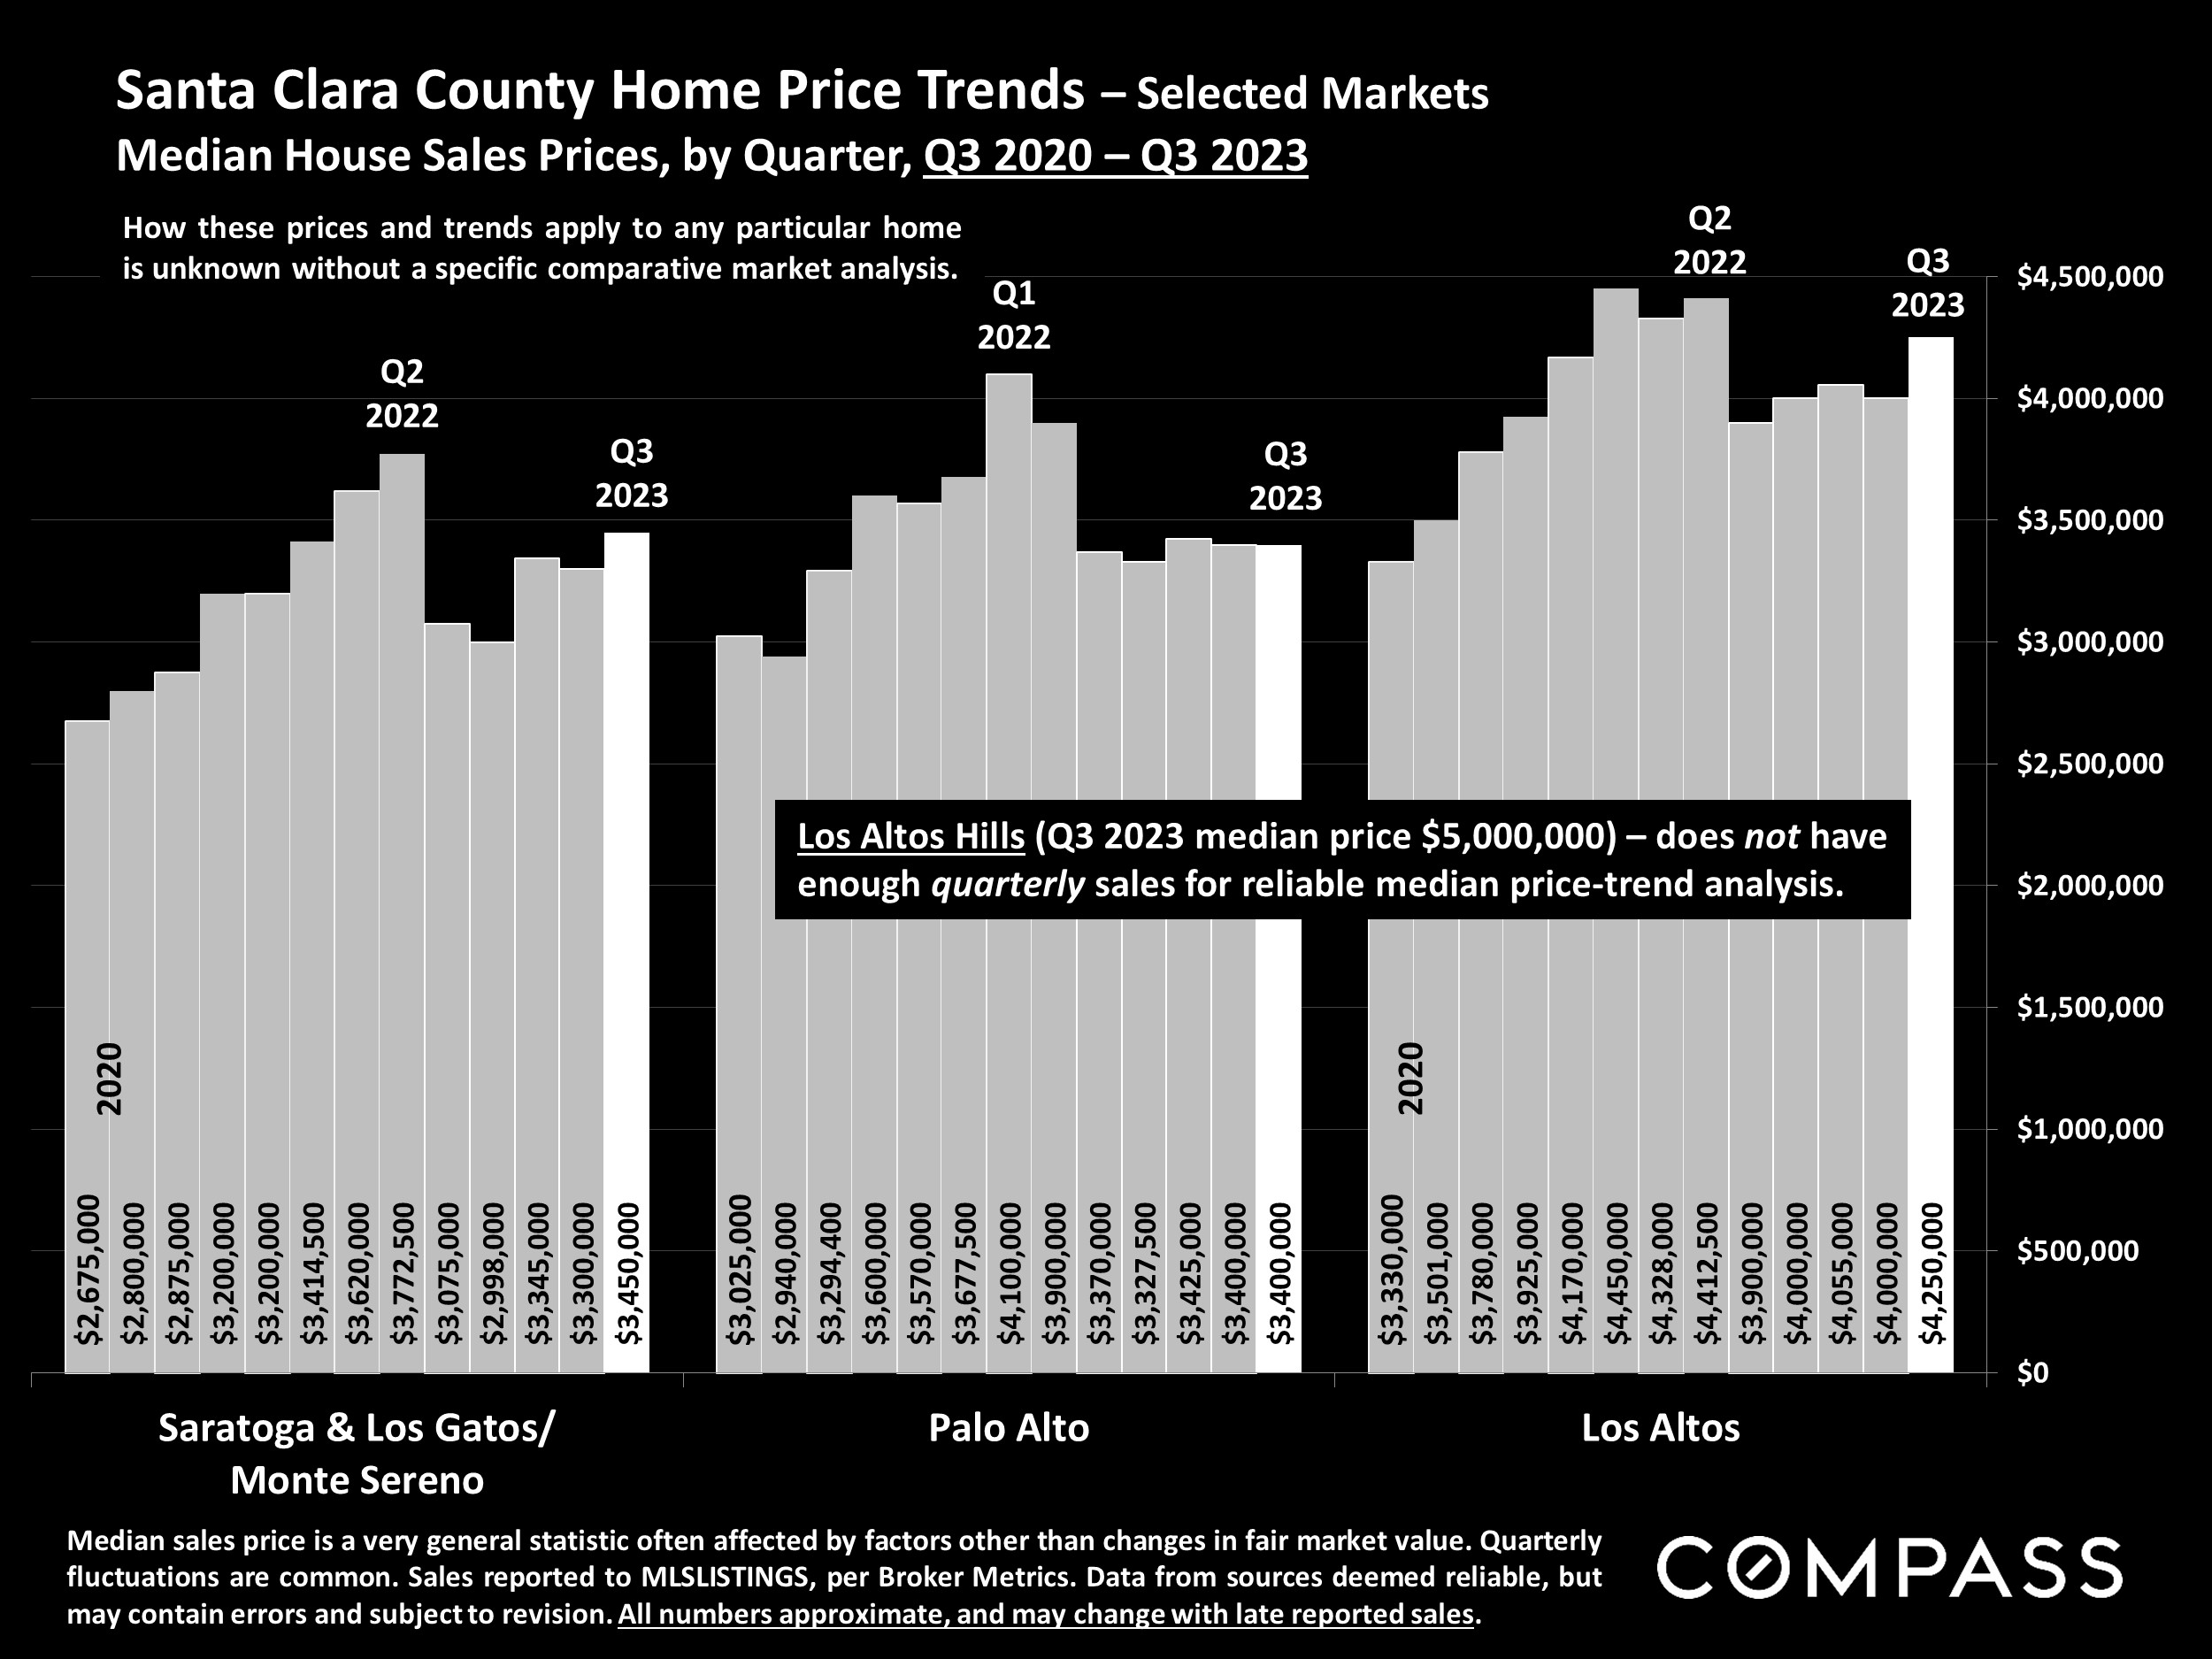
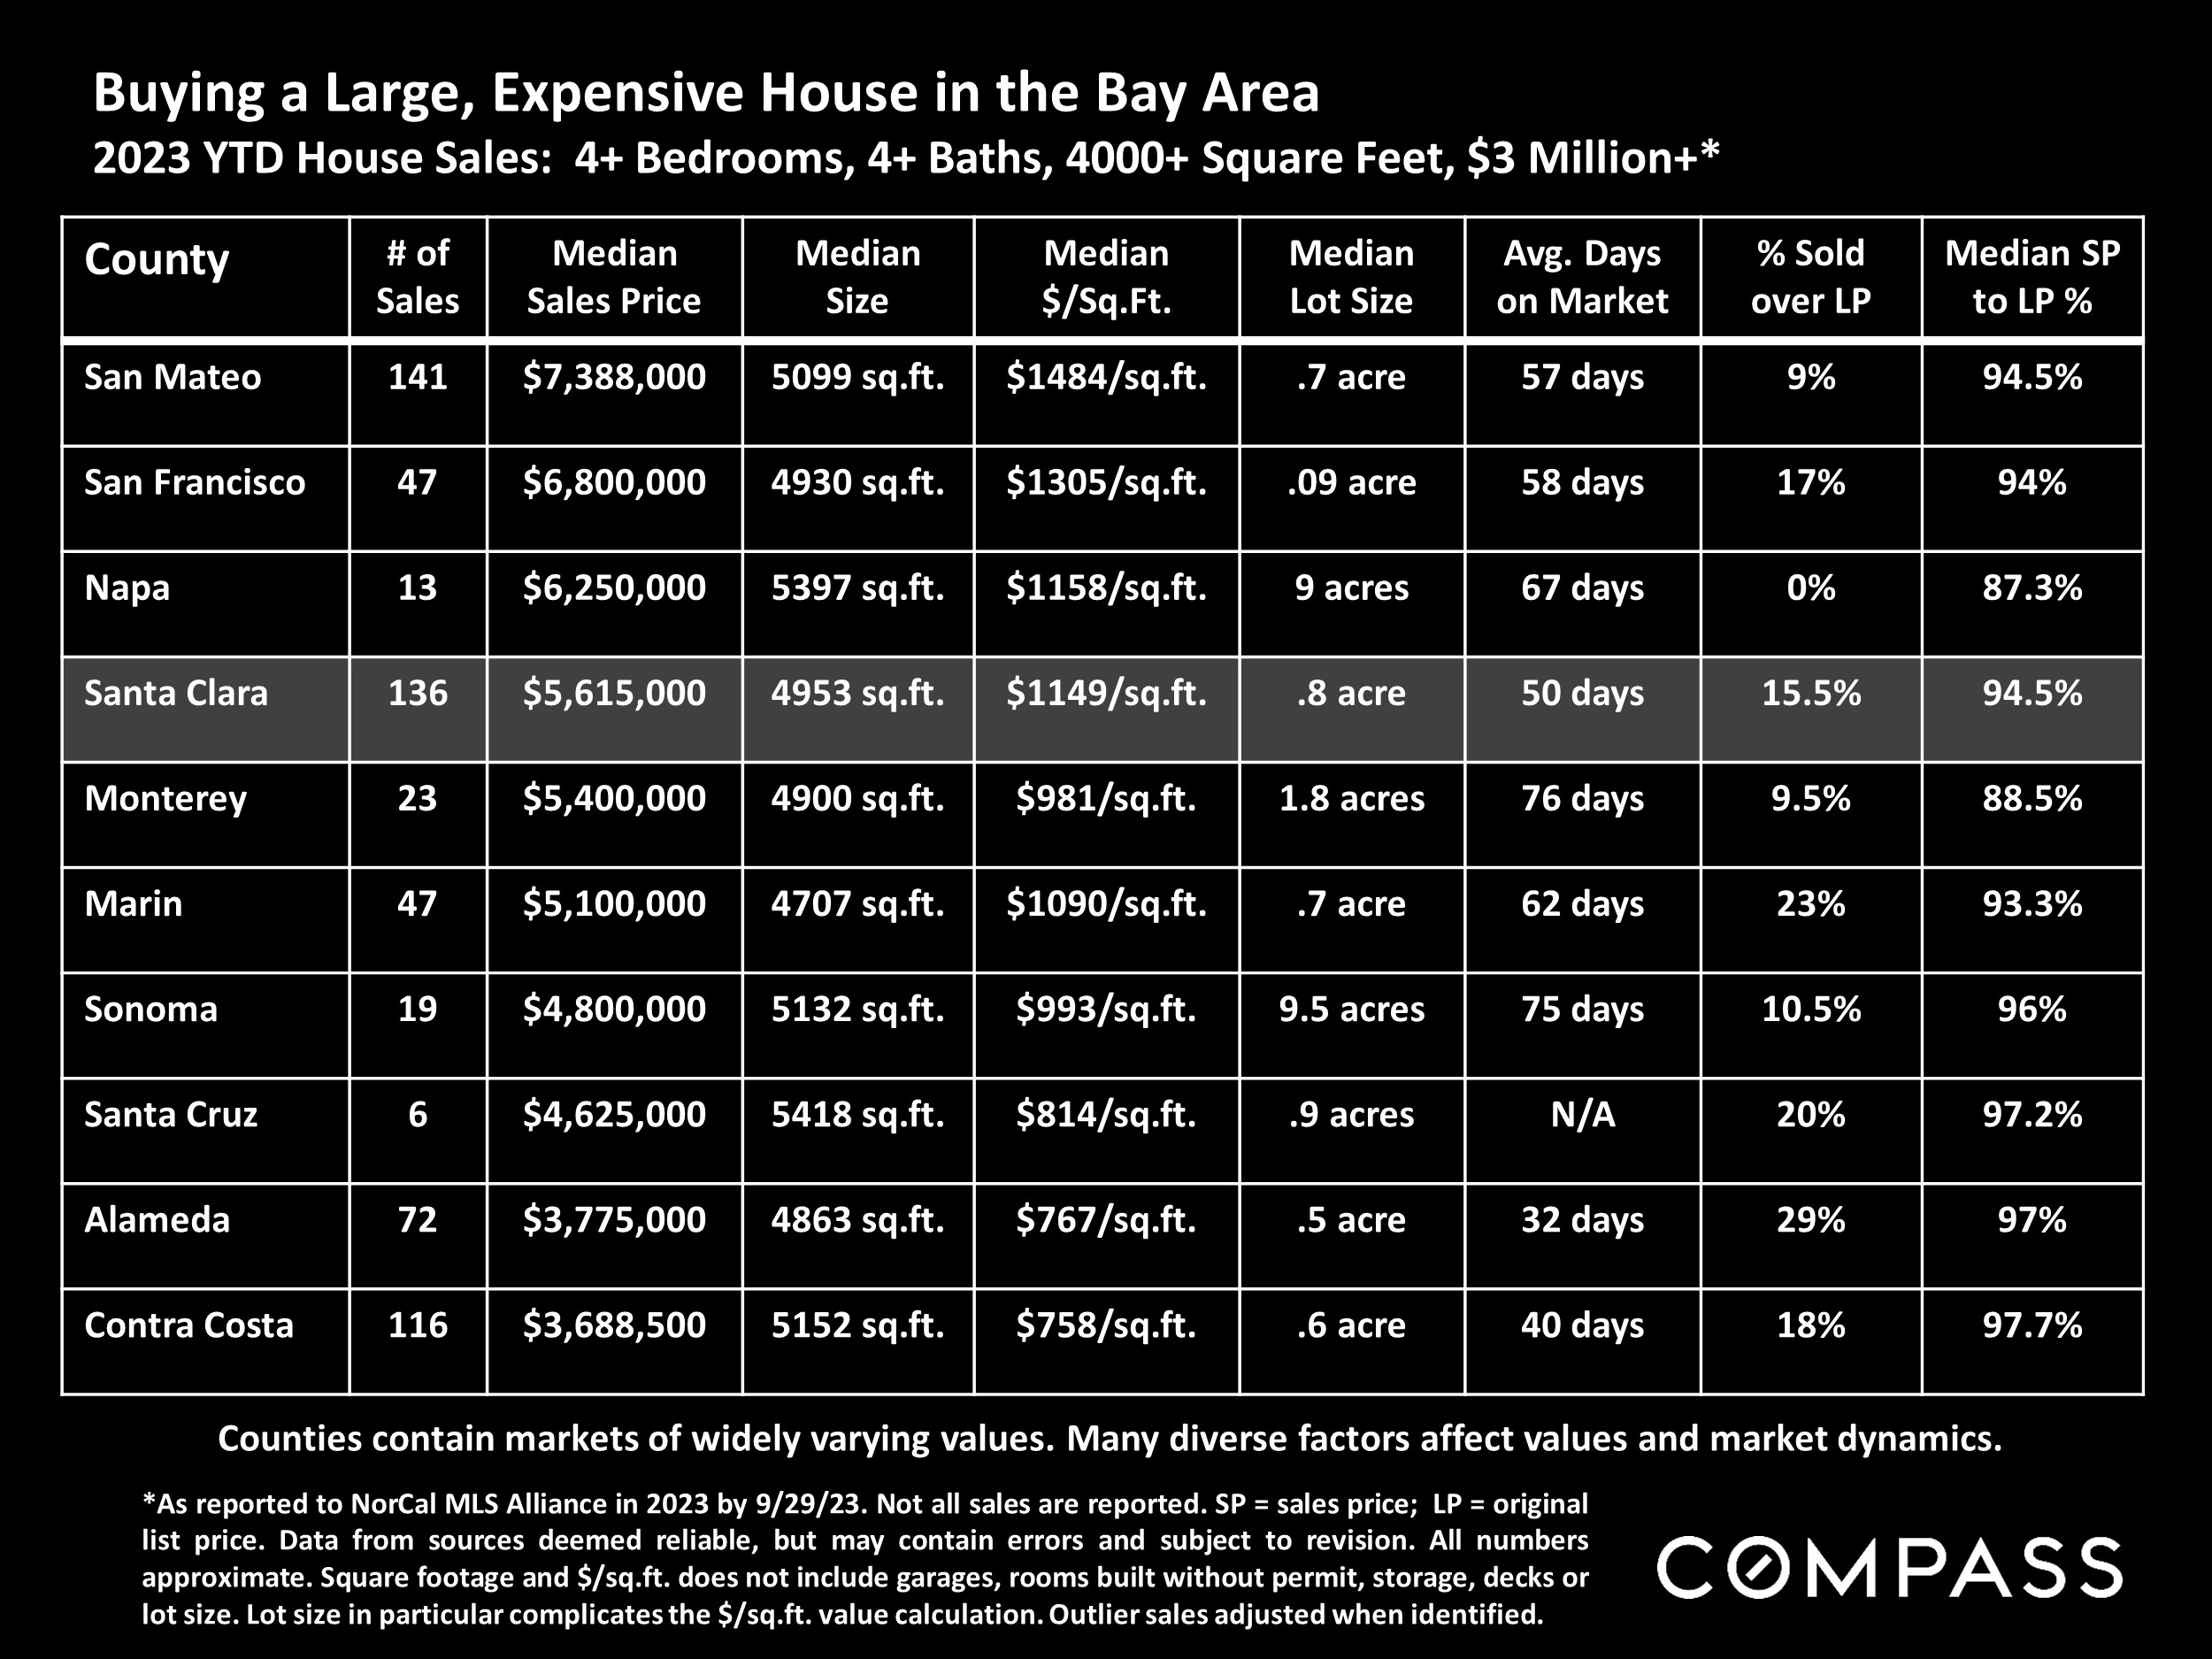
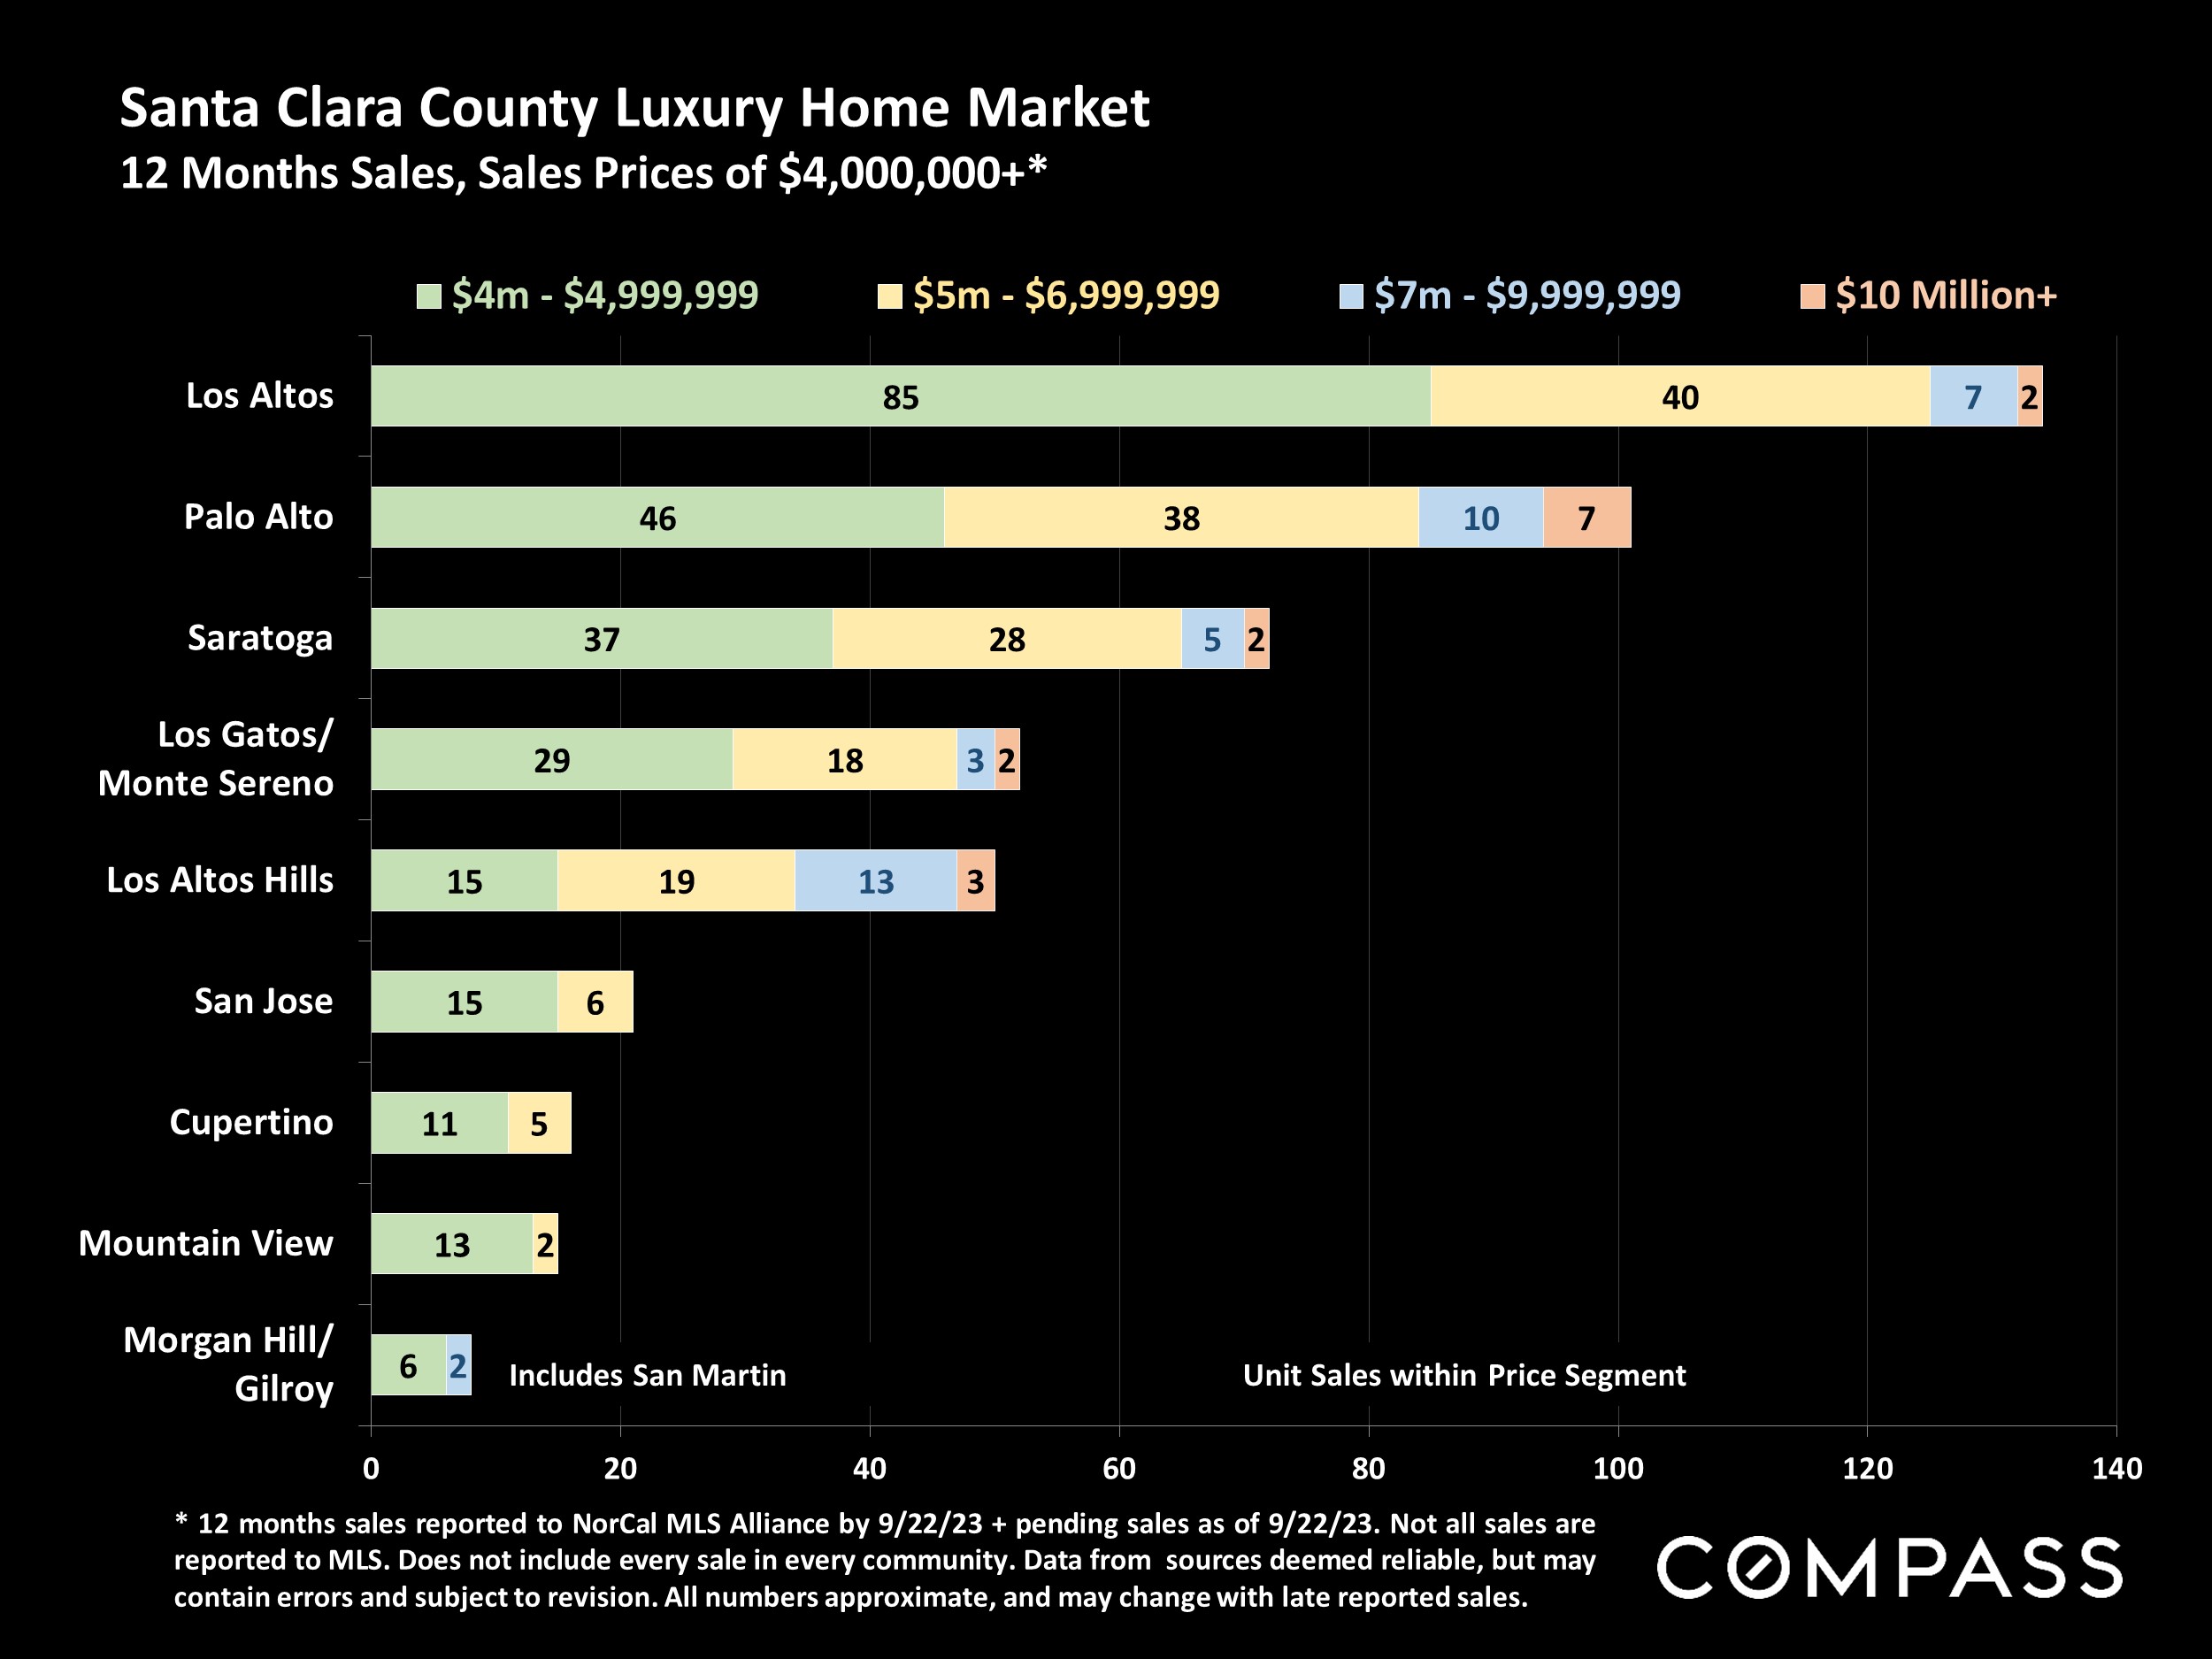
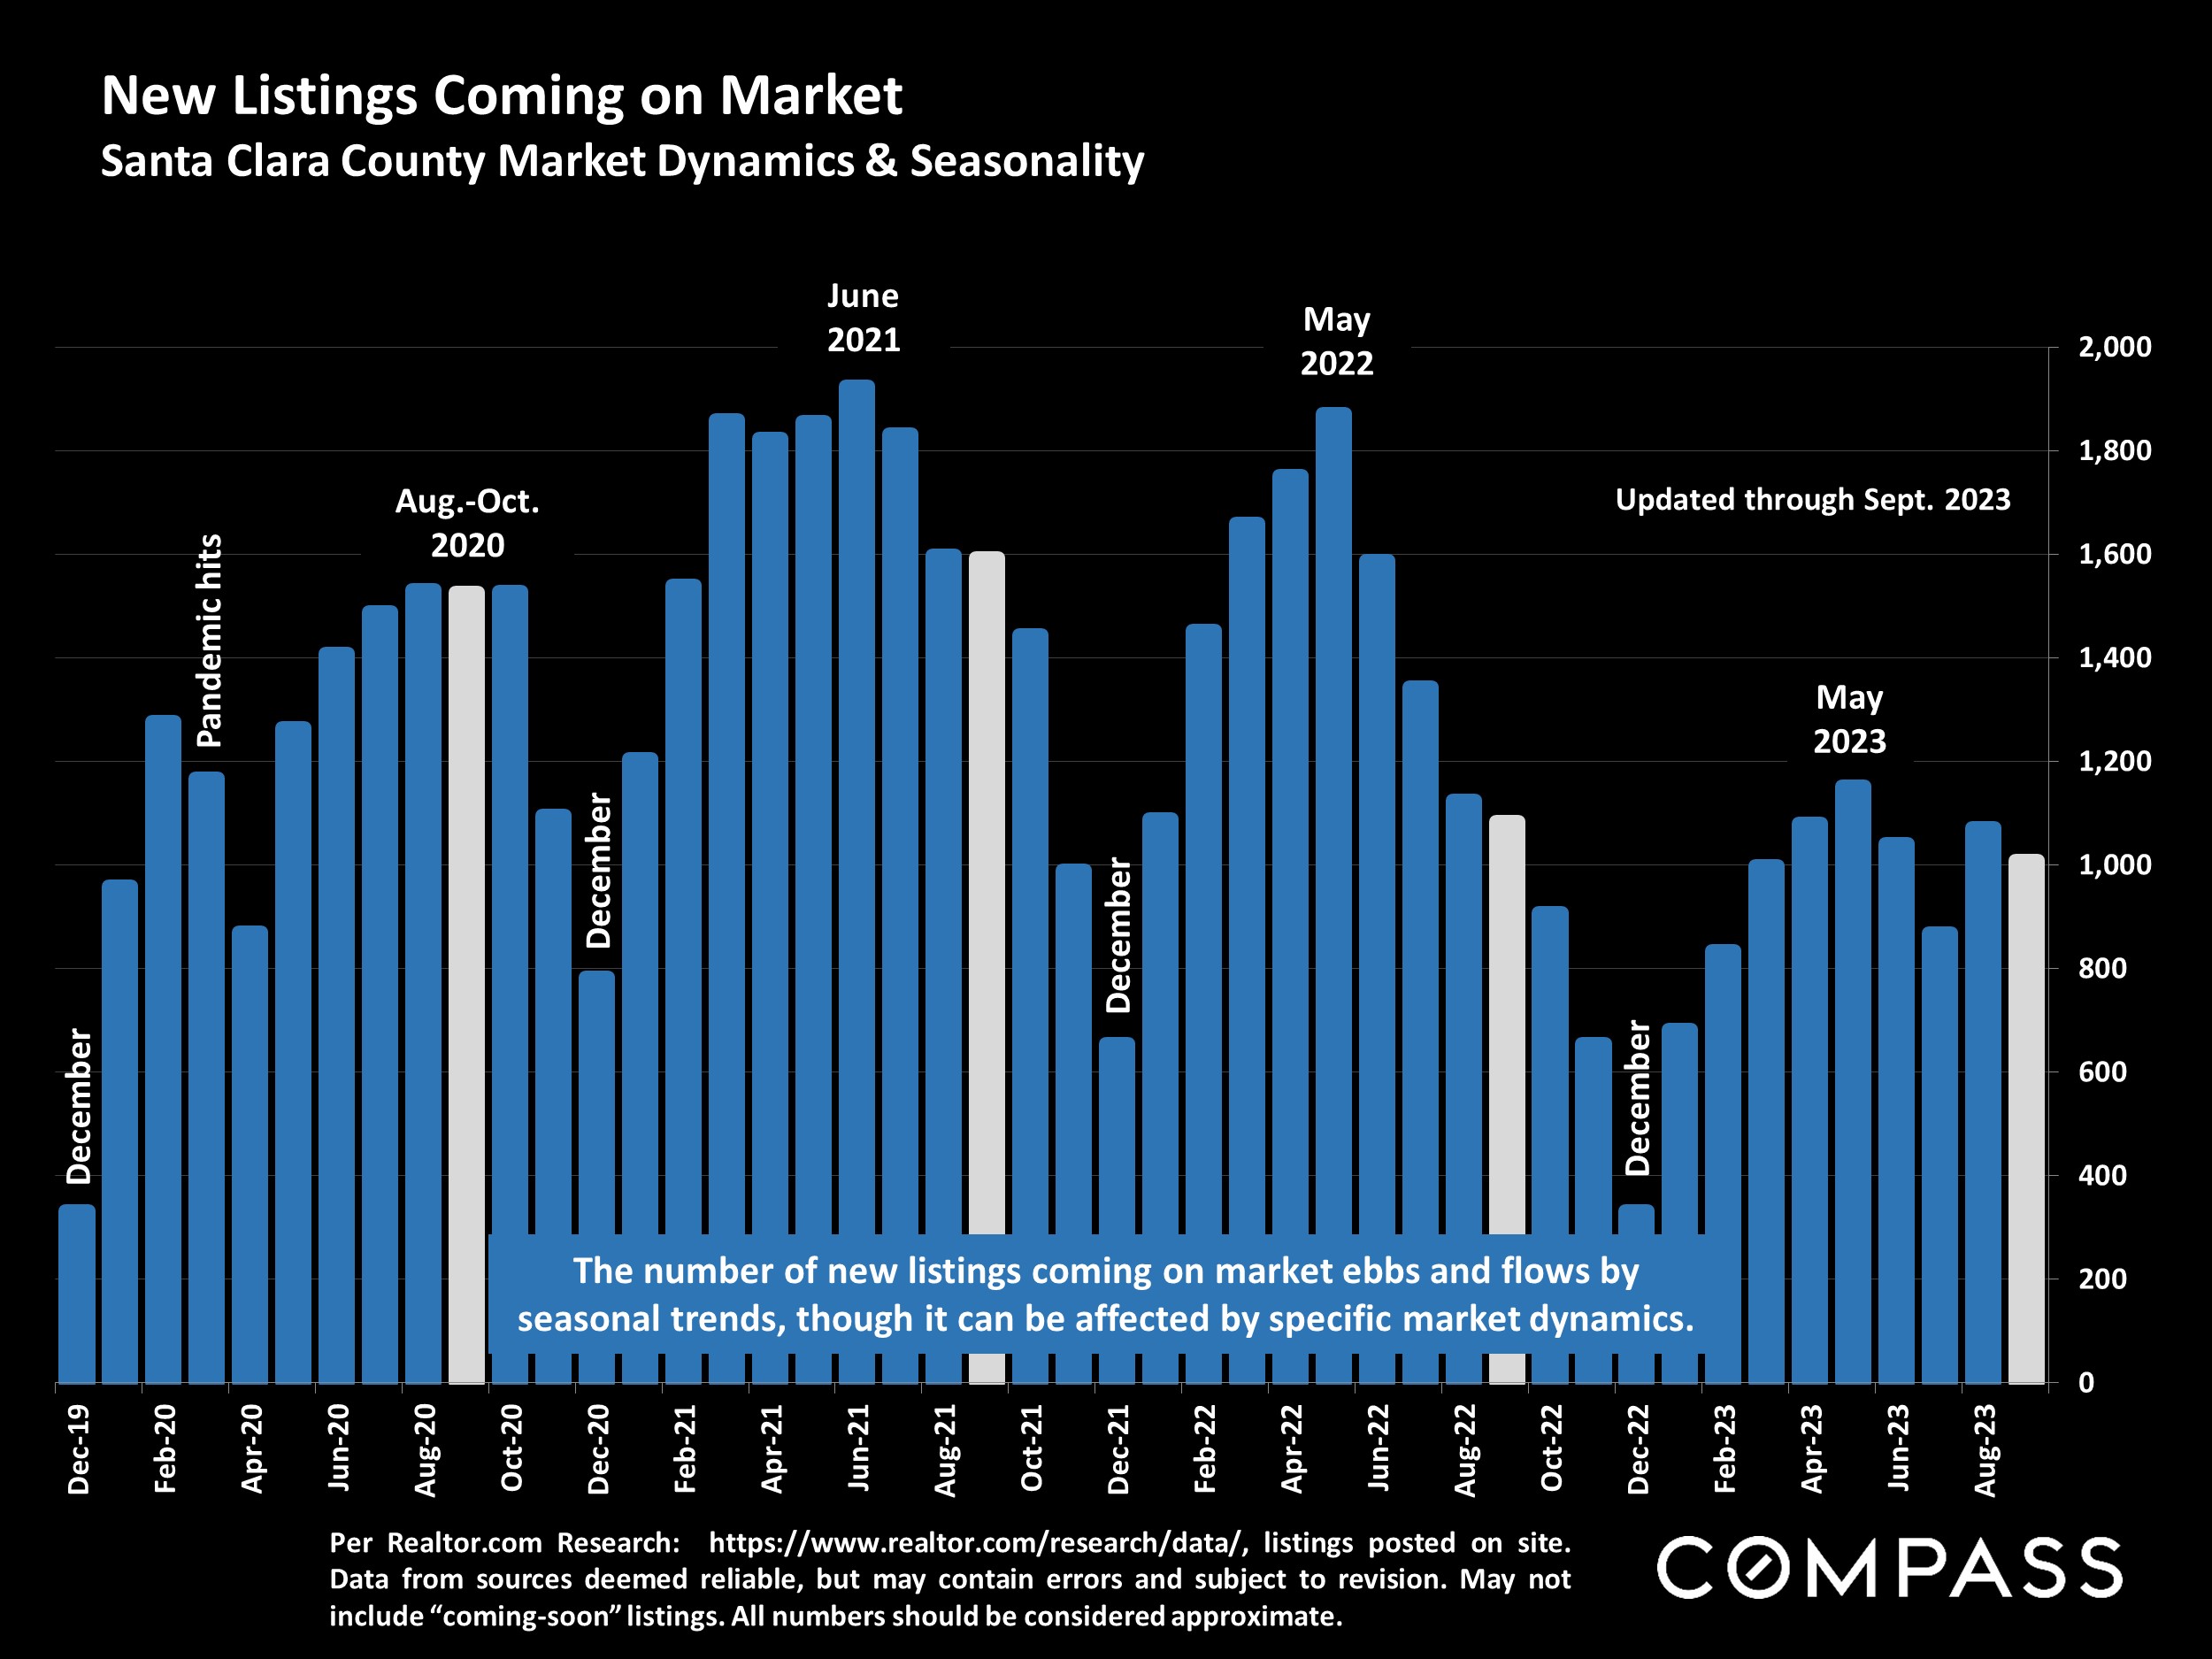
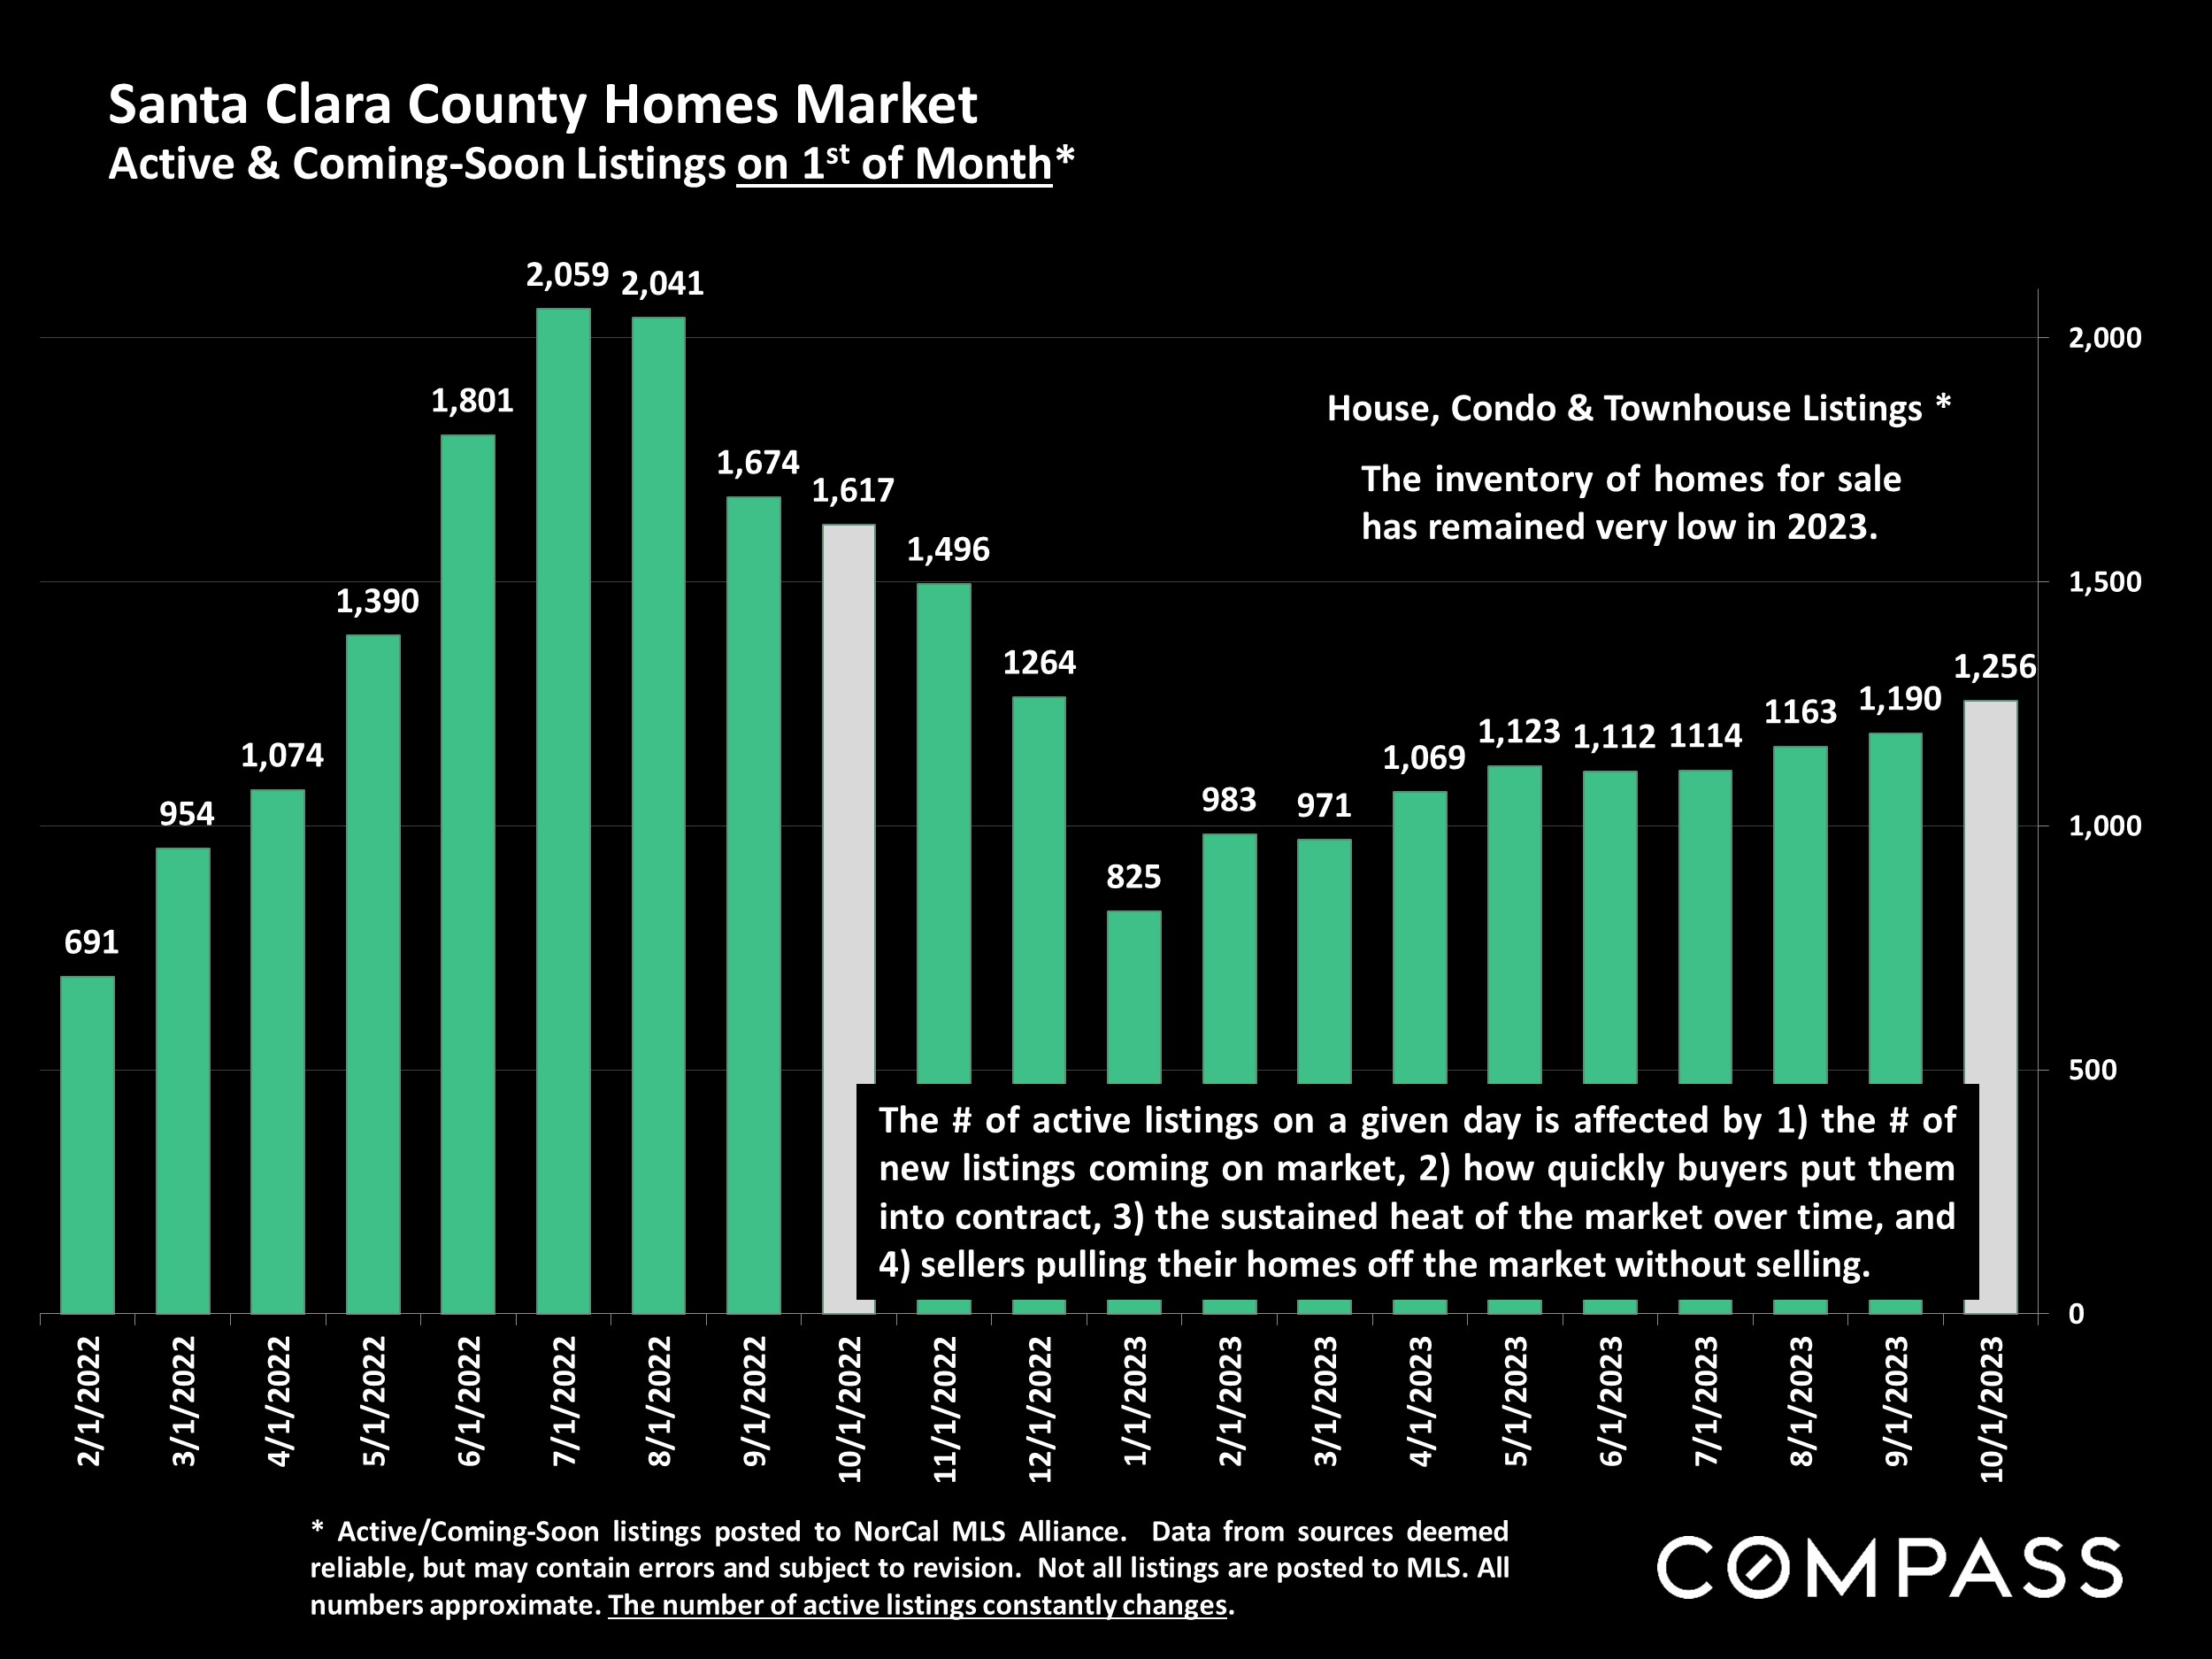
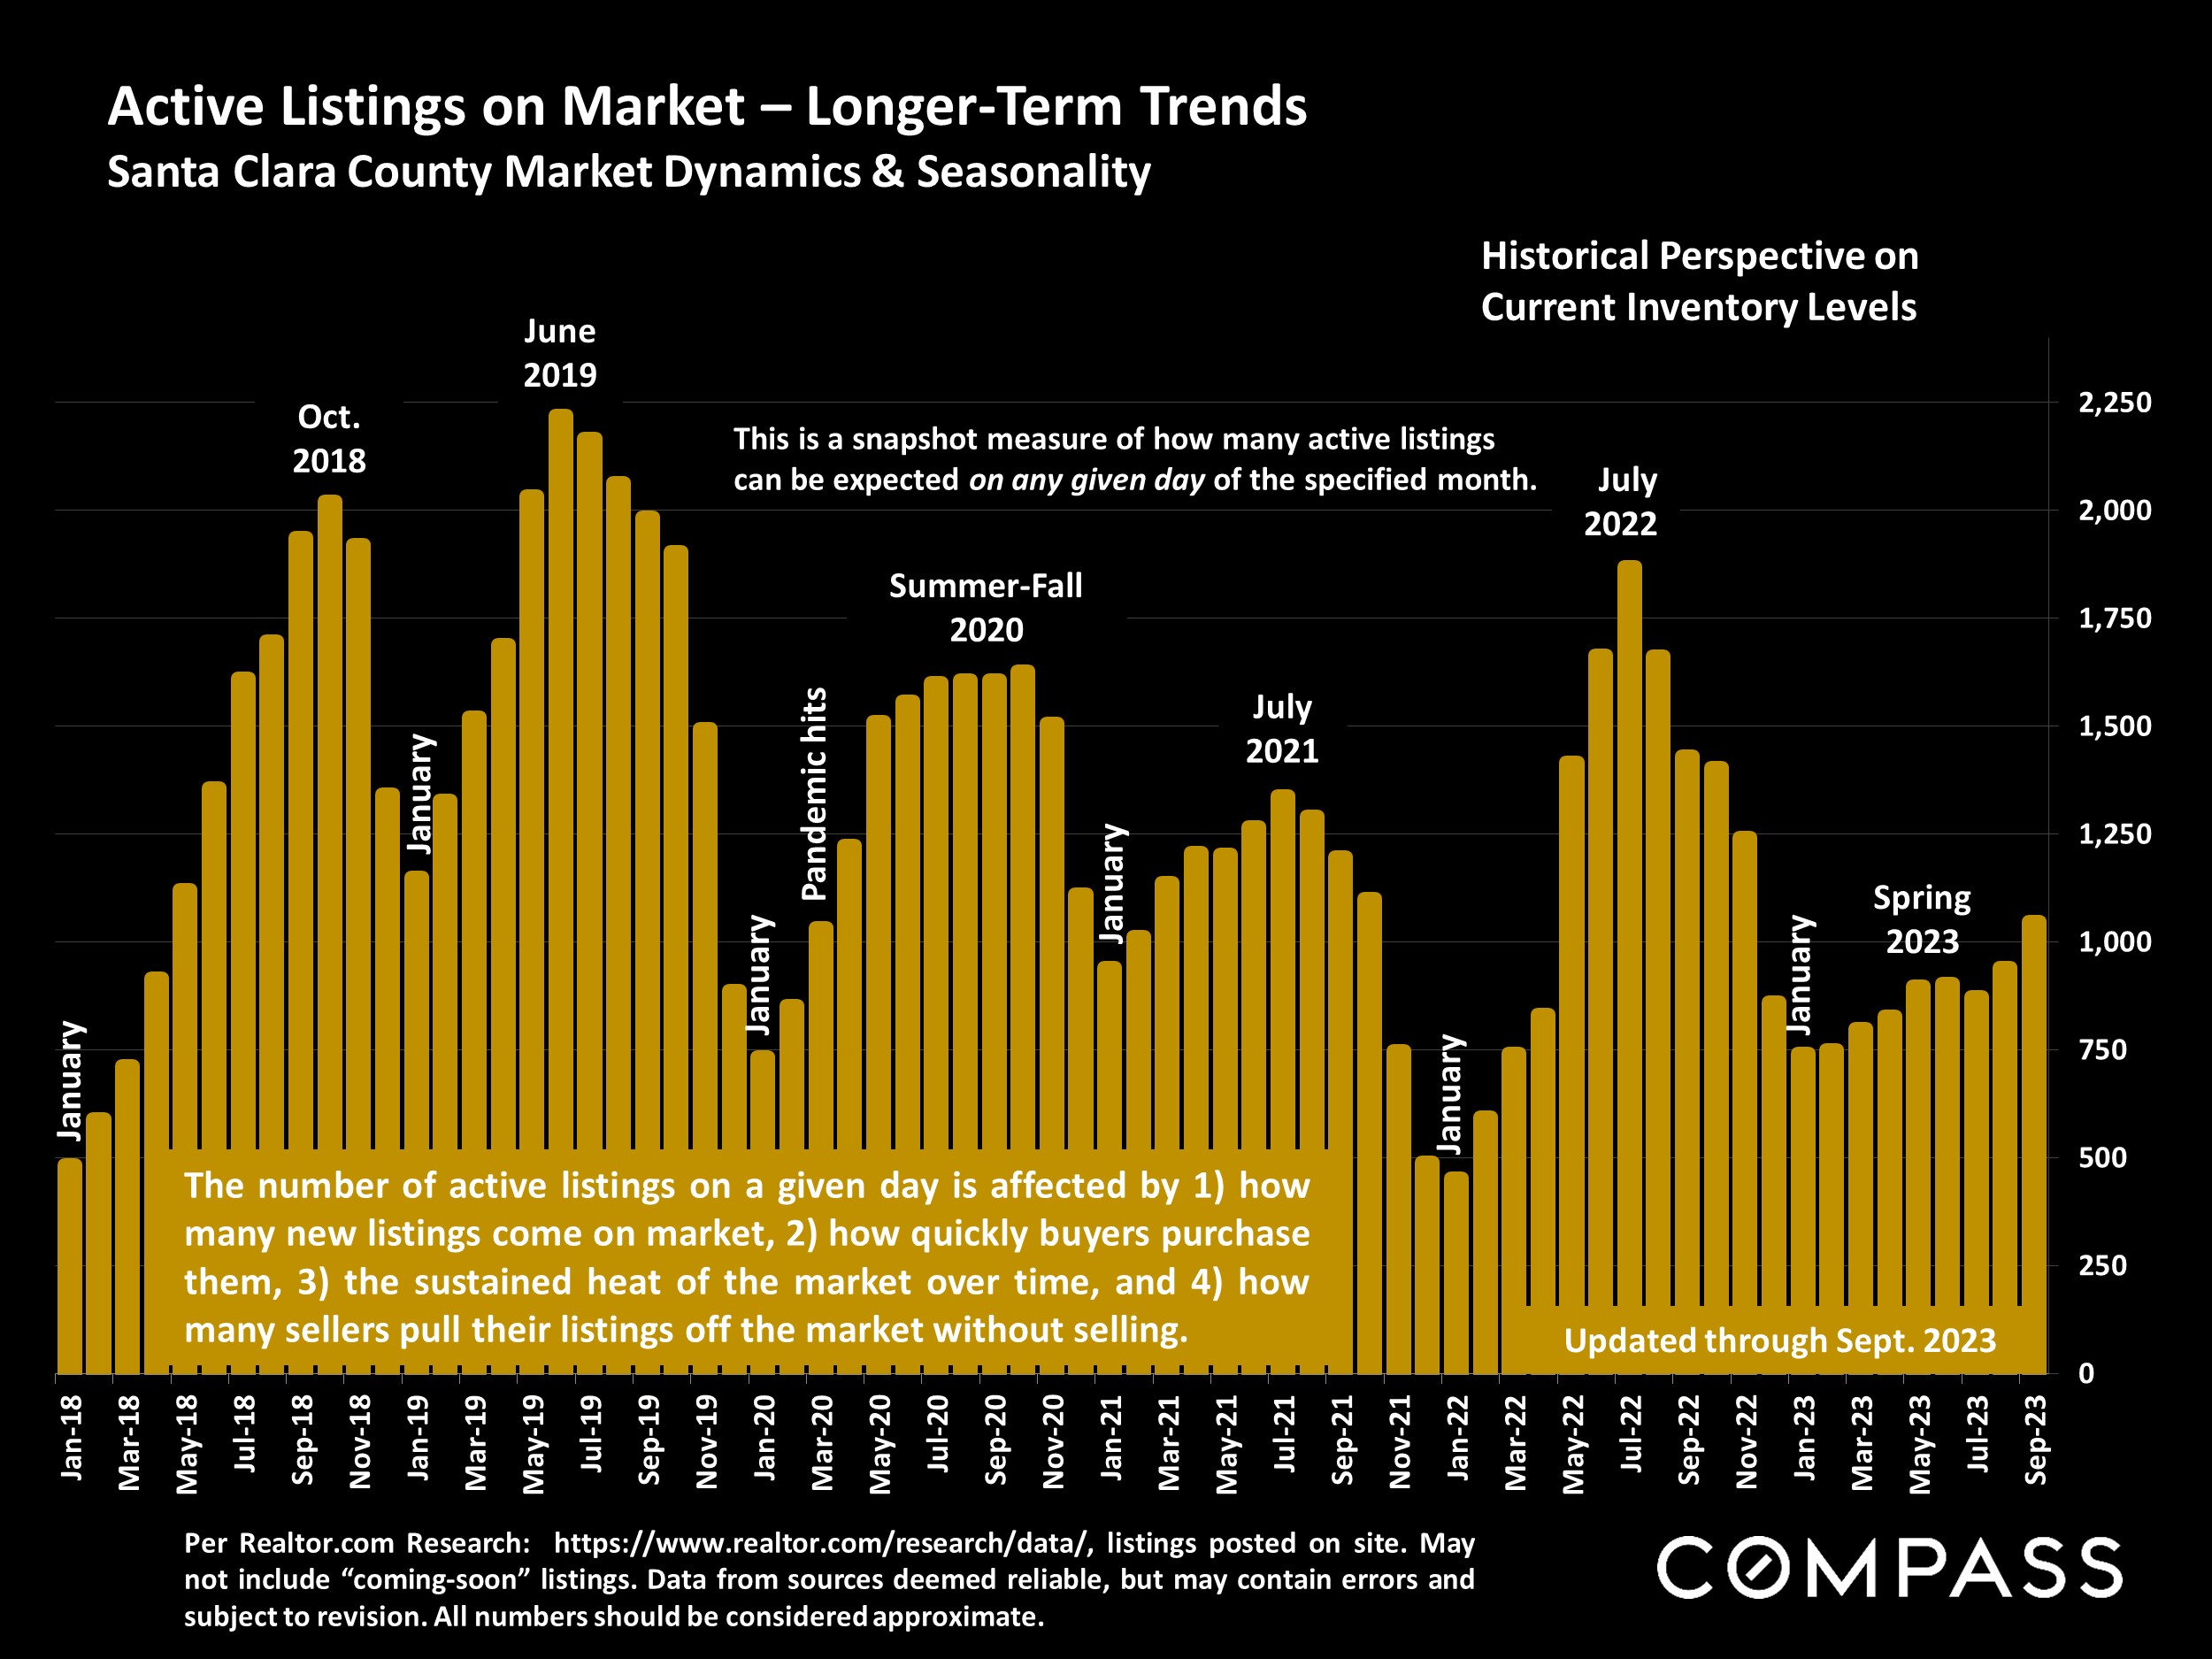
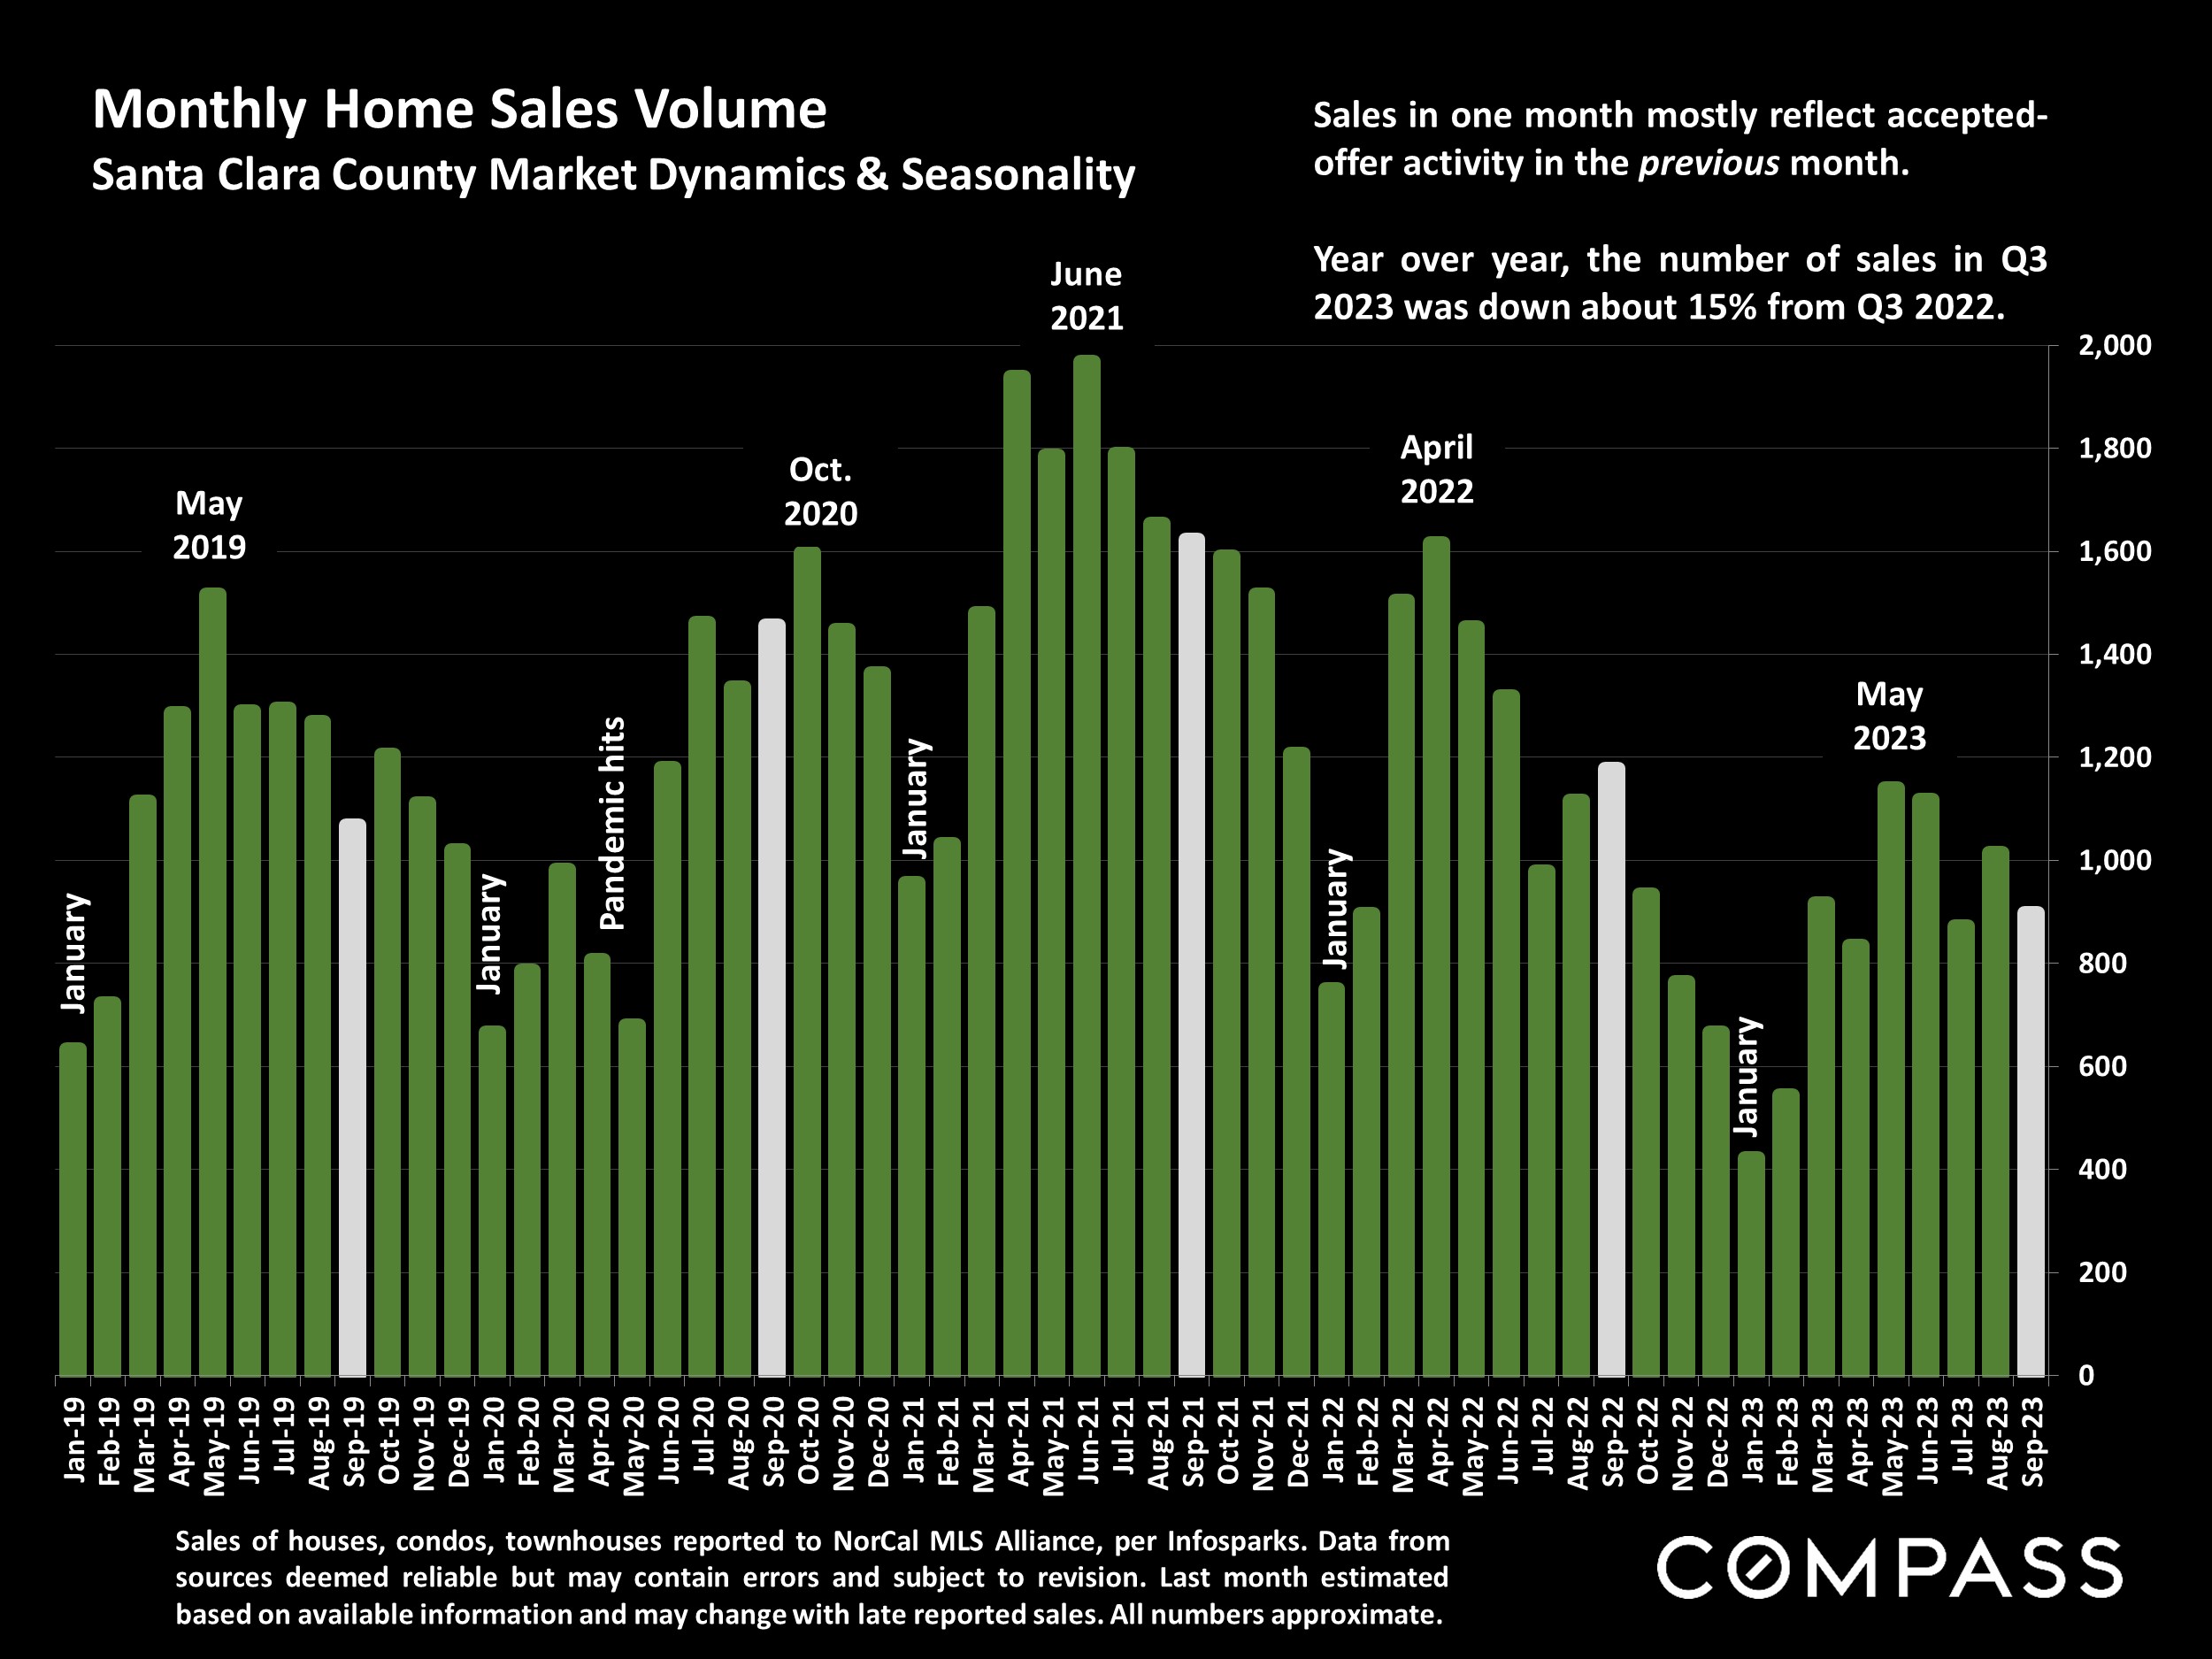
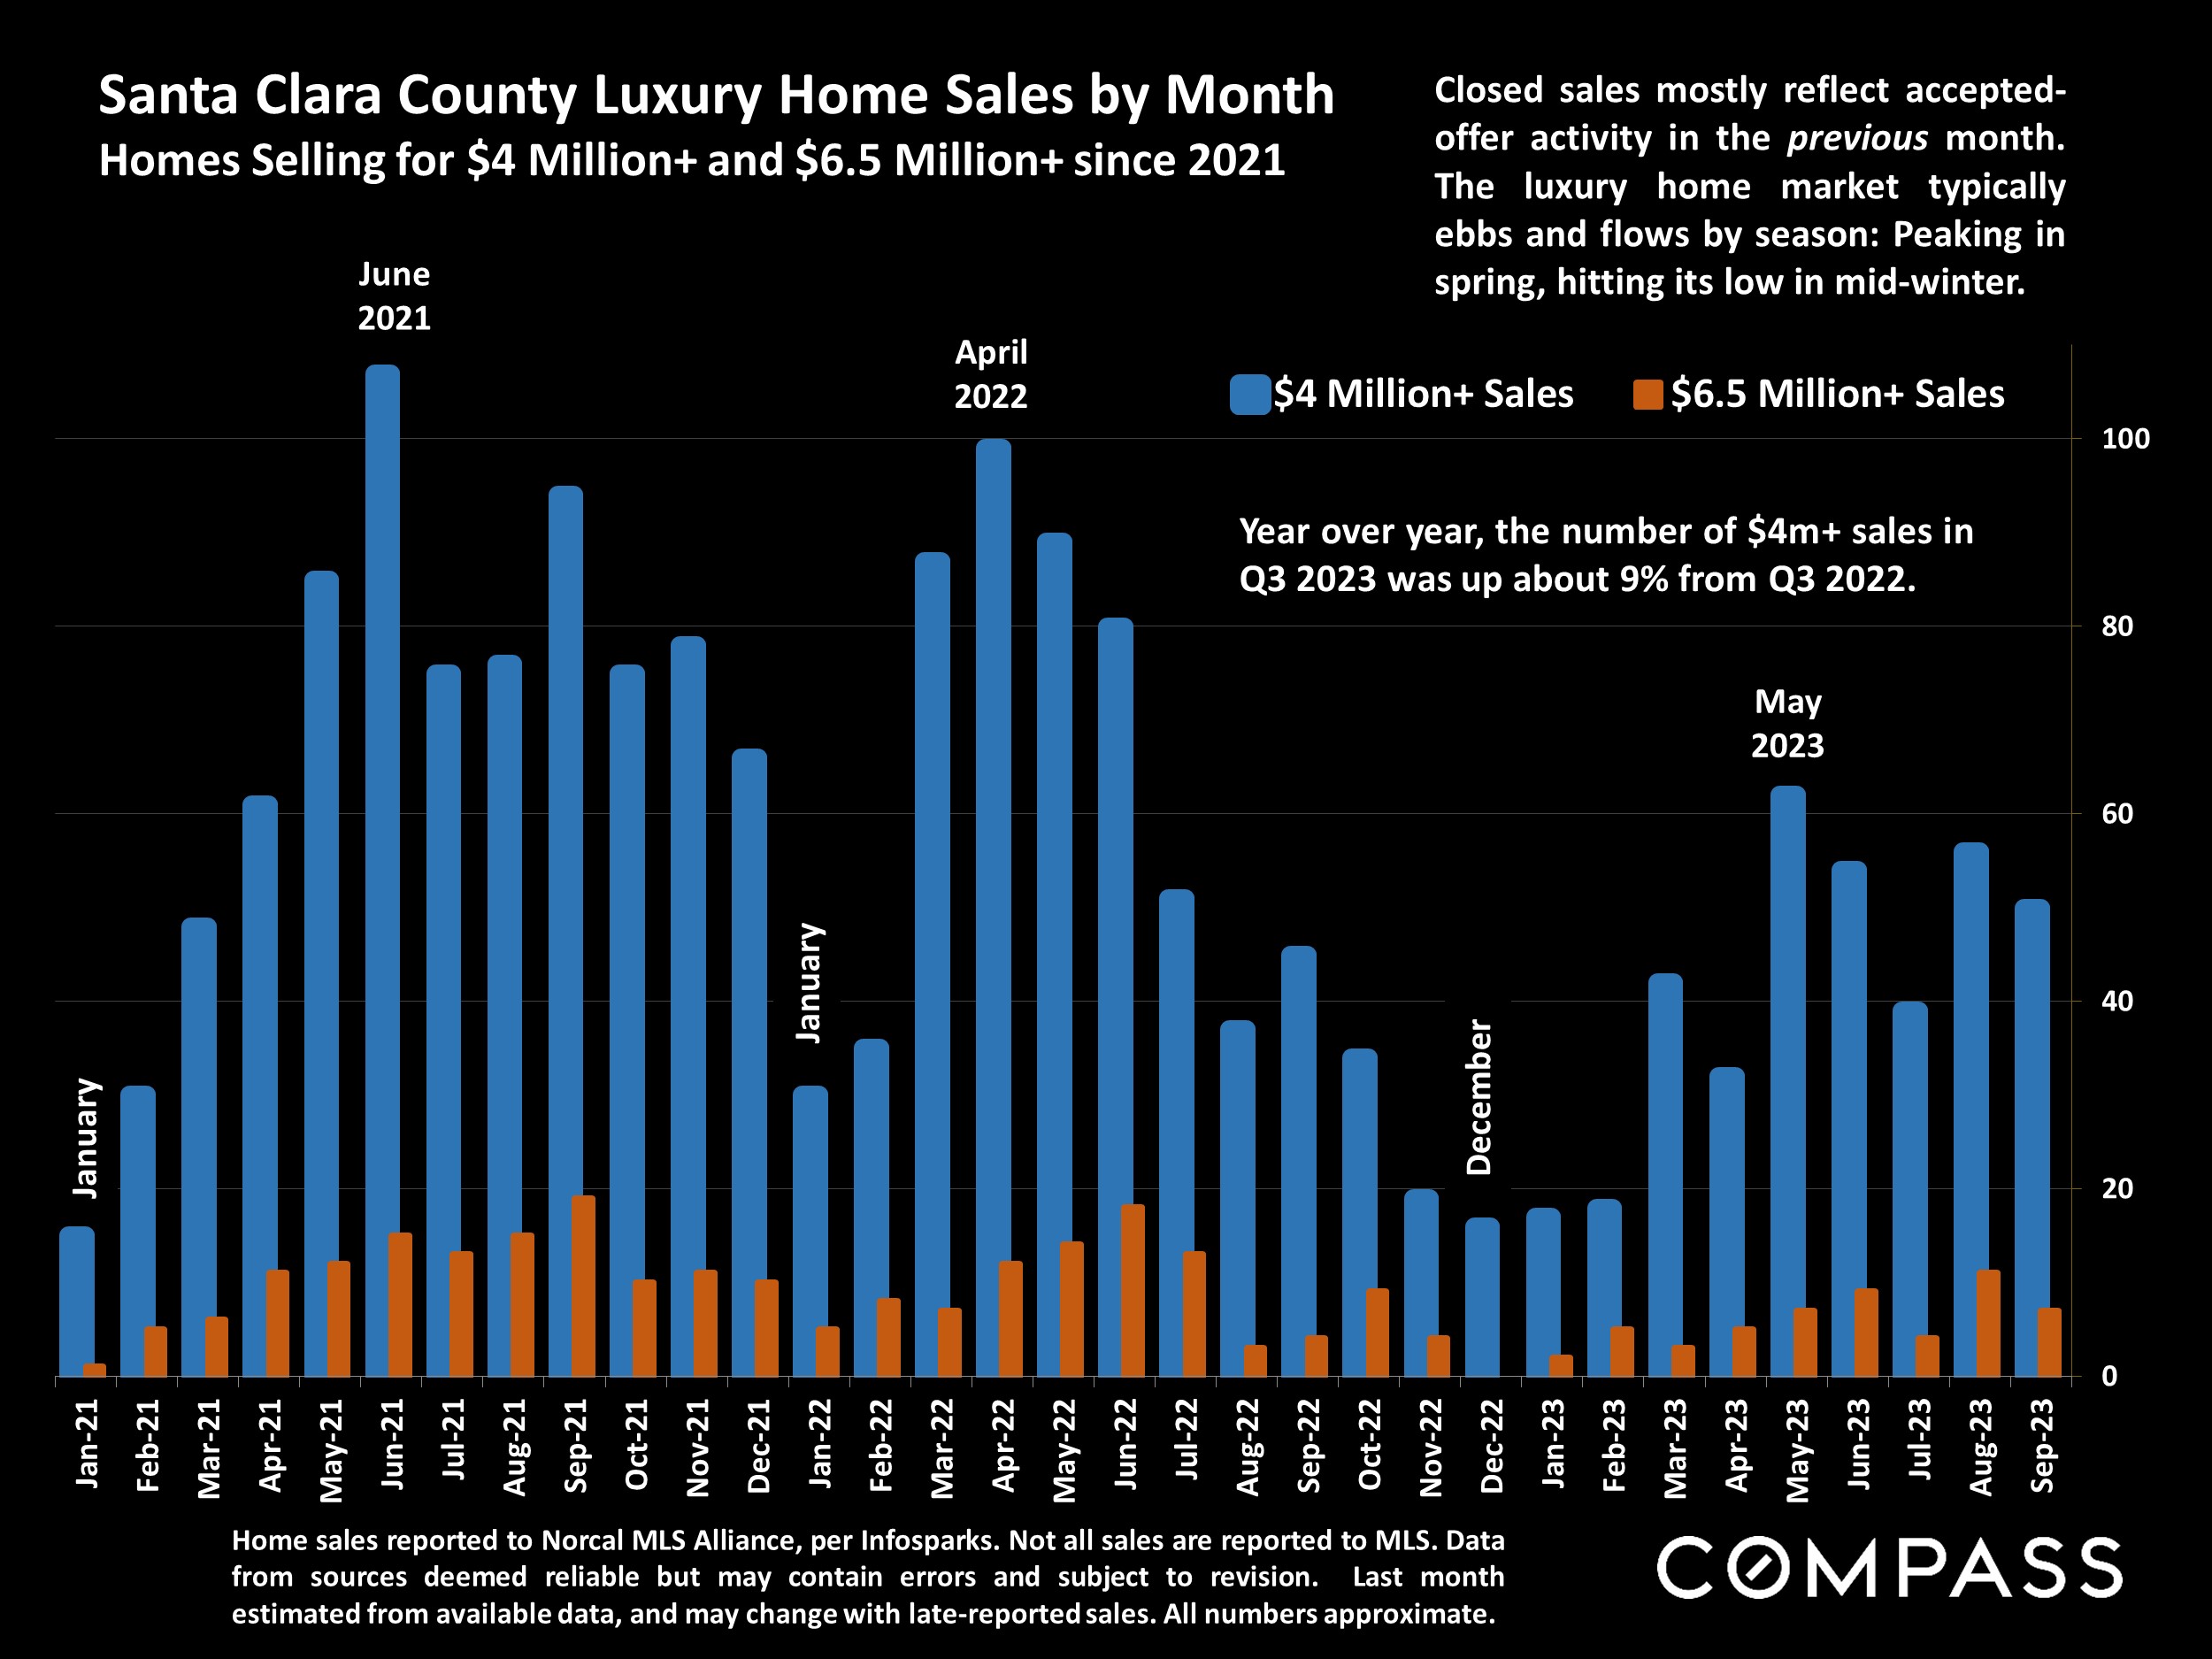
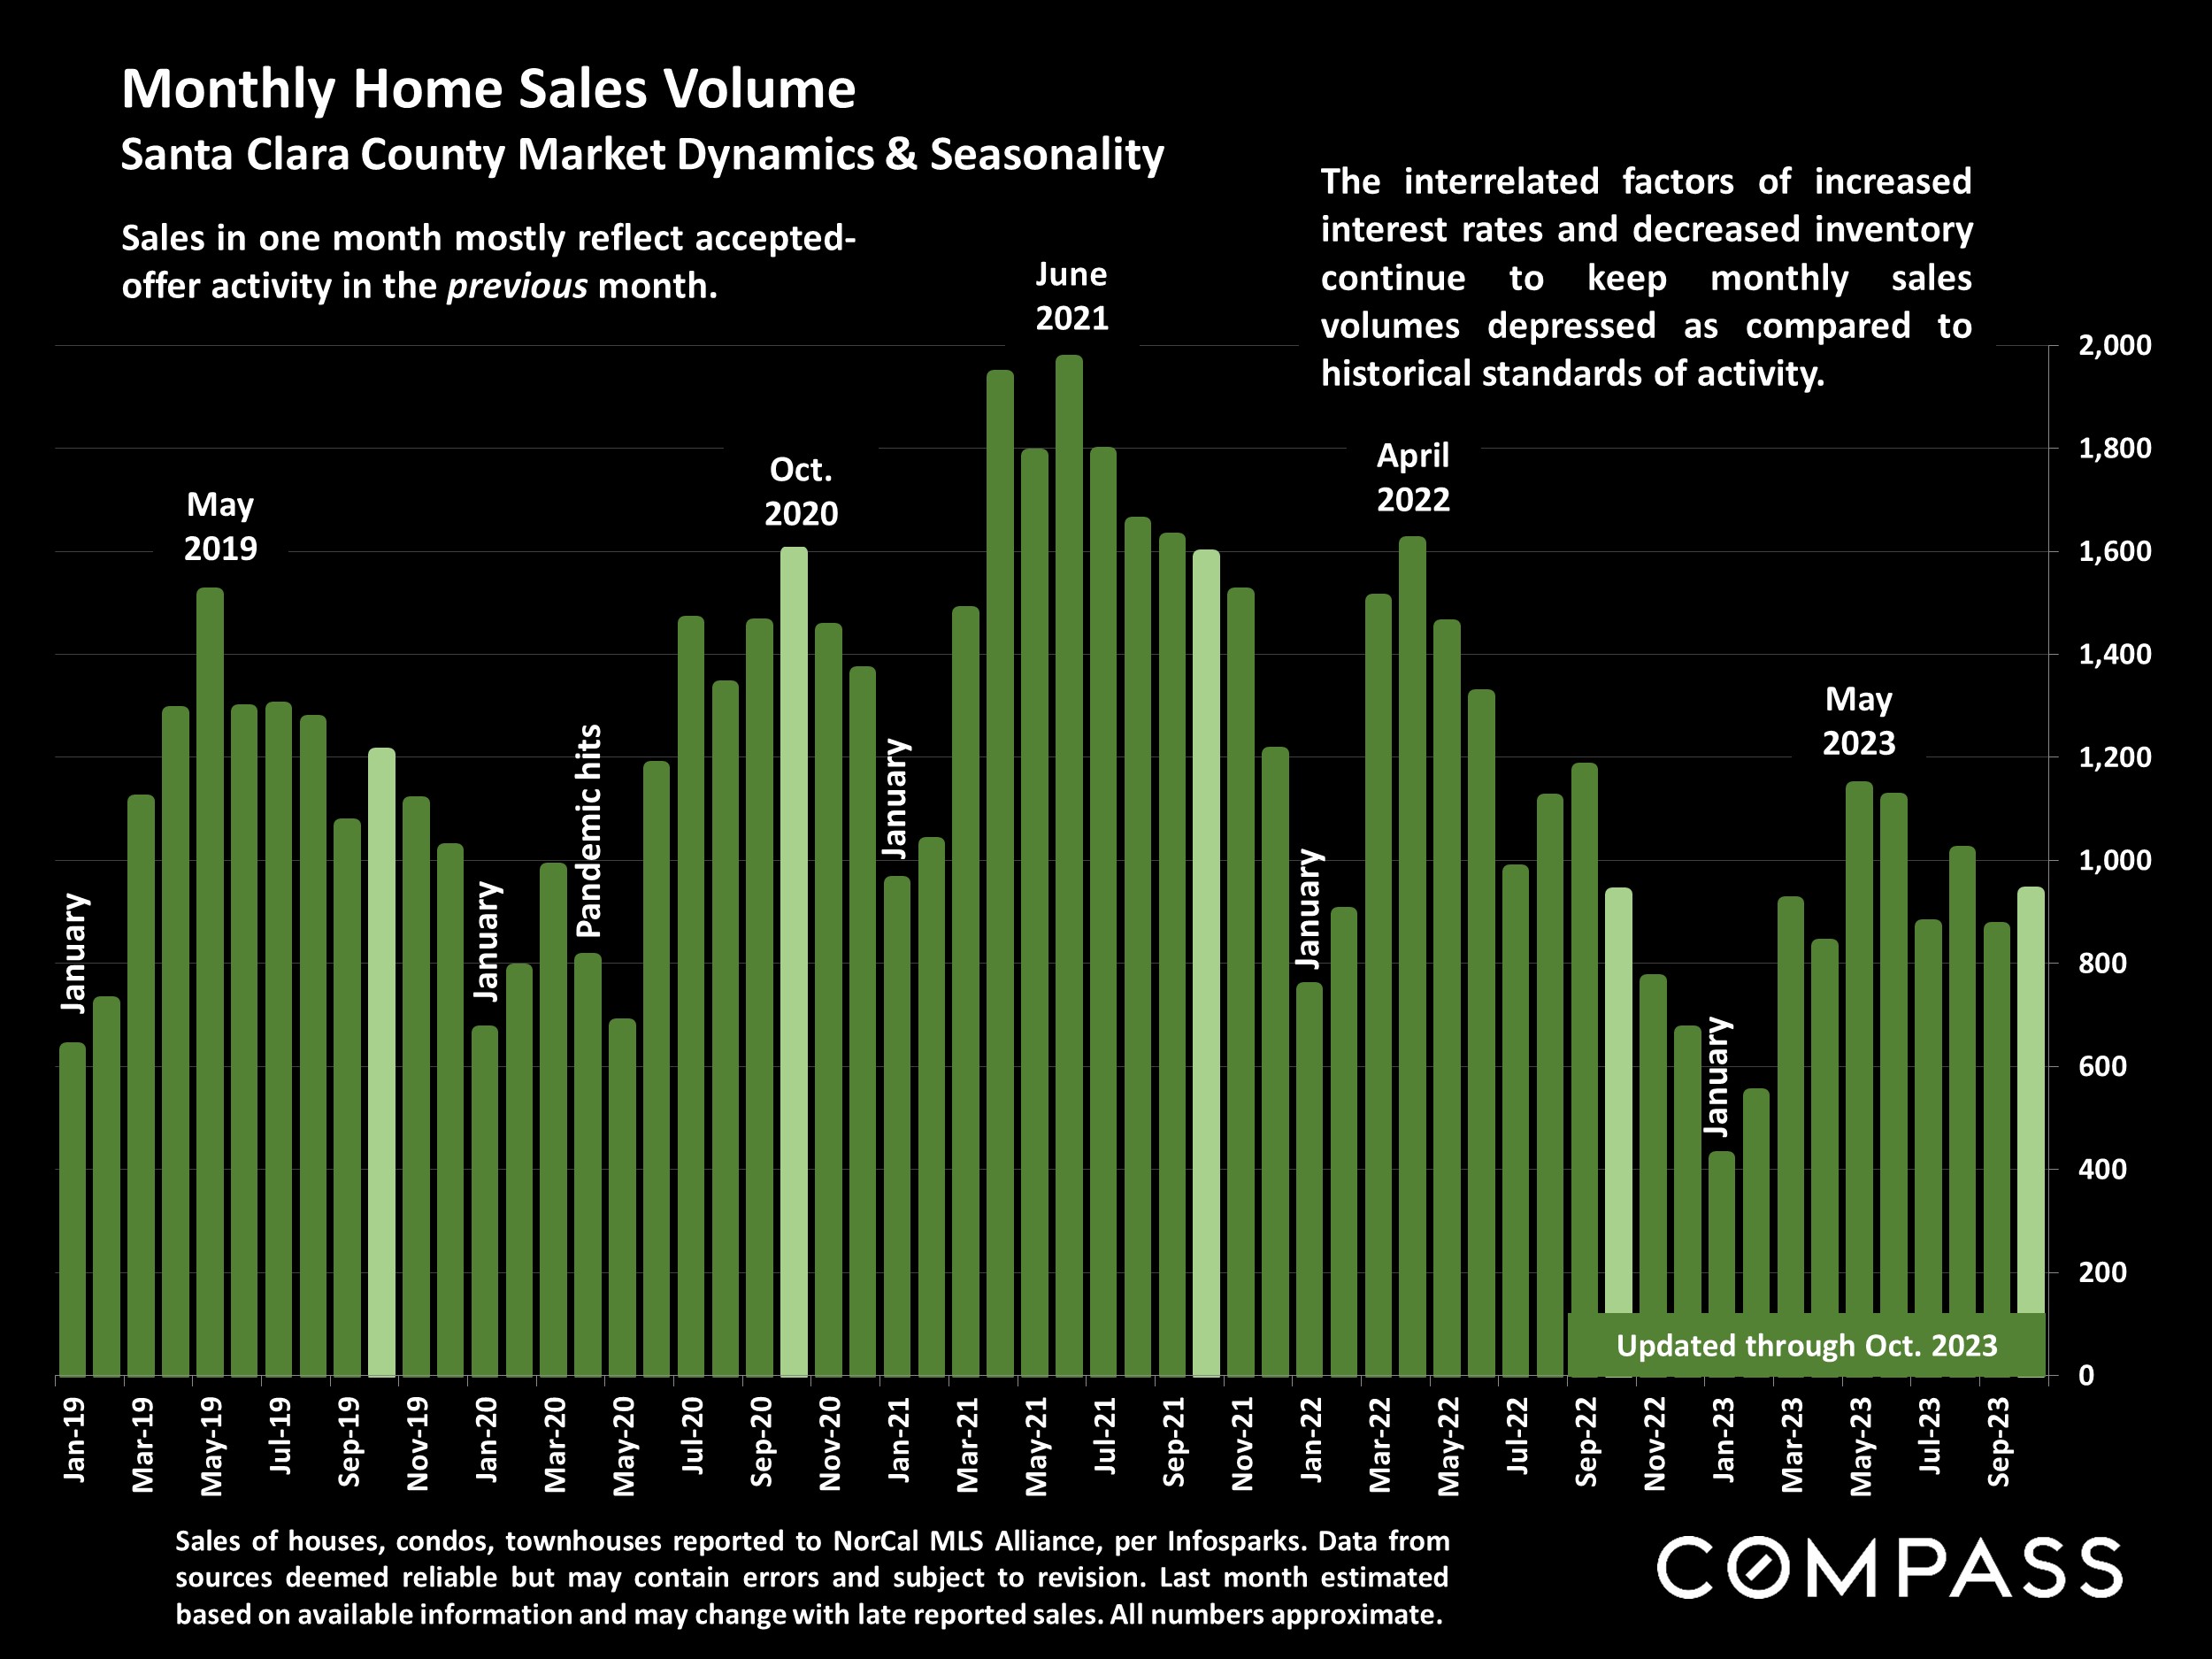
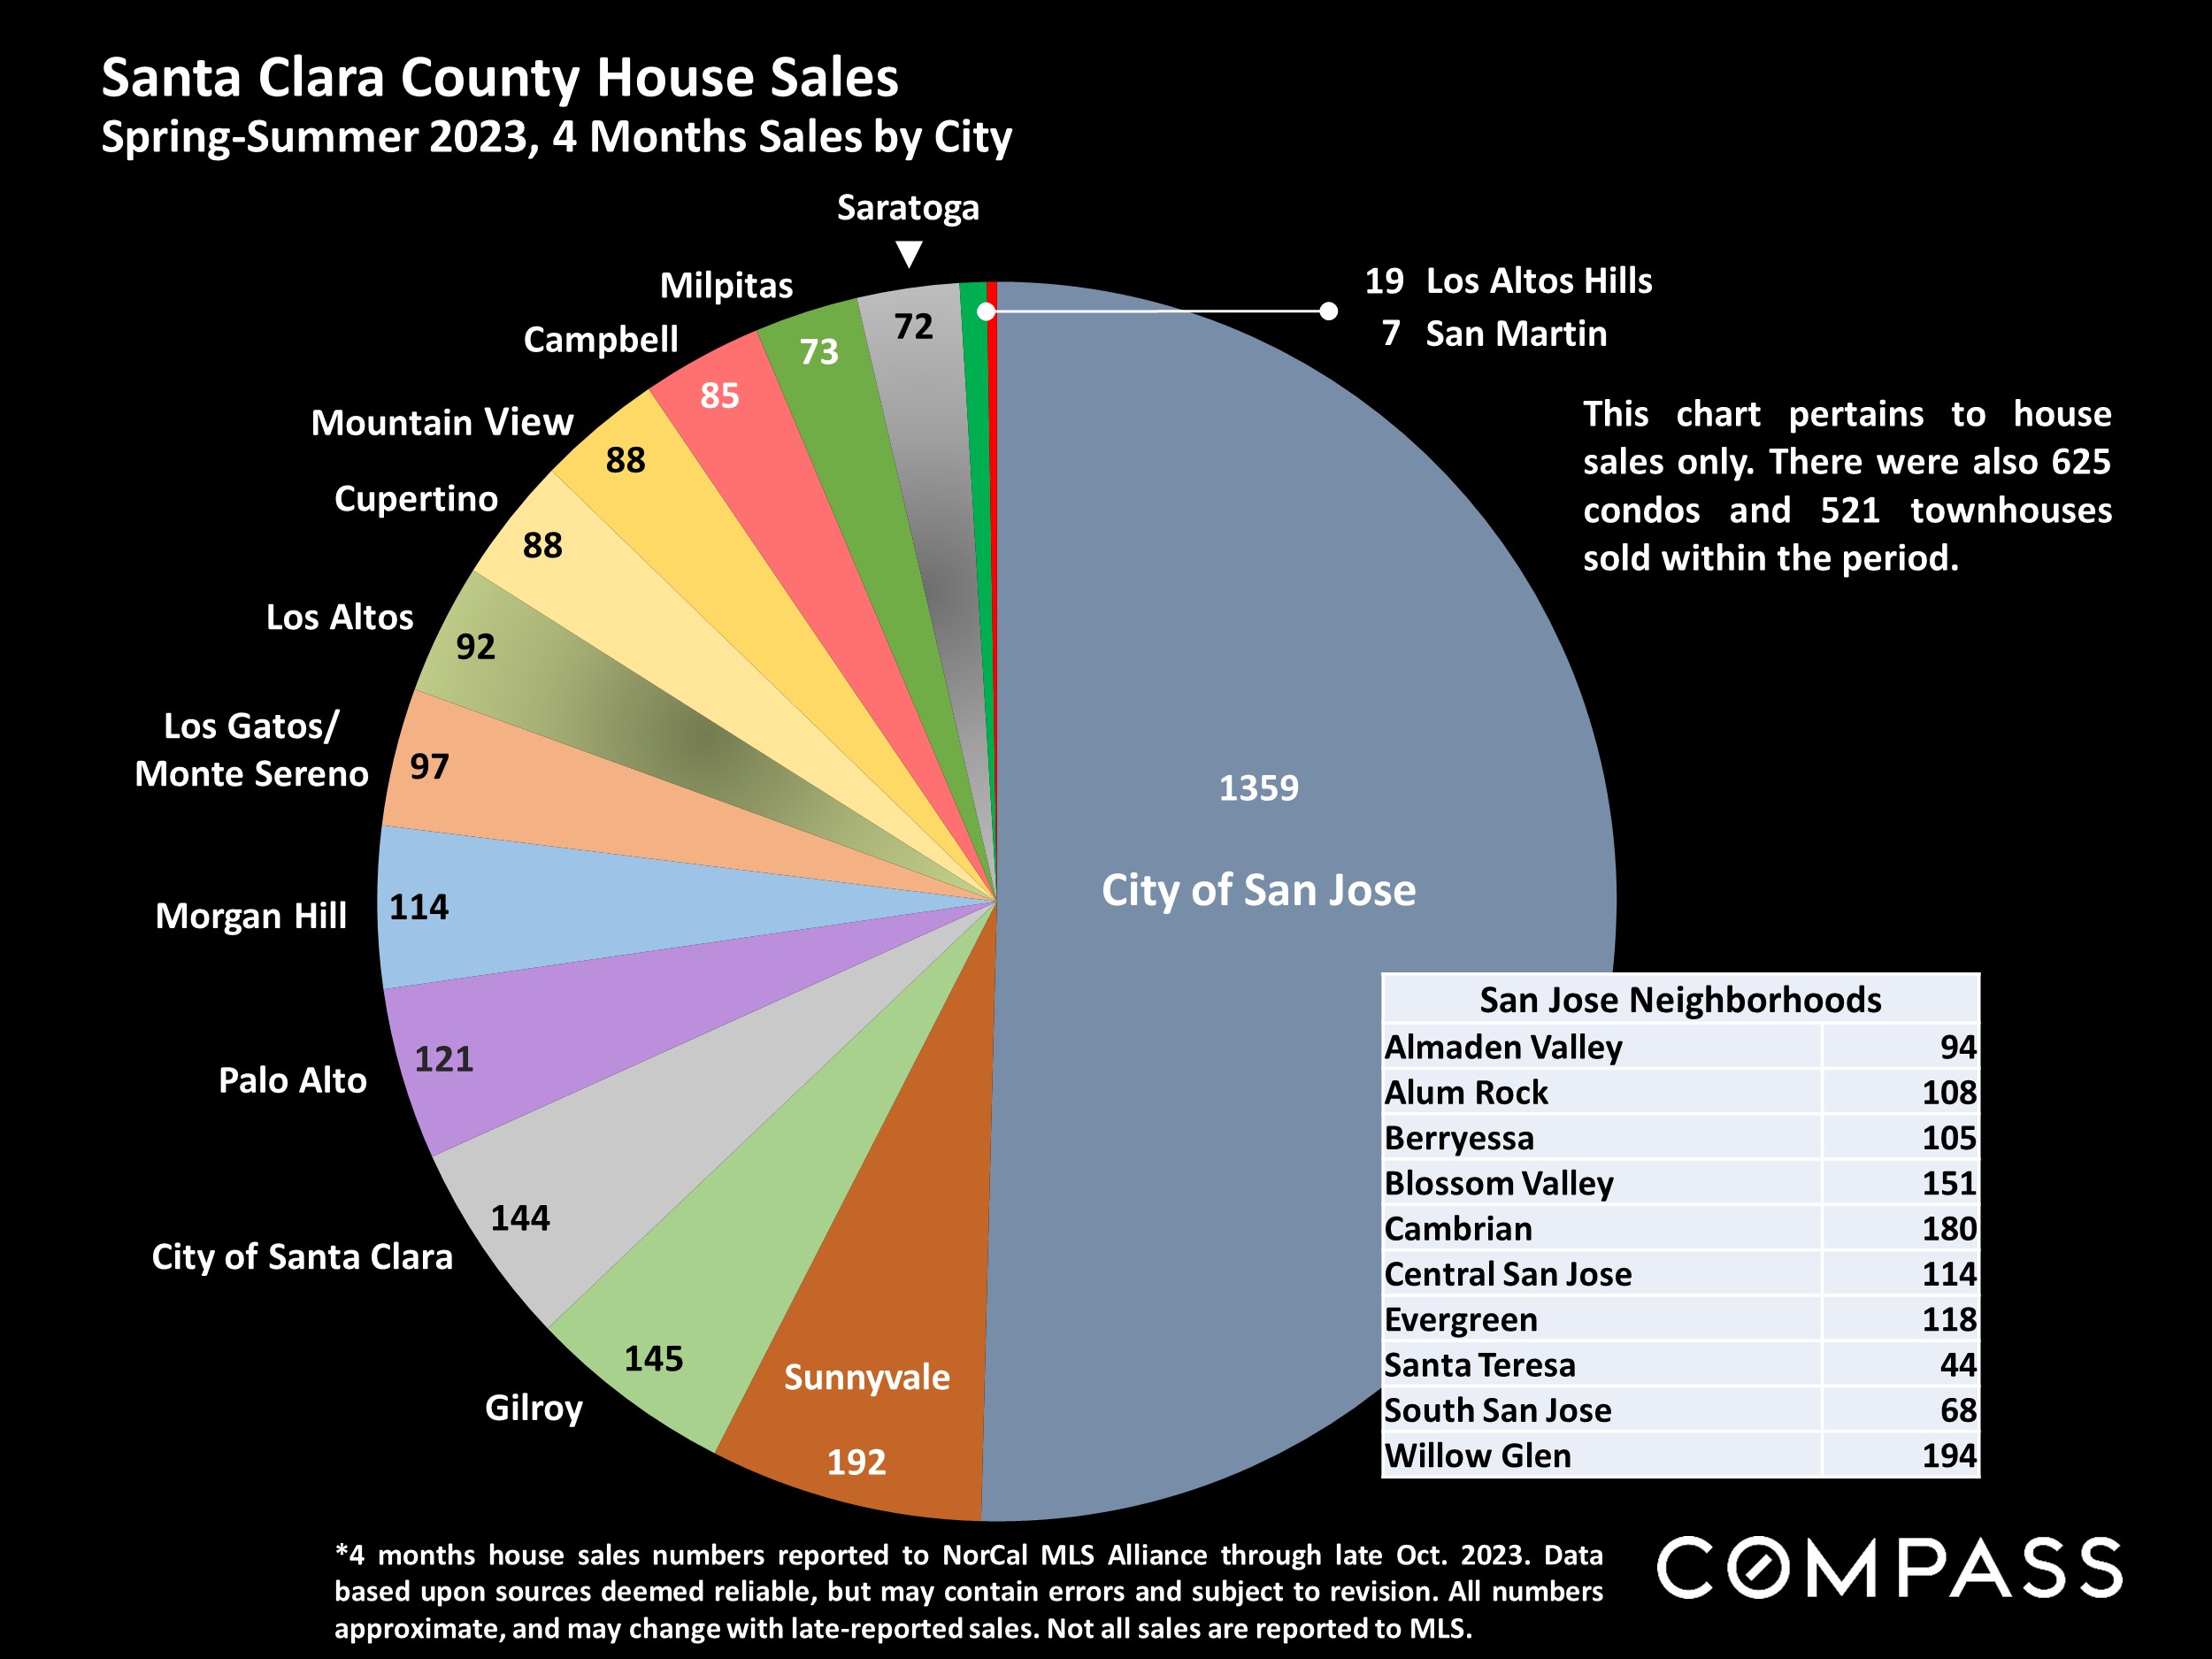
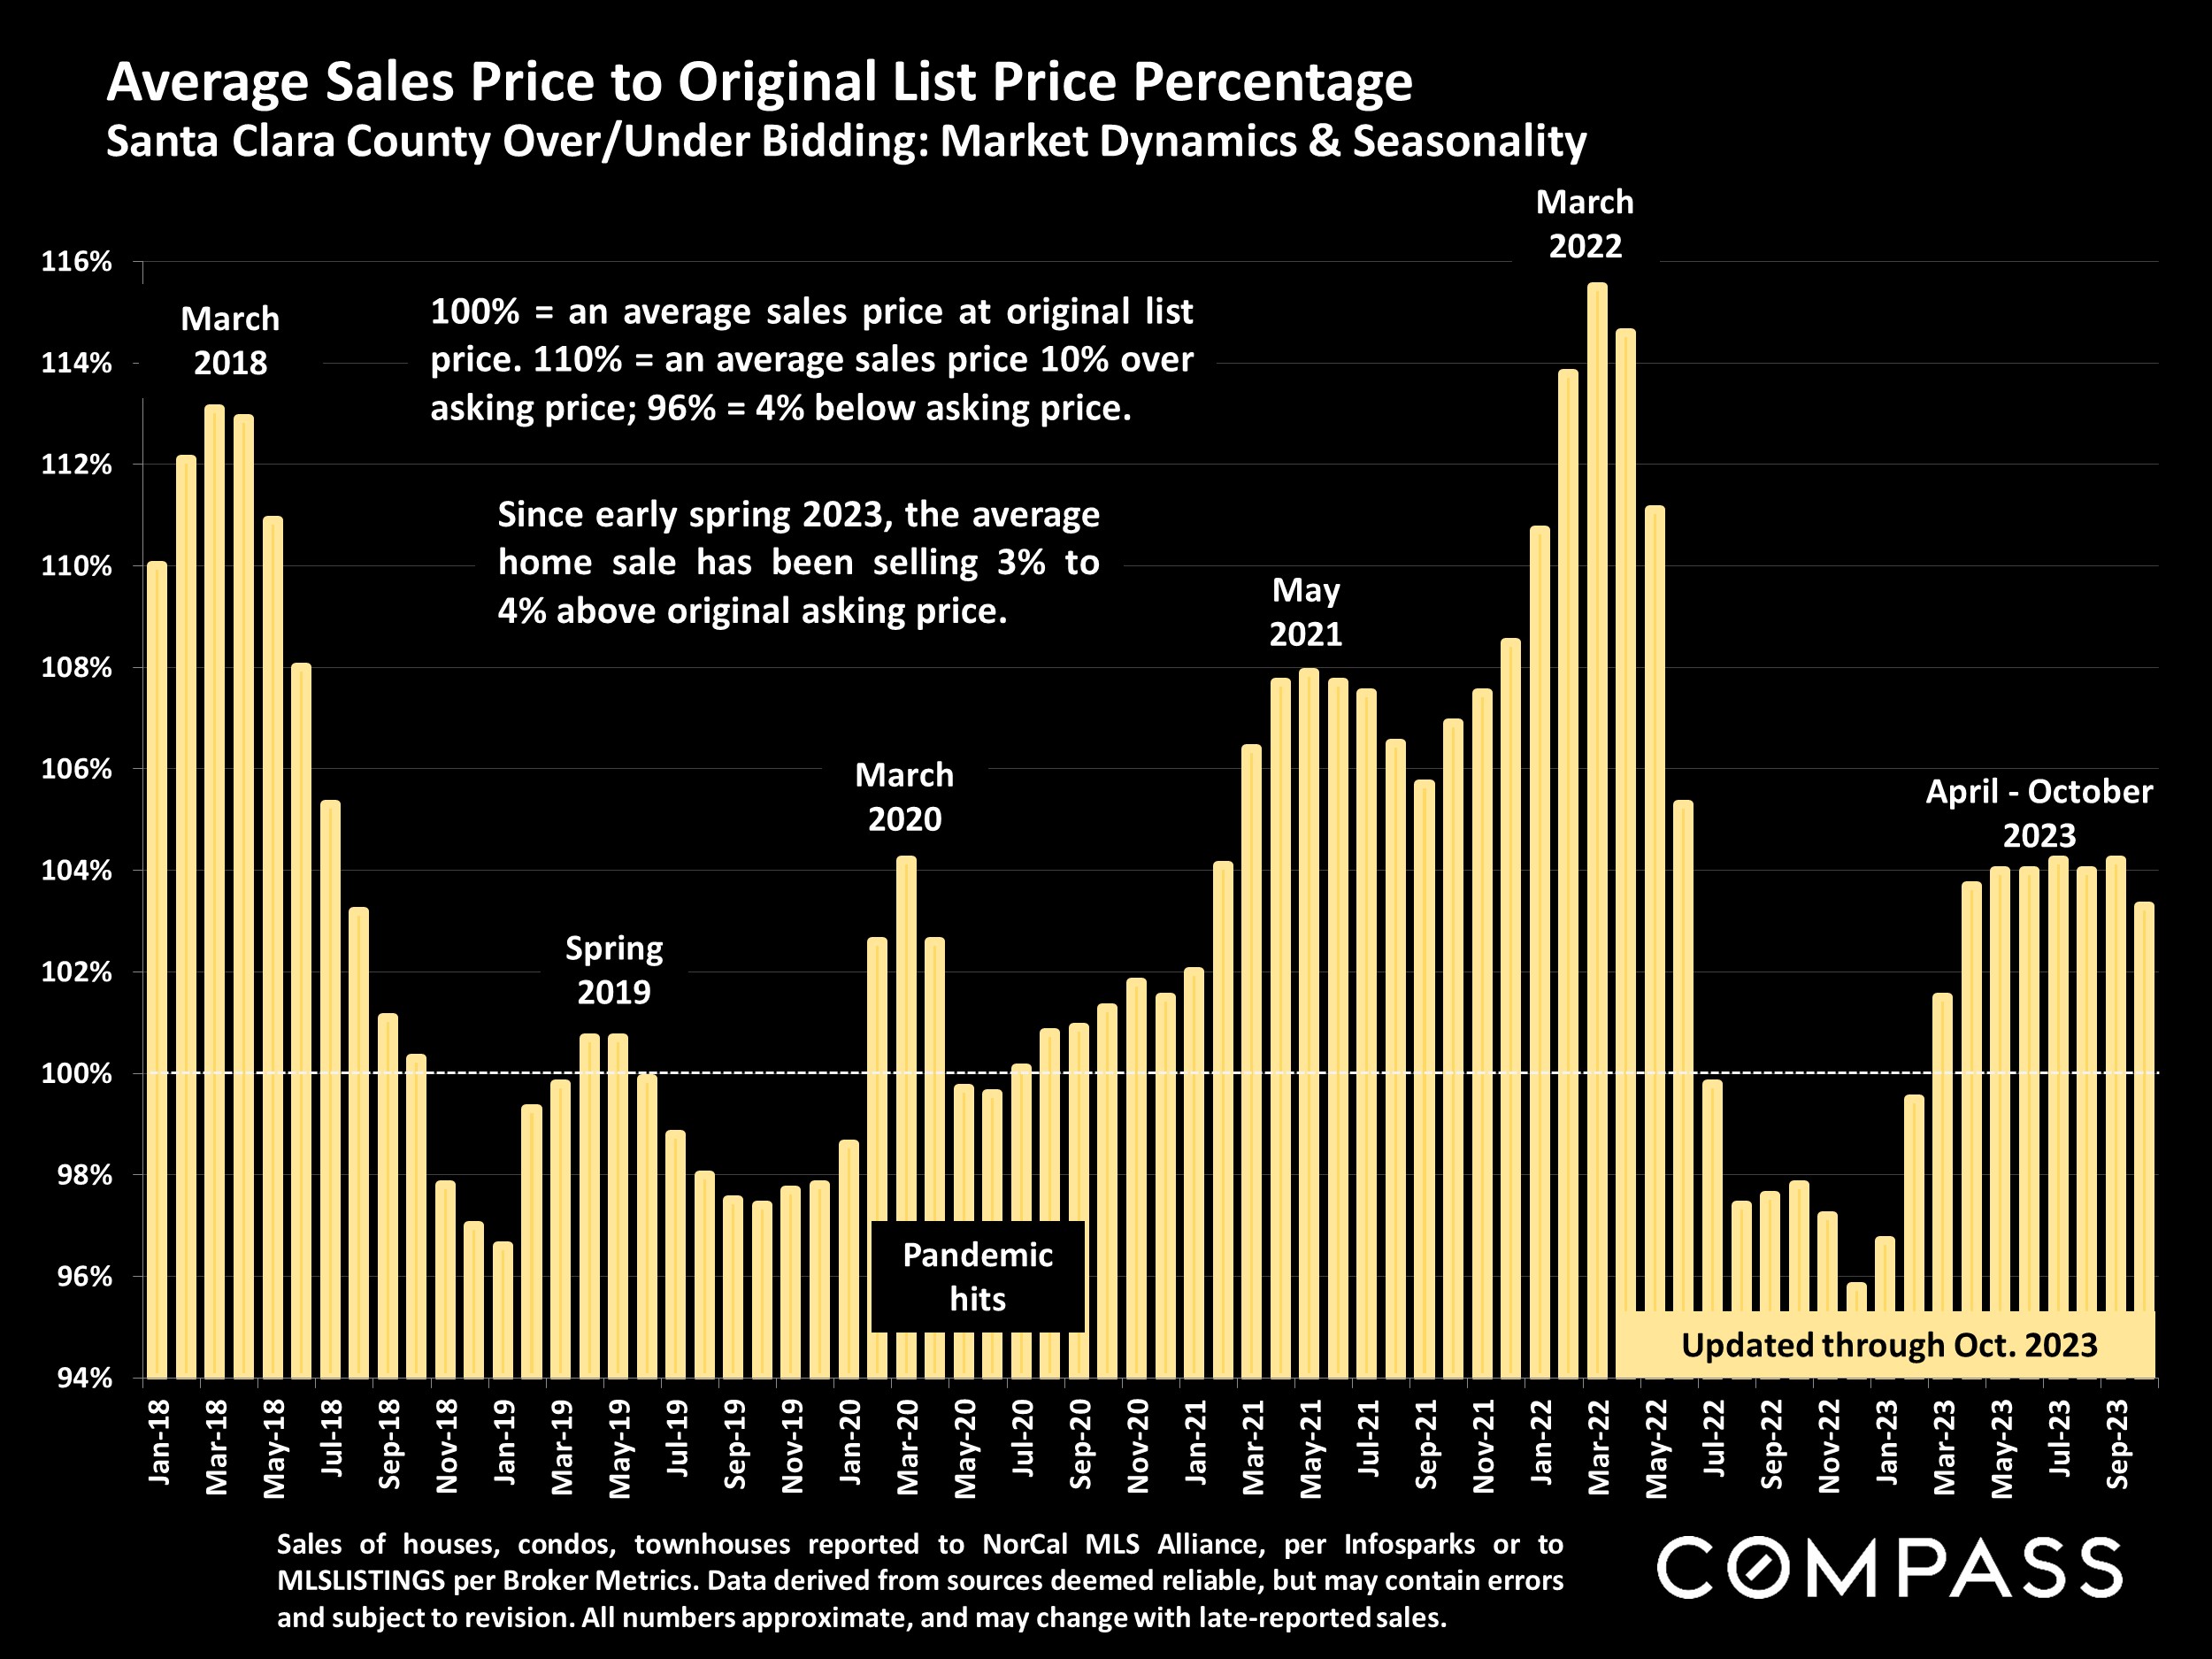
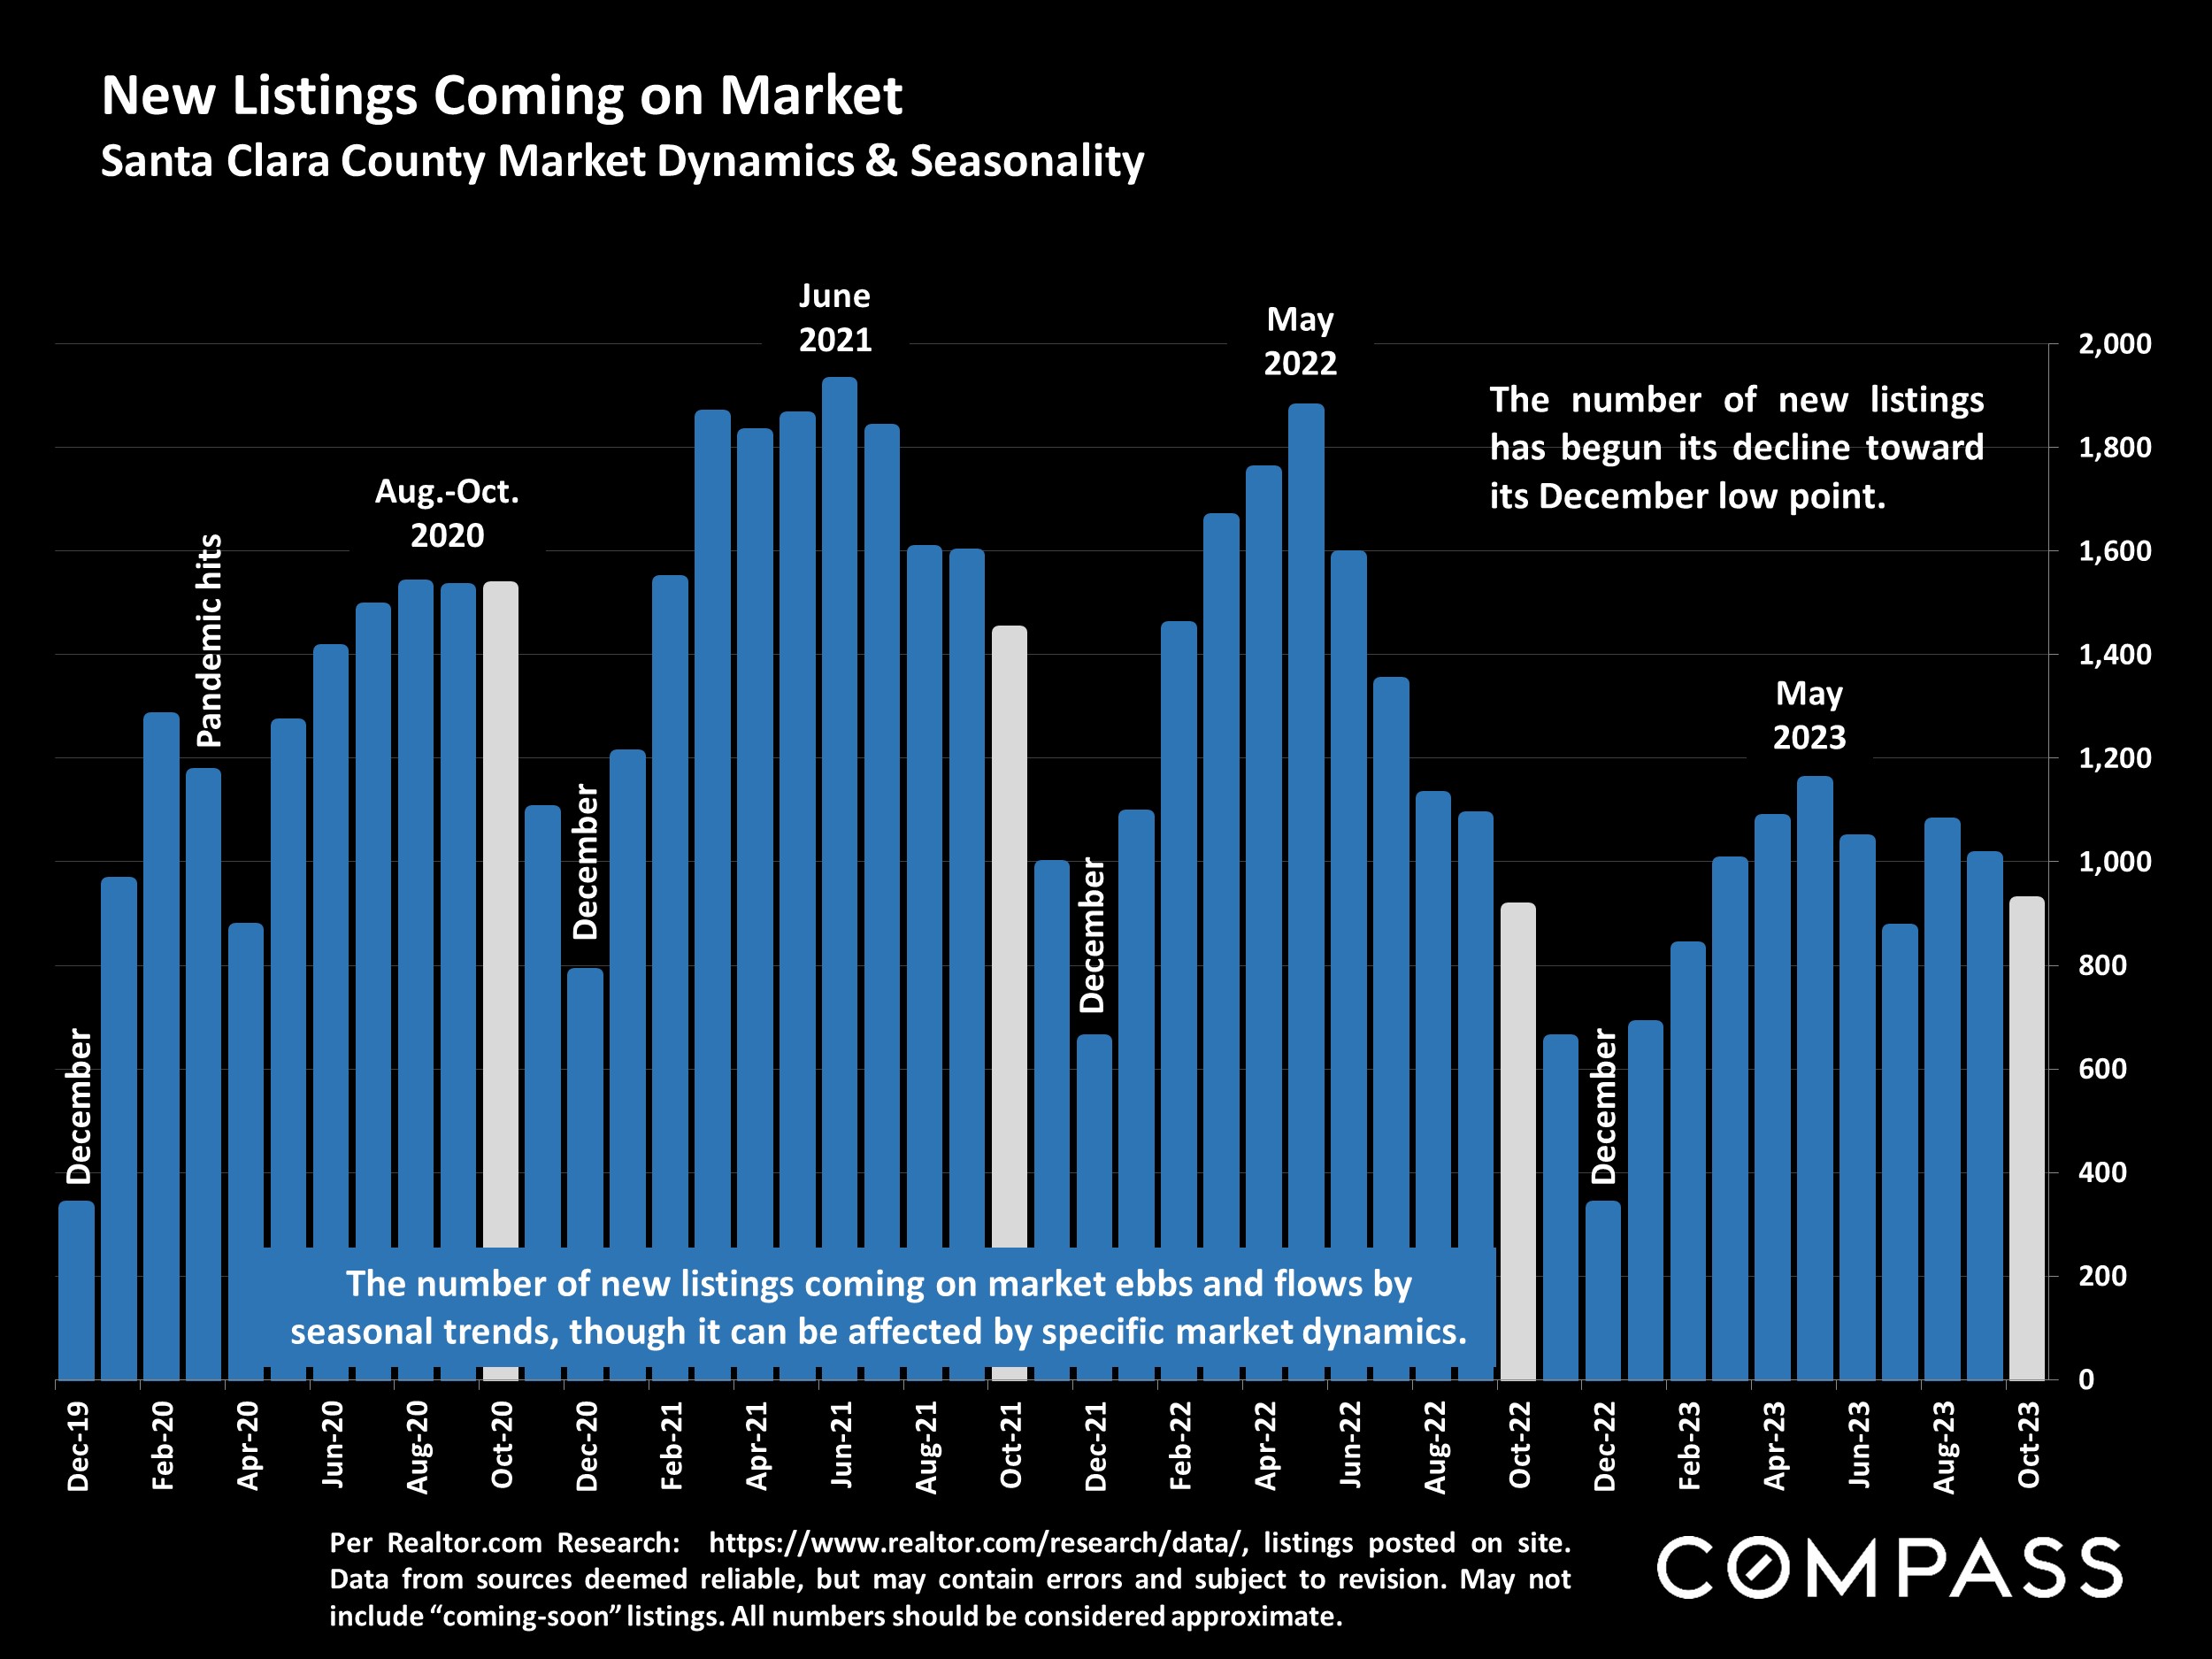
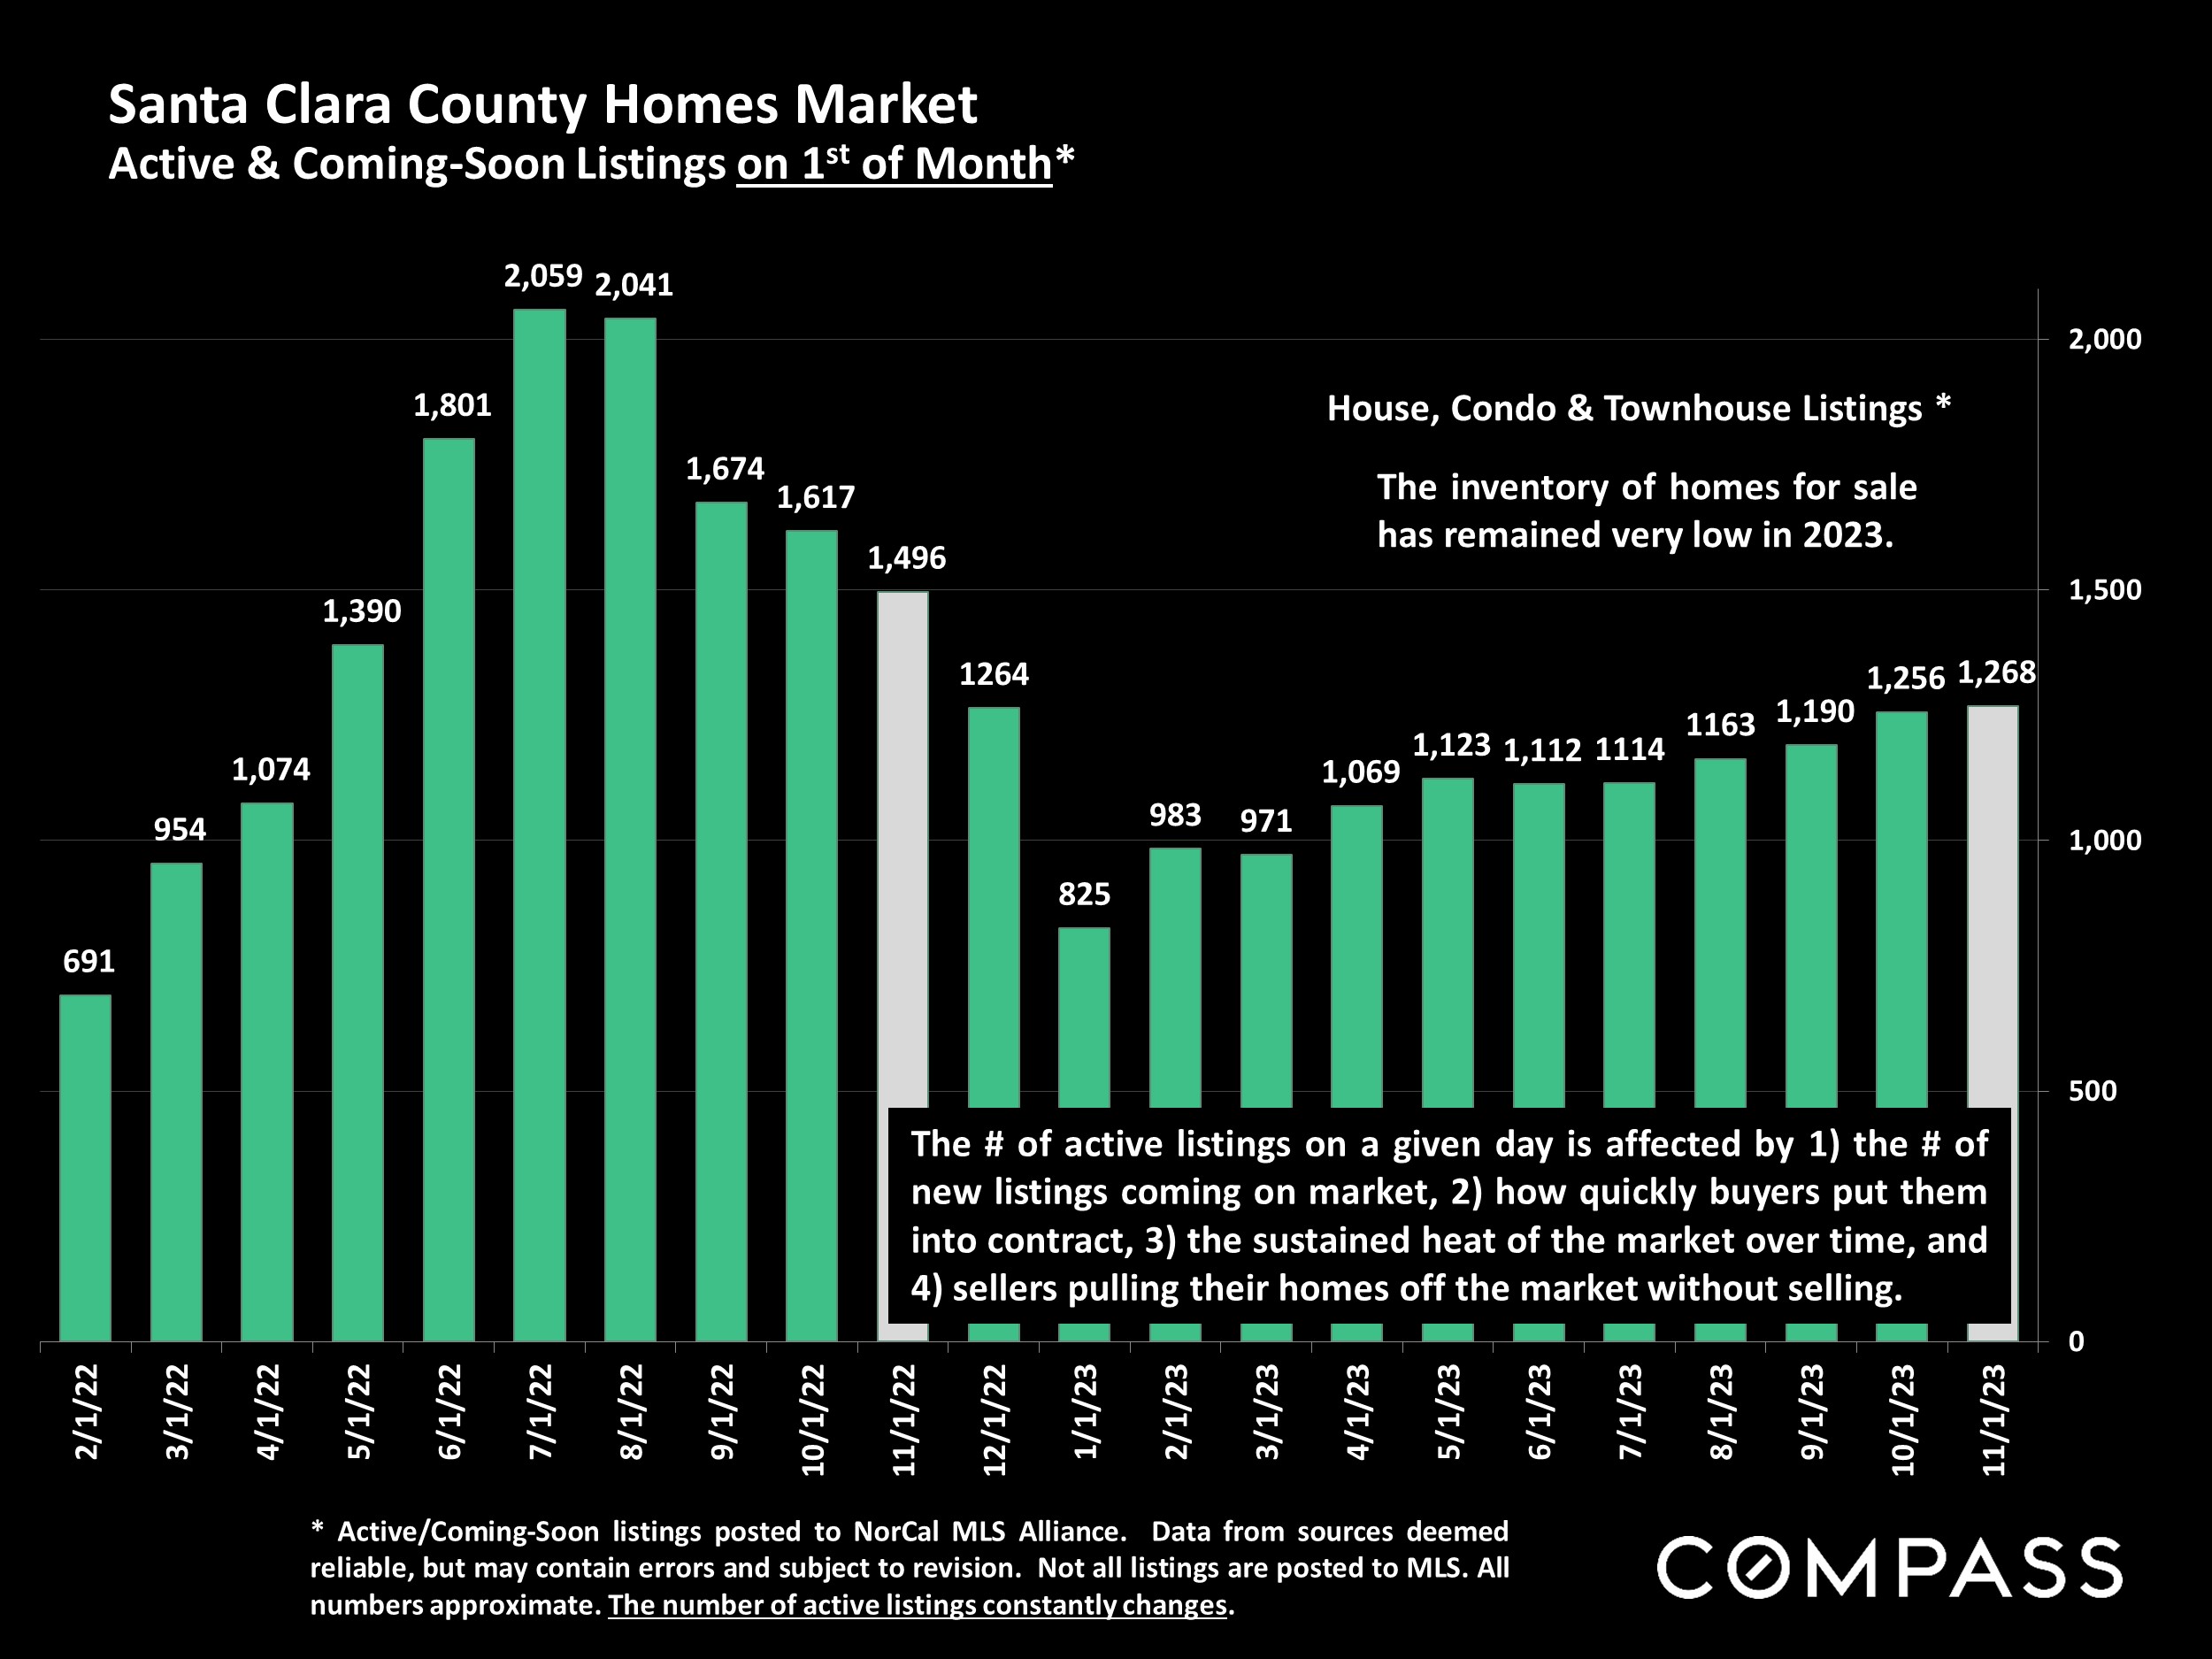
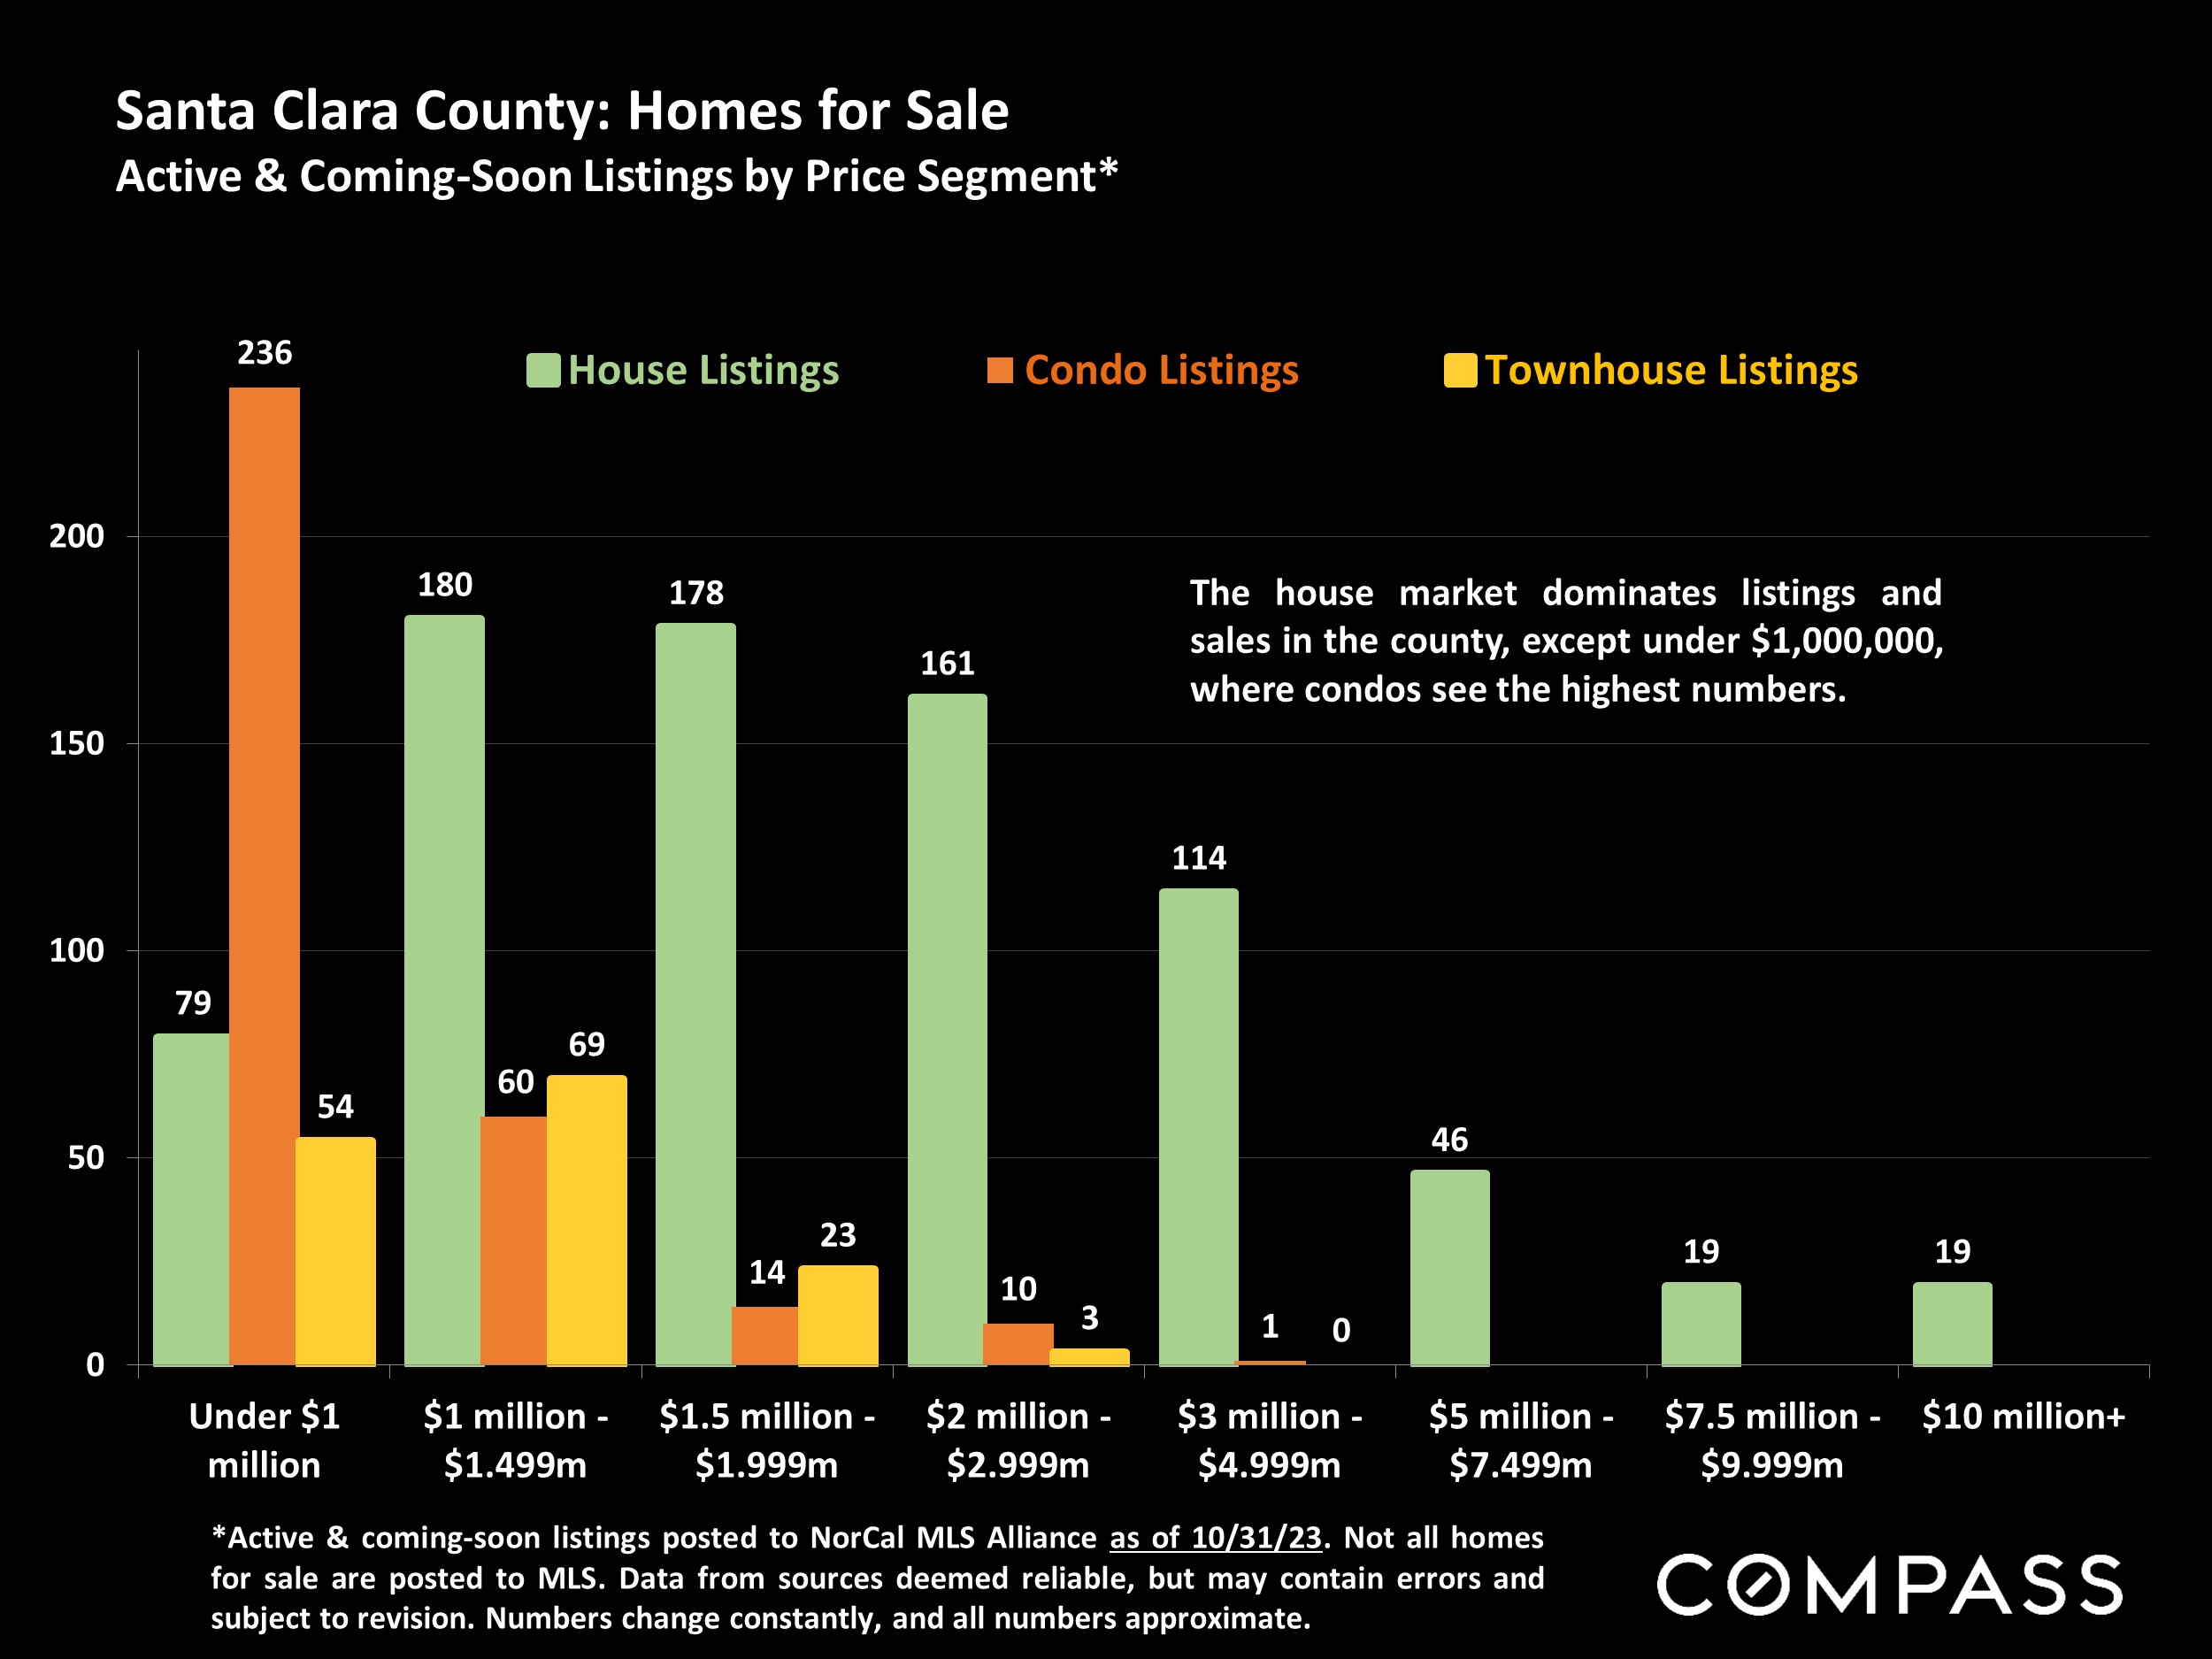
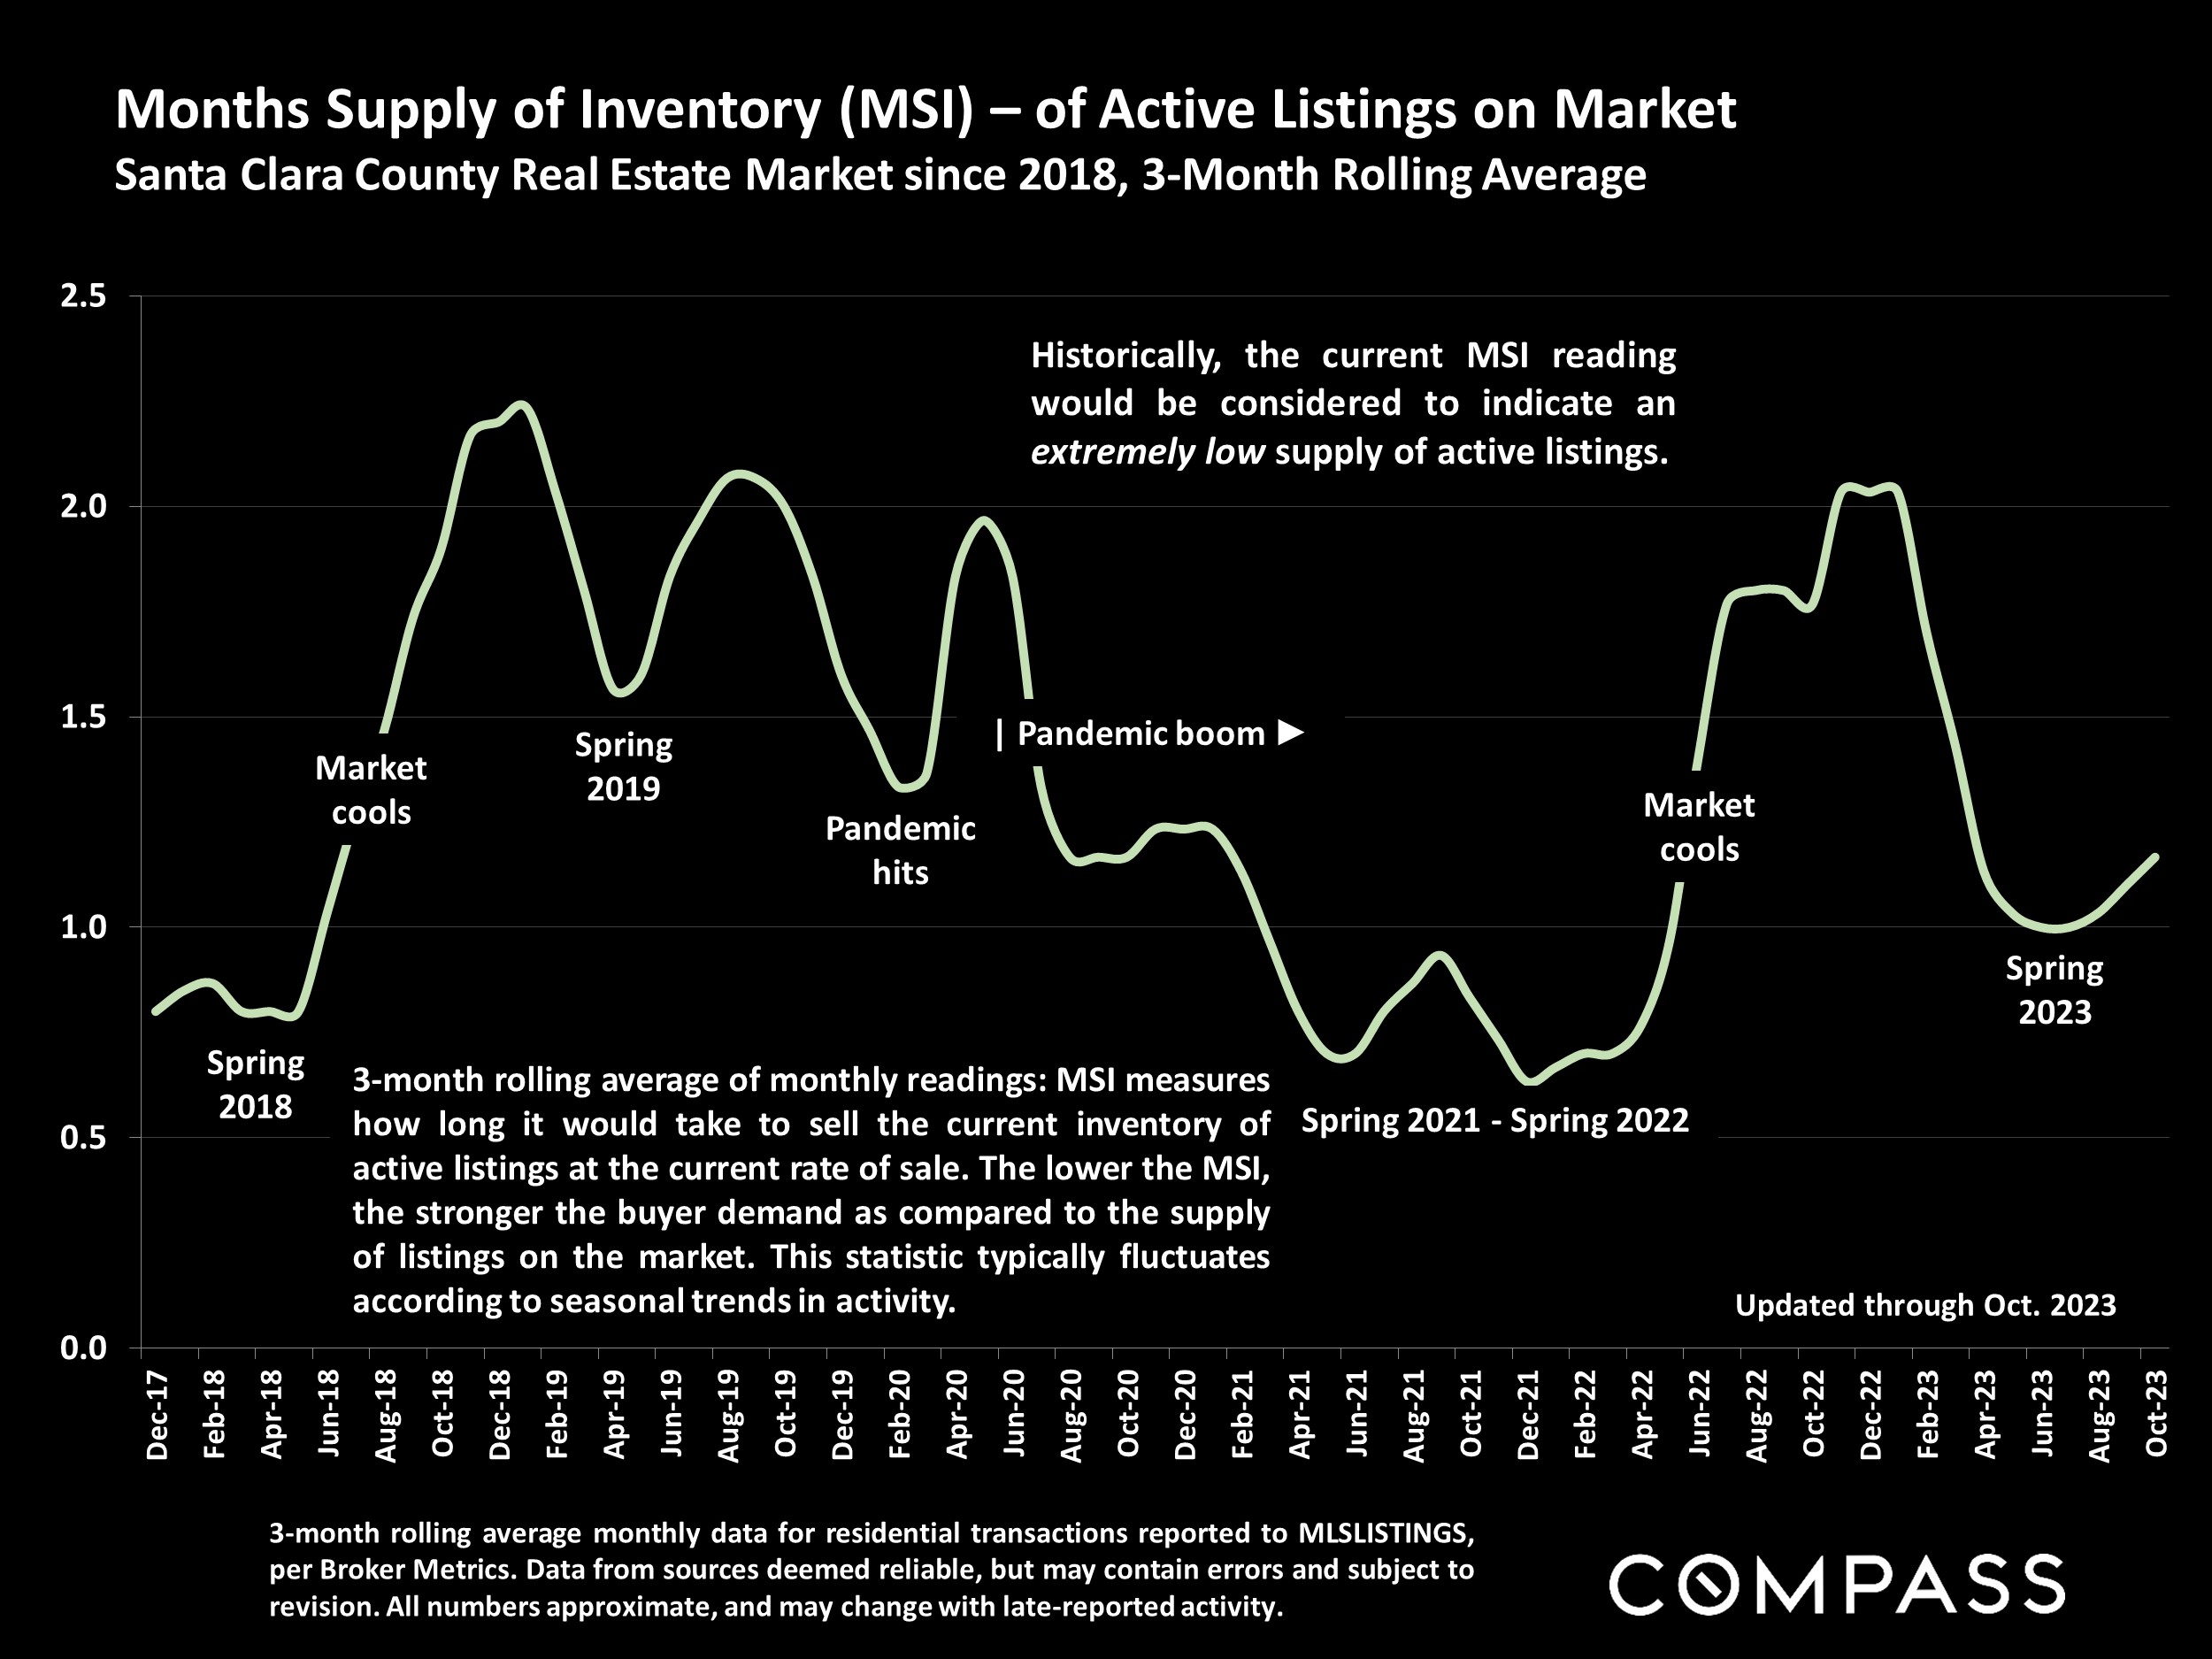
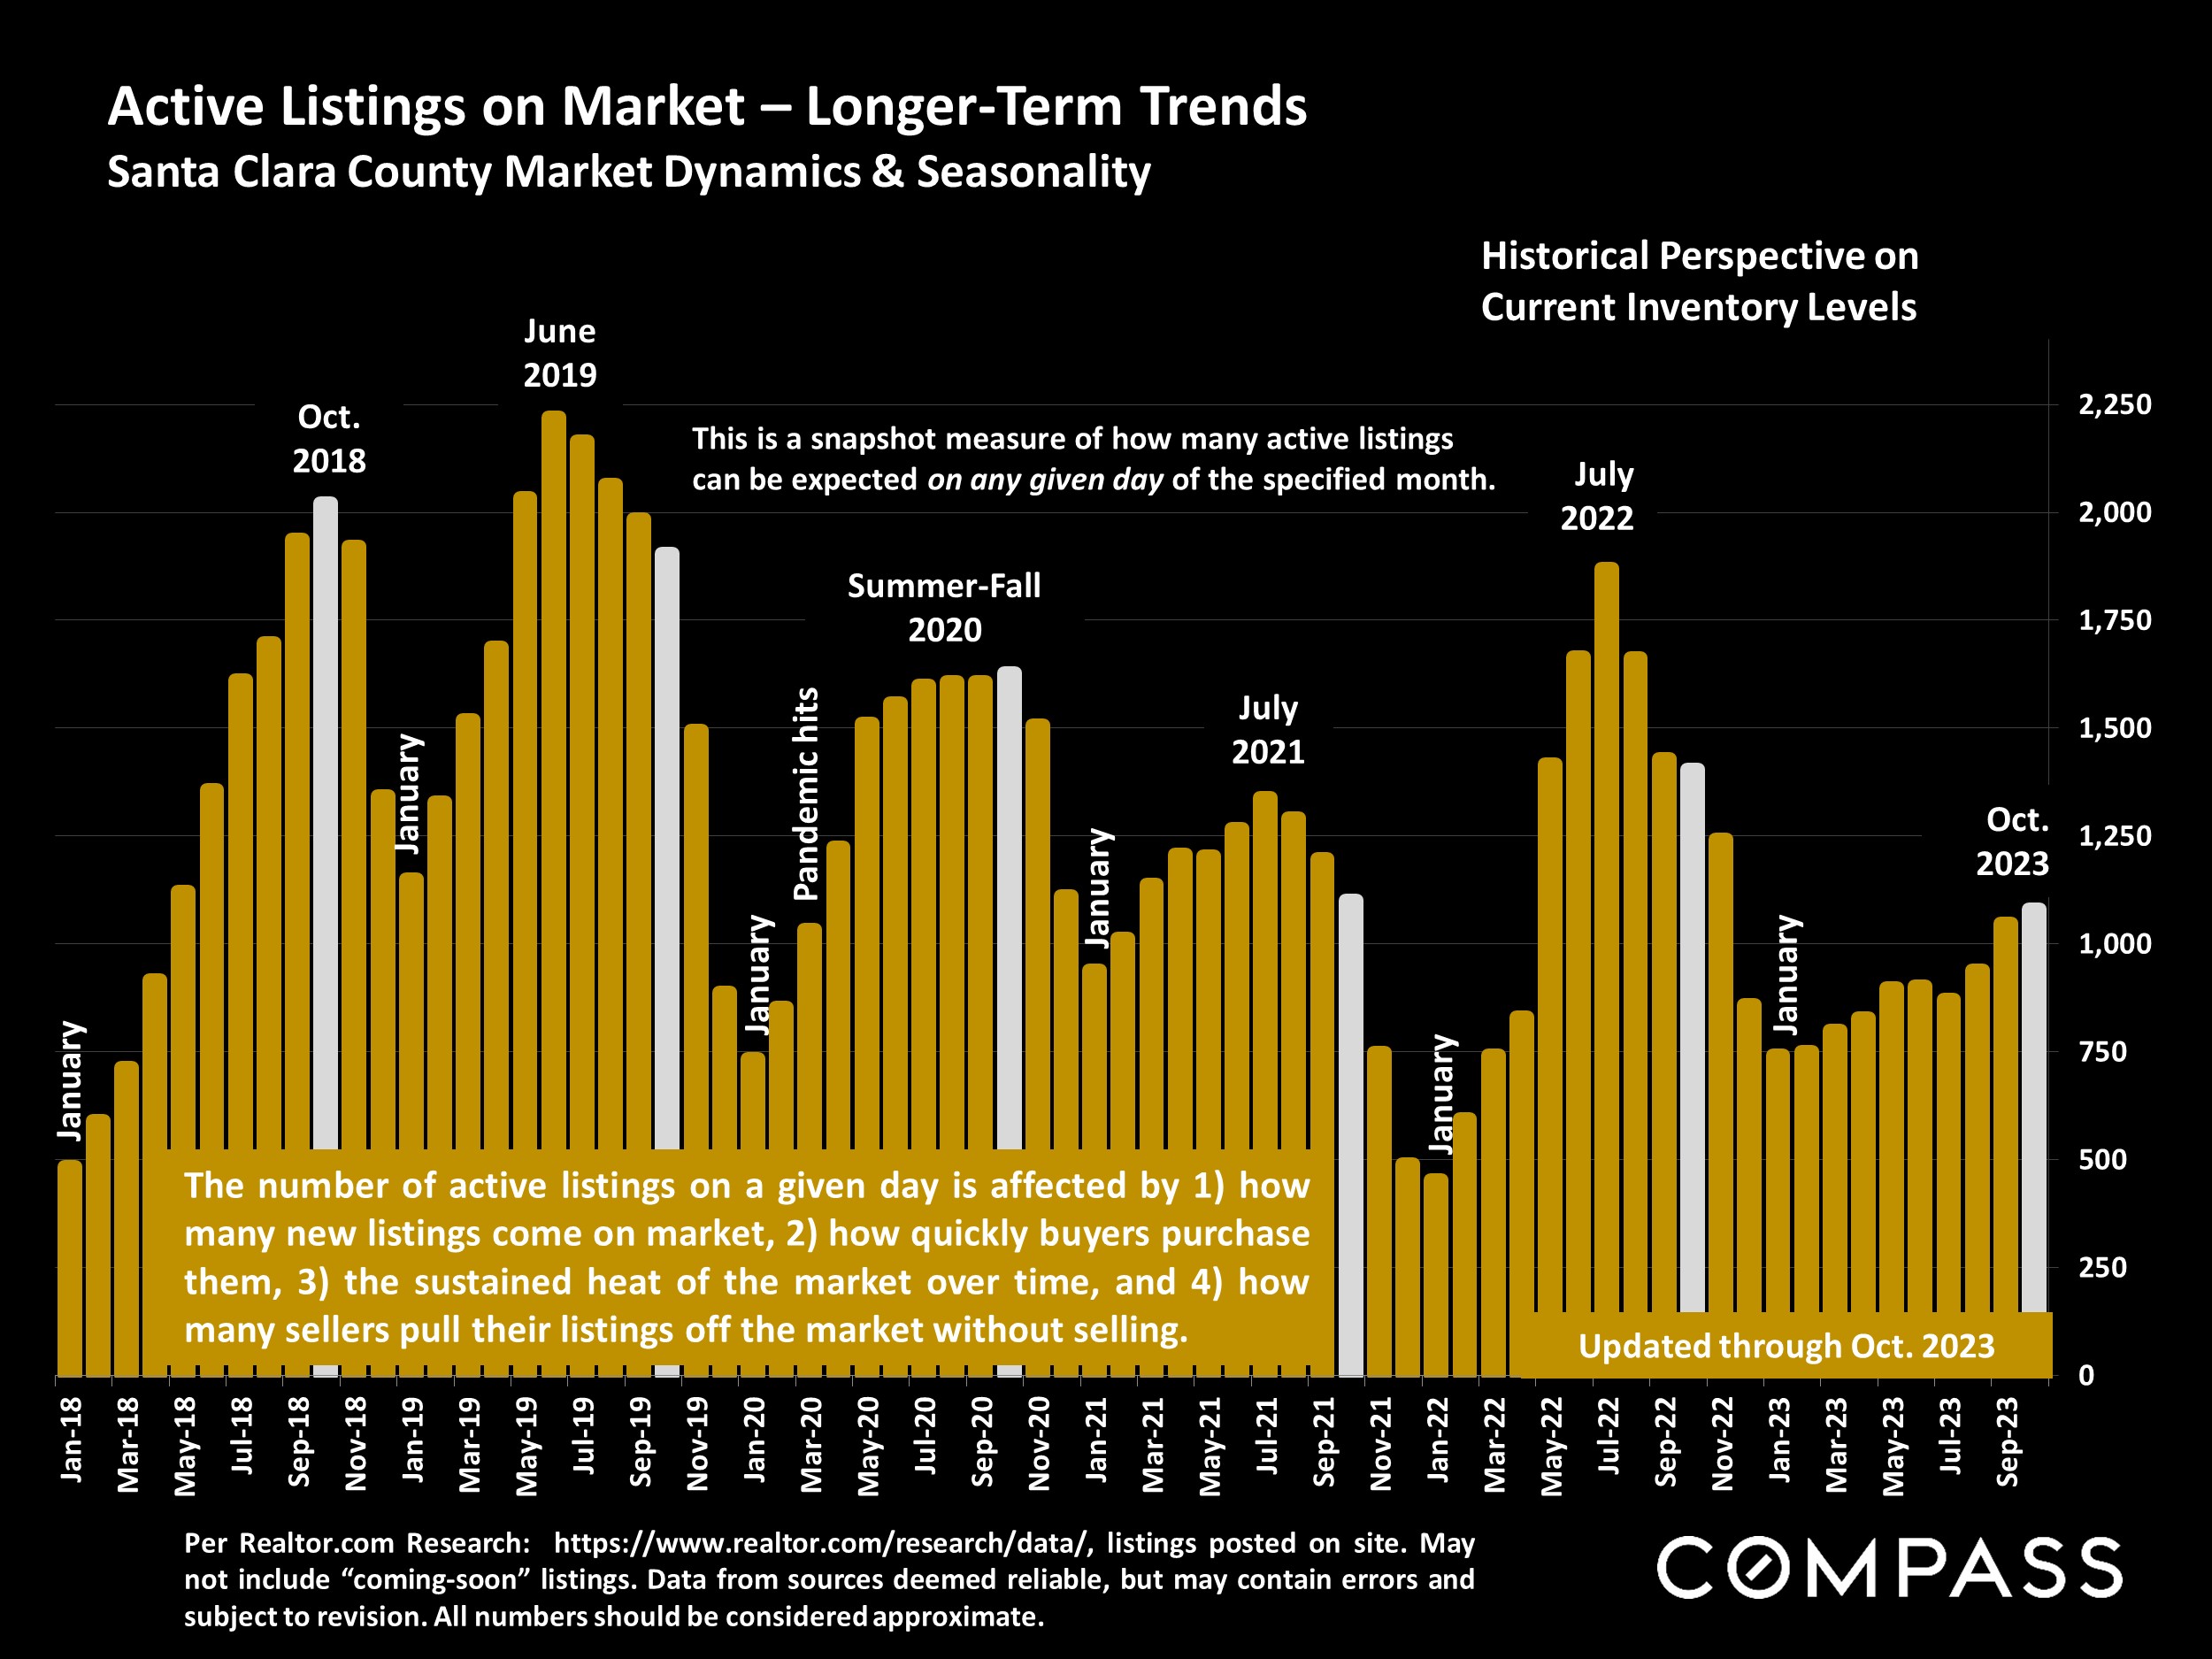
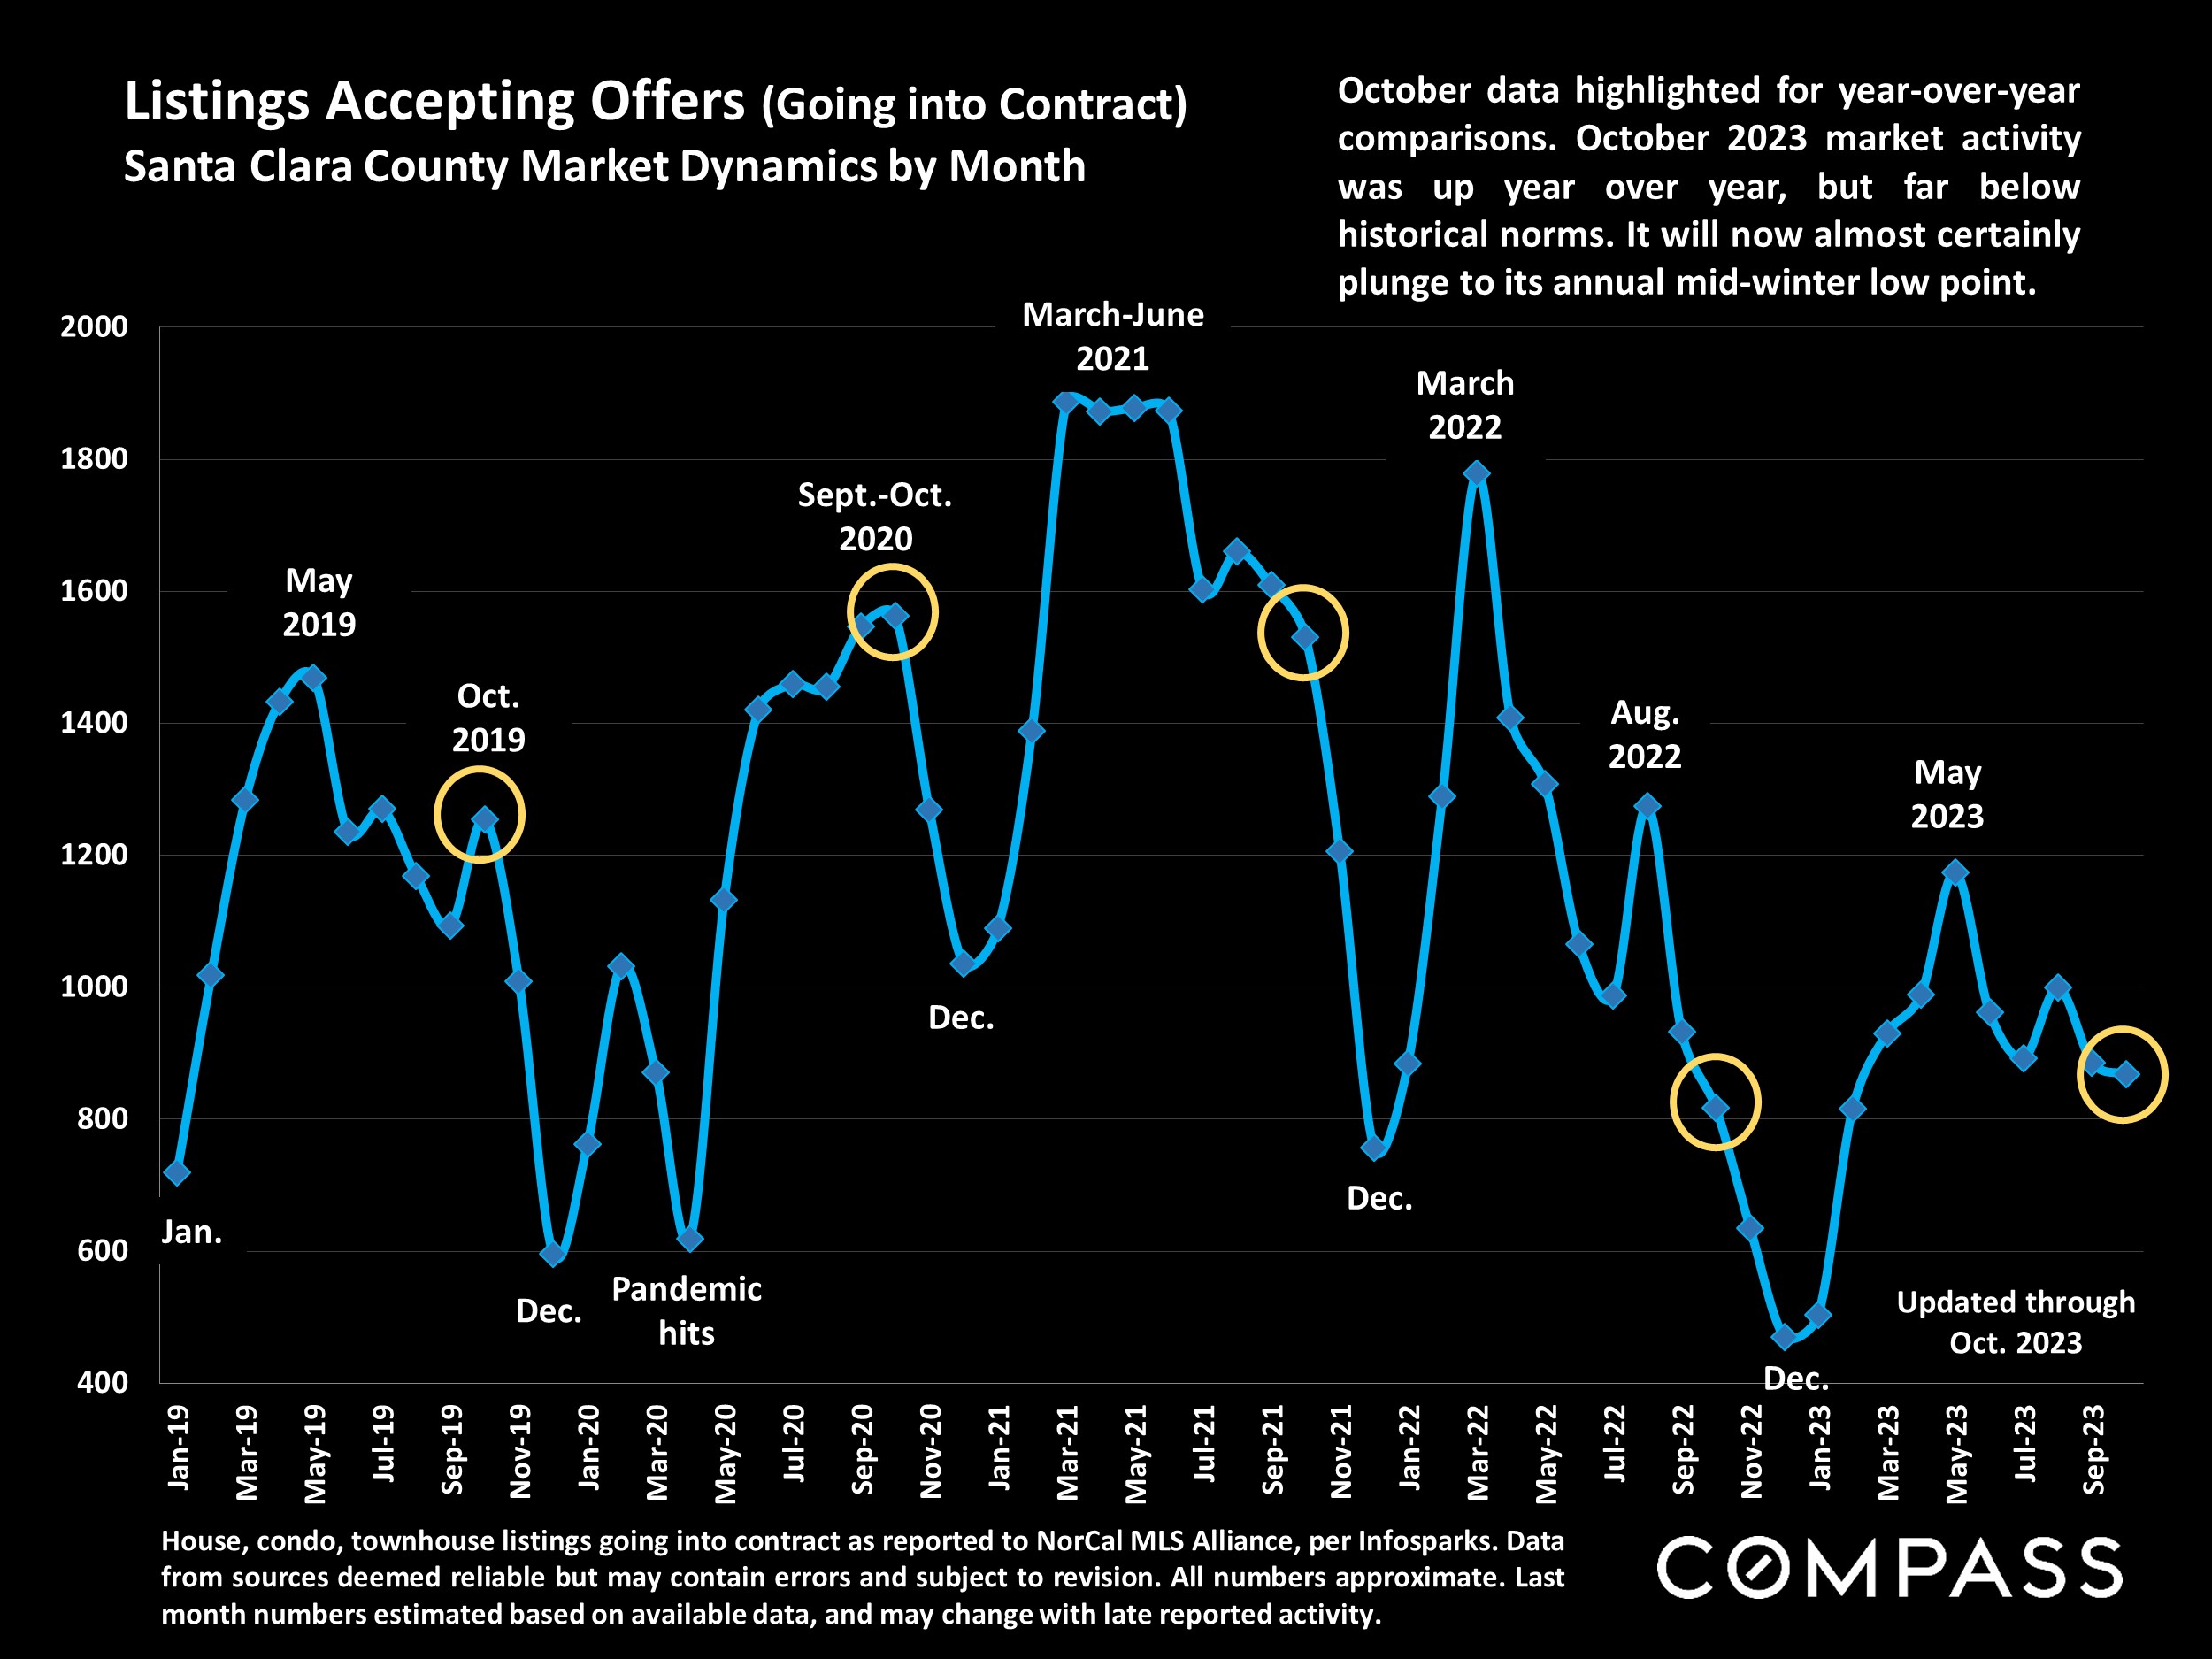
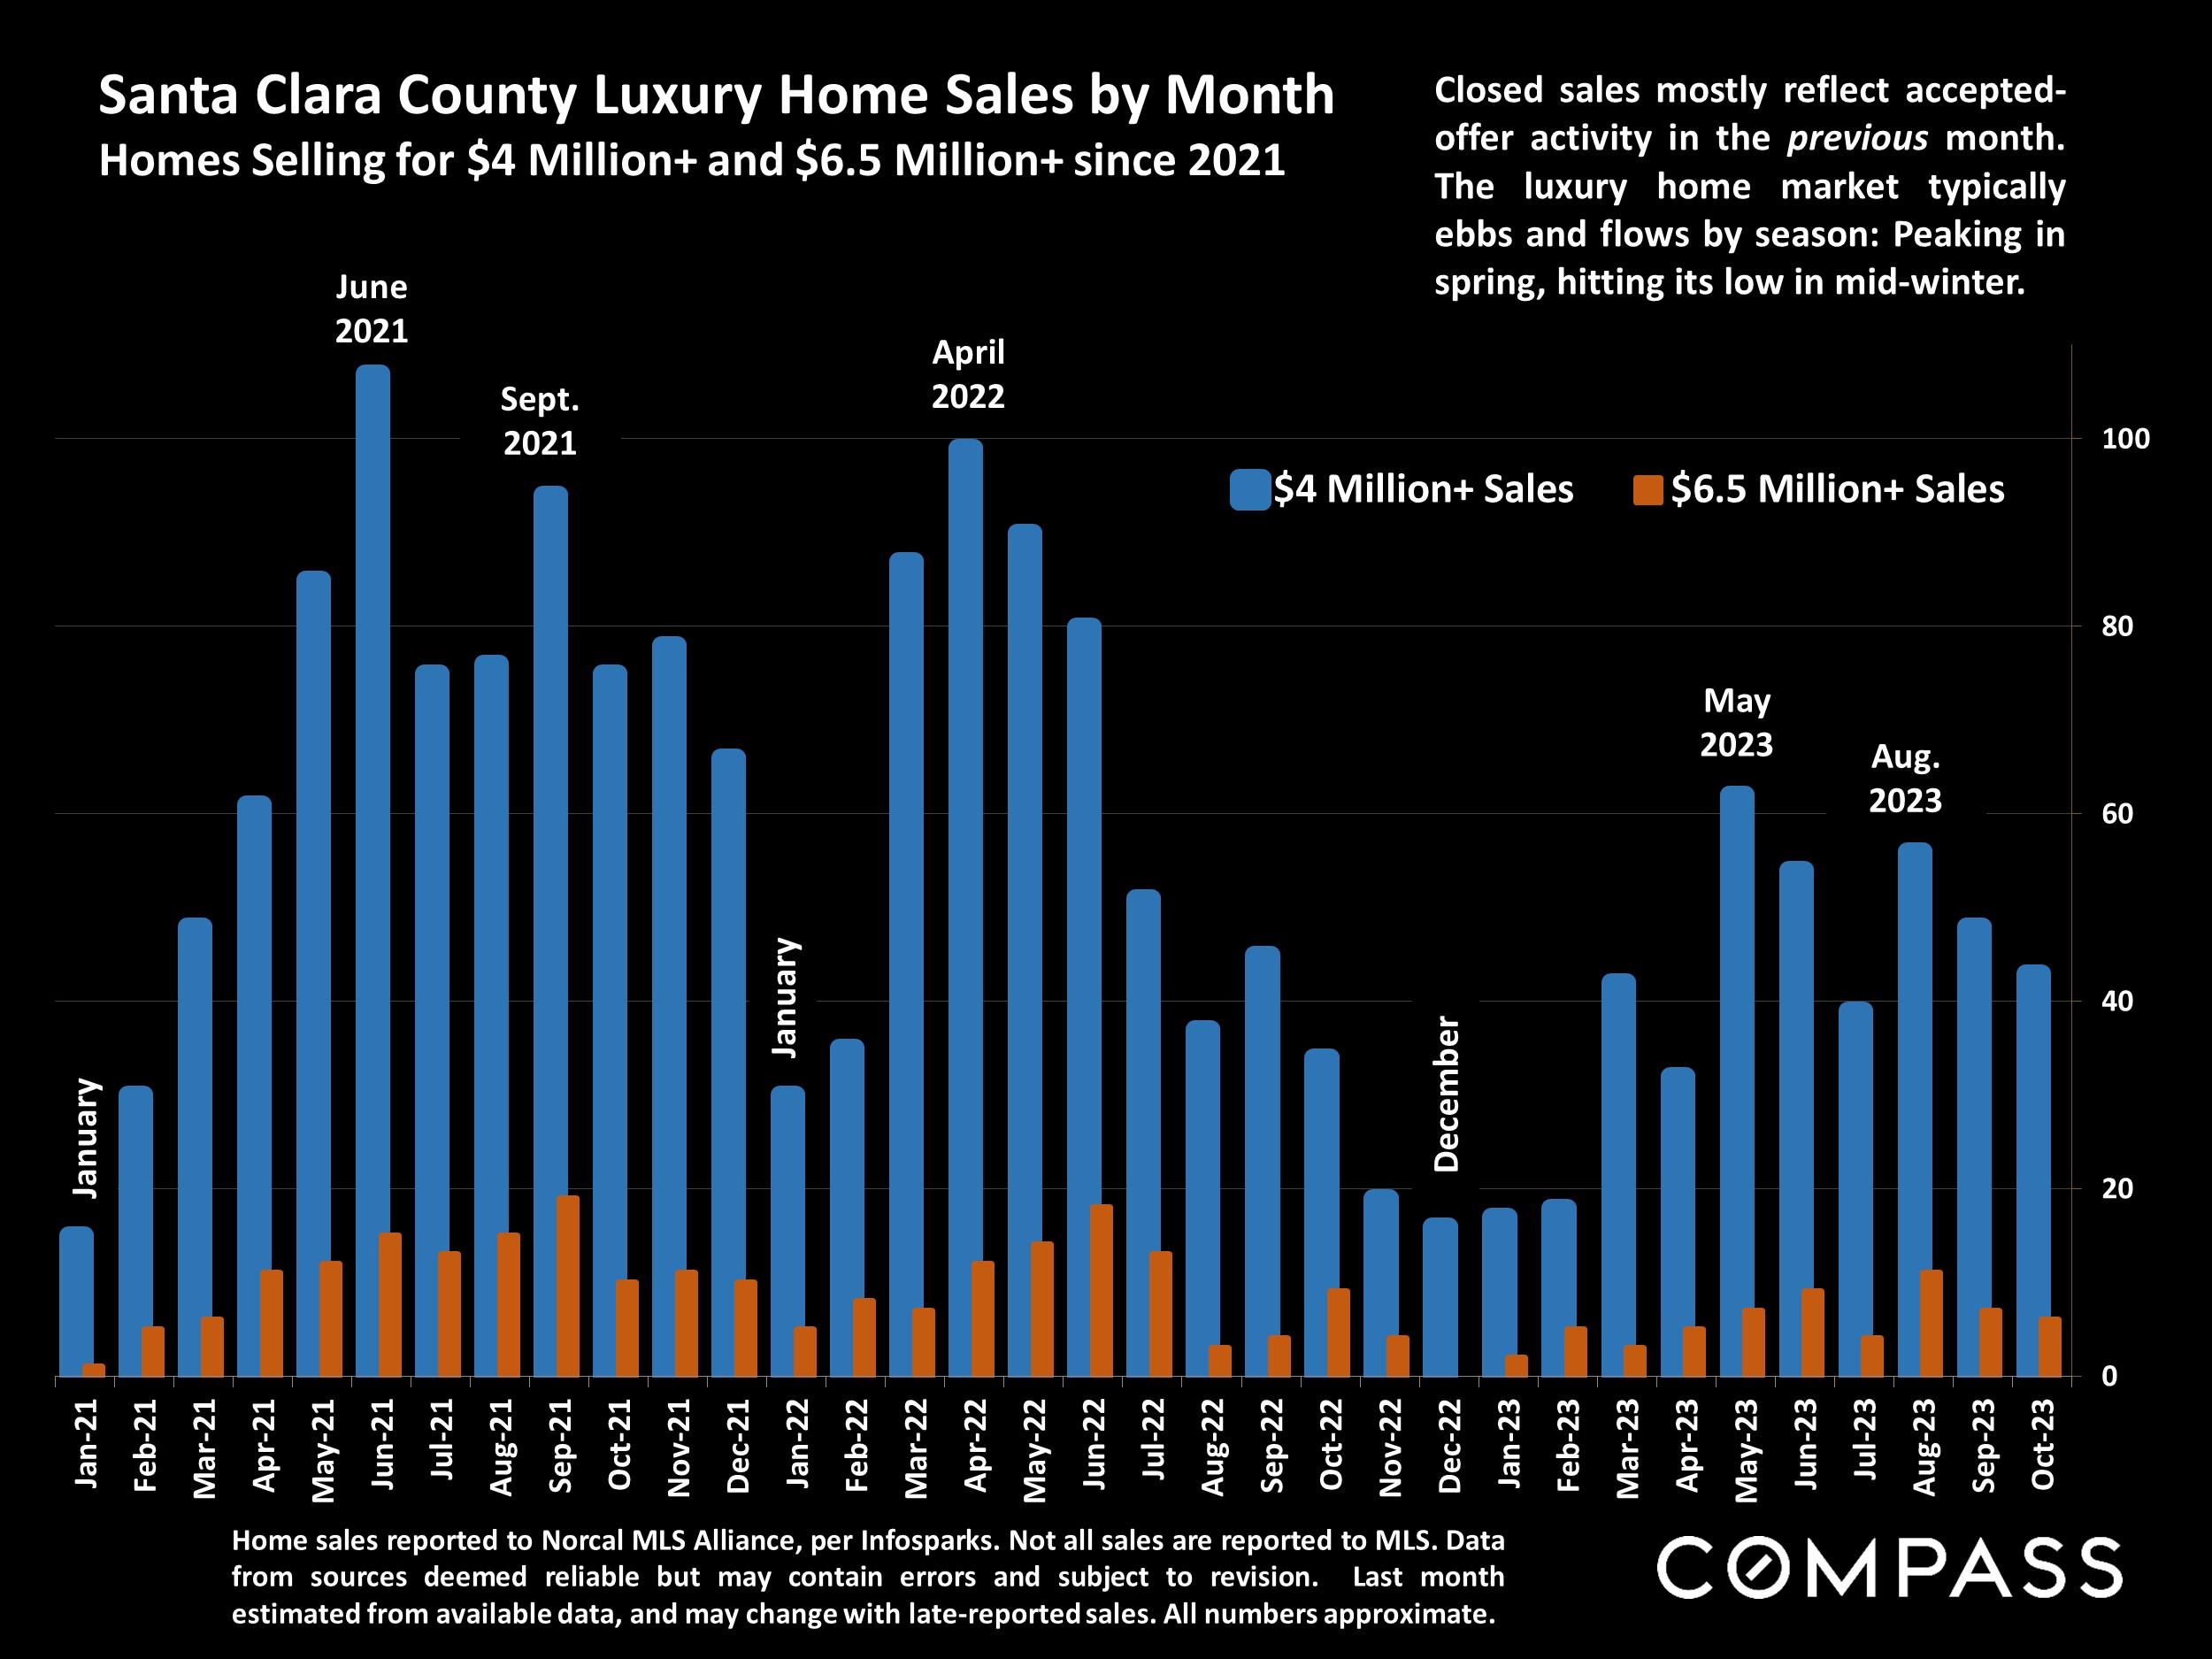
In the meantime, the Santa Clara County market is one of the strongest in the Bay Area. The Q3 median house sales price was up about 9% from Q3 2022- with smaller increases for condos and townhouses – and the supply of listings for sale remains very constrained, remaining far below historical norms. Year over year, the number of home sales in Q3 was down about 15%, mostly due to the low supply of homes available to buy, though also affected by interest rates. Luxury home sales of $4 million+ in Q3 actually increased by 9% from Q3 2022.
The CA Association of Realtors® (CAR) recently issued their initial 2024 market forecast:
“California housing market will rebound in 2024”
CAR forecast: Existing, single-family home sales will increase in 2024 by approximately 23 percent, and the CA median home price is expected to climb by 6.2%. The average 30-year, fixed mortgage interest rate is projected to decline to 6%. Housing supply will remain below normal despite a 10% to 20% increase in active listings, as market conditions and the lending environment continue to improve. [However] the percentage of CA households able to purchase a median-priced single family dwelling will remain very low by long-term standards. CAR Chief Economist, 9/20/23
Statistics are generalities, essentially summaries of widely disparate data generated by dozens, hundreds or thousands of unique, individual sales occurring within different time periods. They are best seen not as precise measurements, but as broad, comparative indicators, with reasonable margins of error. Anomalous fluctuations in statistics are not uncommon, especially in smaller, expensive market segments. Last period data should be considered estimates that may change with late-reported data. Different analytics programs sometimes define statistics – such as “active listings,” “days on market,” and “months supply of inventory” – differently: what is most meaningful are not specific calculations but the trends they illustrate. Most listing and sales data derives from the local or regional multi-listing service (MLS) of the area specified in the analysis, but not all listings or sales are reported to MLS and these won’t be reflected in the data. “Homes” signifies real-property, single-household housing units: houses, condos, co-ops, townhouses, duets and TICs (but not mobile homes), as applicable to each market. City/town names refer specifically to the named cities and towns, unless otherwise delineated. Multi-county metro areas will be specified as such. Data from sources deemed reliable, but may contain errors and subject to revision. All numbers to be considered approximate.
Many aspects of value cannot be adequately reflected in median and average statistics: curb appeal, age, condition, amenities, views, lot size, quality of outdoor space, “bonus” rooms, additional parking, quality of location within the neighborhood, and so on. How any of these statistics apply to any particular home is unknown without a specific comparative market analysis. Median Sales Price is that price at which half the properties sold for more and half for less. It may be affected by seasonality, “unusual” events, or changes in inventory and buying trends, as well as by changes in fair market value. The median sales price for an area will often conceal an enormous variety of sales prices in the underlying individual sales.
Dollar per Square Foot is based upon the home’s interior living space and does not include garages, unfinished attics and basements, rooms built without permit, patios, decks or yards (though all those can add value to a home). These figures are usually derived from appraisals or tax records, but are sometimes unreliable (especially for older homes) or unreported altogether. The calculation can only be made on those home sales that reported square footage.
Photo use under the Creative Commons License: https://creativecommons.org/licenses/by-sa/2.0/
Compass is a real estate broker licensed by the State of California, DRE 01527235. Equal Housing Opportunity. This report has been prepared solely for information purposes. The information herein is based on or derived from information generally available to the public and/or from sources believed to be reliable. No representation or warranty can be given with respect to the accuracy or completeness of the information. Compass disclaims any and all liability relating to this report, including without limitation any express or implied representations or warranties for statements contained in, and omissions from, the report. Nothing contained herein is intended to be or should be read as any regulatory, legal, tax, accounting or other advice and Compass does not provide such advice. All opinions are subject to change without notice. Compass makes no representation regarding the accuracy of any statements regarding any references to the laws, statutes or regulations of any state are those of the author(s). Past performance is no guarantee of future results.
“The surprisingly quick recovery [of the housing market] suggests that the residential real-estate downturn is turning out to be shorter and shallower than many housing economists expected after mortgage rates soared last year…There still aren’t enough homes for sale to meet demand.” The Wall Street Journal, “The Fall in Home Prices May Already Be Over,” 9/8/23
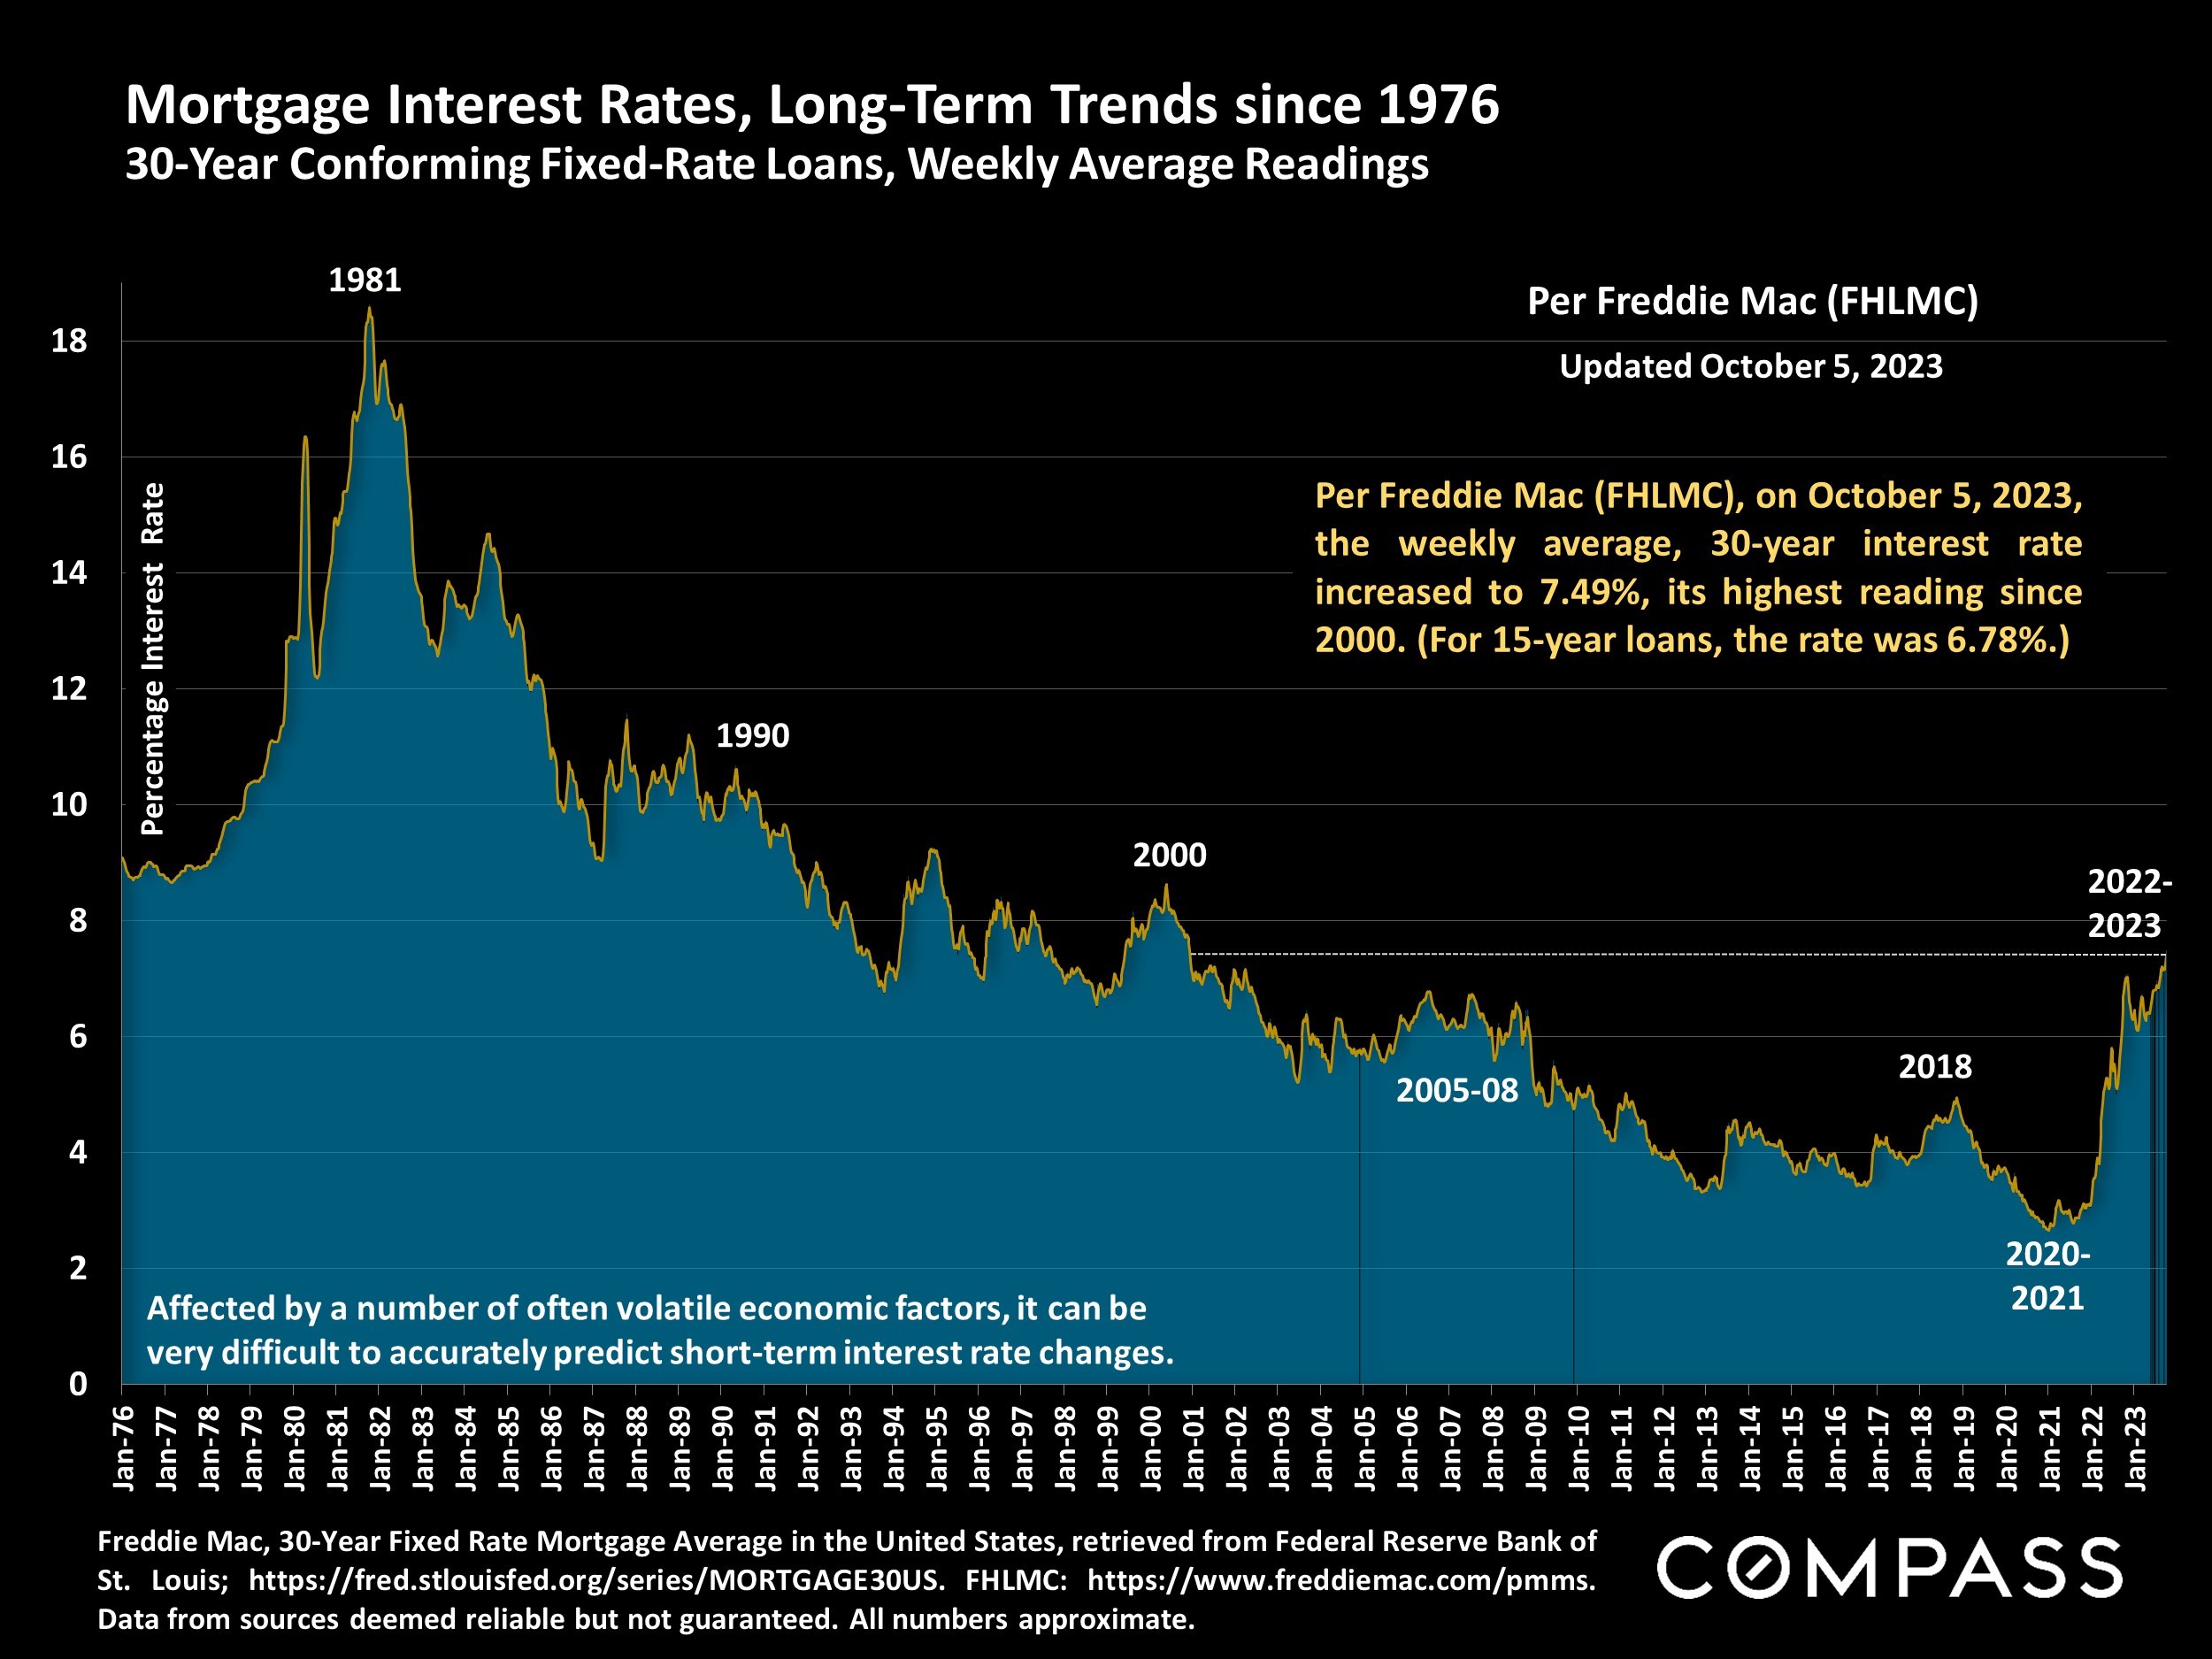
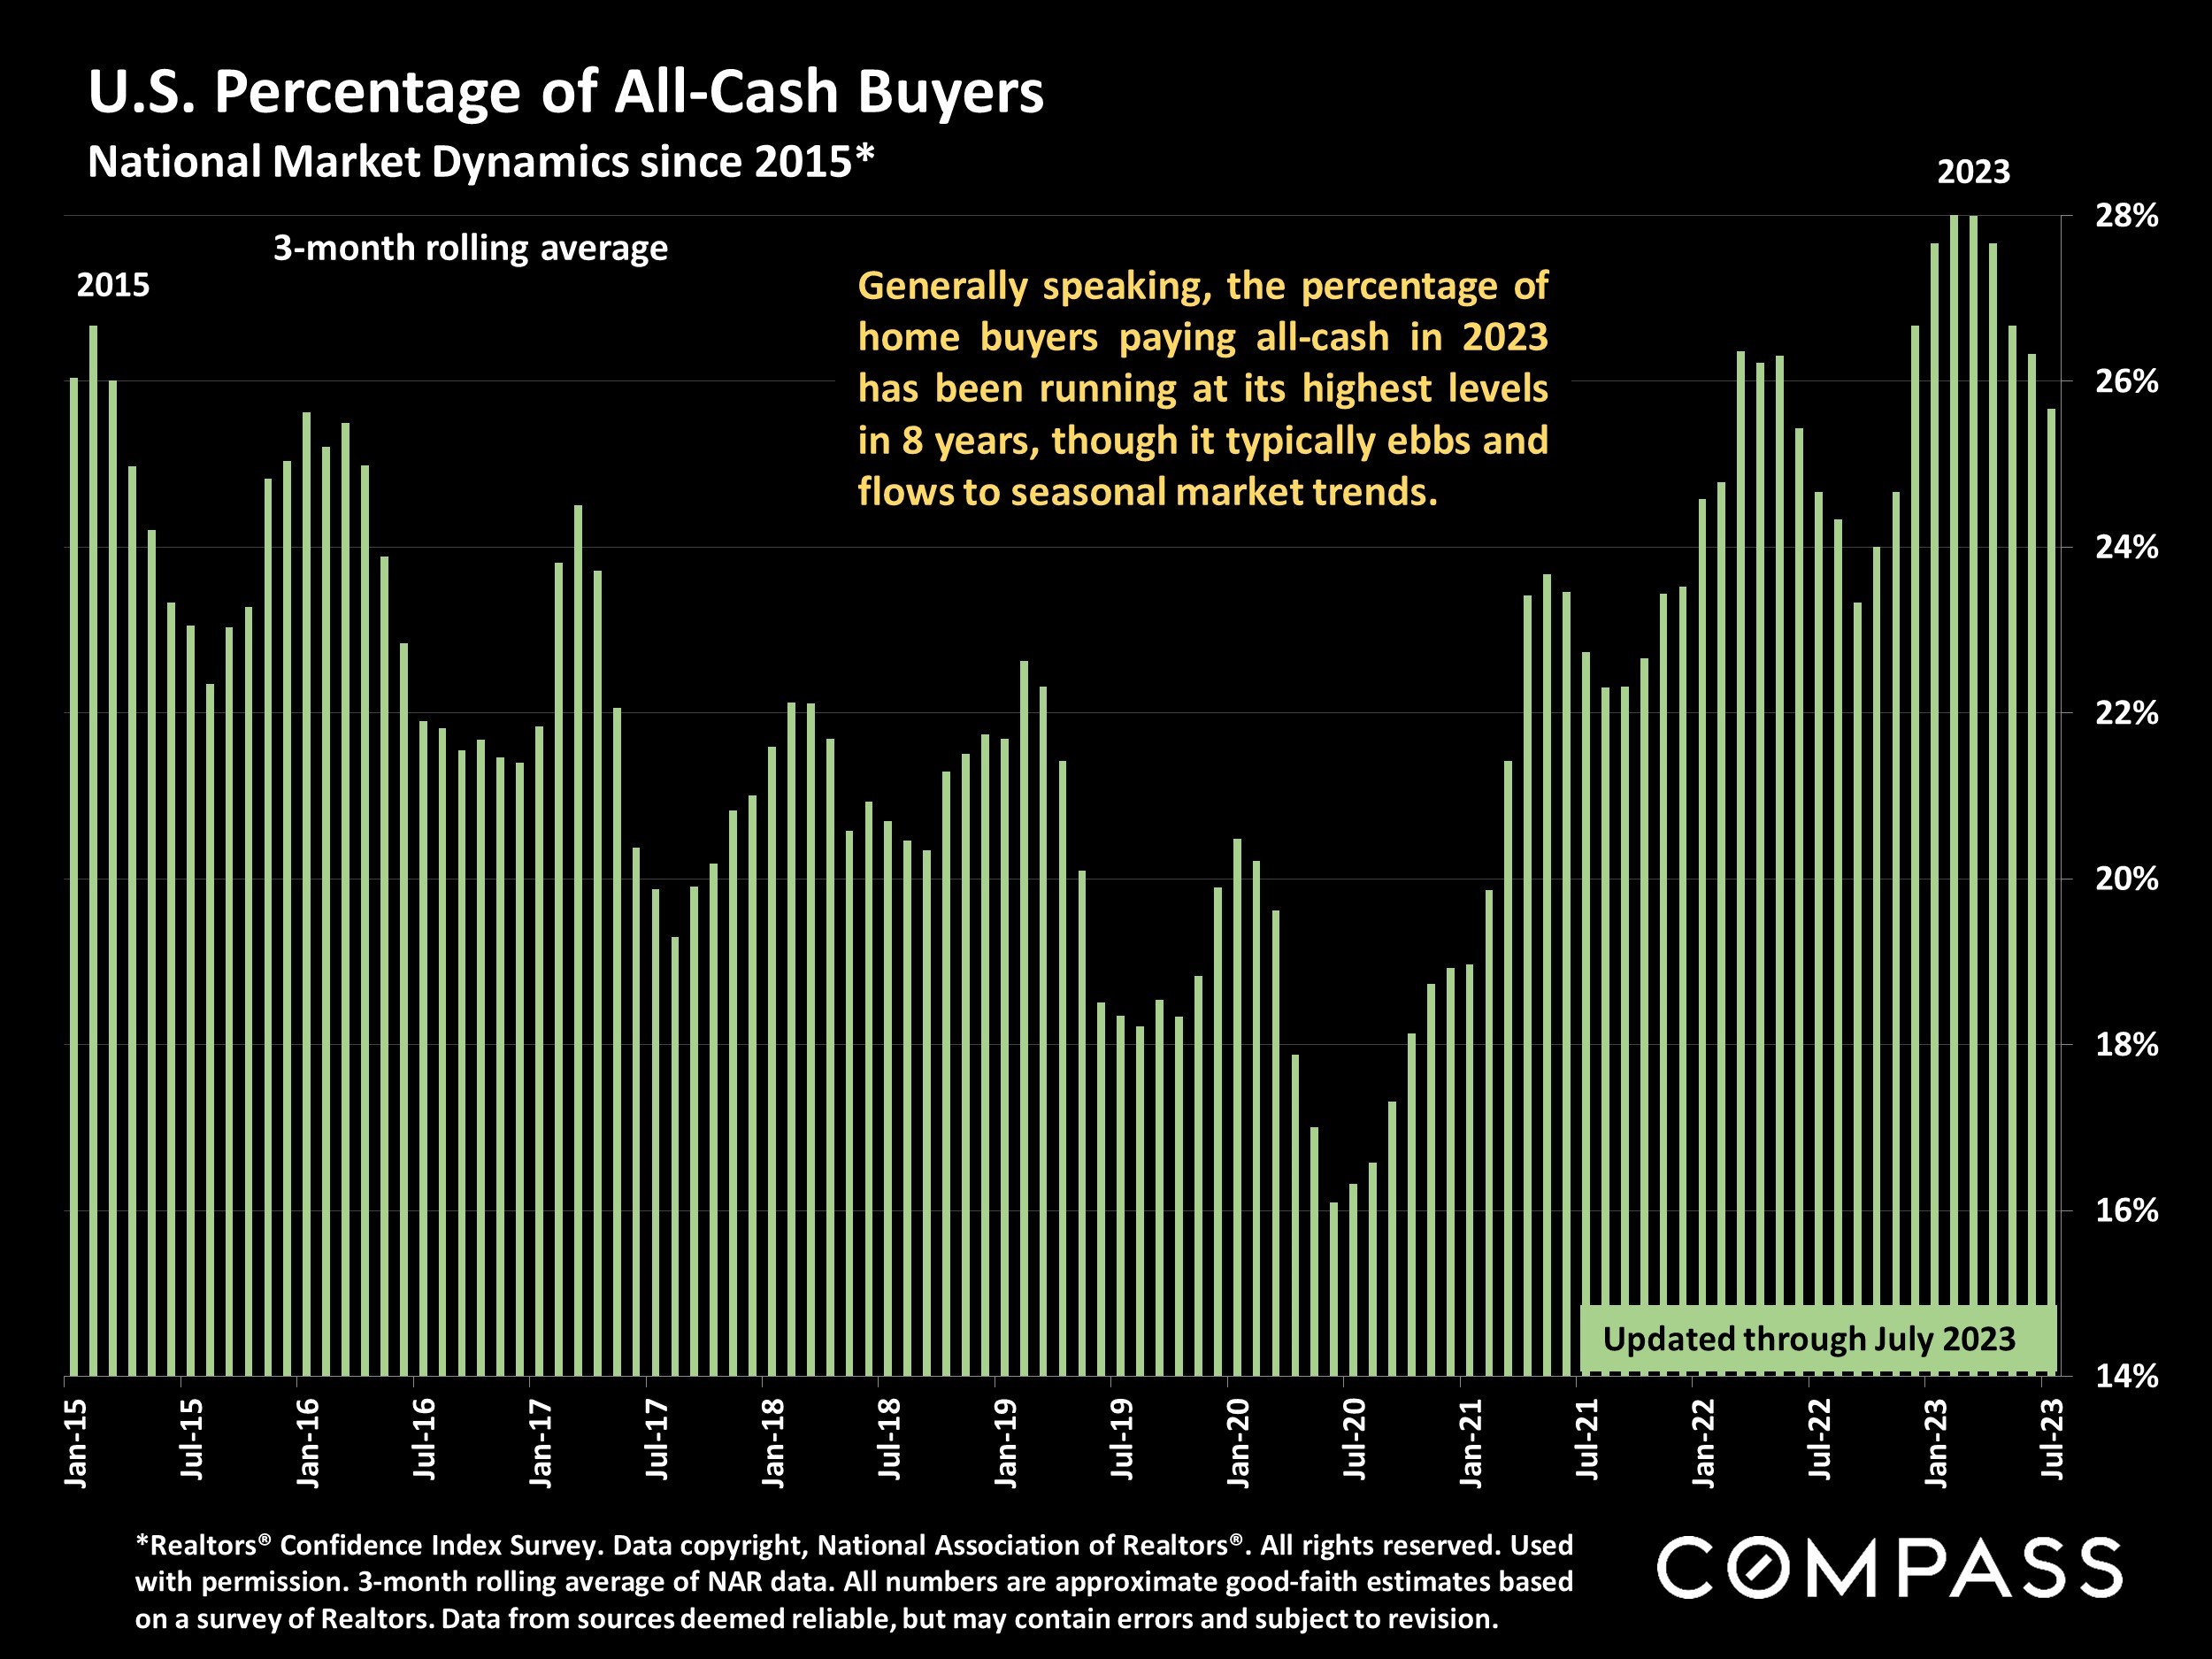
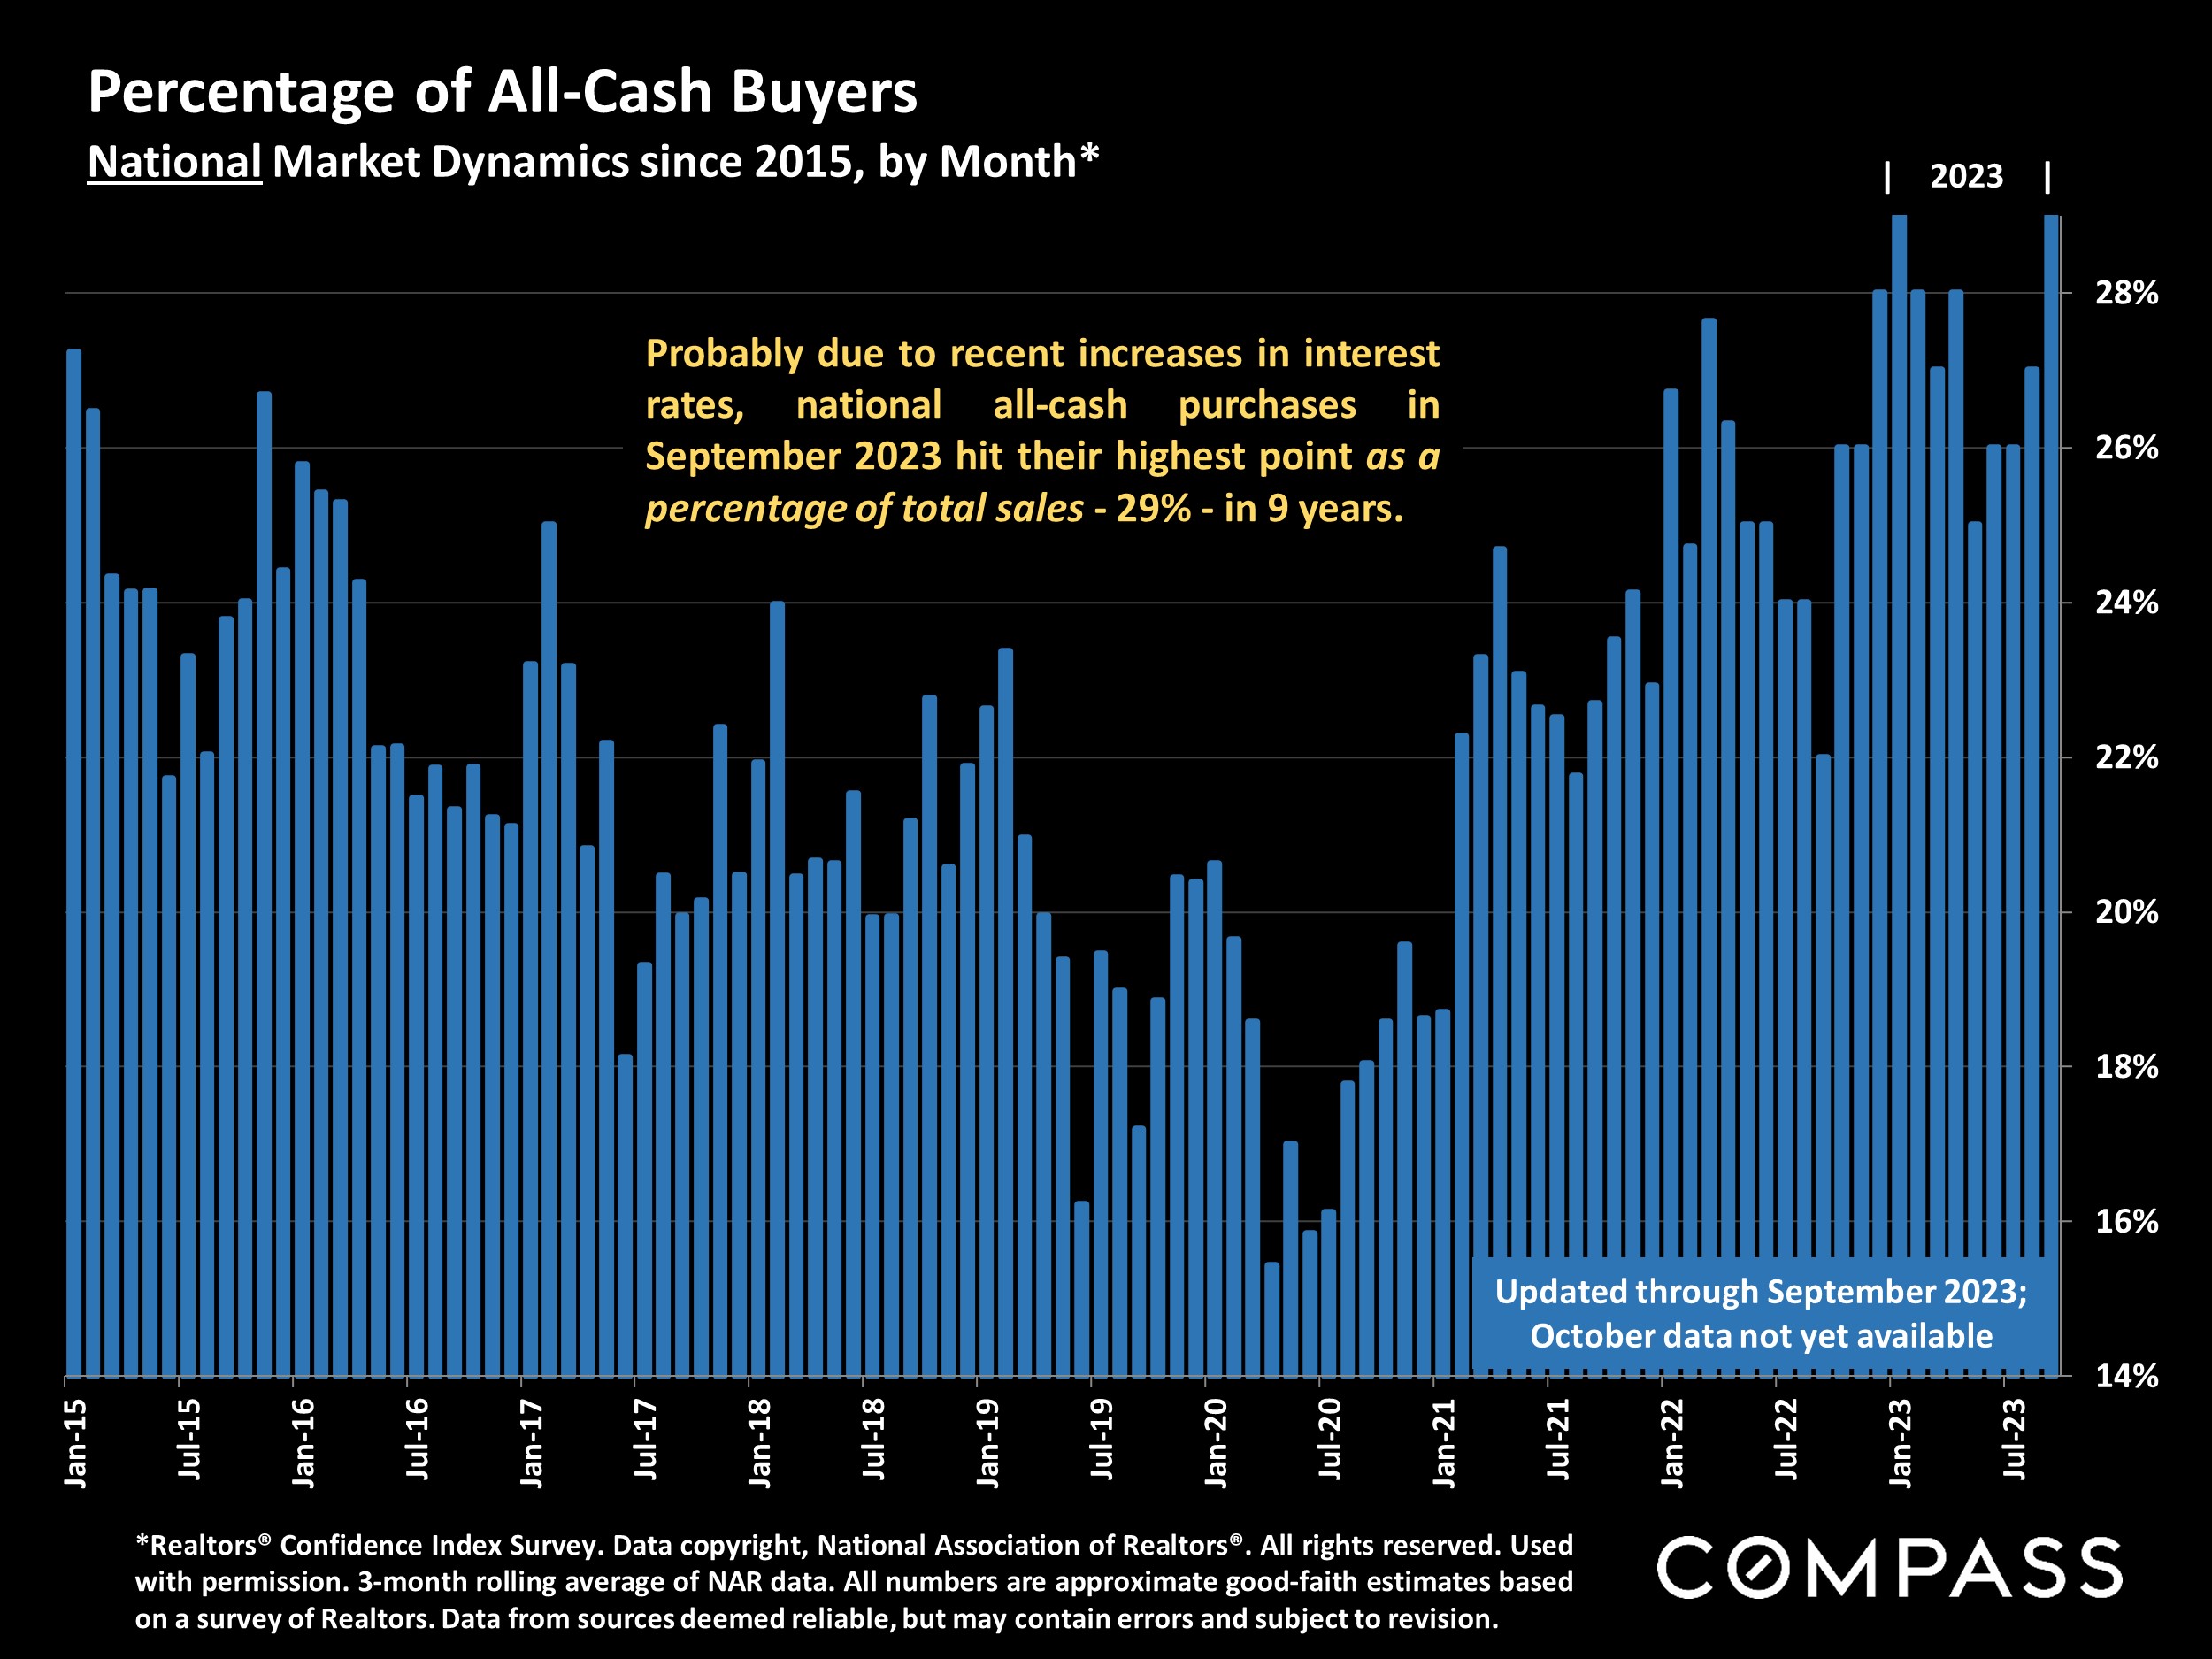
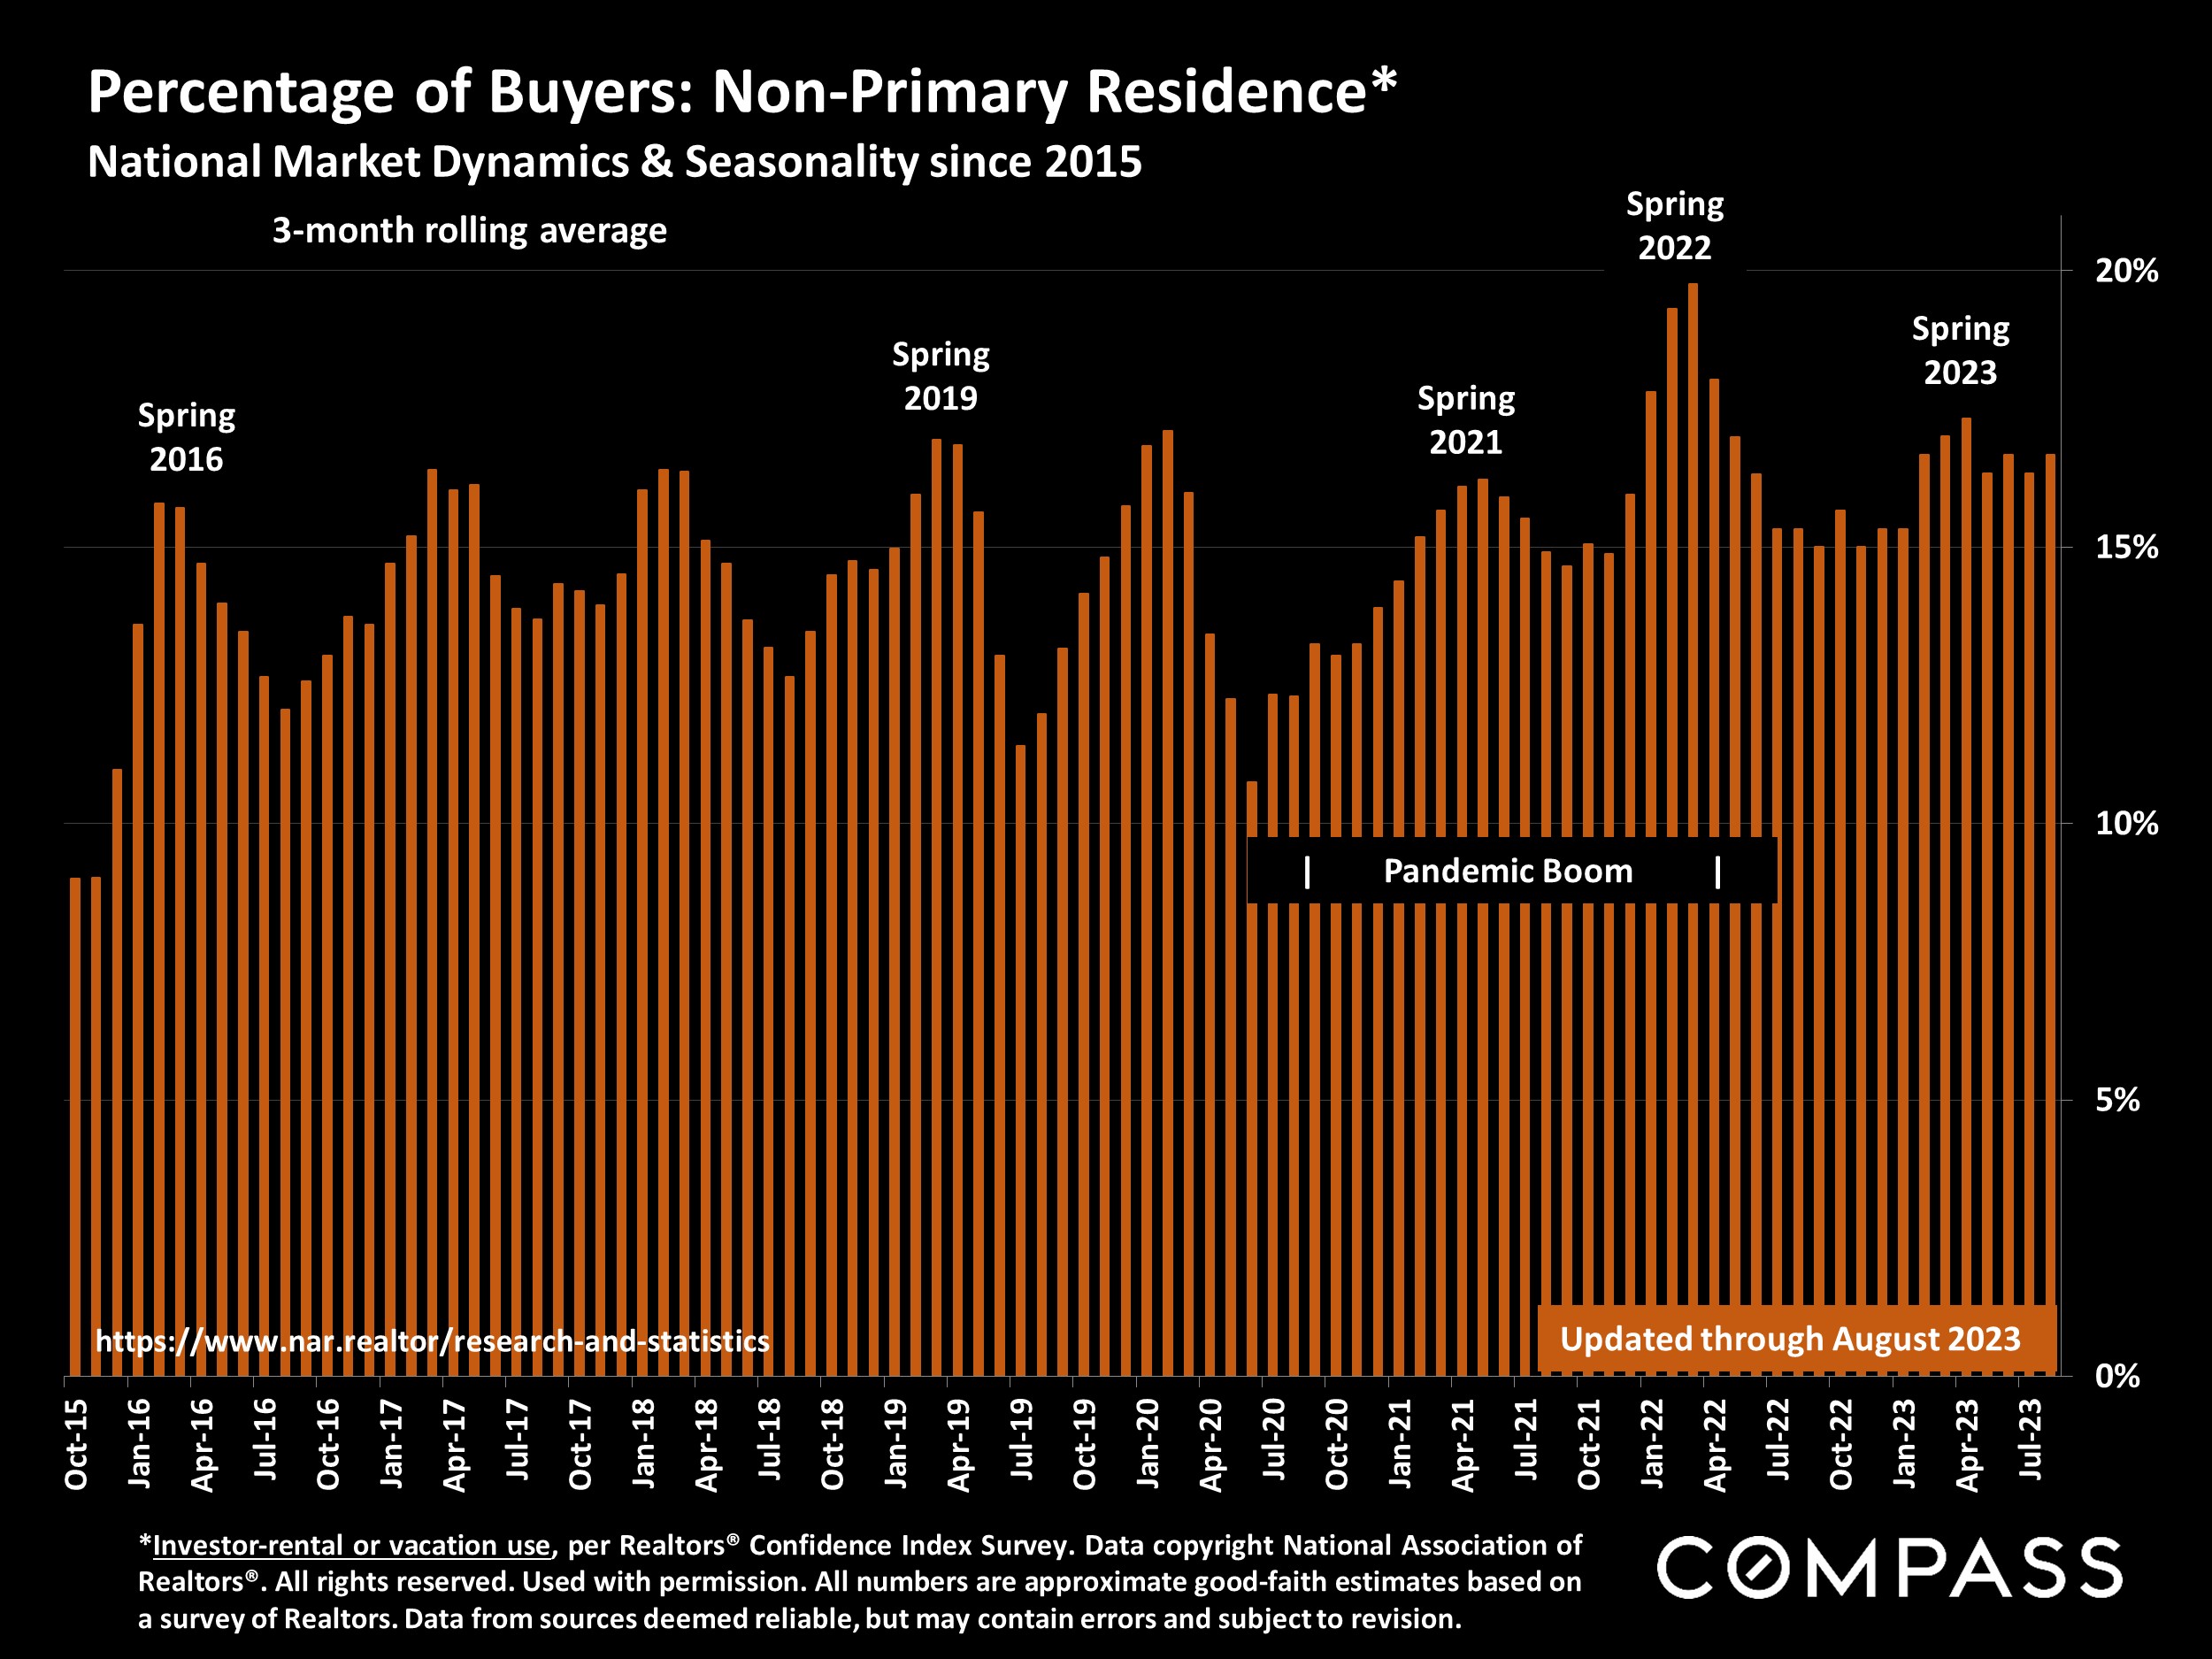
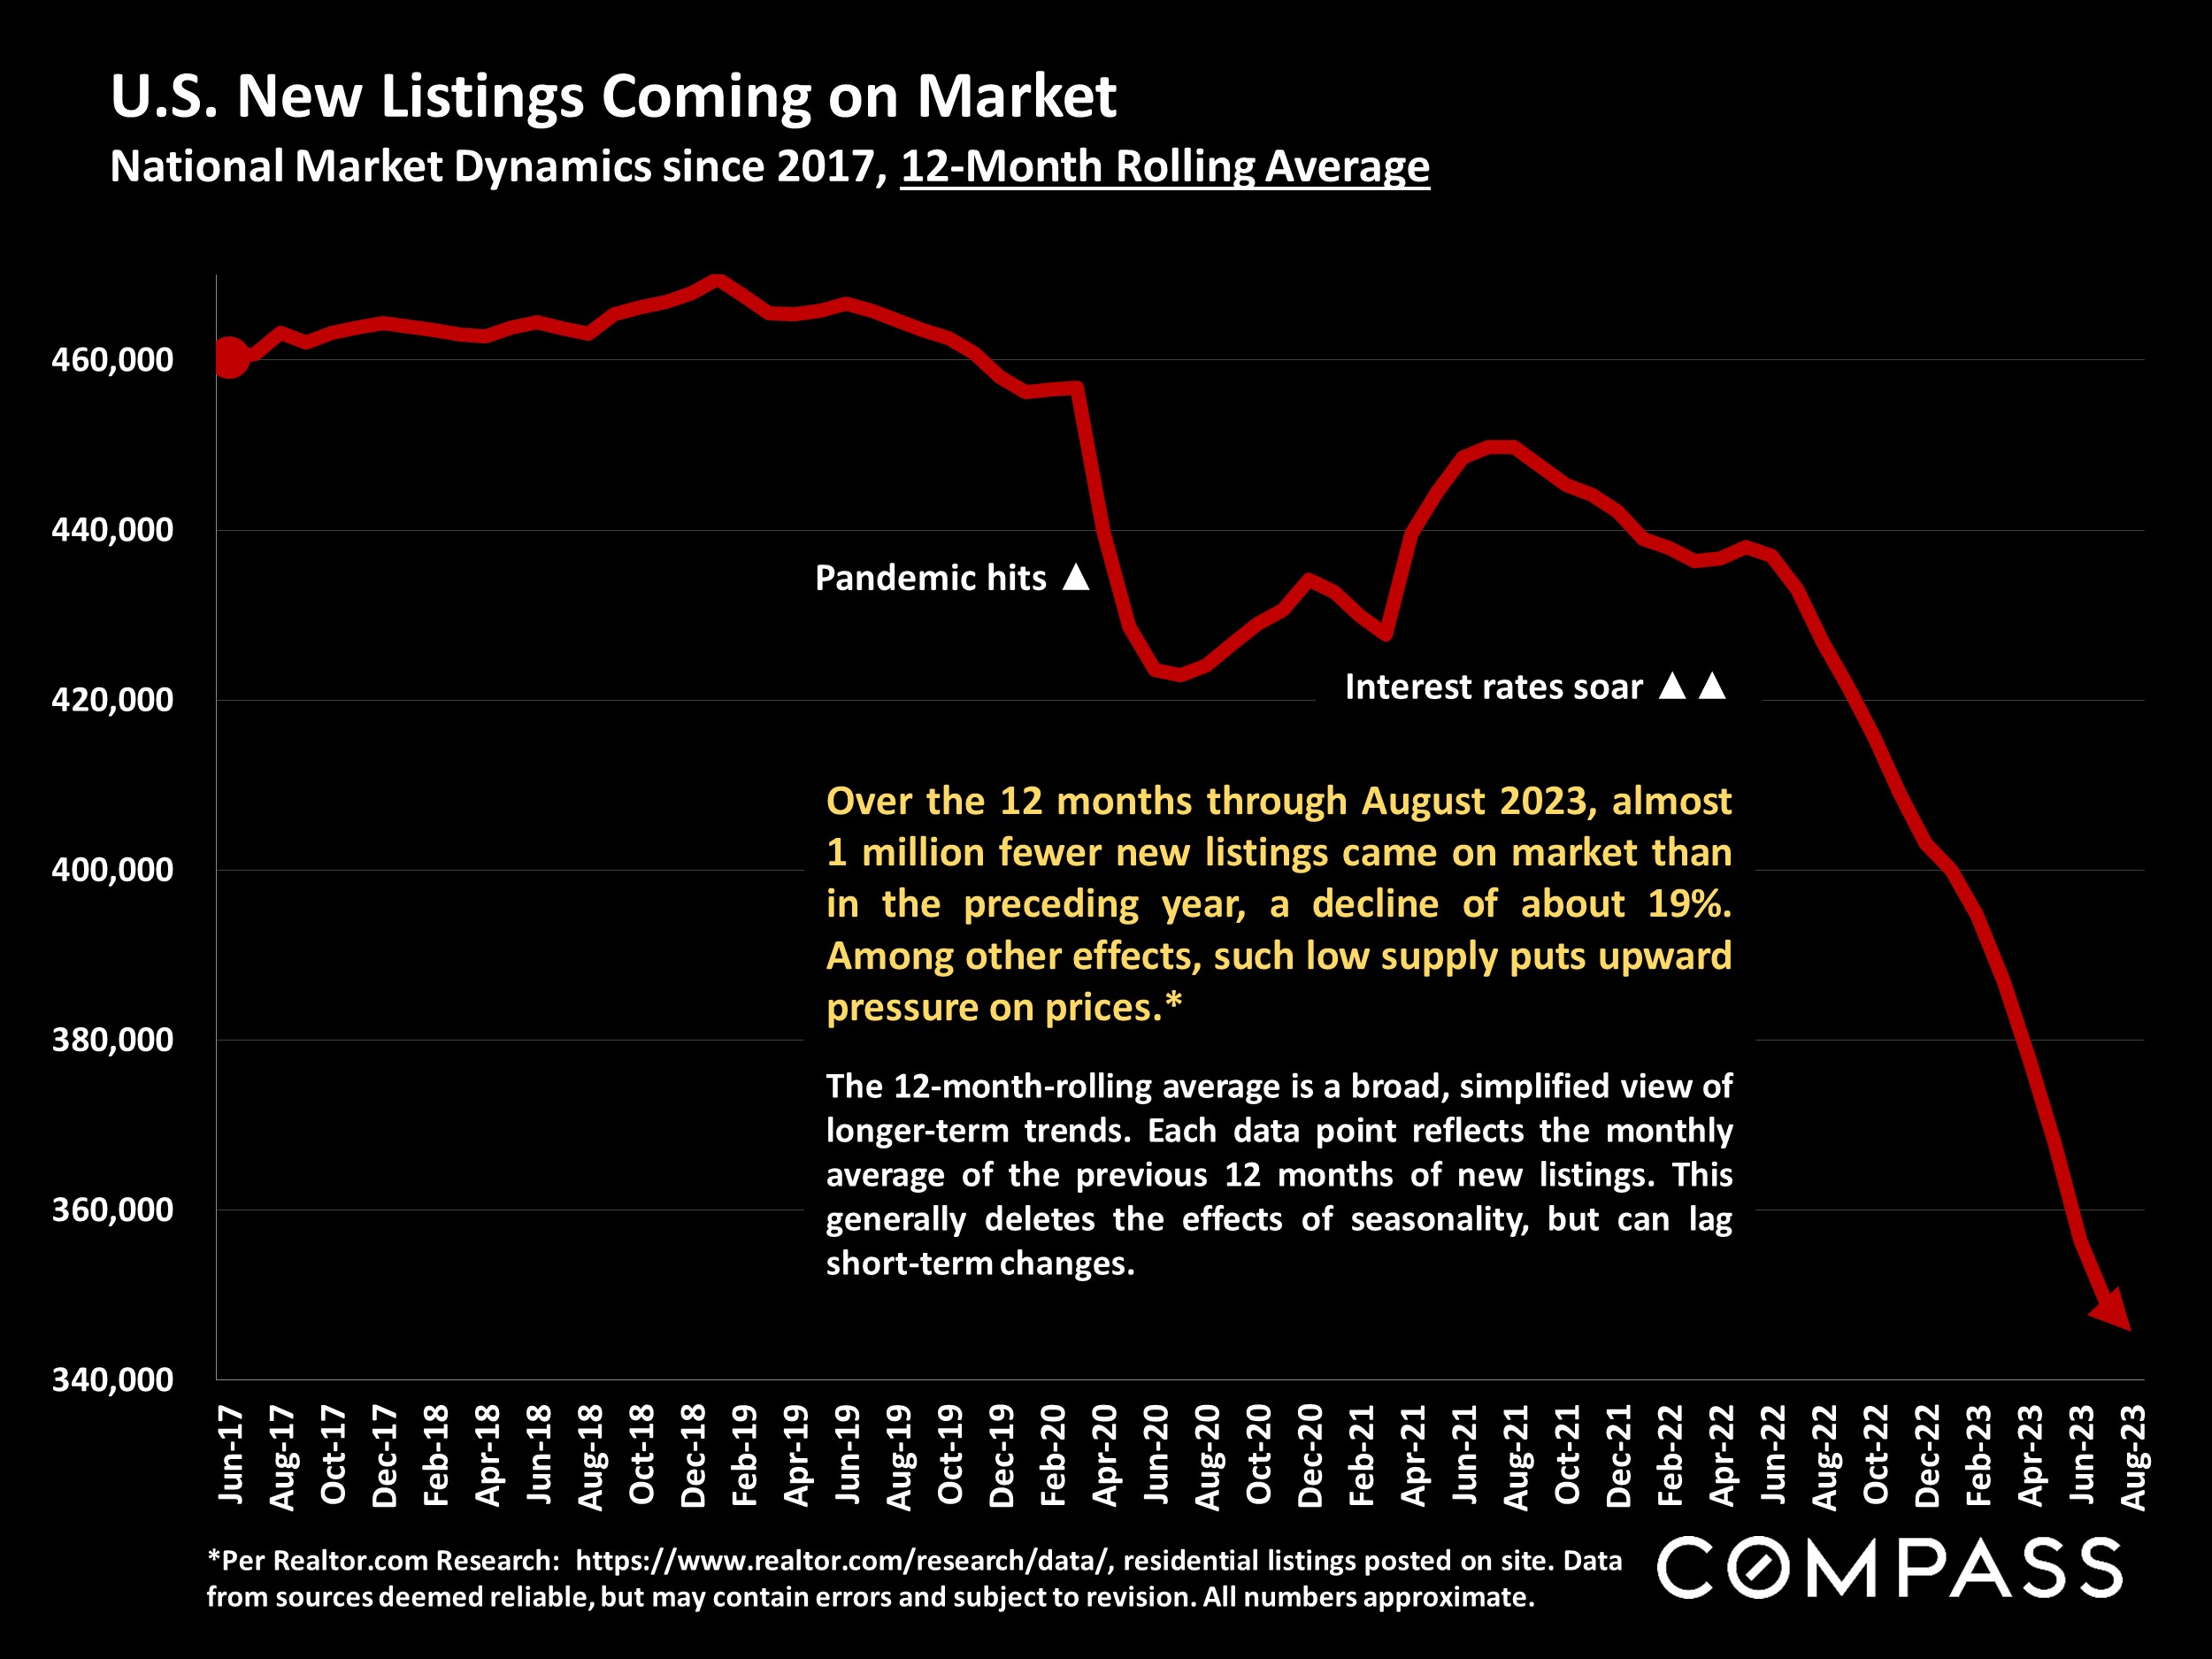
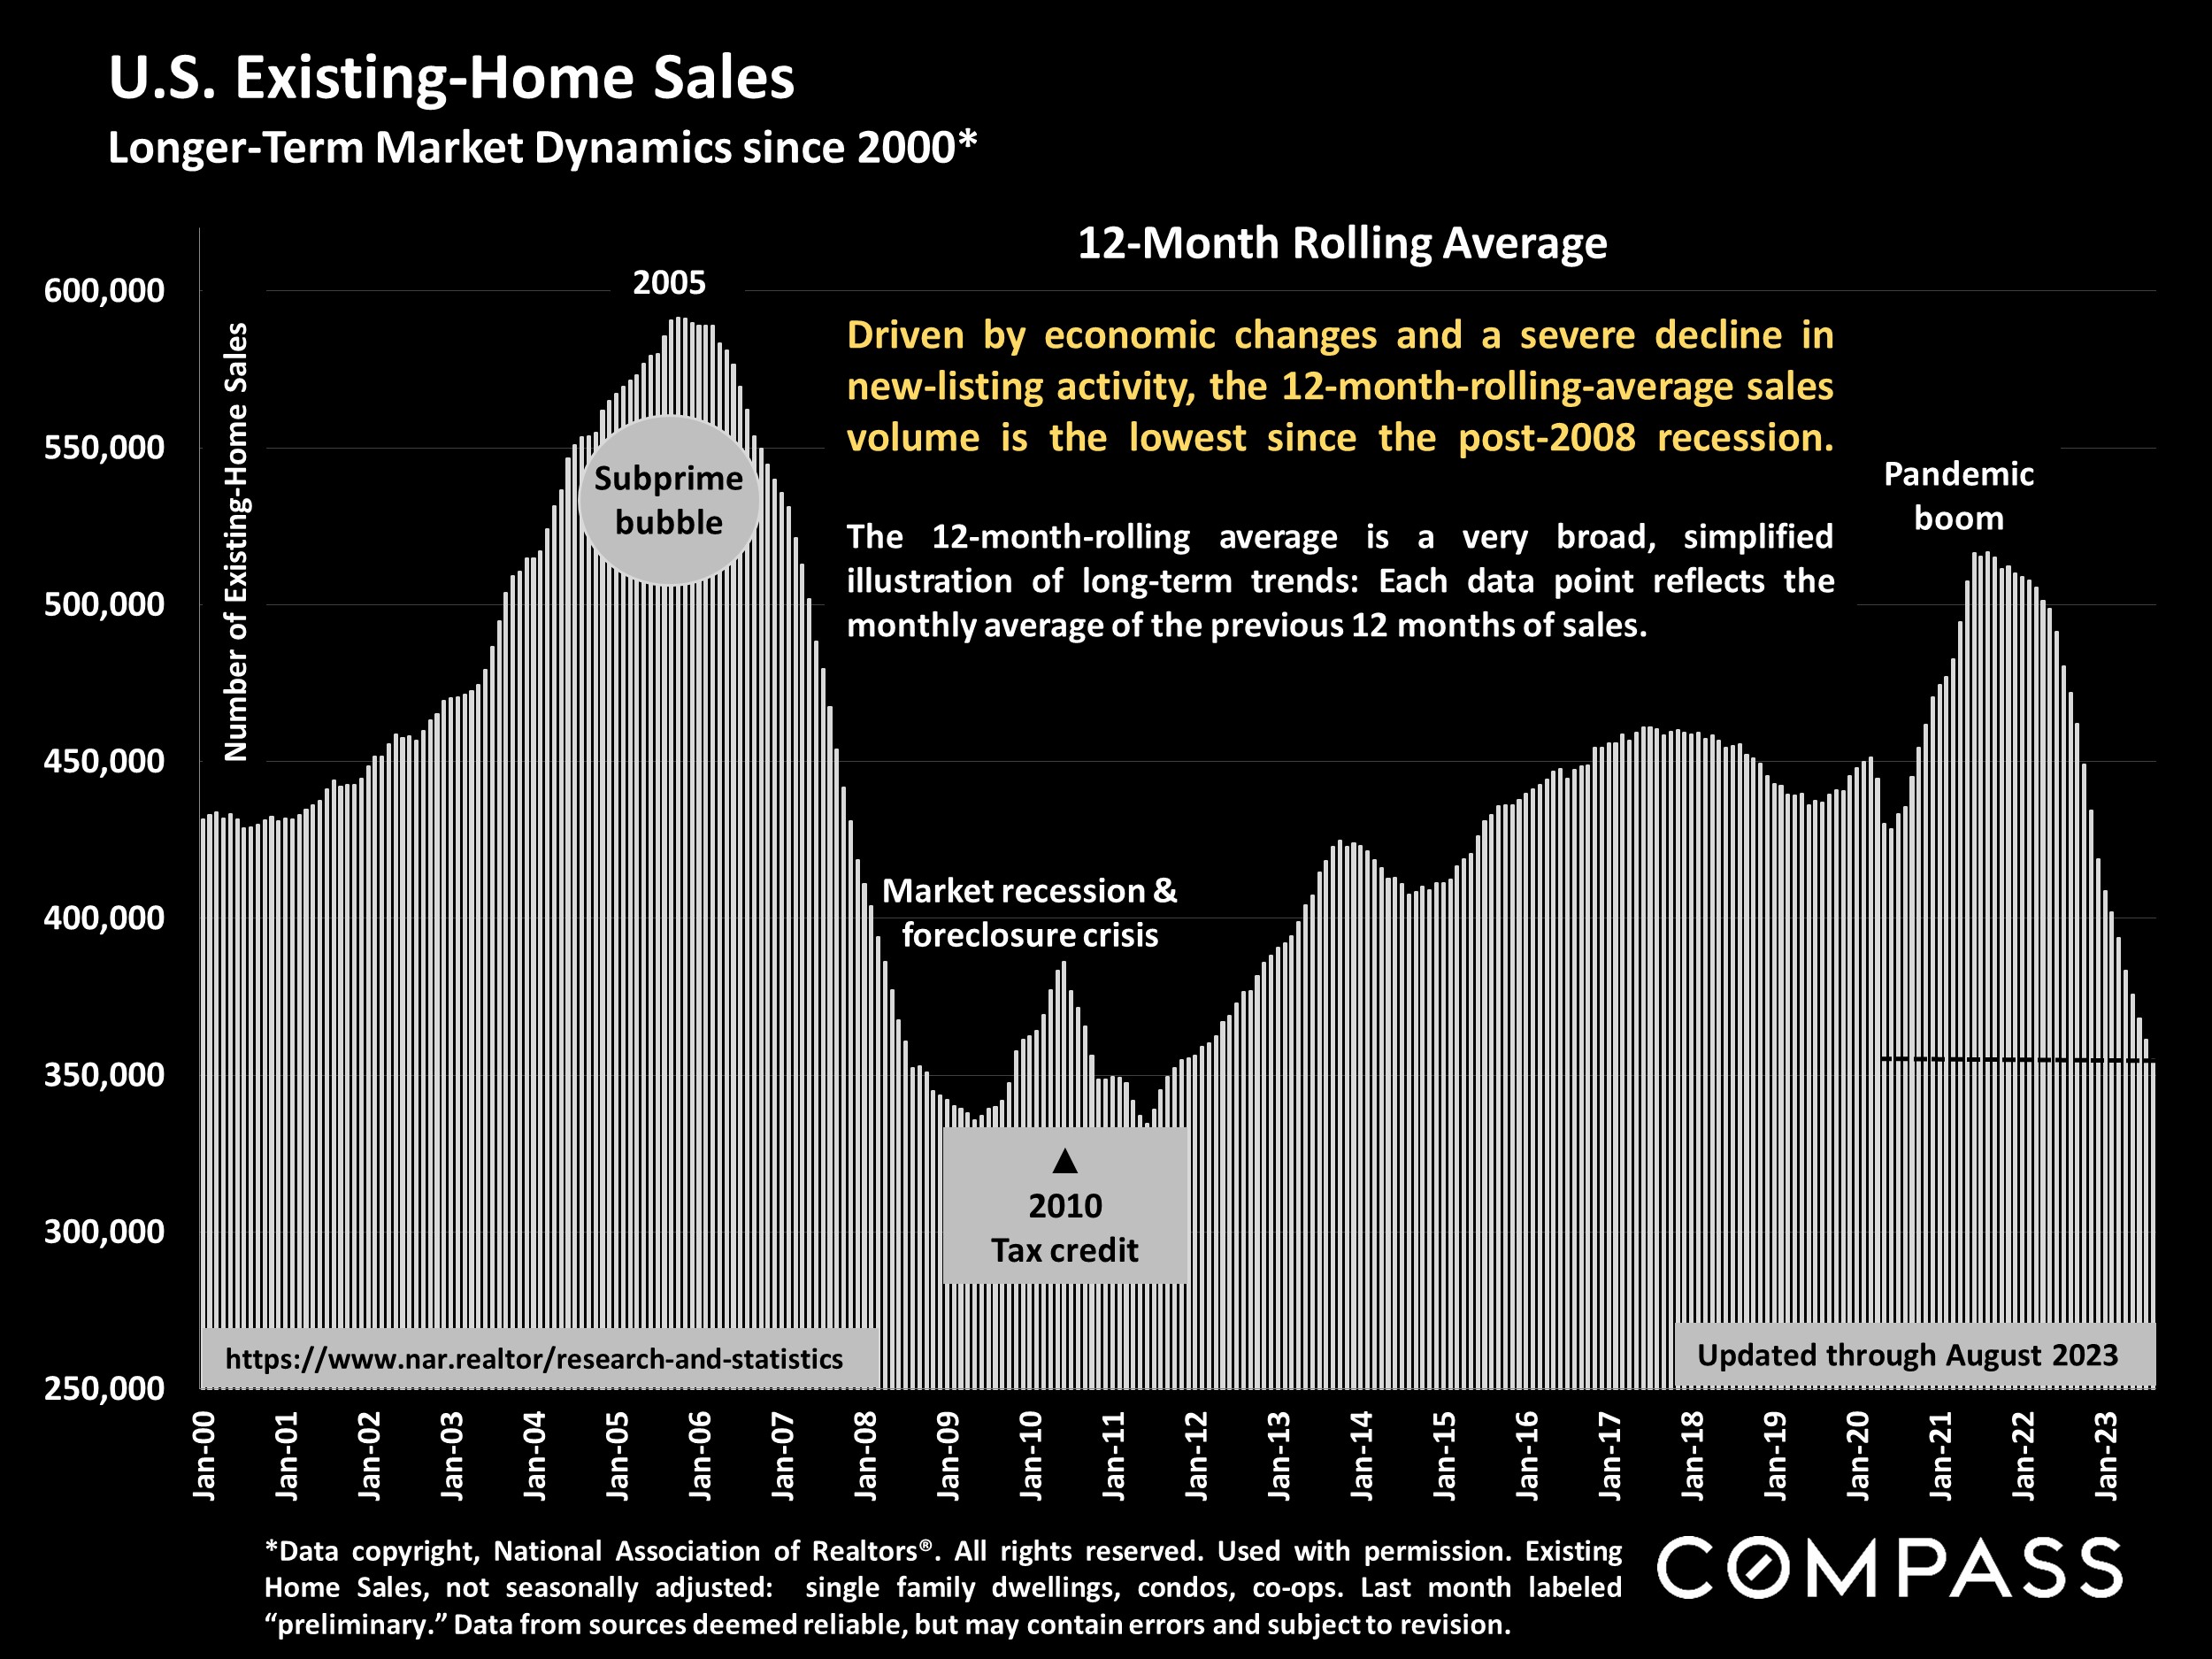
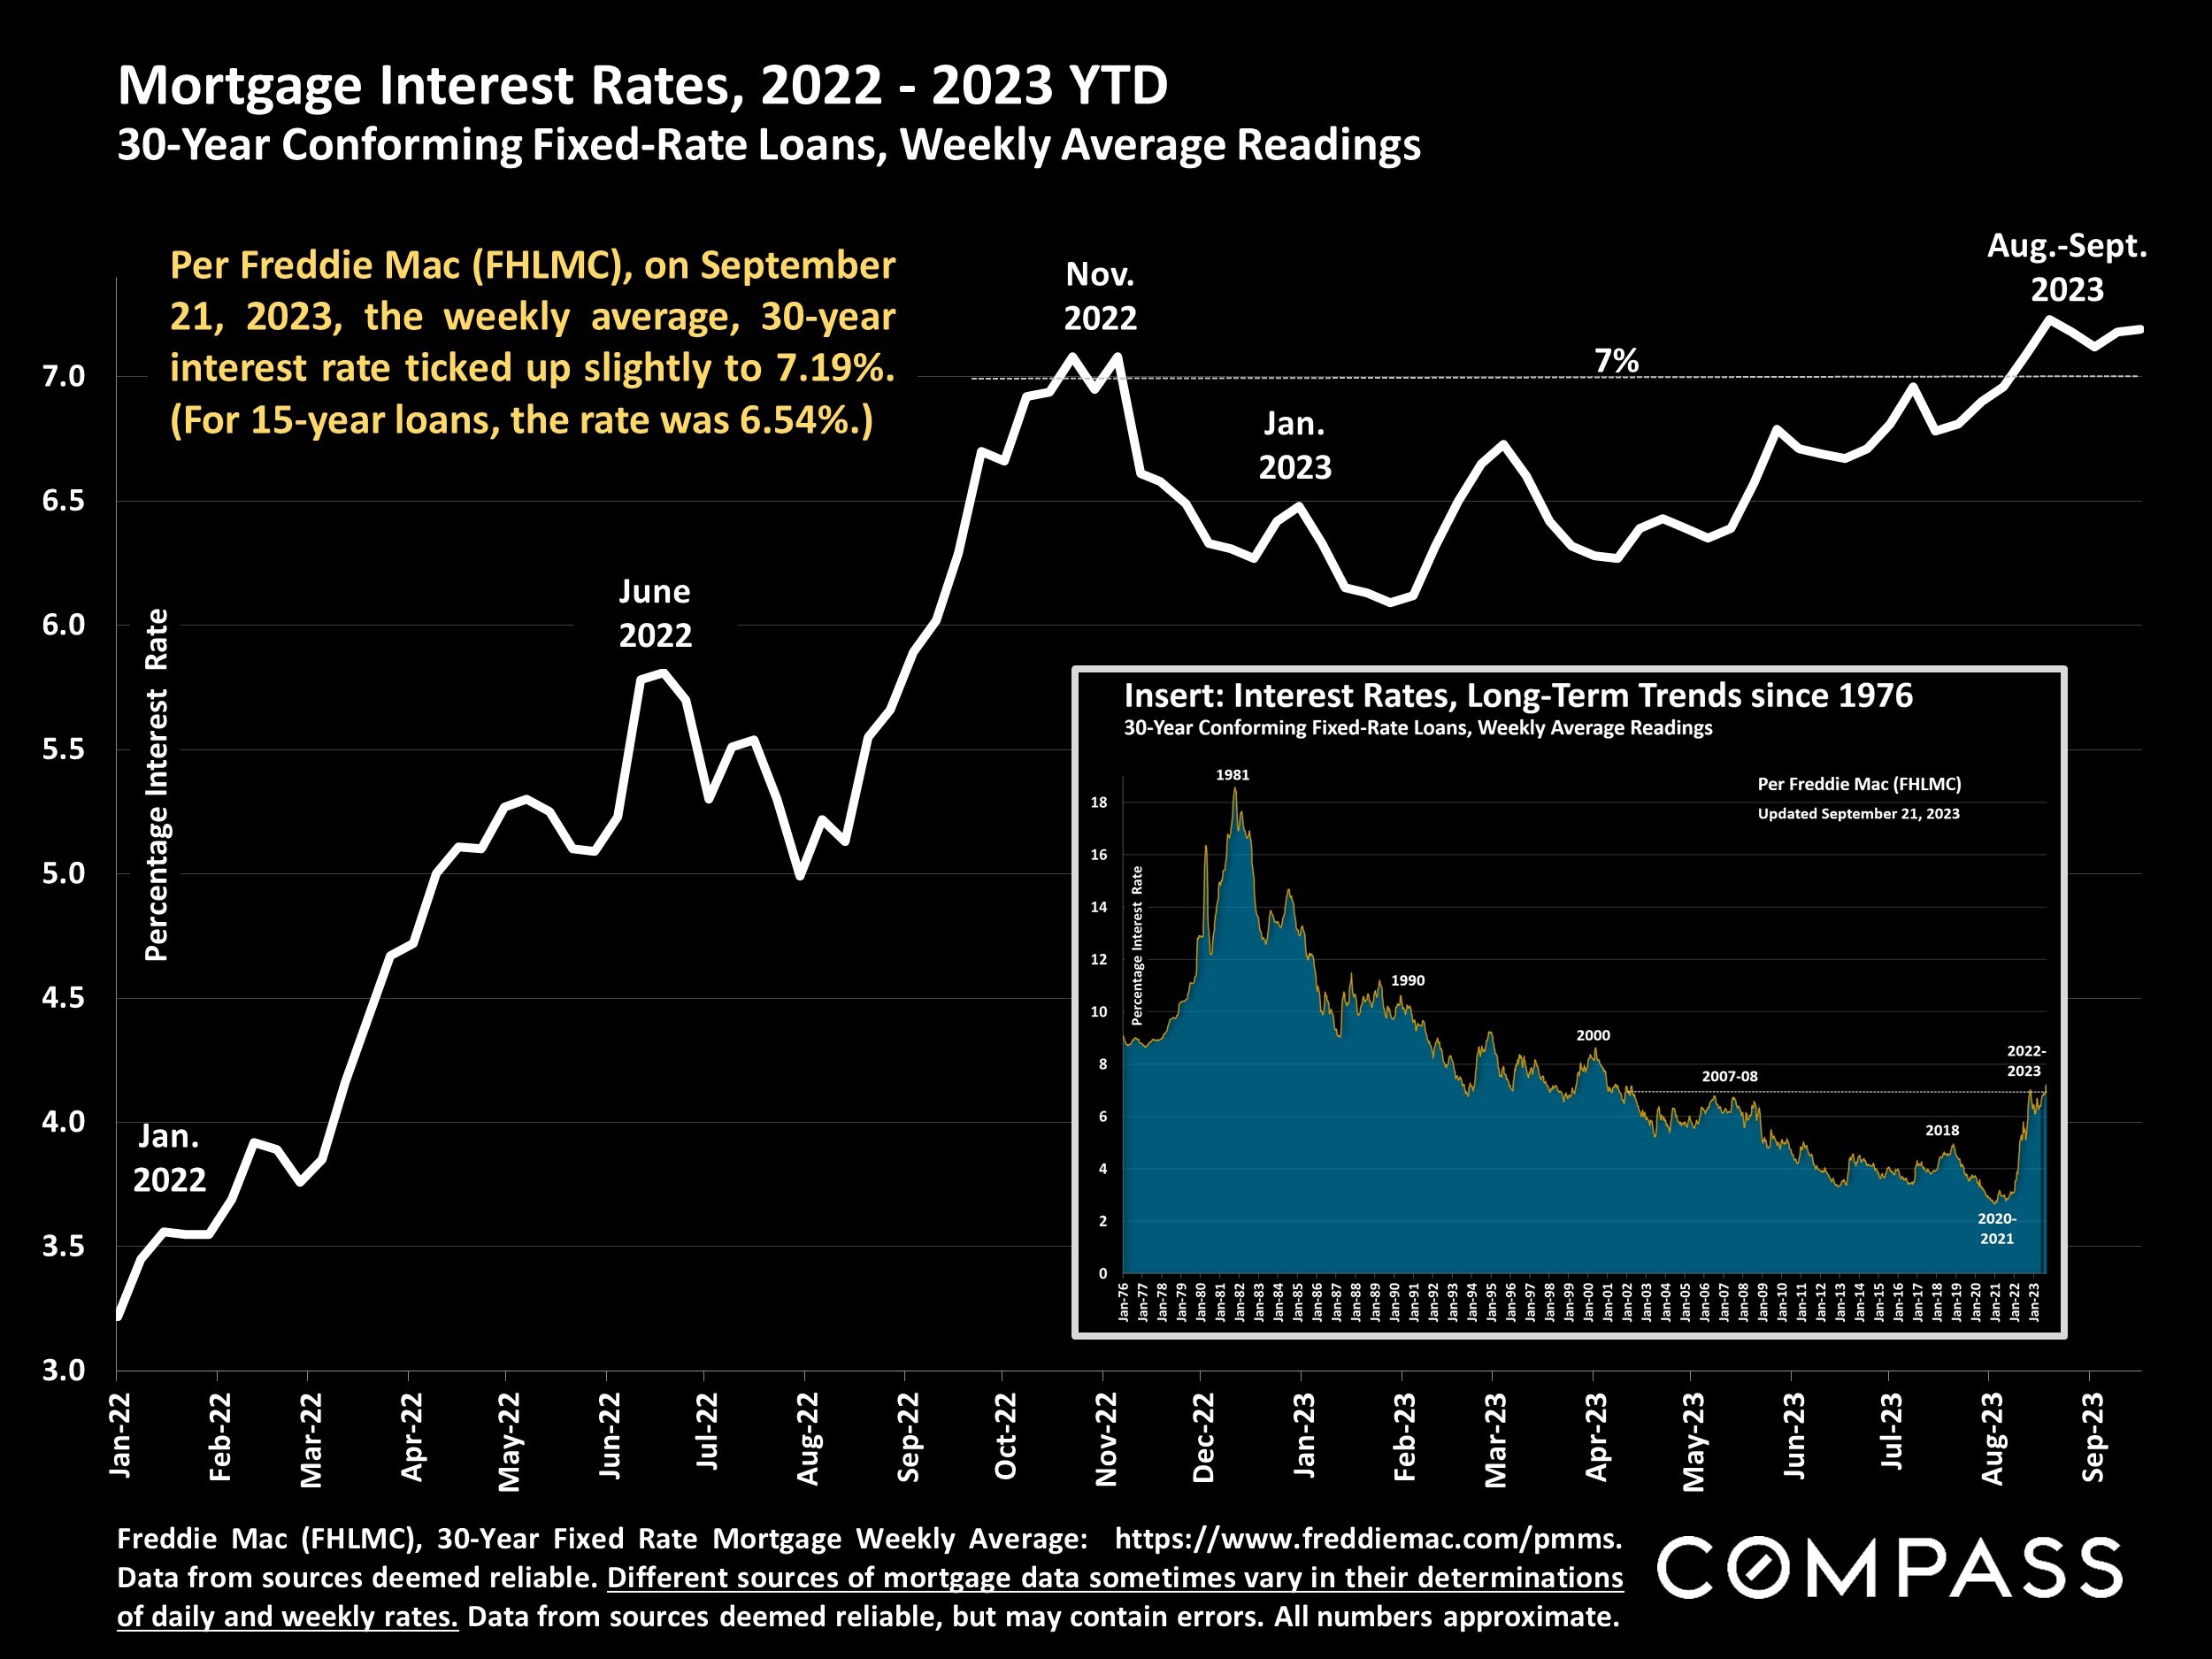
Generally speaking, the market rebounded much more strongly in 2023 than seemed possible at the end of 2022, when, after hitting historic peaks during the pandemic boom, economic and demand indicators hit their lowest points since the great recession. The relatively low number of Bay Area sellers putting their homes on the market continues to be a factor in the balance between supply and demand, in the recovery in home prices, and the decline in overall sales volumes. In August, the average, weekly, 30-year mortgage rate, as published by FHLMC, ticked back up over 7%, a situation which continues to impact housing affordability. Perhaps in response, the percentage of buyers paying all cash has generally been running at its highest national level in 8 years. August was a relatively volatile month for stock markets.
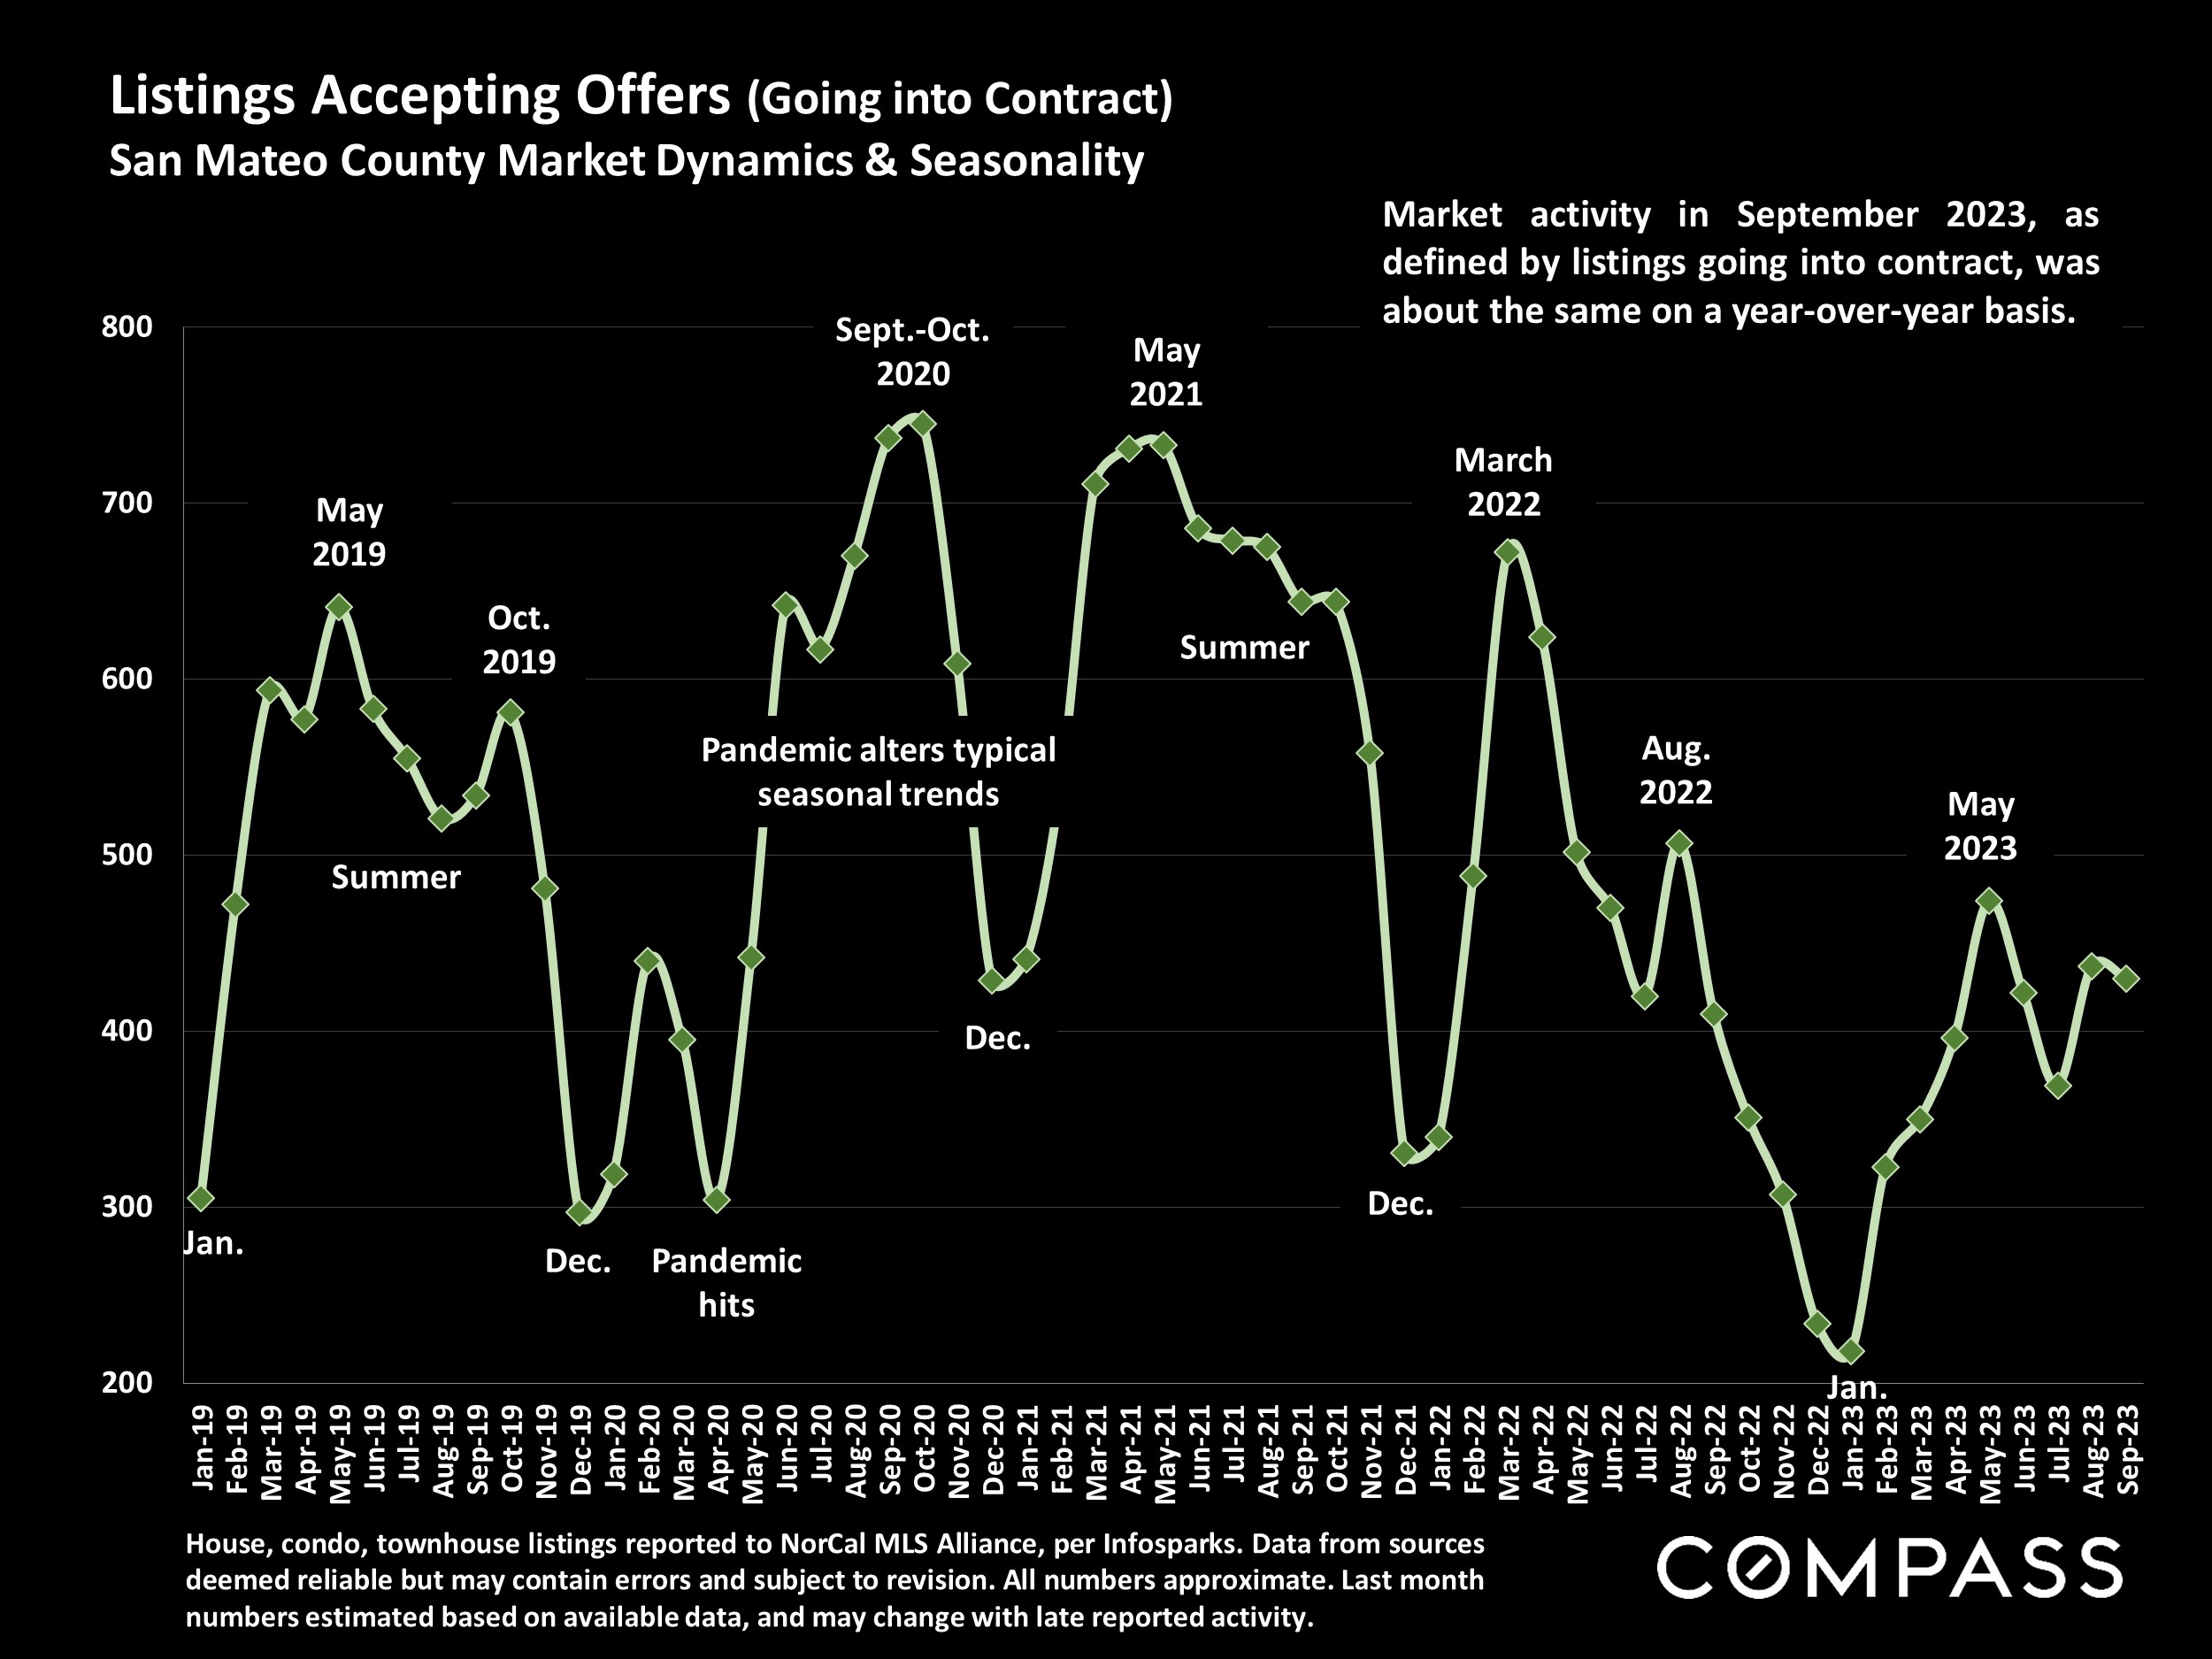
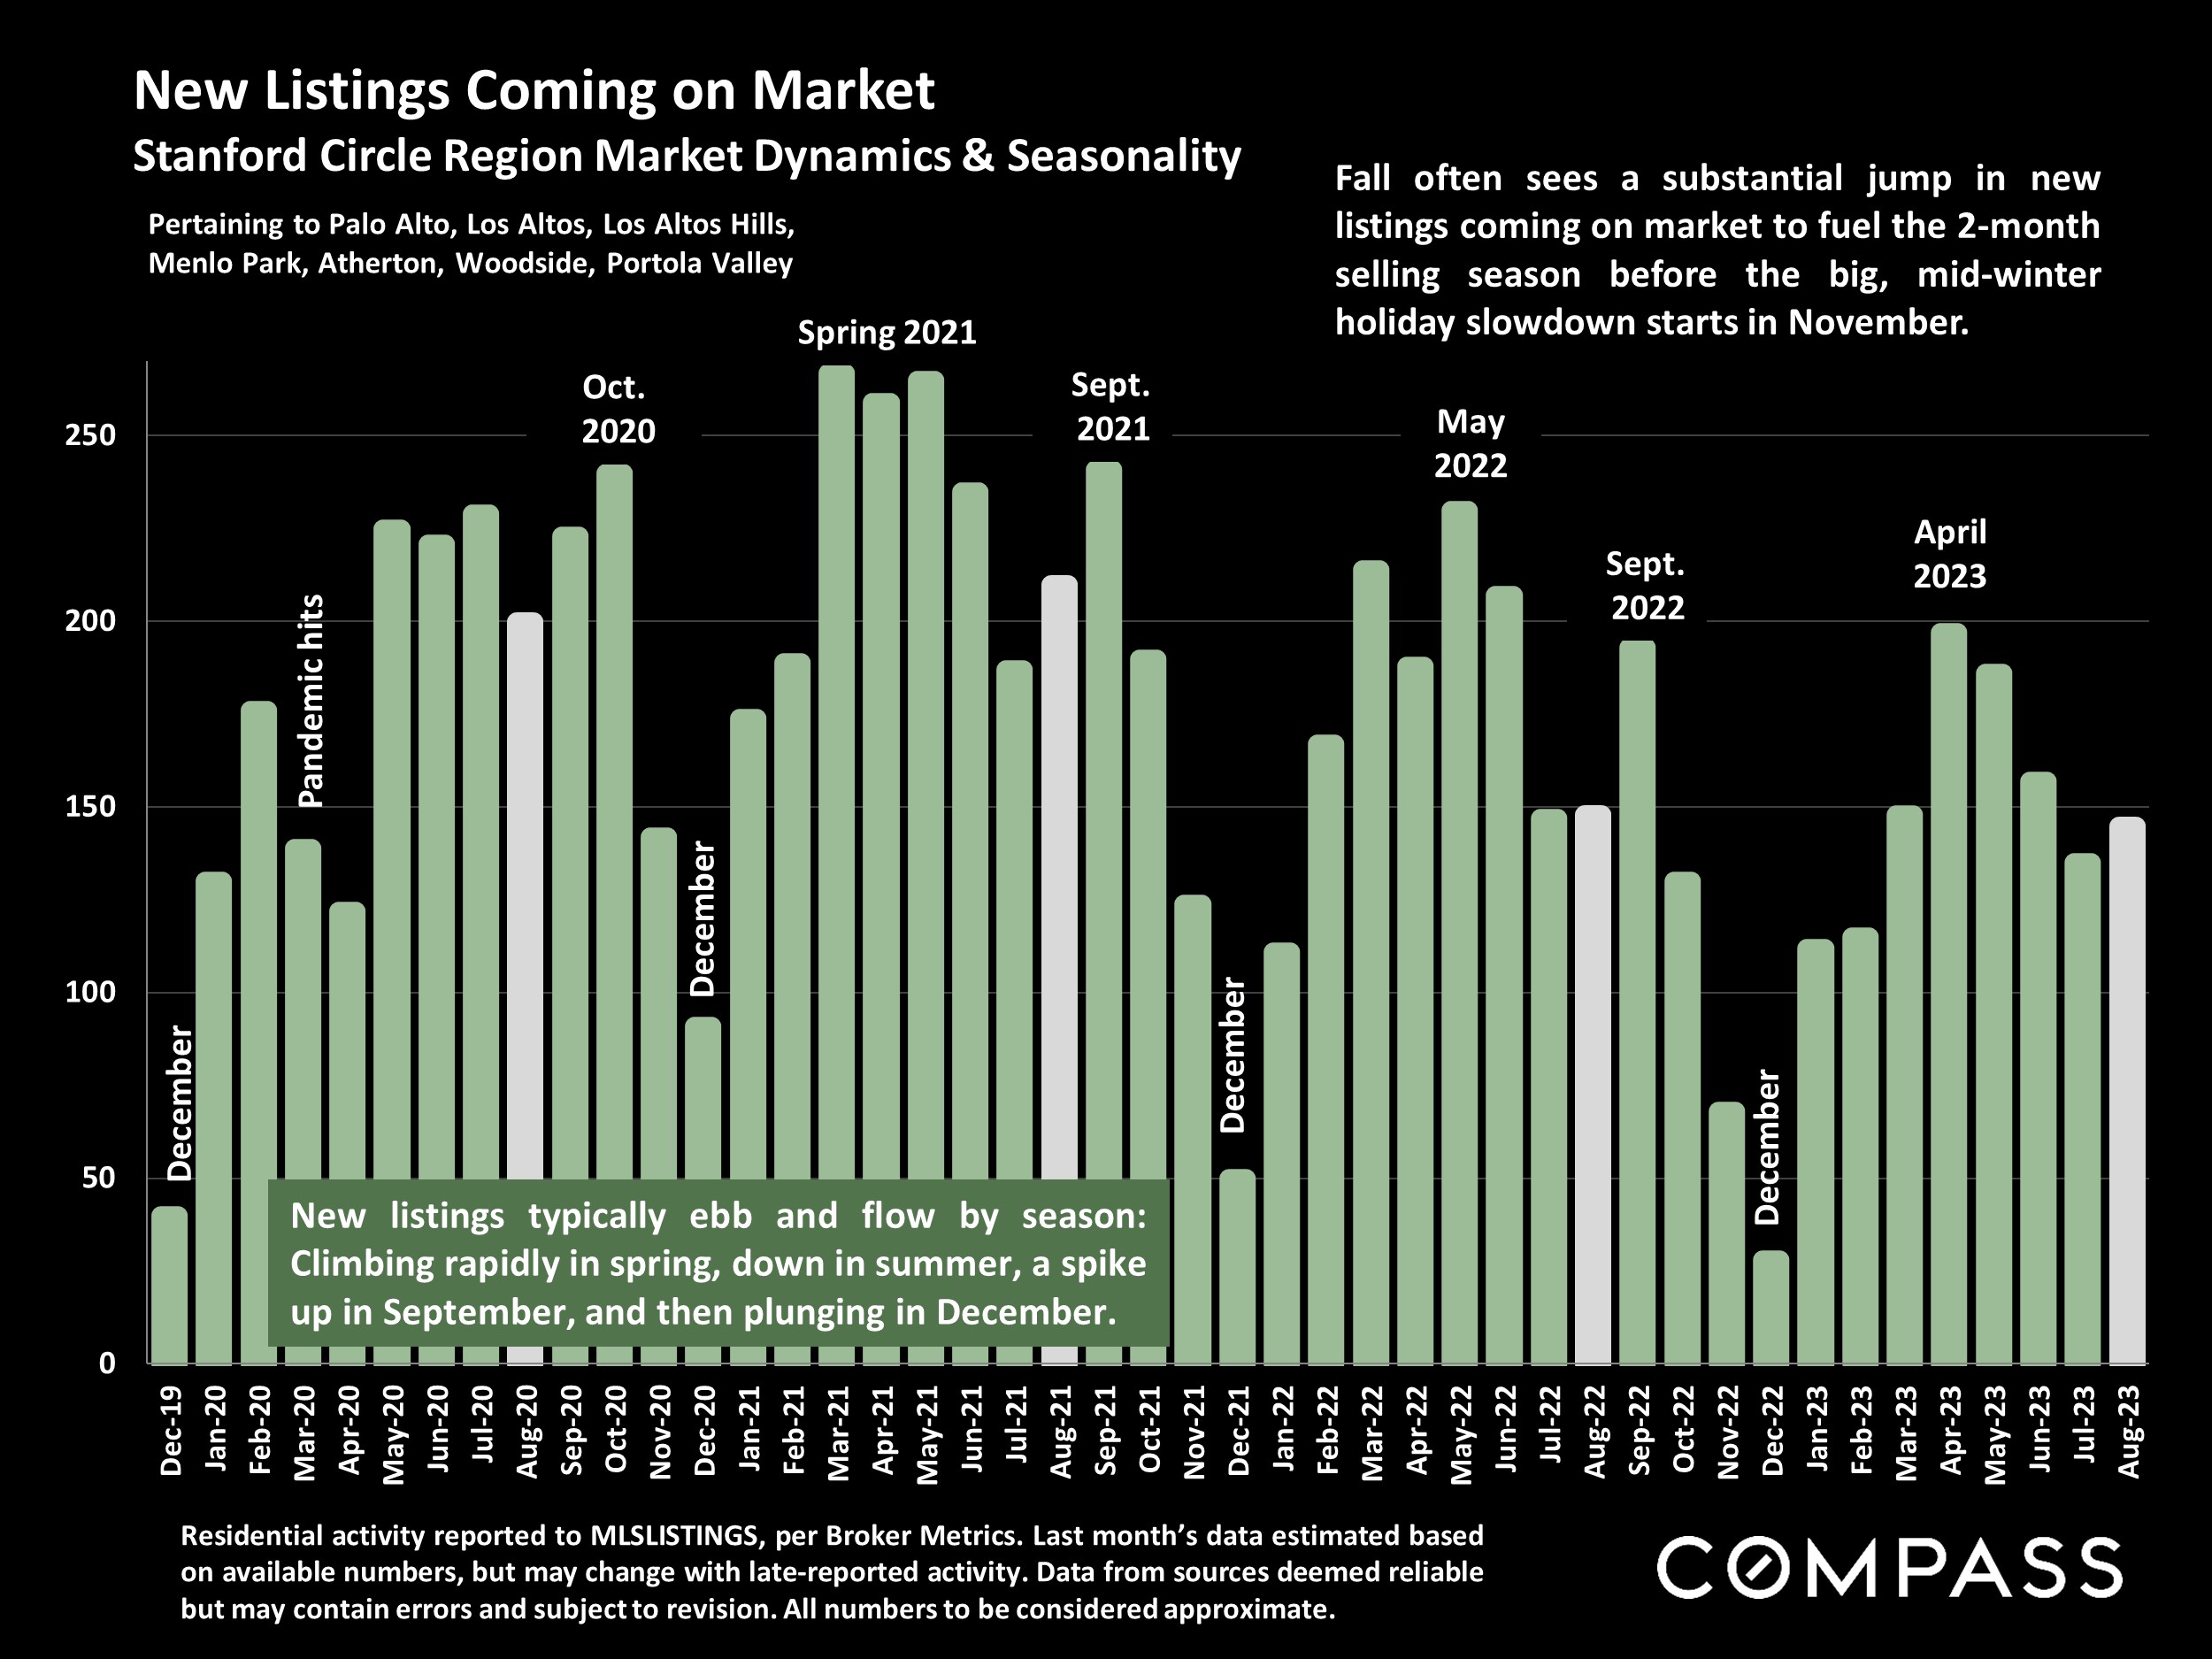
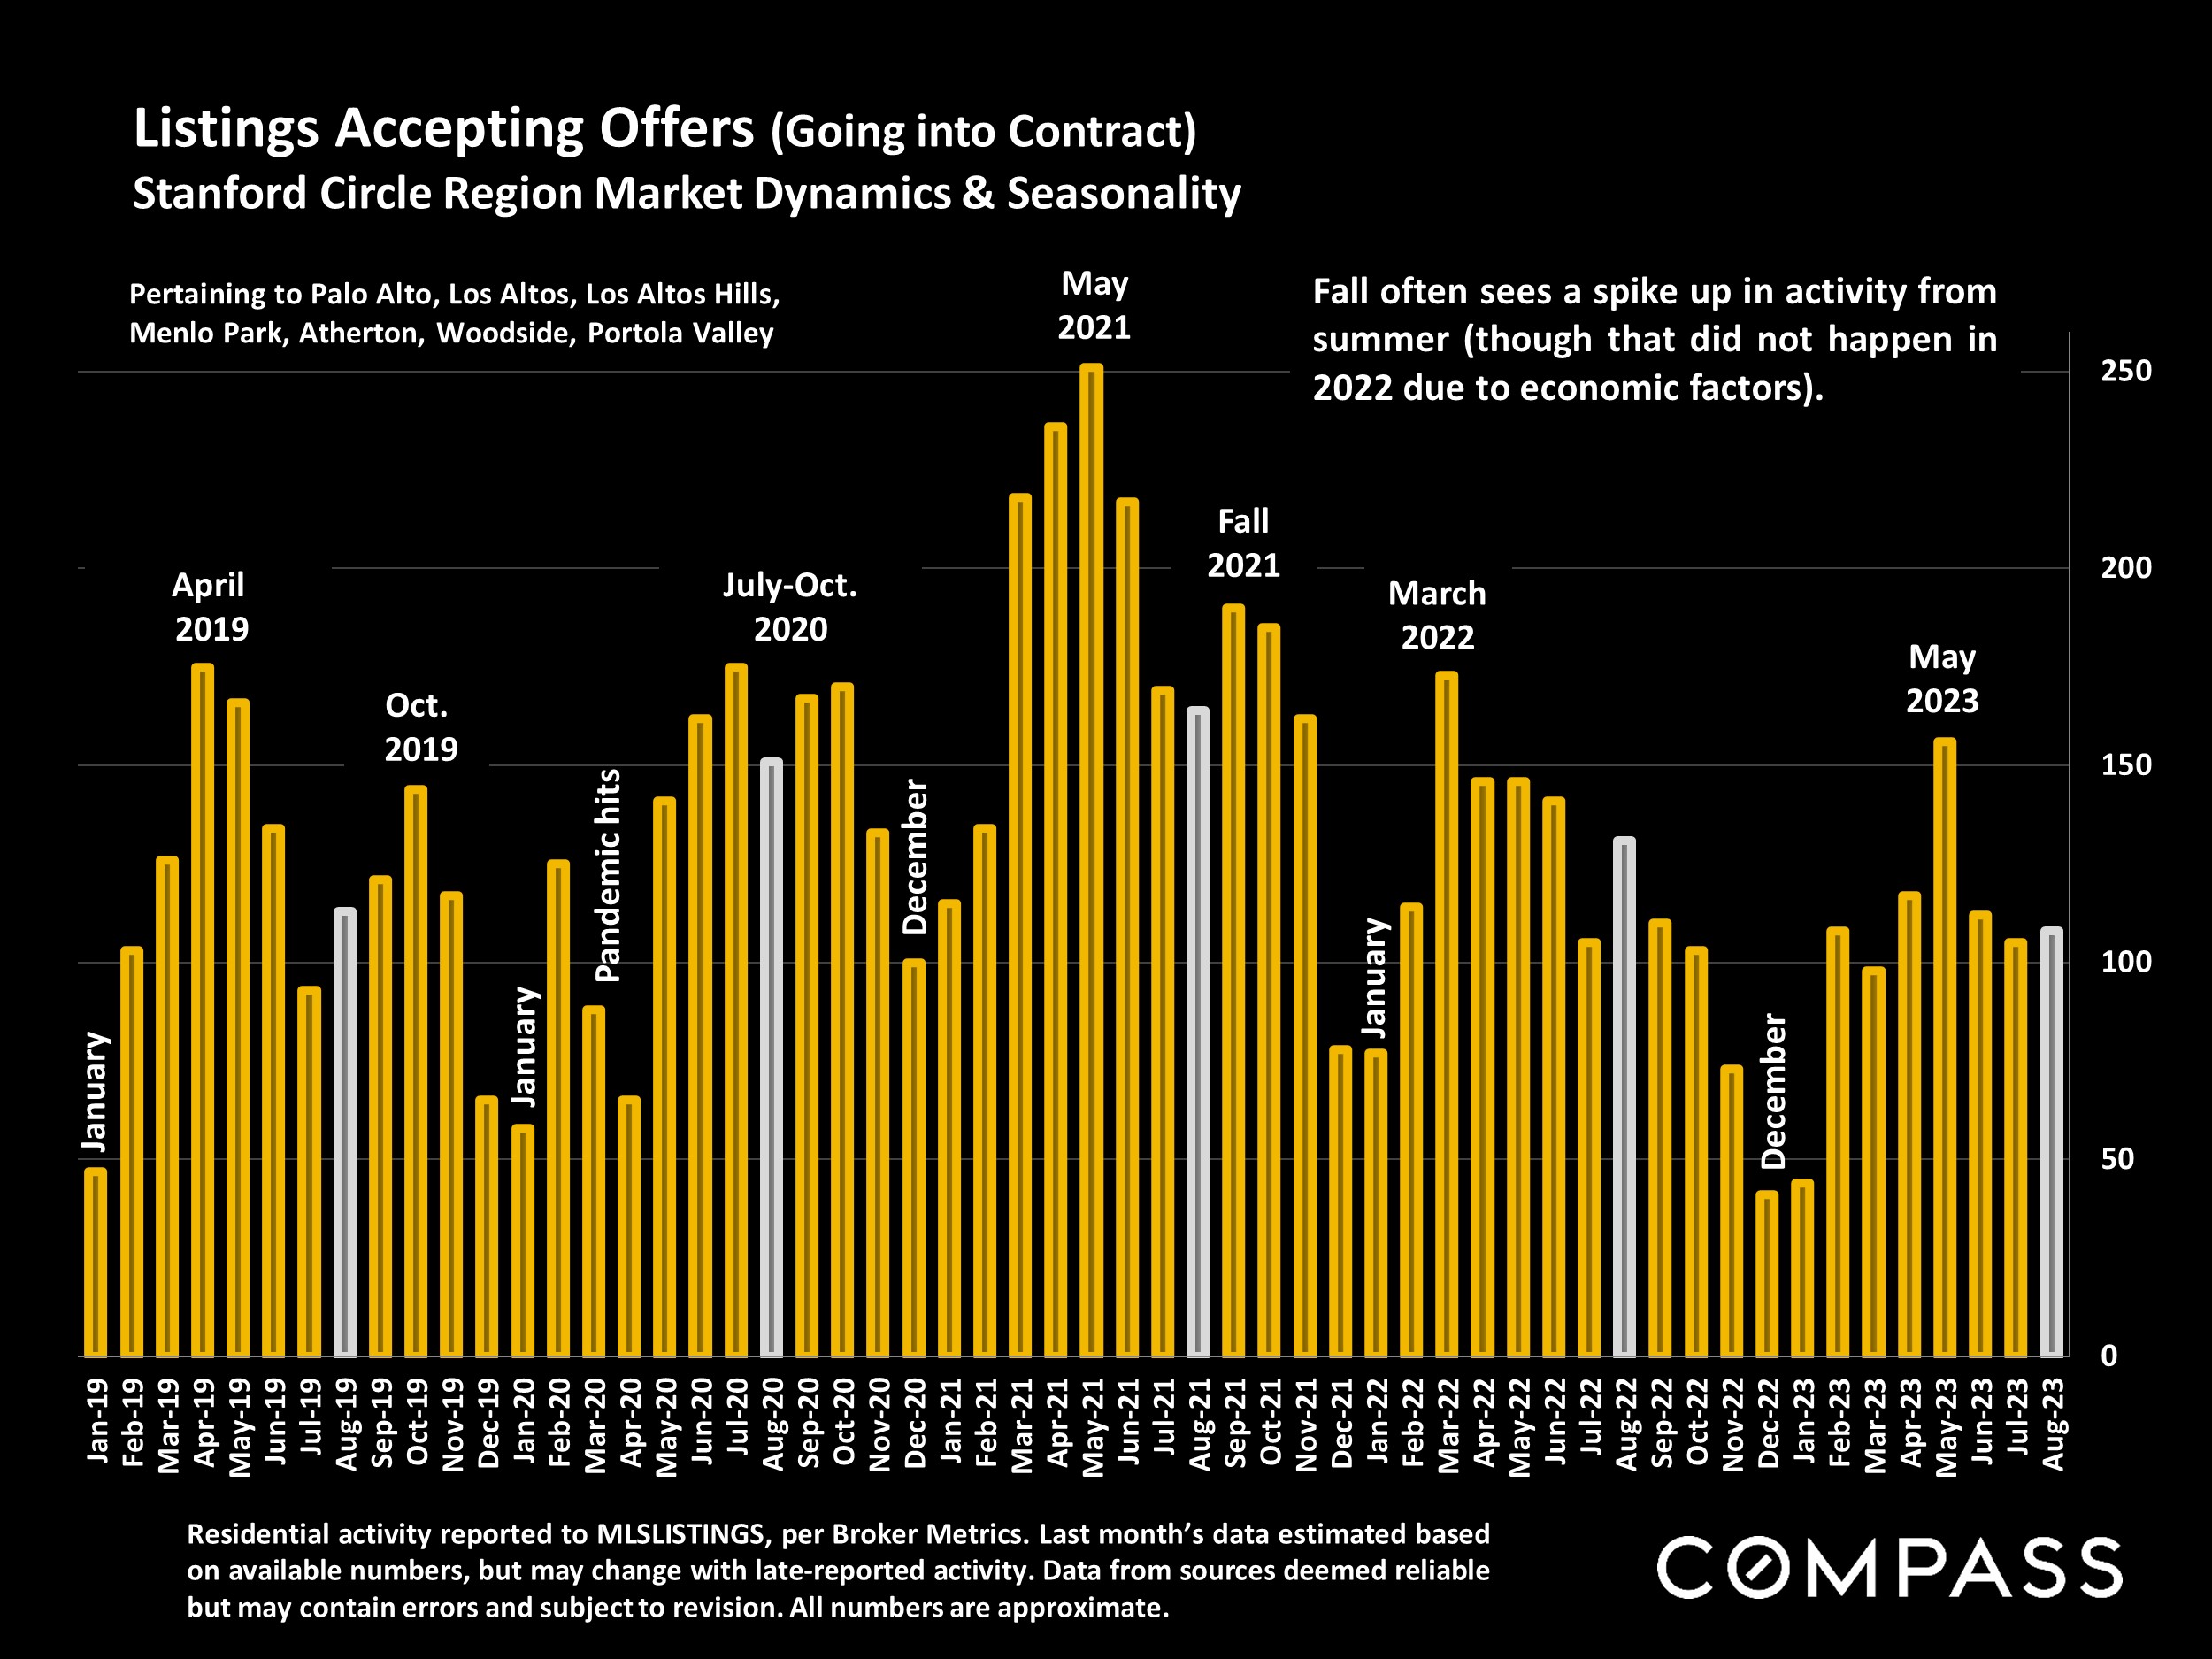
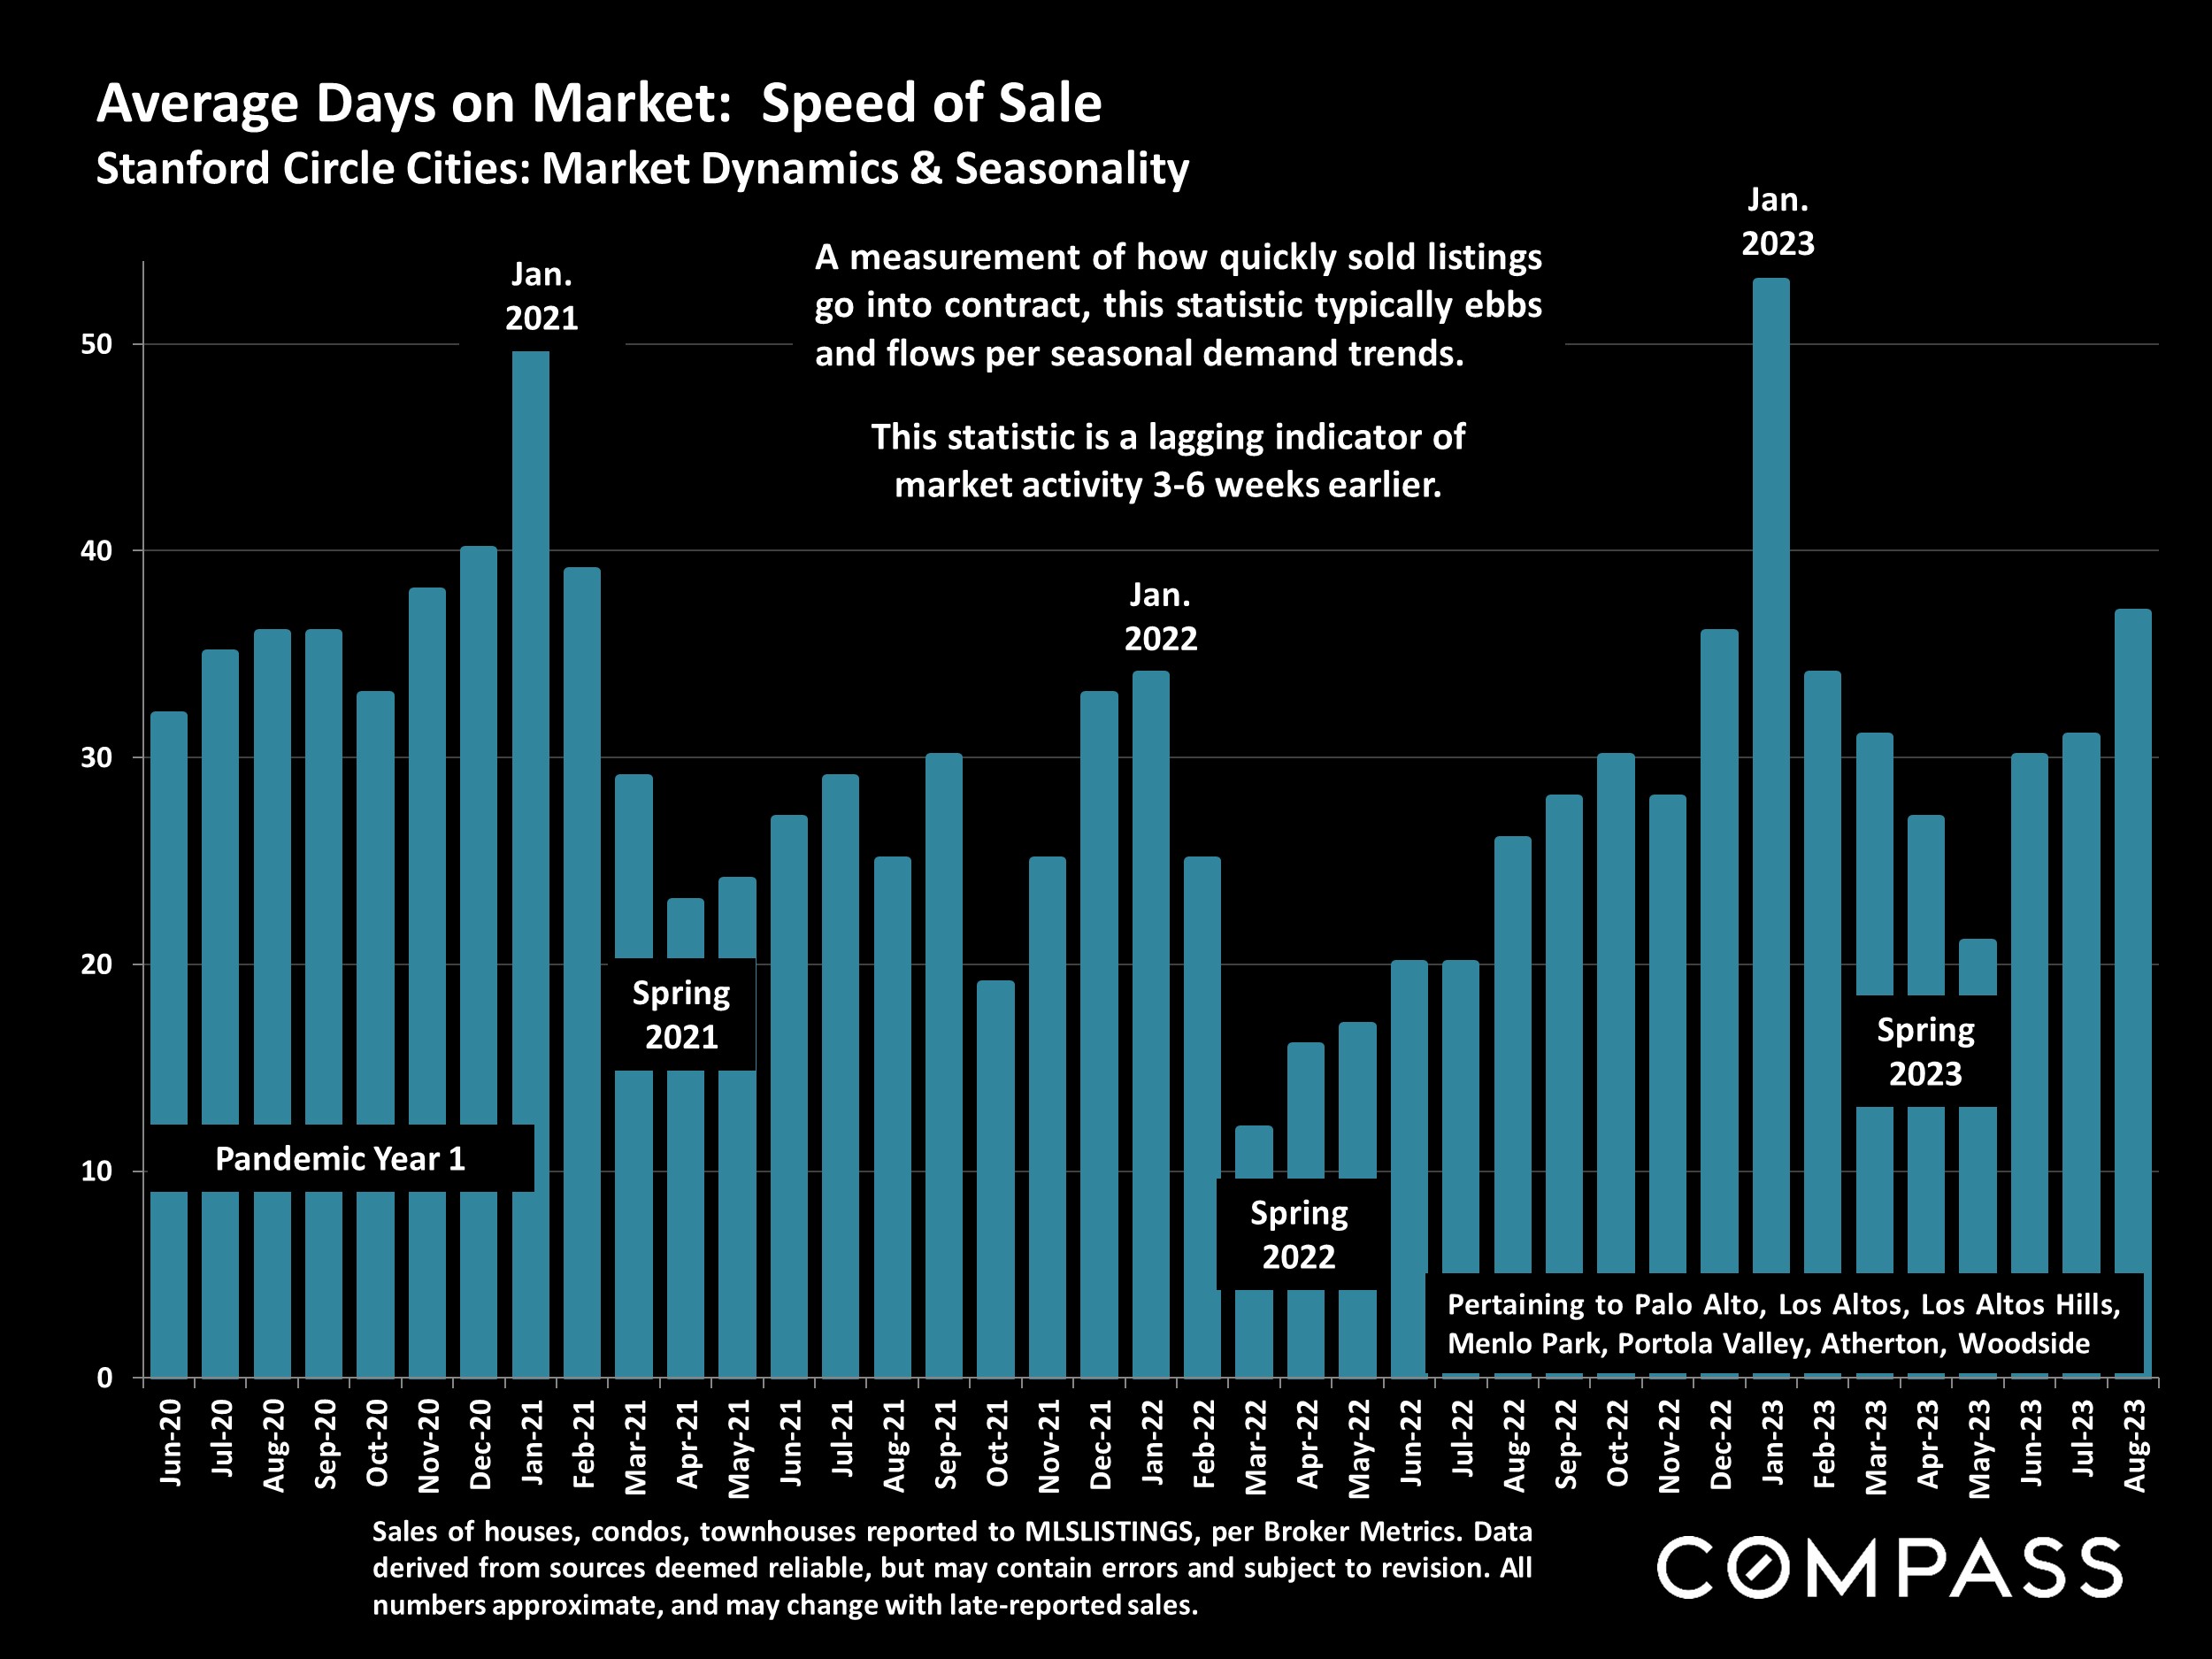
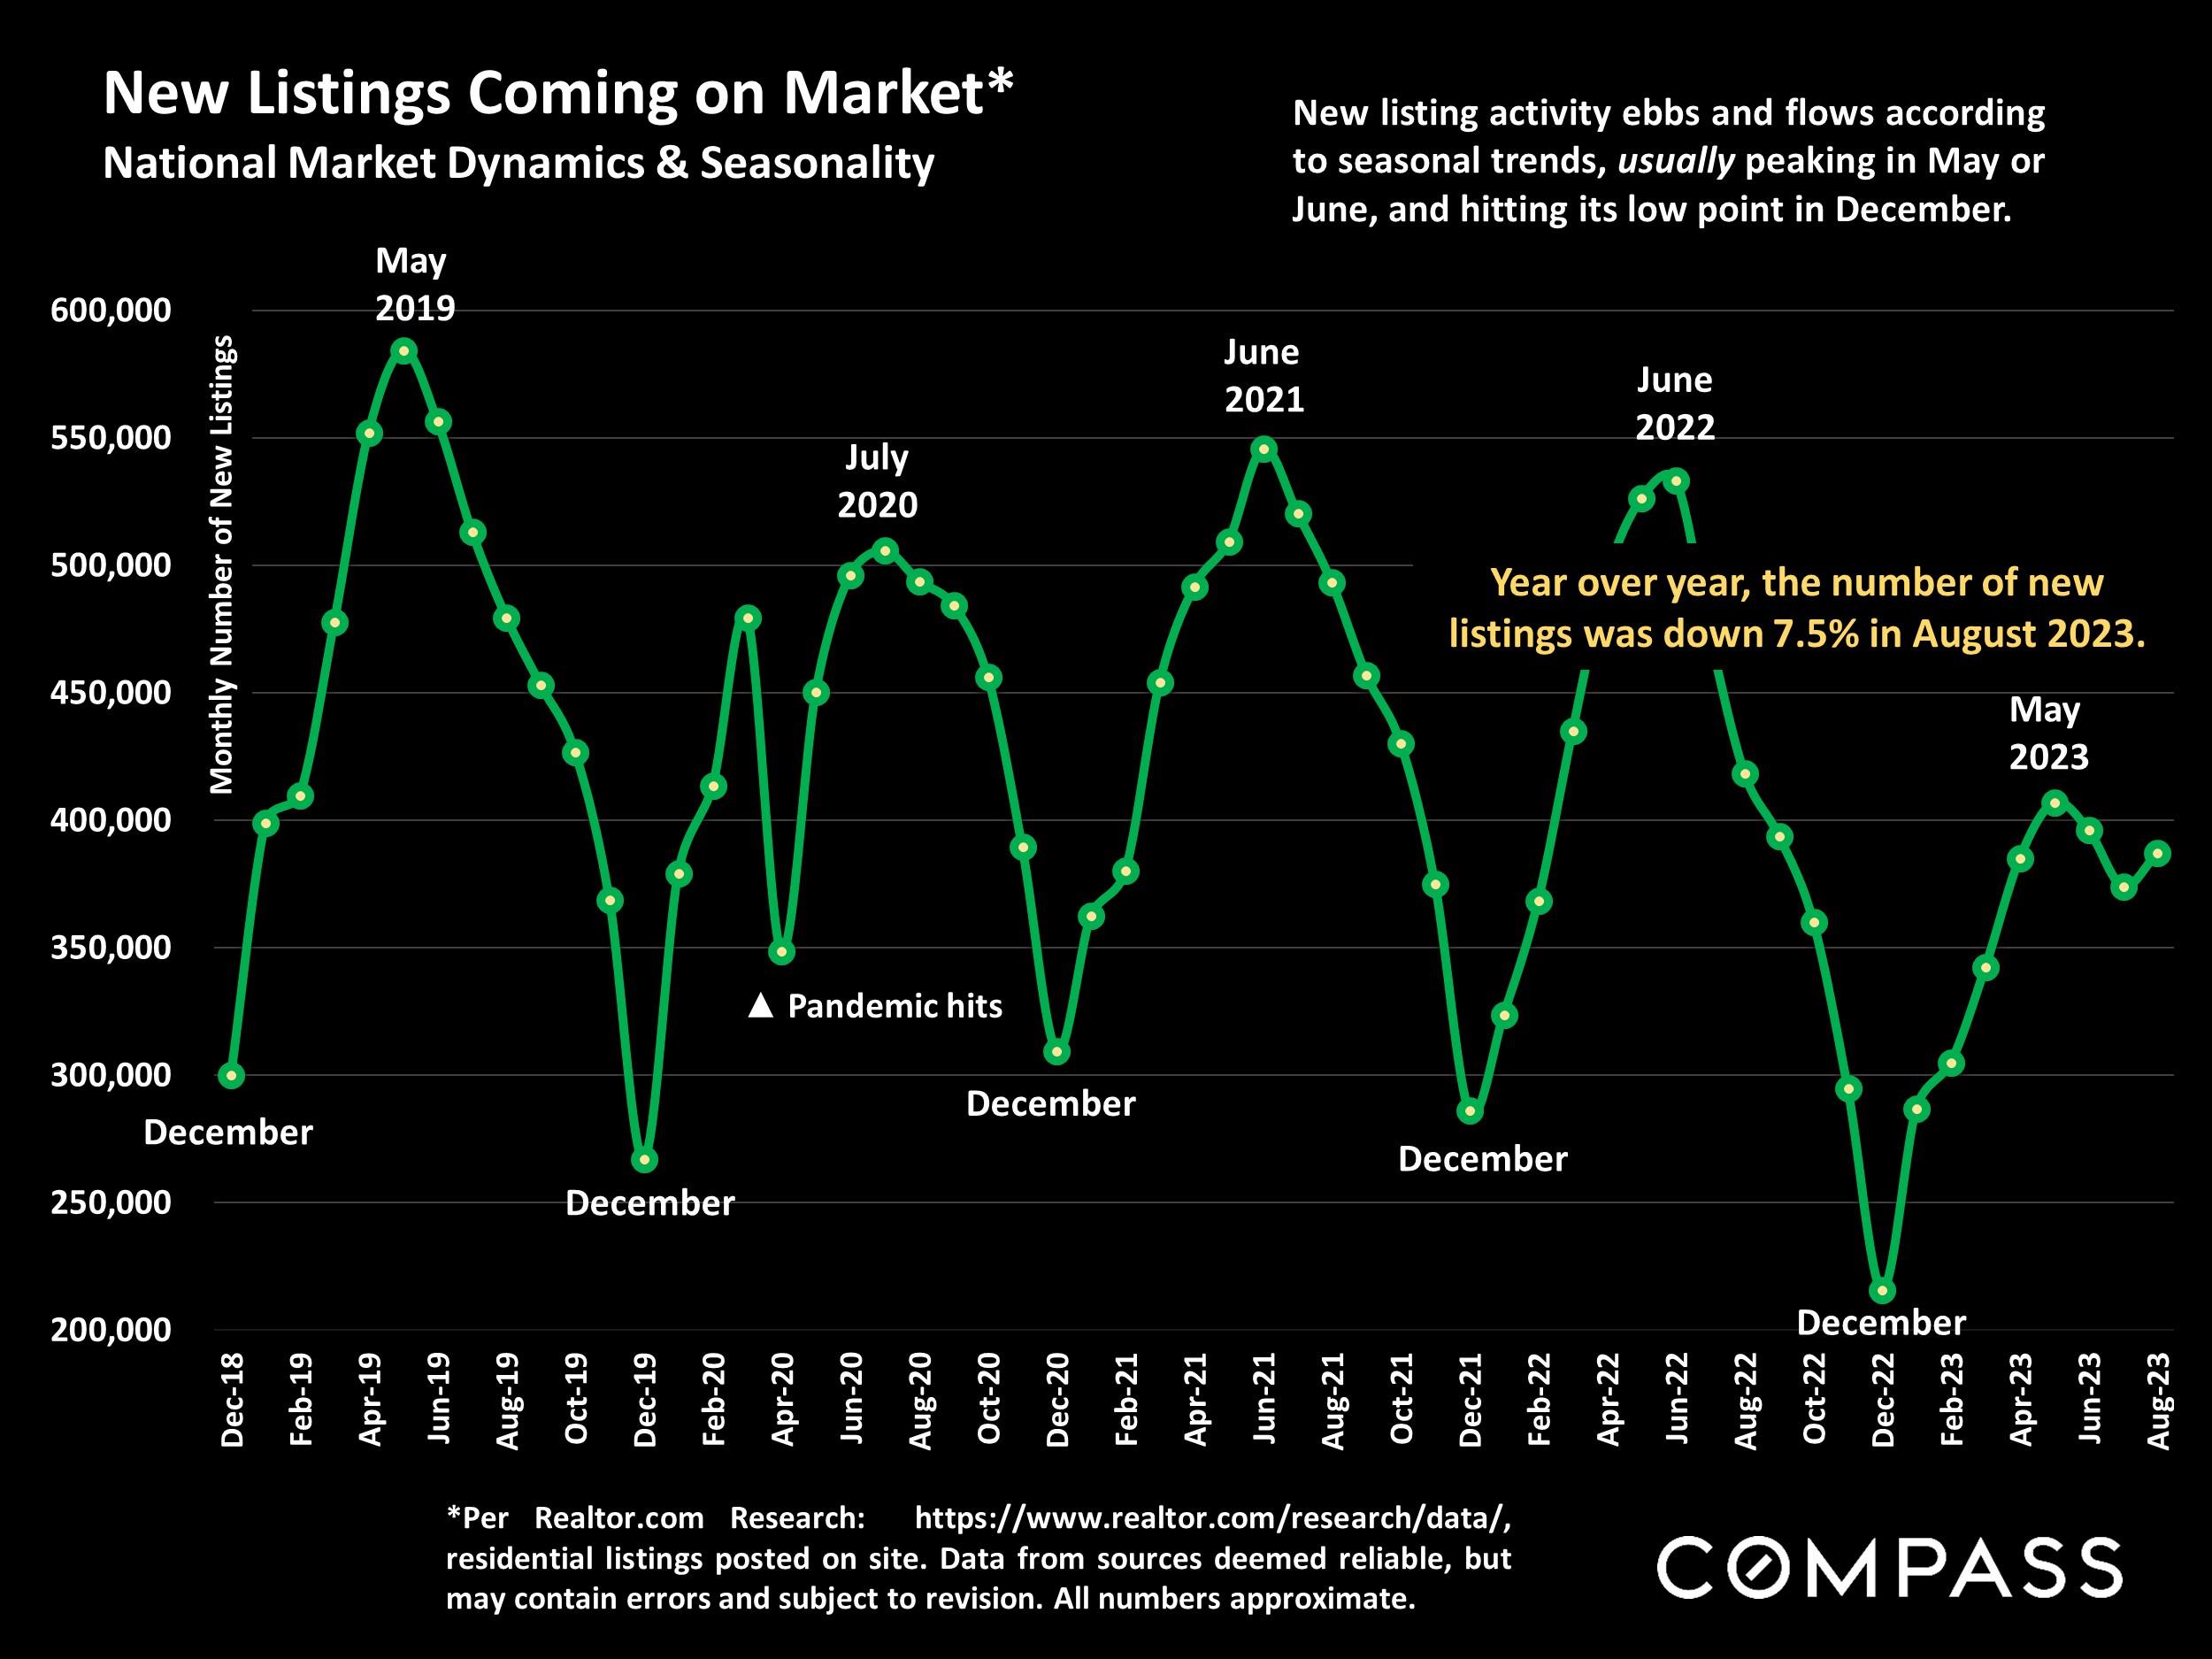
After the usual summer slowdown from the spring peak, the autumn selling season began after Labor Day and runs until early-mid November, when the market typically begins its big, mid- winter holiday slowdown. By Thanksgiving, the number of new listings coming on market has plummeted, and December or January commonly sees the lowest level of monthly sales activity, as defined by listings going into contract.
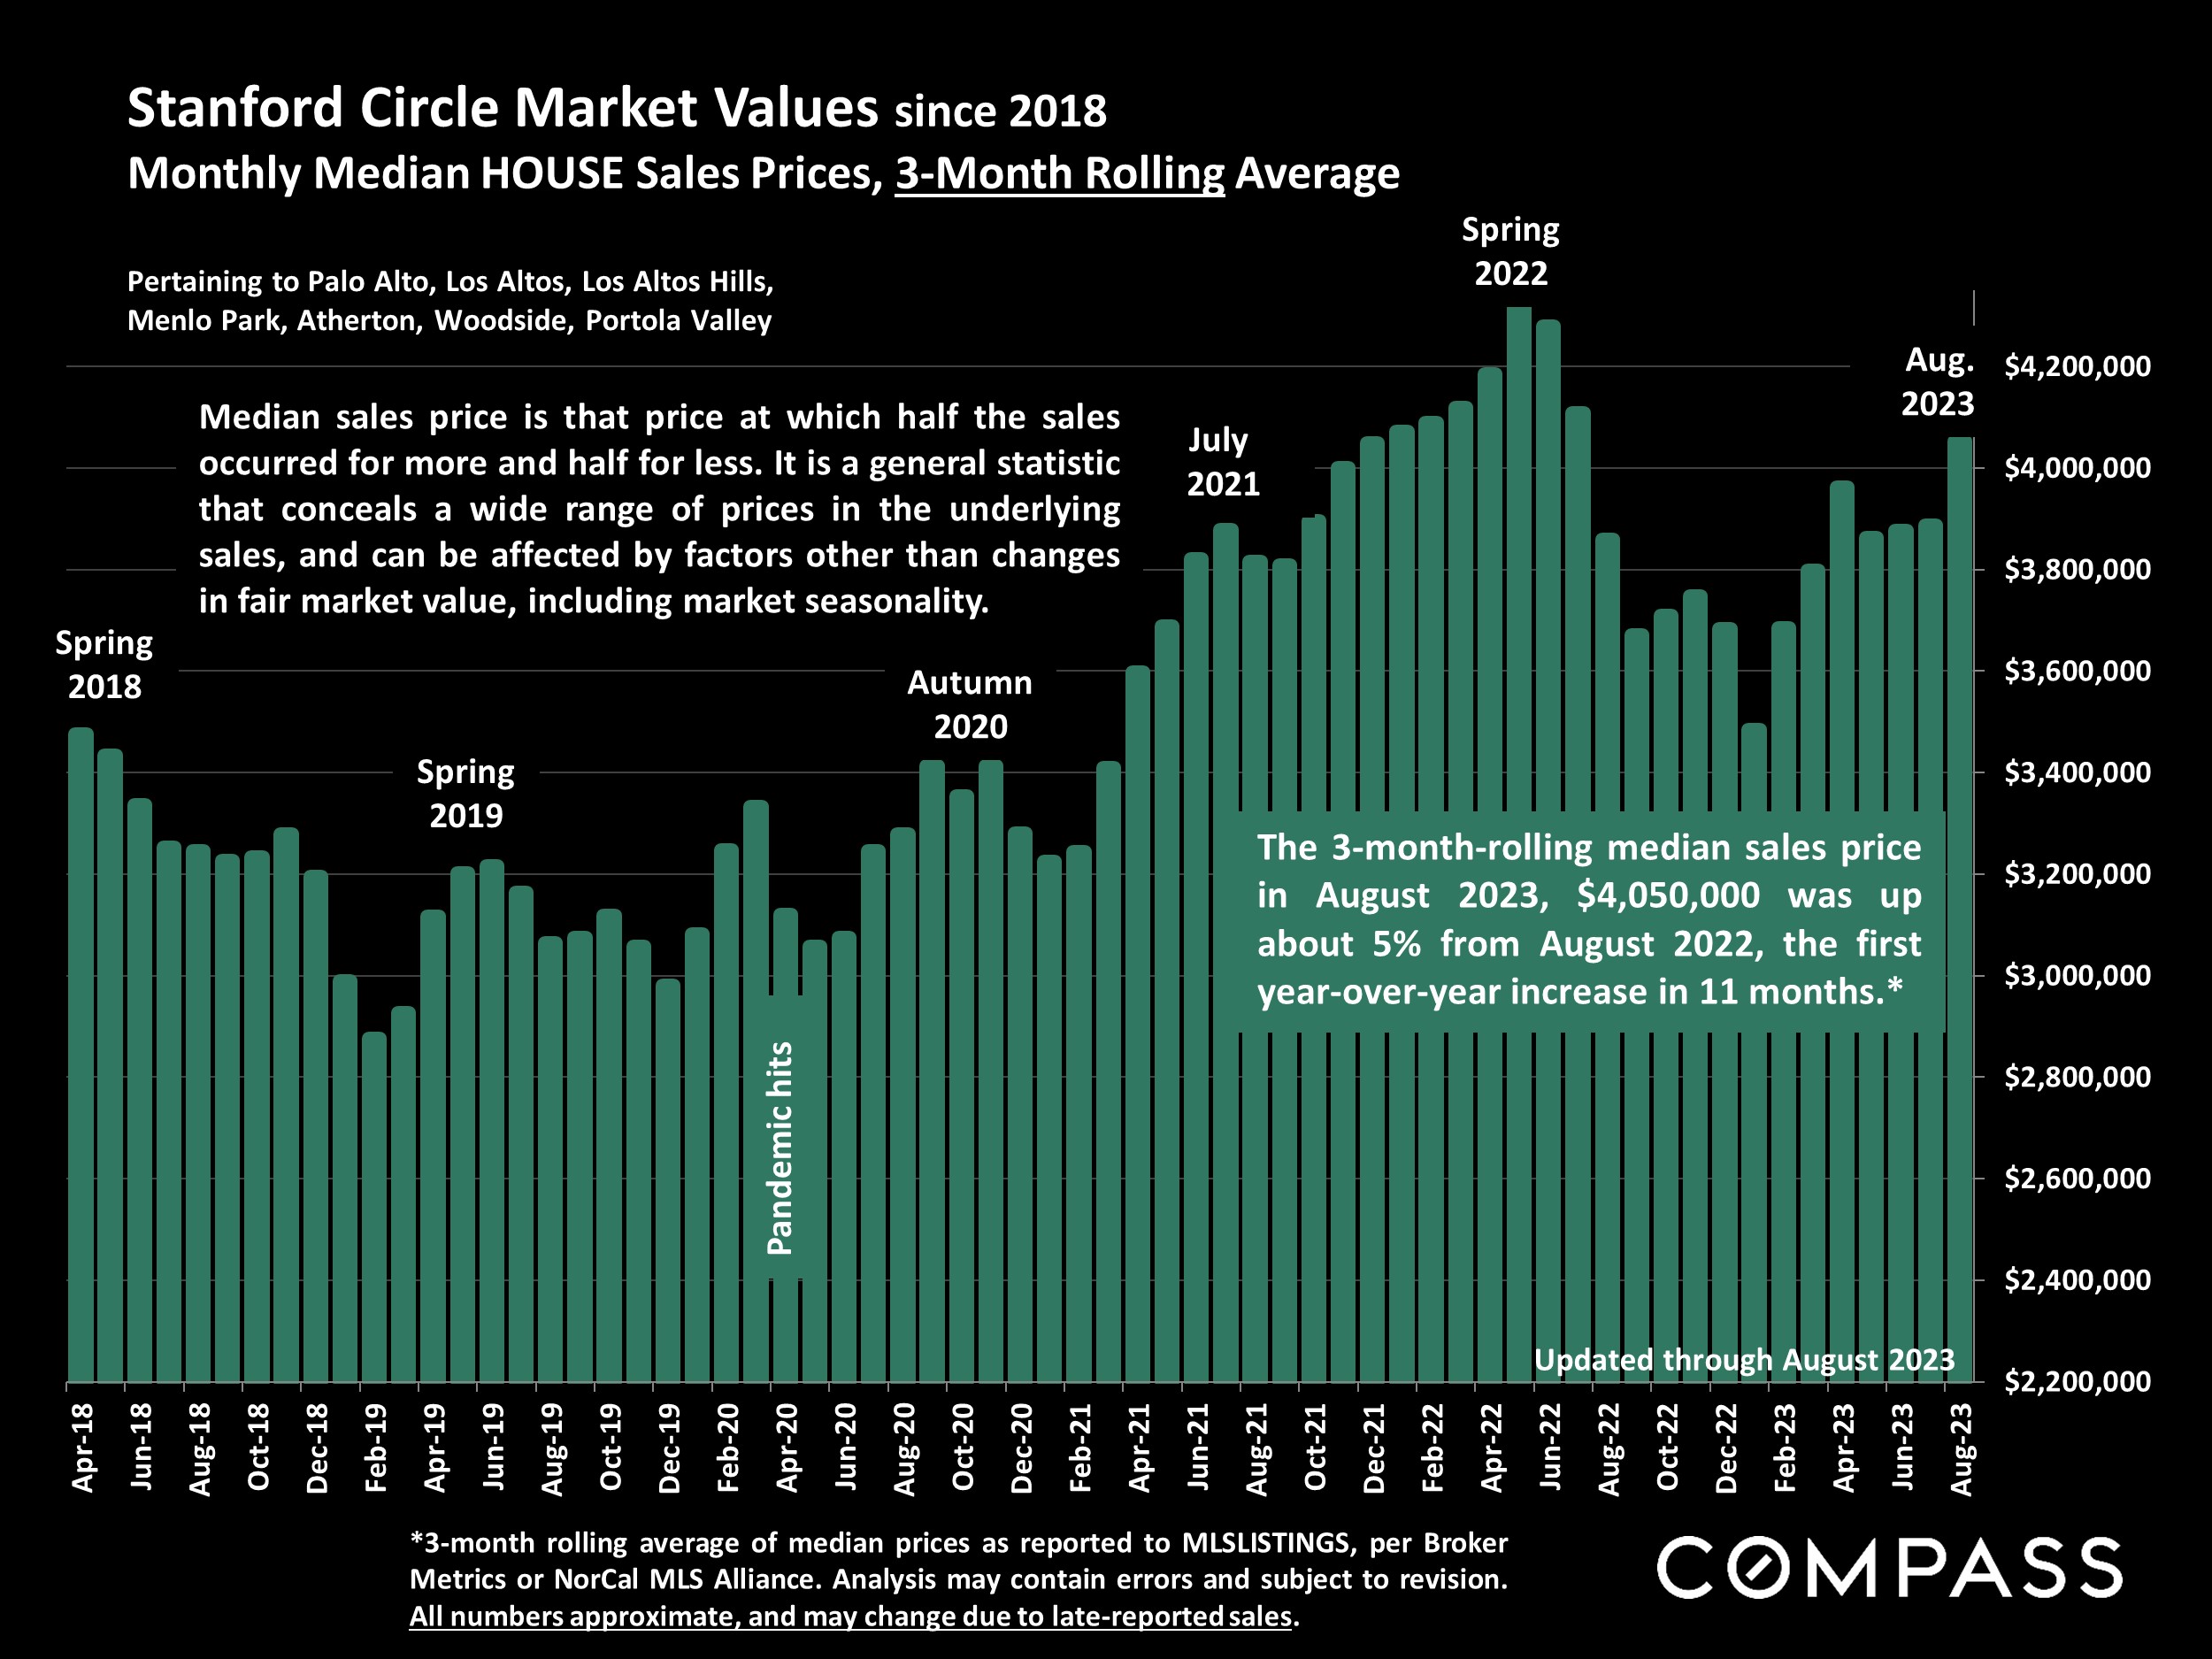
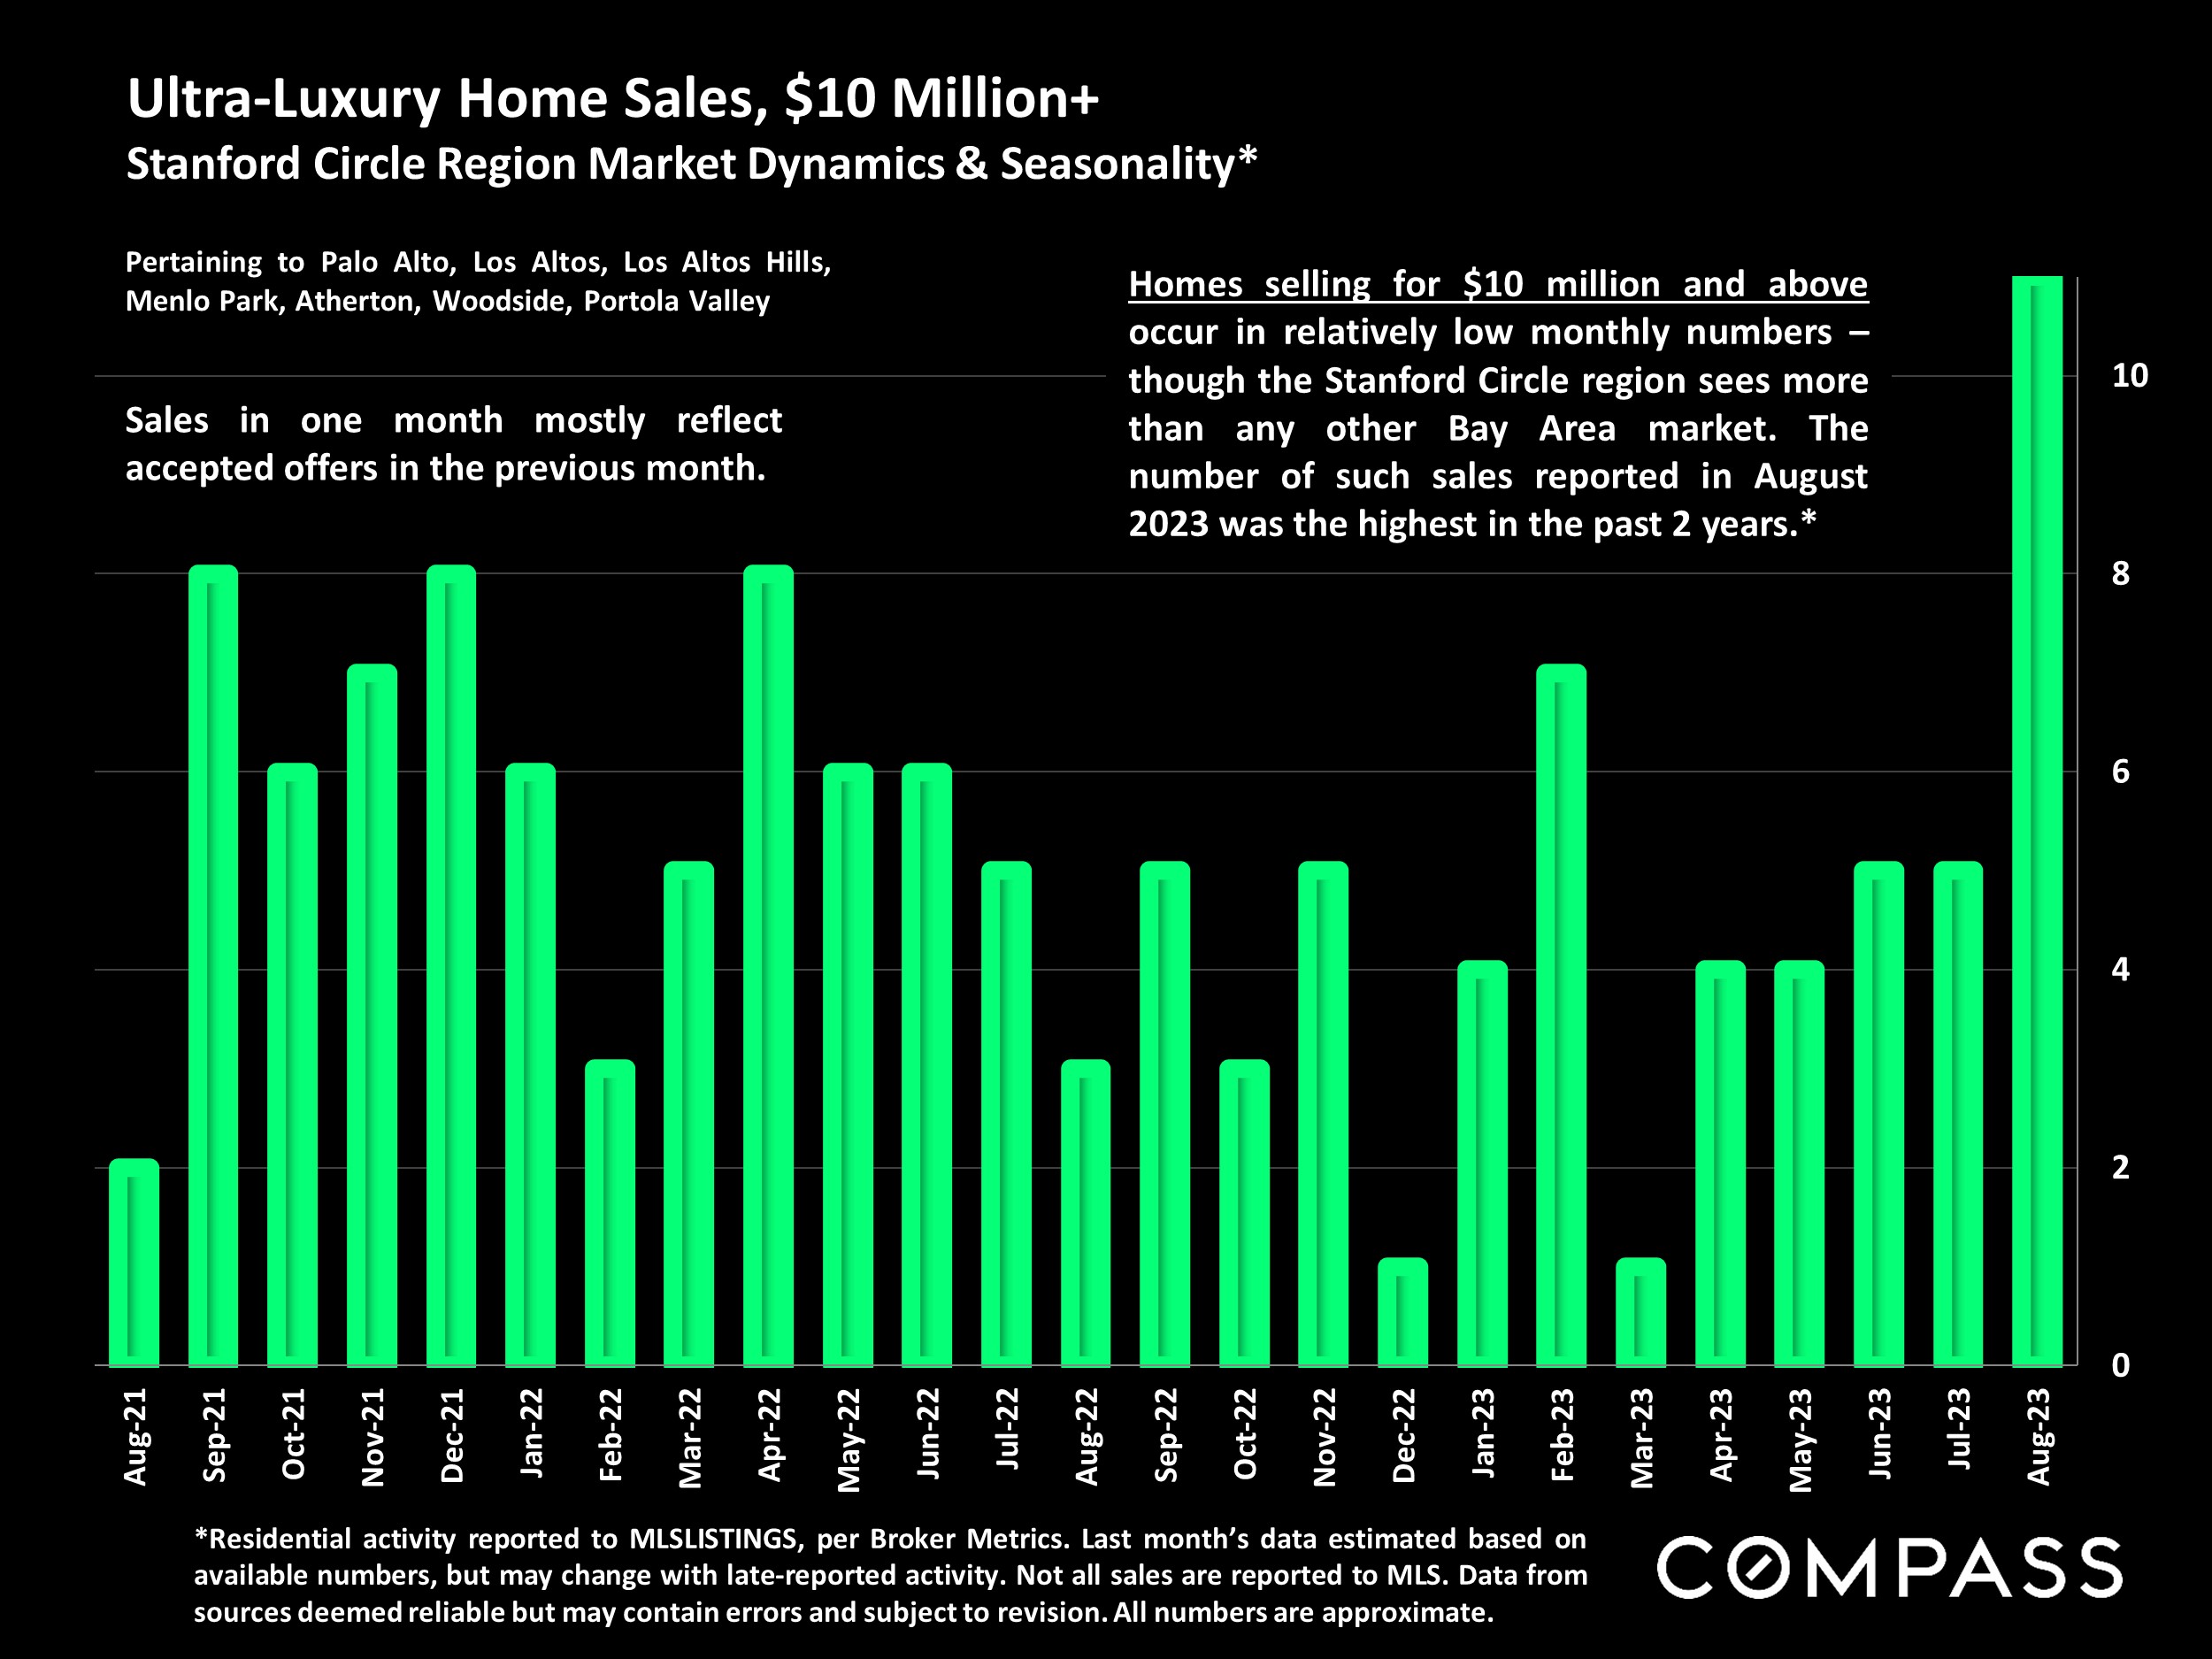
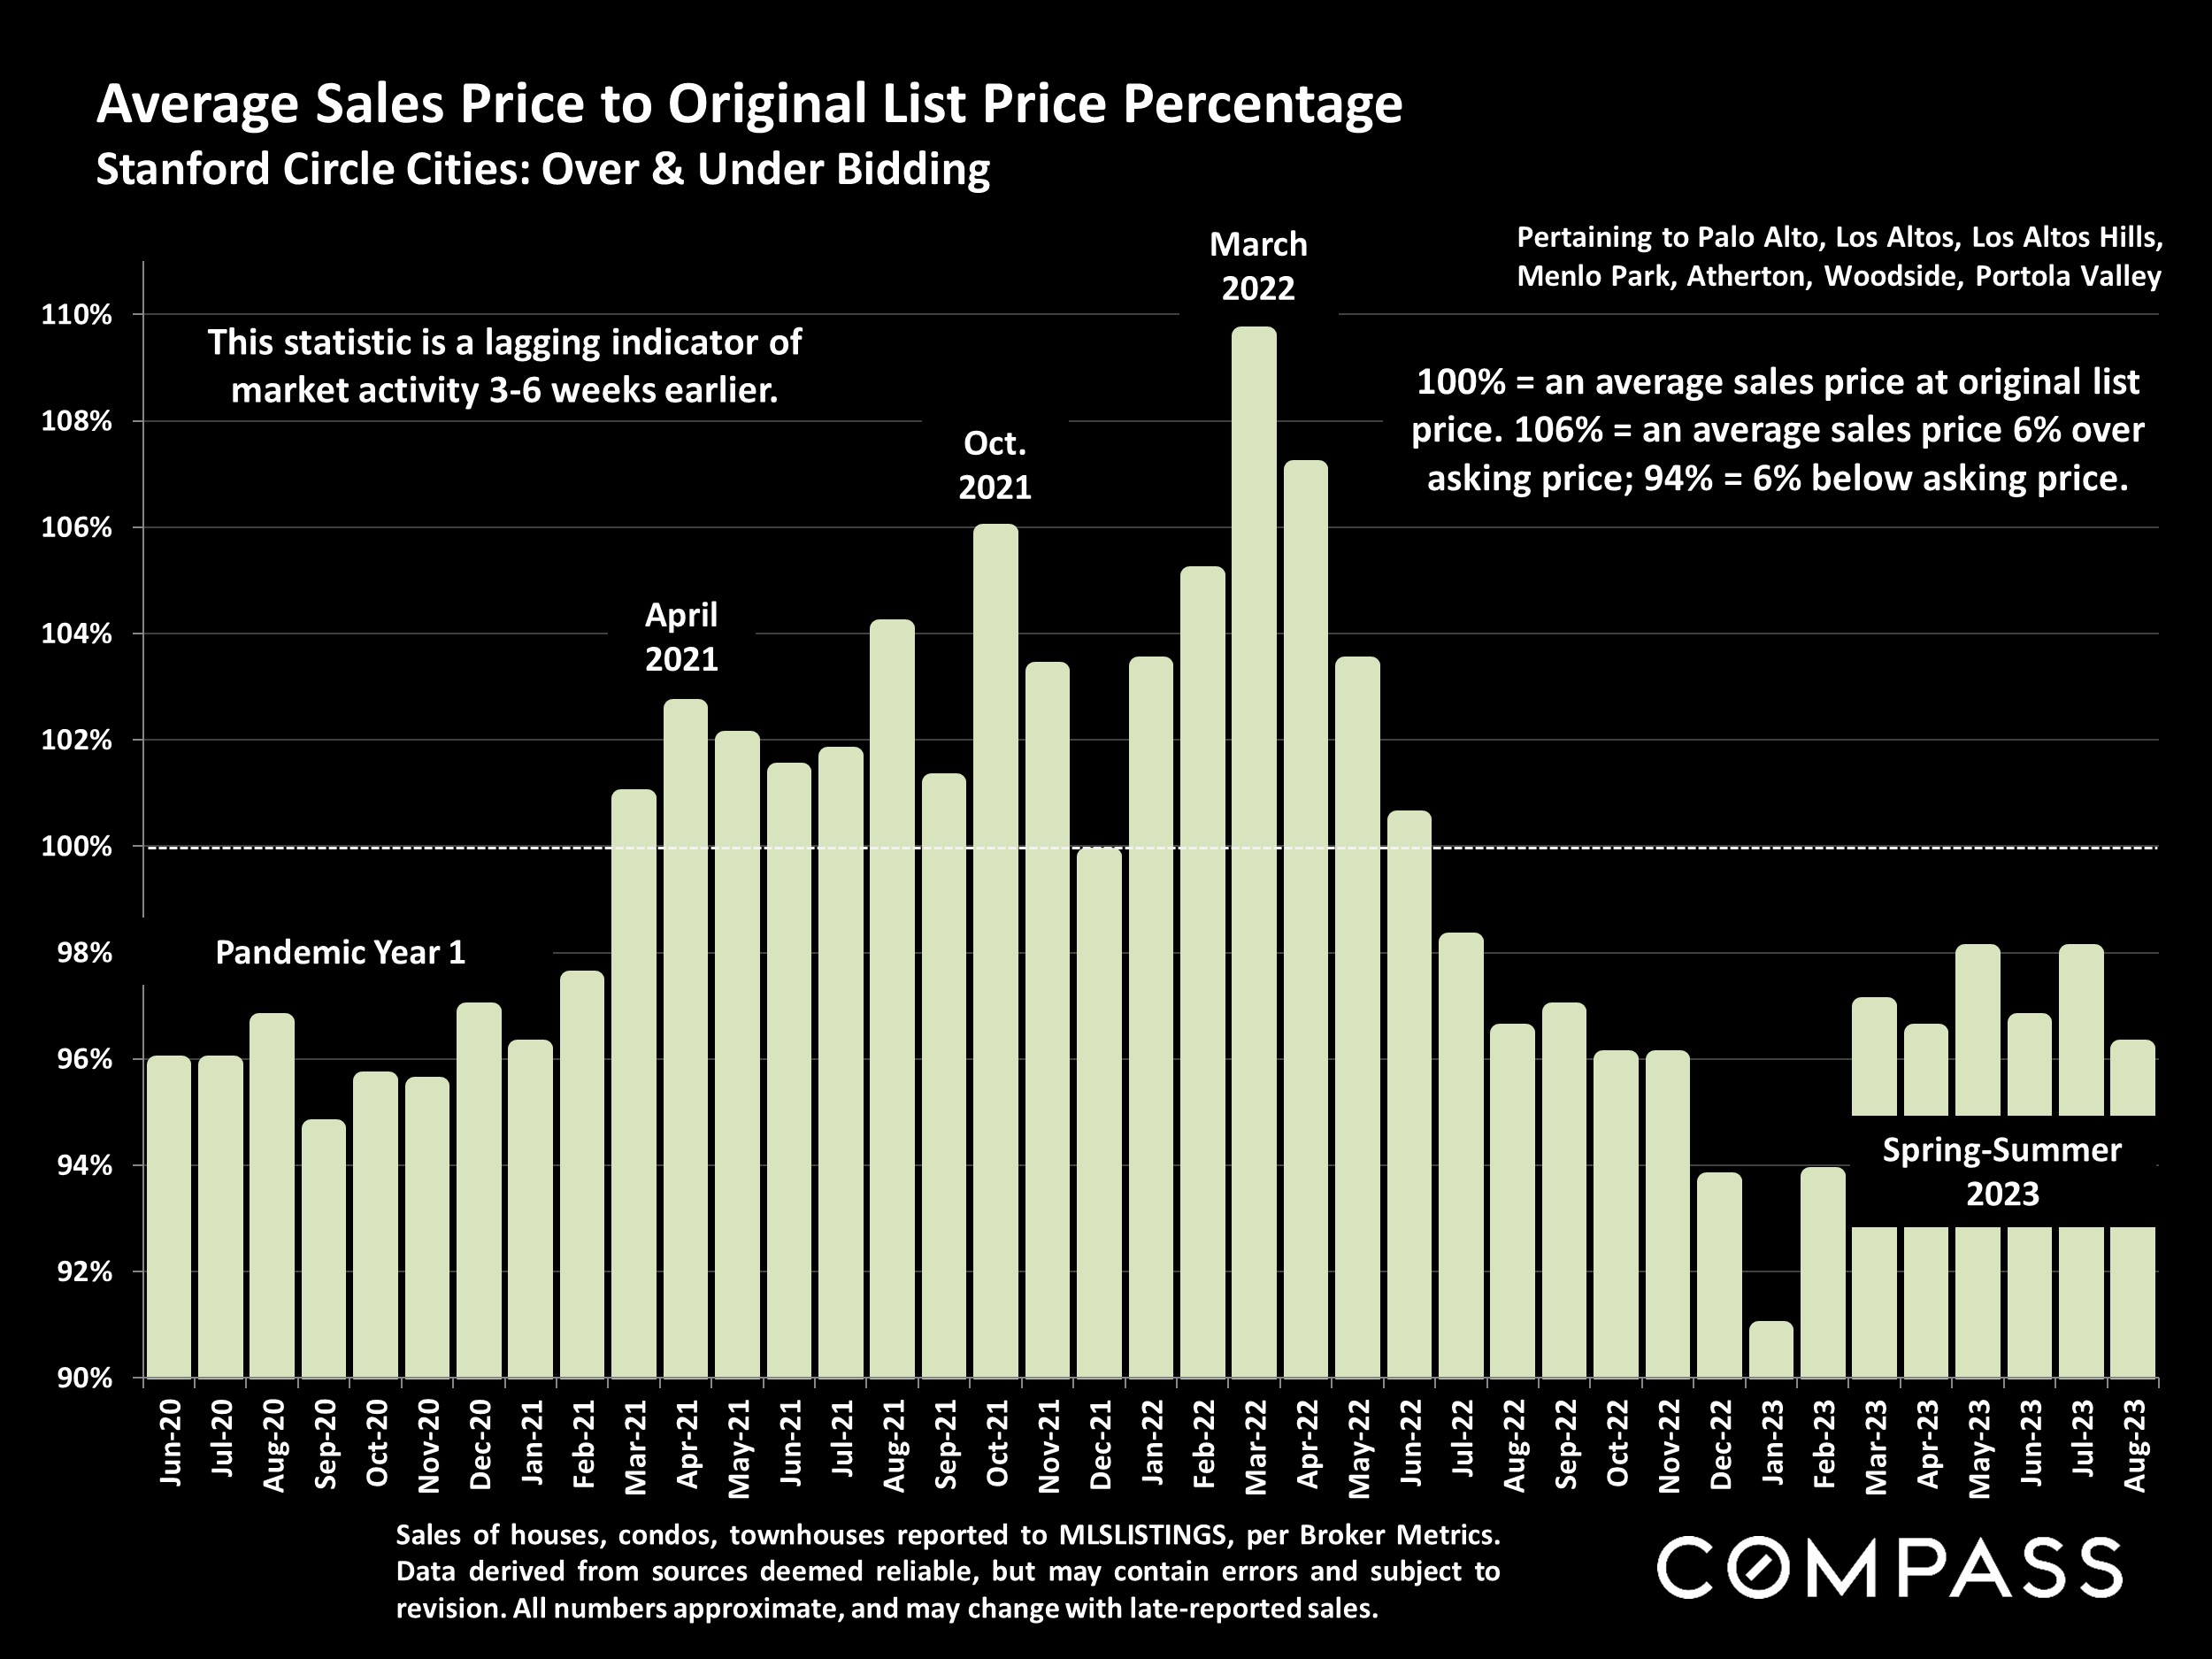
But, in the meantime, we expect to see substantial activity this fall: September often sees a considerable jump in the number of new listings for sale. Already in August, year-over-year median home sales price appreciation in the Stanford Circle region turned positive for the first time in 11 months. And the number of homes selling for $10 million and above unexpectedly hit its highest number in over 2 years.
Statistics are generalities, essentially summaries of widely disparate data generated by dozens, hundreds or thousands of unique, individual sales occurring within different time periods. They are best seen not as precise measurements, but as broad, comparative indicators, with reasonable margins of error. Anomalous fluctuations in statistics are not uncommon, especially in smaller, expensive market segments. Last period data should be considered estimates that may change with late-reported data. Different analytics programs sometimes define statistics – such as “active listings,” “days on market,” and “months supply of inventory” – differently: what is most meaningful are not specific calculations but the trends they illustrate. Most listing and sales data derives from the local or regional multi-listing service (MLS) of the area specified in the analysis, but not all listings or sales are reported to MLS and these won’t be reflected in the data. “Homes” signifies real-property, single-household housing units: houses, condos, co-ops, townhouses, duets and TICs (but not mobile homes), as applicable to each market. City/town names refer specifically to the named cities and towns, unless otherwise delineated. Multi-county metro areas will be specified as such. Data from sources deemed reliable, but may contain errors and subject to revision. All numbers to be considered approximate.
Many aspects of value cannot be adequately reflected in median and average statistics: curb appeal, age, condition, amenities, views, lot size, quality of outdoor space, “bonus” rooms, additional parking, quality of location within the neighborhood, and so on. How any of these statistics apply to any particular home is unknown without a specific comparative market analysis. Median Sales Price is that price at which half the properties sold for more and half for less. It may be affected by seasonality, “unusual” events, or changes in inventory and buying trends, as well as by changes in fair market value. The median sales price for an area will often conceal an enormous variety of sales prices in the underlying individual sales.
Dollar per Square Foot is based upon the home’s interior living space and does not include garages, unfinished attics and basements, rooms built without permit, patios, decks or yards (though all those can add value to a home). These figures are usually derived from appraisals or tax records, but are sometimes unreliable (especially for older homes) or unreported altogether. The calculation can only be made on those home sales that reported square footage.
Compass is a real estate broker licensed by the State of California, DRE 01527235. Equal Housing Opportunity. This report has been prepared solely for information purposes. The information herein is based on or derived from information generally available to the public and/or from sources believed to be reliable. No representation or warranty can be given with respect to the accuracy or completeness of the information. Compass disclaims any and all liability relating to this report, including without limitation any express or implied representations or warranties for statements contained in, and omissions from, the report. Nothing contained herein is intended to be or should be read as any regulatory, legal, tax, accounting or other advice and Compass does not provide such advice. All opinions are subject to change without notice. Compass makes no representation regarding the accuracy of any statements regarding any references to the laws, statutes or regulations of any state are those of the author(s). Past performance is no guarantee of future results.
“The surprisingly quick recovery [of the housing market] suggests that the residential real-estate downturn is turning out to be shorter and shallower than many housing economists expected after mortgage rates soared last year…There still aren’t enough homes for sale to meet demand.” The Wall Street Journal, “The Fall in Home Prices May Already Be Over,” 9/8/23
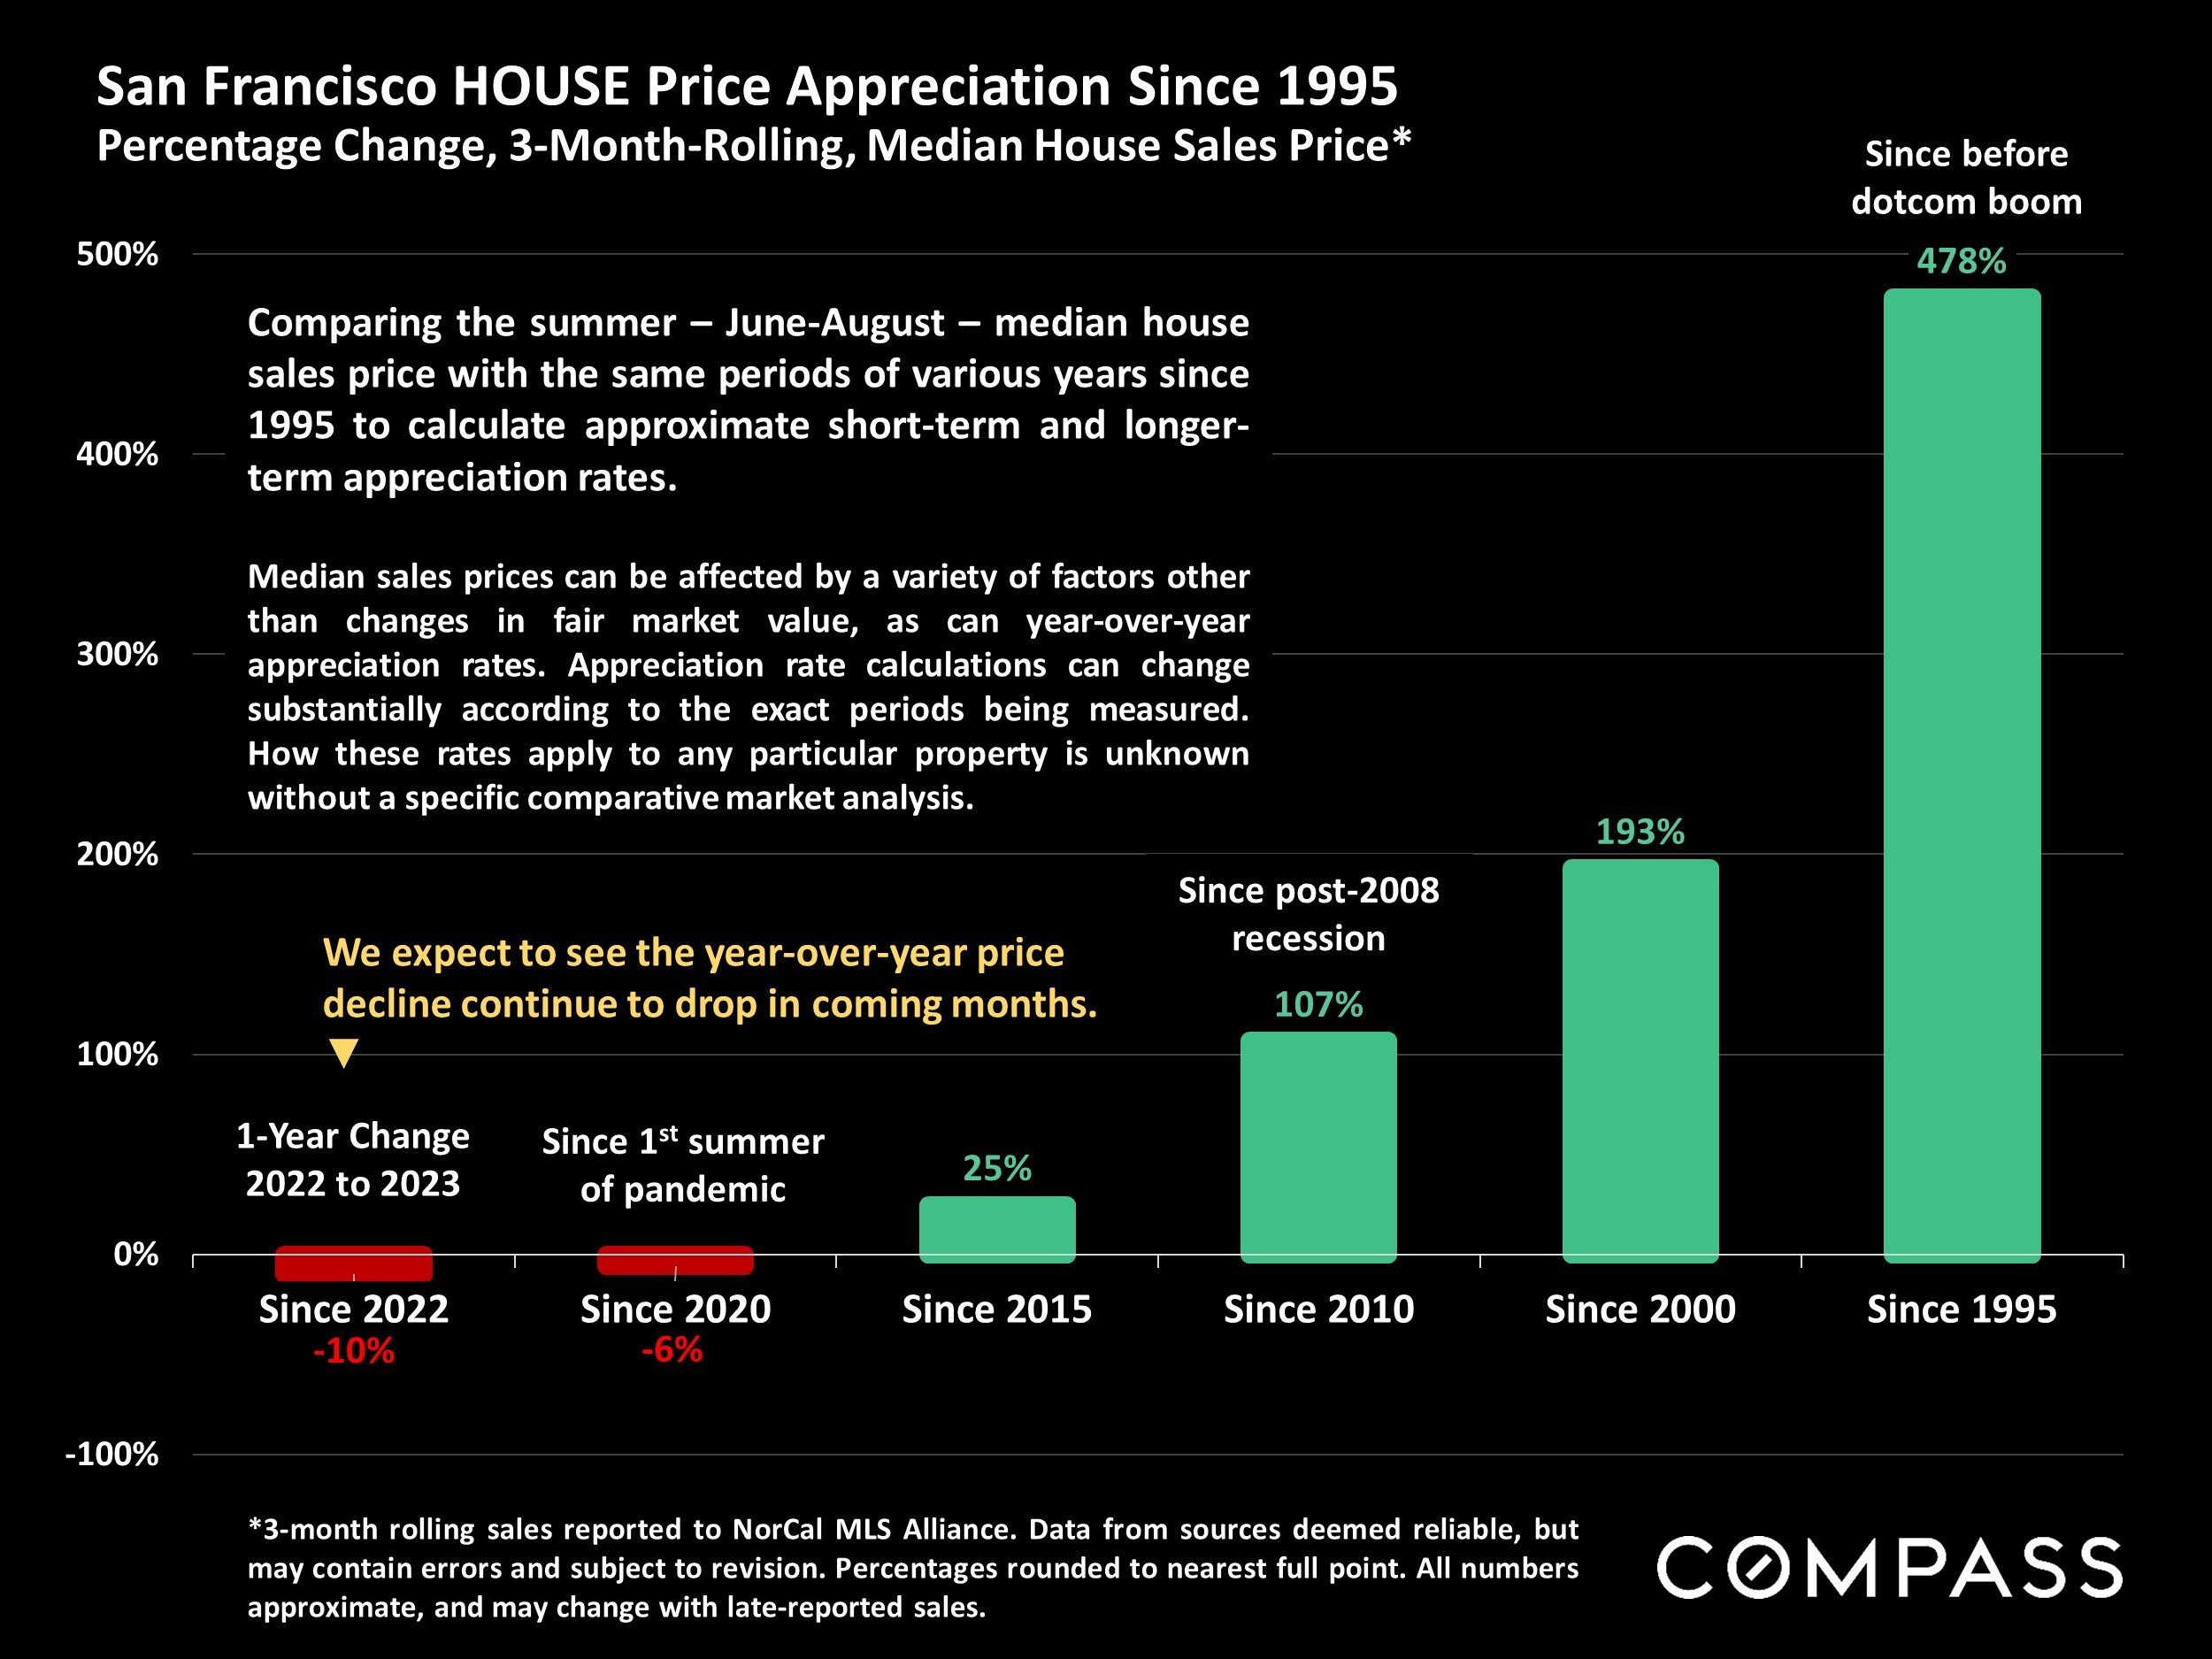
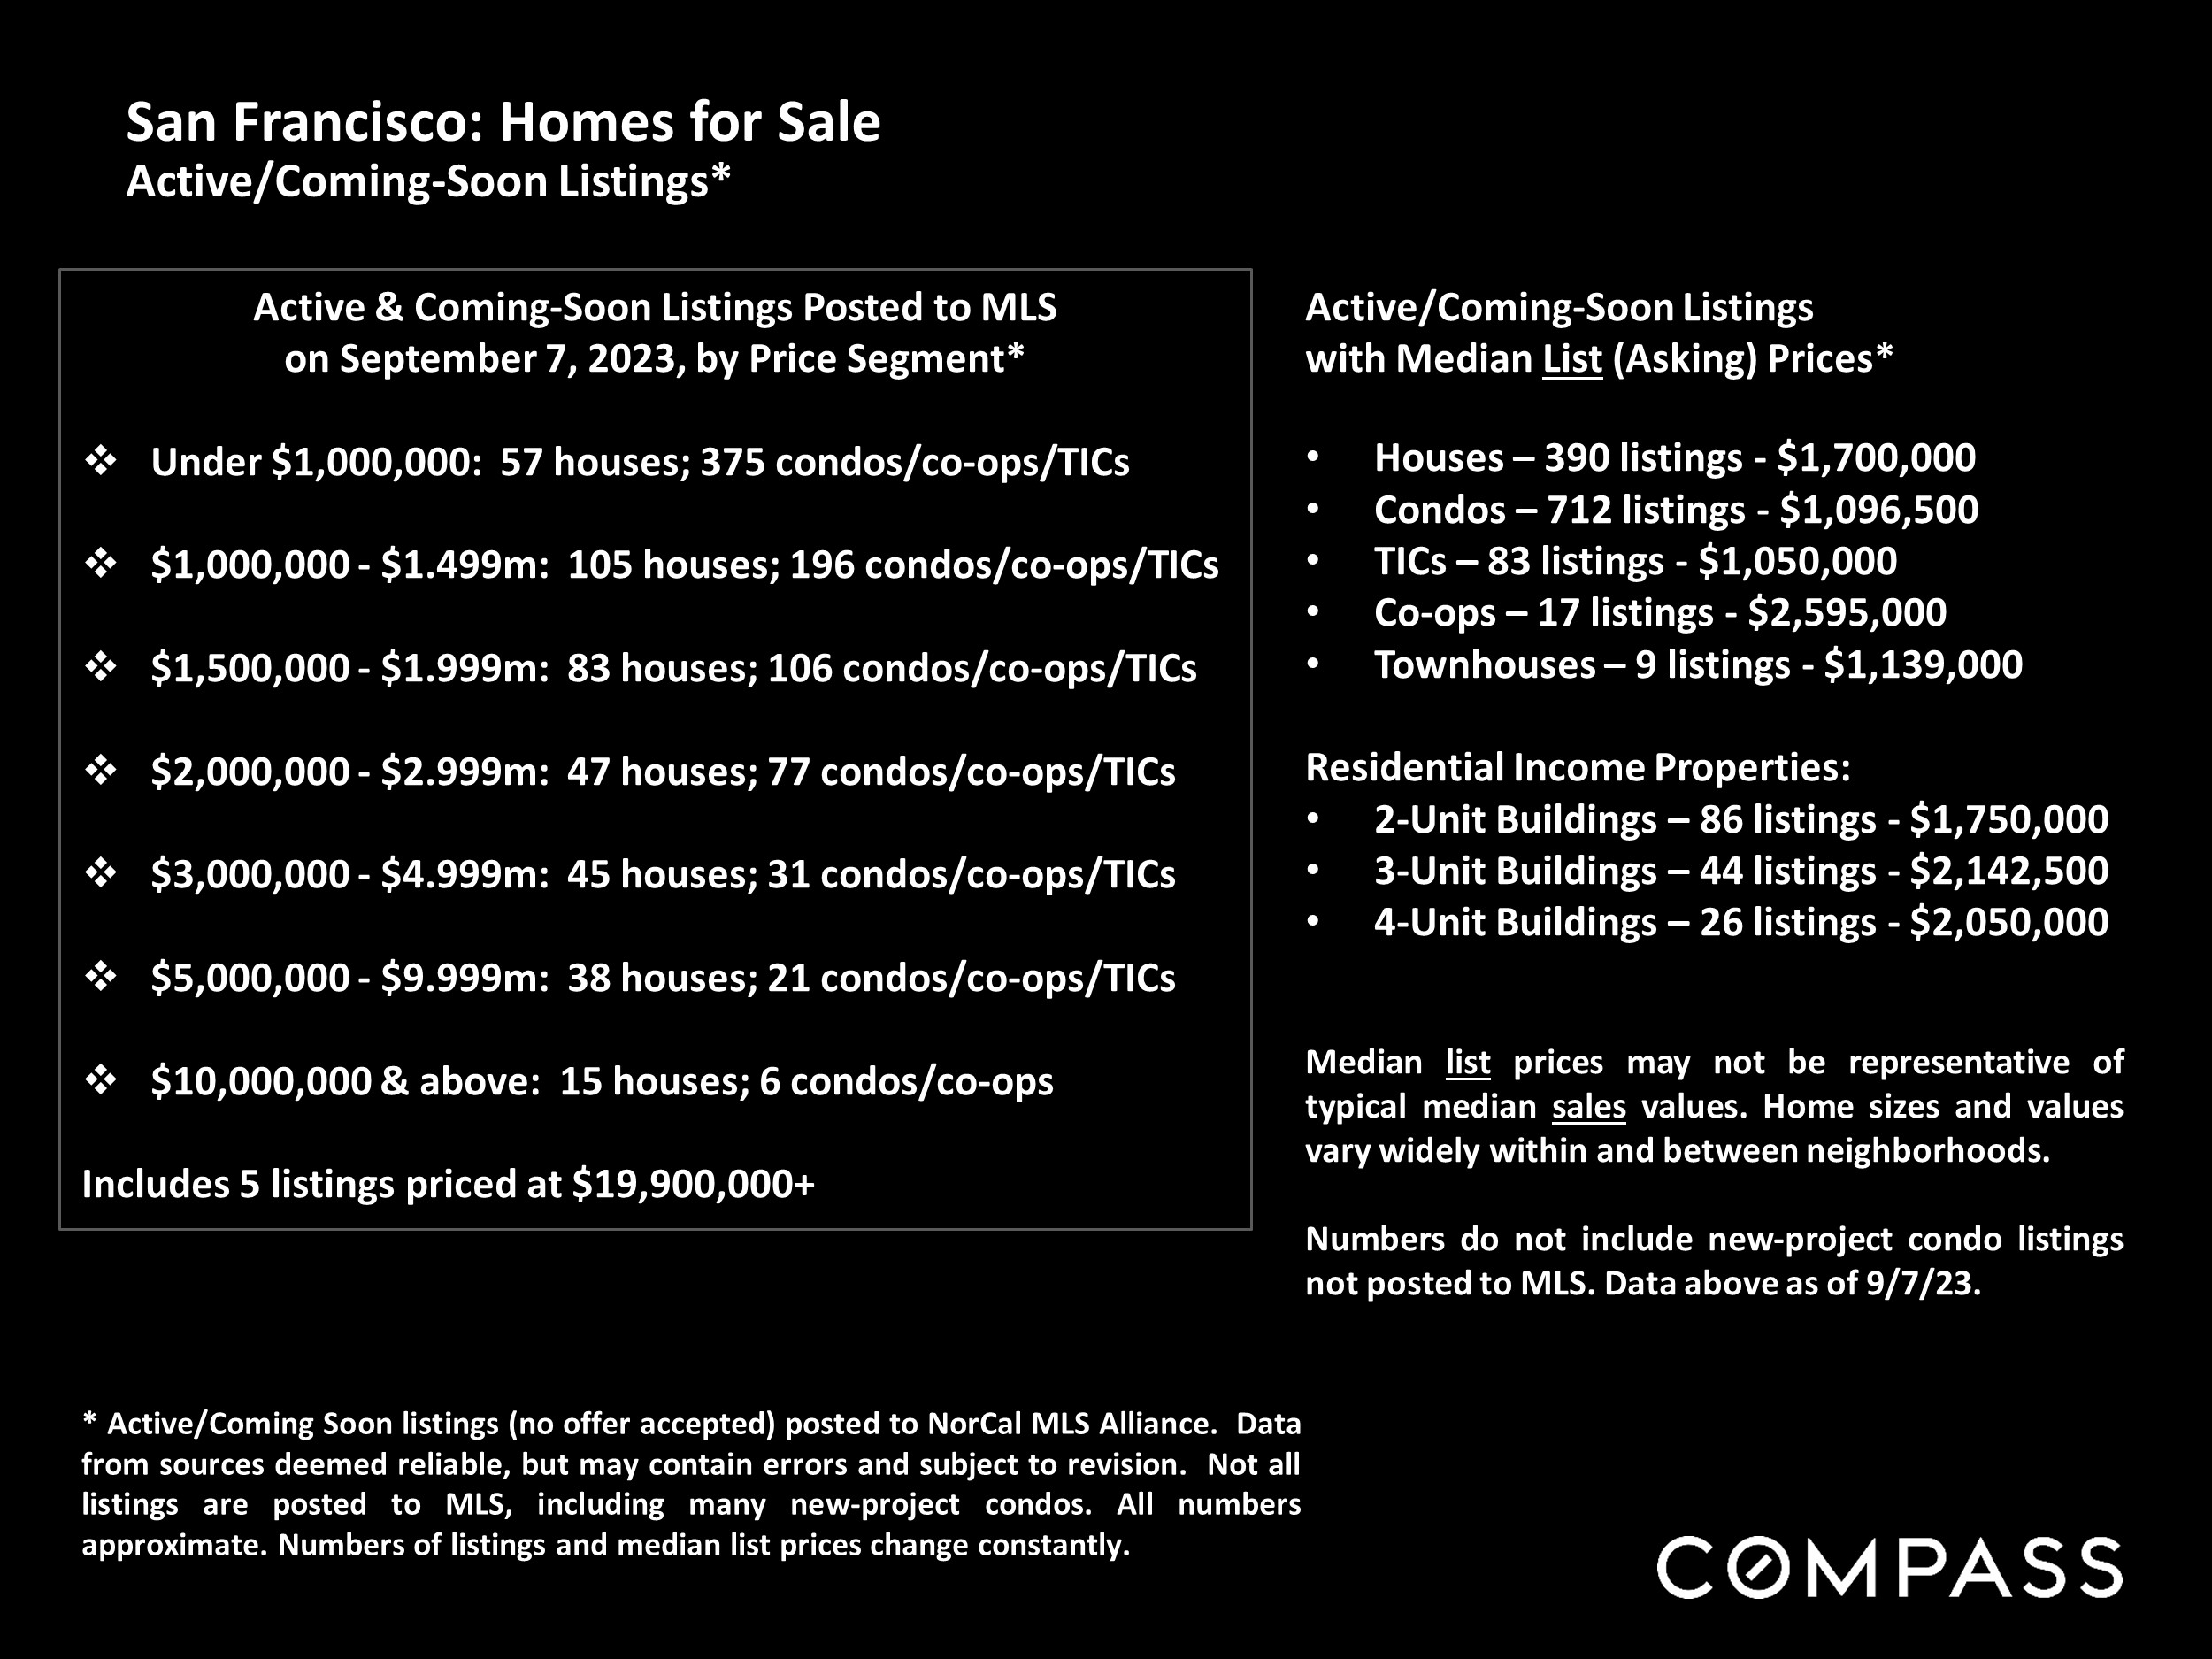
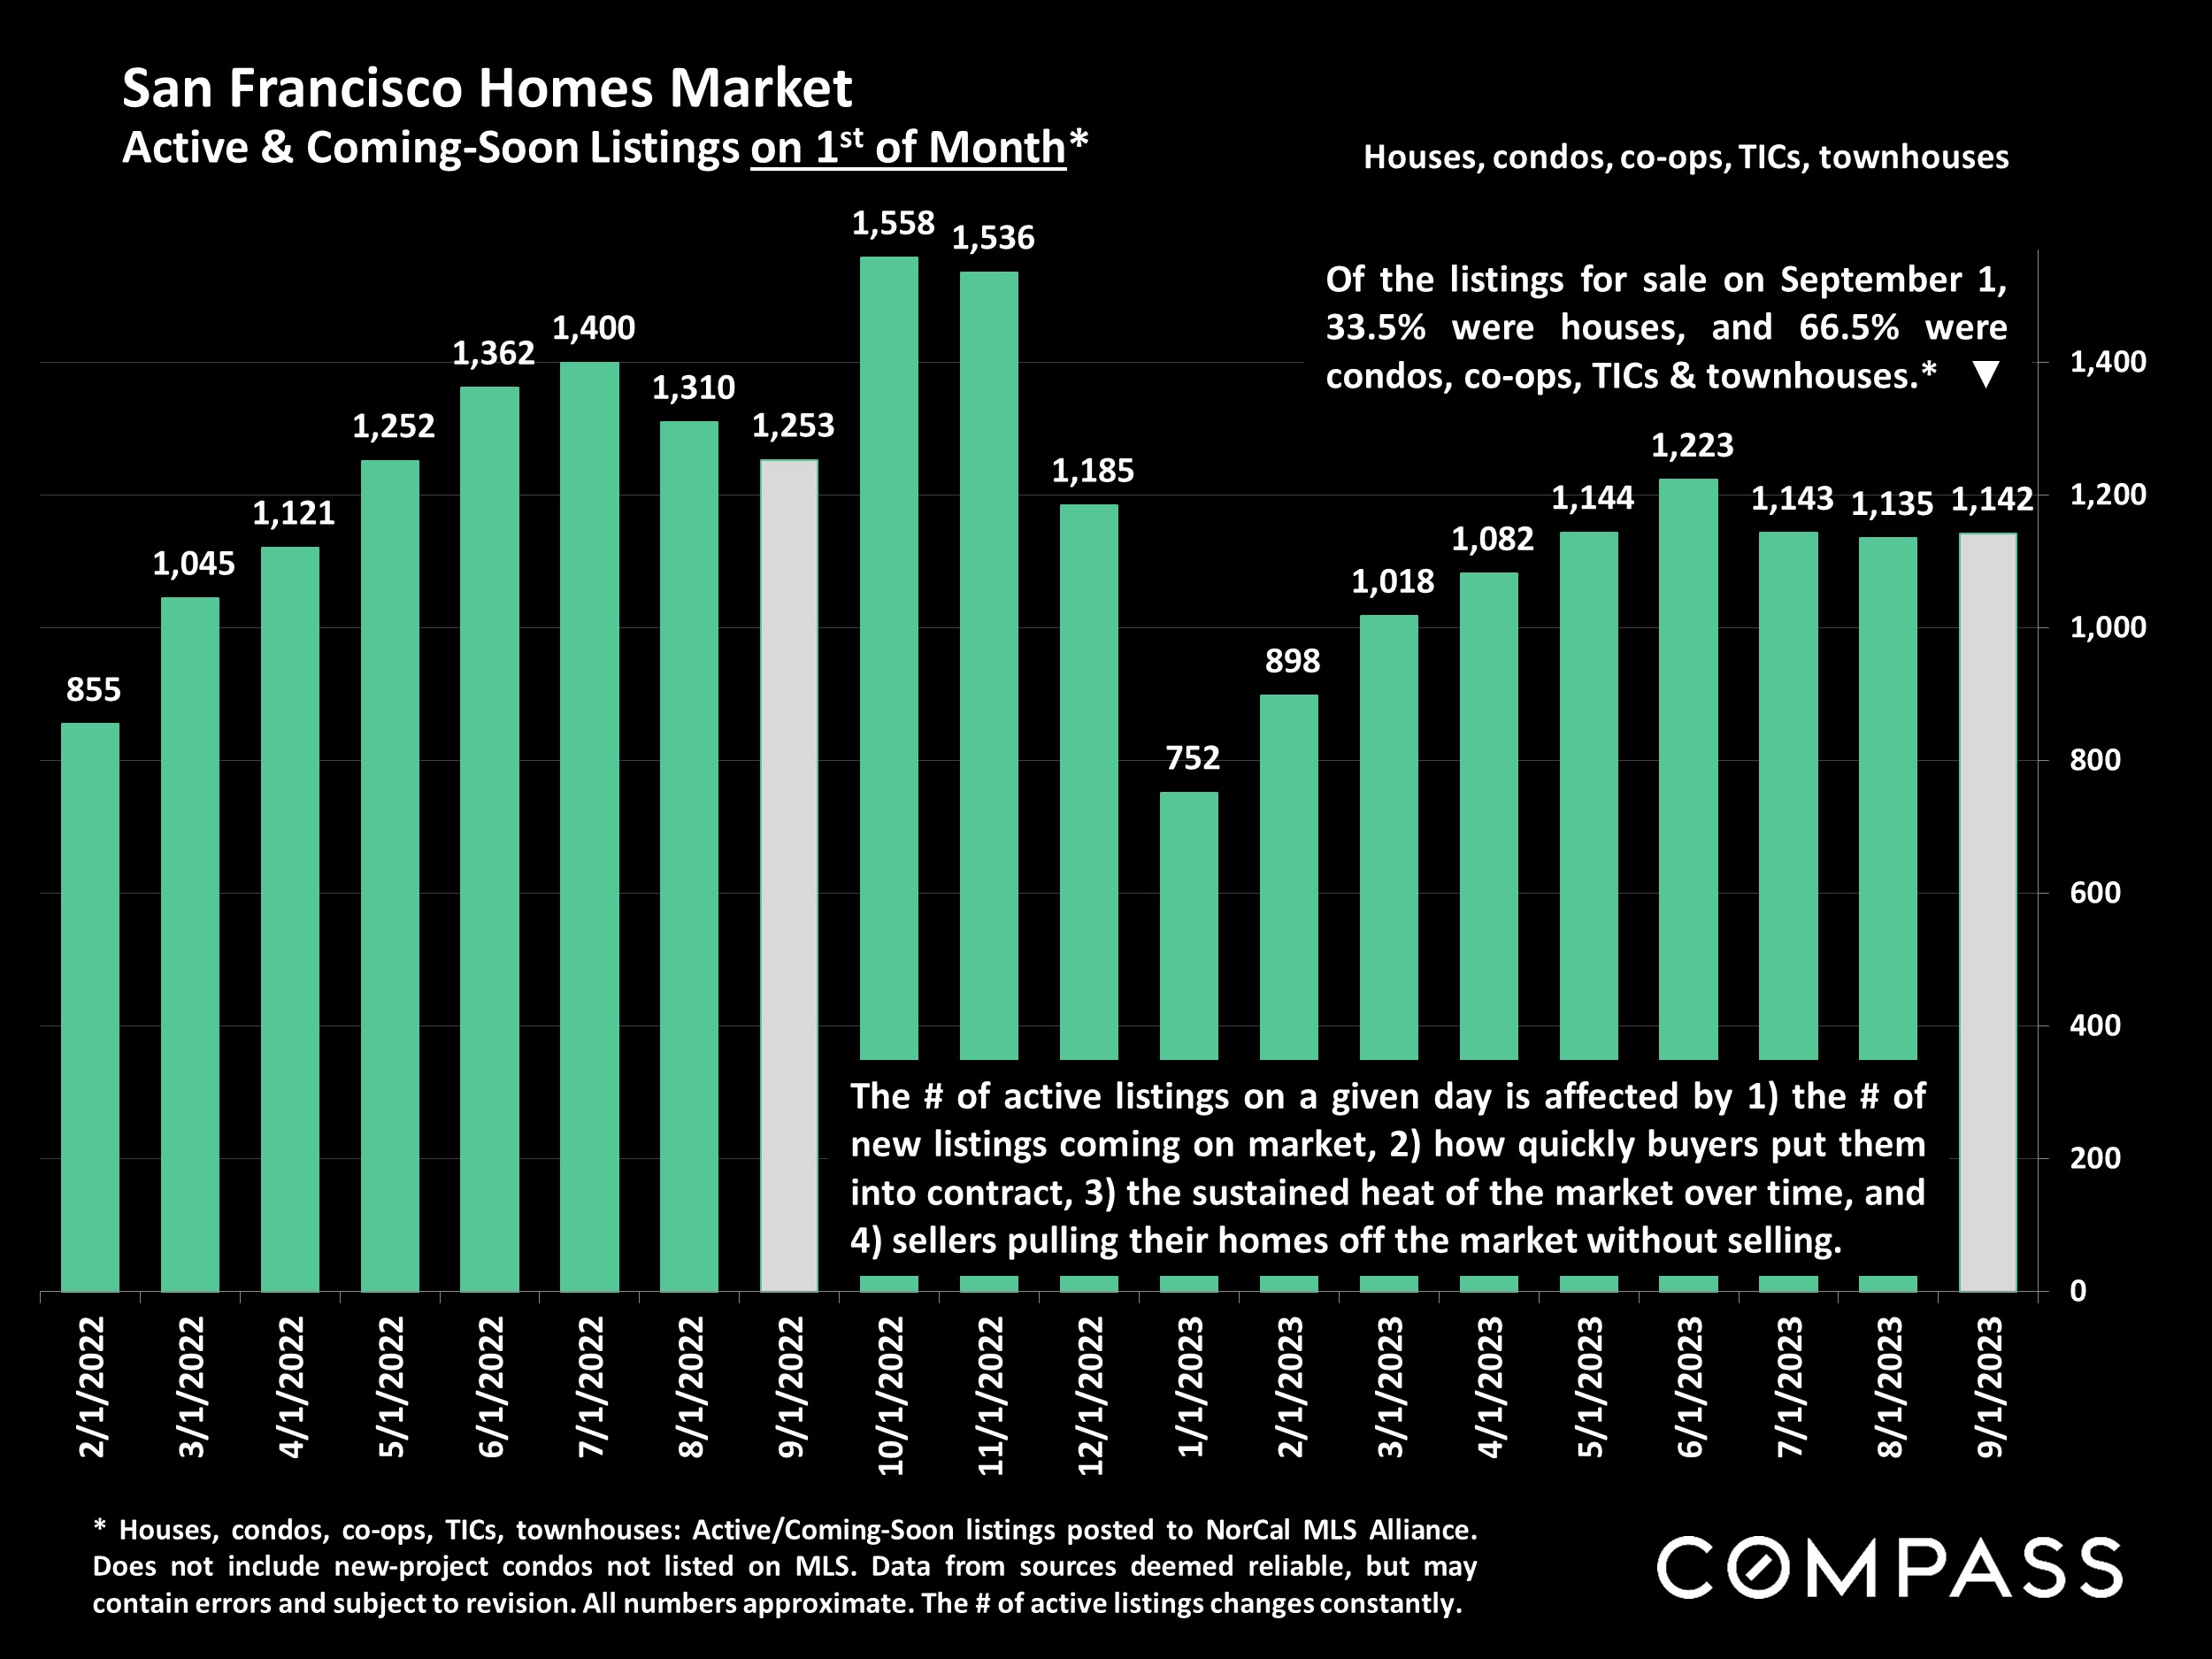
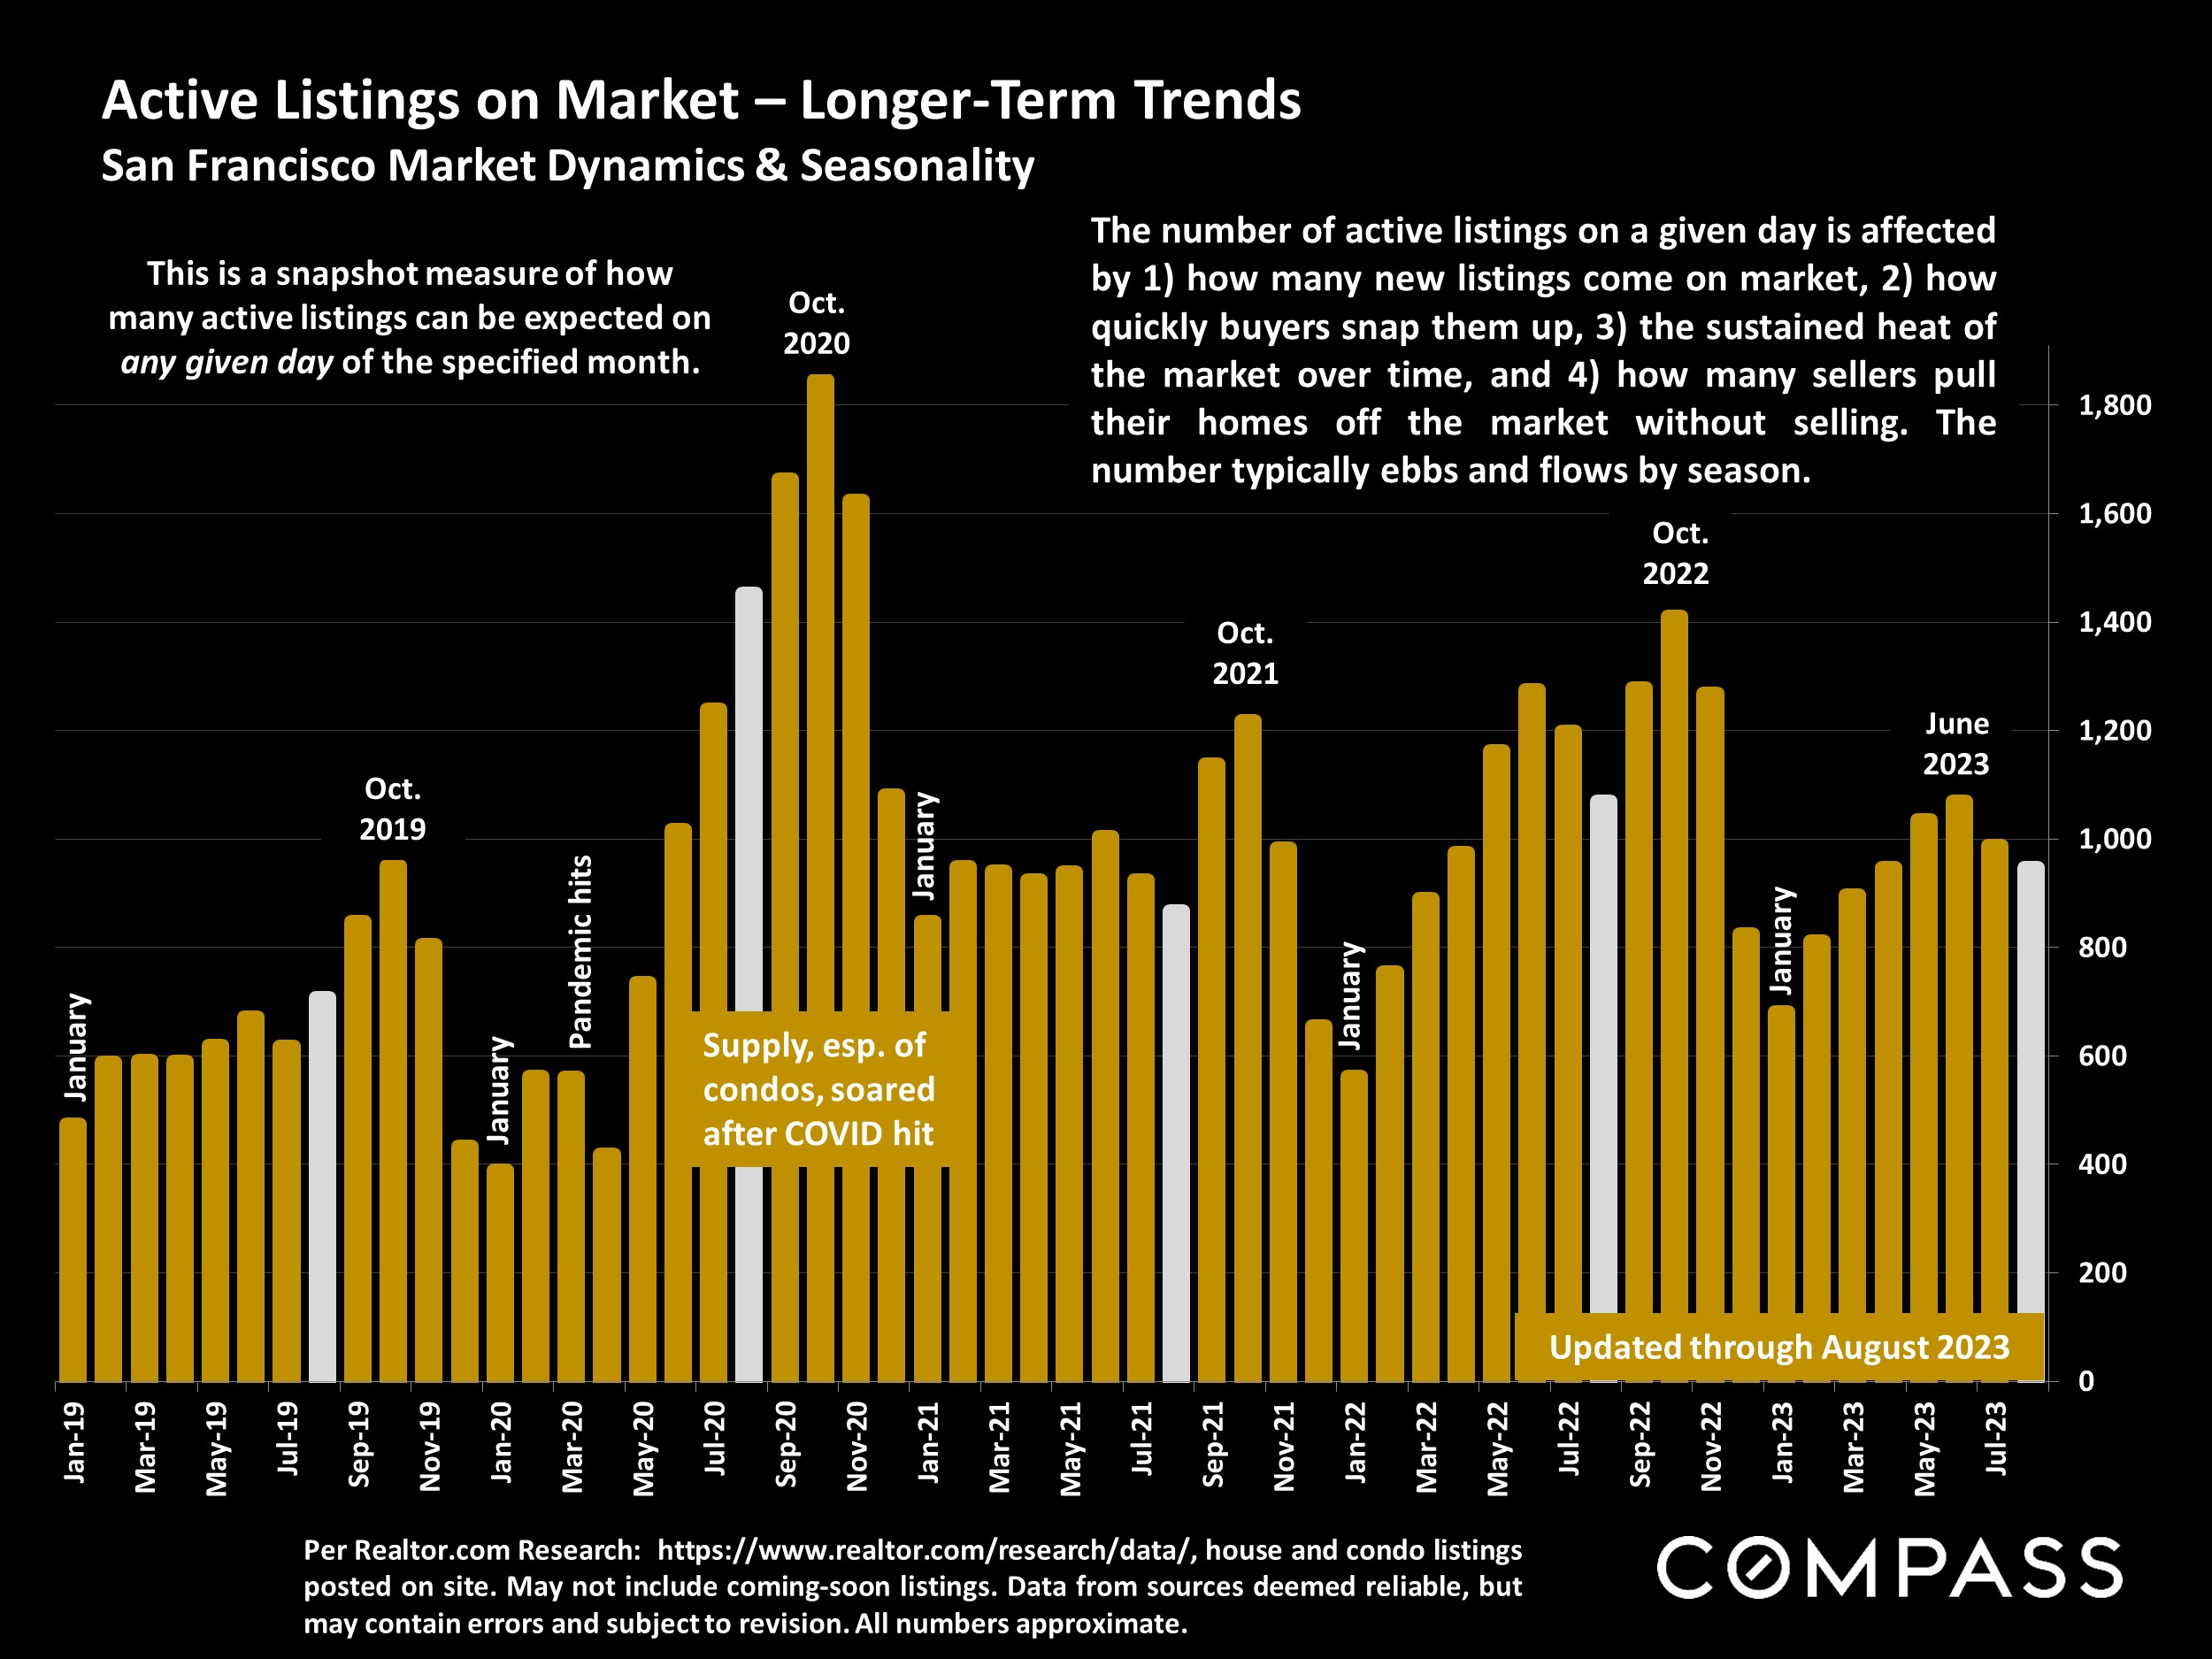
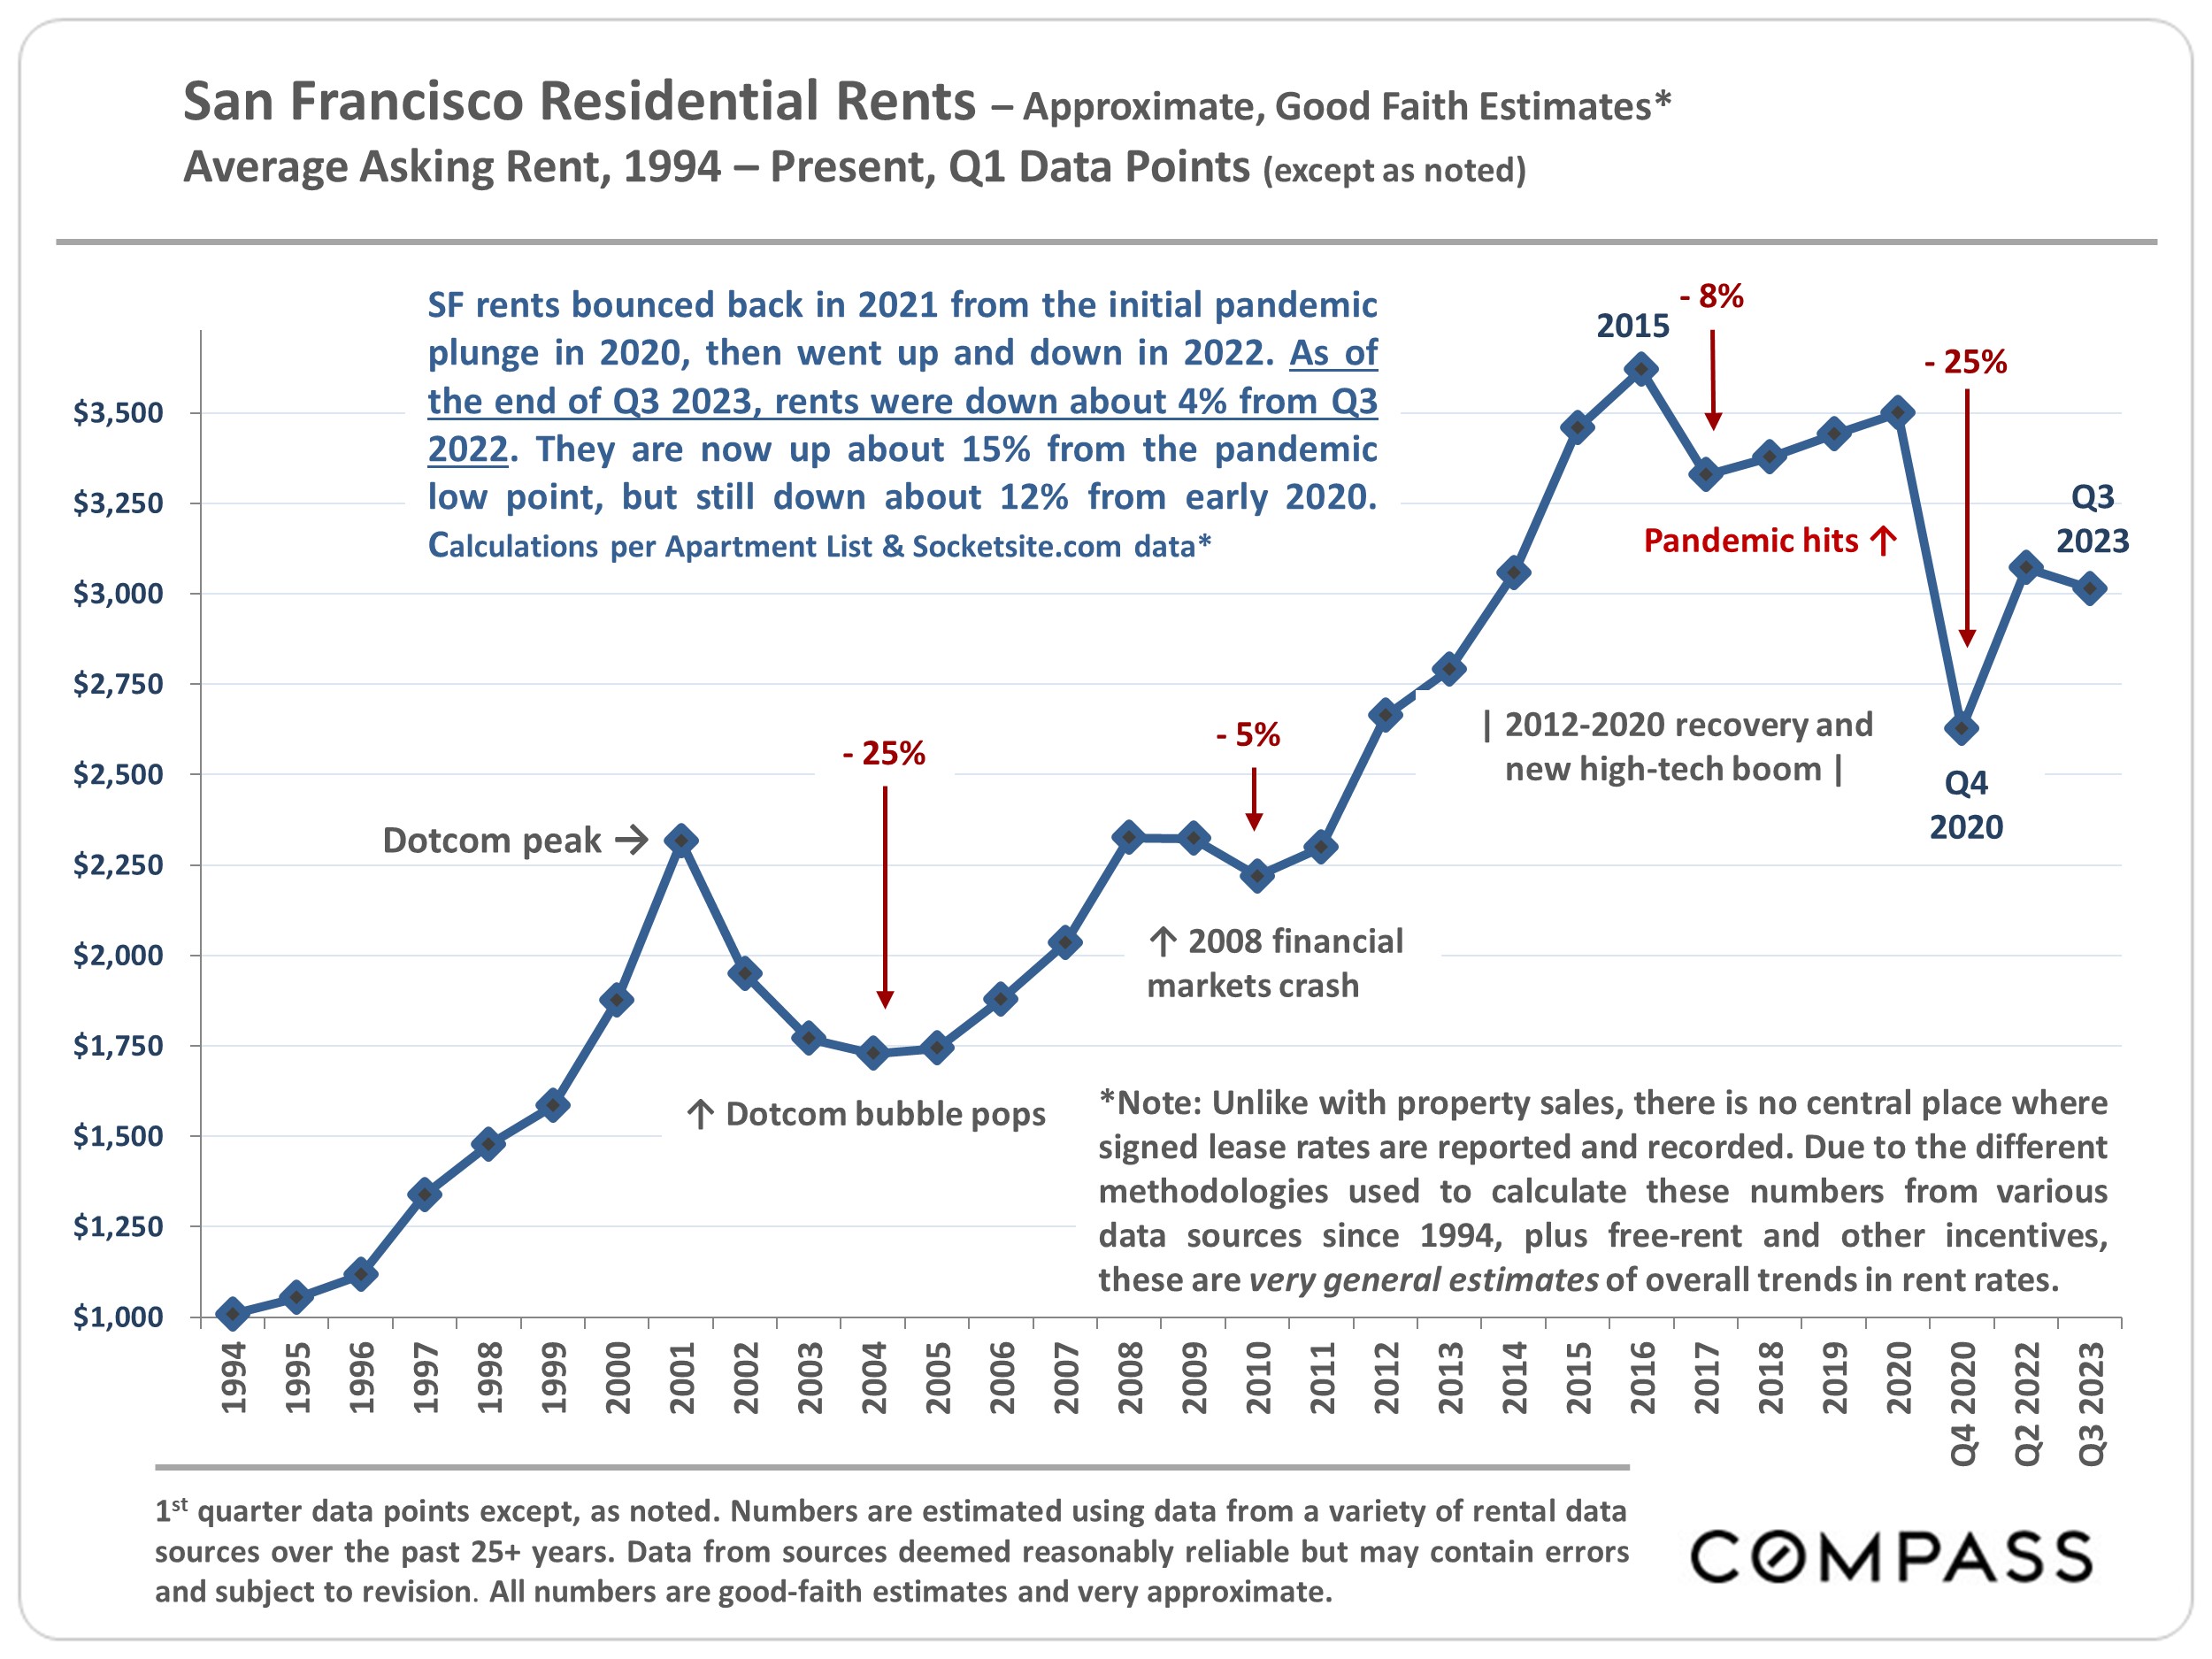
Generally speaking, the market rebounded much more strongly in 2023 than seemed possible at the end of 2022, when, after hitting historic peaks during the pandemic boom, economic and demand indicators hit their lowest points since the great recession. The decline in the number of sellers putting their homes on the market continues to be a factor in the balance between supply and demand, in the recovery in home prices, and the decline of overall sales volumes. In San Francisco, the situation is a little more complicated, with distinct differences between the house and condo markets, and between condo markets in different parts of the city (differences which are illustrated in this report). In August, the average, weekly, 30-year mortgage rate, as published by FHLMC, ticked back up over 7%, a situation which continues to impact housing affordability. Perhaps in response, the percentage of buyers paying all cash has generally been running at its highest national level in 8 years.
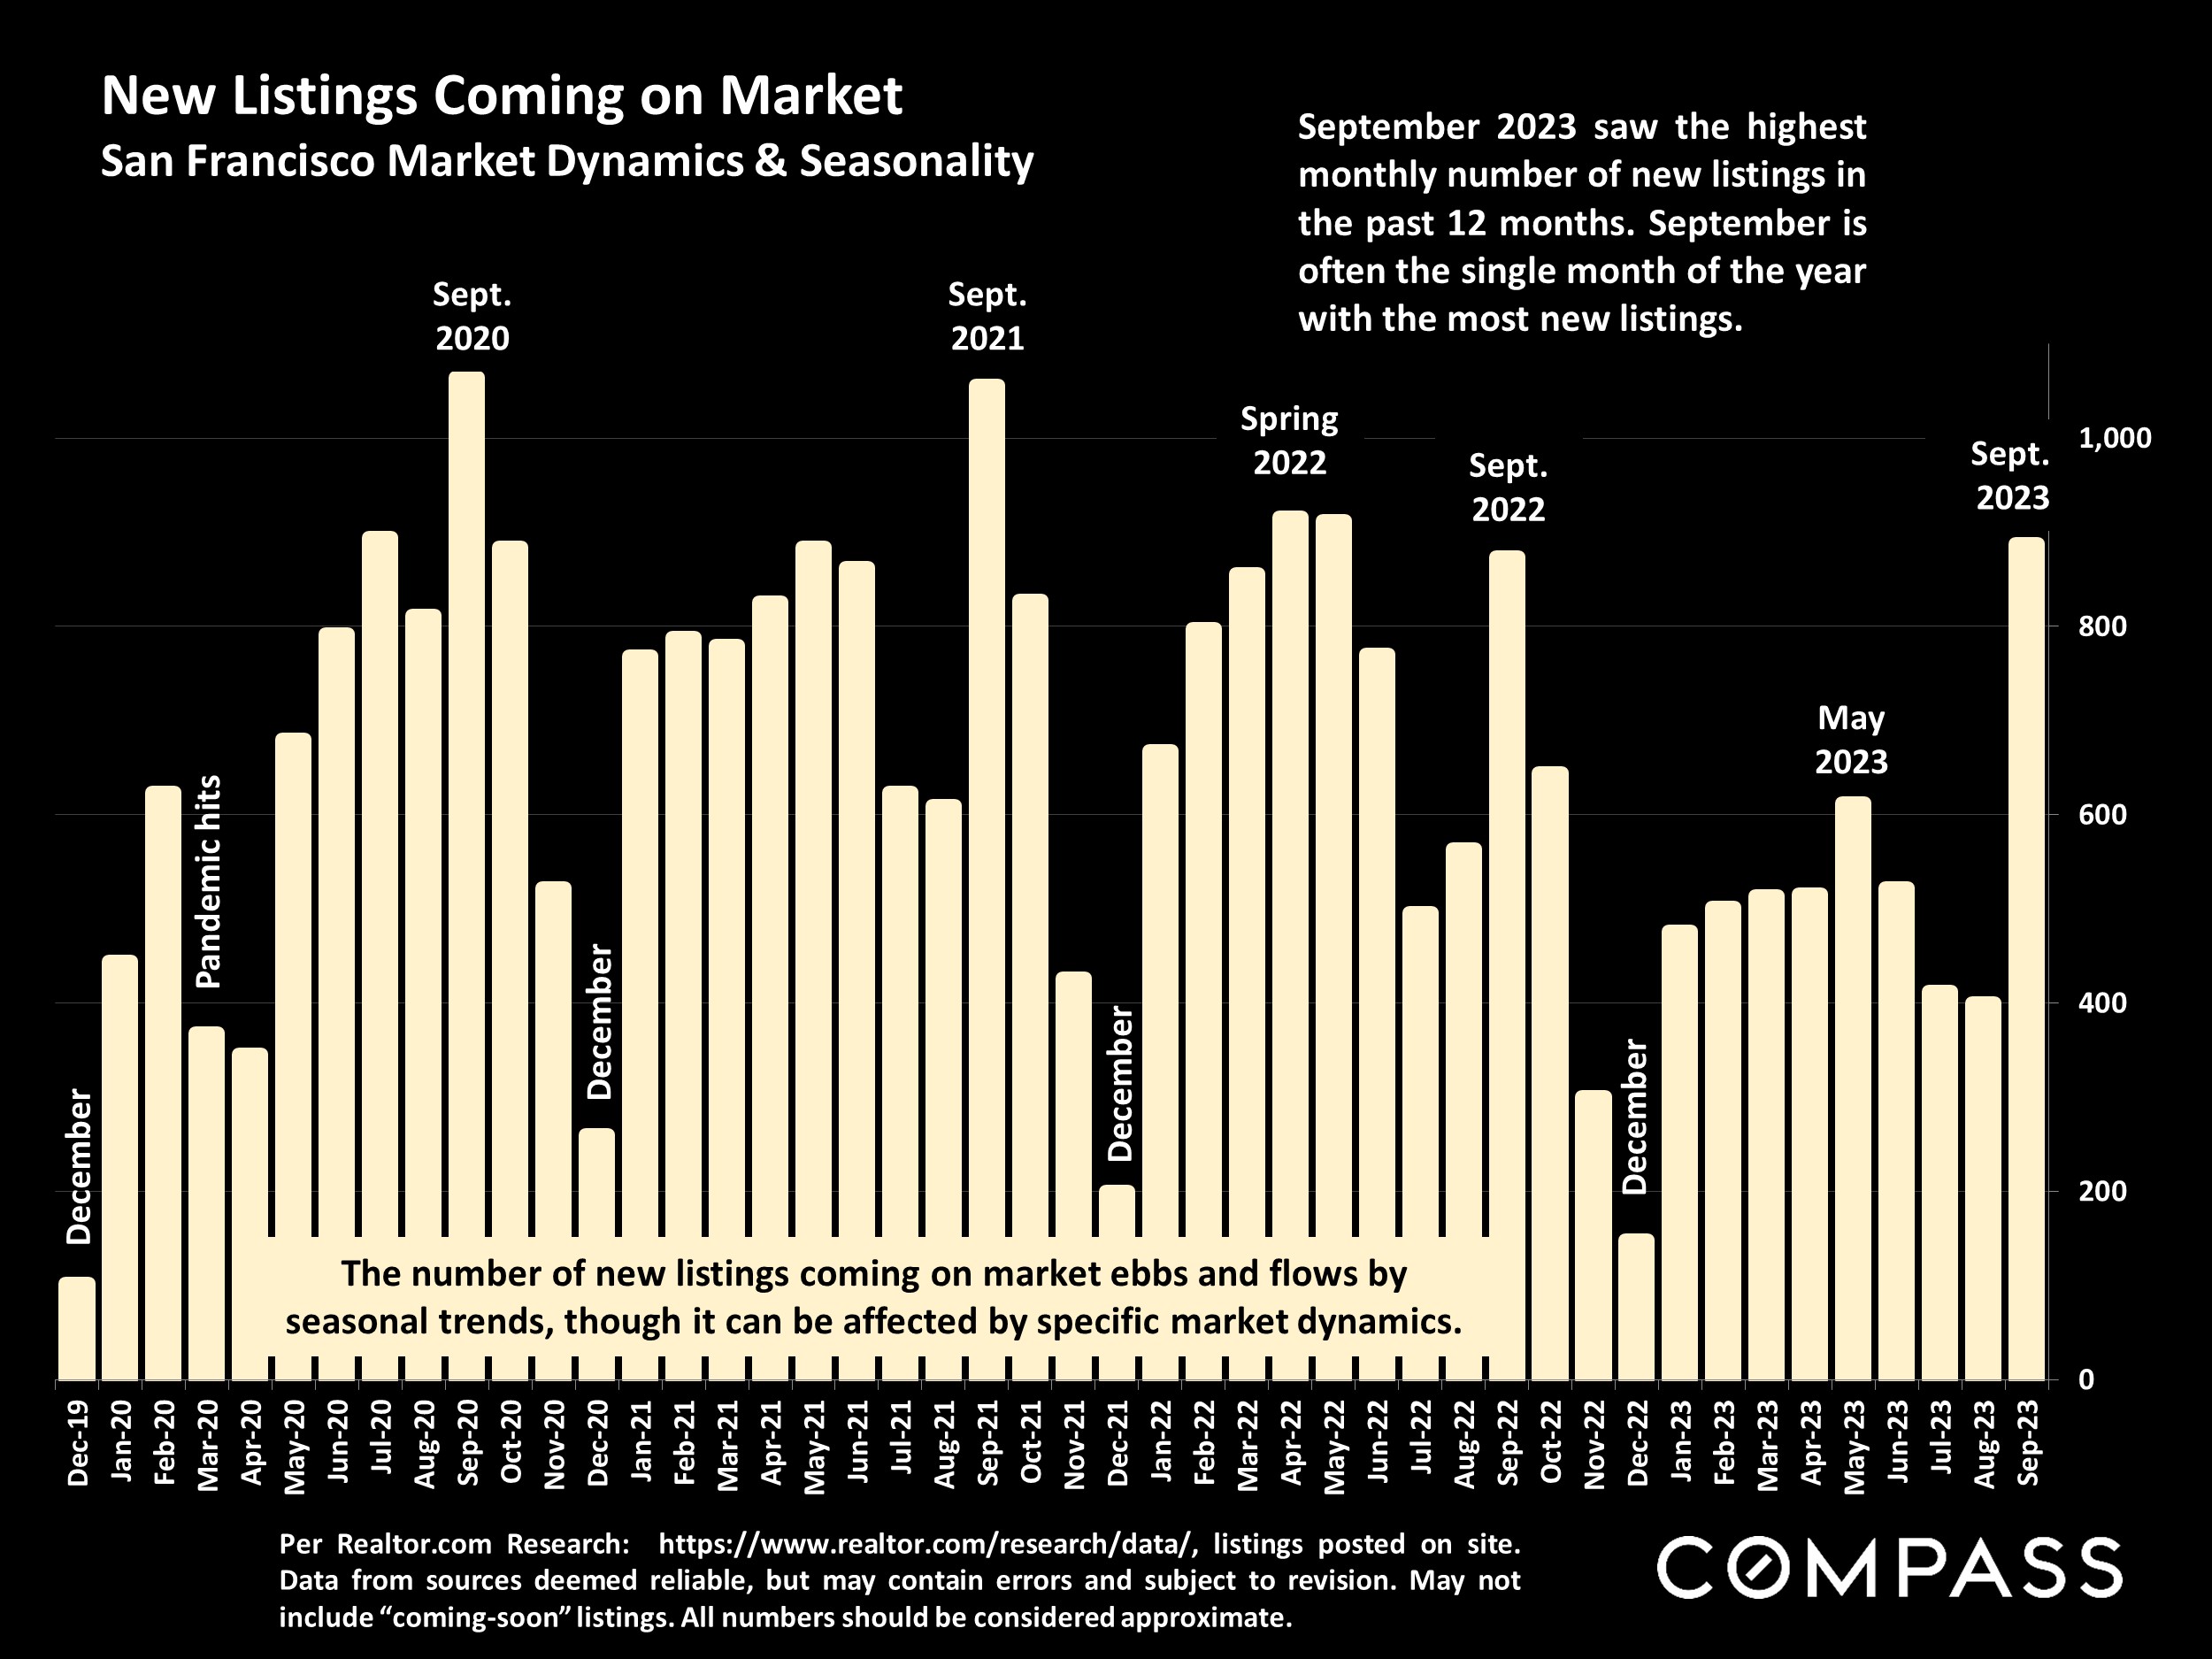
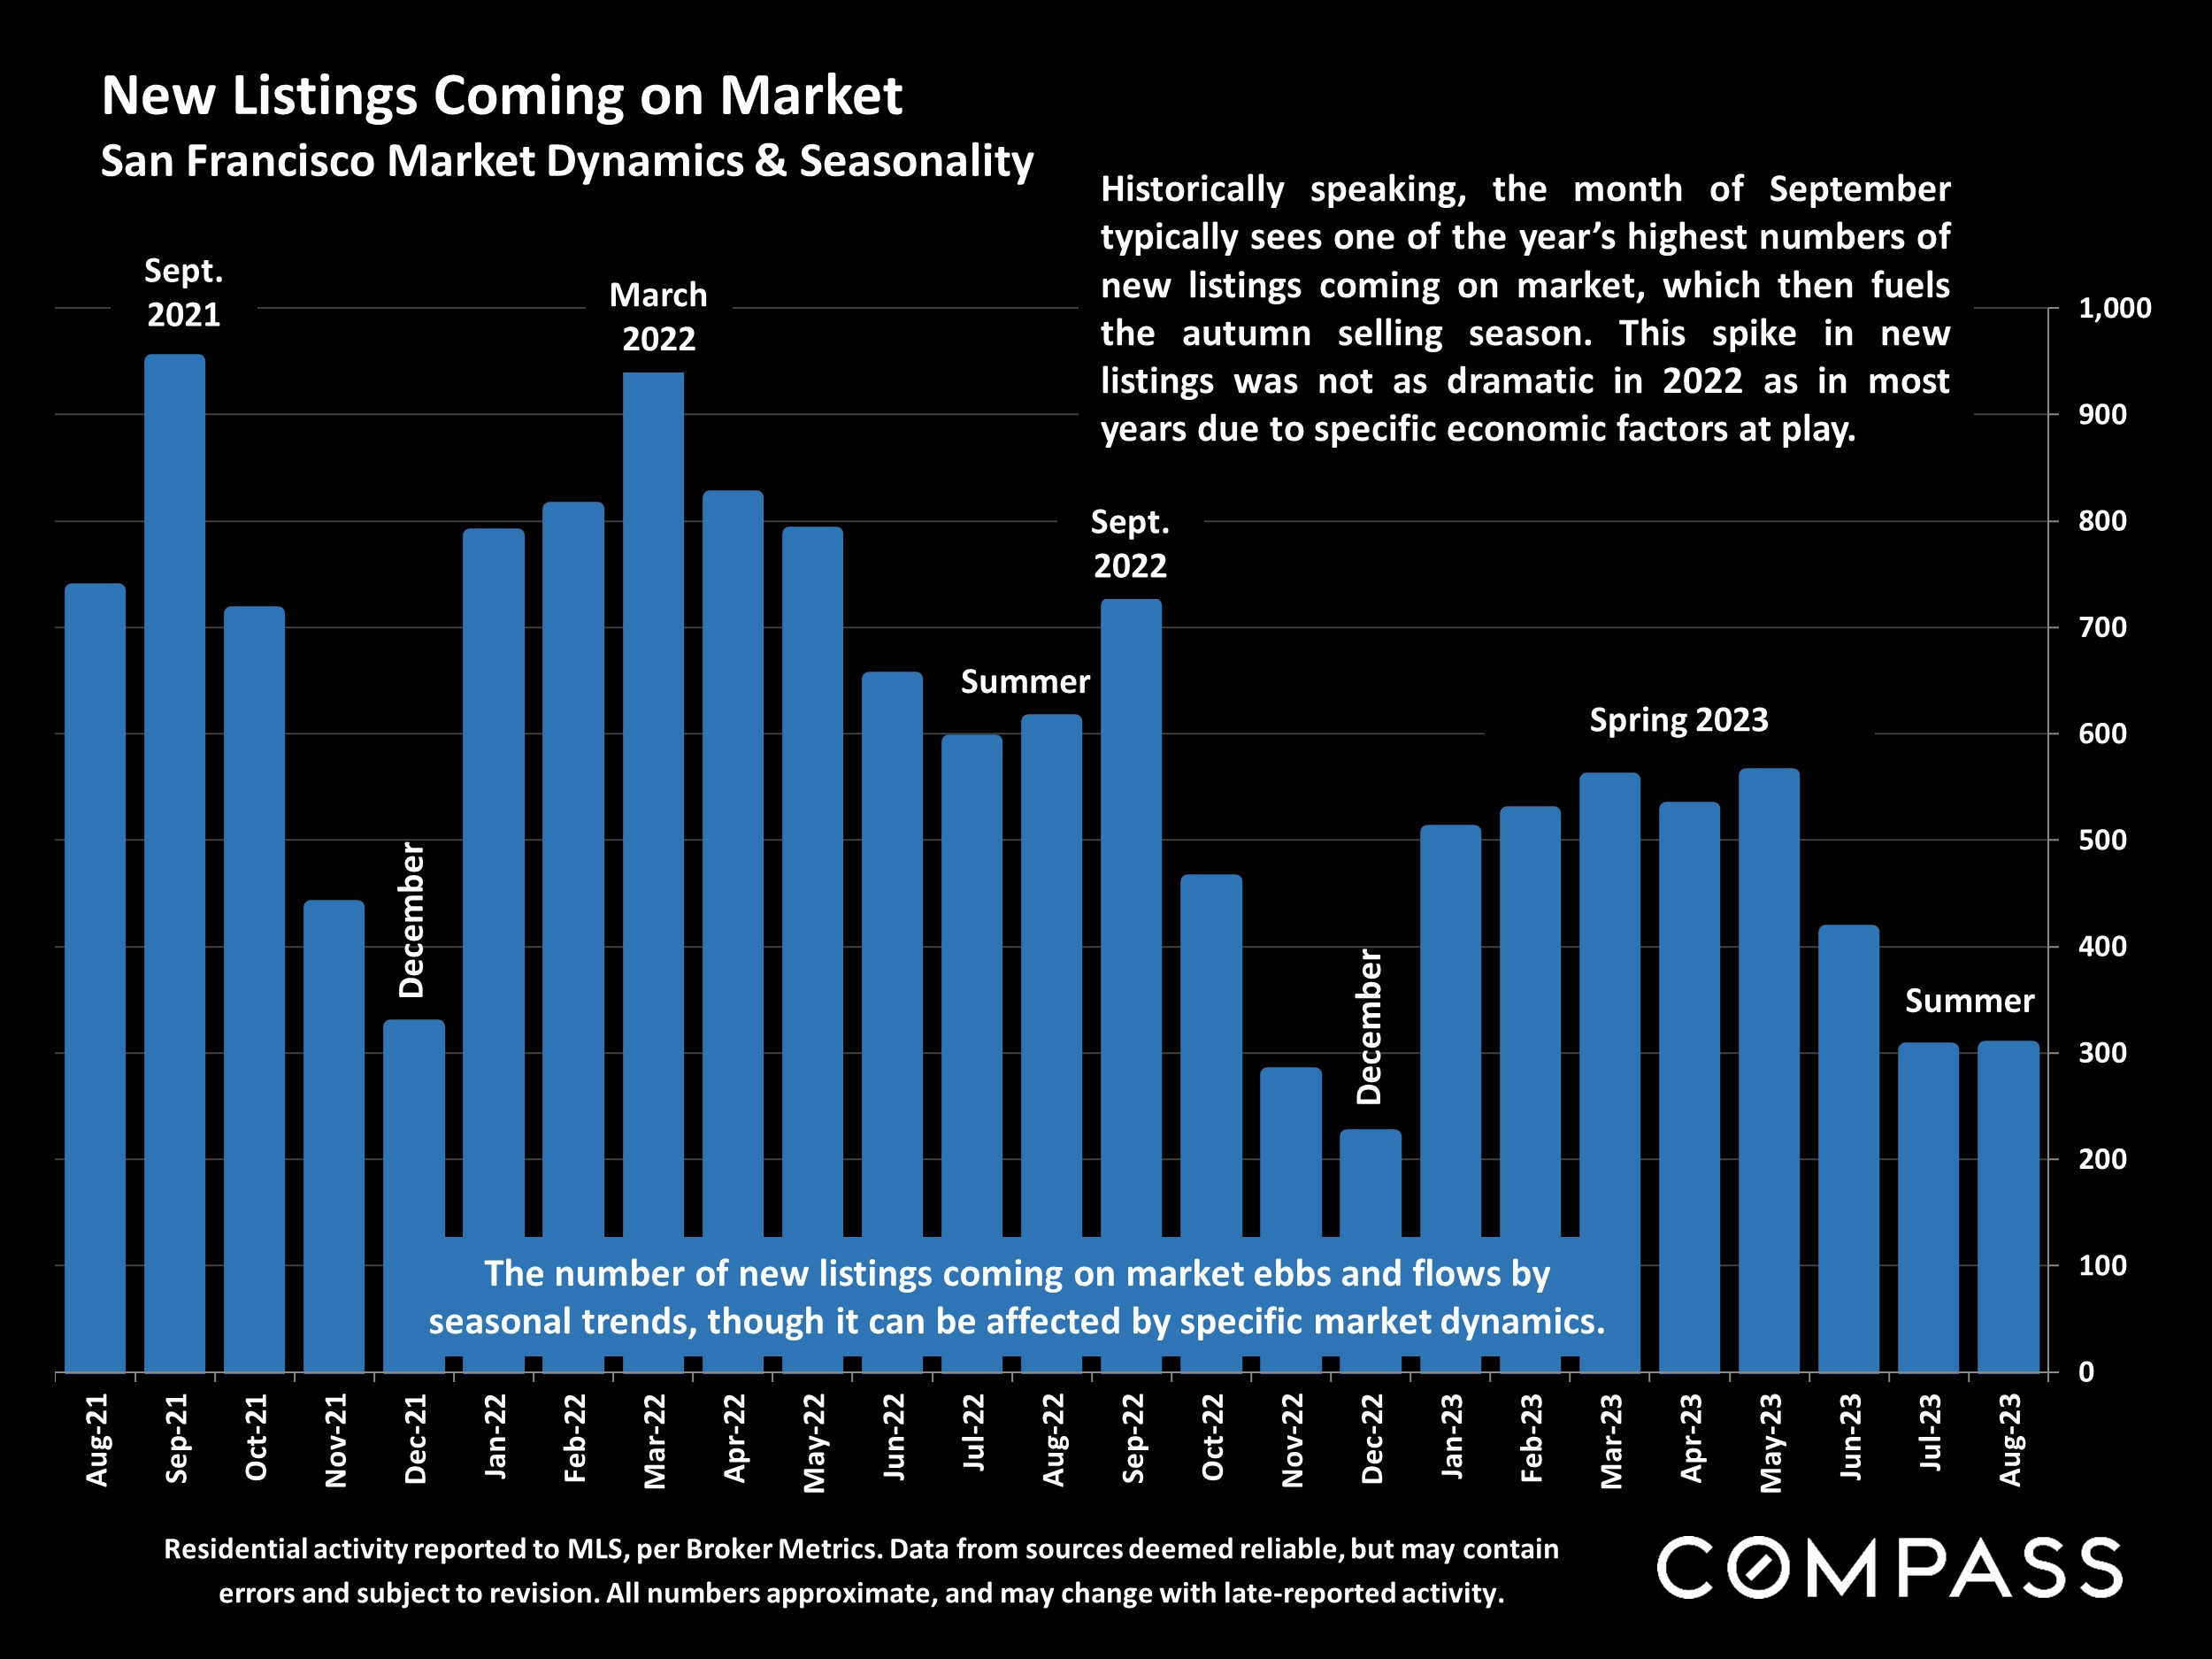
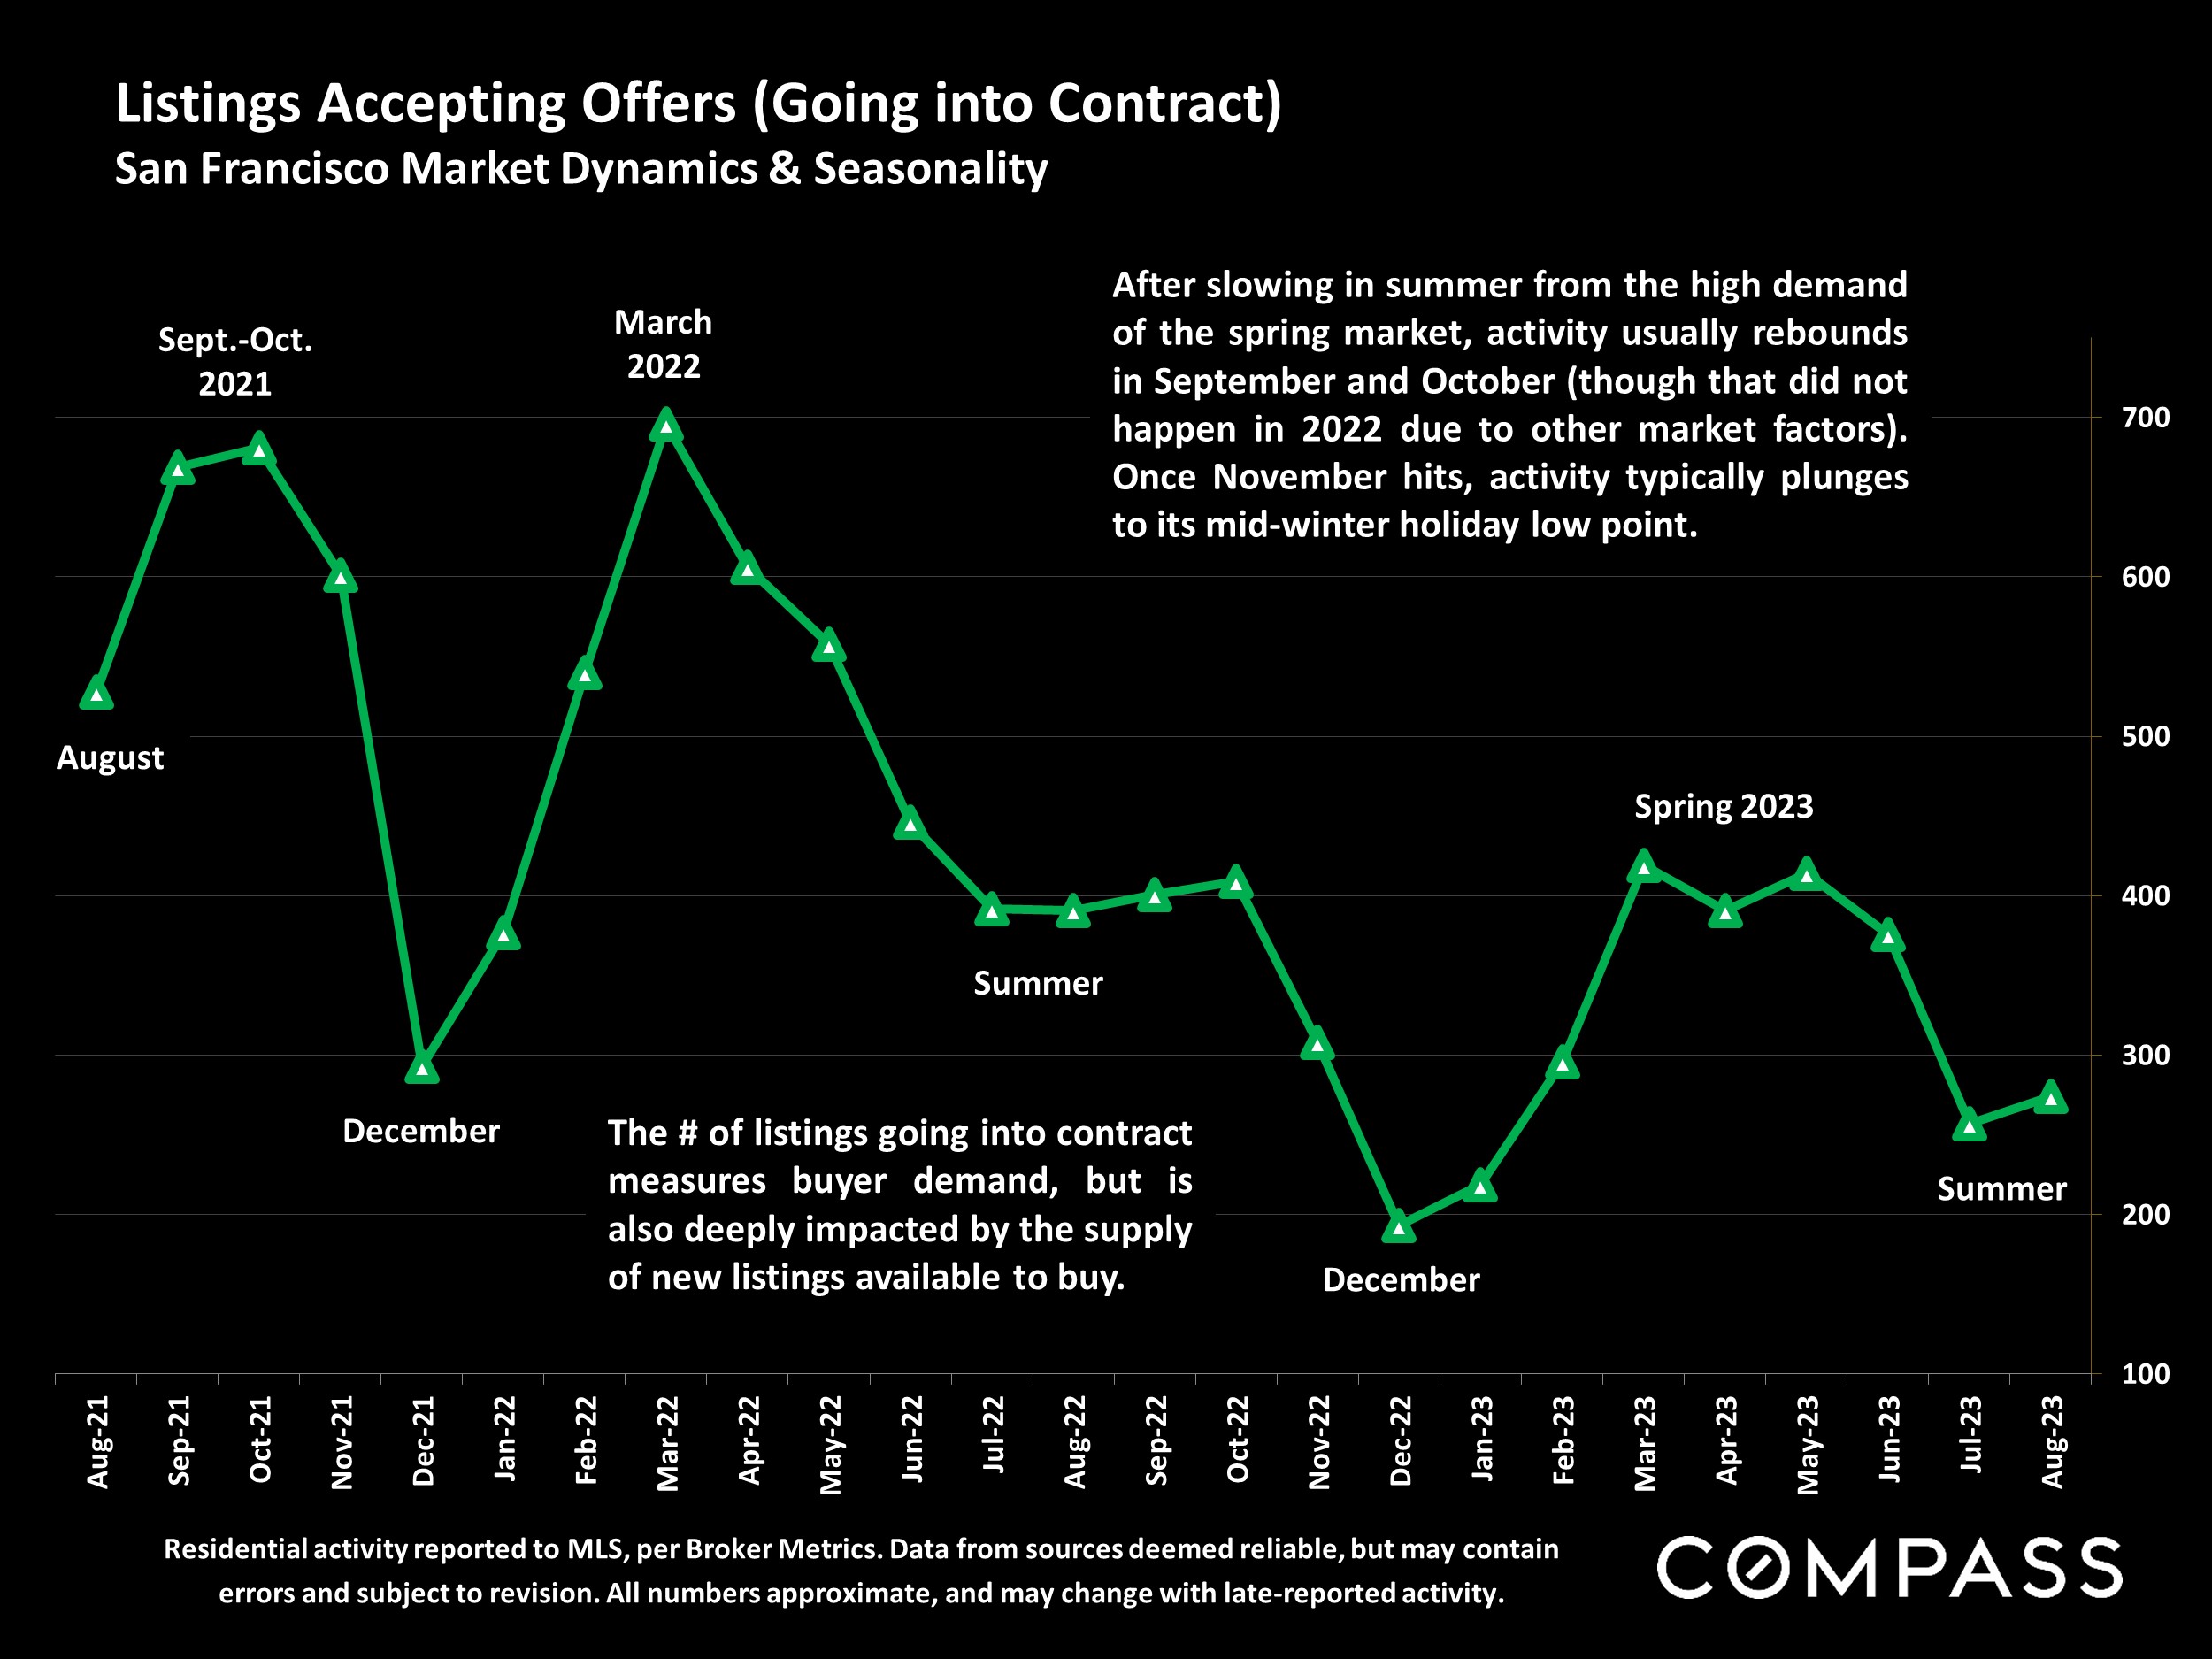
After the usual summer slowdown from spring, the autumn selling season began after Labor Day and runs until early-mid November, when the market typically begins its big, mid-winter holiday slowdown. By Thanksgiving, the number of new listings coming on market has plummeted, and December commonly sees by far the lowest level of monthly sales activity.
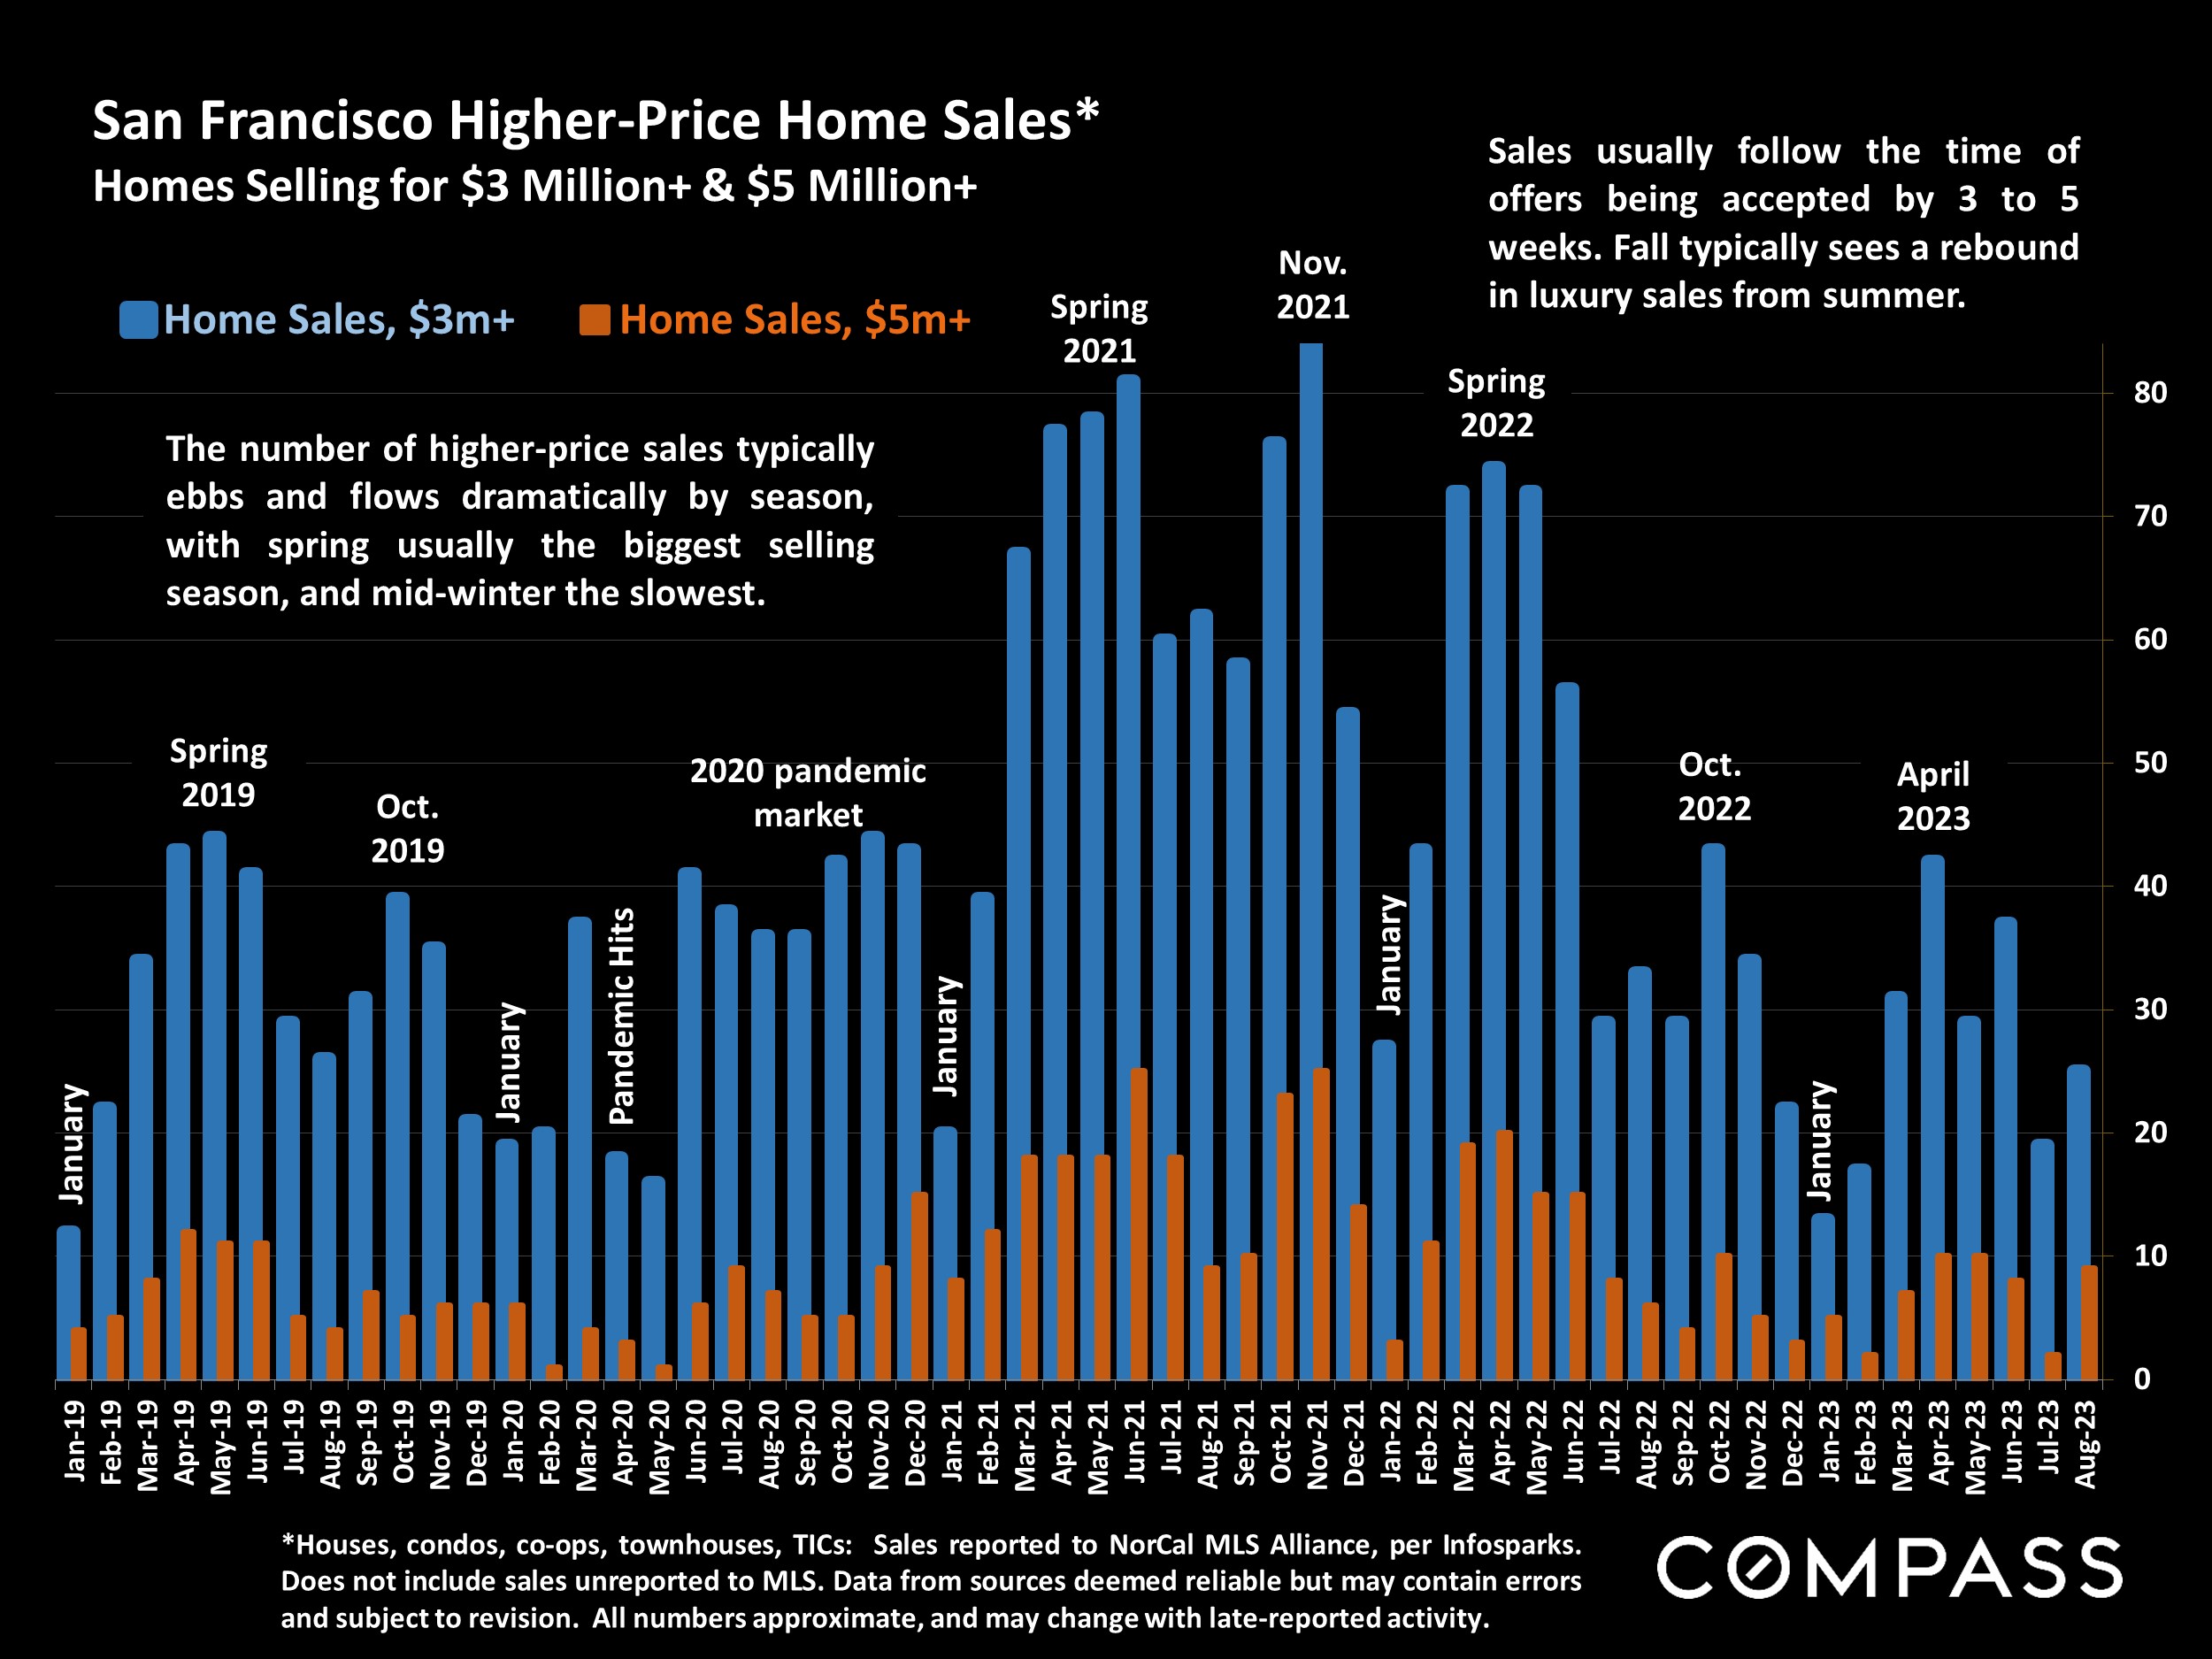
But, in the meantime, we expect to see substantial activity this fall. Historically speaking, September is often the single month of the year with the highest number of new listings. Luxury home listings in San Francisco commonly see a particularly large spike in autumn sales.
Statistics are generalities, essentially summaries of widely disparate data generated by dozens, hundreds or thousands of unique, individual sales occurring within different time periods. They are best seen not as precise measurements, but as broad, comparative indicators, with reasonable margins of error. Anomalous fluctuations in statistics are not uncommon, especially in smaller, expensive market segments. Last period data should be considered estimates that may change with late-reported data. Different analytics programs sometimes define statistics – such as “active listings,” “days on market,” and “months supply of inventory” – differently: what is most meaningful are not specific calculations but the trends they illustrate. Most listing and sales data derives from the local or regional multi-listing service (MLS) of the area specified in the analysis, but not all listings or sales are reported to MLS and these won’t be reflected in the data. “Homes” signifies real-property, single-household housing units: houses, condos, co-ops, townhouses, duets and TICs (but not mobile homes), as applicable to each market. City/town names refer specifically to the named cities and towns, unless otherwise delineated. Multi-county metro areas will be specified as such. Data from sources deemed reliable, but may contain errors and subject to revision. All numbers to be considered approximate.
Many aspects of value cannot be adequately reflected in median and average statistics: curb appeal, age, condition, amenities, views, lot size, quality of outdoor space, “bonus” rooms, additional parking, quality of location within the neighborhood, and so on. How any of these statistics apply to any particular home is unknown without a specific comparative market analysis. Median Sales Price is that price at which half the properties sold for more and half for less. It may be affected by seasonality, “unusual” events, or changes in inventory and buying trends, as well as by changes in fair market value. The median sales price for an area will often conceal an enormous variety of sales prices in the underlying individual sales.
Dollar per Square Foot is based upon the home’s interior living space and does not include garages, unfinished attics and basements, rooms built without permit, patios, decks or yards (though all those can add value to a home). These figures are usually derived from appraisals or tax records, but are sometimes unreliable (especially for older homes) or unreported altogether. The calculation can only be made on those home sales that reported square footage.
Compass is a real estate broker licensed by the State of California, DRE 01527235. Equal Housing Opportunity. This report has been prepared solely for information purposes. The information herein is based on or derived from information generally available to the public and/or from sources believed to be reliable. No representation or warranty can be given with respect to the accuracy or completeness of the information. Compass disclaims any and all liability relating to this report, including without limitation any express or implied representations or warranties for statements contained in, and omissions from, the report. Nothing contained herein is intended to be or should be read as any regulatory, legal, tax, accounting or other advice and Compass does not provide such advice. All opinions are subject to change without notice. Compass makes no representation regarding the accuracy of any statements regarding any references to the laws, statutes or regulations of any state are those of the author(s). Past performance is no guarantee of future results.
This website uses cookies so that we can provide you with the best user experience possible. Cookie information is stored in your browser and performs functions such as recognizing you when you return to our website, and helping our team to understand which sections of the website you find most interesting and useful. Learn more about how we use this information in our Privacy Policy.
You can adjust all of your cookie settings by navigating the tabs on the left hand side.
Strictly Necessary Cookies
Strictly Necessary Cookie should be enabled at all times so that we can save your preferences for cookie settings.
If you disable this cookie, we will not be able to save your preferences. This means that every time you visit this website you will need to enable or disable cookies again.


 Note that the quantity of sales in any given local submarket is usually relatively small and/or the number of sales that report the necessary financial information can be limited. Buildings of different ages, qualities and sizes selling in different periods can cause these average and median figures to fluctuate significantly. Furthermore, the reliability of some of these calculations depends upon the quality of the income and expense figures provided by the listing agents, and sometimes instead of actual numbers, much less meaningful projected or scheduled figures are used. Therefore, the above statistics should be considered very general indicators, and how they apply to any particular property without a specific comparative market analysis is unknown.