San Francisco 2-4 Units, April 2023

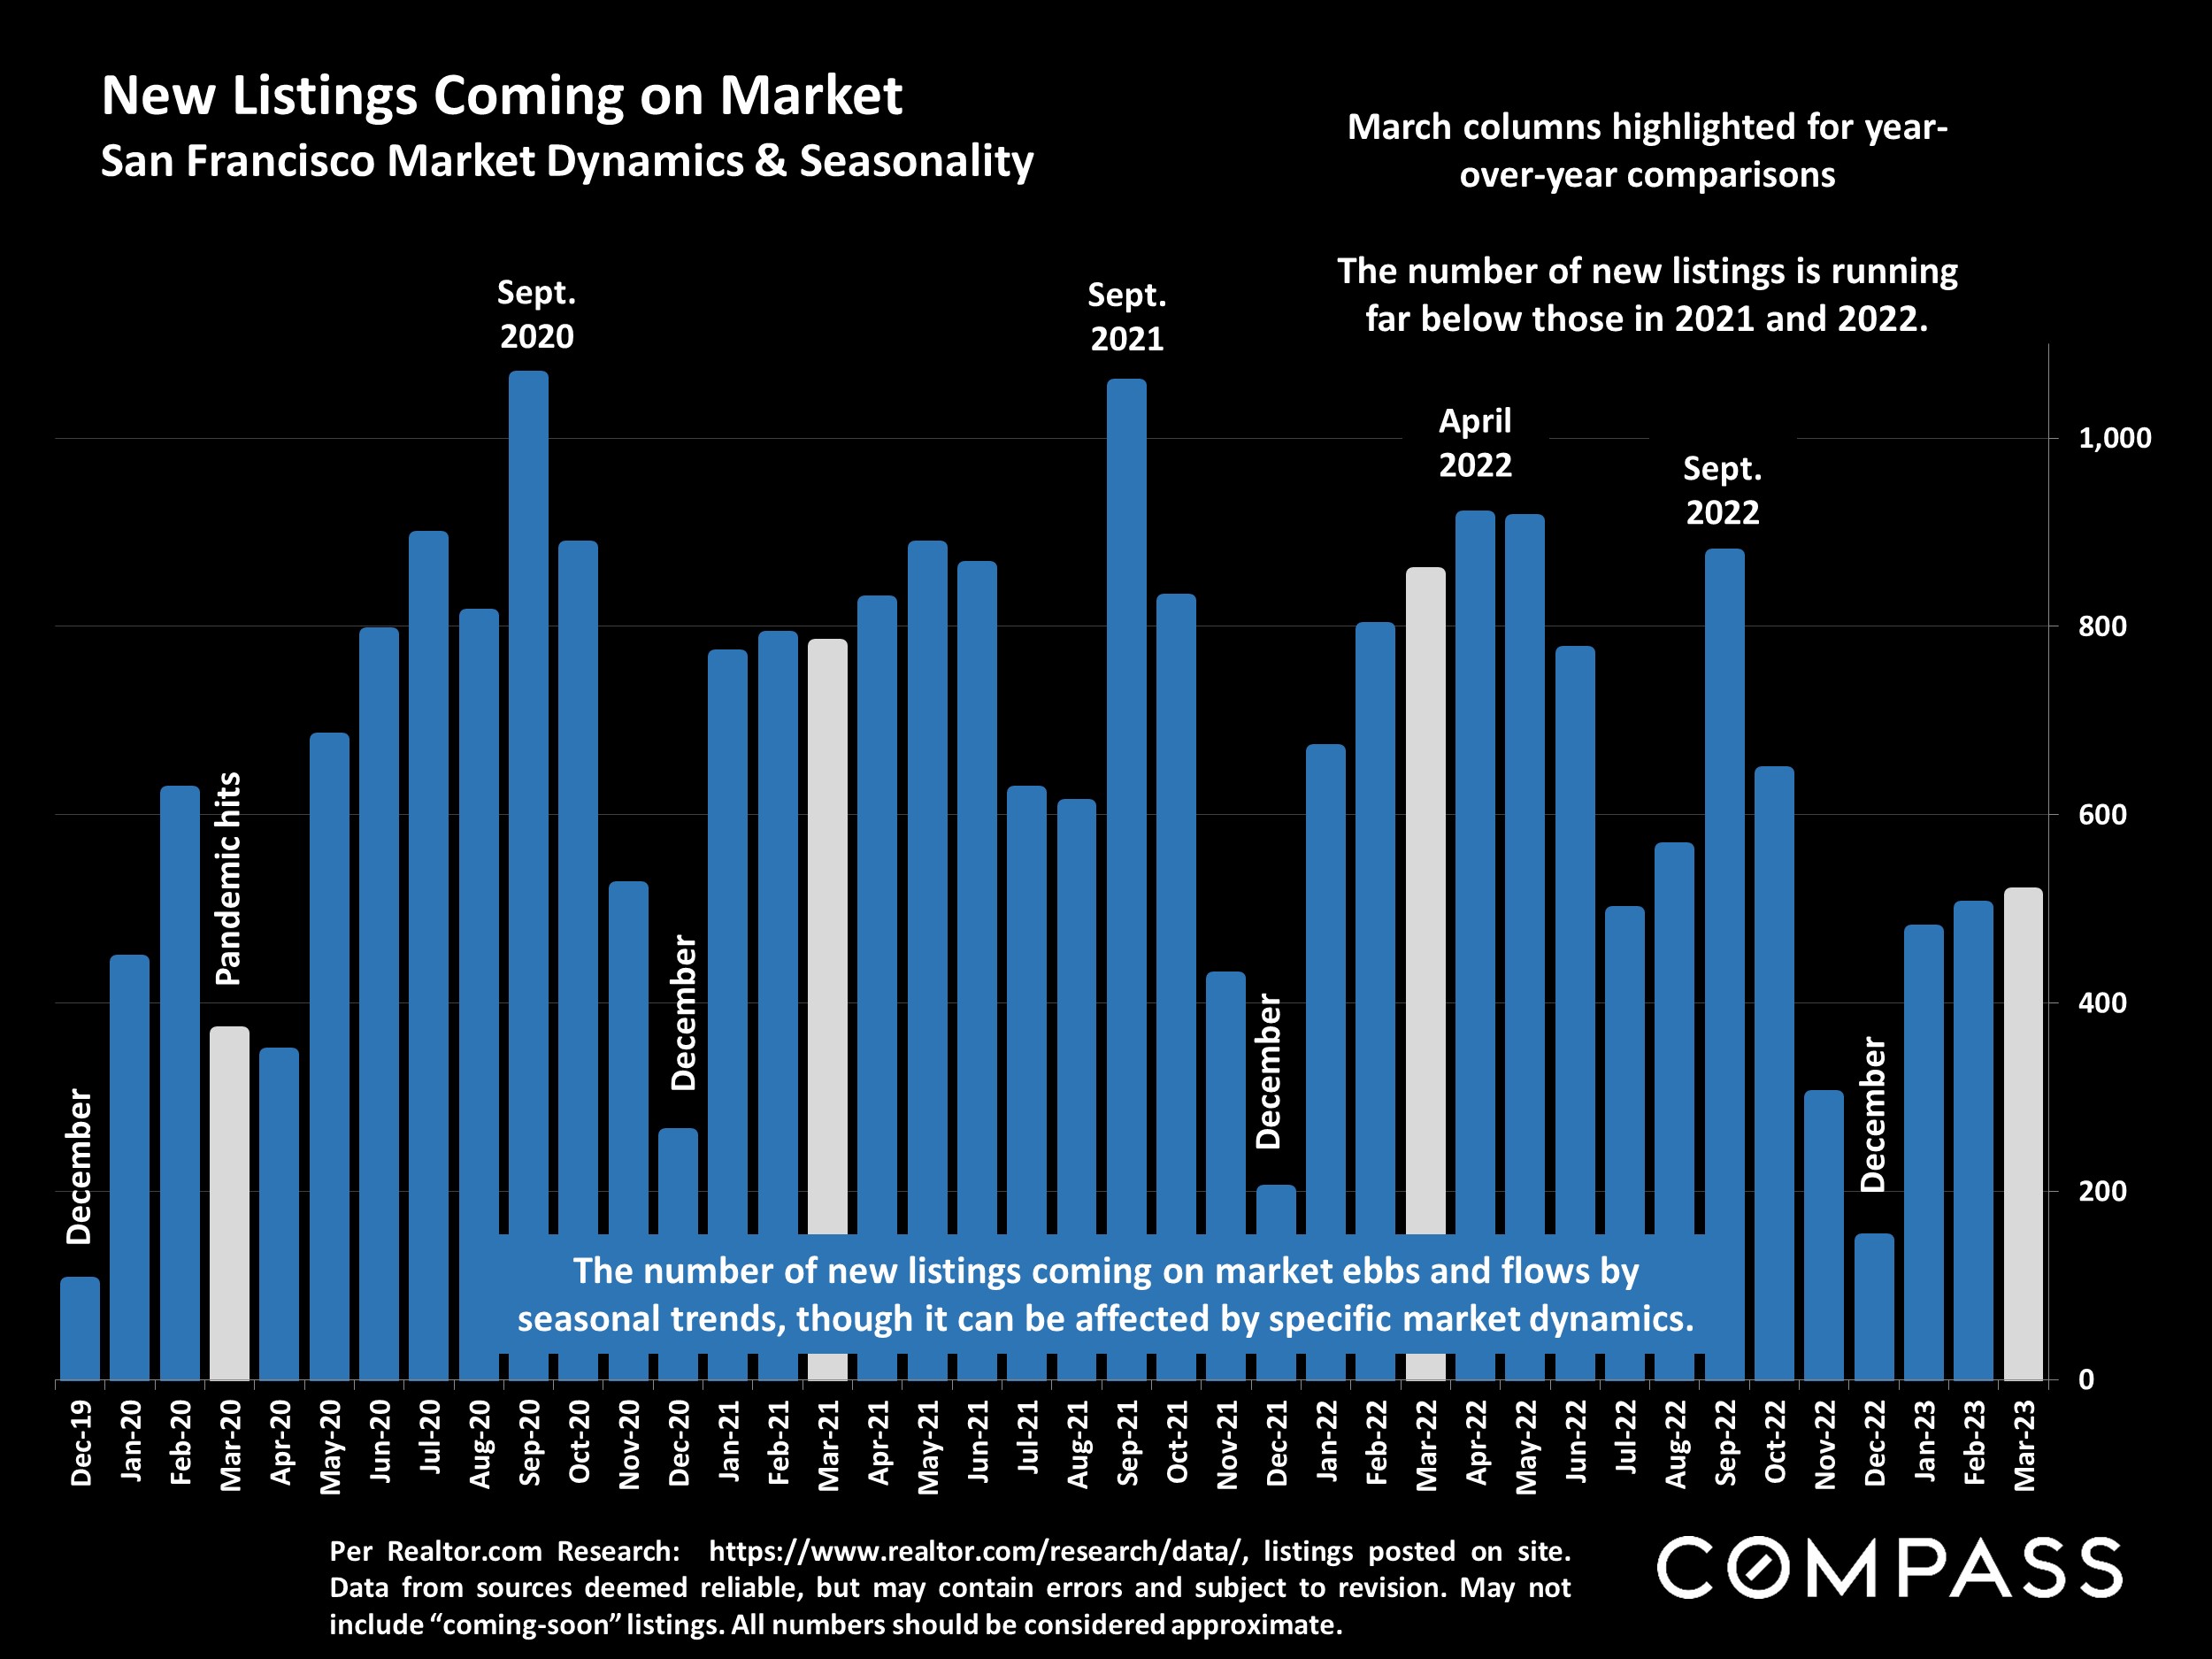
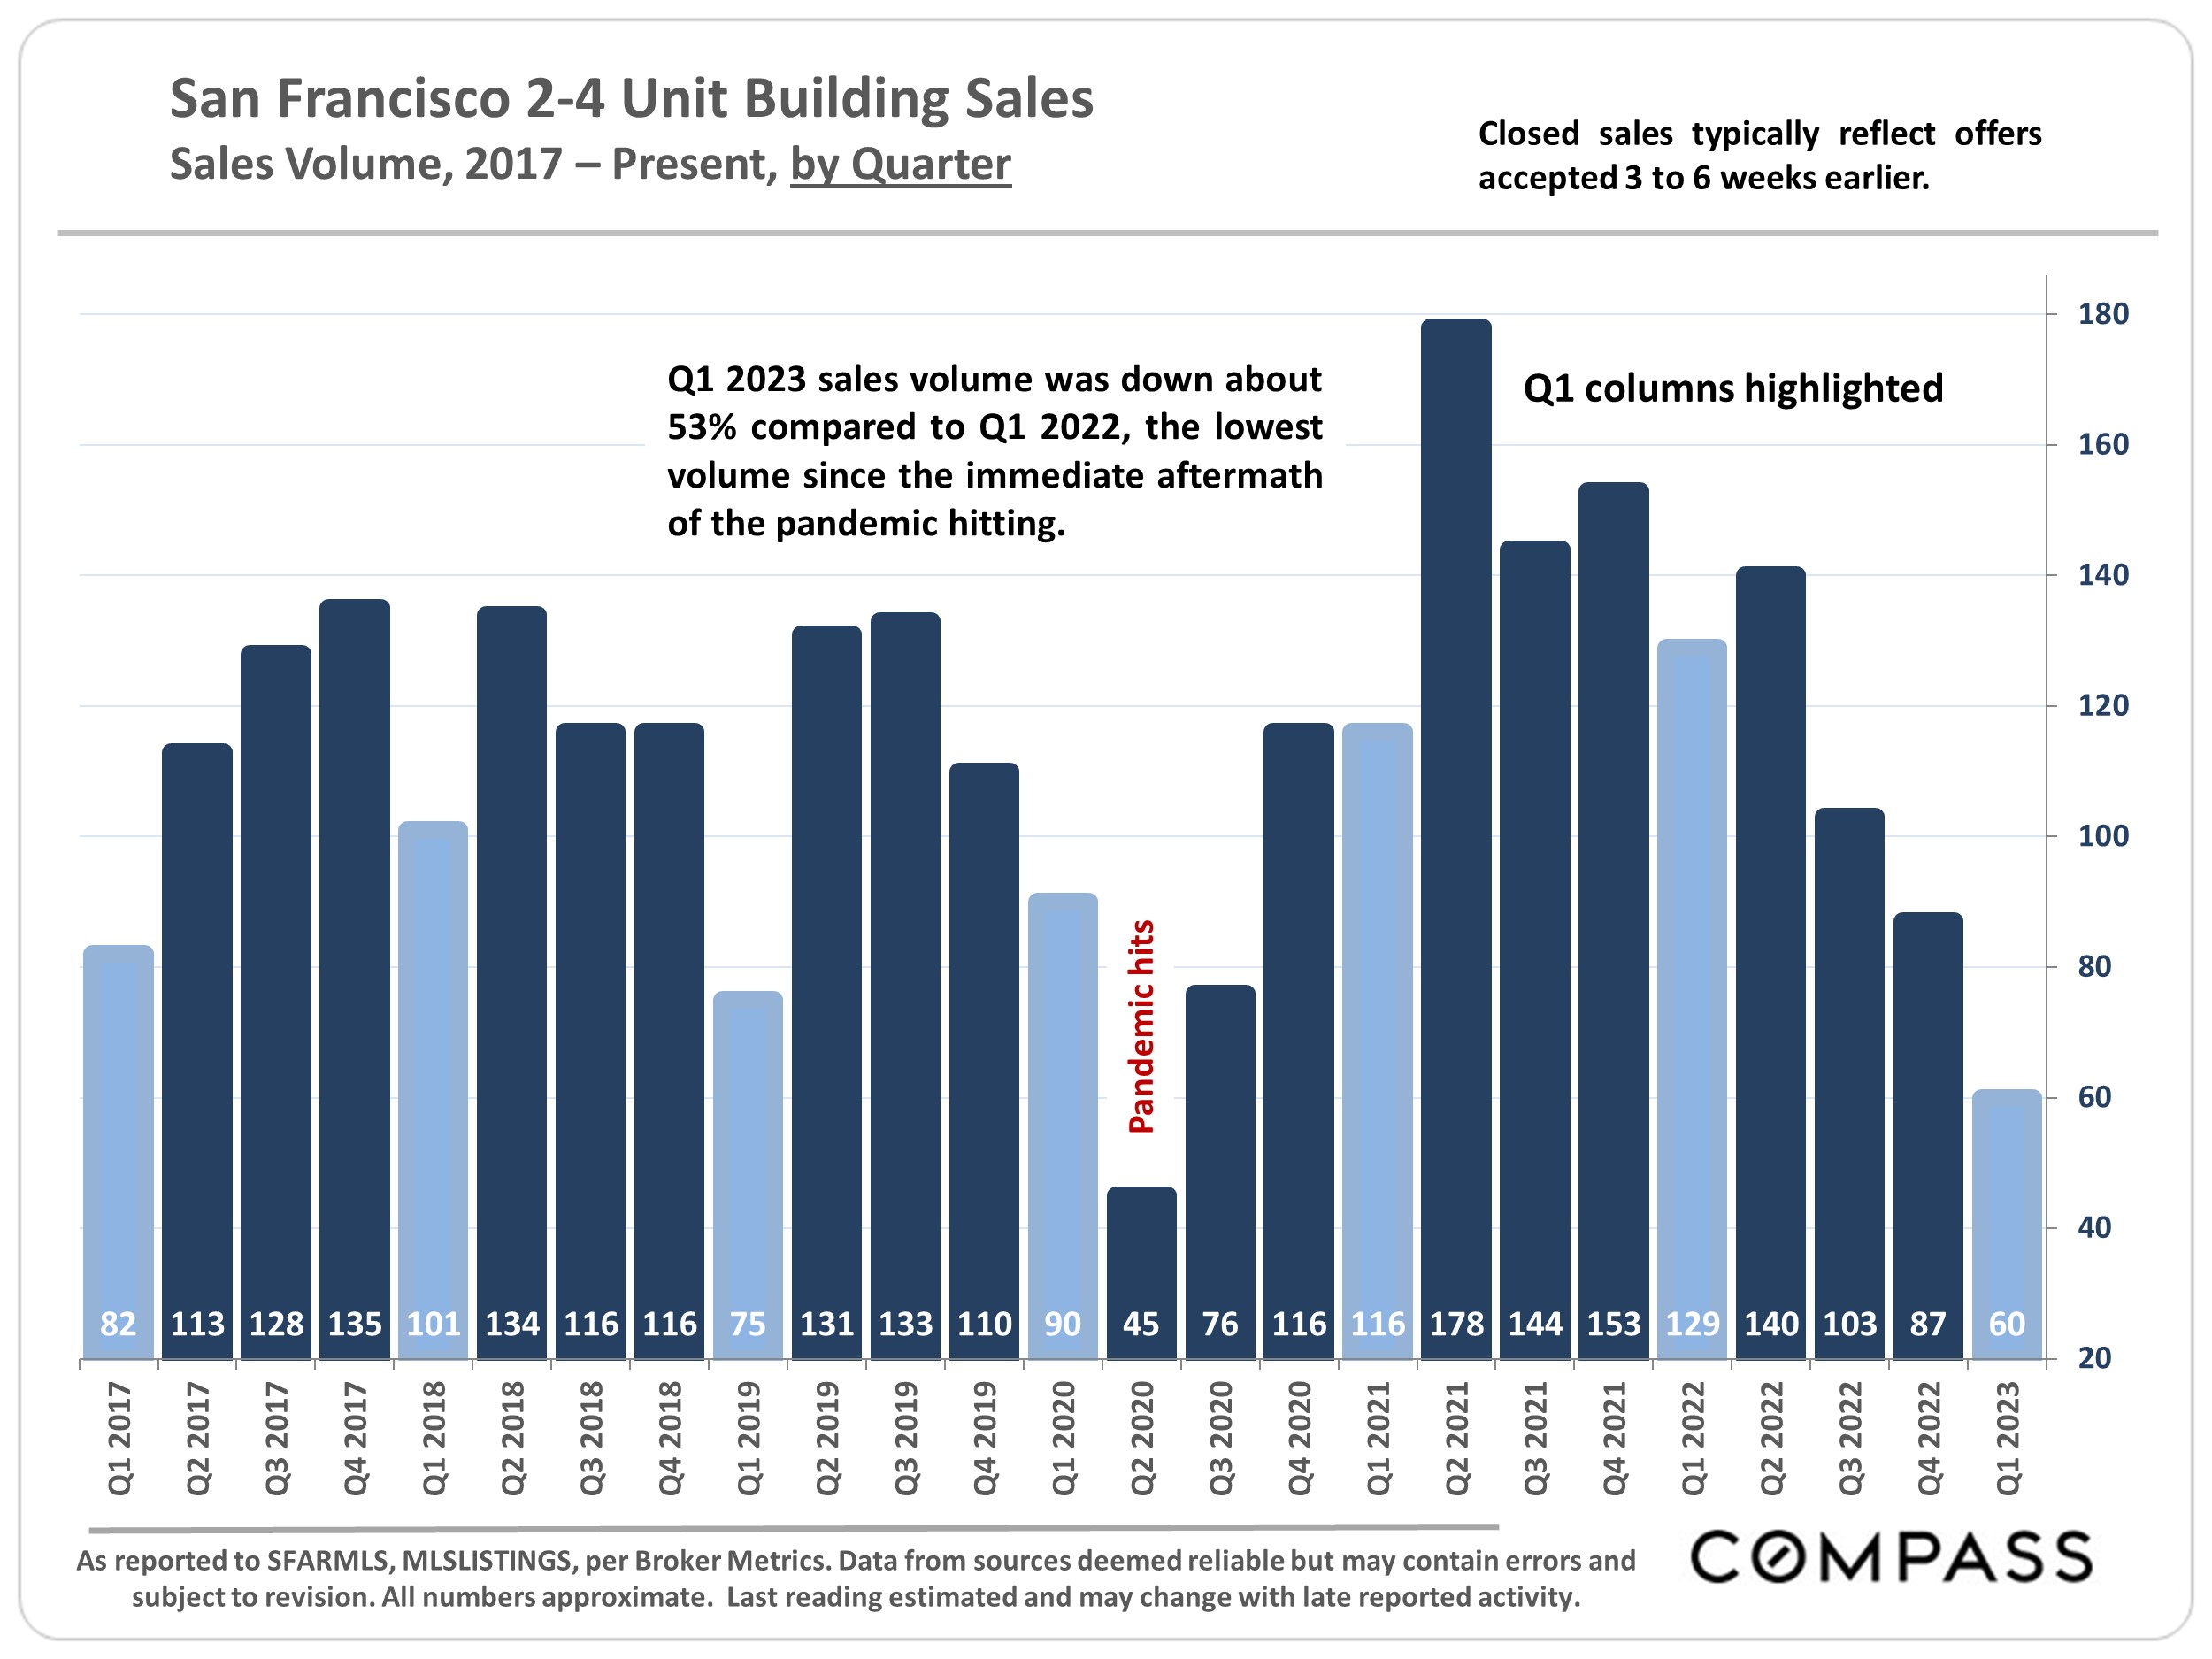
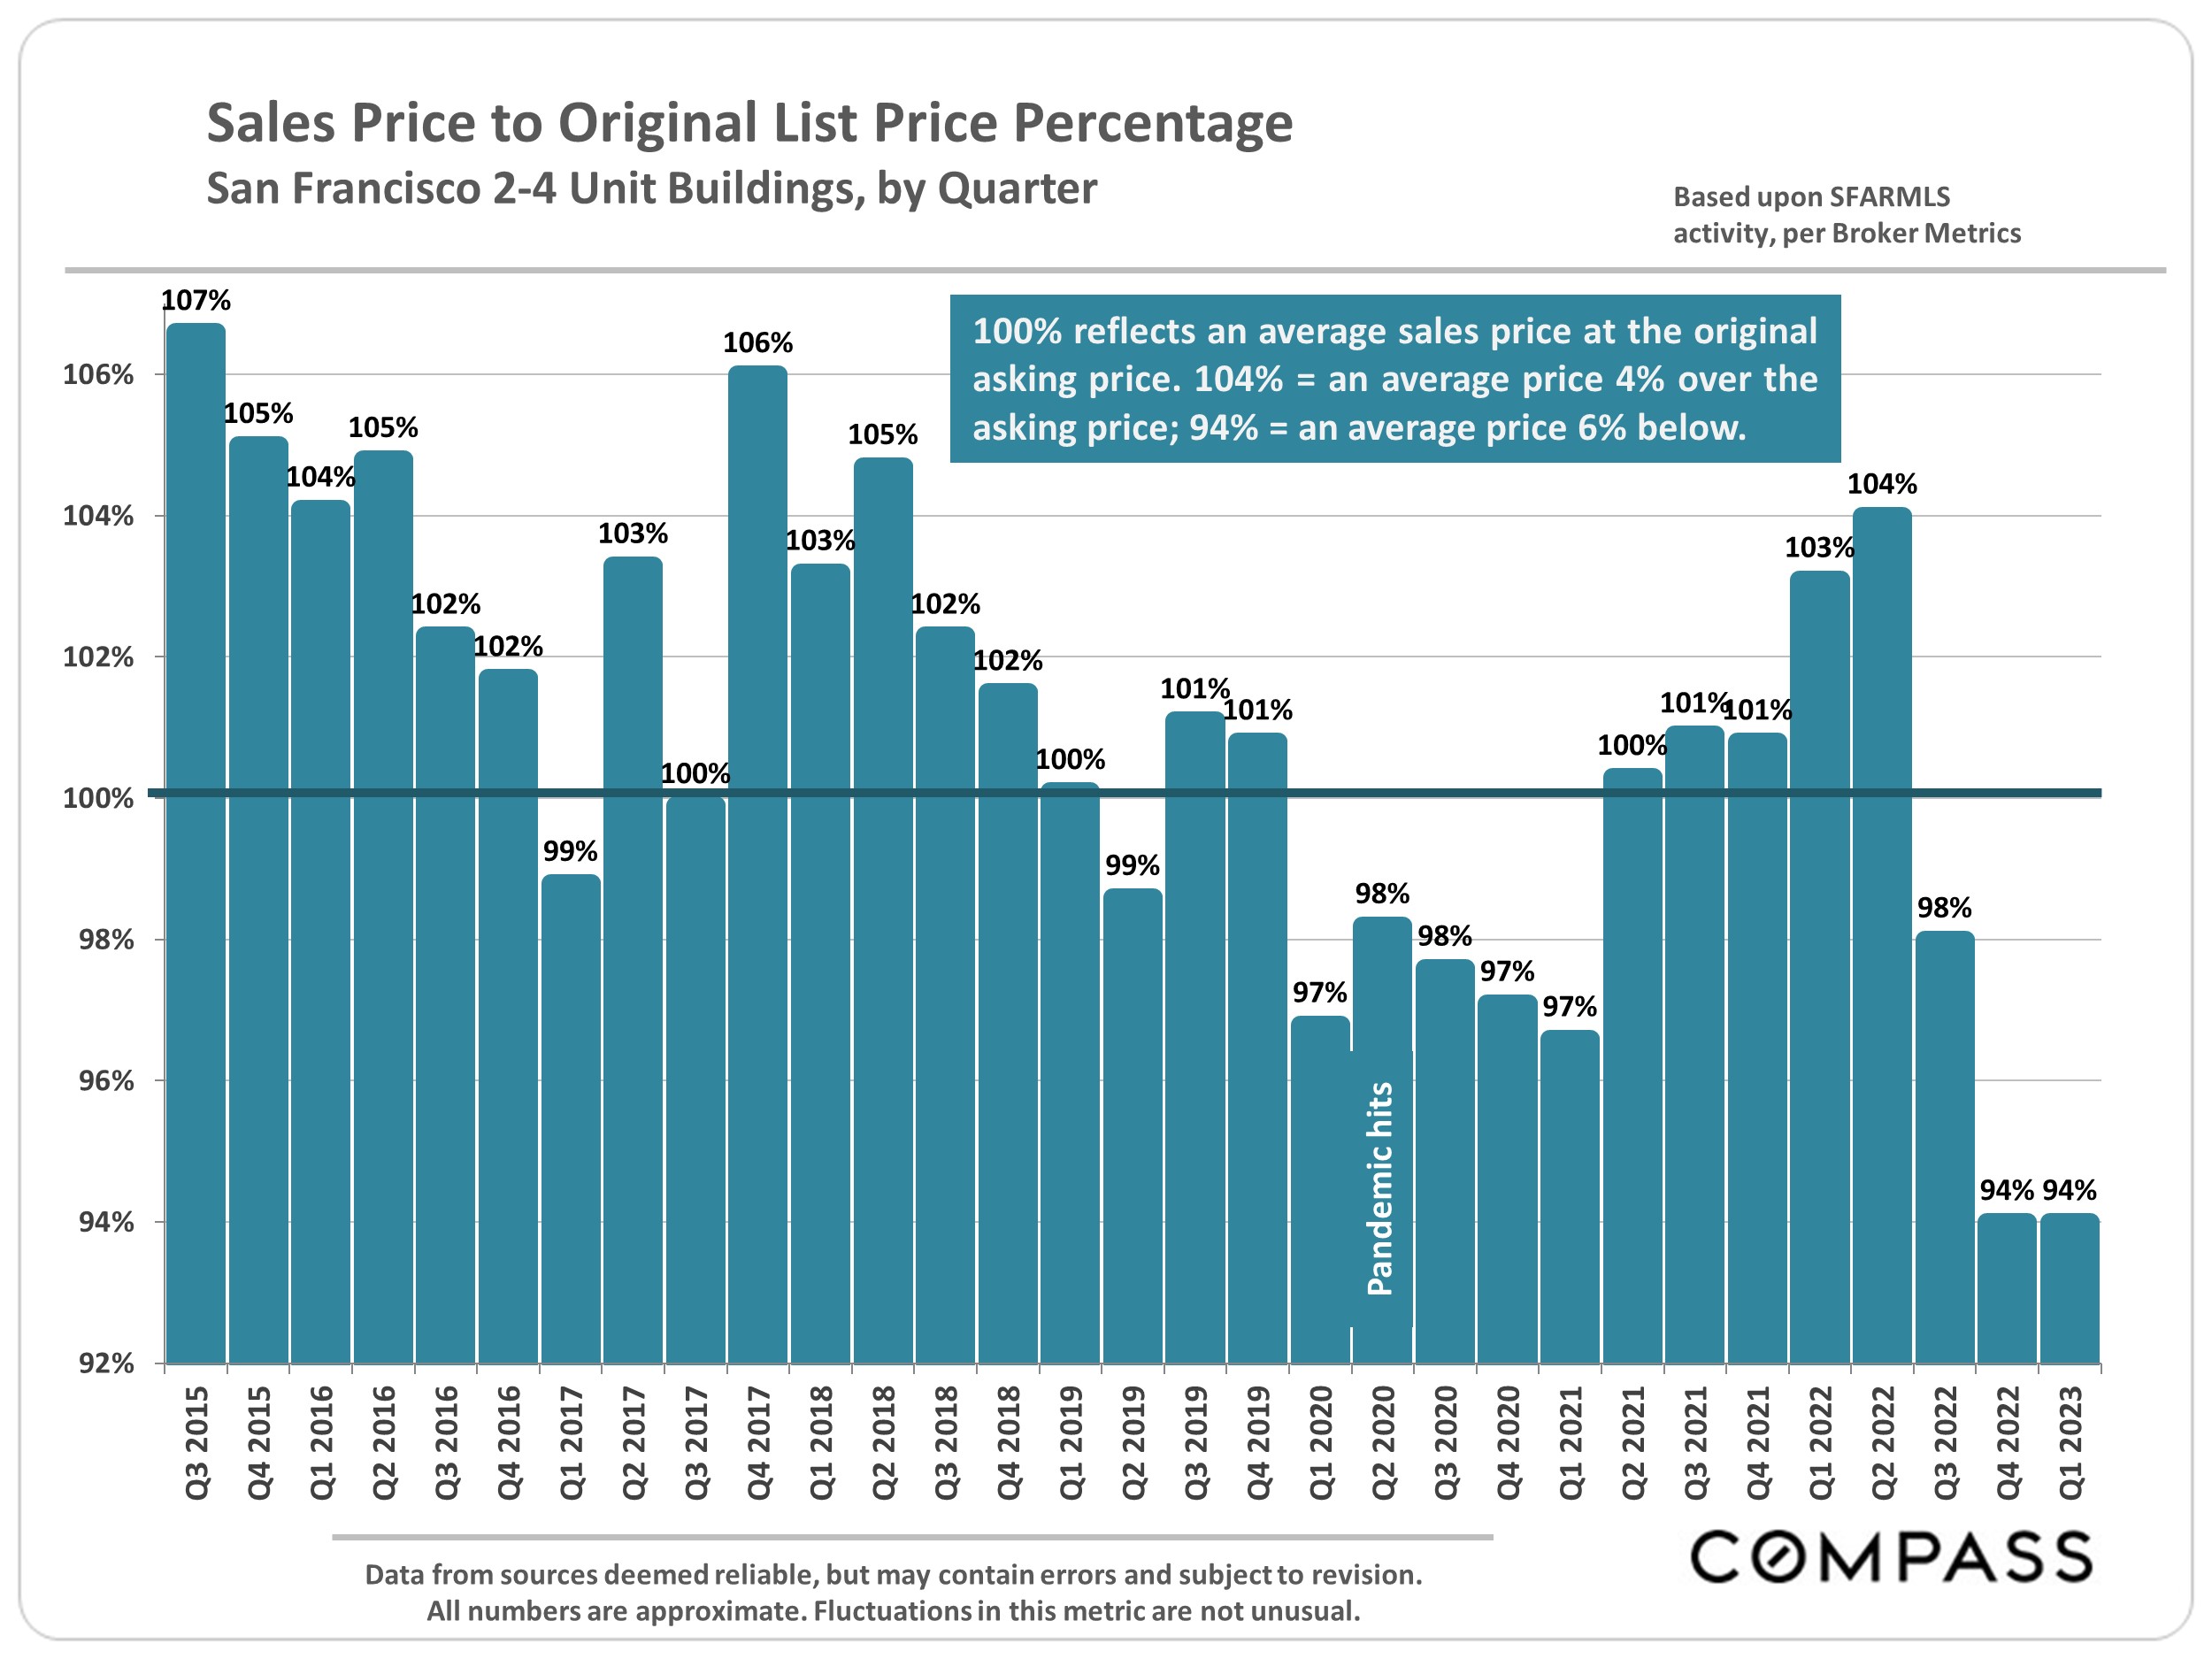
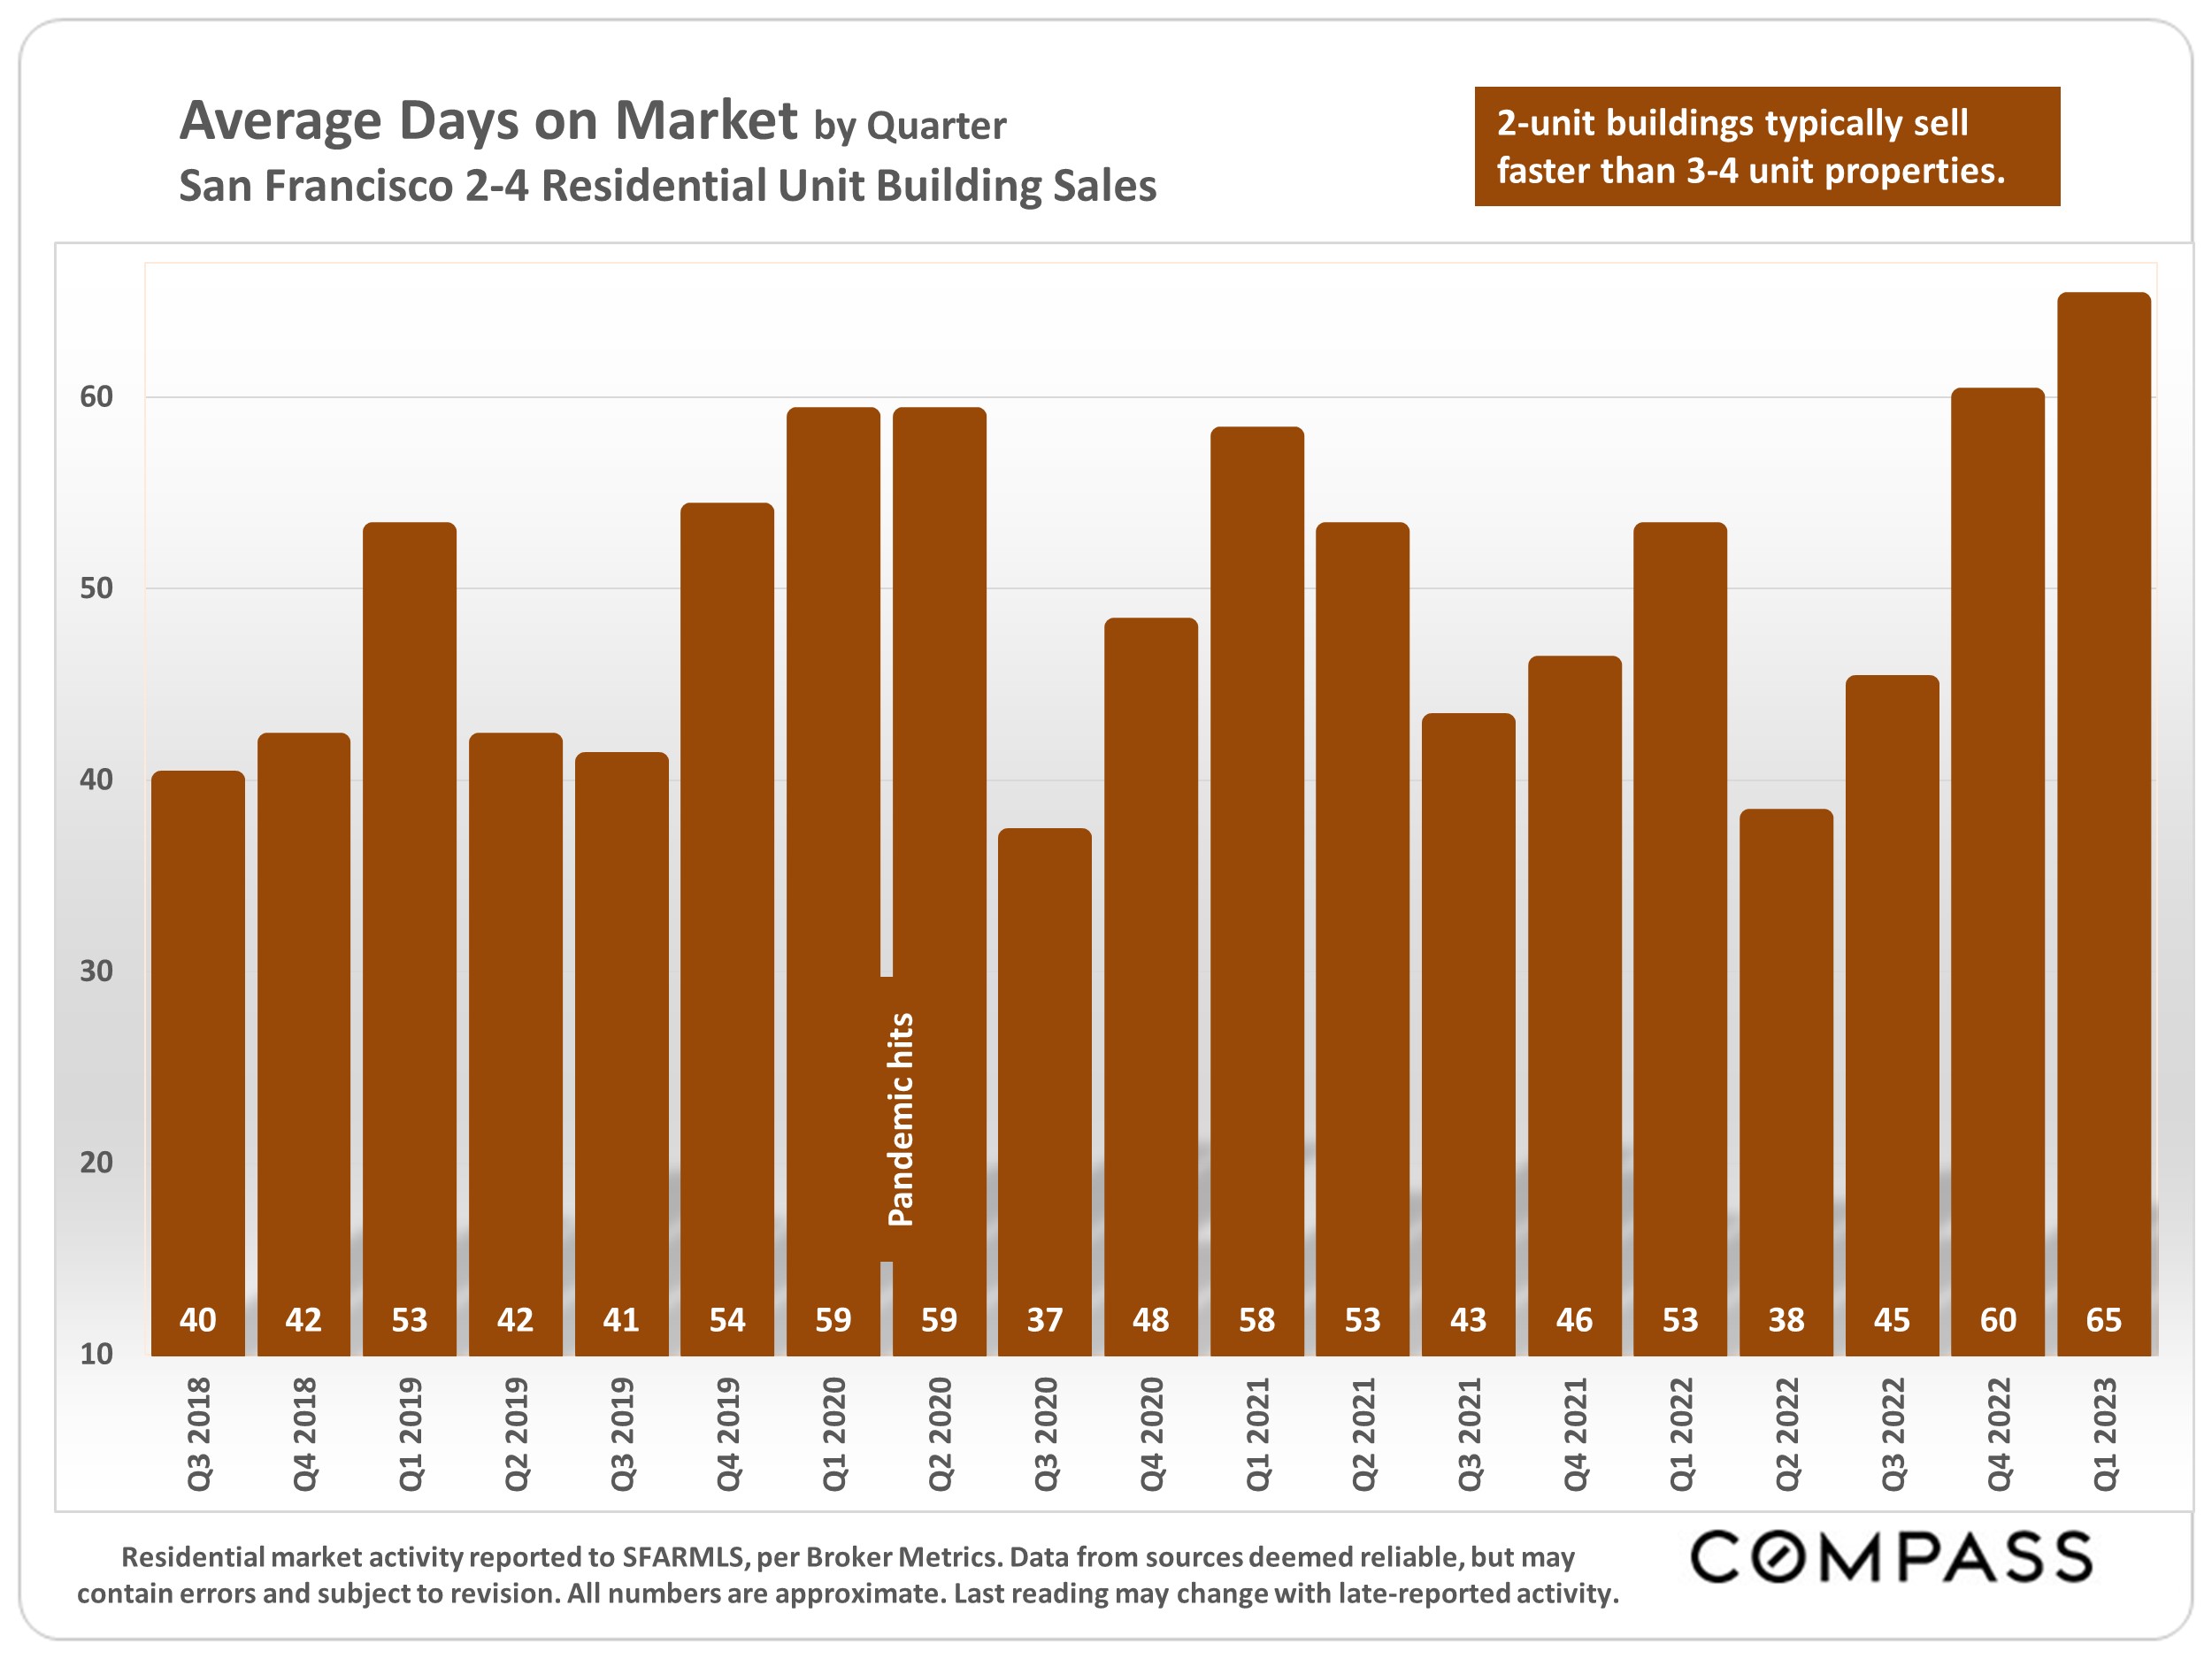
The environment in the San Francisco multi-family market continued to be challenging the first quarter of 2023 due to both local issues and national factors, with a drop in quarterly sales volume rivaling the plunge seen in the immediate aftermath of the pandemic hitting in early 2020.

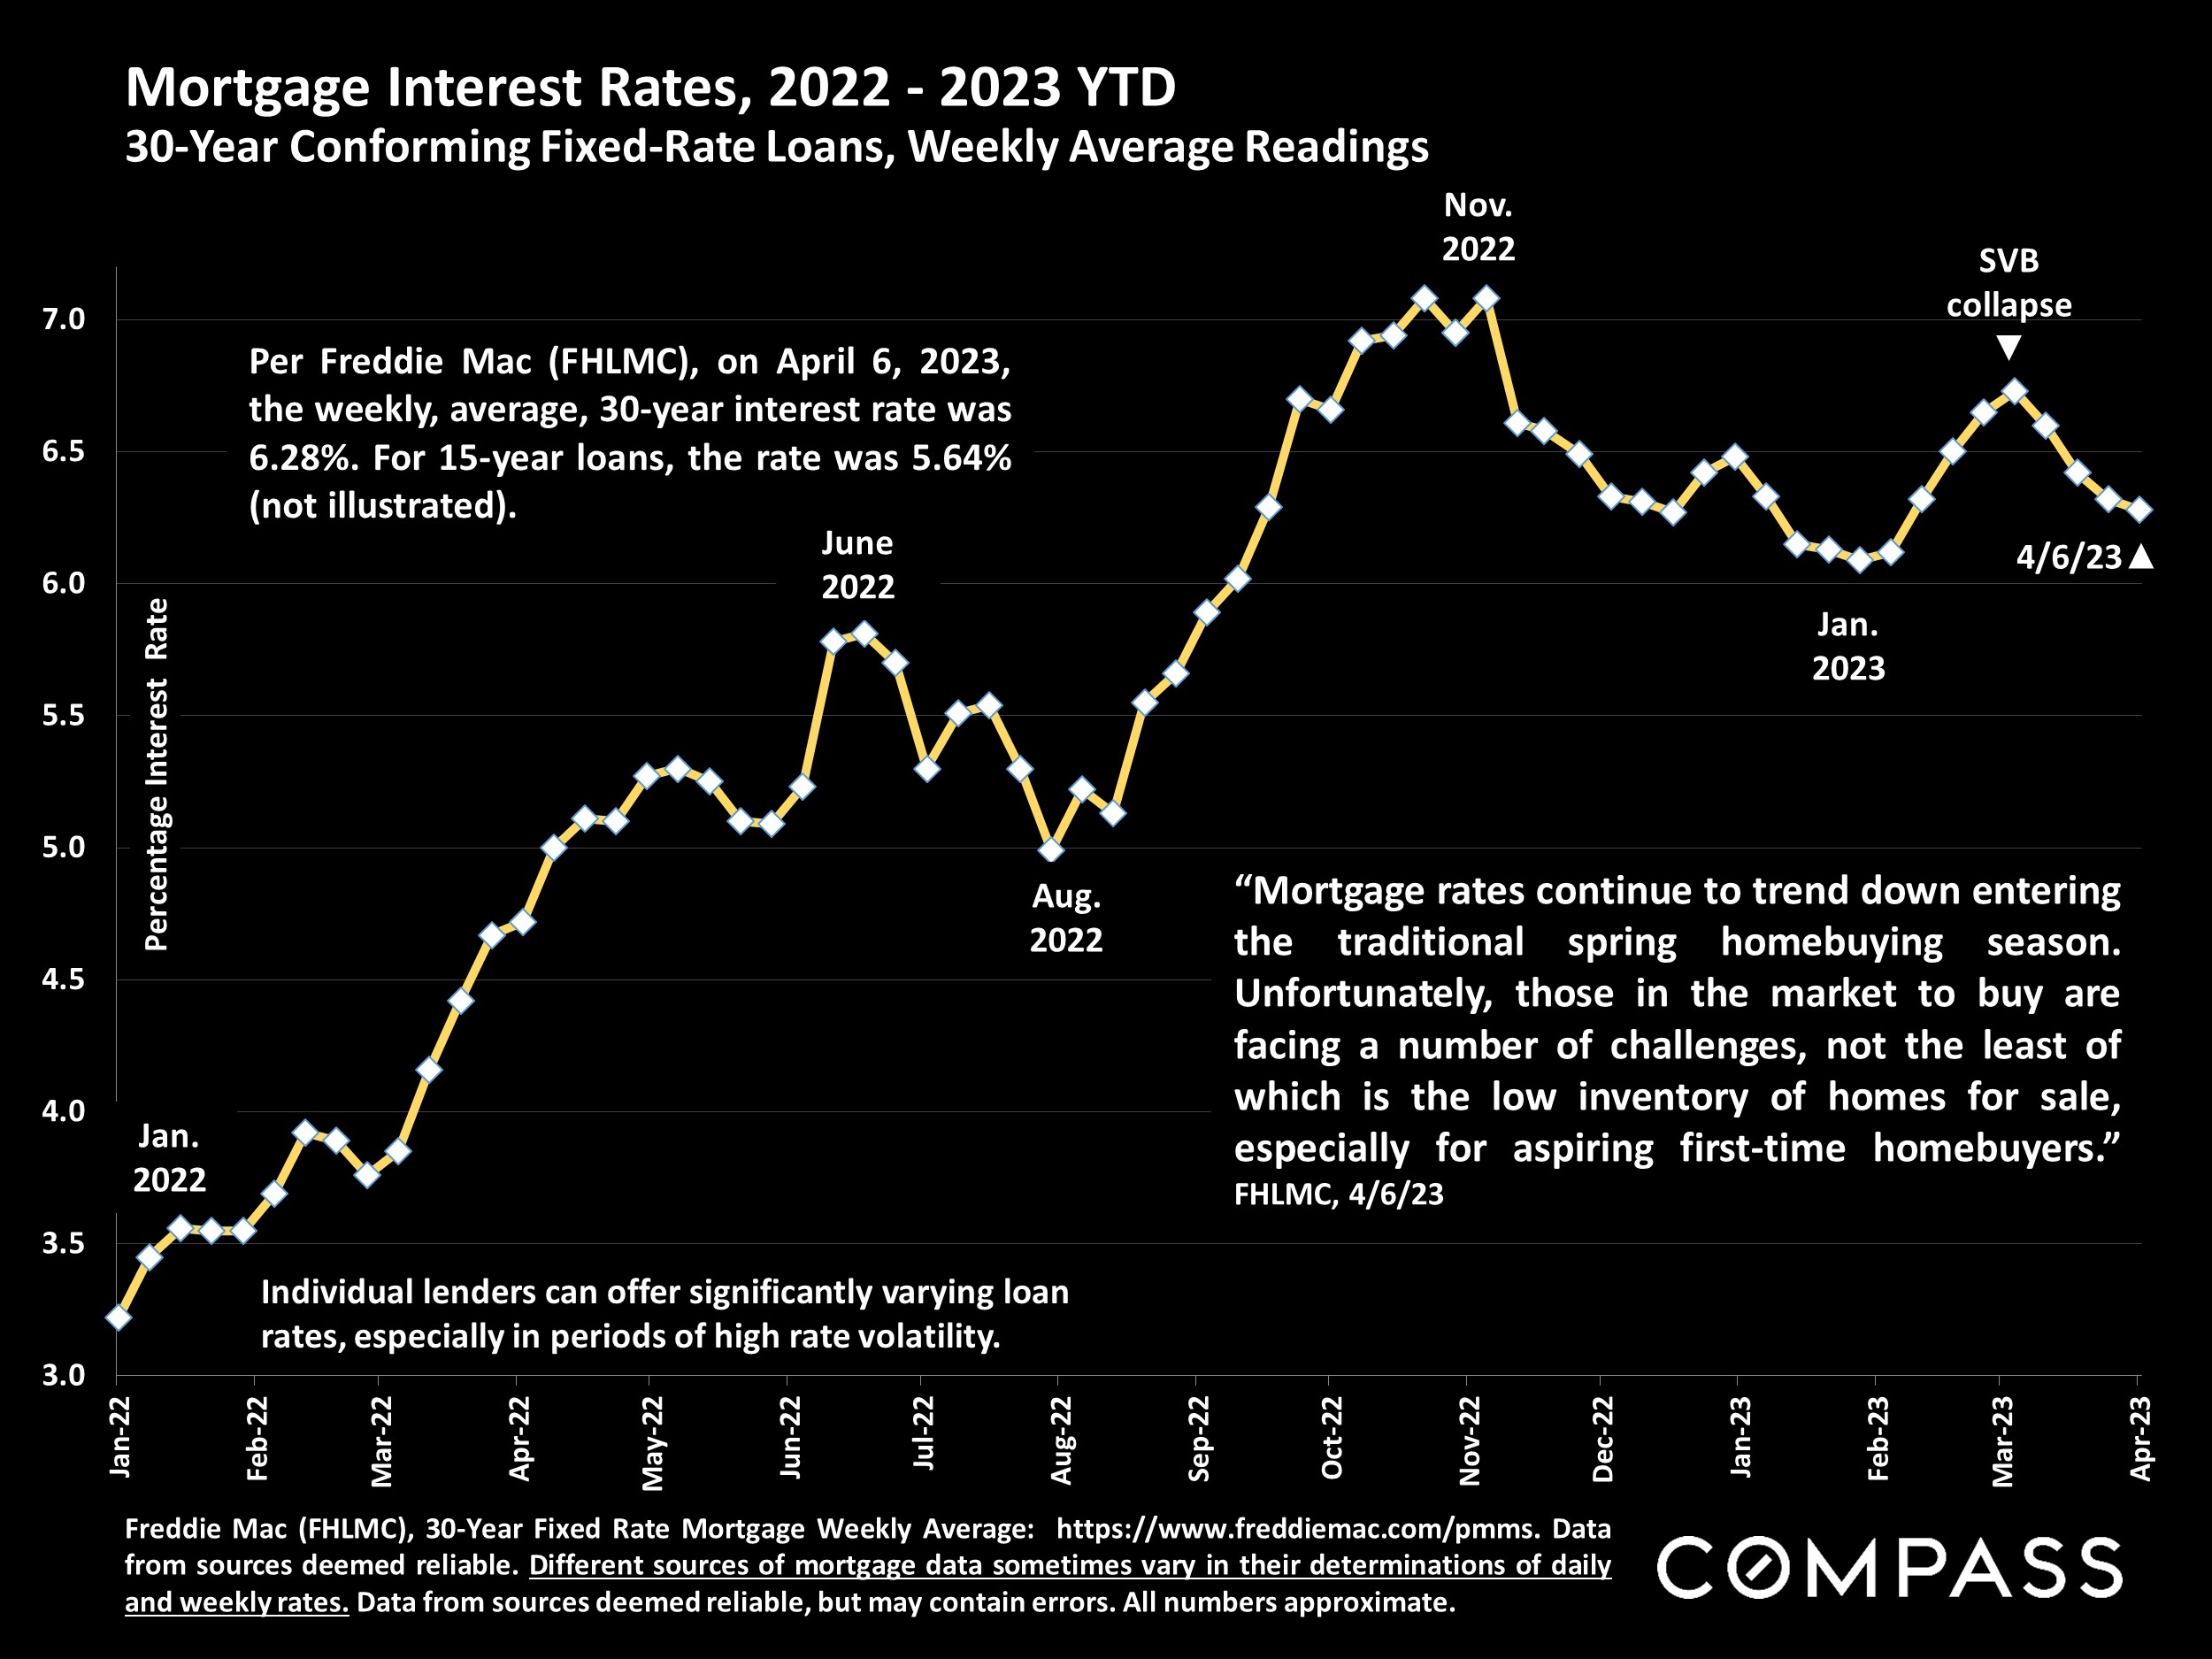
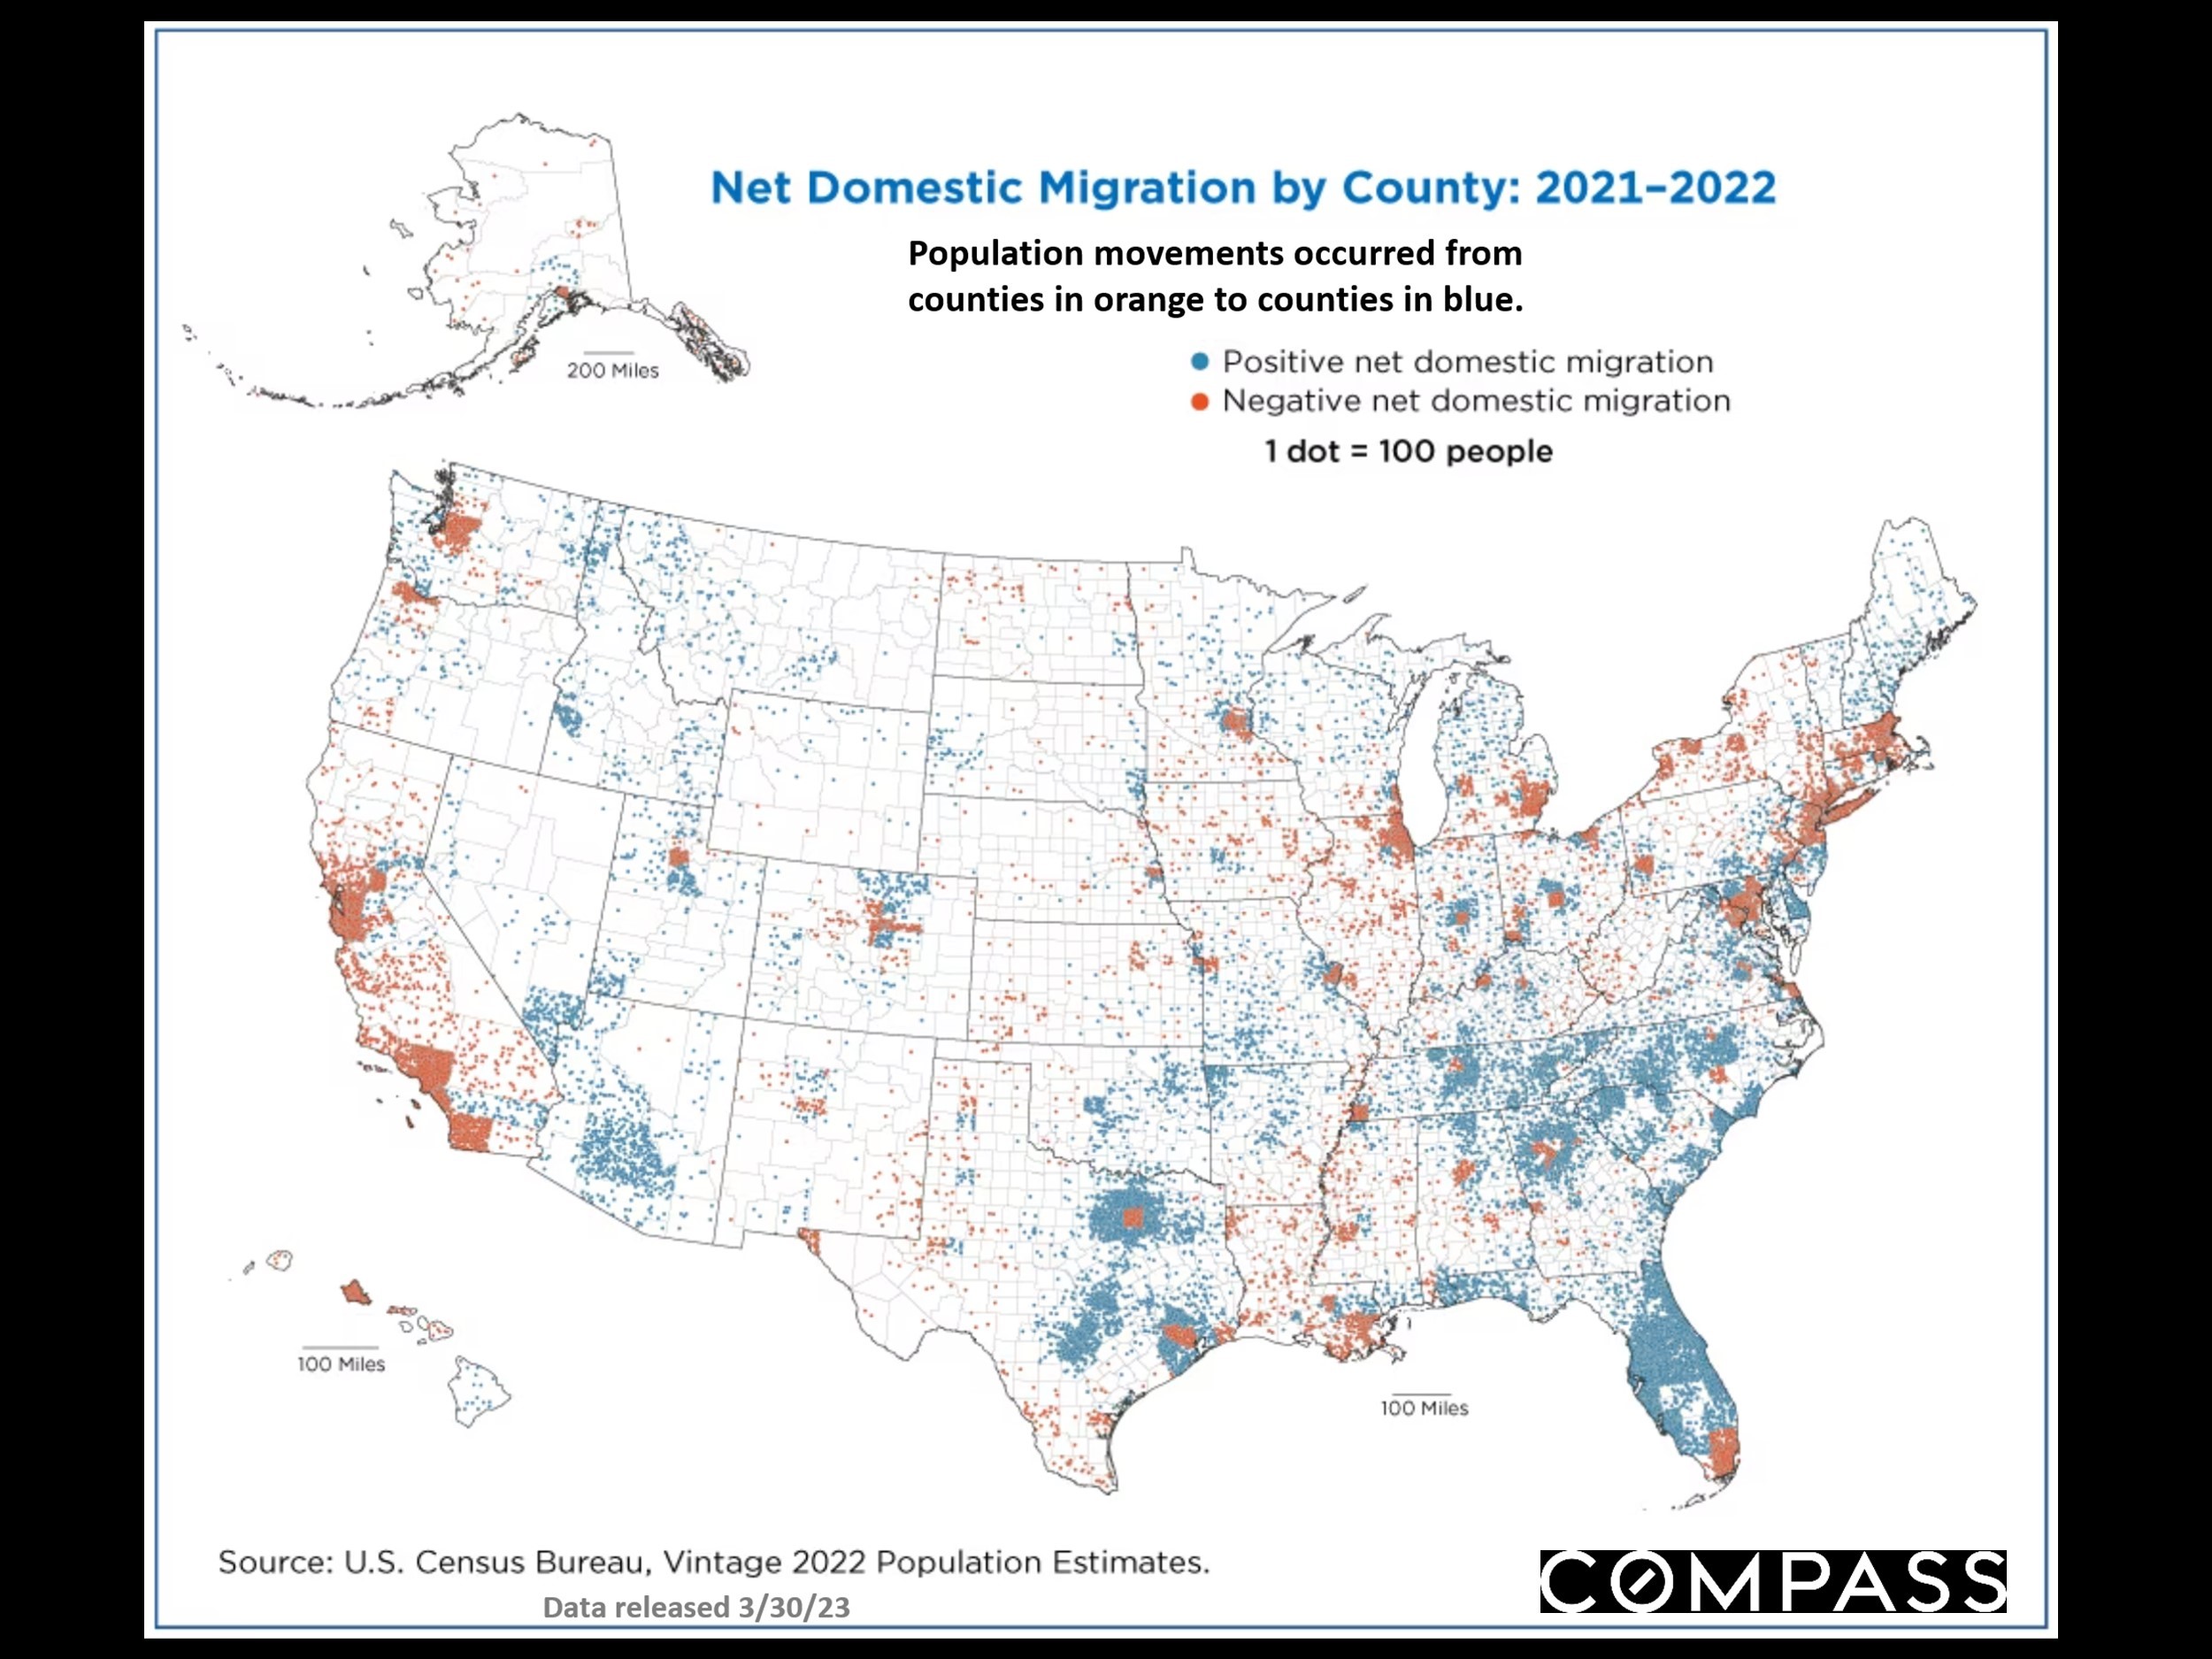
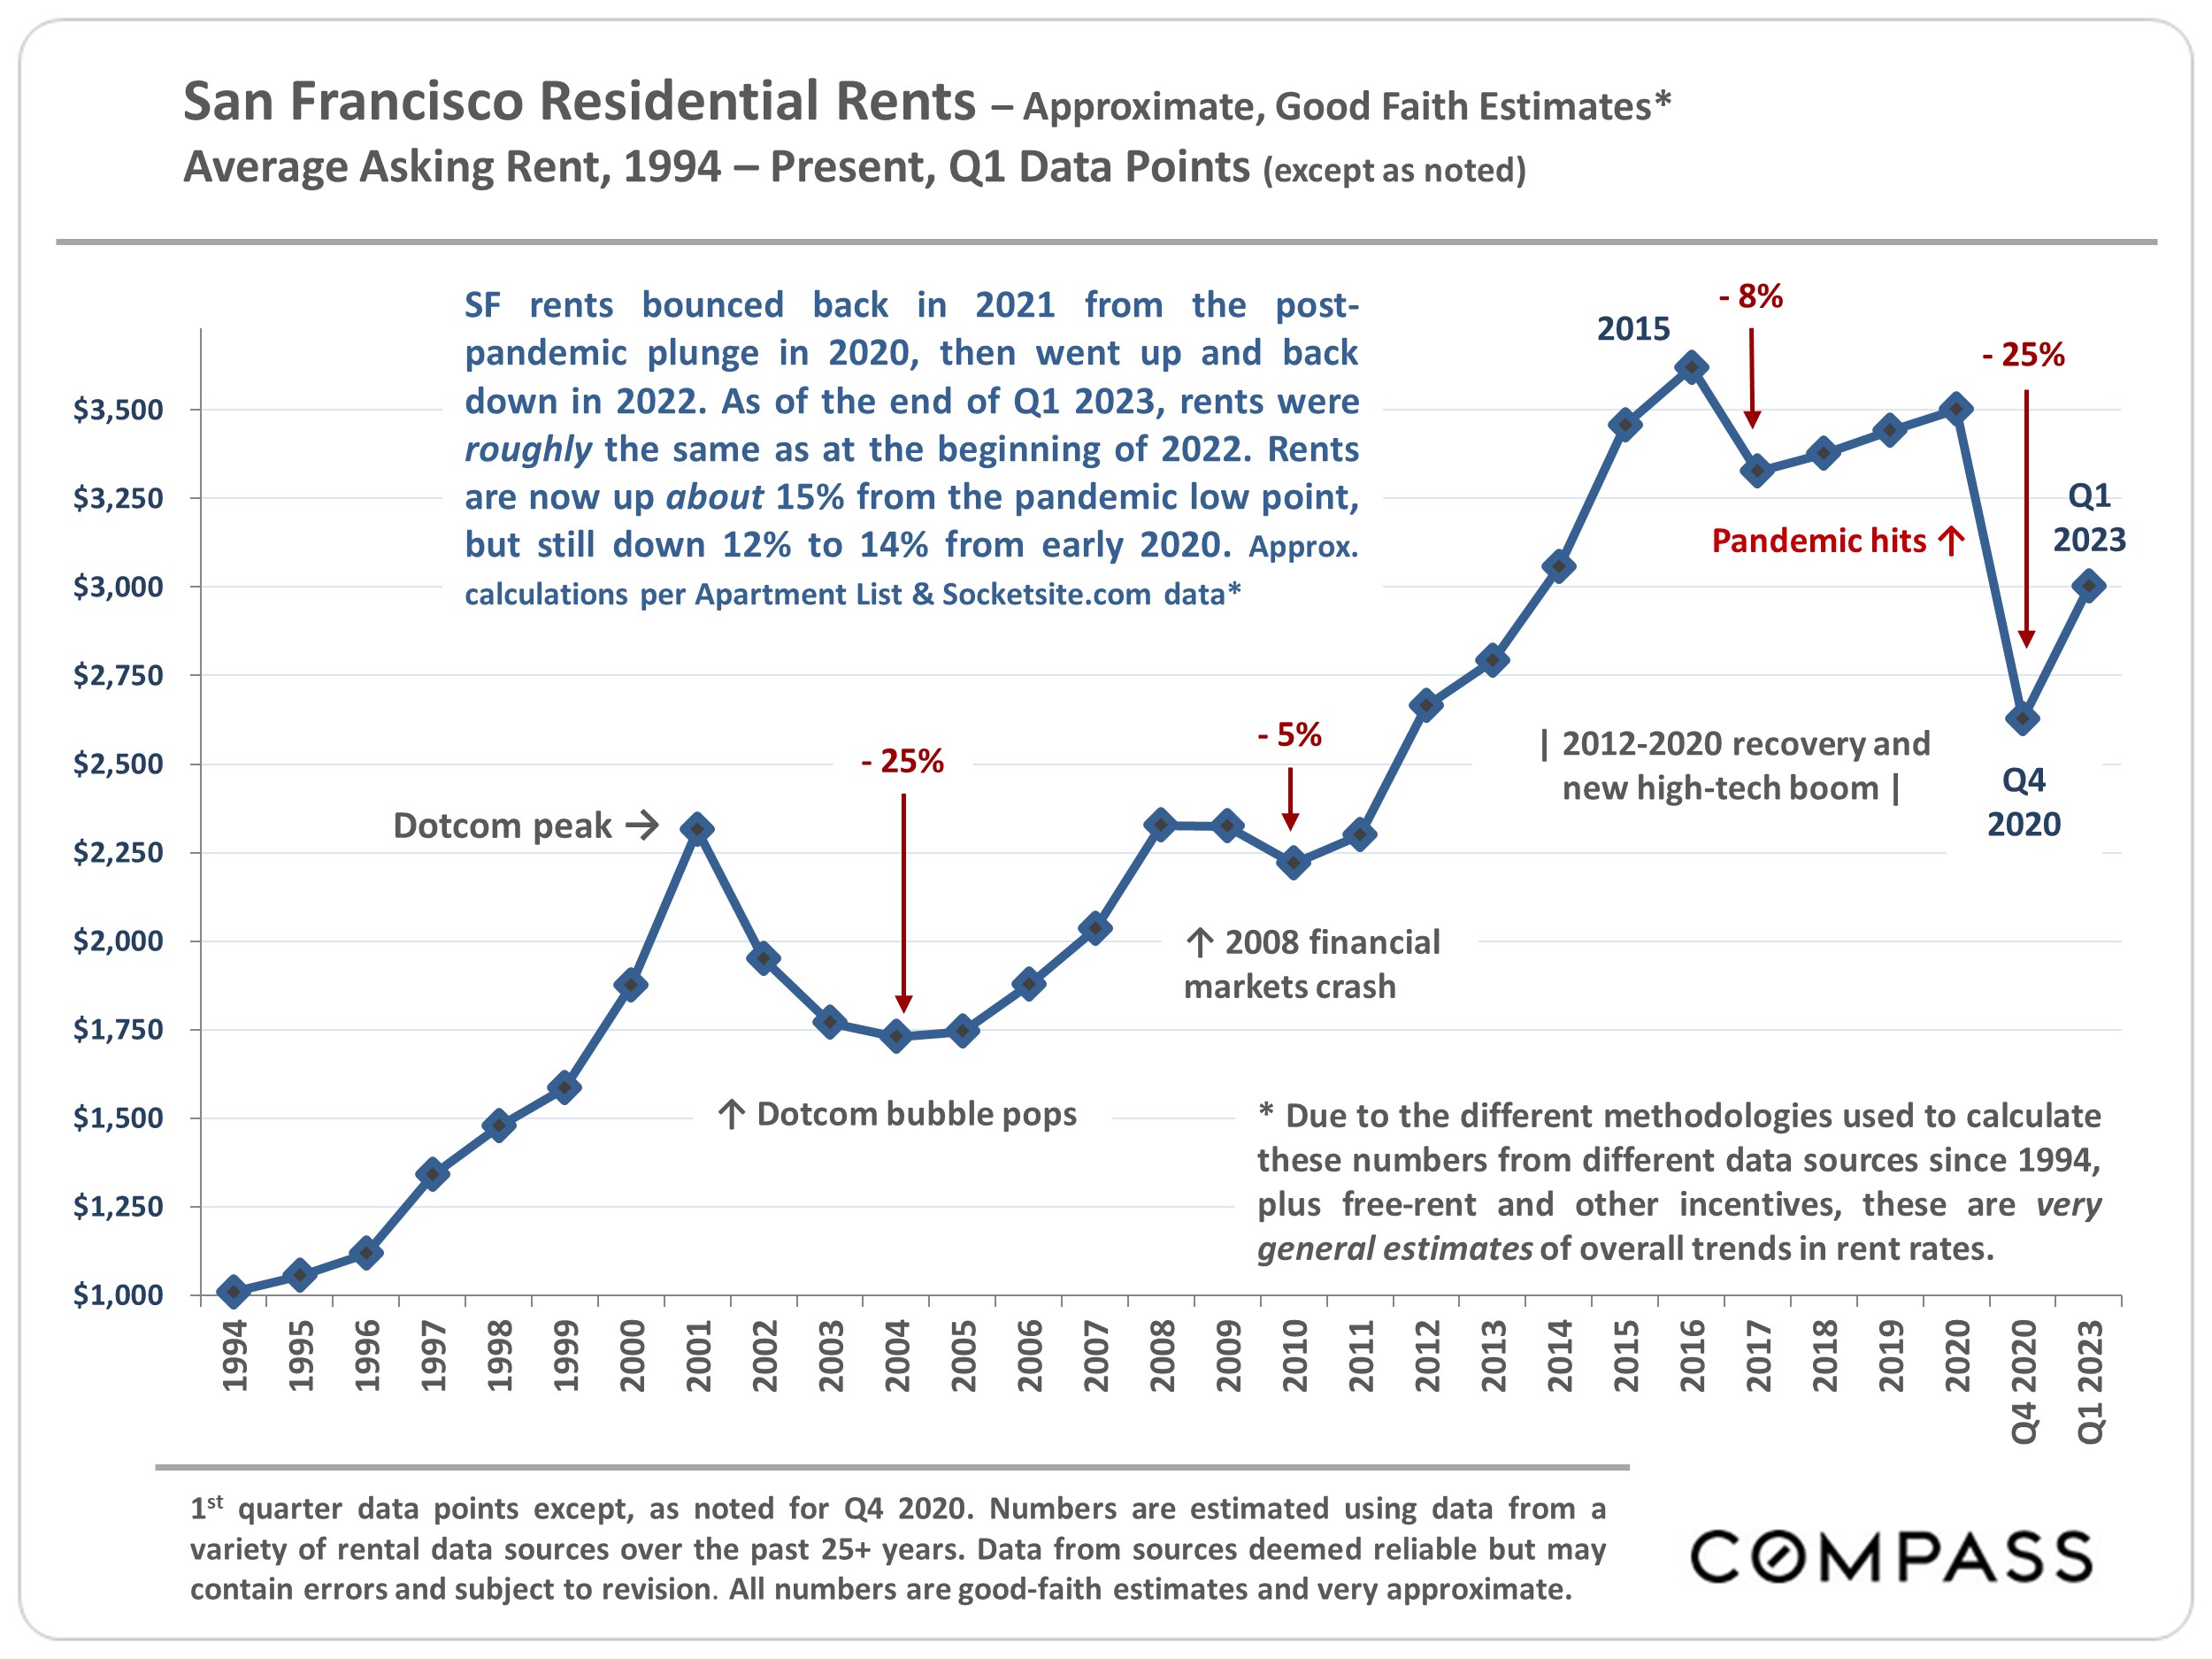
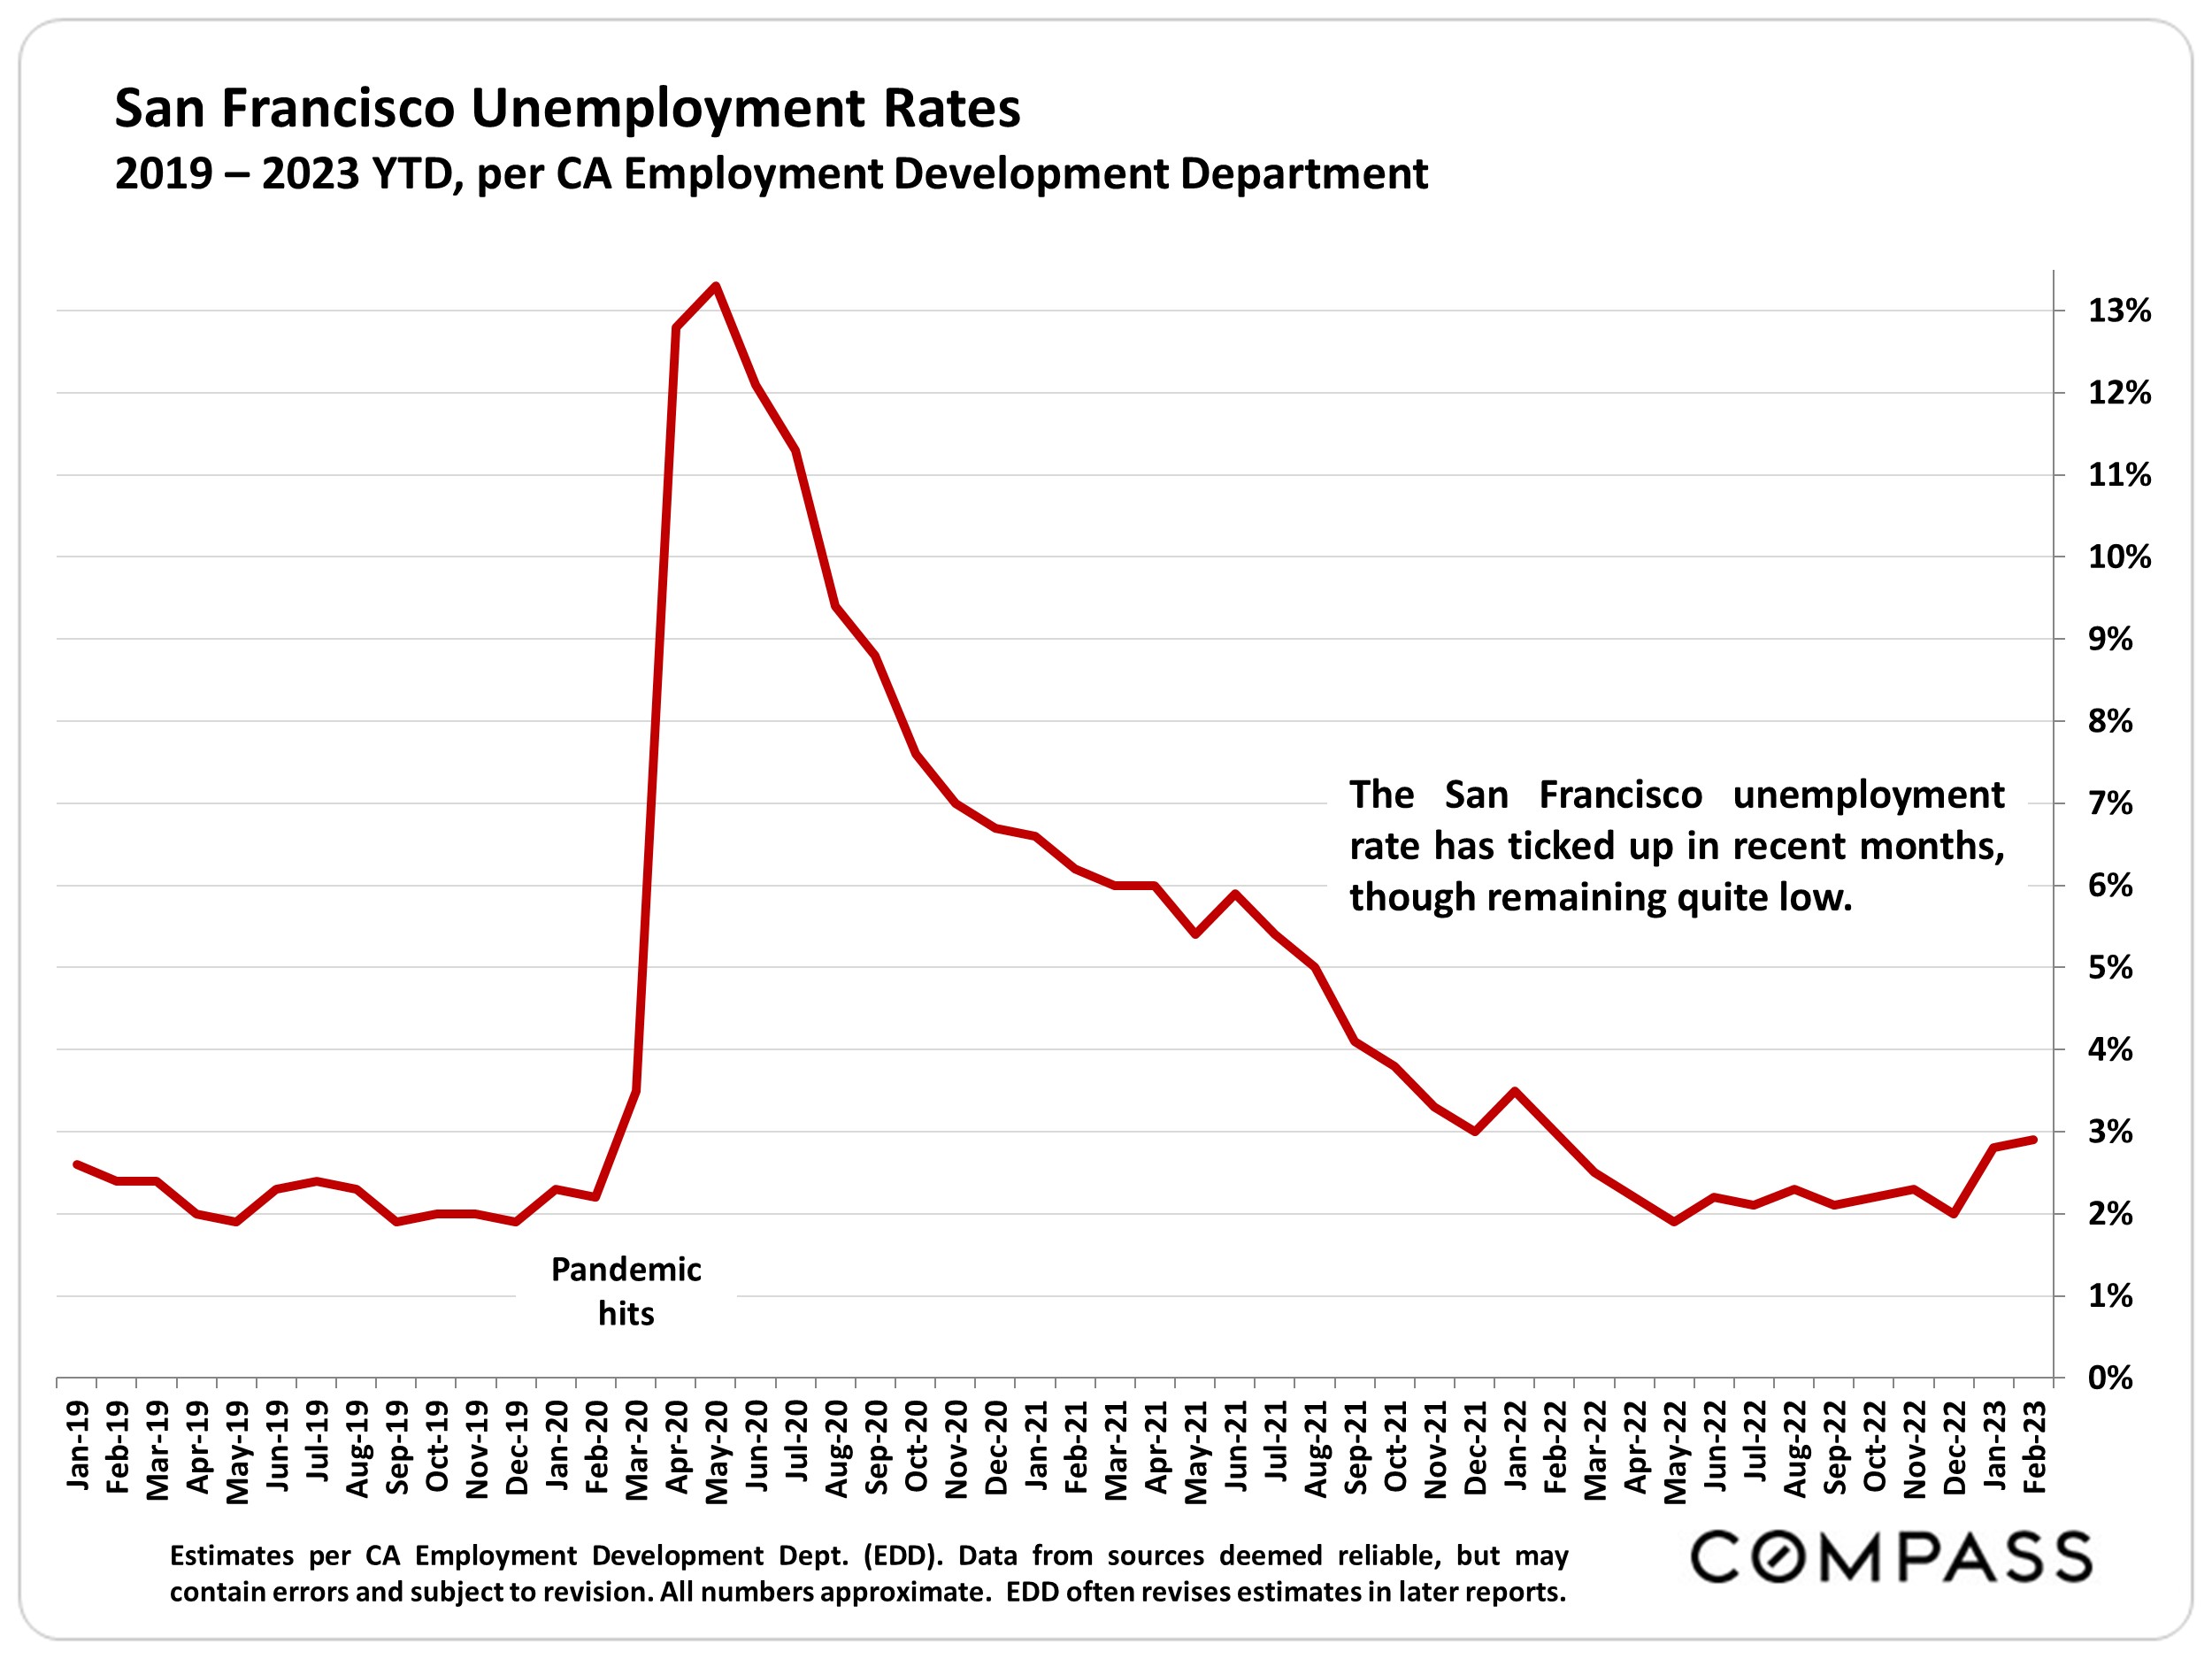
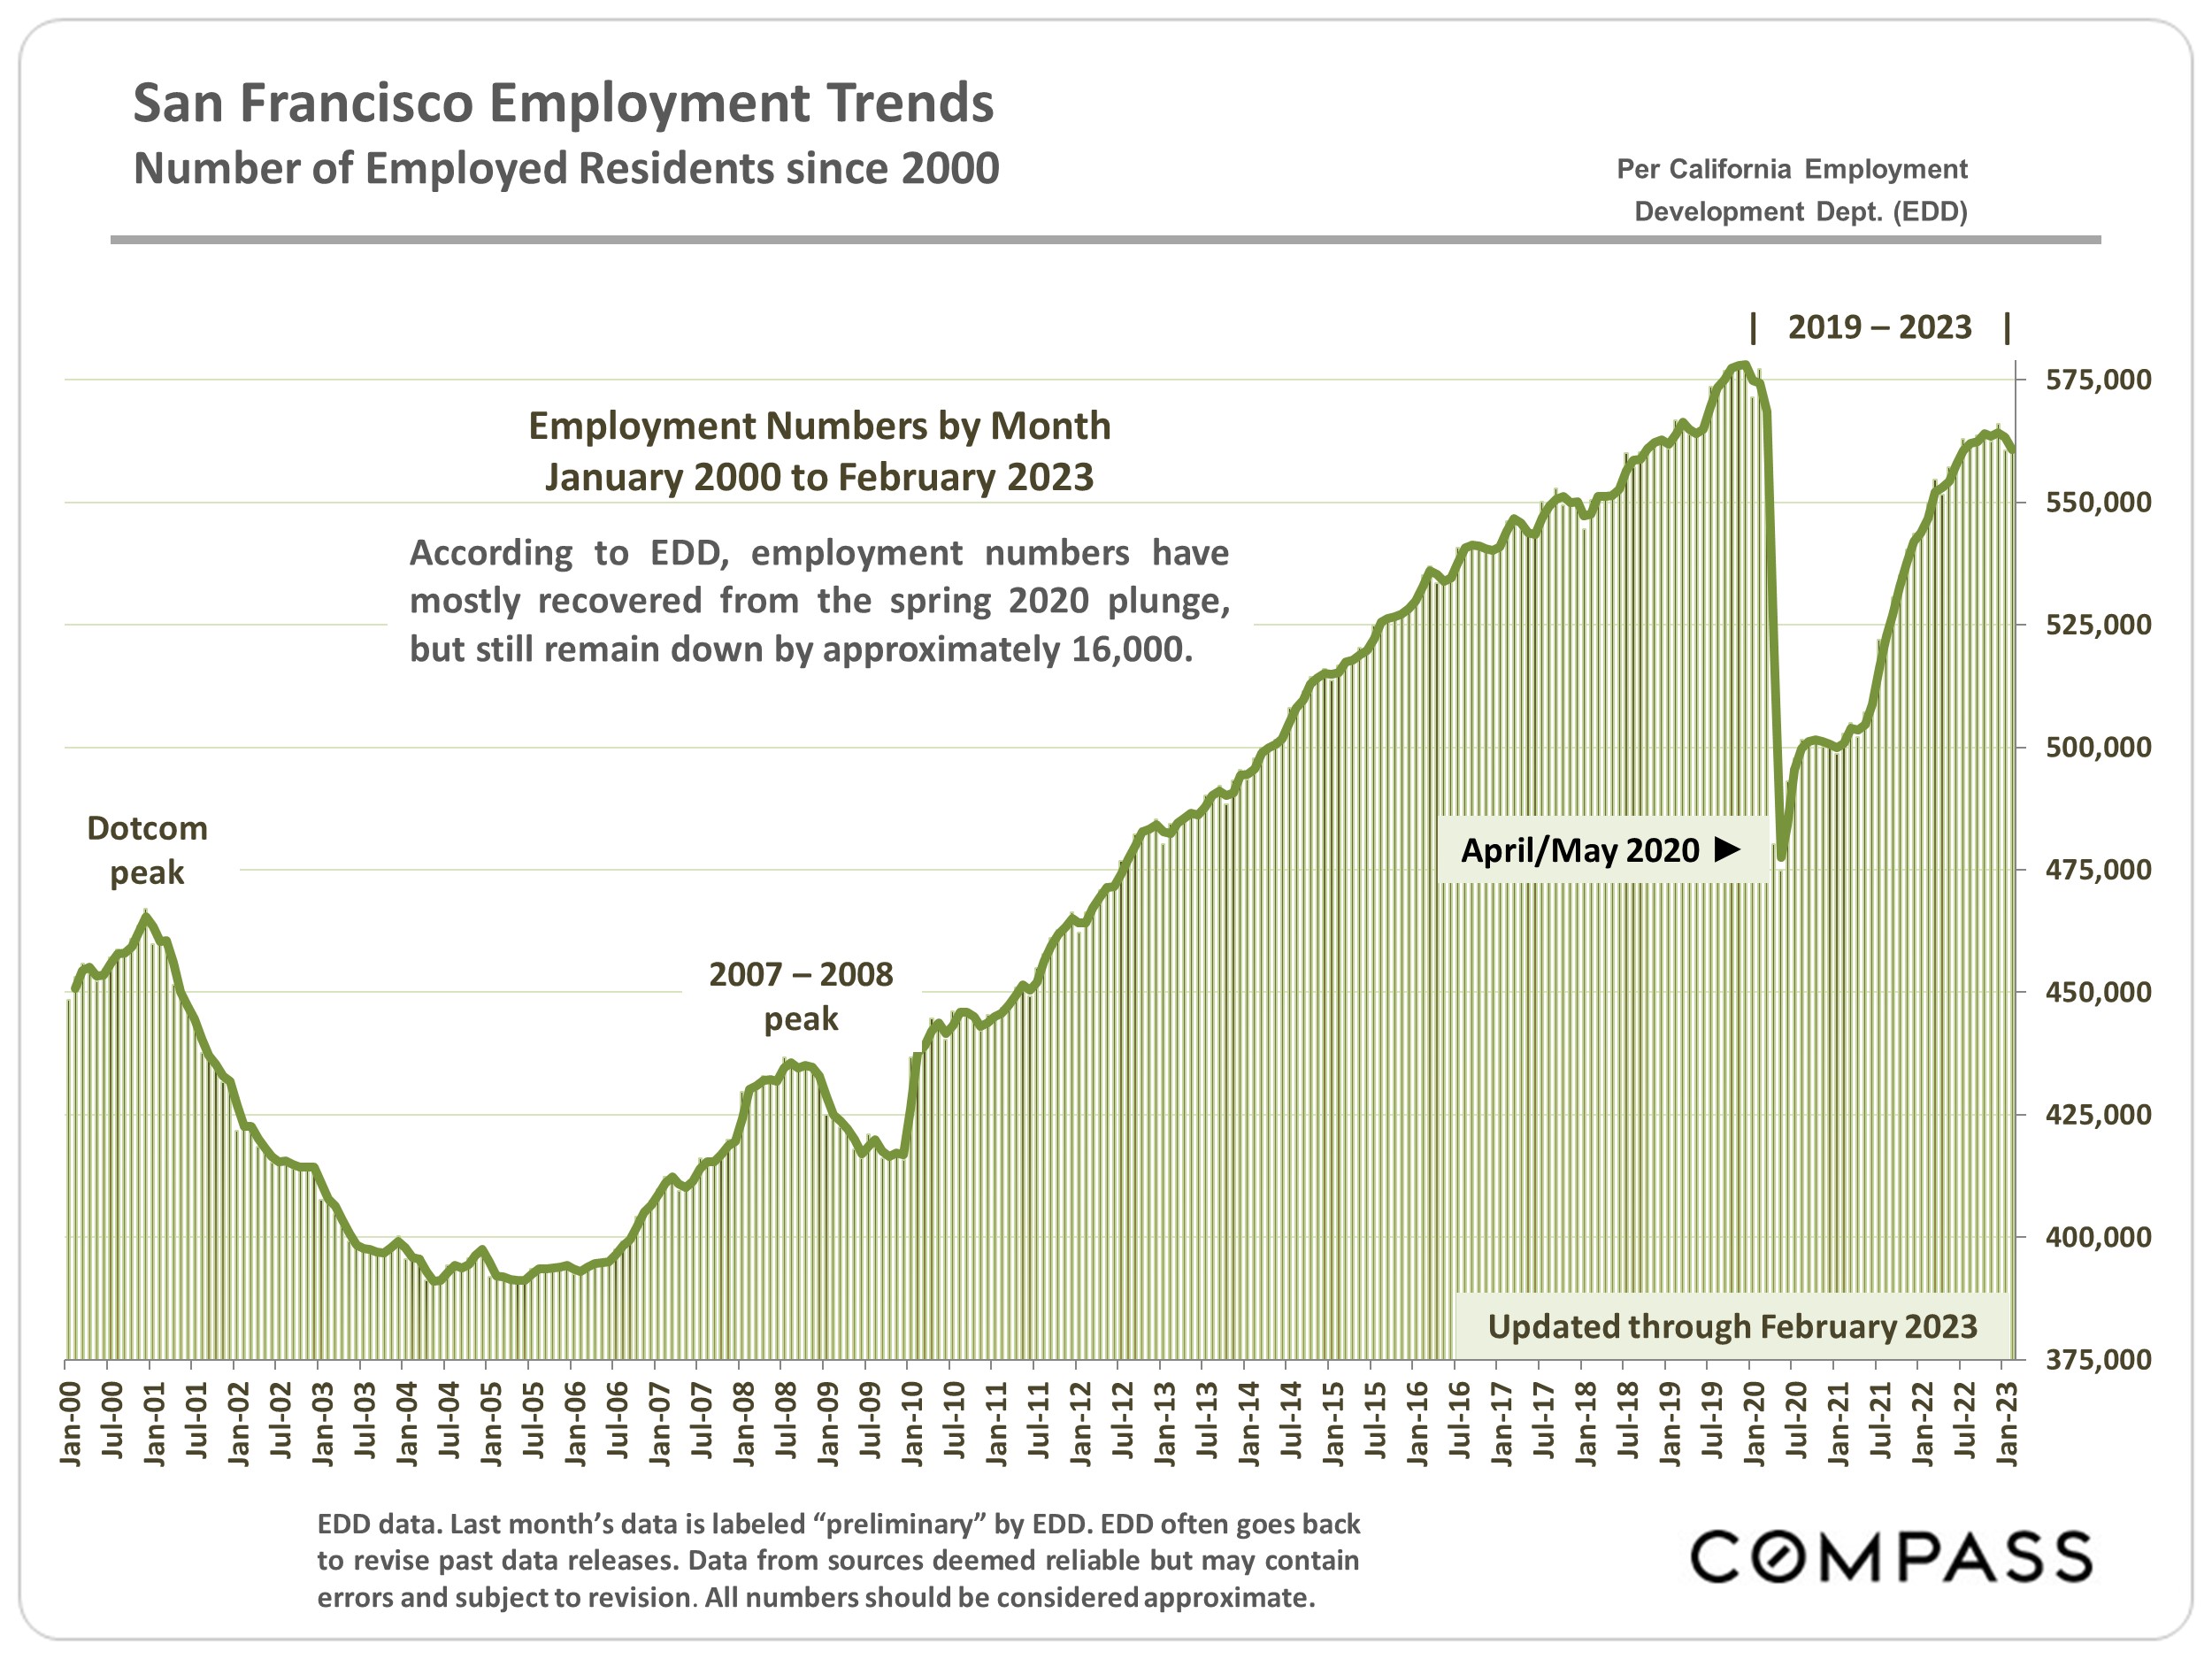
Local factors include high-tech layoffs, half-empty office buildings, a continued decline in population in 2021-2022 (though the decline is much reduced from the previous 12-month period), and various social/political issues. Interest rates remain more than twice as high as at the start of 2022. According to Apartment List, average asking rents in San Francisco climbed in the first half of 2022, but dropped back down, erasing the gain, in the second, and have ticked down further, slightly, so far in 2023: Rents remain well below pre-pandemic rates. The recent banking crisis, which caused the collapse of Silicon Valley Bank and ongoing uncertainty with First Republic Bank among others, is reportedly making it more difficult to buy properties as lenders pull back or raise rates.

According to the Wall Street Journal, quoting data published by Co-Star, national sales of multi-family buildings in Q1 fell at the fastest rate since 2009. The WSJ also reported that, according to the MSCI Real Assets pricing index, national multi-family prices dropped 8.7% in February on a year-over-year basis (with another source estimating a much sharper drop).

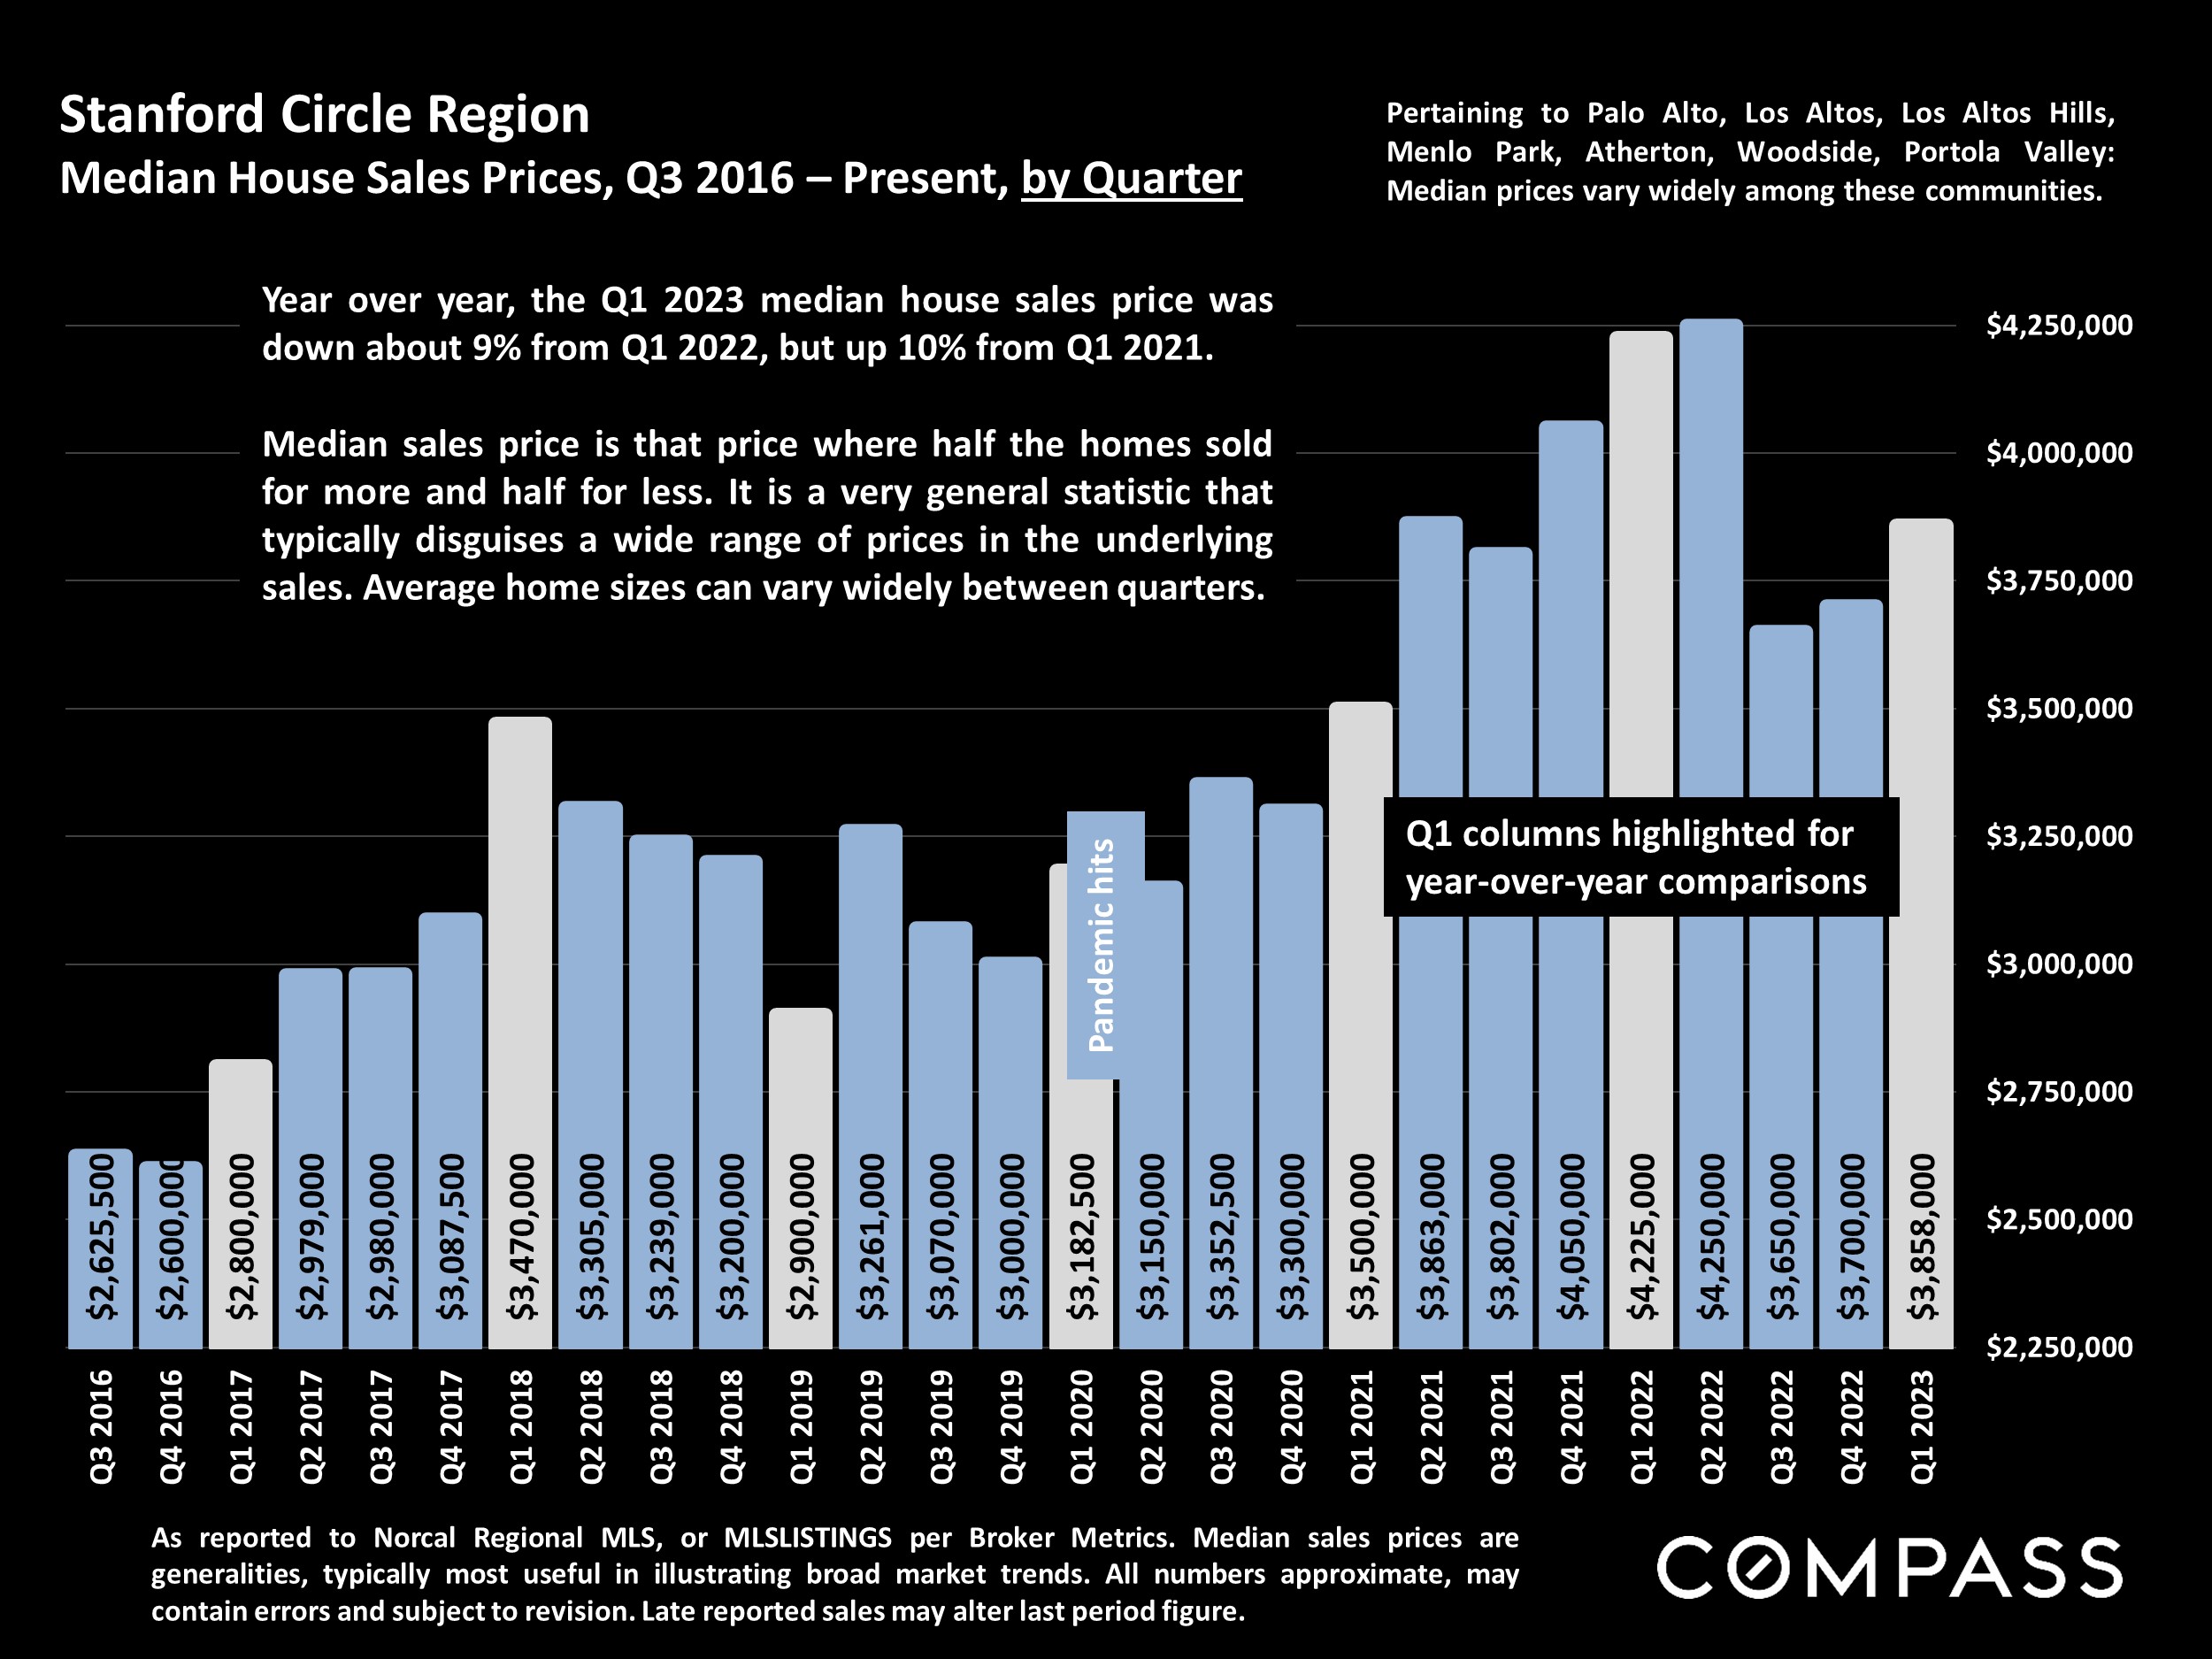
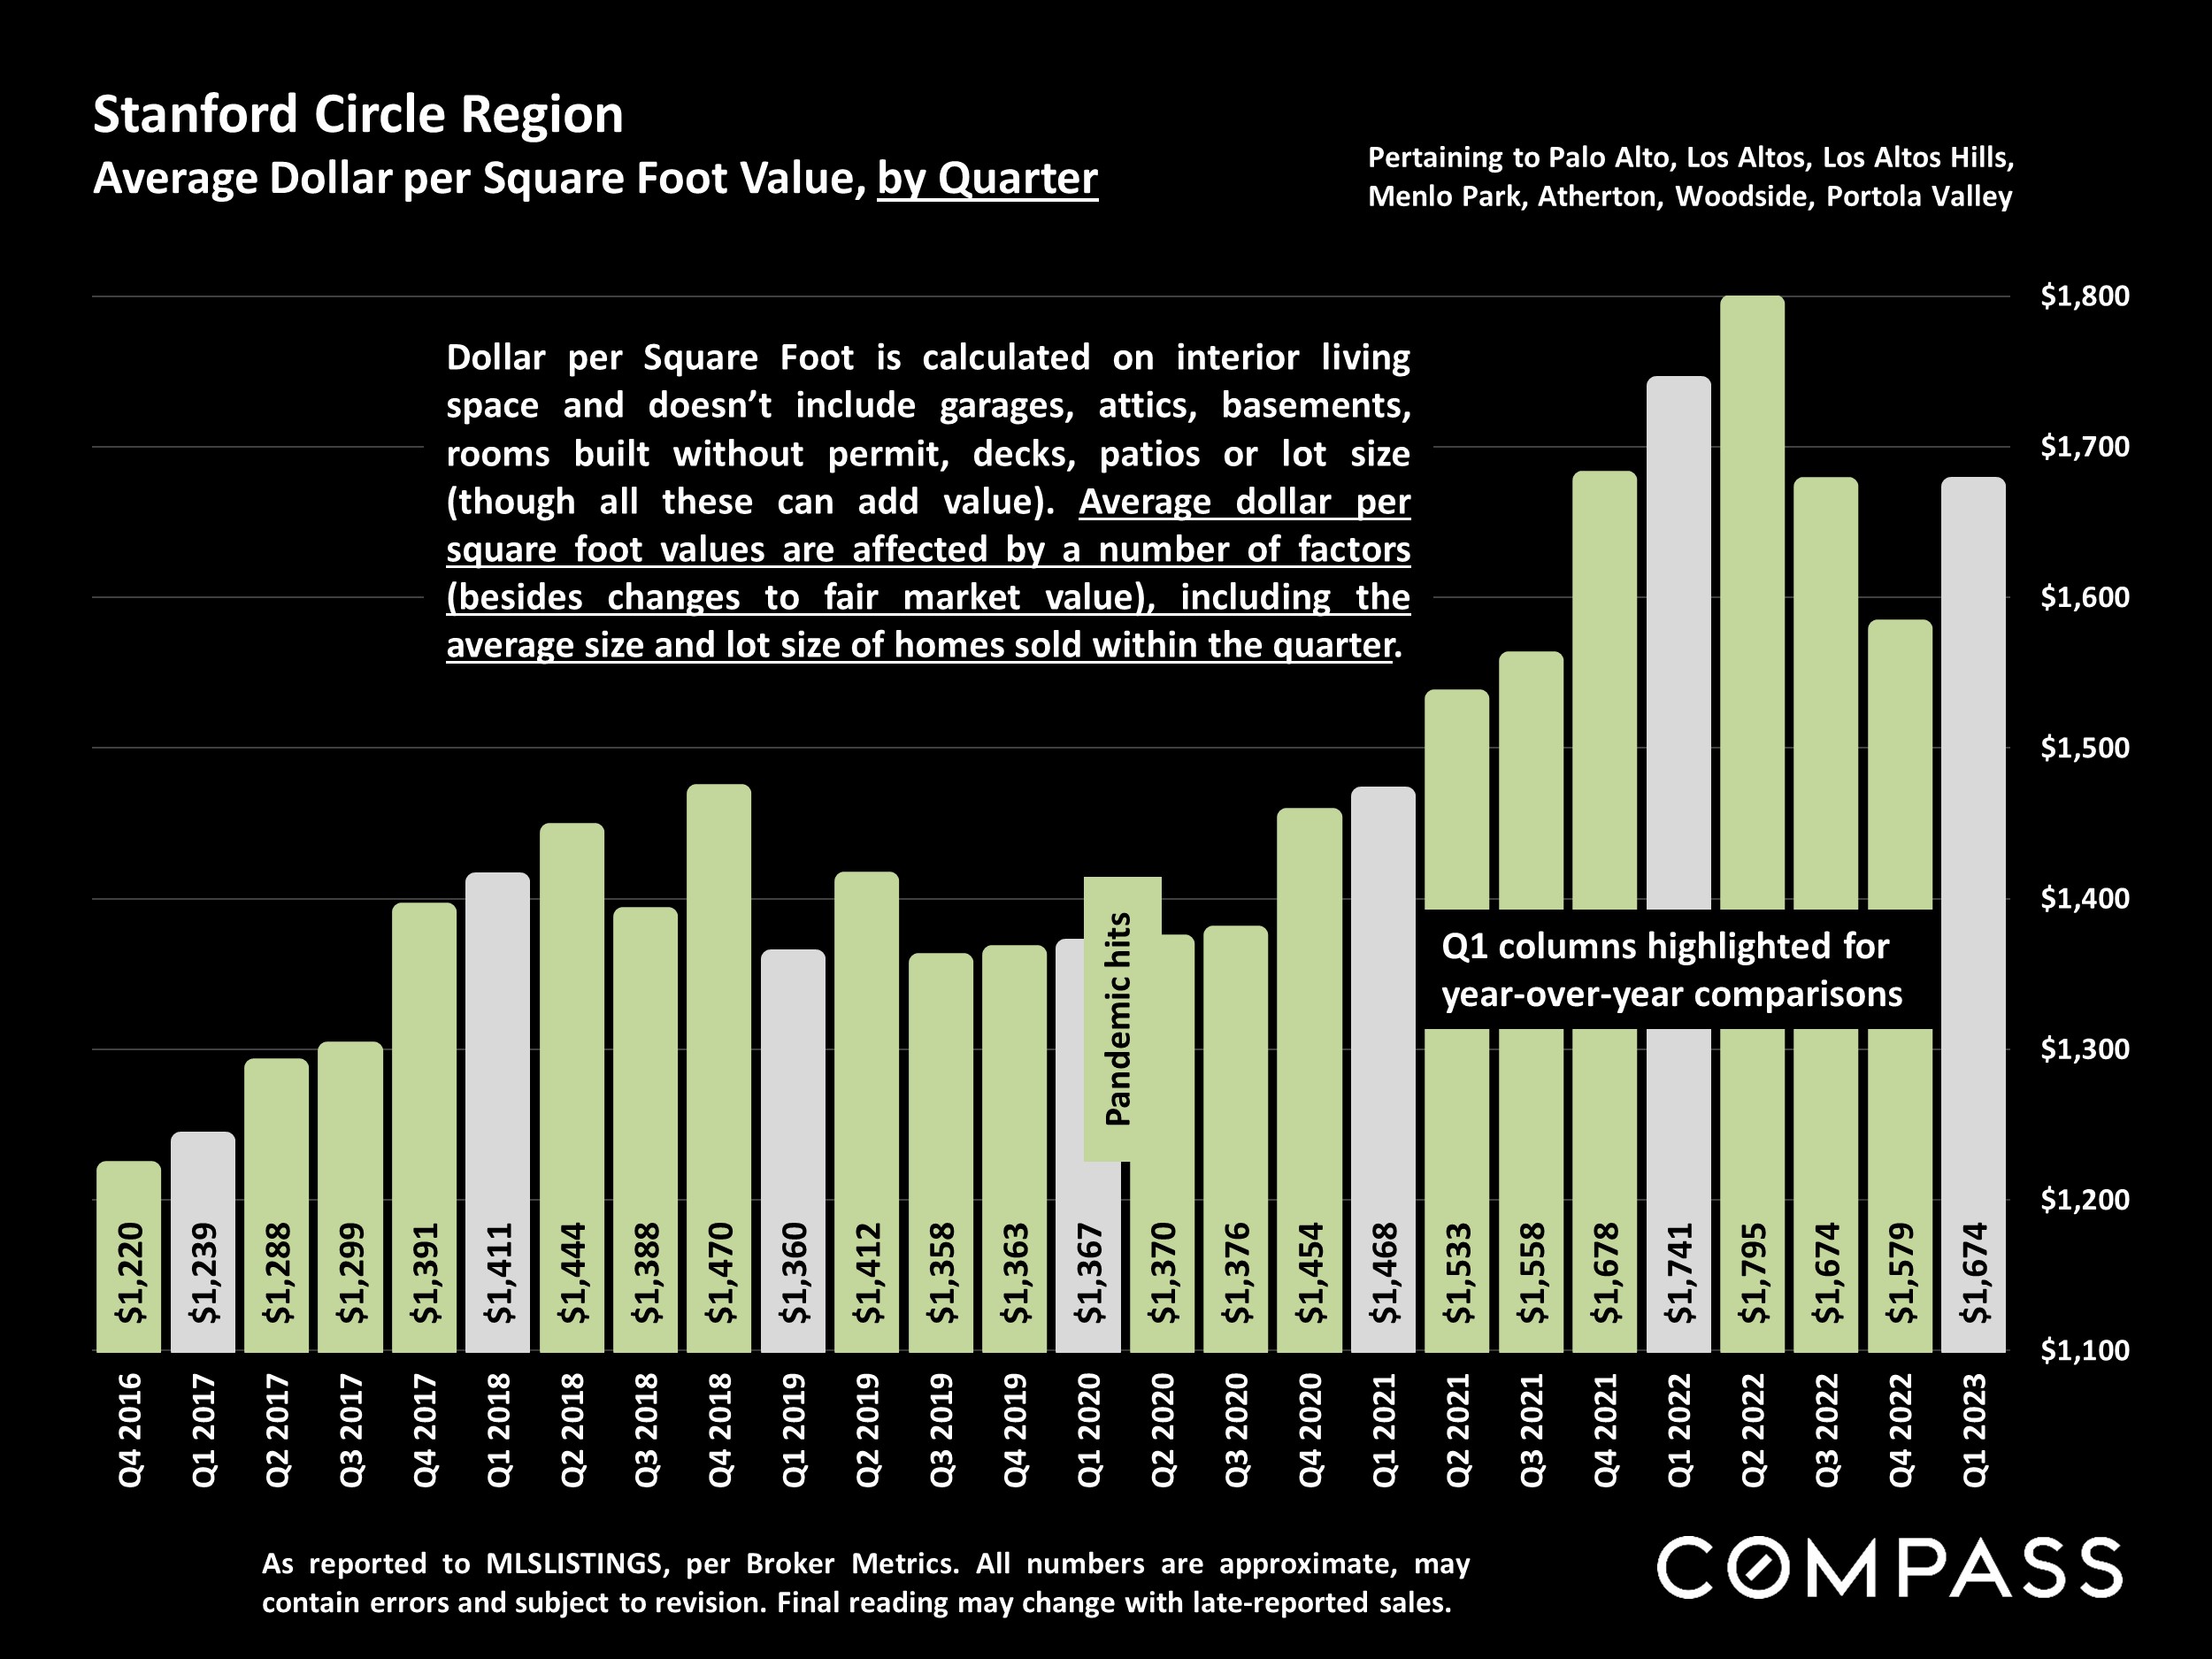
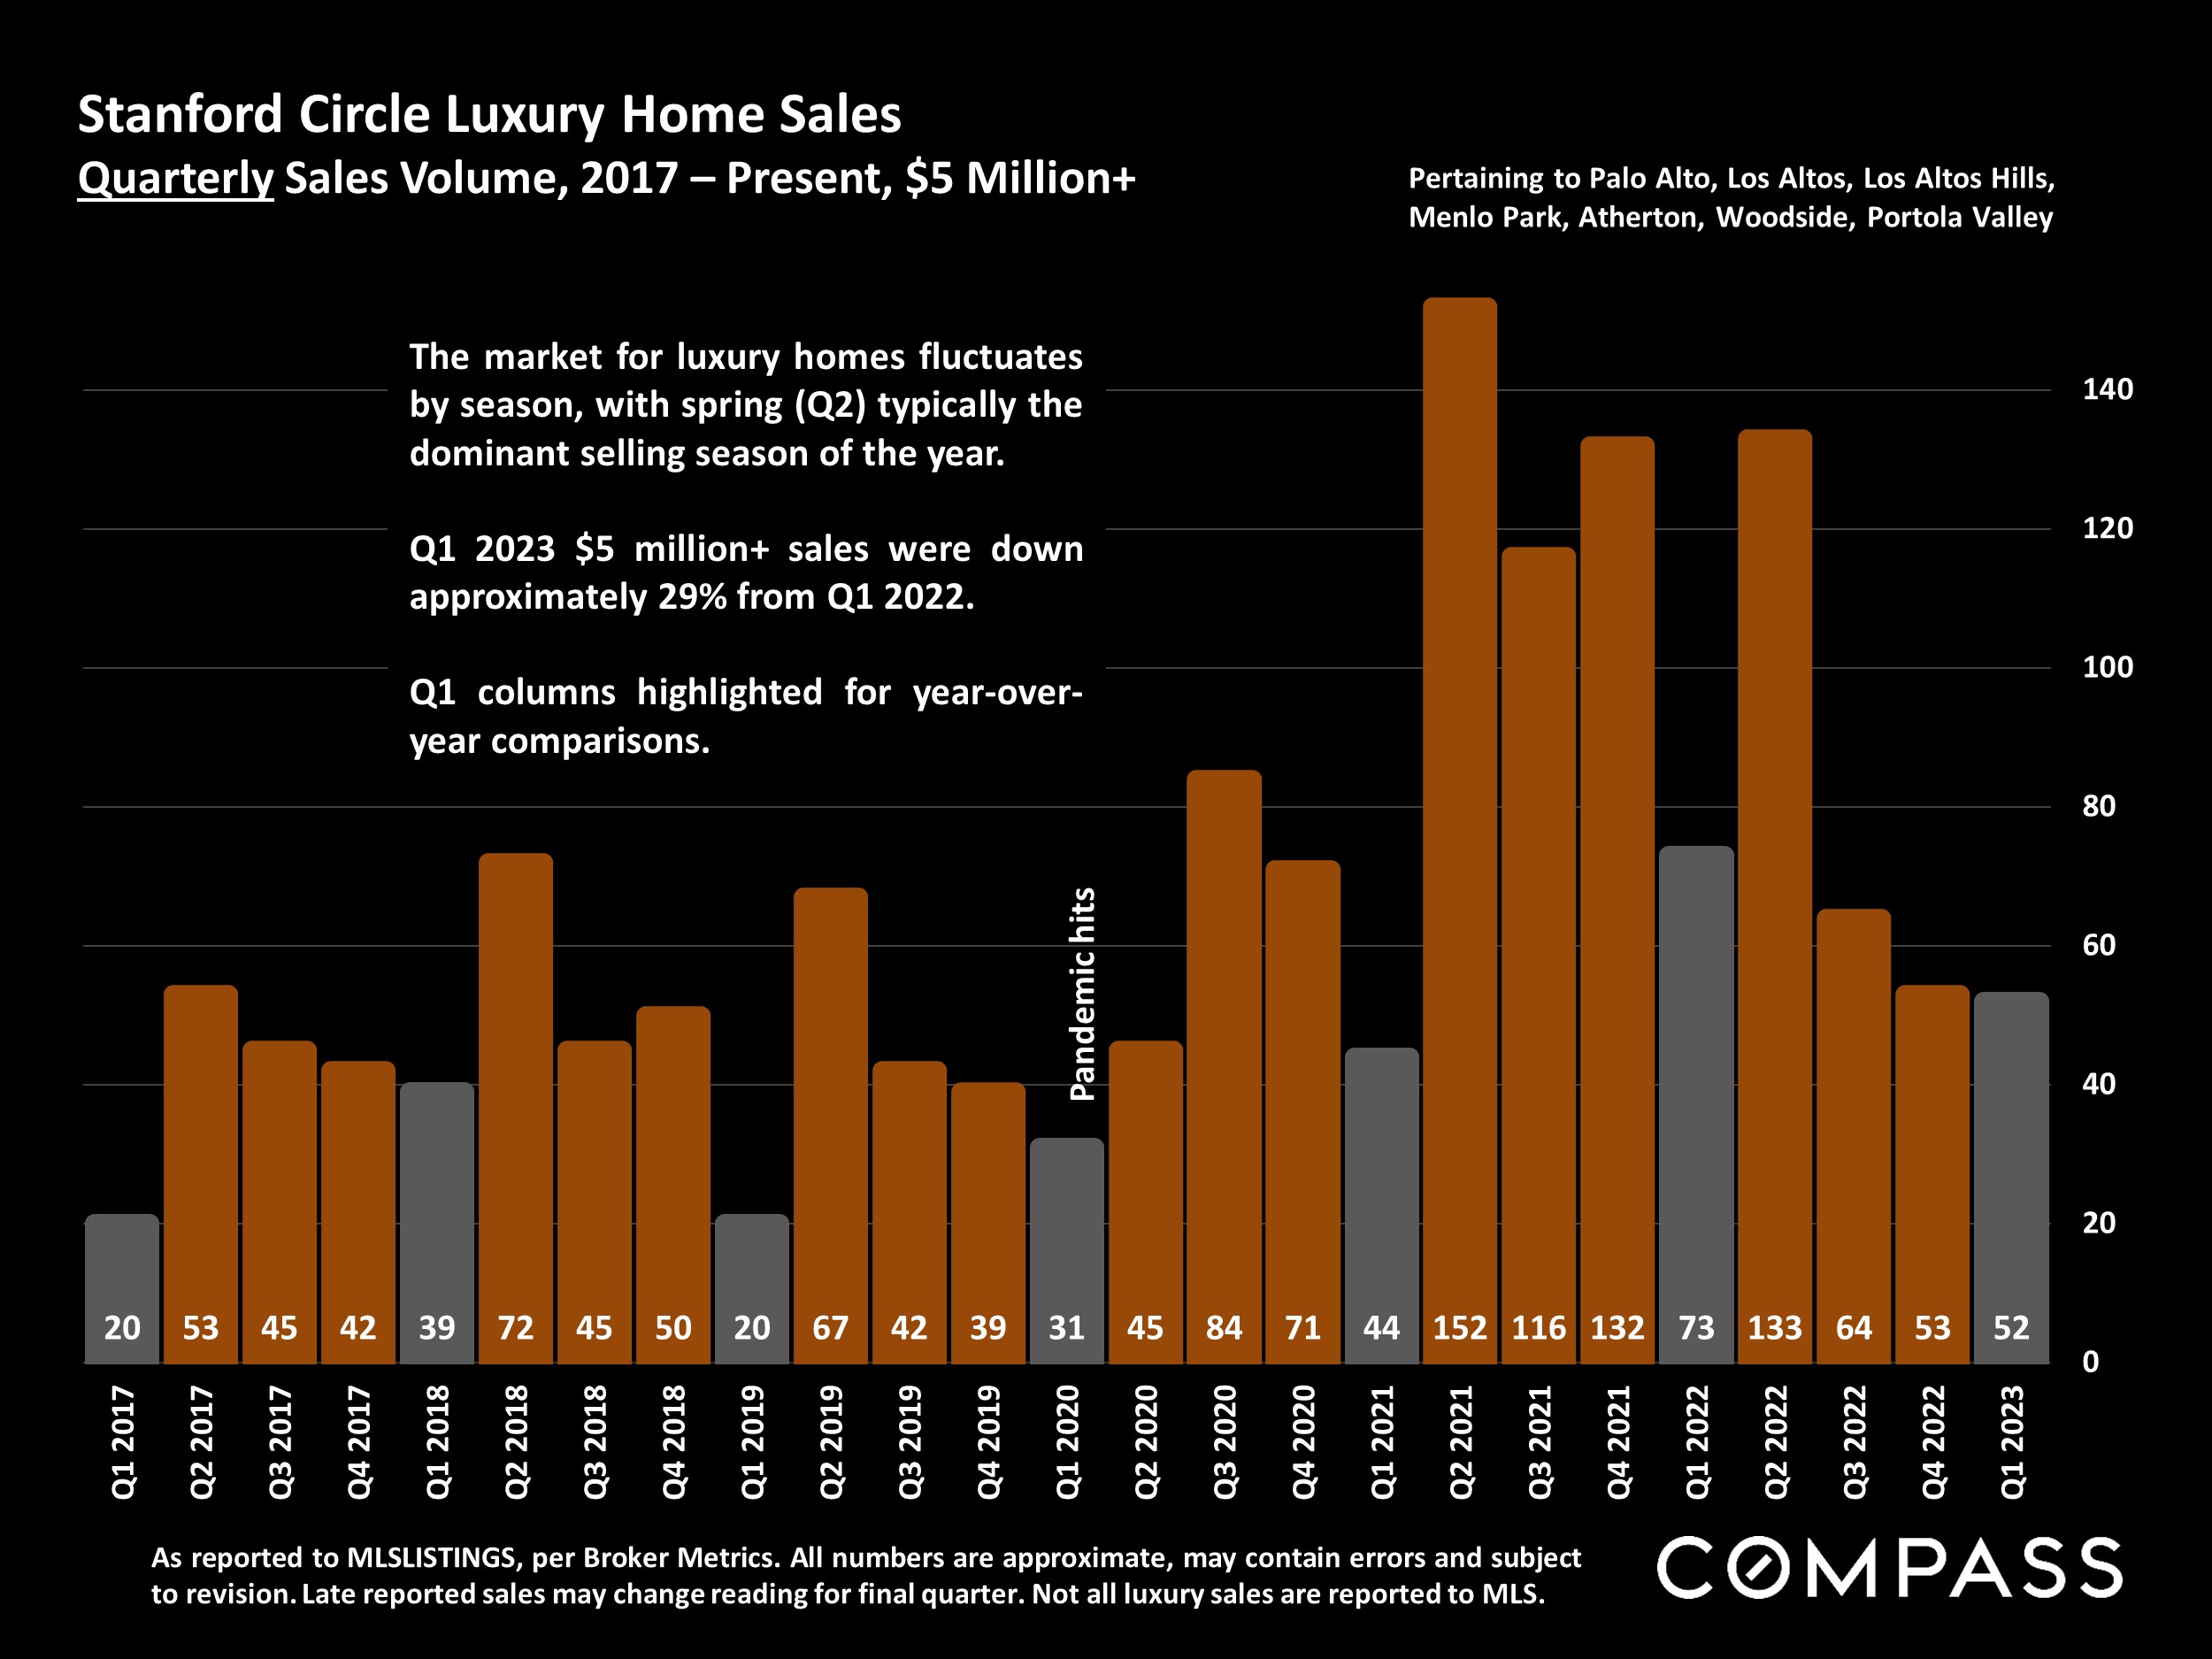
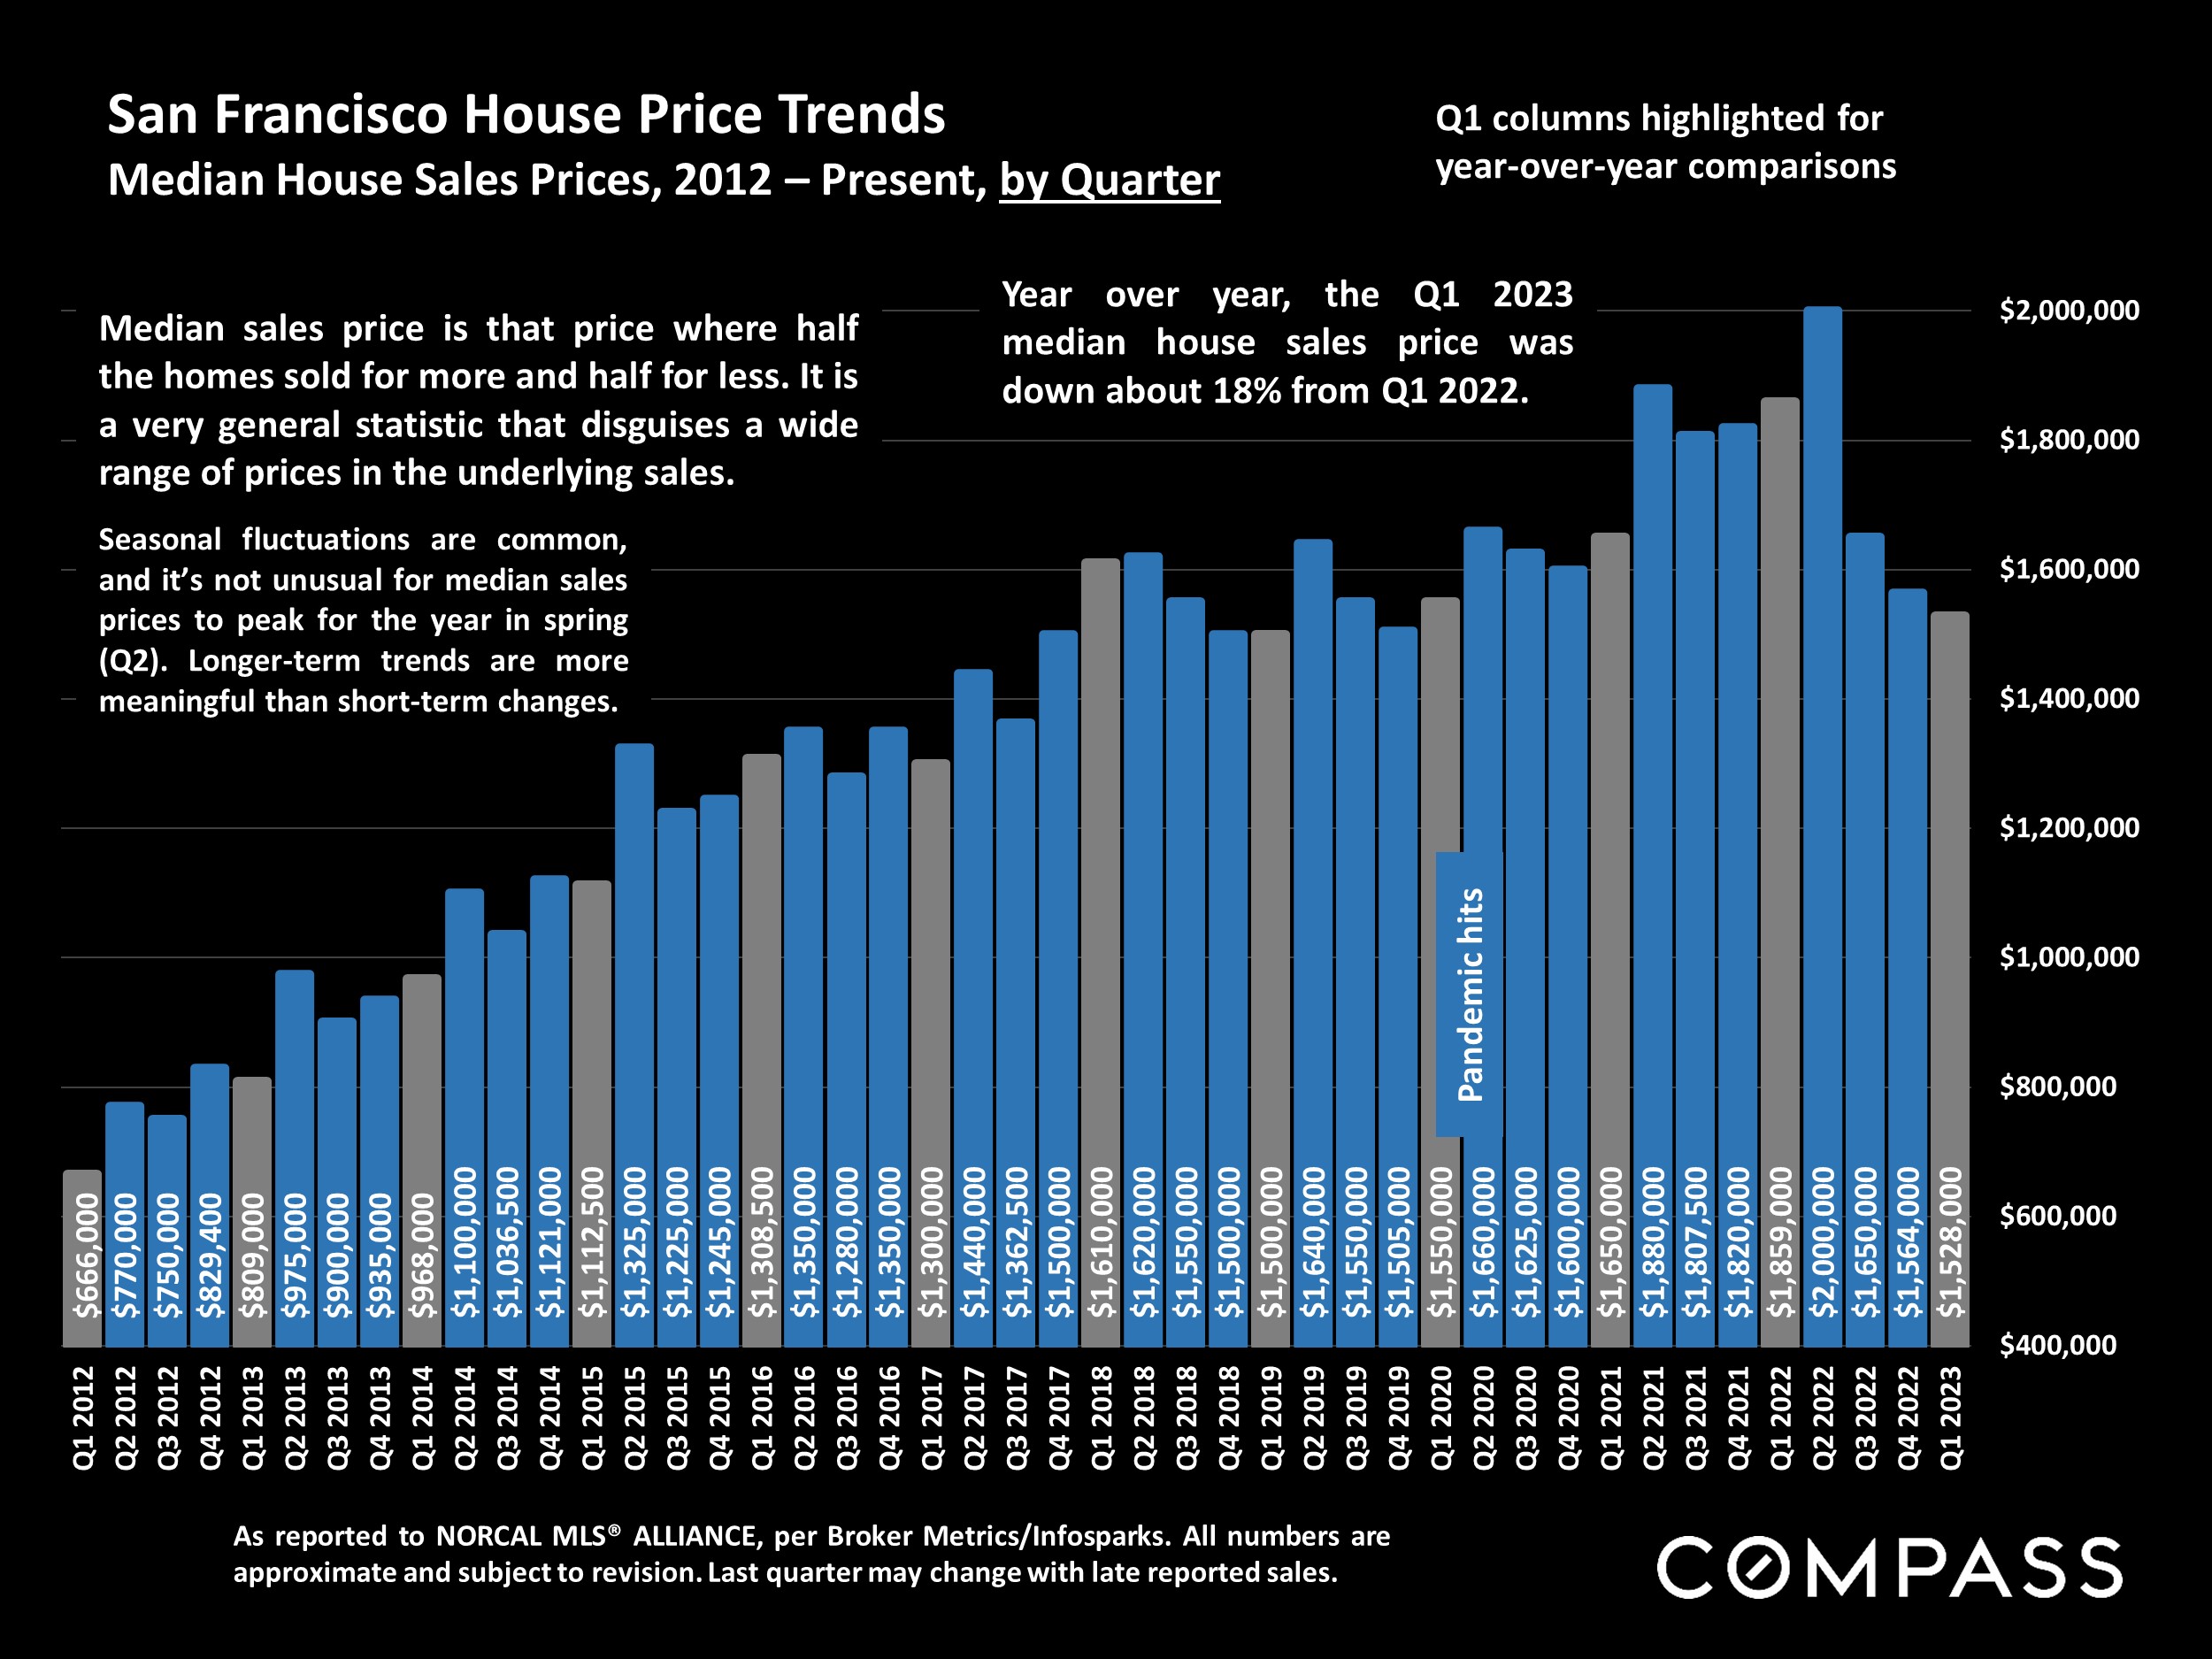
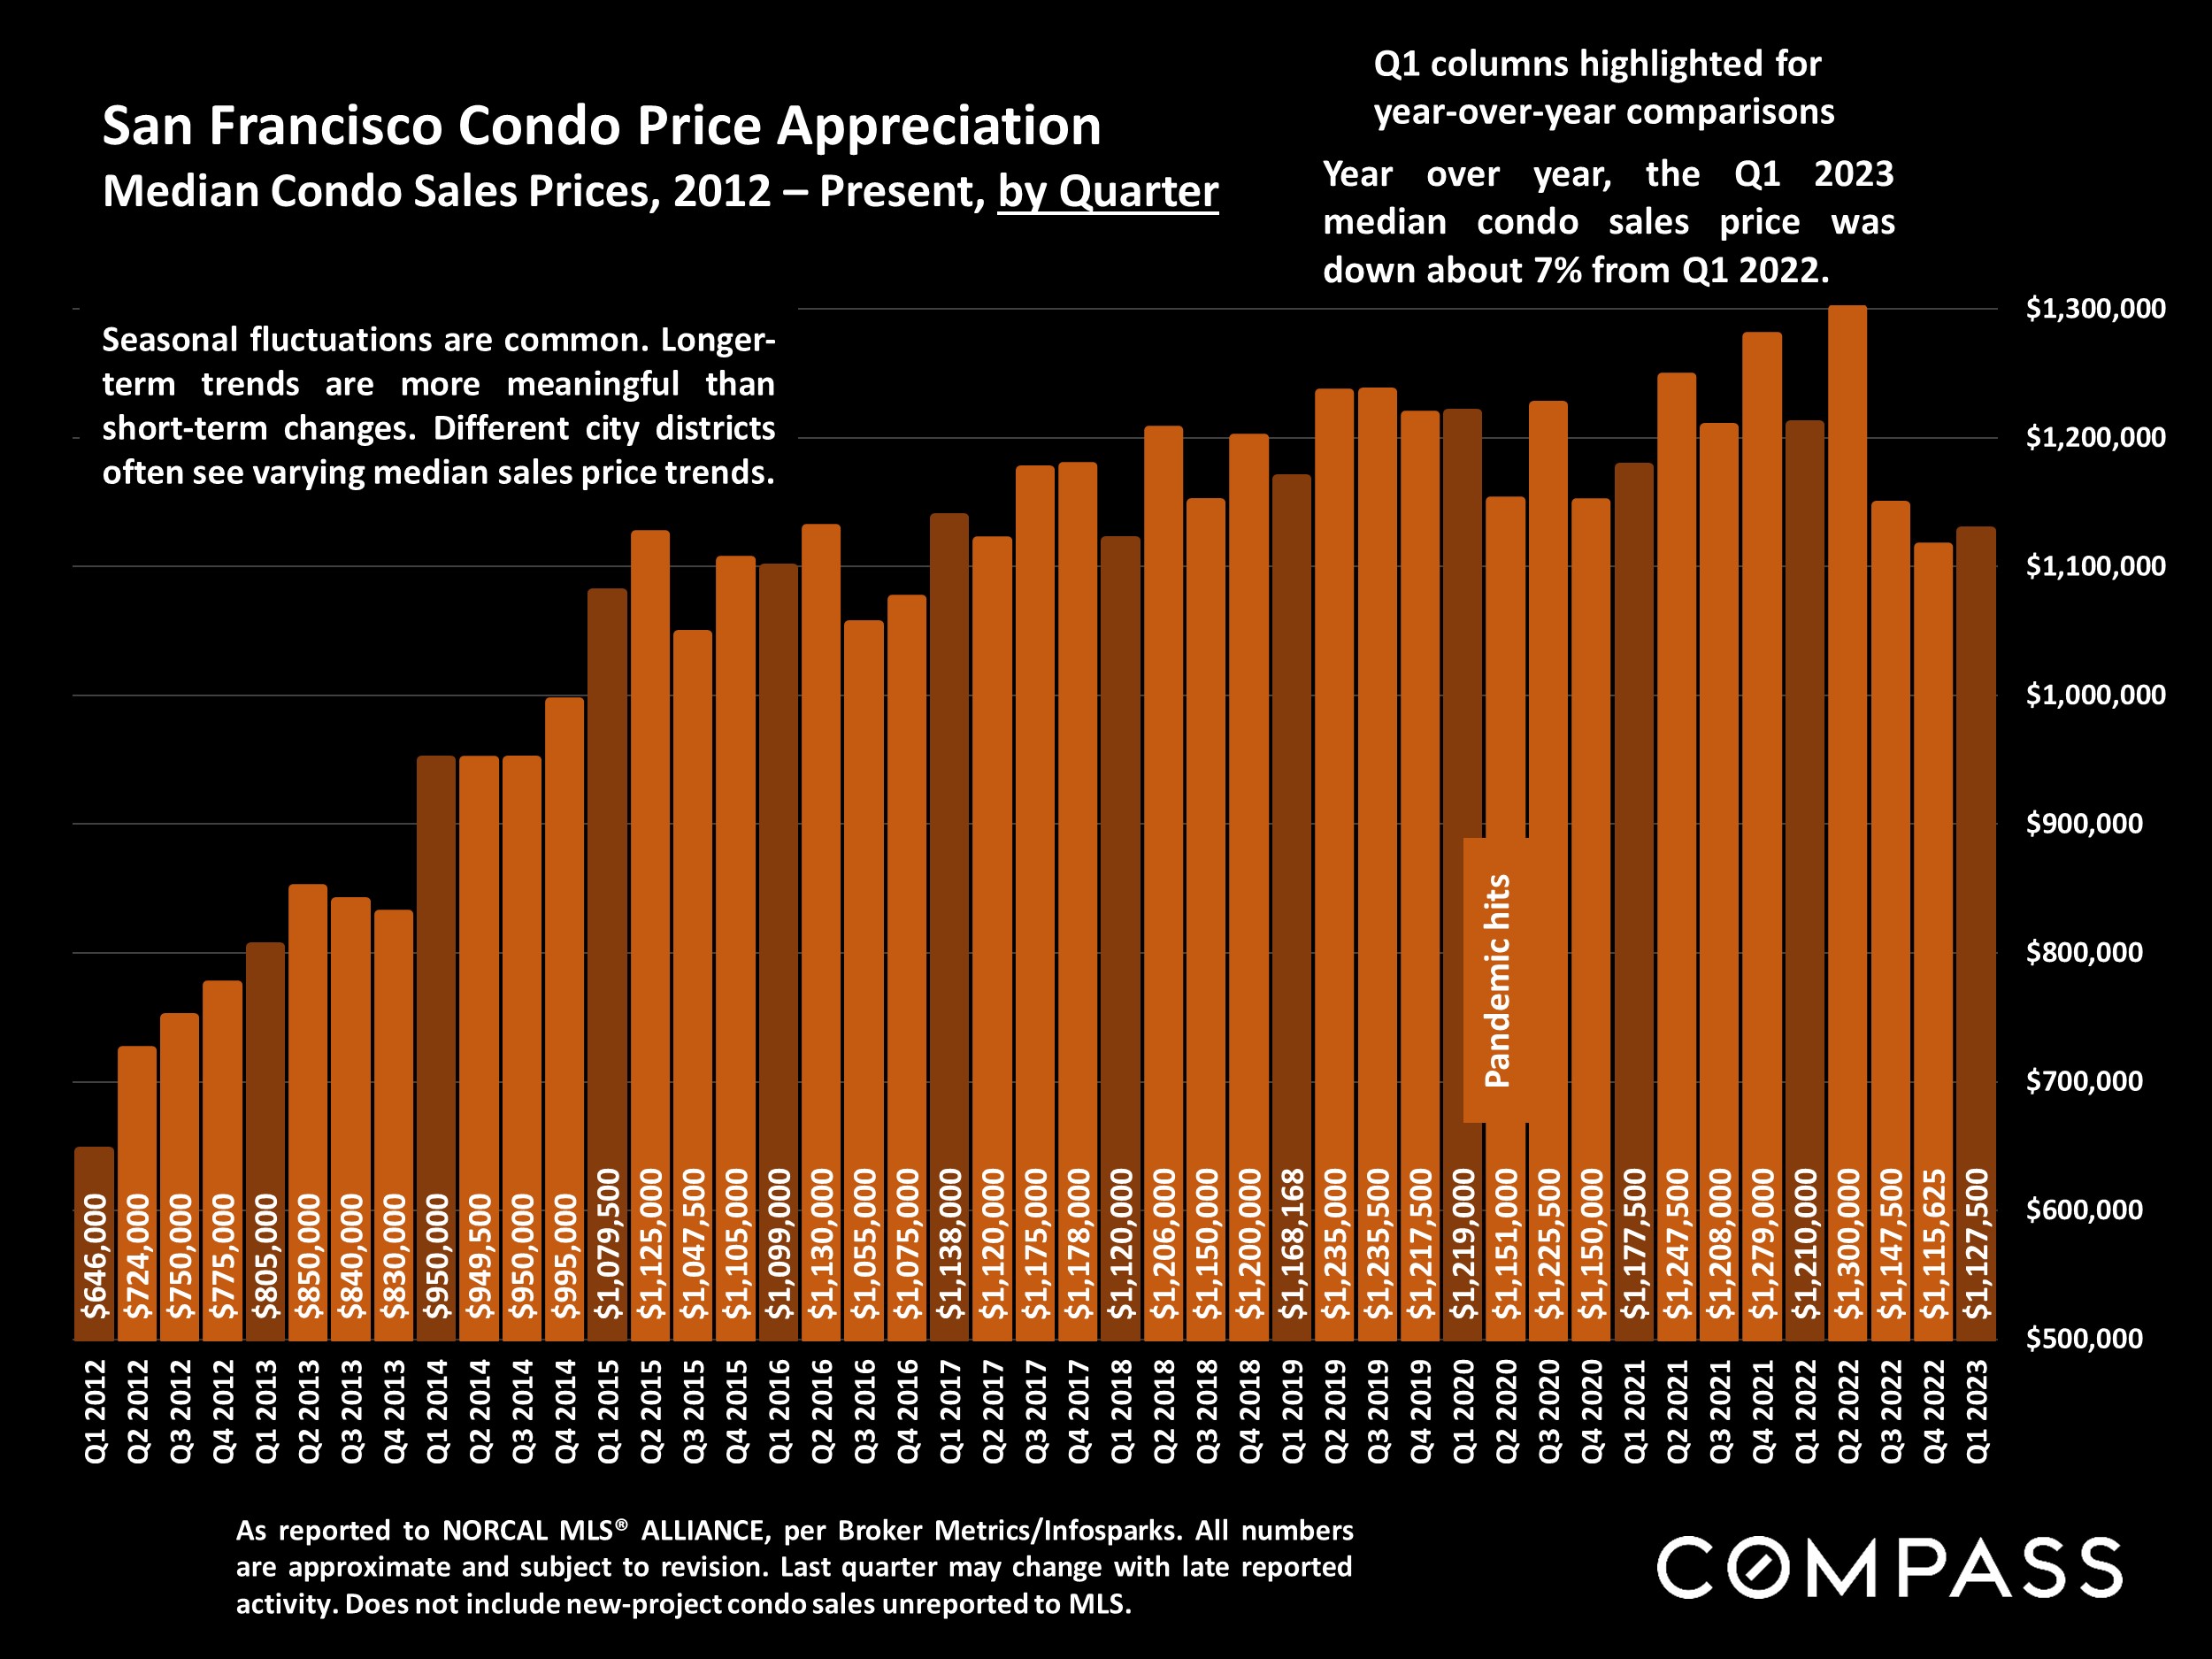
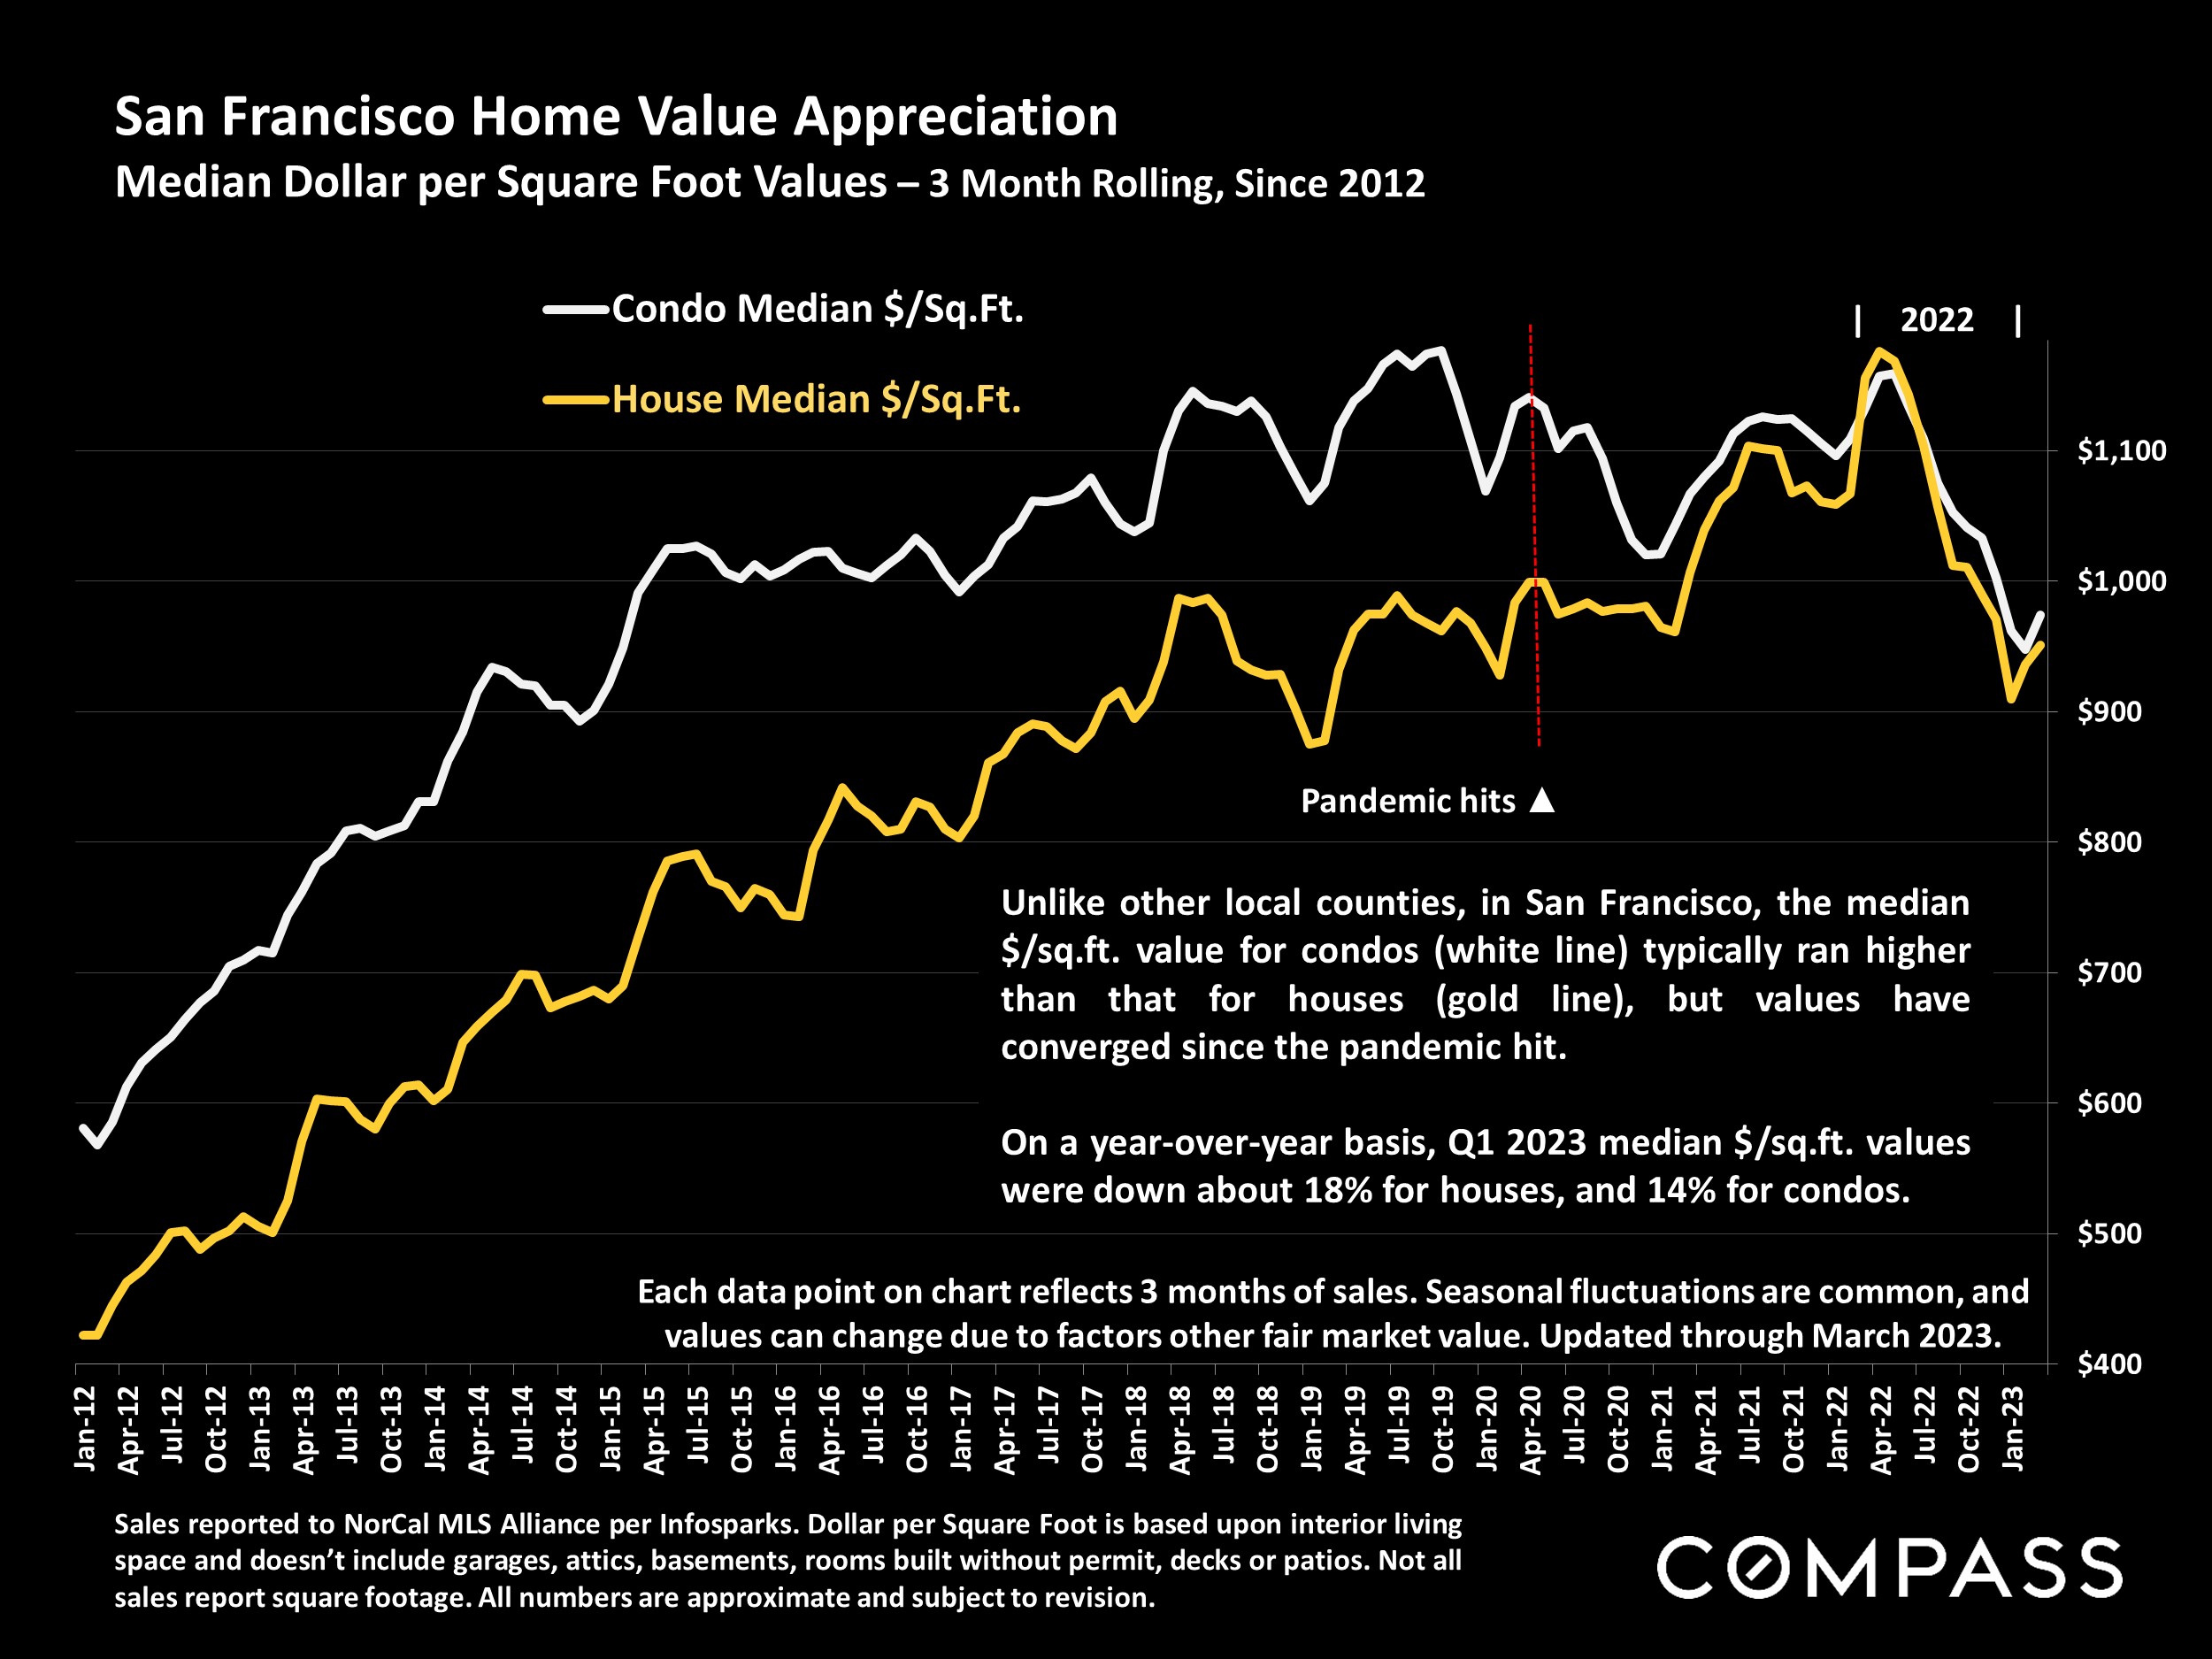
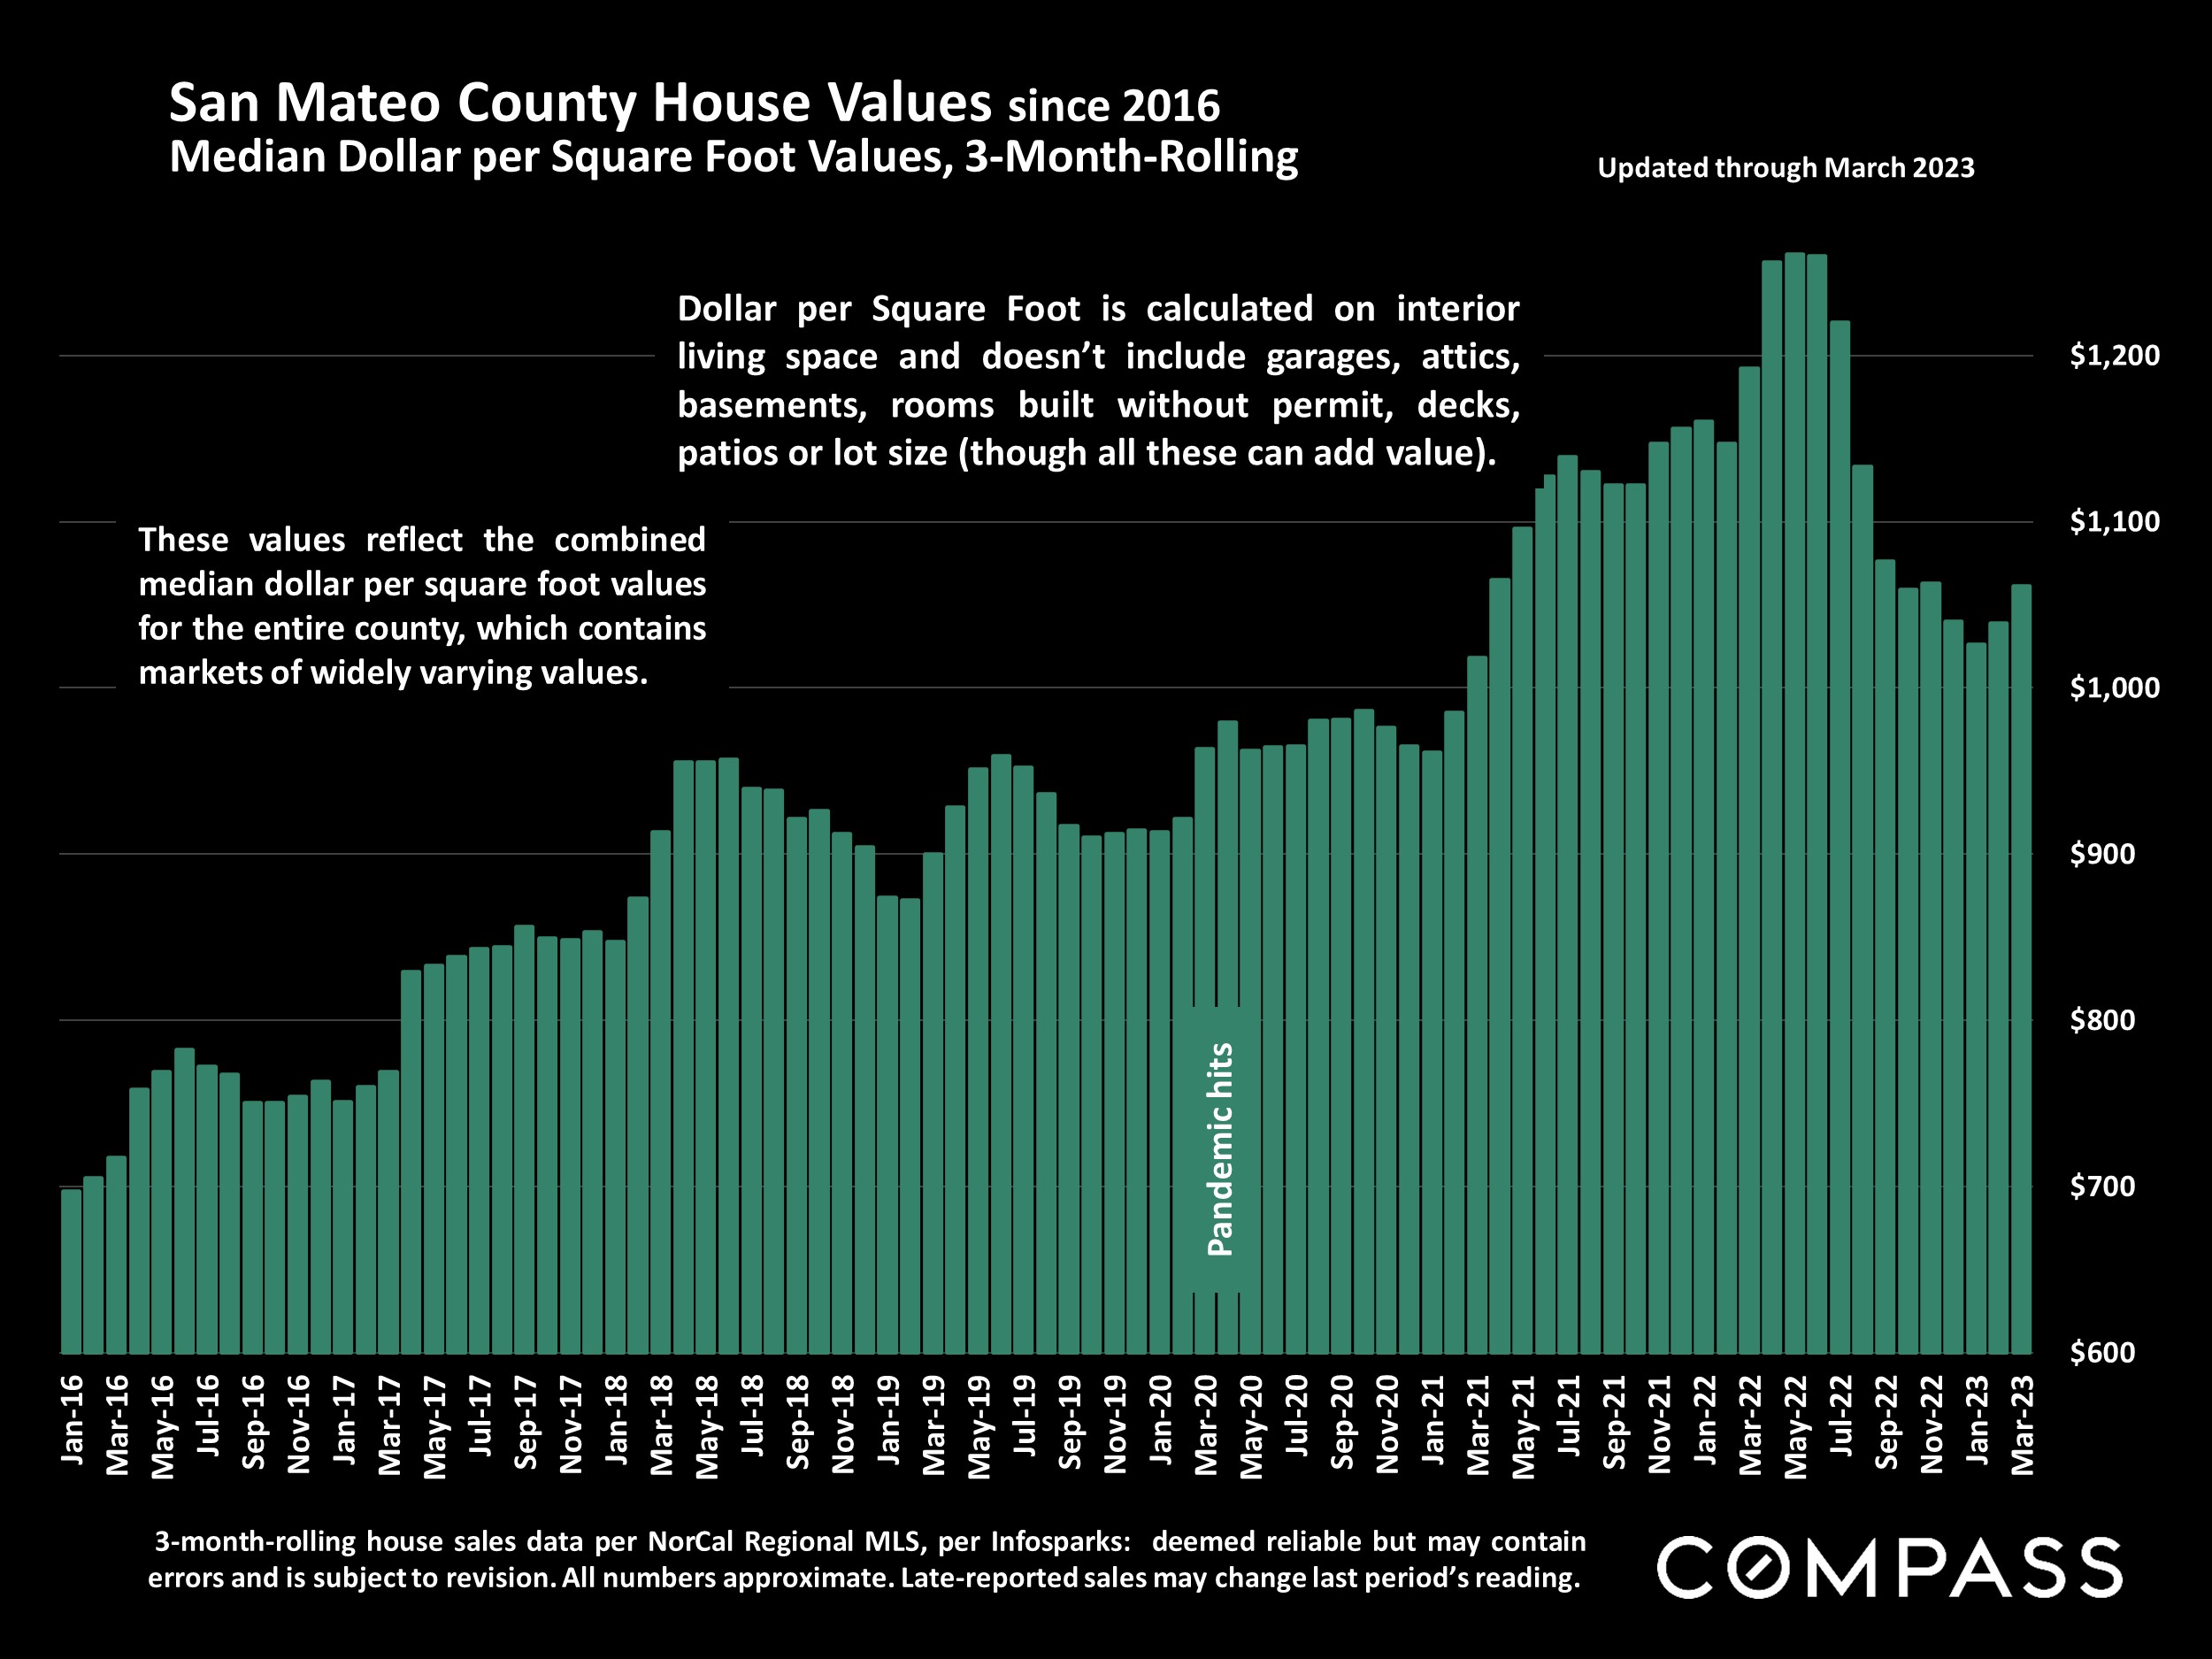
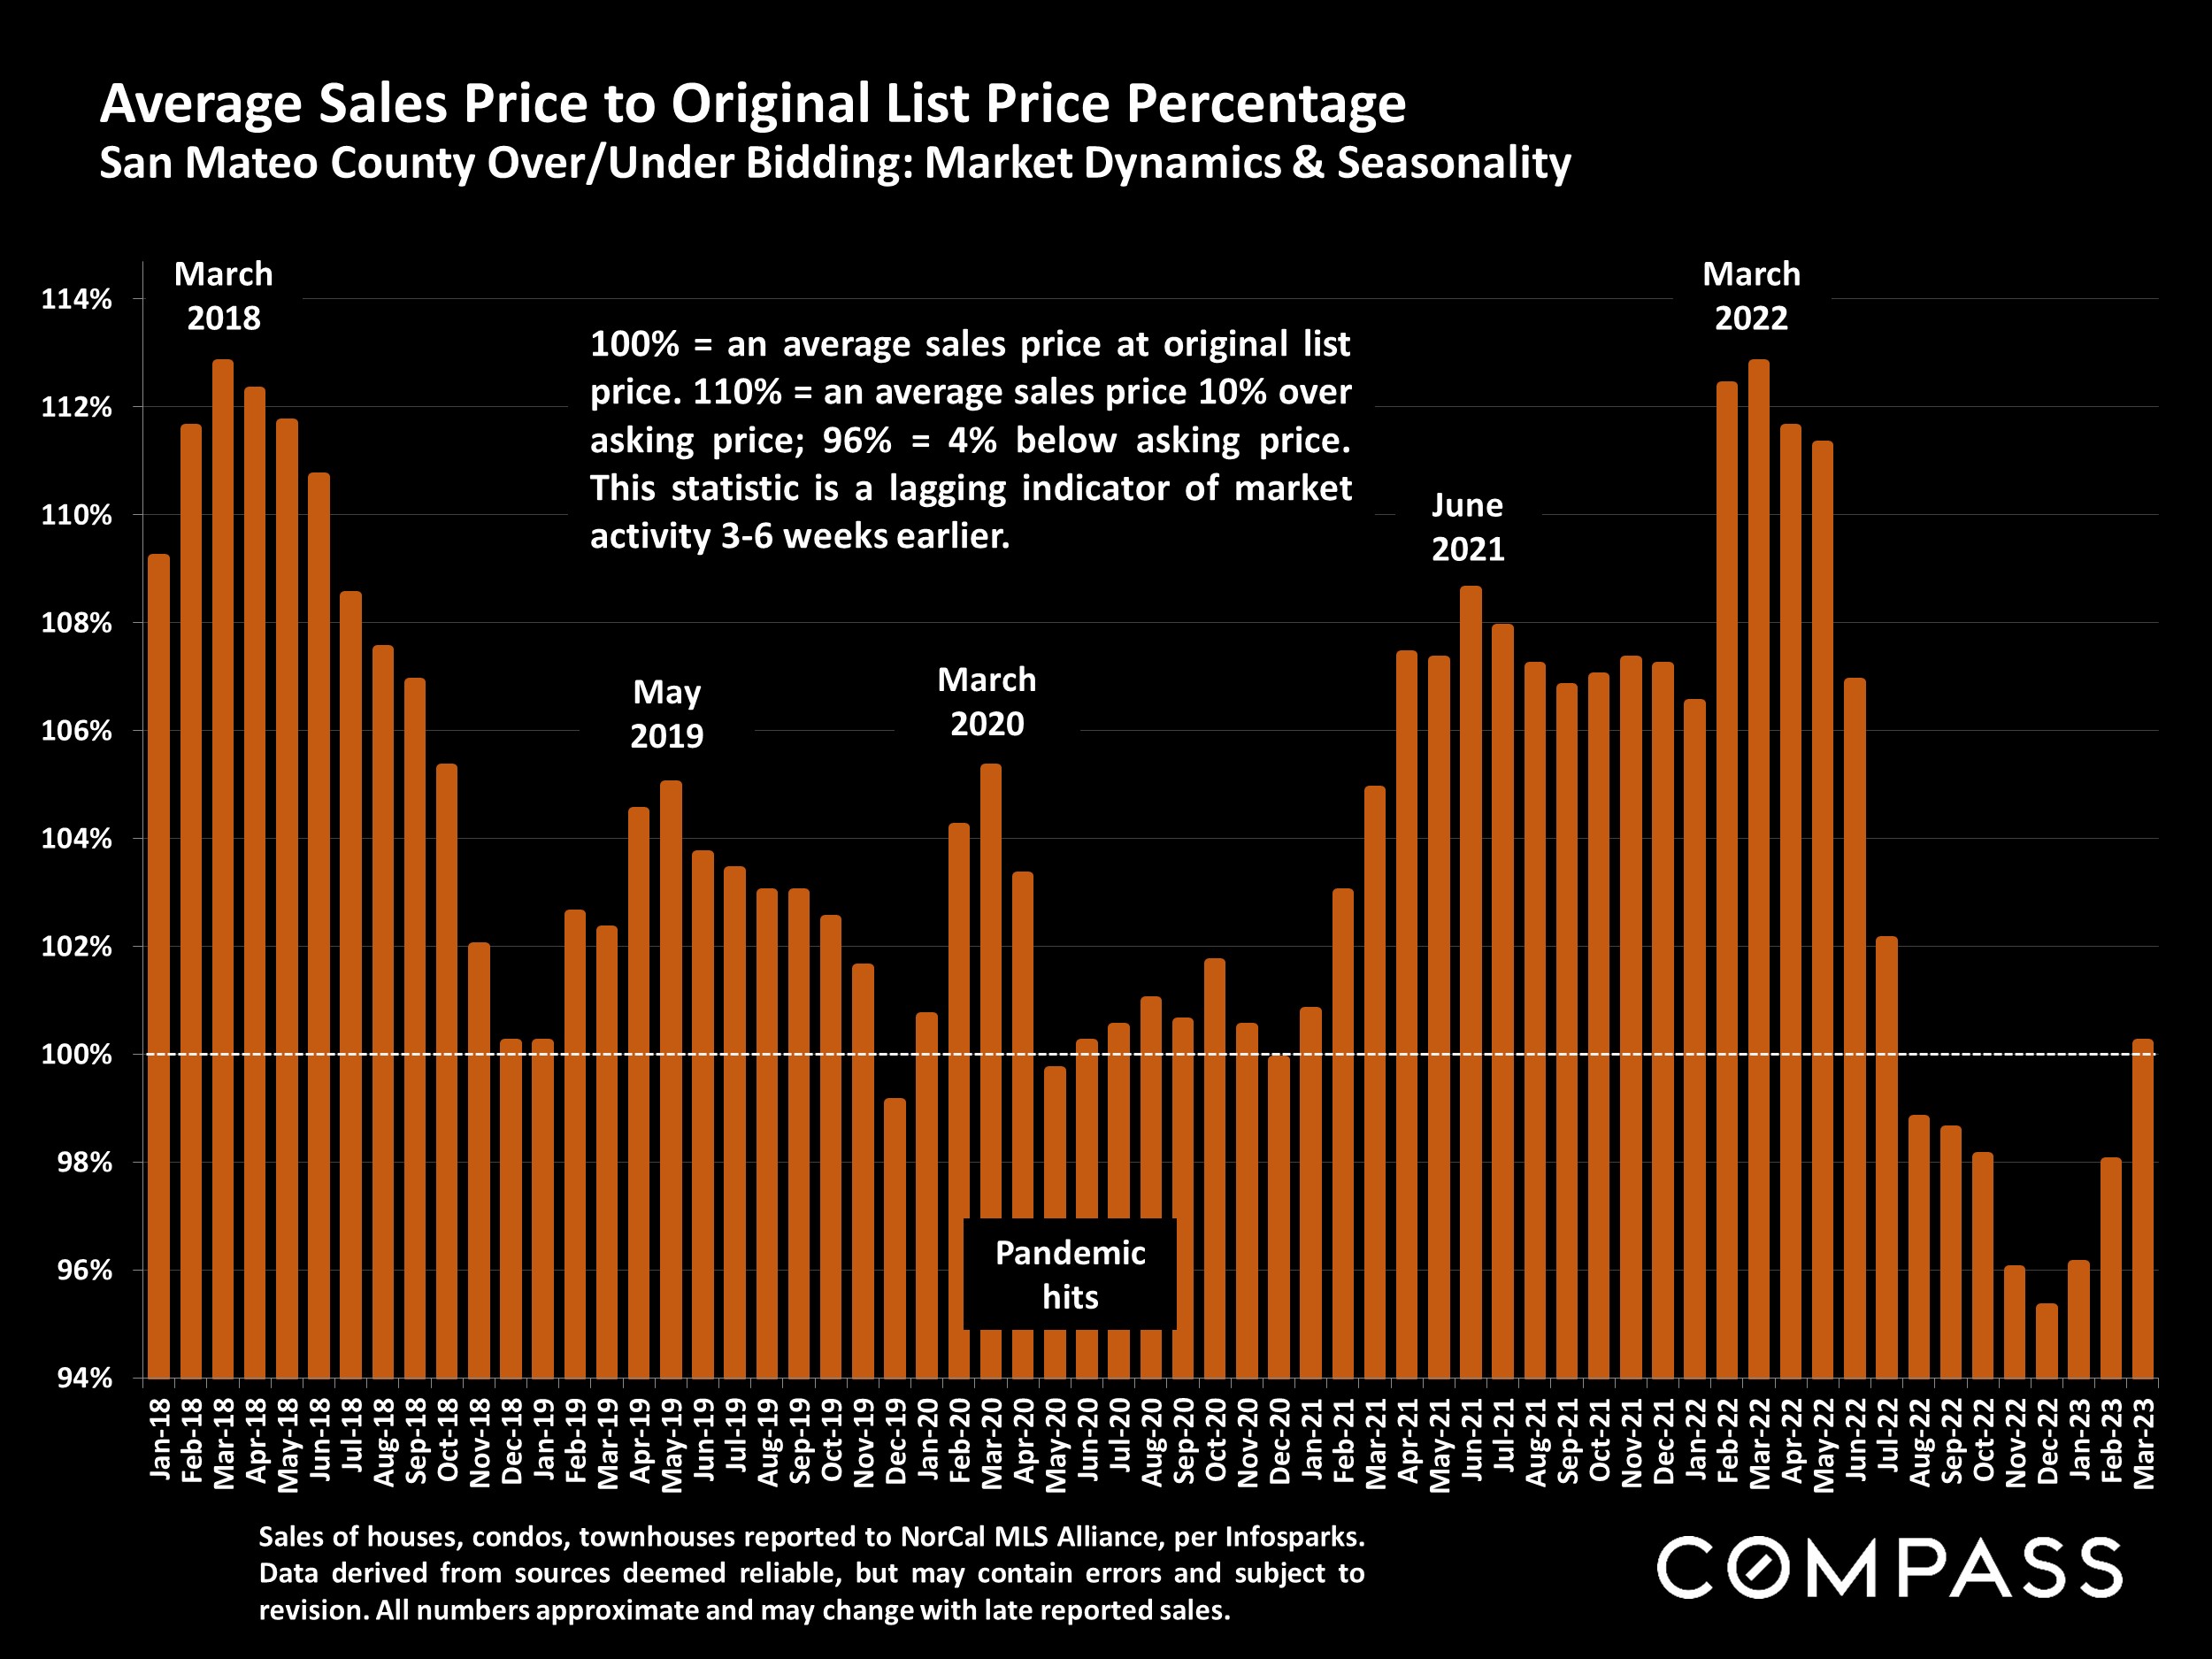
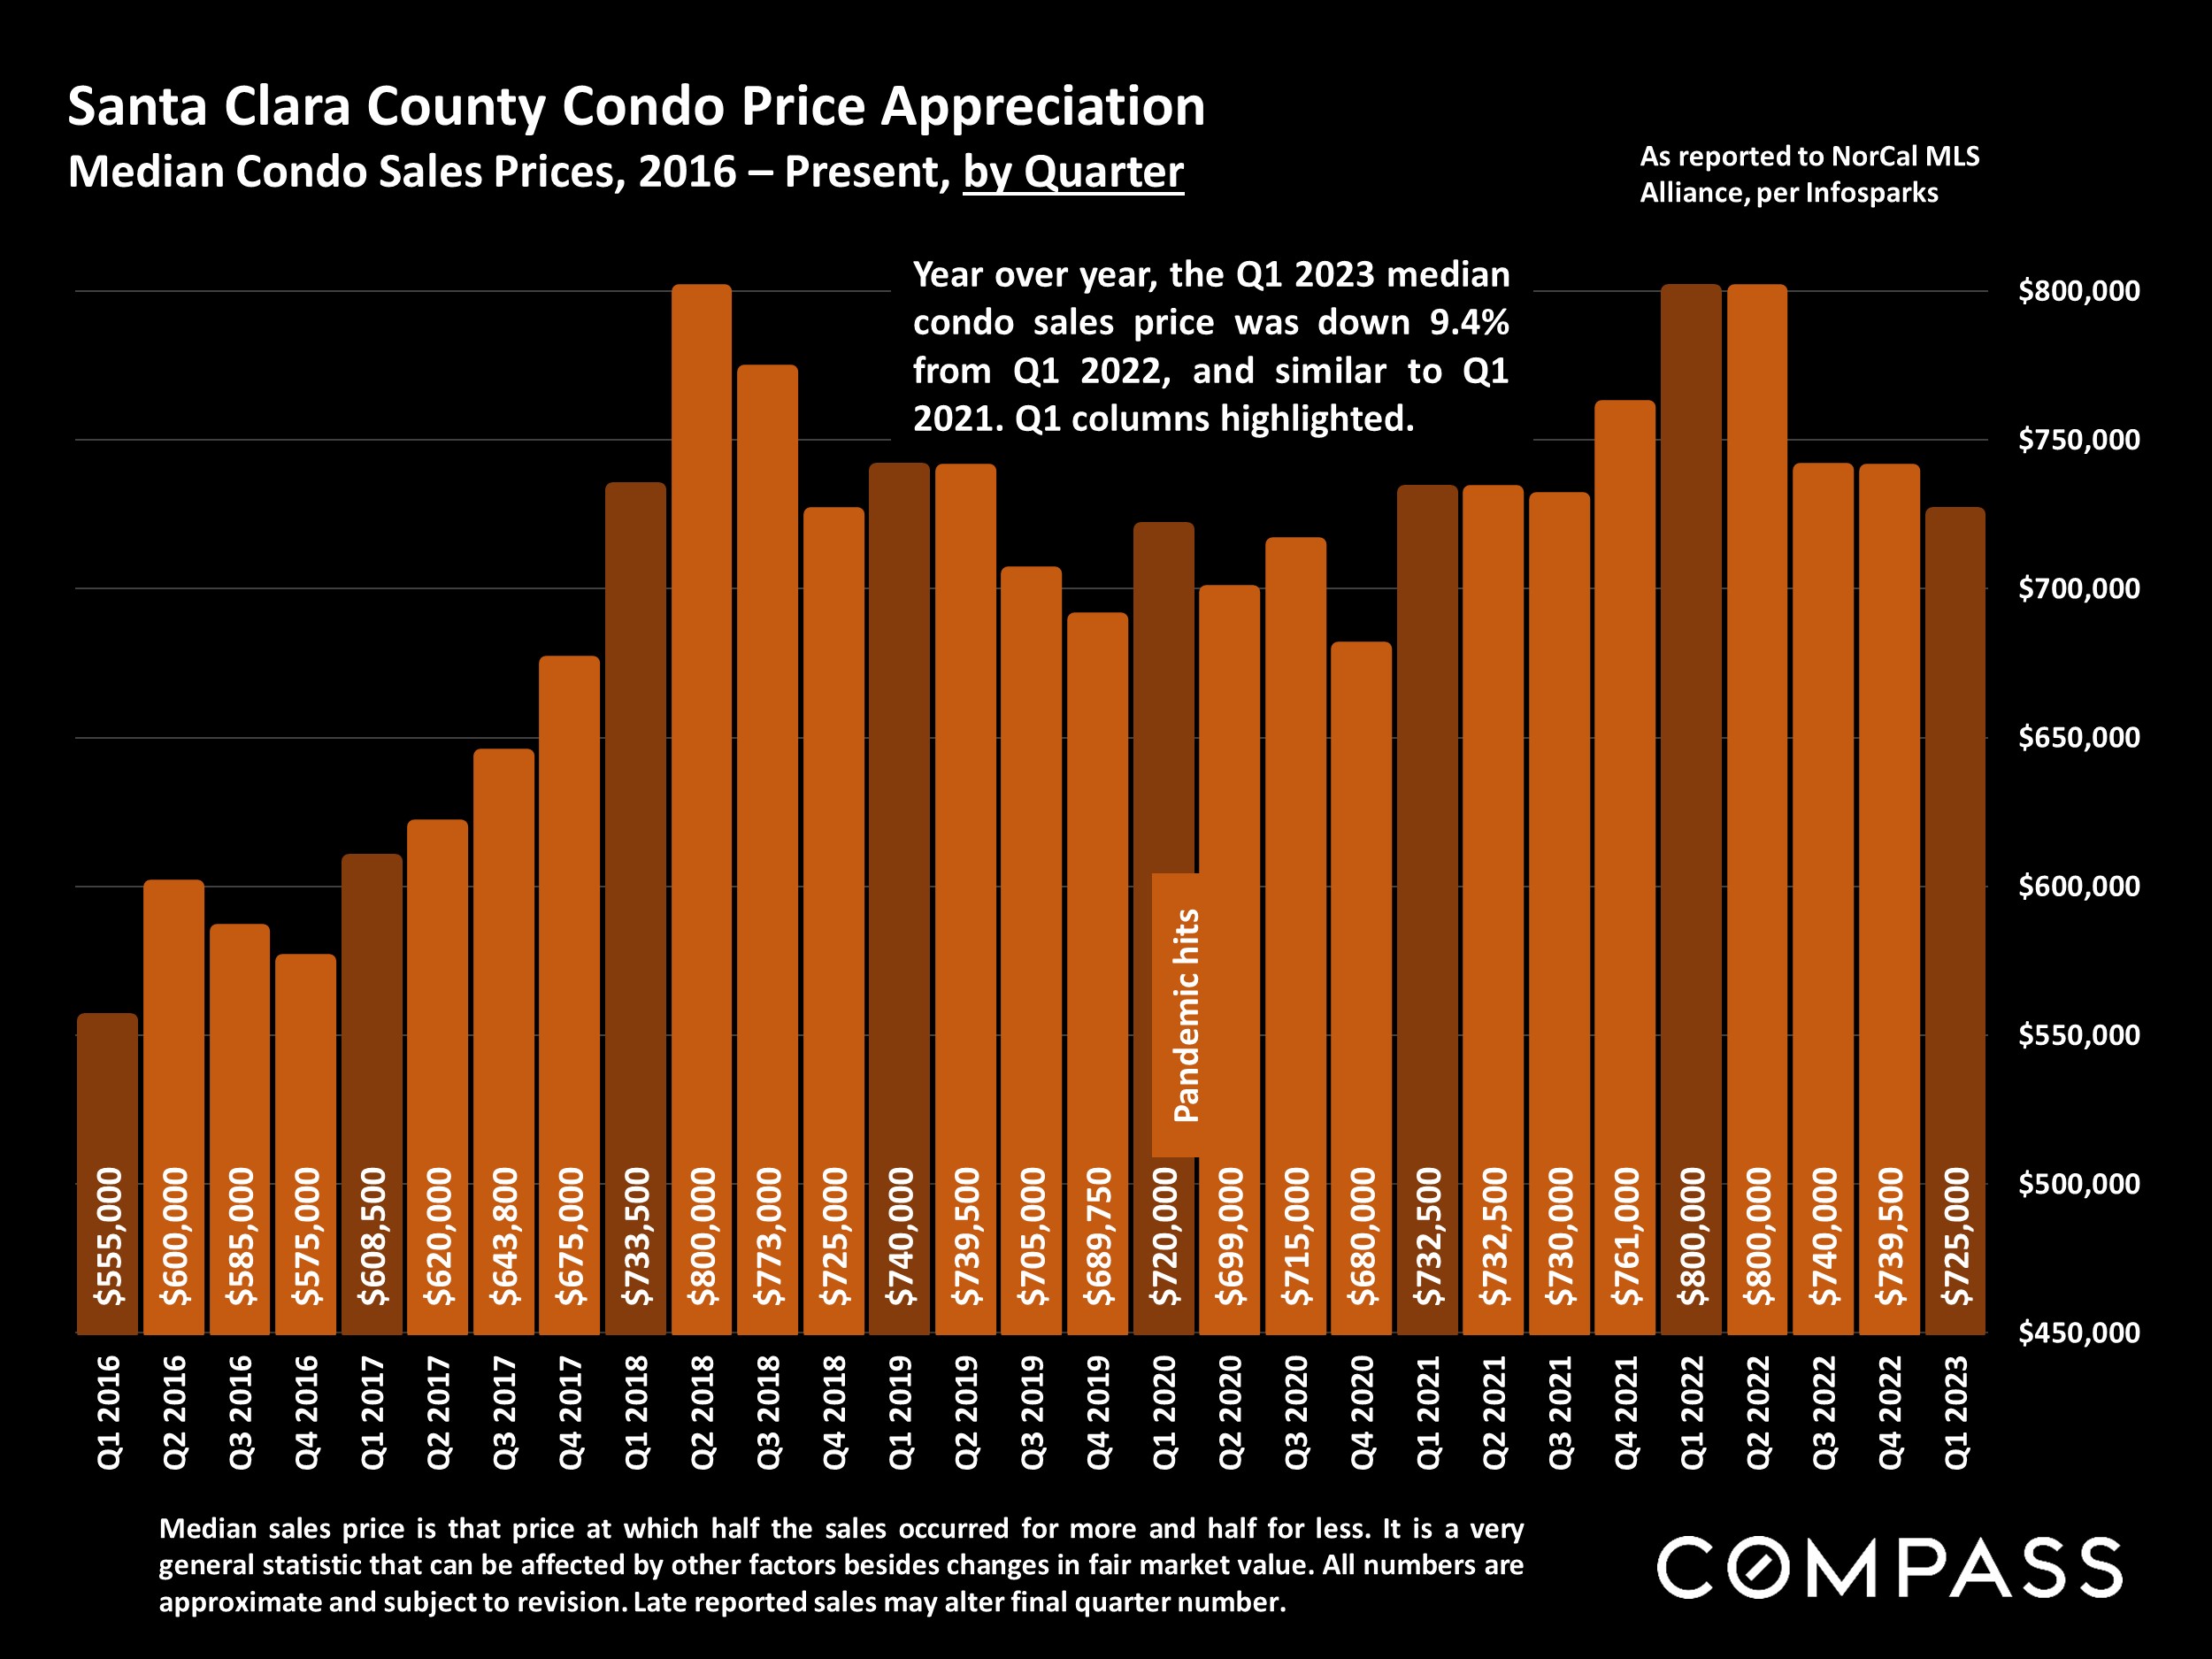
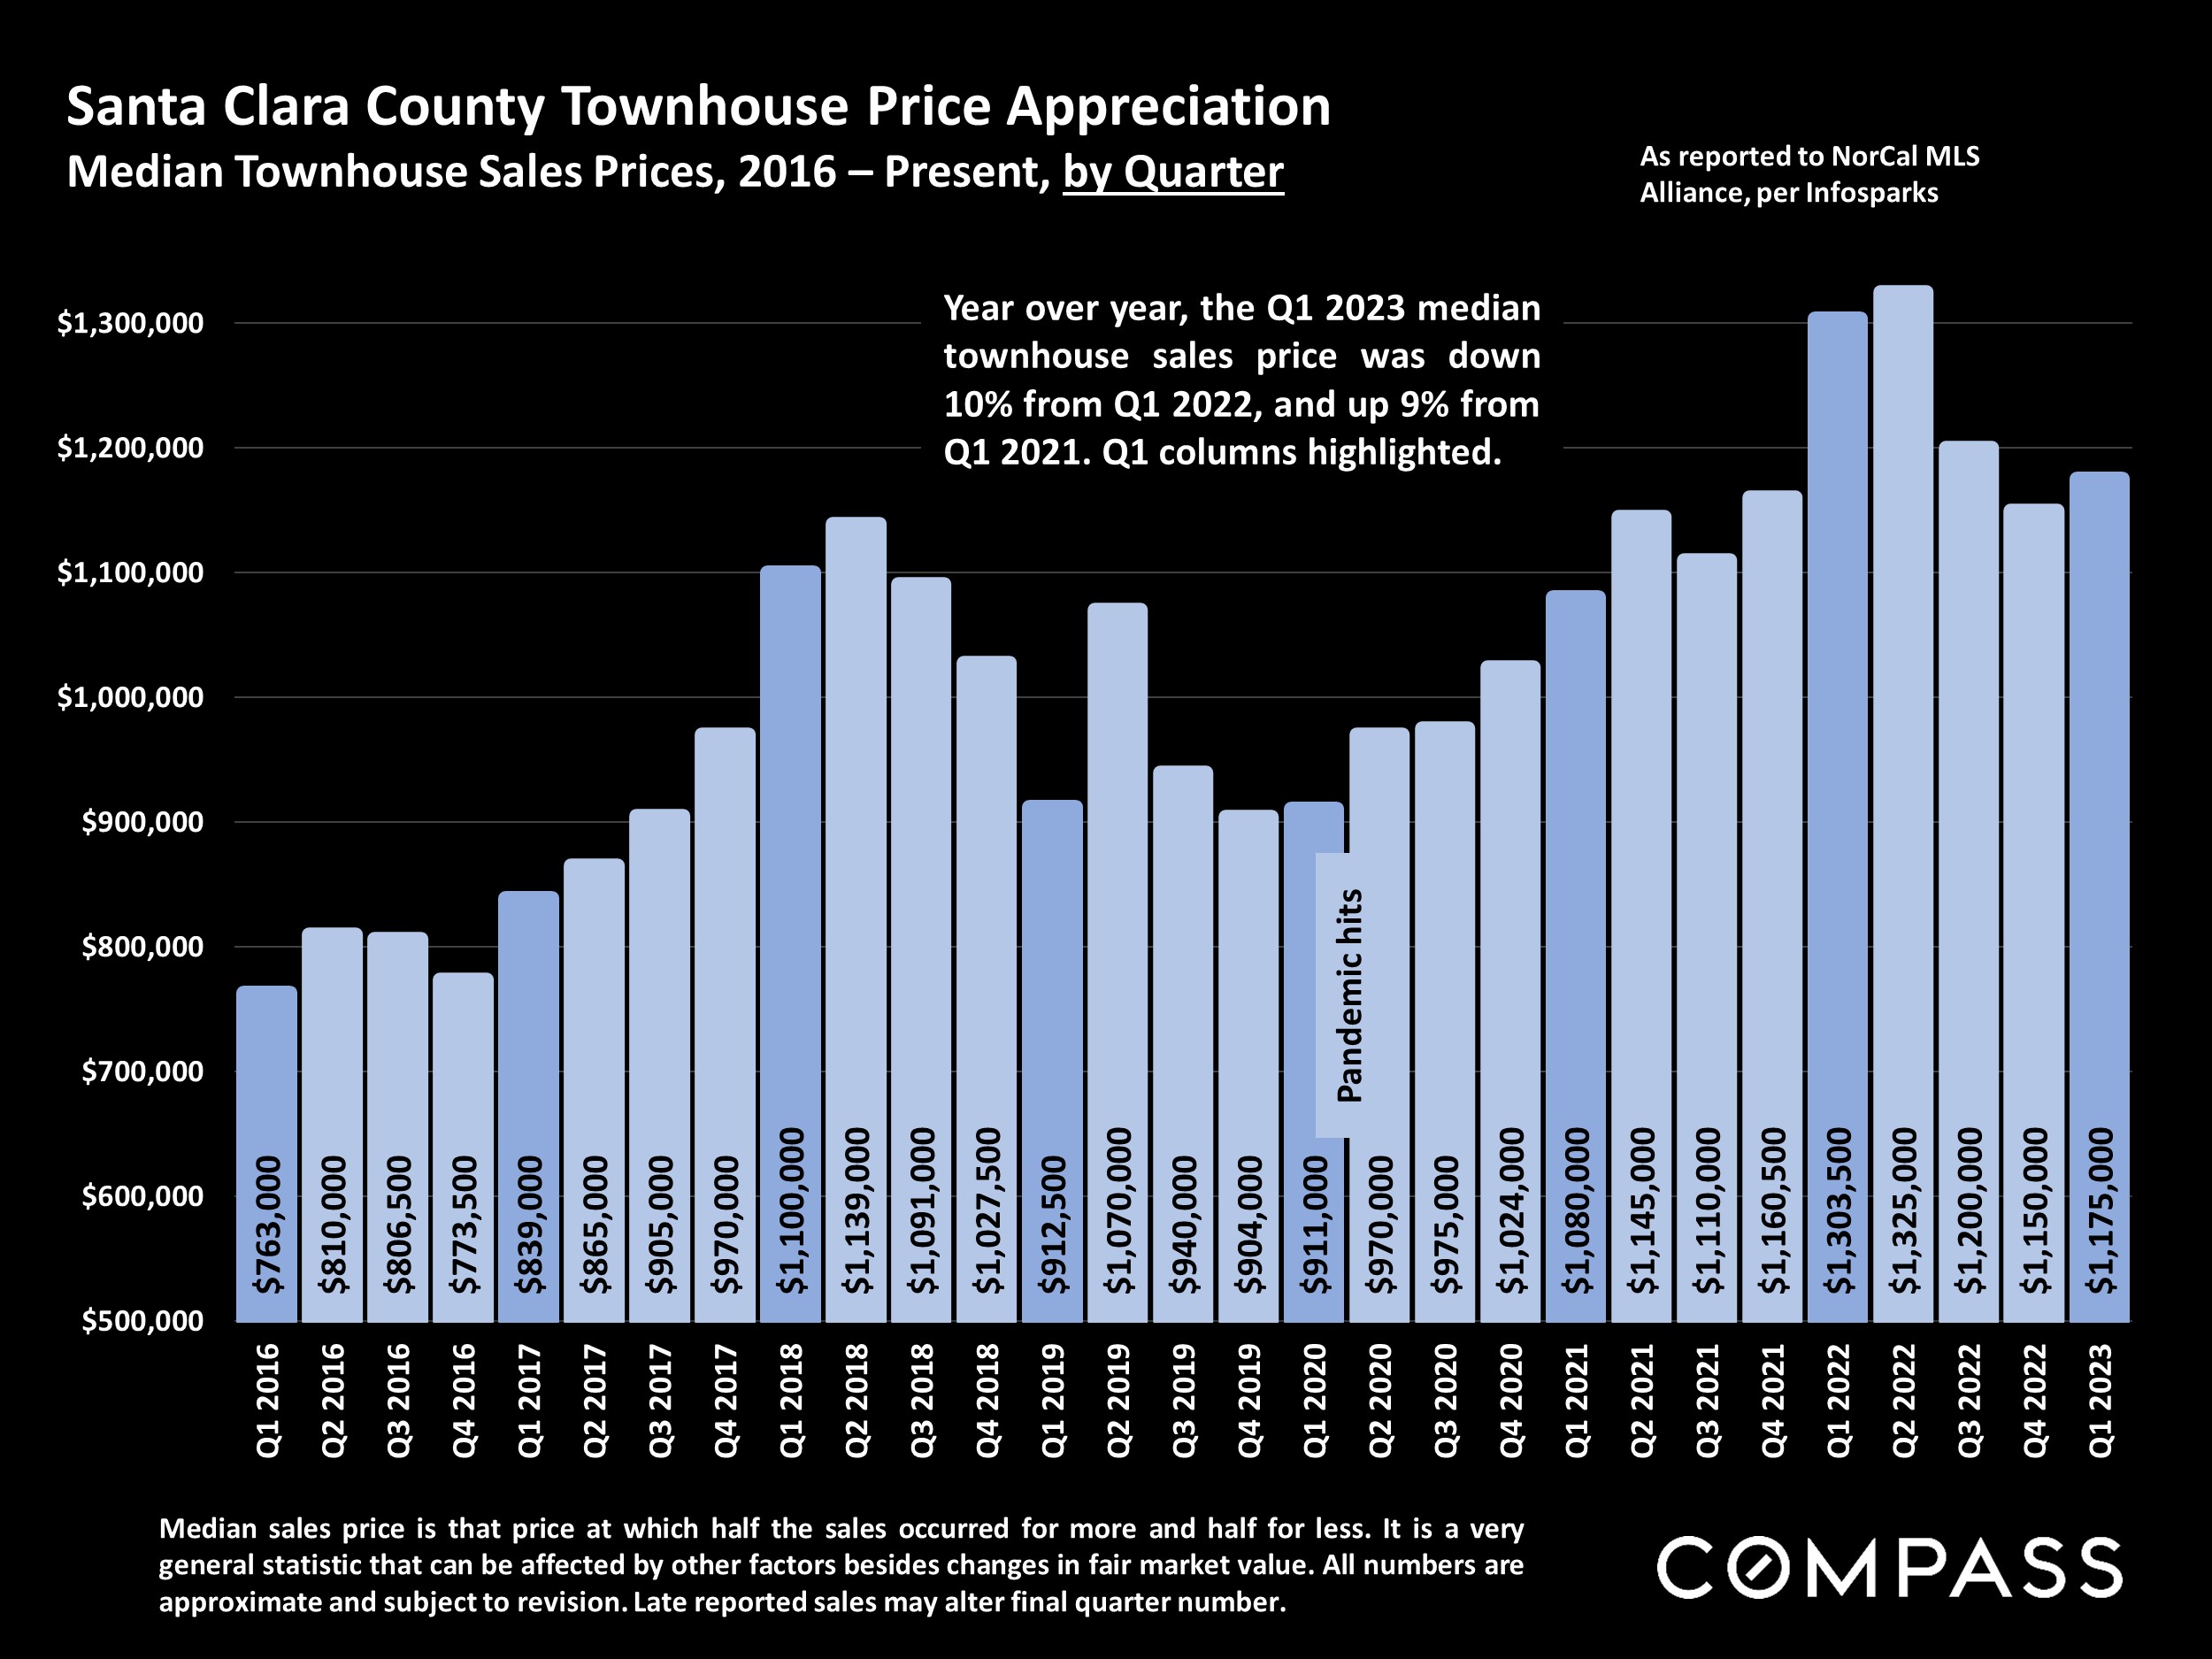
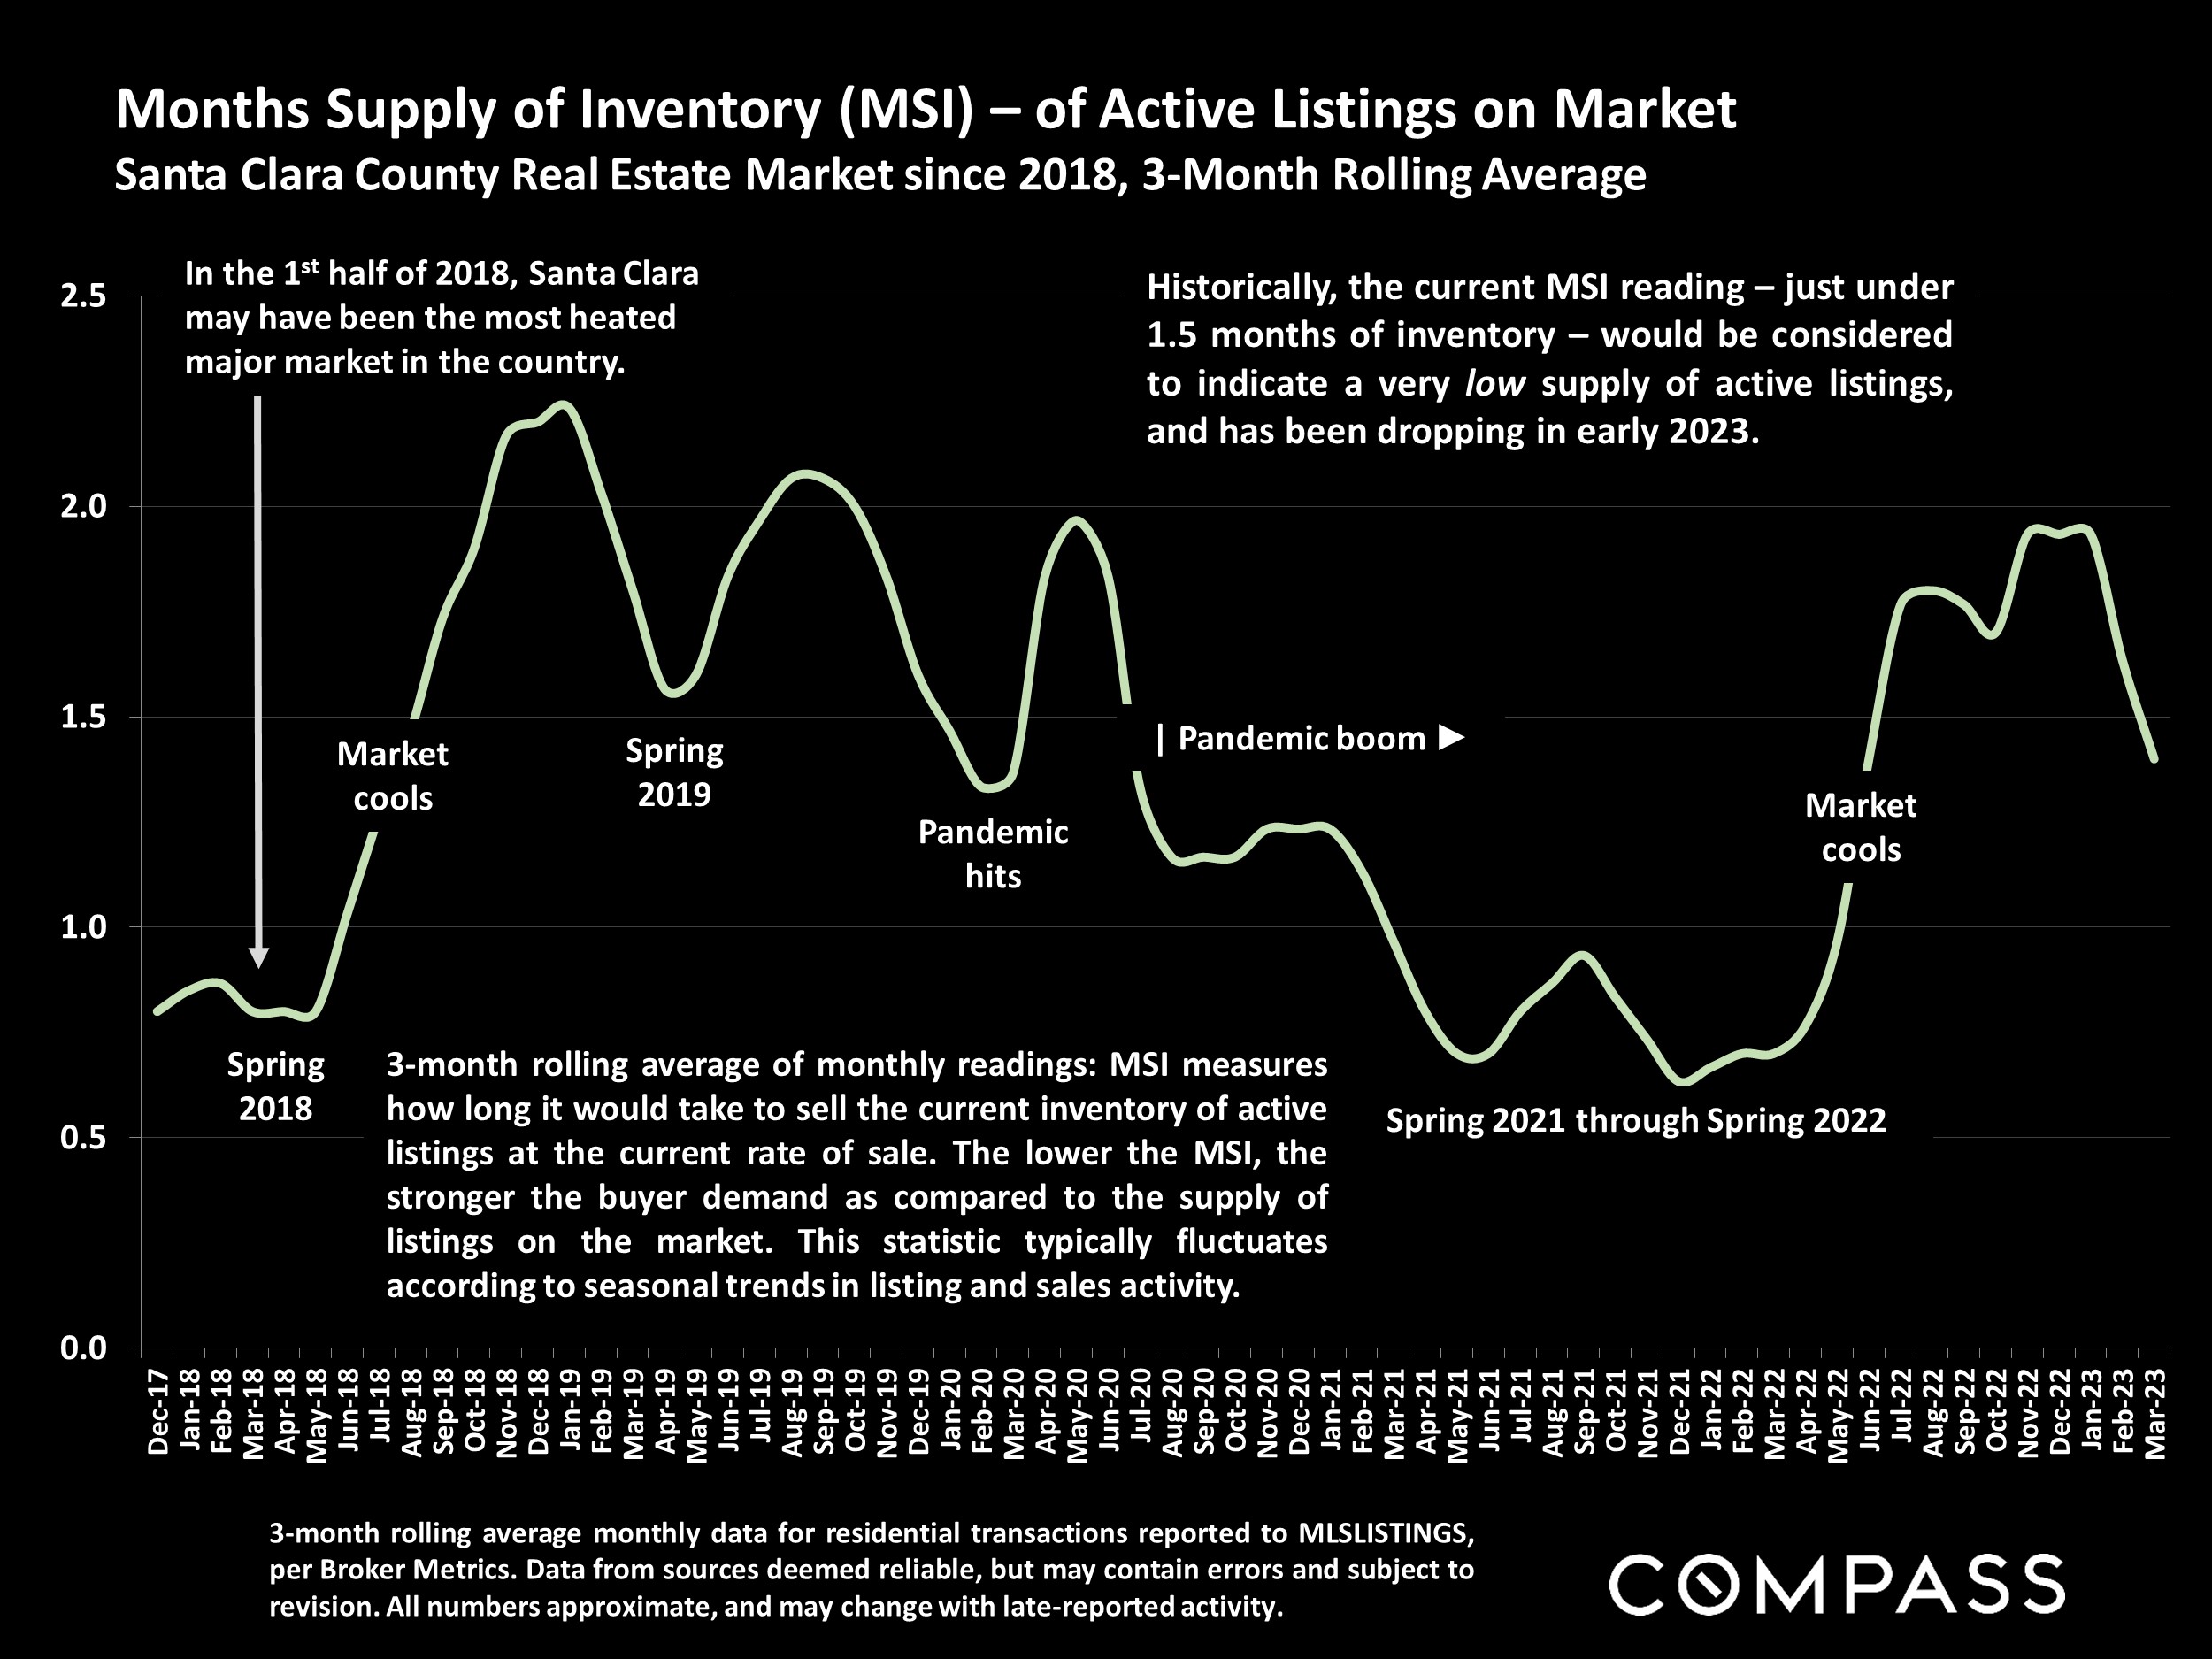
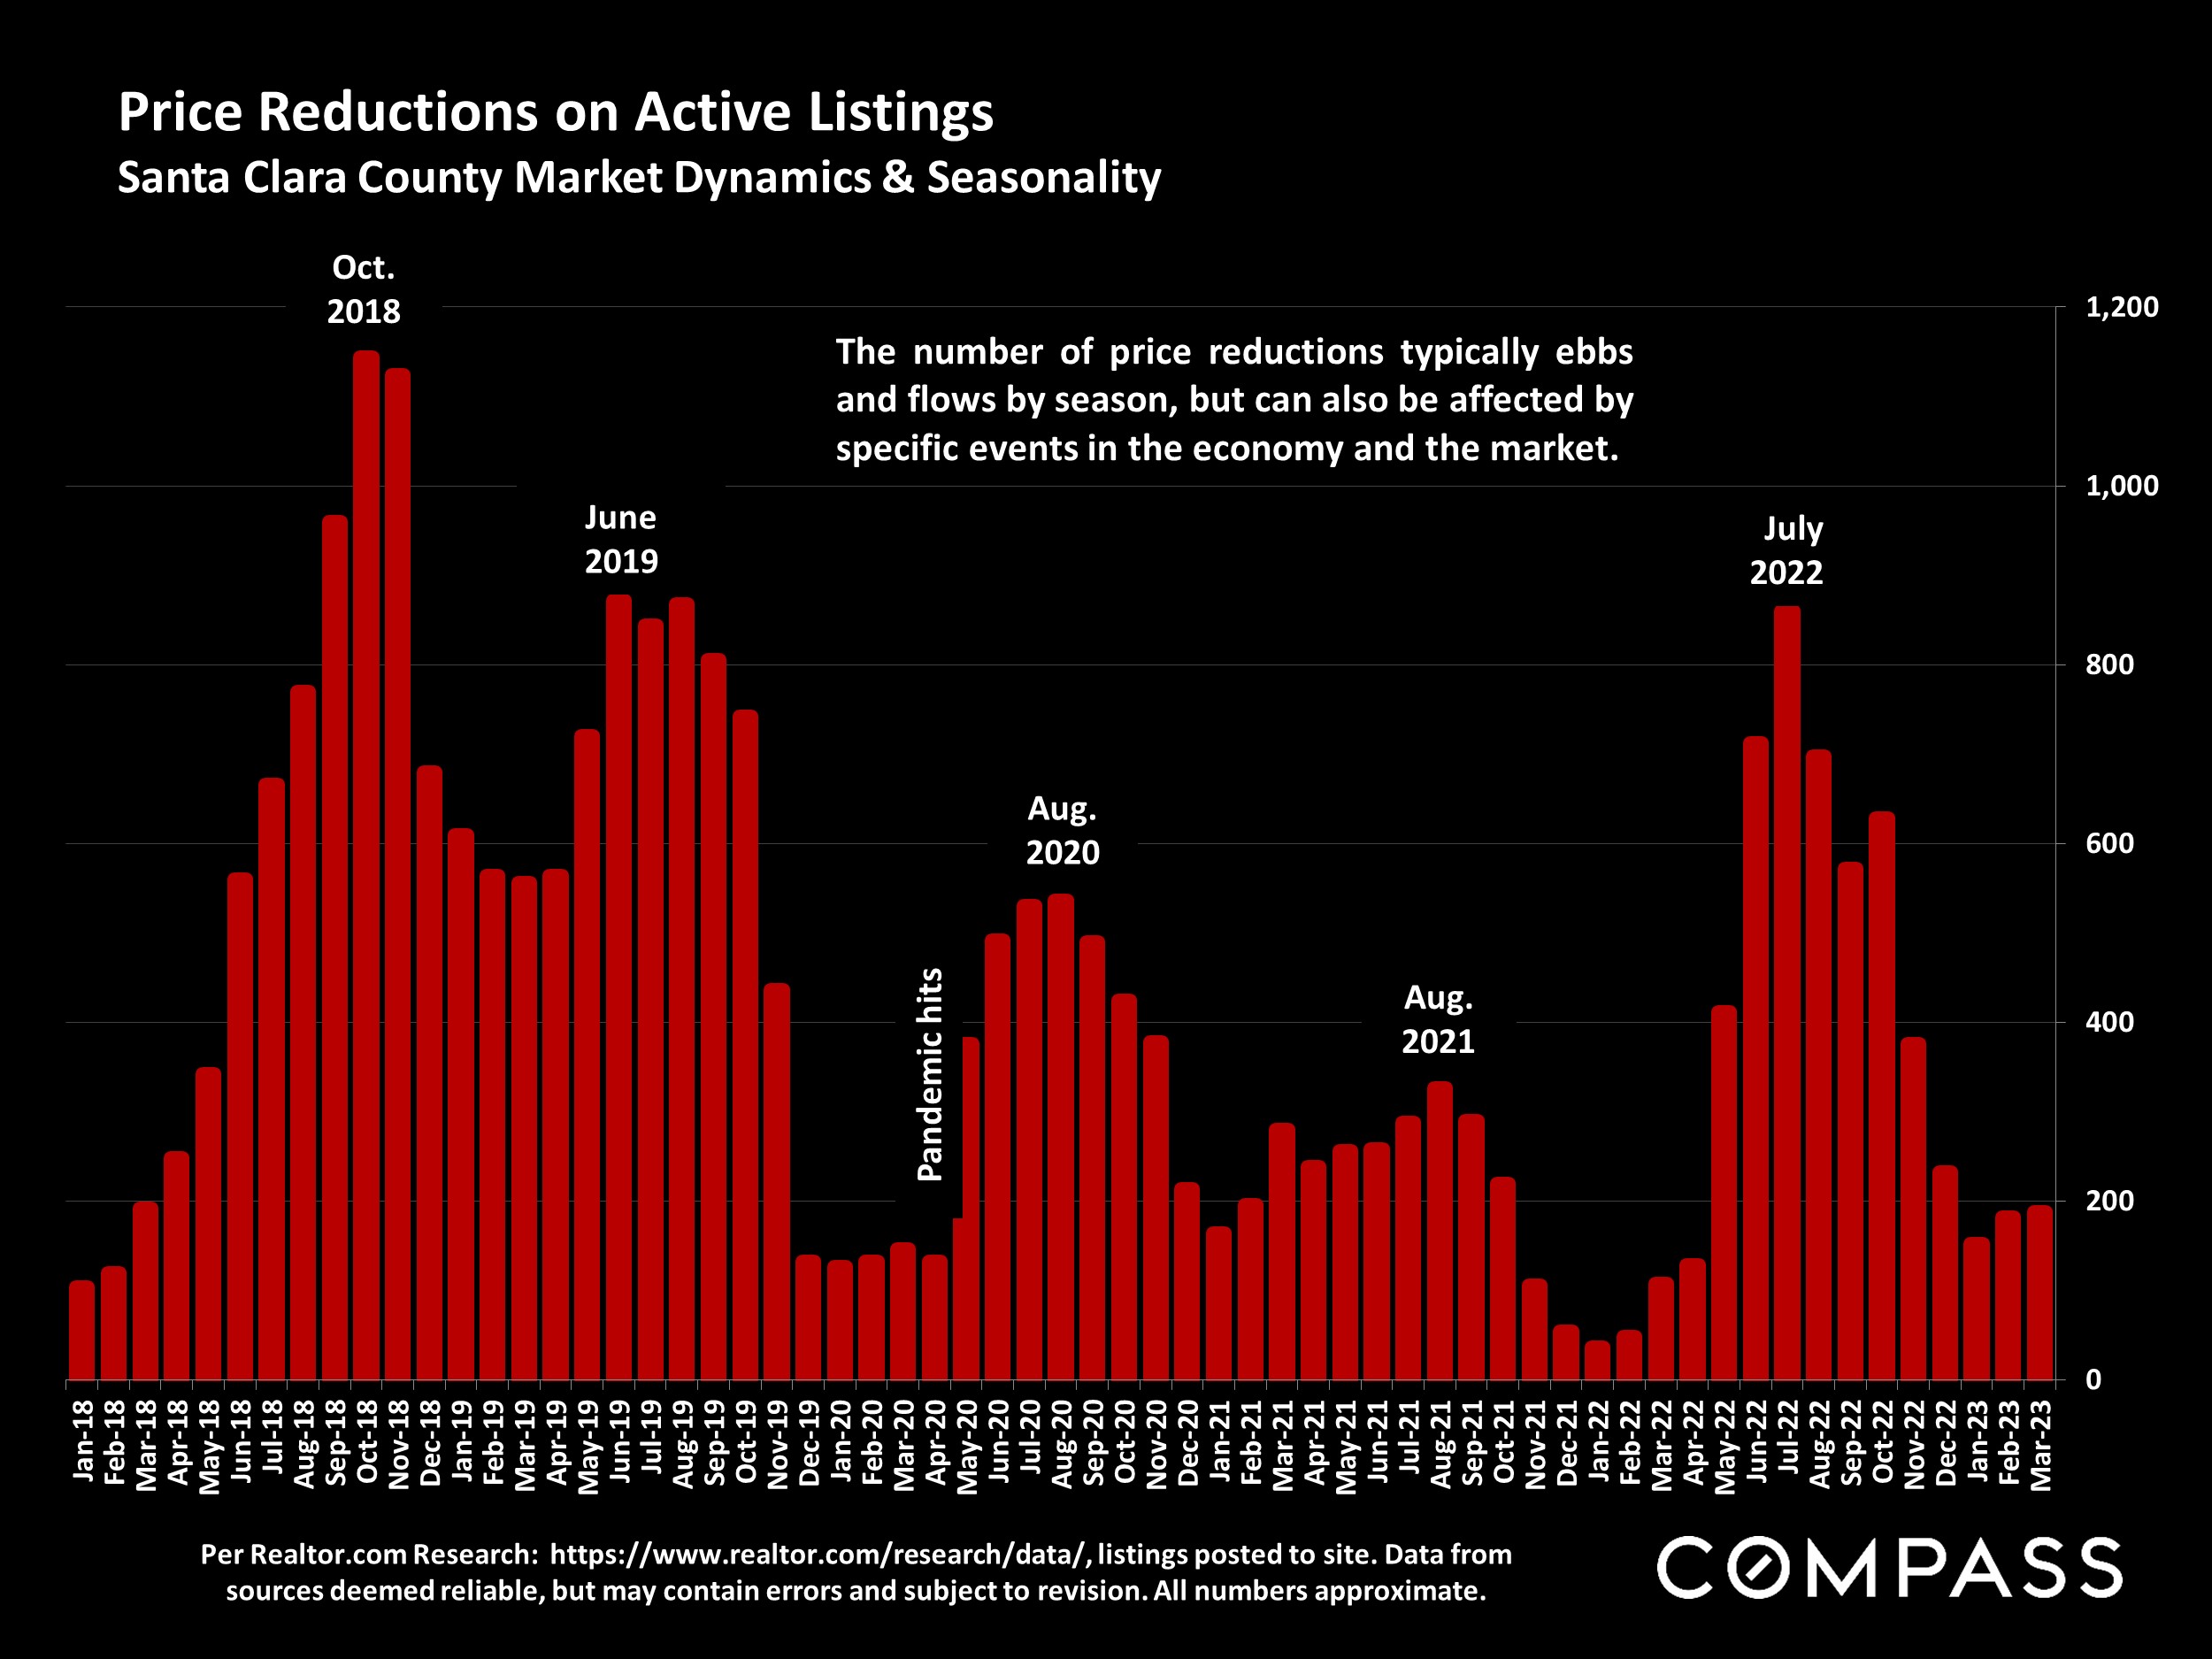
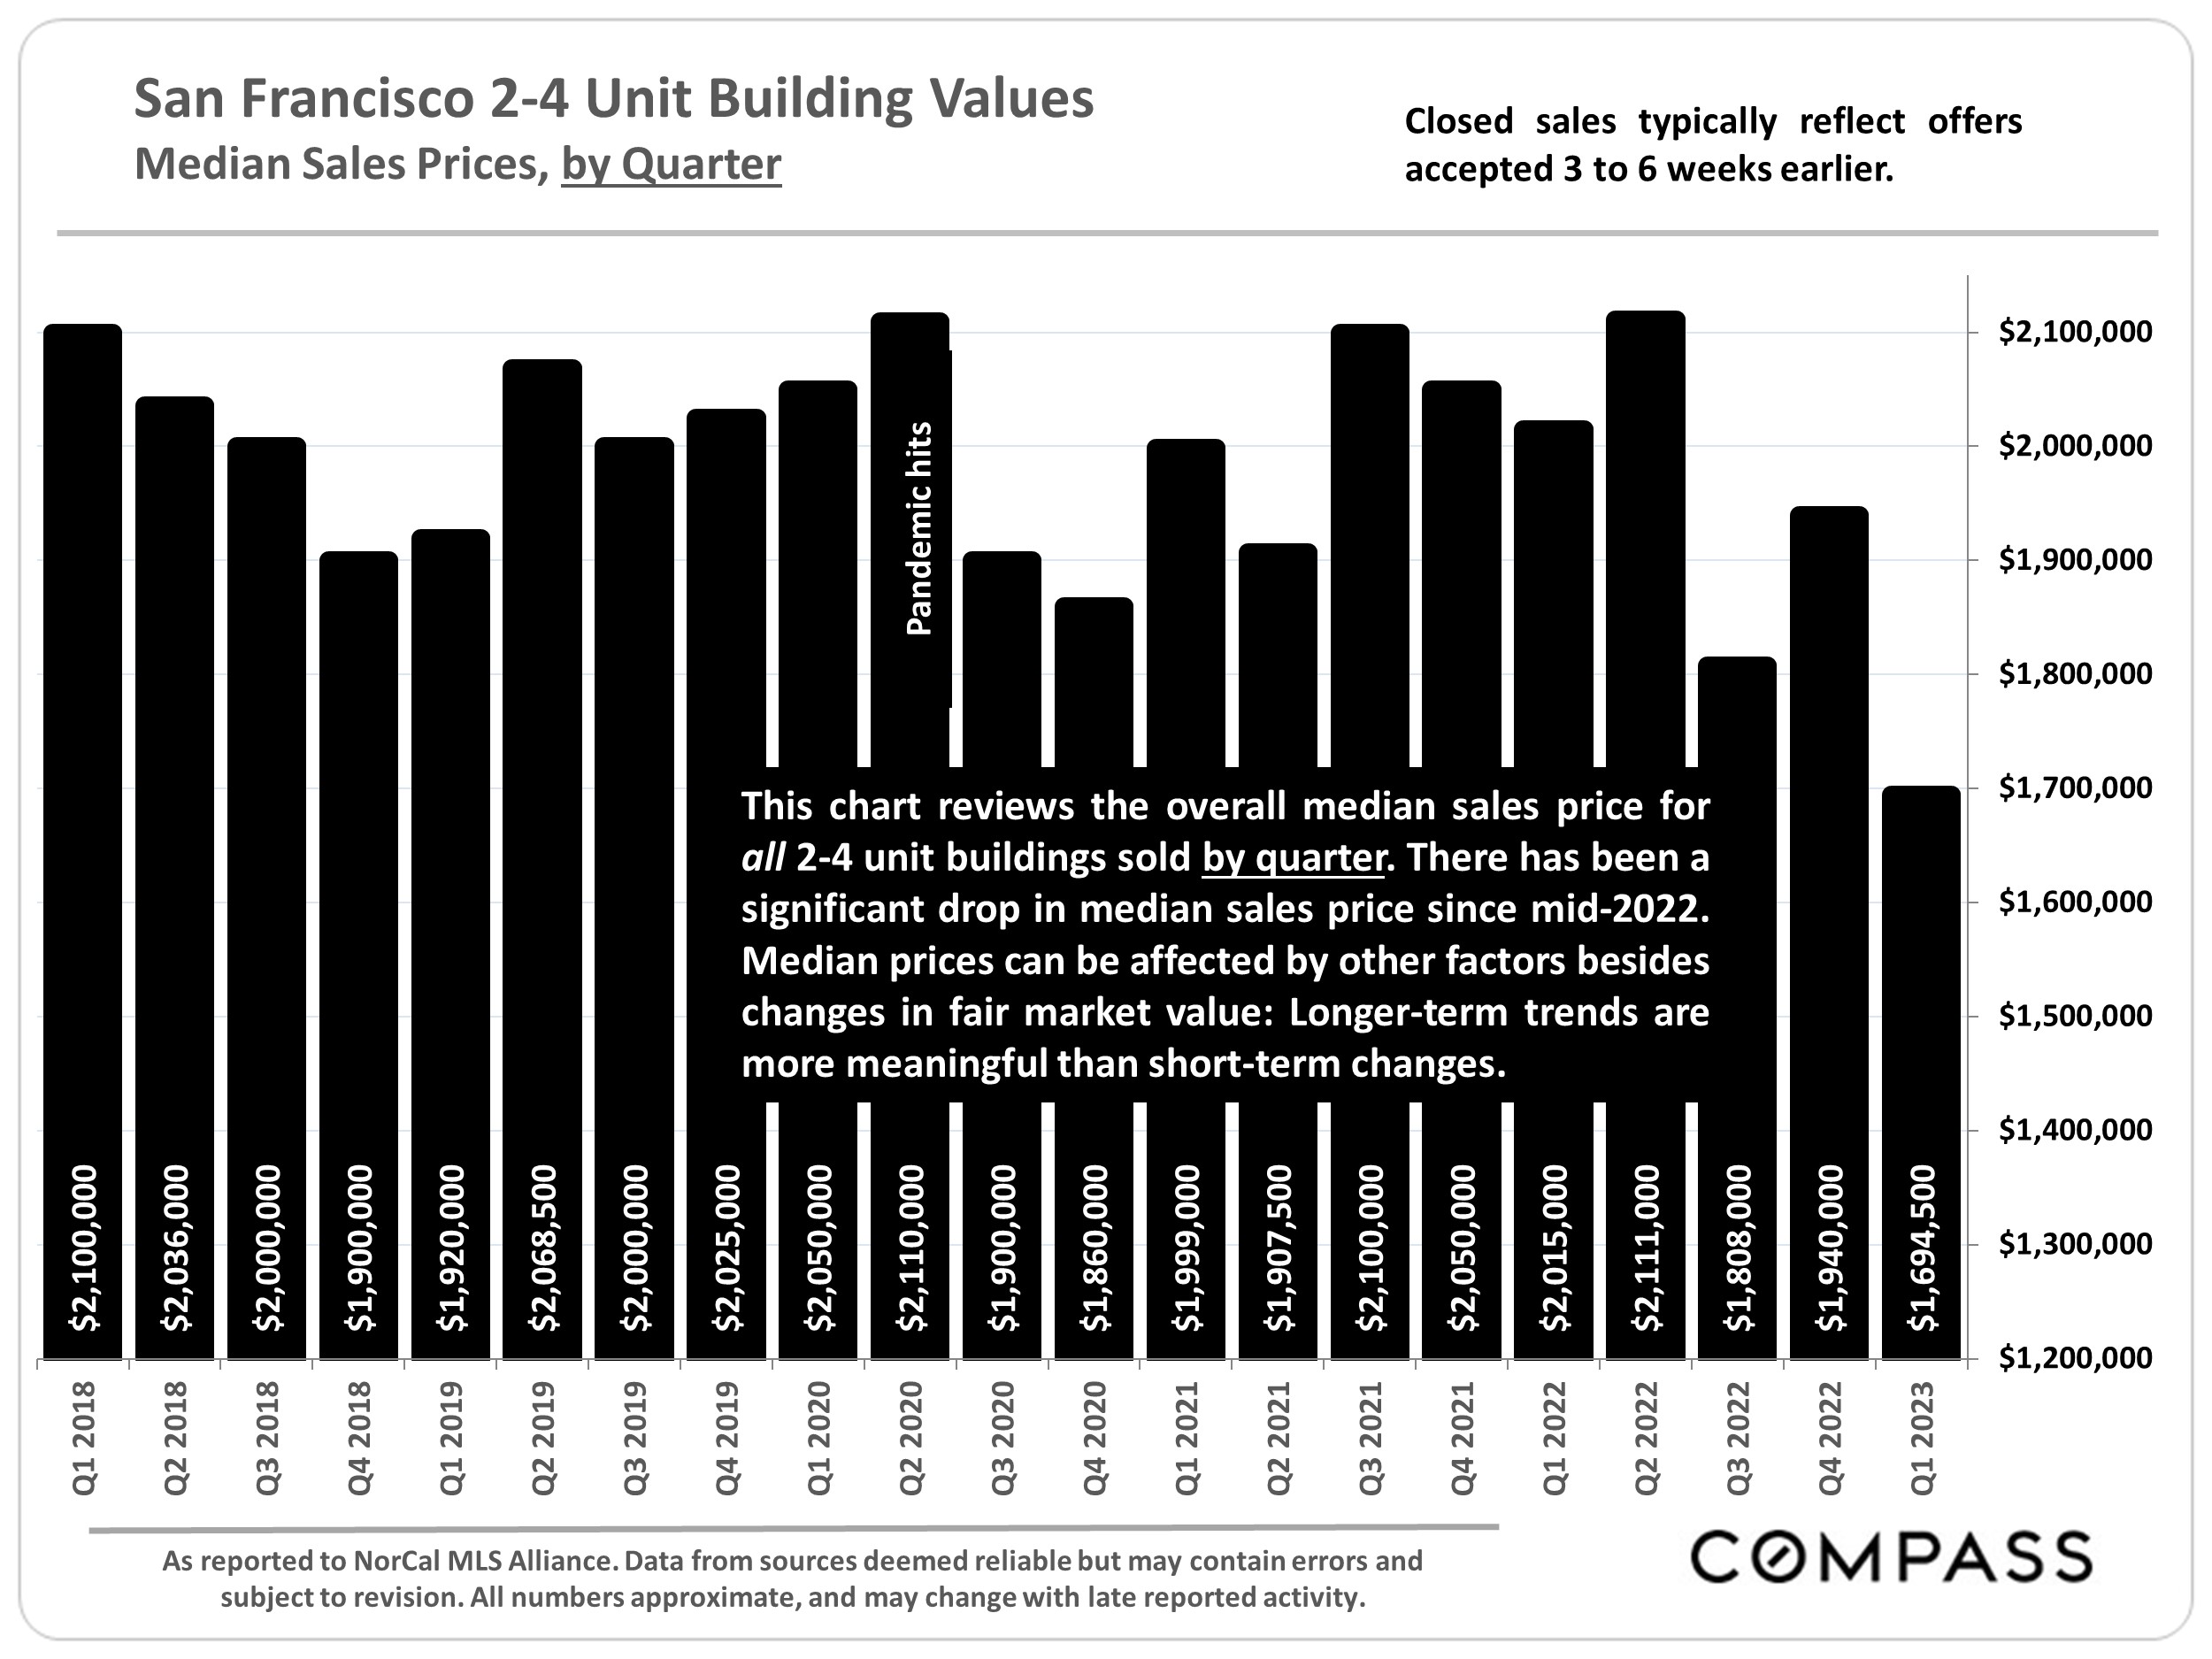
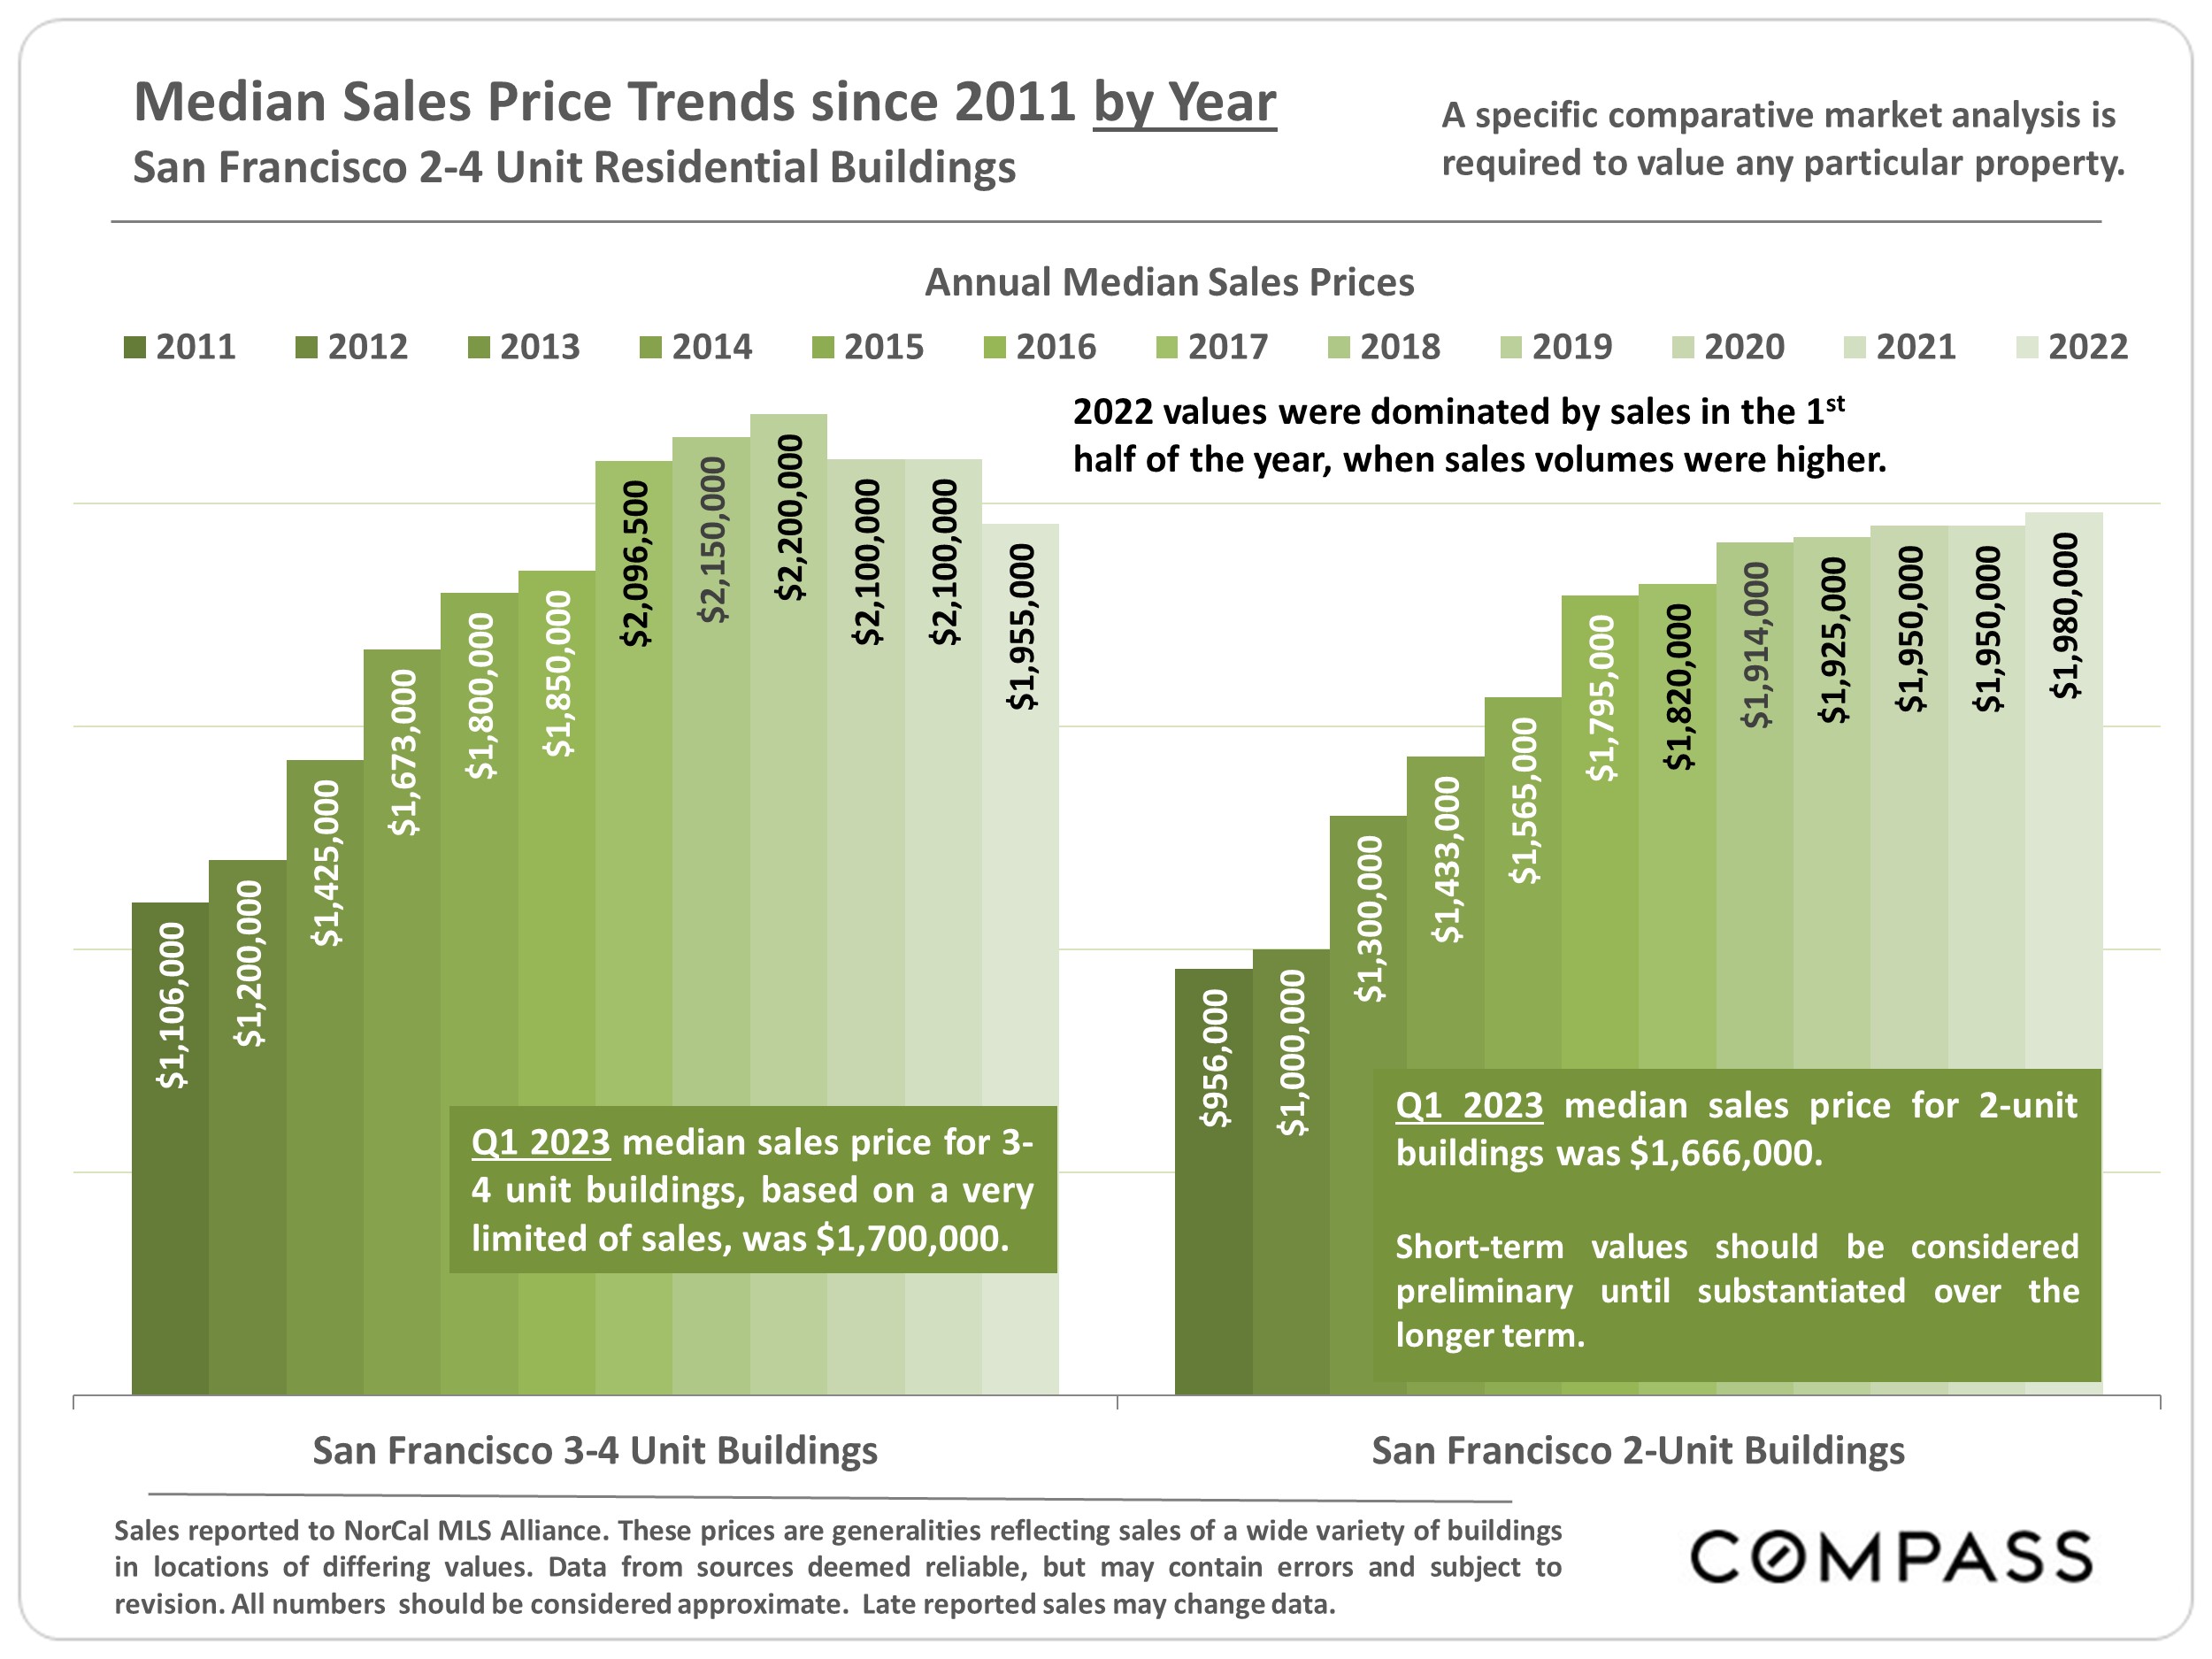
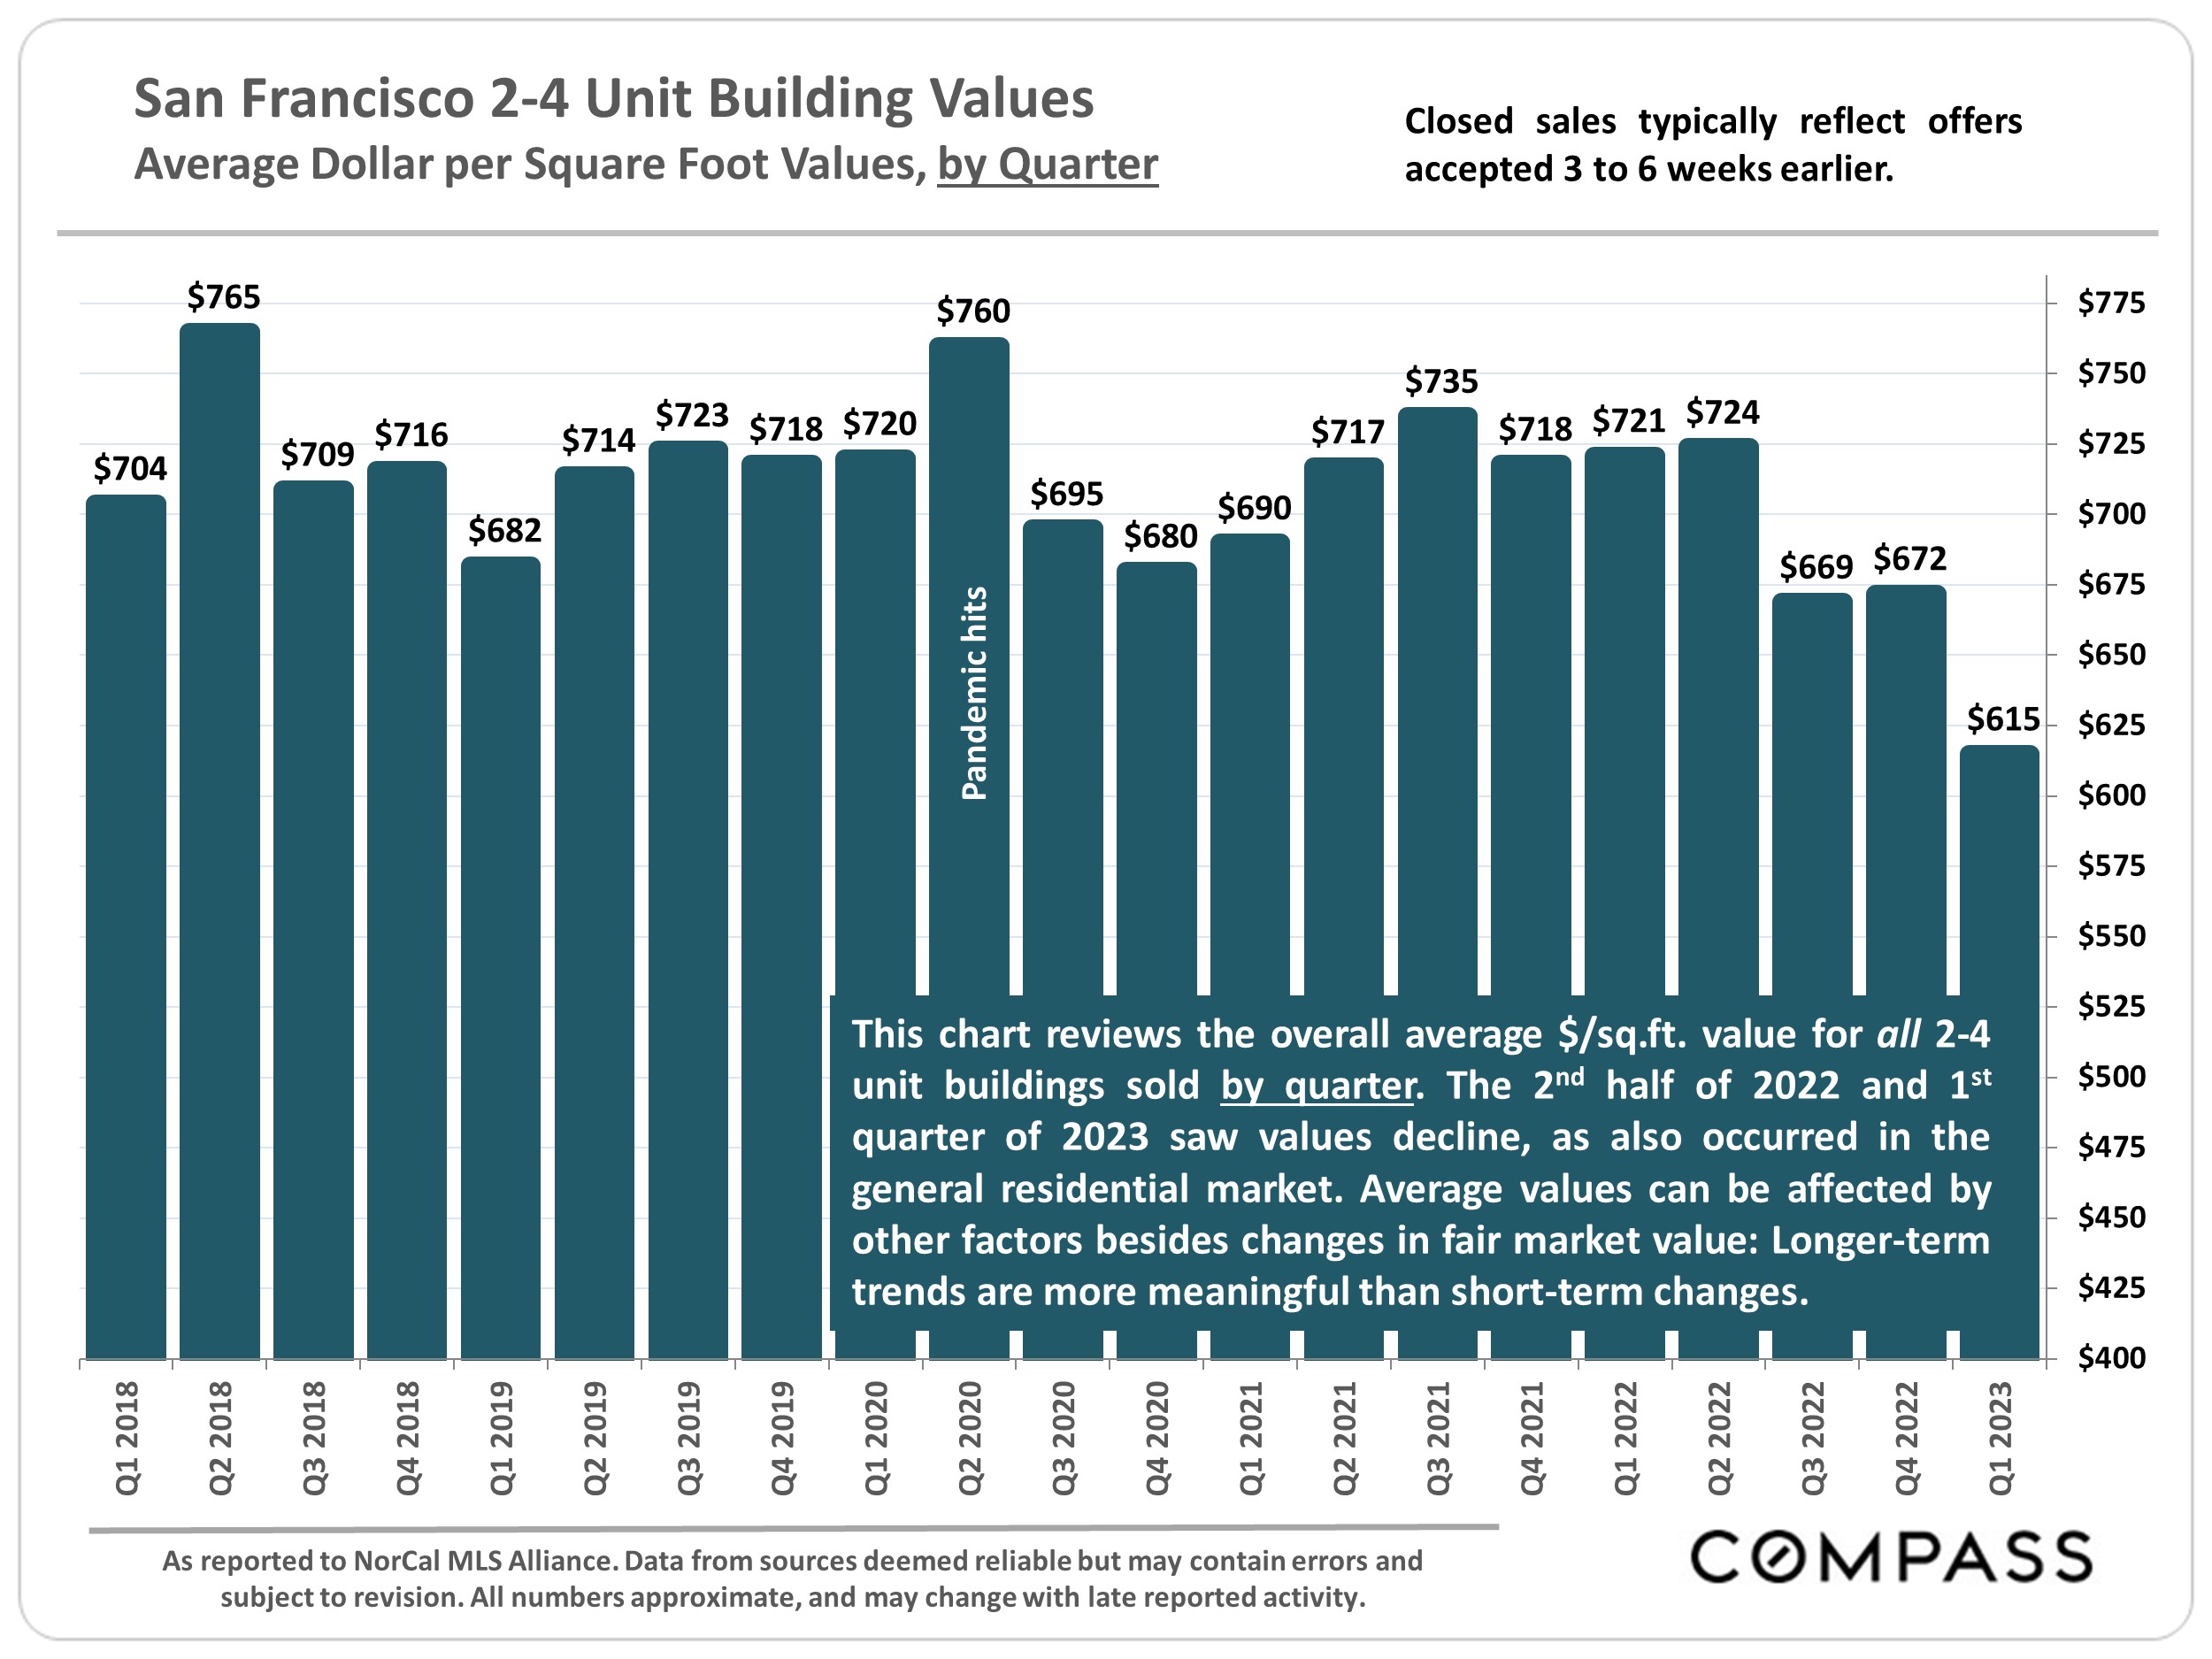
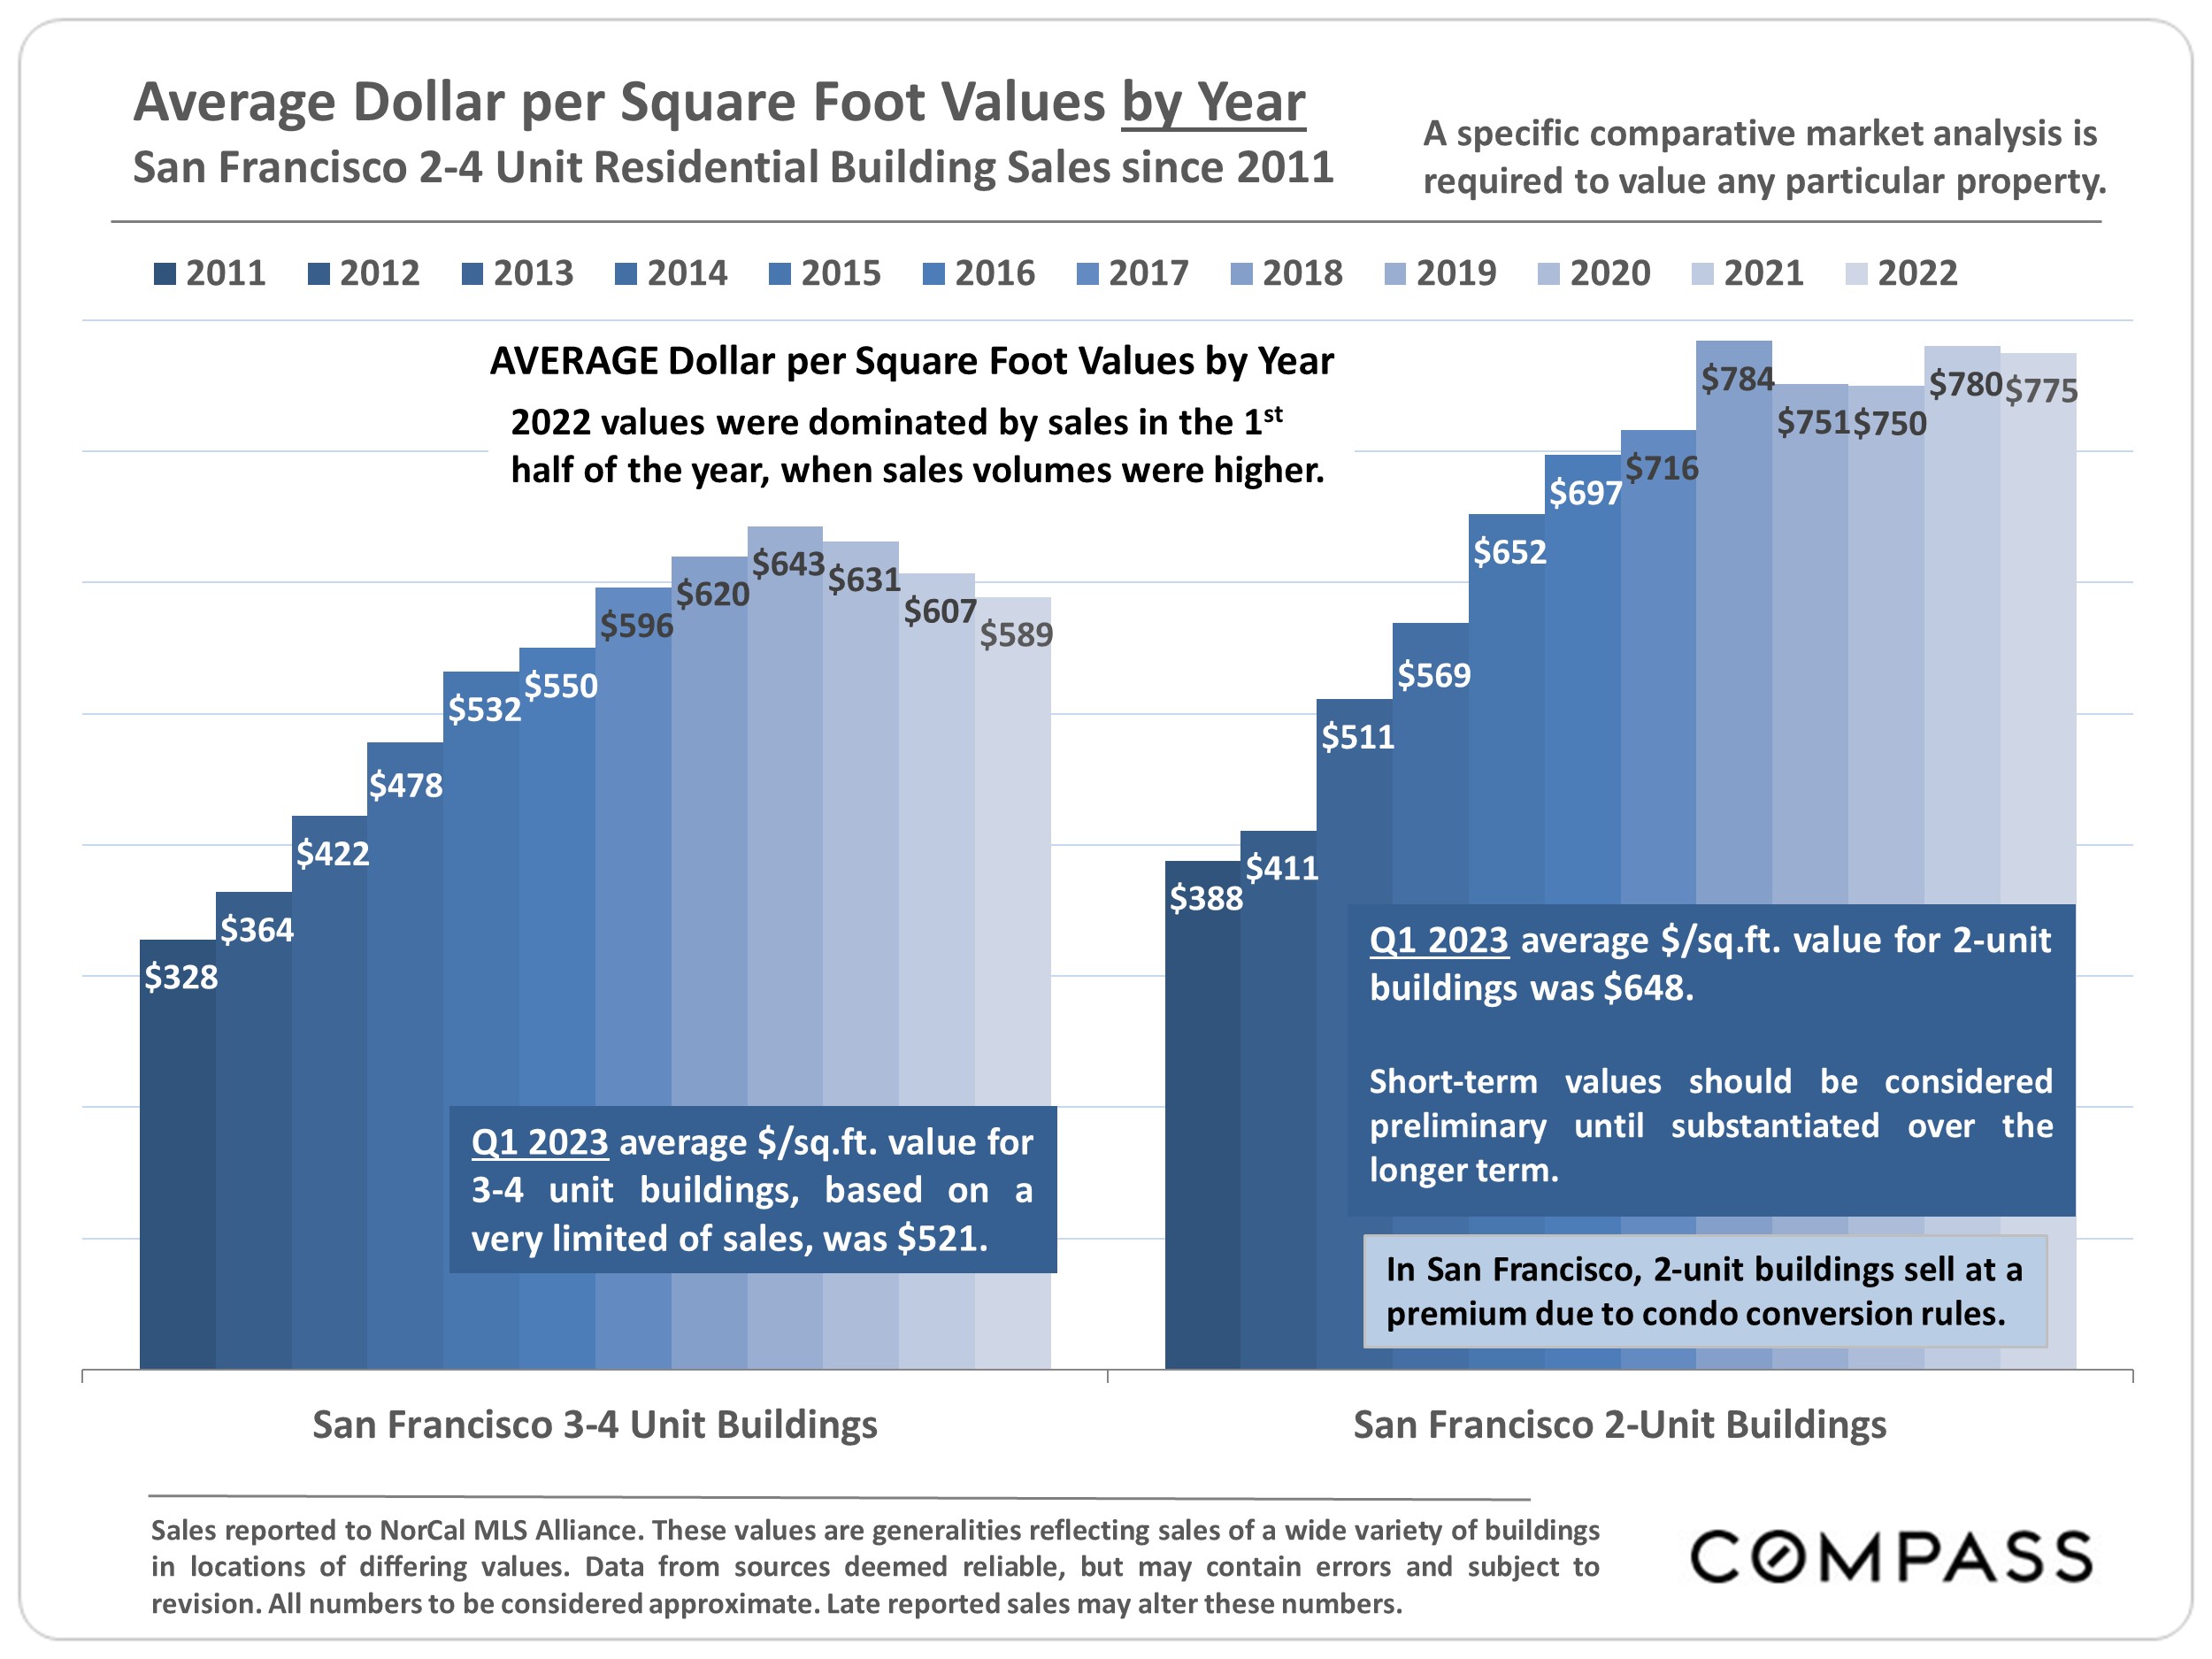
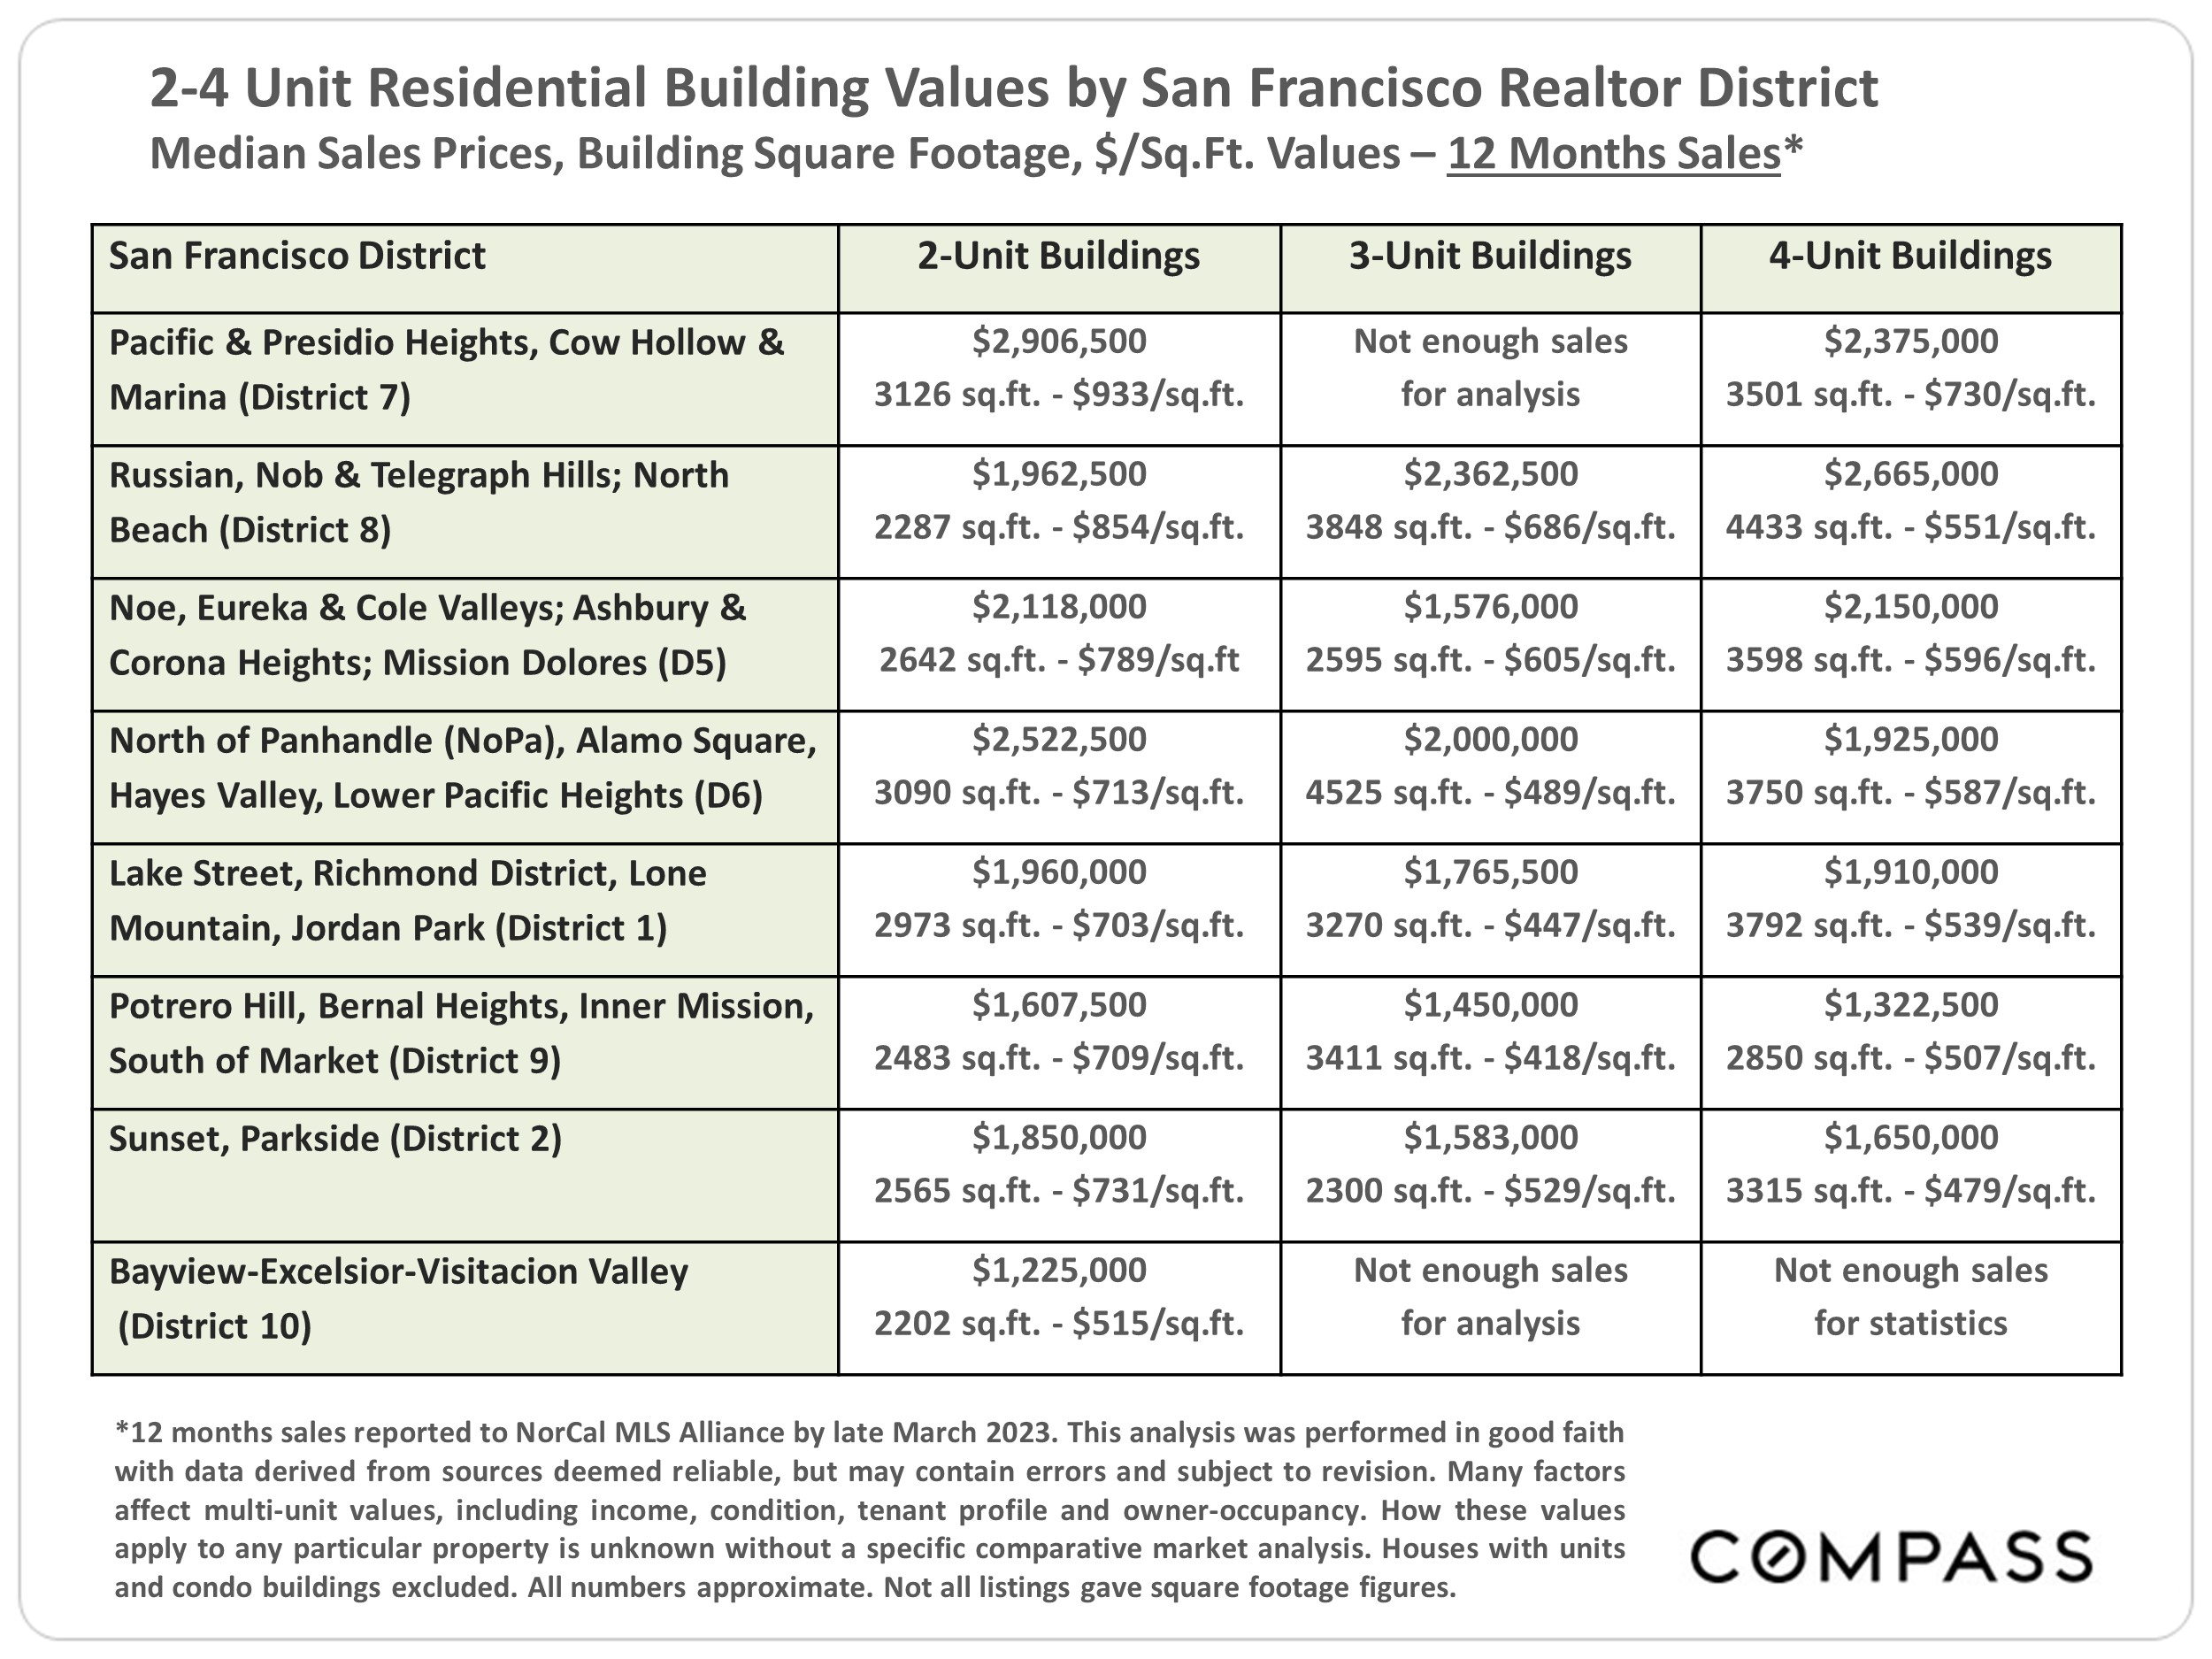
As illustrated in this report, median sales prices and average dollar per square foot values for SF 2-4 unit, multi-family buildings showed significant declines in Q1, dropping 15% to 16% on a year-over- year basis, continuing the trend – similar to that seen in the general residential market – which began in mid-2022. These value metrics should be considered preliminary until substantiated over the longer term. Typically, sales activity climbs rapidly in Q2, and should give us much more data.

Data reported to regional MLS associations. Q1 2023 numbers are estimates using data available in early April 2023: Late reported sales may alter these numbers. Statistics are generalities, essentially summaries of disparate data generated by unique, individual sales. They are best seen not as precise measurements, but as broad, comparative indicators. Anomalous fluctuations in statistics are not uncommon, especially in smaller market segments with fewer sales. Data from sources deemed reliable, but may contain errors and subject to revision. All numbers approximate. How these figures apply to any particular property is unknown without a specific comparative market analysis.

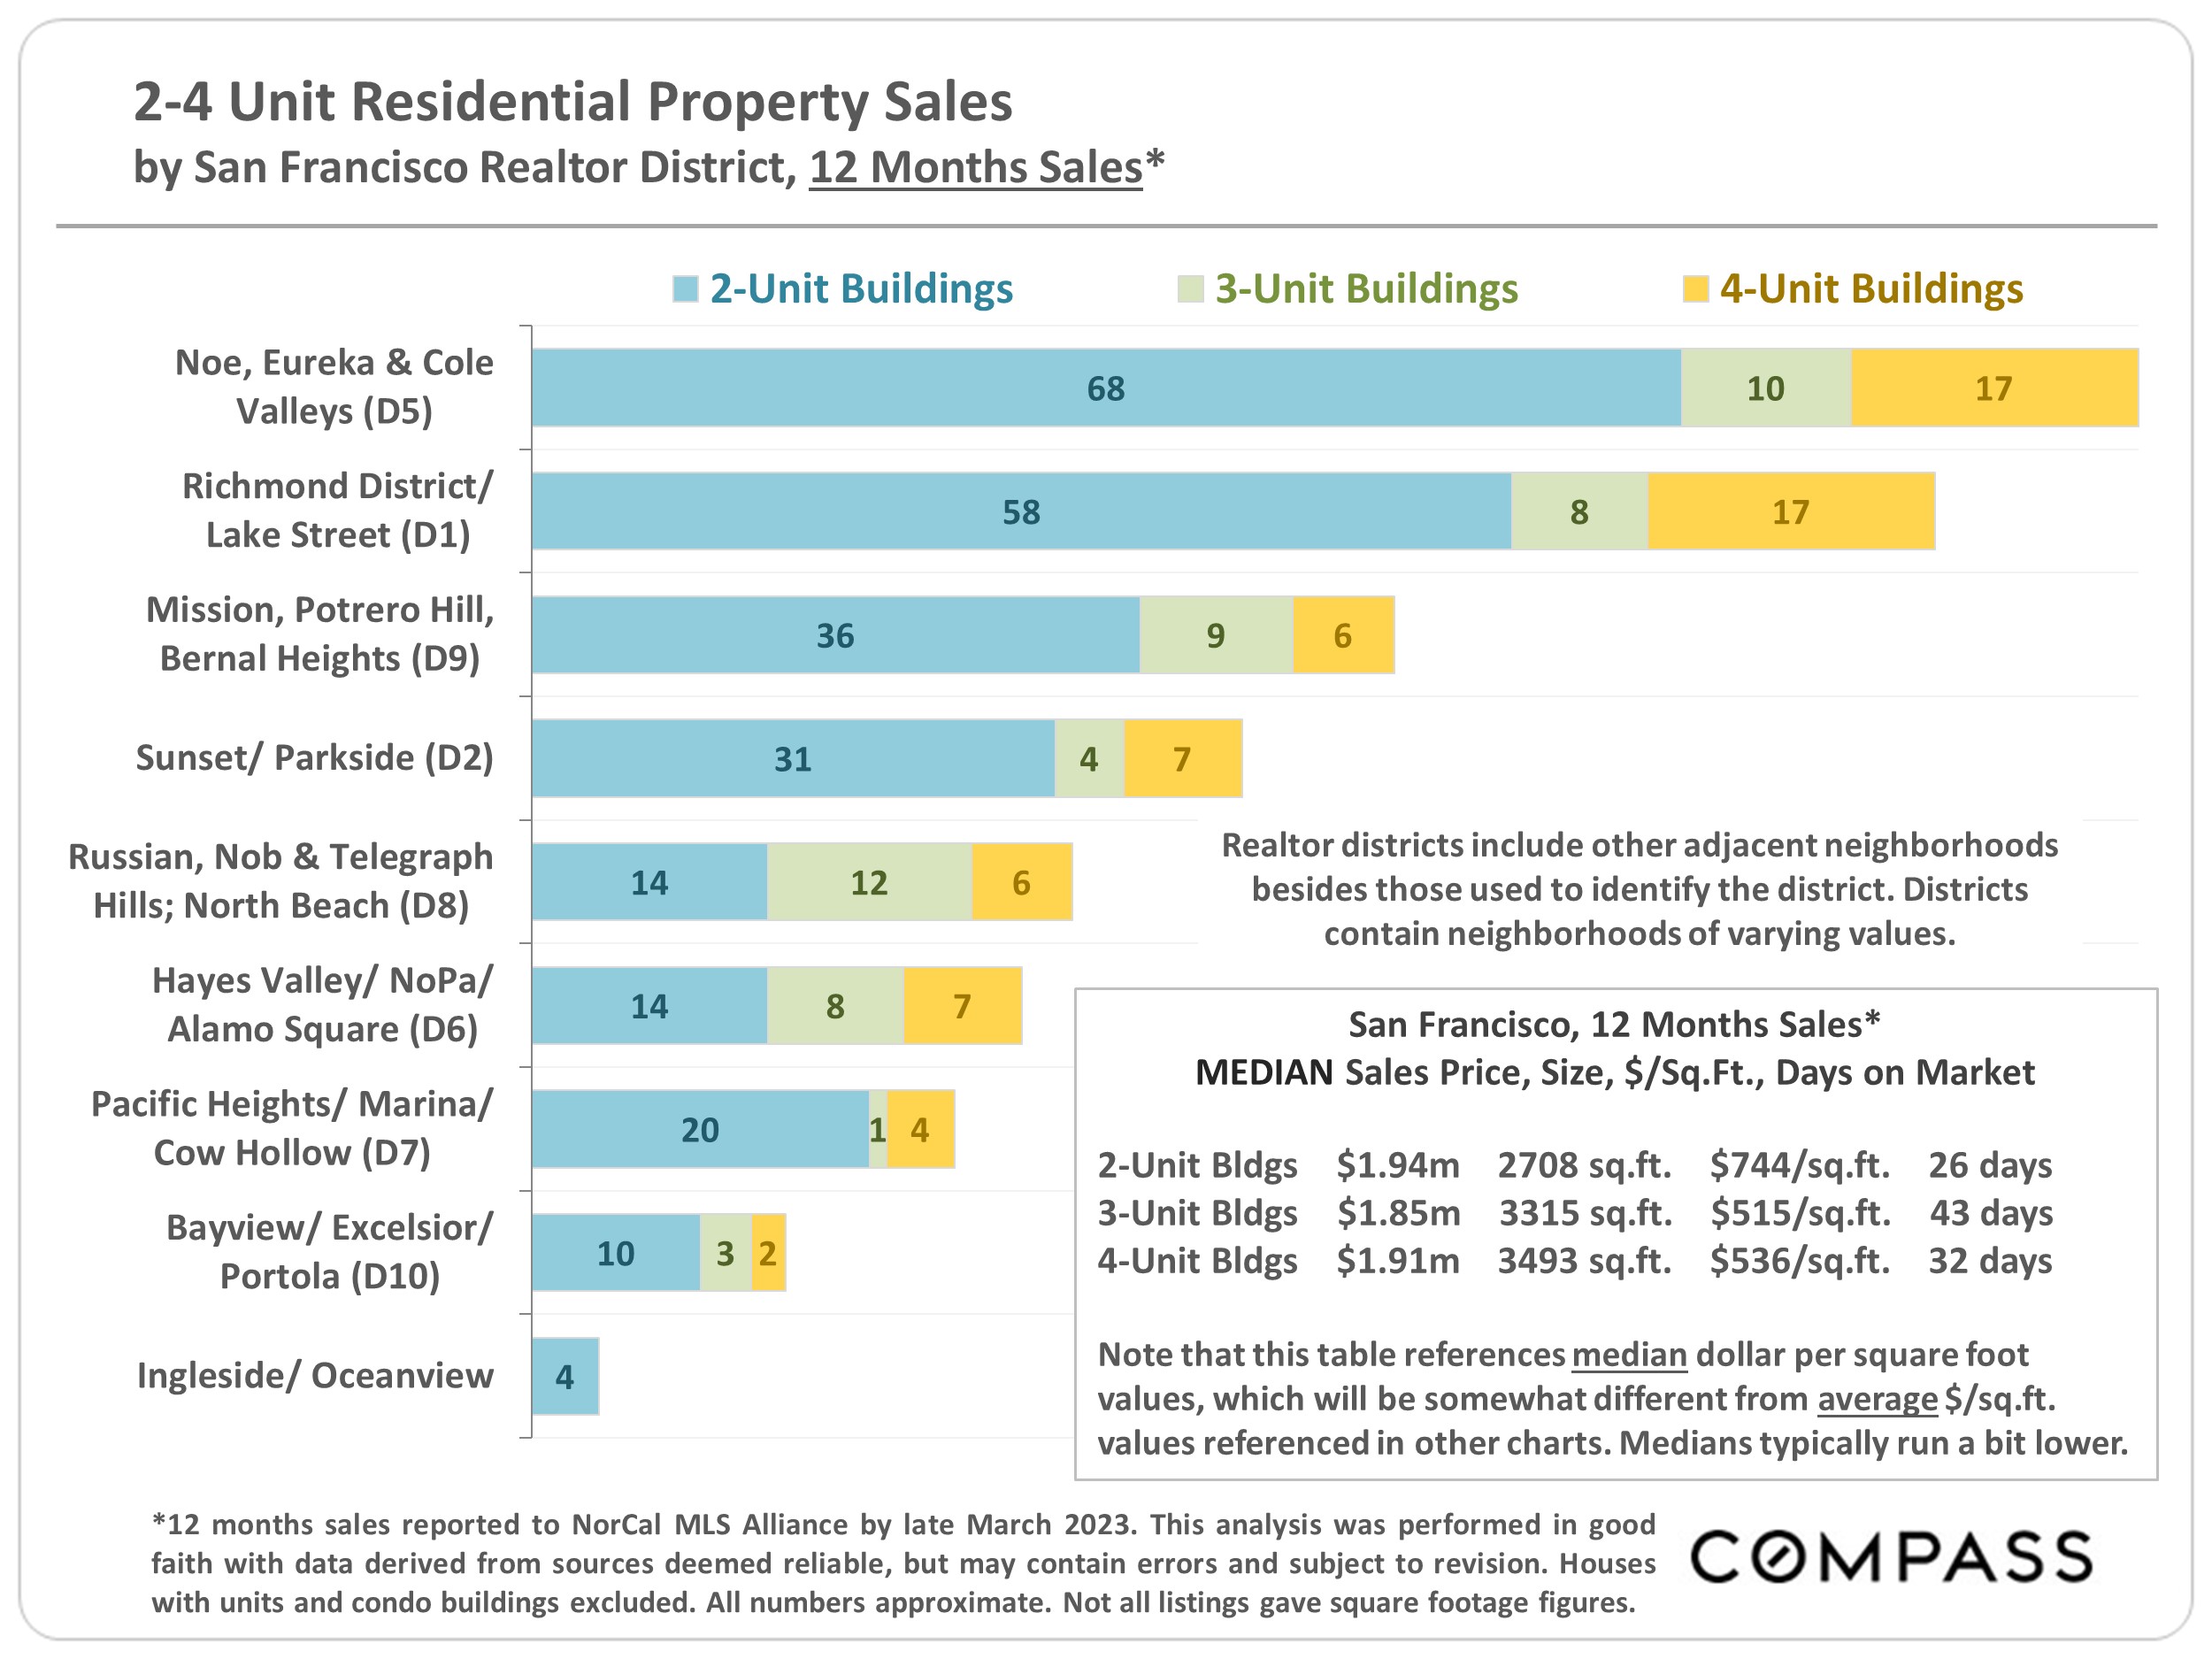
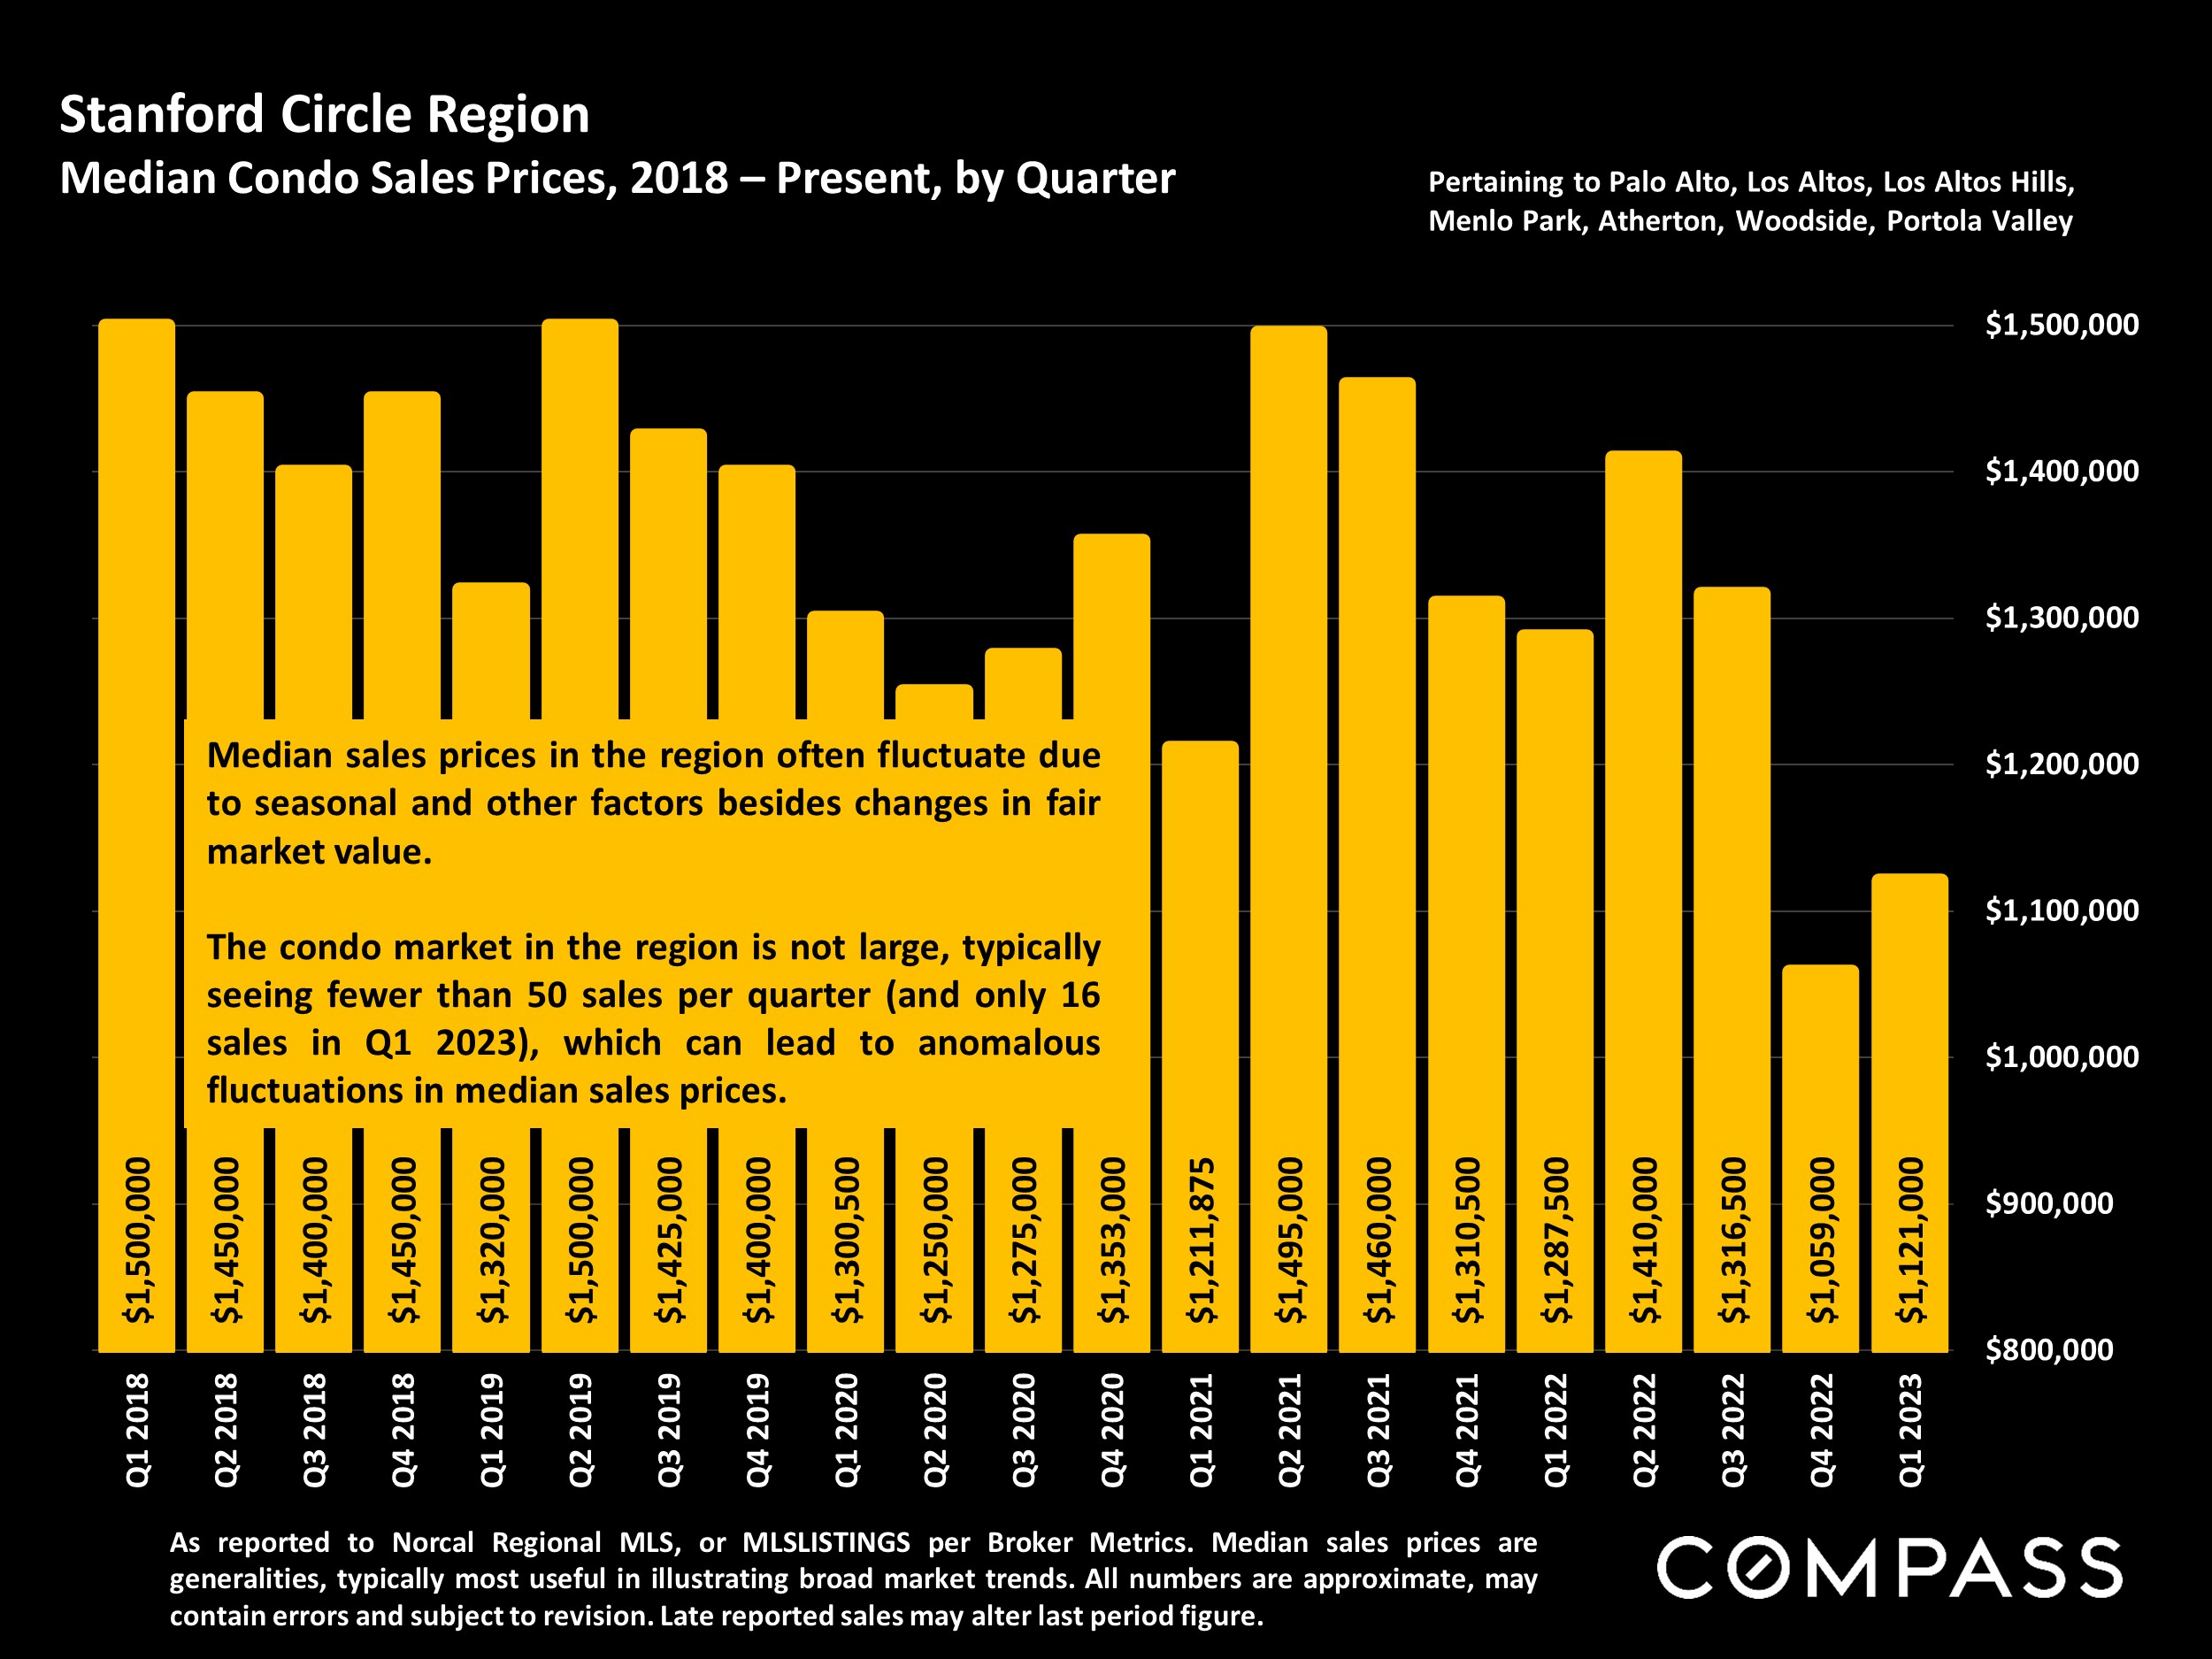
Note that the quantity of sales in any given local submarket is usually relatively small and/or the number of sales that report the necessary financial information can be limited. Buildings of different ages, qualities and sizes selling in different periods can cause these average and median figures to fluctuate significantly. Furthermore, the reliability of some of these calculations depends upon the quality of the income and expense figures provided by the listing agents, and sometimes instead of actual numbers, much less meaningful projected or scheduled figures are used. Therefore, the above statistics should be considered very general indicators, and how they apply to any particular property without a specific comparative market analysis is unknown.

These analyses were made in good faith with data from sources deemed reliable, but they may contain errors and are subject to revision. Statistics are generalities and all numbers should be considered approximate.

Compass is a real estate broker licensed by the State of California, DRE 01527235. Equal Housing Opportunity. This report has been prepared solely for information purposes. The information herein is based on or derived from information generally available to the public and/or from sources believed to be reliable. No representation or warranty can be given with respect to the accuracy or completeness of the information. Compass disclaims any and all liability relating to this report, including without limitation any express or implied representations or warranties for statements contained in, and omissions from, the report. Nothing contained herein is intended to be or should be read as any regulatory, legal, tax, accounting or other advice and Compass does not provide such advice. All opinions are subject to change without notice. Compass makes no representation regarding the accuracy of any statements regarding any references to the laws, statutes or regulations of any state are those of the author(s). Past performance is no guarantee of future results.

Stanford Circle Real Estate, April 2023

The Market Continues to Recover, But with Many Dynamics at Play

Buyer demand continued to rebound from the depths of the mid-winter slowdown: The number and percentage of listings going into contract, and overbidding percentages continued to climb, and days-on-market to drop as the spring selling season gained traction. Buyers generally shrugged off the local banking crisis, the main effect of which, so far, has been a significant drop in interest rates in the 4 weeks after SVB collapsed.

But though conditions have improved considerably, the market remains significantly weaker on a year-over-year basis, and across the Bay Area, median home sales prices have generally declined. However, it’s worth remembering that the market in Q1 2022 was severely overheated, and approaching the peak of a historic, 10-year boom. This will distort many year-over-year comparisons.
The number of new listings coming on market continues to be extremely low, as many potential sellers hold off from listing their homes due to the doubling of interest rates since early 2022: This constitutes a huge factor in market dynamics and is undoubtedly holding back sales activity.

Across the Bay Area, year-over-year sales declines in the highest price segments have outpaced drops for less expensive homes, and their demand-to-supply ratio – the number of sales compared to the number of listings for sale – is much weaker. Luxury home sales have been hit harder since the market correction began in mid-2022, though they too have been rebounding in 2023.

April, May & June sales volumes are commonly among the highest of the year, and this is especially true for luxury home sales. Stanford Circle is by far the most expensive regional market
in the Bay Area.

Report created in good faith with data from sources deemed reliable, but may contain errors and subject to revision. All numbers approximate, and may change with late-reported activity.

Statistics are generalities, essentially summaries of widely disparate data generated by dozens, hundreds or thousands of unique, individual sales occurring within different time periods. They are best seen not as precise measurements, but as broad, comparative indicators, with reasonable margins of error. Anomalous fluctuations in statistics are not uncommon, especially in smaller, expensive market segments. Last period data should be considered estimates that may change with late-reported data. Different analytics programs sometimes define statistics – such as “active listings,” “days on market,” and “months supply of inventory” – differently: what is most meaningful are not specific calculations but the trends they illustrate. Most listing and sales data derives from the local or regional multi-listing service (MLS) of the area specified in the analysis, but not all listings or sales are reported to MLS and these won’t be reflected in the data. “Homes” signifies real-property, single-household housing units: houses, condos, co-ops, townhouses, duets and TICs (but not mobile homes), as applicable to each market. City/town names refer specifically to the named cities and towns, unless otherwise delineated. Multi-county metro areas will be specified as such. Data from sources deemed reliable, but may contain errors and subject to revision. All numbers to be considered approximate.

Many aspects of value cannot be adequately reflected in median and average statistics: curb appeal, age, condition, amenities, views, lot size, quality of outdoor space, “bonus” rooms, additional parking, quality of location within the neighborhood, and so on. How any of these statistics apply to any particular home is unknown without a specific comparative market analysis. Median Sales Price is that price at which half the properties sold for more and half for less. It may be affected by seasonality, “unusual” events, or changes in inventory and buying trends, as well as by changes in fair market value. The median sales price for an area will often conceal an enormous variety of sales prices in the underlying individual sales.
Dollar per Square Foot is based upon the home’s interior living space and does not include garages, unfinished attics and basements, rooms built without permit, patios, decks or yards (though all those can add value to a home). These figures are usually derived from appraisals or tax records, but are sometimes unreliable (especially for older homes) or unreported altogether. The calculation can only be made on those home sales that reported square footage.

Compass is a real estate broker licensed by the State of California, DRE 01527235. Equal Housing Opportunity. This report has been prepared solely for information purposes. The information herein is based on or derived from information generally available to the public and/or from sources believed to be reliable. No representation or warranty can be given with respect to the accuracy or completeness of the information. Compass disclaims any and all liability relating to this report, including without limitation any express or implied representations or warranties for statements contained in, and omissions from, the report. Nothing contained herein is intended to be or should be read as any regulatory, legal, tax, accounting or other advice and Compass does not provide such advice. All opinions are subject to change without notice. Compass makes no representation regarding the accuracy of any statements regarding any references to the laws, statutes or regulations of any state are those of the author(s). Past performance is no guarantee of future results.

San Francisco County Real Estate, April 2023

The Market Continues to Recover, But with Many Dynamics at Play

Buyer demand continued to rebound from the depths of the mid-winter slowdown: The number and percentage of listings going into contract, and overbidding percentages continued to climb, and days-on-market to drop as the spring selling season gained traction. Buyers generally shrugged off the local banking crisis, the main effect of which, so far, has been a significant drop in interest rates in the 4 weeks after SVB collapsed.

But though conditions have improved considerably, the market remains significantly weaker on a year-over-year basis, and across the Bay Area, median home sales prices have generally declined. However, it’s worth remembering that the market in Q1 2022 was severely overheated, and approaching the peak of a historic, 10-year boom. This will distort many year-over-year comparisons.
The number of new listings coming on market continues to be extremely low, as many potential sellers hold off from listing their homes due to the doubling of interest rates since early 2022: This constitutes a huge factor in market dynamics and is undoubtedly holding back sales activity.

Across the Bay Area, year-over-year sales declines in the highest price segments have outpaced drops for less expensive homes, and their demand-to-supply ratio – the number of sales compared to the number of listings for sale – is much weaker. Luxury home sales have been hit harder since the market correction began in mid-2022, though they too have been rebounding in 2023.

April, May & June sales volumes are commonly among the highest of the year, and this is especially true for luxury home sales.

Report created in good faith with data from sources deemed reliable, but may contain errors and subject to revision. All numbers approximate, and may change with late-reported activity.

Statistics are generalities, essentially summaries of widely disparate data generated by dozens, hundreds or thousands of unique, individual sales occurring within different time periods. They are best seen not as precise measurements, but as broad, comparative indicators, with reasonable margins of error. Anomalous fluctuations in statistics are not uncommon, especially in smaller, expensive market segments. Last period data should be considered estimates that may change with late-reported data. Different analytics programs sometimes define statistics – such as “active listings,” “days on market,” and “months supply of inventory” – differently: what is most meaningful are not specific calculations but the trends they illustrate. Most listing and sales data derives from the local or regional multi-listing service (MLS) of the area specified in the analysis, but not all listings or sales are reported to MLS and these won’t be reflected in the data. “Homes” signifies real-property, single-household housing units: houses, condos, co-ops, townhouses, duets and TICs (but not mobile homes), as applicable to each market. City/town names refer specifically to the named cities and towns, unless otherwise delineated. Multi-county metro areas will be specified as such. Data from sources deemed reliable, but may contain errors and subject to revision. All numbers to be considered approximate.

Many aspects of value cannot be adequately reflected in median and average statistics: curb appeal, age, condition, amenities, views, lot size, quality of outdoor space, “bonus” rooms, additional parking, quality of location within the neighborhood, and so on. How any of these statistics apply to any particular home is unknown without a specific comparative market analysis. Median Sales Price is that price at which half the properties sold for more and half for less. It may be affected by seasonality, “unusual” events, or changes in inventory and buying trends, as well as by changes in fair market value. The median sales price for an area will often conceal an enormous variety of sales prices in the underlying individual sales.
Dollar per Square Foot is based upon the home’s interior living space and does not include garages, unfinished attics and basements, rooms built without permit, patios, decks or yards (though all those can add value to a home). These figures are usually derived from appraisals or tax records, but are sometimes unreliable (especially for older homes) or unreported altogether. The calculation can only be made on those home sales that reported square footage.

Compass is a real estate broker licensed by the State of California, DRE 01527235. Equal Housing Opportunity. This report has been prepared solely for information purposes. The information herein is based on or derived from information generally available to the public and/or from sources believed to be reliable. No representation or warranty can be given with respect to the accuracy or completeness of the information. Compass disclaims any and all liability relating to this report, including without limitation any express or implied representations or warranties for statements contained in, and omissions from, the report. Nothing contained herein is intended to be or should be read as any regulatory, legal, tax, accounting or other advice and Compass does not provide such advice. All opinions are subject to change without notice. Compass makes no representation regarding the accuracy of any statements regarding any references to the laws, statutes or regulations of any state are those of the author(s). Past performance is no guarantee of future results.

San Mateo County Real Estate, April 2023

The Market Continues to Recover, But with Many Dynamics at Play

Buyer demand continued to rebound from the depths of the mid-winter slowdown: The number and percentage of listings going into contract, and overbidding percentages continued to climb, and days-on-market to drop as the spring selling season gained traction. Buyers generally shrugged off the local banking crisis, the main effect of which, so far, has been a significant drop in interest rates in the 4 weeks after SVB collapsed.

But though conditions have improved considerably, the market remains significantly weaker on a year-over-year basis, and across the Bay Area, median home sales prices have generally declined. However, it’s worth remembering that the market in Q1 2022 was severely overheated, and approaching the peak of a historic, 10-year boom. This will distort many year-over-year comparisons.
The number of new listings coming on market continues to be extremely low, as many potential sellers hold off from listing their homes due to the doubling of interest rates since early 2022: This constitutes a huge factor in market dynamics and is undoubtedly holding back sales activity.

Across the Bay Area, year-over-year sales declines in the highest price segments have outpaced drops for less expensive homes, and their demand-to-supply ratio – the number of sales compared to the number of listings for sale – is much weaker. Luxury home sales have been hit harder since the market correction began in mid-2022, though they too have been rebounding in 2023.

April, May & June sales volumes are commonly among the highest of the year, and this is especially true for luxury home sales.

Report created in good faith with data from sources deemed reliable, but may contain errors and subject to revision. All numbers approximate, and may change with late-reported activity.

Statistics are generalities, essentially summaries of widely disparate data generated by dozens, hundreds or thousands of unique, individual sales occurring within different time periods. They are best seen not as precise measurements, but as broad, comparative indicators, with reasonable margins of error. Anomalous fluctuations in statistics are not uncommon, especially in smaller, expensive market segments. Last period data should be considered estimates that may change with late-reported data. Different analytics programs sometimes define statistics – such as “active listings,” “days on market,” and “months supply of inventory” – differently: what is most meaningful are not specific calculations but the trends they illustrate. Most listing and sales data derives from the local or regional multi-listing service (MLS) of the area specified in the analysis, but not all listings or sales are reported to MLS and these won’t be reflected in the data. “Homes” signifies real-property, single-household housing units: houses, condos, co-ops, townhouses, duets and TICs (but not mobile homes), as applicable to each market. City/town names refer specifically to the named cities and towns, unless otherwise delineated. Multi-county metro areas will be specified as such. Data from sources deemed reliable, but may contain errors and subject to revision. All numbers to be considered approximate.

Many aspects of value cannot be adequately reflected in median and average statistics: curb appeal, age, condition, amenities, views, lot size, quality of outdoor space, “bonus” rooms, additional parking, quality of location within the neighborhood, and so on. How any of these statistics apply to any particular home is unknown without a specific comparative market analysis. Median Sales Price is that price at which half the properties sold for more and half for less. It may be affected by seasonality, “unusual” events, or changes in inventory and buying trends, as well as by changes in fair market value. The median sales price for an area will often conceal an enormous variety of sales prices in the underlying individual sales.
Dollar per Square Foot is based upon the home’s interior living space and does not include garages, unfinished attics and basements, rooms built without permit, patios, decks or yards (though all those can add value to a home). These figures are usually derived from appraisals or tax records, but are sometimes unreliable (especially for older homes) or unreported altogether. The calculation can only be made on those home sales that reported square footage.

Compass is a real estate broker licensed by the State of California, DRE 01527235. Equal Housing Opportunity. This report has been prepared solely for information purposes. The information herein is based on or derived from information generally available to the public and/or from sources believed to be reliable. No representation or warranty can be given with respect to the accuracy or completeness of the information. Compass disclaims any and all liability relating to this report, including without limitation any express or implied representations or warranties for statements contained in, and omissions from, the report. Nothing contained herein is intended to be or should be read as any regulatory, legal, tax, accounting or other advice and Compass does not provide such advice. All opinions are subject to change without notice. Compass makes no representation regarding the accuracy of any statements regarding any references to the laws, statutes or regulations of any state are those of the author(s). Past performance is no guarantee of future results.

Santa Clara County Real Estate, April 2023

The Market Continues to Recover, But with Many Dynamics at Play

Buyer demand continued to rebound from the depths of the mid-winter slowdown: The number and percentage of listings going into contract, and overbidding percentages continued to climb, and days-on-market to drop as the spring selling season gained traction. Buyers generally shrugged off the local banking crisis, the main effect of which, so far, has been a significant drop in interest rates in the 4 weeks after SVB collapsed.

But though conditions have improved considerably, the market remains significantly weaker on a year-over-year basis, and across the Bay Area, median home sales prices have generally declined. However, it’s worth remembering that the market in Q1 2022 was severely overheated, and approaching the peak of a historic, 10-year boom. This will distort many year-over-year comparisons.
The number of new listings coming on market continues to be extremely low, as many potential sellers hold off from listing their homes due to the doubling of interest rates since early 2022: This constitutes a huge factor in market dynamics and is undoubtedly holding back sales activity.

Across the Bay Area, year-over-year sales declines in the highest price segments have outpaced drops for less expensive homes, and their demand-to-supply ratio – the number of sales compared to the number of listings for sale – is much weaker. Luxury home sales have been hit harder since the market correction began in mid-2022, though they too have been rebounding in 2023.

April, May & June sales volumes are commonly among the highest of the year, and this is especially true for luxury home sales.

Report created in good faith with data from sources deemed reliable, but may contain errors and subject to revision. All numbers approximate, and may change with late-reported activity.

Statistics are generalities, essentially summaries of widely disparate data generated by dozens, hundreds or thousands of unique, individual sales occurring within different time periods. They are best seen not as precise measurements, but as broad, comparative indicators, with reasonable margins of error. Anomalous fluctuations in statistics are not uncommon, especially in smaller, expensive market segments. Last period data should be considered estimates that may change with late-reported data. Different analytics programs sometimes define statistics – such as “active listings,” “days on market,” and “months supply of inventory” – differently: what is most meaningful are not specific calculations but the trends they illustrate. Most listing and sales data derives from the local or regional multi-listing service (MLS) of the area specified in the analysis, but not all listings or sales are reported to MLS and these won’t be reflected in the data. “Homes” signifies real-property, single-household housing units: houses, condos, co-ops, townhouses, duets and TICs (but not mobile homes), as applicable to each market. City/town names refer specifically to the named cities and towns, unless otherwise delineated. Multi-county metro areas will be specified as such. Data from sources deemed reliable, but may contain errors and subject to revision. All numbers to be considered approximate.

Many aspects of value cannot be adequately reflected in median and average statistics: curb appeal, age, condition, amenities, views, lot size, quality of outdoor space, “bonus” rooms, additional parking, quality of location within the neighborhood, and so on. How any of these statistics apply to any particular home is unknown without a specific comparative market analysis. Median Sales Price is that price at which half the properties sold for more and half for less. It may be affected by seasonality, “unusual” events, or changes in inventory and buying trends, as well as by changes in fair market value. The median sales price for an area will often conceal an enormous variety of sales prices in the underlying individual sales.
Dollar per Square Foot is based upon the home’s interior living space and does not include garages, unfinished attics and basements, rooms built without permit, patios, decks or yards (though all those can add value to a home). These figures are usually derived from appraisals or tax records, but are sometimes unreliable (especially for older homes) or unreported altogether. The calculation can only be made on those home sales that reported square footage.

Compass is a real estate broker licensed by the State of California, DRE 01527235. Equal Housing Opportunity. This report has been prepared solely for information purposes. The information herein is based on or derived from information generally available to the public and/or from sources believed to be reliable. No representation or warranty can be given with respect to the accuracy or completeness of the information. Compass disclaims any and all liability relating to this report, including without limitation any express or implied representations or warranties for statements contained in, and omissions from, the report. Nothing contained herein is intended to be or should be read as any regulatory, legal, tax, accounting or other advice and Compass does not provide such advice. All opinions are subject to change without notice. Compass makes no representation regarding the accuracy of any statements regarding any references to the laws, statutes or regulations of any state are those of the author(s). Past performance is no guarantee of future results.

Skip to content