CoreLogic S&P Case-Shiller Home Price Index Update, February 2022

The Index is published 2 months after the month delineated – the December 2021 index was released 2/22/22 – and reflects a 3-month moving average. The CoreLogic S&P Case-Shiller Home Price Index does not evaluate median sales price changes, but employs its own proprietary algorithm to measure home price appreciation over time. Since its indices cover large areas with hundreds of communities of widely varying home values, the C-S chart numbers do not refer to specific prices, but instead reflect prices as compared to those prevailing in January 2000, all designated as having a consistent value of 100. A reading of 300 signifies home price appreciation of 200% since January 2000.

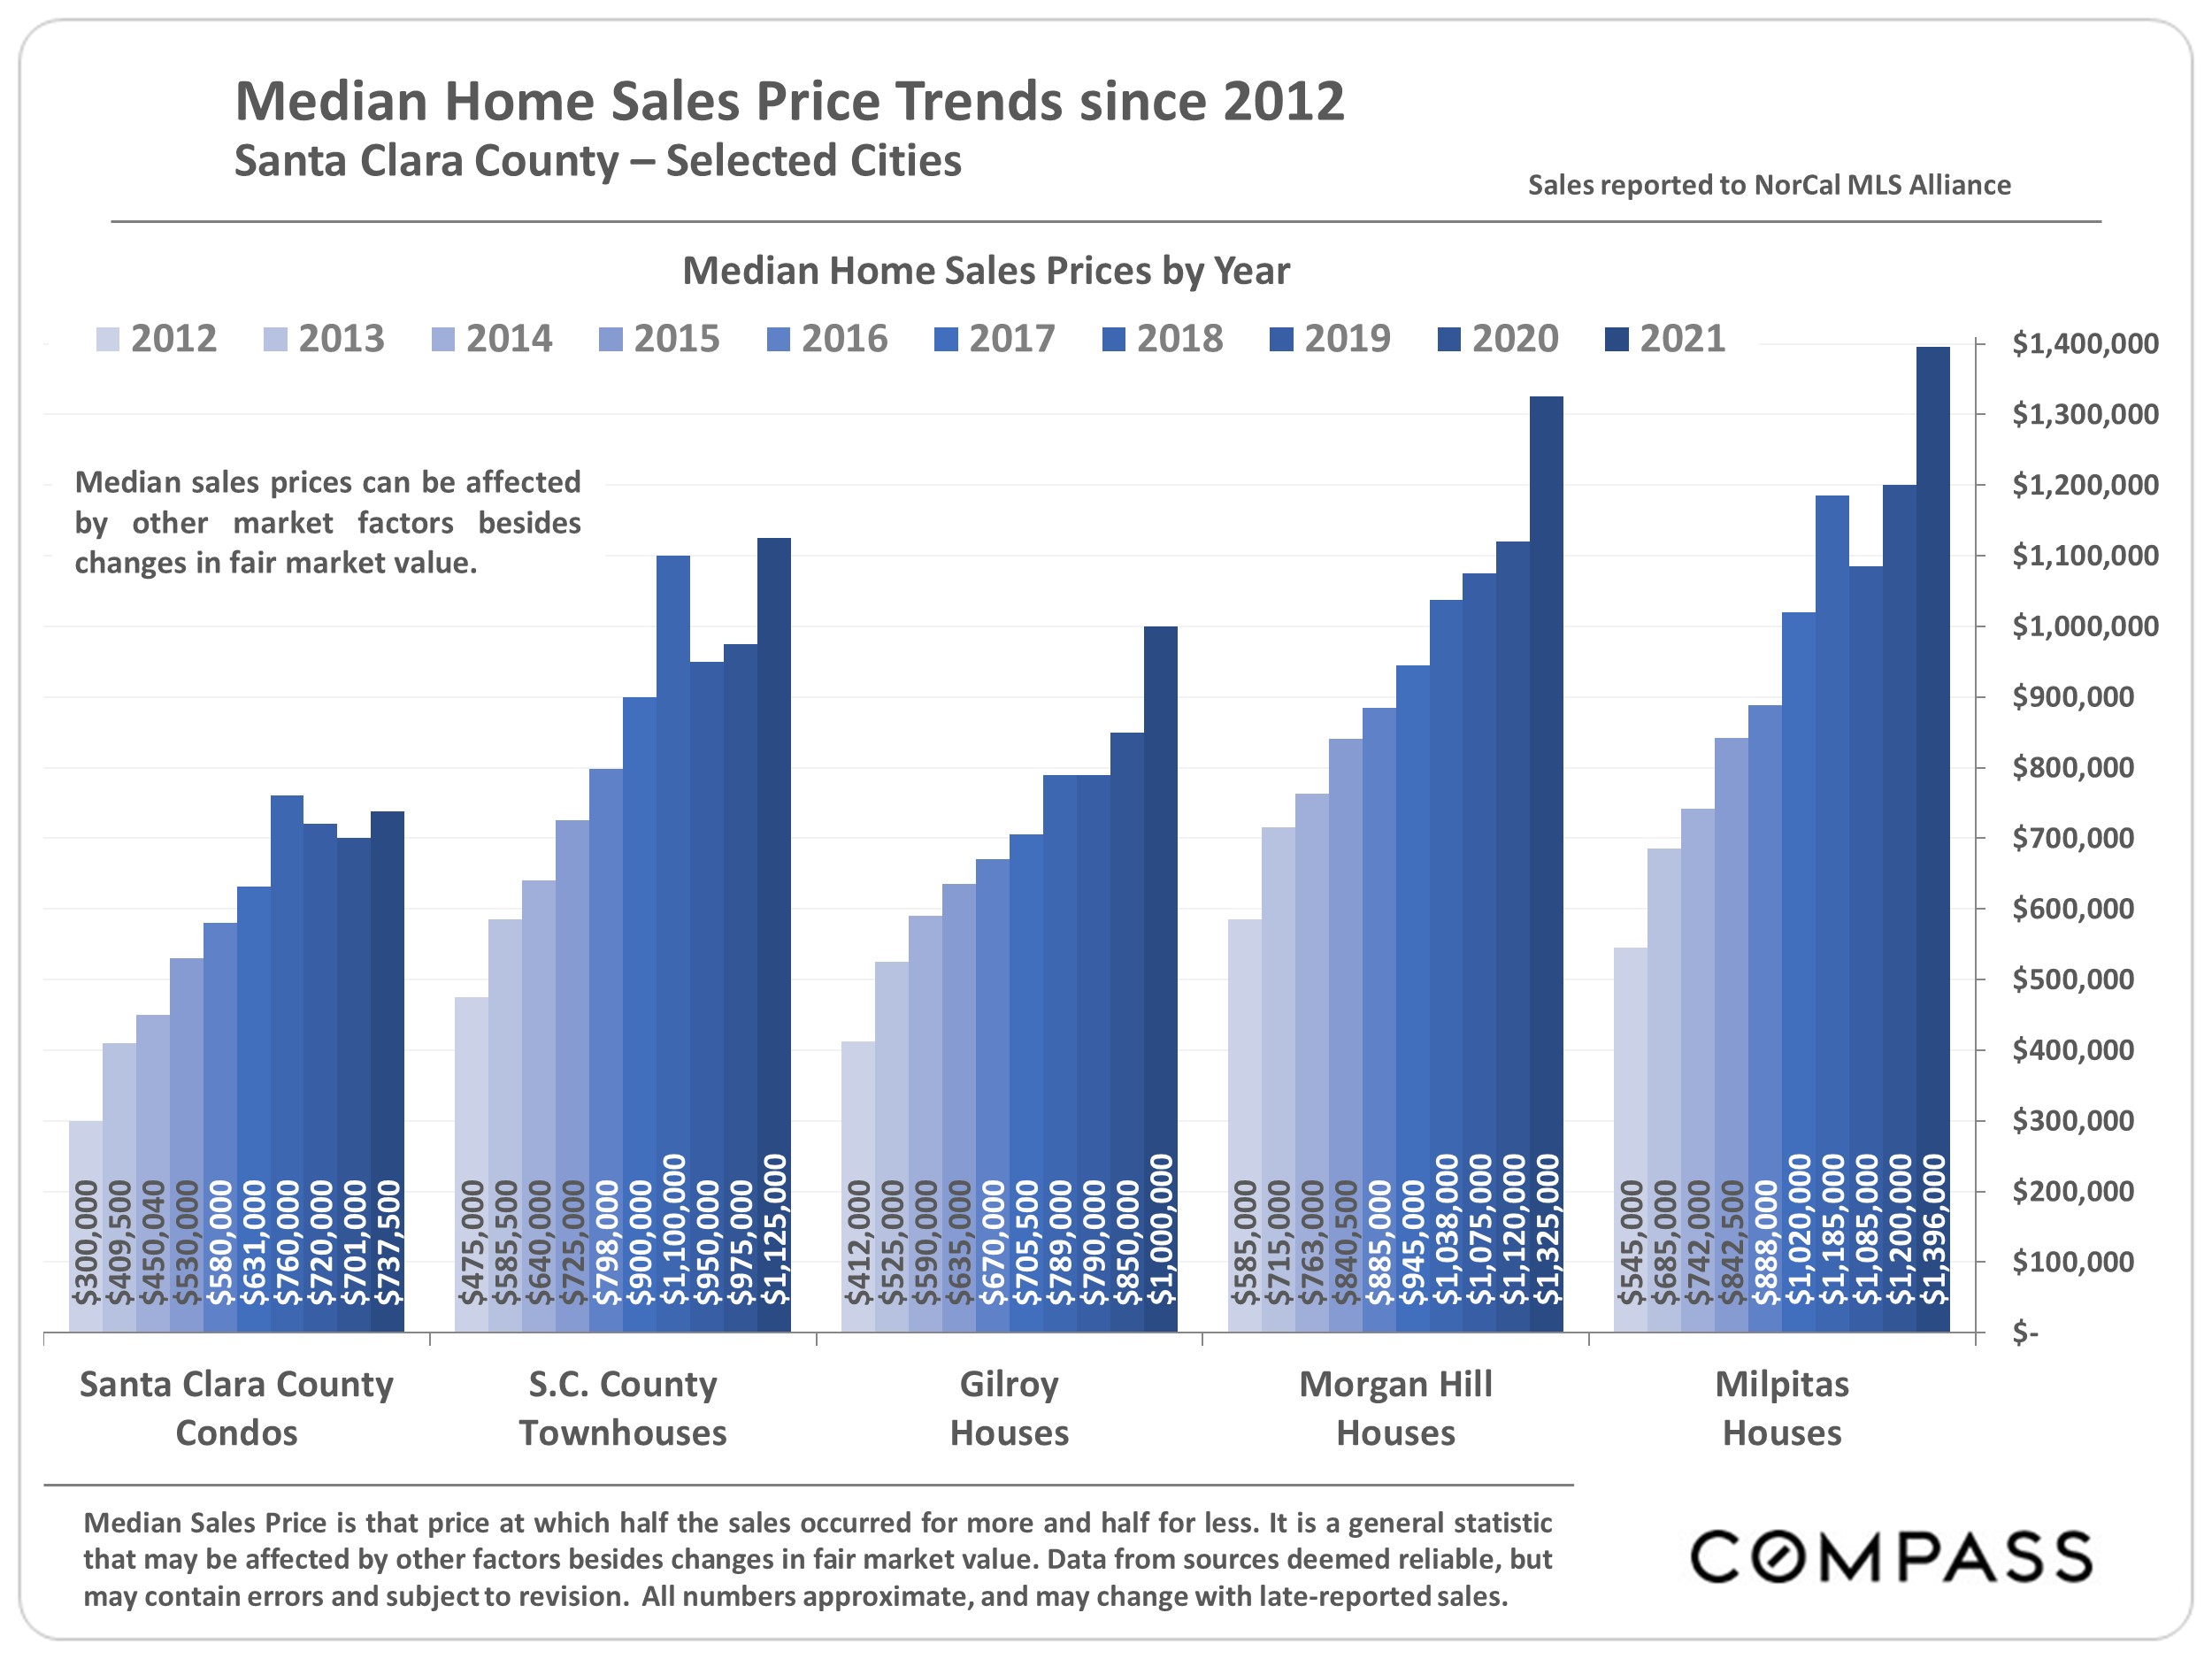
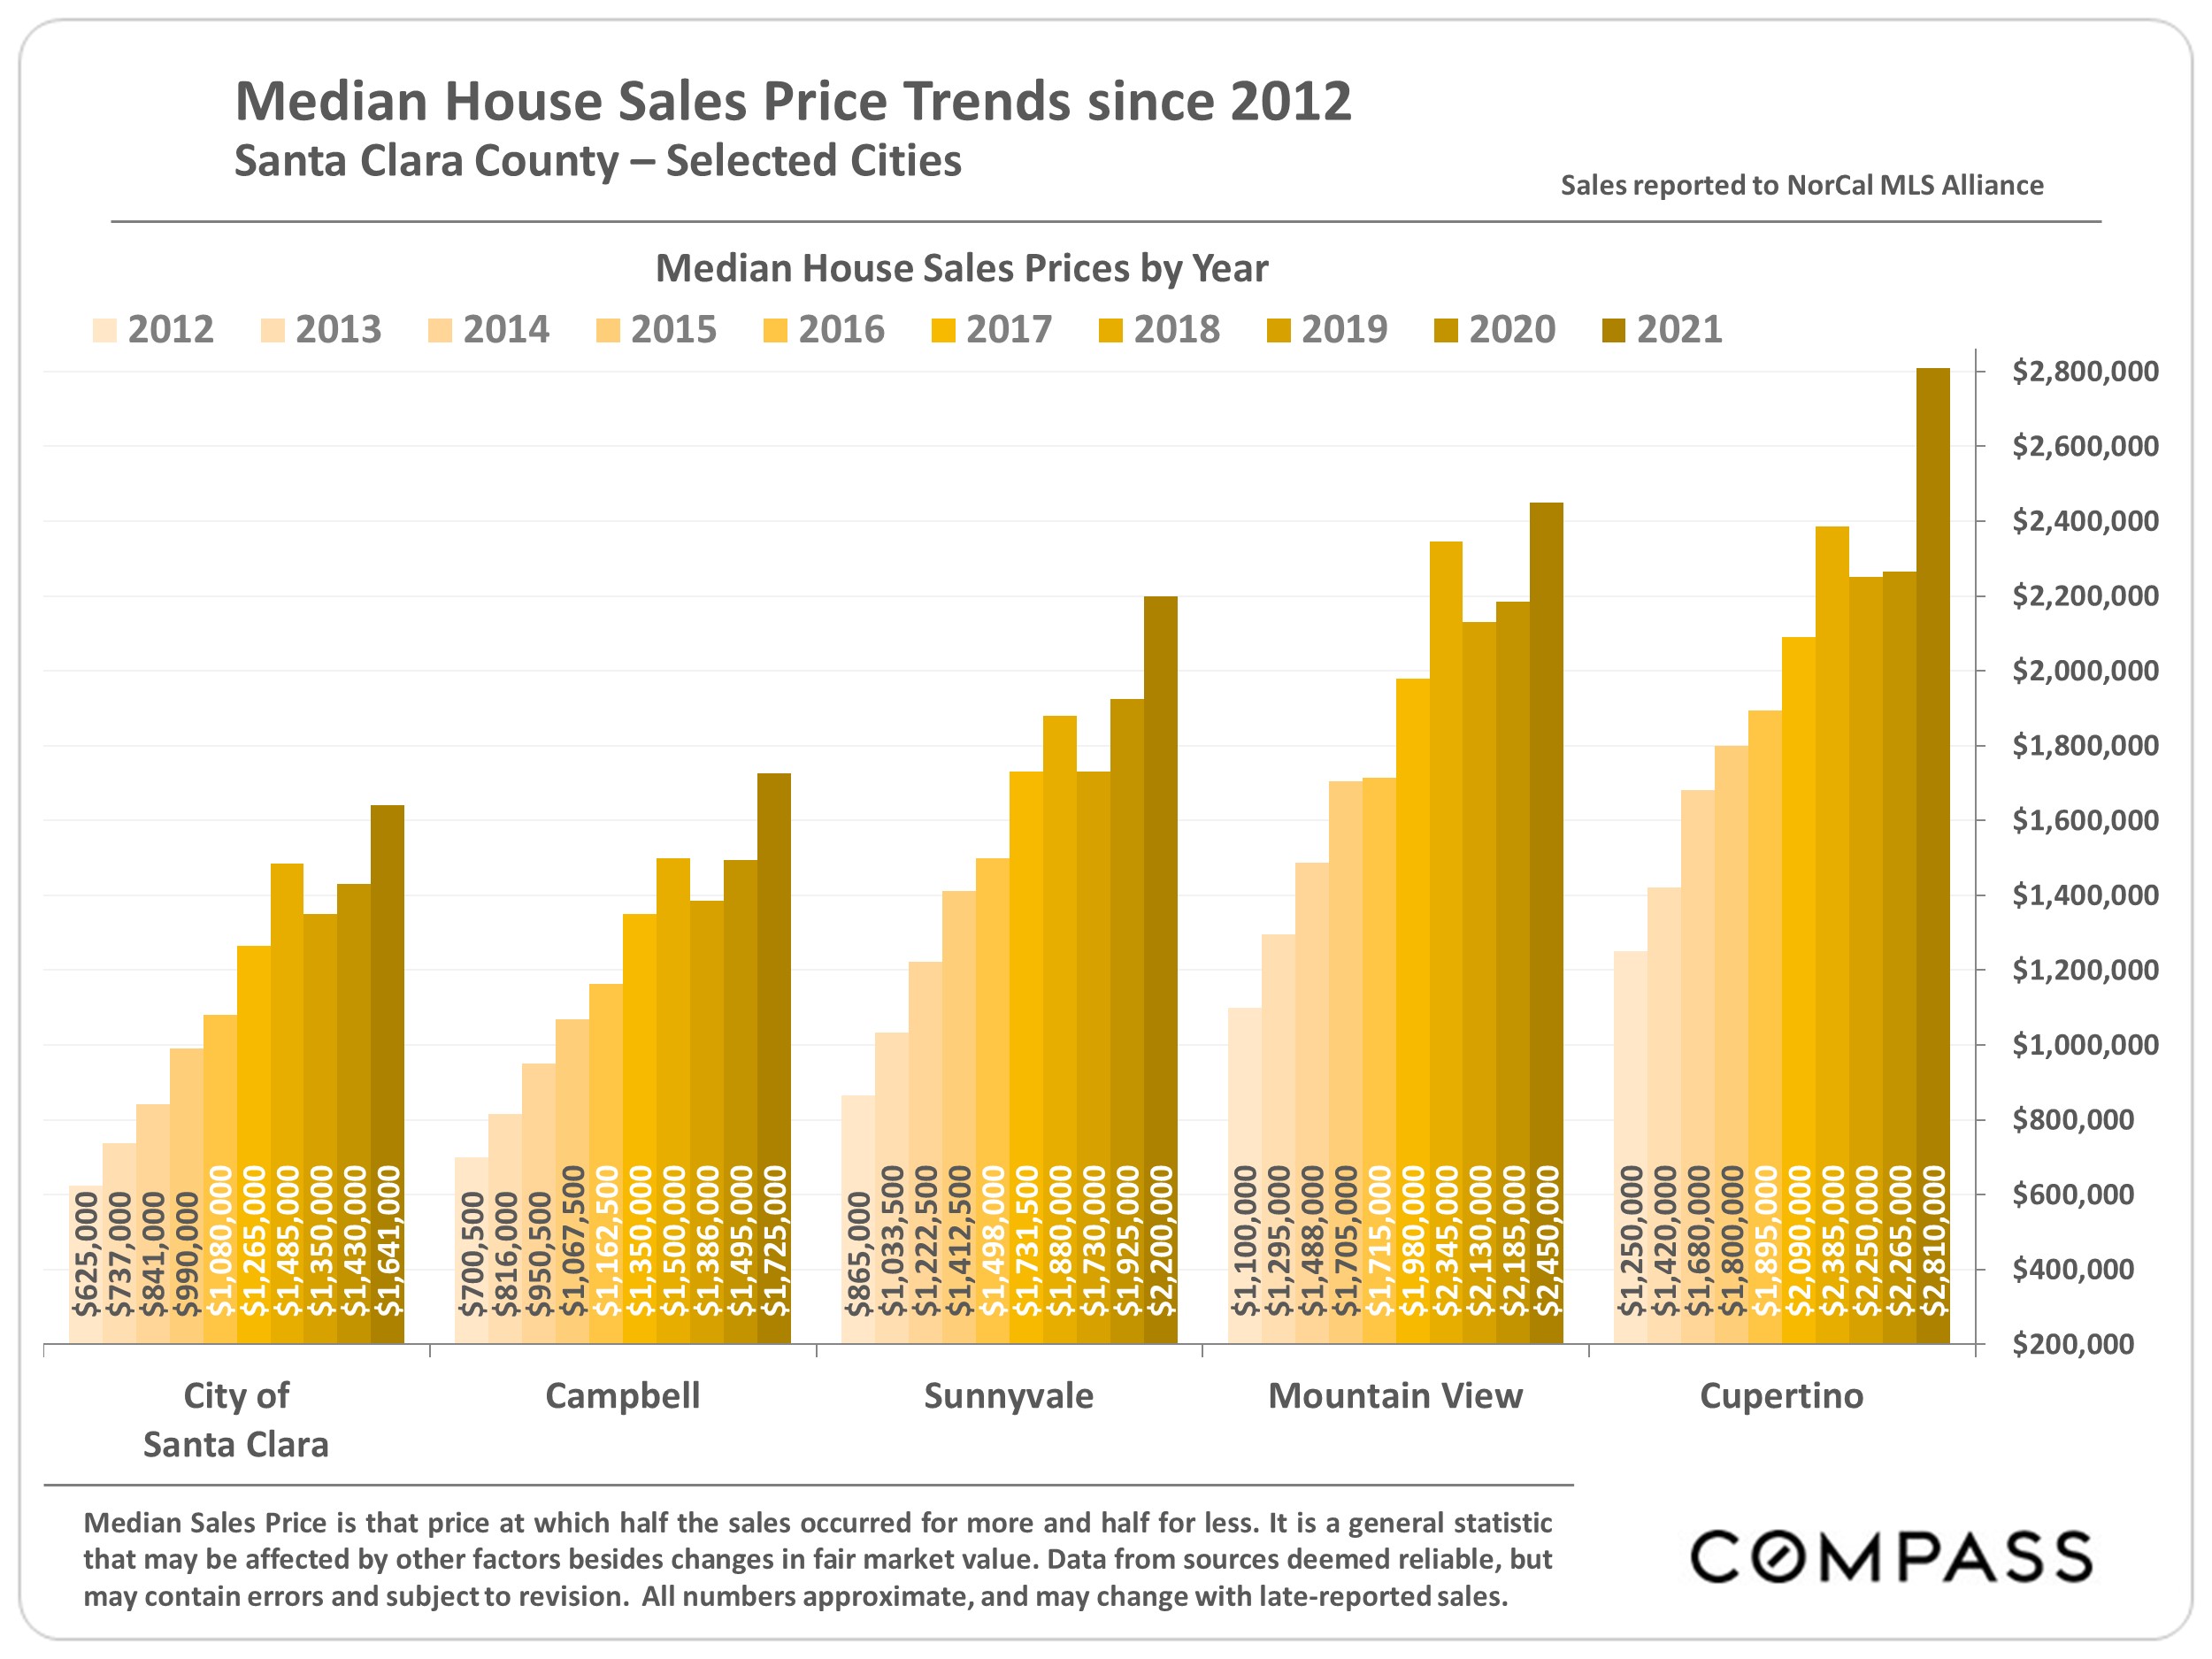
According to Case-Shiller, since the pandemic hit markets in March 2020 (through December 2021), SF Metro Area and national house values have appreciated by 27% and 29% respectively. SF Metro Area condo values increased by 6%. (This report also contains 2 charts based on annual county median sales price changes per sales reported to MLS.)

The Case-Shiller San Francisco Metro Statistical Area includes San Francisco, Marin, San Mateo, Alameda and Contra Costa Counties. (Alameda and Contra Costa have by far the greatest numbers of house sales included in the analysis.) The Index trend lines, in their ups and downs, generally apply well to other Bay Area counties as well. In northern California, Case-Shiller only tracks prices for the 5 counties of the SF Metro Area.

Case-Shiller divides all house sales into thirds, in low, mid and high price tiers: For example, the third of sales with the lowest prices is the low-price tier. The price ranges of these tiers change as the market changes. The 3 price tiers experienced dramatically different bubbles, crashes and recoveries over the past 20+ years, to a large degree determined by how badly the tier was affected by the subprime financing crisis. The low price tier was worst affected – huge subprime bubble, huge crash, most dramatic recovery – and the high-price least affected (but still significantly so). In the last 5 years, the low- and mid-price tiers have seen appreciation rates above that of the high-price tier. All Bay Area counties, to varying degrees, have sales in all 3 price tiers.

There are hundreds of unique markets in the Bay Area, with varying prices and market dynamics. C-S calculations are huge generalities summarizing many different markets: *https://www.spglobal.com/spdji/en/indices/indicators/sp-corelogic-case-shiller-san-francisco-home-price-nsa-index/#overview

These analyses were made in good faith with data from sources deemed reliable, but may contain errors and subject to revision. The CoreLogic S&P Case-Shiller Index often revises past monthly readings.

Data courtesy of S&P Dow Jones Indices LLC, CoreLogic S&P/Case-Shiller:

https://www.spglobal.com/spdji/en/indices/indicators/sp-corelogic-case-shiller-san-francisco-home-price-nsa-index/#overview

All analyses made in good-faith with data deemed reliable, but may contain errors and subject to revision. All statistics are generalities, and how the Case-Shiller Index or median home sales price calculations apply to any particular property is impossible to know without a specific comparative market analysis.

Compass is a real estate broker licensed by the State of California, DRE 01527235. Equal Housing Opportunity. This report has been prepared solely for information purposes. The information herein is based on or derived from information generally available to the public and/or from sources believed to be reliable. No representation or warranty can be given with respect to the accuracy or completeness of the information. Compass disclaims any and all liability relating to this report, including without limitation any express or implied representations or warranties for statements contained in, and omissions from, the report. Nothing contained herein is intended to be or should be read as any regulatory, legal, tax, accounting or other advice and Compass does not provide such advice. All opinions are subject to change without notice. Compass makes no representation regarding the accuracy of any statements regarding any references to the laws, statutes or regulations of any state are those of the author(s). Past performance is no guarantee
of future results.

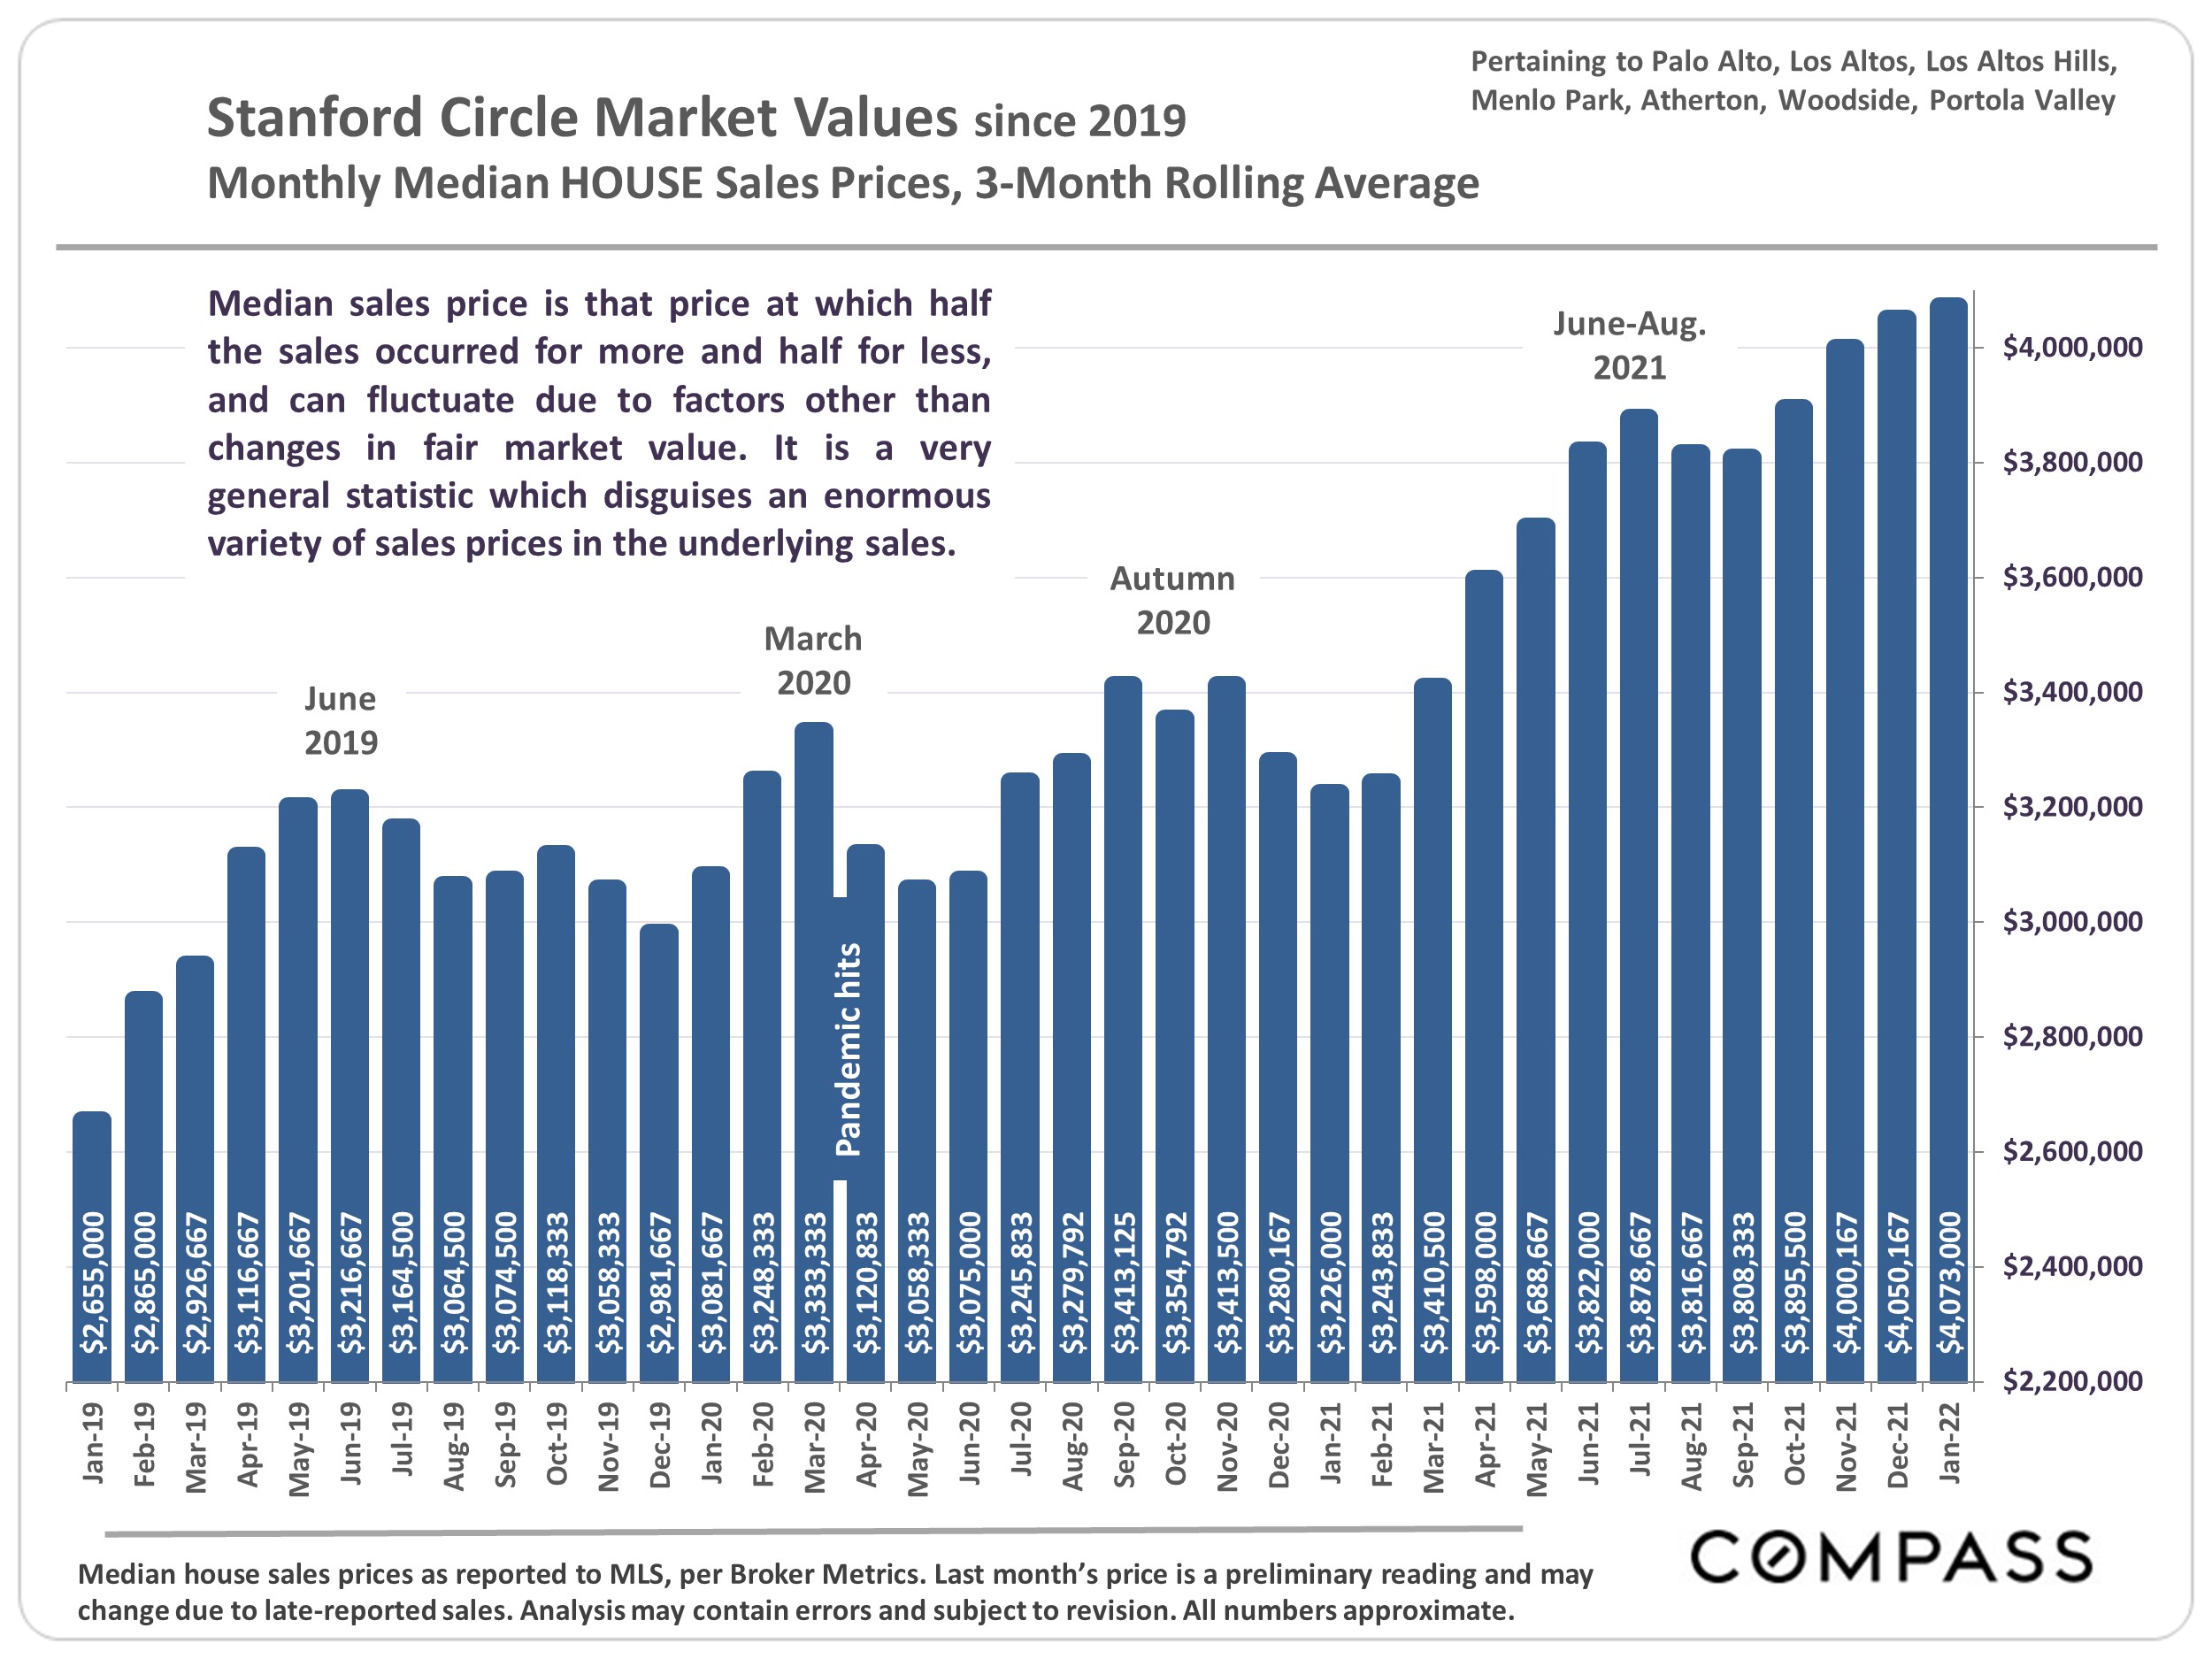
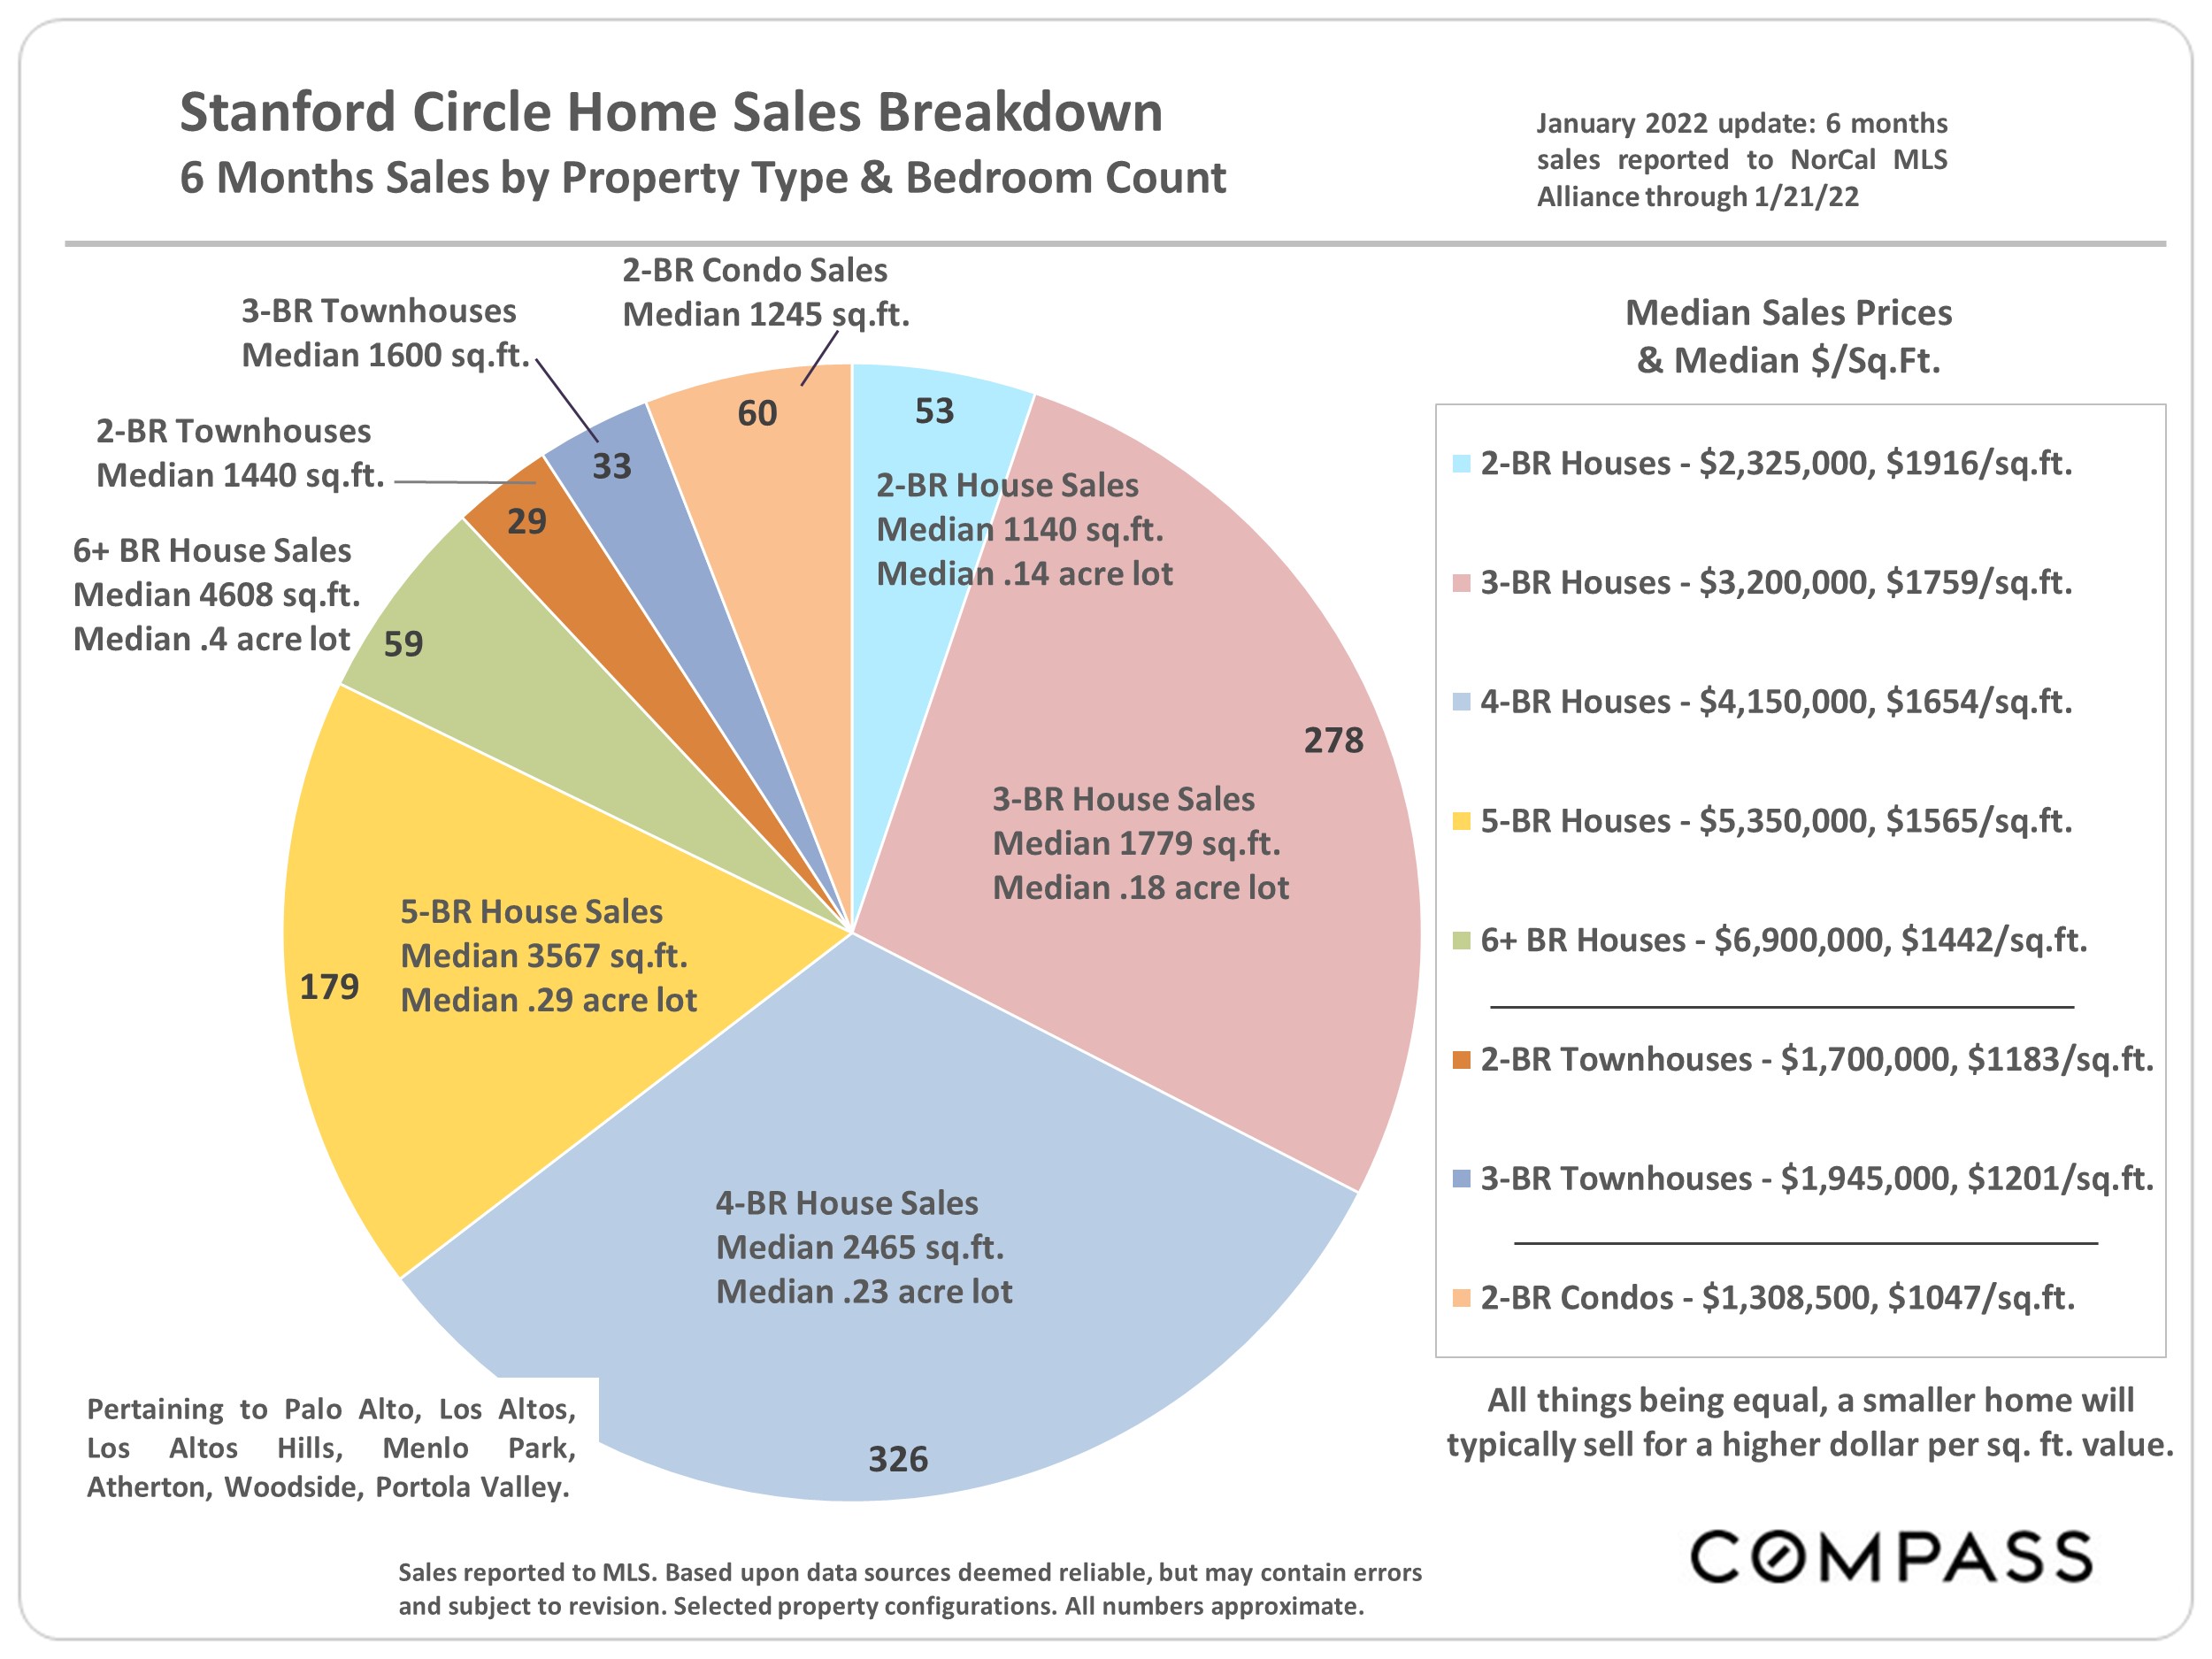
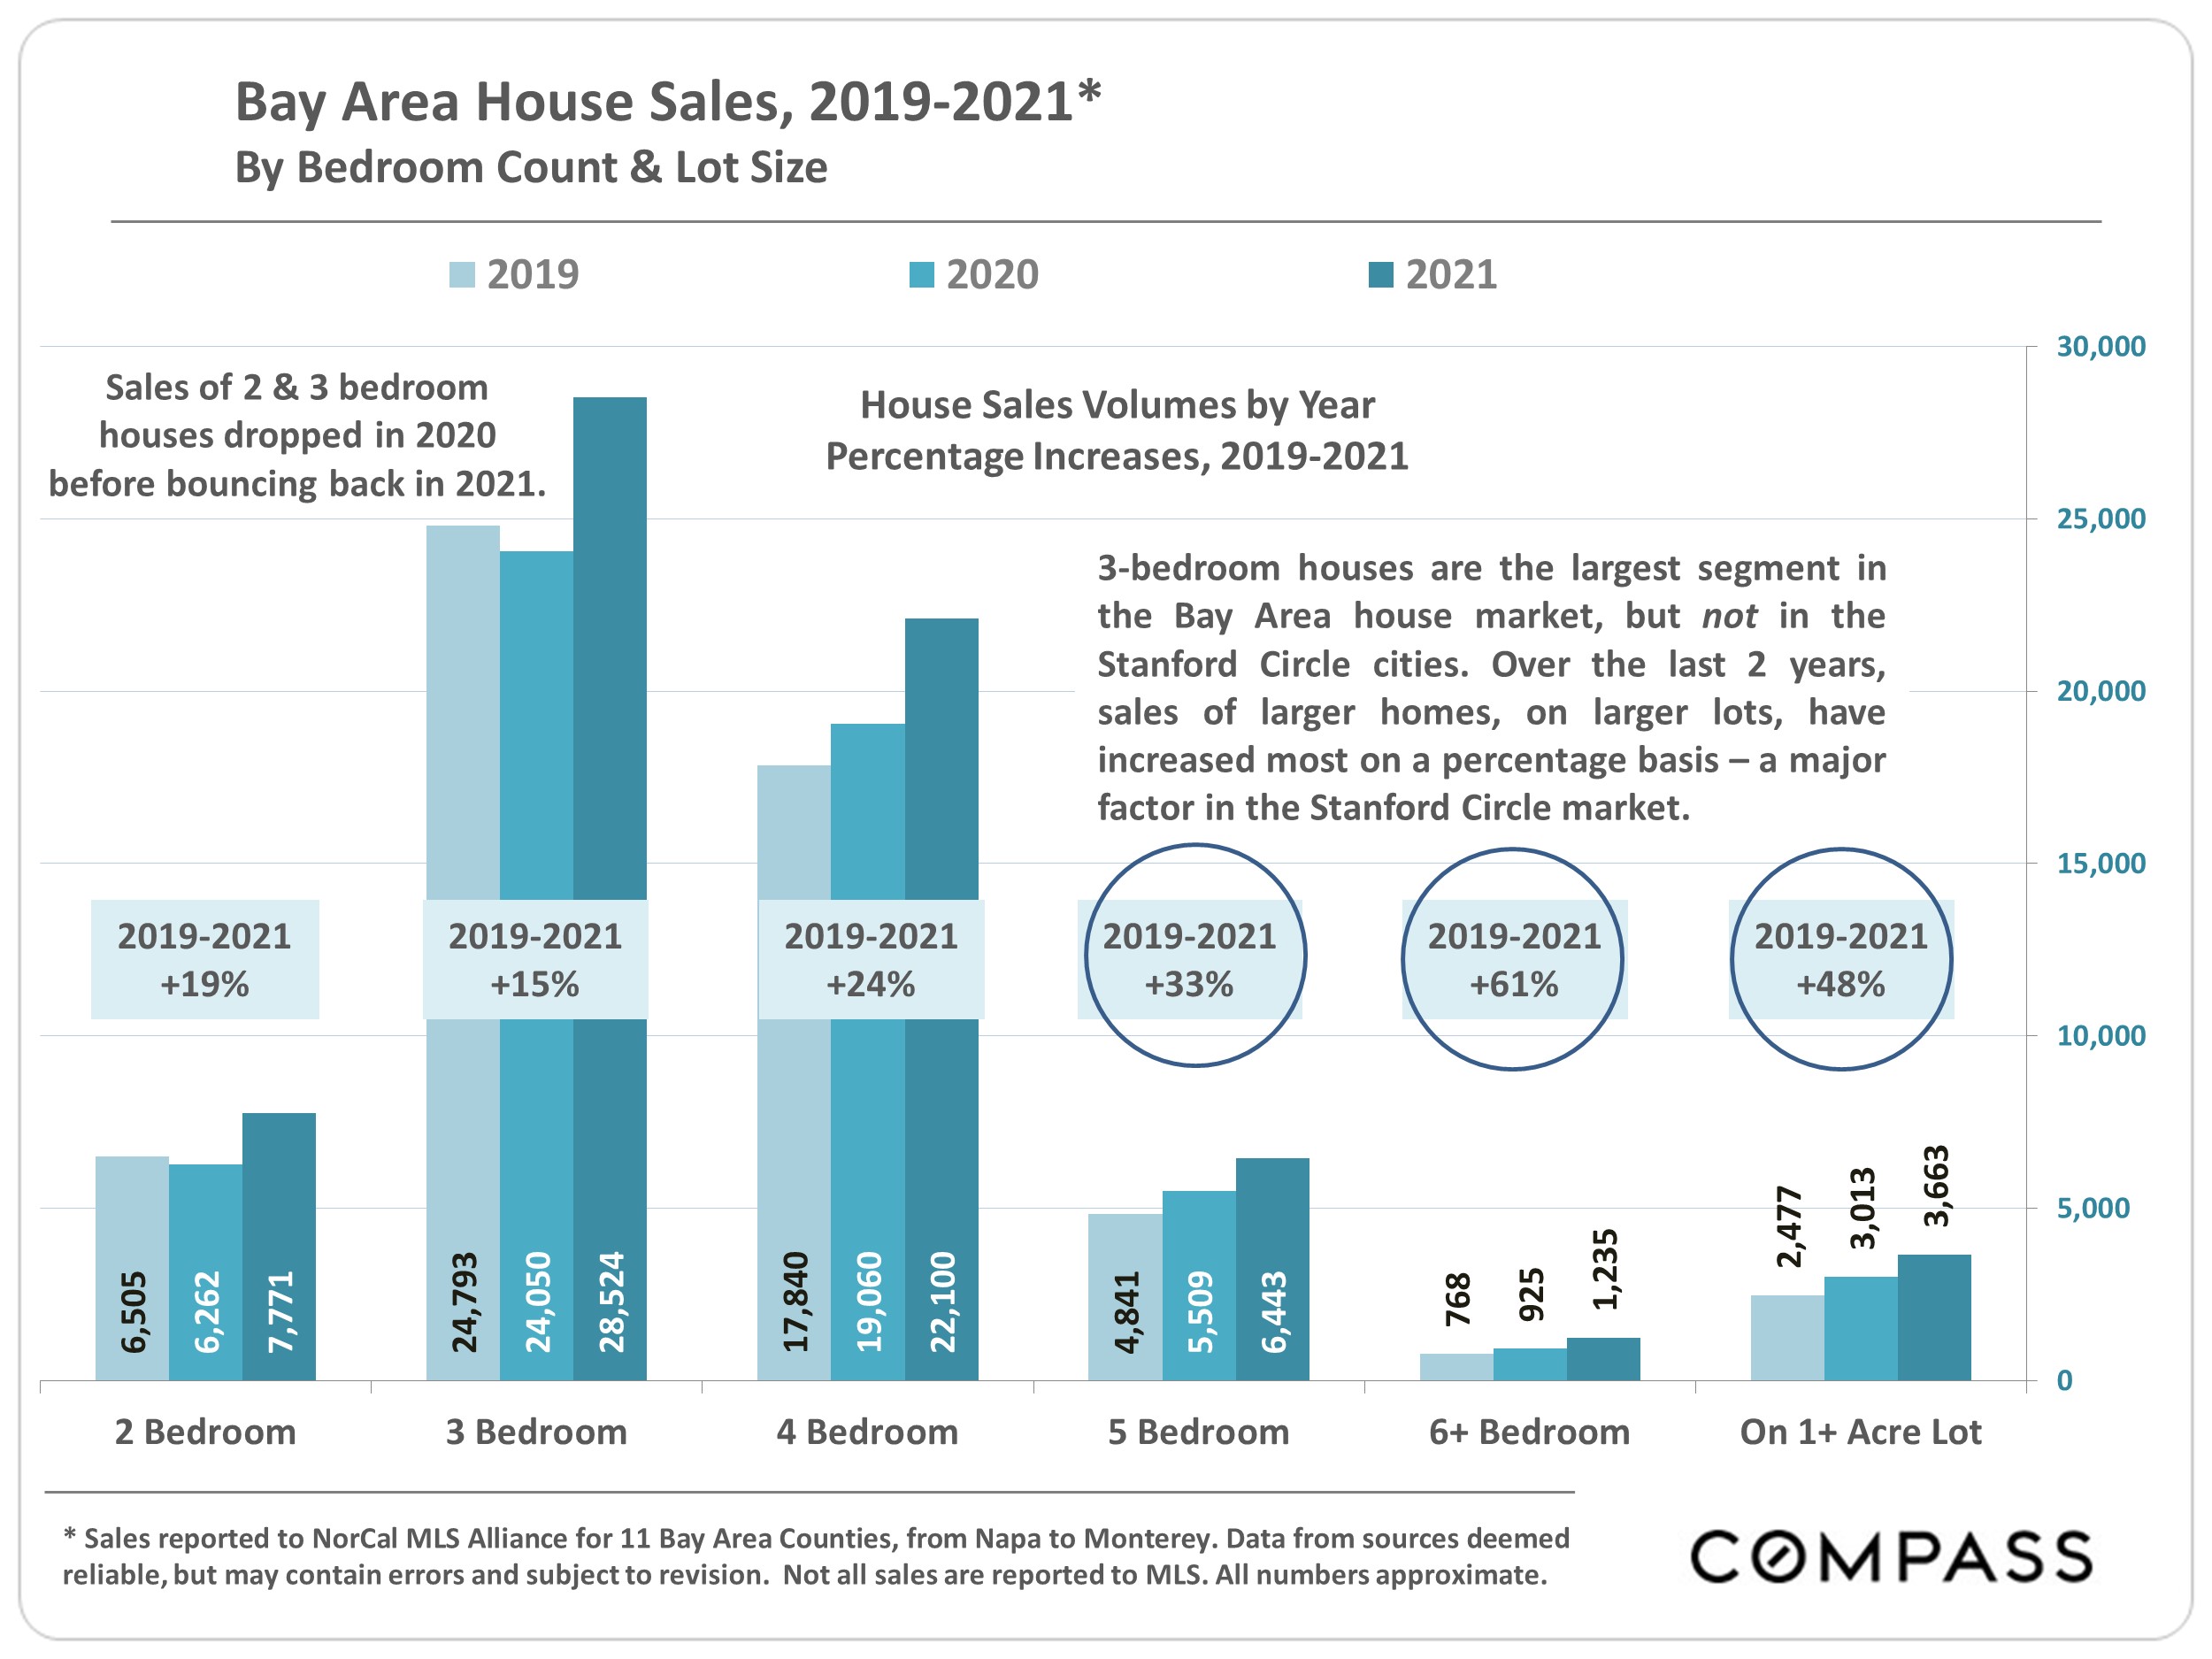
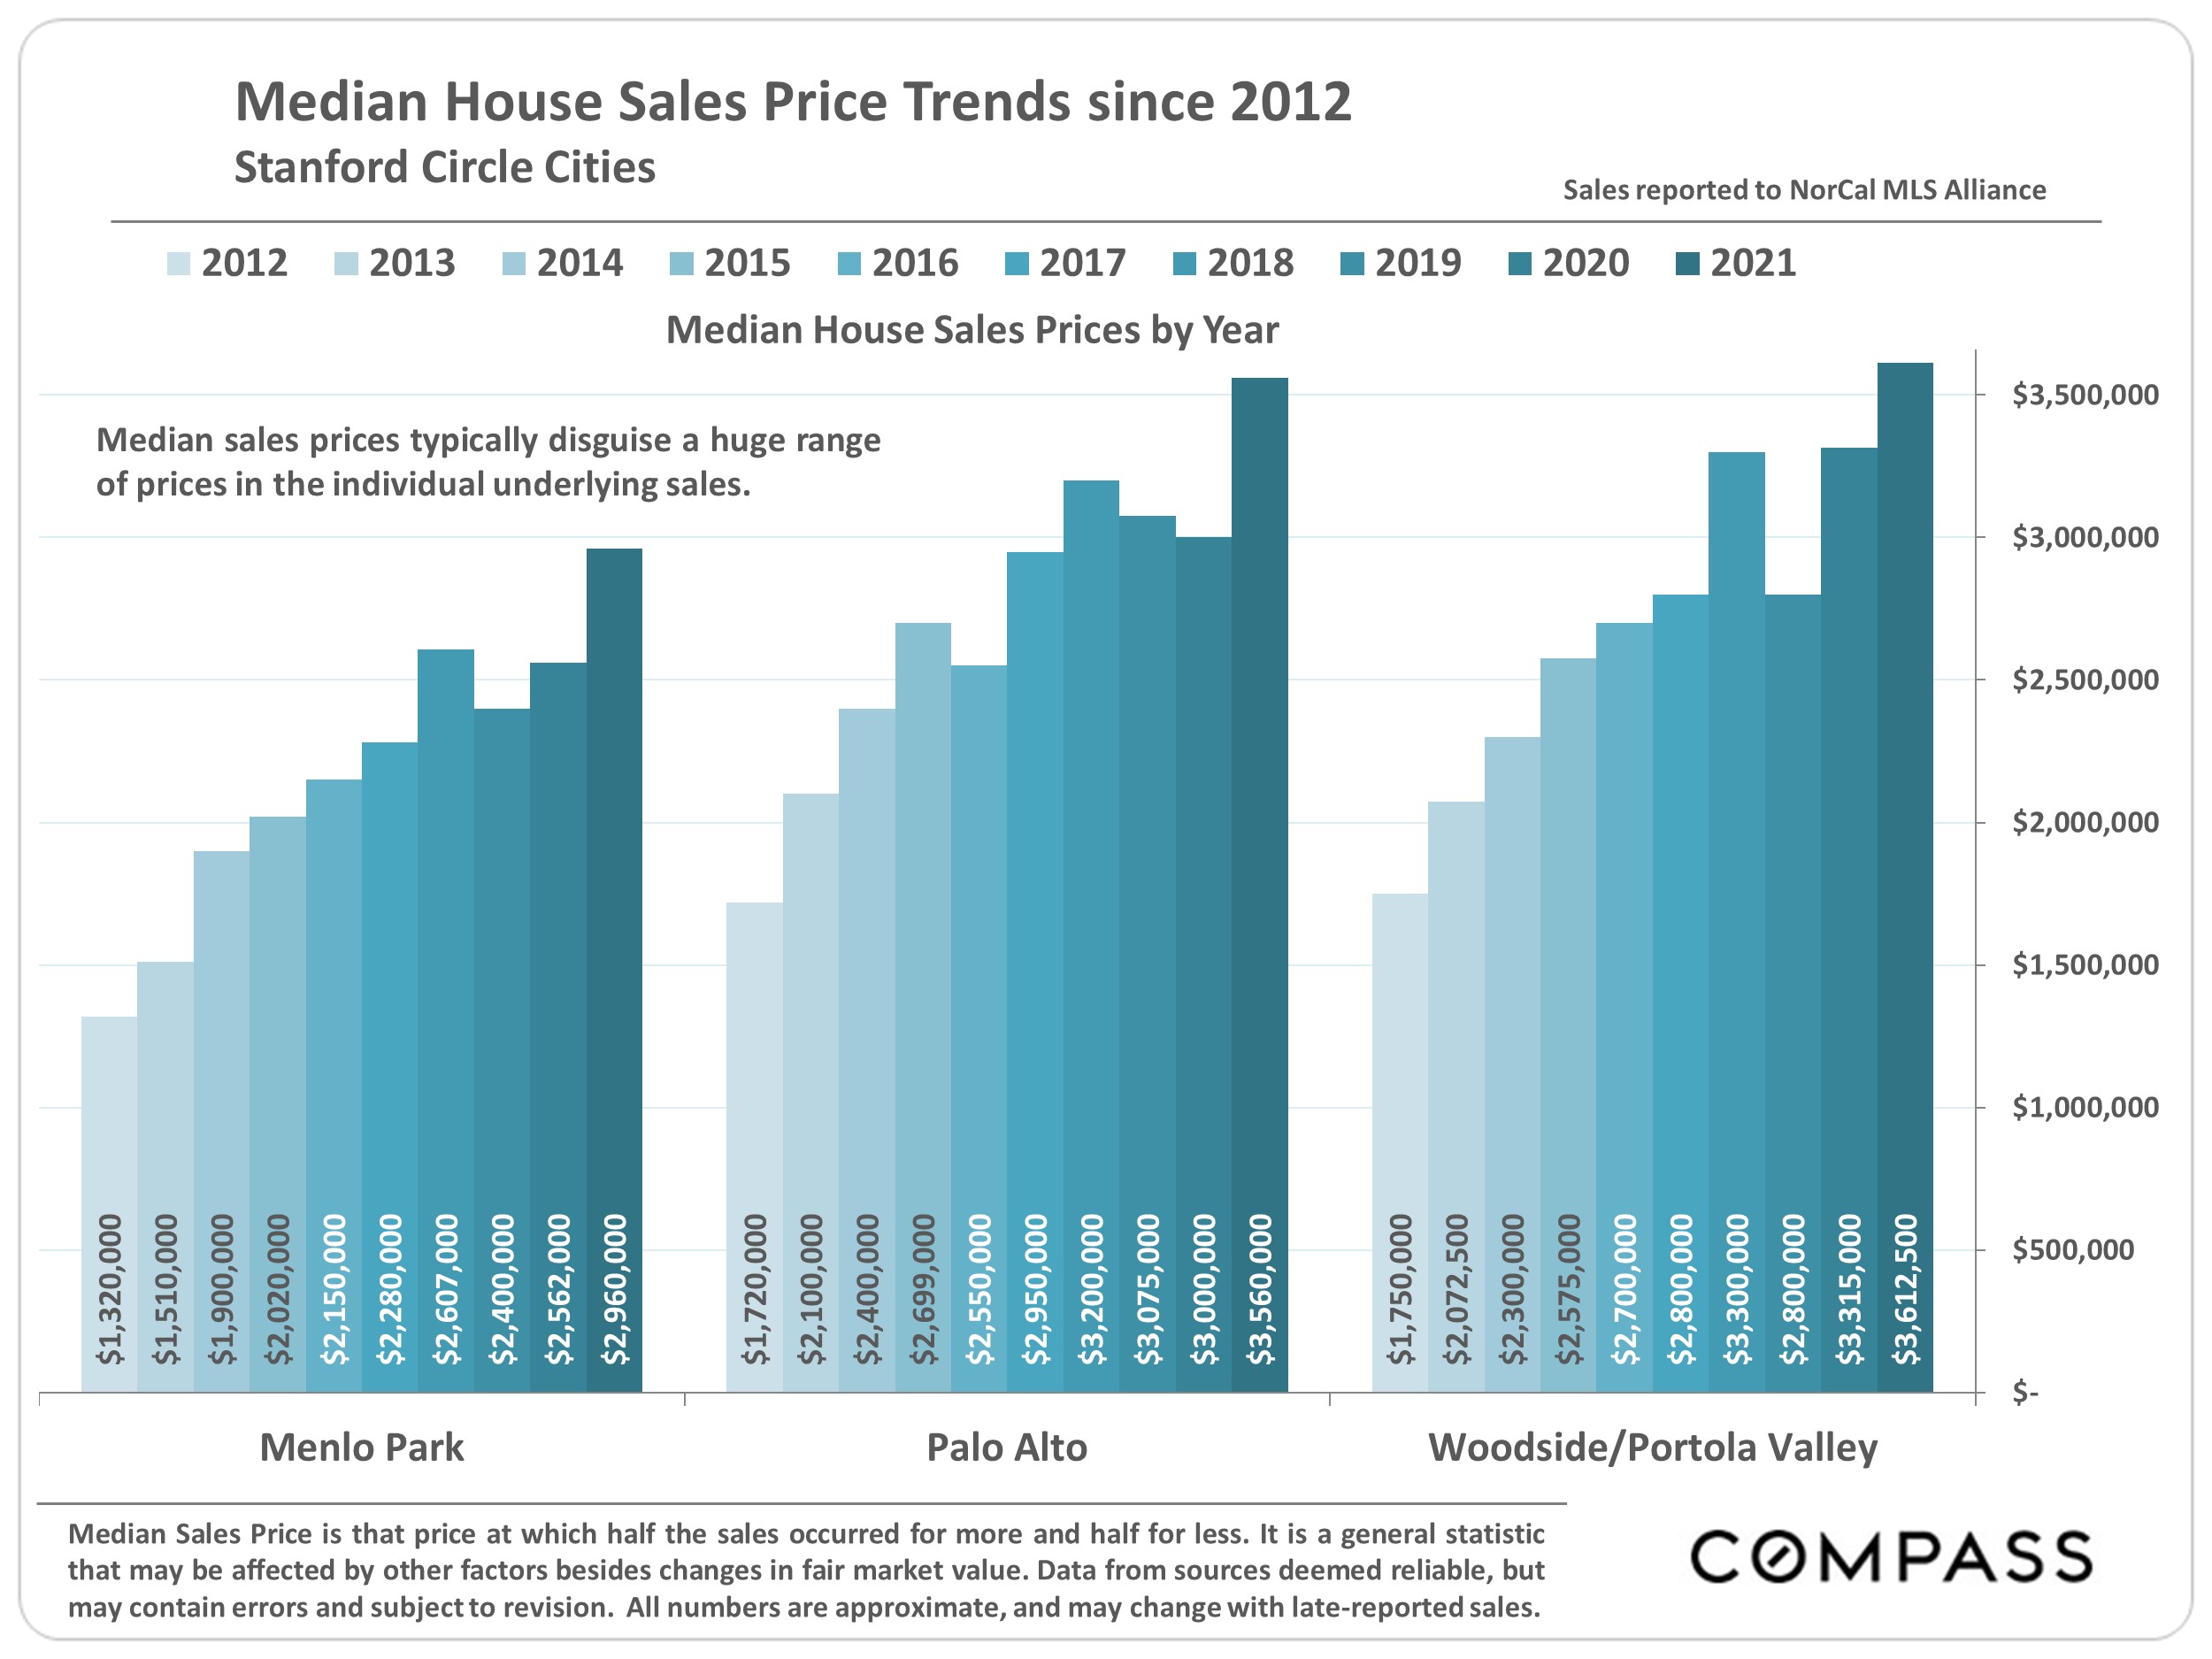
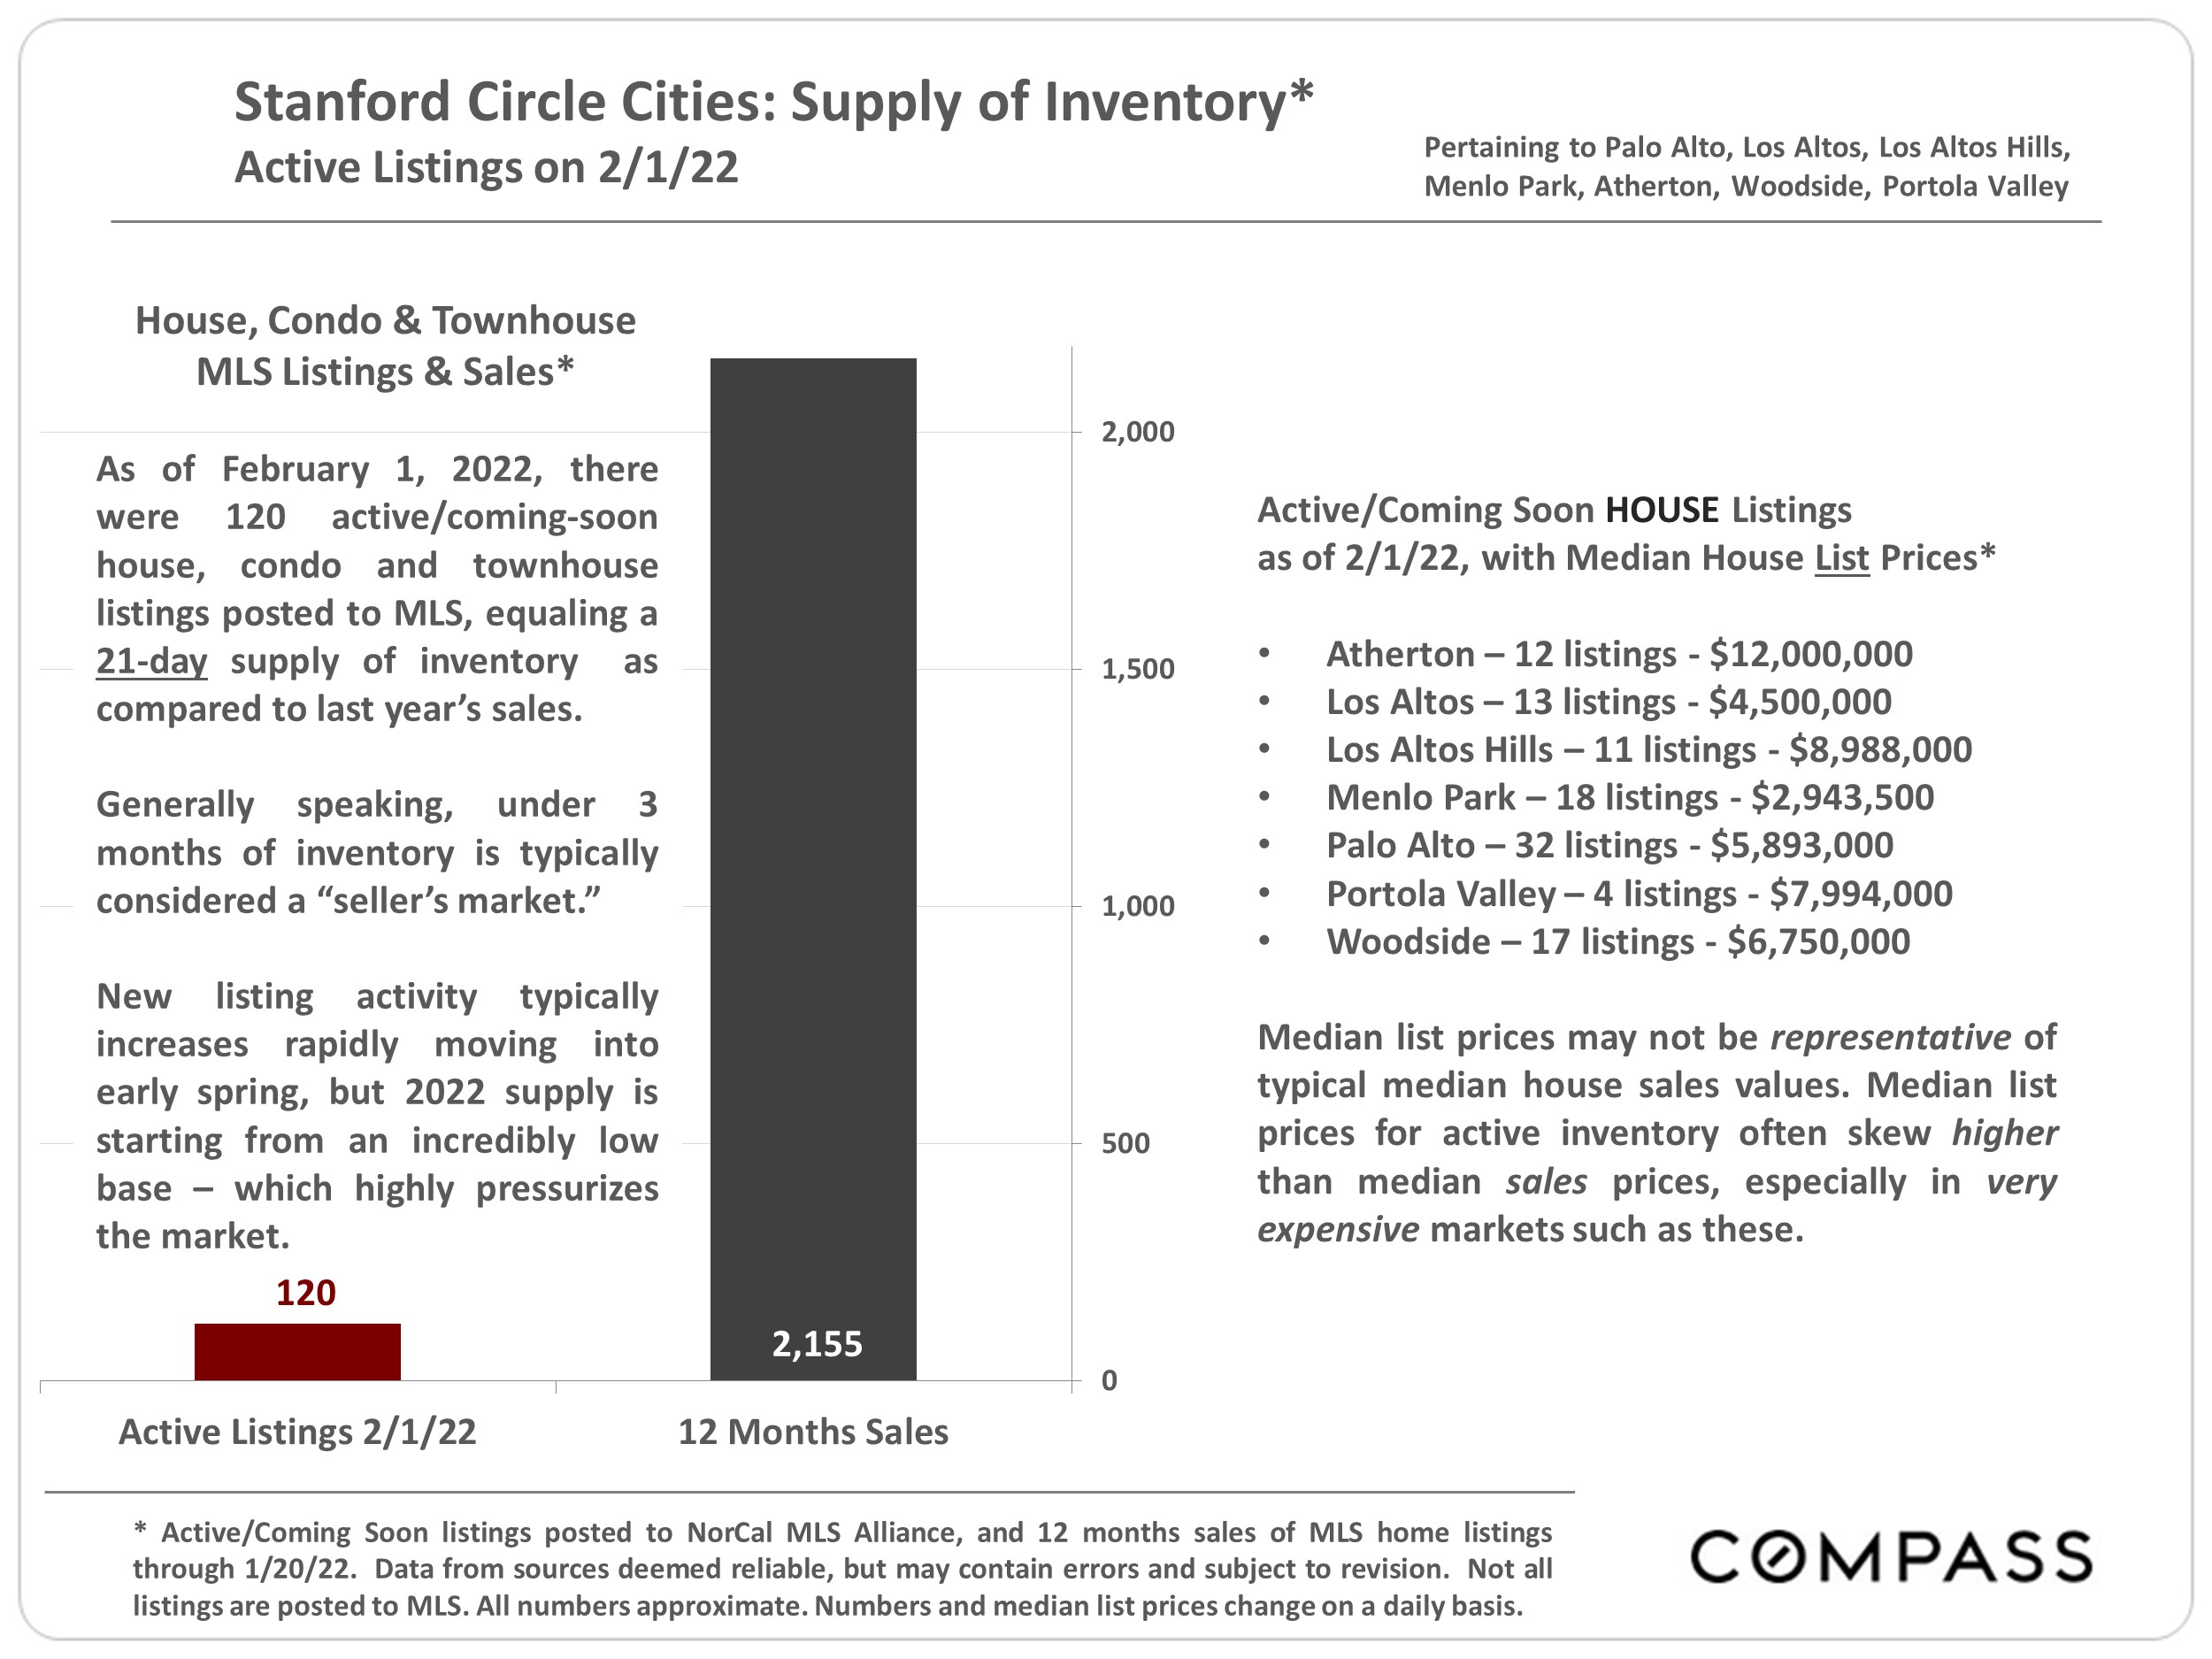
“Stanford Circle Cities” Real Estate Trends, February 2022

2022 Begins with Mixed Economic Indicators

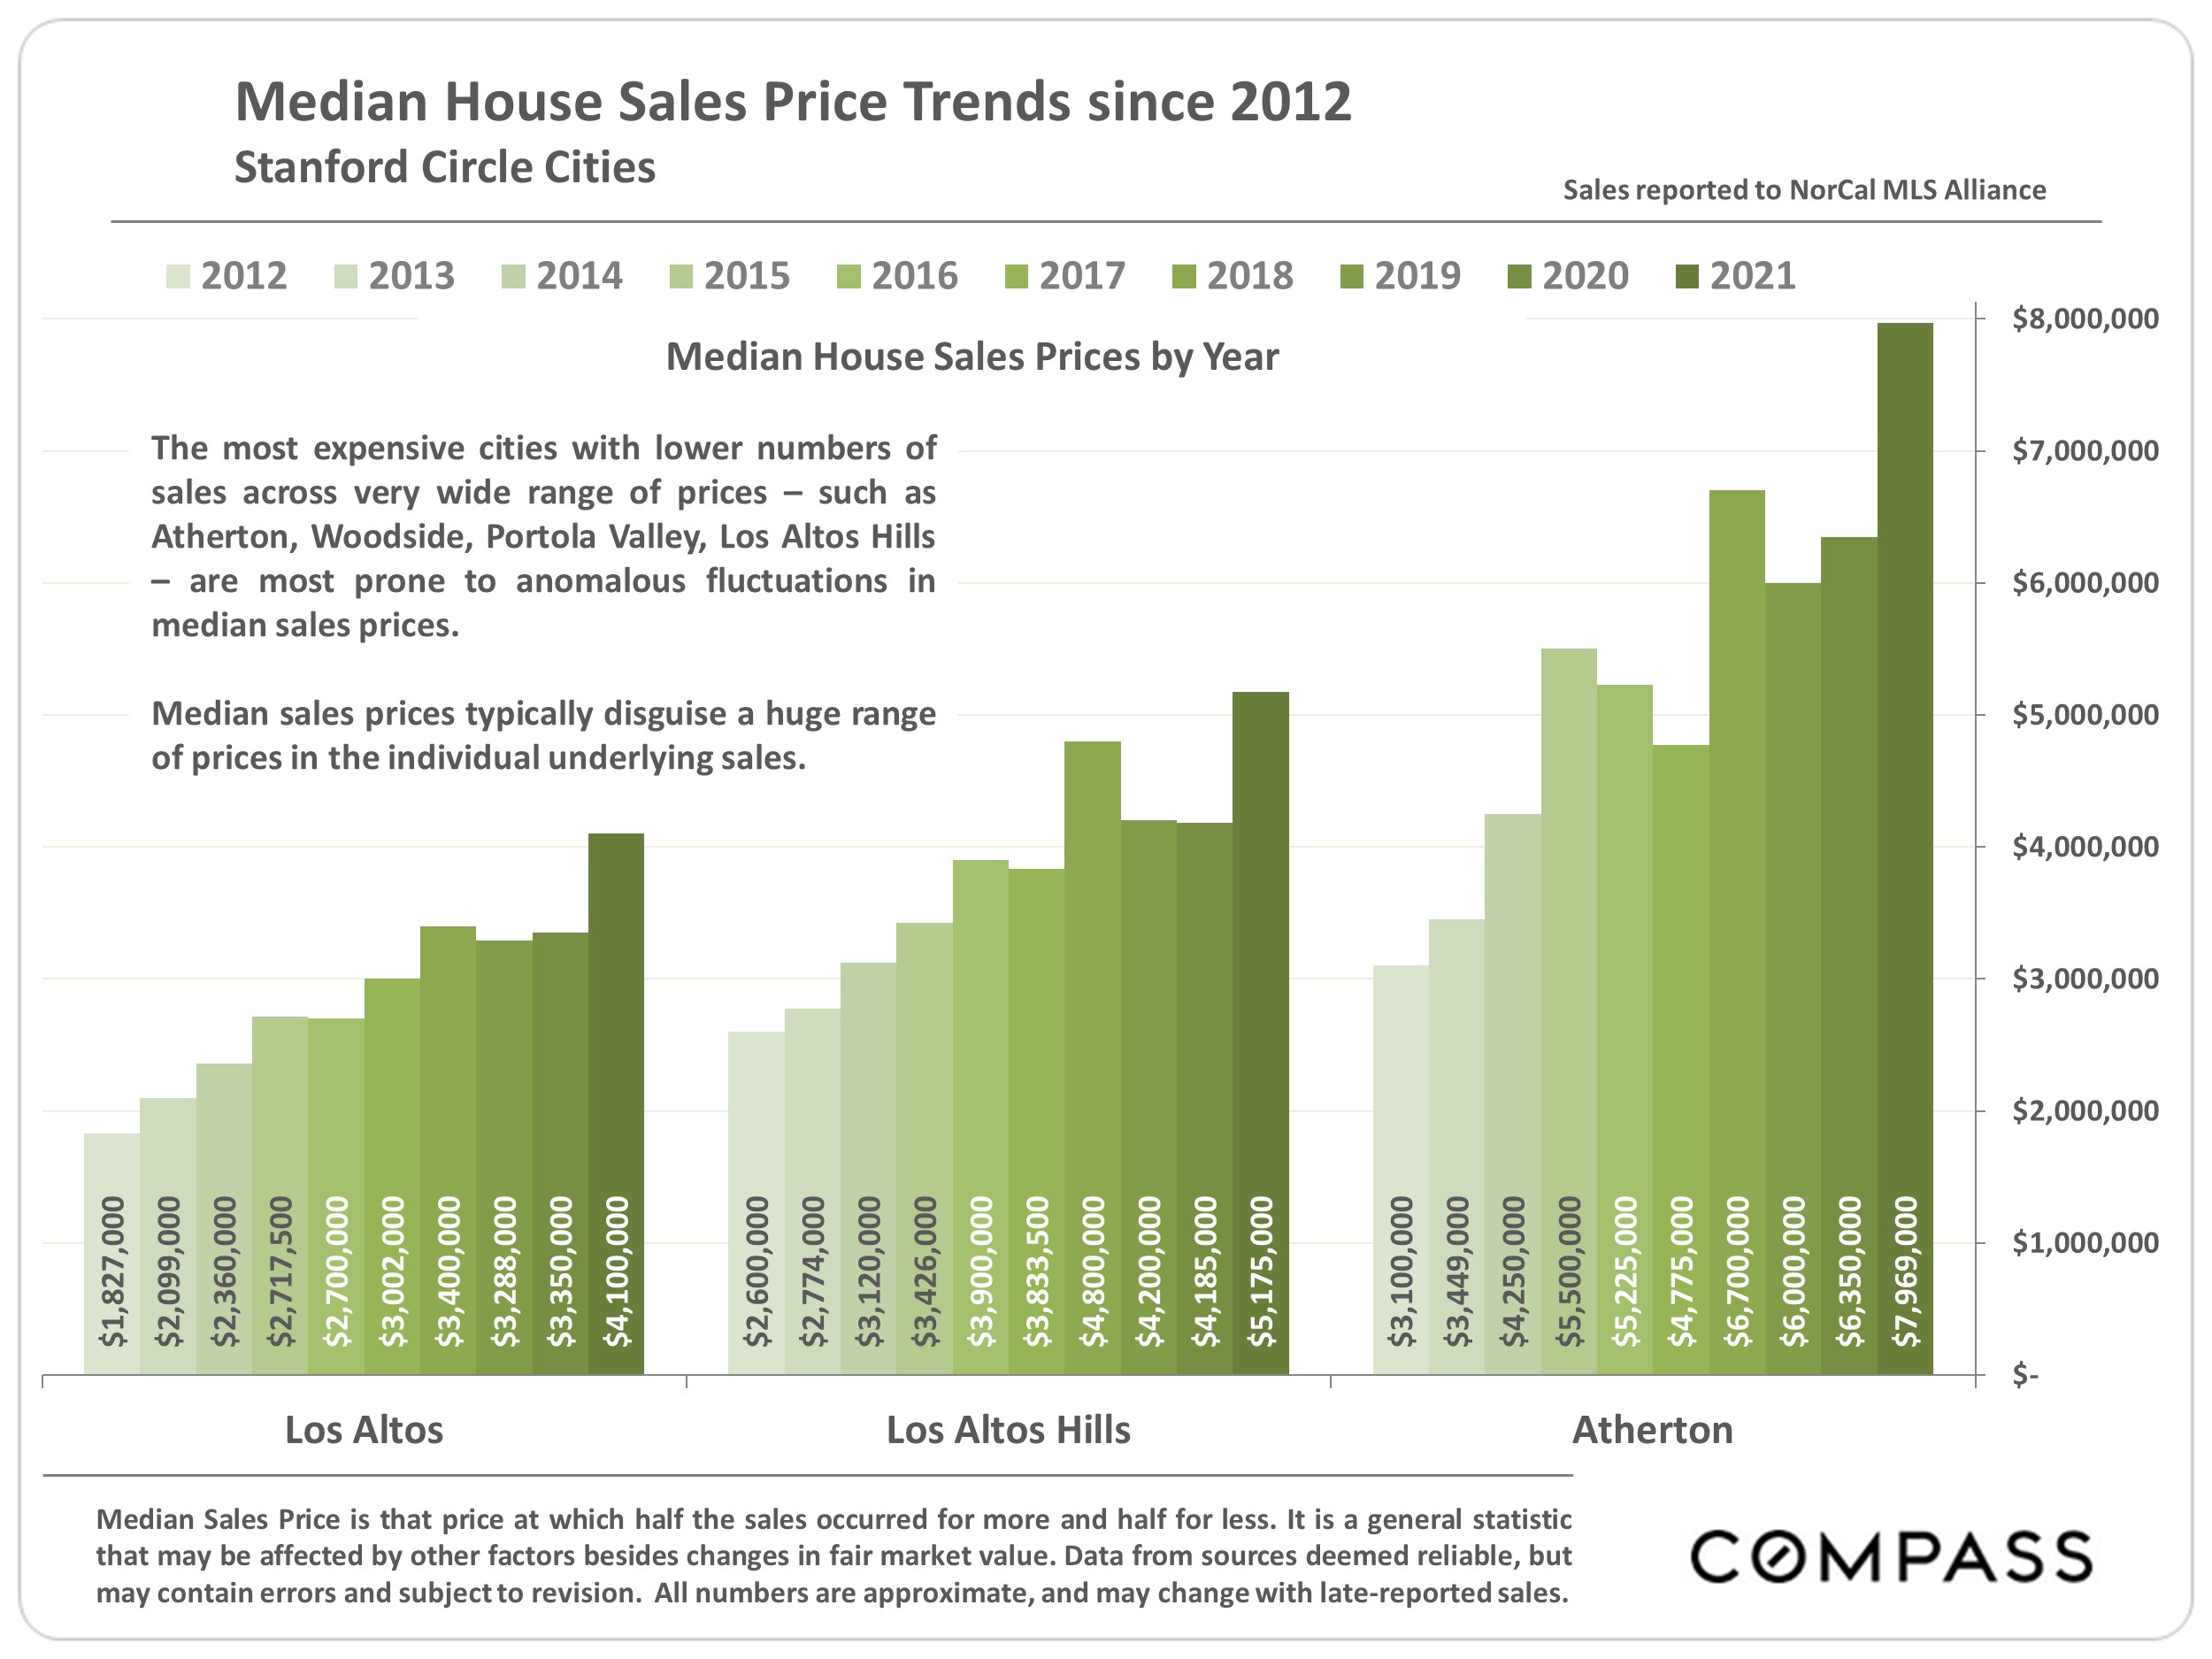
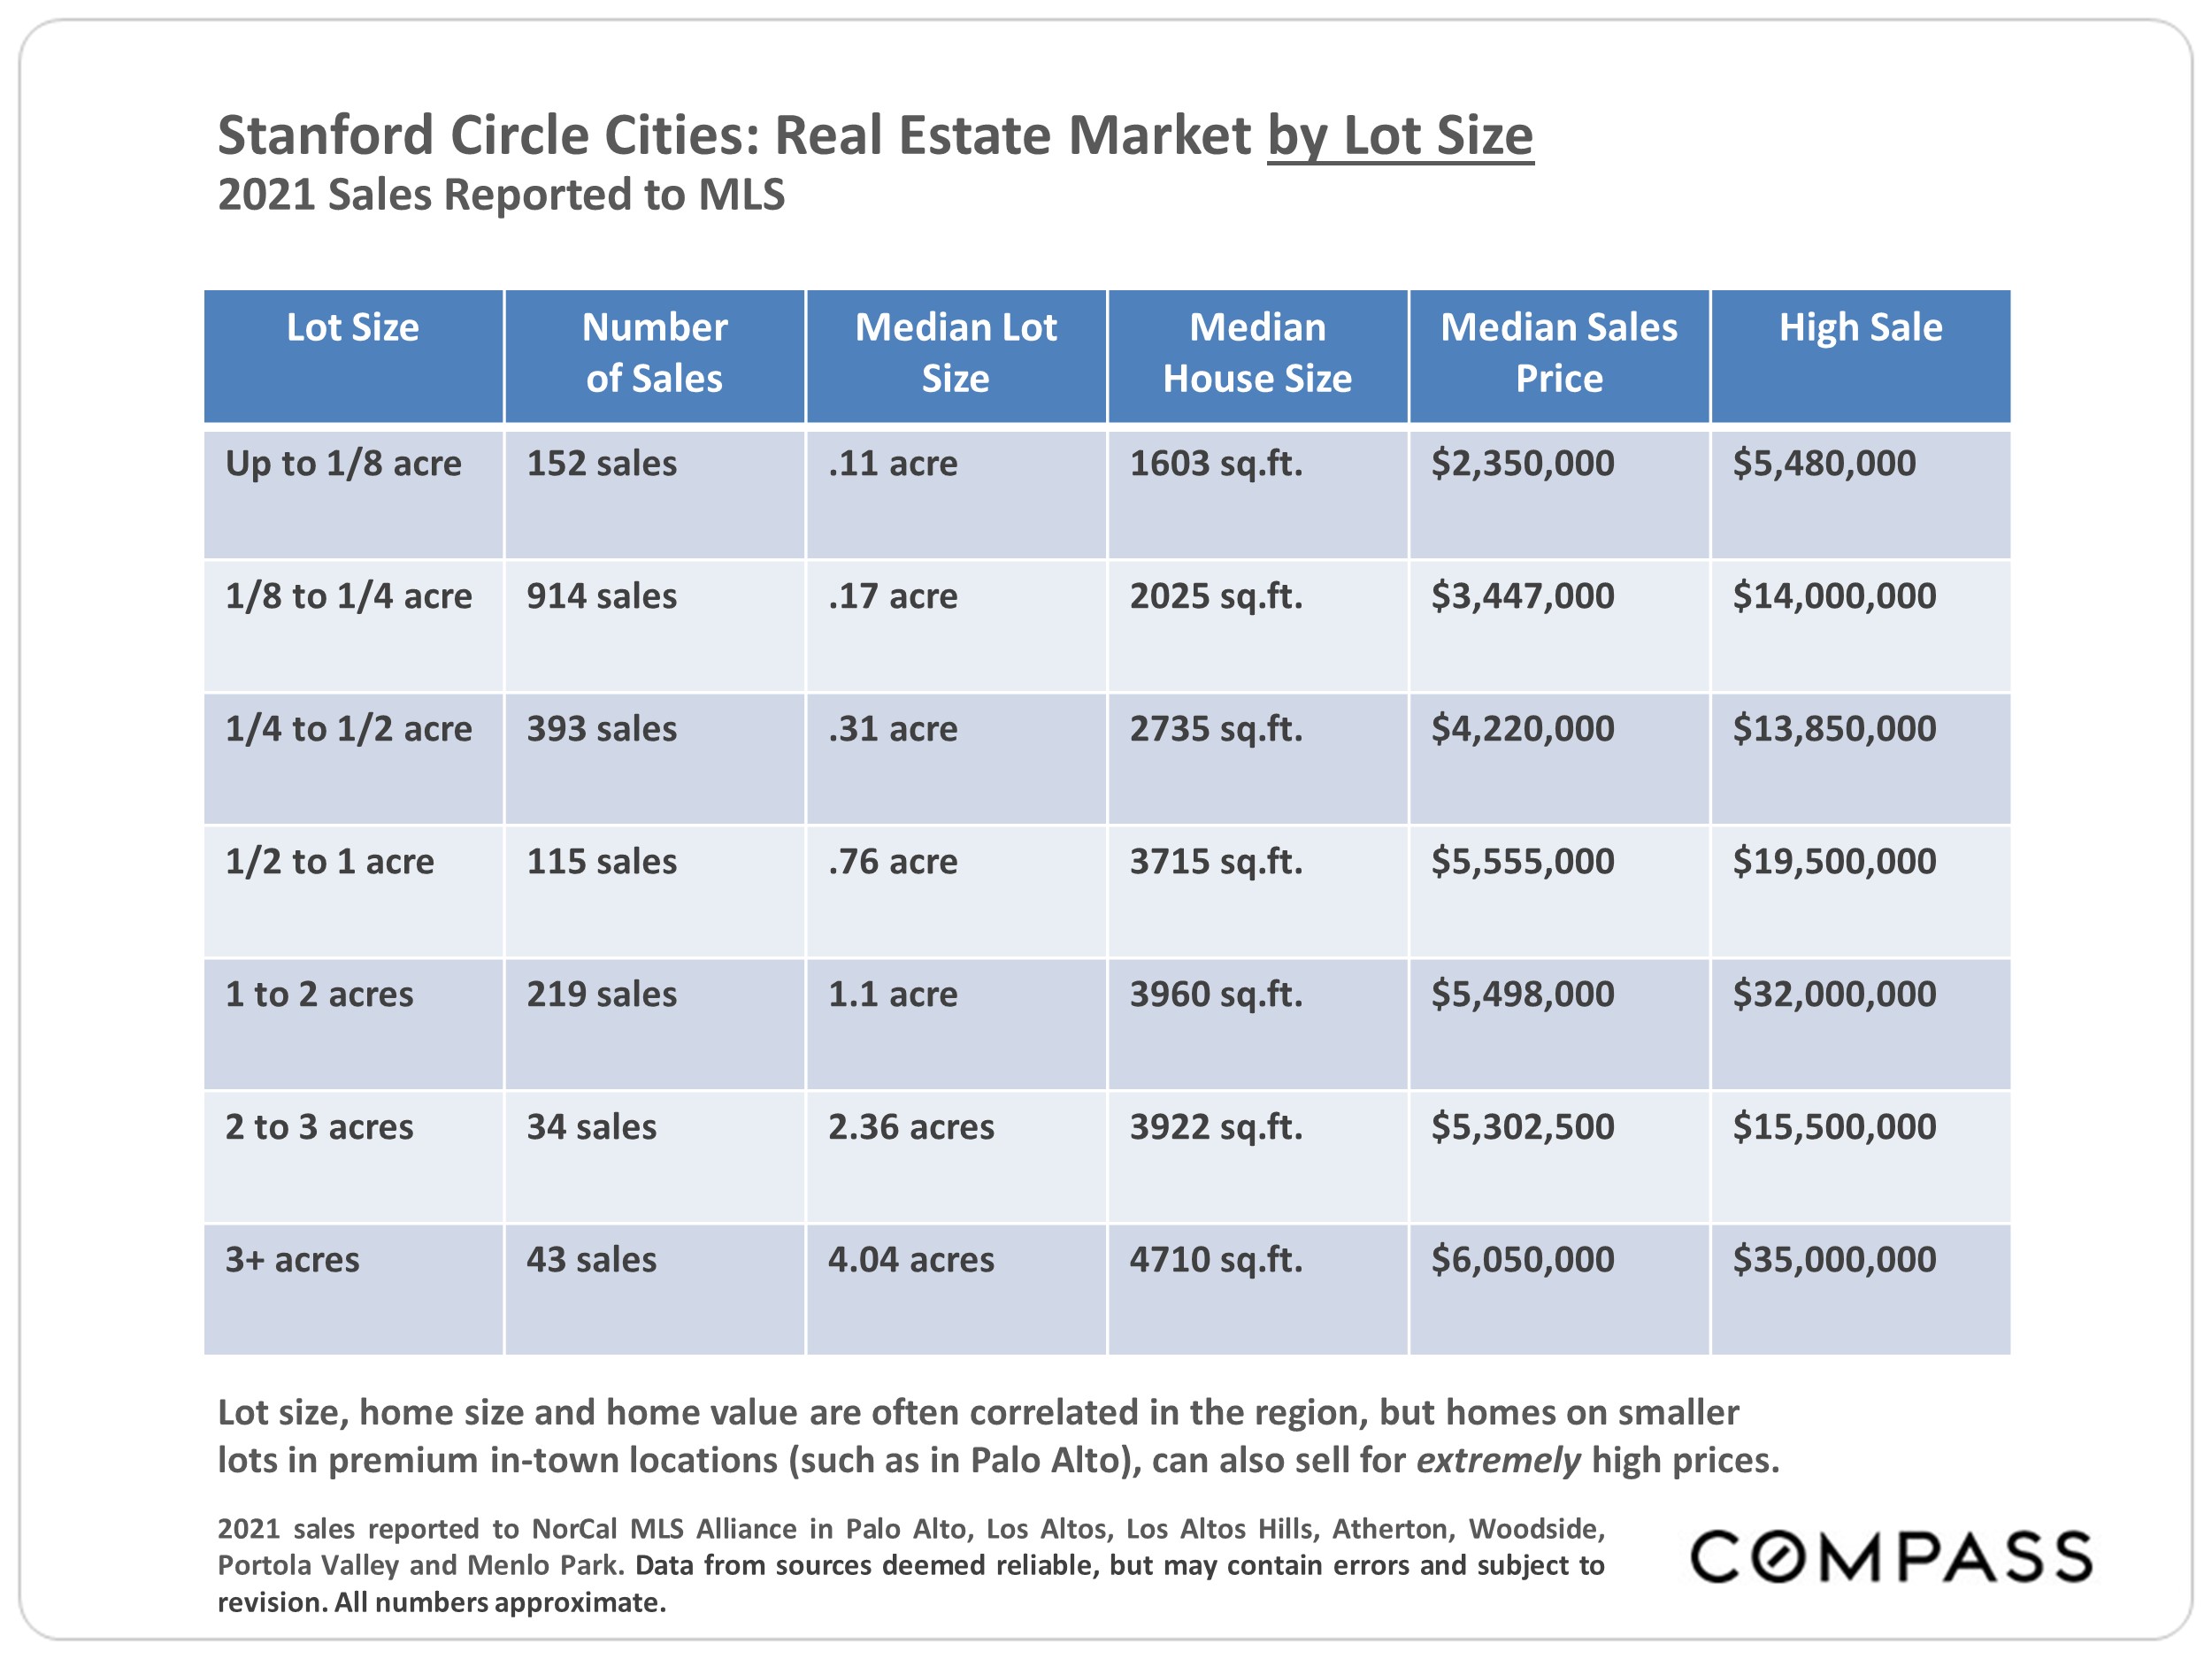
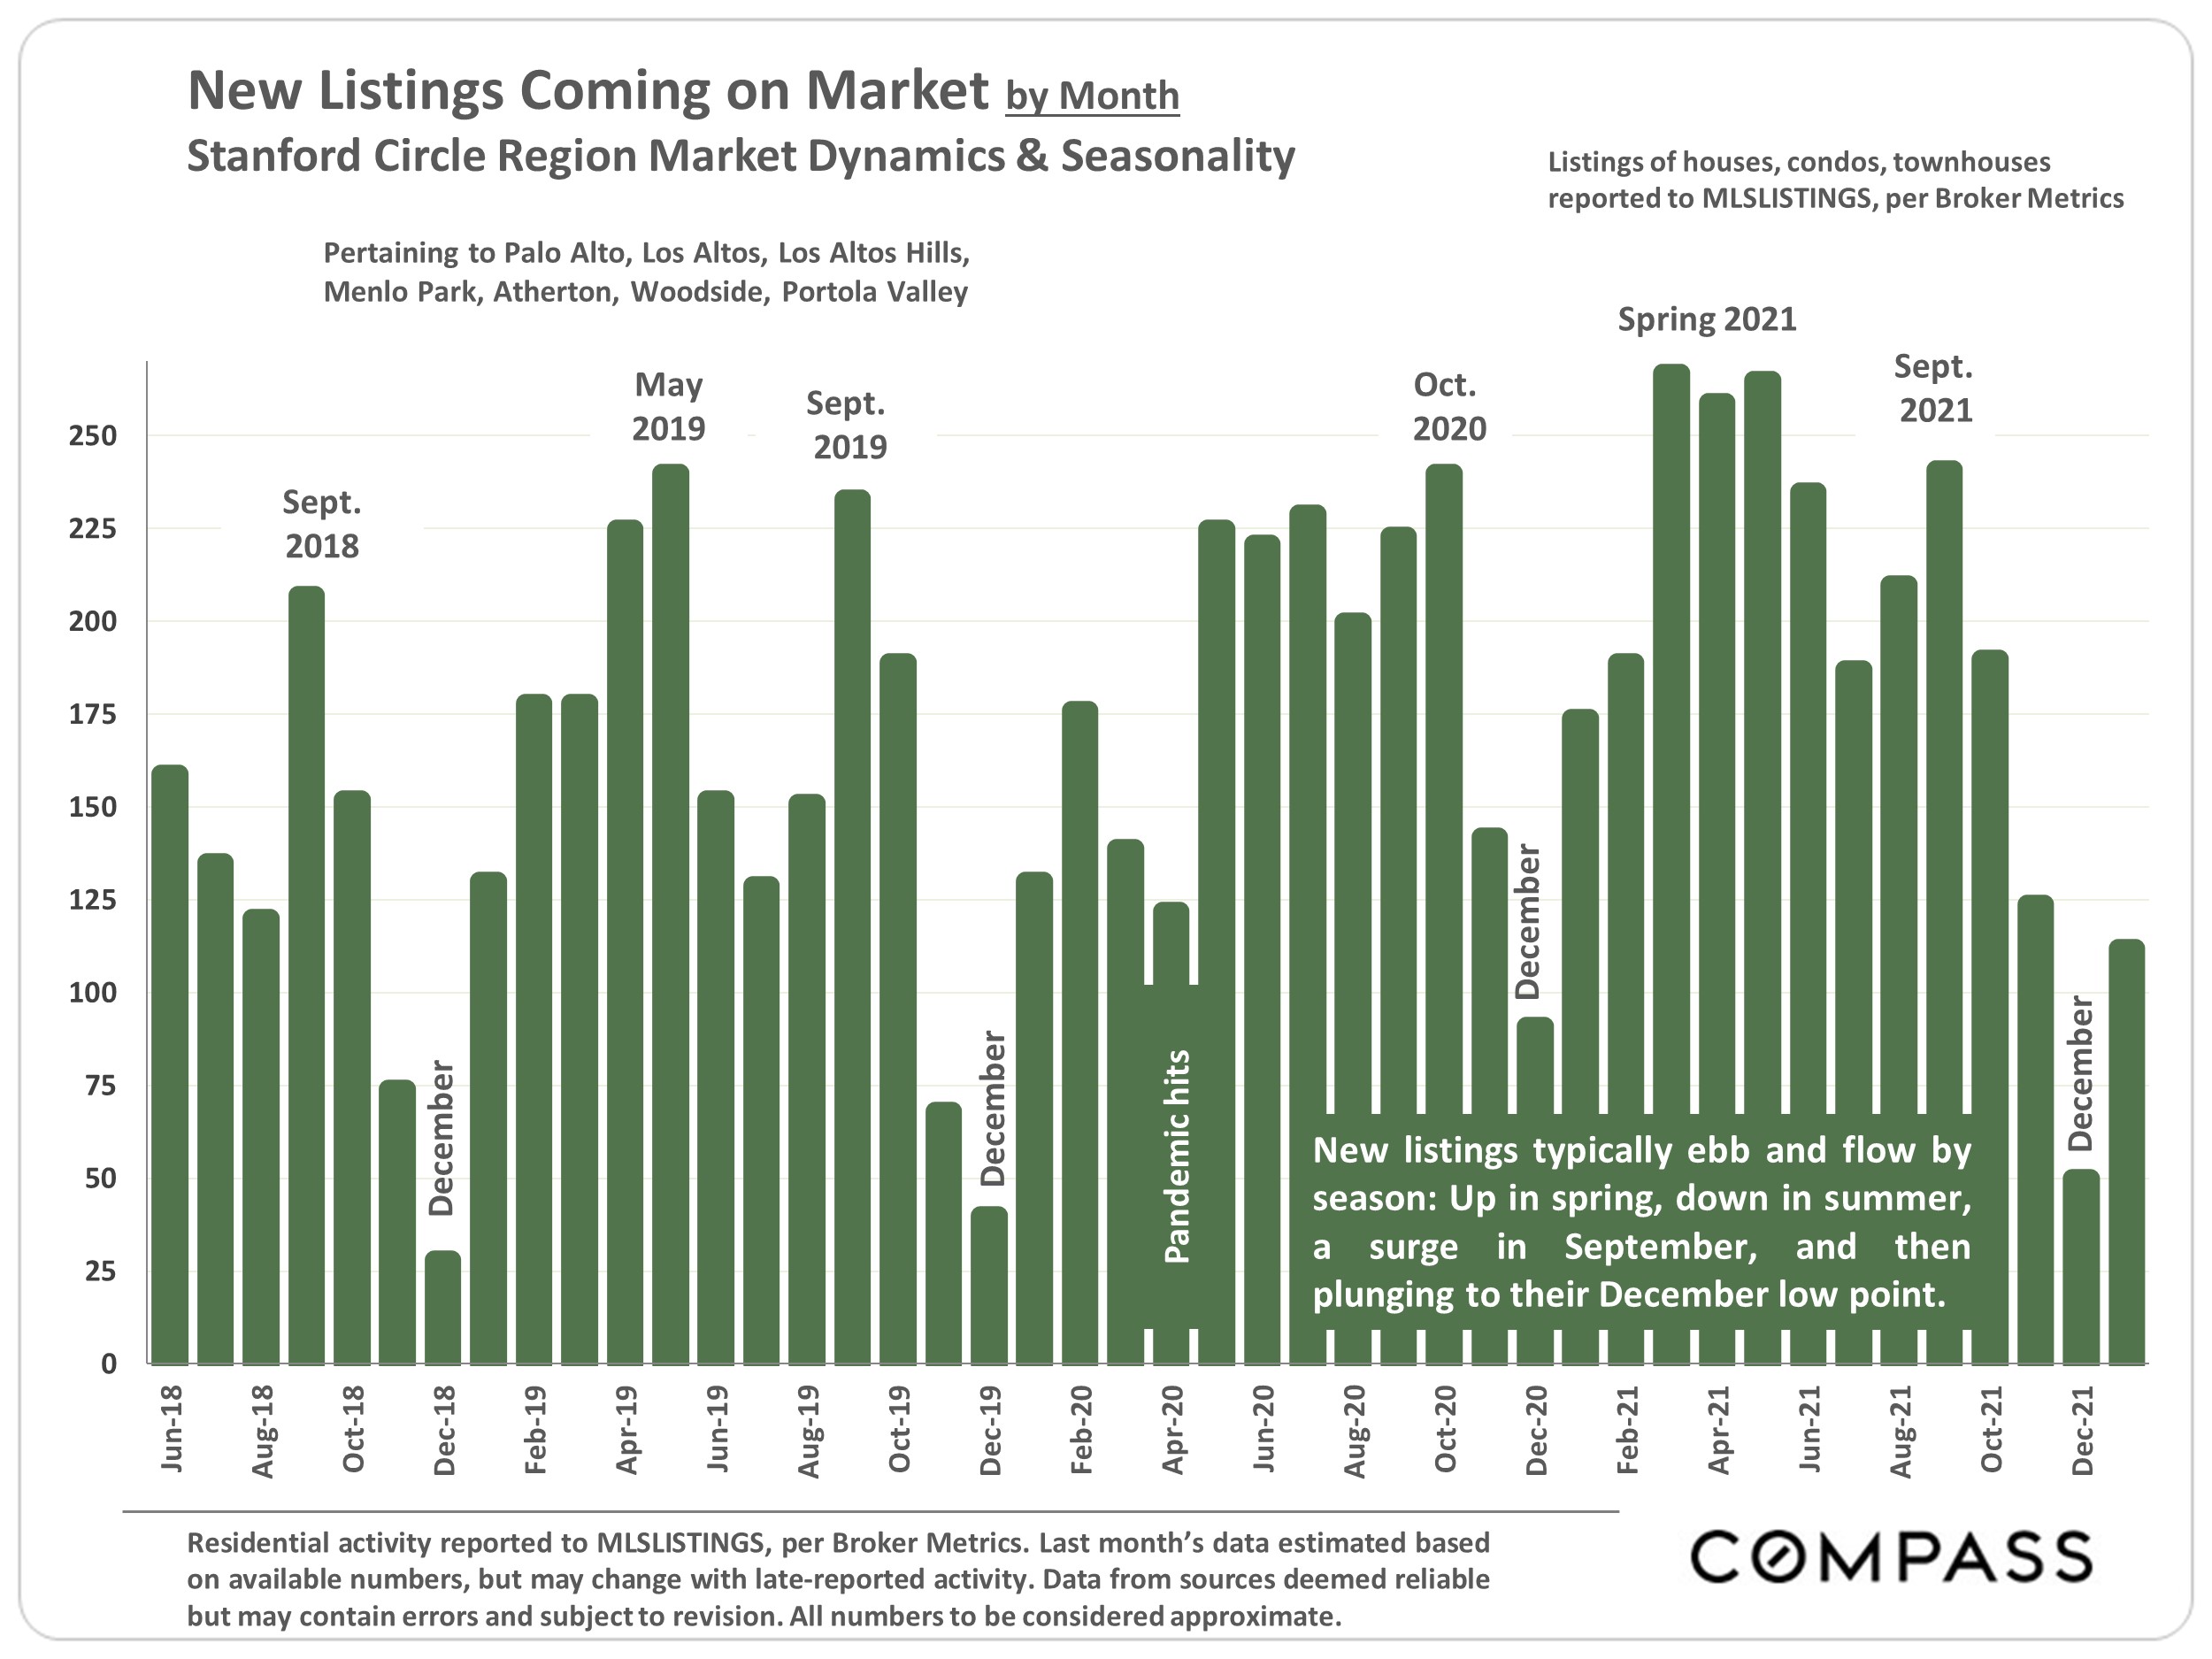
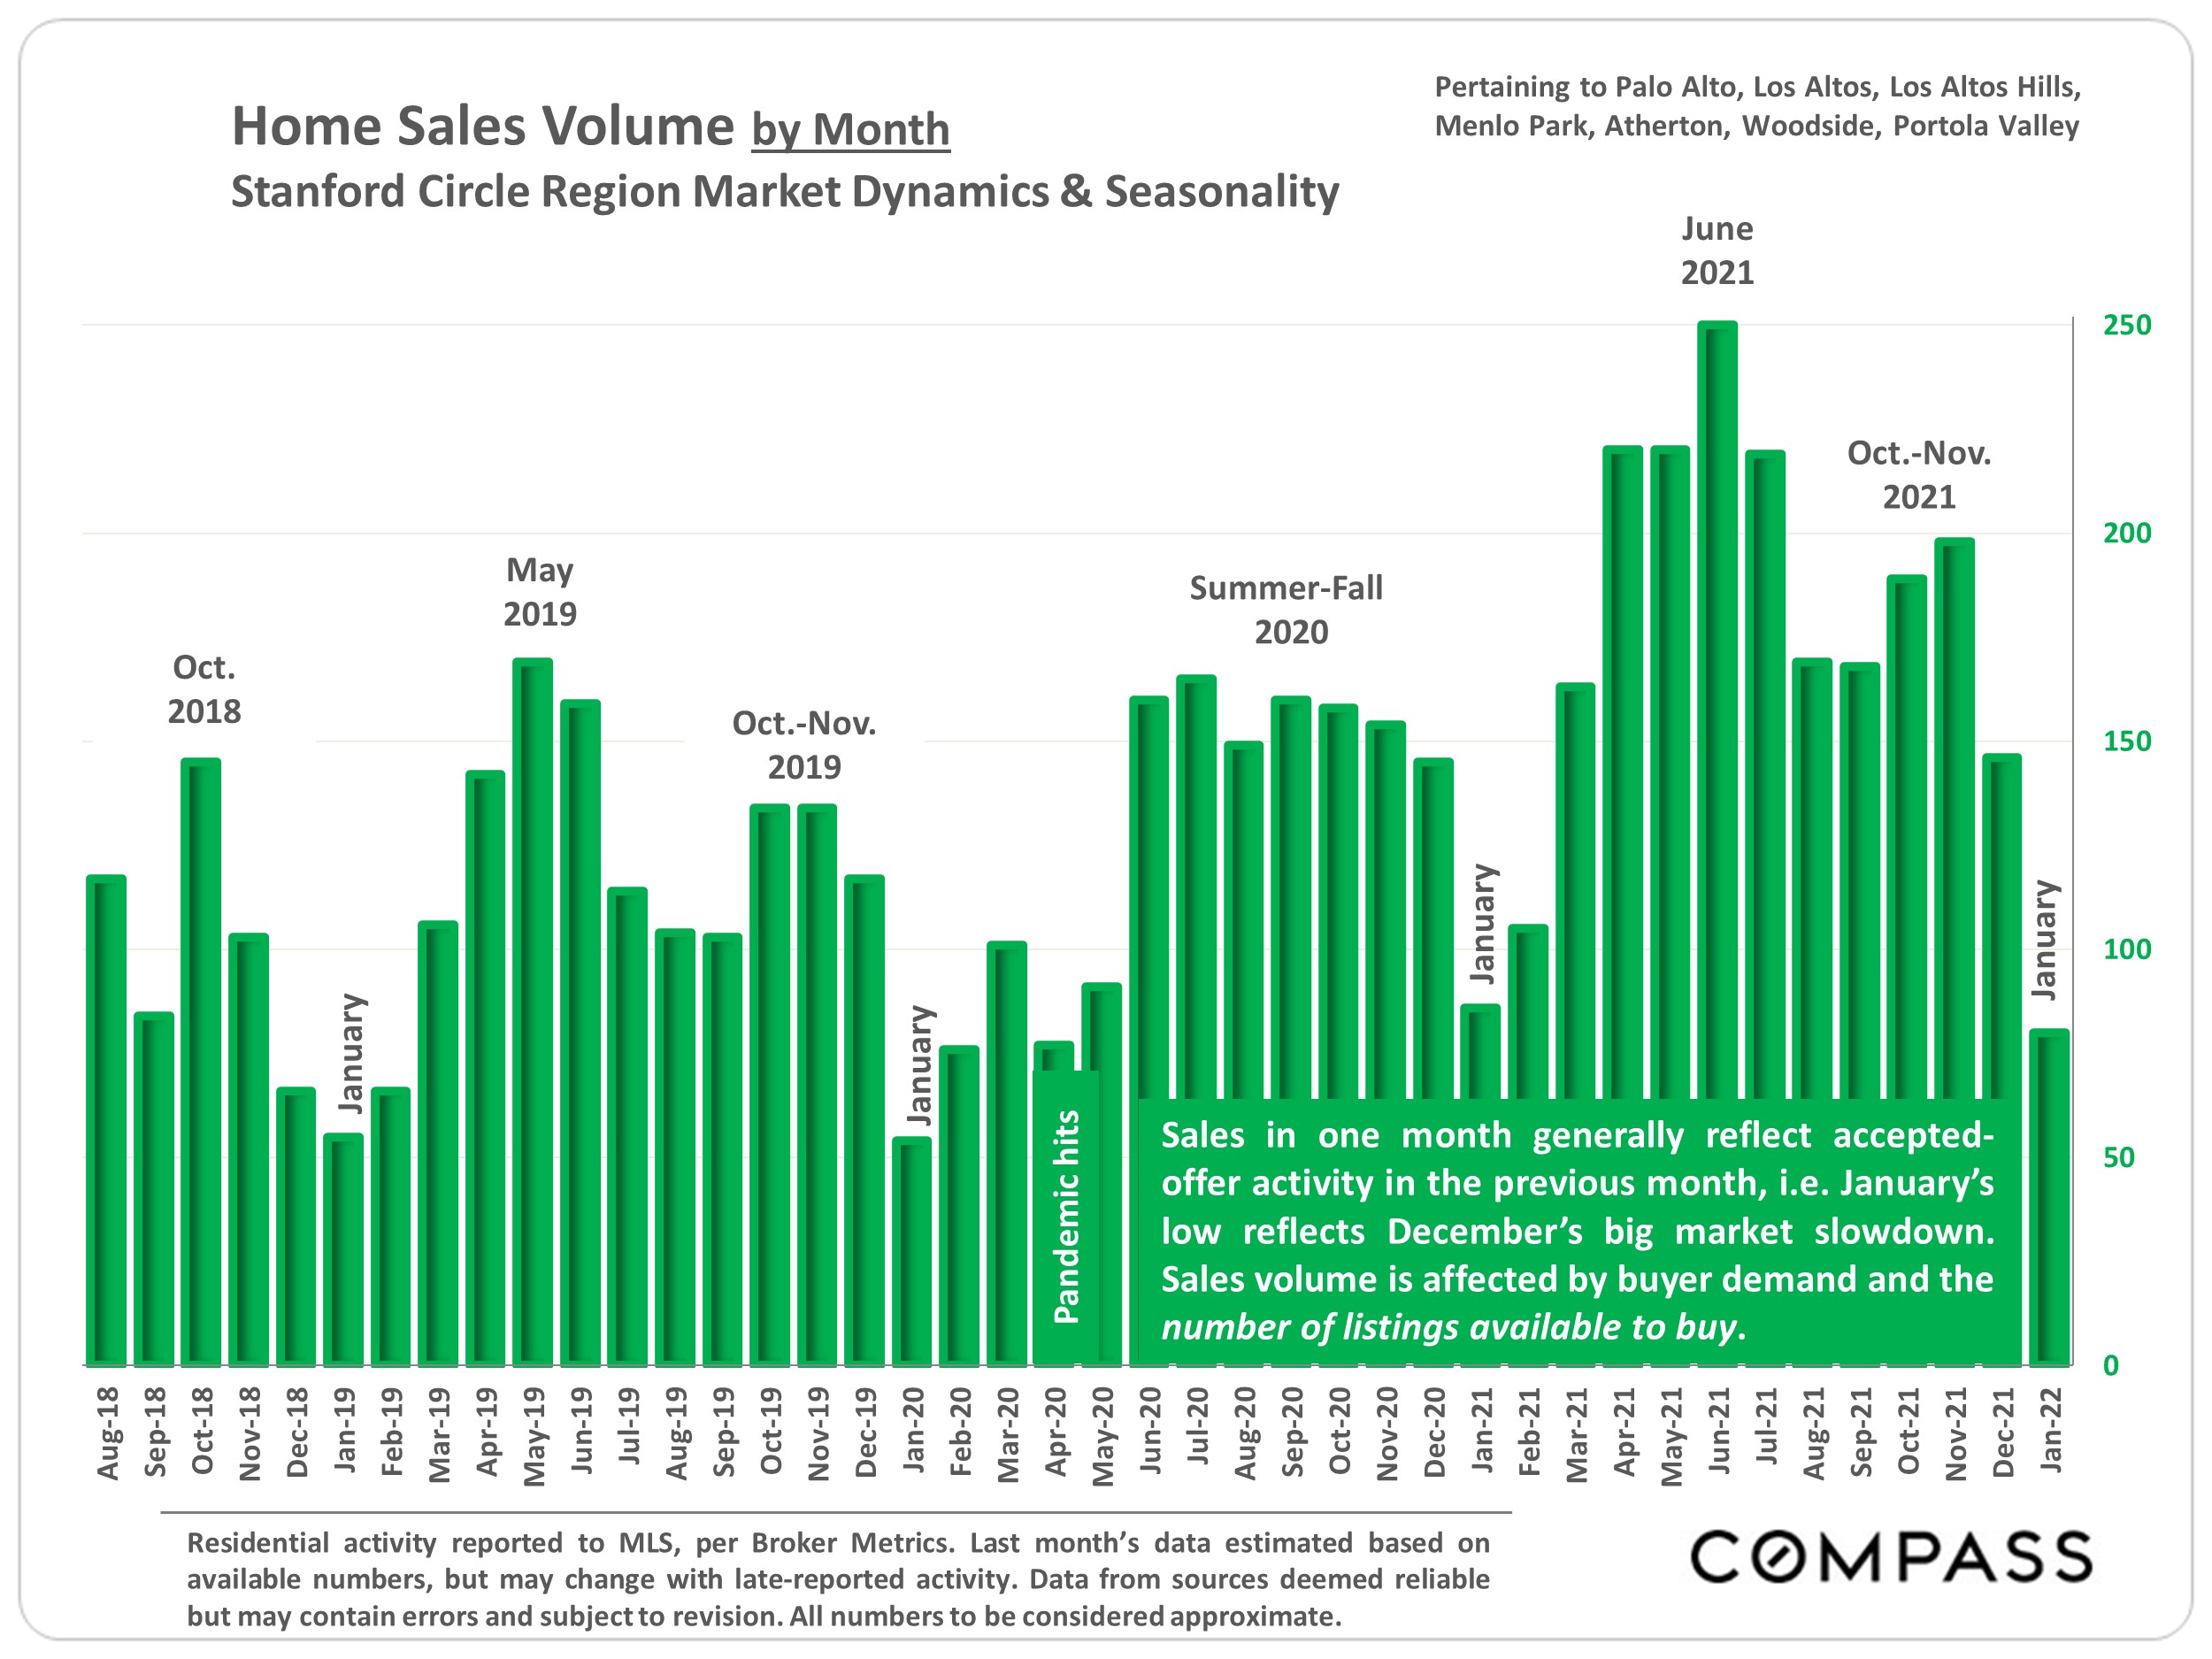
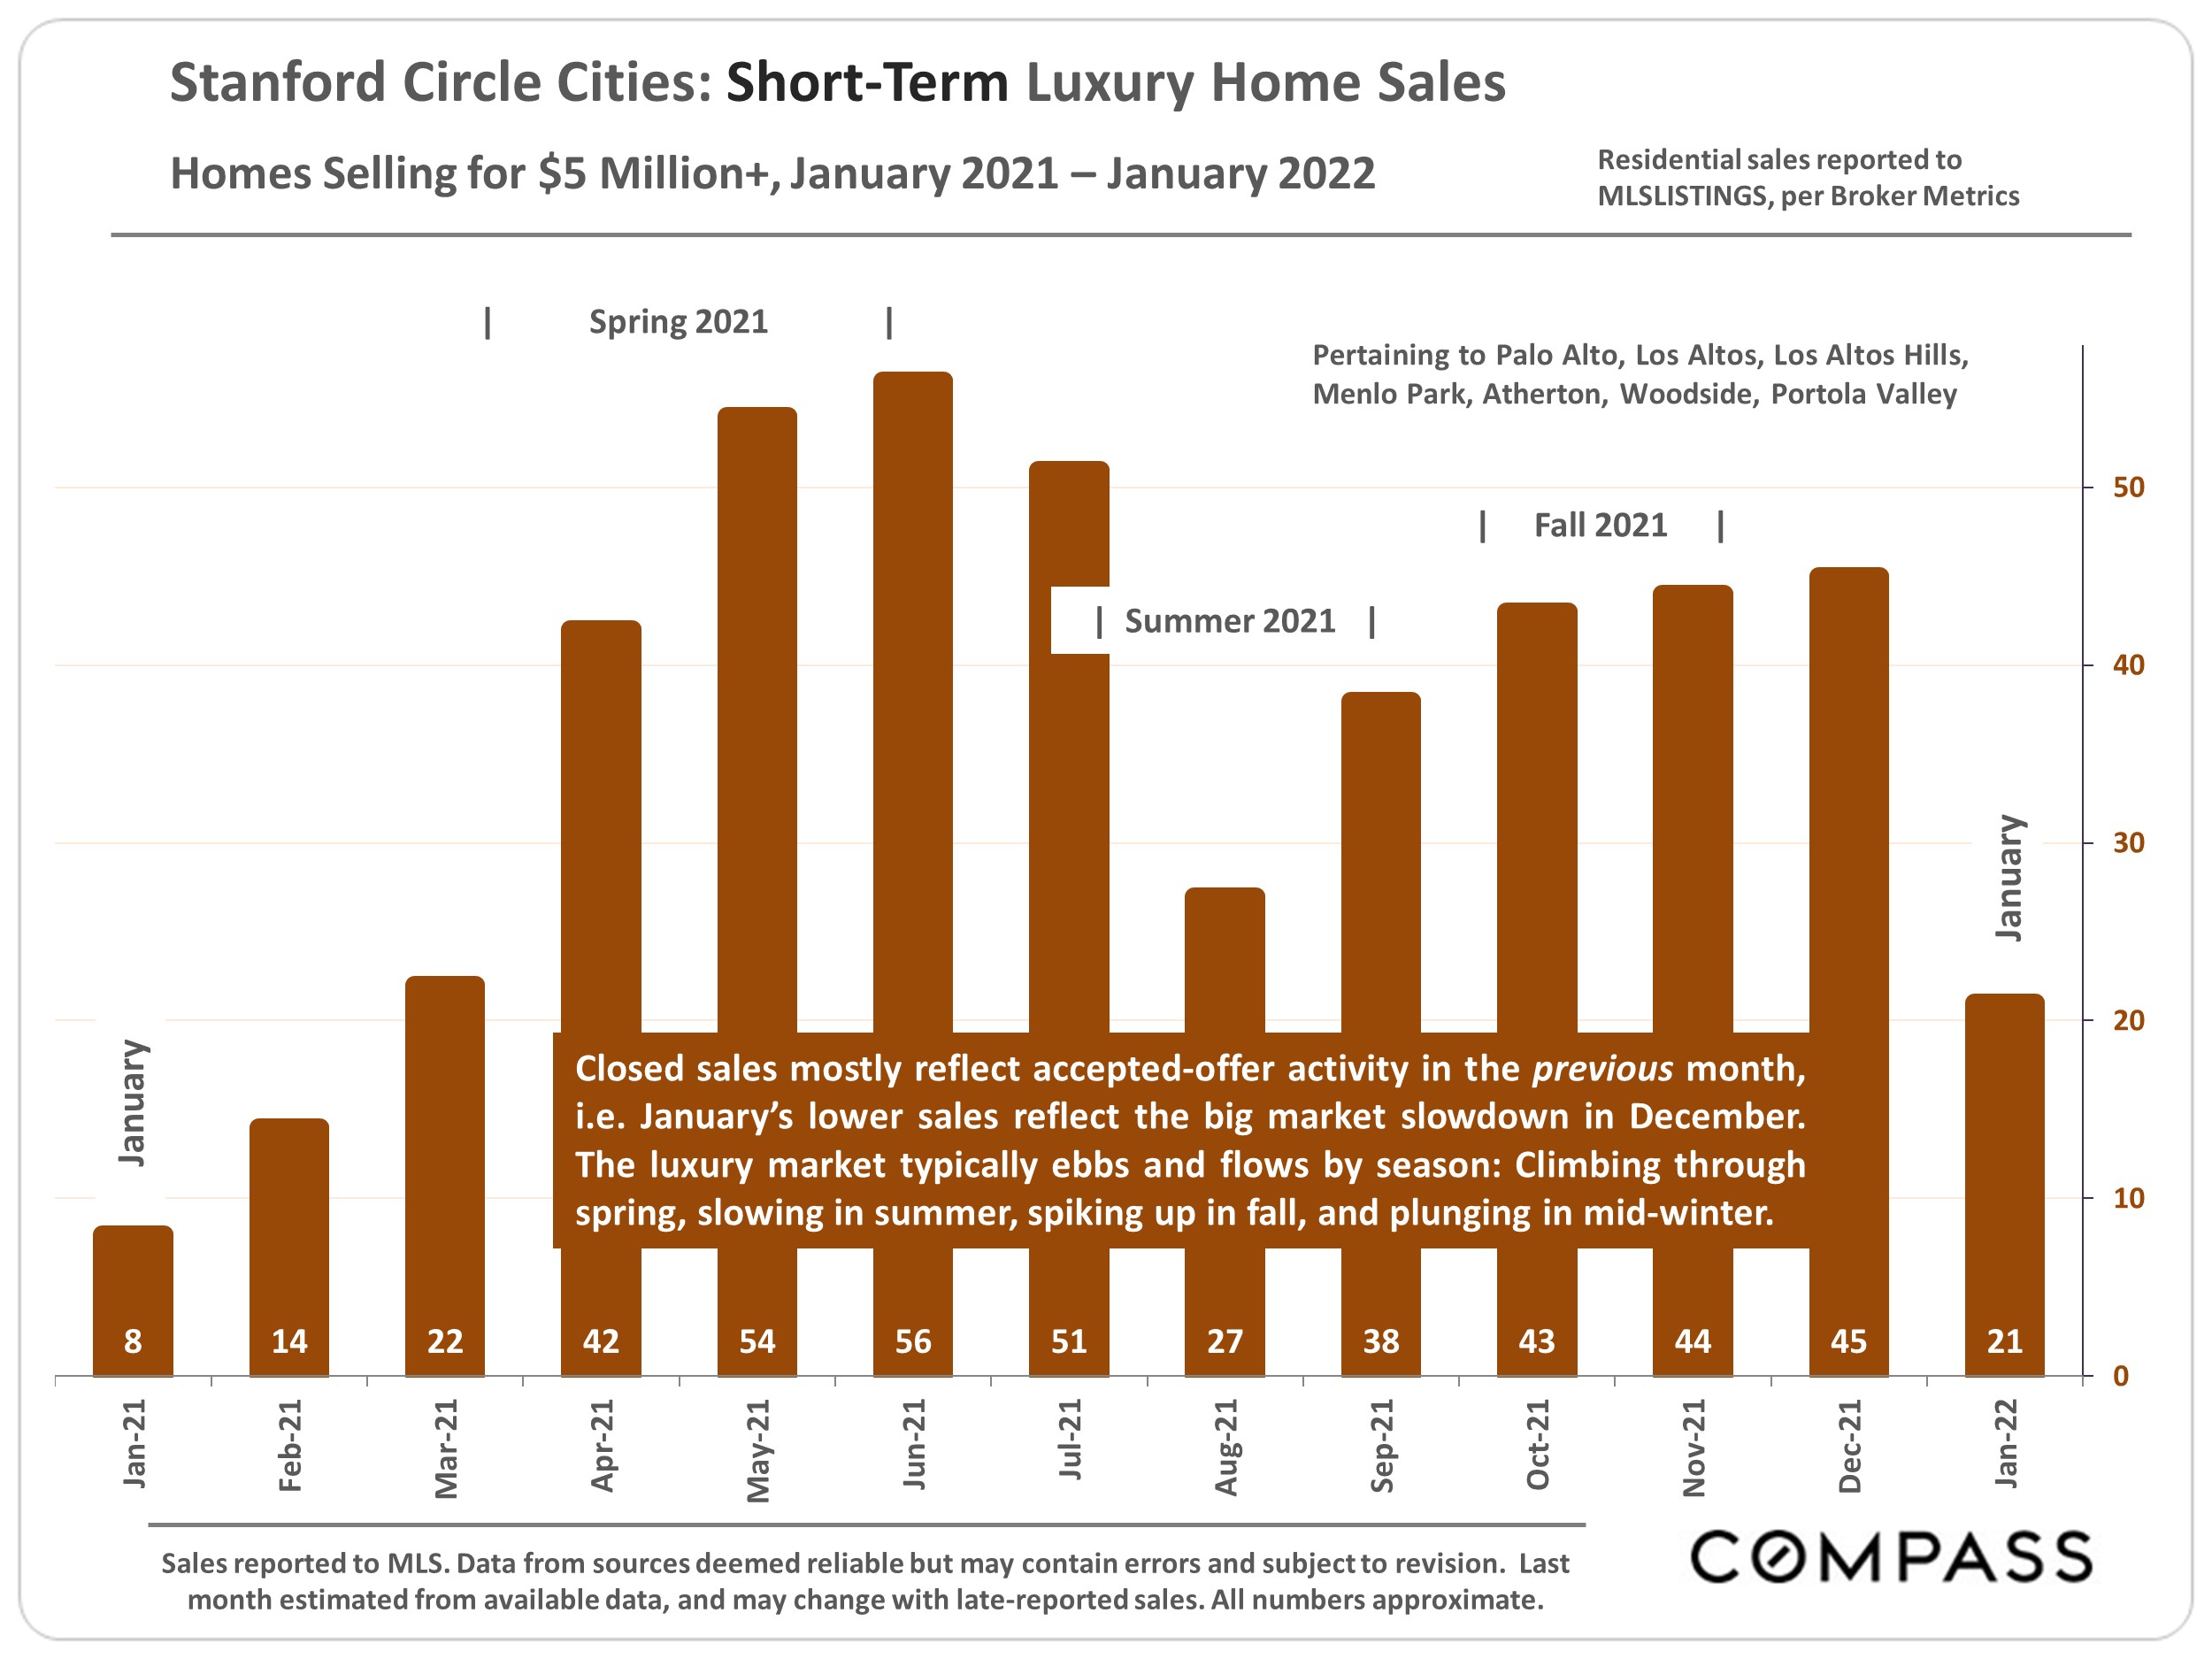
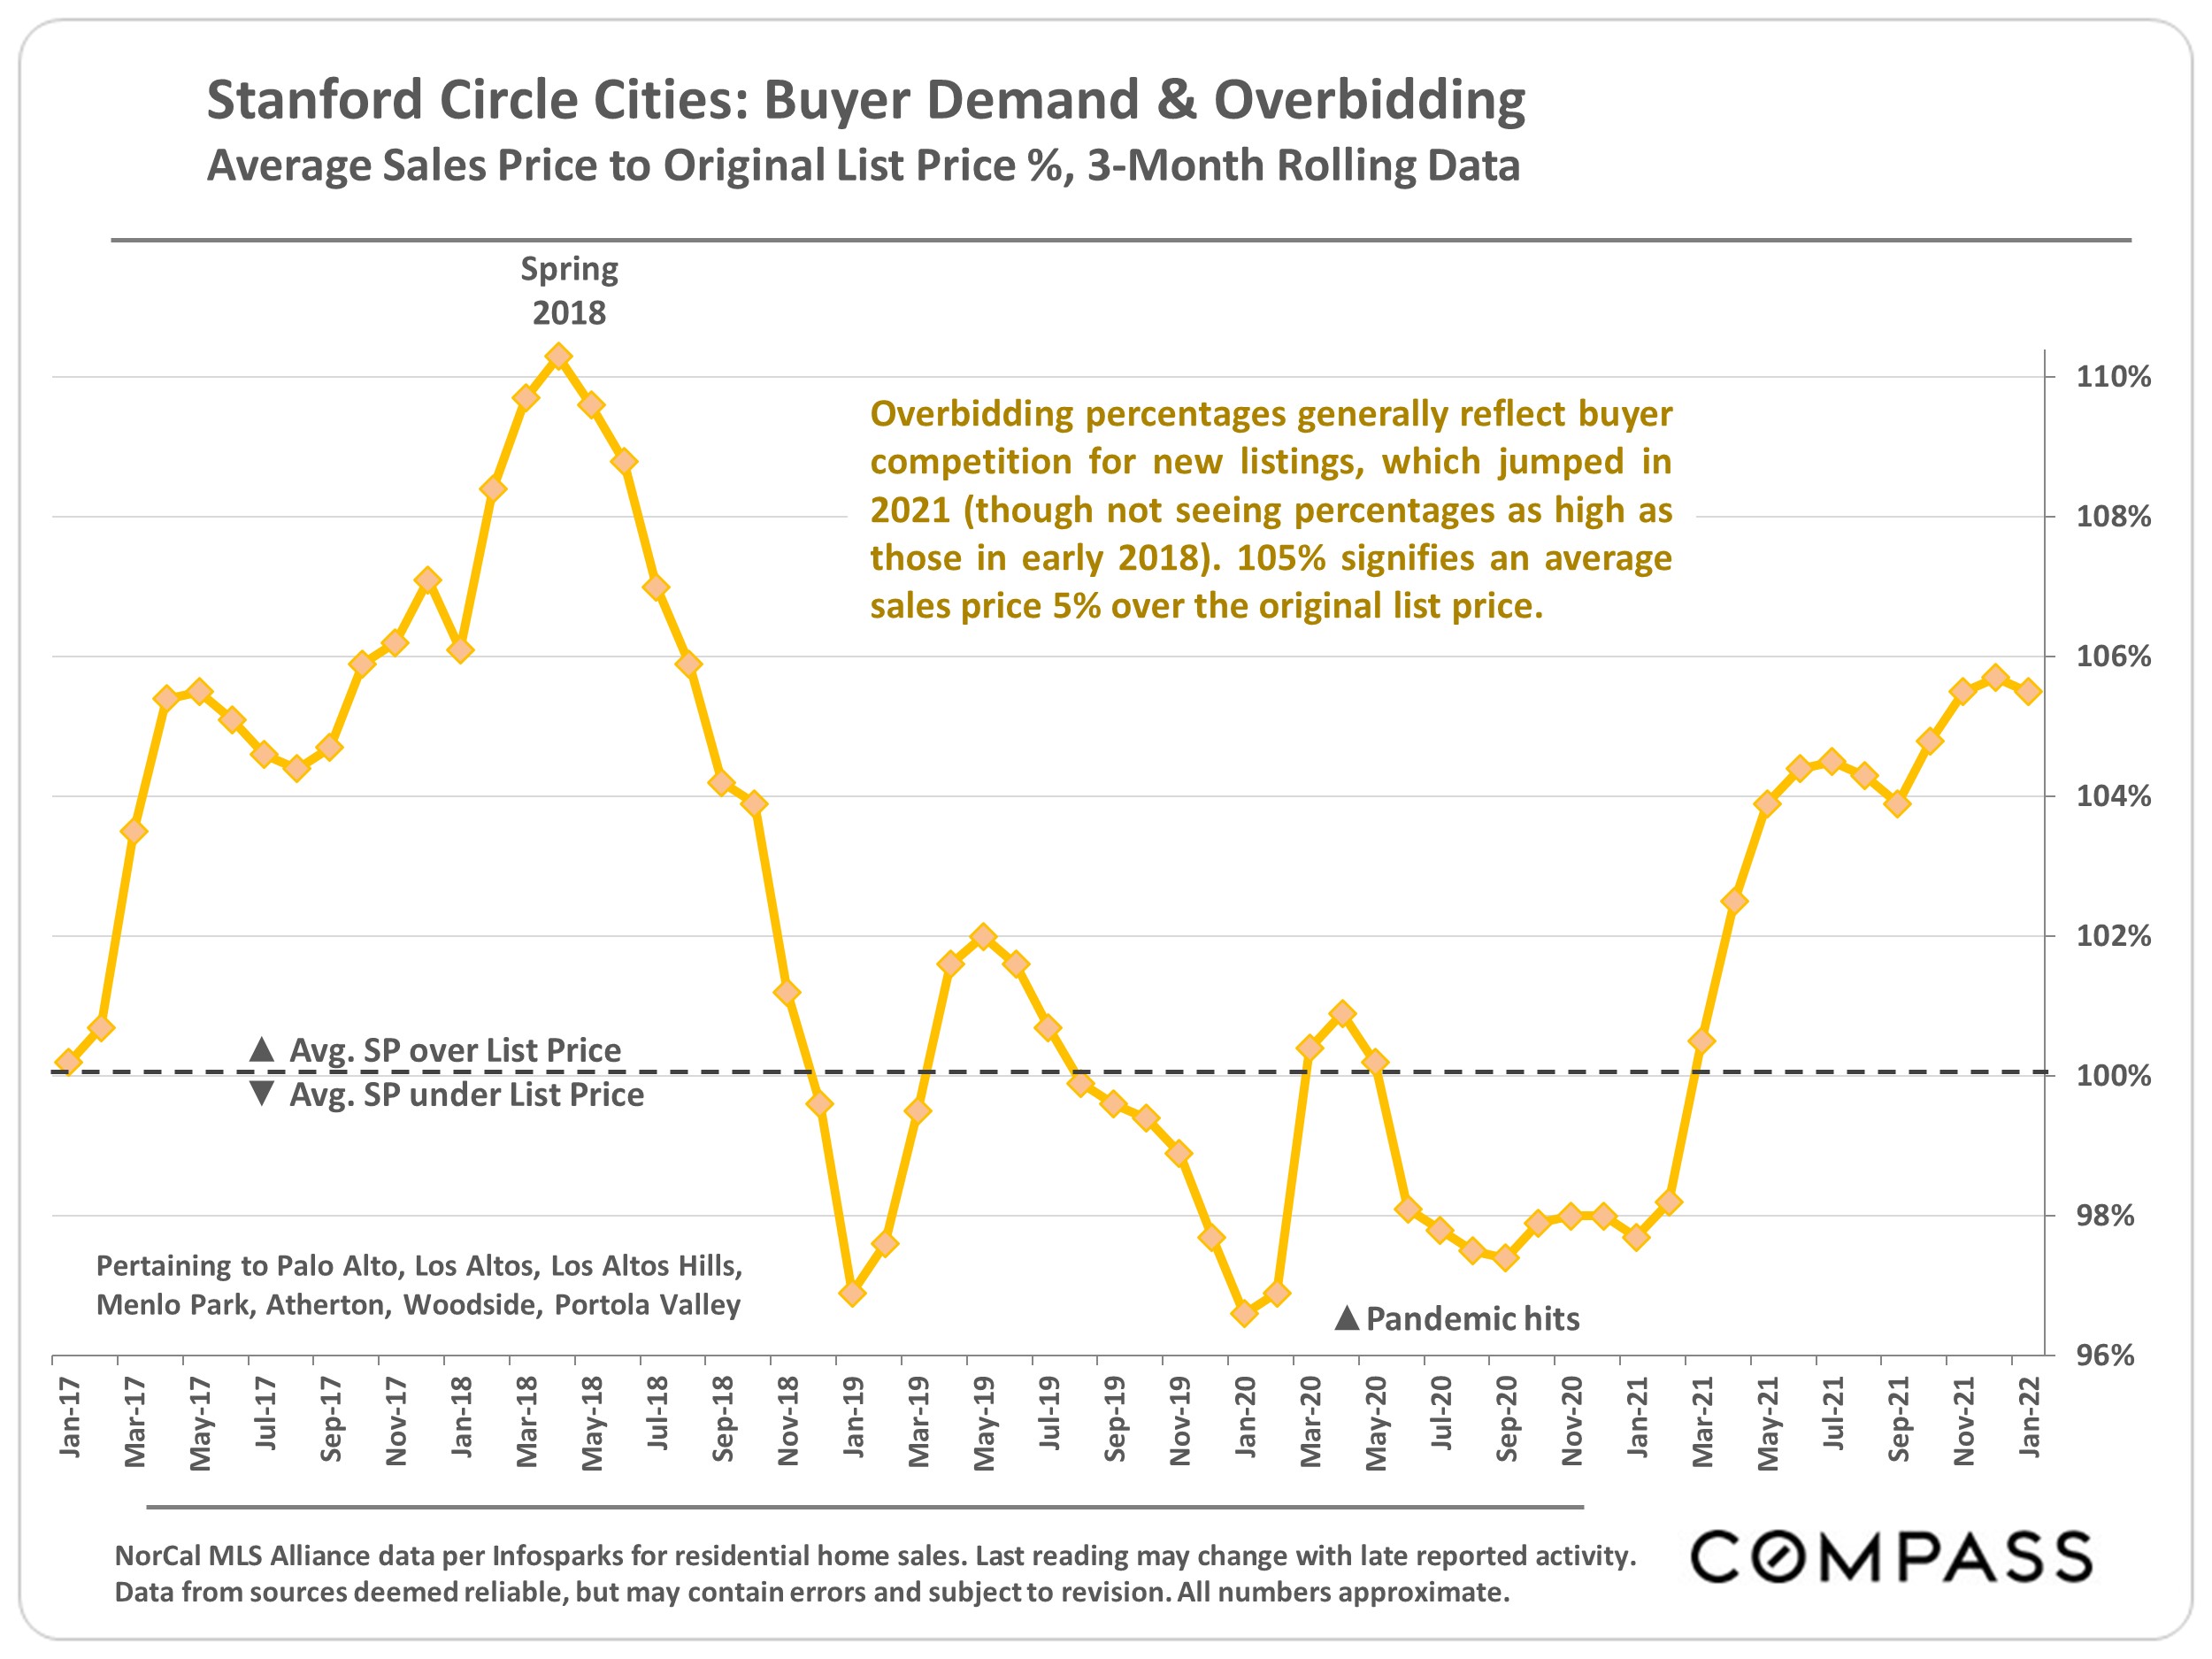
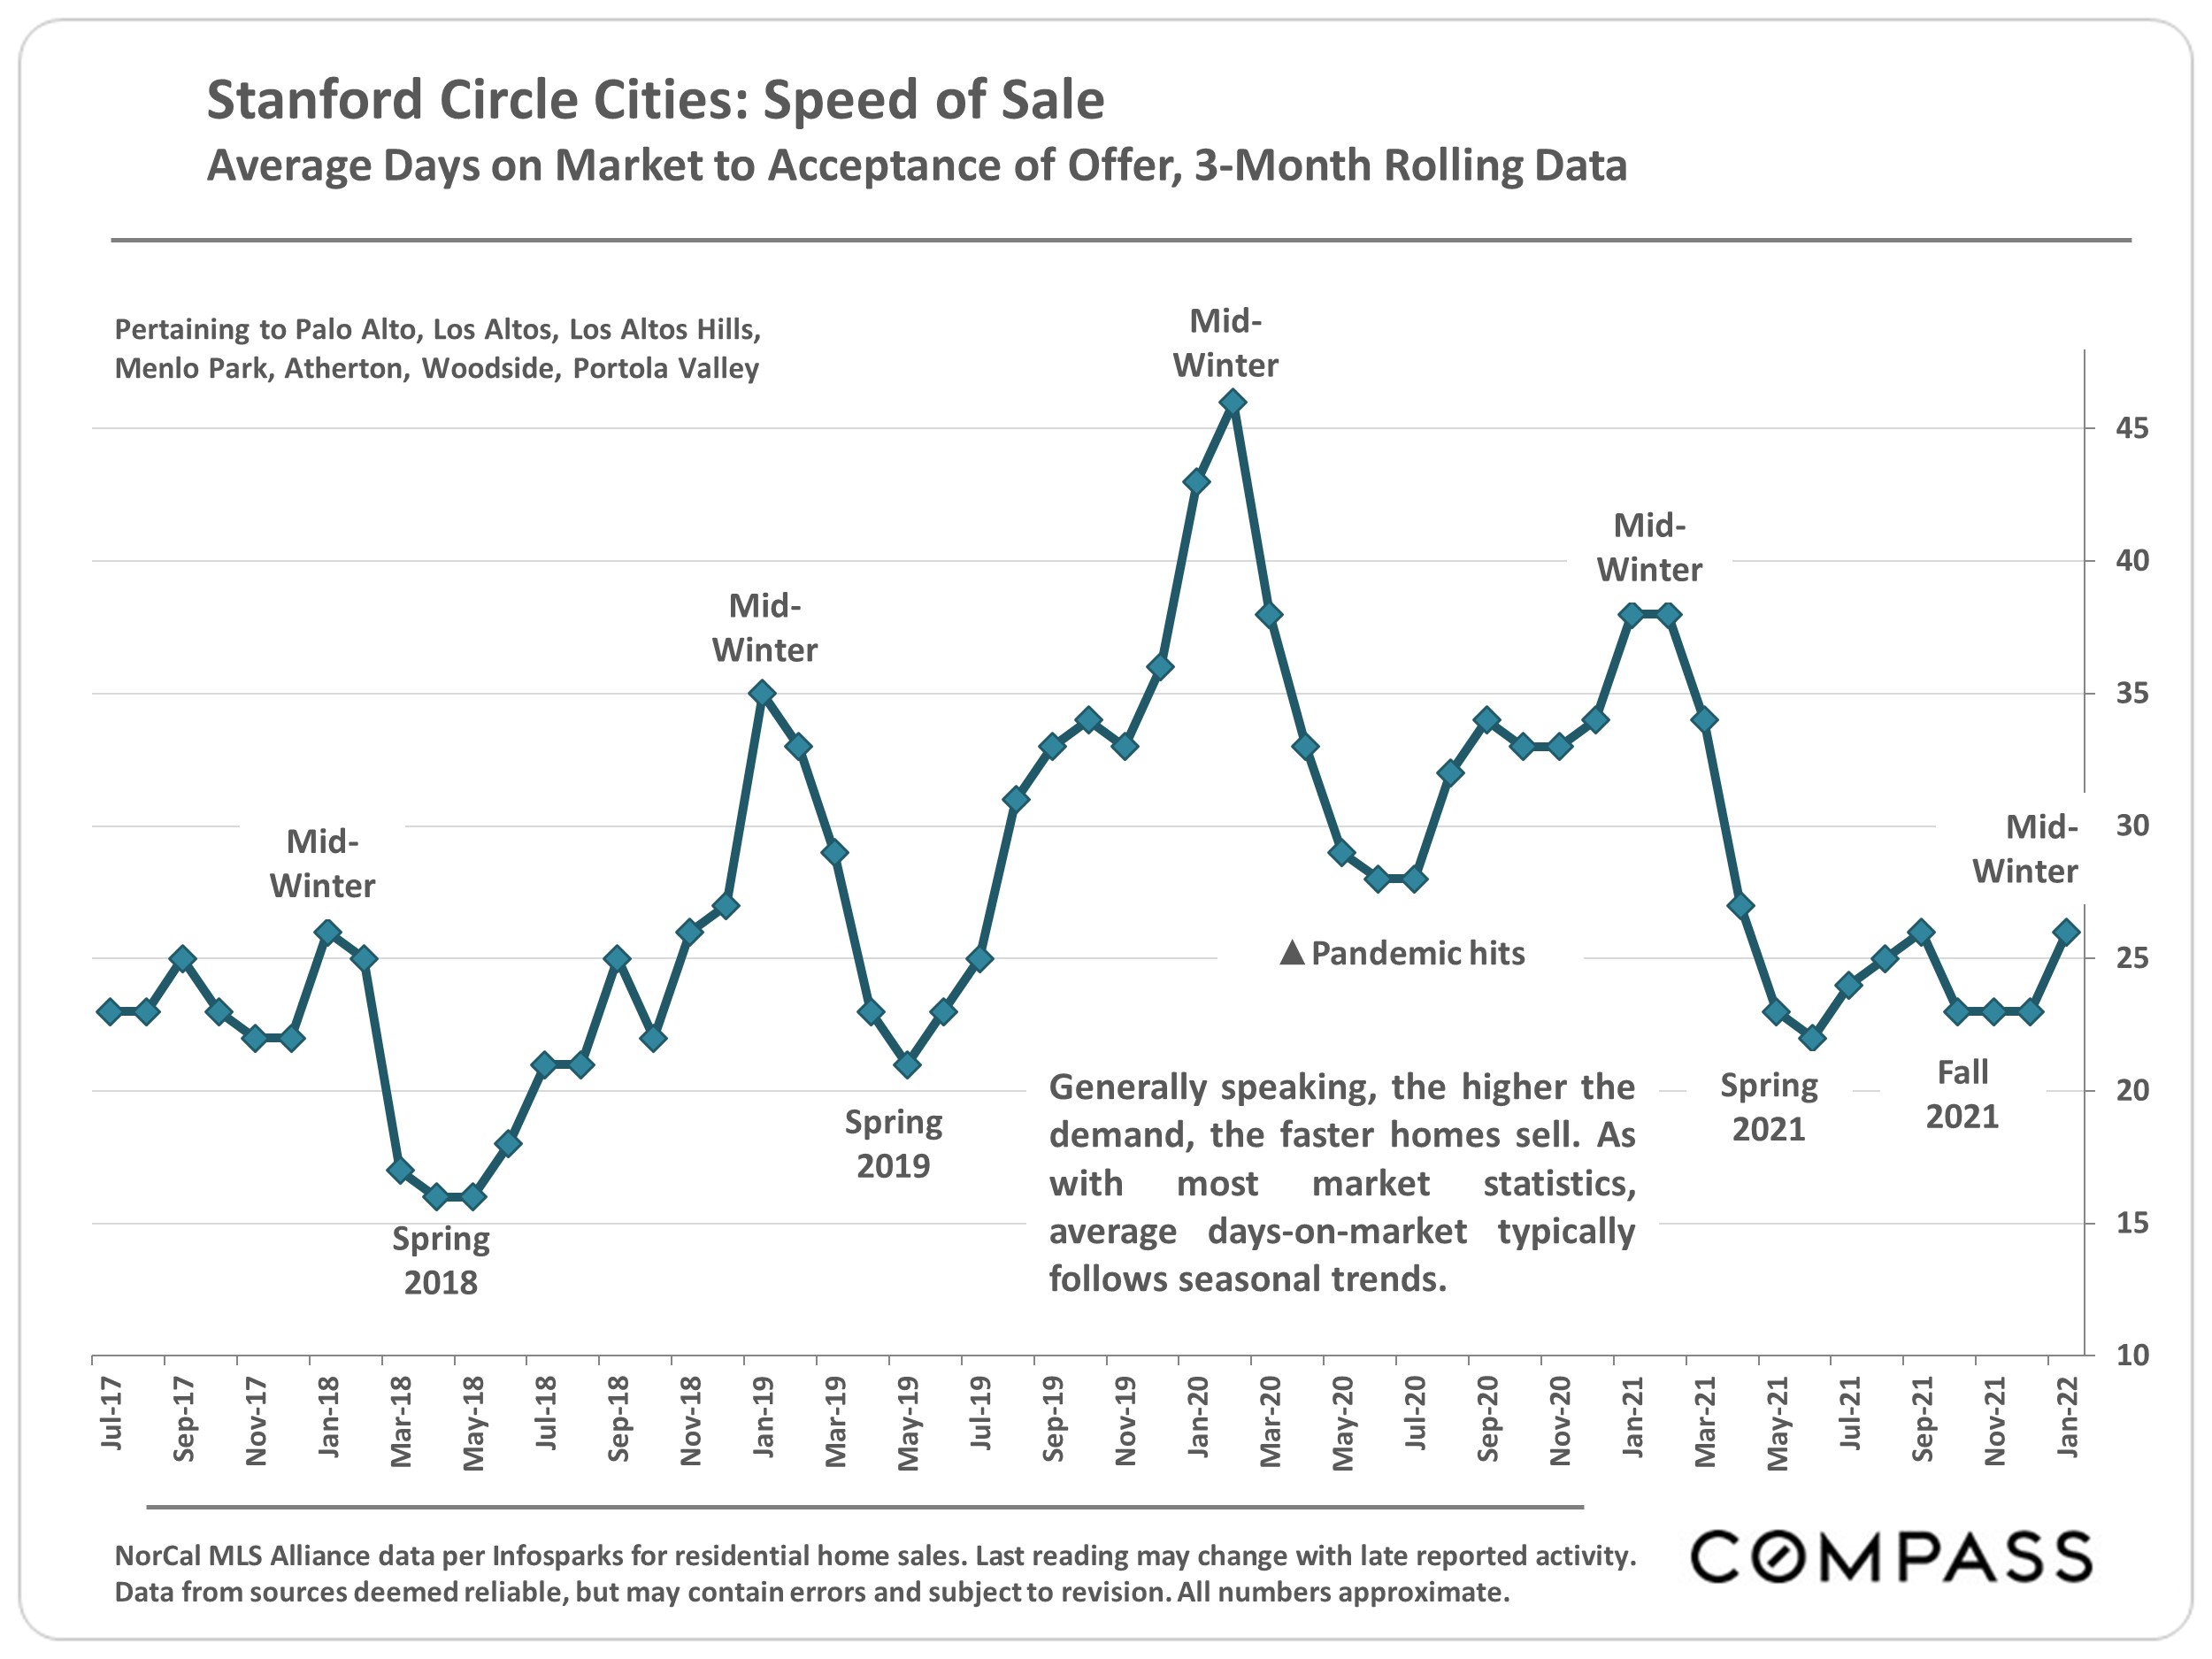
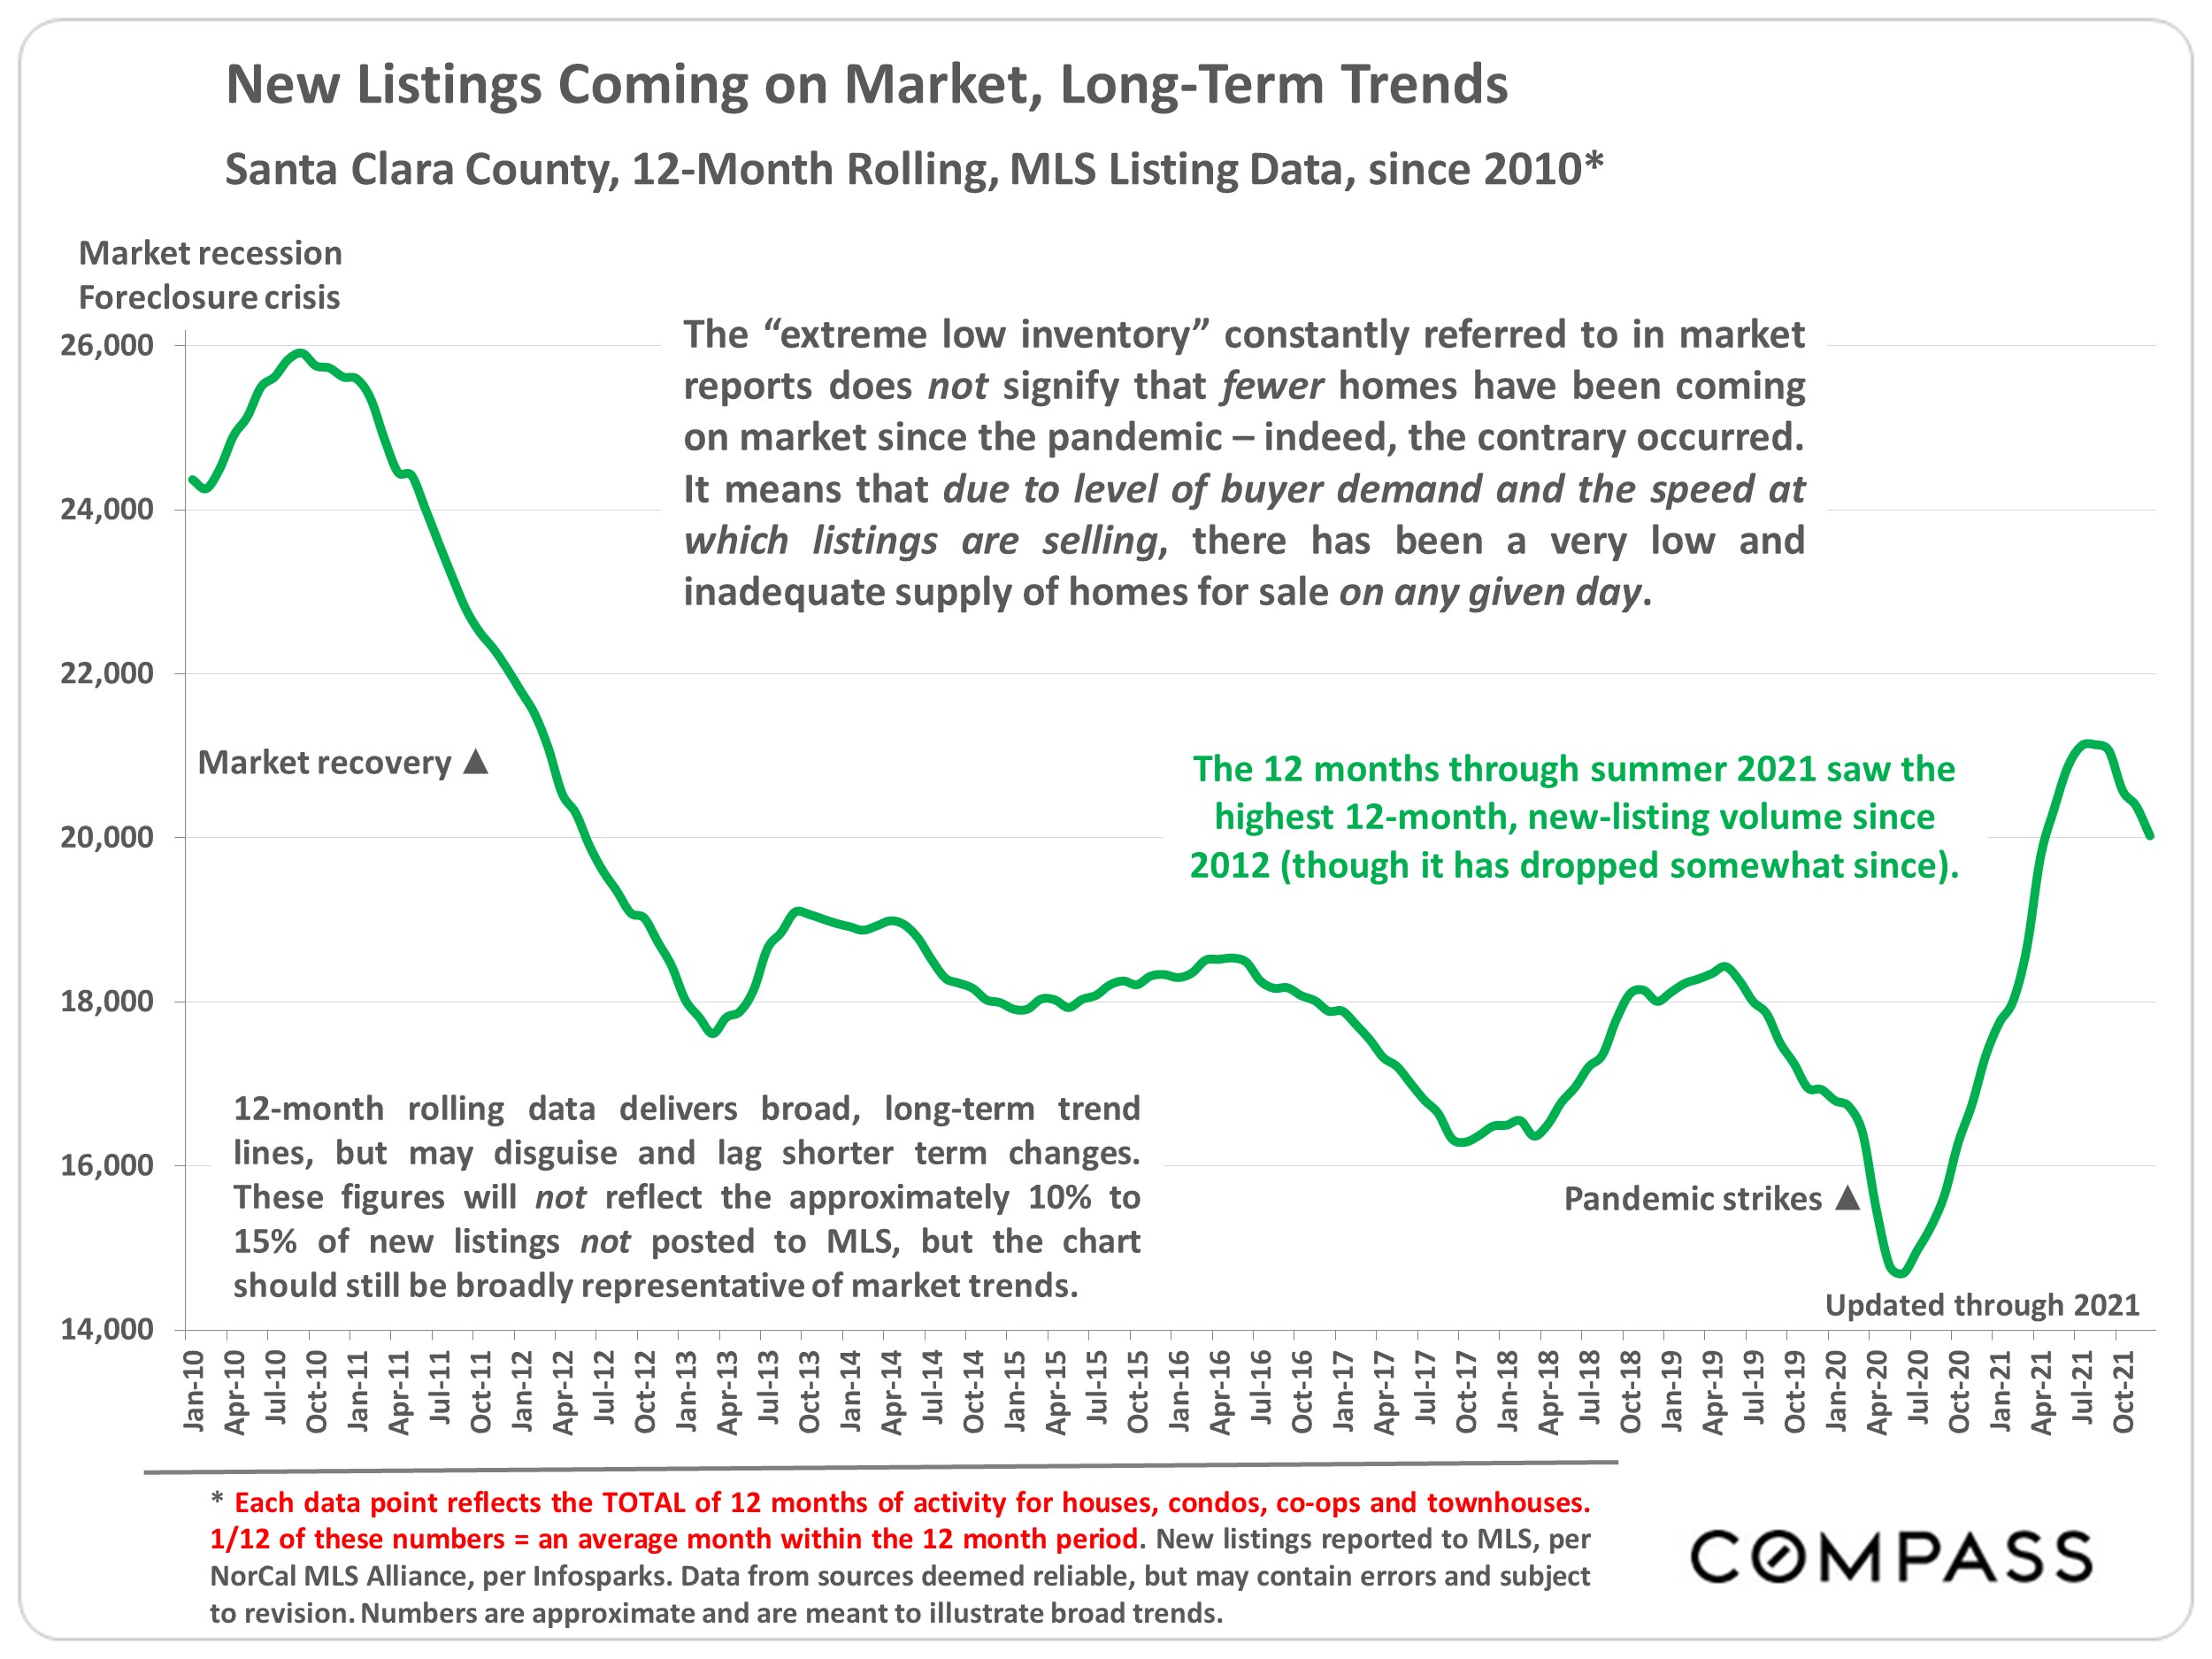
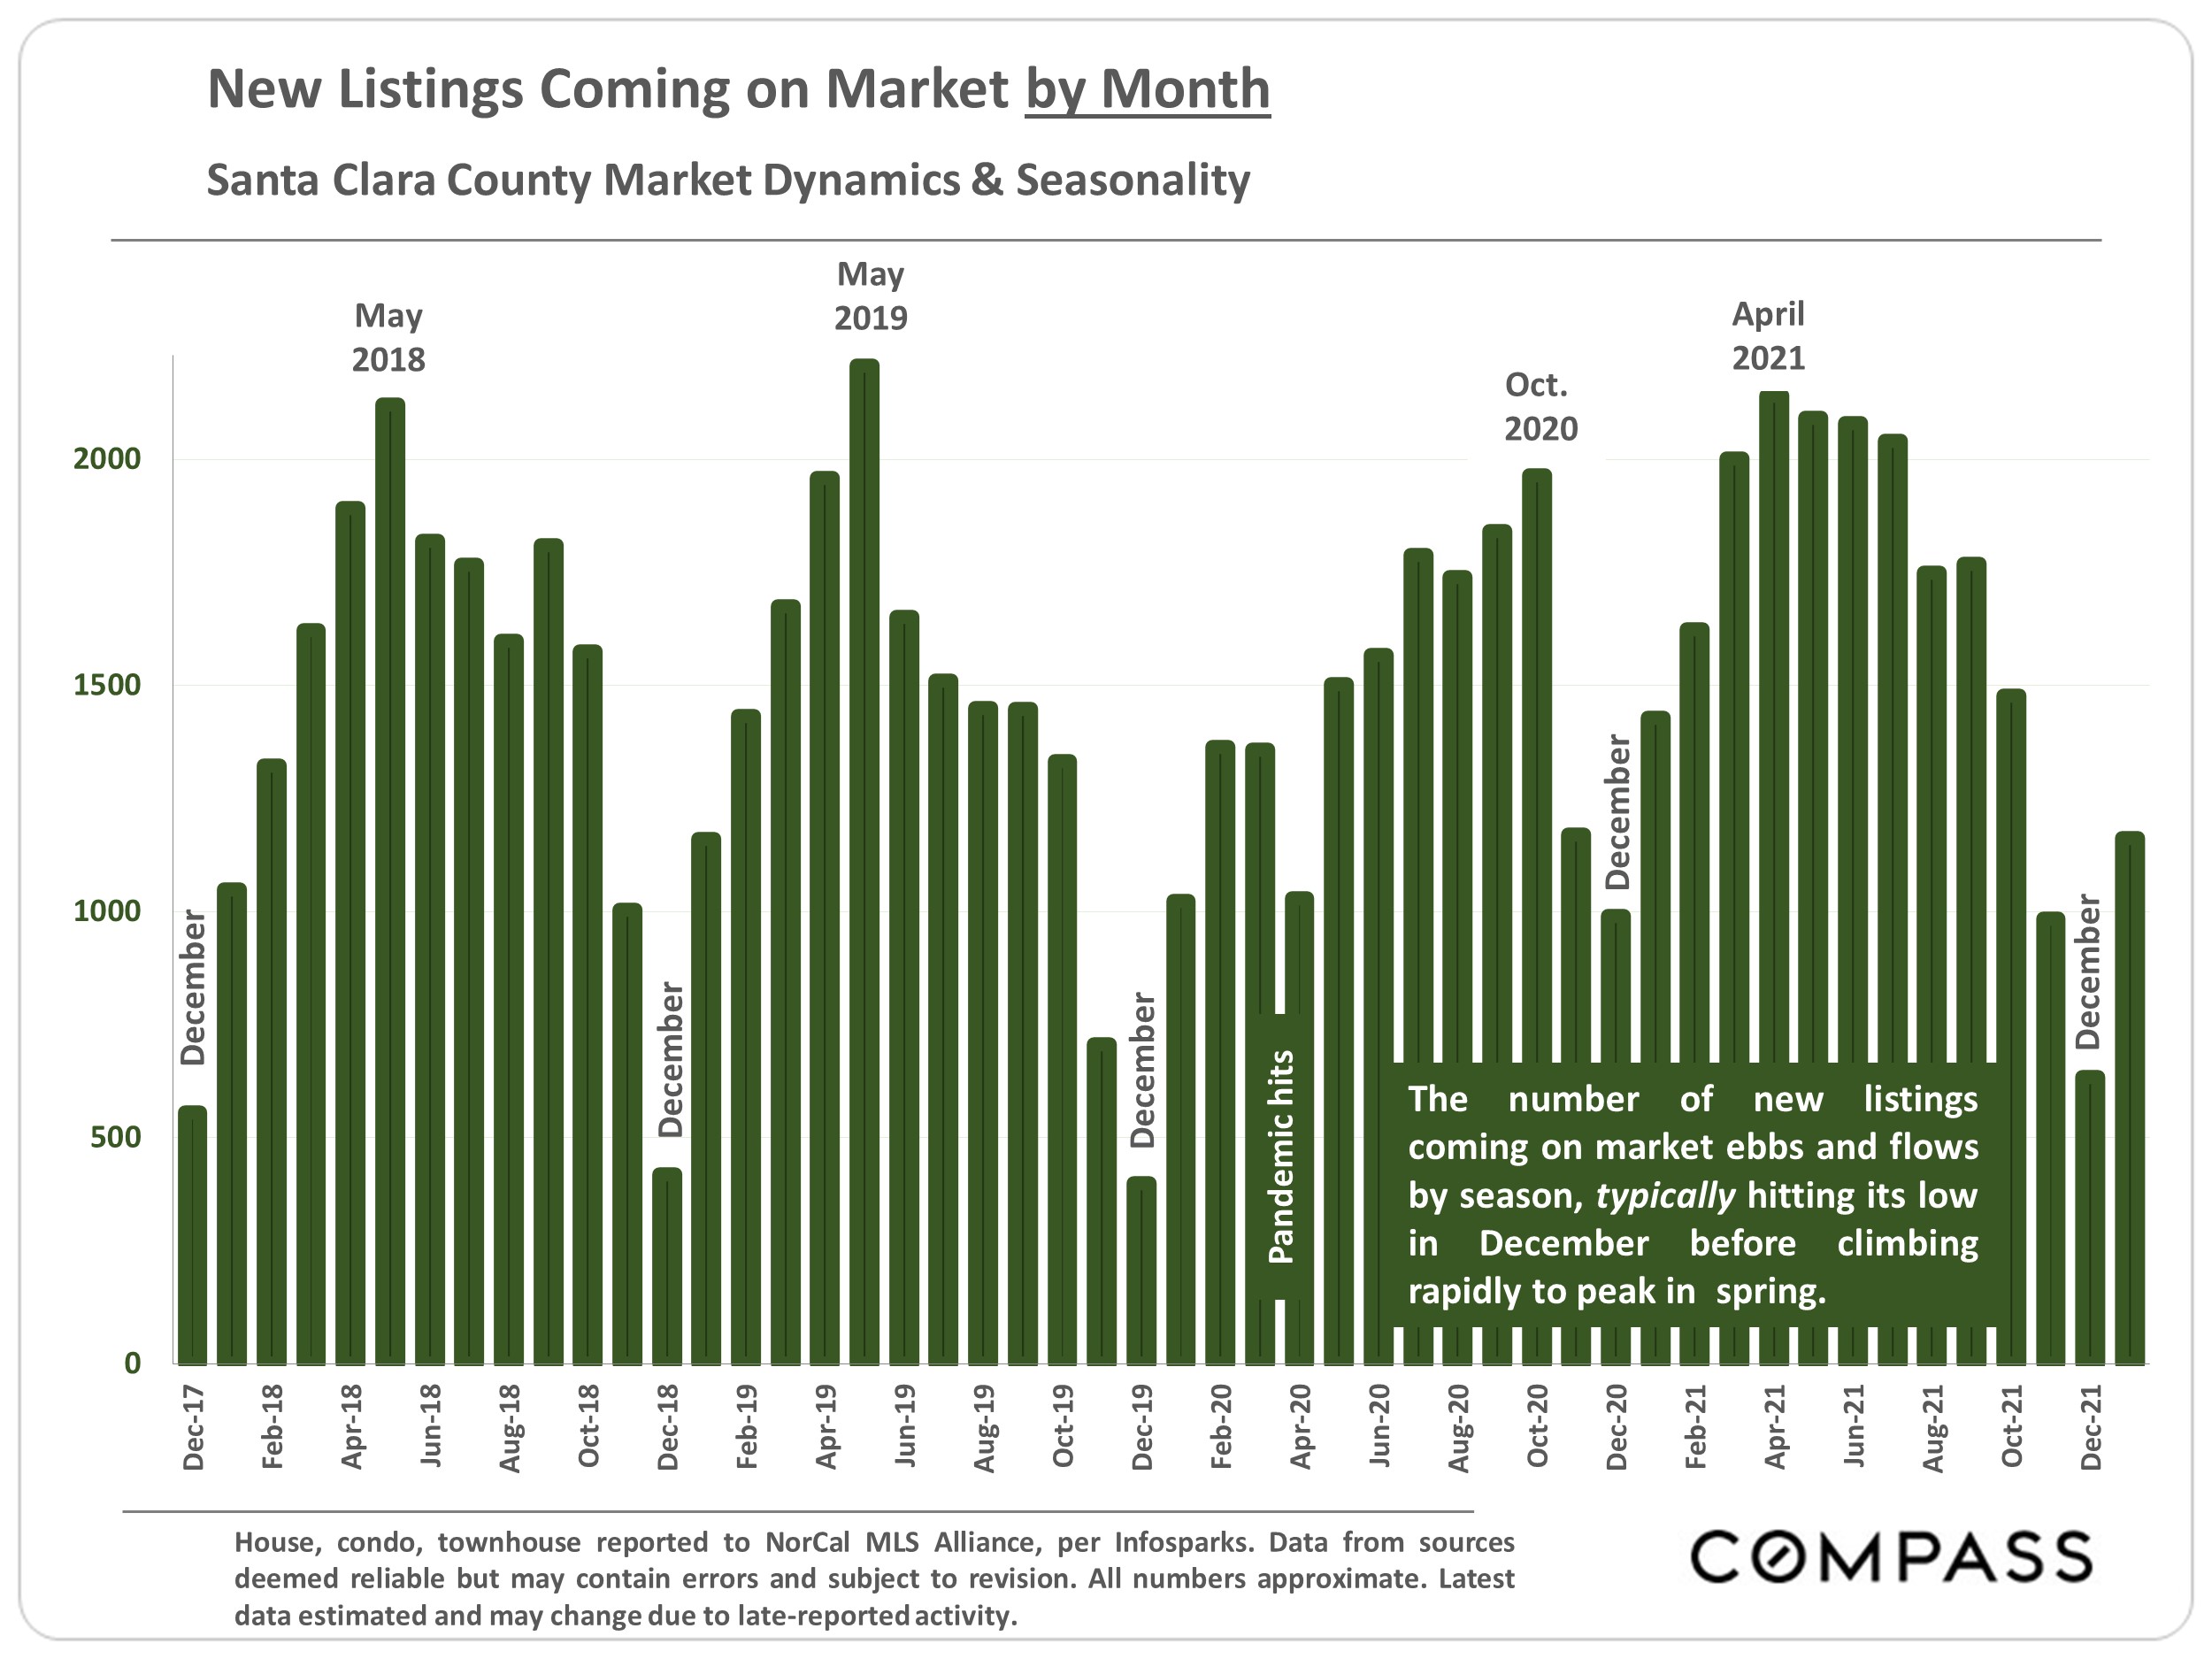
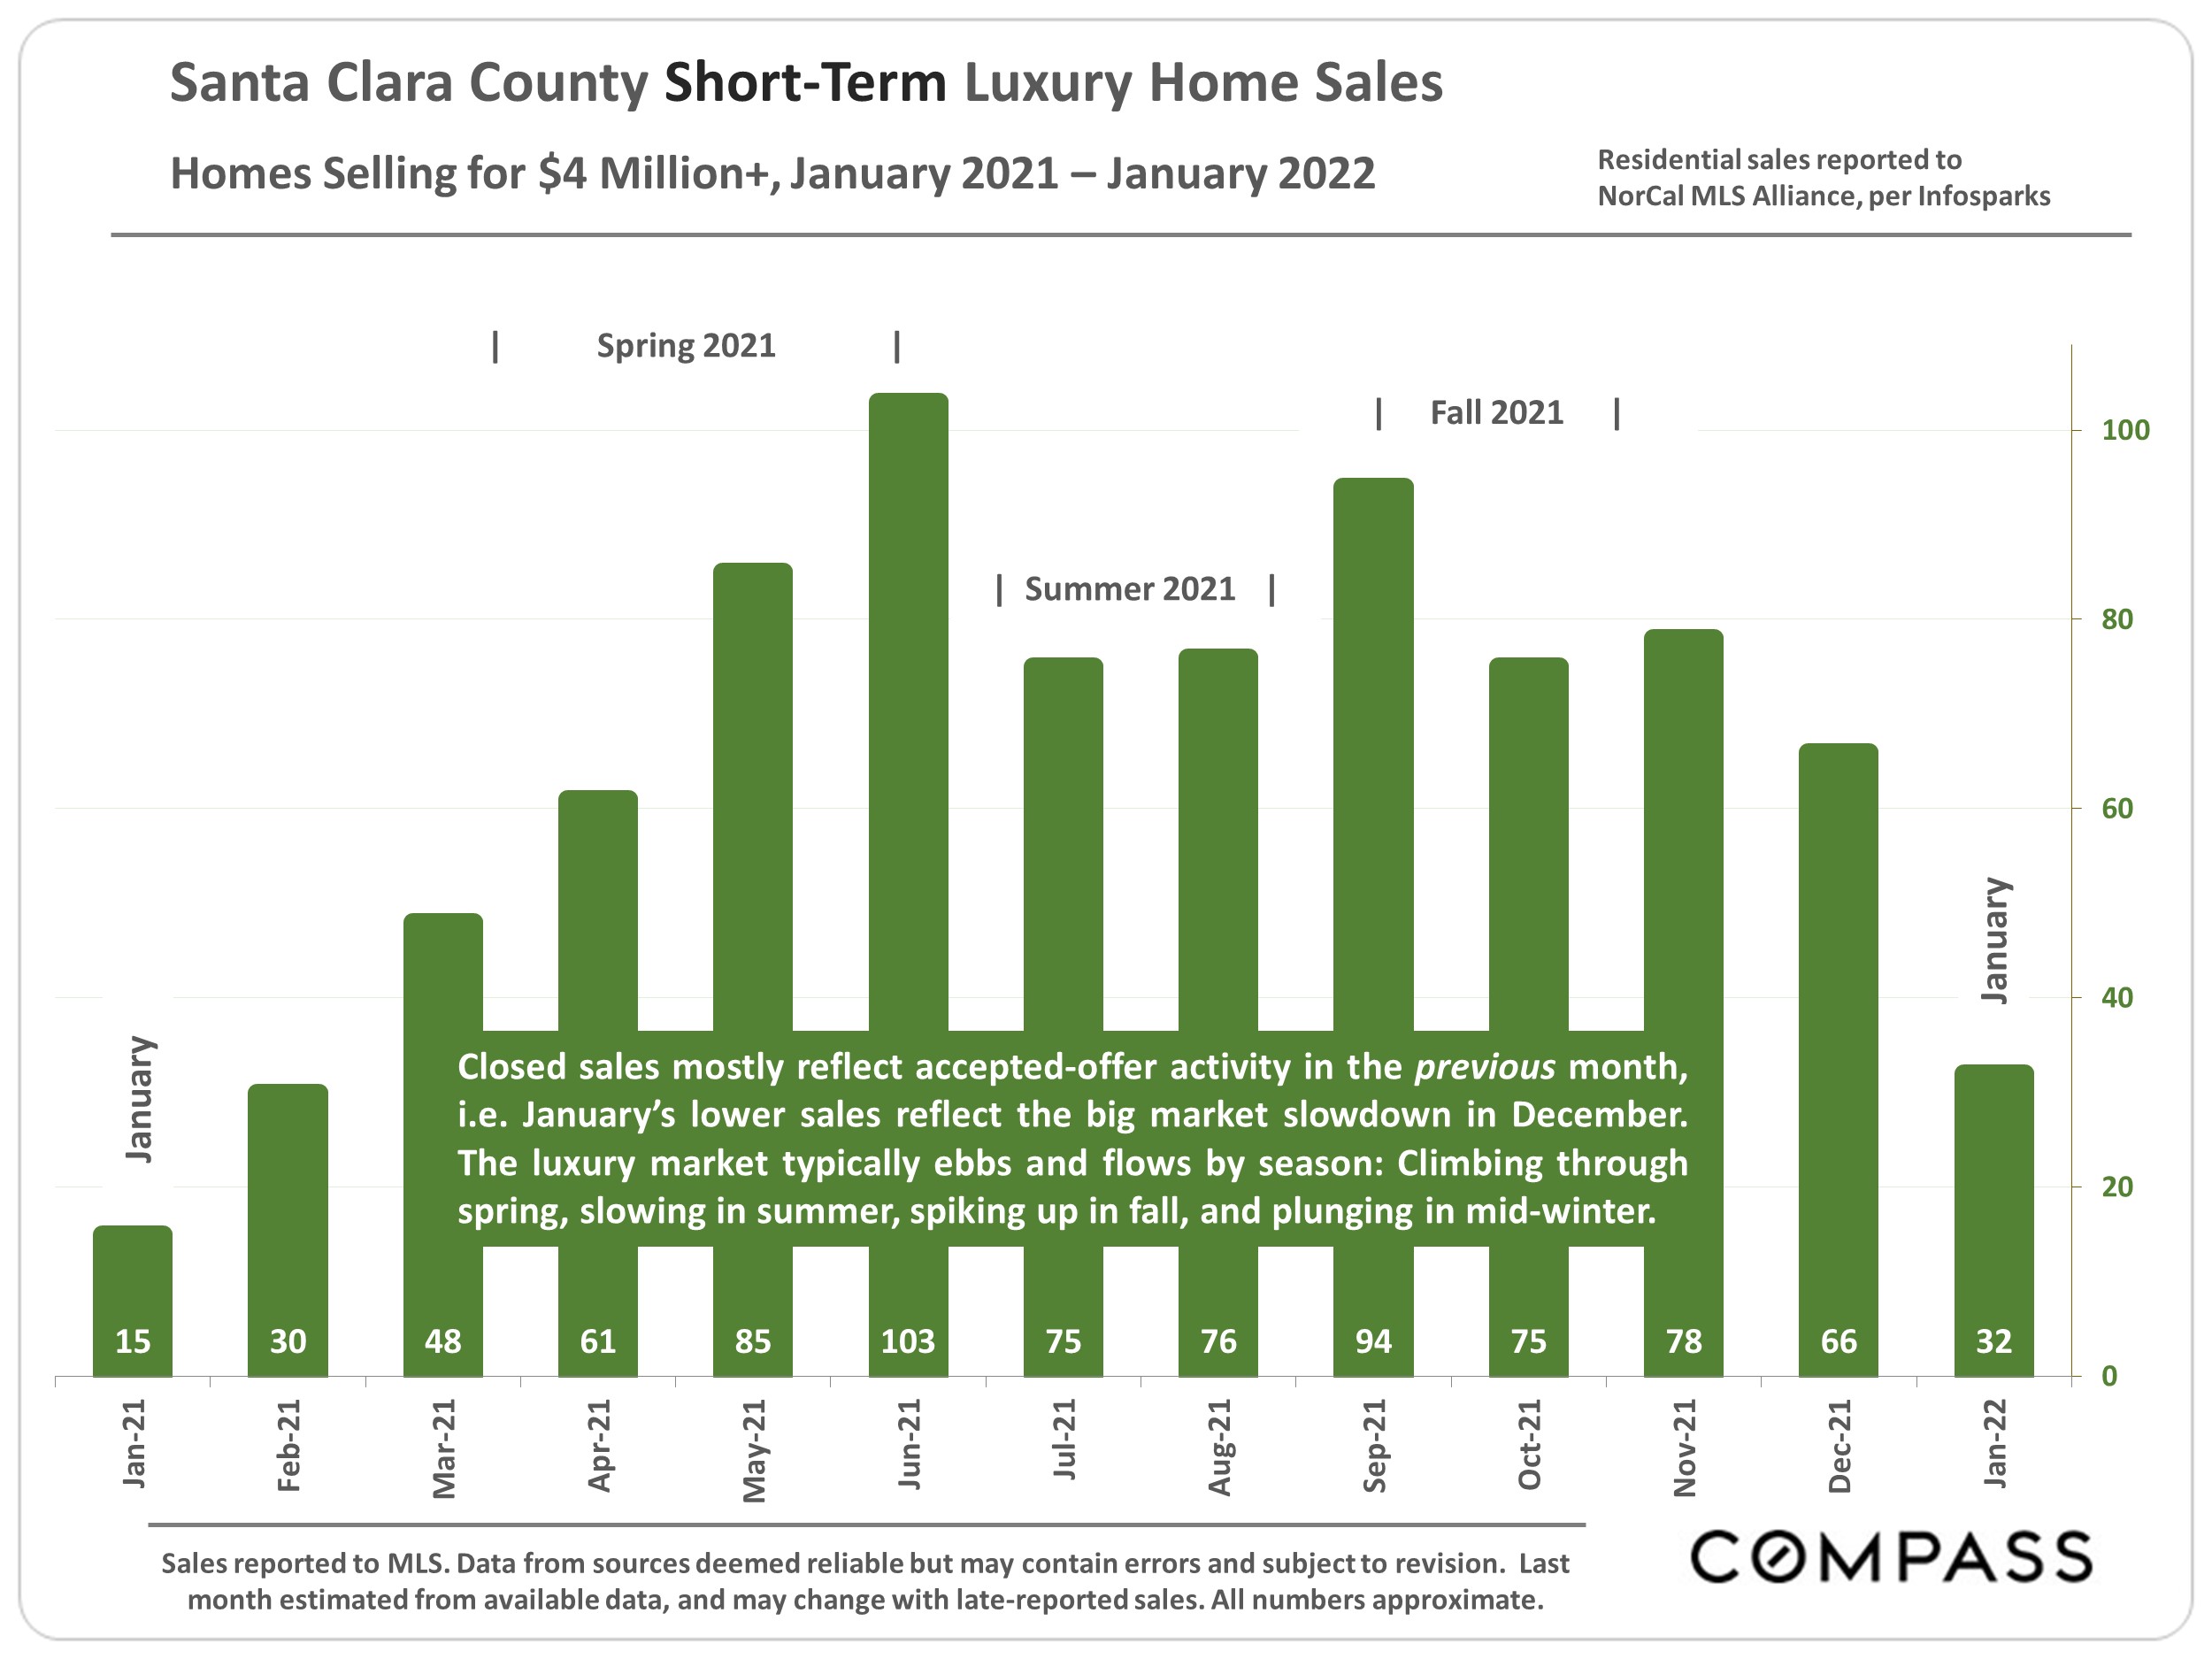
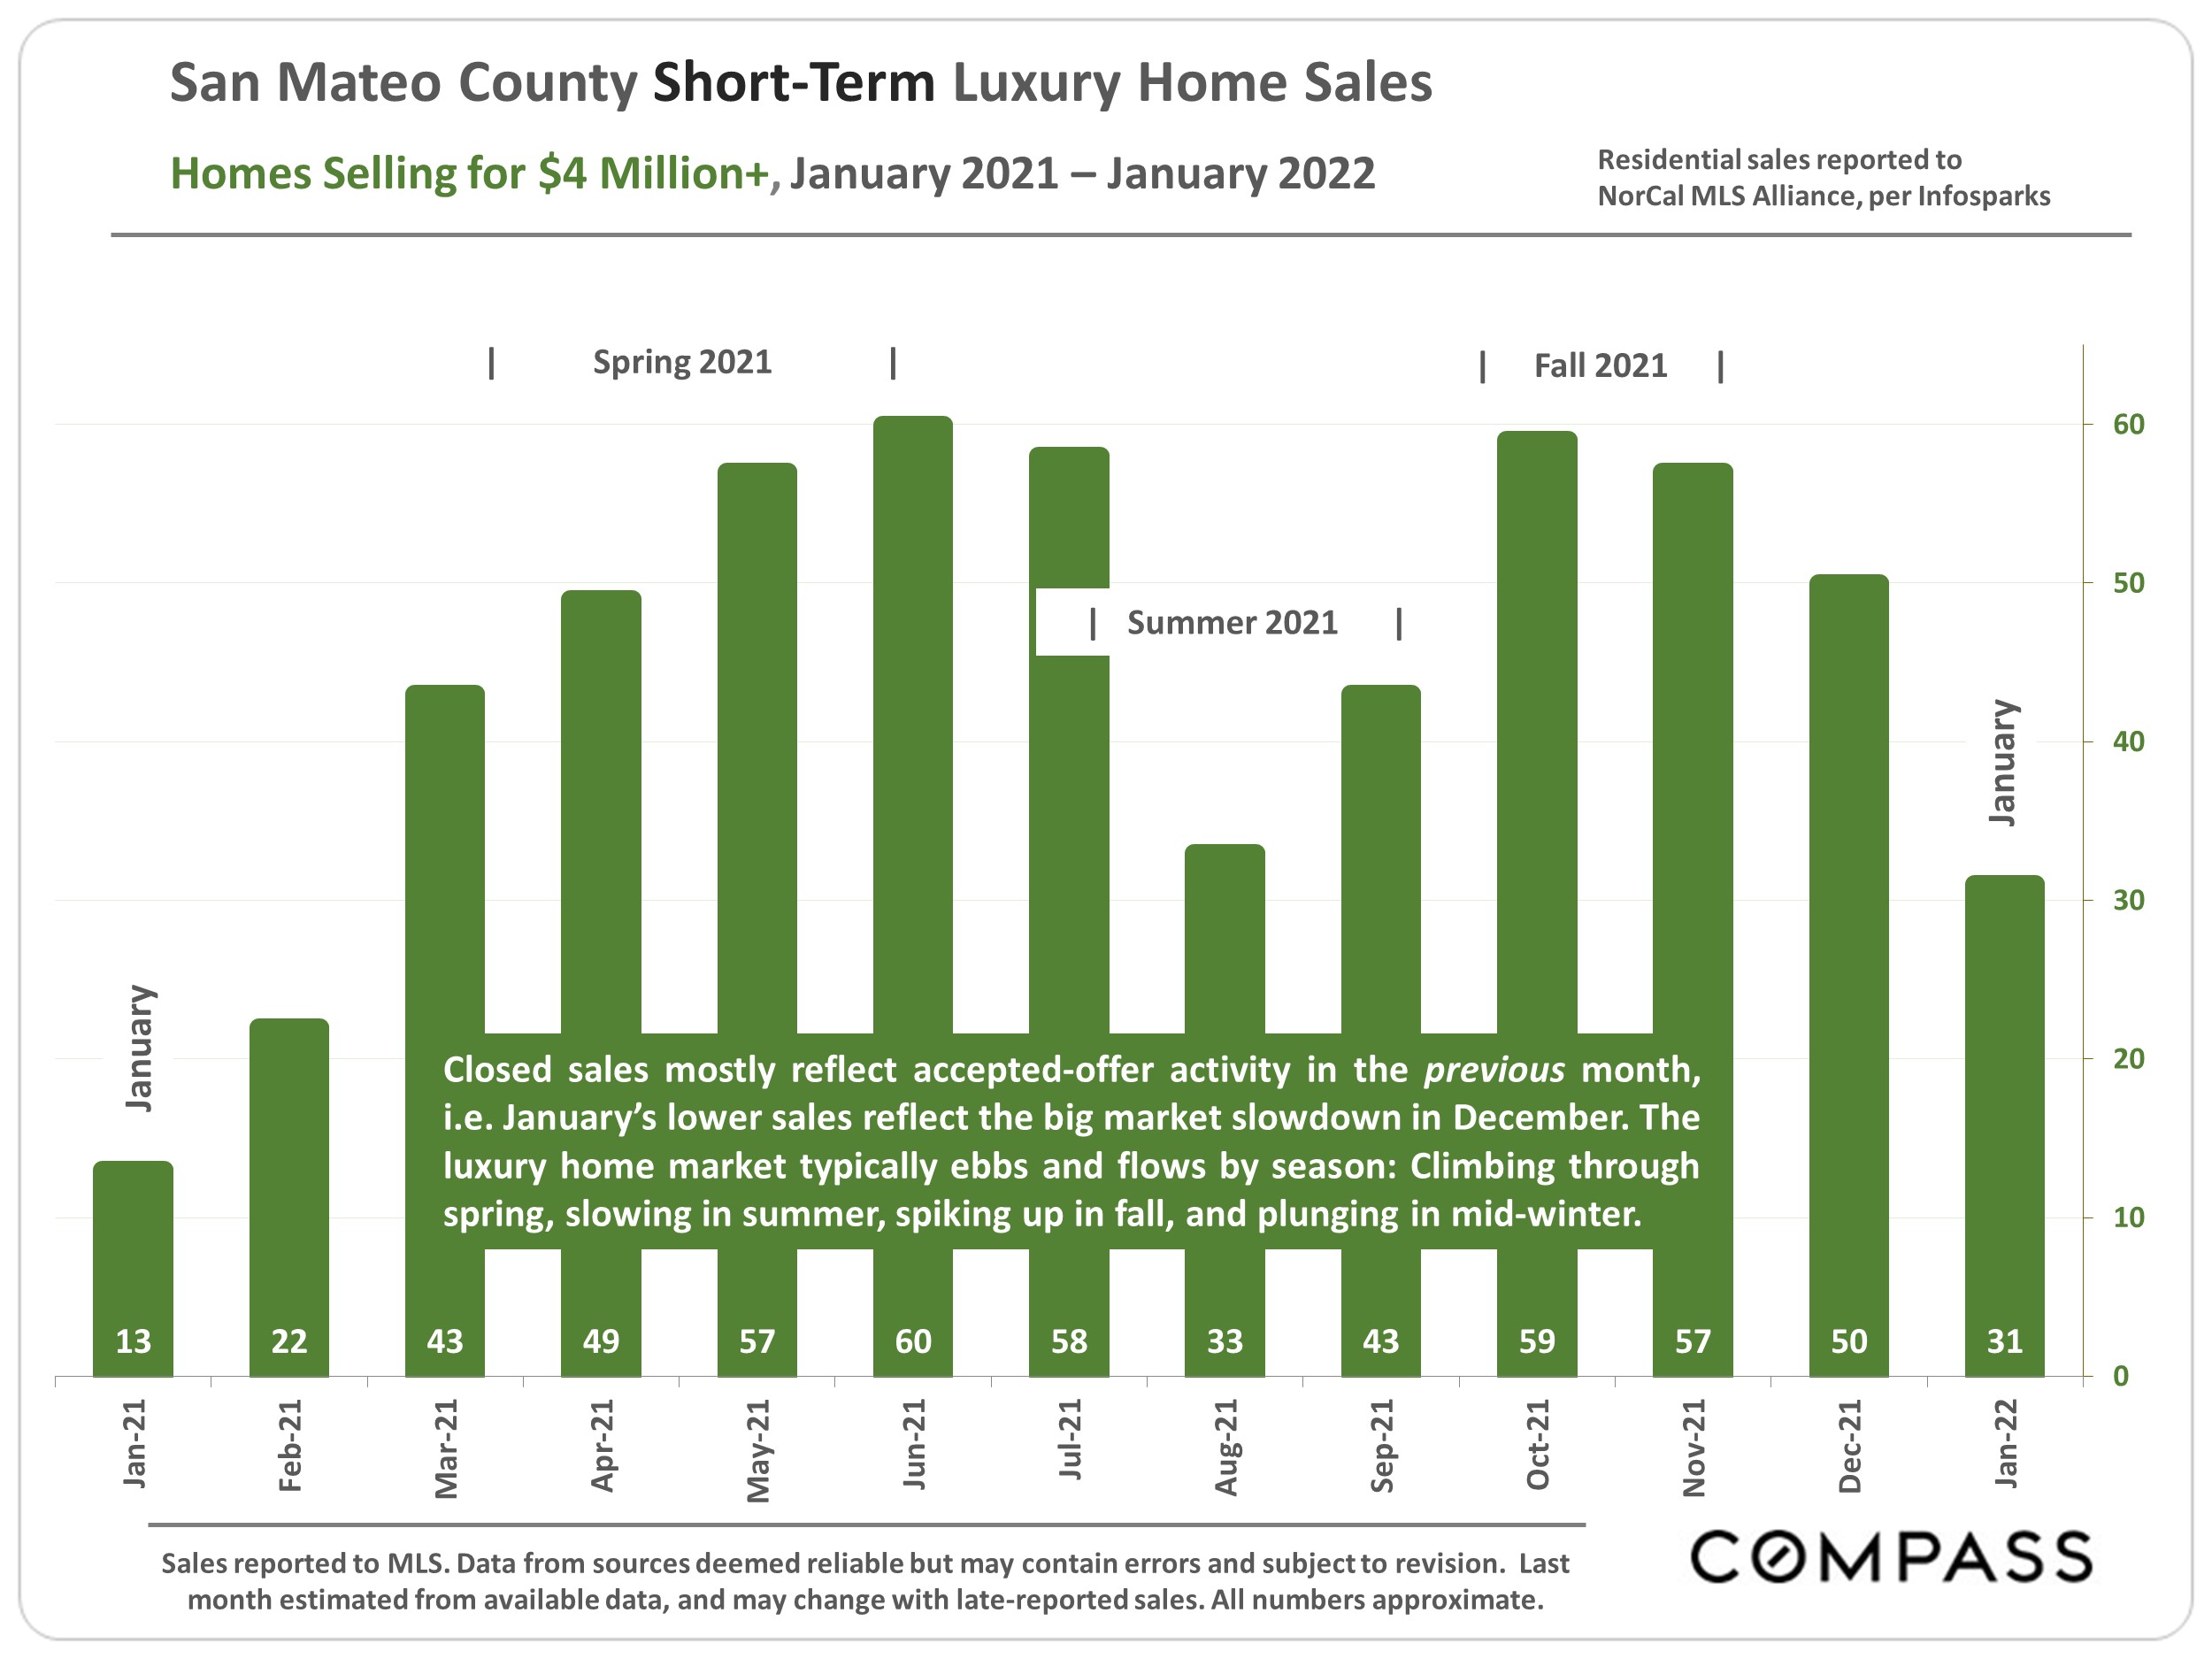
2021 was one of the most frenzied real estate markets ever, with buyer demand far exceeding the supply of listings available to buy — and all the usual indicators, including home price appreciation trends, reflected this severe imbalance. As is the normal seasonal trend, listing and offer activity dropped substantially mid- November through early January, resulting in very low sales volume in the year’s first month.

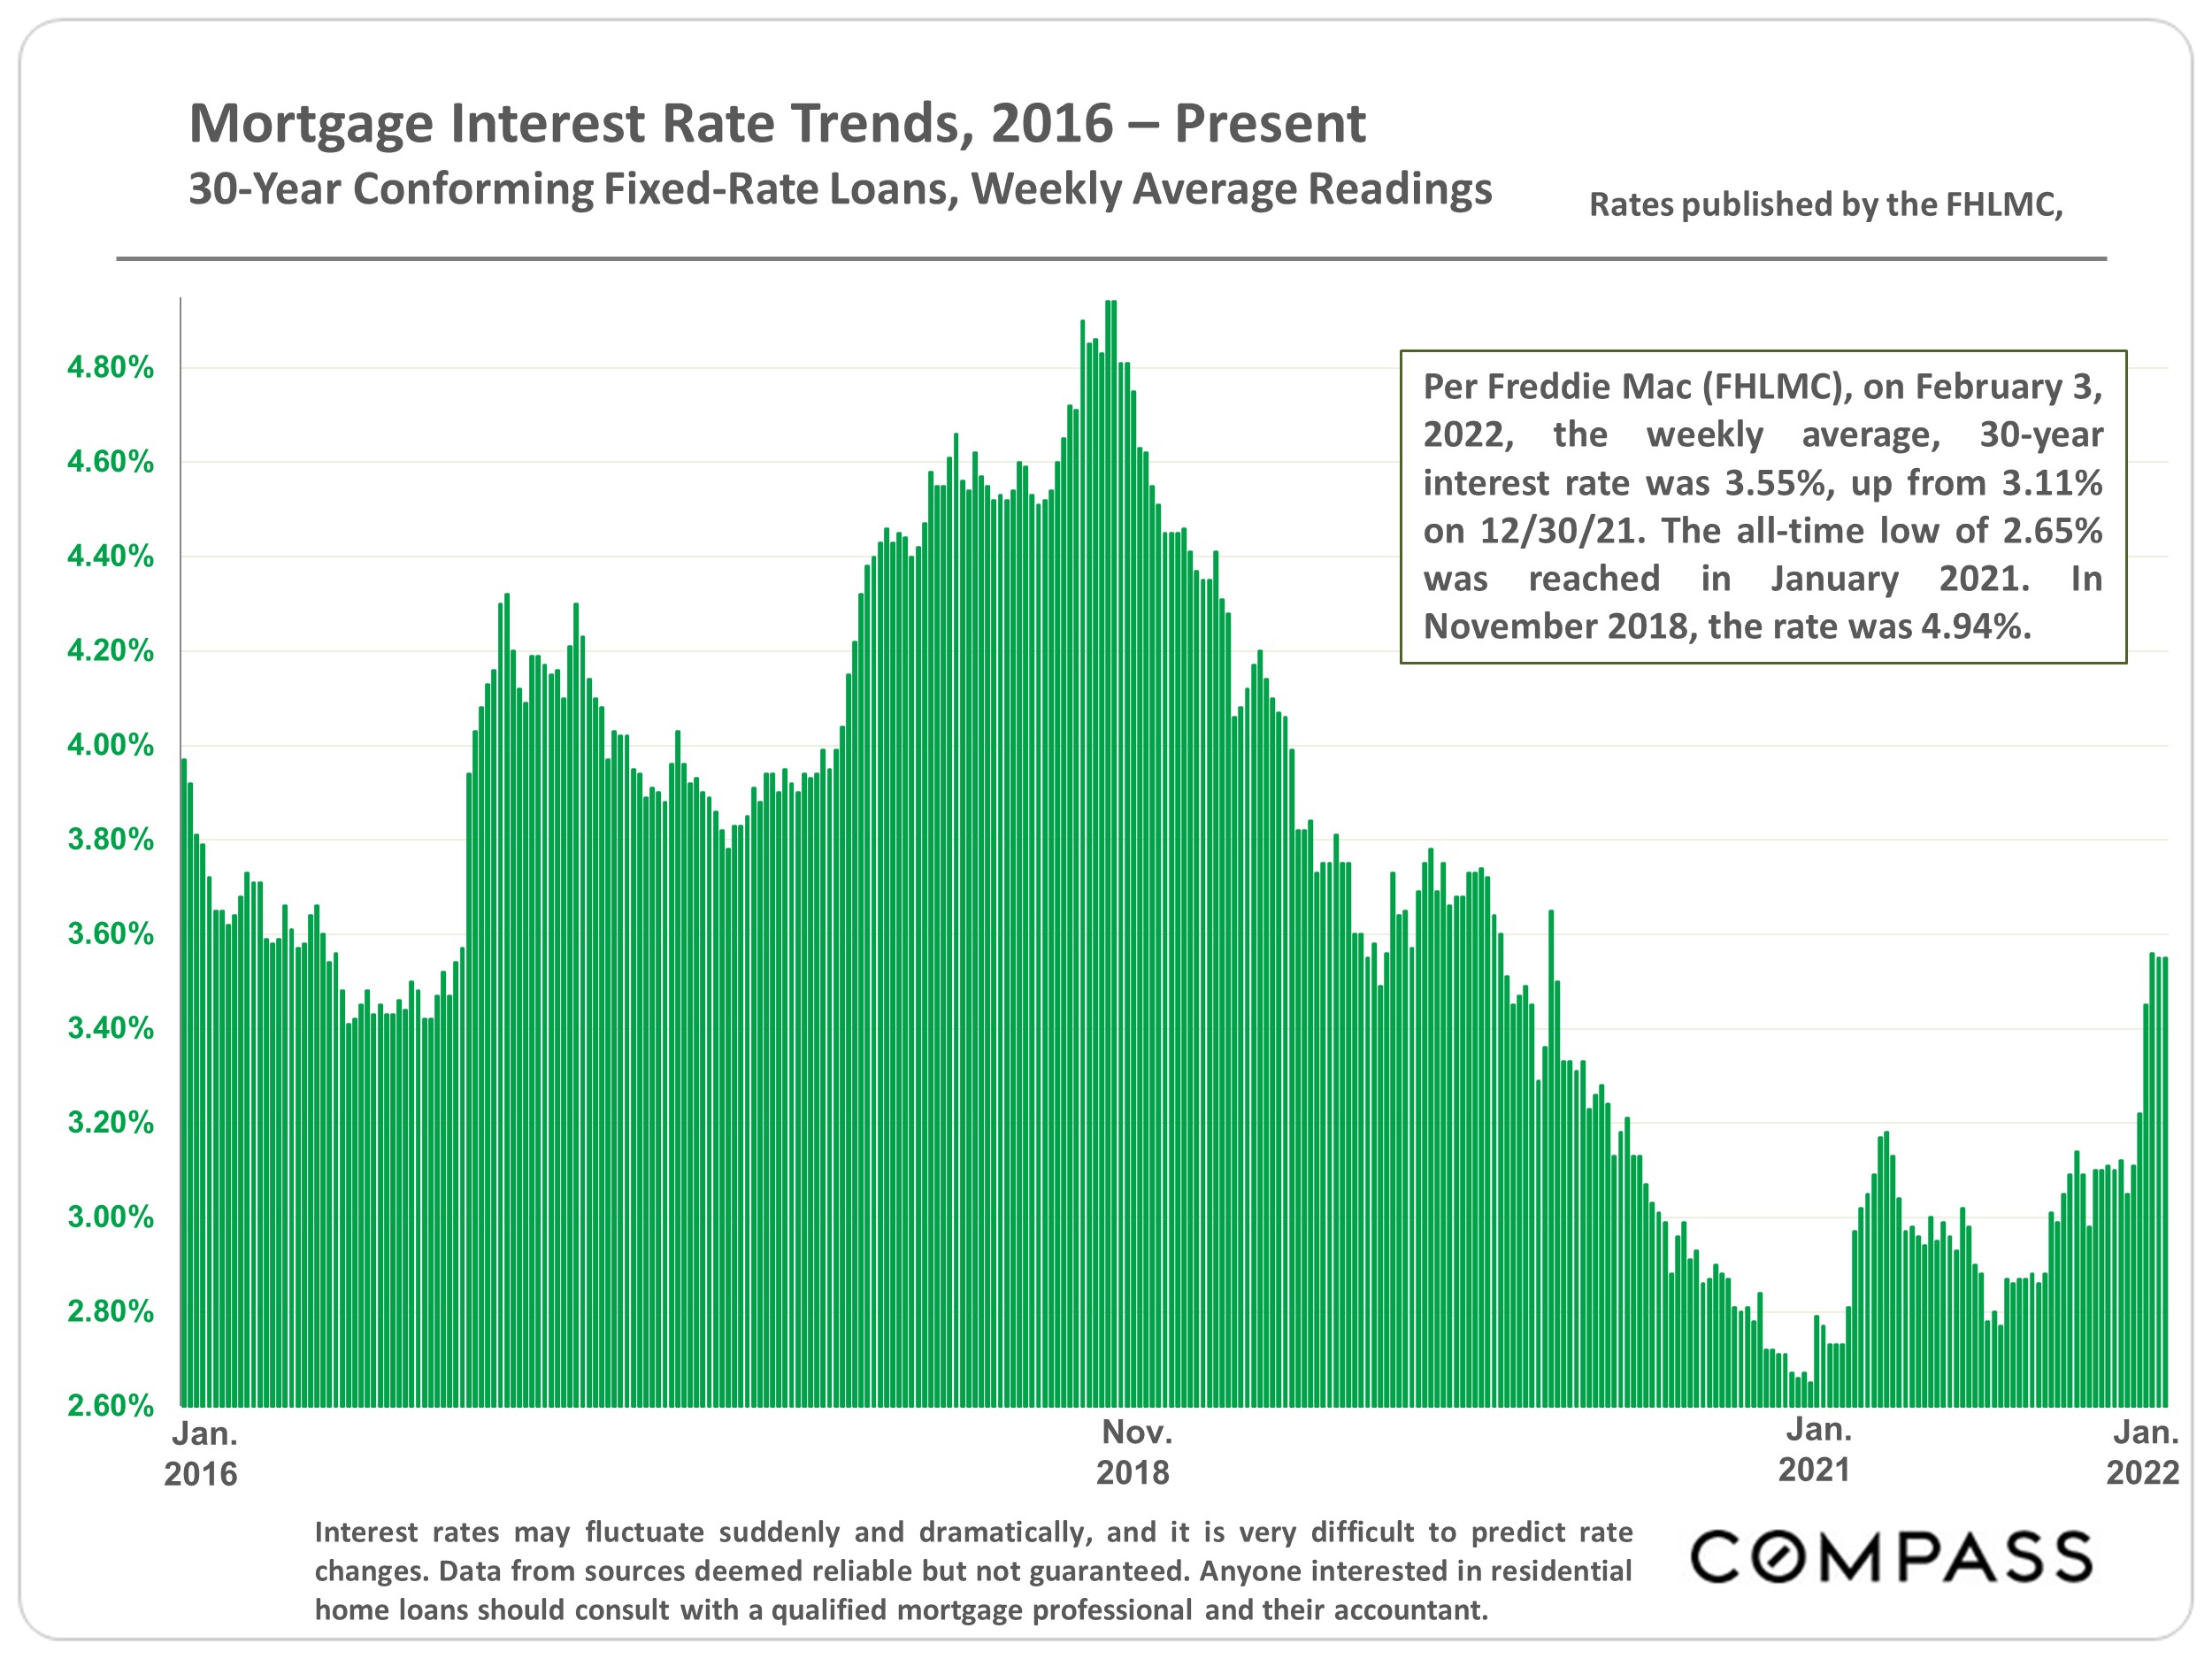
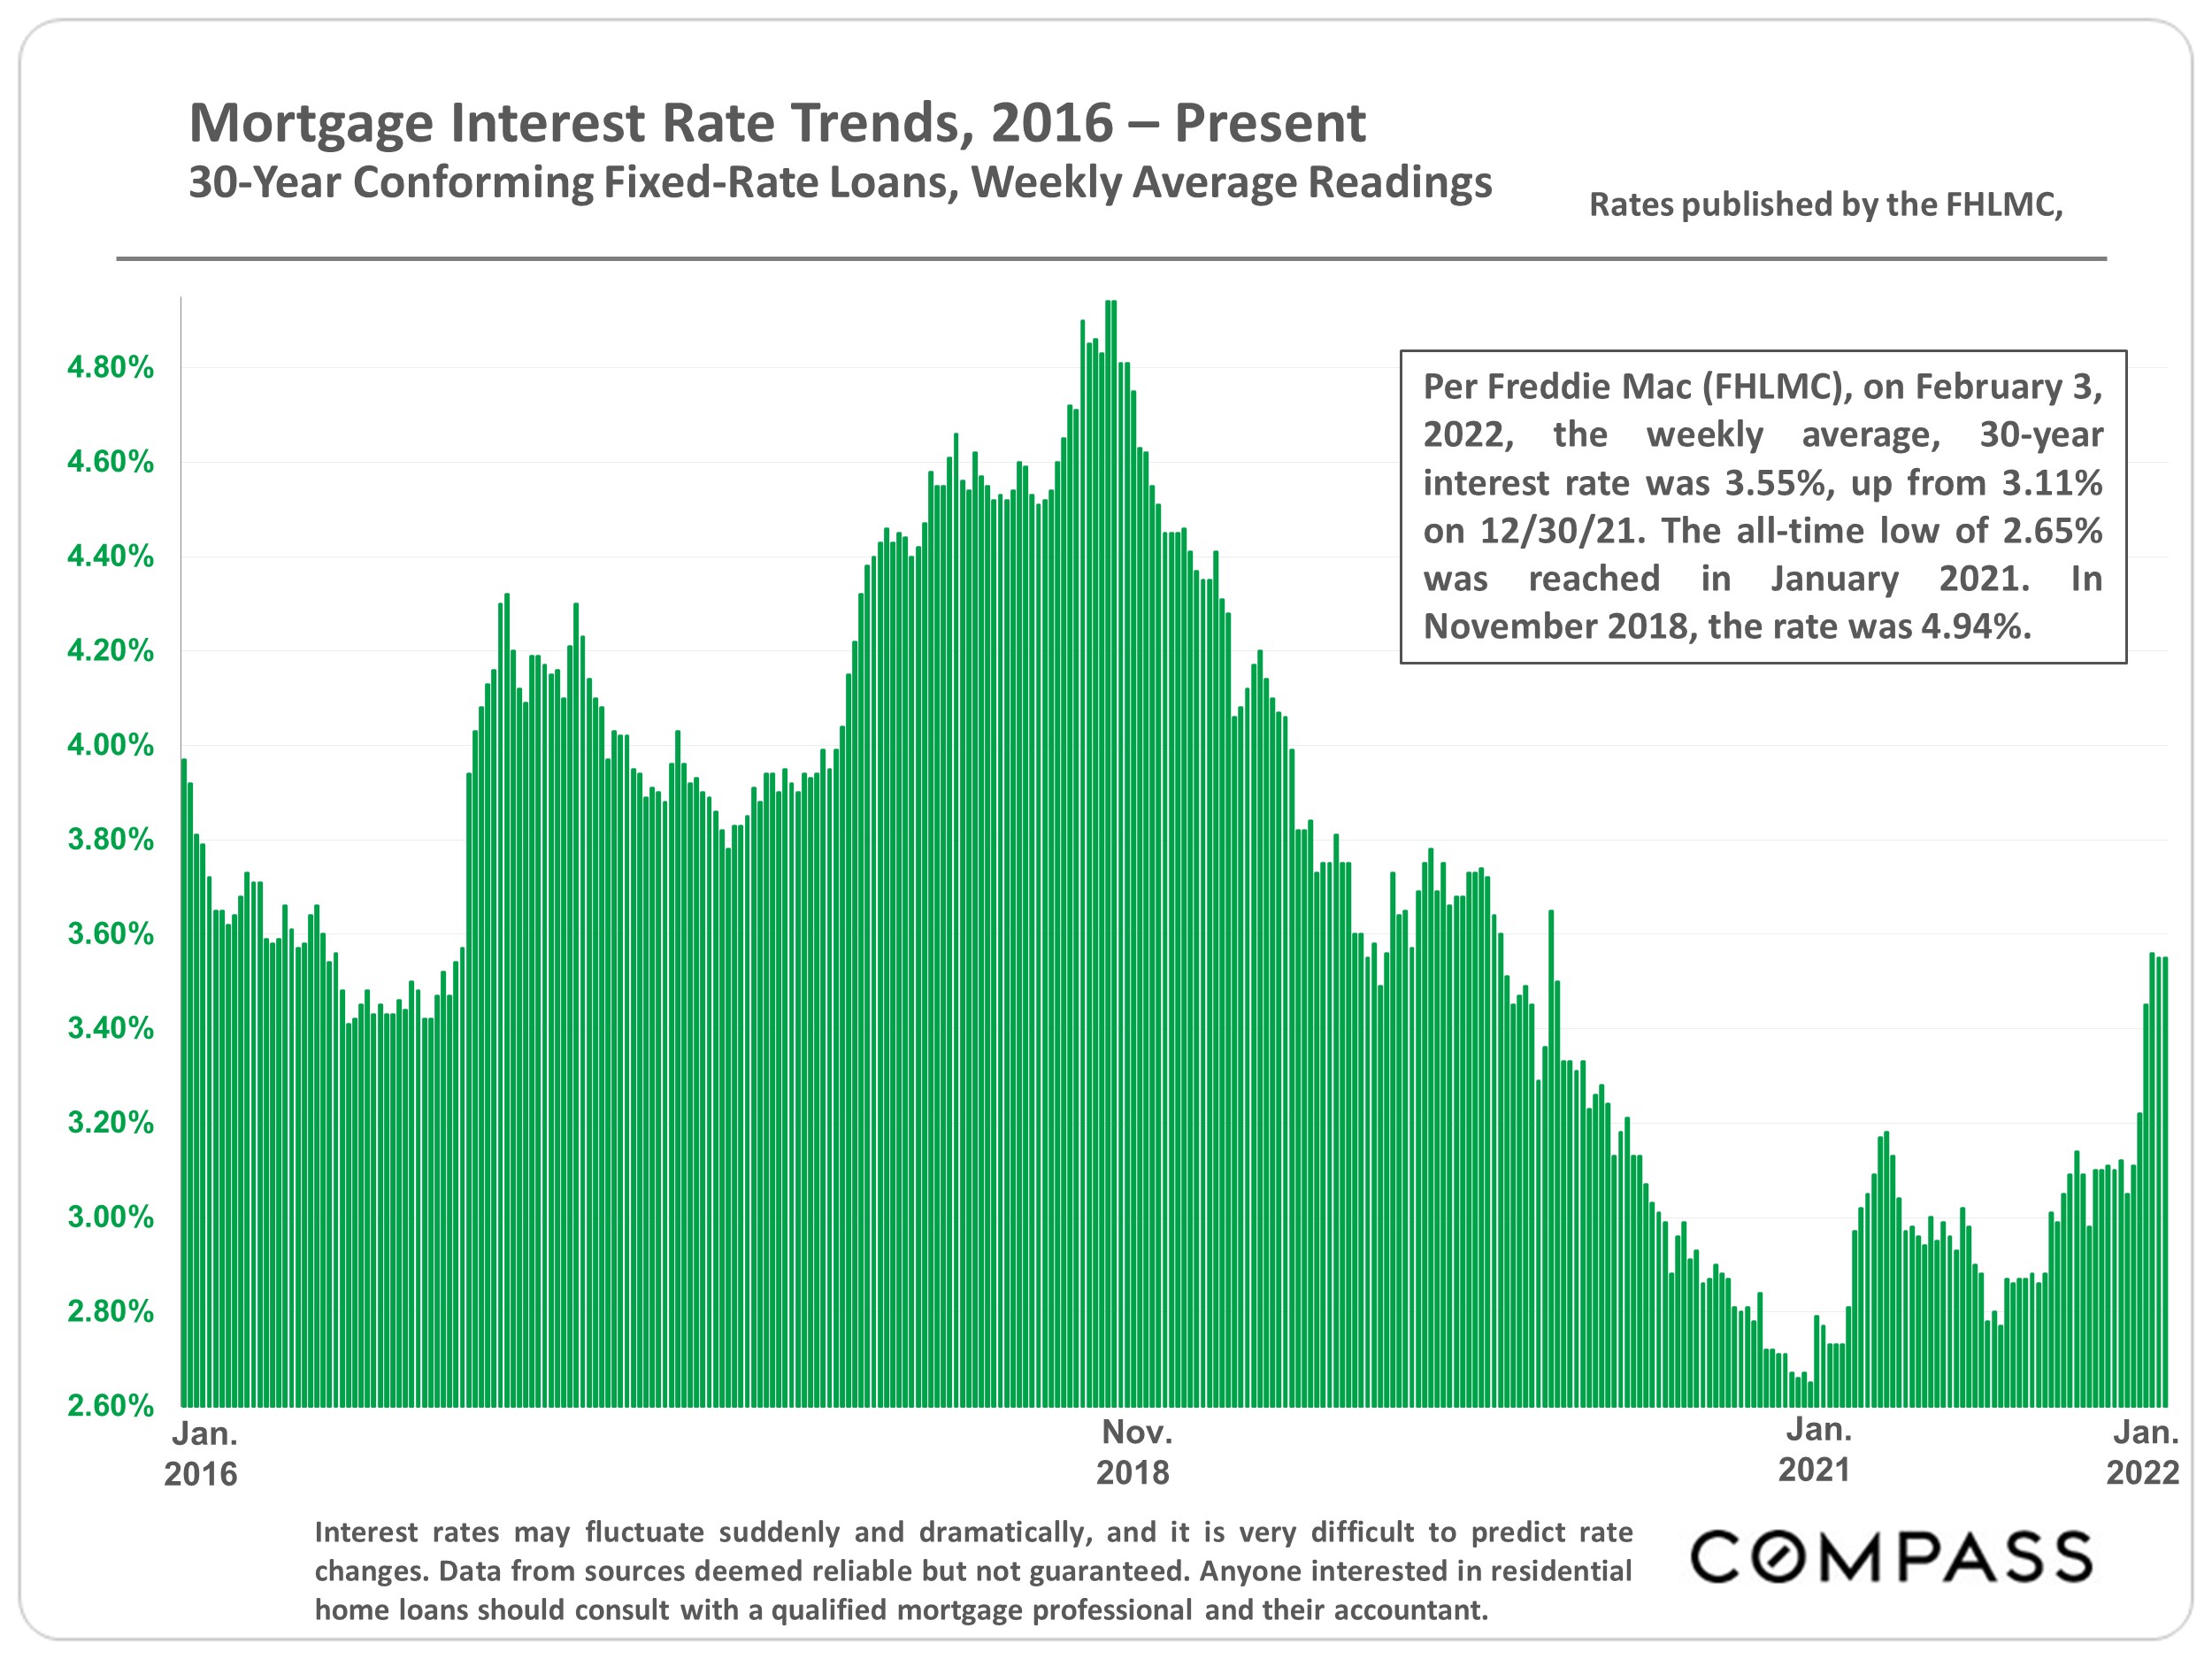
As of 2/3/22, mortgage interest rates have risen 14% in 2022, putting them 34% above the low 1 year ago. Inflation is at a 40-year high, and the Fed plans to make major changes to its interest-rate policies and its interventions in the economy generally. Consumer confidence has been dropping, and financial markets have seen considerable turbulence in the new year. Geopolitical risks of major-power conflict appear to be rising.

On the other hand, employment, GDP, and household-wealth indicators are quite positive; by historical standards, interest rates remain very low and stock markets very high; COVID infections are falling. The Bay Area is home to many of the world’s most innovative and successful companies; there is an enormous concentration of local wealth; and a staggering amount of money sloshing around the economy looking for somewhere to invest. Many believe real estate to be an excellent hedge against inflation, and an excellent long-term investment generally (heightened by tax advantages).

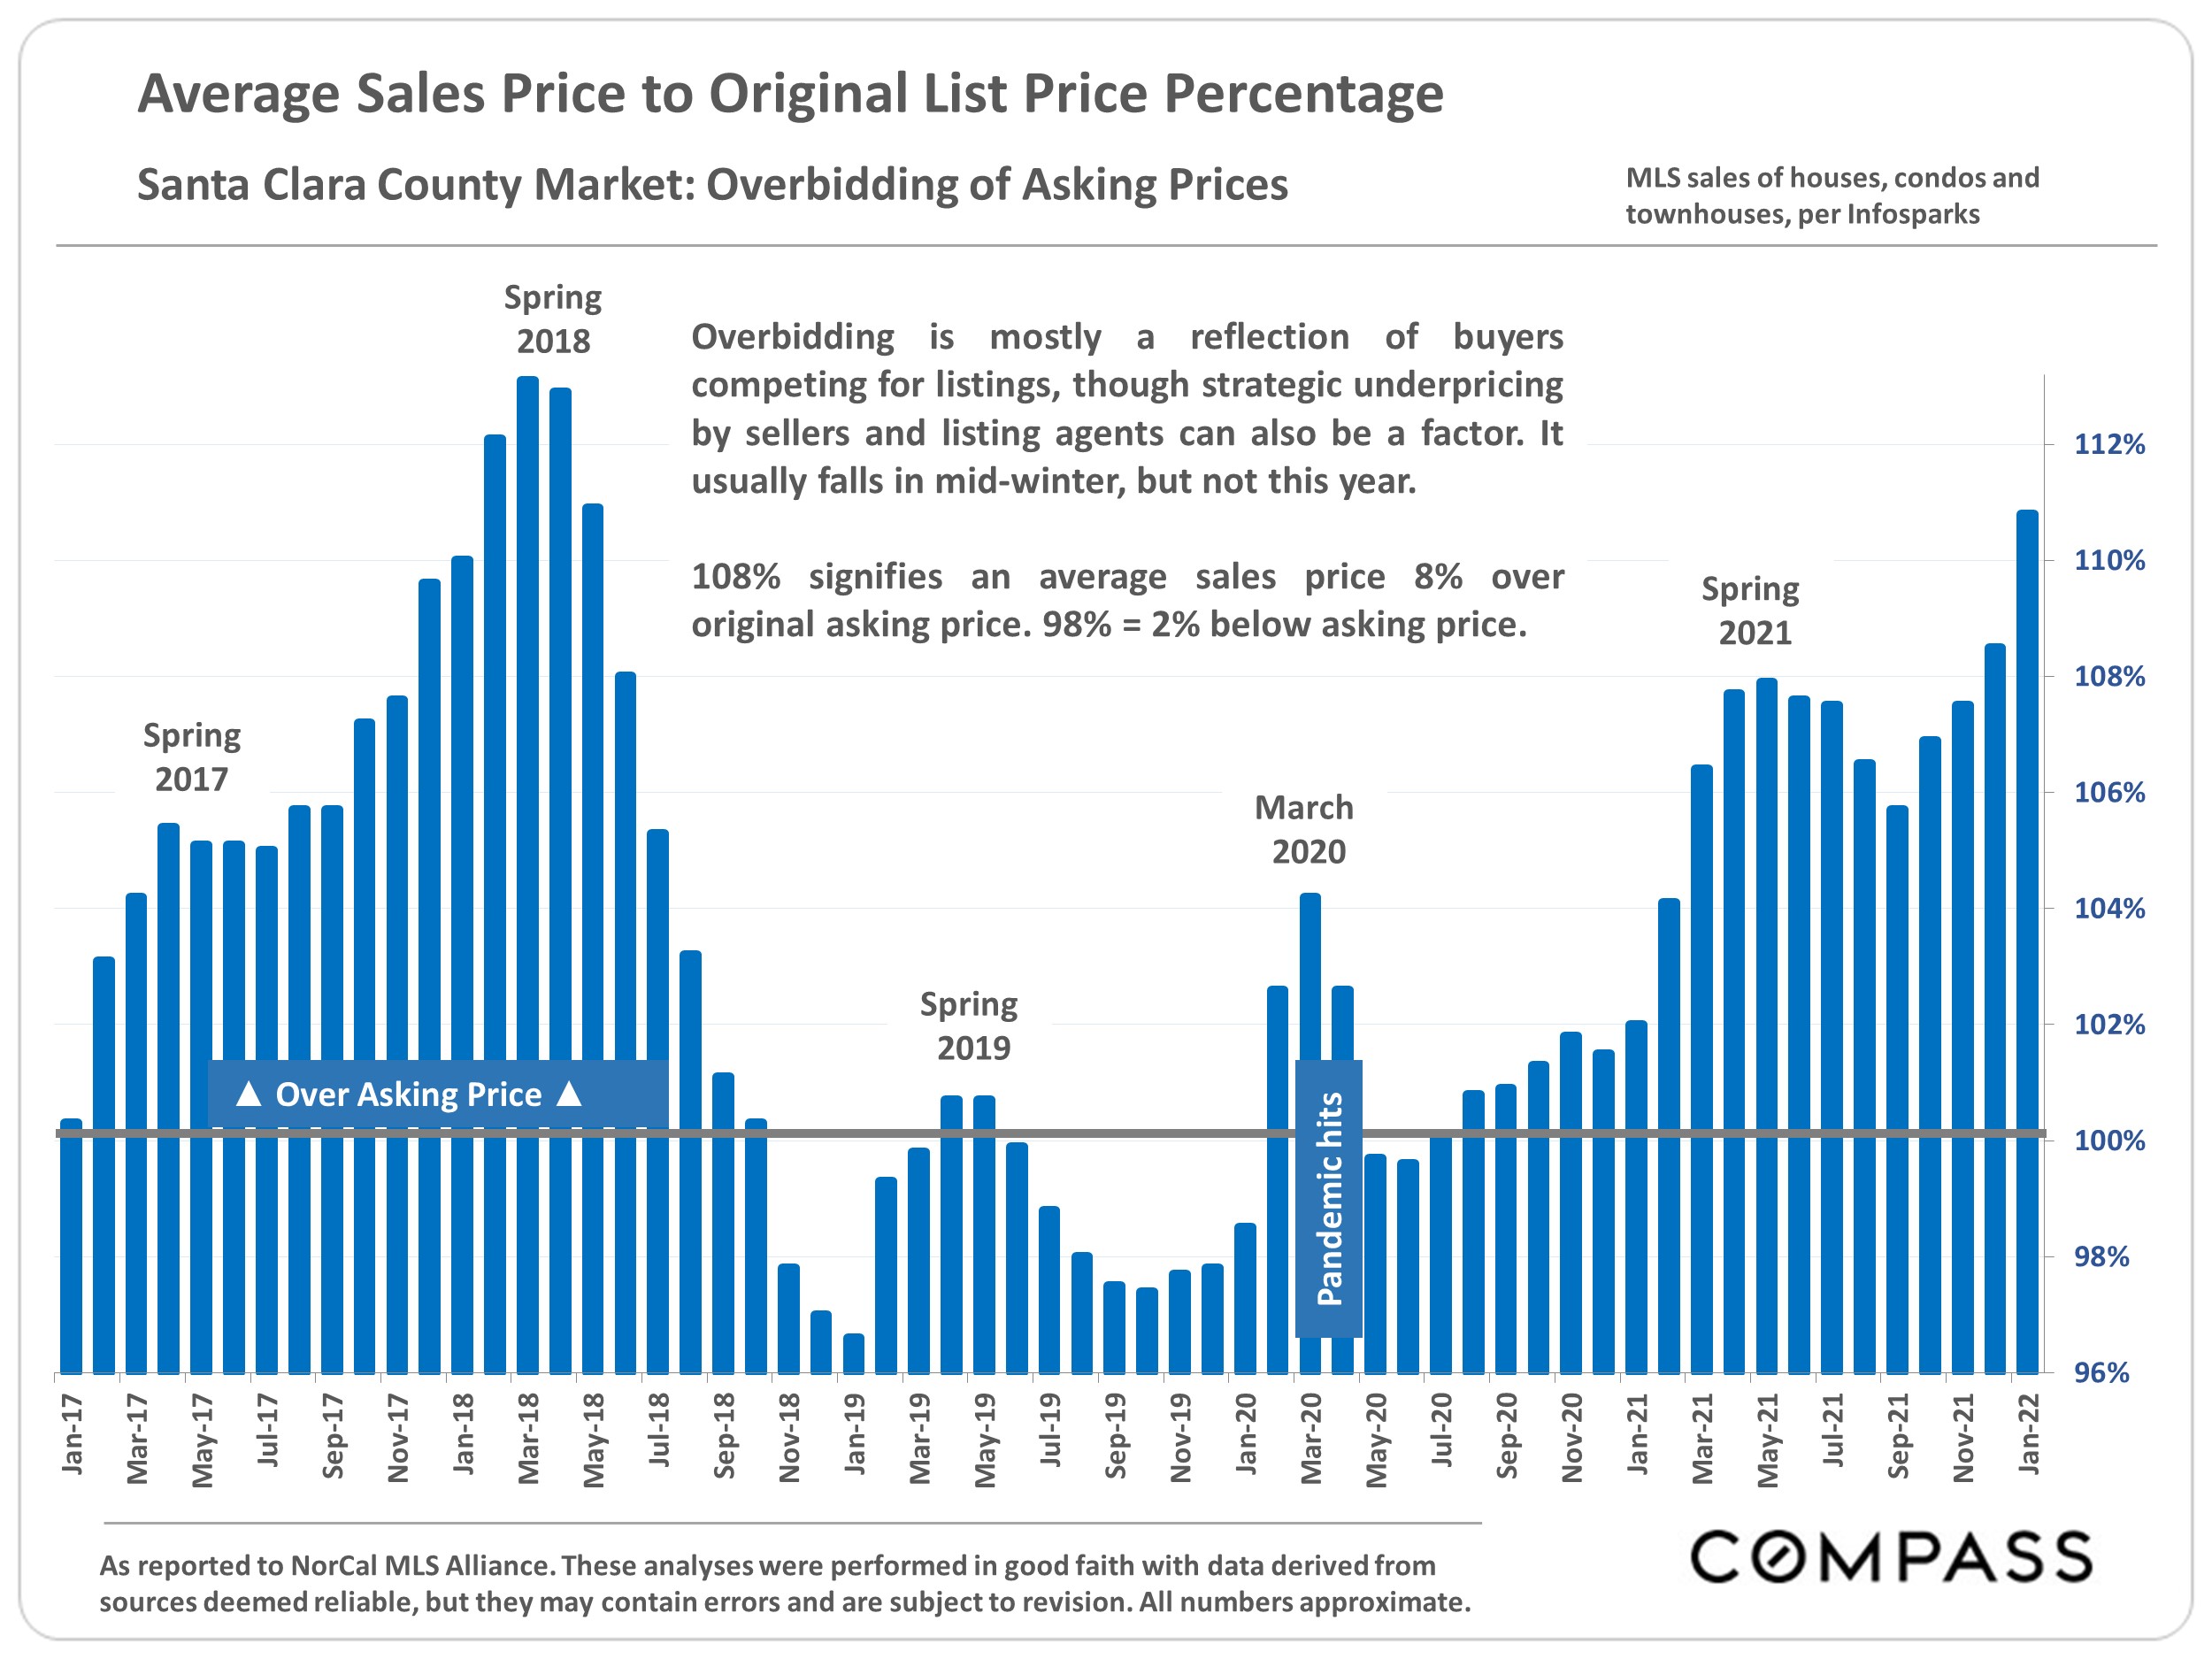
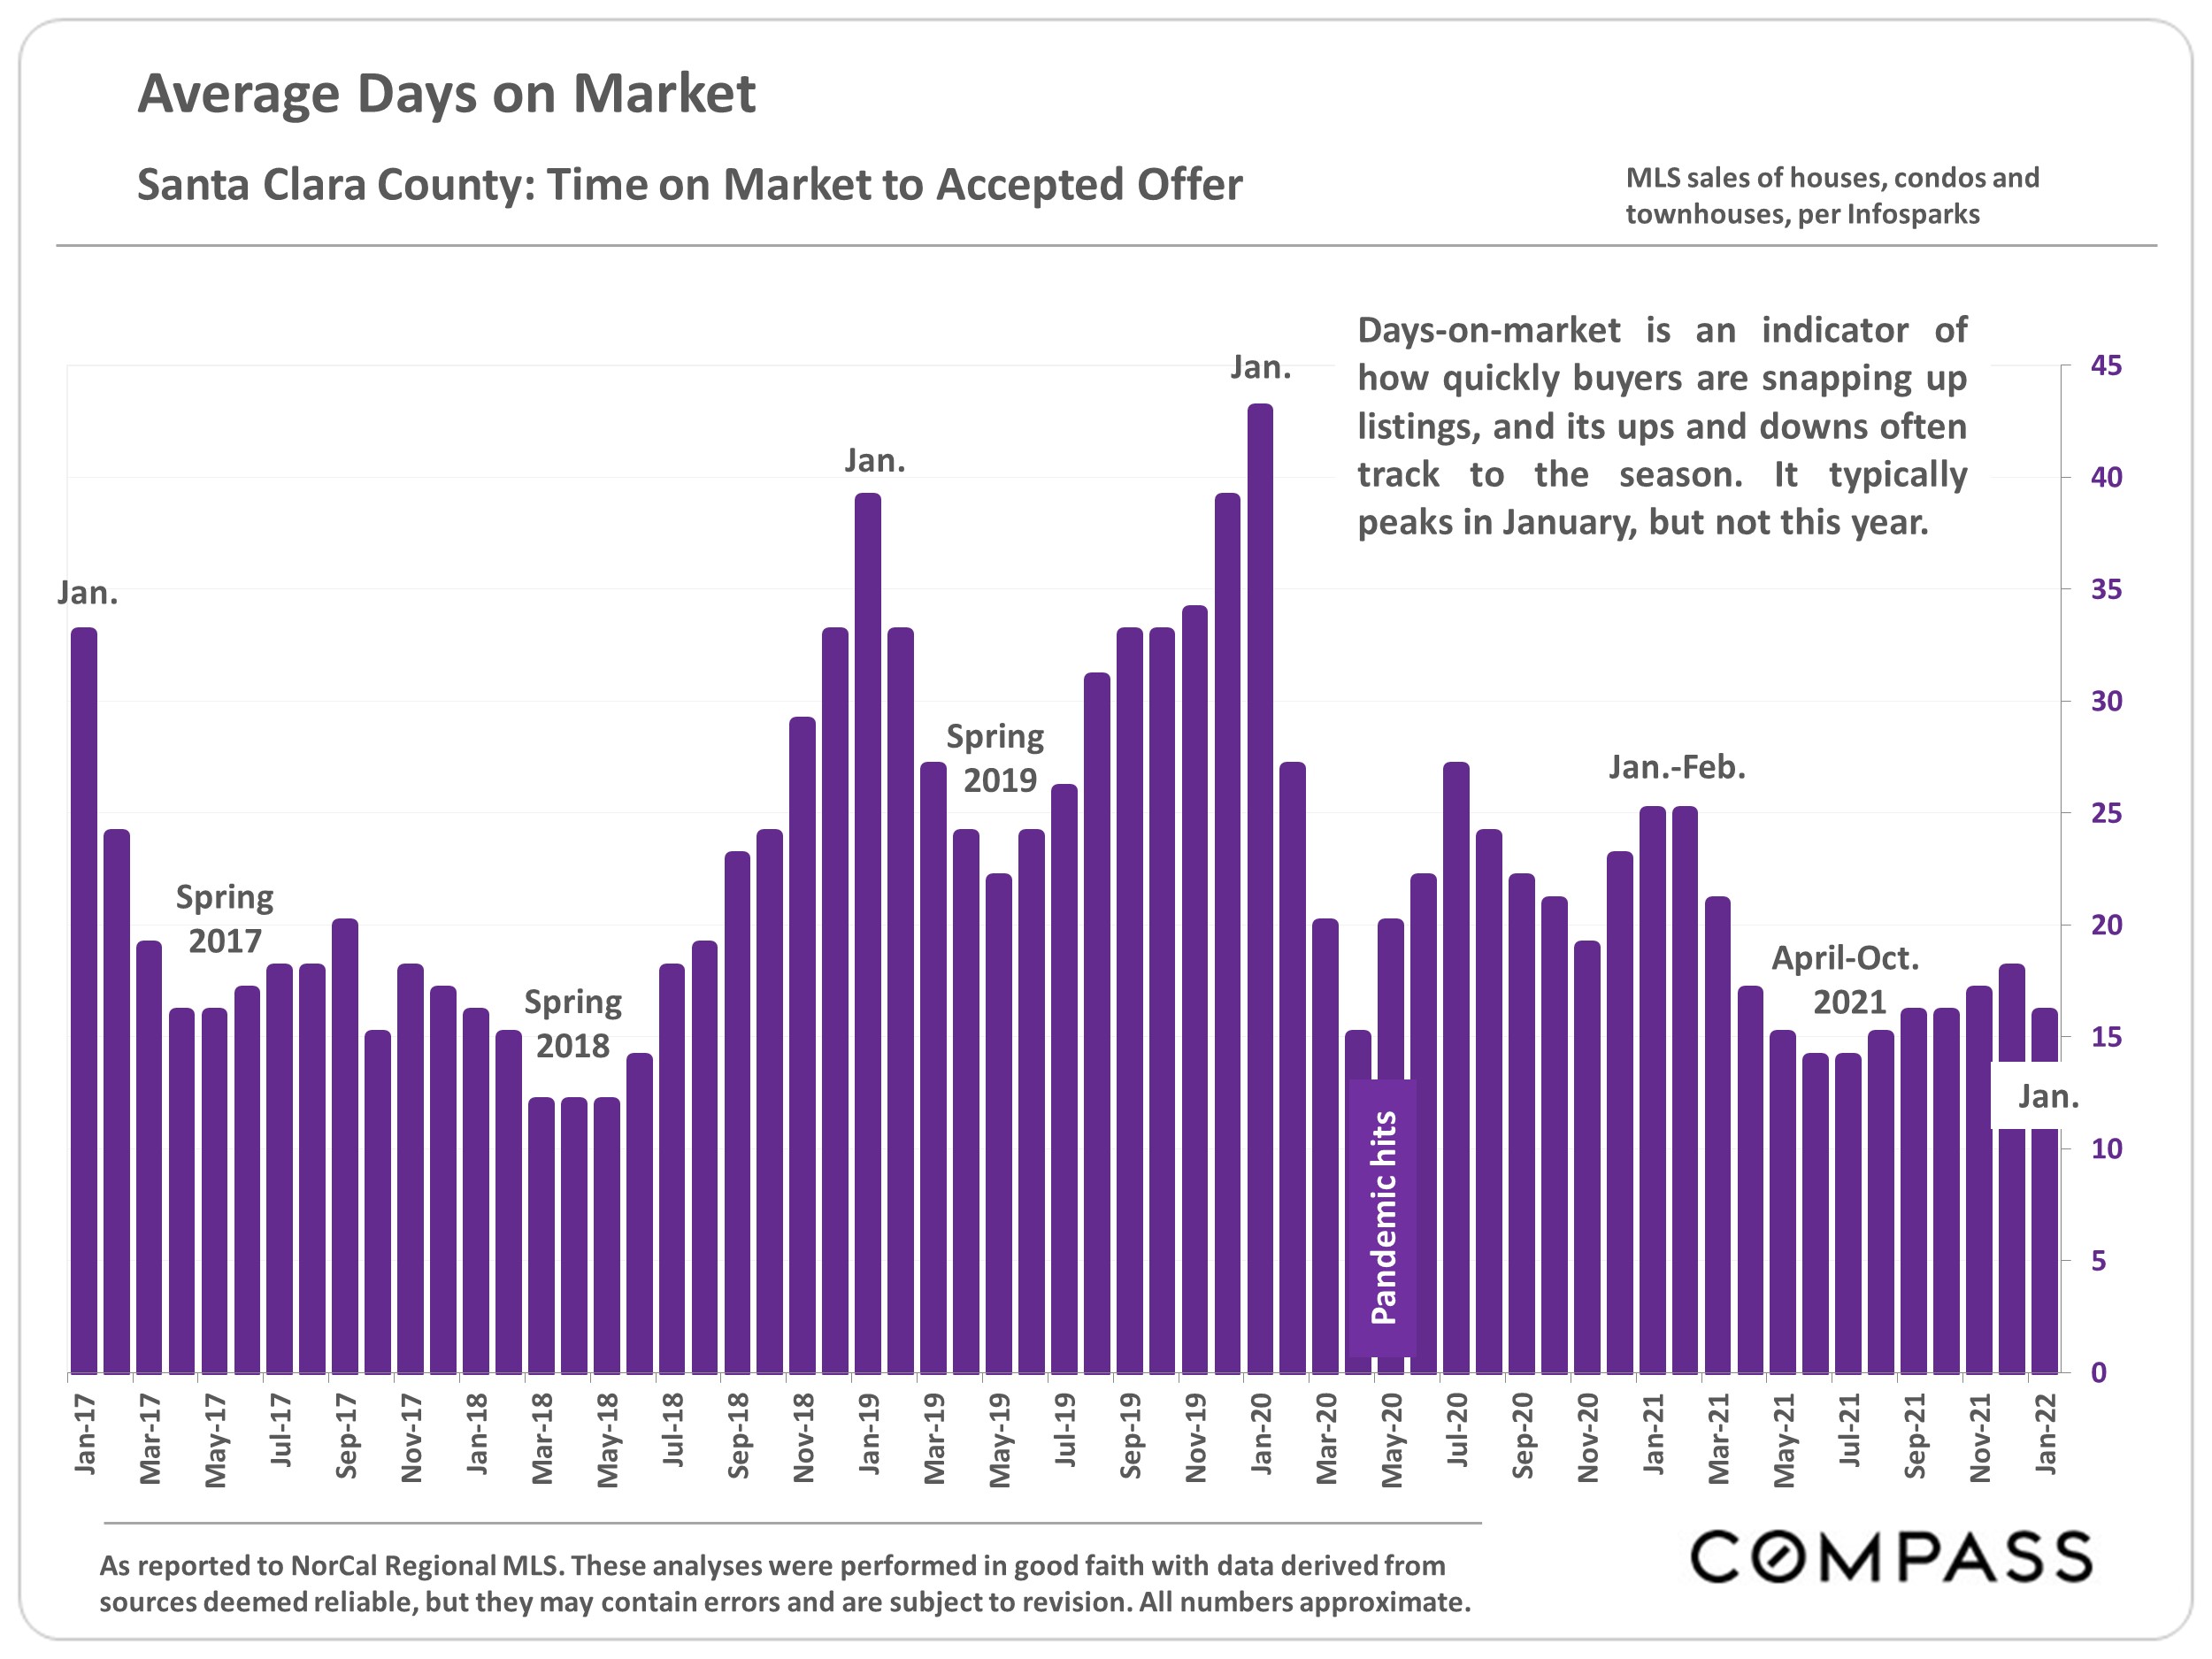
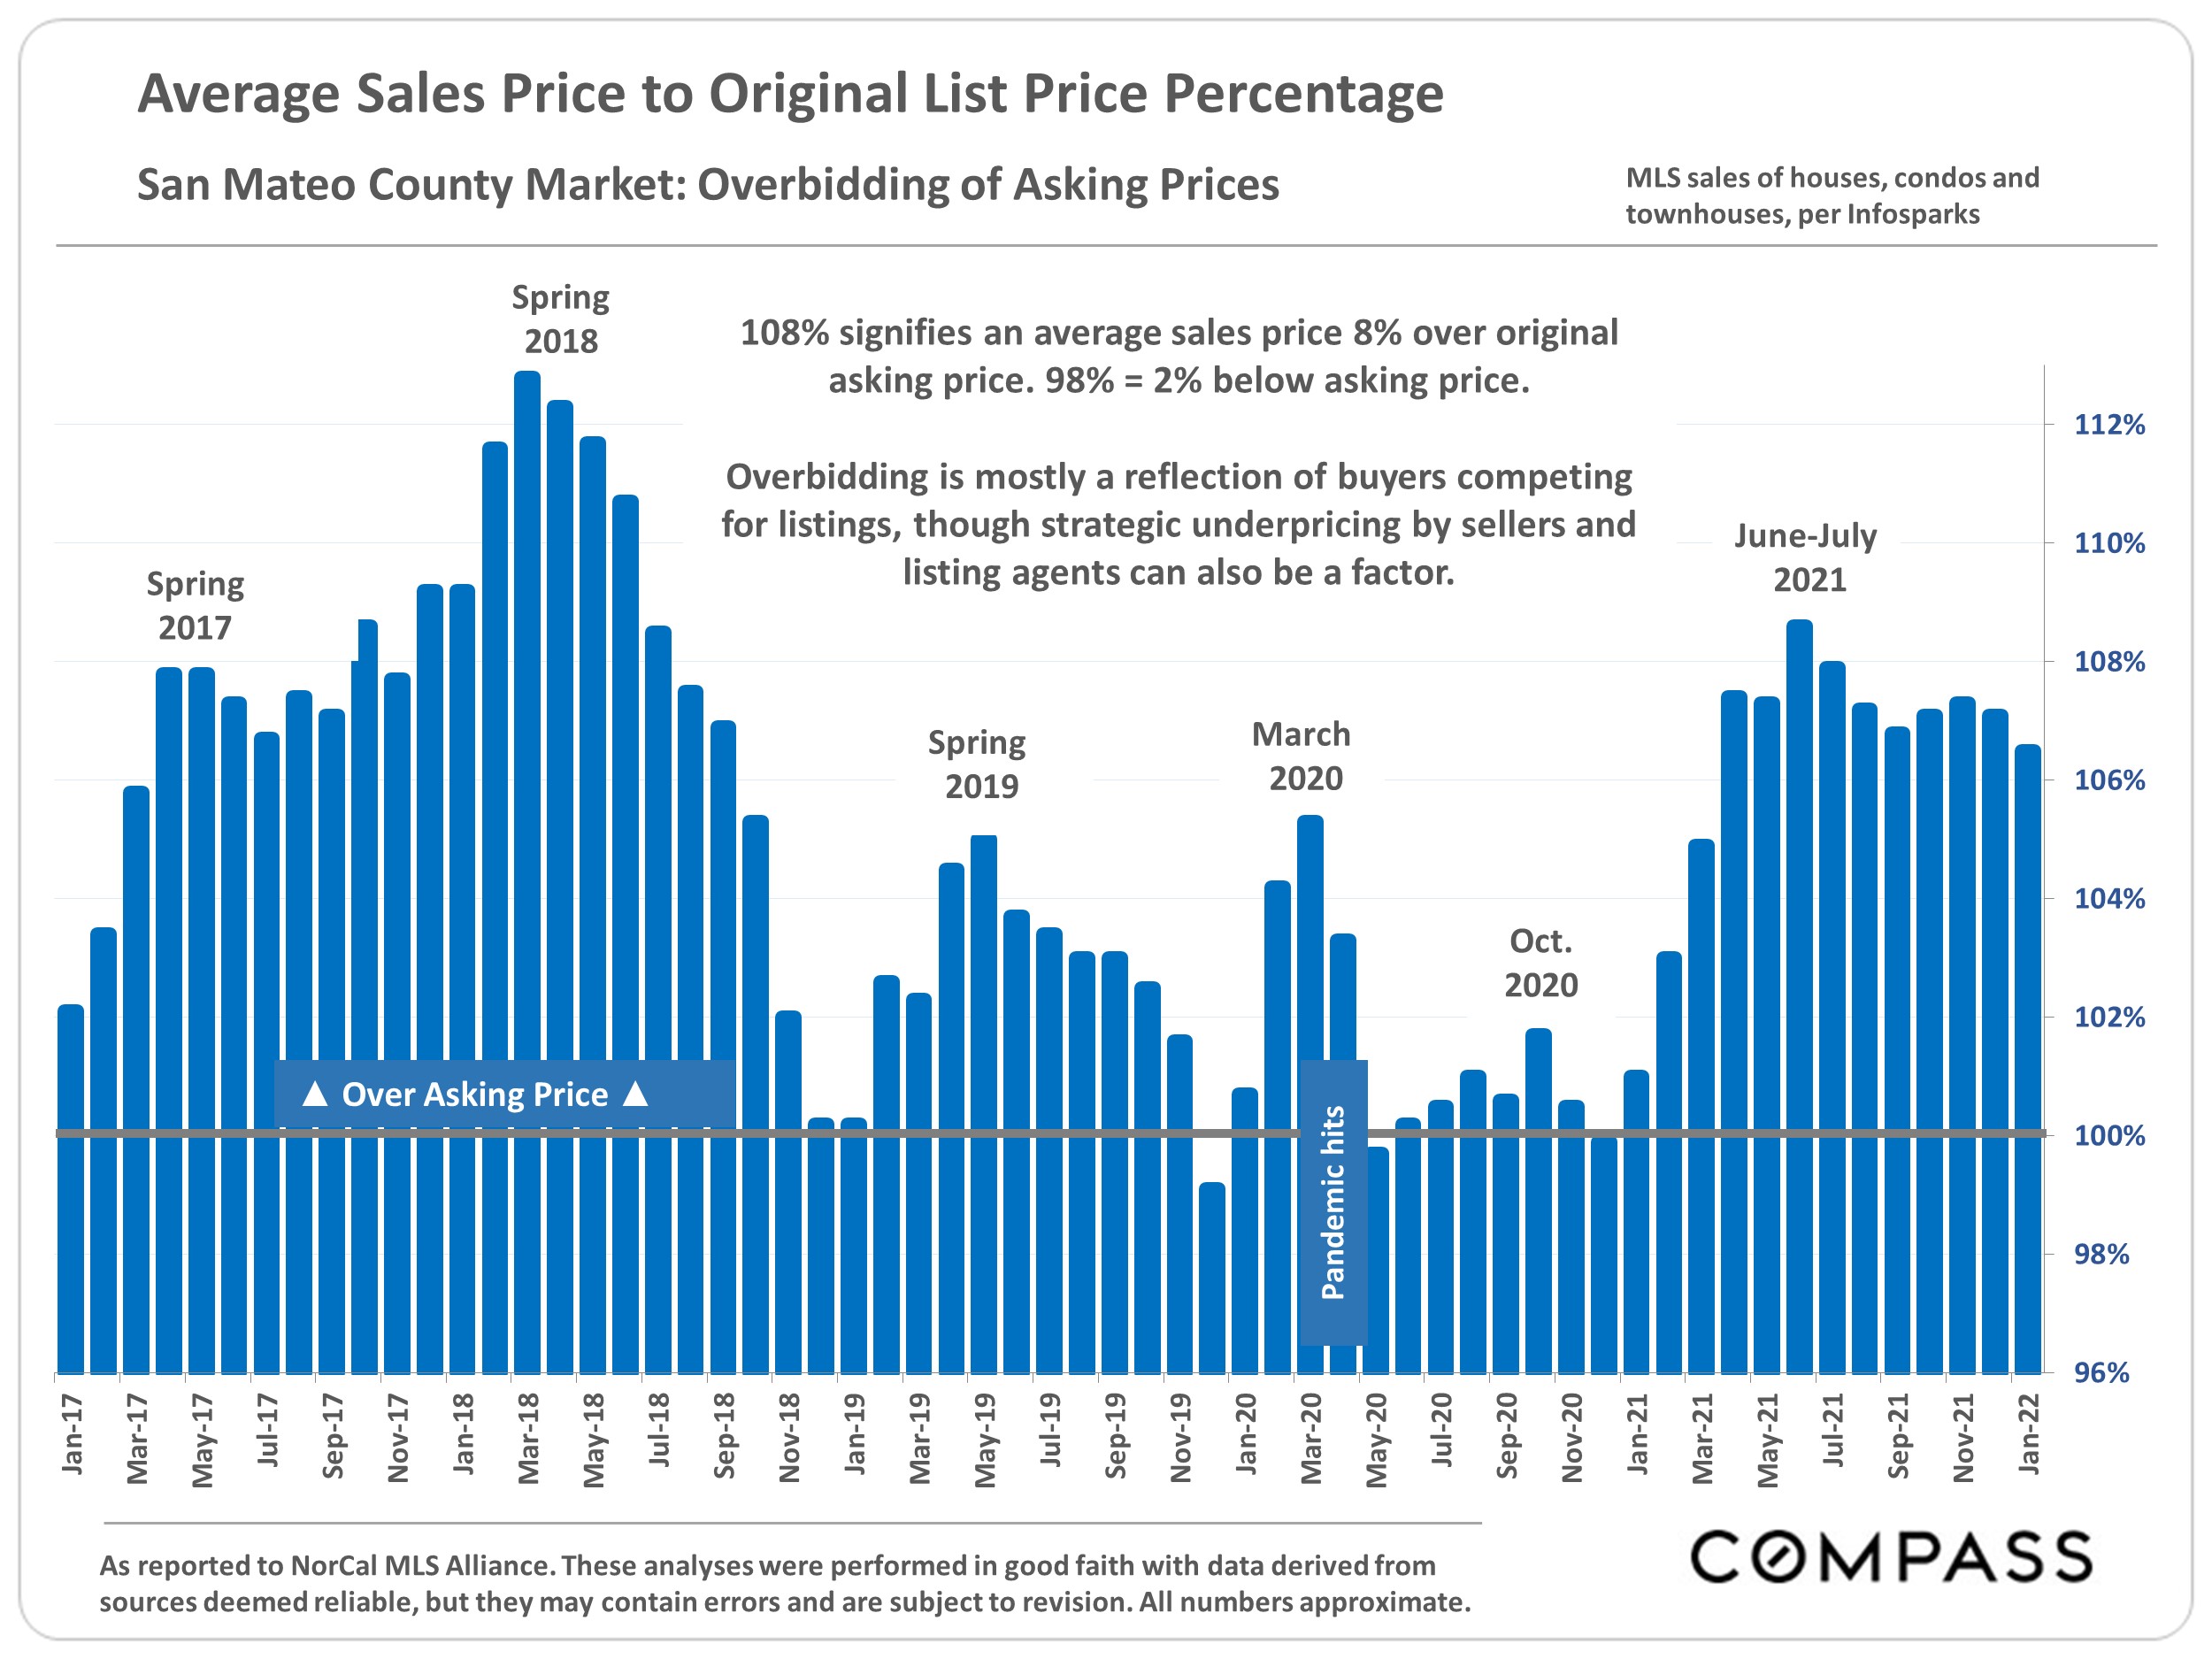
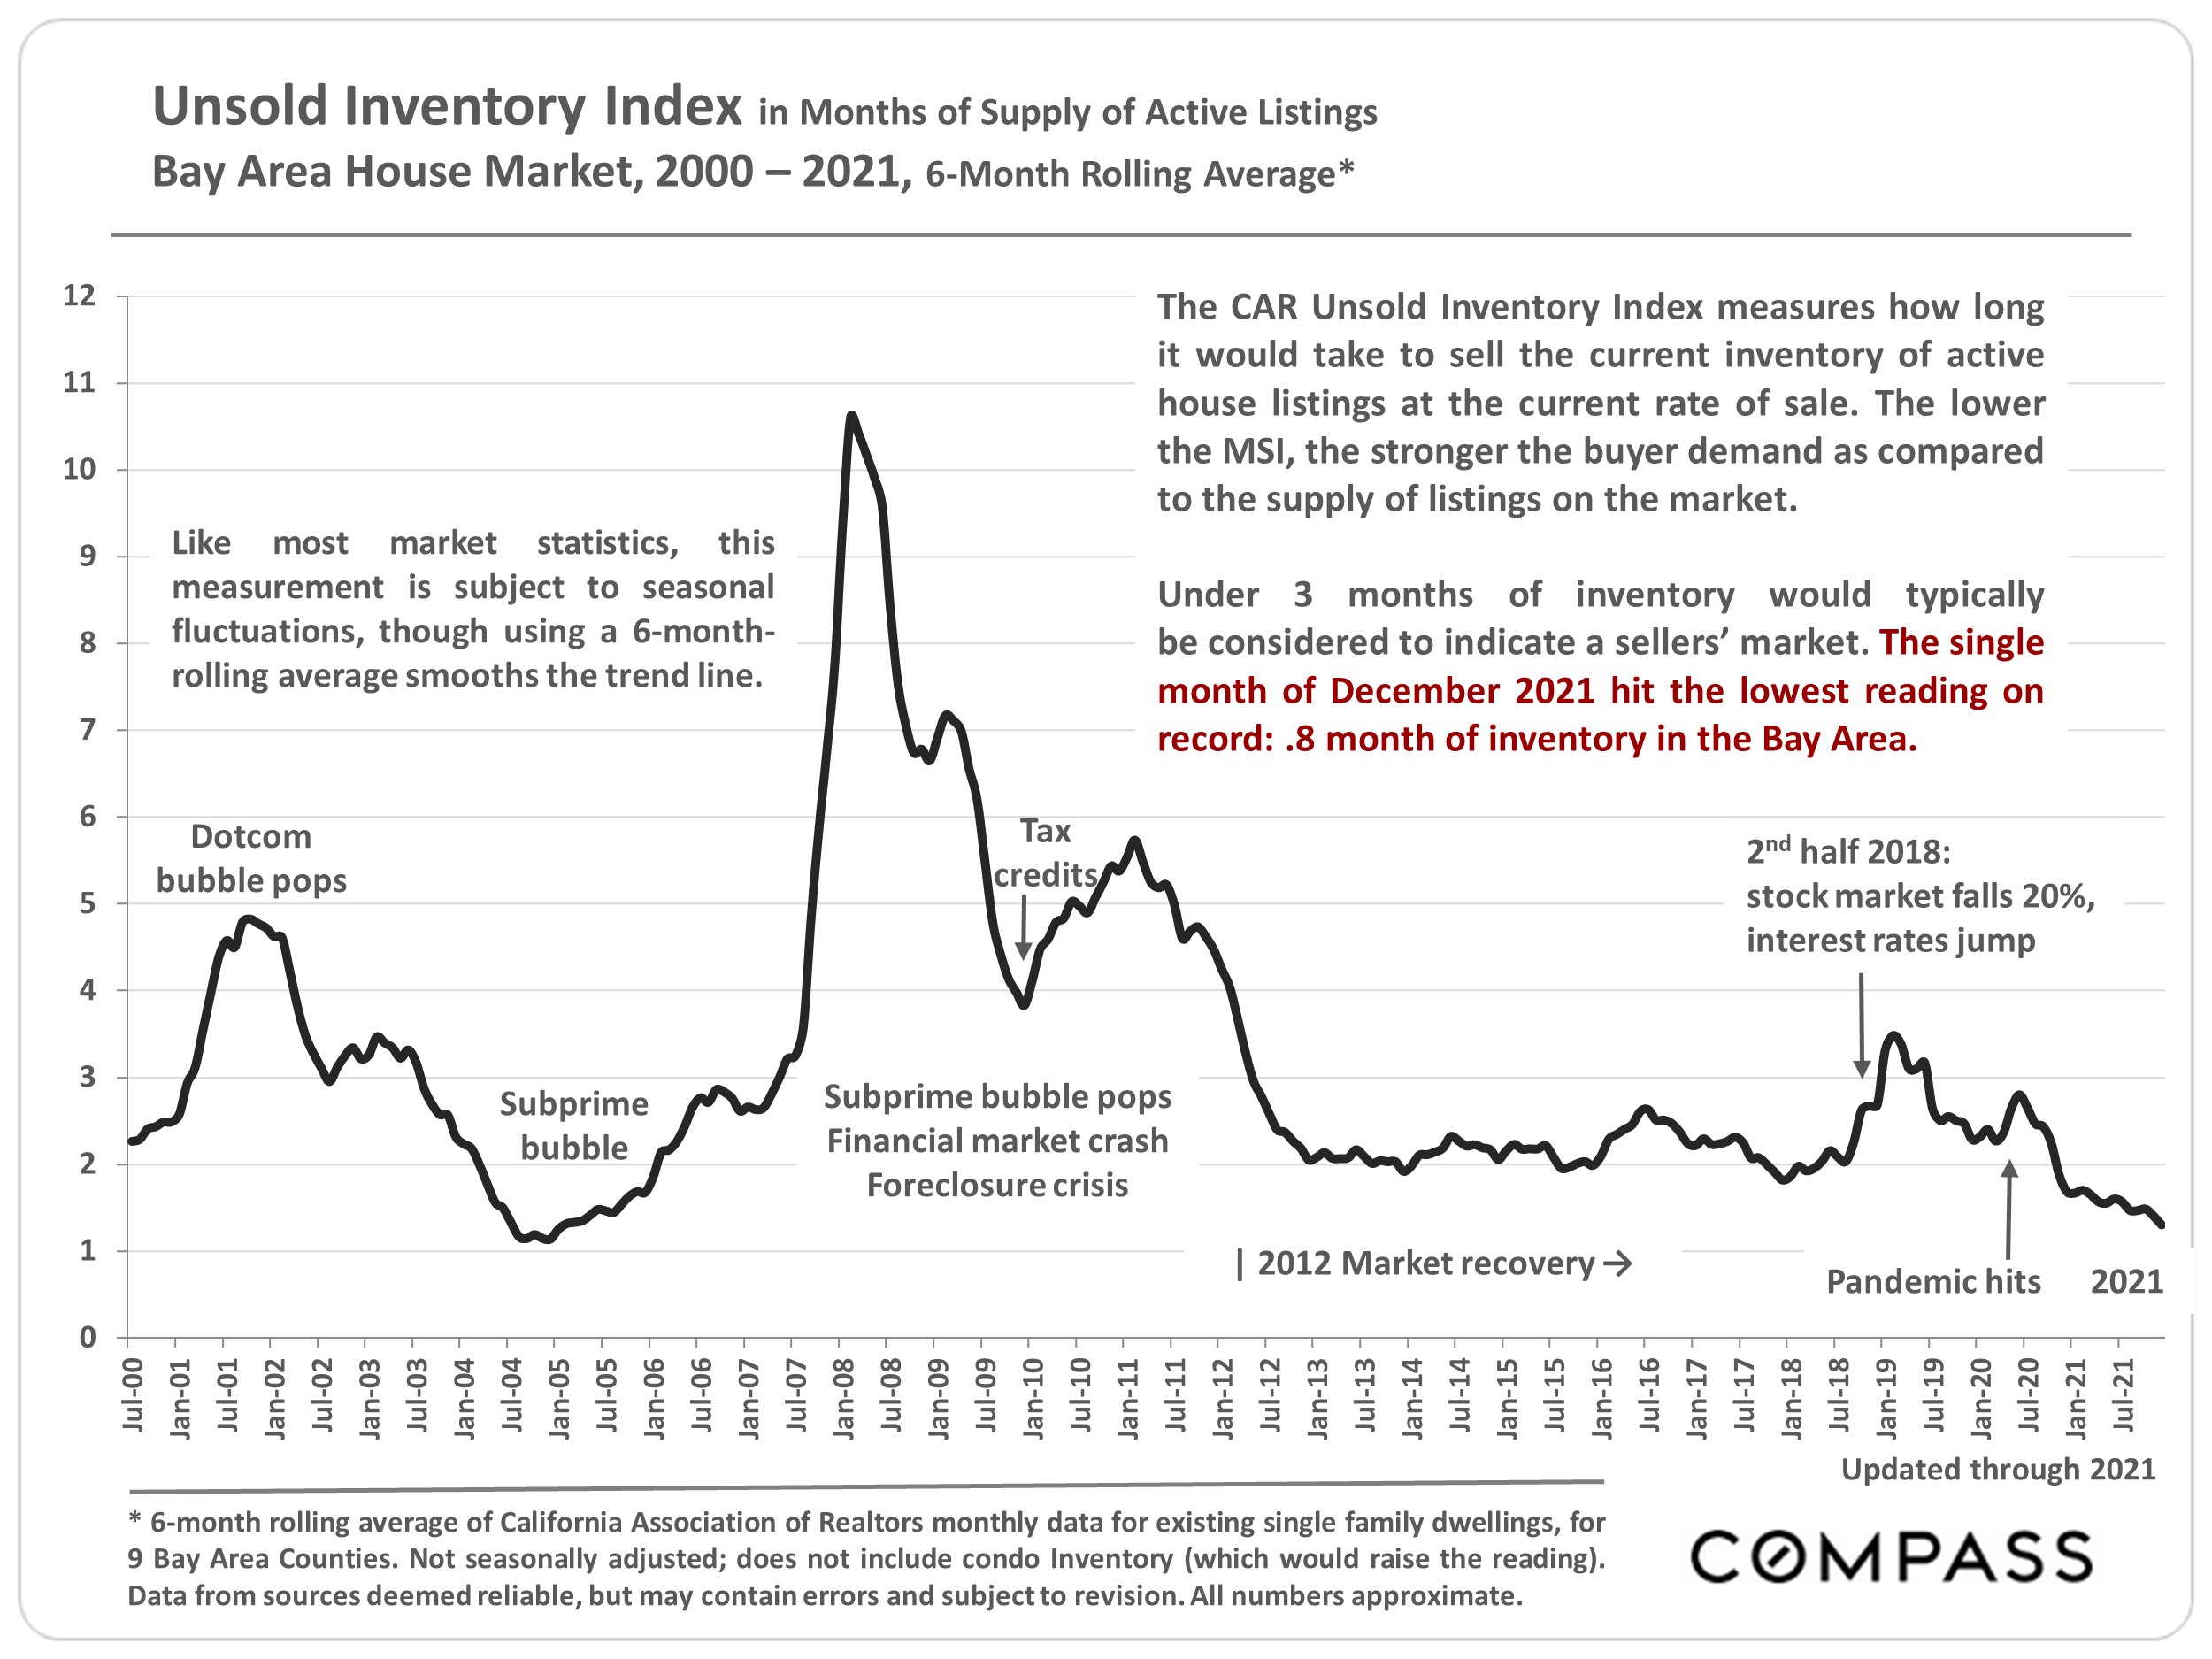
In the Bay Area, real estate market indicators remain very strong: demand for homes still very high, inventory still very low. So far, buyers do not seem to be significantly rattled by stock market gyrations, and increasing interest rates may be motivating some to buy sooner than later. As the new year wakes up, a common dynamic in heated markets is for buyers to jump back in much faster than sellers: Demand outpaces supply right from the start, with all the usual results (multiple offers, overbidding, fast sales), even as the number of new listings starts climbing. This describes 2022 to date, but more will be known once the spring selling season — typically the biggest of the year — really gets underway. (In the Bay Area, the “spring” market can begin in February.)

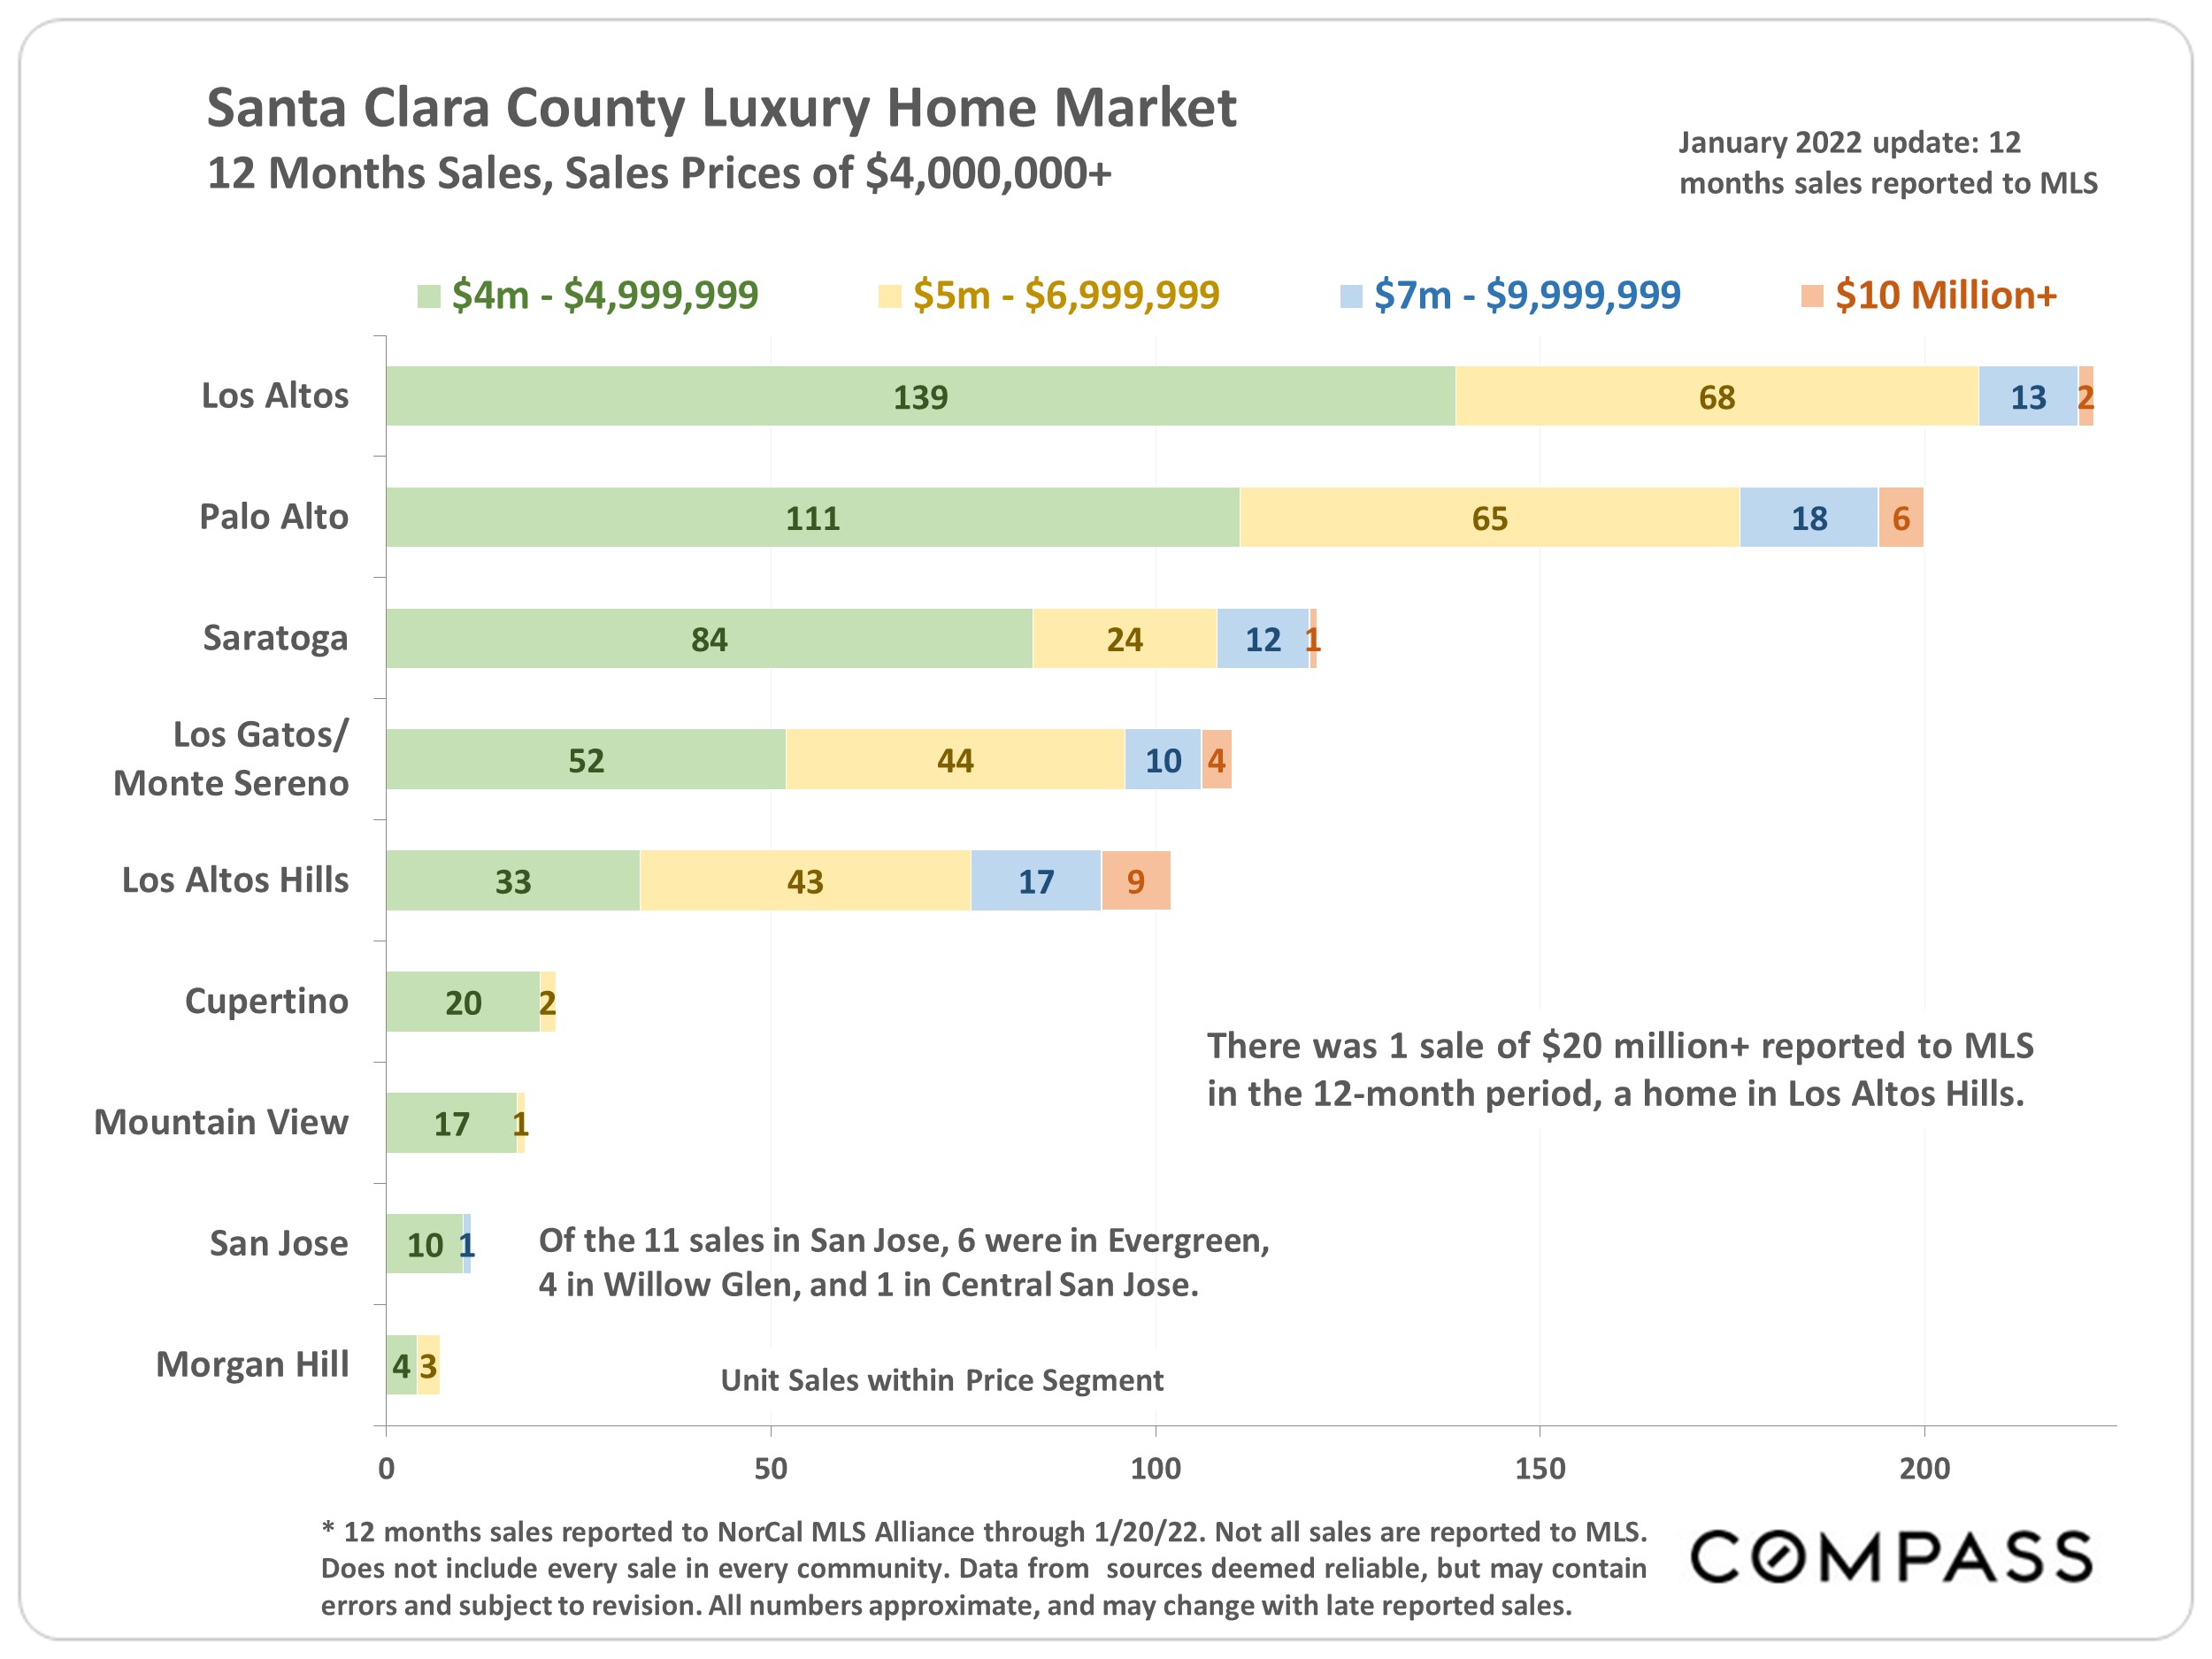
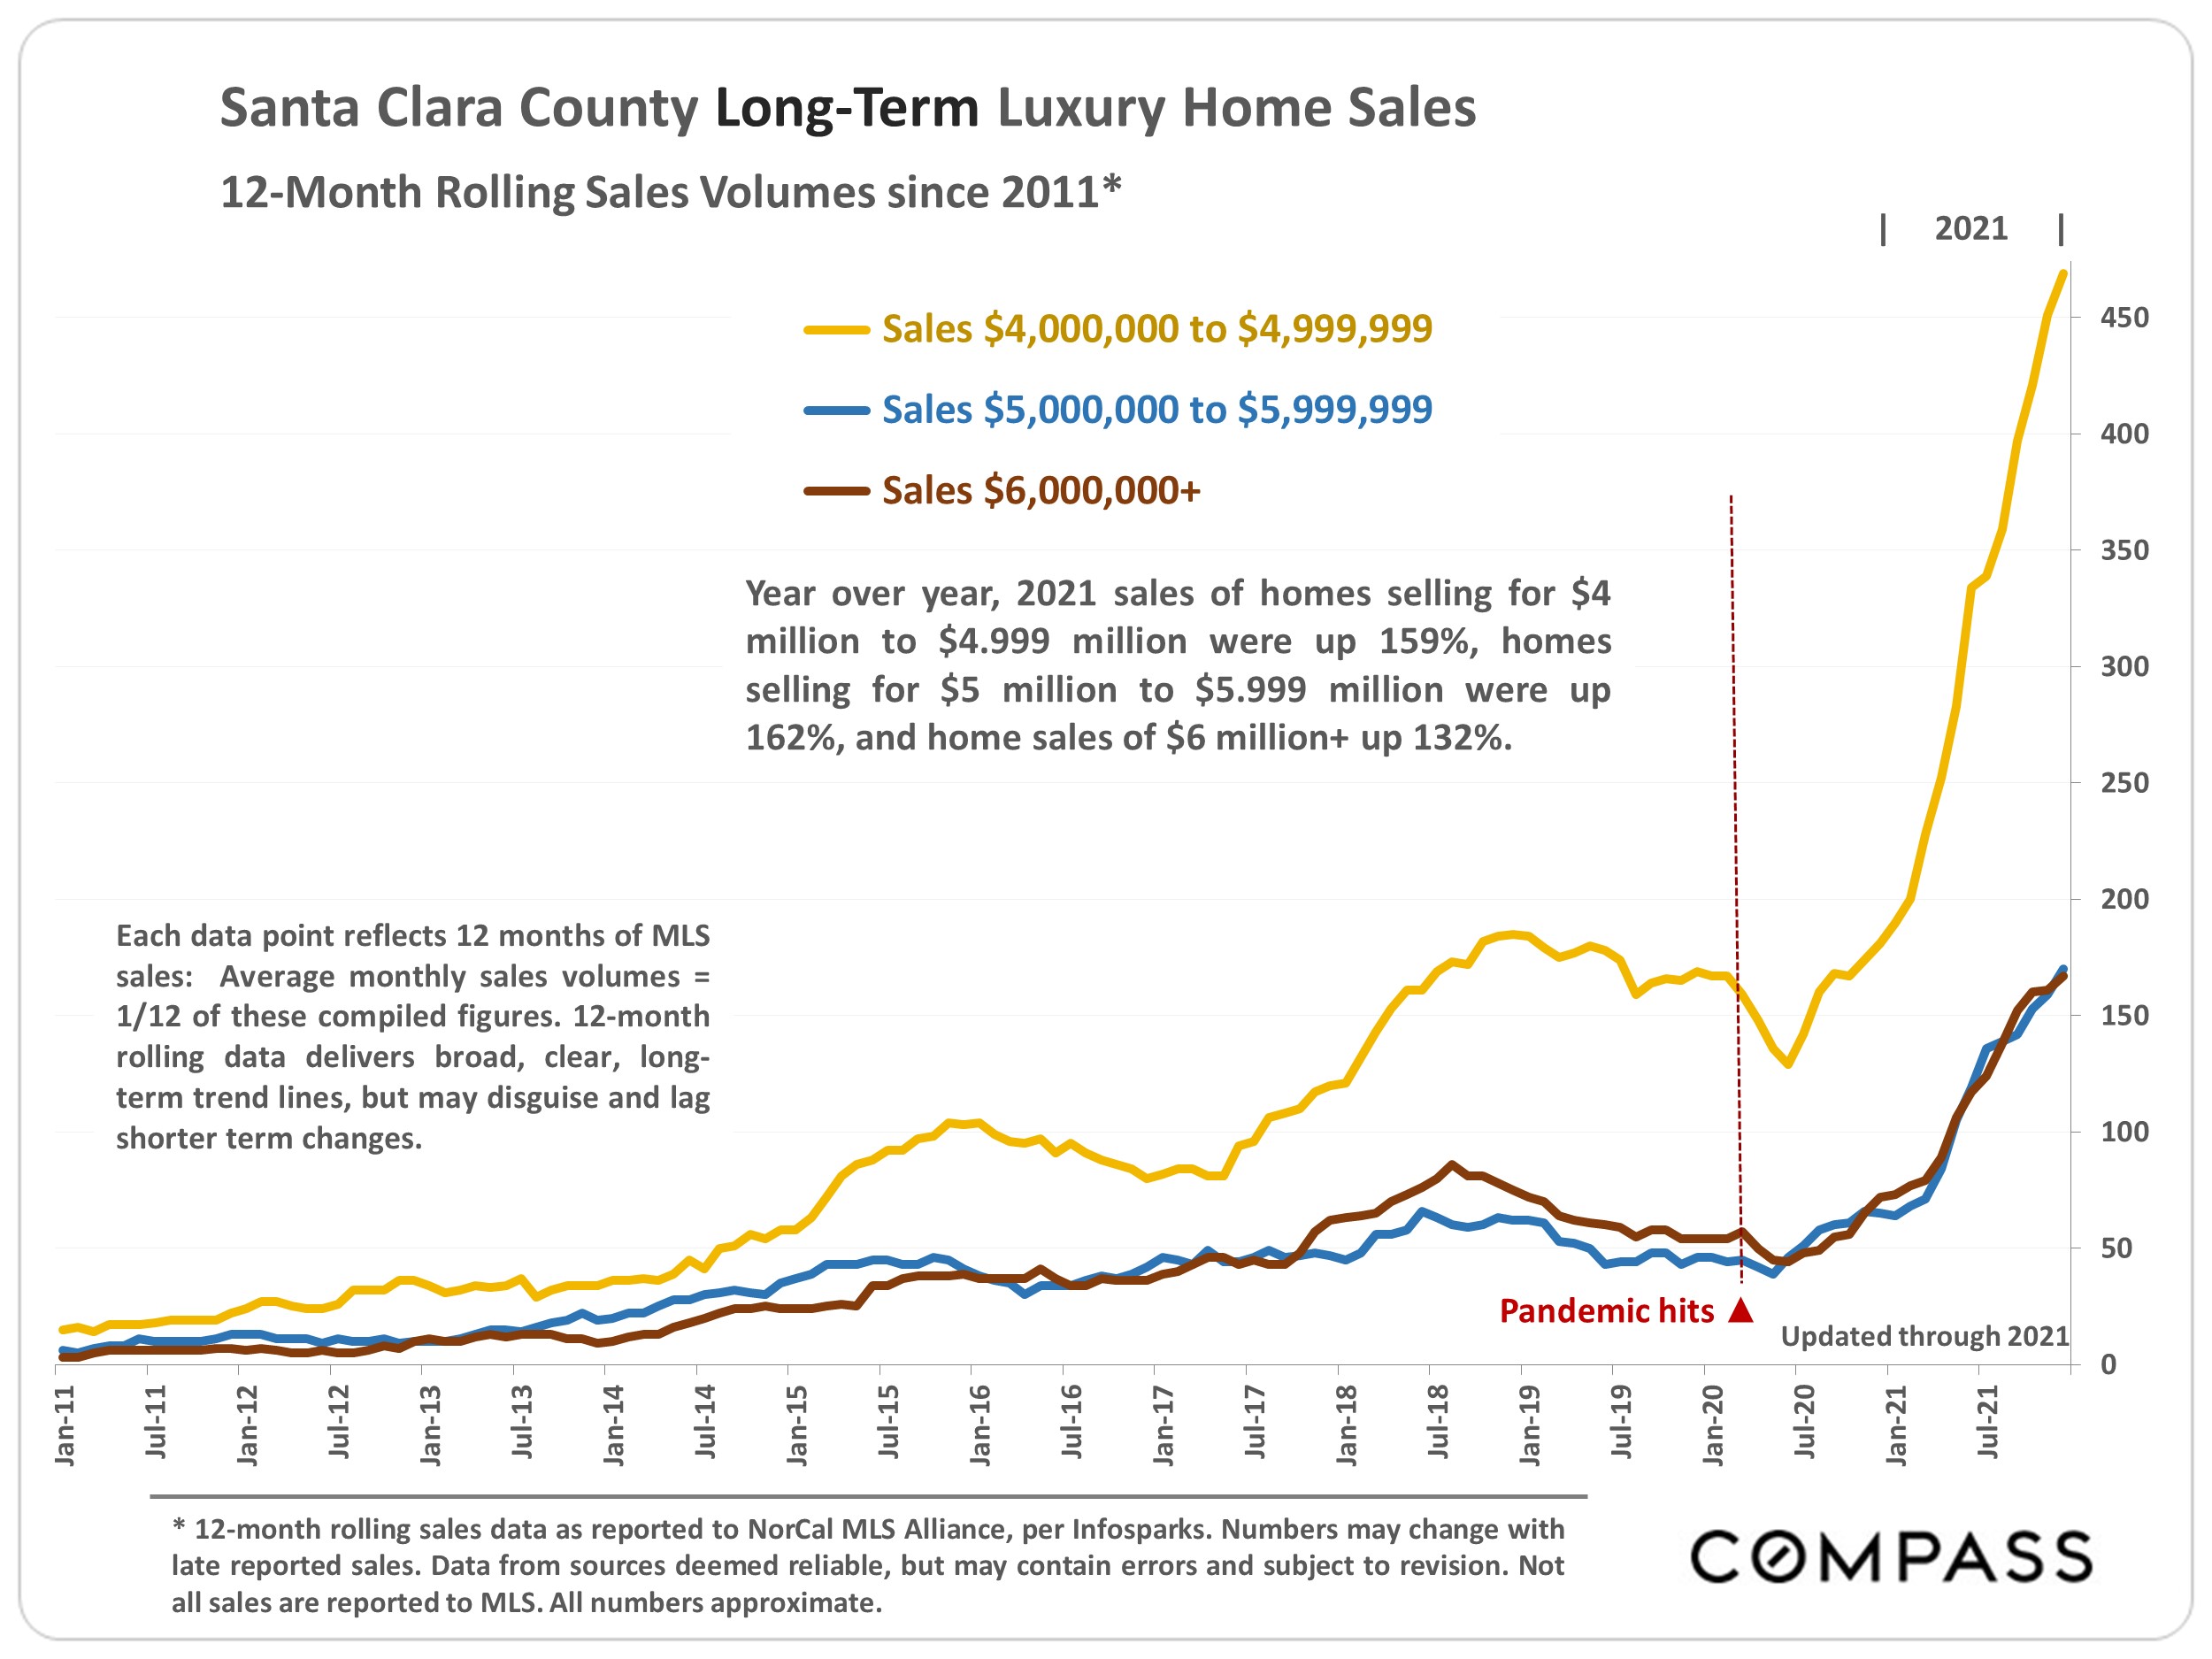
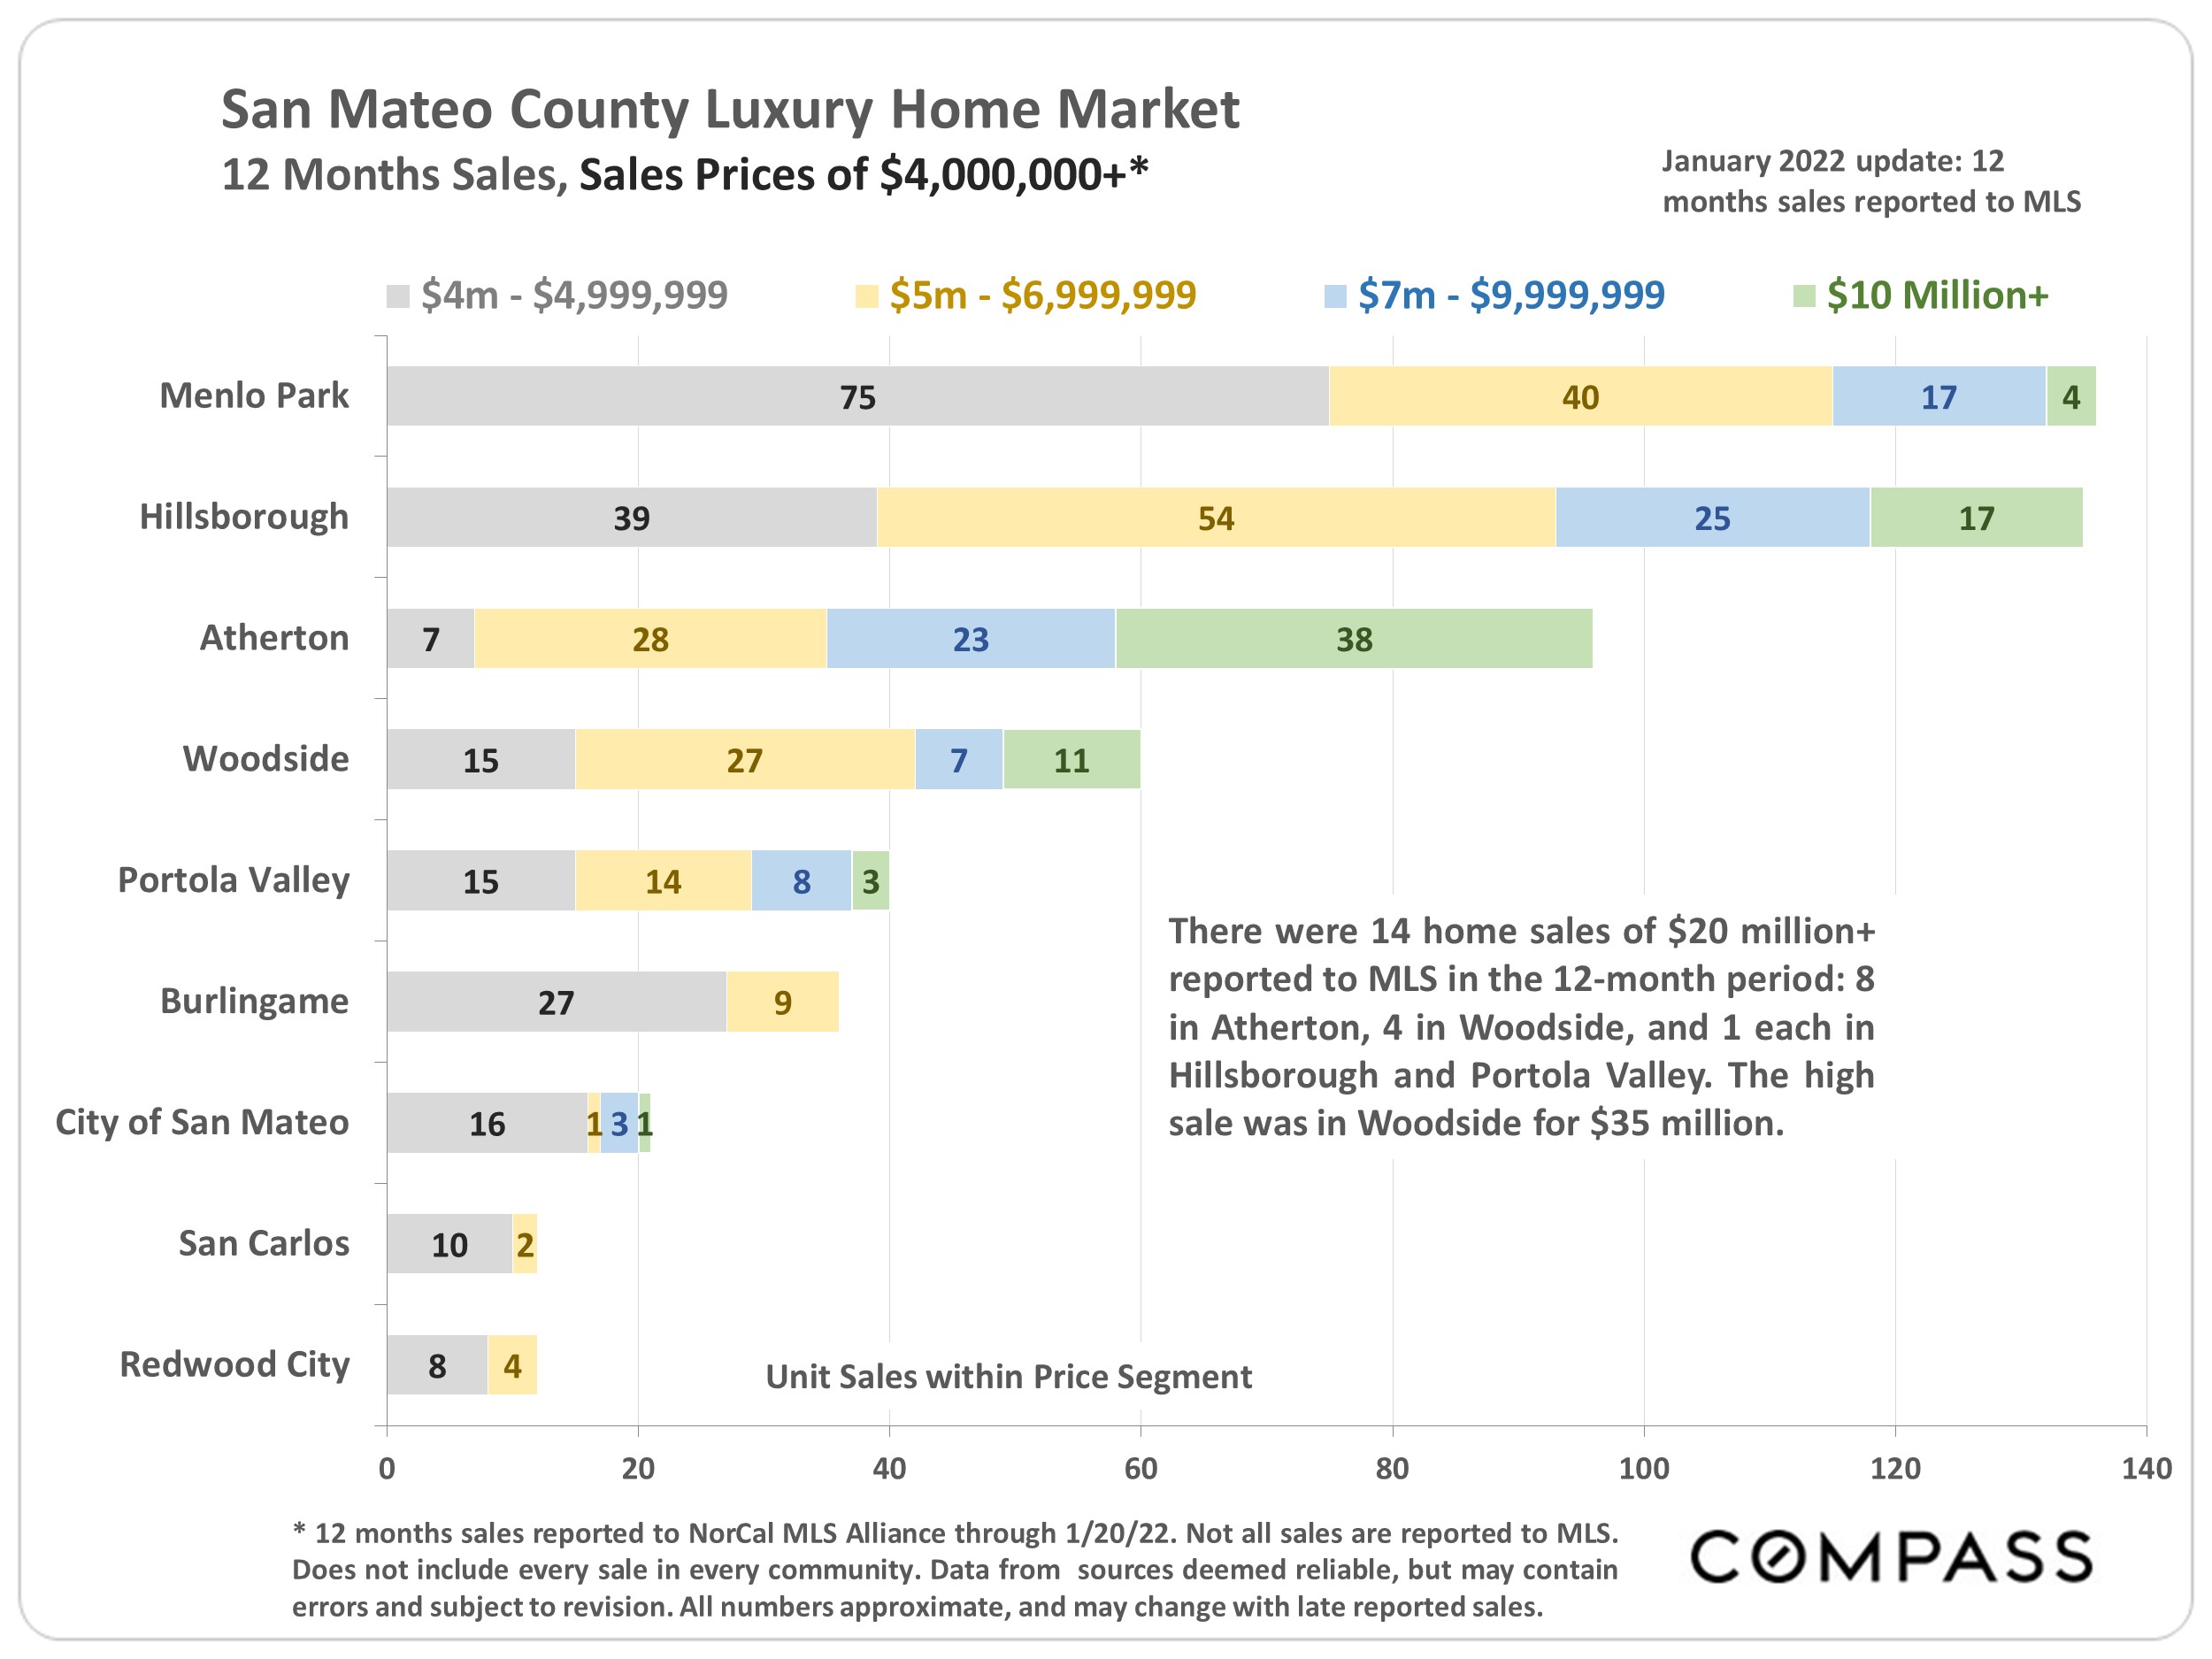
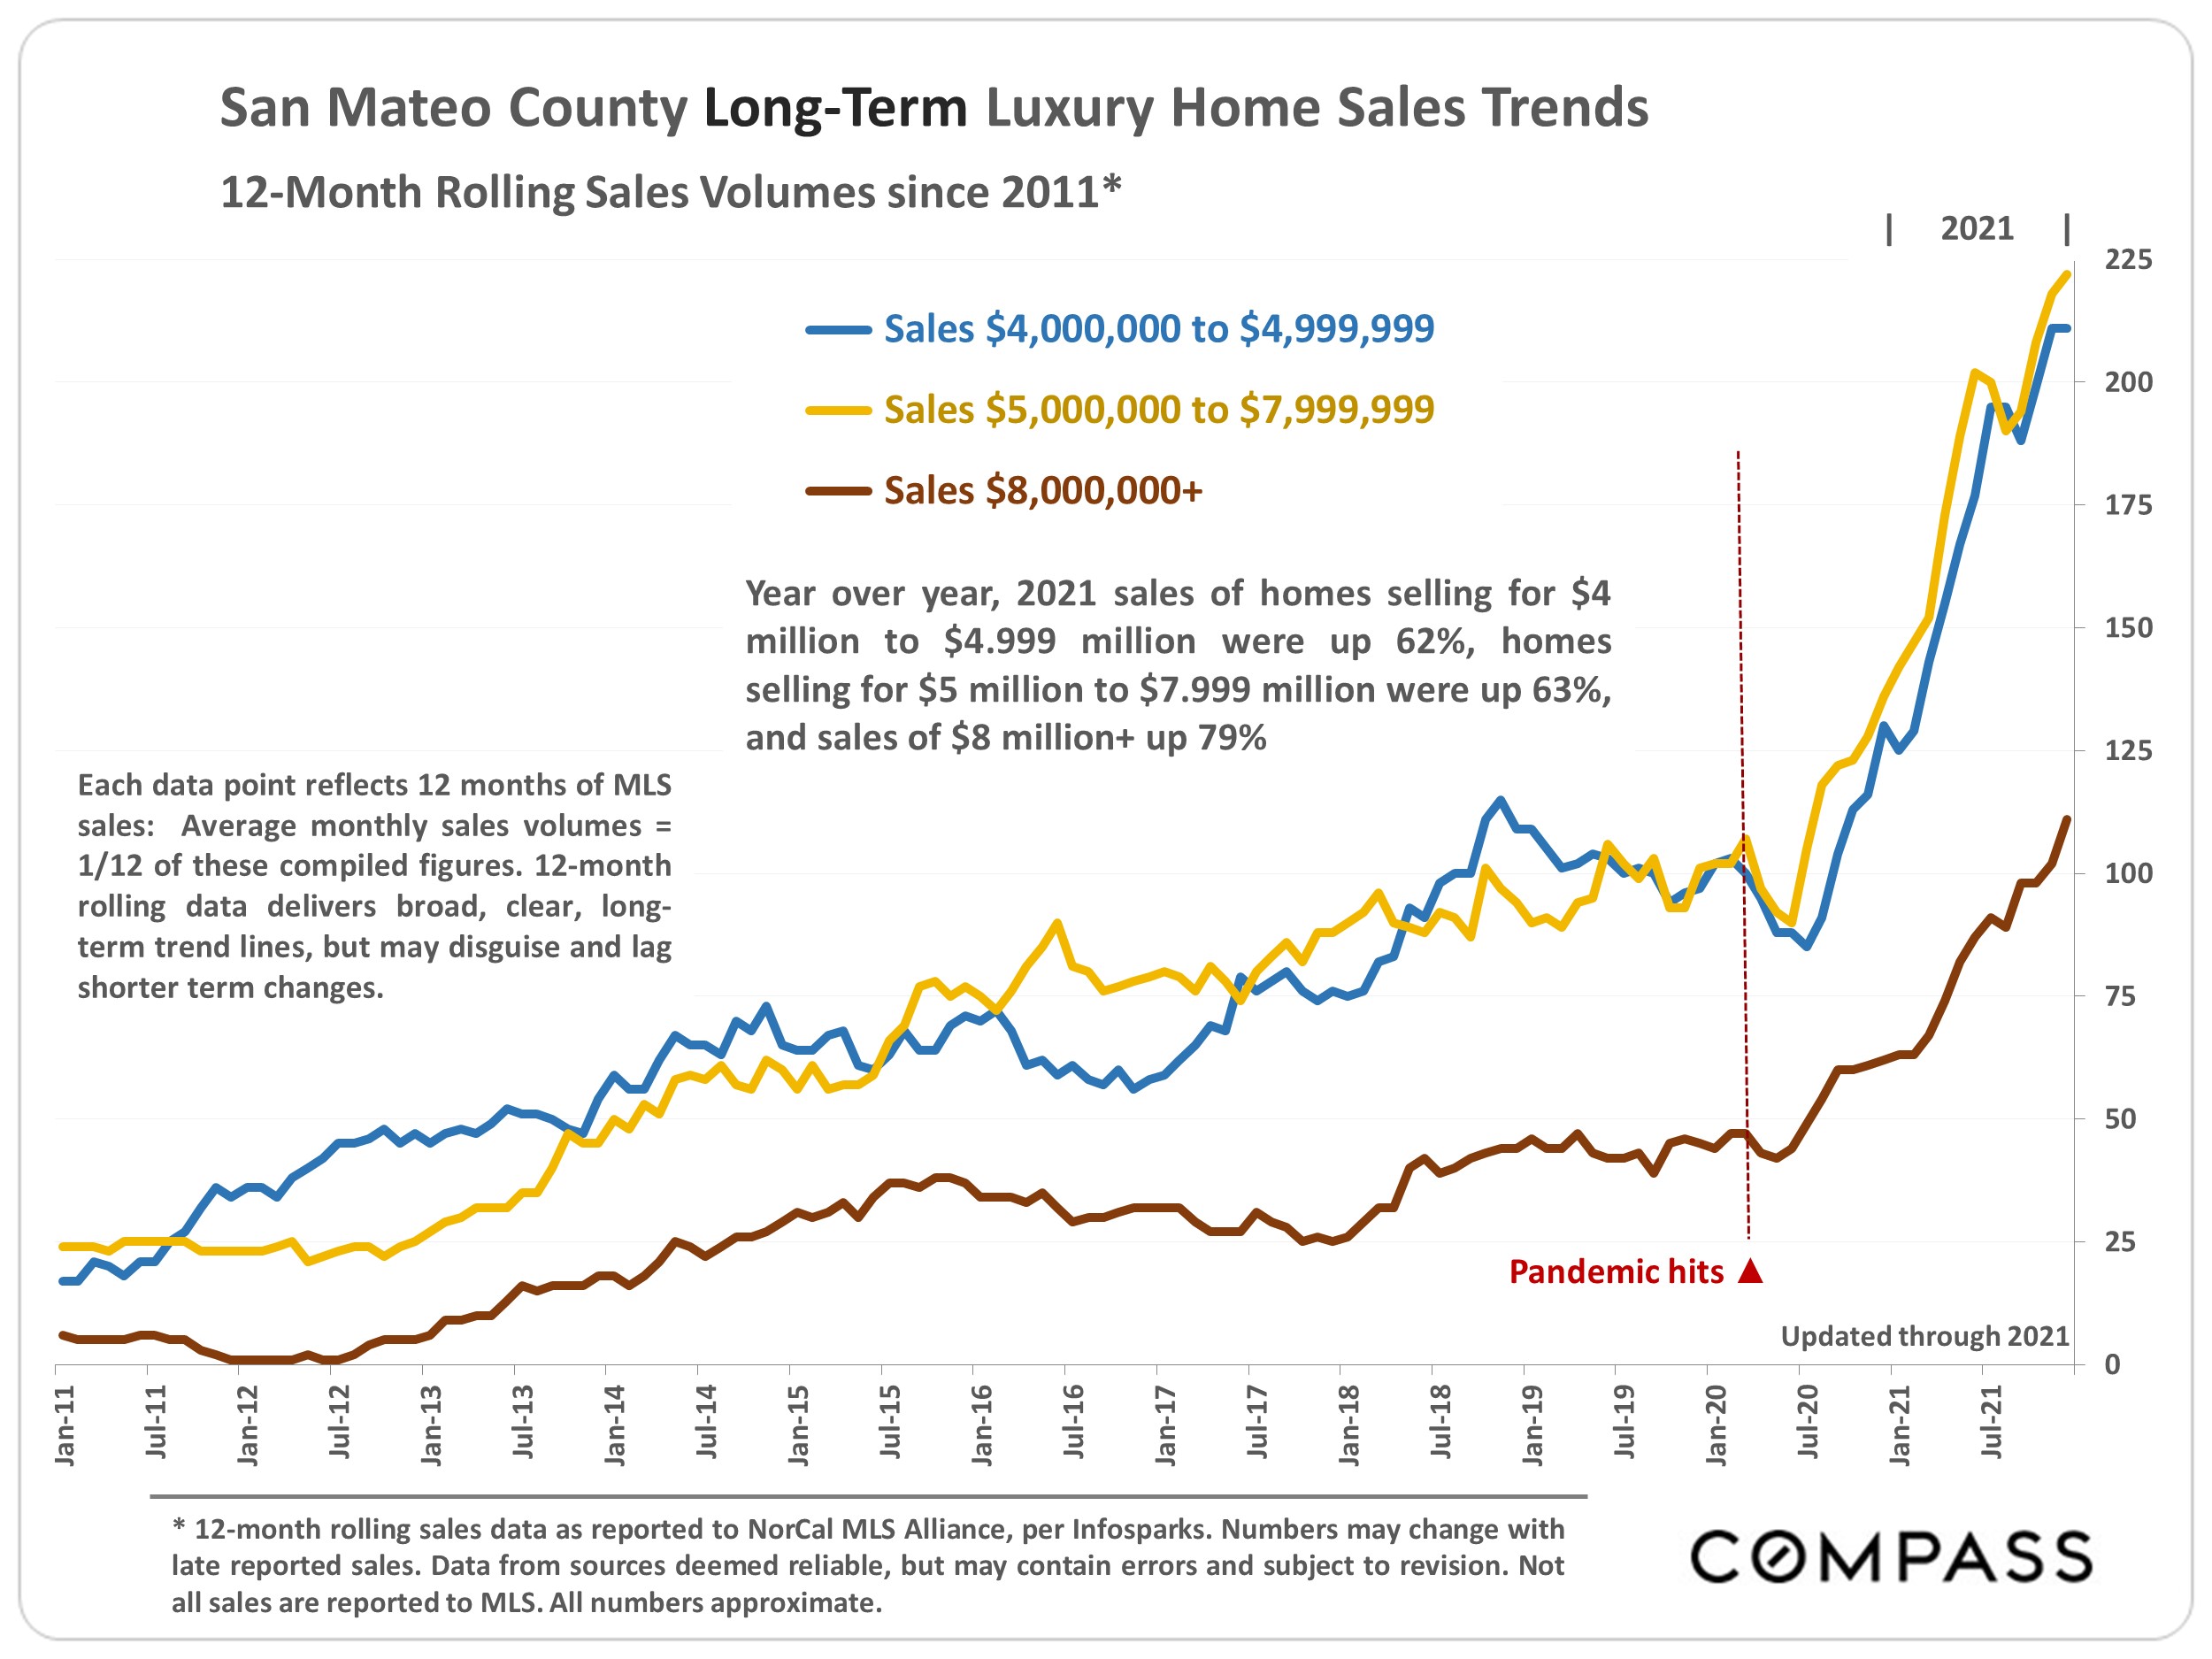
As an aside: Compared to the general market, luxury home buyers tend to be less sensitive to interest rate movements, but more sensitive to turbulence and uncertainty in financial markets.

Source: Compass

It is impossible to know how median and average value statistics apply to any particular home without a specific comparative market analysis. These analyses were made in good faith with data from sources deemed reliable, but may contain errors and are subject to revision. It is not our intent to convince you of a particular position, but to attempt to provide straightforward data and analysis, so you can make your own informed decisions. Median and average statistics are enormous generalities: There are hundreds of different markets in San Francisco and the Bay Area, each with its own unique dynamics. Median prices and average dollar per square foot values can be and often are affected by other factors besides changes in fair market value. Longer term trends are much more meaningful than short-term.

Compass is a real estate broker licensed by the State of California, DRE 01527235. Equal Housing Opportunity. This report has been prepared solely for information purposes. The information herein is based on or derived from information generally available to the public and/or from sources believed to be reliable. No representation or warranty can be given with respect to the accuracy or completeness of the information. Compass disclaims any and all liability relating to this report, including without limitation any express or implied representations or warranties for statements contained in, and omissions from, the report. Nothing contained herein is intended to be or should be read as any regulatory, legal, tax, accounting or other advice and Compass does not provide such advice. All opinions are subject to change without notice. Compass makes no representation regarding the accuracy of any statements regarding any references to the laws, statutes or regulations of any state are those of the author(s). Past performance is no guarantee of future results.
Santa Clara County Real Estate, February 2022

2022 Begins with Mixed Economic Indicators

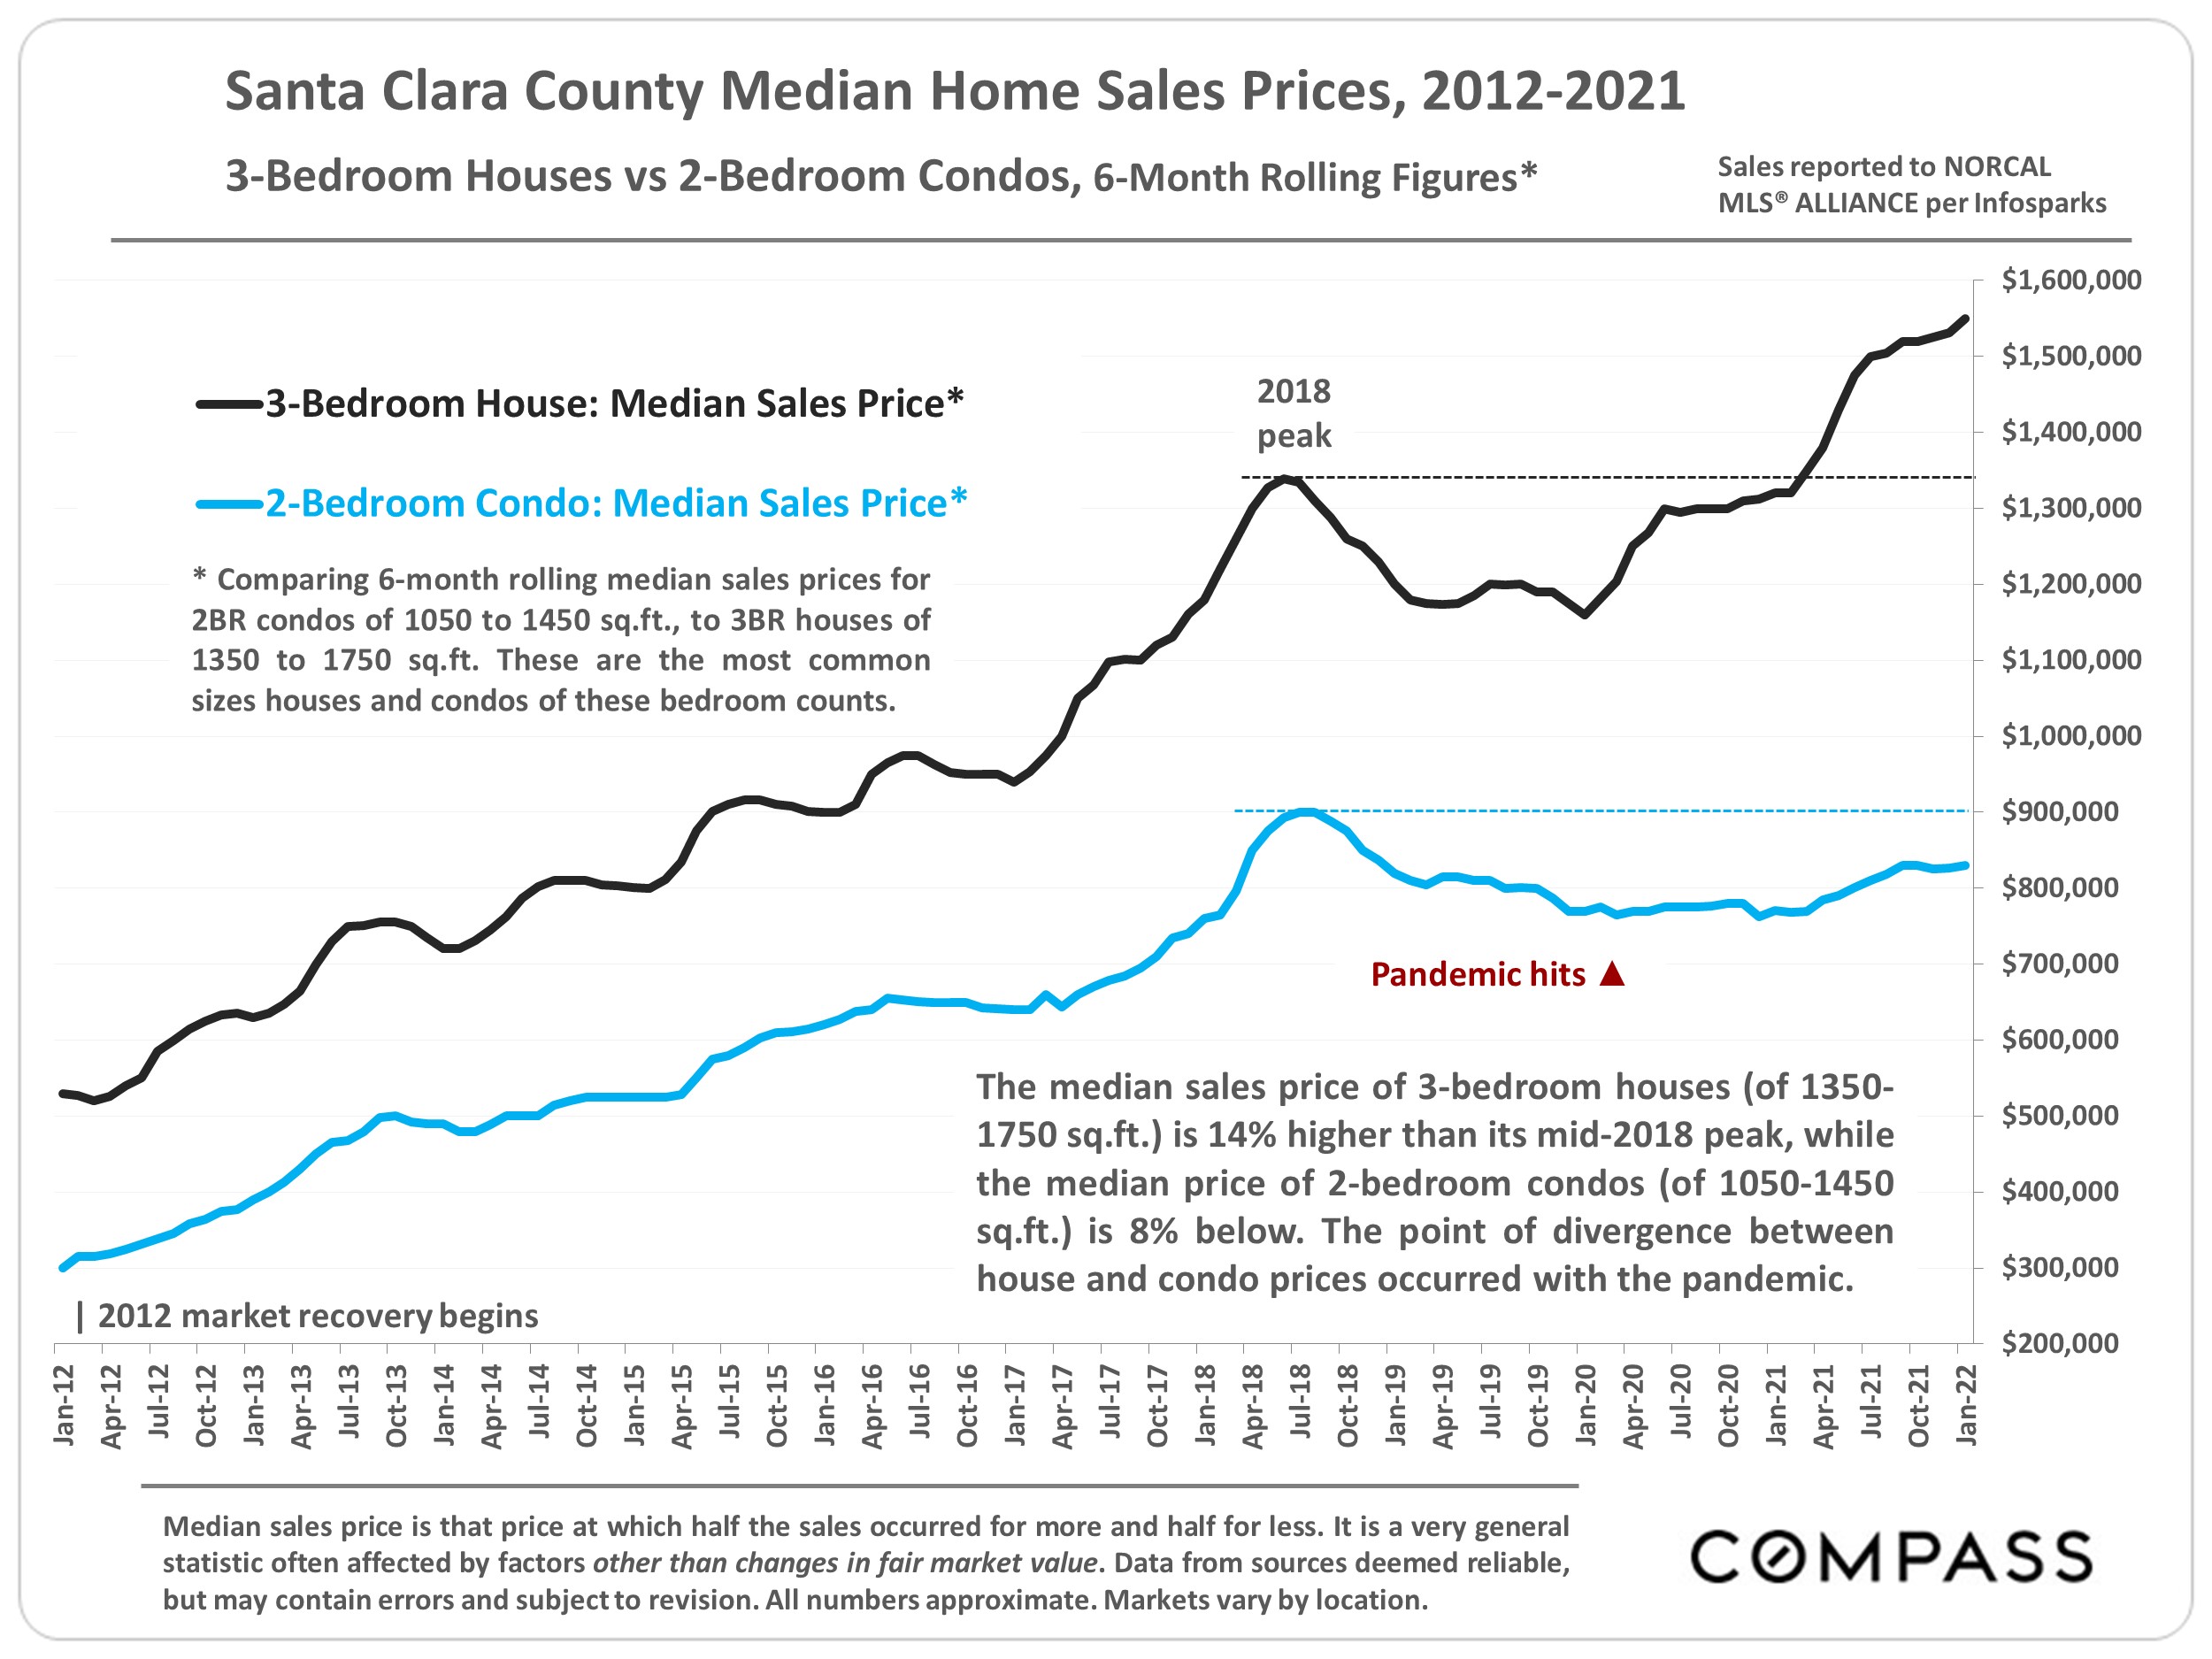
2021 was one of the most frenzied real estate markets ever, with buyer demand far exceeding the supply of listings available to buy — and all the usual indicators, including home price appreciation trends, reflected this severe imbalance. As is the normal seasonal trend, listing and offer activity dropped substantially mid- November through early January, resulting in very low sales volume in the year’s first month.

As of 2/3/22, mortgage interest rates have risen 14% in 2022, putting them 34% above the low 1 year ago. Inflation is at a 40-year high, and the Fed plans to make major changes to its interest-rate policies and its interventions in the economy generally. Consumer confidence has been dropping, and financial markets have seen considerable turbulence in the new year. Geopolitical risks of major-power conflict appear to be rising.

On the other hand, employment, GDP, and household-wealth indicators are quite positive; by historical standards, interest rates remain very low and stock markets very high; COVID infections are falling. The Bay Area is home to many of the world’s most innovative and successful companies; there is an enormous concentration of local wealth; and a staggering amount of money sloshing around the economy looking for somewhere to invest. Many believe real estate to be an excellent hedge against inflation, and an excellent long-term investment generally (heightened by tax advantages).

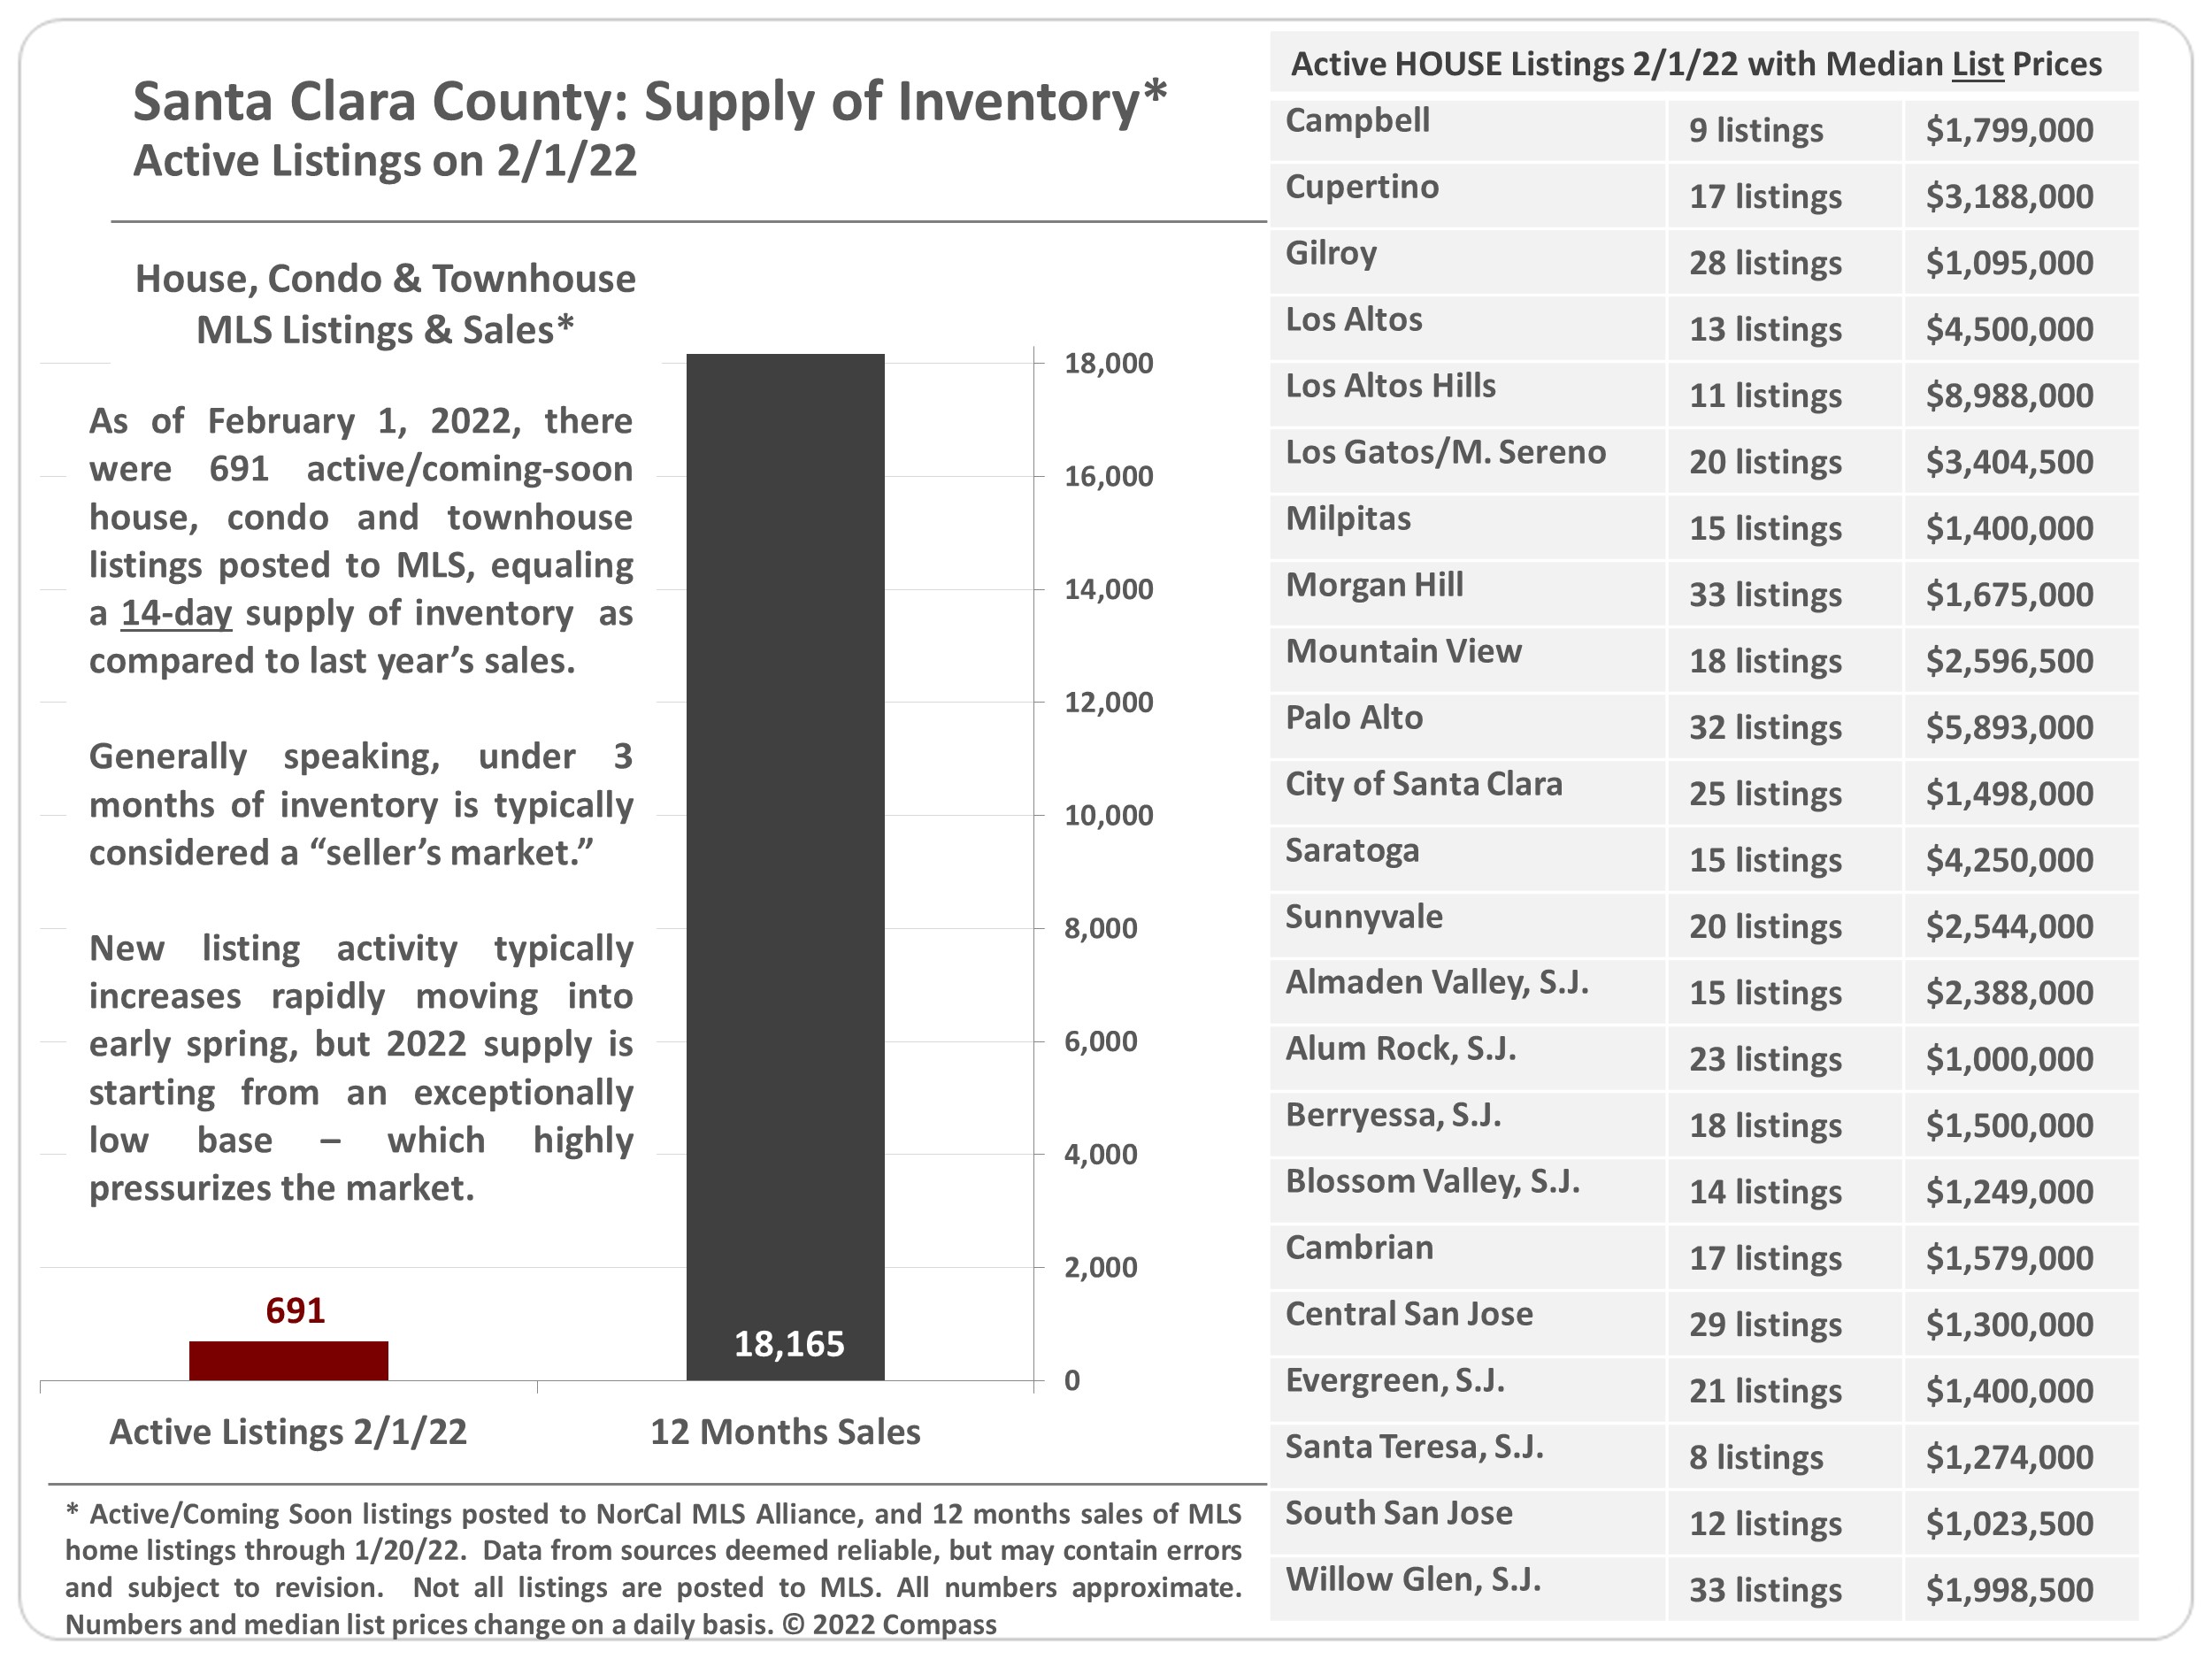
In the Bay Area, real estate market indicators remain very strong: demand for homes still very high, inventory still very low. So far, buyers do not seem to be significantly rattled by stock market gyrations, and increasing interest rates may be motivating some to buy sooner than later. As the new year wakes up, a common dynamic in heated markets is for buyers to jump back in much faster than sellers: Demand outpaces supply right from the start, with all the usual results (multiple offers, overbidding, fast sales), even as the number of new listings starts climbing. This describes 2022 to date, but more will be known once the spring selling season — typically the biggest of the year — really gets underway. (In the Bay Area, the “spring” market can begin in February.)

As an aside: Compared to the general market, luxury home buyers tend to be less sensitive to interest rate movements, but more sensitive to turbulence and uncertainty in financial markets.

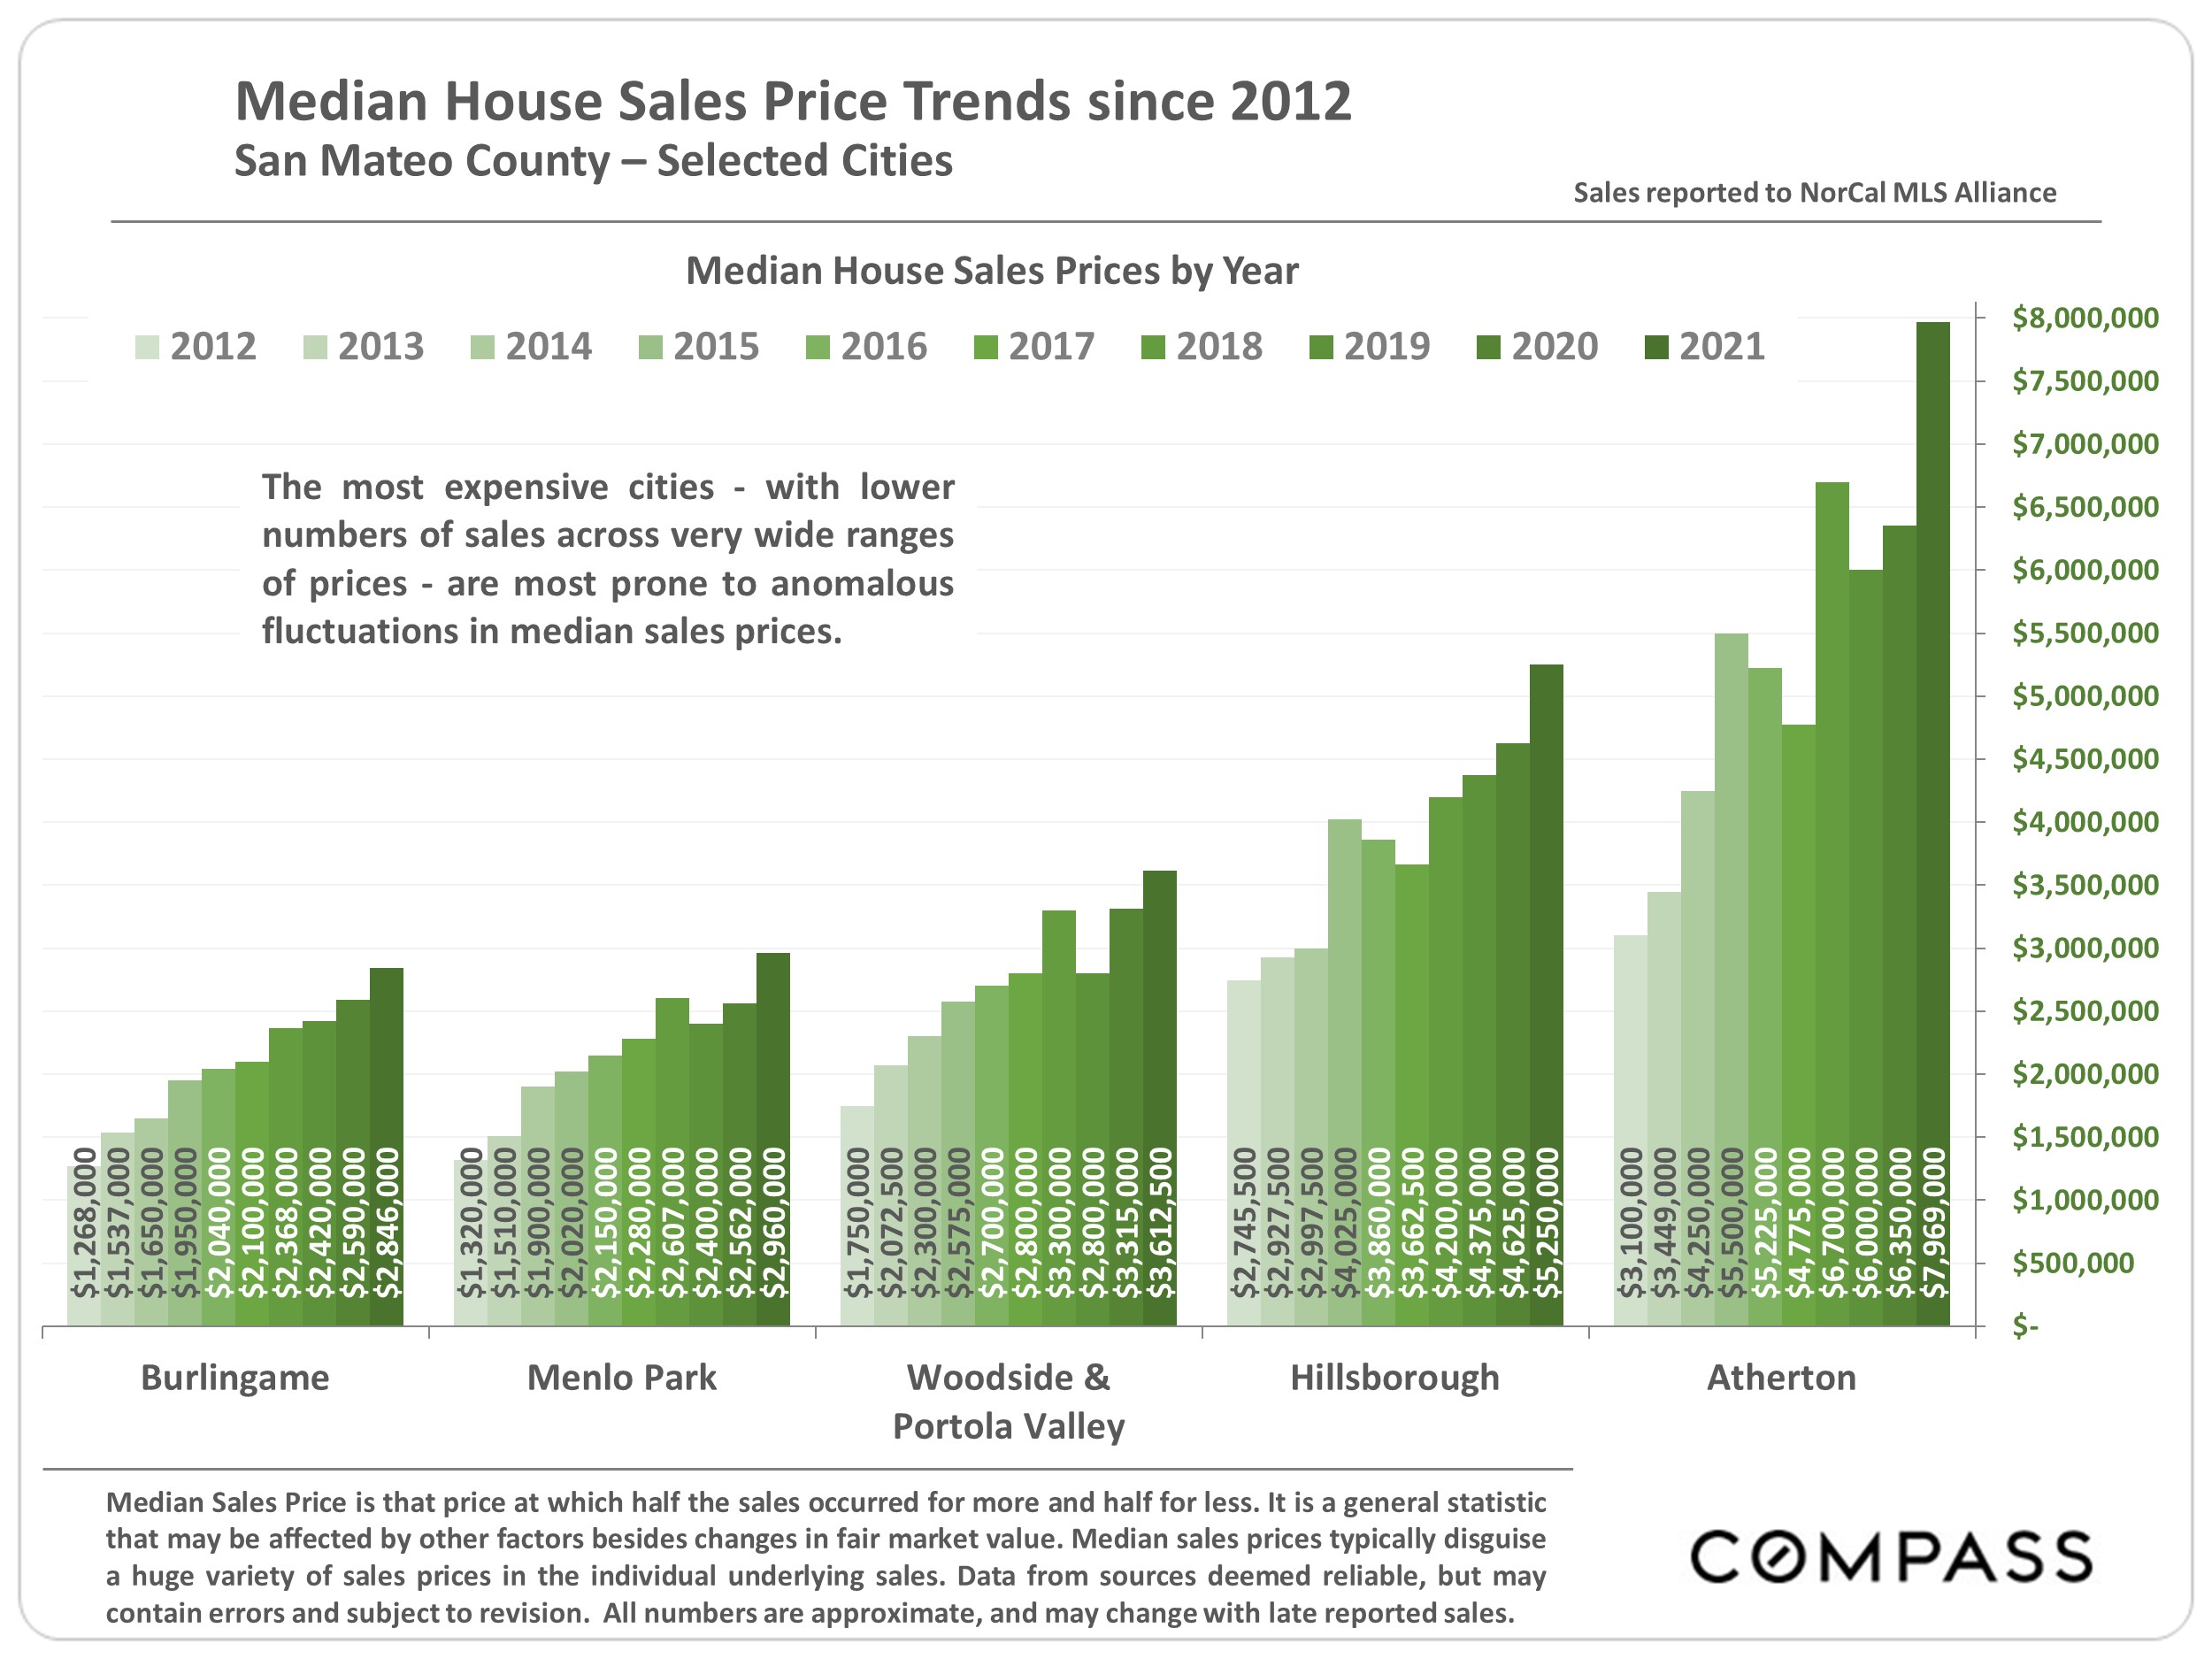
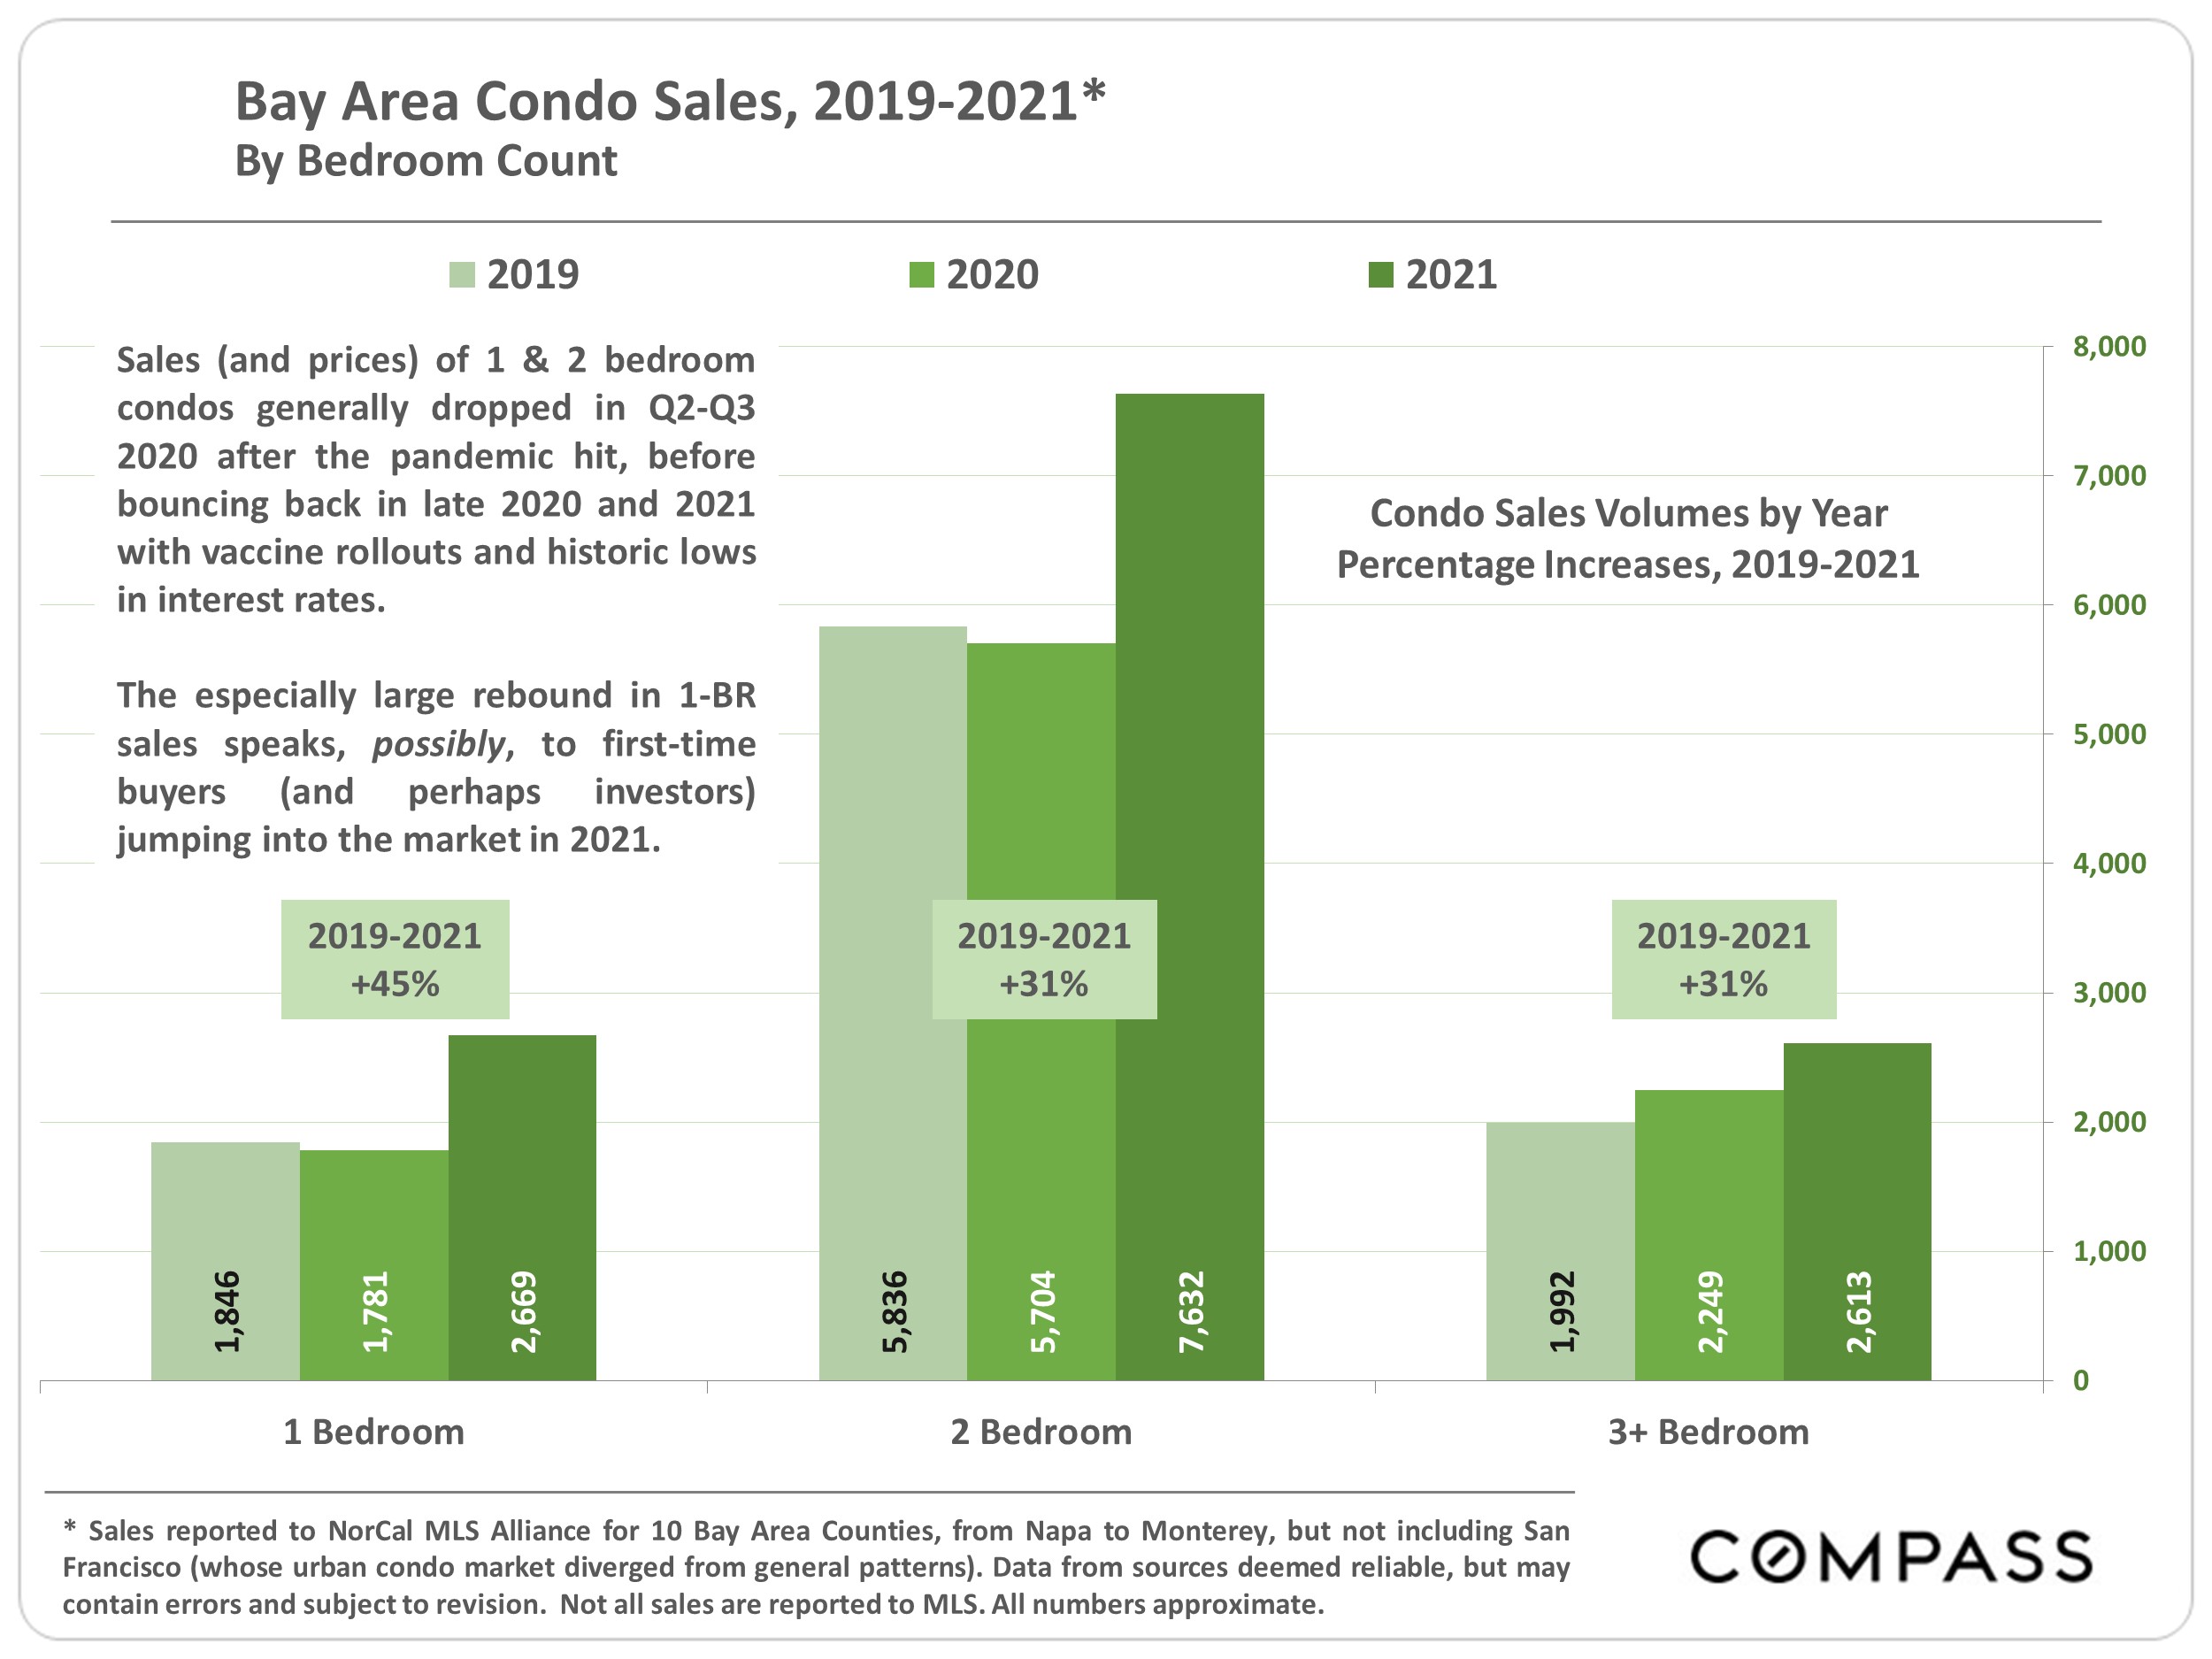
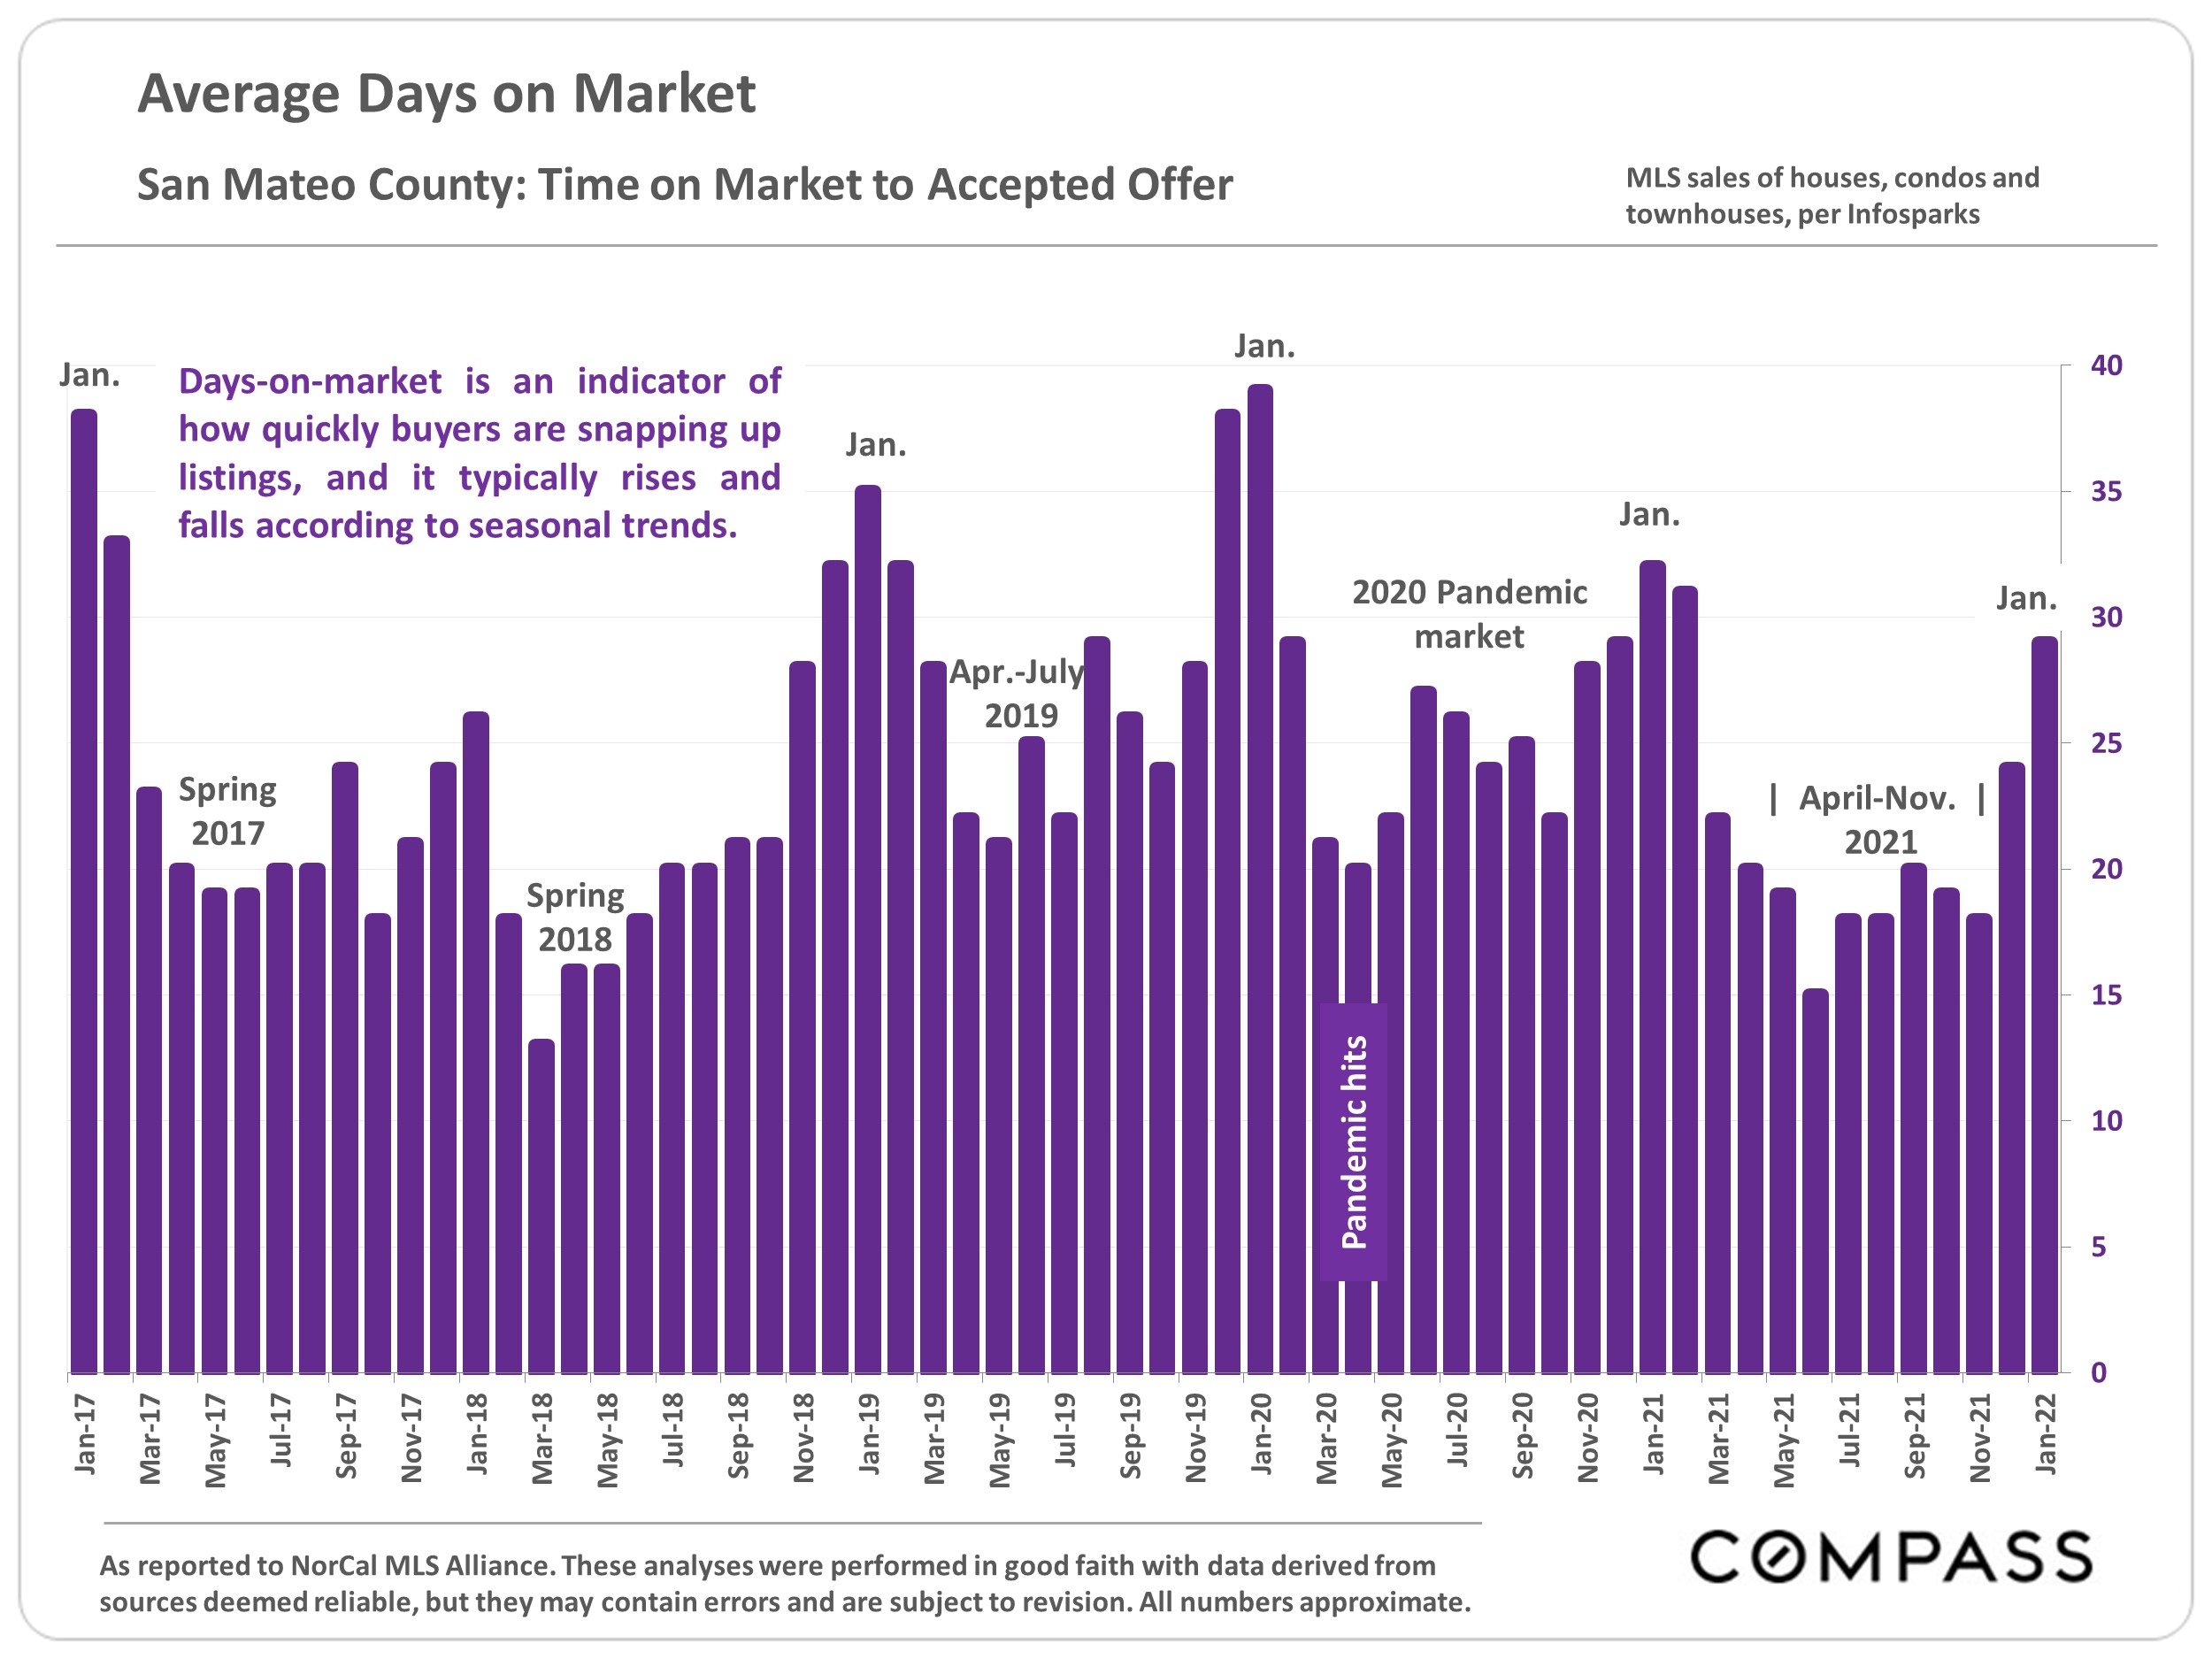
San Mateo County Real Estate, February 2022

2022 Begins with Mixed Economic Indicators

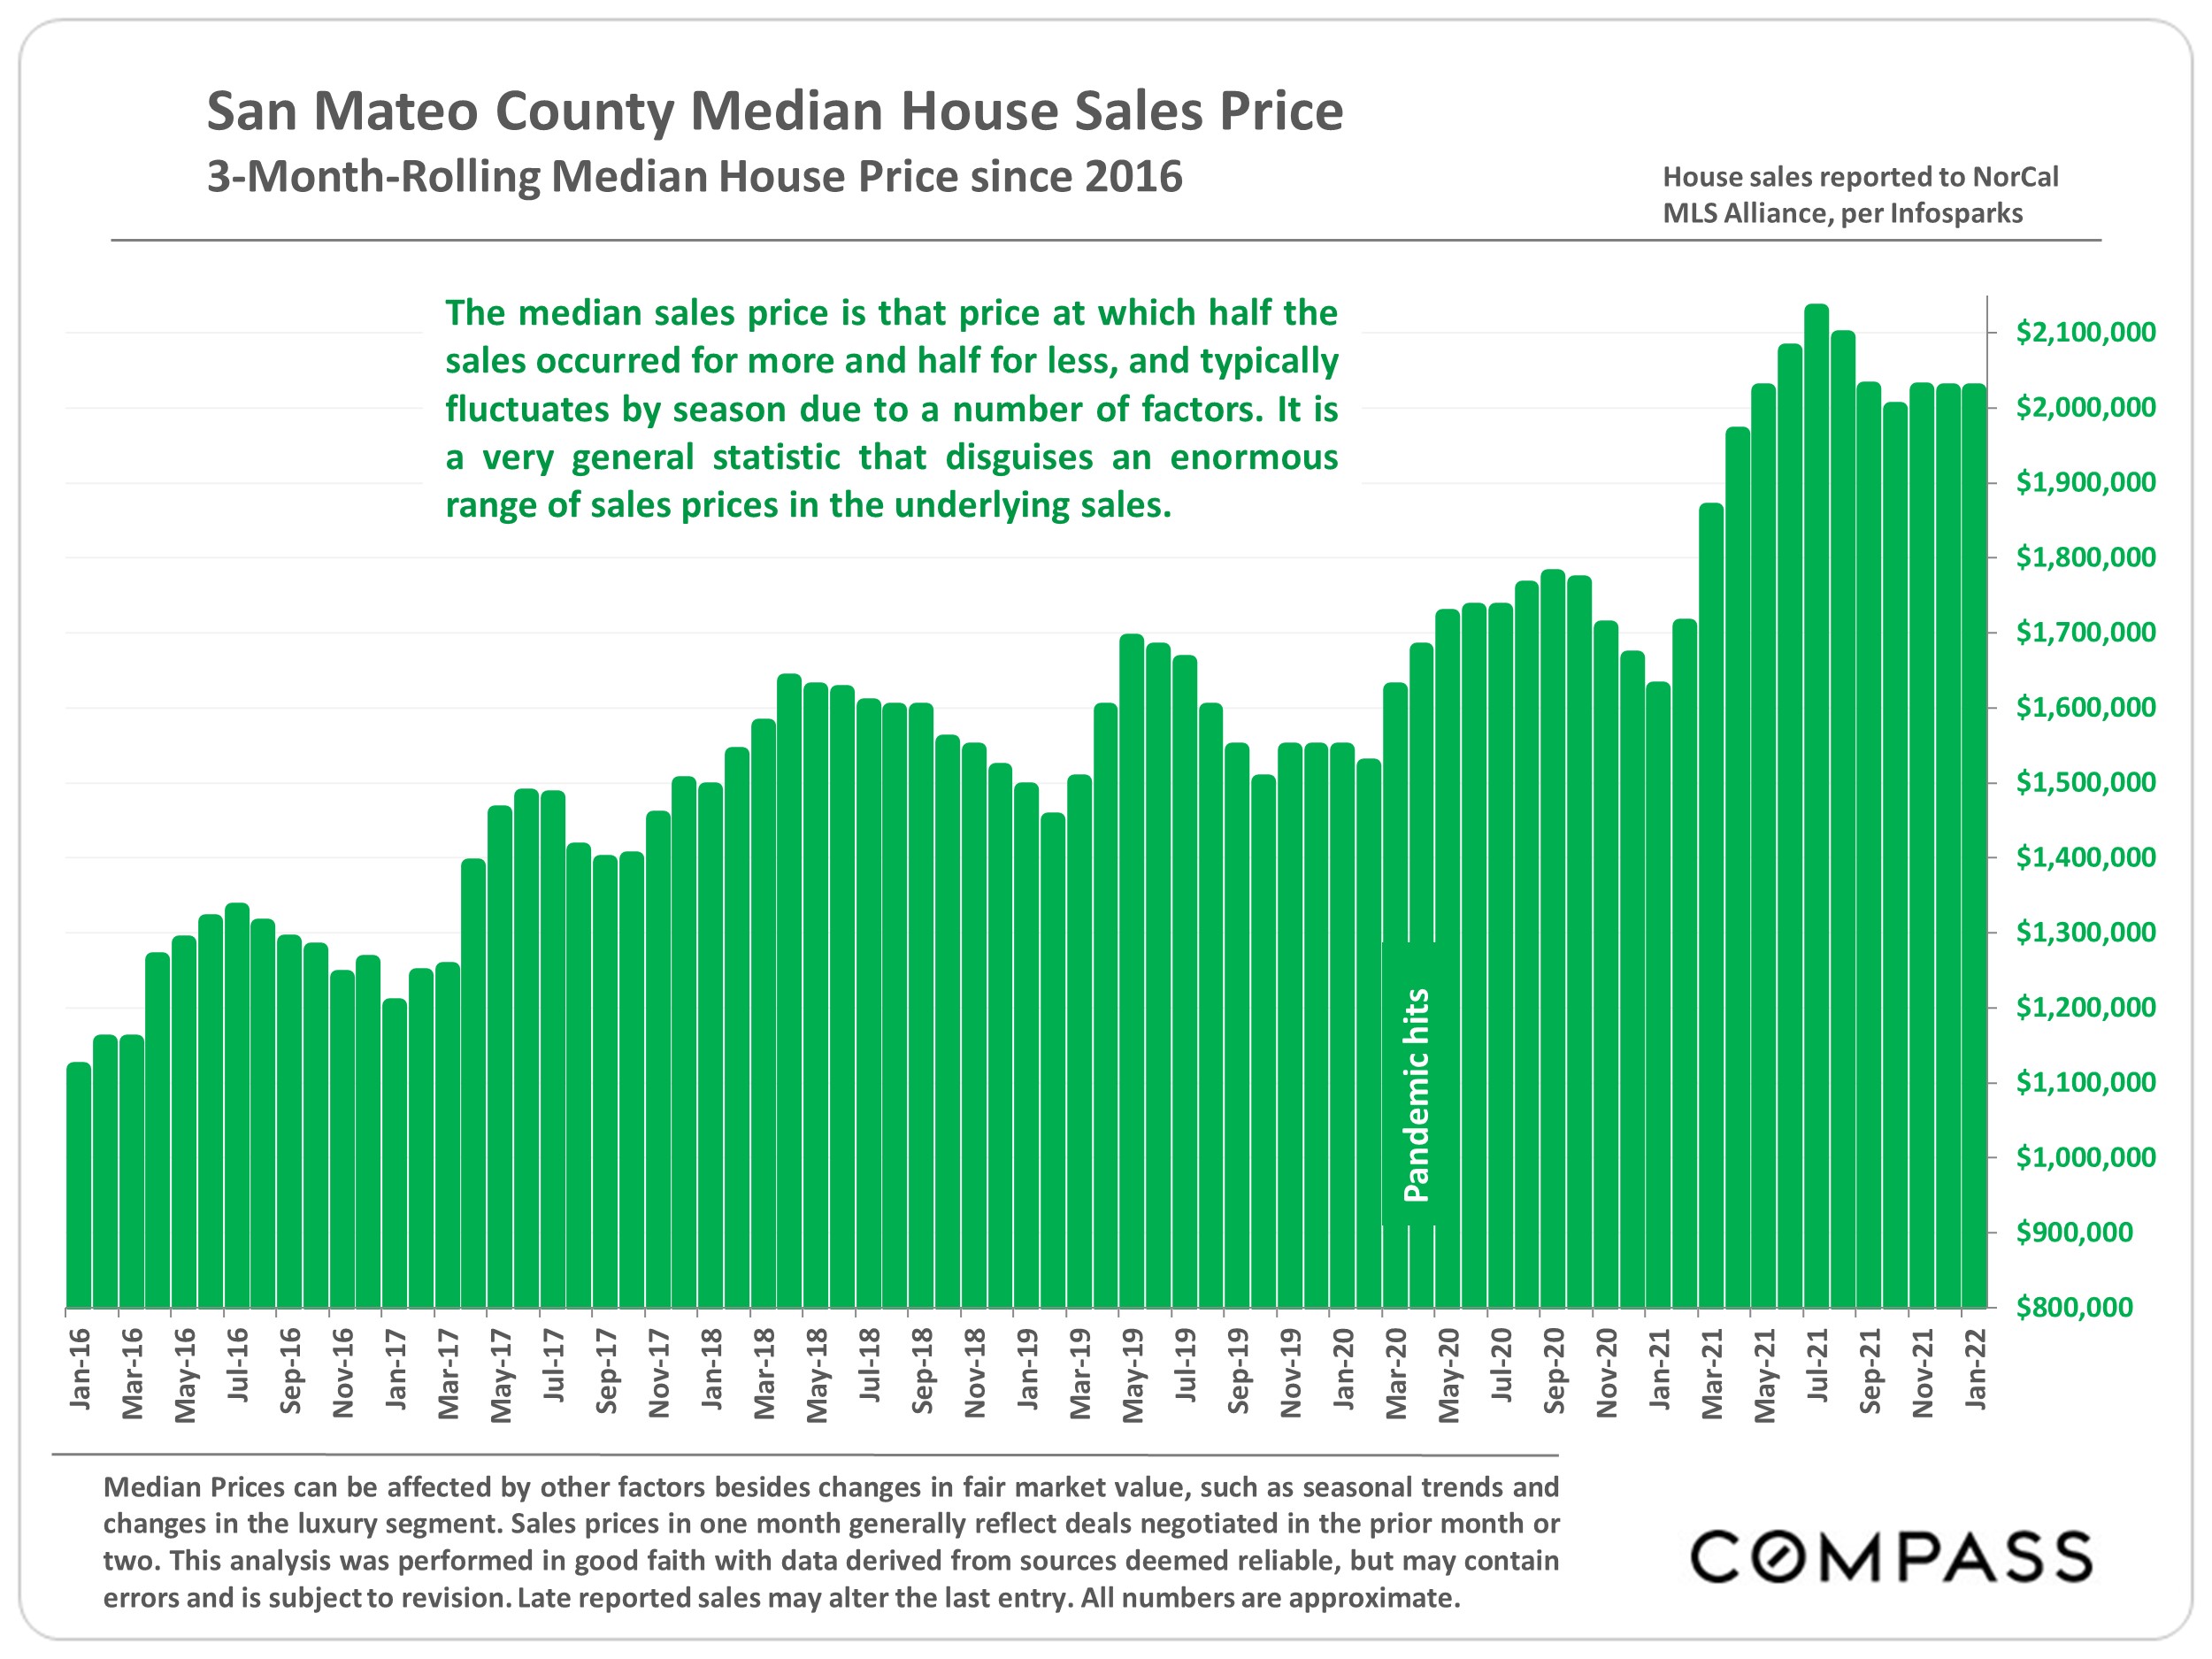
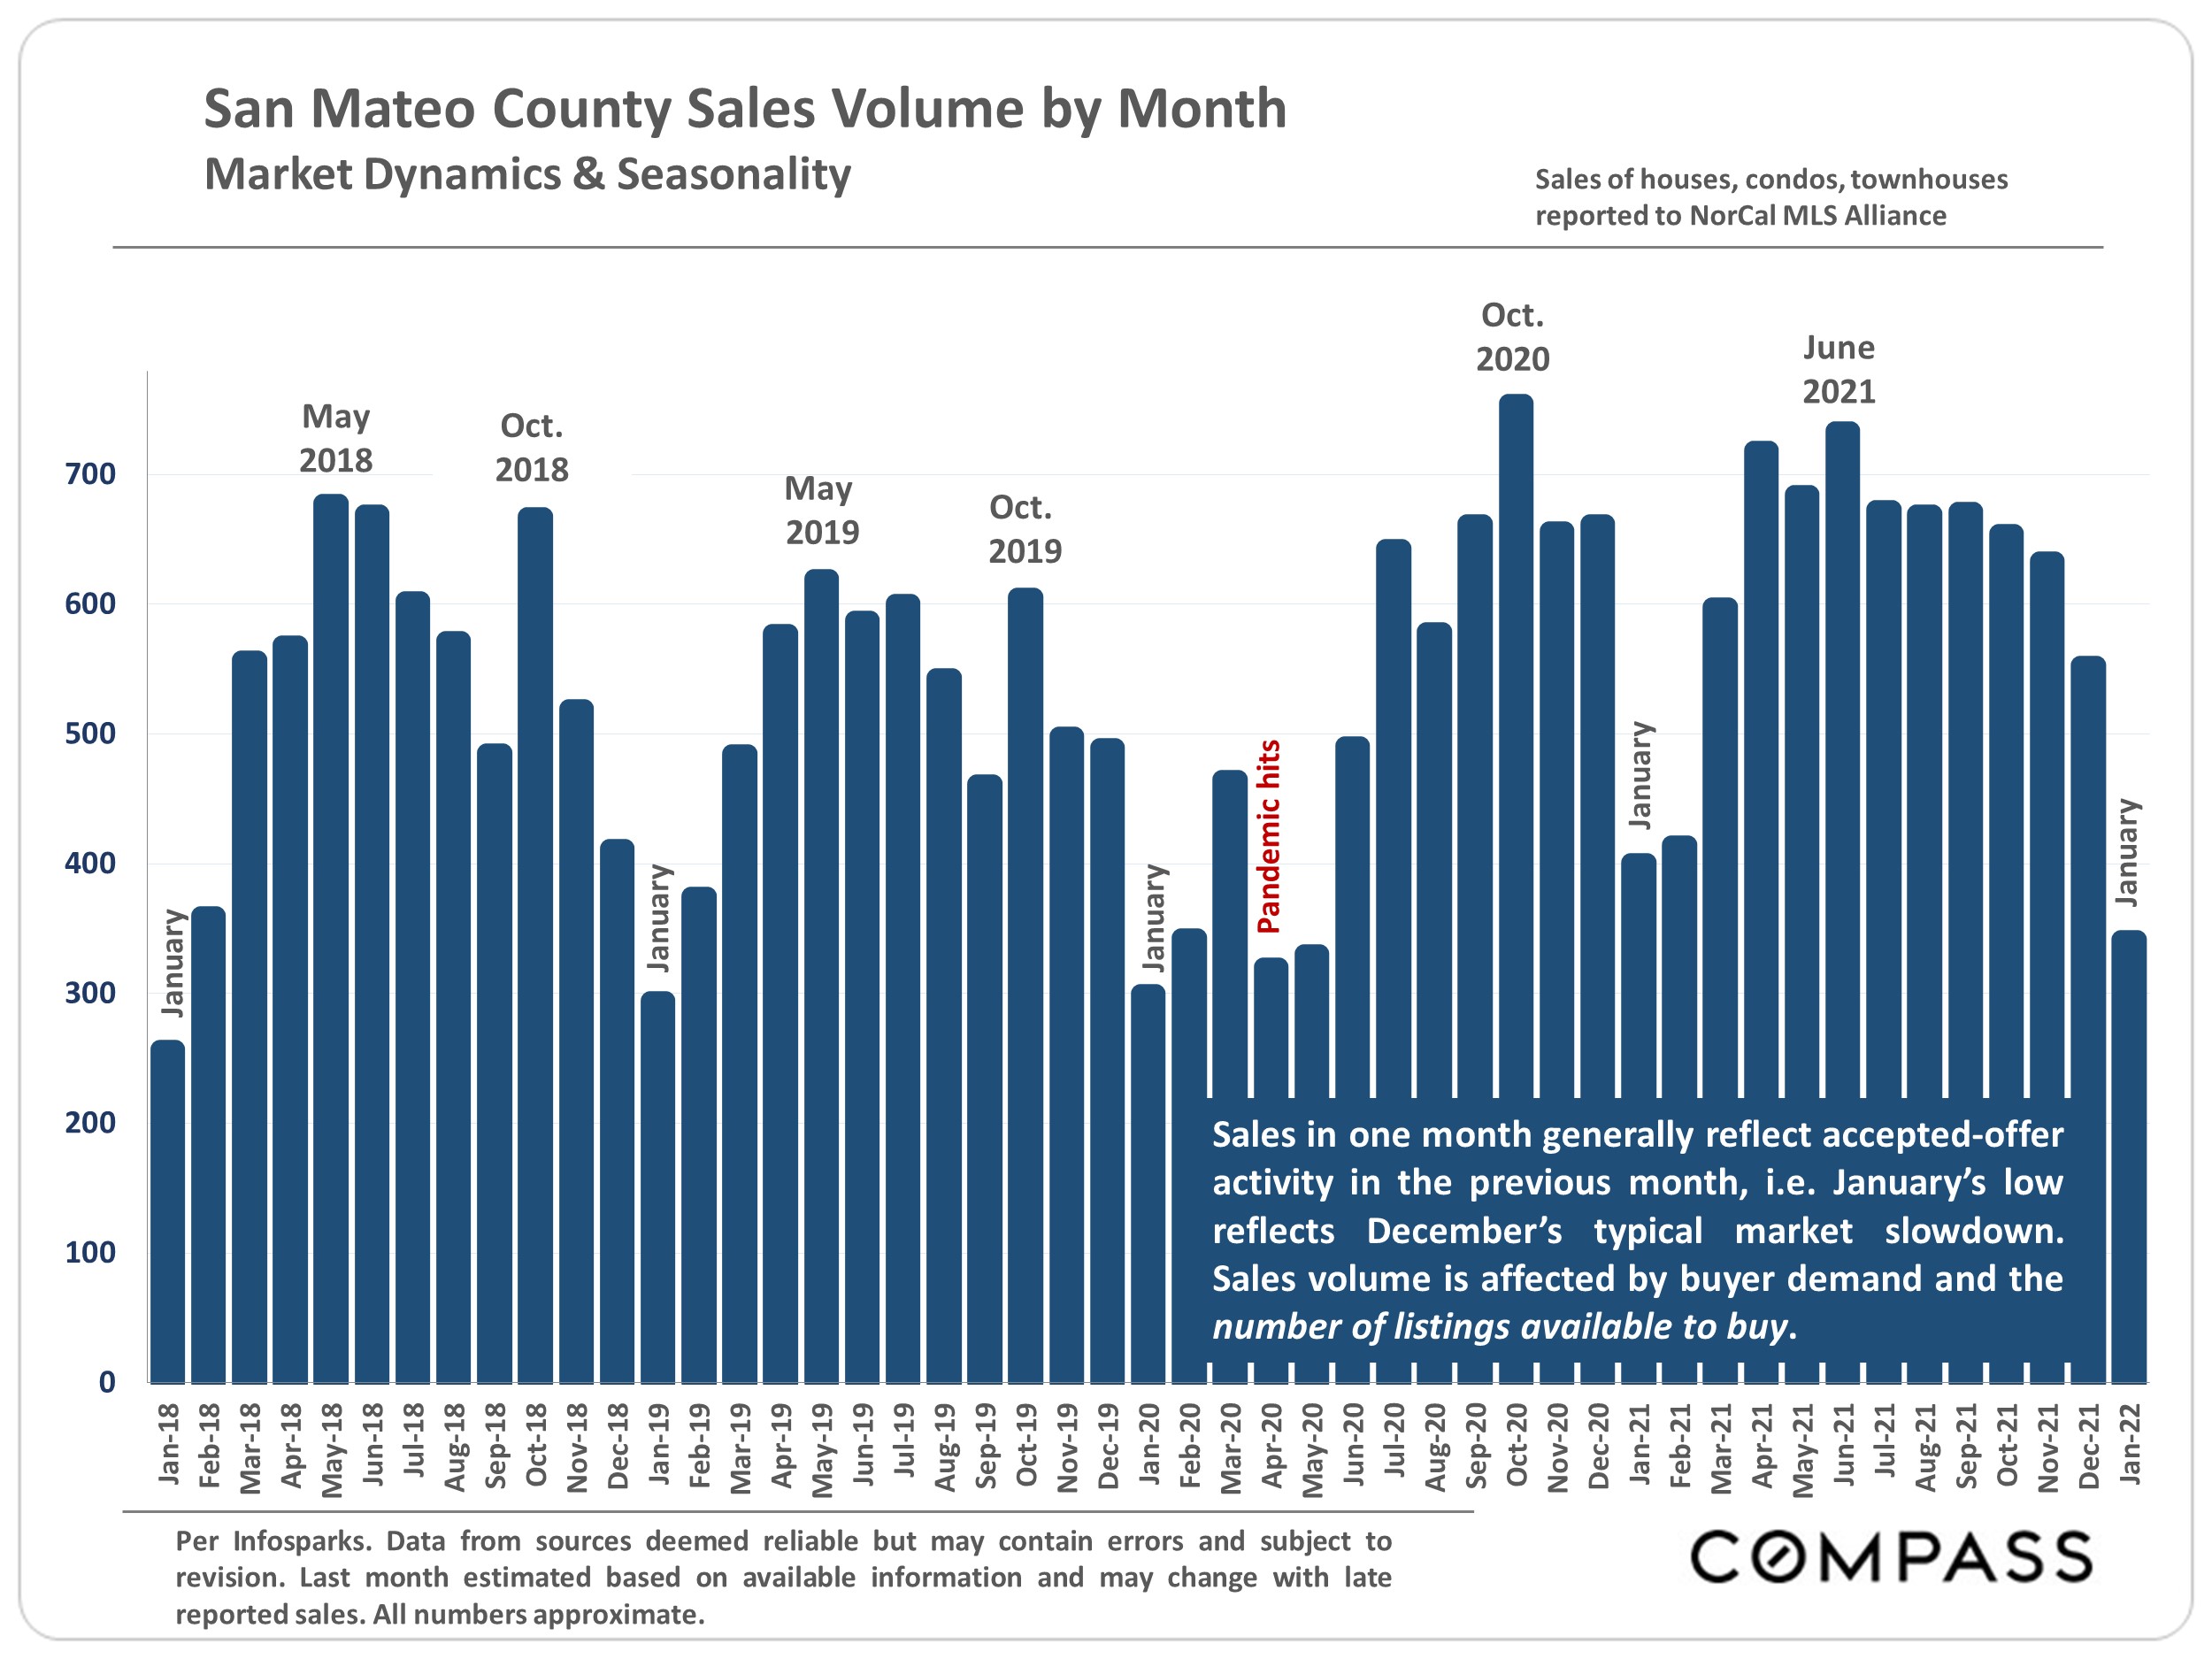
2021 was one of the most frenzied real estate markets ever, with buyer demand far exceeding the supply of listings available to buy — and all the usual indicators, including home price appreciation trends, reflected this severe imbalance. As is the normal seasonal trend, listing and offer activity dropped substantially mid-November through early January, resulting in very low sales volume in the year’s first month.

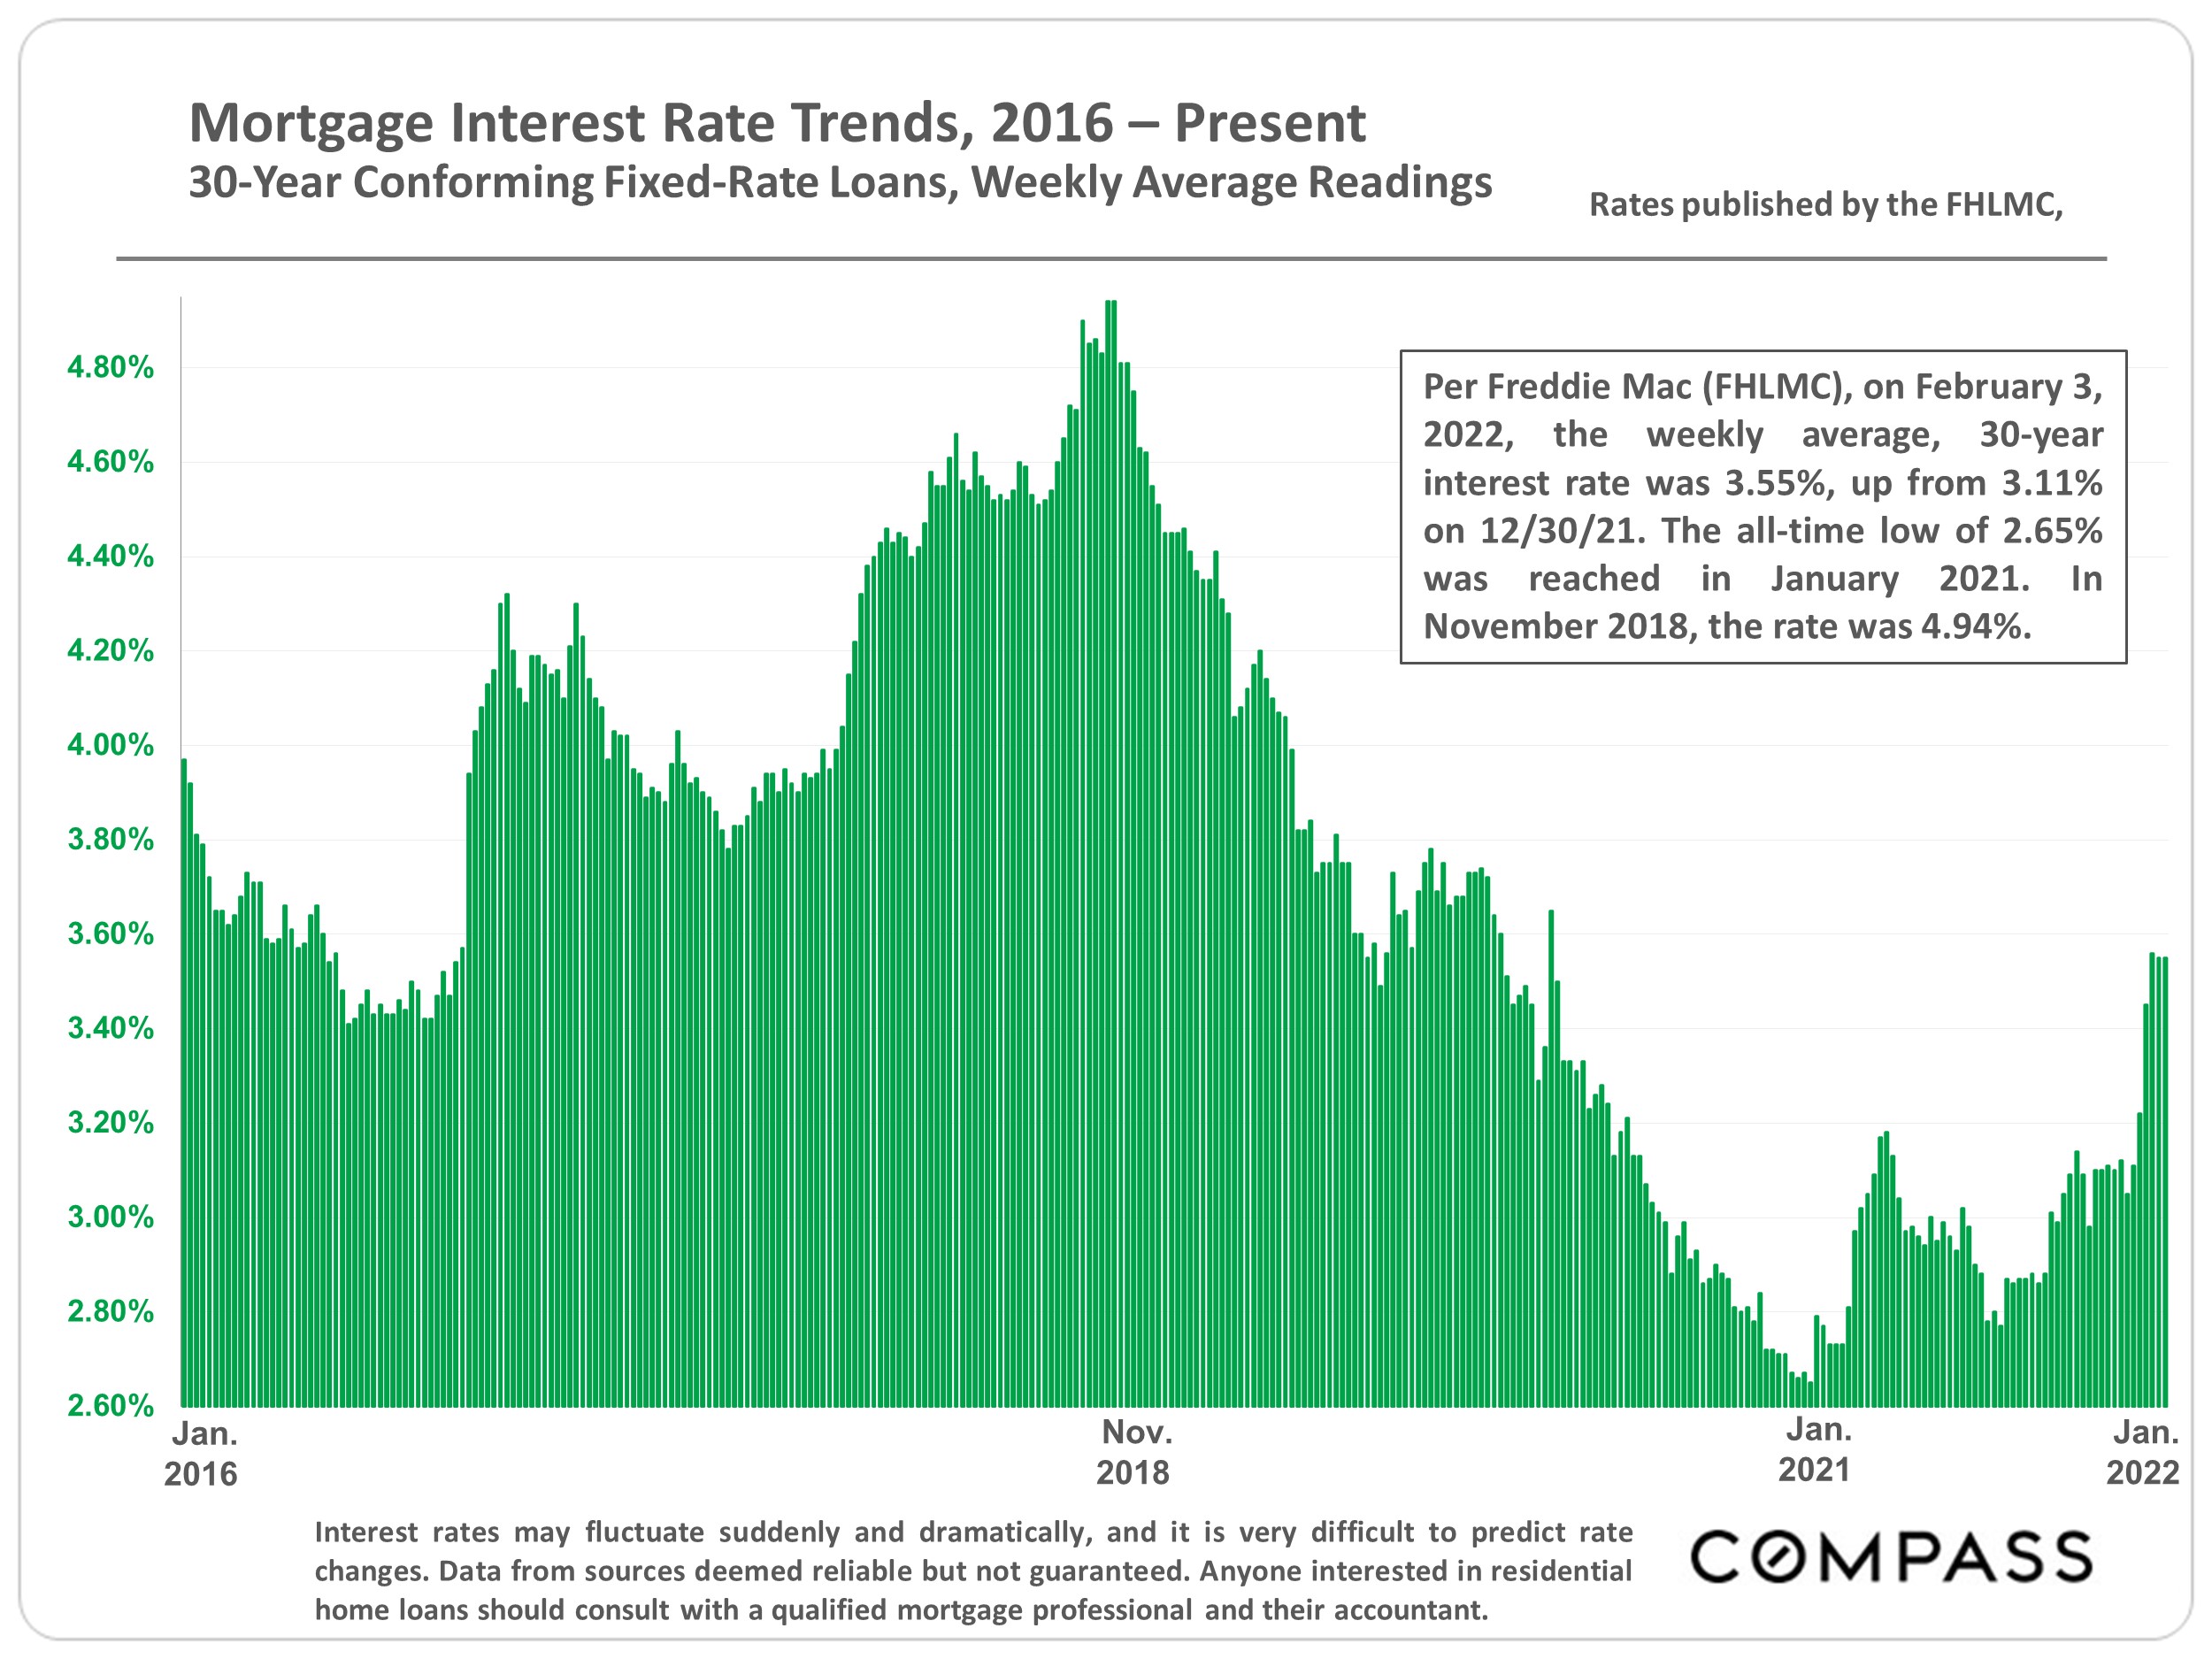
As of 2/3/22, mortgage interest rates have risen 14% in 2022, putting them 34% above the low 1 year ago. Inflation is at a 40-year high, and the Fed plans to make major changes to its interest-rate policies and its interventions in the economy generally. Consumer confidence has been dropping, and financial markets have seen considerable turbulence in the new year. Geopolitical risks of major-power conflict appear to be rising.

On the other hand, employment, GDP, and household-wealth indicators are quite positive; by historical standards, interest rates remain very low and stock markets very high; COVID infections are falling. The Bay Area is home to many of the world’s most innovative and successful companies; there is an enormous concentration of local wealth; and a staggering amount of money sloshing around the economy looking for somewhere to invest. Many believe real estate to be an excellent hedge against inflation, and an excellent long-term investment generally (heightened by tax advantages).

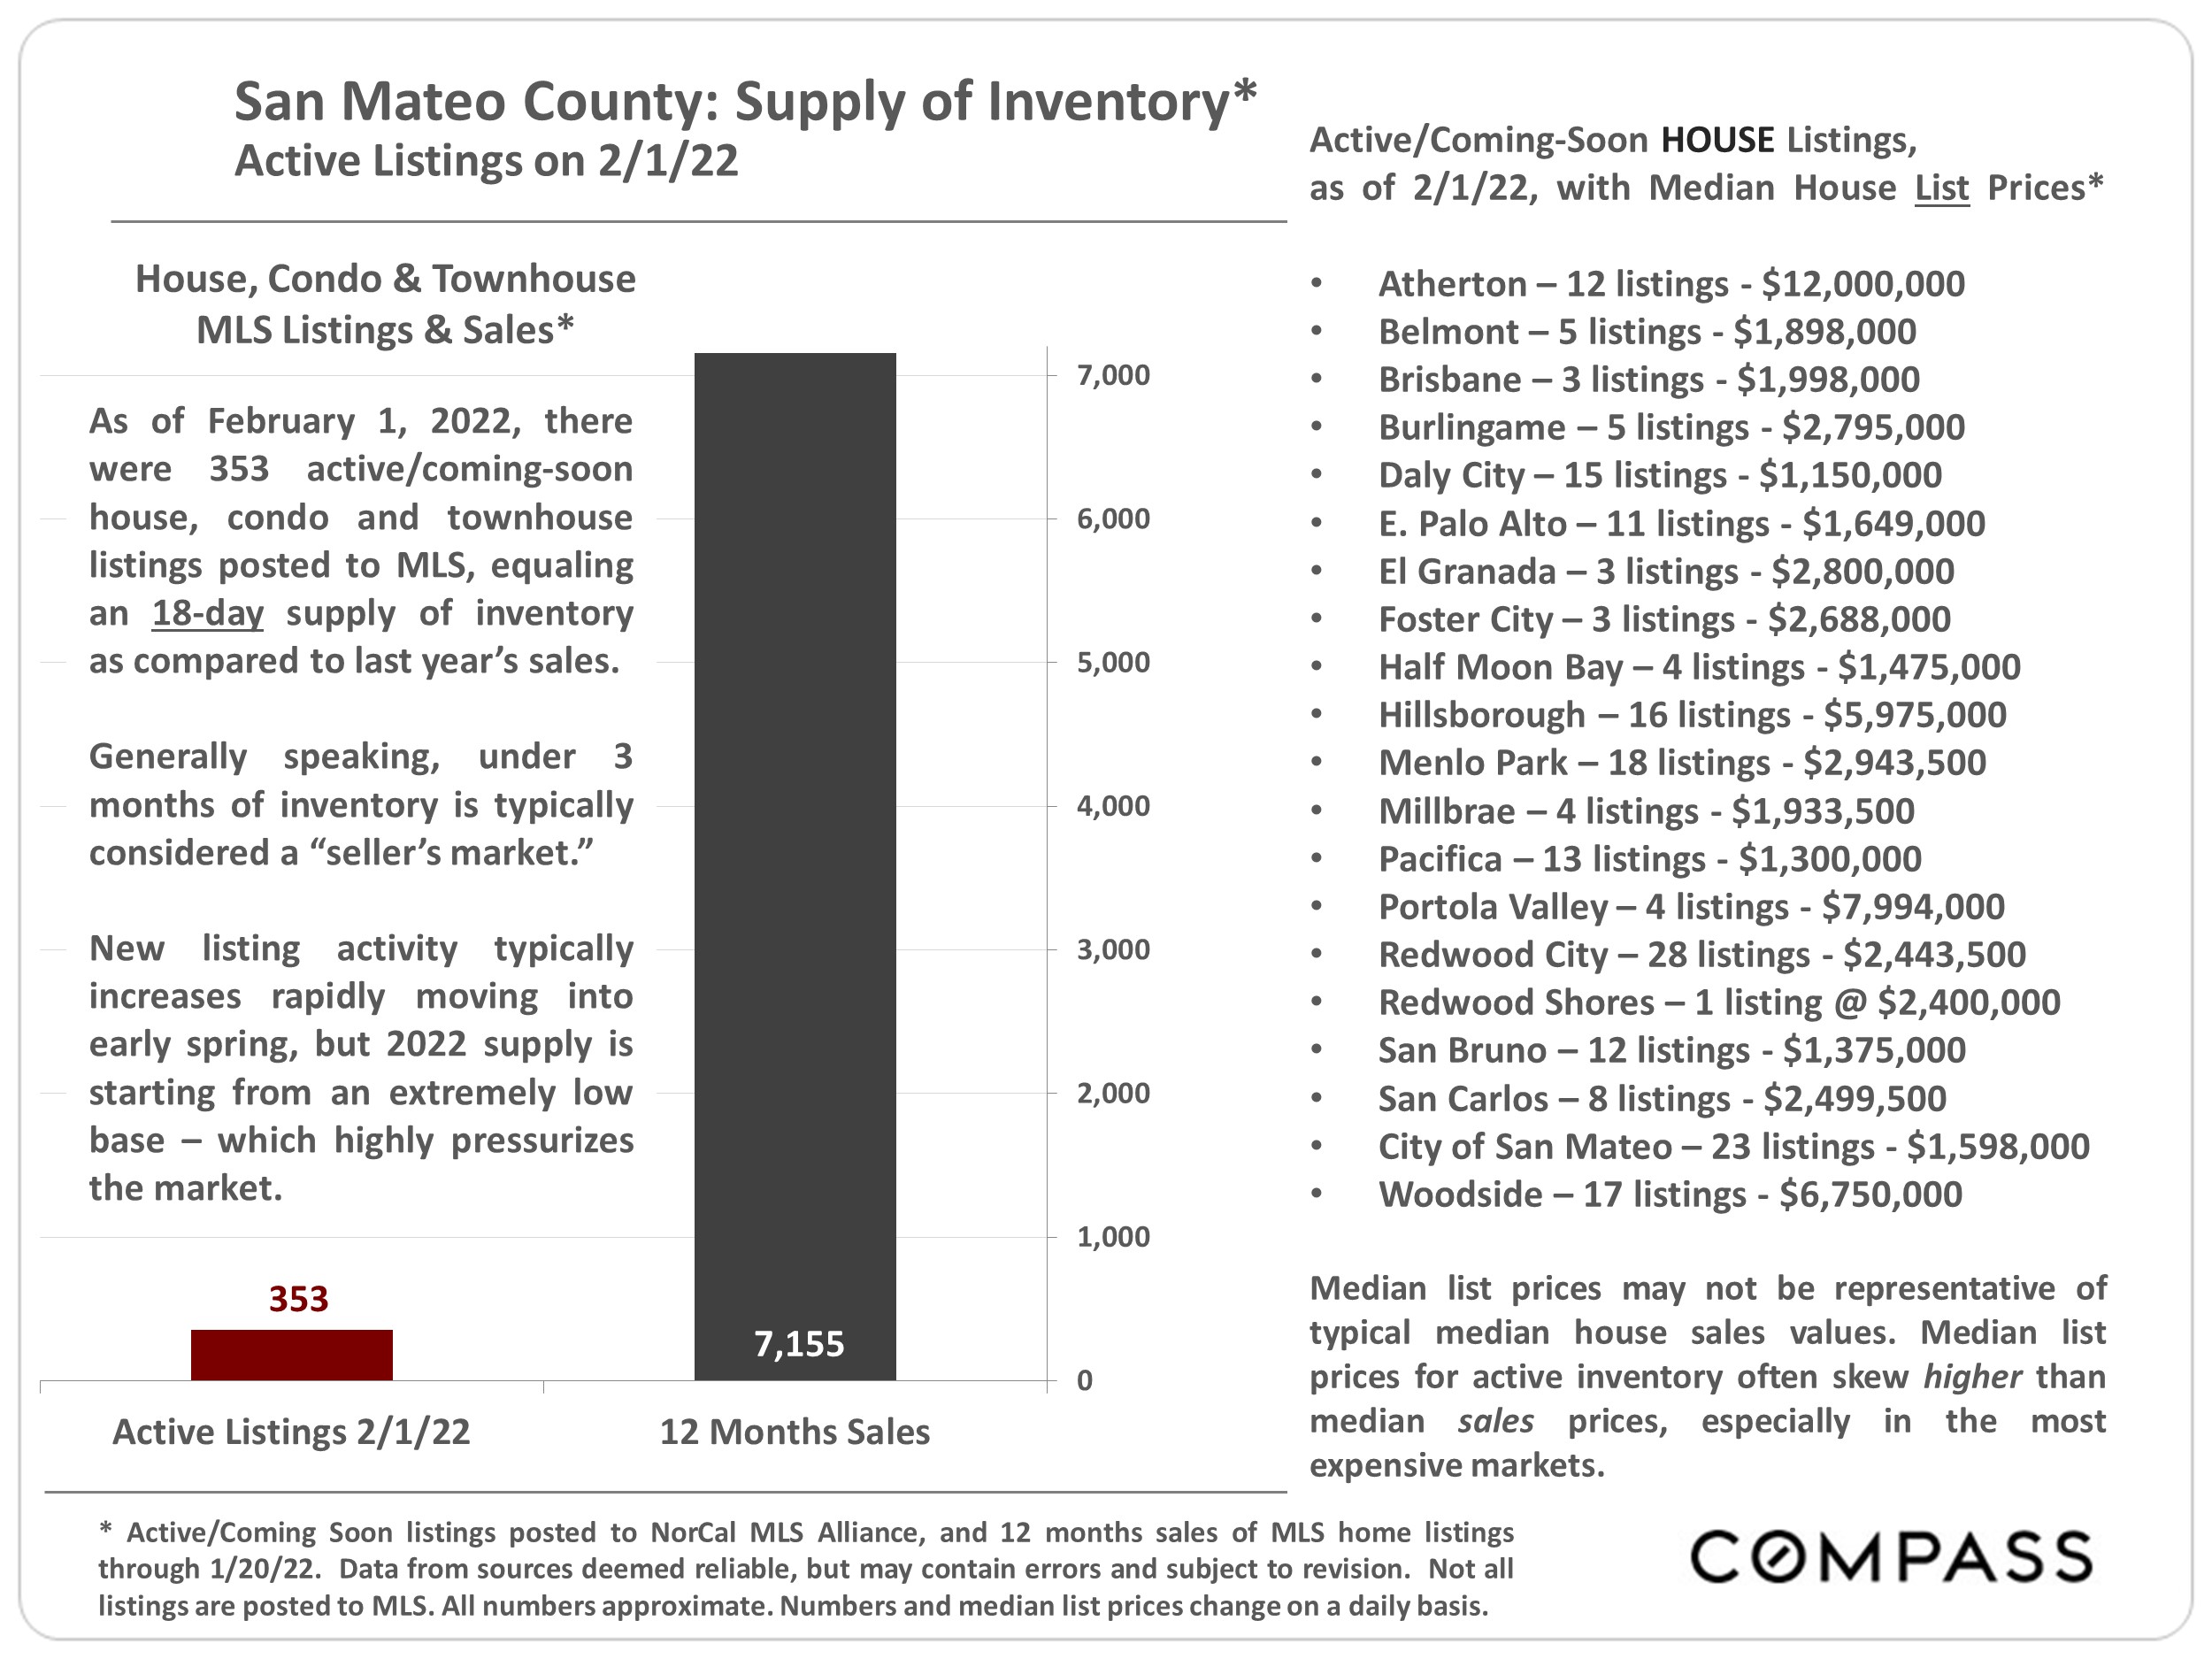
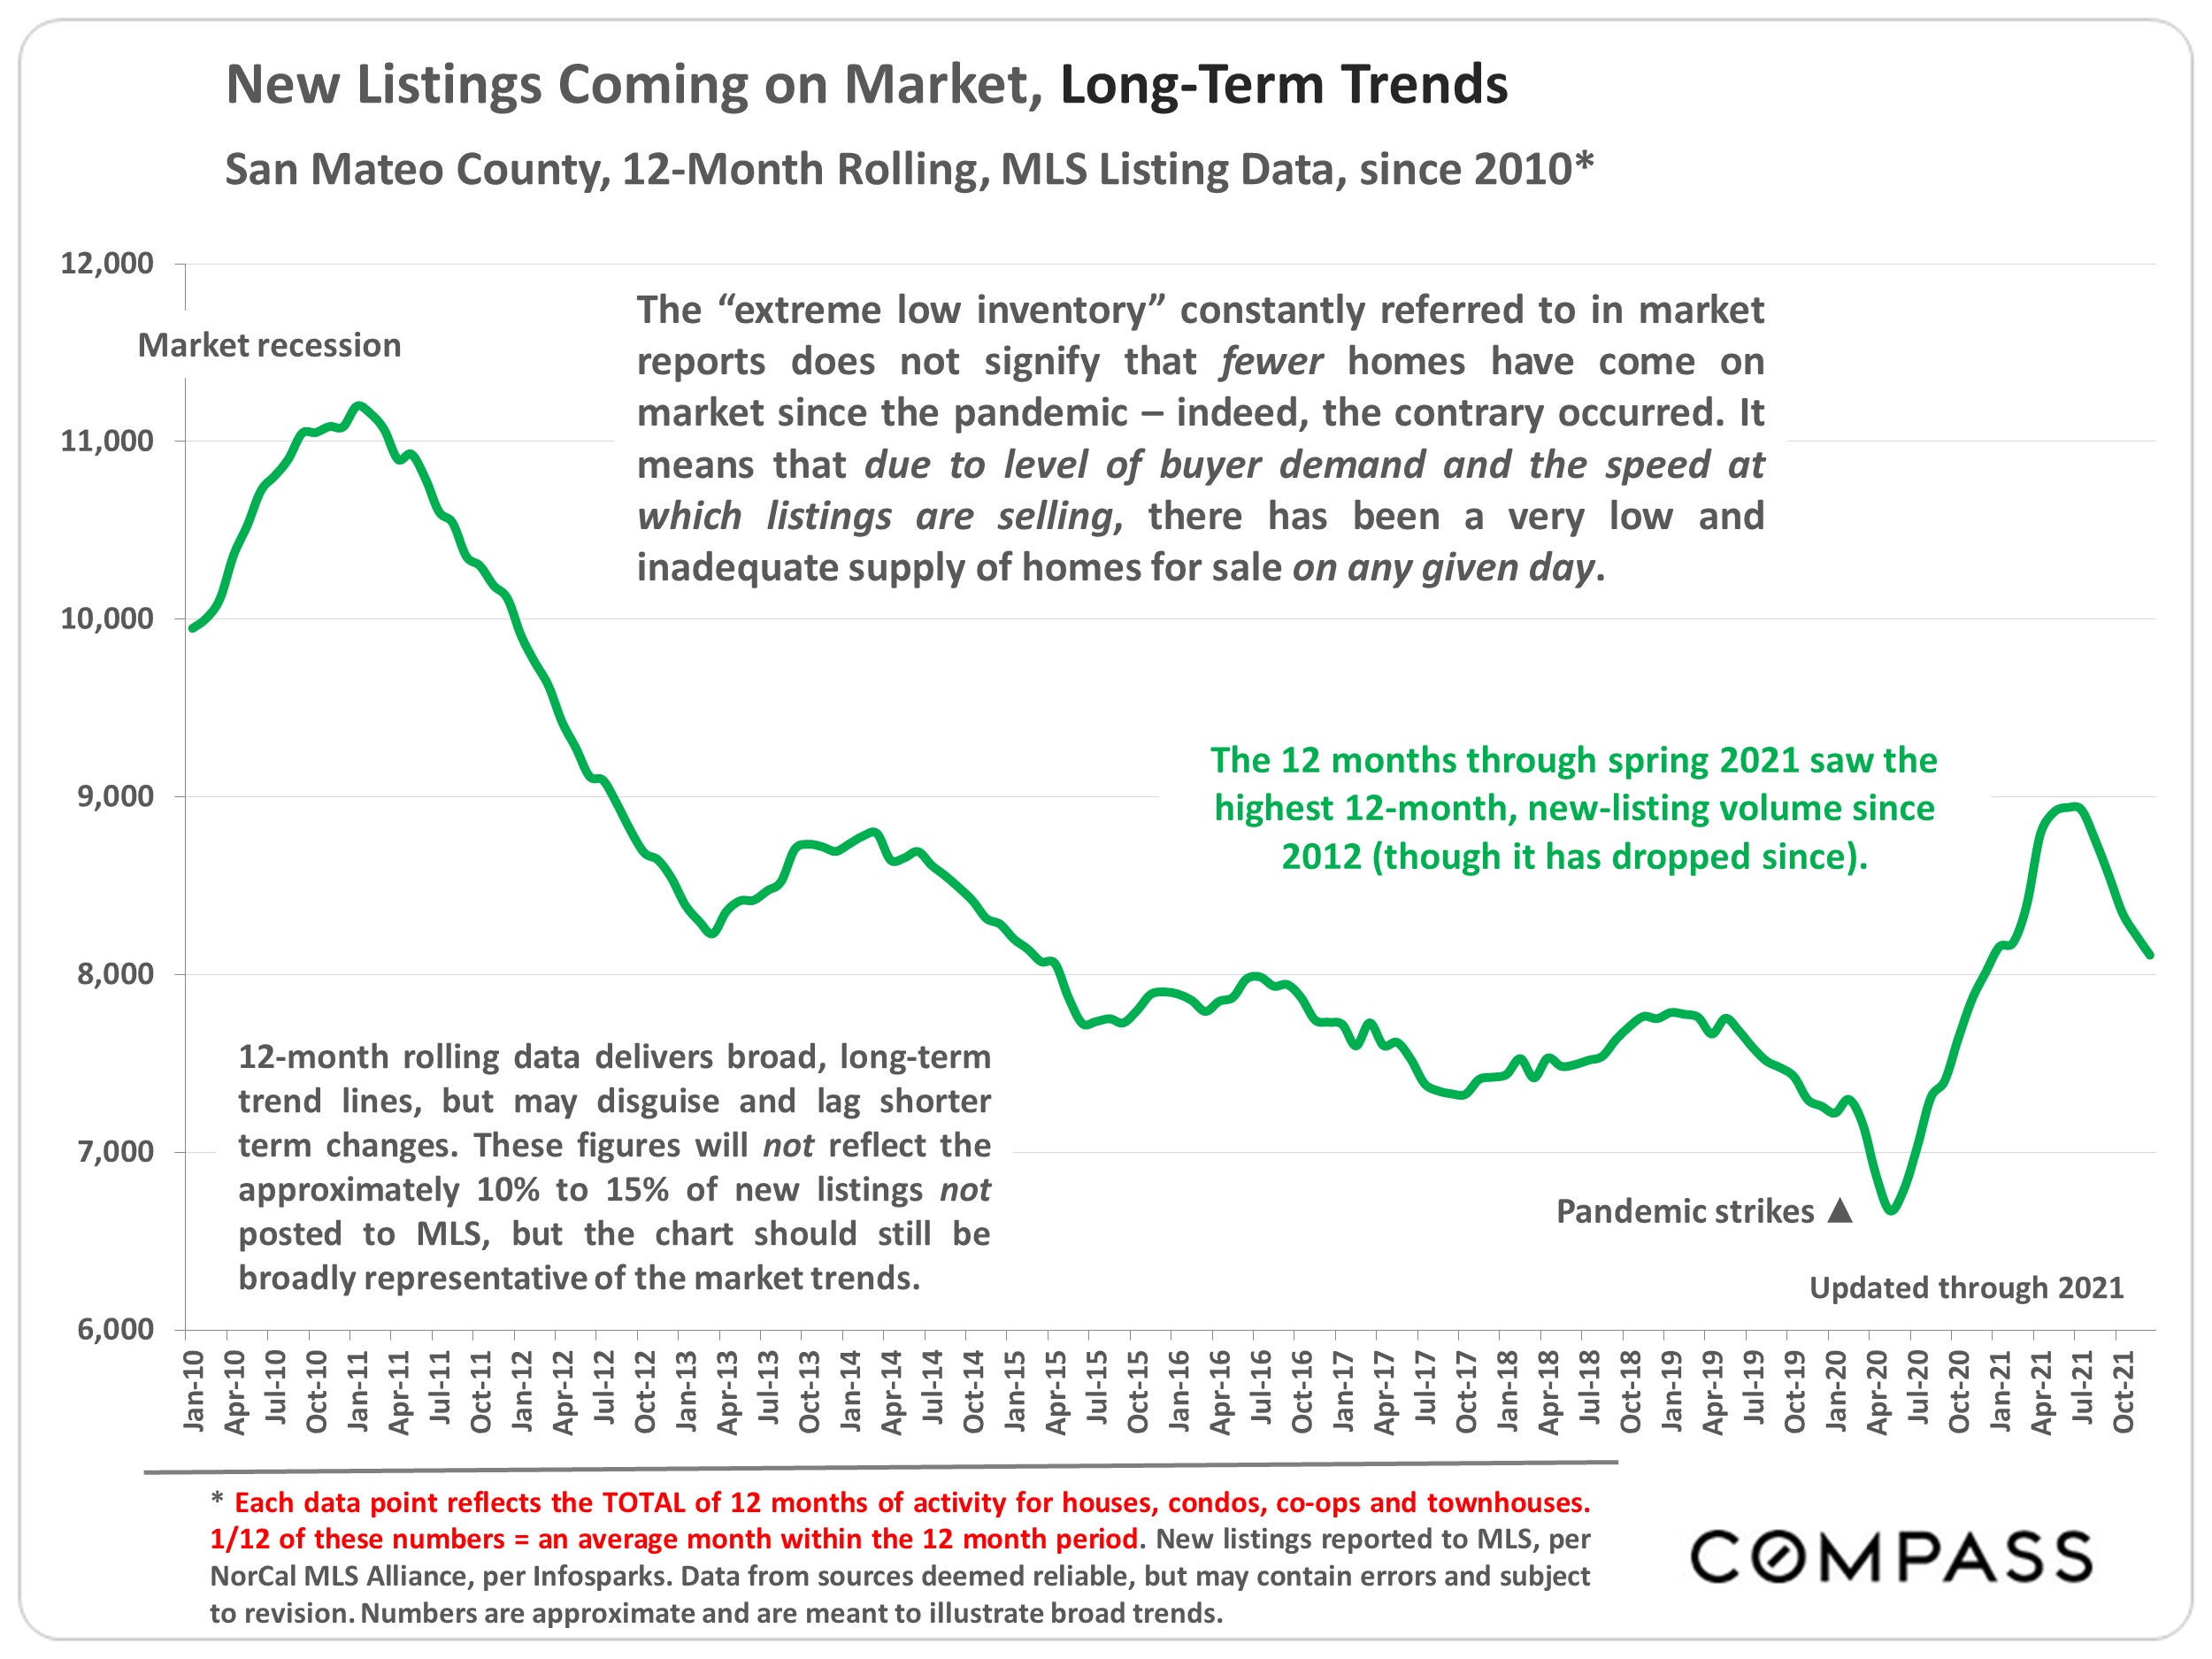
In the Bay Area, real estate market indicators remain very strong: demand for homes still very high, inventory still very low. So far, buyers do not seem to be significantly rattled by stock market gyrations, and increasing interest rates may be motivating some to buy sooner than later. As the new year wakes up, a common dynamic in heated markets is for buyers to jump back in much faster than sellers: Demand outpaces supply right from the start, with all the usual results (multiple offers, overbidding, fast sales), even as the number of new listings starts climbing. This describes 2022 to date, but more will be known once the spring selling season — typically the biggest of the year — really gets underway. (In the Bay Area, the “spring” market can begin in February.)

As an aside: Compared to the general market, luxury home buyers tend to be less sensitive to interest rate movements, but more sensitive to turbulence and uncertainty in financial markets.

Source: Compass

It is impossible to know how median and average value statistics apply to any particular home without a specific comparative market analysis. These analyses were made in good faith with data from sources deemed reliable, but may contain errors and are subject to revision. It is not our intent to convince you of a particular position, but to attempt to provide straightforward data and analysis, so you can make your own informed decisions. Median and average statistics are enormous generalities: There are hundreds of different markets in San Francisco and the Bay Area, each with its own unique dynamics. Median prices and average dollar per square foot values can be and often are affected by other factors besides changes in fair market value. Longer term trends are much more meaningful than short-term.

Compass is a real estate broker licensed by the State of California, DRE 01527235. Equal Housing Opportunity. This report has been prepared solely for information purposes. The information herein is based on or derived from information generally available to the public and/or from sources believed to be reliable. No representation or warranty can be given with respect to the accuracy or completeness of the information. Compass disclaims any and all liability relating to this report, including without limitation any express or implied representations or warranties for statements contained in, and omissions from, the report. Nothing contained herein is intended to be or should be read as any regulatory, legal, tax, accounting or other advice and Compass does not provide such advice. All opinions are subject to change without notice. Compass makes no representation regarding the accuracy of any statements regarding any references to the laws, statutes or regulations of any state are those of the author(s). Past performance is no guarantee of future results.
Skip to content