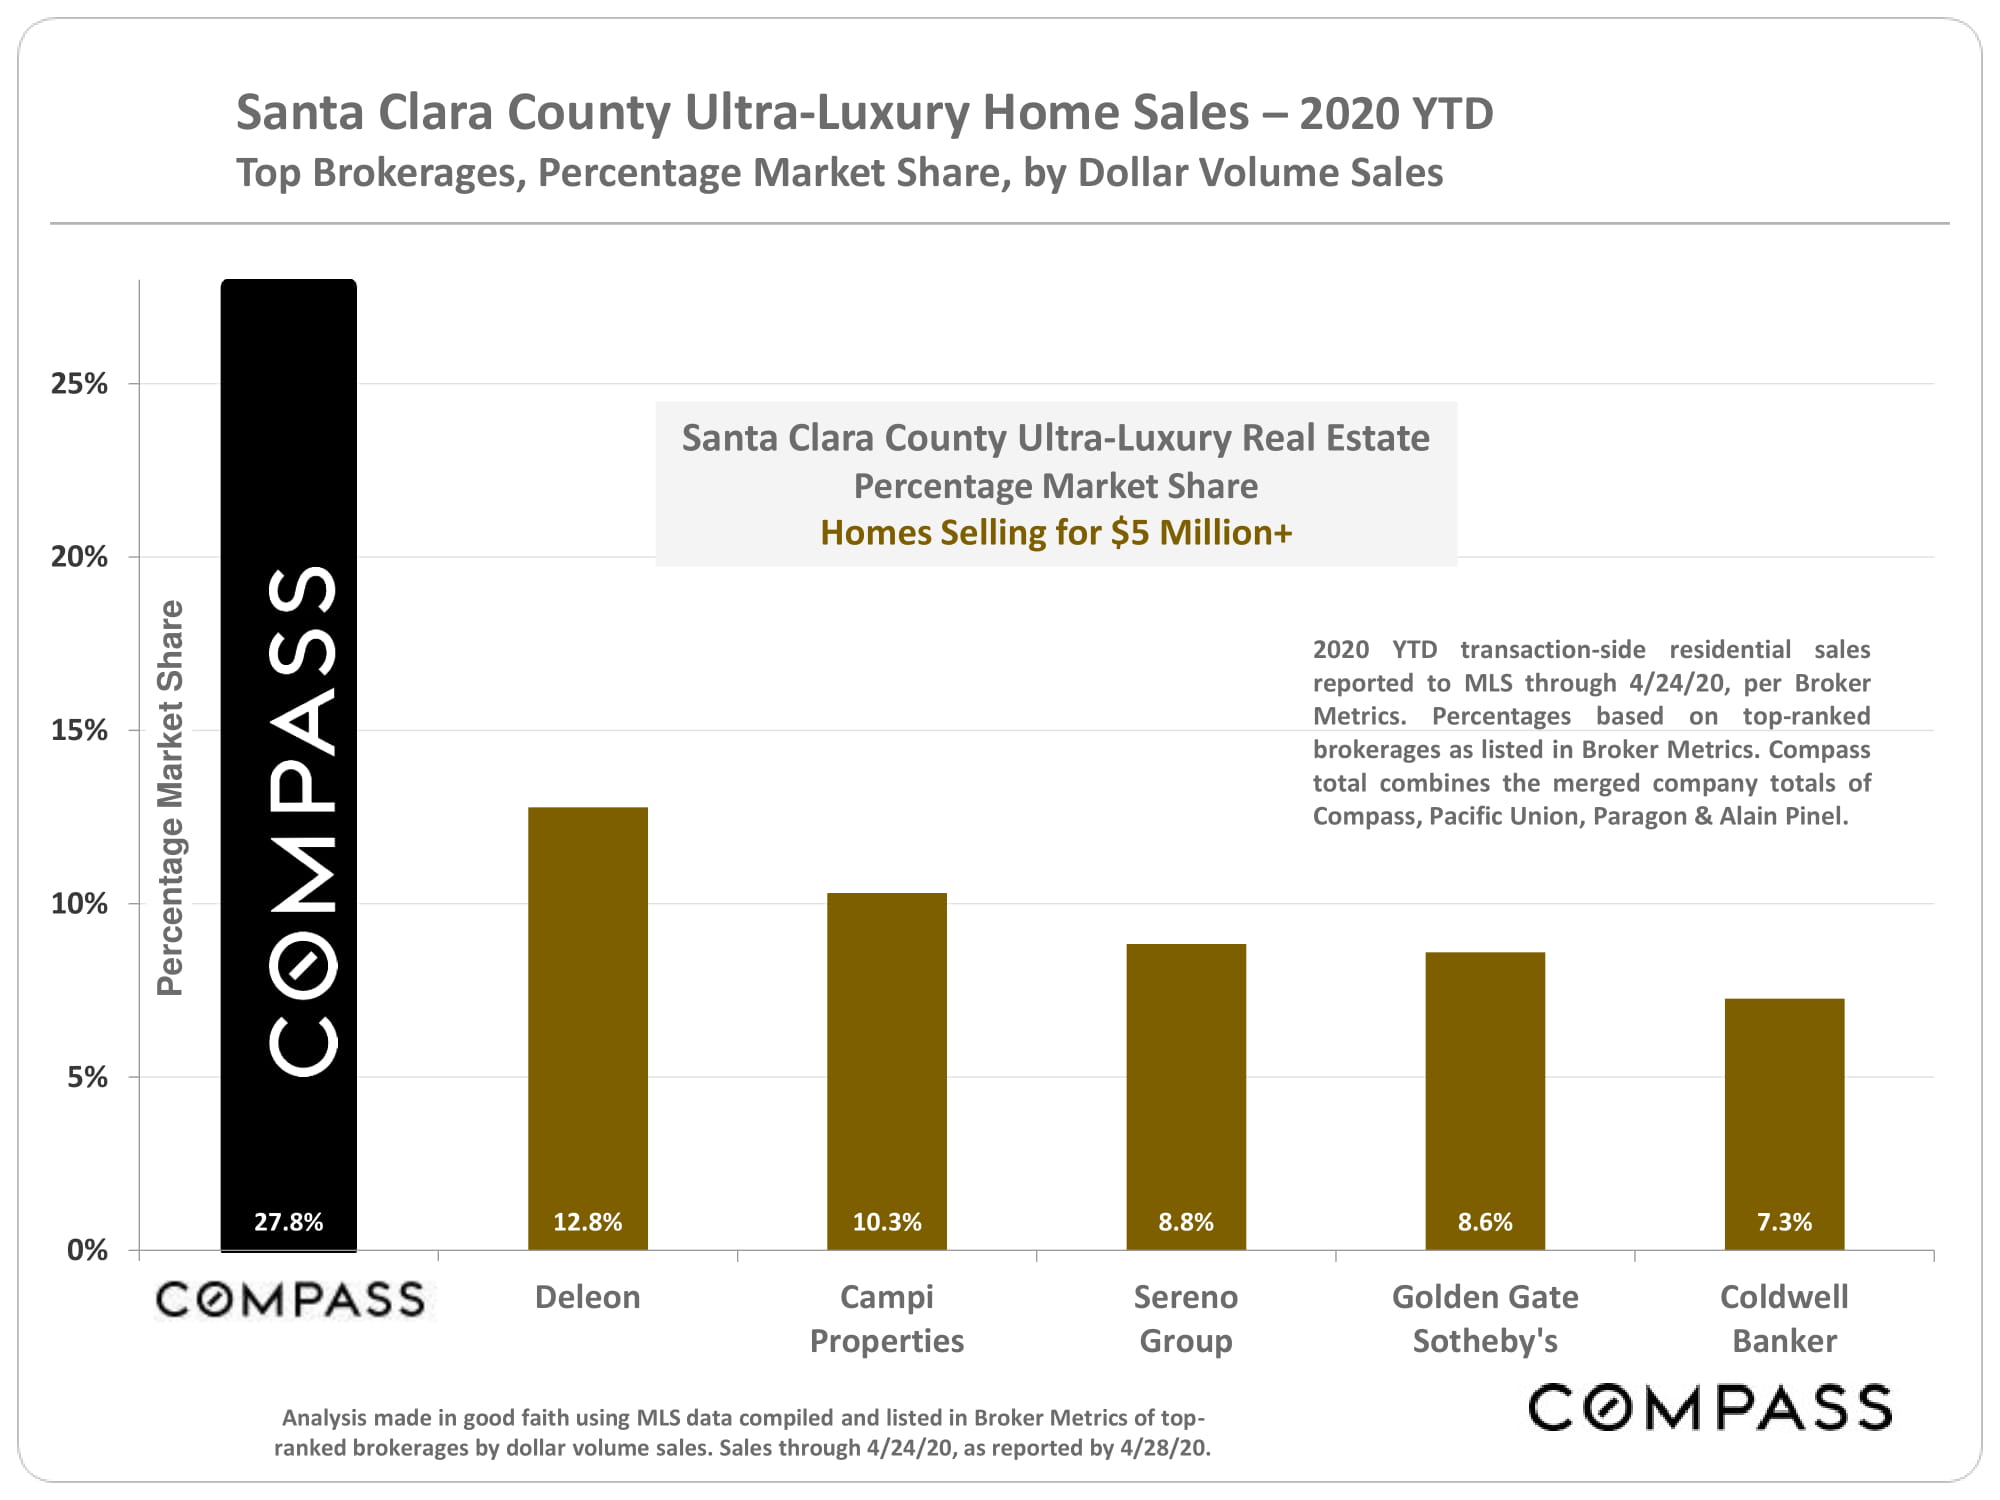
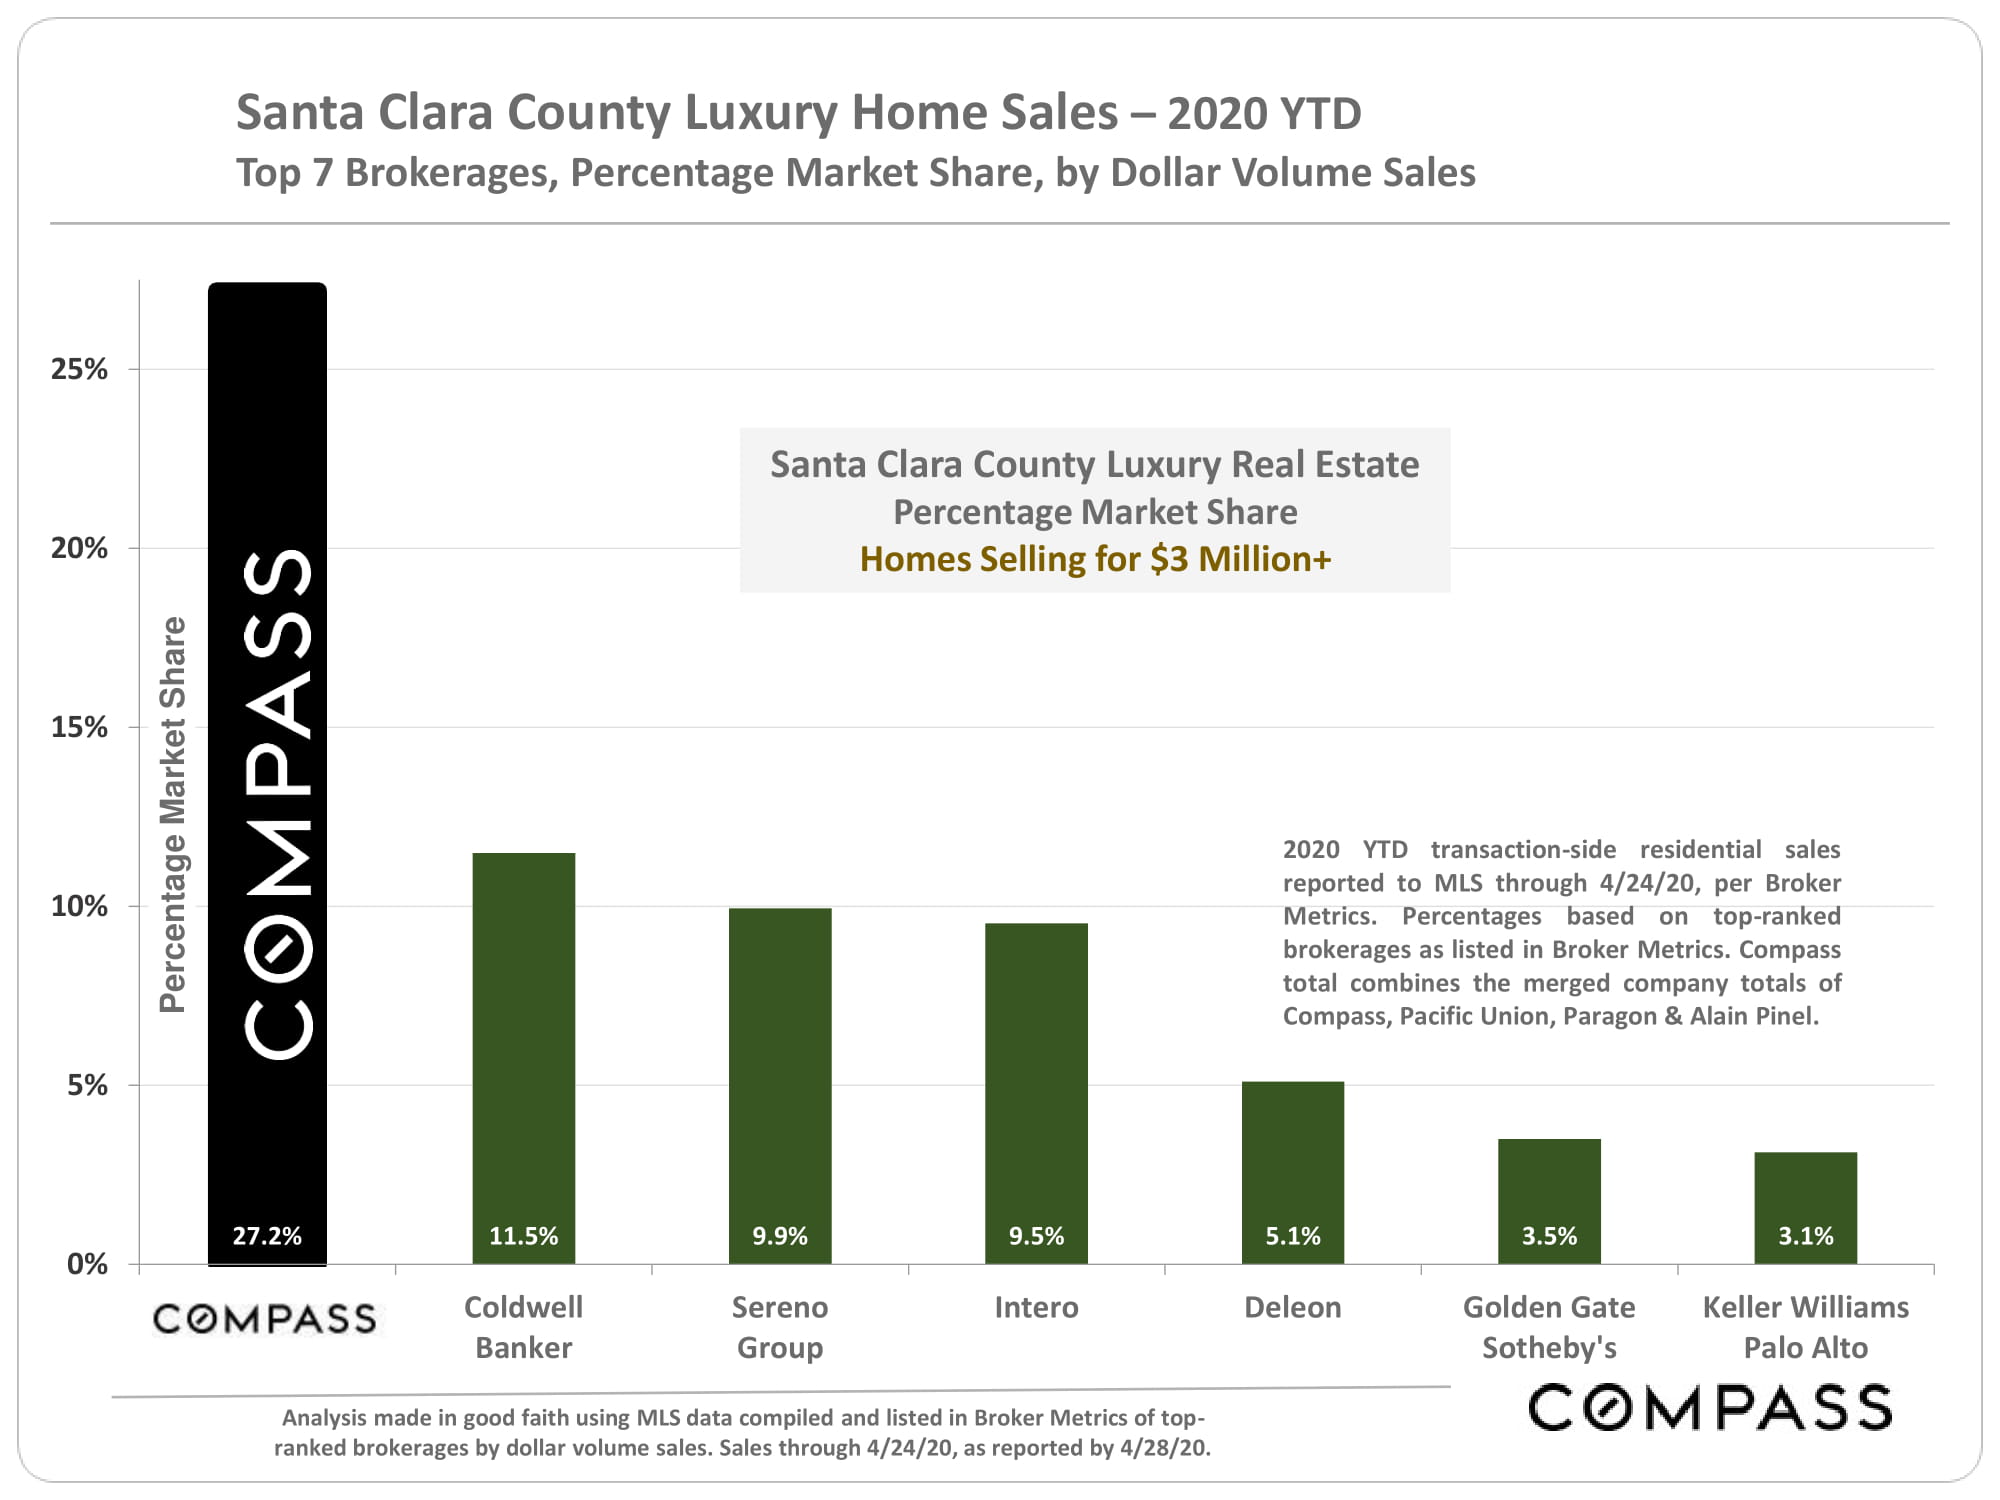
Santa Clara County Home Sales, January-April 2020

Source: Compass

It is impossible to know how median and average value statistics apply to any particular home without a specific comparative market analysis. Many factors affect sales prices besides neighborhood/ bedroom count: quality of location within the neighborhood, condition, size,architecture,views, amenities,parking,outdoor space, etc.

These analyses were made in good faith with data from sources deemed reliable, but may contain errors and are subject to revision. It is not our intent to convince you of a particular position,but to attempt to provide straightforward data and analysis, so you can make your own informed decisions. Median and average statistics are enormous generalities: There are hundreds of different markets in San Francisco and the Bay Area, each with its own unique dynamics. Median prices and average dollar per square foot values can be and often are affected by other factors besides changes in fair market value. Longer term trends are much more meaningful than short-term.

Compass is a real estate broker licensed by the State of California, DRE 01527235. Equal Housing Opportunity. This report has been prepared solely for information purposes. The information herein is based on or derived from information generally available to the public and/or from sources believed to be reliable. No representation or warranty can be given with respect to the accuracy or completeness of the information. Compass disclaims any and all liability relating to this report, including without limitation any express or implied representations or warranties for statements contained in, and omissions from, the report. Nothing contained herein is intended to be or should be read as any regulatory, legal, tax, accounting or other advice and Compass does not provide such advice. All opinions are subject to change without notice. Compass makes no representation regarding the accuracy of any statements regarding any references to the laws, statutes or regulations of any state are those of the author(s). Past performance is no guarantee of future results.
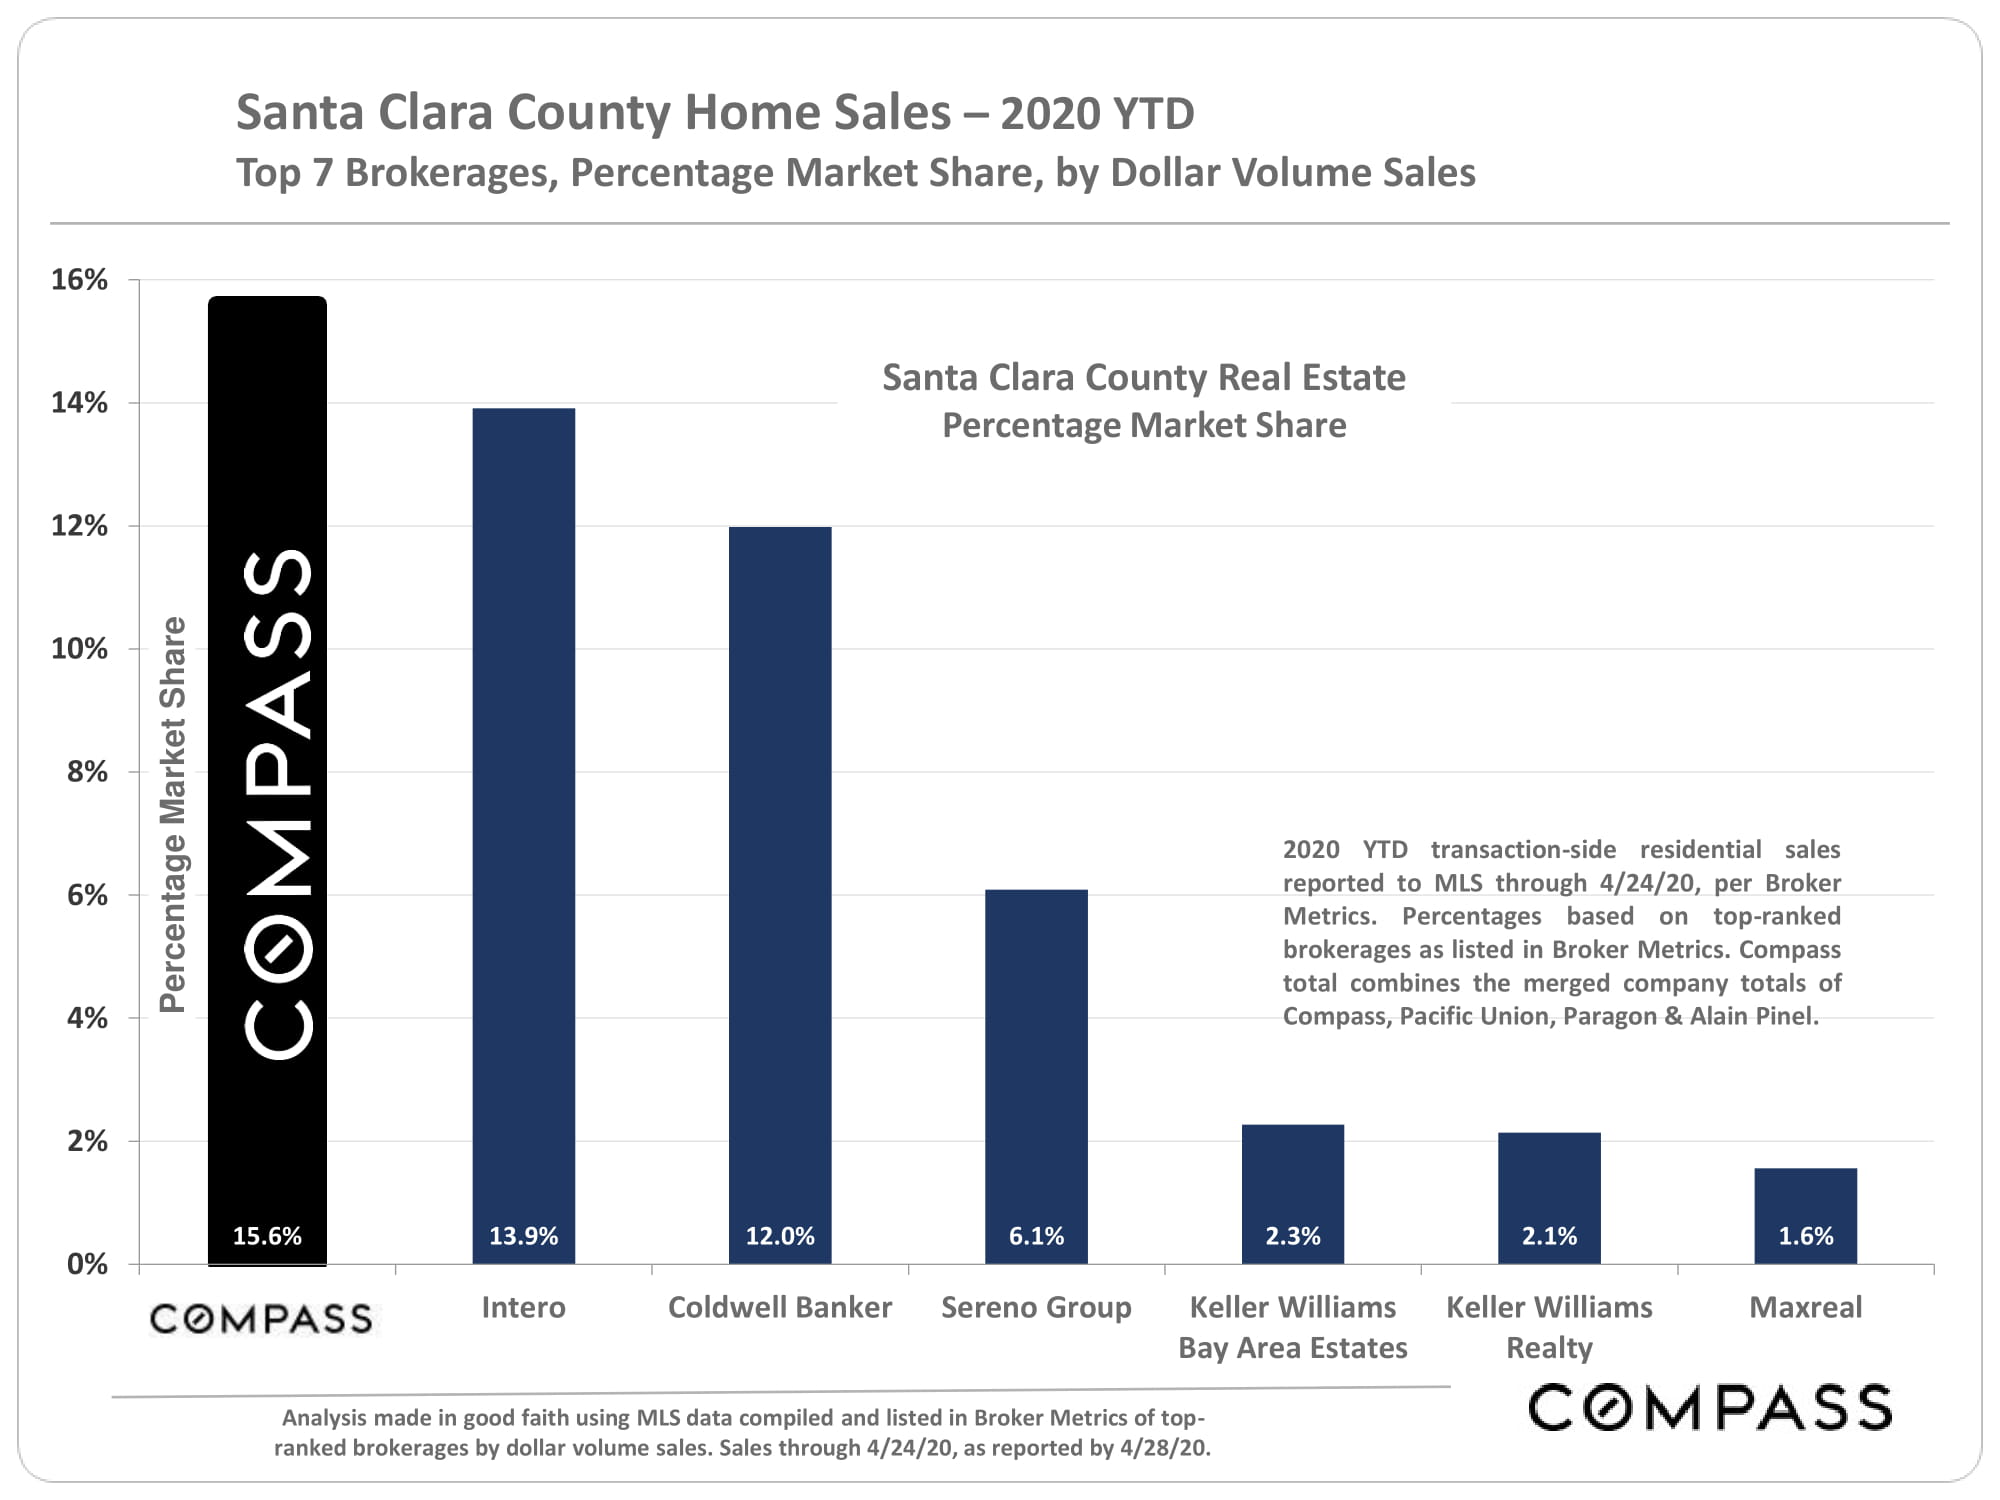
 

Santa Clara County Real Estate, March 2020

There is a lot going on in the world right now and we won’t pretend to know how things will turn out or affect the local real estate market over the next few months. In the meantime, this report will look at the most recent data available, though the impact of the wild volatility in the financial markets and the unfolding situation with the coronavirus has yet to show up in reliable statistics. Typically, the spring selling season is the most active of the year.


One positive for real estate is that mortgage interest rates hit a historic low in early March, as illustrated below, and rates play a huge role in housing affordability.


Short-Term & Long-Term Trends in Median Home Sales Prices


The February median house sales price was well above that of February 2019, but a tad below that of February 2018. Frankly, monthly year-over-year statistics are of limited value: One must really look at longer term trends for meaningful insight into market conditions. These are illustrated in the second chart following.


In this chart below, it’s interesting to see how county median sales prices pulled away from Bay Area prices in 2017. In 2017 through mid-2018, Santa Clara County may have been the hottest major market in the country. Then significant cooling occurred in the second half of 2018, with 2019 seeing some recovery.

Mortgage Interest Rates Hit Historic Low

Home Sales Breakdown

Prices & Statistics by City

Inventory vs. Sales

A graphic illustration of what occurred in the market during 2017, 2018 and 2019 (though this chart goes back to 2013).

Selected Market Indicators

(& Market Seasonality)

Source: Compass

It is impossible to know how median and average value statistics apply to any particular home without a specific comparative market analysis. These analyses were made in good faith with data from sources deemed reliable, but may contain errors and are subject to revision. It is not our intent to convince you of a particular position, but to attempt to provide straightforward data and analysis, so you can make your own informed decisions. Median and average statistics are enormous generalities: There are hundreds of different markets in San Francisco and the Bay Area, each with its own unique dynamics. Median prices and average dollar per square foot values can be and often are affected by other factors besides changes in fair market value. Longer term trends are much more meaningful than short-term.

Compass is a real estate broker licensed by the State of California, DRE 01527235. Equal Housing Opportunity. This report has been prepared solely for information purposes. The information herein is based on or derived from information generally available to the public and/or from sources believed to be reliable. No representation or warranty can be given with respect to the accuracy or completeness of the information. Compass disclaims any and all liability relating to this report, including without limitation any express or implied representations or warranties for statements contained in, and omissions from, the report. Nothing contained herein is intended to be or should be read as any regulatory, legal, tax, accounting or other advice and Compass does not provide such advice. All opinions are subject to change without notice. Compass makes no representation regarding the accuracy of any statements regarding any references to the laws, statutes or regulations of any state are those of the author(s). Past performance is no guarantee of future results.

Santa Clara County Real Estate, January 2020

Generally speaking, after years of high appreciation rates, annual 2019 Bay Area median home prices went down a little bit, went up a little bit or basically remained unchanged as compared to 2018. Santa Clara County prices dropped the most in the Bay Area, but it must be remembered that it appreciated the most in the previous year. Indeed, Santa Clara may have been the hottest market in the country from mid-2017 to mid-2018, before suddenly cooling down.

For 2020, economist Ken Rosen at UC Berkeley has said he expects the Bay Area median price to remain basically flat, within a general range of up or down 2% – in other words, roughly similar to what happened last year. We can’t predict the future, but that doesn’t sound unreasonable, and happily avoids the sensationalism of many other media-grabbing forecasts.

Median sales prices are generalities and not exact measurements of changes in fair market value. They can be affected by a number of factors and are sometimes subject to anomalous fluctuations. How they apply to any particular home is unknown without a specific comparative market analysis.

Economic Factors Affecting

Real Estate Markets


Source: Compass

It is impossible to know how median and average value statistics apply to any particular home without a specific comparative market analysis. These analyses were made in good faith with data from sources deemed reliable, but may contain errors and are subject to revision. It is not our intent to convince you of a particular position, but to attempt to provide straightforward data and analysis, so you can make your own informed decisions. Median and average statistics are enormous generalities: There are hundreds of different markets in San Francisco and the Bay Area, each with its own unique dynamics. Median prices and average dollar per square foot values can be and often are affected by other factors besides changes in fair market value. Longer term trends are much more meaningful than short-term.

Compass is a real estate broker licensed by the State of California, DRE 01527235. Equal Housing Opportunity. This report has been prepared solely for information purposes. The information herein is based on or derived from information generally available to the public and/or from sources believed to be reliable. No representation or warranty can be given with respect to the accuracy or completeness of the information. Compass disclaims any and all liability relating to this report, including without limitation any express or implied representations or warranties for statements contained in, and omissions from, the report. Nothing contained herein is intended to be or should be read as any regulatory, legal, tax, accounting or other advice and Compass does not provide such advice. All opinions are subject to change without notice. Compass makes no representation regarding the accuracy of any statements regarding any references to the laws, statutes or regulations of any state are those of the author(s). Past performance is no guarantee of future results.

Skip to content