How Landlords Can Recover From Shelter-in-place

In any crisis, like a recession or the current pandemic, there will be winners and losers. Single-family rentals are showing signs of being on the winning side.


Advantages For Landlords

“The COVID-19 pandemic will make homeownership more difficult for many Americans suffering employment loss and potential reduction in credit scores,” says Ted Jones, chief economist at Stewart Title Guaranty Company. “However, this will continue to drive rental demands, particularly for certain products. I think single-family rental markets is in the catbird seat as we speak right now.”

The new generation of home-dwellers is more inclined to rent than buy. According to Pew Research, the millennial generation—which accounts for roughly half of US households with children—are more likely to rent than own a home compared to previous generations. 

According to “The Dream on Hold,” a study by RENTCafe, an online apartment-finding service, census data showed that over the last decade homeownership by families declined by nearly 3.6 million. By contrast, the number of families living in rentals rose by 1.9 million.

Another factor benefitting single-family rentals is the impact COVID-19 is having on America’s biggest cities. Writing for the New York Times, Sabrina Tavernise reports that “the virus has found fertile ground in the density that is otherwise prized. And it comes as the country’s major urban centers were already losing their appeal for many Americans as skyrocketing rents and changes in the labor market have pushed the country’s youngest adults to suburbs and smaller cities often far from the coasts.”


Necessary Adaptations


Along with these favorable conditions for single-family rentals comes a series of challenges for property owners who must quickly adapt to the ever-changing guidelines and regulations concerning essential services, showings, property maintenance, and cleaning and eviction protocols. Because we are still in the thick of the pandemic, these directives are constantly changing, so be sure to keep abreast of your county and city guidelines and let your tenants be aware of them as well.


  • Showings


Like real estate agents, most landlords have halted in-person property tours and replaced them with virtual tours. Video conferencing services like Zoom, Google Hangouts, Skype, and FaceTime have come to the rescue as we continue to practice social distancing. 

Instead of doing individual virtual walk-throughs, you can streamline the process. Record a video on your phone as you walk through your rental property. It’s also helpful to take pictures of amenities you wish to highlight. Then, post it online to both advertise the property and replace the need for in-person tours.


  • Maintenance


Perform emergency repairs only. Let your tenants know that in order to keep everyone safe and healthy, non-essential repairs are suspended. If there is an emergency repair that must be fixed in a timely manner, follow the CDC’s safety guidelines

The following would classify as essential repairs:

  • Leaking pipes
  • Broken furnace or air conditioner
  • Broken washing machine or dryer
  • Leaking roof
  • Smells of gas or noxious fumes
  • Growing mold
  • Broken stove or refrigerator
  • Backed up toilet or sewage drain
  • Power outage
  • Broken key to unit
  • Fire or smoke damage
  • Water heater isn’t working–no hot water

For non-essential repairs, property owners and managers around the country are assisting renters via technology, such as:

  • How-to videos with step-by-step instructions
  • Video calls (via FaceTime, Skype, etc.)
  • Asking for pictures or videos of maintenance issues and assisting tenants virtually and/or giving access to necessary tools.


Evictions

California Governor Gavin Newsom has extended the executive order issued in March that allowed local governments to enact COVID-19 eviction moratoriums. The statewide order was pushed back through July 28 and applies to any local orders that were set to expire as well.

The California Apartment Association has issued the following advice for landlords weighing the concurrent legislative, executive, and judicial orders:

“Continue to follow any applicable local moratorium and the federal eviction moratorium if a property is federally assisted, as these measures may limit the ability to serve a three-day notice to pay or quit. Local moratoria also may also limit the ability to carry out ‘no fault’ evictions and give tenants financially affected by the pandemic an extended repayment period. If a property is not subject to the federal moratorium or a local ordinance, the owner can serve a three-day notice to pay rent or quit but cannot enforce it in court.”

Many landlords have also decided to stop charging late fees for rent. This takes even more pressure off of tenants and shows that you’re willing to work with them to provide some relief. You may also want to consider allowing renters to break their lease, if necessary.

For more detailed information on Landlord-Tenant Regulations during Covid-19, click here.


Can We Help?

Amid this rapidly changing environment with both opportunities and challenges for single-family renters, rely on the industry knowledge and experience of Julie and her team to stay on top of the game.

Call Julie at 650.799.8888 or Julie@JulieTsaiLaw.com to schedule a free consultation.

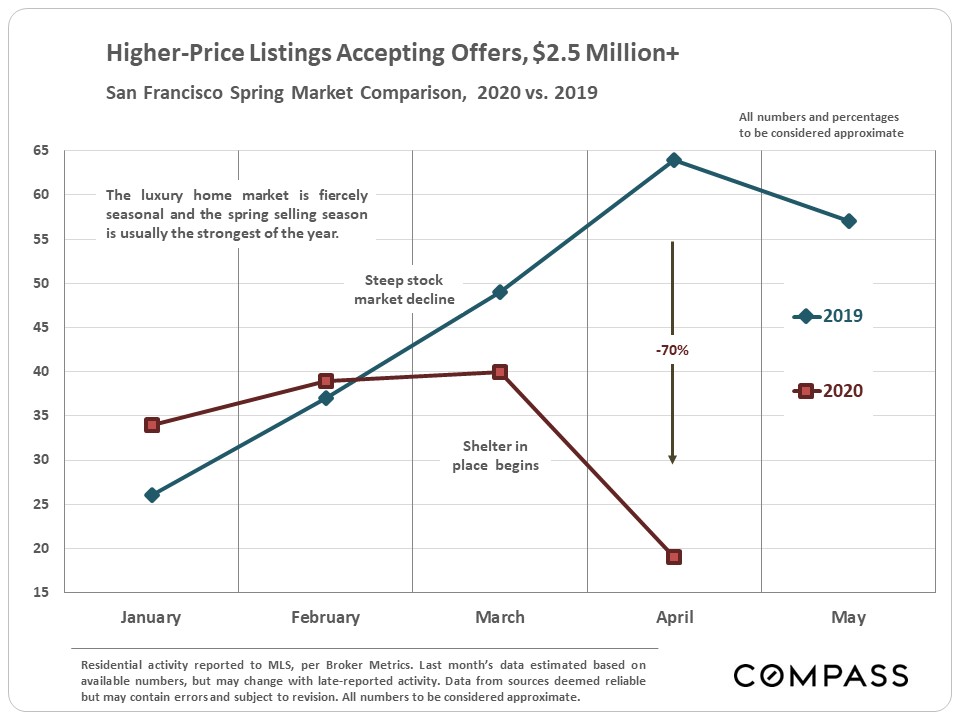
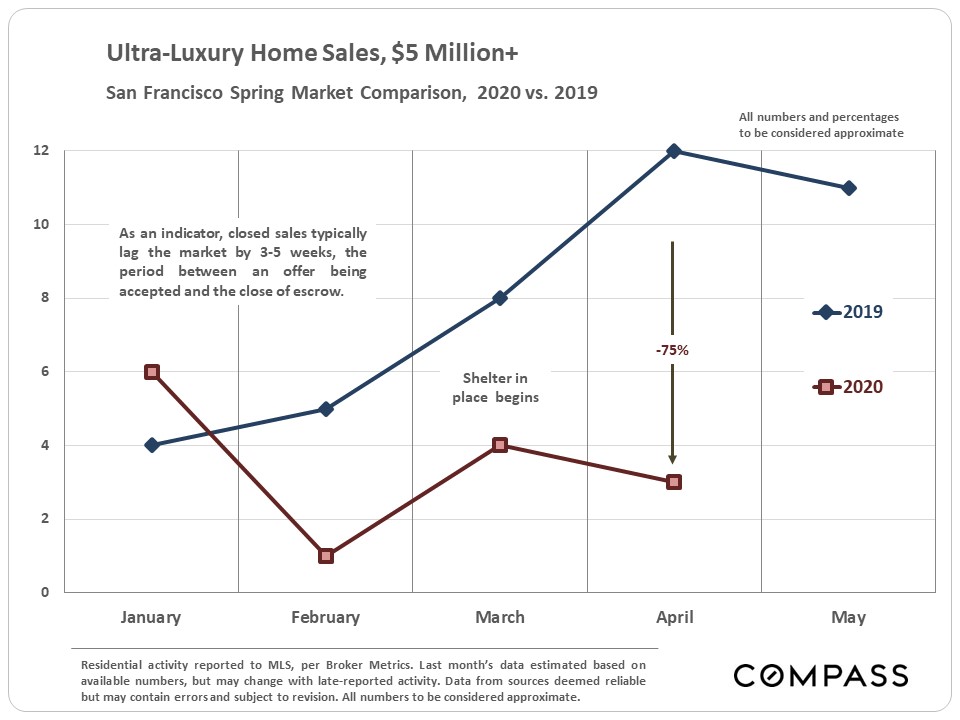
San Francisco Real Estate: Coronavirus Update, May 2020

San Francisco Real Estate Market – Begins to Slowly Recover


Source: Compass

It is impossible to know how median and average value statistics apply to any particular home without a specific comparative market analysis. Many factors affect sales prices besides neighborhood/ bedroom count: quality of location within the neighborhood, condition, size, architecture, views, amenities, parking, outdoor space, etc.

These analyses were made in good faith with data from sources deemed reliable, but may contain errors and are subject to revision. It is not our intent to convince you of a particular position,but to attempt to provide straightforward data and analysis, so you can make your own informed decisions. Median and average statistics are enormous generalities: There are hundreds of different markets in San Francisco and the Bay Area, each with its own unique dynamics. Median prices and average dollar per square foot values can be and often are affected by other factors besides changes in fair market value. Longer term trends are much more meaningful than short-term.

Compass is a real estate broker licensed by the State of California, DRE 01527235. Equal Housing Opportunity. This report has been prepared solely for information purposes. The information herein is based on or derived from information generally available to the public and/or from sources believed to be reliable. No representation or warranty can be given with respect to the accuracy or completeness of the information. Compass disclaims any and all liability relating to this report, including without limitation any express or implied representations or warranties for statements contained in, and omissions from, the report. Nothing contained herein is intended to be or should be read as any regulatory, legal, tax, accounting or other advice and Compass does not provide such advice. All opinions are subject to change without notice. Compass makes no representation regarding the accuracy of any statements  regarding  any references to the laws, statutes or regulations  of any state are those of  the author(s).  Past performance is no guarantee  of future  results.
 

San Mateo County Real Estate Market Begins to Bounce Back, May 2020

Market activity begins to tick up after severe shelter-in-place plunge. No decline in median home prices. Interest rates hit new low.
May 2020 Crisis Update
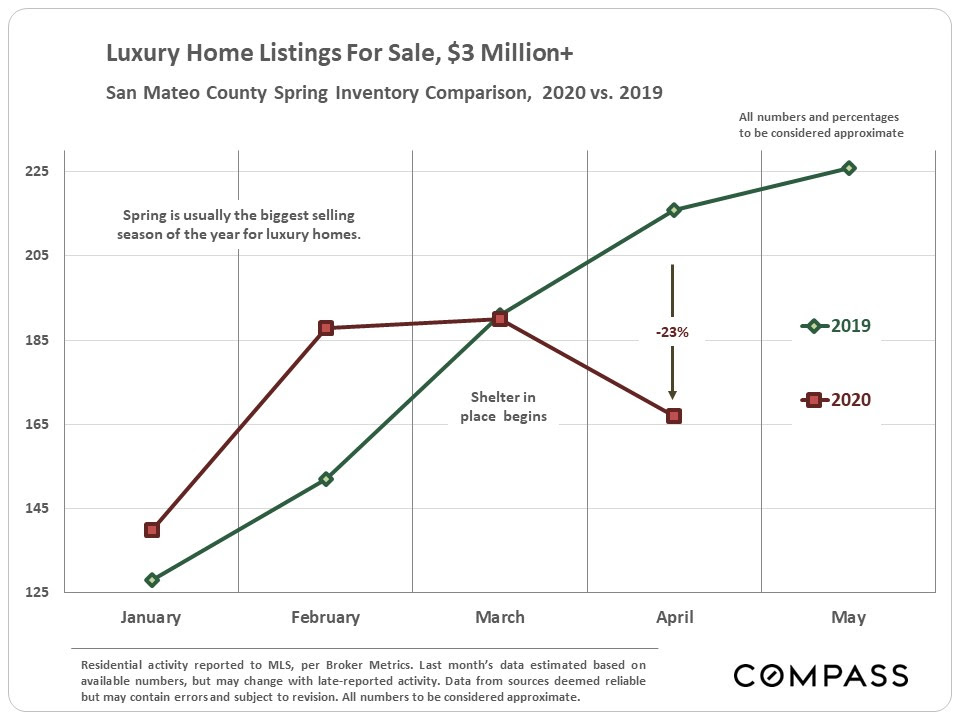
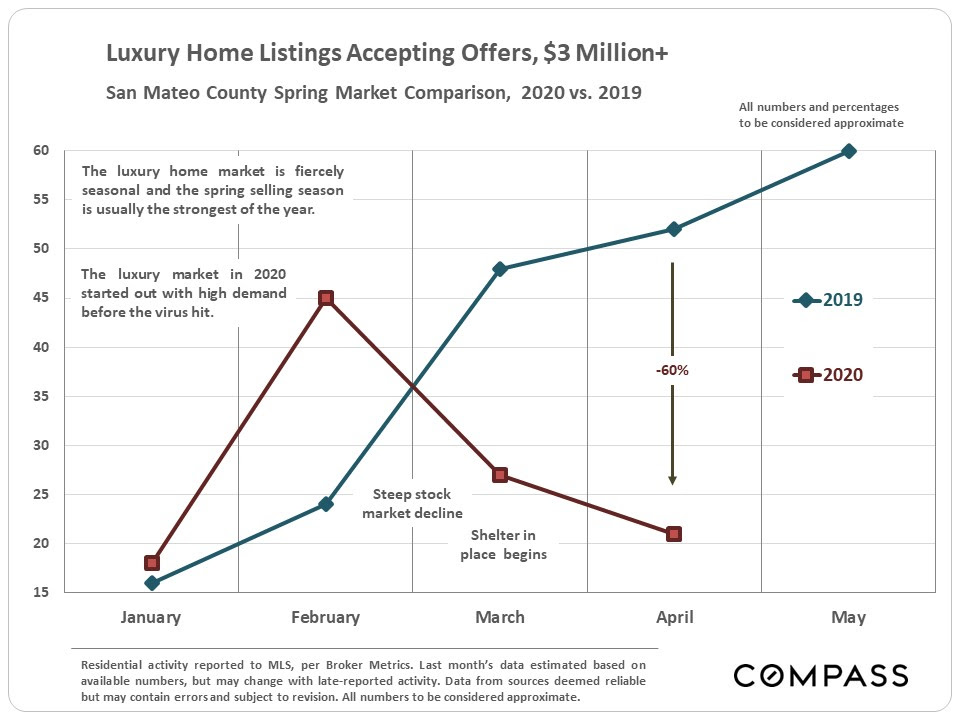
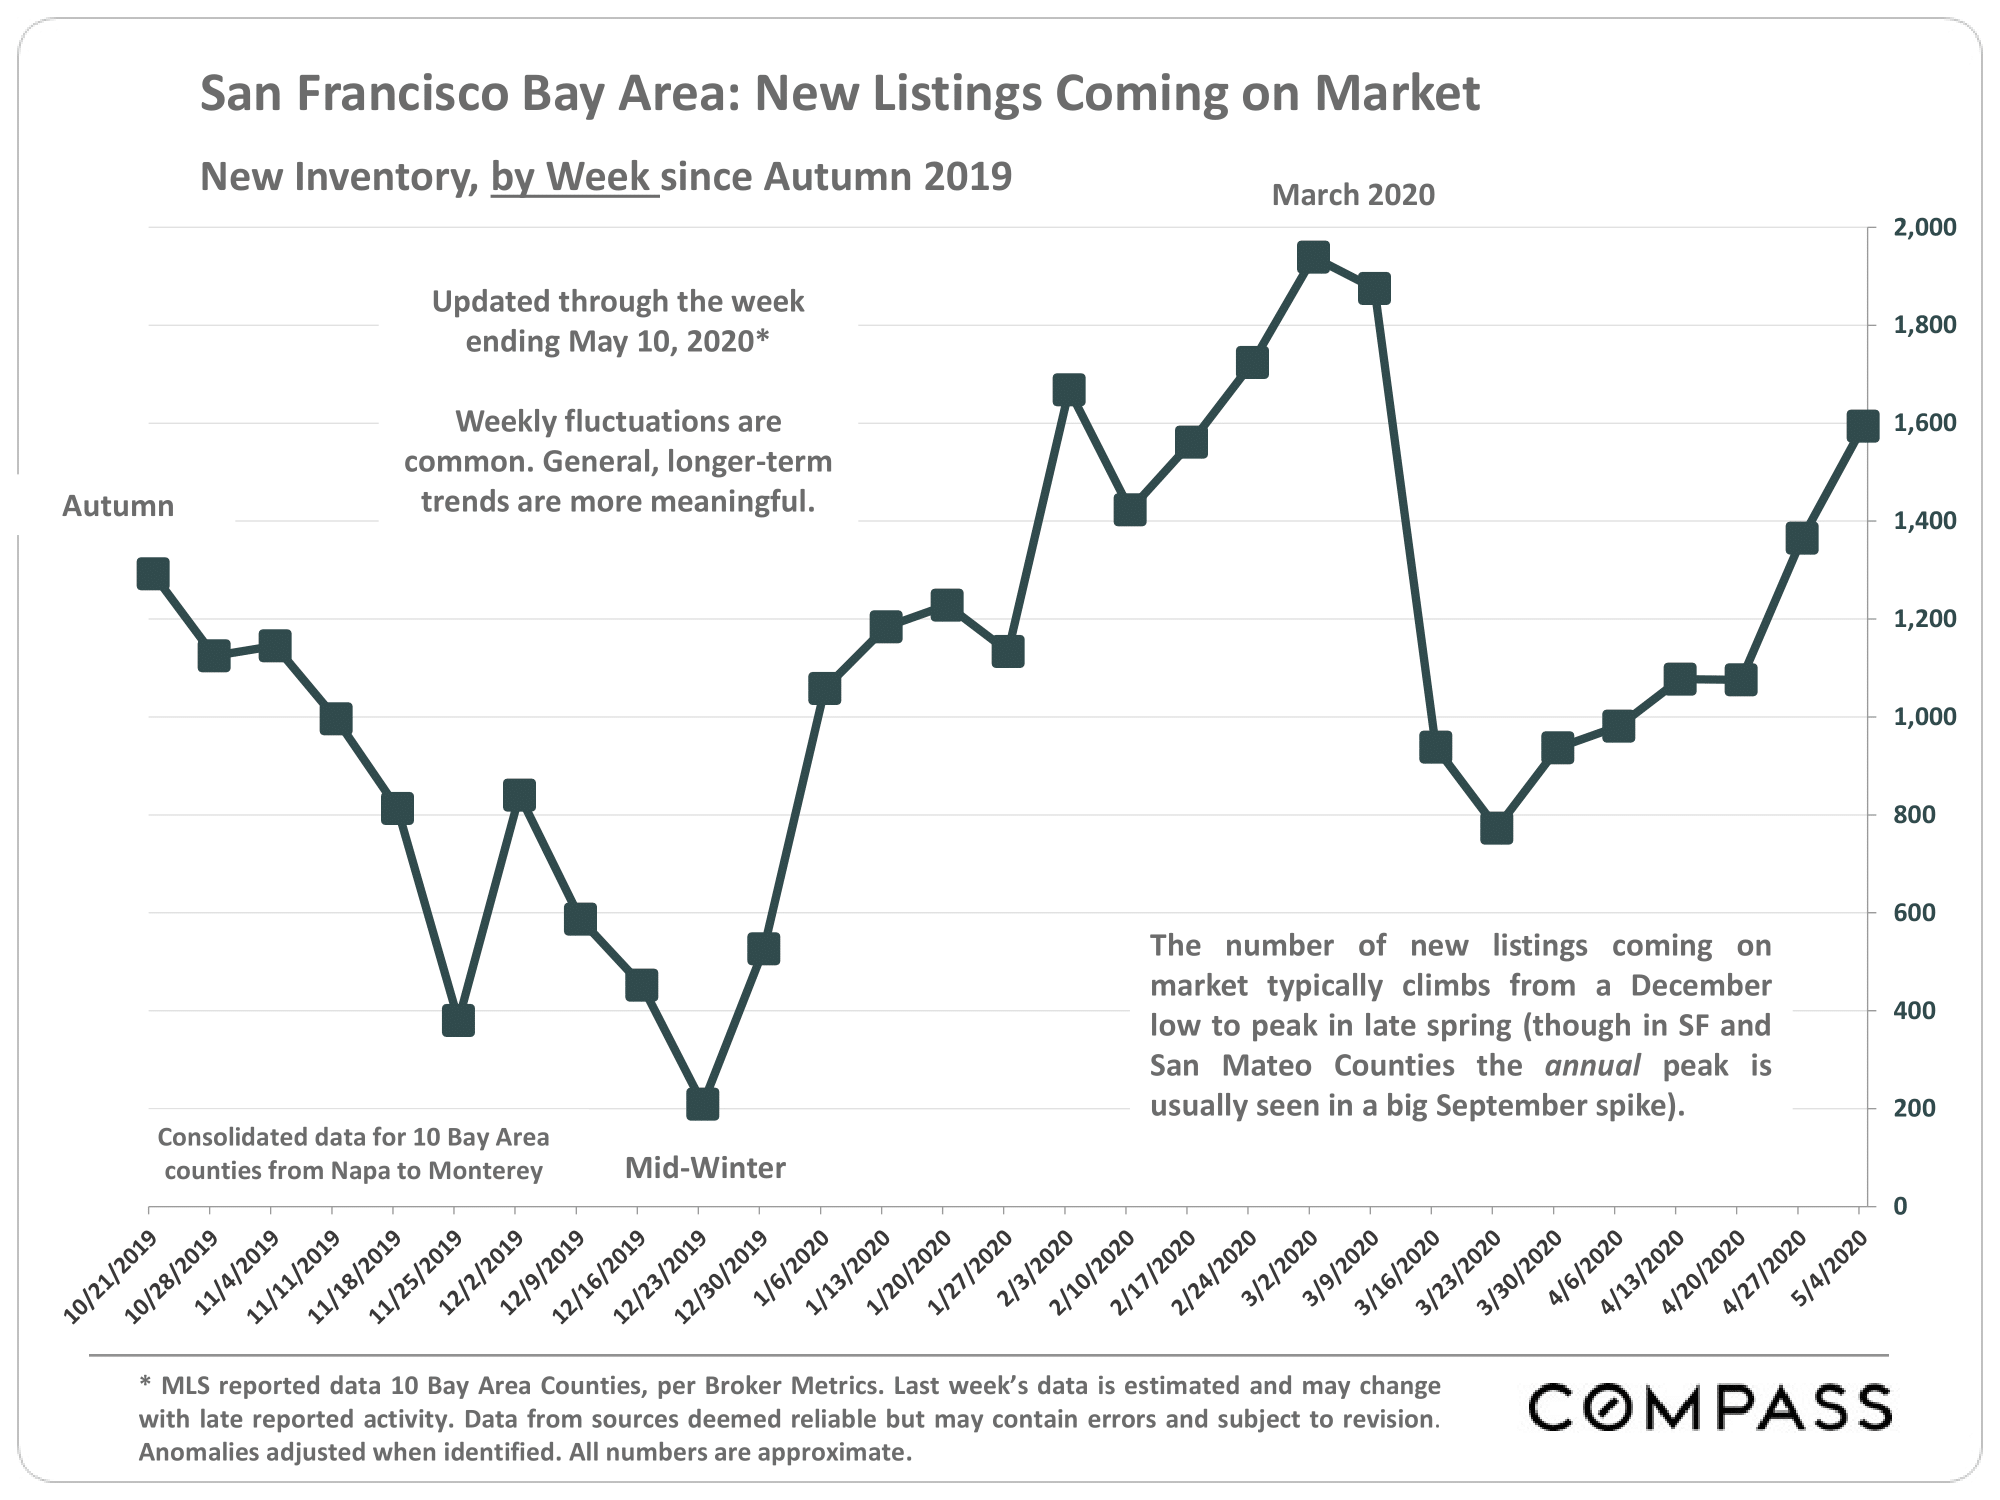
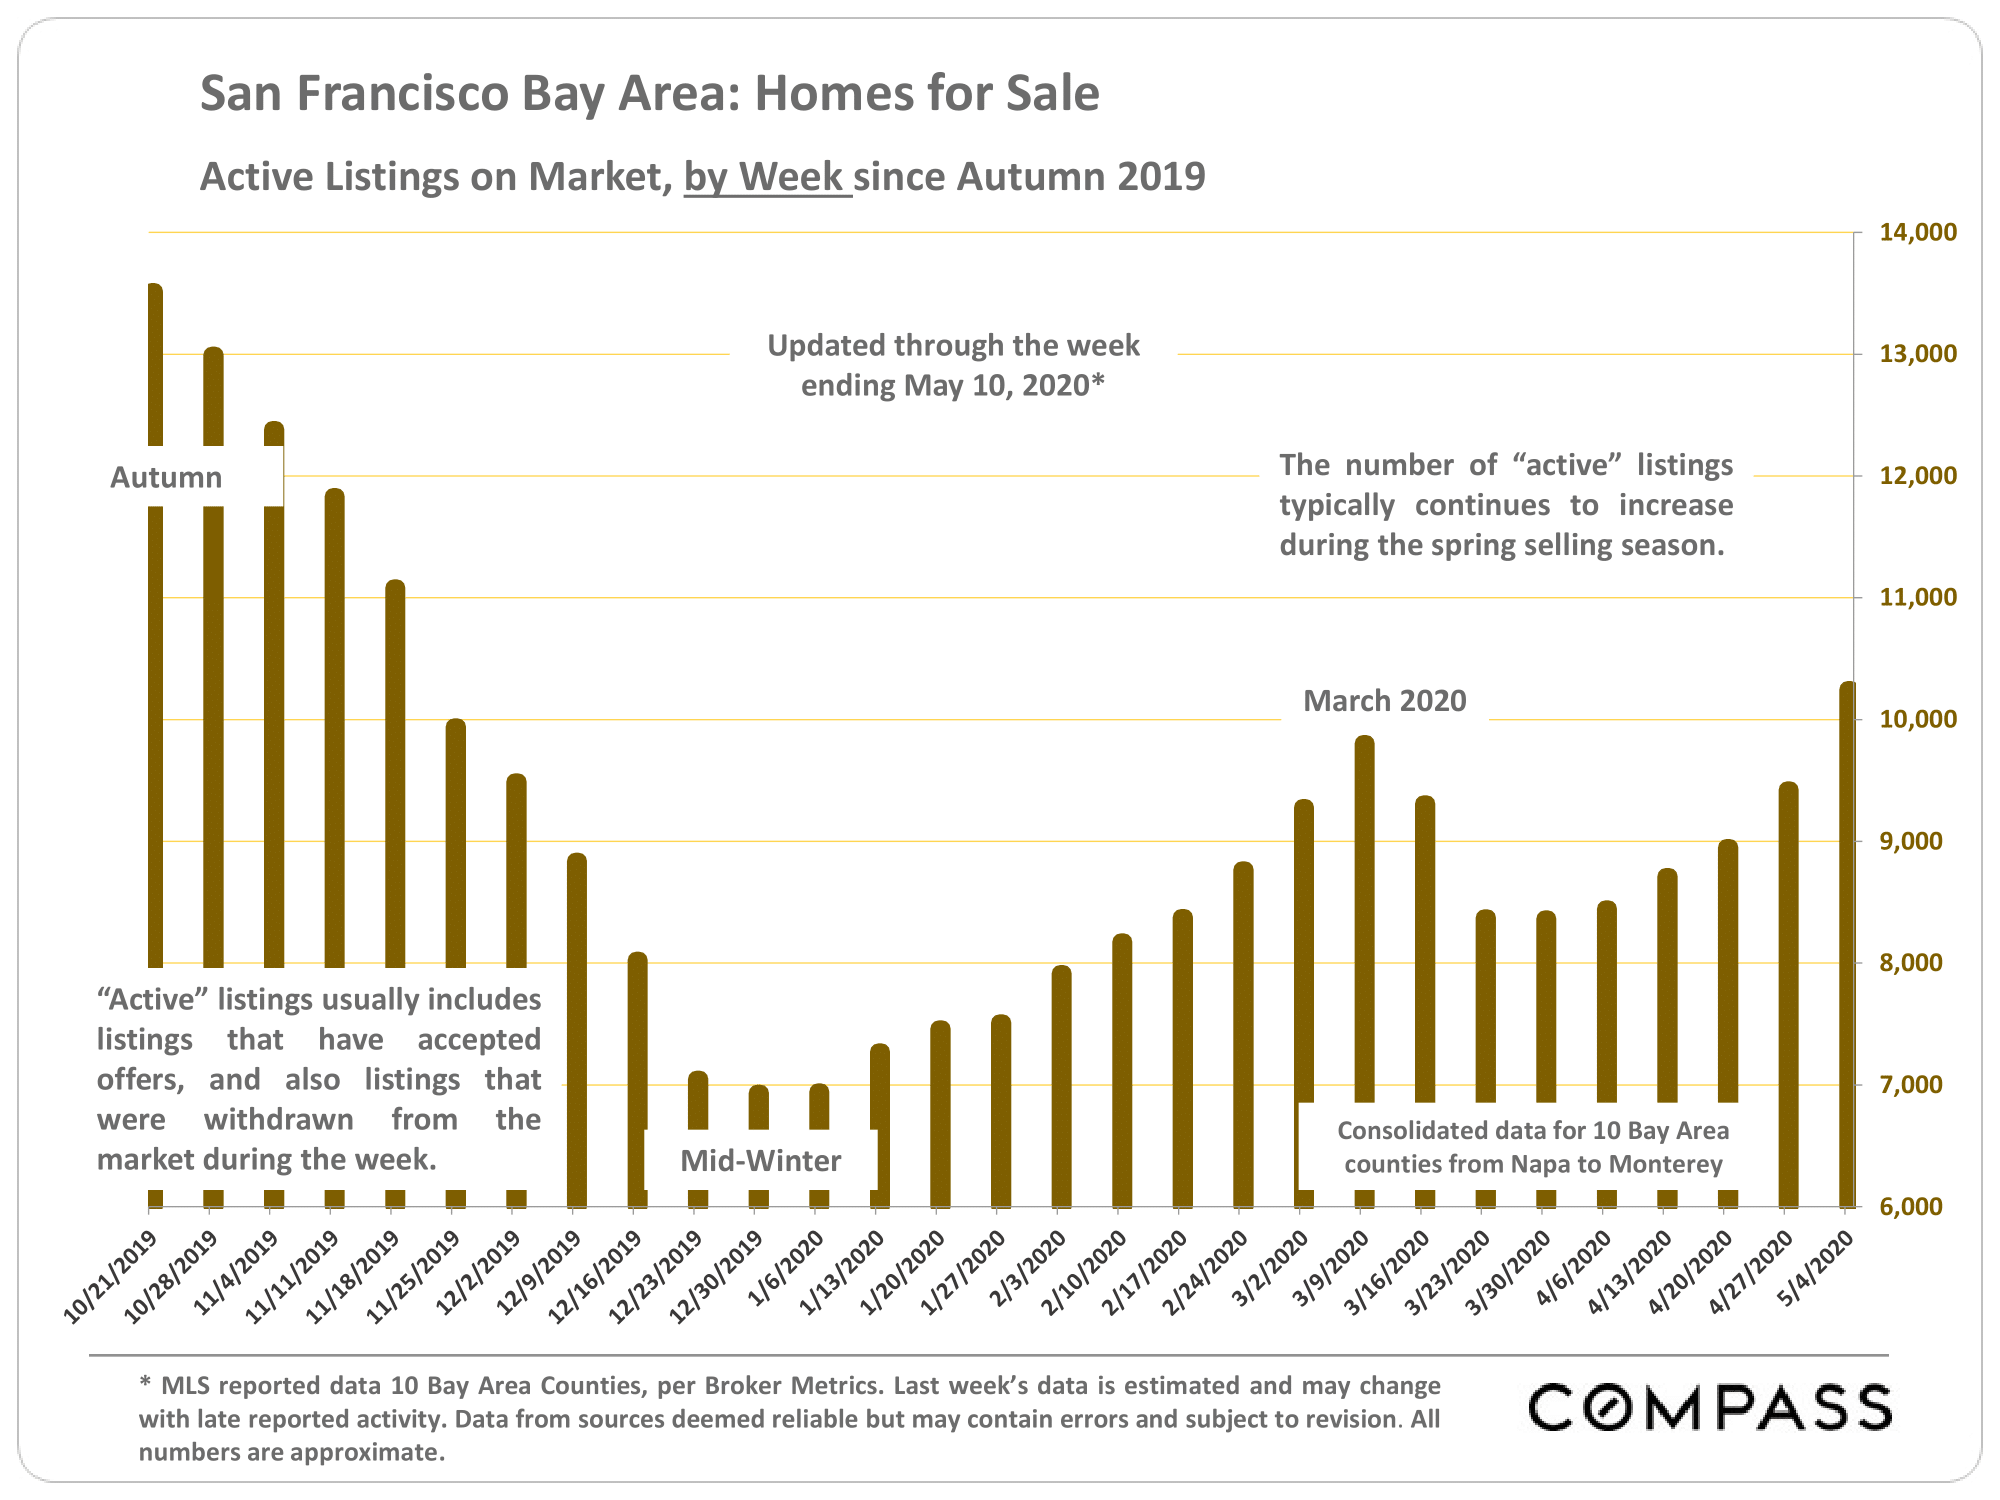
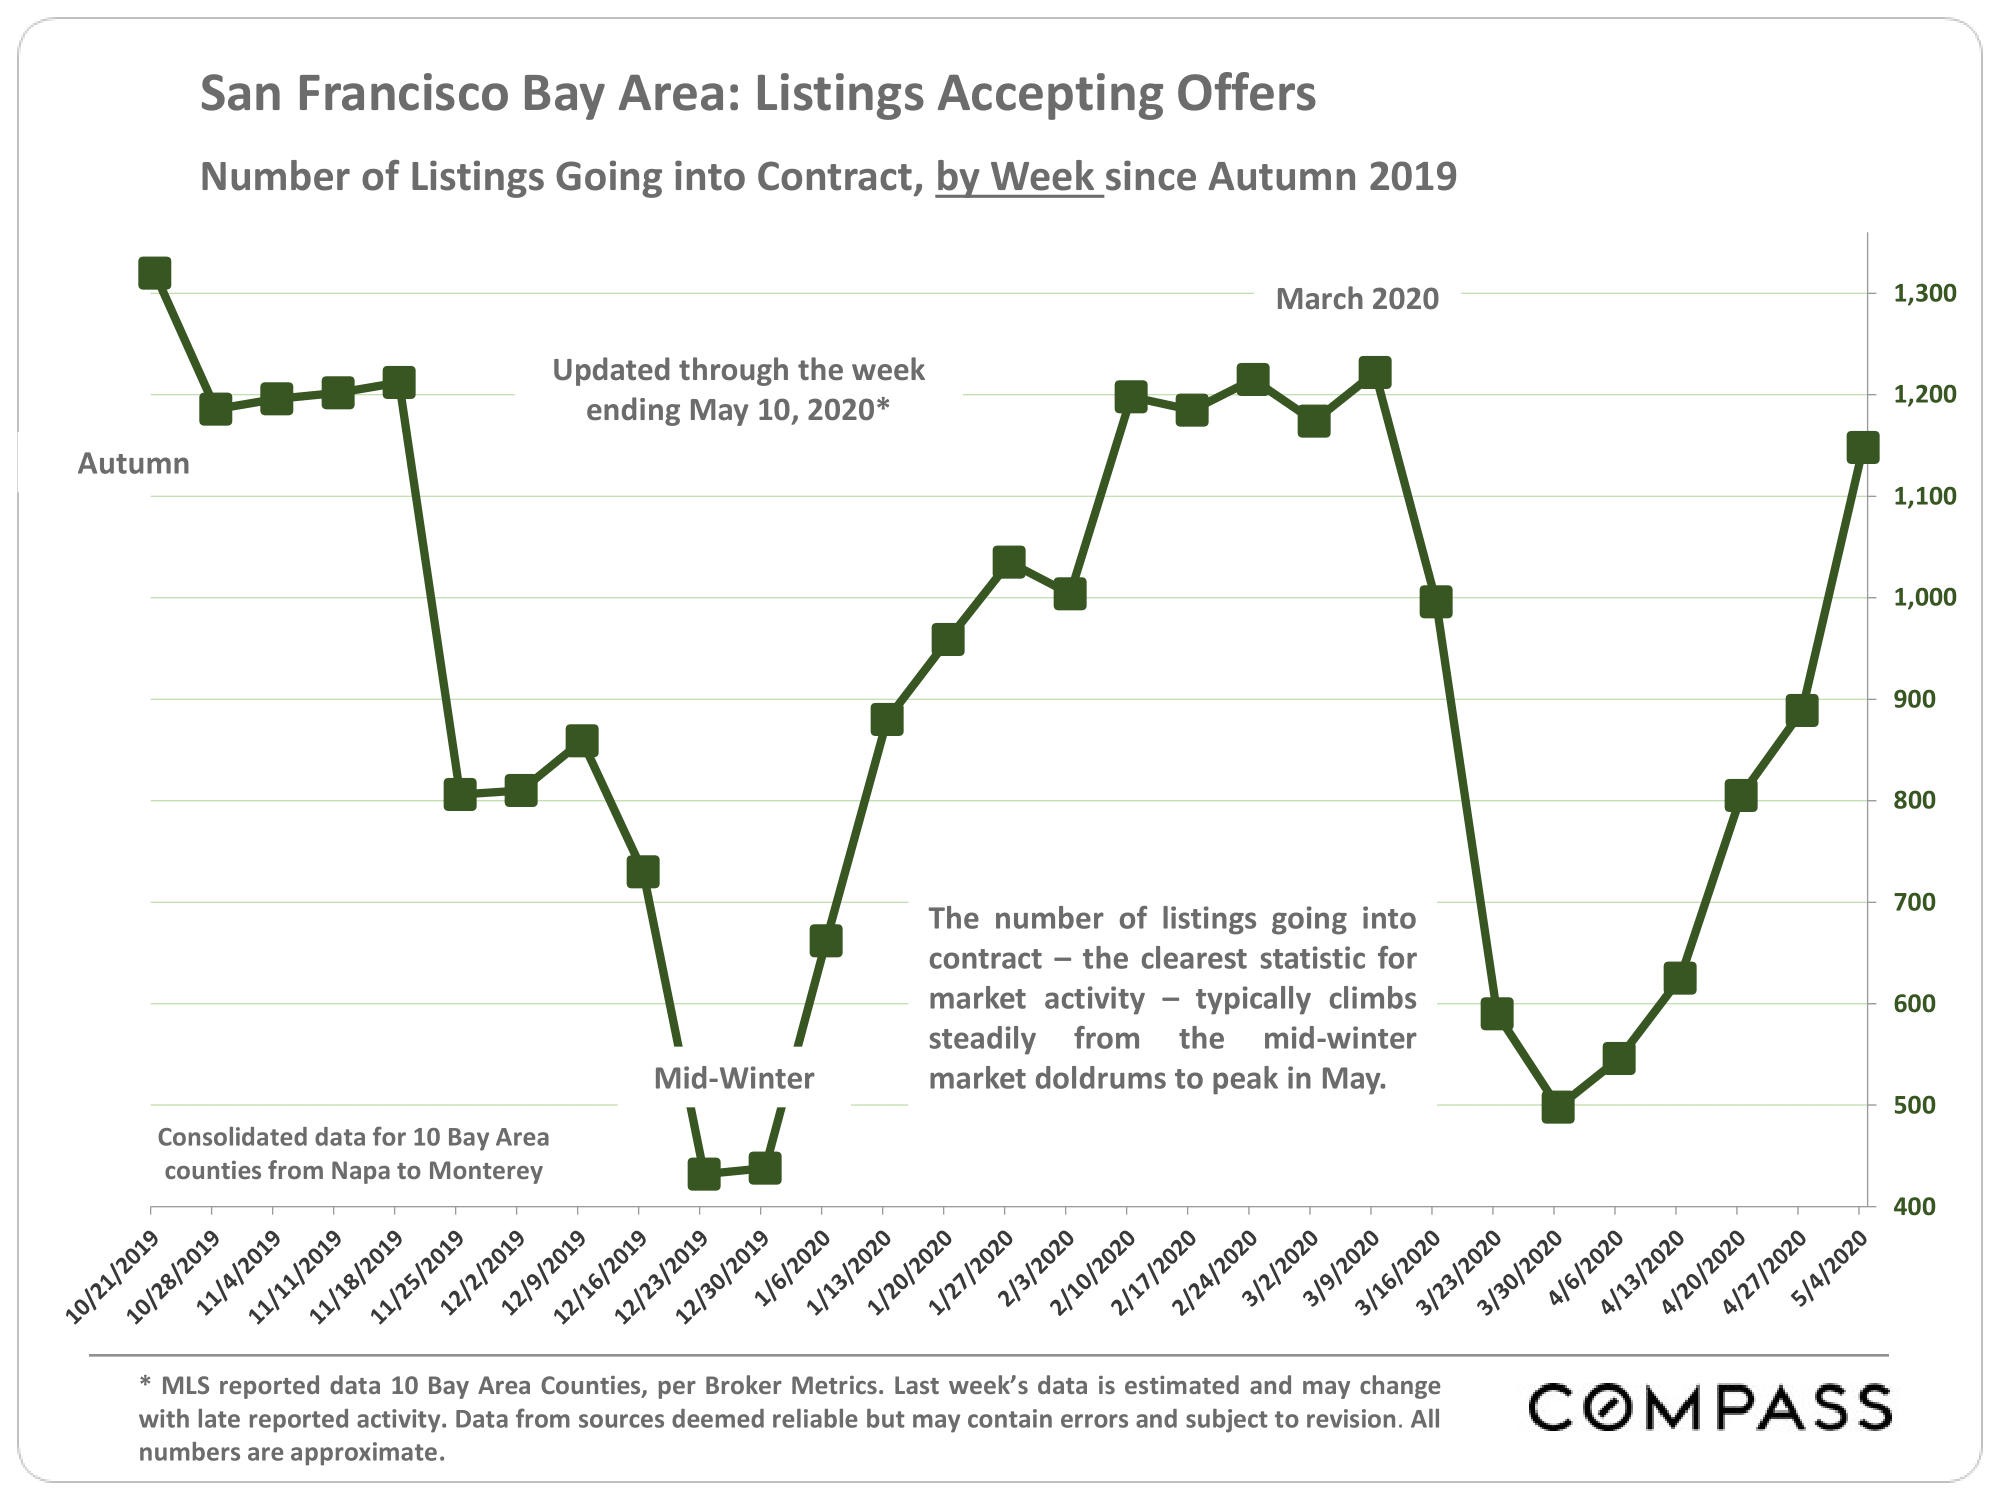
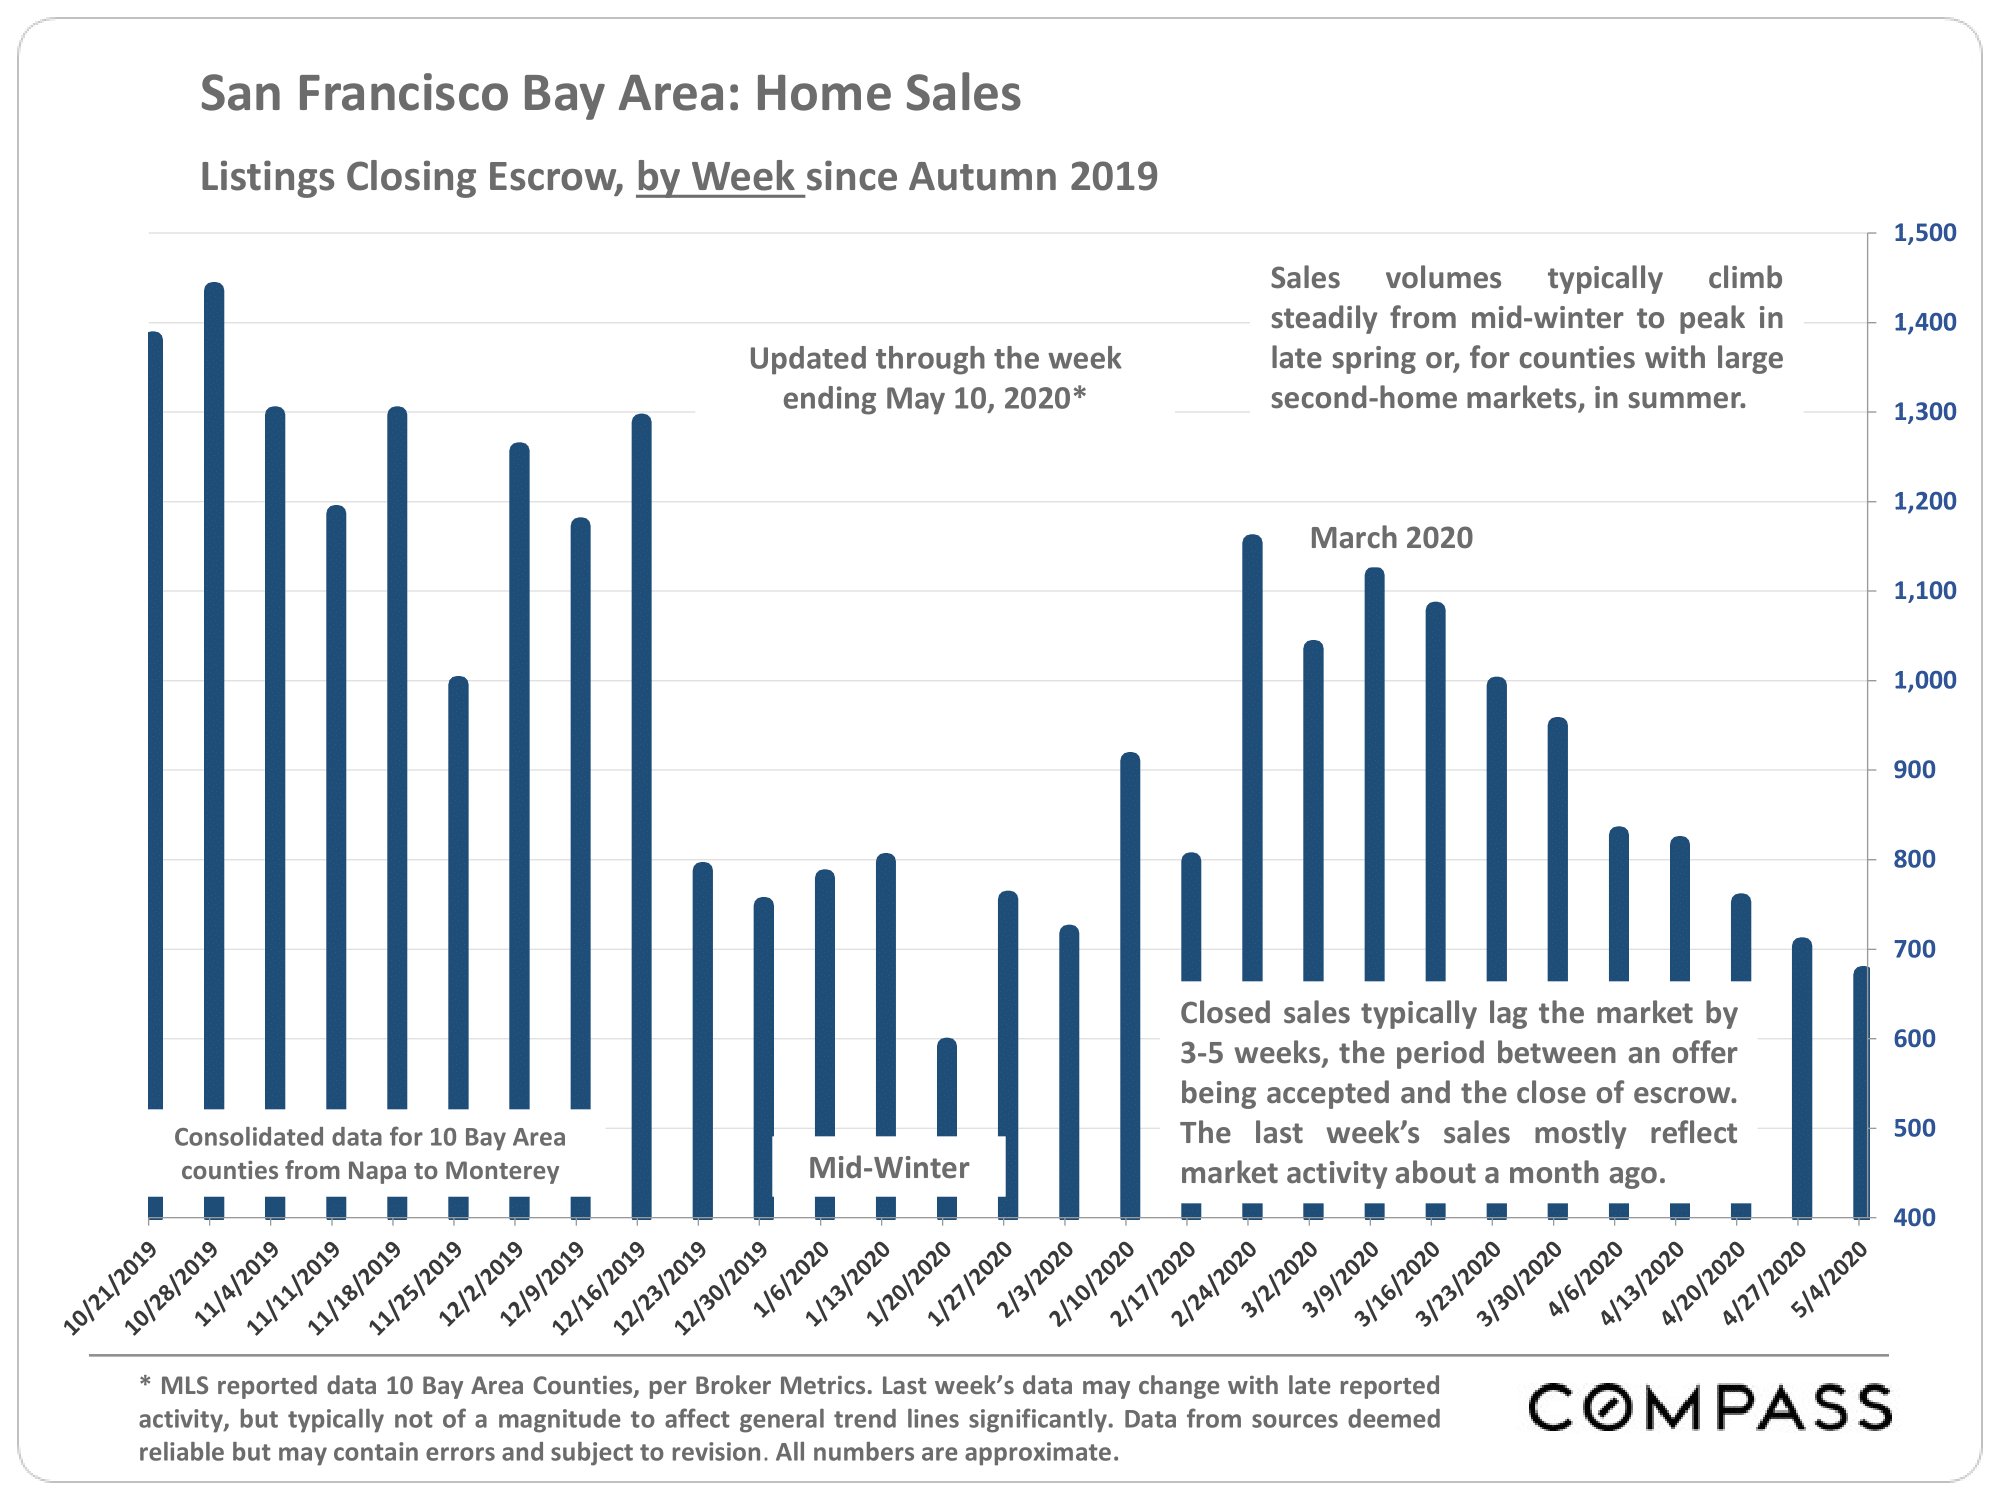
Shelter-in-place caused steep drops in activity across the board in what is typically the busiest selling season of the year. However, though still far below normal levels, activity has been slowly picking up since bottoming out in late March/early April, and will presumably continue to do so with the easing of both shelter-in-place and property-showing rules. 
So far, home prices have seen no declines. In fact, there have been substantial year-over-year gains, but a fair proportion of the sales behind April median sales prices still reflects offers accepted prior to shelter in place. 
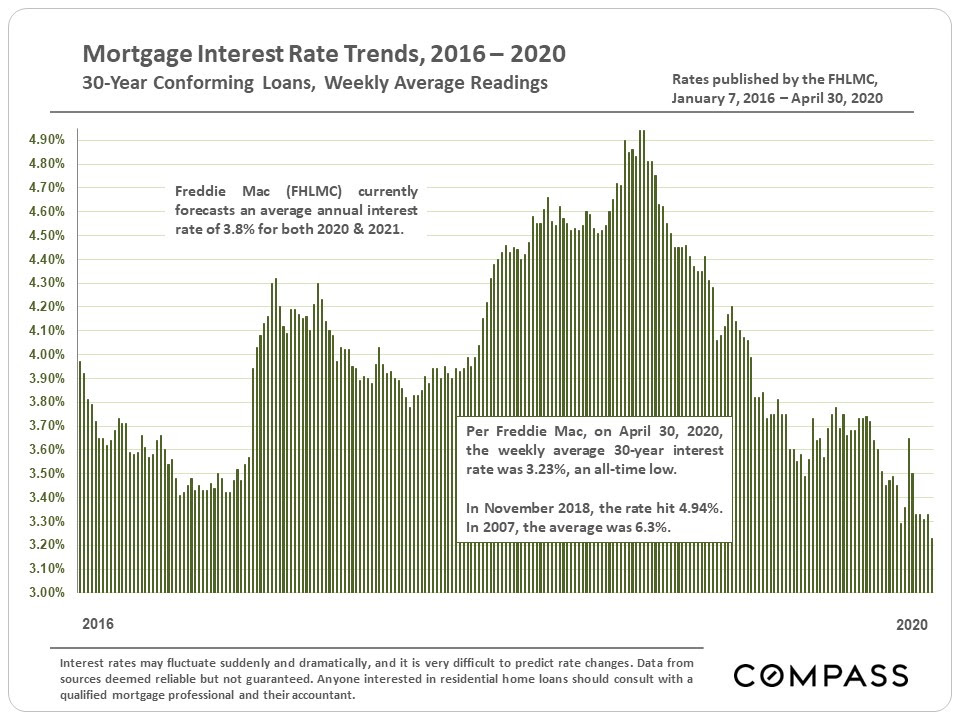
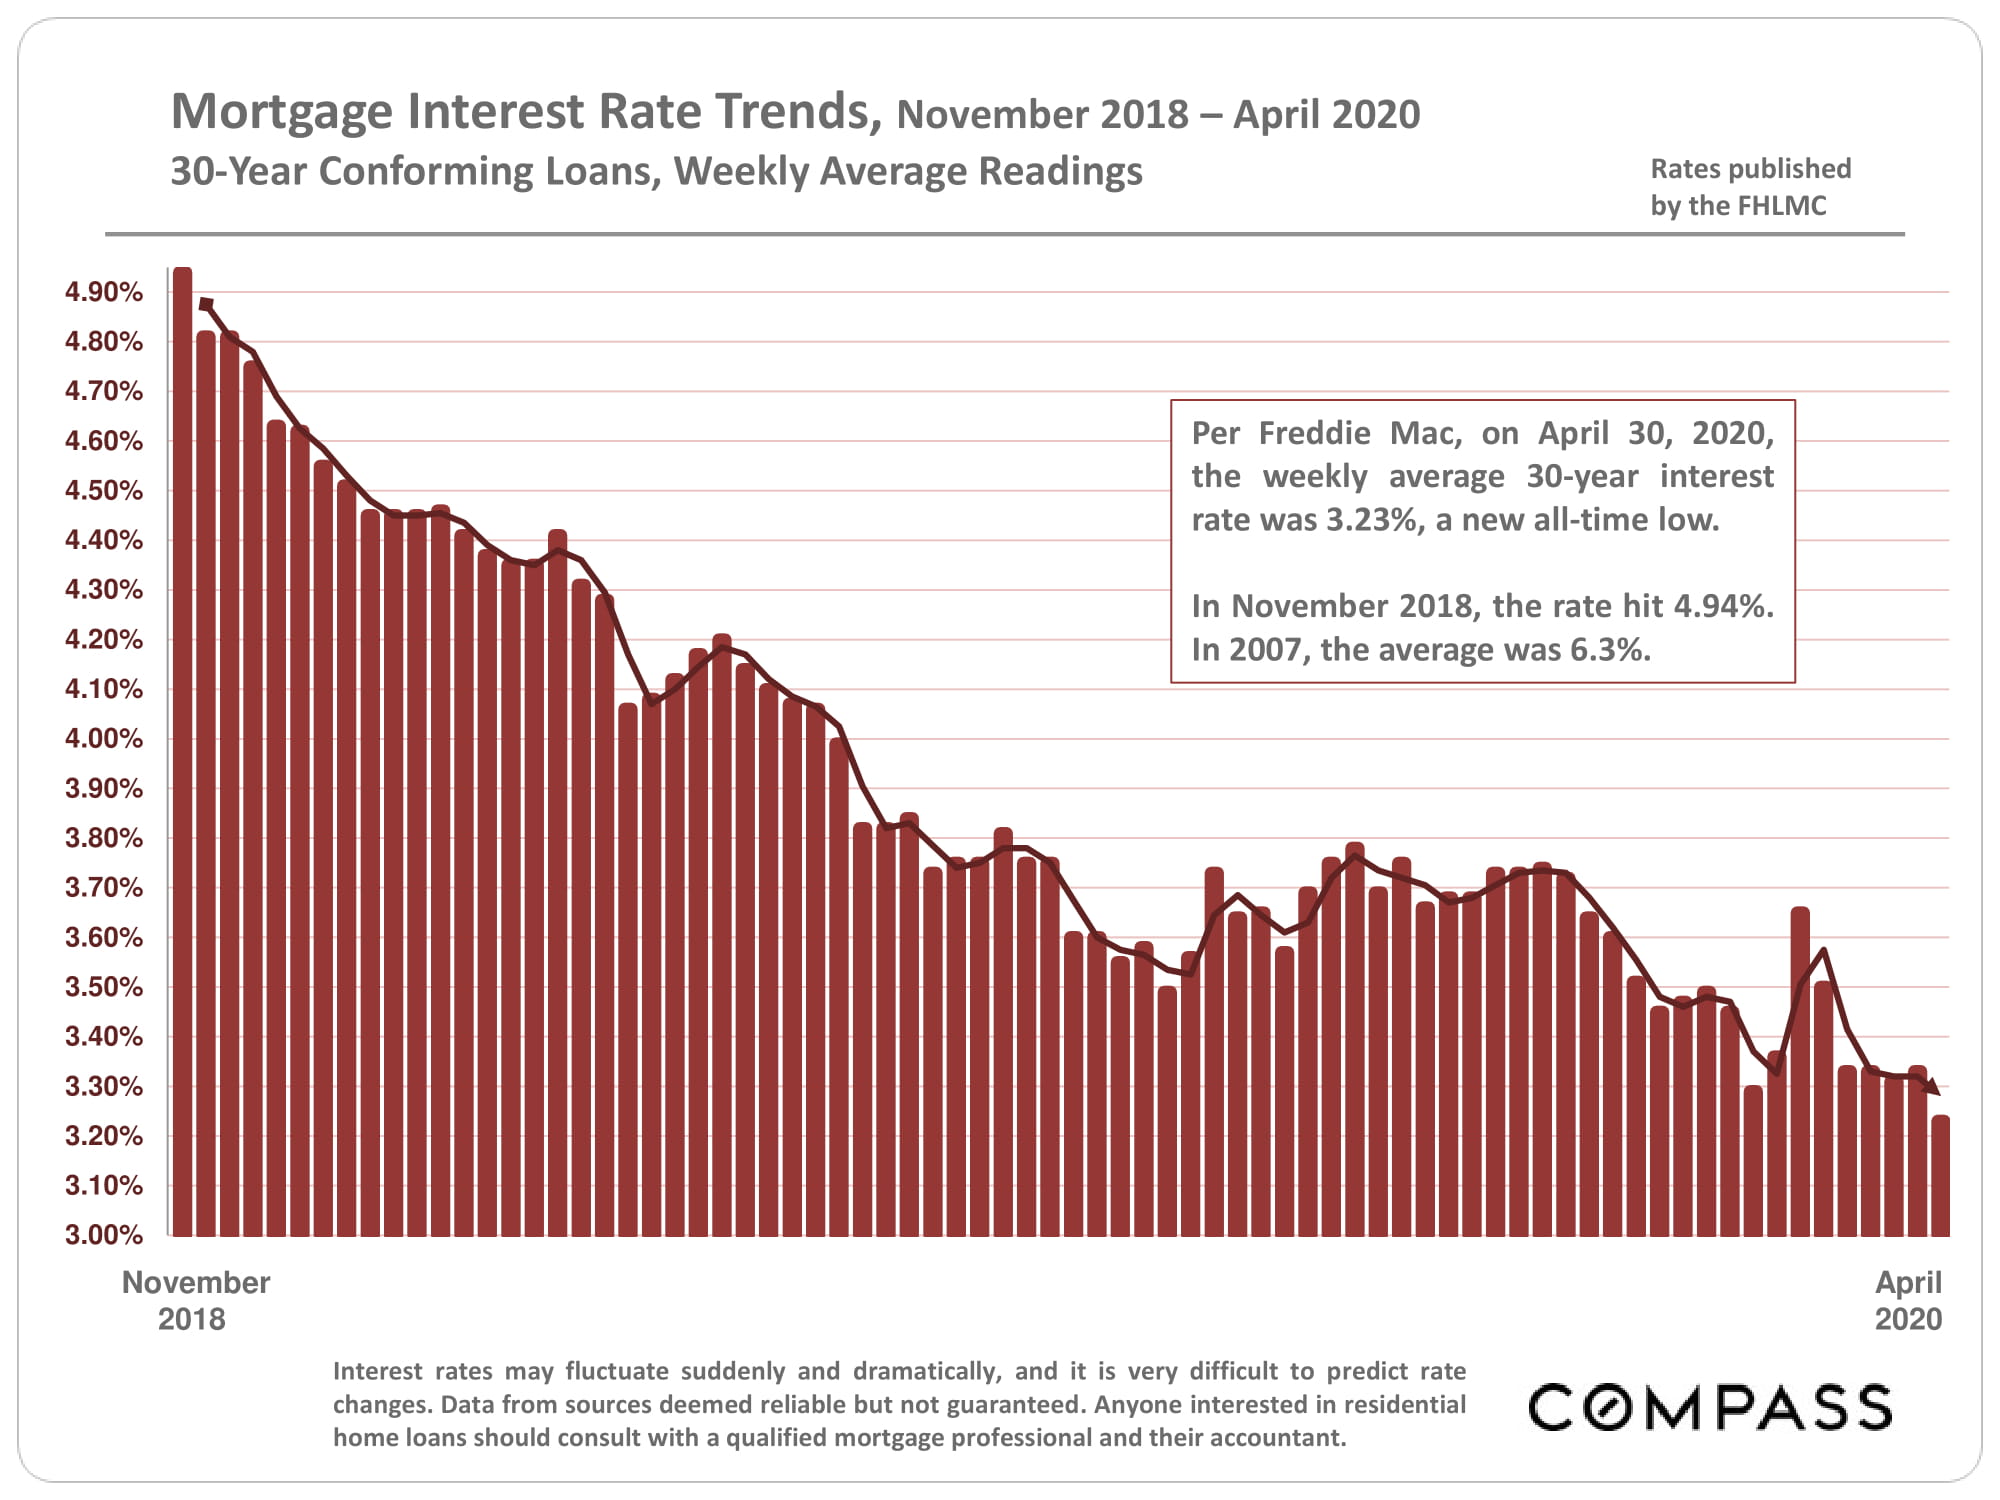
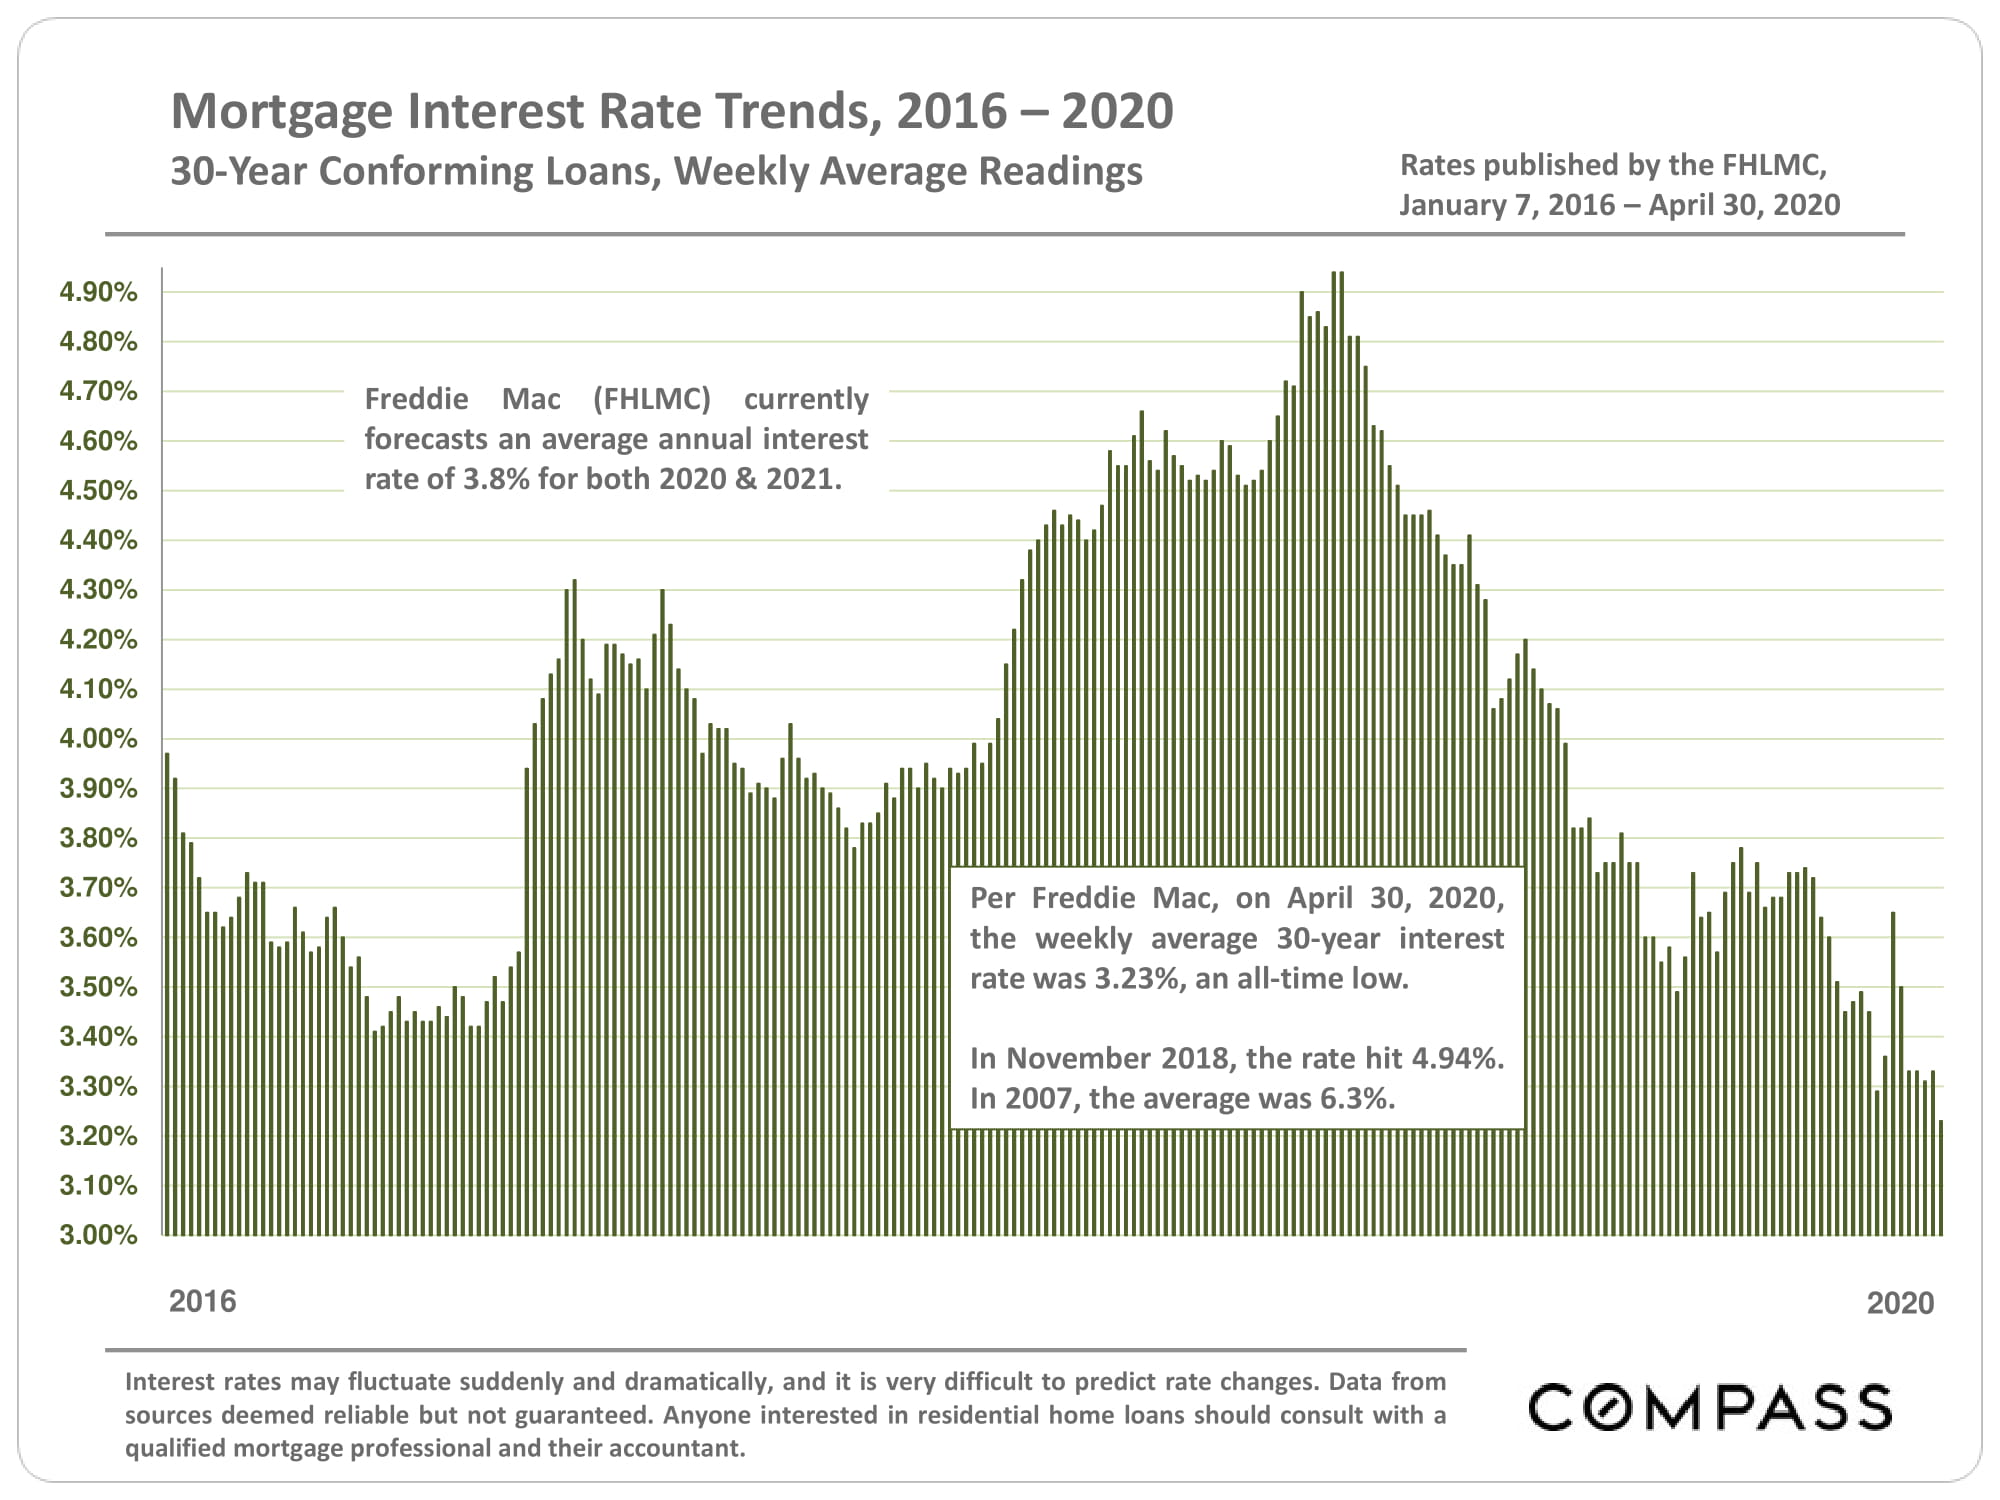
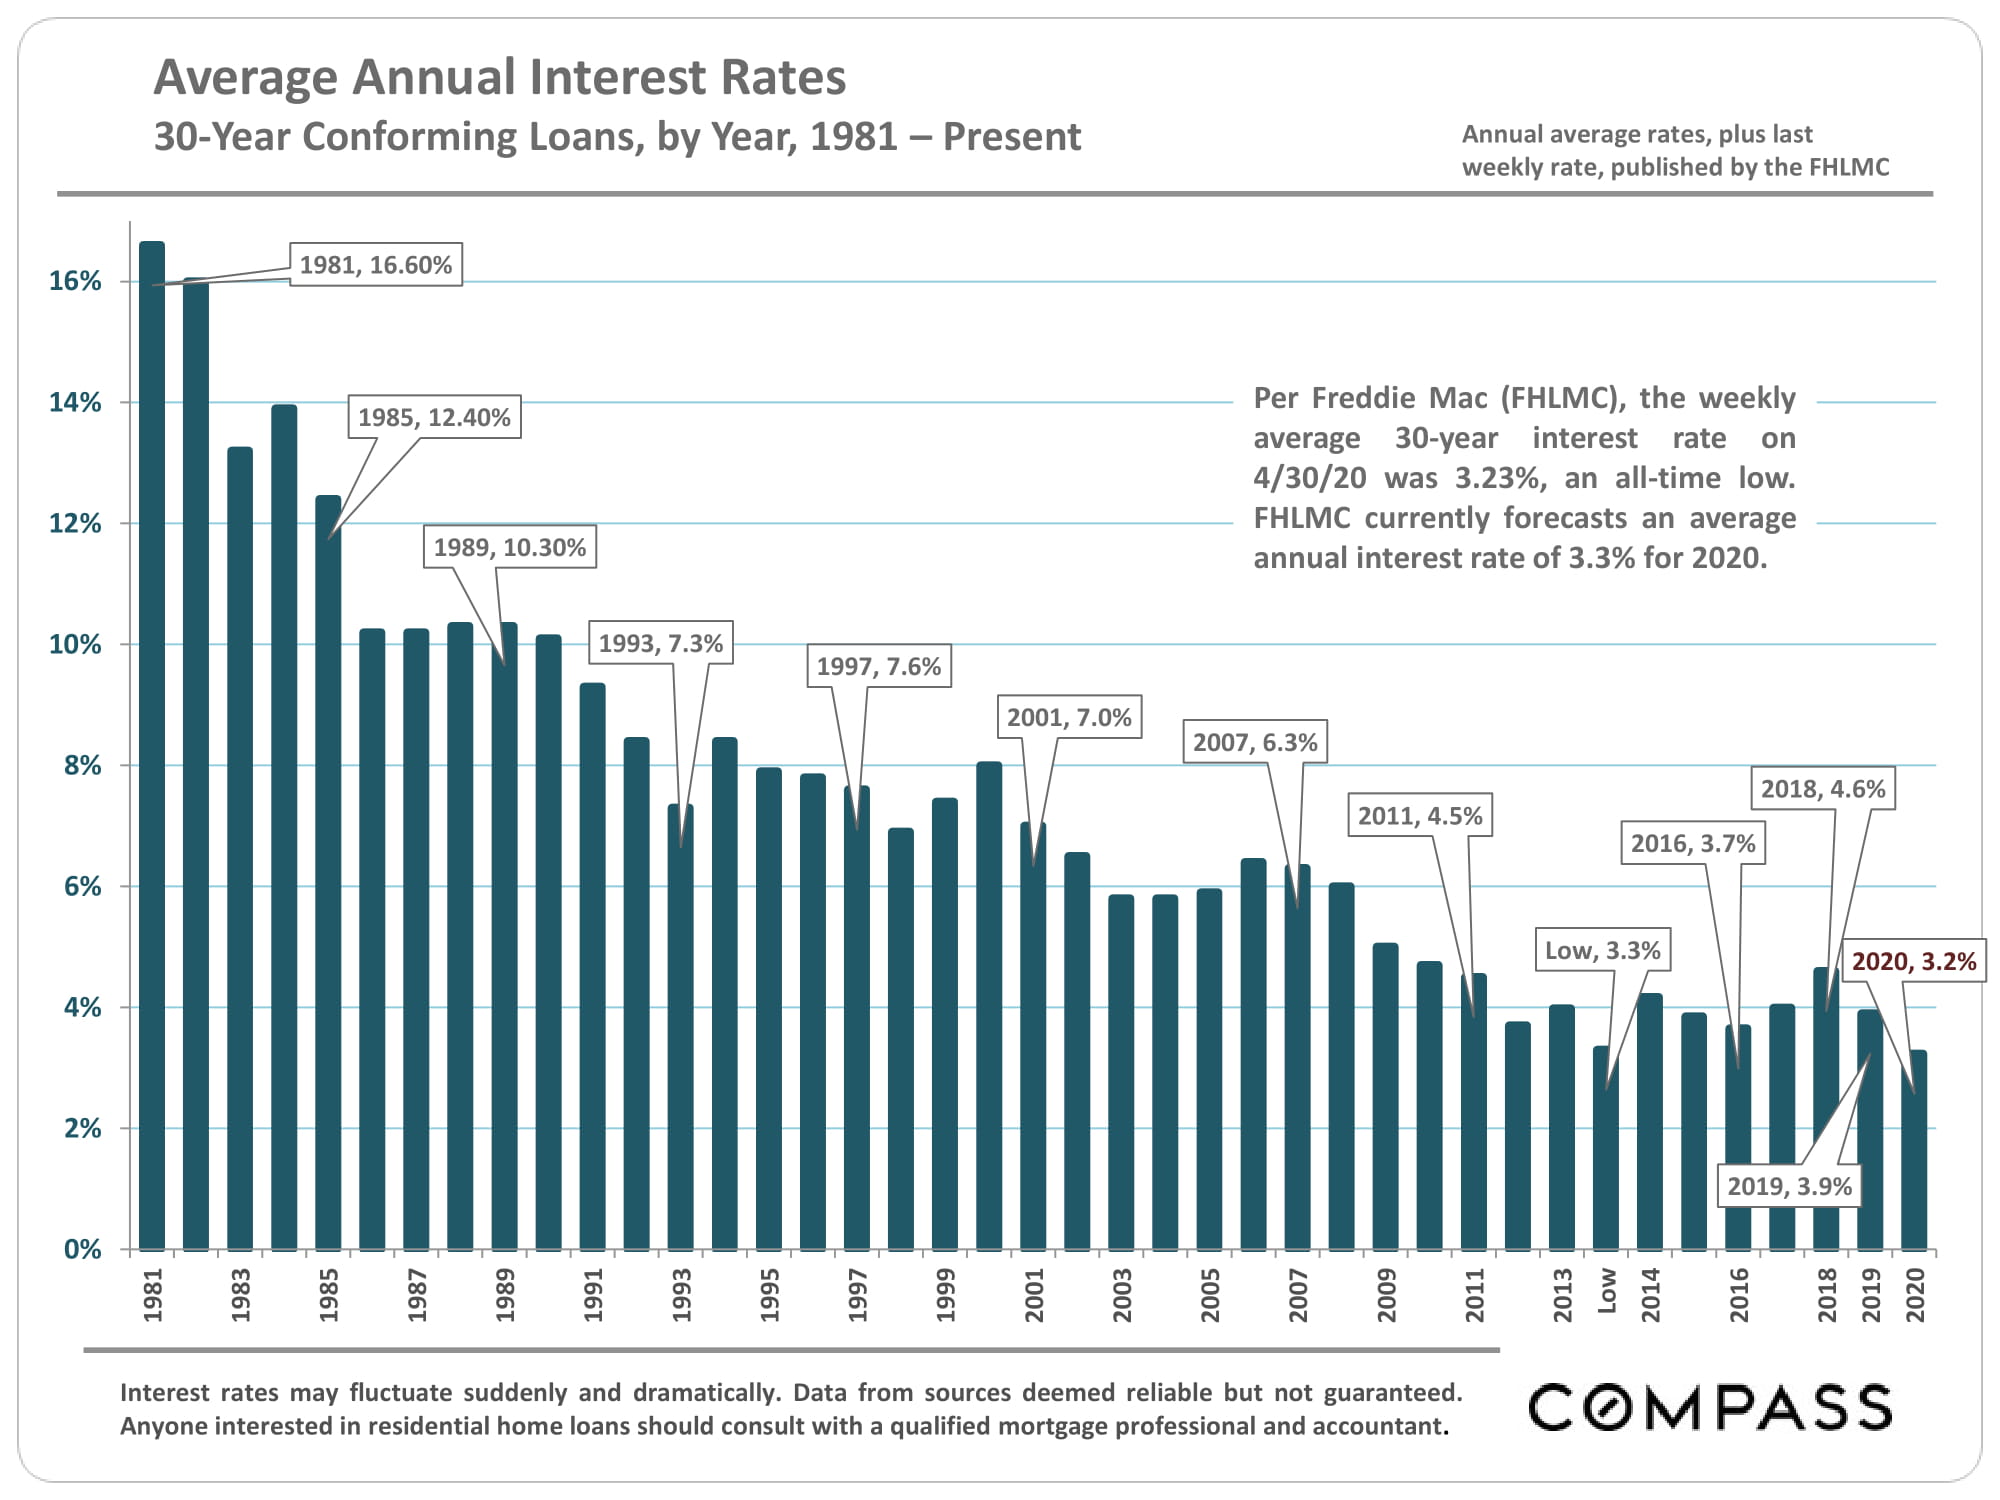
Interest rates hit a new historic low in the last week of April. 
Week by Week Supply & Demand Trends
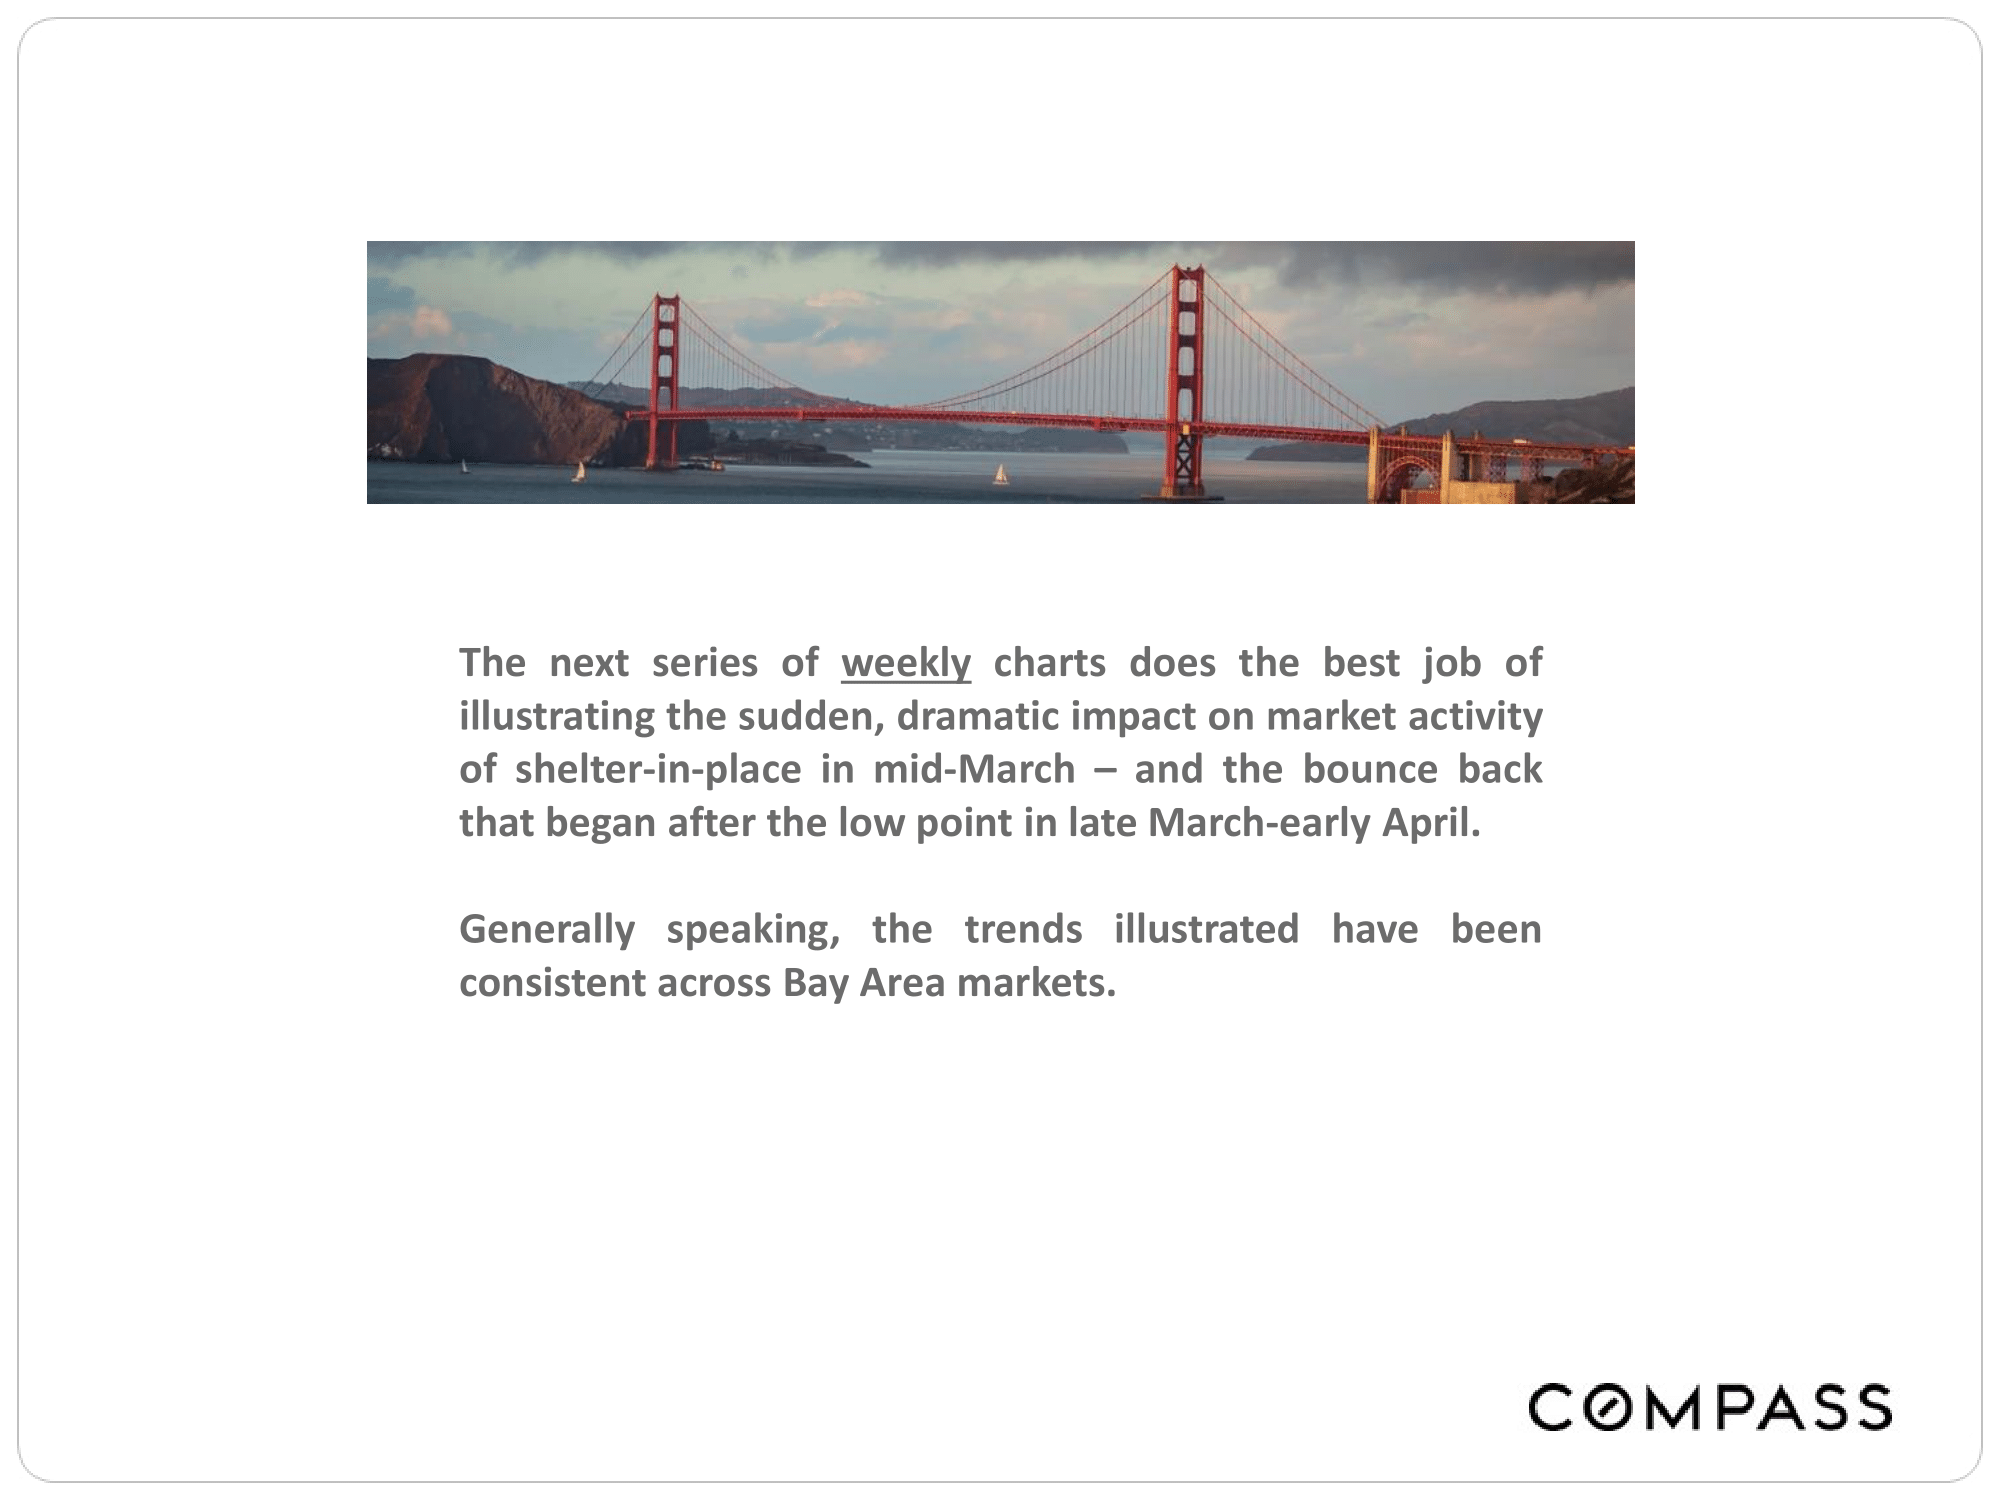
The only way to clearly perceive the recent changes in the market – sudden plunge and the beginning of recovery – is by looking at WEEKLY trends in buyer and seller activity. These are illustrated in this first chart below.
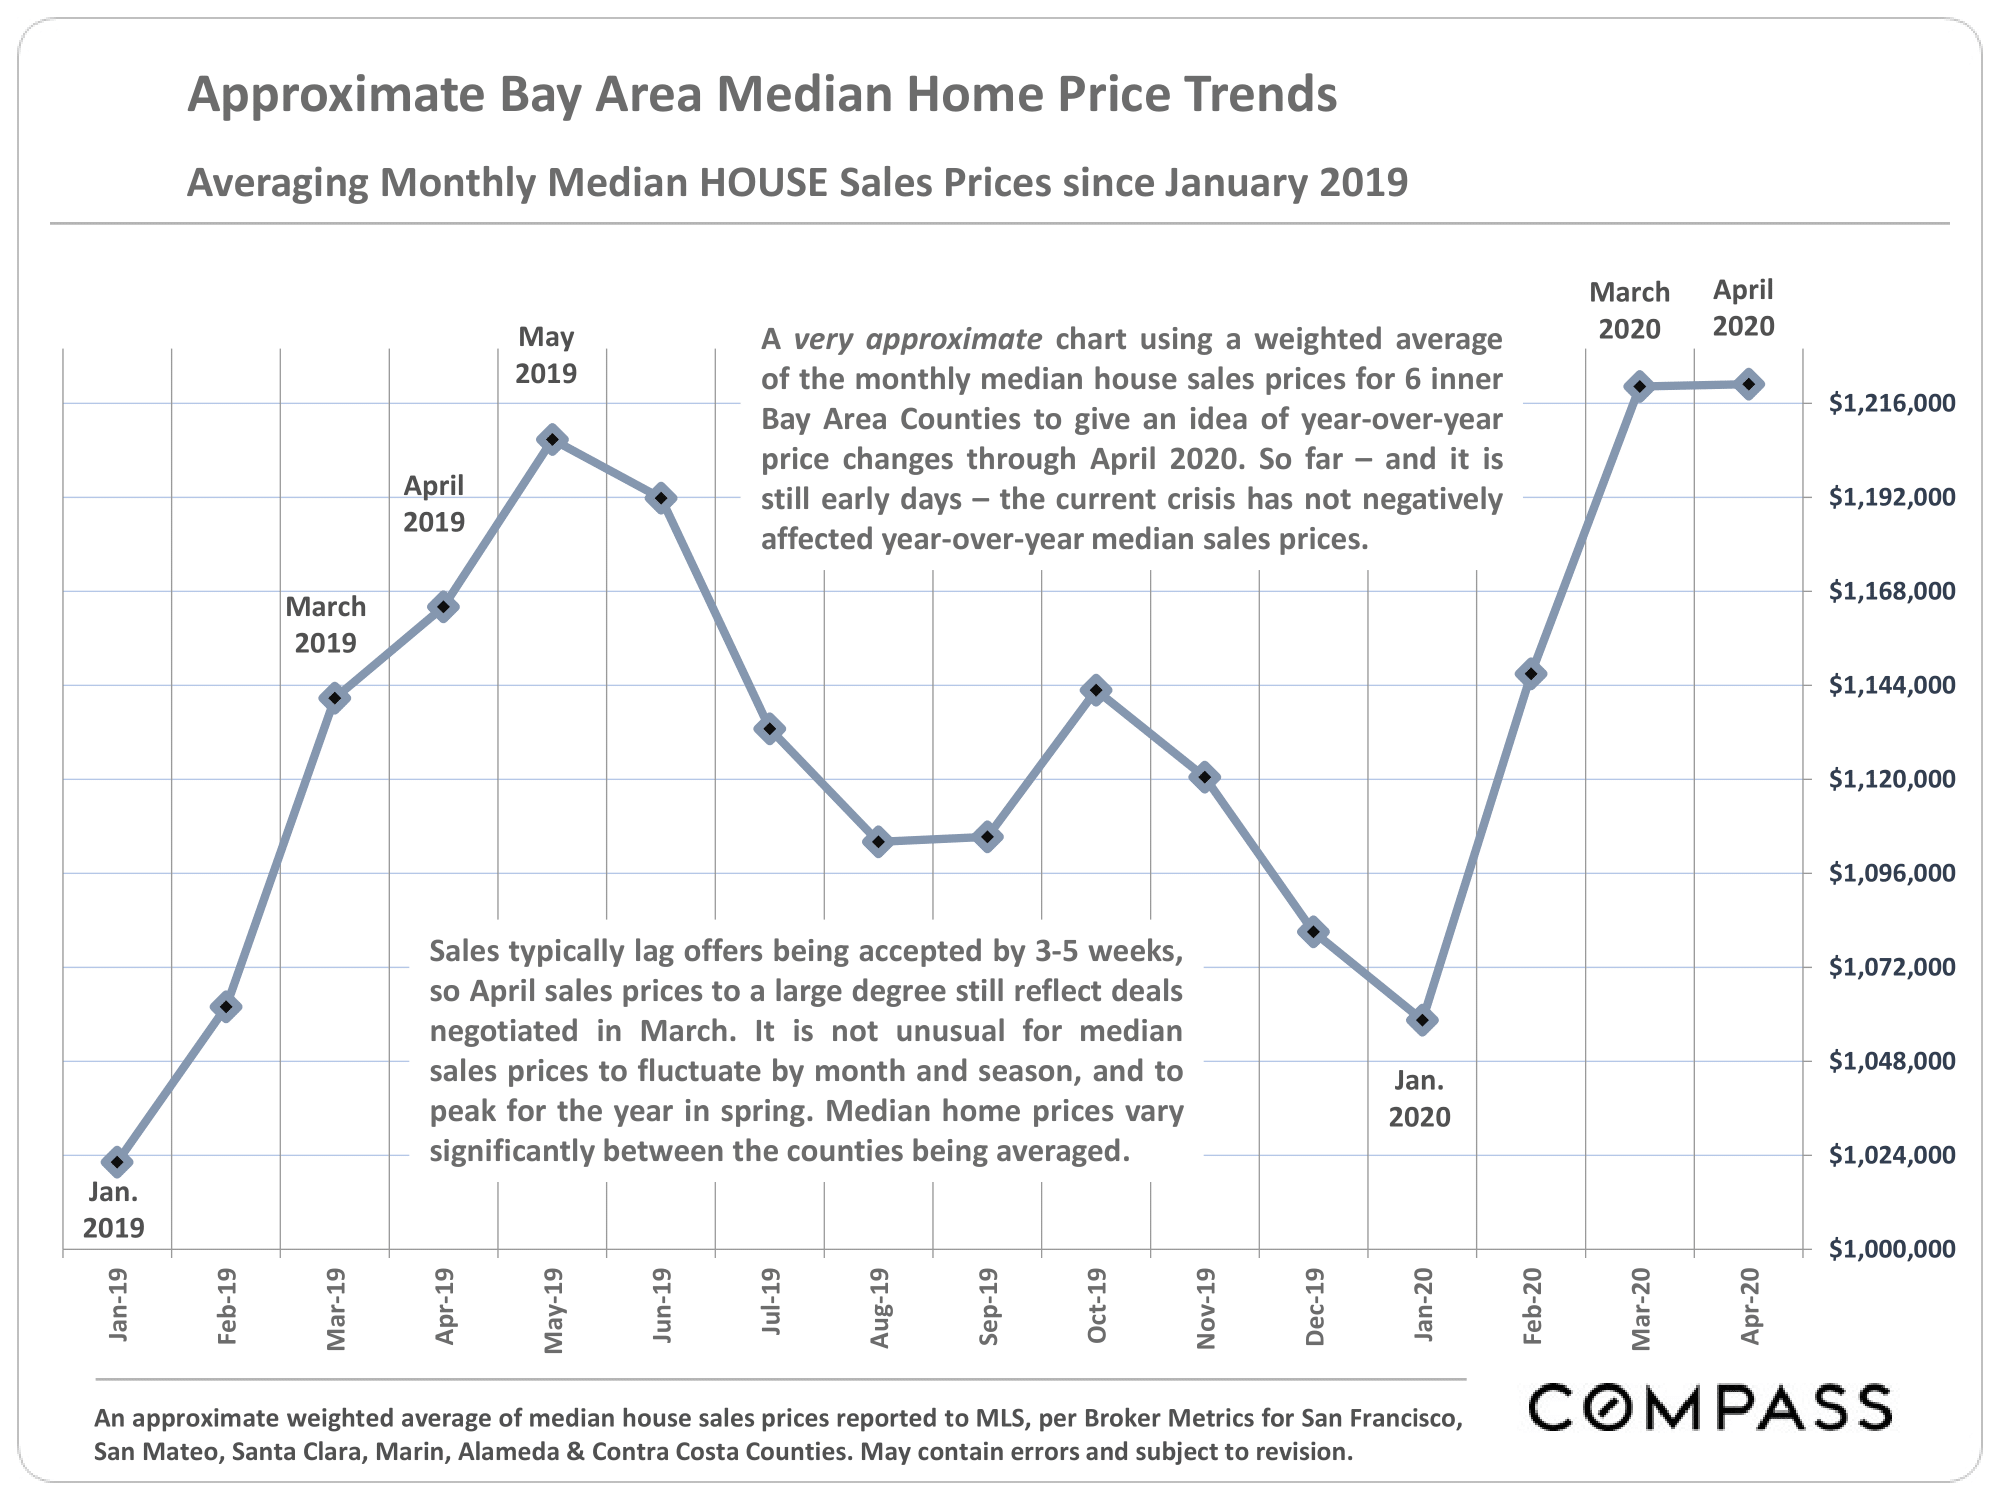
Year-over-Year Changes in Median Home Sales Prices 
Generally speaking, the first months of 2020 have been characterized by often substantial year-over-year increases in median home sales prices across the Bay Area.
Long-Term Trends in Median House Prices
– 12-Month Rolling Illustration
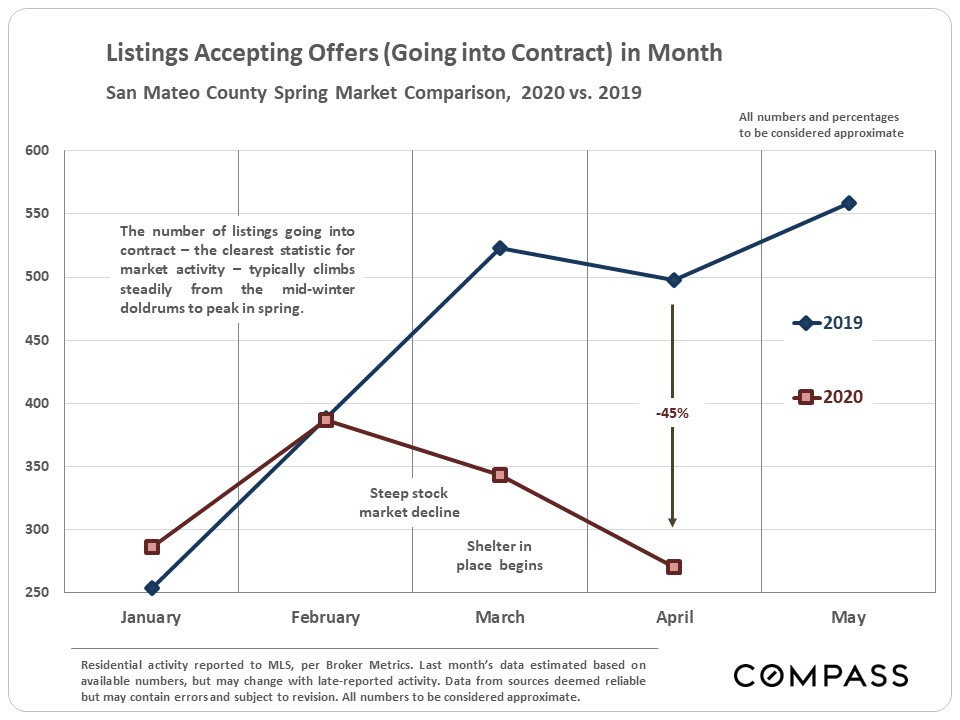
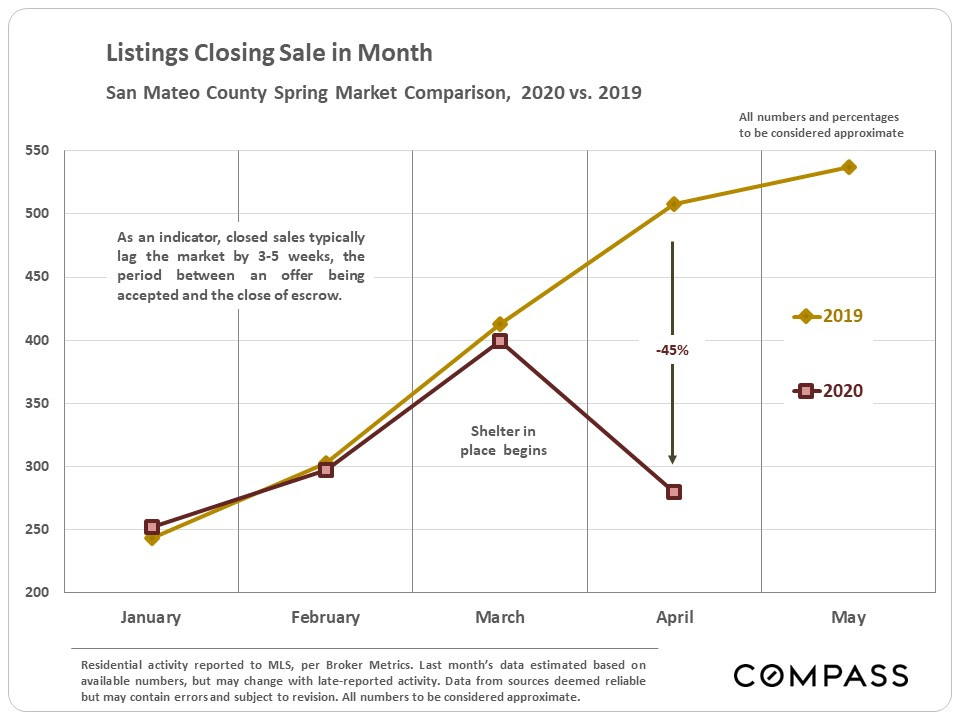
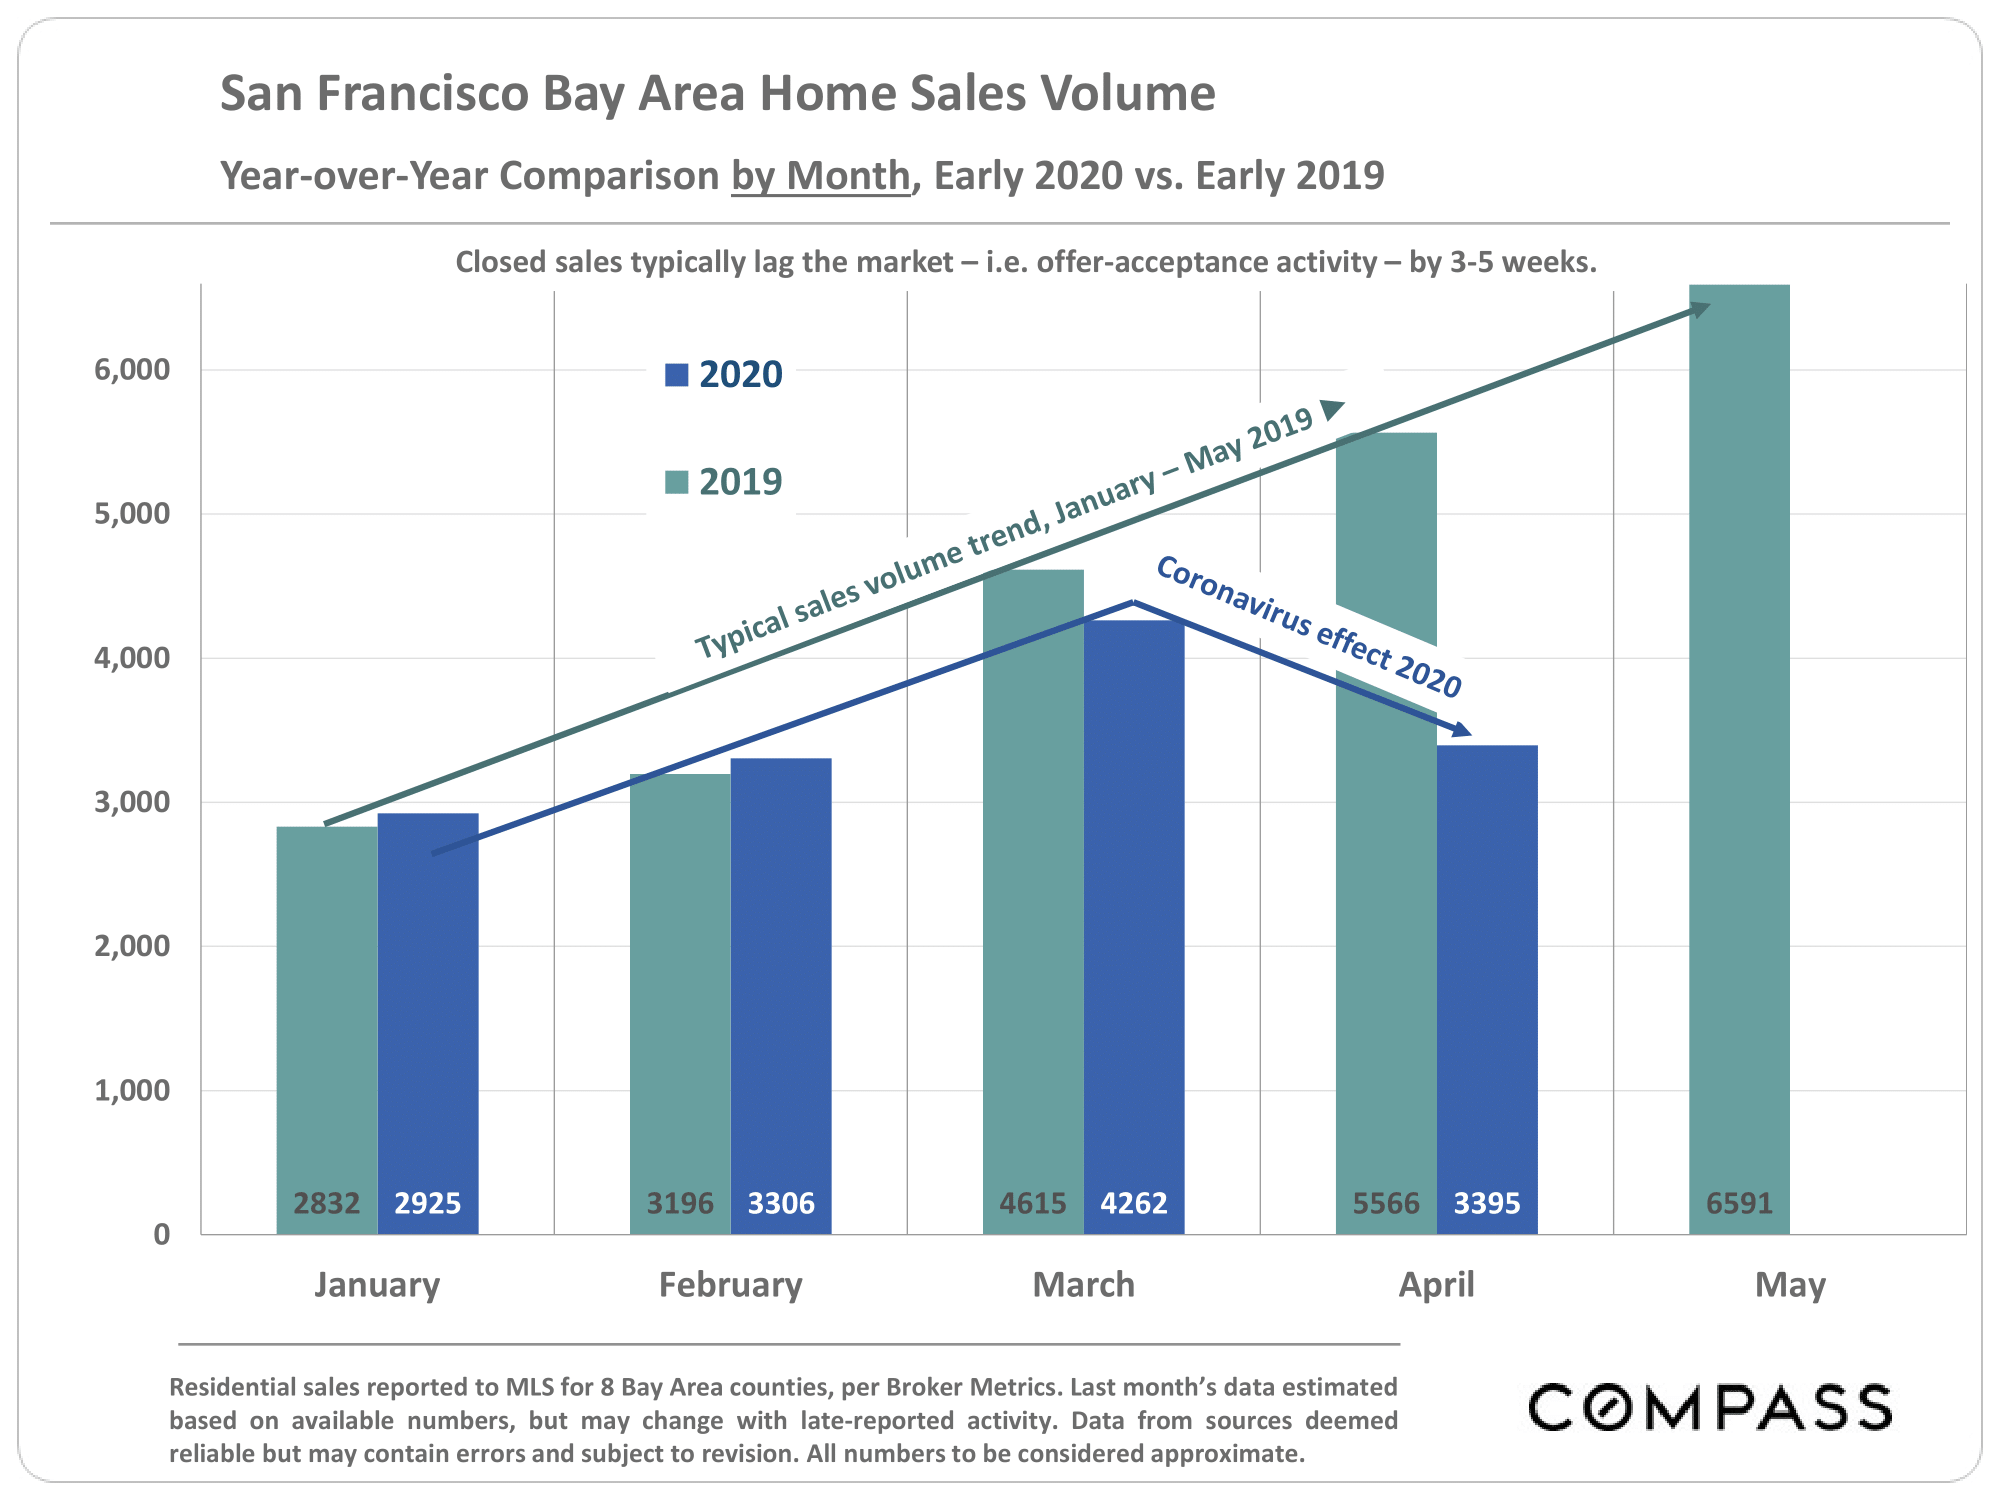
Monthly Supply & Demand, Year-over-Year Comparisons
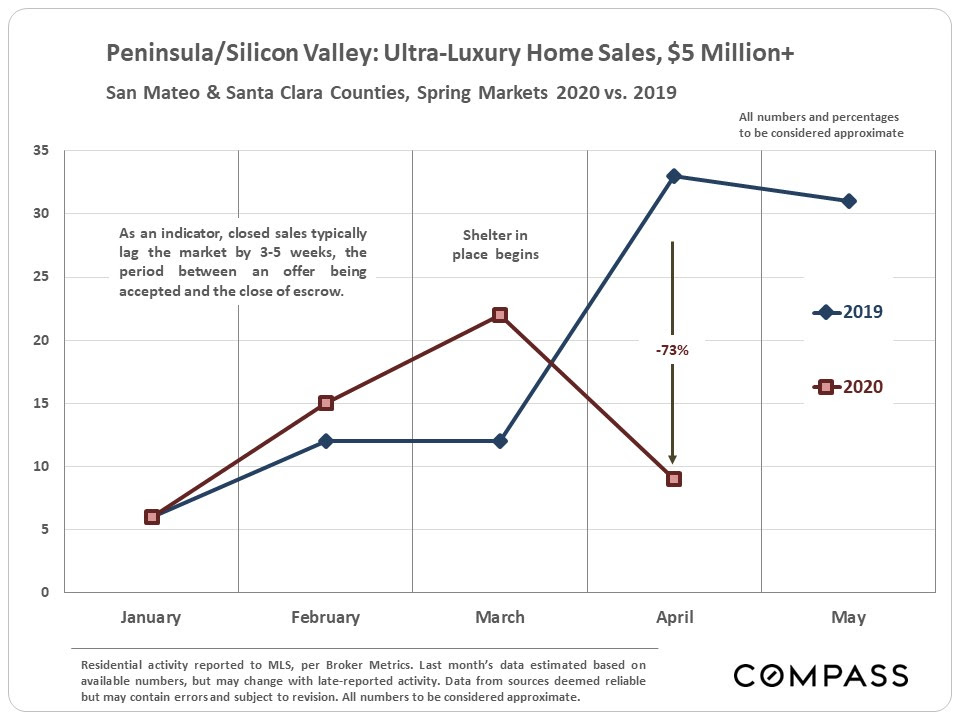
The next series of charts reflects the dramatic changes in seller and buyer dynamics by MONTH as compared to spring 2019. 
Mortgage Interest Rates
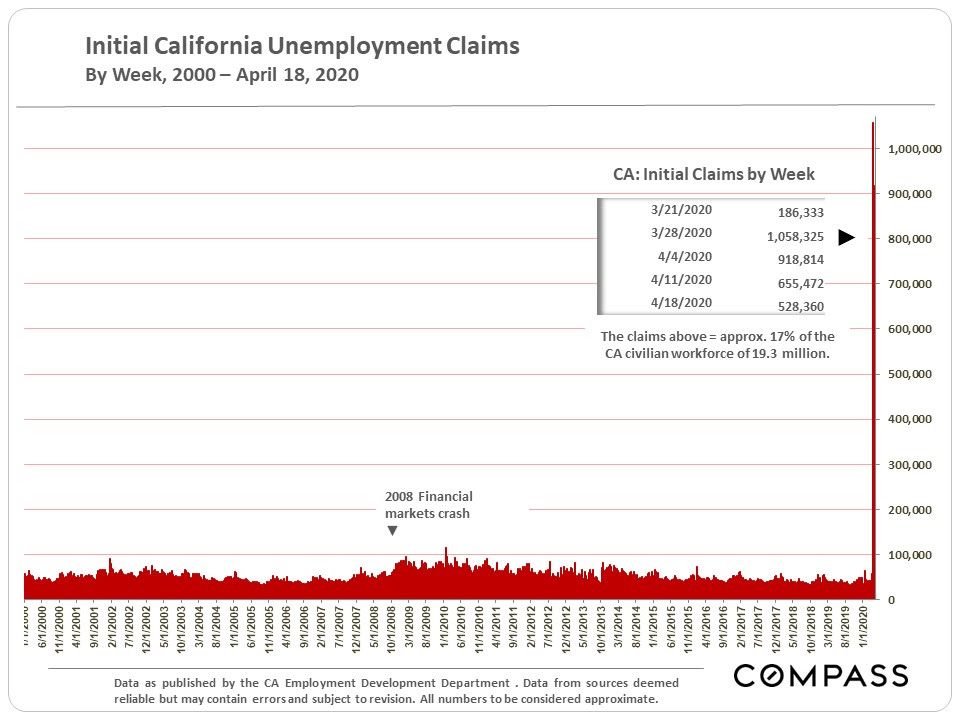
Unemployment
We are not going to review the economic news already extensively covered in the media, except for this stark illustration of the unparalleled rise in unemployment. How quickly this horrifying trend can be reversed will probably be the single largest factor behind an economic recovery.

Source: Compass

It is impossible to know how median and average value statistics apply to any particular home without a specific comparative market analysis. Many factors affect sales prices besides neighborhood/ bedroom count: quality of location within the neighborhood, condition, size,architecture,views, amenities,parking,outdoor space, etc.

These analyses were made in good faith with data from sources deemed reliable, but may contain errors and are subject to revision. It is not our intent to convince you of a particular position,but to attempt to provide straightforward data and analysis, so you can make your own informed decisions. Median and average statistics are enormous generalities: There are hundreds of different markets in San Francisco and the Bay Area, each with its own unique dynamics. Median prices and average dollar per square foot values can be and often are affected by other factors besides changes in fair market value. Longer term trends are much more meaningful than short-term.

Compass is a real estate broker licensed by the State of California, DRE 01527235. Equal Housing Opportunity. This report has been prepared solely for information purposes. The information herein is based on or derived from information generally available to the public and/or from sources believed to be reliable. No representation or warranty can be given with respect to the accuracy or completeness of the information. Compass disclaims any and all liability relating to this report, including without limitation any express or implied representations or warranties for statements contained in, and omissions from, the report. Nothing contained herein is intended to be or should be read as any regulatory, legal, tax, accounting or other advice and Compass does not provide such advice. All opinions are subject to change without notice. Compass makes no representation regarding the accuracy of any statements regarding any references to the laws, statutes or regulations of any state are those of the author(s). Past performance is no guarantee of future results.
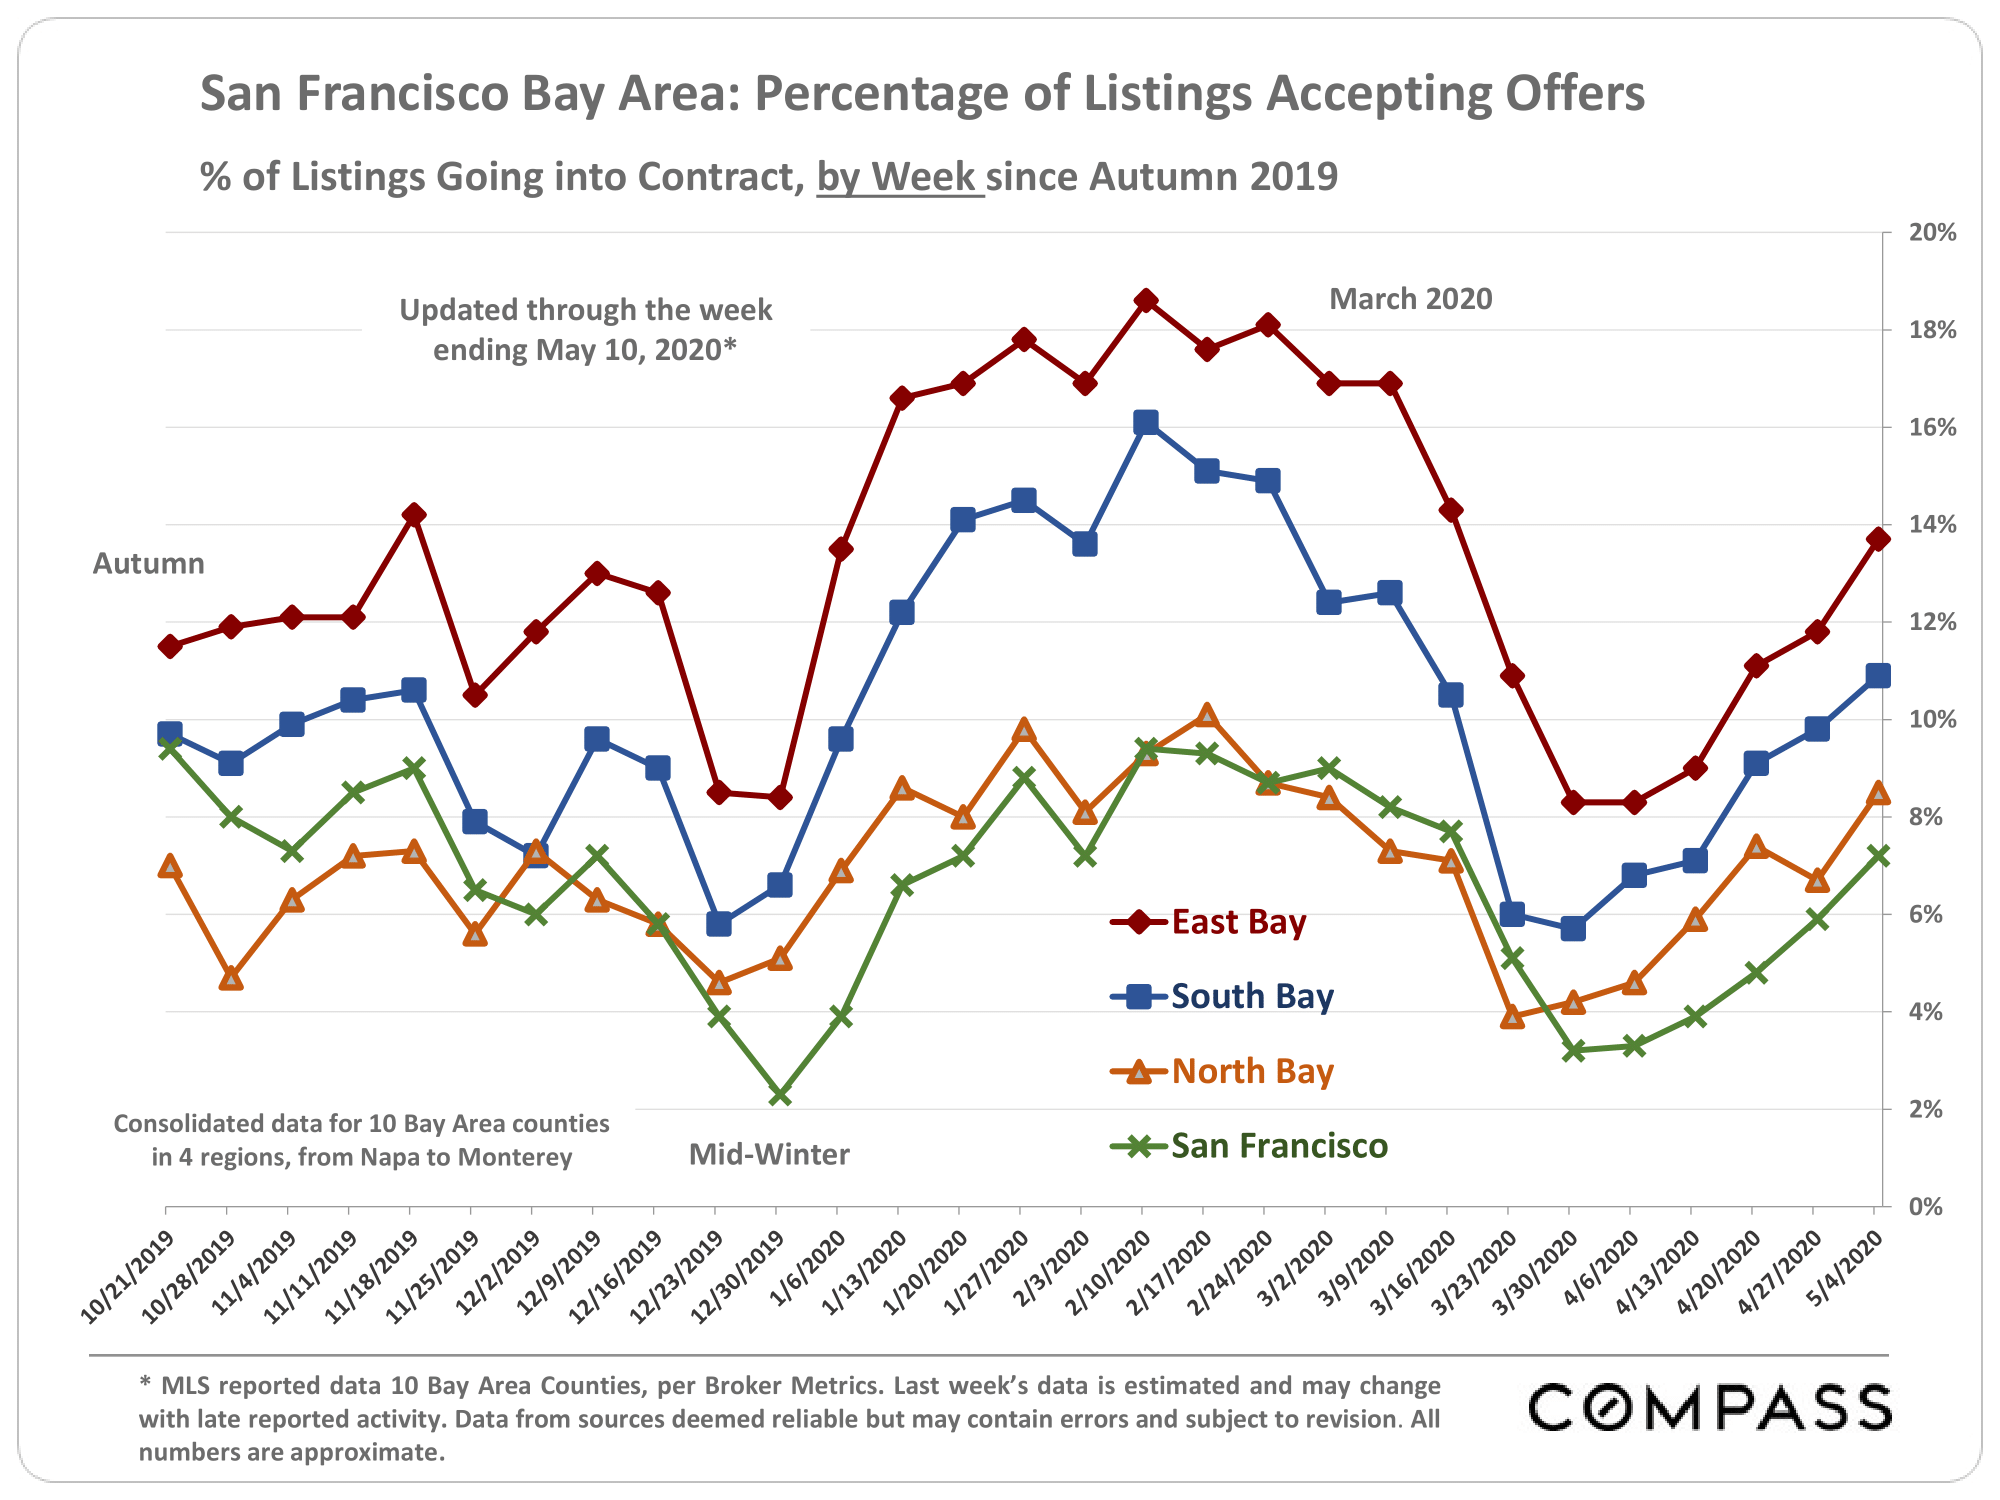
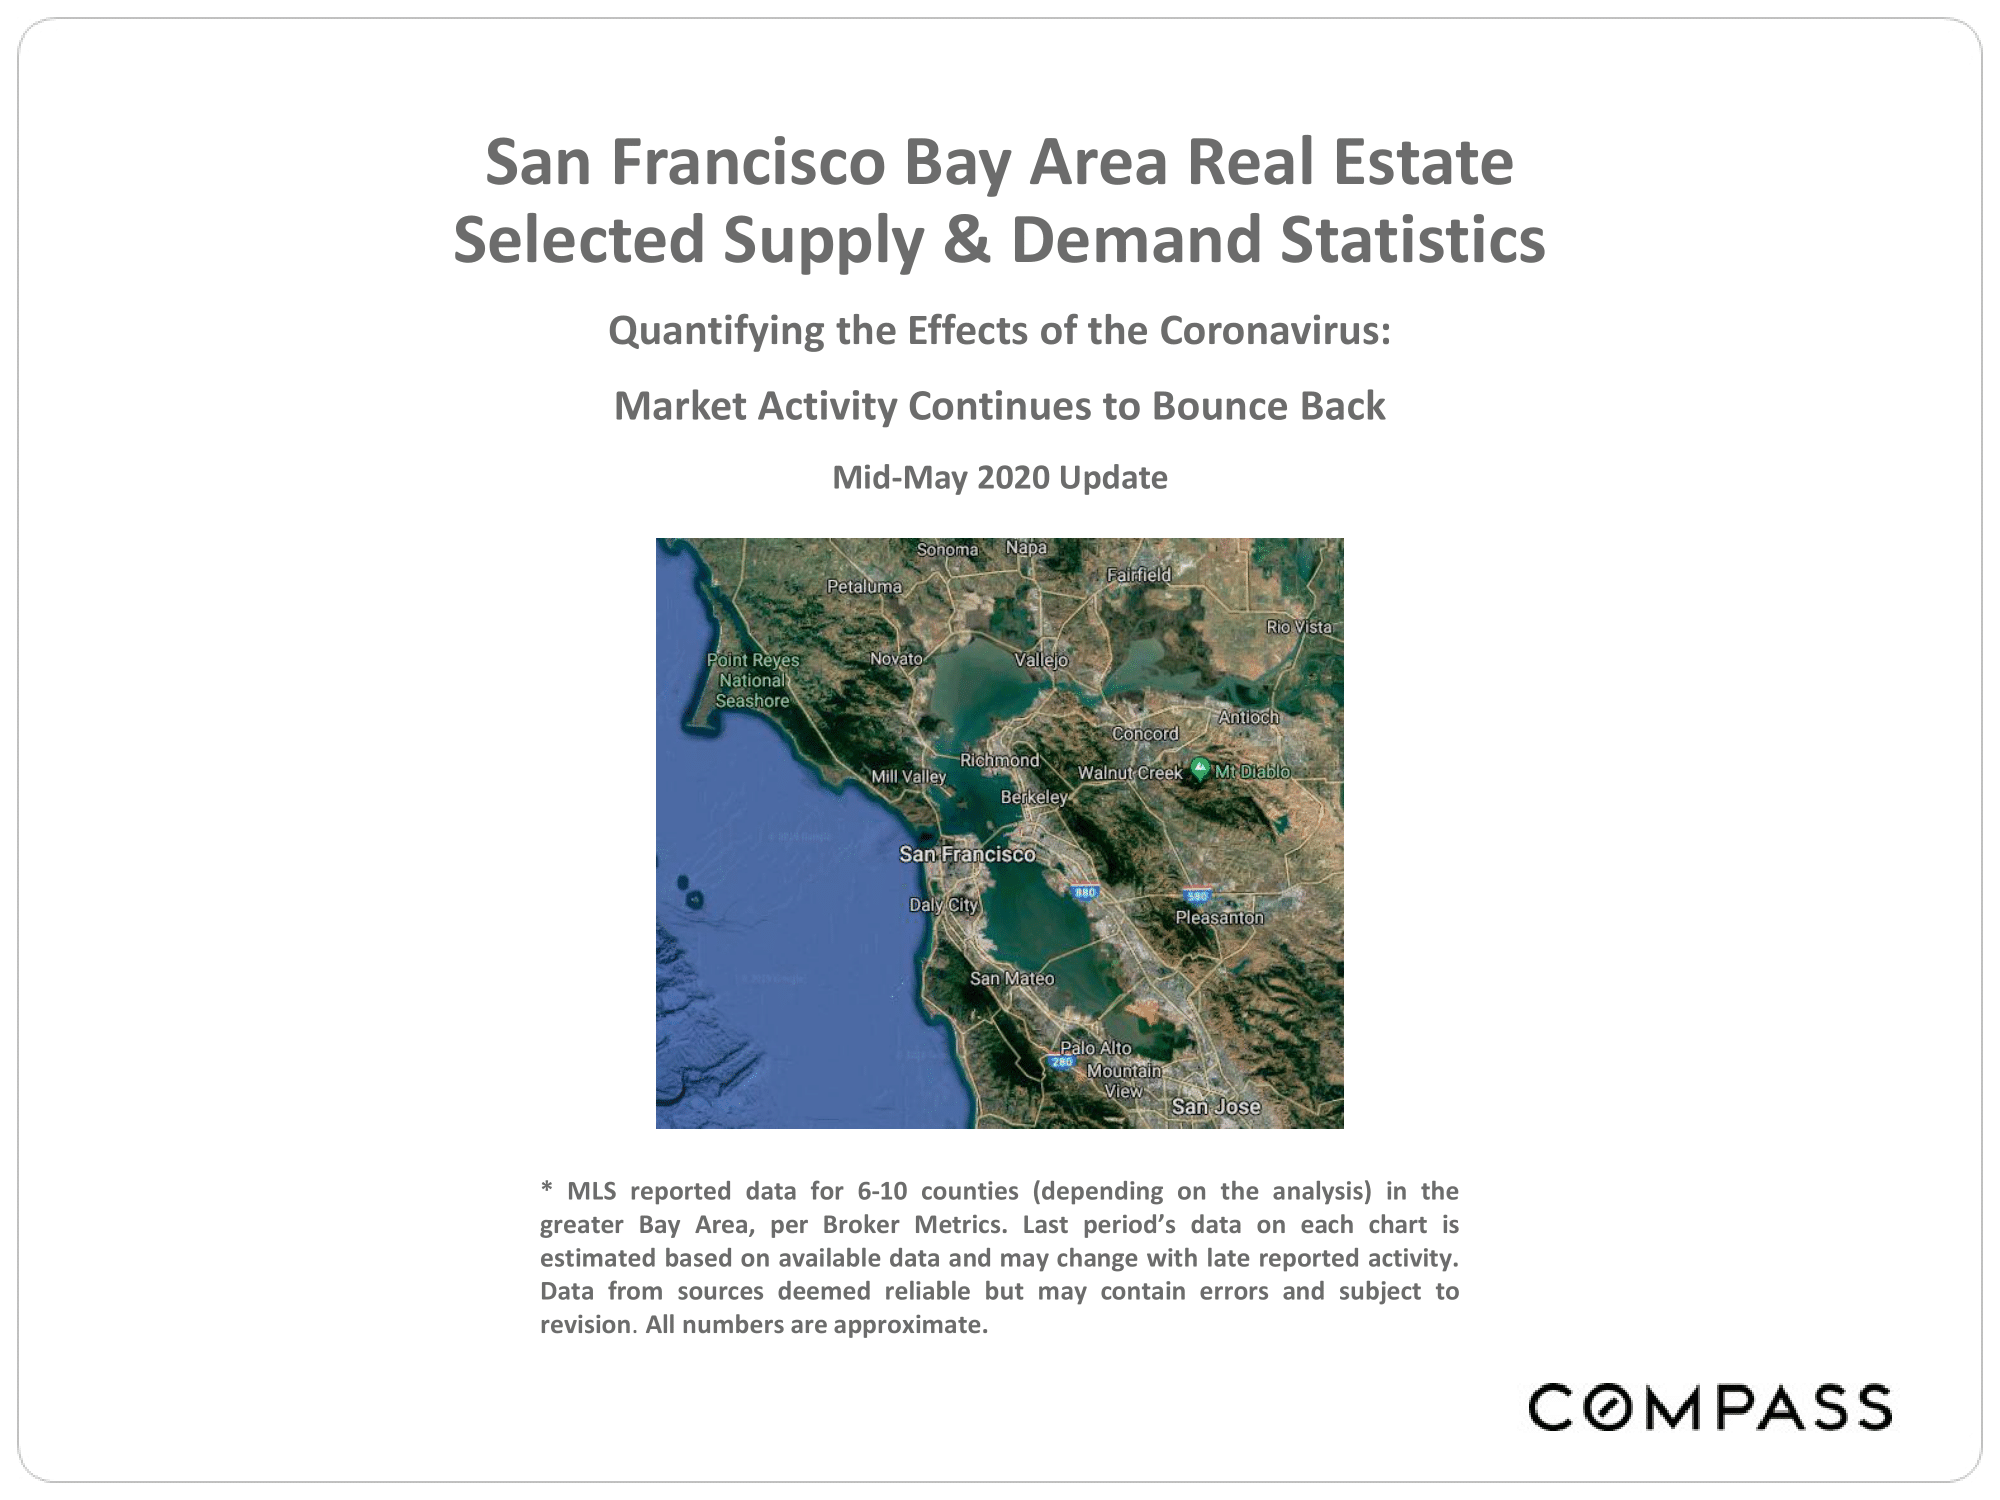
Bay Area Weekly Market Activity Continues to Bounce Back, Mid-May 2020 Update

Source: Compass

It is impossible to know how median and average value statistics apply to any particular home without a specific comparative market analysis. Many factors affect sales prices besides neighborhood/ bedroom count: quality of location within the neighborhood, condition, size, architecture, views, amenities, parking, outdoor space, etc.

These analyses were made in good faith with data from sources deemed reliable, but may contain errors and are subject to revision. It is not our intent to convince you of a particular position,but to attempt to provide straightforward data and analysis, so you can make your own informed decisions. Median and average statistics are enormous generalities: There are hundreds of different markets in San Francisco and the Bay Area, each with its own unique dynamics. Median prices and average dollar per square foot values can be and often are affected by other factors besides changes in fair market value. Longer term trends are much more meaningful than short-term.
Compass is a real estate broker licensed by the State of California, DRE 01527235. Equal Housing Opportunity. This report has been prepared solely for information purposes. The information herein is based on or derived from information generally available to the public and/or from sources believed to be reliable. No representation or warranty can be given with respect to the accuracy or completeness of the information. Compass disclaims any and all liability relating to this report, including without limitation any express or implied representations or warranties for statements contained in, and omissions from, the report. Nothing contained herein is intended to be or should be read as any regulatory, legal, tax, accounting or other advice and Compass does not provide such advice. All opinions are subject to change without notice. Compass makes no representation regarding the accuracy of any statements  regarding  any references to the laws, statutes or regulations  of any state are those of  the author(s).  Past performance is no guarantee  of future  results.


Santa Clara County Real Estate Market Begins to Bounce Back – Slowly, May 2020

Market activity begins to tick up after severe shelter-in-place plunge. Median house sales prices are up. Interest rates hit new low.
May 2020 Crisis Update
Shelter-in-place caused steep drops in activity across the board in what is typically the busiest selling season of the year. However, though still far below normal levels, activity has been slowly picking up since bottoming out in late March/early April, and will presumably continue to do so with the easing of both shelter-in-place and property-showing rules. 
So far, median house prices have seen no declines – in fact, quite the contrary – but a fair proportion of the sales behind the April median sales price still reflects offers accepted prior to shelter in place. 
Interest rates hit a new historic low in the last week of April. 
Week by Week Supply & Demand Trends
The only way to clearly perceive the recent changes in the market – sudden plunge and the beginning of recovery – is by looking at WEEKLY trends in buyer and seller activity. These are illustrated in this first chart below. 
Year-over-Year Changes in Median House Sales Price 
Generally speaking, the first months of 2020 have been characterized by year-over-year increases, sometimes quite substantial, in median house sales prices across the Bay Area. (Median condo sales prices in Santa Clara County – not illustrated below – have dropped somewhat on a year-over-year basis.)
Medium-Term Monthly Median House Sales Price
Long-Term Trends in Median House Prices
– 12-Month Rolling Illustration
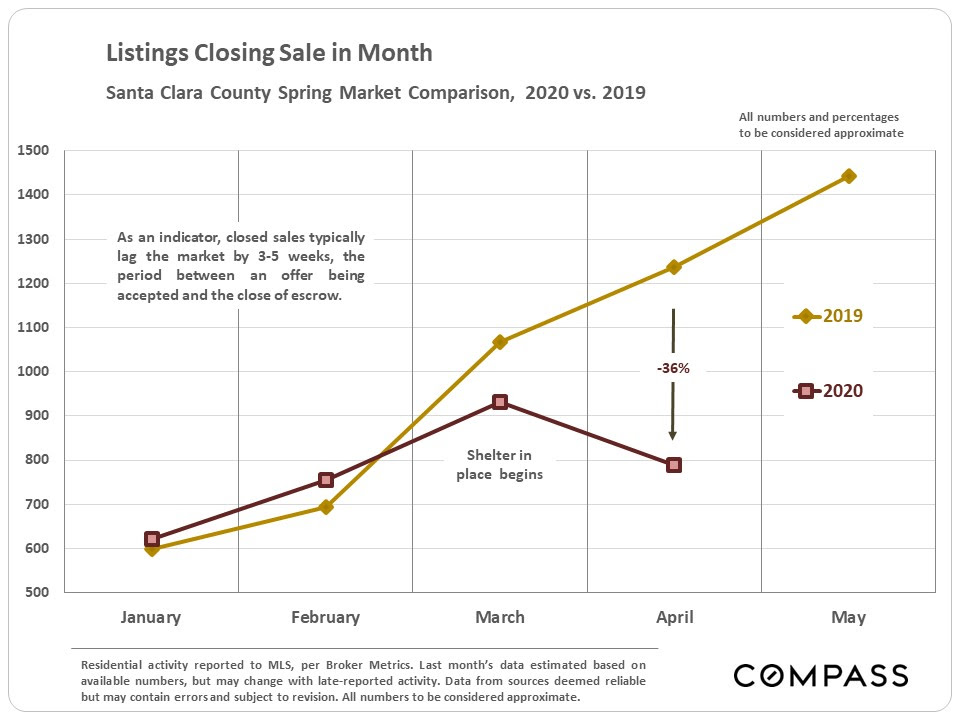
Remember that sales are a slightly lagging indicator of market activity.
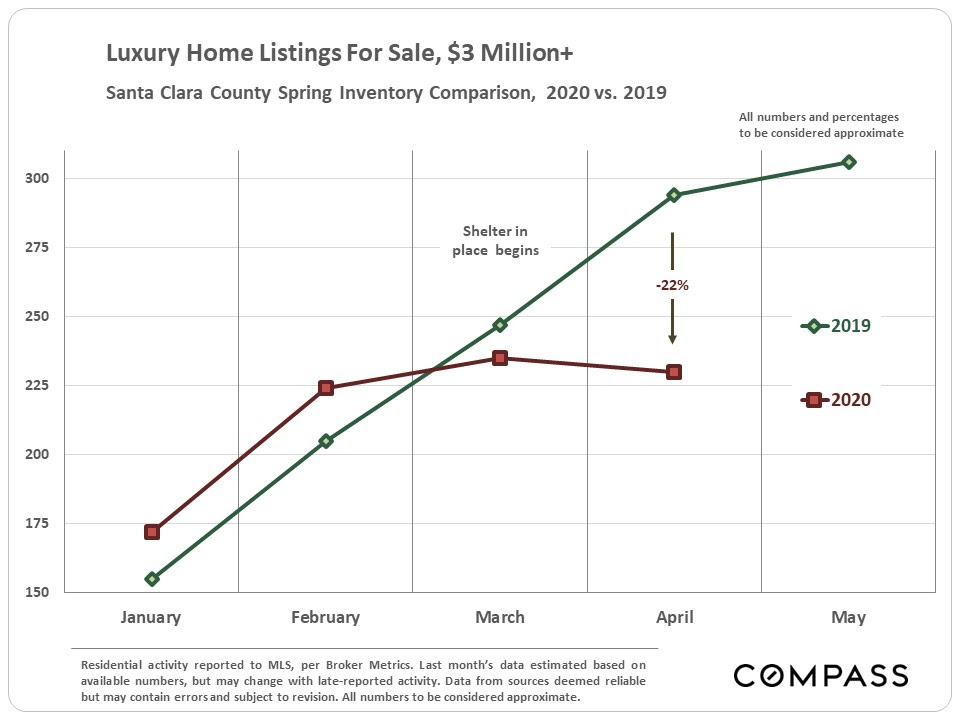
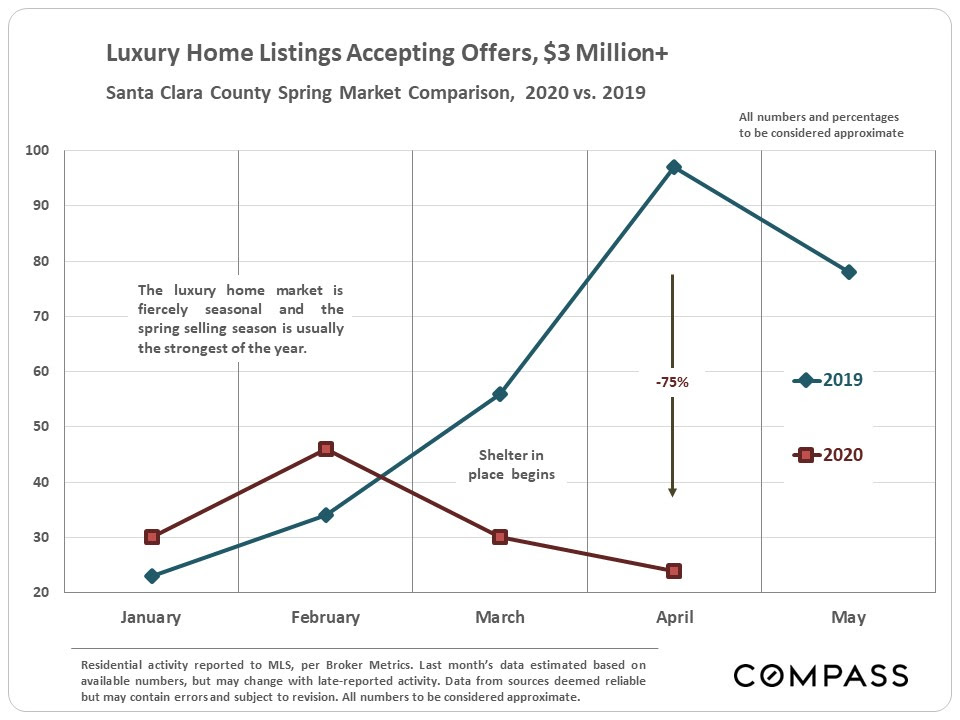
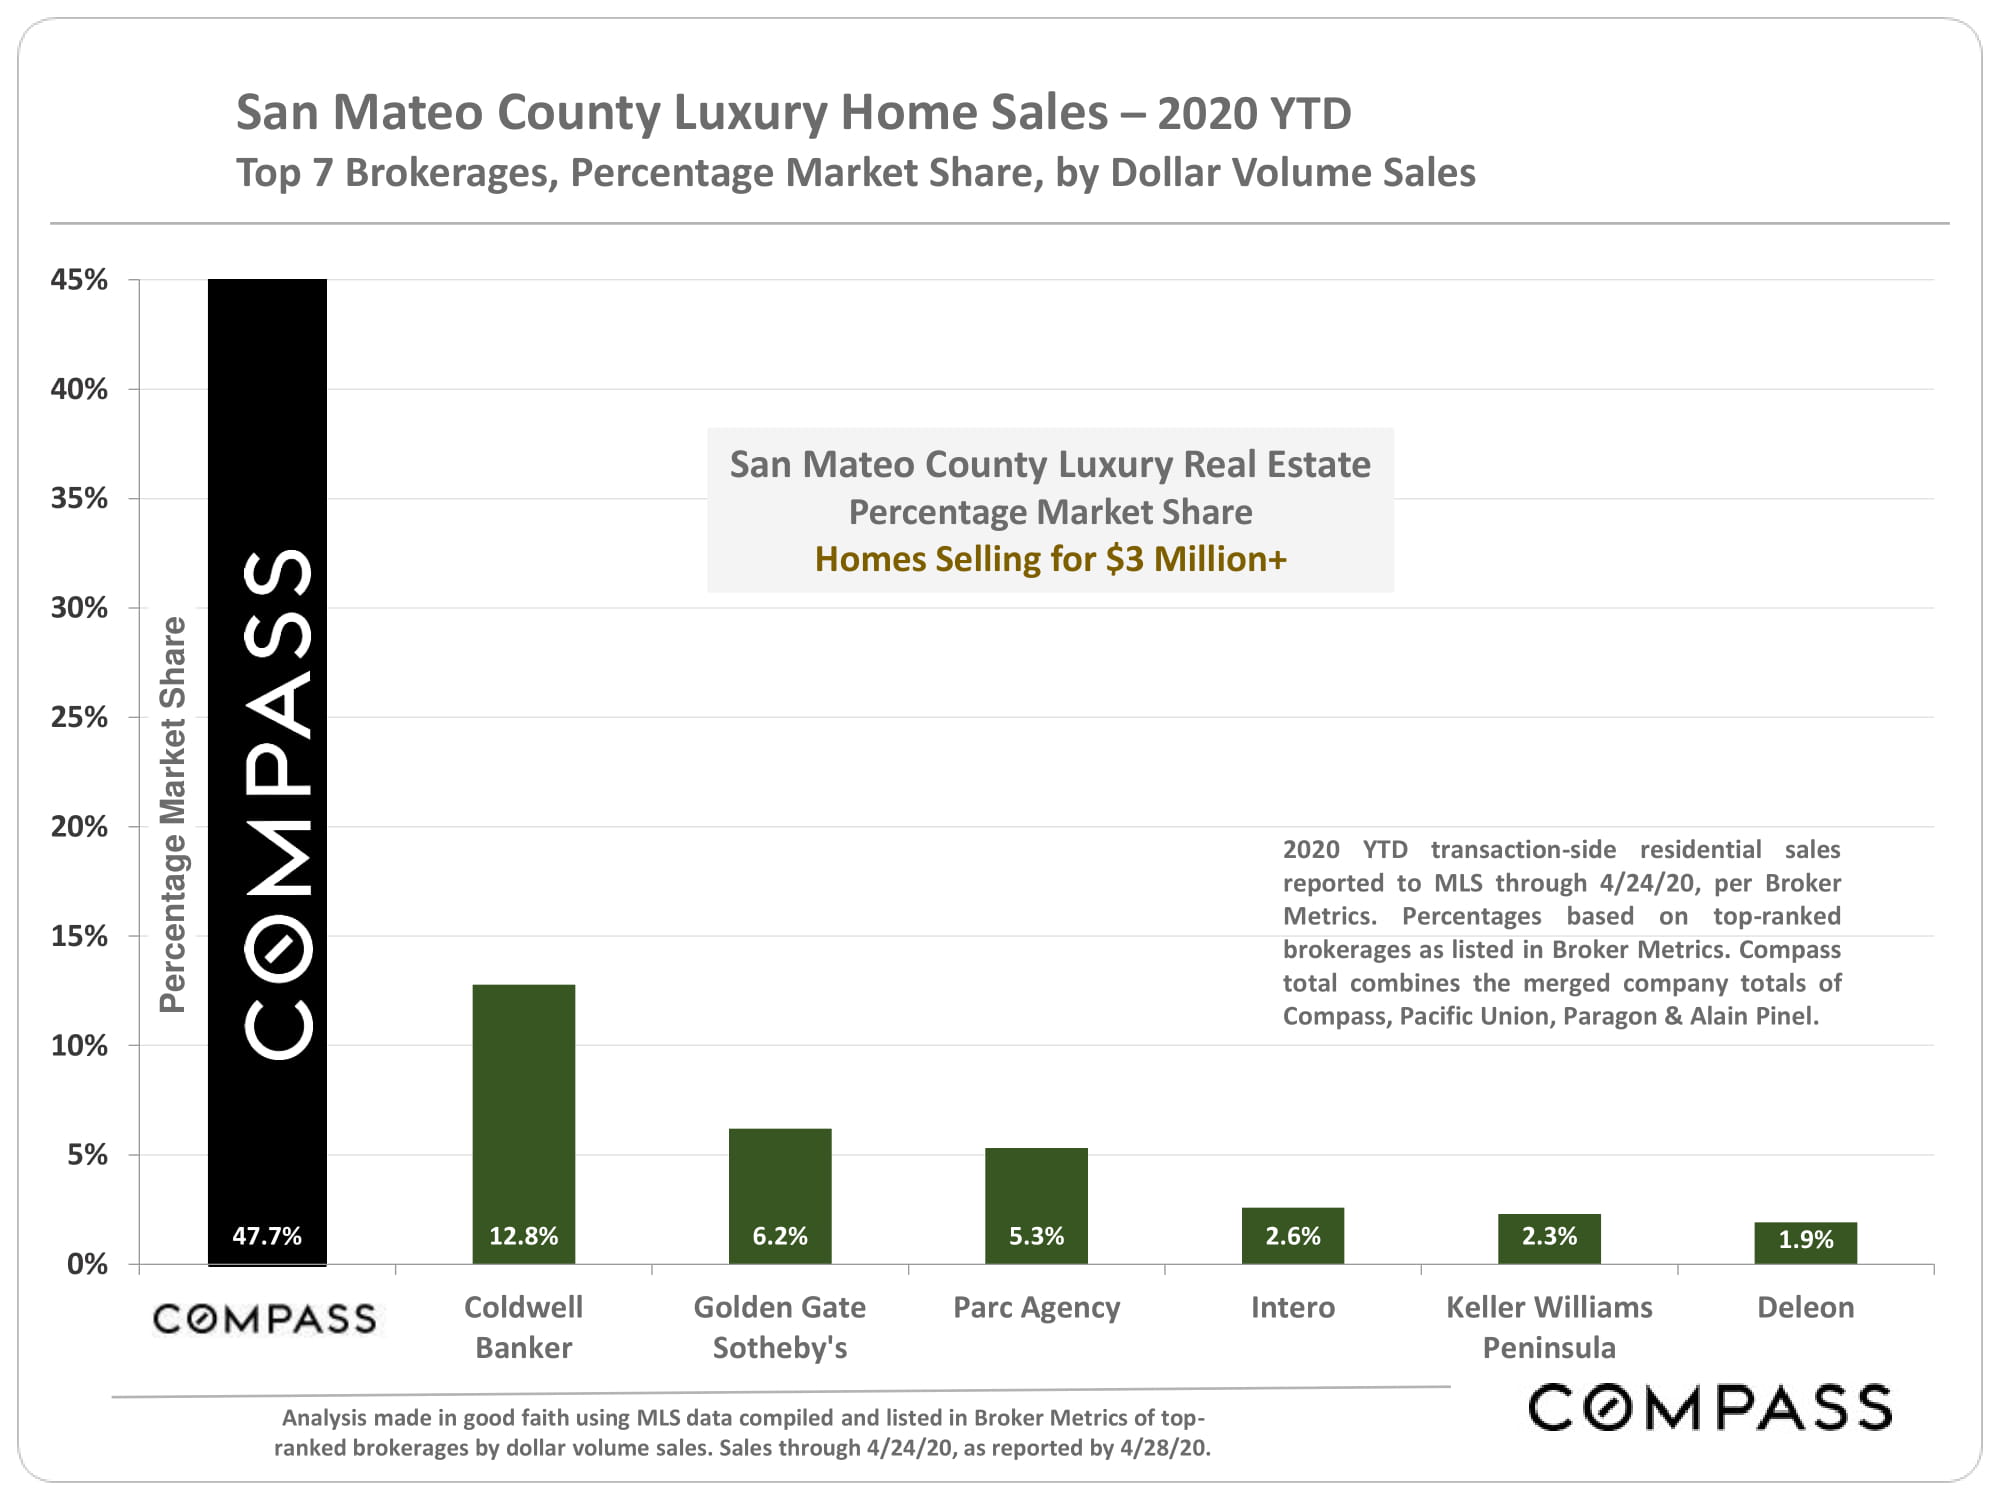
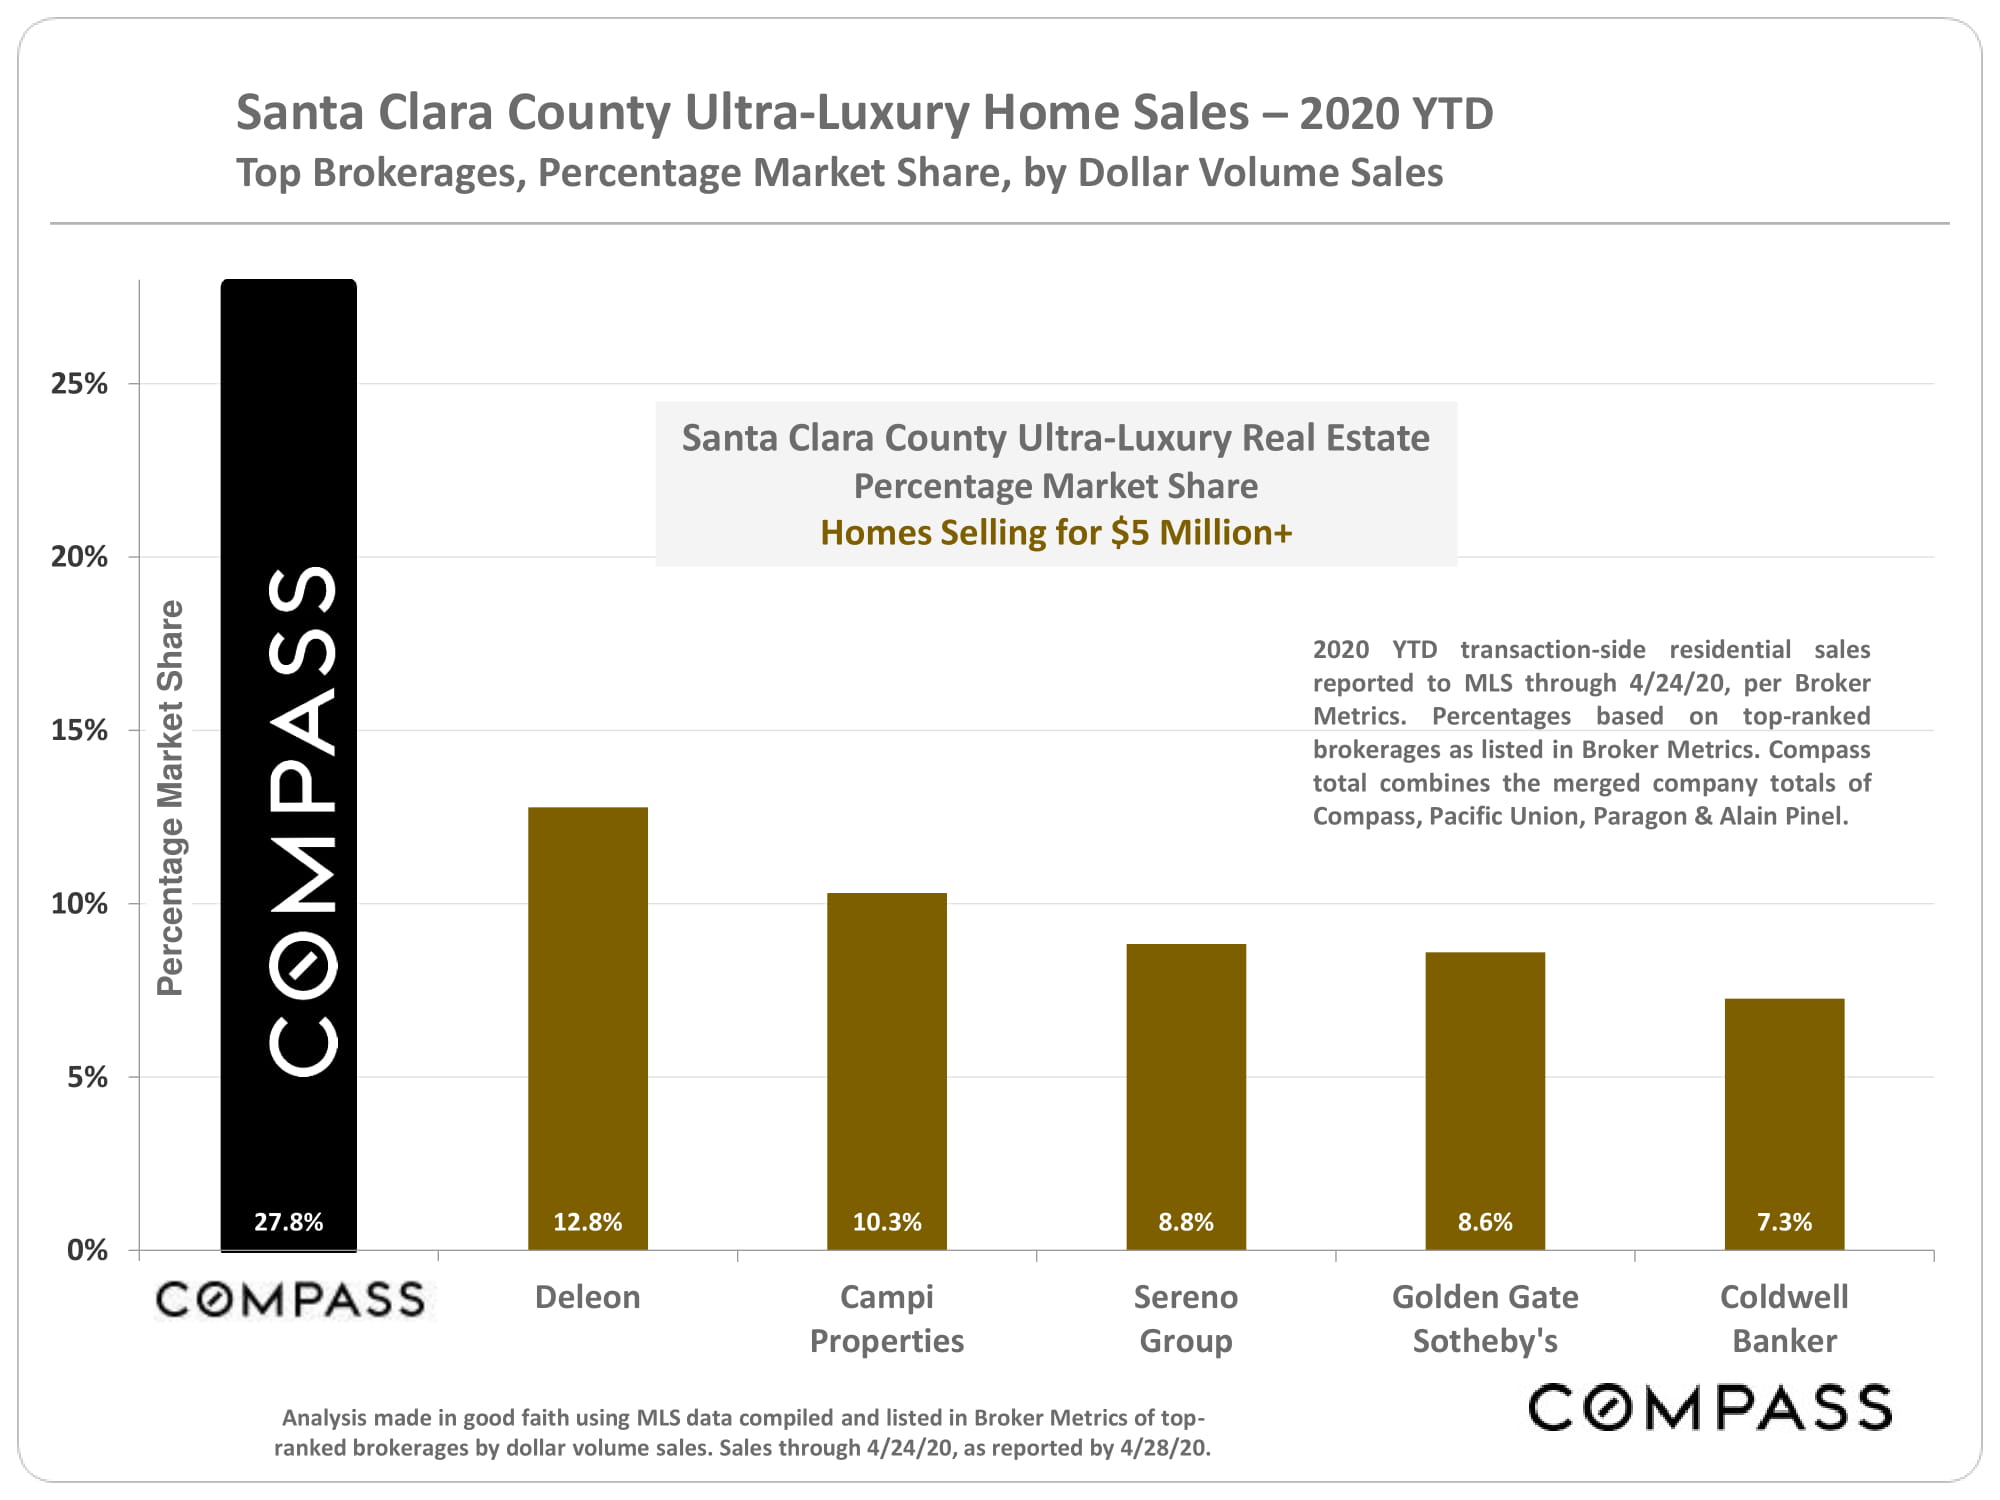
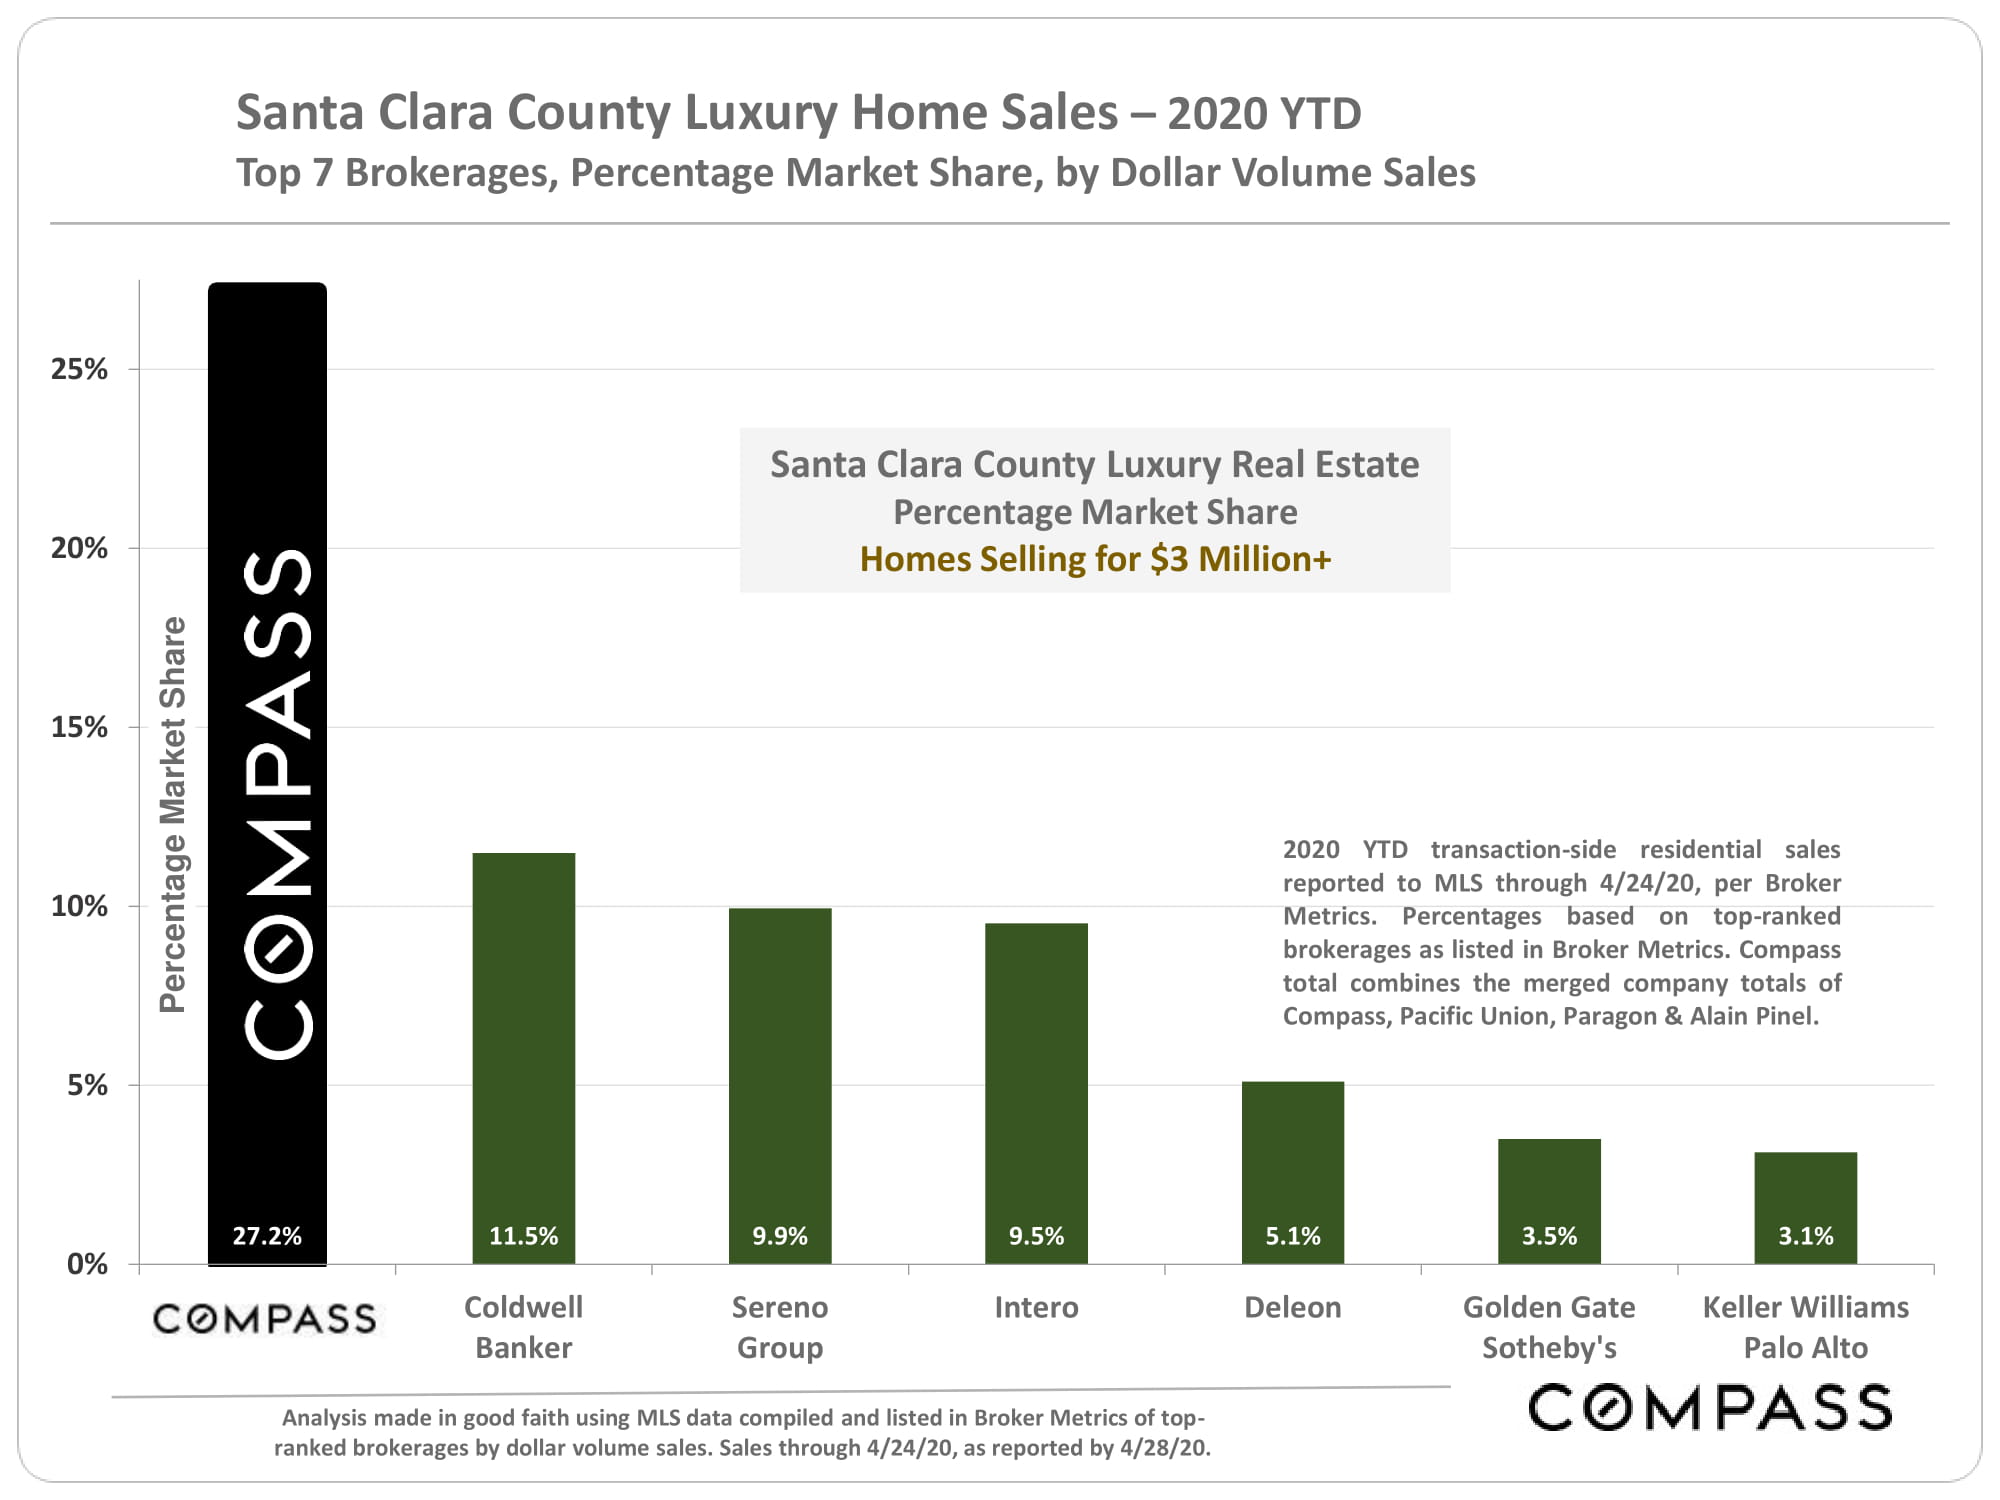
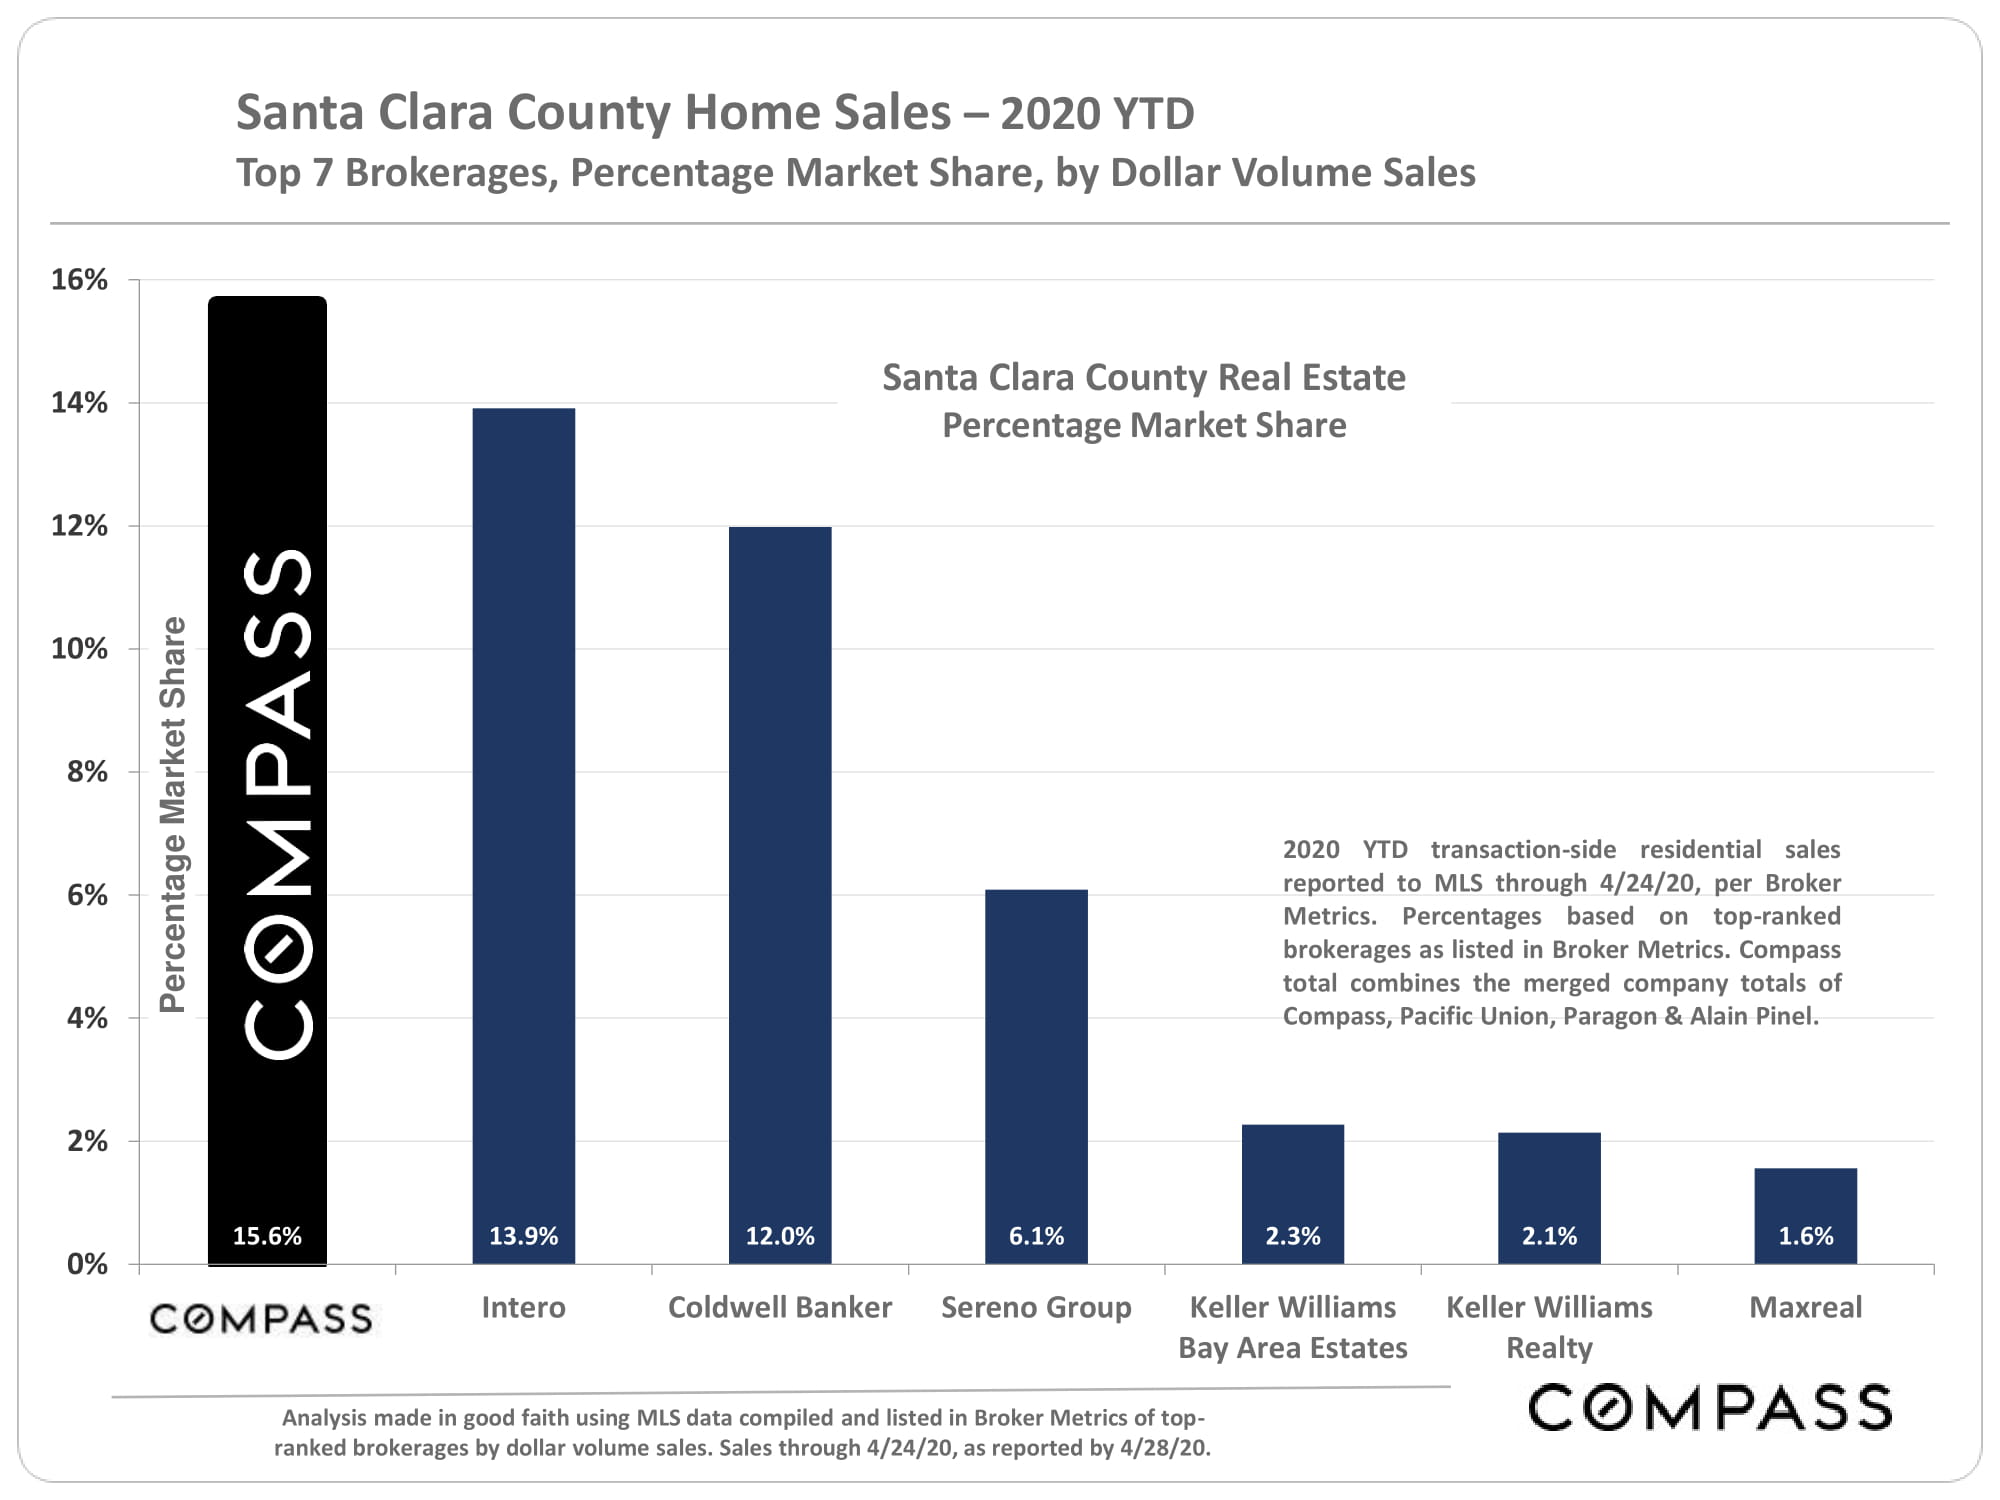
Year-over-Year Changes in Luxury Home Markets
Mortgage Interest Rates
Unemployment 
We are not going to review the economic news already extensively covered in the media, except for this stark illustration of the unparalleled rise in unemployment. How quickly this horrifying trend can be reversed will probably be the single largest factor behind an economic recovery (after the discovery of a vaccine).

Source: Compass

It is impossible to know how median and average value statistics apply to any particular home without a specific comparative market analysis. Many factors affect sales prices besides neighborhood/ bedroom count: quality of location within the neighborhood, condition, size,architecture,views, amenities,parking,outdoor space, etc.

These analyses were made in good faith with data from sources deemed reliable, but may contain errors and are subject to revision. It is not our intent to convince you of a particular position,but to attempt to provide straightforward data and analysis, so you can make your own informed decisions. Median and average statistics are enormous generalities: There are hundreds of different markets in San Francisco and the Bay Area, each with its own unique dynamics. Median prices and average dollar per square foot values can be and often are affected by other factors besides changes in fair market value. Longer term trends are much more meaningful than short-term.

Compass is a real estate broker licensed by the State of California, DRE 01527235. Equal Housing Opportunity. This report has been prepared solely for information purposes. The information herein is based on or derived from information generally available to the public and/or from sources believed to be reliable. No representation or warranty can be given with respect to the accuracy or completeness of the information. Compass disclaims any and all liability relating to this report, including without limitation any express or implied representations or warranties for statements contained in, and omissions from, the report. Nothing contained herein is intended to be or should be read as any regulatory, legal, tax, accounting or other advice and Compass does not provide such advice. All opinions are subject to change without notice. Compass makes no representation regarding the accuracy of any statements regarding any references to the laws, statutes or regulations of any state are those of the author(s). Past performance is no guarantee of future results.

Santa Clara County Real Estate 2020 vs 2019 Spring Market Comparisons

Since mid-March, shelter-in-place ca used steep drops in activity across the board in what is typically the busiest selling season of the year. However, activity has been picking up since bottoming out in late March/early April, and will presumably continue to increase with the easing of both shelter-in-place and property-showing rules. So far, median house prices have seen no declines -in fact, the year has seen substantial year-over-year increases, though median condo prices have dropped. (A fair proportion of the sales behind April median sales prices still reflects offers accepted prior to shelter in place.) Interest rates hit a new historic low in the last week of April.

MLS reported data, per Broker Metrics. Last month’s data estimated using available data, and may change with late reported activity. Data from sources deemed reliable but may contain errors and subject to revision. All numbers are approximate.

Source: Compass

It is impossible to know how median and average value statistics apply to any particular home without a specific comparative market analysis. Many factors affect sales prices besides neighborhood/ bedroom count: quality of location within the neighborhood, condition, size, architecture, views, amenities, parking, outdoor space, etc.

These analyses were made in good faith with data from sources deemed reliable, but may contain errors and are subject to revision. It is not our intent to convince you of a particular position, but to attempt to provide straightforward data and analysis, so you can make your own informed decisions. Median and average statistics are enormous generalities: There are hundreds of different markets in San Francisco and the Bay Area, each with its own unique dynamics. Median prices and average dollar per square foot values can be and often are affected by other factors besides changes in fair market value. Longer term trends are much more meaningful than short-term.

Compass is a real estate broker licensed by the State of California, DRE 01527235. Equal Housing Opportunity. This report has been prepared solely for information purposes. The information herein is based on or derived from information generally available to the public and/or from sources believed to be reliable. No representation or warranty can be given with respect to the accuracy or completeness of the information. Compass disclaims any and all liability relating to this report, including without limitation any express or implied representations or warranties for statements contained in, and omissions from, the report. Nothing contained herein is intended to be or should be read as any regulatory, legal, tax, accounting or other advice and Compass does not provide such advice. All opinions are subject to change without notice. Compass makes no representation regarding the accuracy of any statements regarding any references to the laws, statutes or regulations of any state are those of the author(s). Past performance is no guarantee of future results.


San Mateo County Home Sales – January-April 2020

Source: Compass

It is impossible to know how median and average value statistics apply to any particular home without a specific comparative market analysis. Many factors affect sales prices besides neighborhood/ bedroom count: quality of location within the neighborhood, condition, size,architecture,views, amenities,parking,outdoor space, etc.

These analyses were made in good faith with data from sources deemed reliable, but may contain errors and are subject to revision. It is not our intent to convince you of a particular position,but to attempt to provide straightforward data and analysis, so you can make your own informed decisions. Median and average statistics are enormous generalities: There are hundreds of different markets in San Francisco and the Bay Area, each with its own unique dynamics. Median prices and average dollar per square foot values can be and often are affected by other factors besides changes in fair market value. Longer term trends are much more meaningful than short-term.

Compass is a real estate broker licensed by the State of California, DRE 01527235. Equal Housing Opportunity. This report has been prepared solely for information purposes. The information herein is based on or derived from information generally available to the public and/or from sources believed to be reliable. No representation or warranty can be given with respect to the accuracy or completeness of the information. Compass disclaims any and all liability relating to this report, including without limitation any express or implied representations or warranties for statements contained in, and omissions from, the report. Nothing contained herein is intended to be or should be read as any regulatory, legal, tax, accounting or other advice and Compass does not provide such advice. All opinions are subject to change without notice. Compass makes no representation regarding the accuracy of any statements regarding any references to the laws, statutes or regulations of any state are those of the author(s). Past performance is no guarantee of future results.

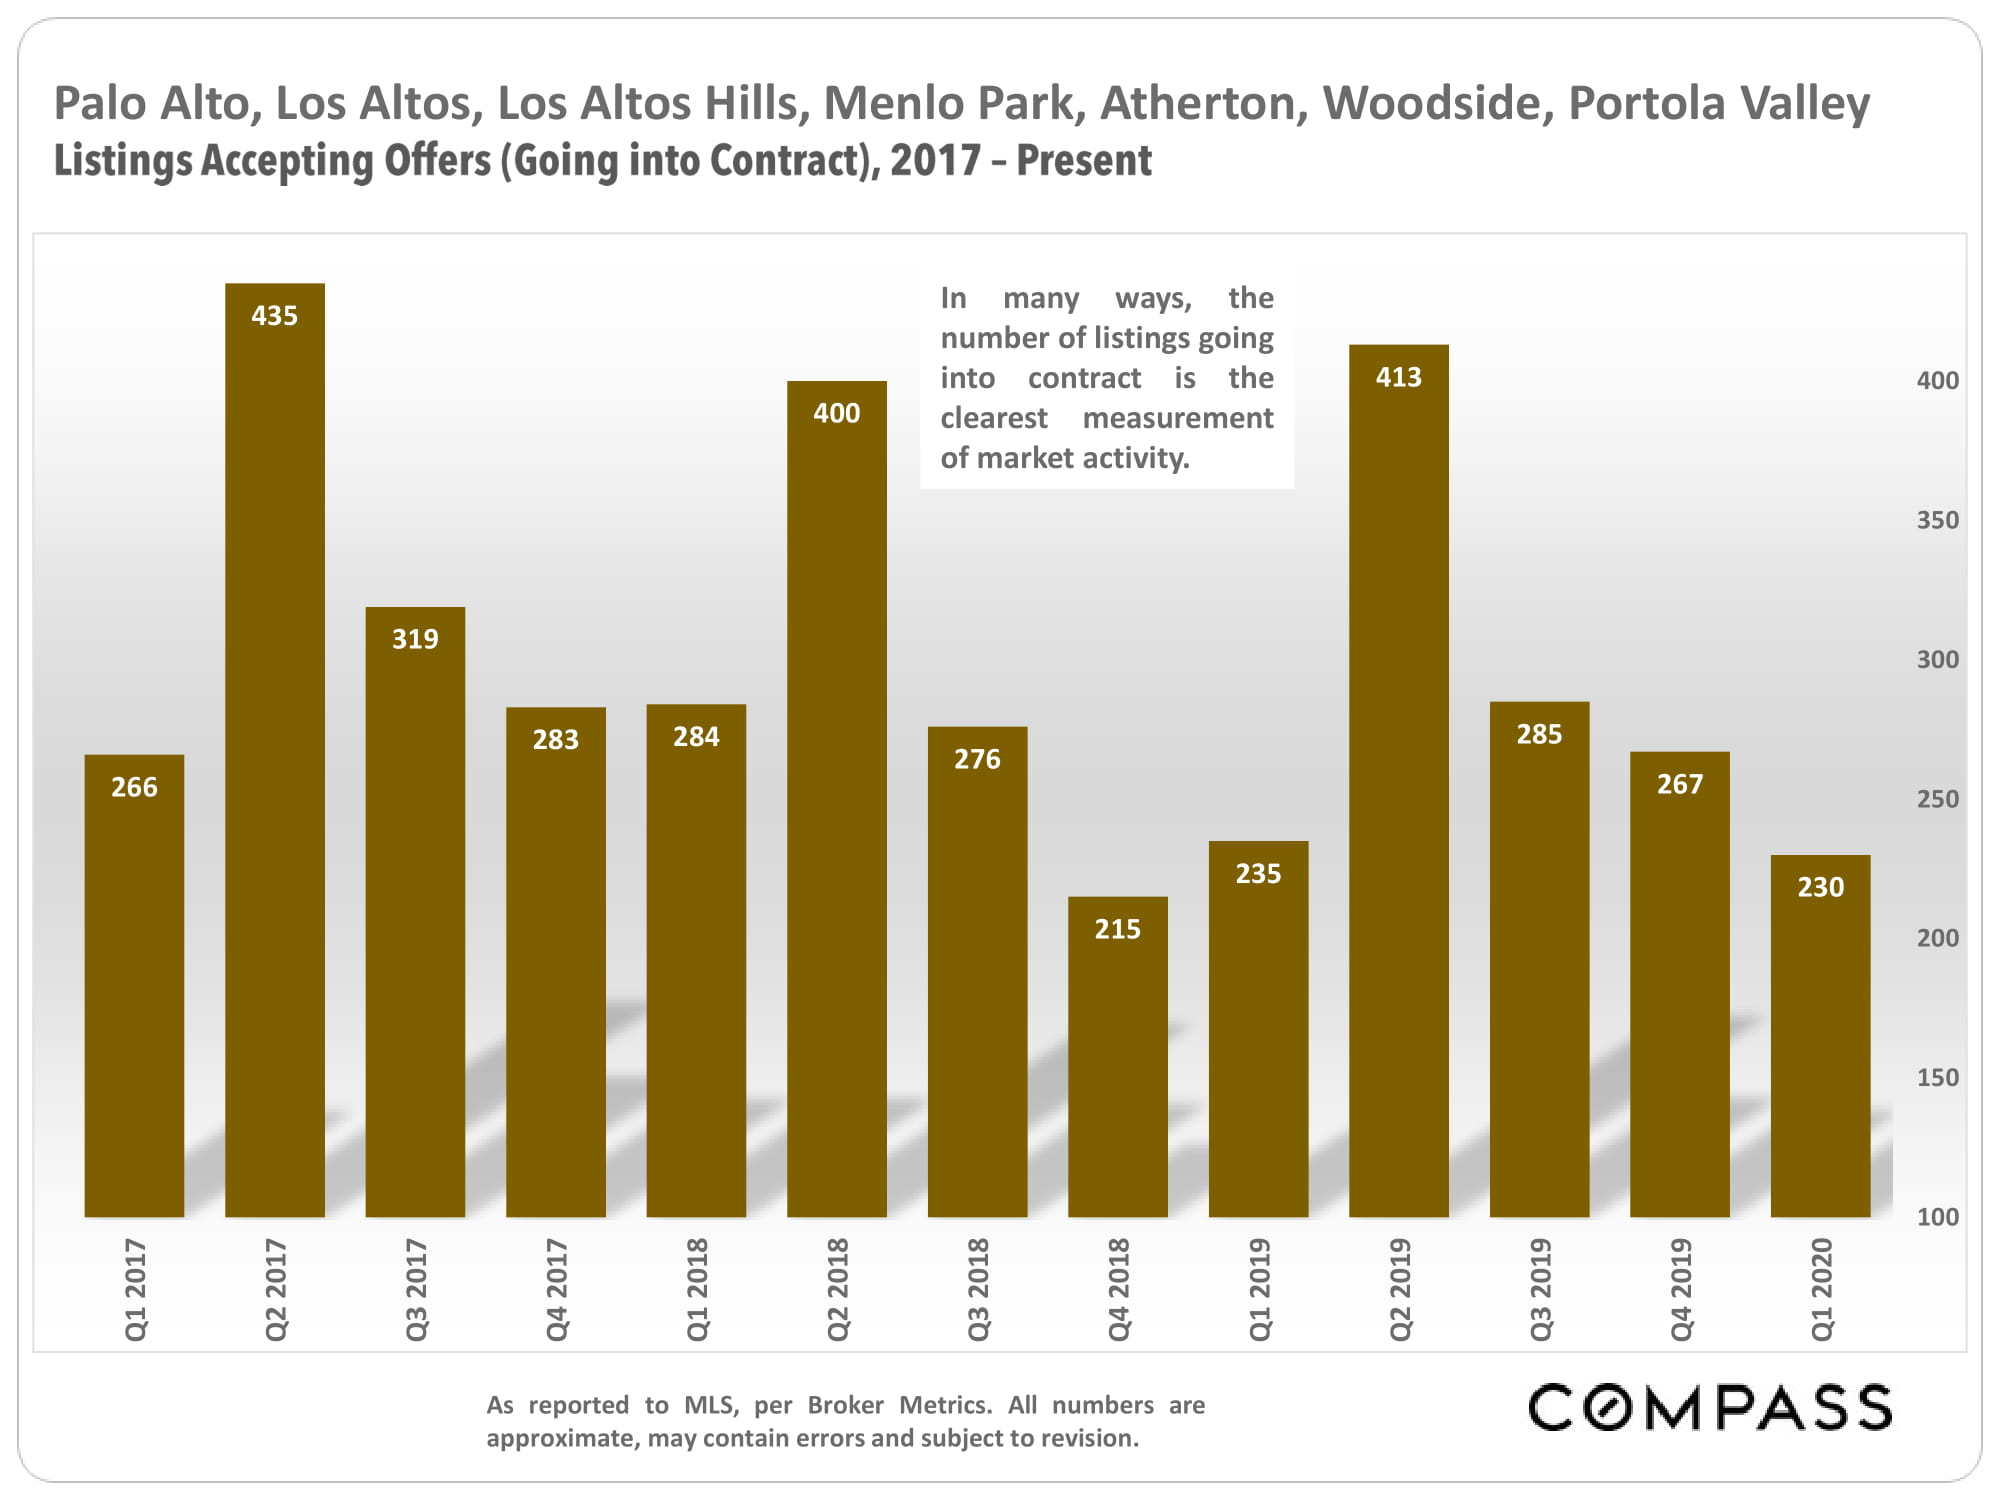
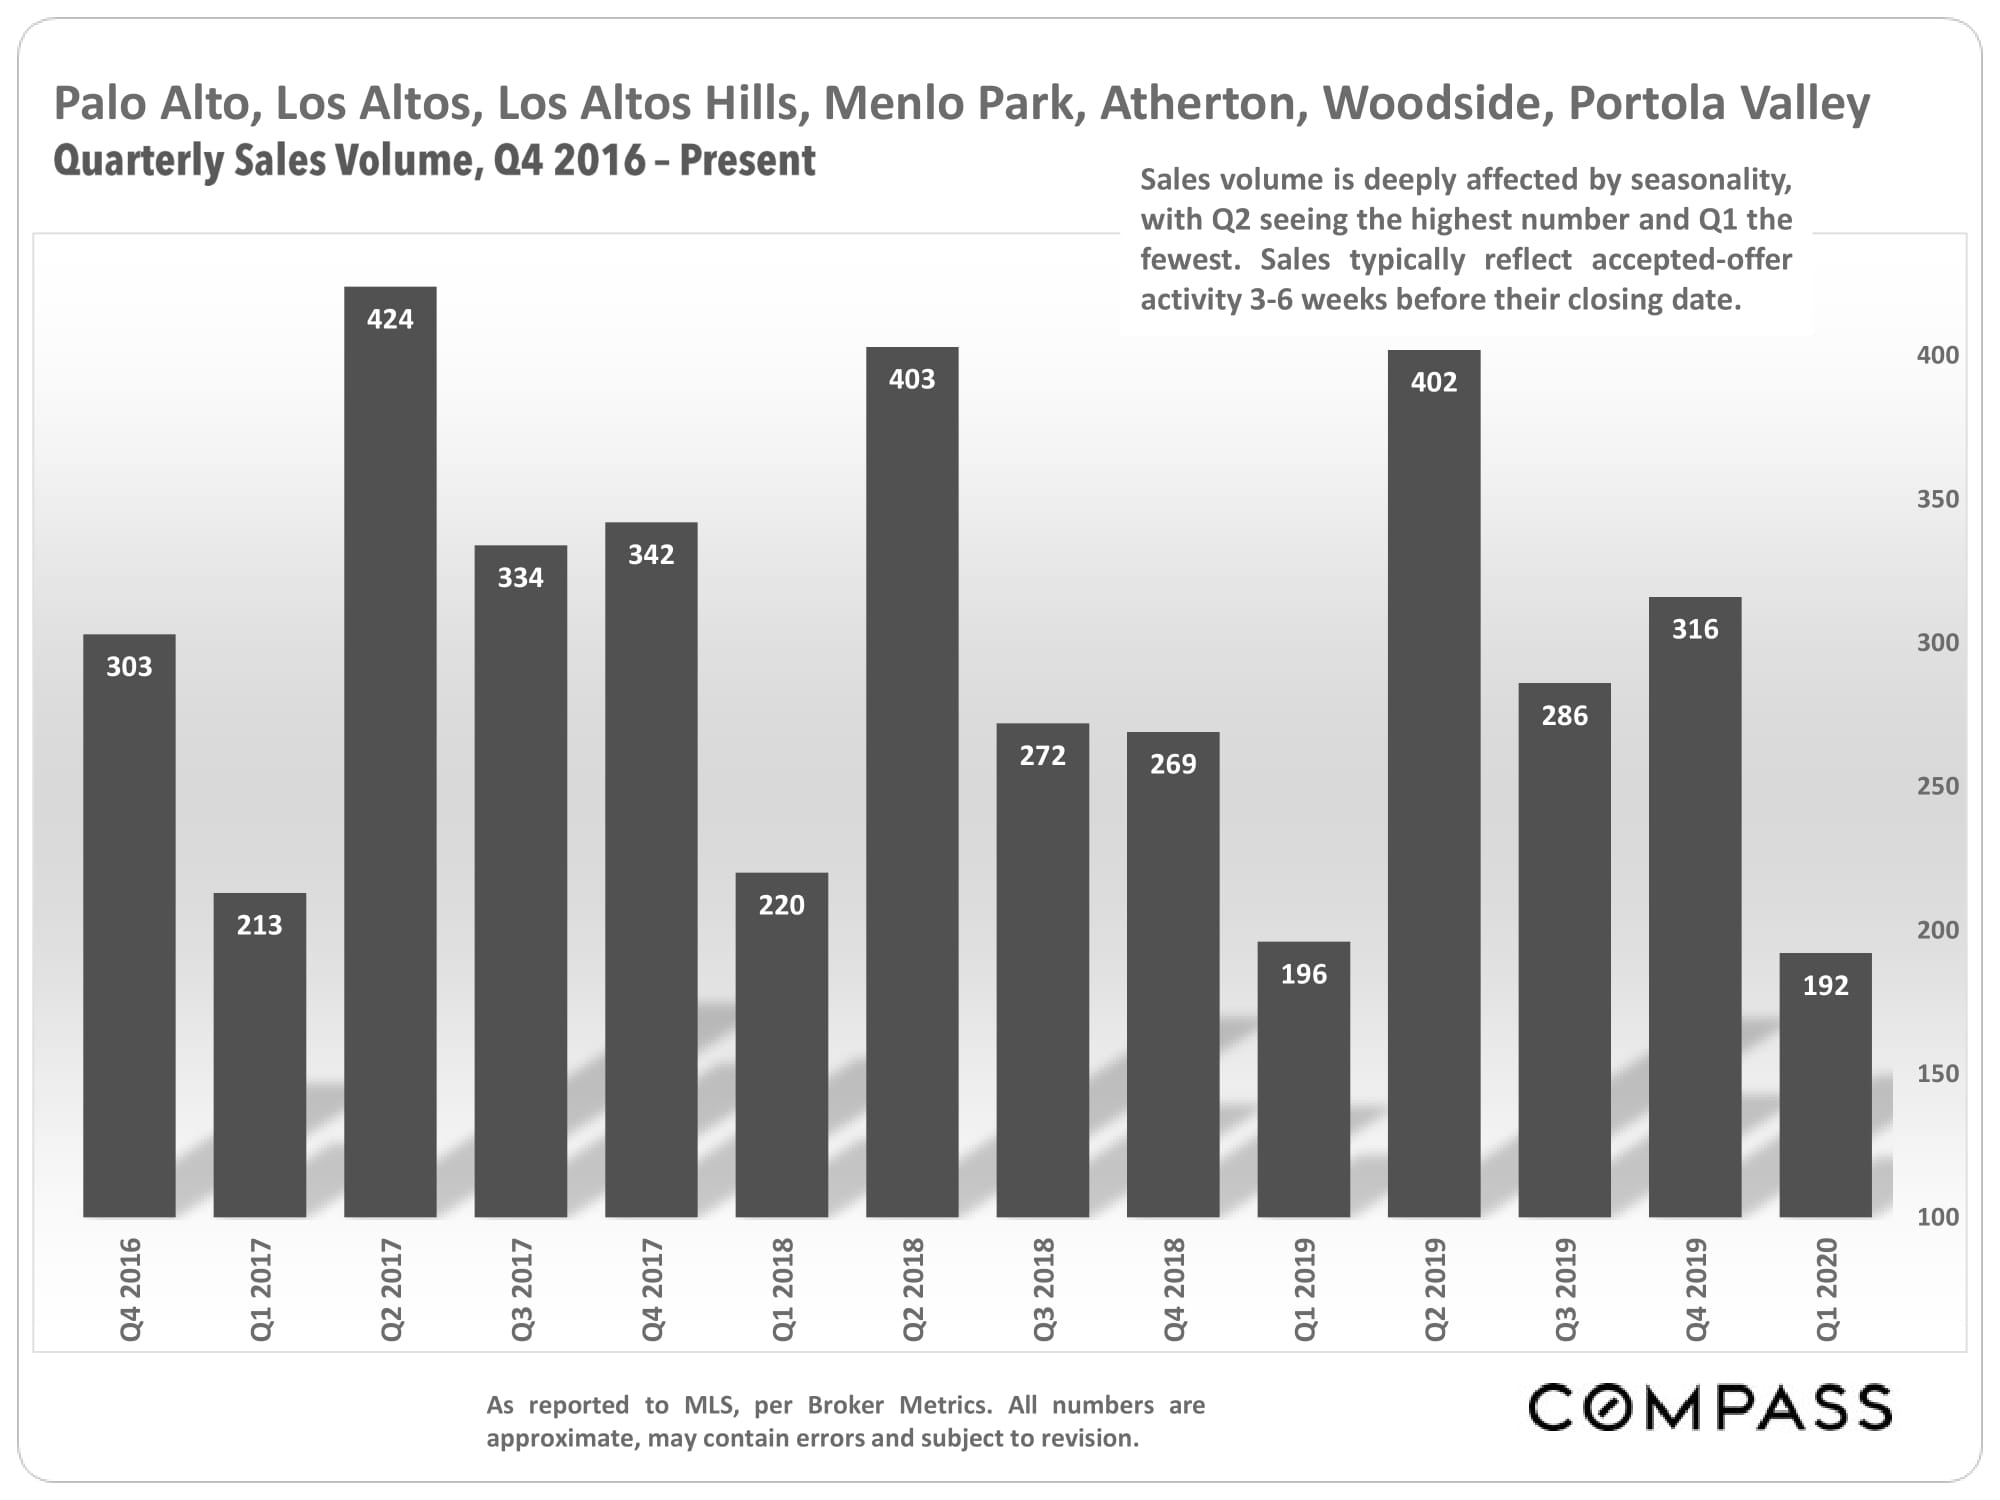
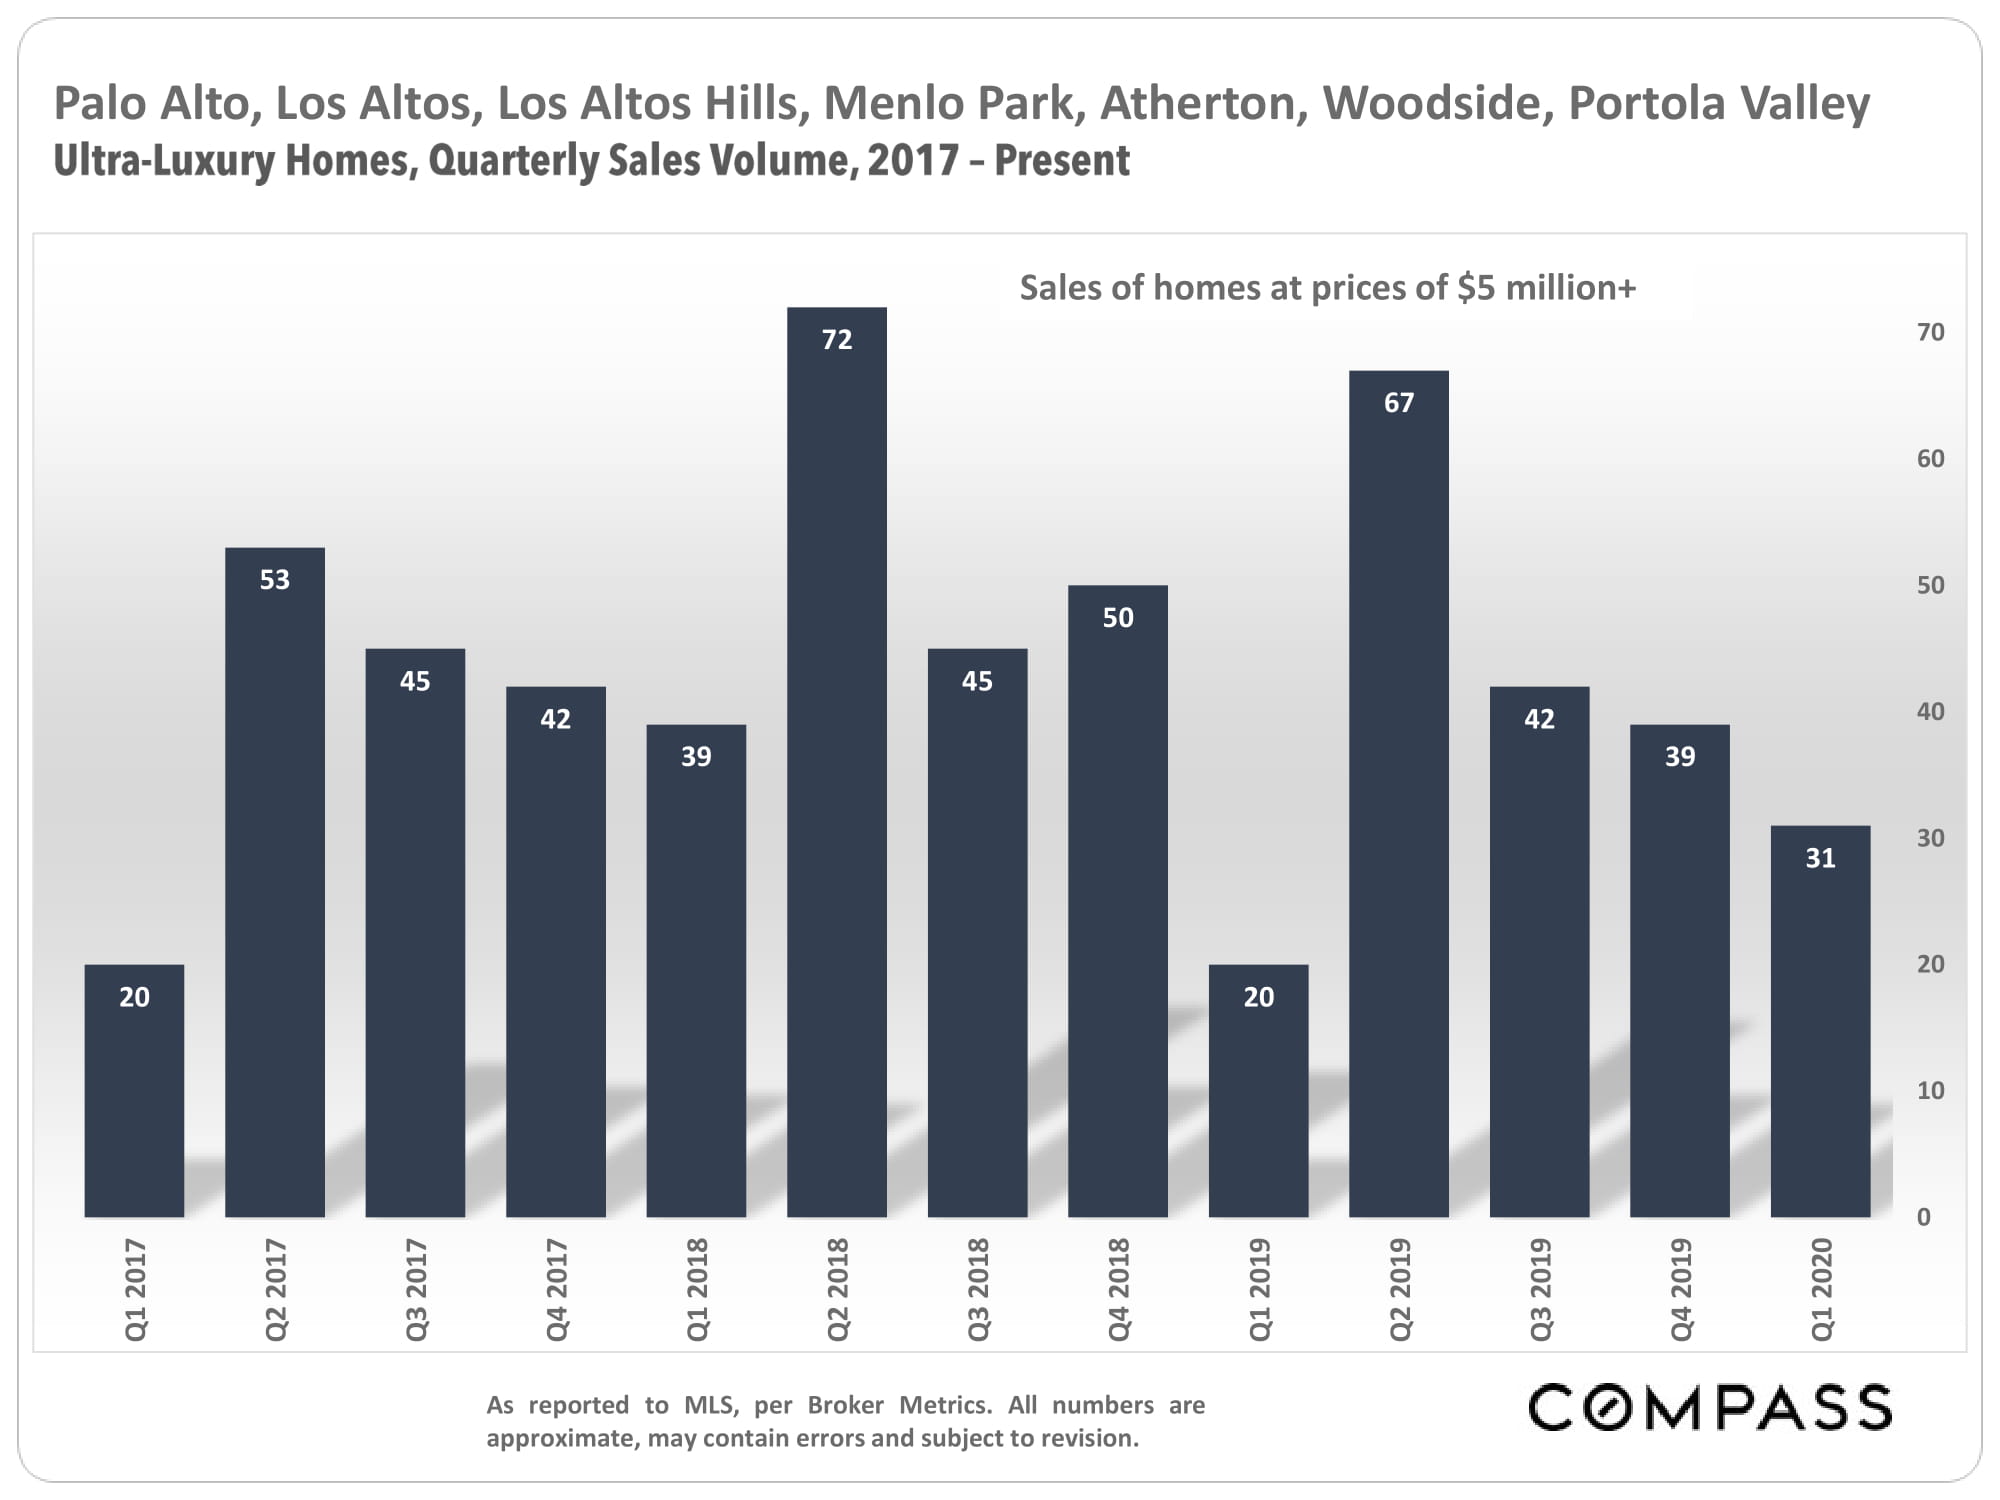
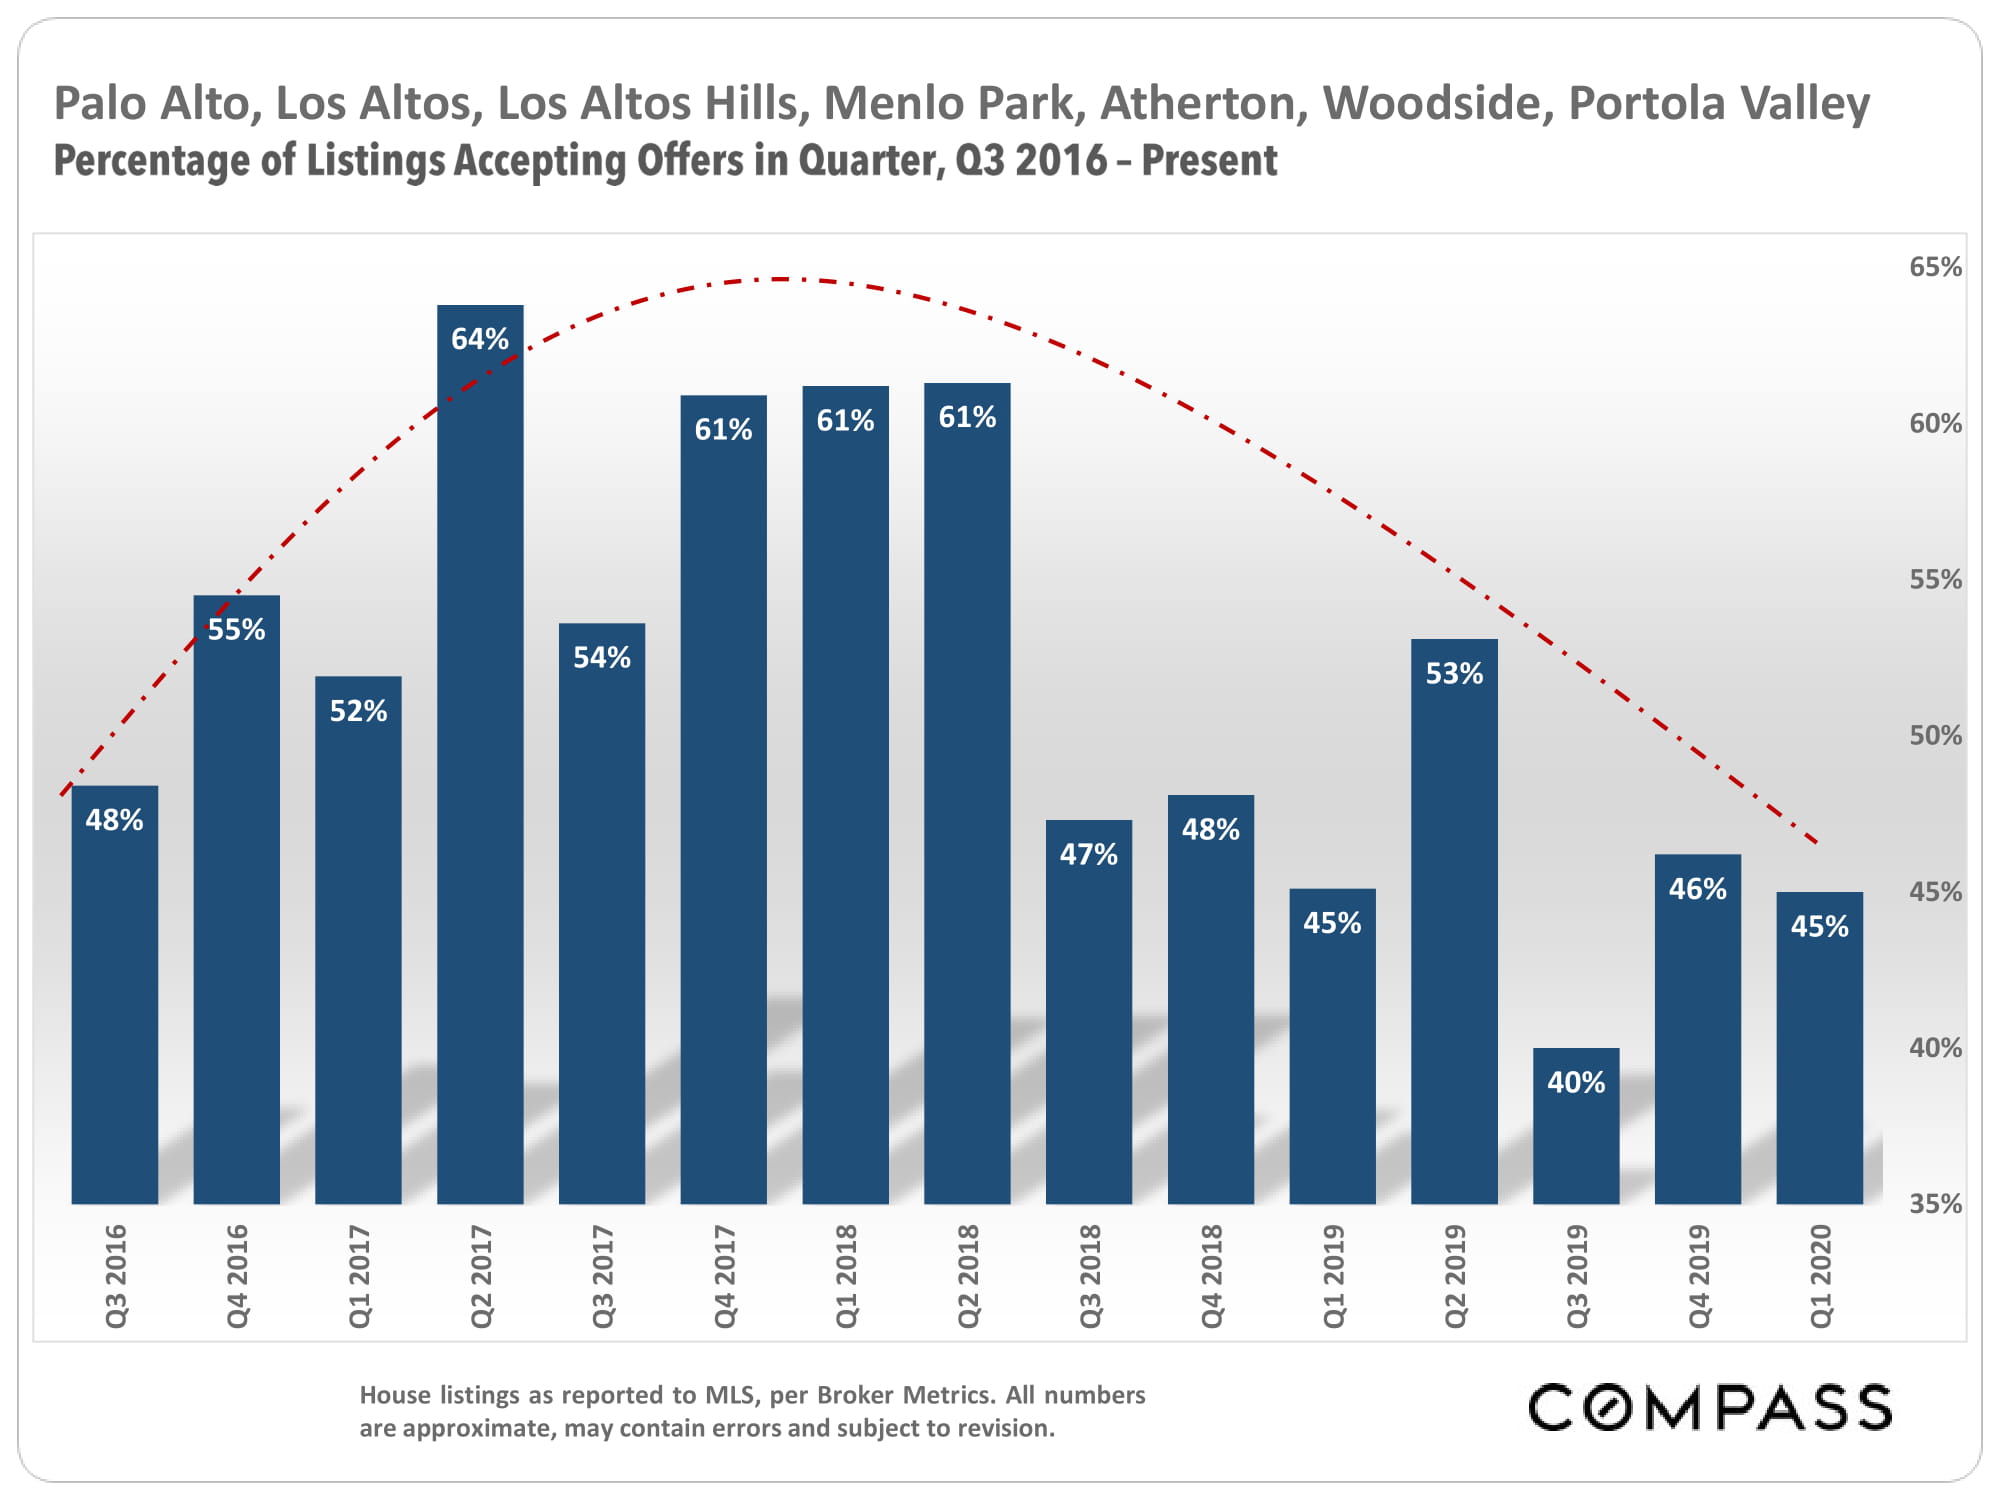
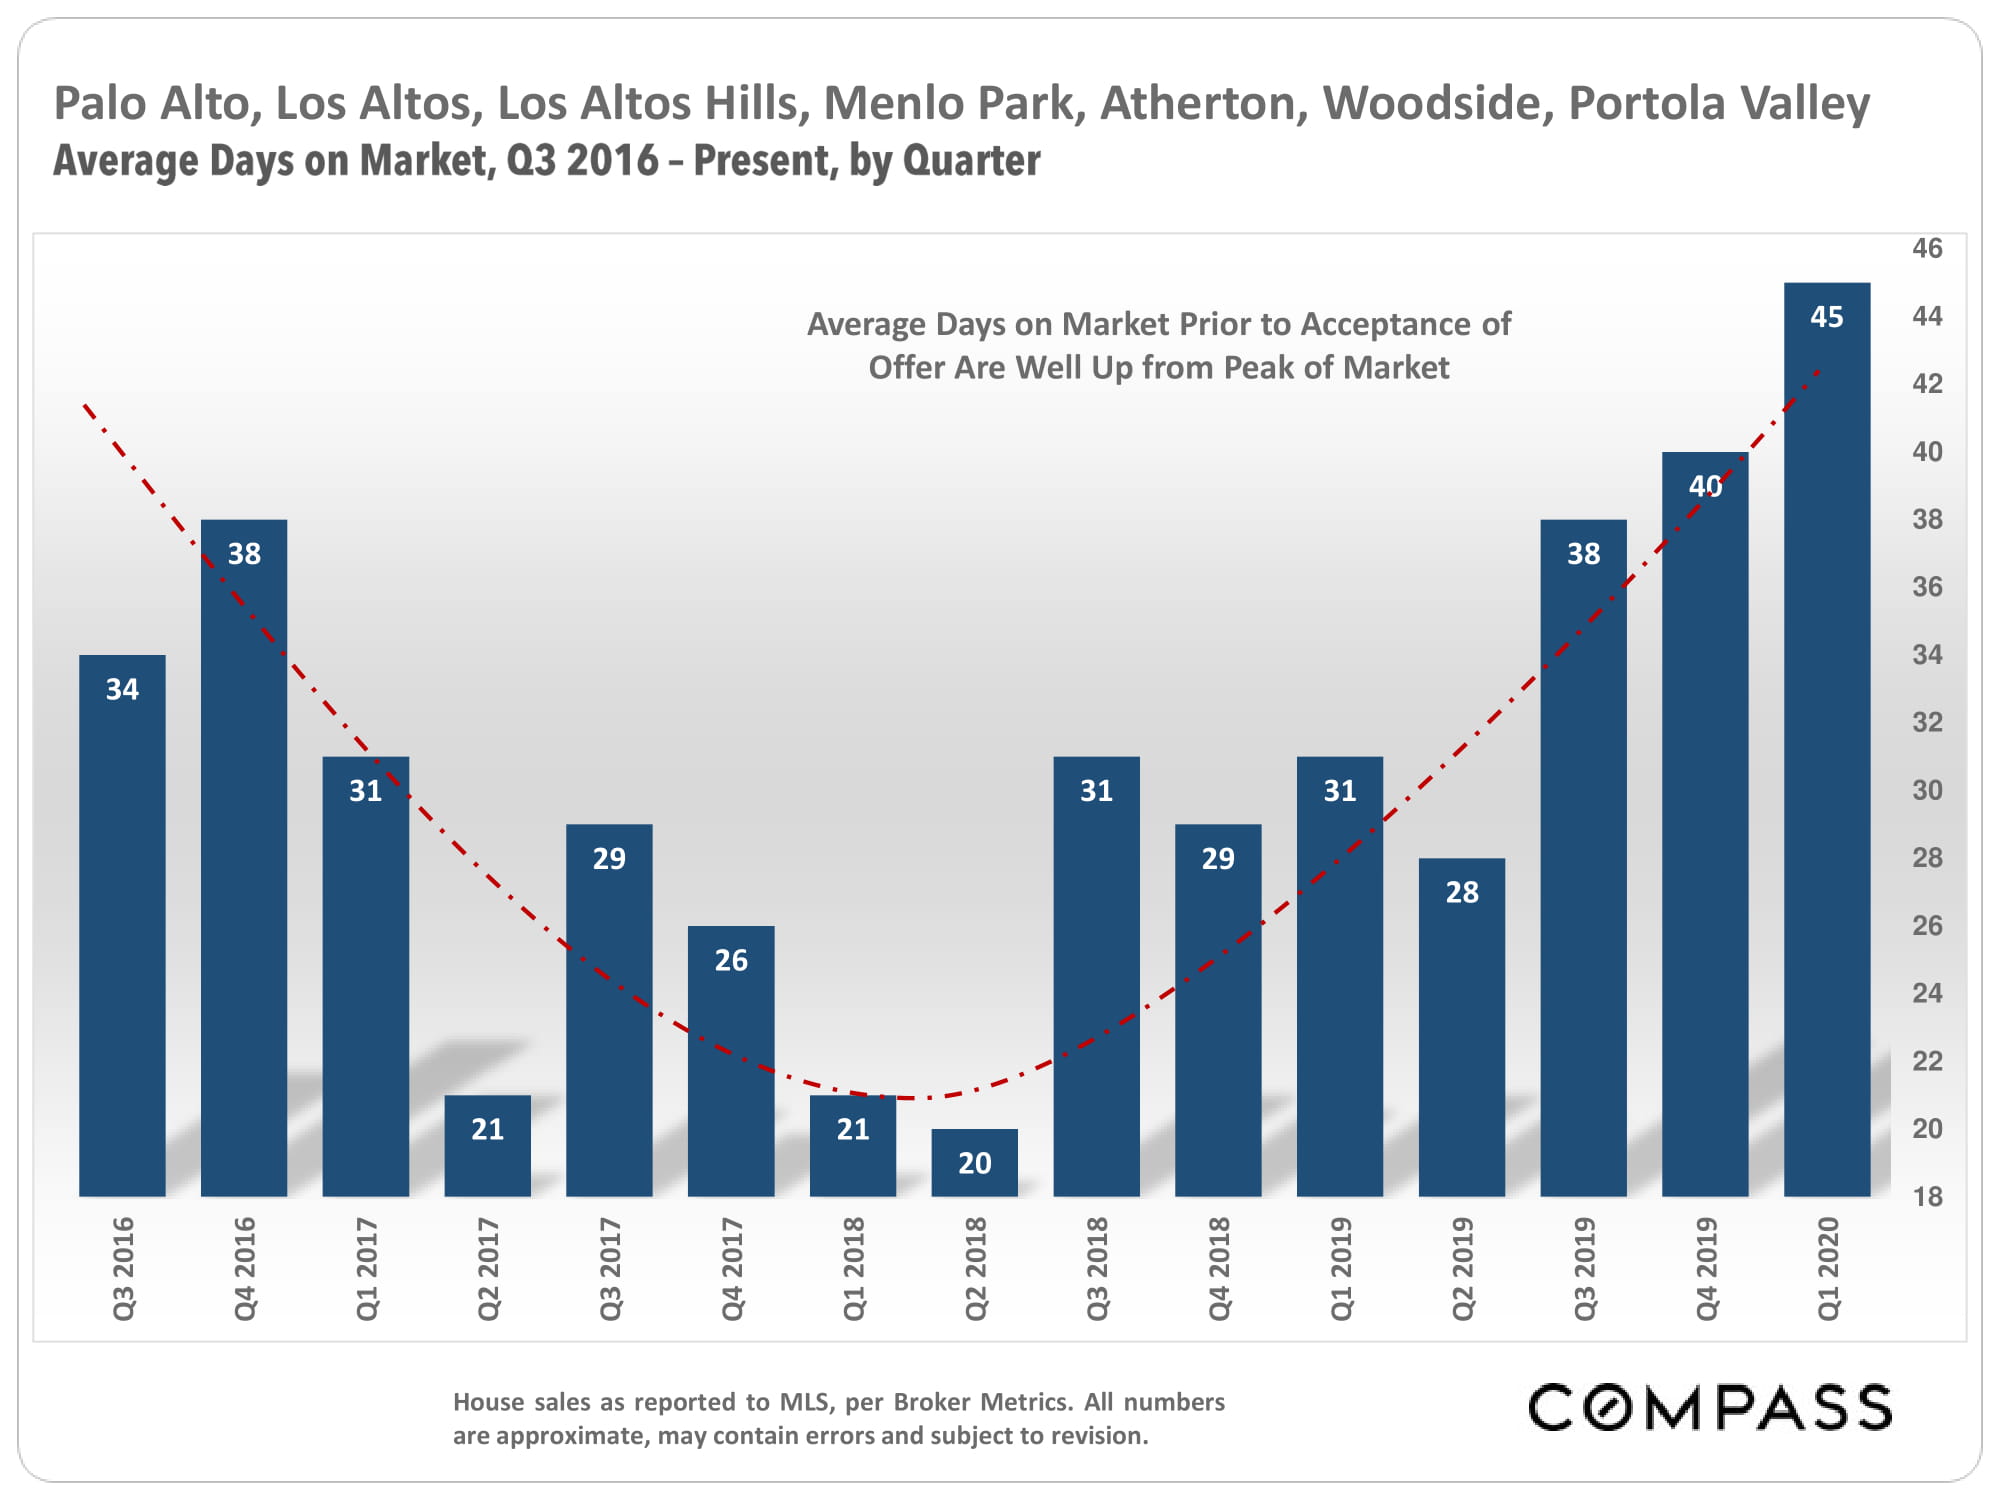
Stanford University Circle of Cities Quarterly, Q1 2020

The Circle of Very Expensive Home Markets Surrounding Stanford University

Palo Alto, Menlo Park, Atherton, Woodside,  Portola Valley, Los Altos & Los Altos Hills

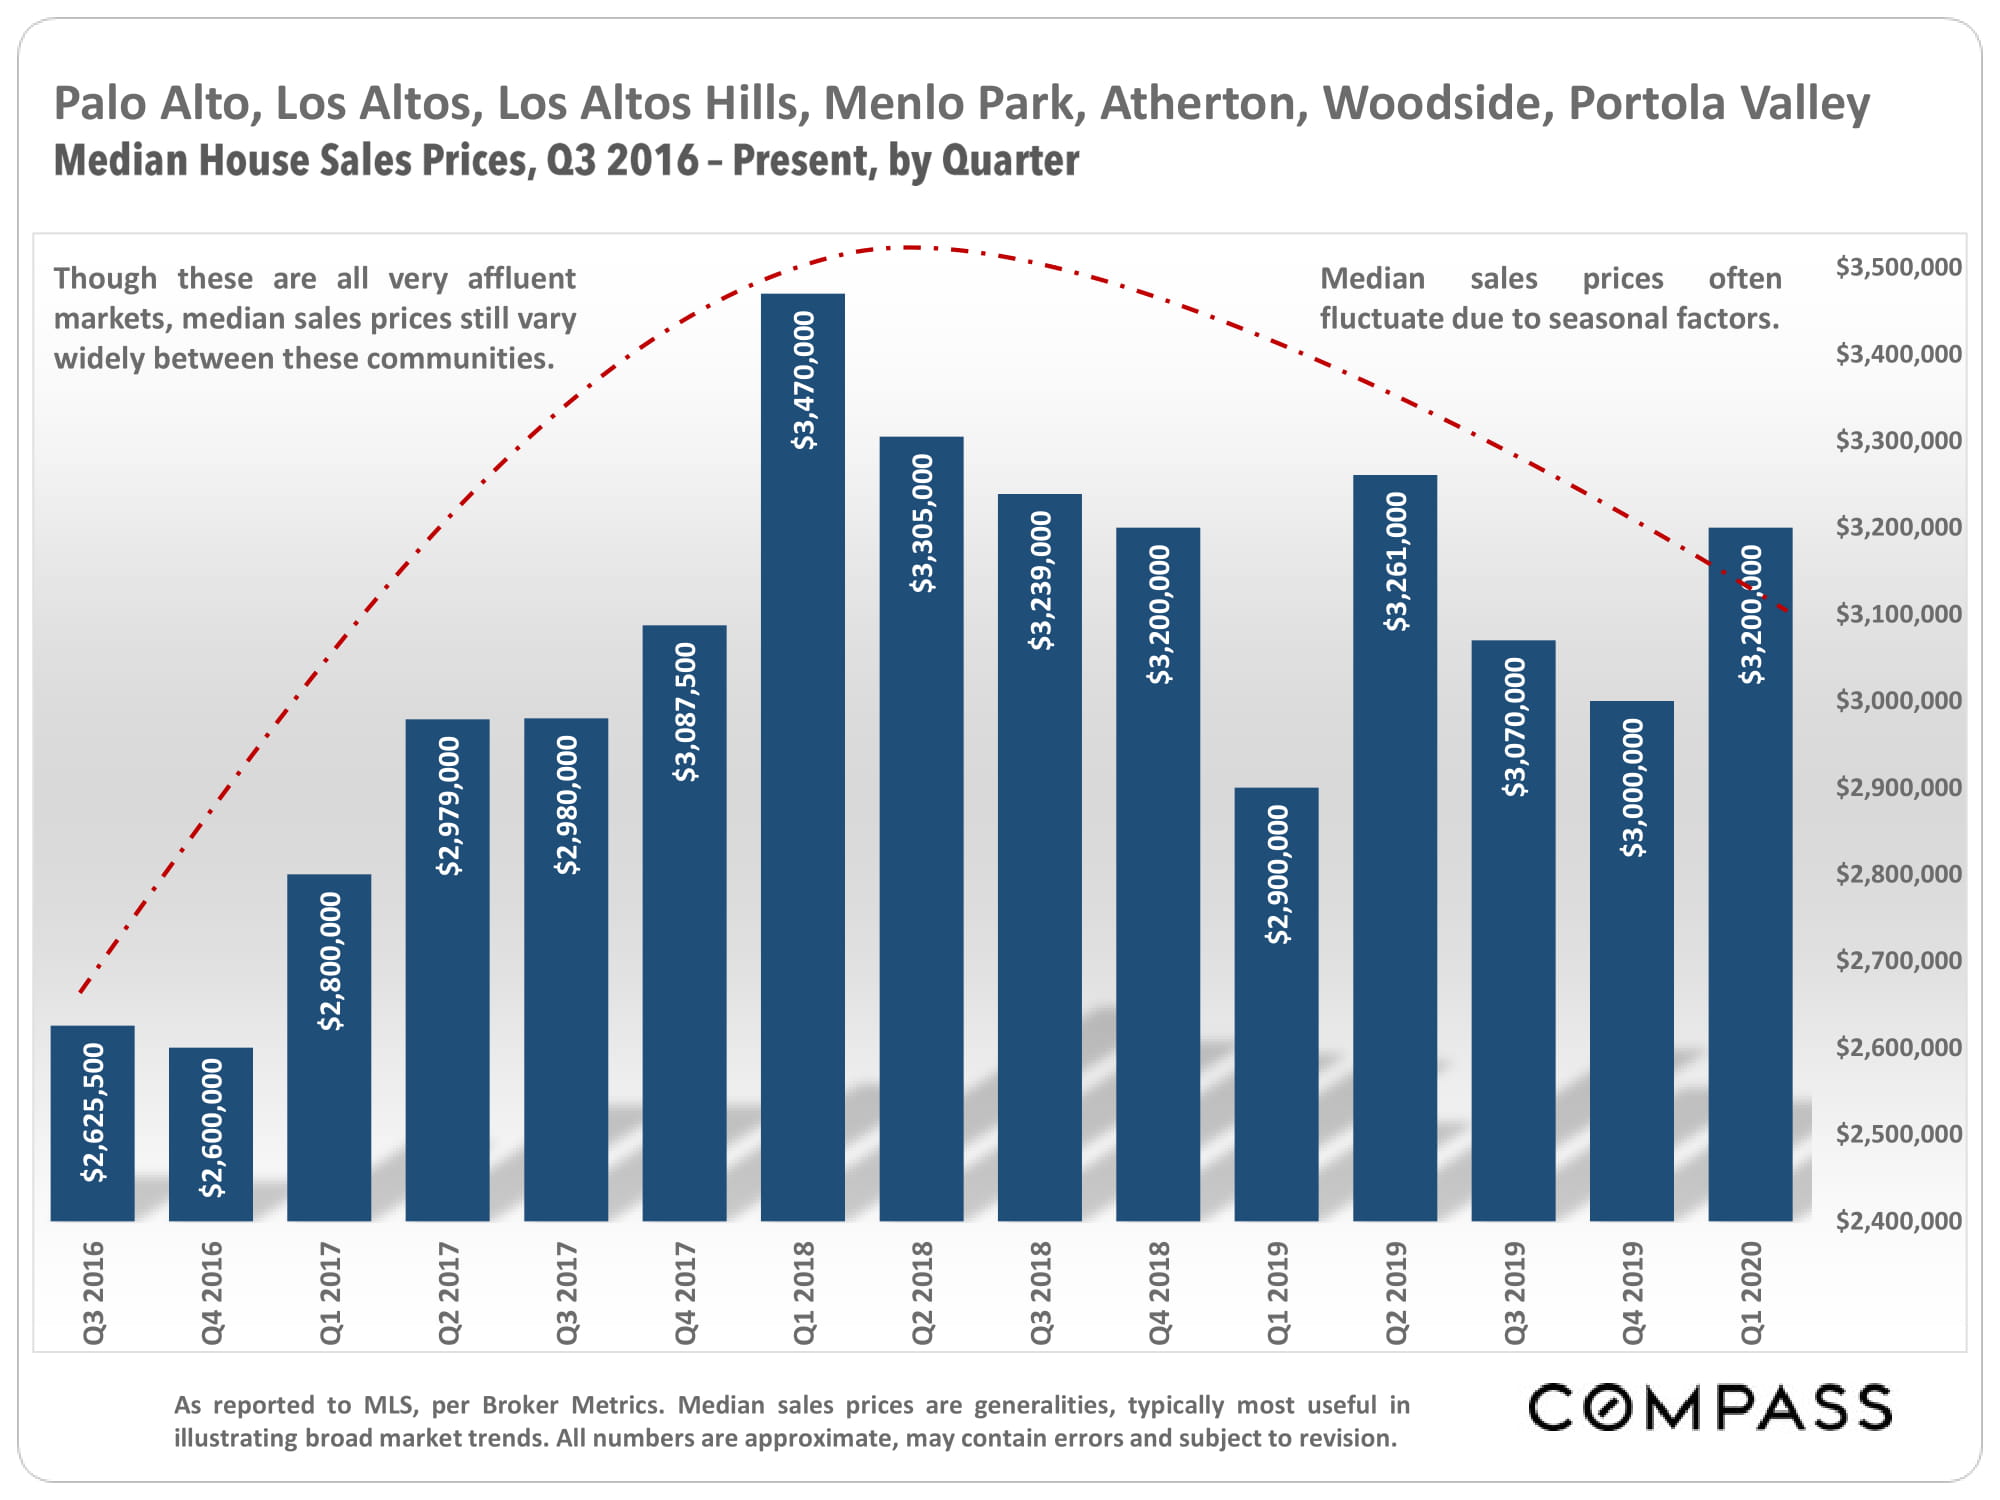
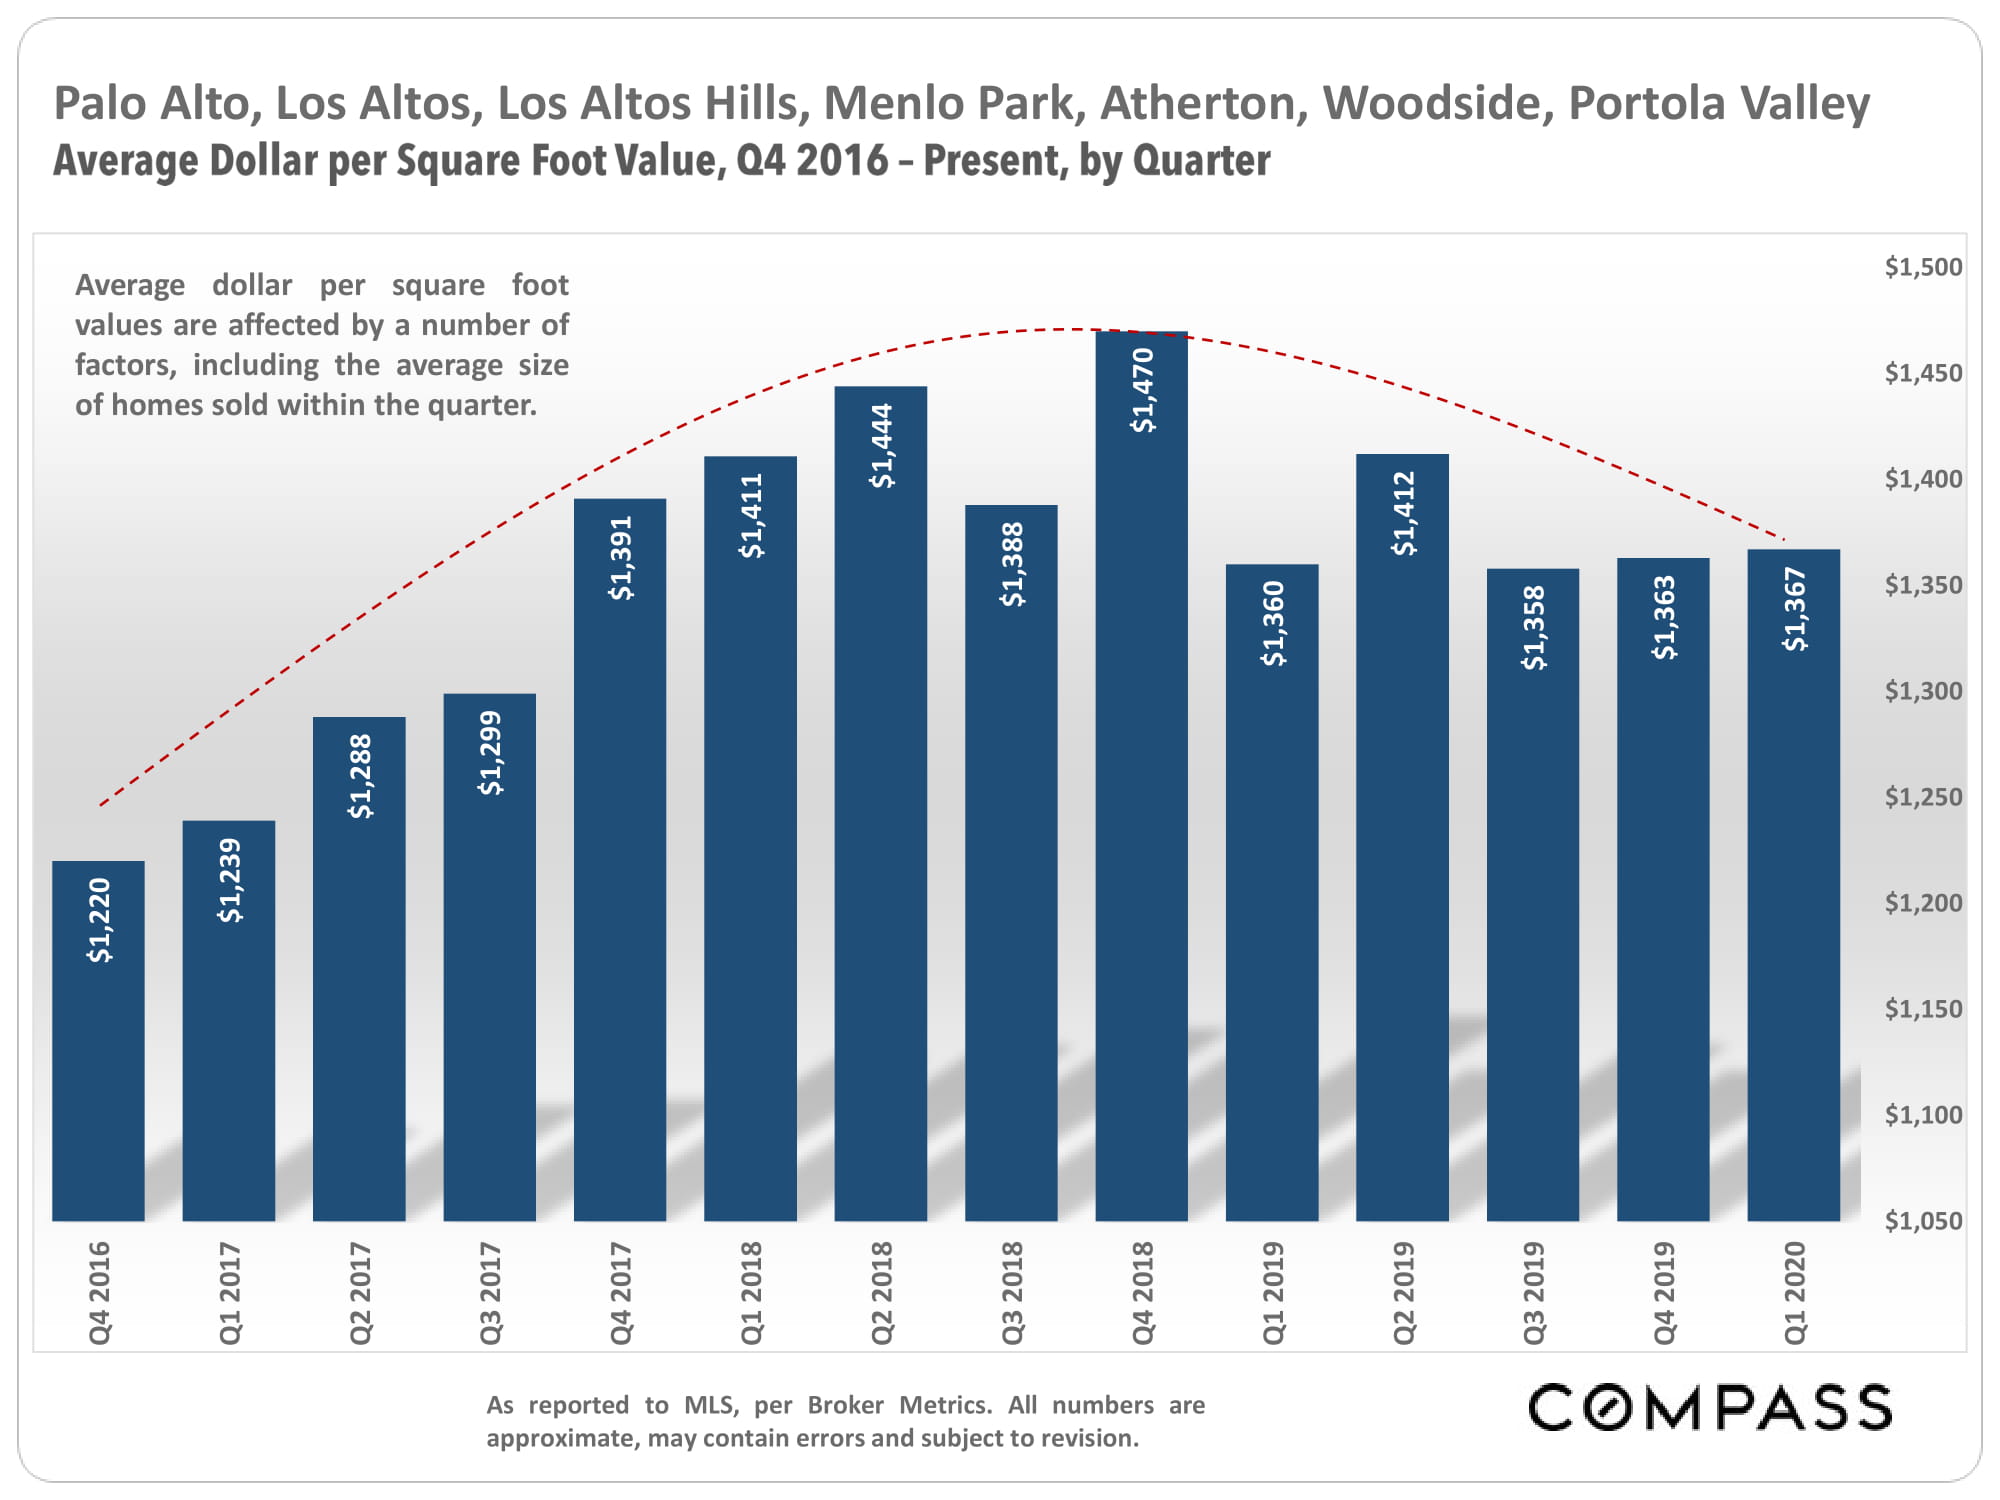
By combining these markets – some of which are relatively small – the statistics reflect a greater body of data, which usually makes the indicators more reliable. However, though these are all very affluent markets, note that median sales prices still vary between these communities, sometimes by millions of dollars. Median sales prices are generalities best used to illustrate broad market trends.

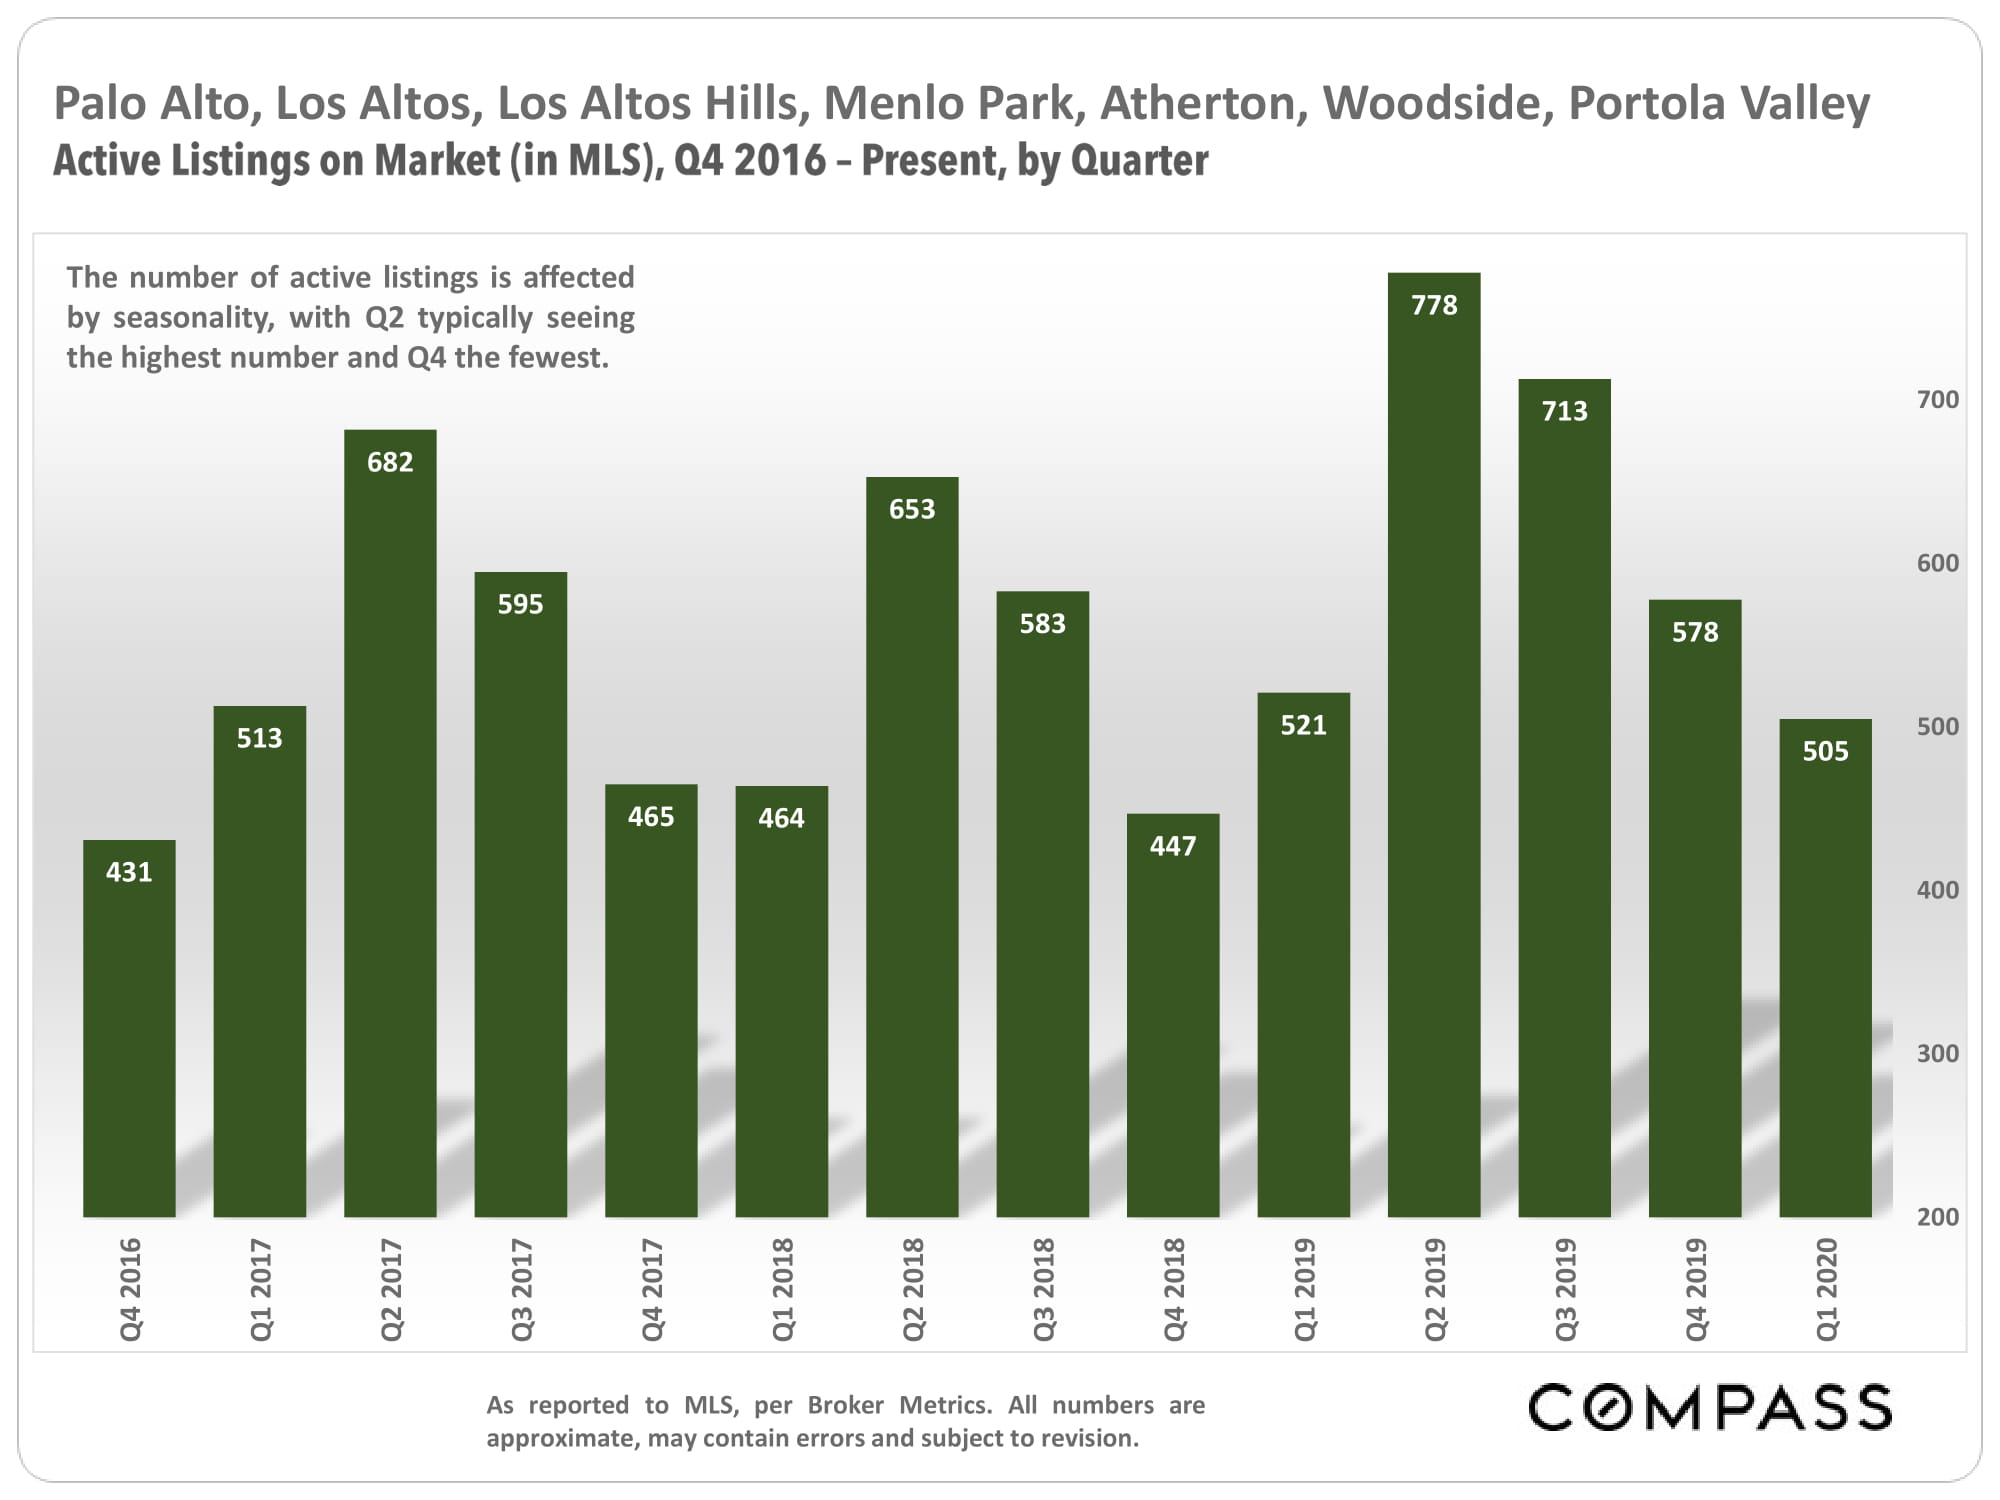
Market indicators are often seasonal in nature, with Q2 typically being the period of highest demand, and the mid-winter holiday period being the period of lowest activity.

Since the coronavirus didn’t really start impacting most markets until early-mid March, and because of the lag time between an offer being accepted on a listing and it closing escrow, the effect of the crisis on Q1 2020 statistics was limited.


Source: Compass

It is impossible to know how median and average value statistics apply to any particular home without a specific comparative market analysis. Many factors affect sales prices besides neighborhood/ bedroom count: quality of location within the neighborhood, condition, size,architecture,views, amenities,parking,outdoor space, etc.

These analyses were made in good faith with data from sources deemed reliable, but may contain errors and are subject to revision. It is not our intent to convince you of a particular position,but to attempt to provide straightforward data and analysis, so you can make your own informed decisions. Median and average statistics are enormous generalities: There are hundreds of different markets in San Francisco and the Bay Area, each with its own unique dynamics. Median prices and average dollar per square foot values can be and often are affected by other factors besides changes in fair market value. Longer term trends are much more meaningful than short-term.

Compass is a real estate broker licensed by the State of California, DRE 01527235. Equal Housing Opportunity. This report has been prepared solely for information purposes. The information herein is based on or derived from information generally available to the public and/or from sources believed to be reliable. No representation or warranty can be given with respect to the accuracy or completeness of the information. Compass disclaims any and all liability relating to this report, including without limitation any express or implied representations or warranties for statements contained in, and omissions from, the report. Nothing contained herein is intended to be or should be read as any regulatory, legal, tax, accounting or other advice and Compass does not provide such advice. All opinions are subject to change without notice. Compass makes no representation regarding the accuracy of any statements regarding any references to the laws, statutes or regulations of any state are those of the author(s). Past performance is no guarantee of future results.


Short-Term Long-Term-30 Years Rates – Mortgage Rates Hit Another All-Time Low

Source: Compass

It is impossible to know how median and average value statistics apply to any particular home without a specific comparative market analysis. Many factors affect sales prices besides neighborhood/ bedroom count: quality of location within the neighborhood, condition, size,architecture,views, amenities,parking,outdoor space, etc.

These analyses were made in good faith with data from sources deemed reliable, but may contain errors and are subject to revision. It is not our intent to convince you of a particular position,but to attempt to provide straightforward data and analysis, so you can make your own informed decisions. Median and average statistics are enormous generalities: There are hundreds of different markets in San Francisco and the Bay Area, each with its own unique dynamics. Median prices and average dollar per square foot values can be and often are affected by other factors besides changes in fair market value. Longer term trends are much more meaningful than short-term.

Compass is a real estate broker licensed by the State of California, DRE 01527235. Equal Housing Opportunity. This report has been prepared solely for information purposes. The information herein is based on or derived from information generally available to the public and/or from sources believed to be reliable. No representation or warranty can be given with respect to the accuracy or completeness of the information. Compass disclaims any and all liability relating to this report, including without limitation any express or implied representations or warranties for statements contained in, and omissions from, the report. Nothing contained herein is intended to be or should be read as any regulatory, legal, tax, accounting or other advice and Compass does not provide such advice. All opinions are subject to change without notice. Compass makes no representation regarding the accuracy of any statements regarding any references to the laws, statutes or regulations of any state are those of the author(s). Past performance is no guarantee of future results.

Santa Clara County Home Sales, January-April 2020

Source: Compass

It is impossible to know how median and average value statistics apply to any particular home without a specific comparative market analysis. Many factors affect sales prices besides neighborhood/ bedroom count: quality of location within the neighborhood, condition, size,architecture,views, amenities,parking,outdoor space, etc.

These analyses were made in good faith with data from sources deemed reliable, but may contain errors and are subject to revision. It is not our intent to convince you of a particular position,but to attempt to provide straightforward data and analysis, so you can make your own informed decisions. Median and average statistics are enormous generalities: There are hundreds of different markets in San Francisco and the Bay Area, each with its own unique dynamics. Median prices and average dollar per square foot values can be and often are affected by other factors besides changes in fair market value. Longer term trends are much more meaningful than short-term.

Compass is a real estate broker licensed by the State of California, DRE 01527235. Equal Housing Opportunity. This report has been prepared solely for information purposes. The information herein is based on or derived from information generally available to the public and/or from sources believed to be reliable. No representation or warranty can be given with respect to the accuracy or completeness of the information. Compass disclaims any and all liability relating to this report, including without limitation any express or implied representations or warranties for statements contained in, and omissions from, the report. Nothing contained herein is intended to be or should be read as any regulatory, legal, tax, accounting or other advice and Compass does not provide such advice. All opinions are subject to change without notice. Compass makes no representation regarding the accuracy of any statements regarding any references to the laws, statutes or regulations of any state are those of the author(s). Past performance is no guarantee of future results.


Skip to content