San Mateo County Real Estate, September 2022

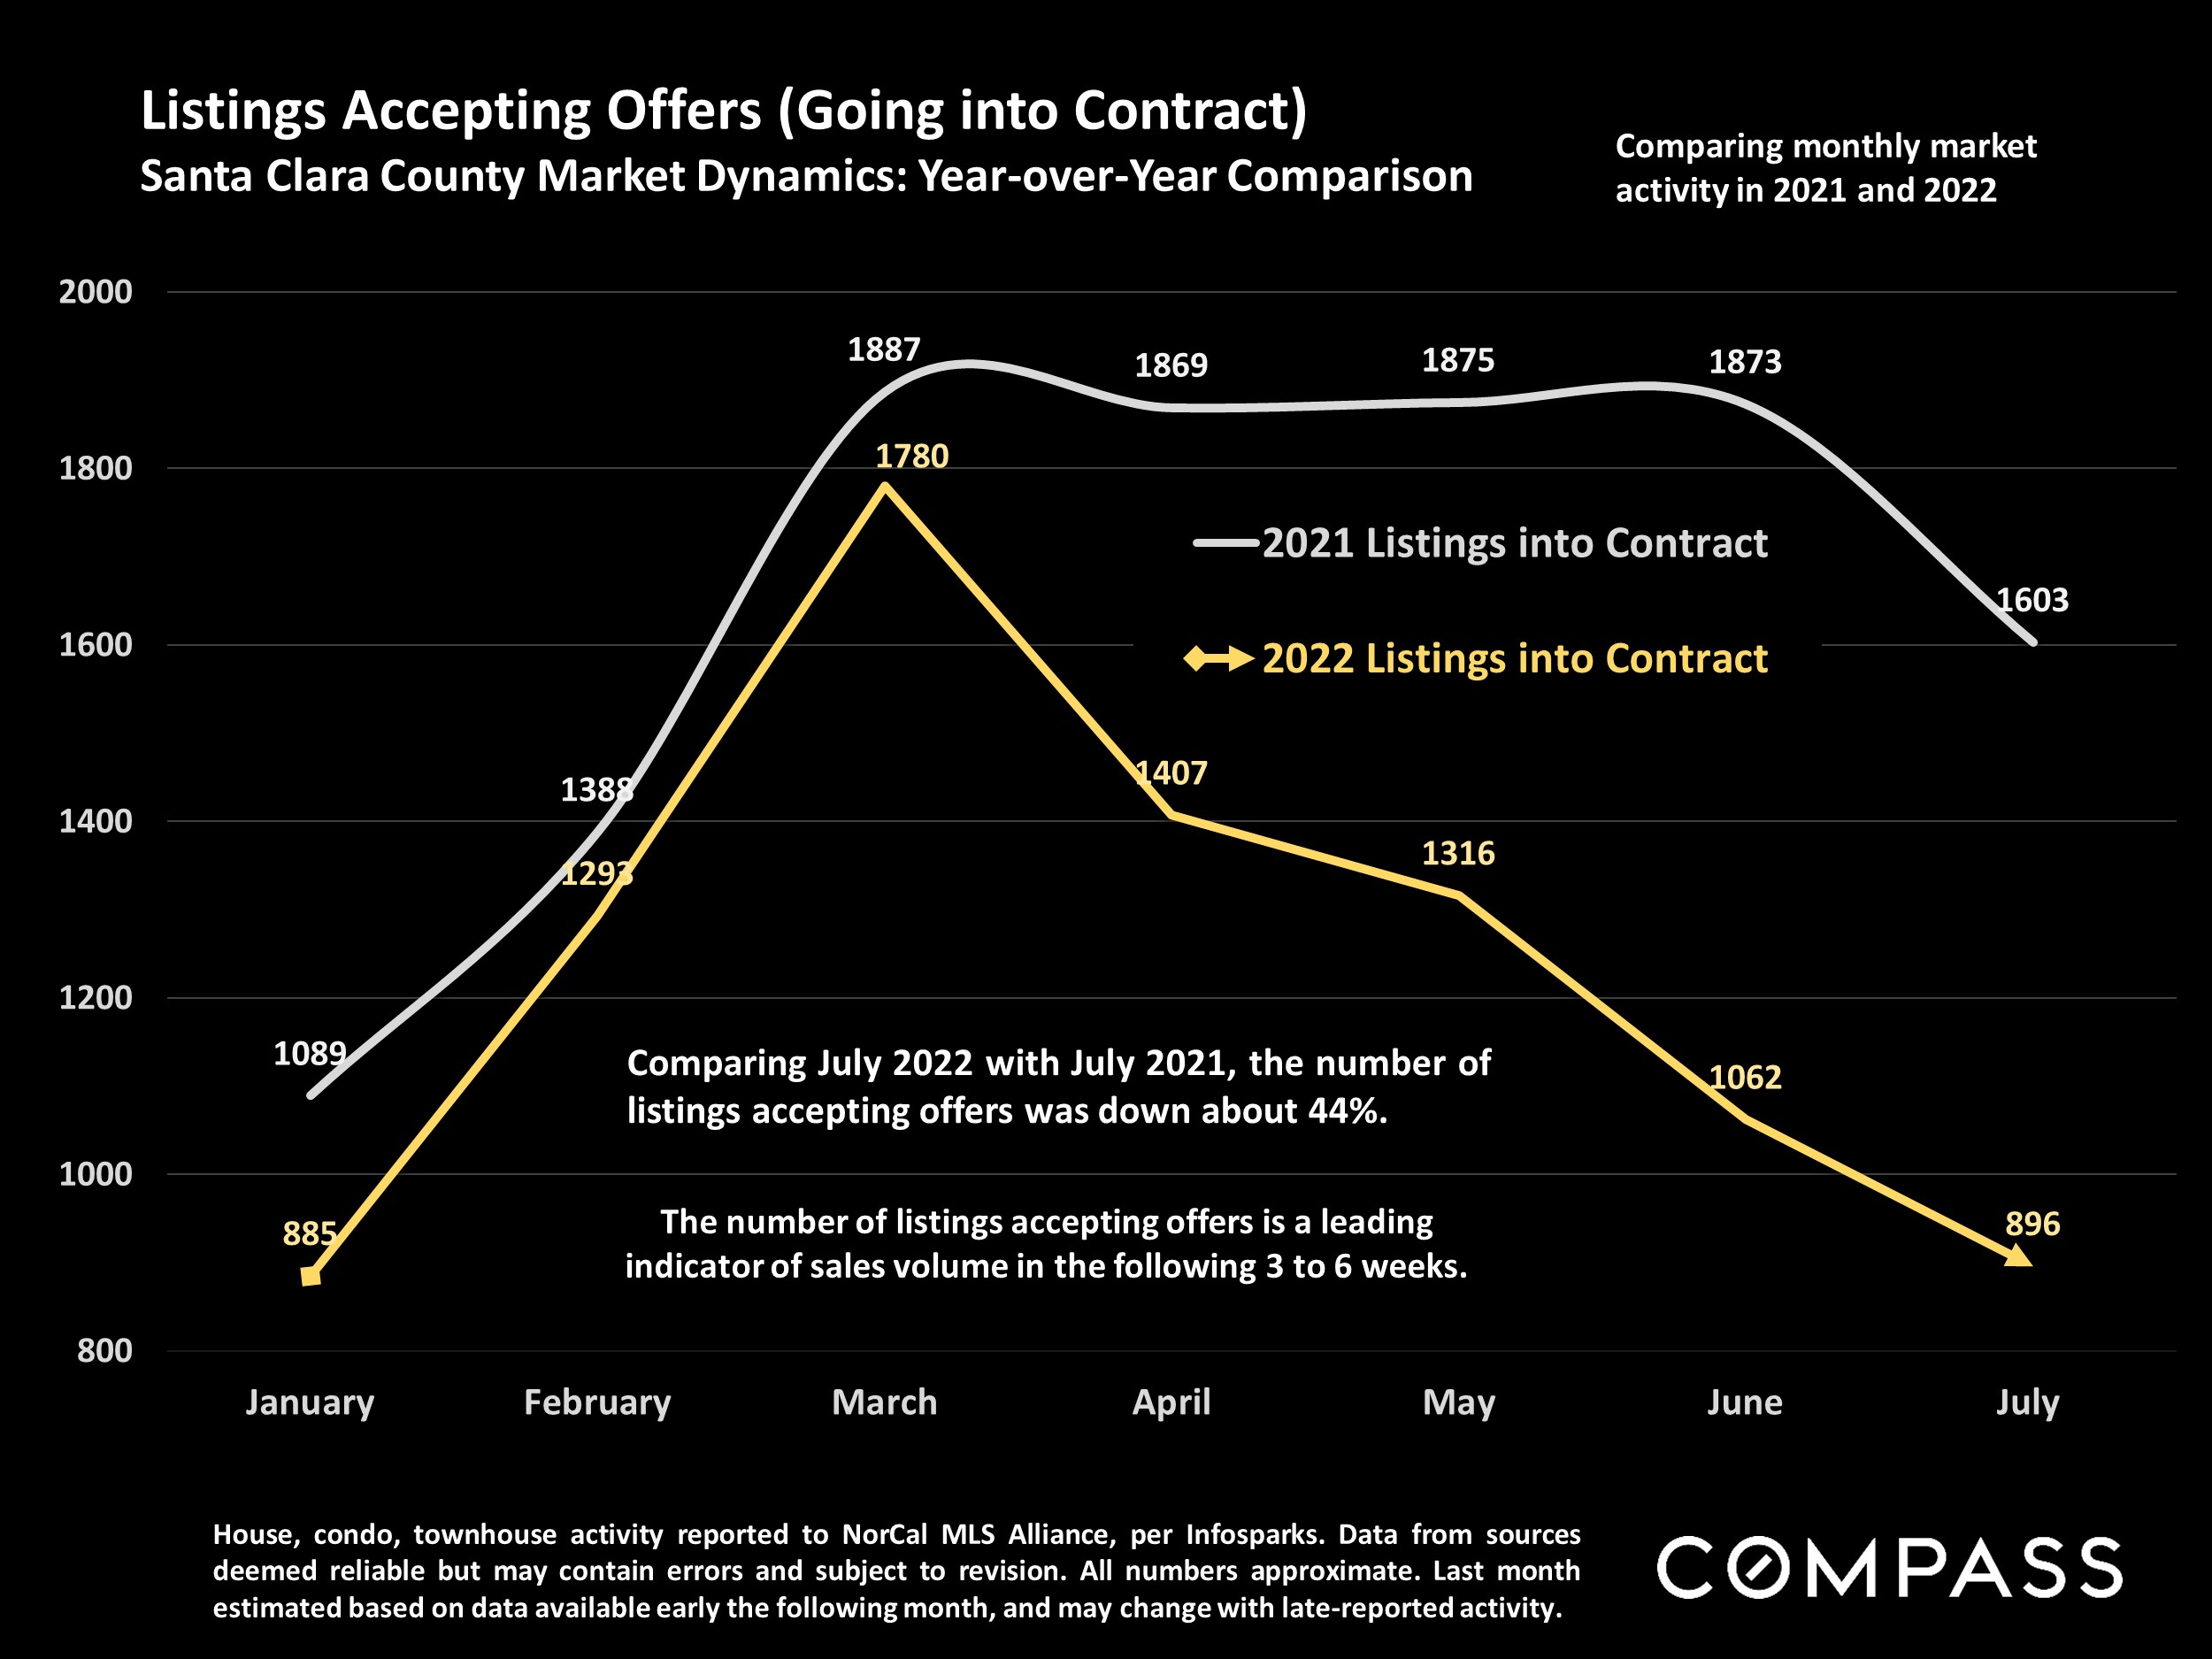
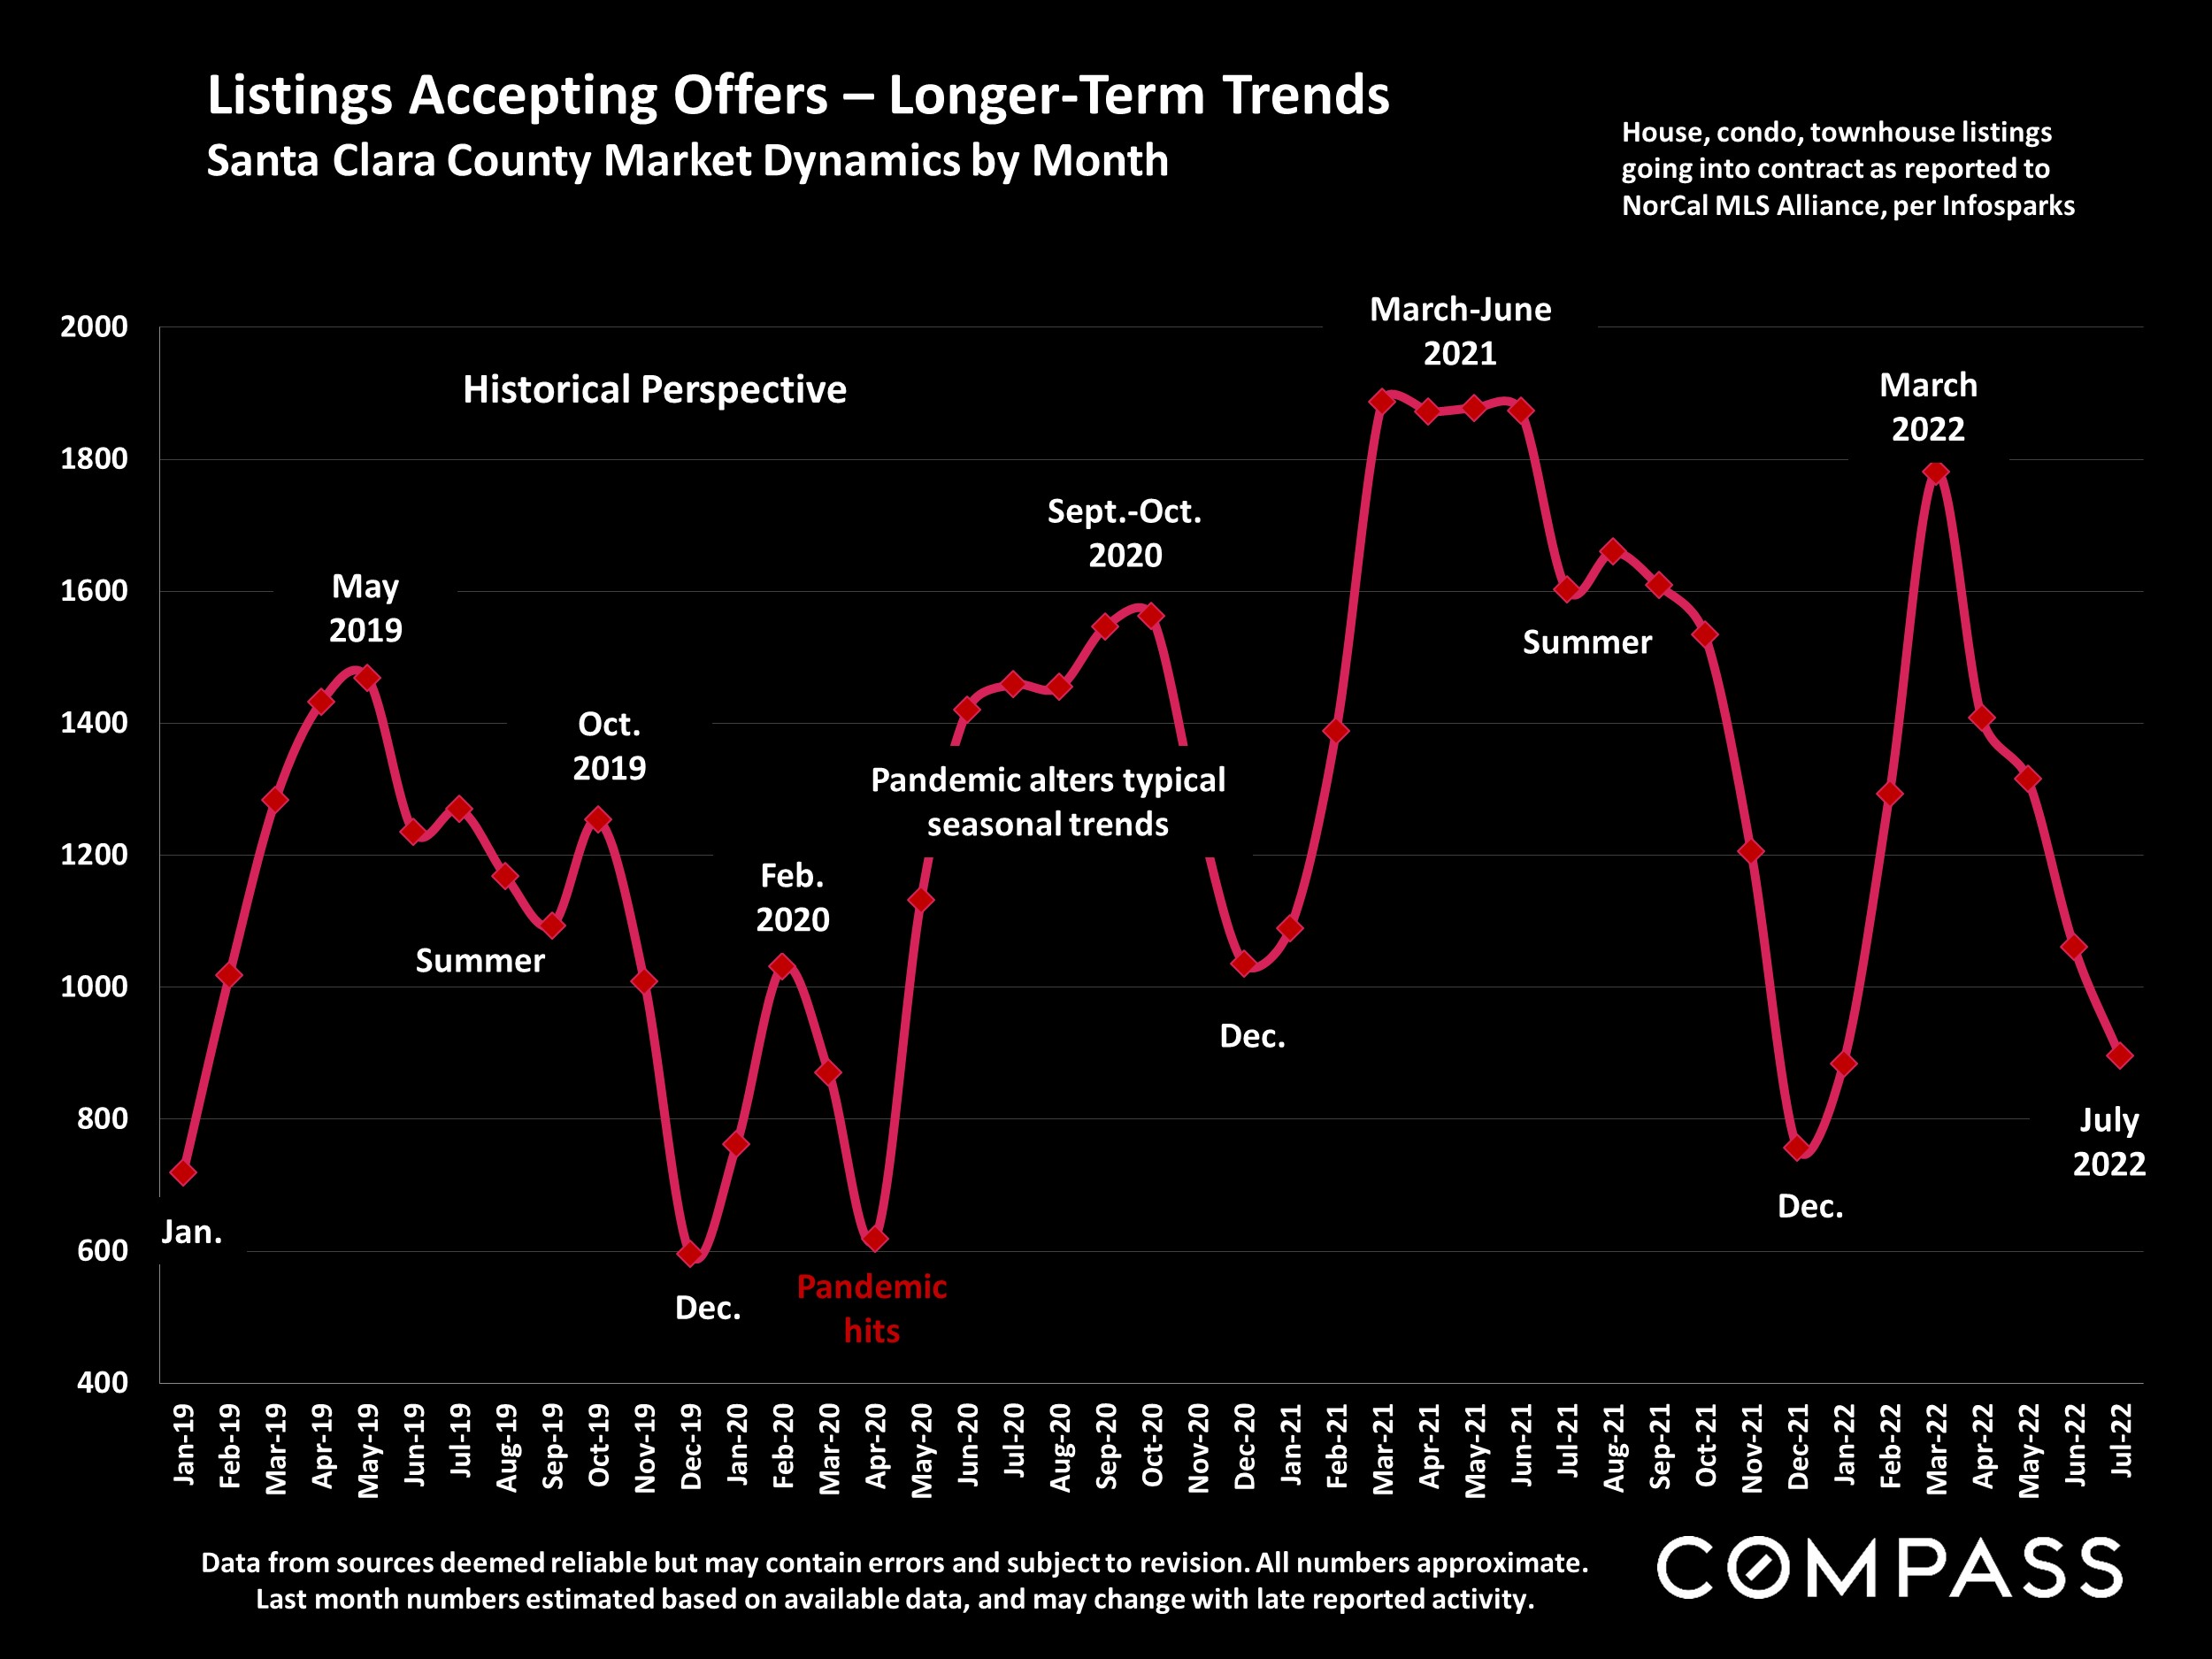
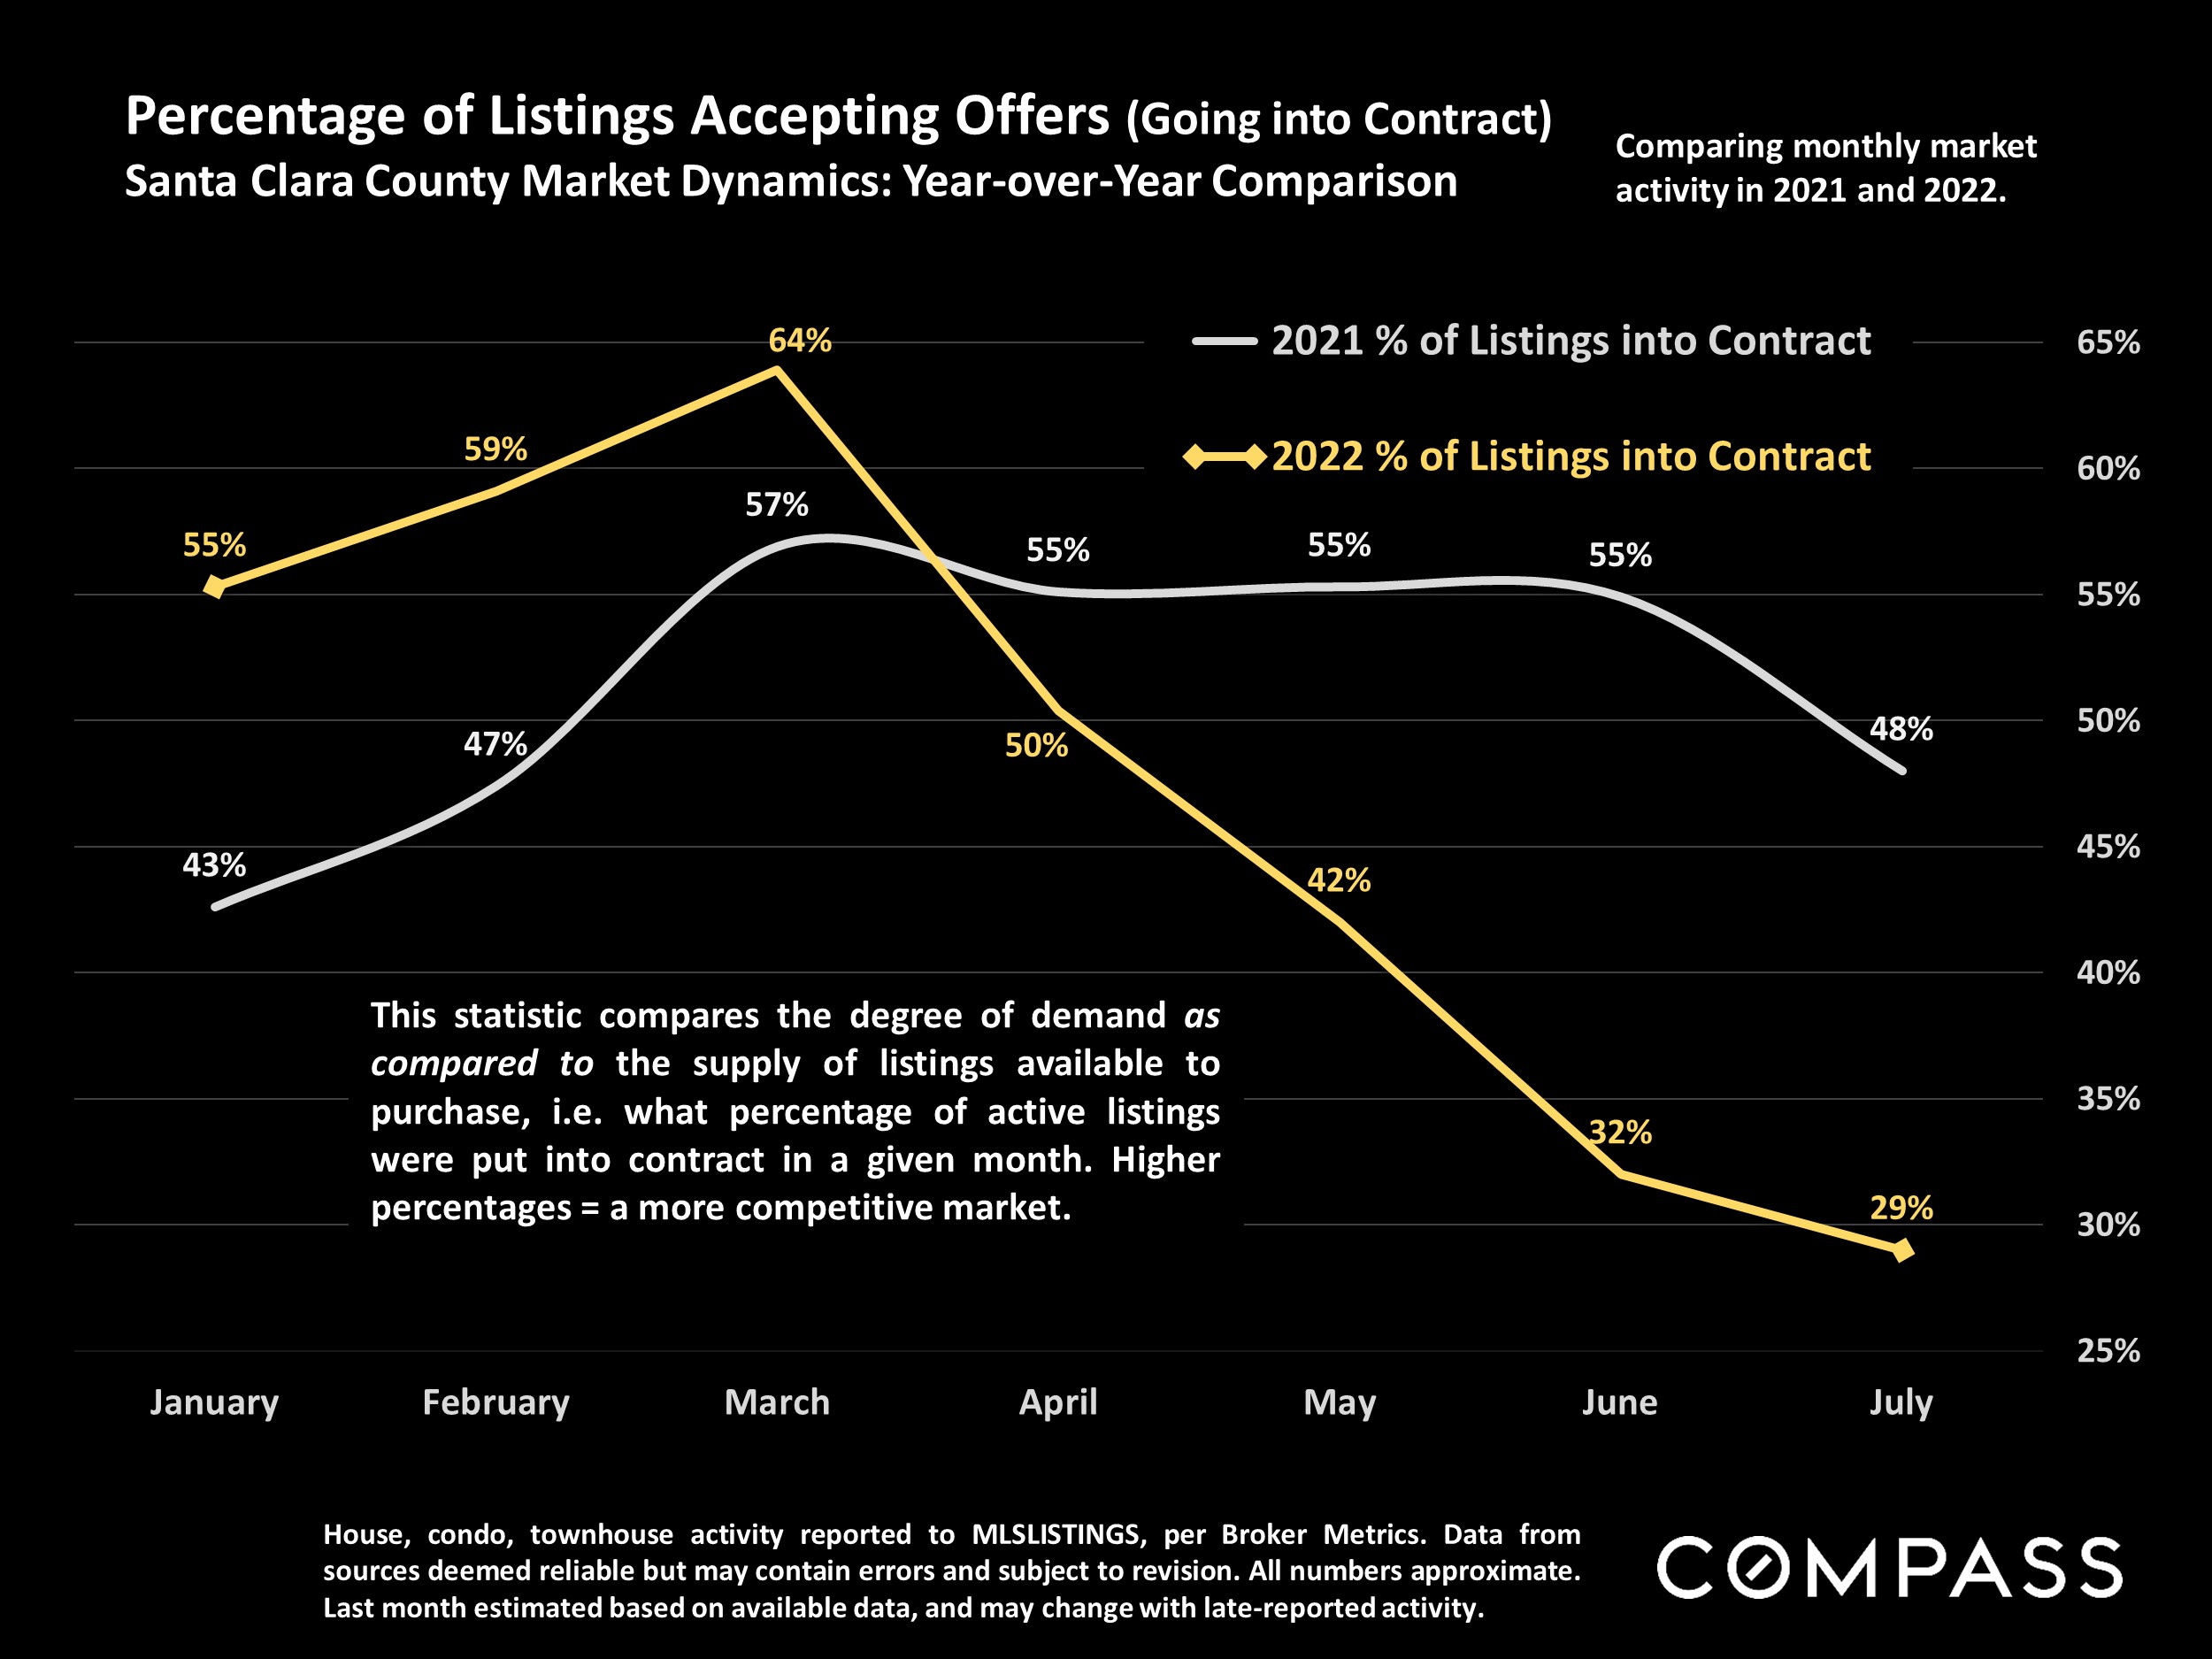
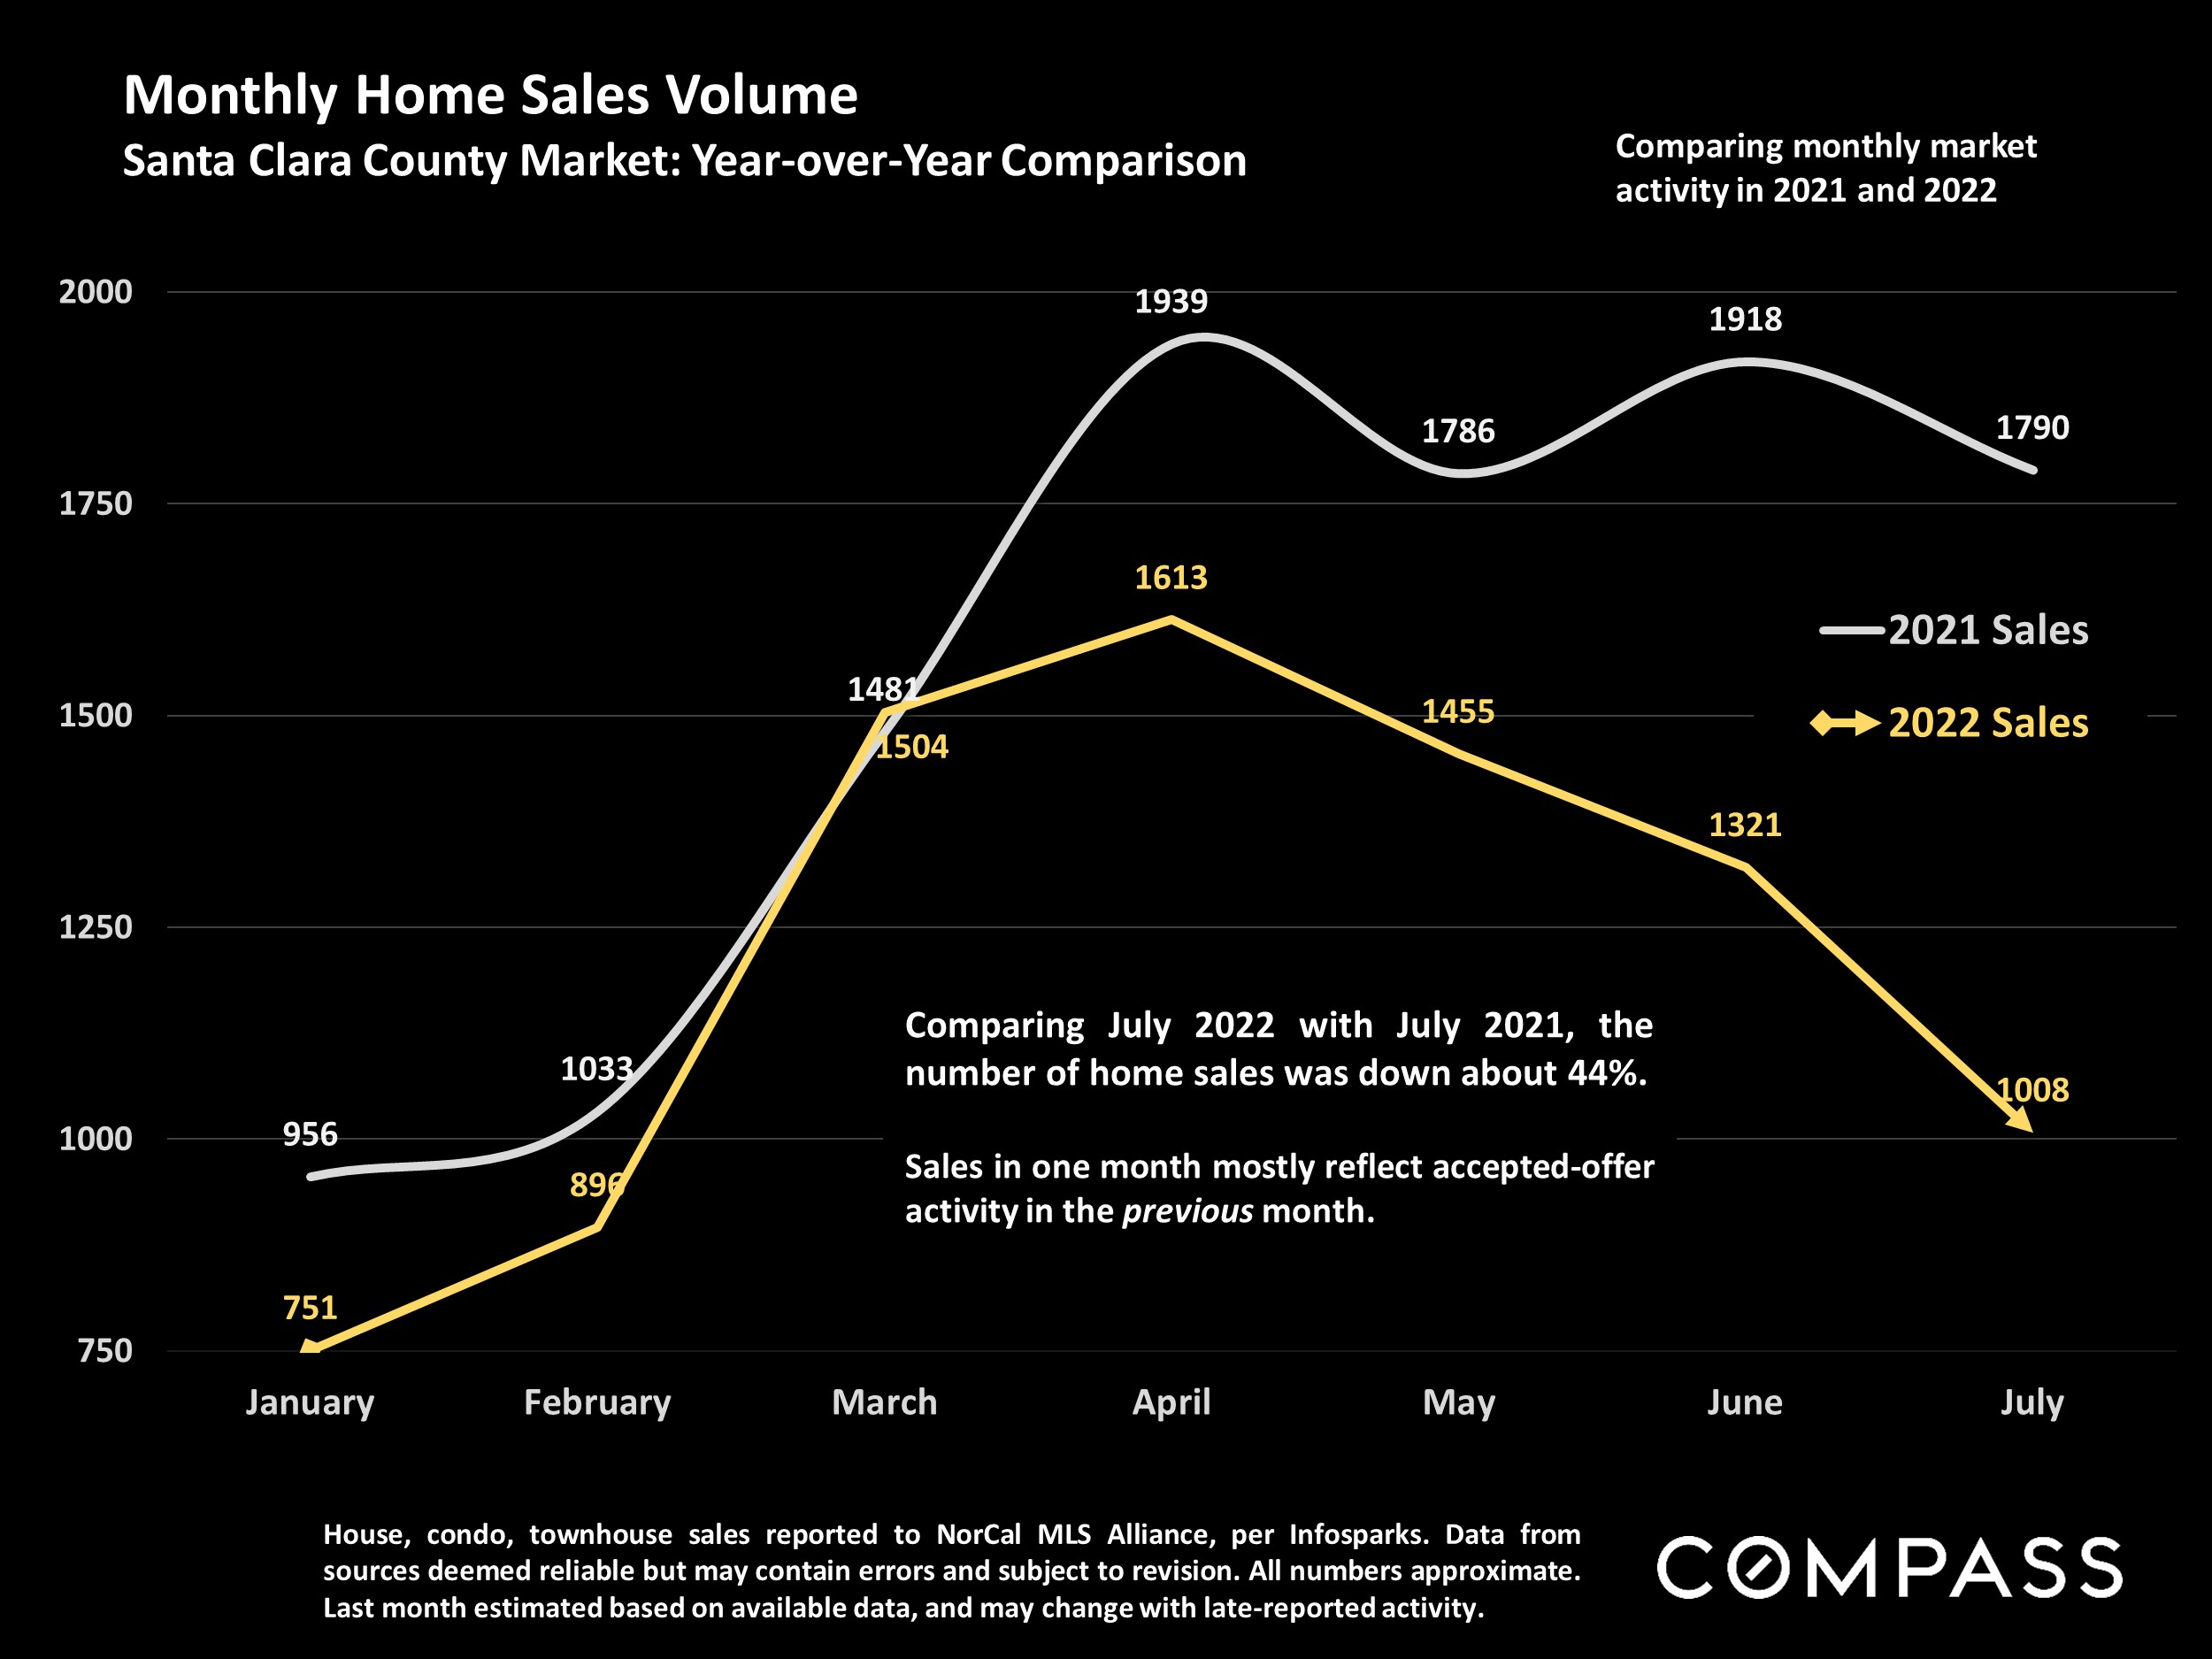
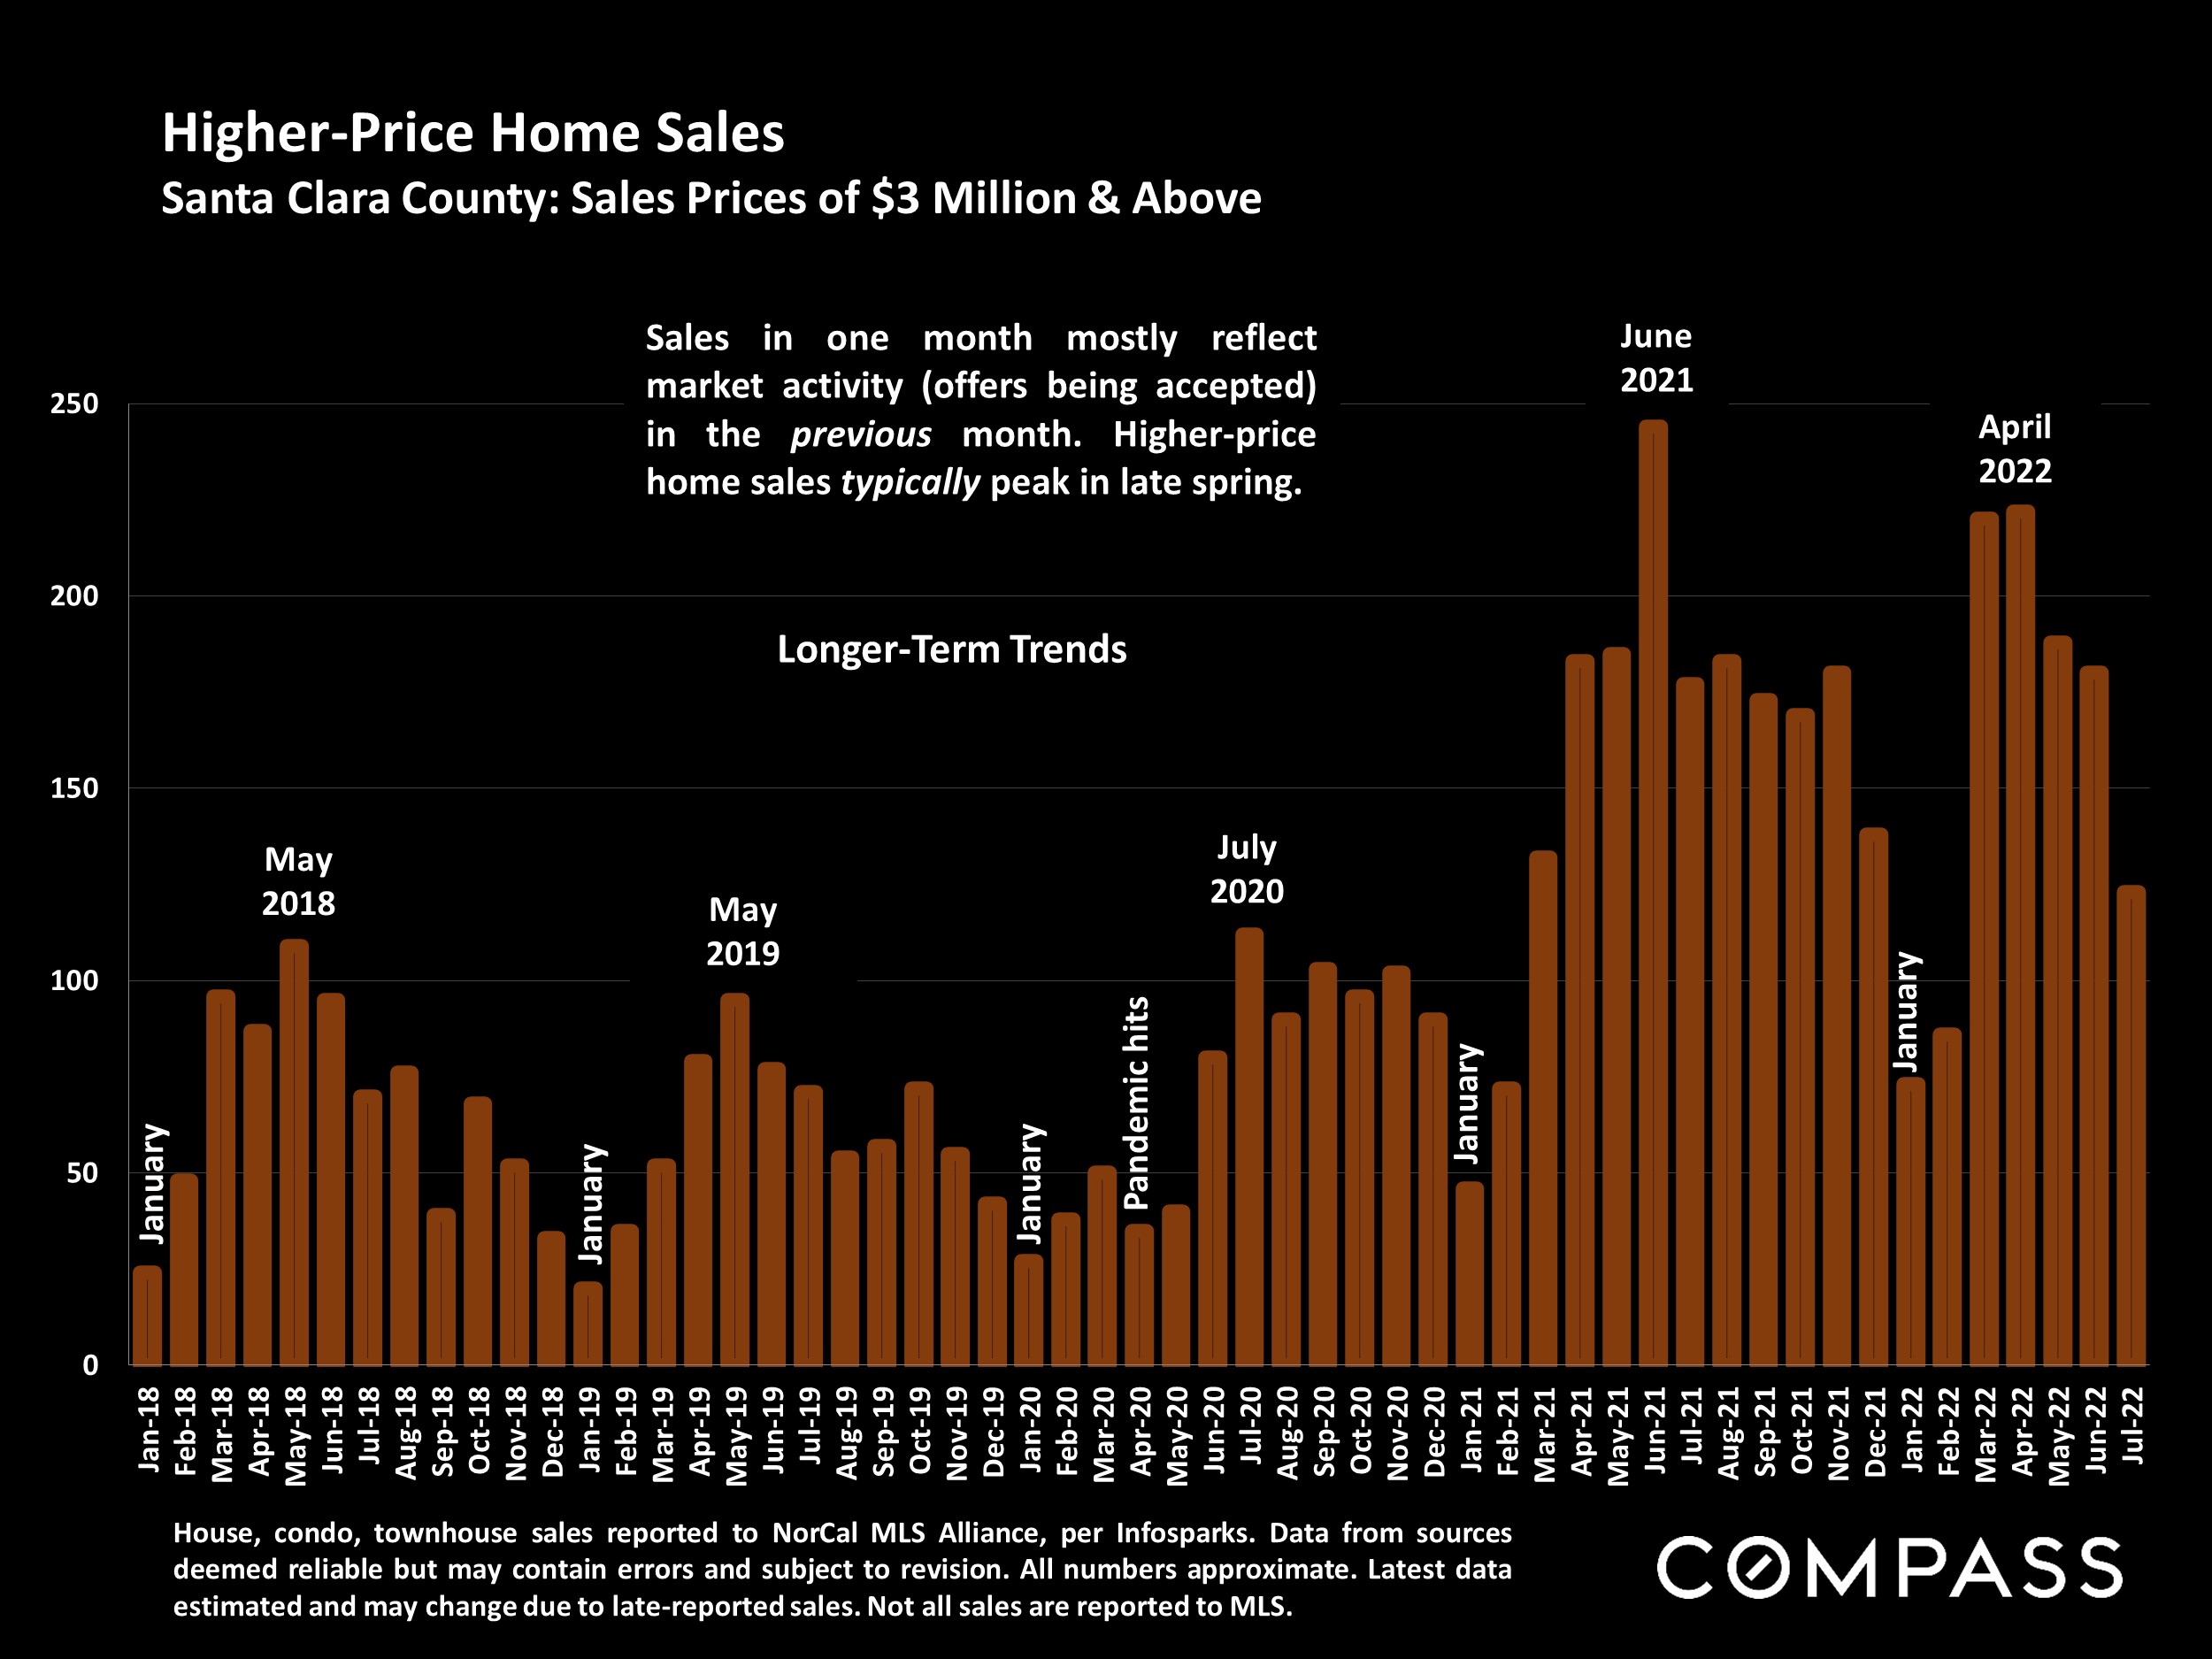
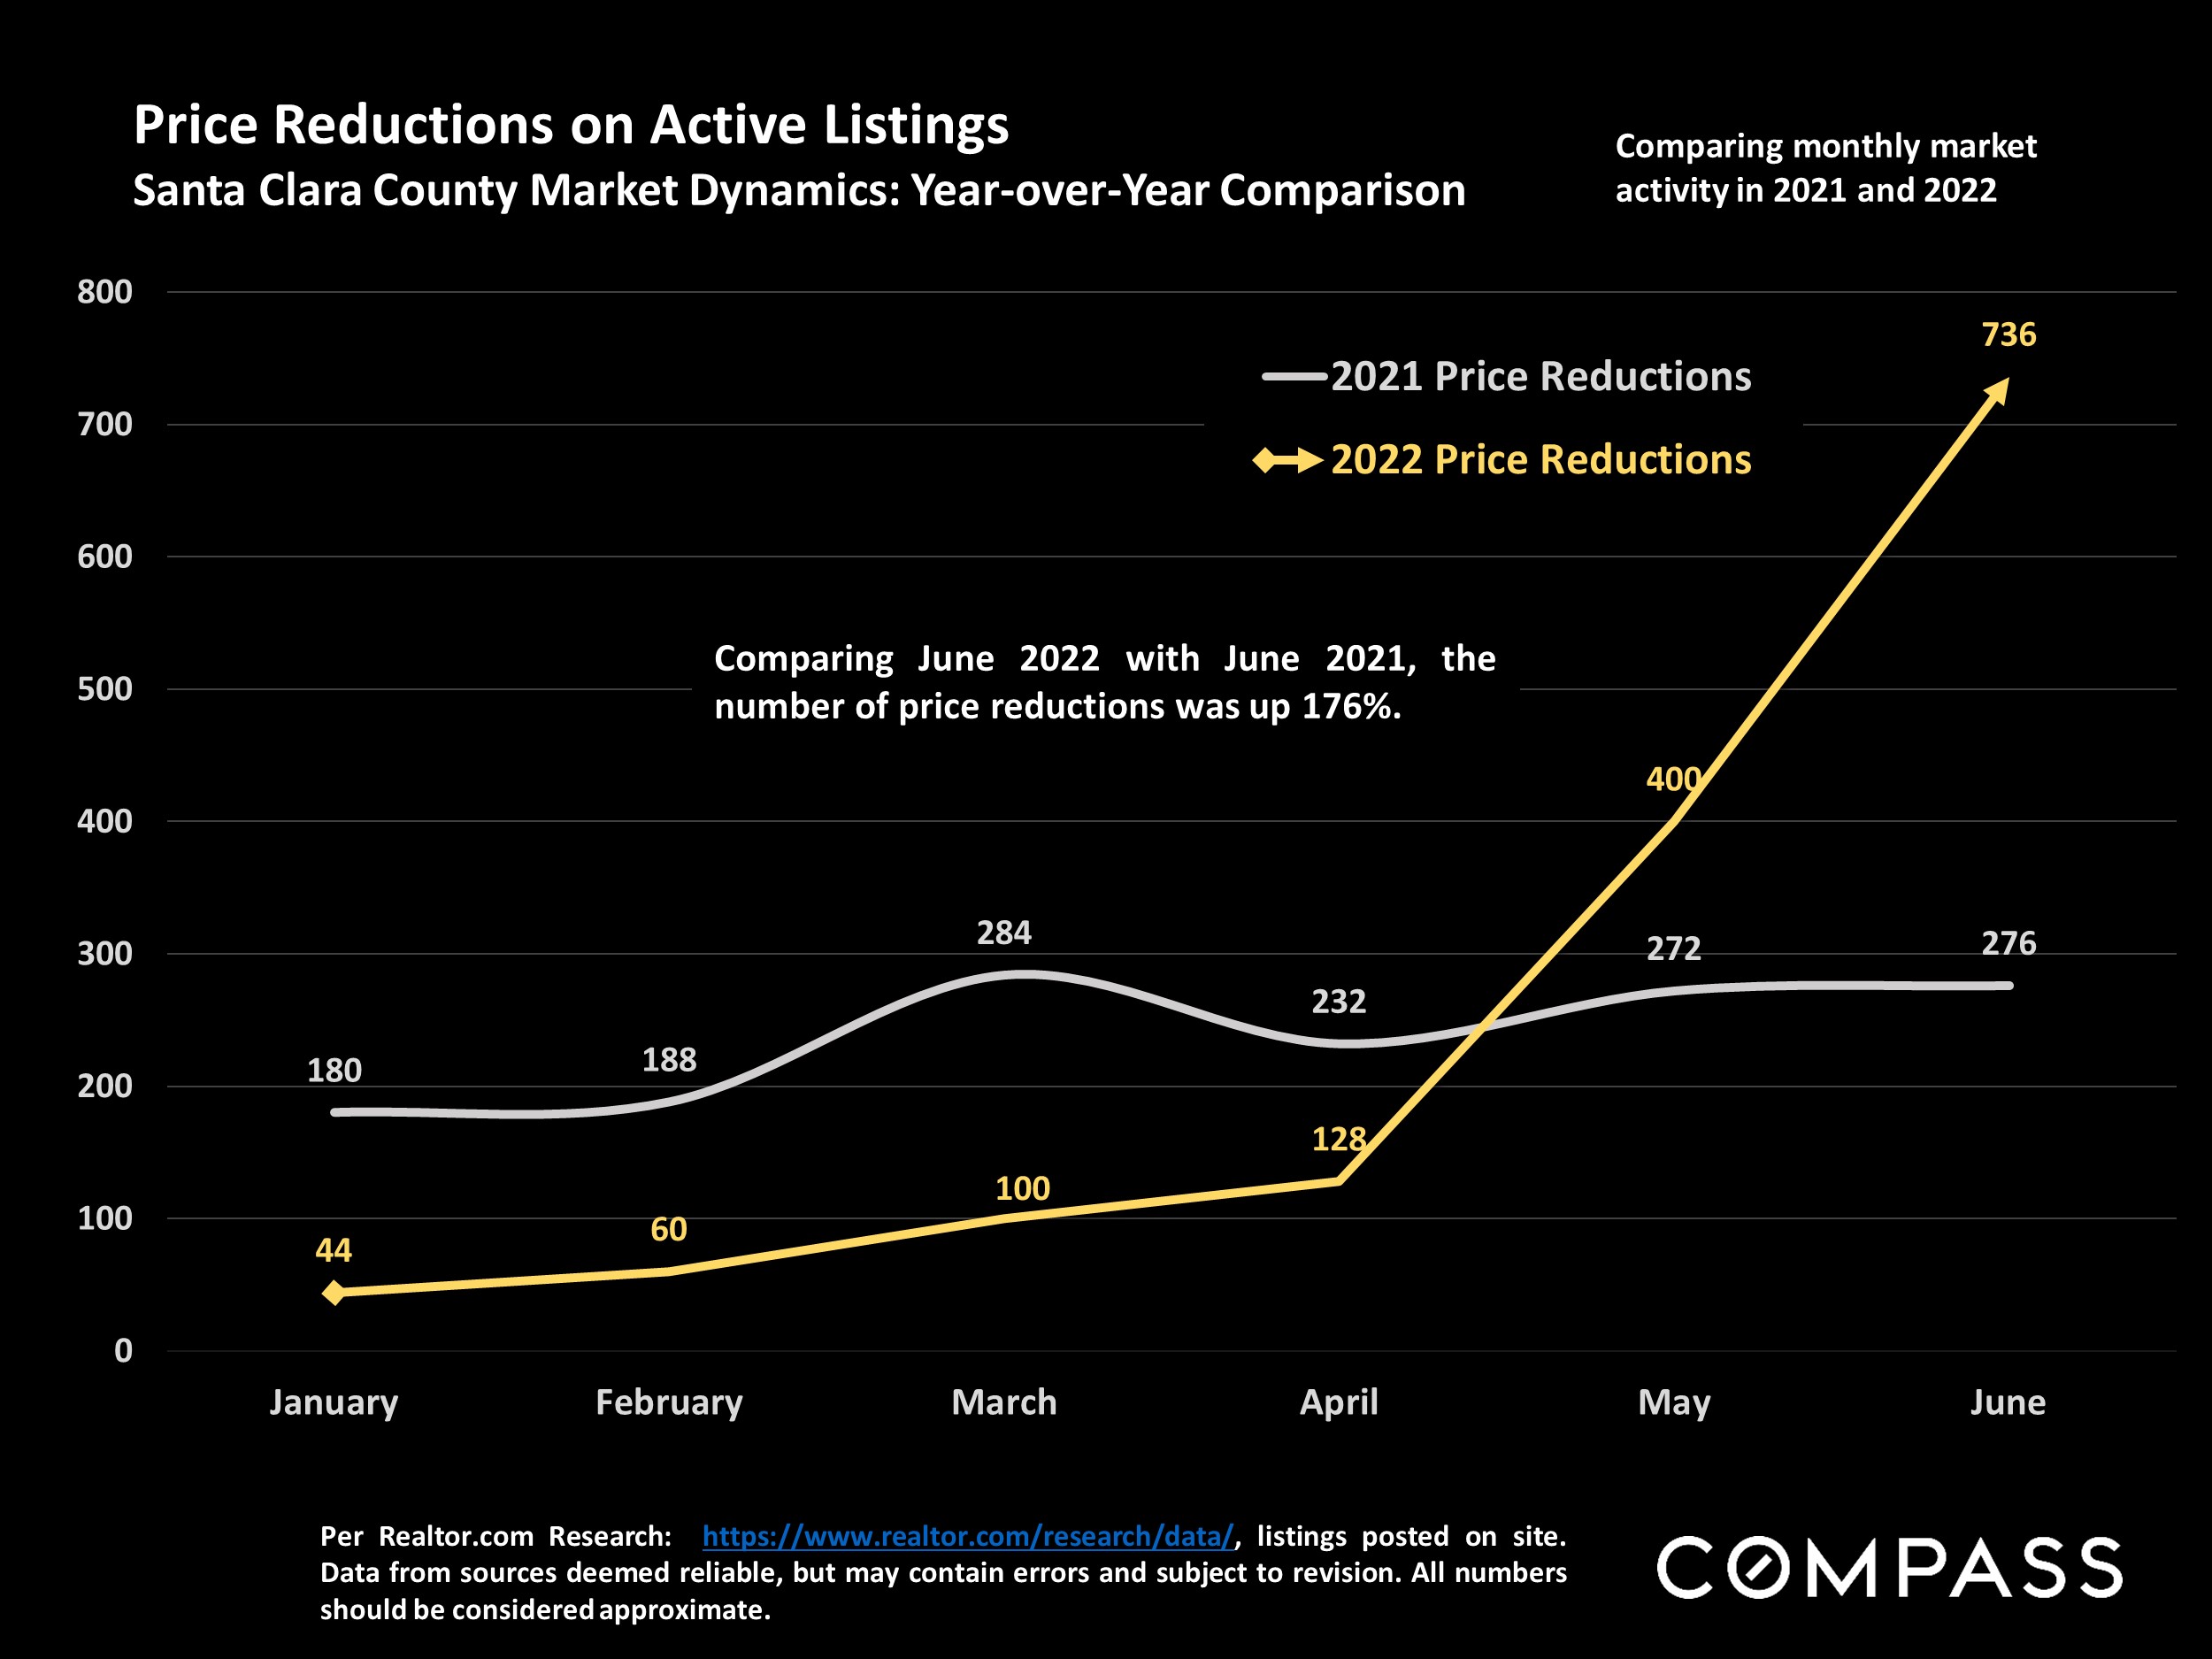
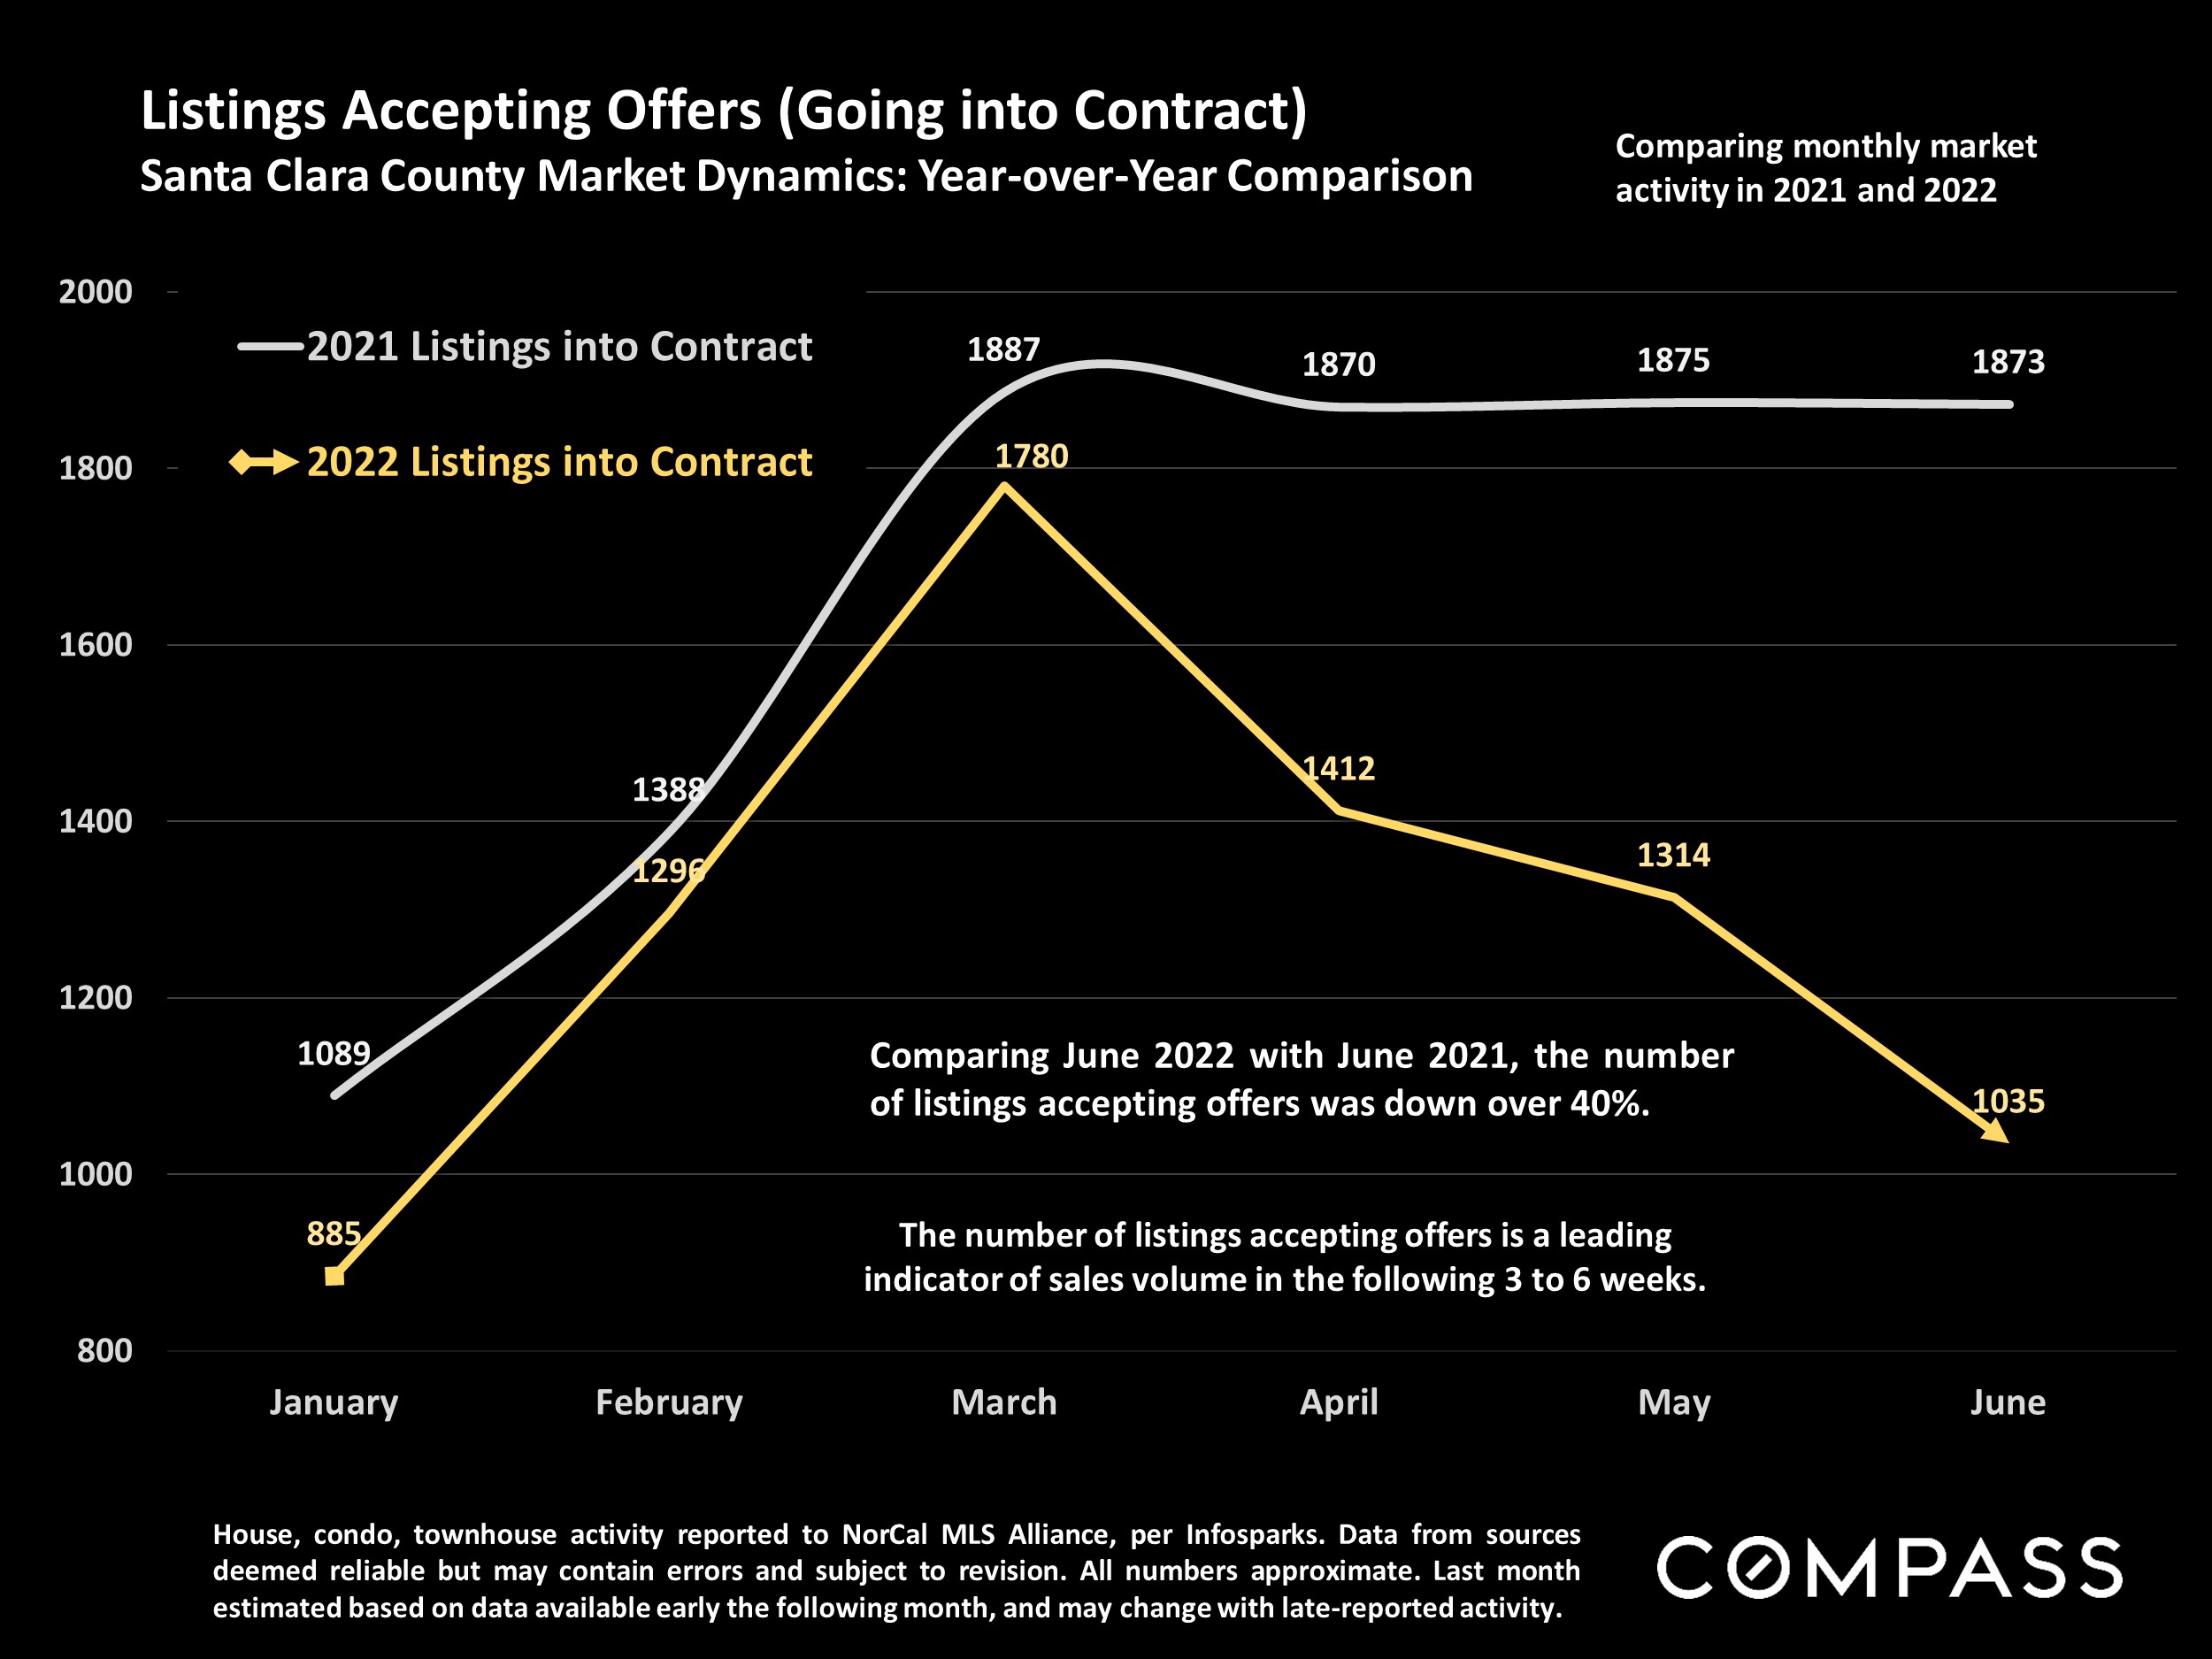
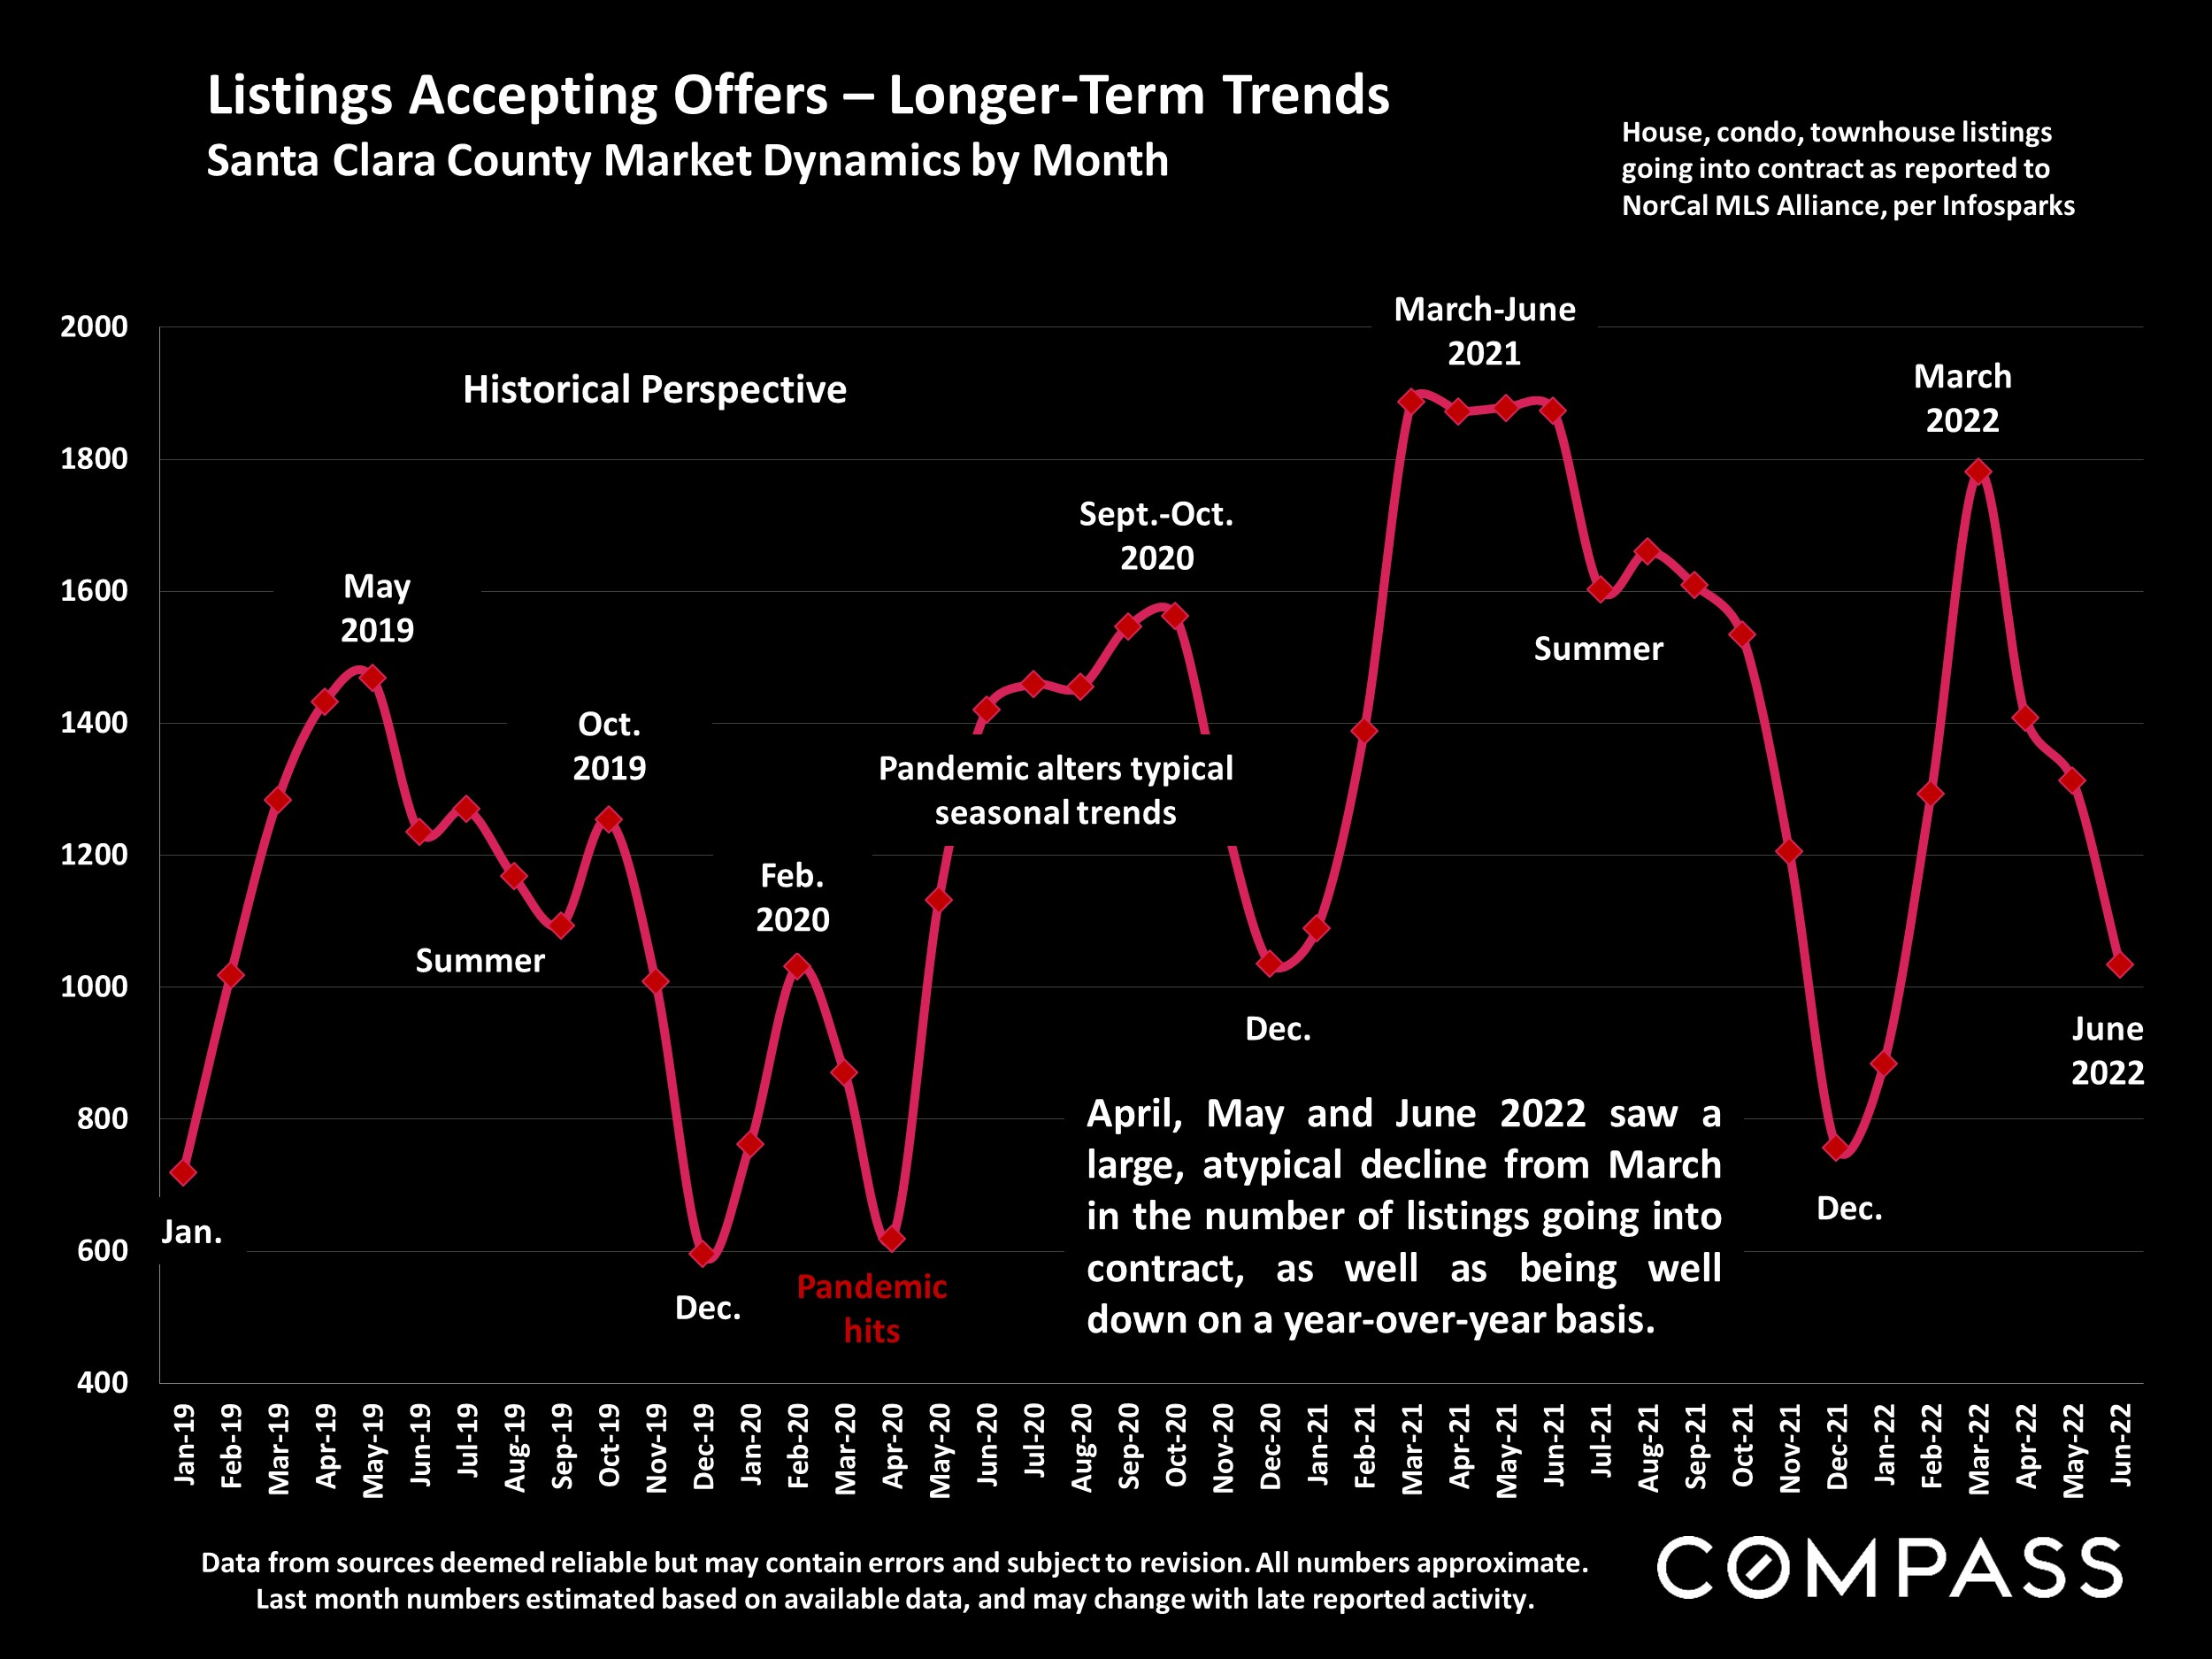
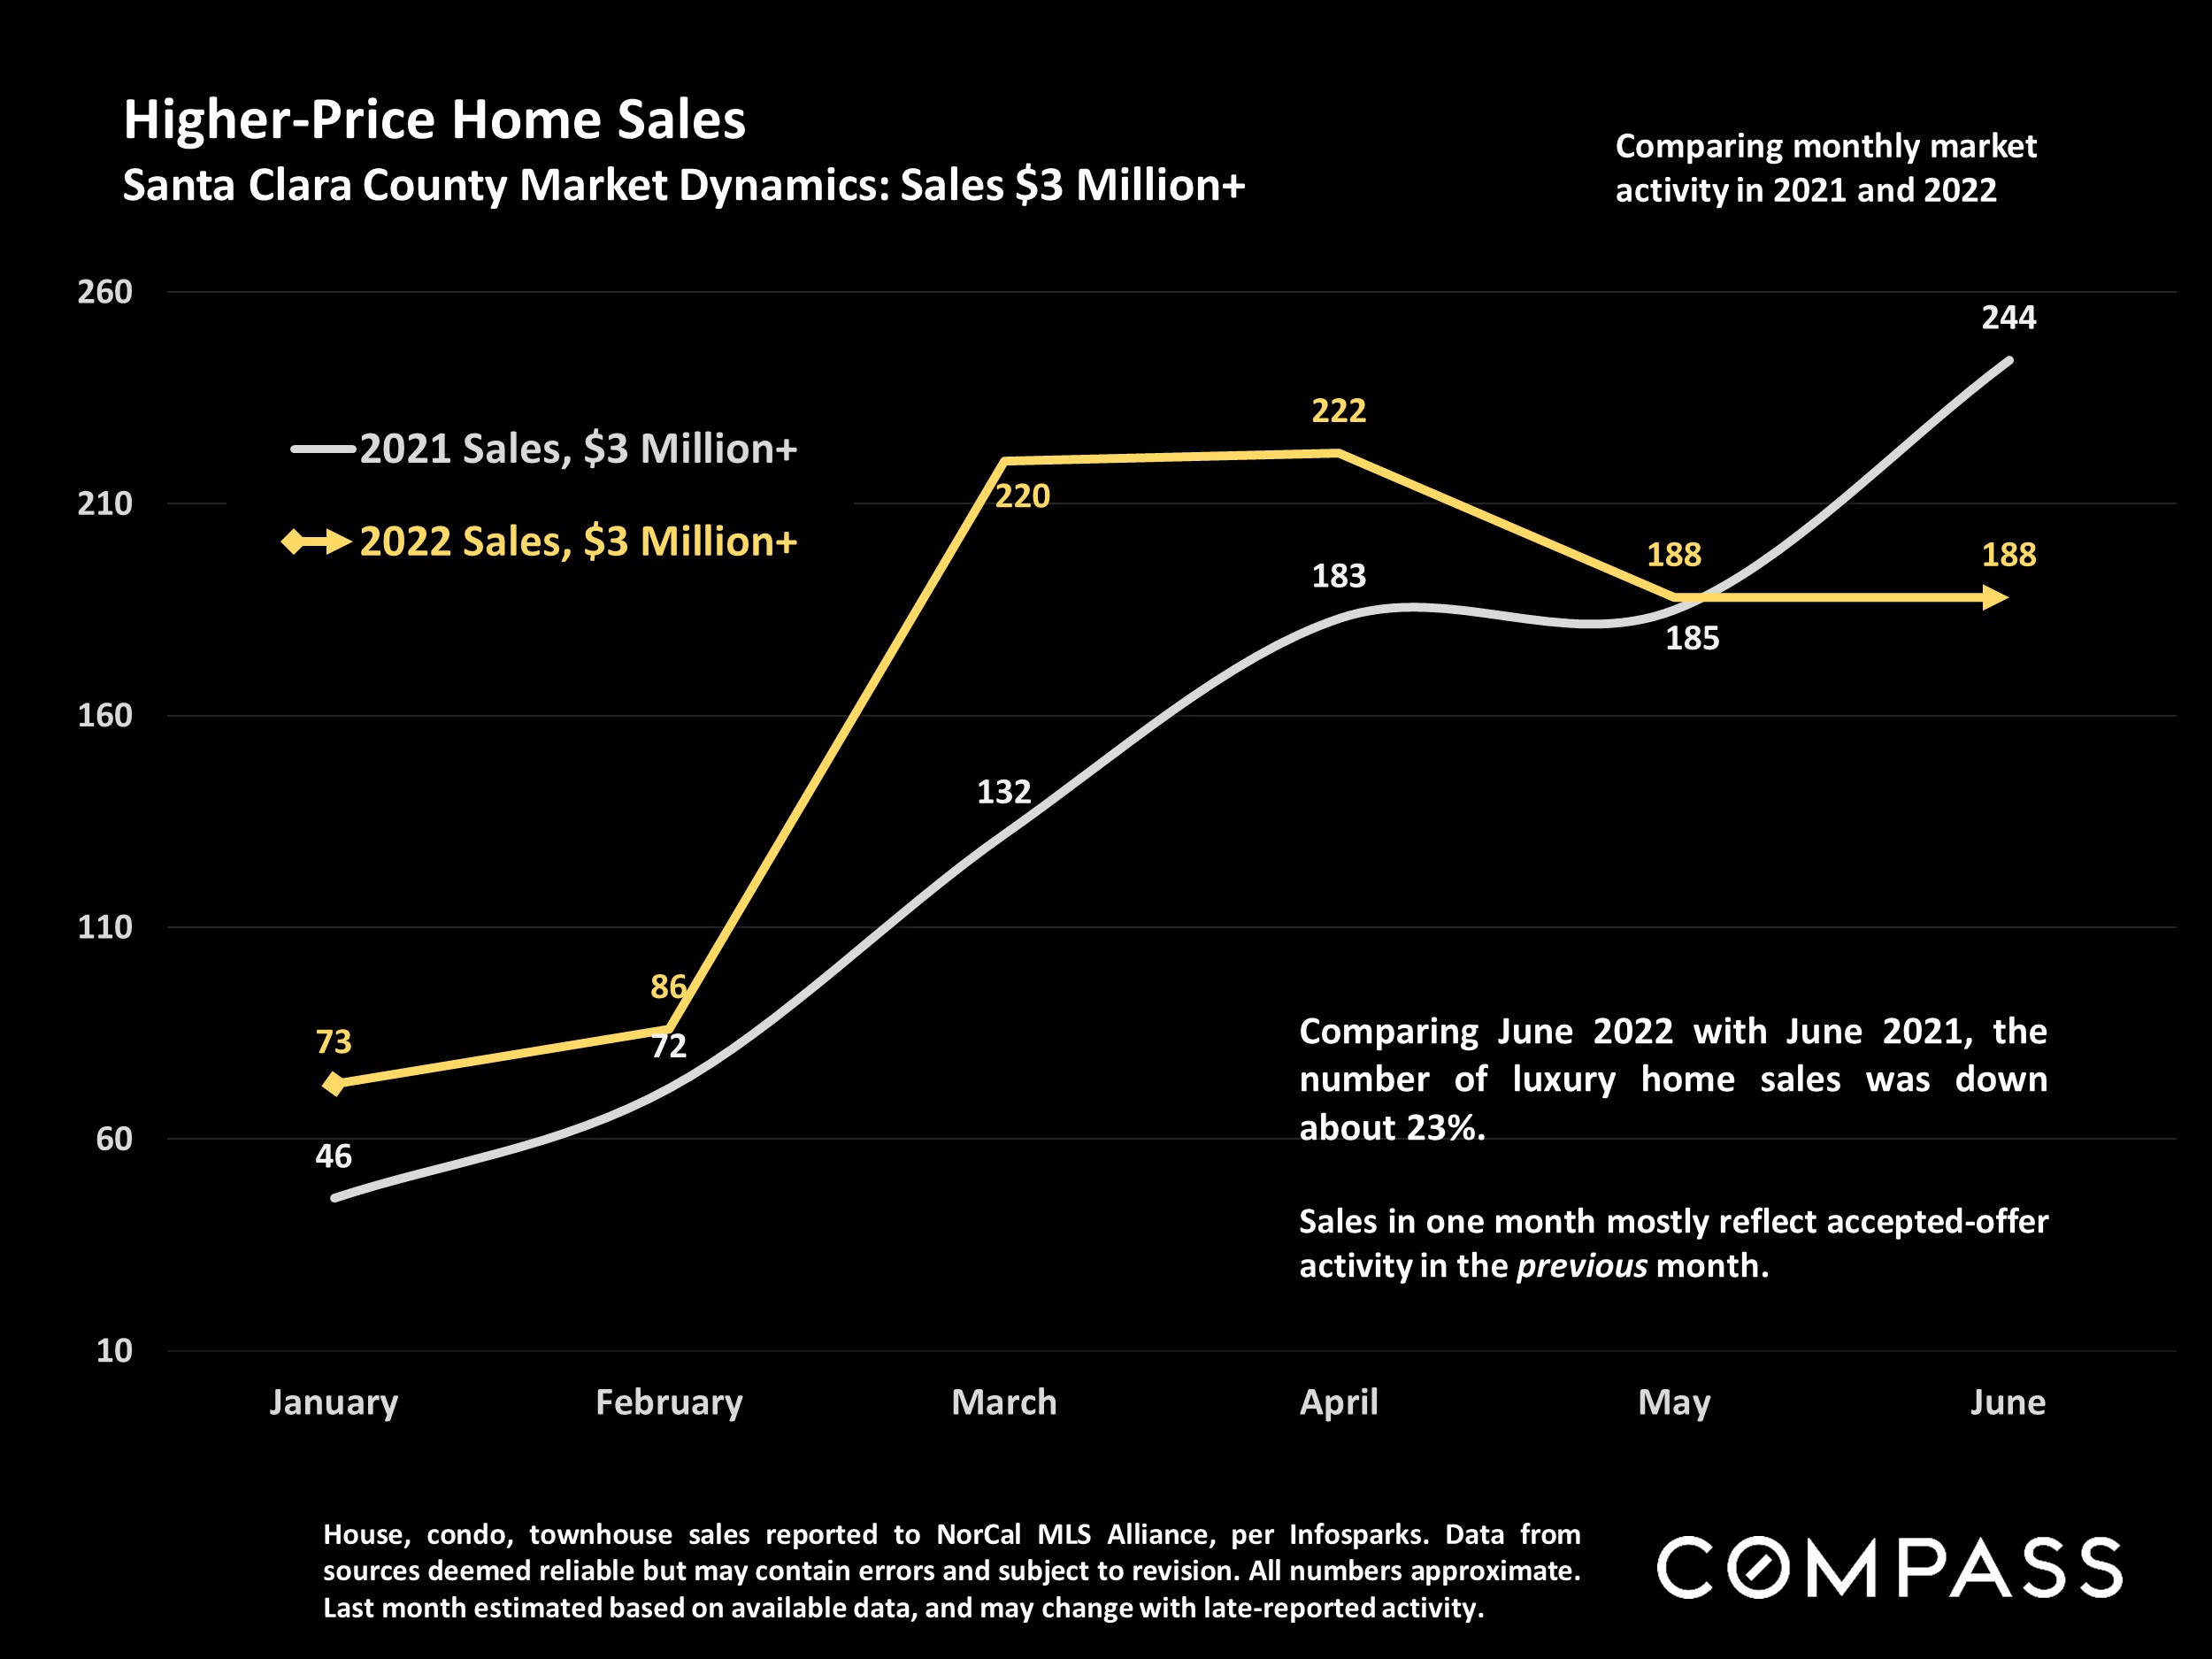
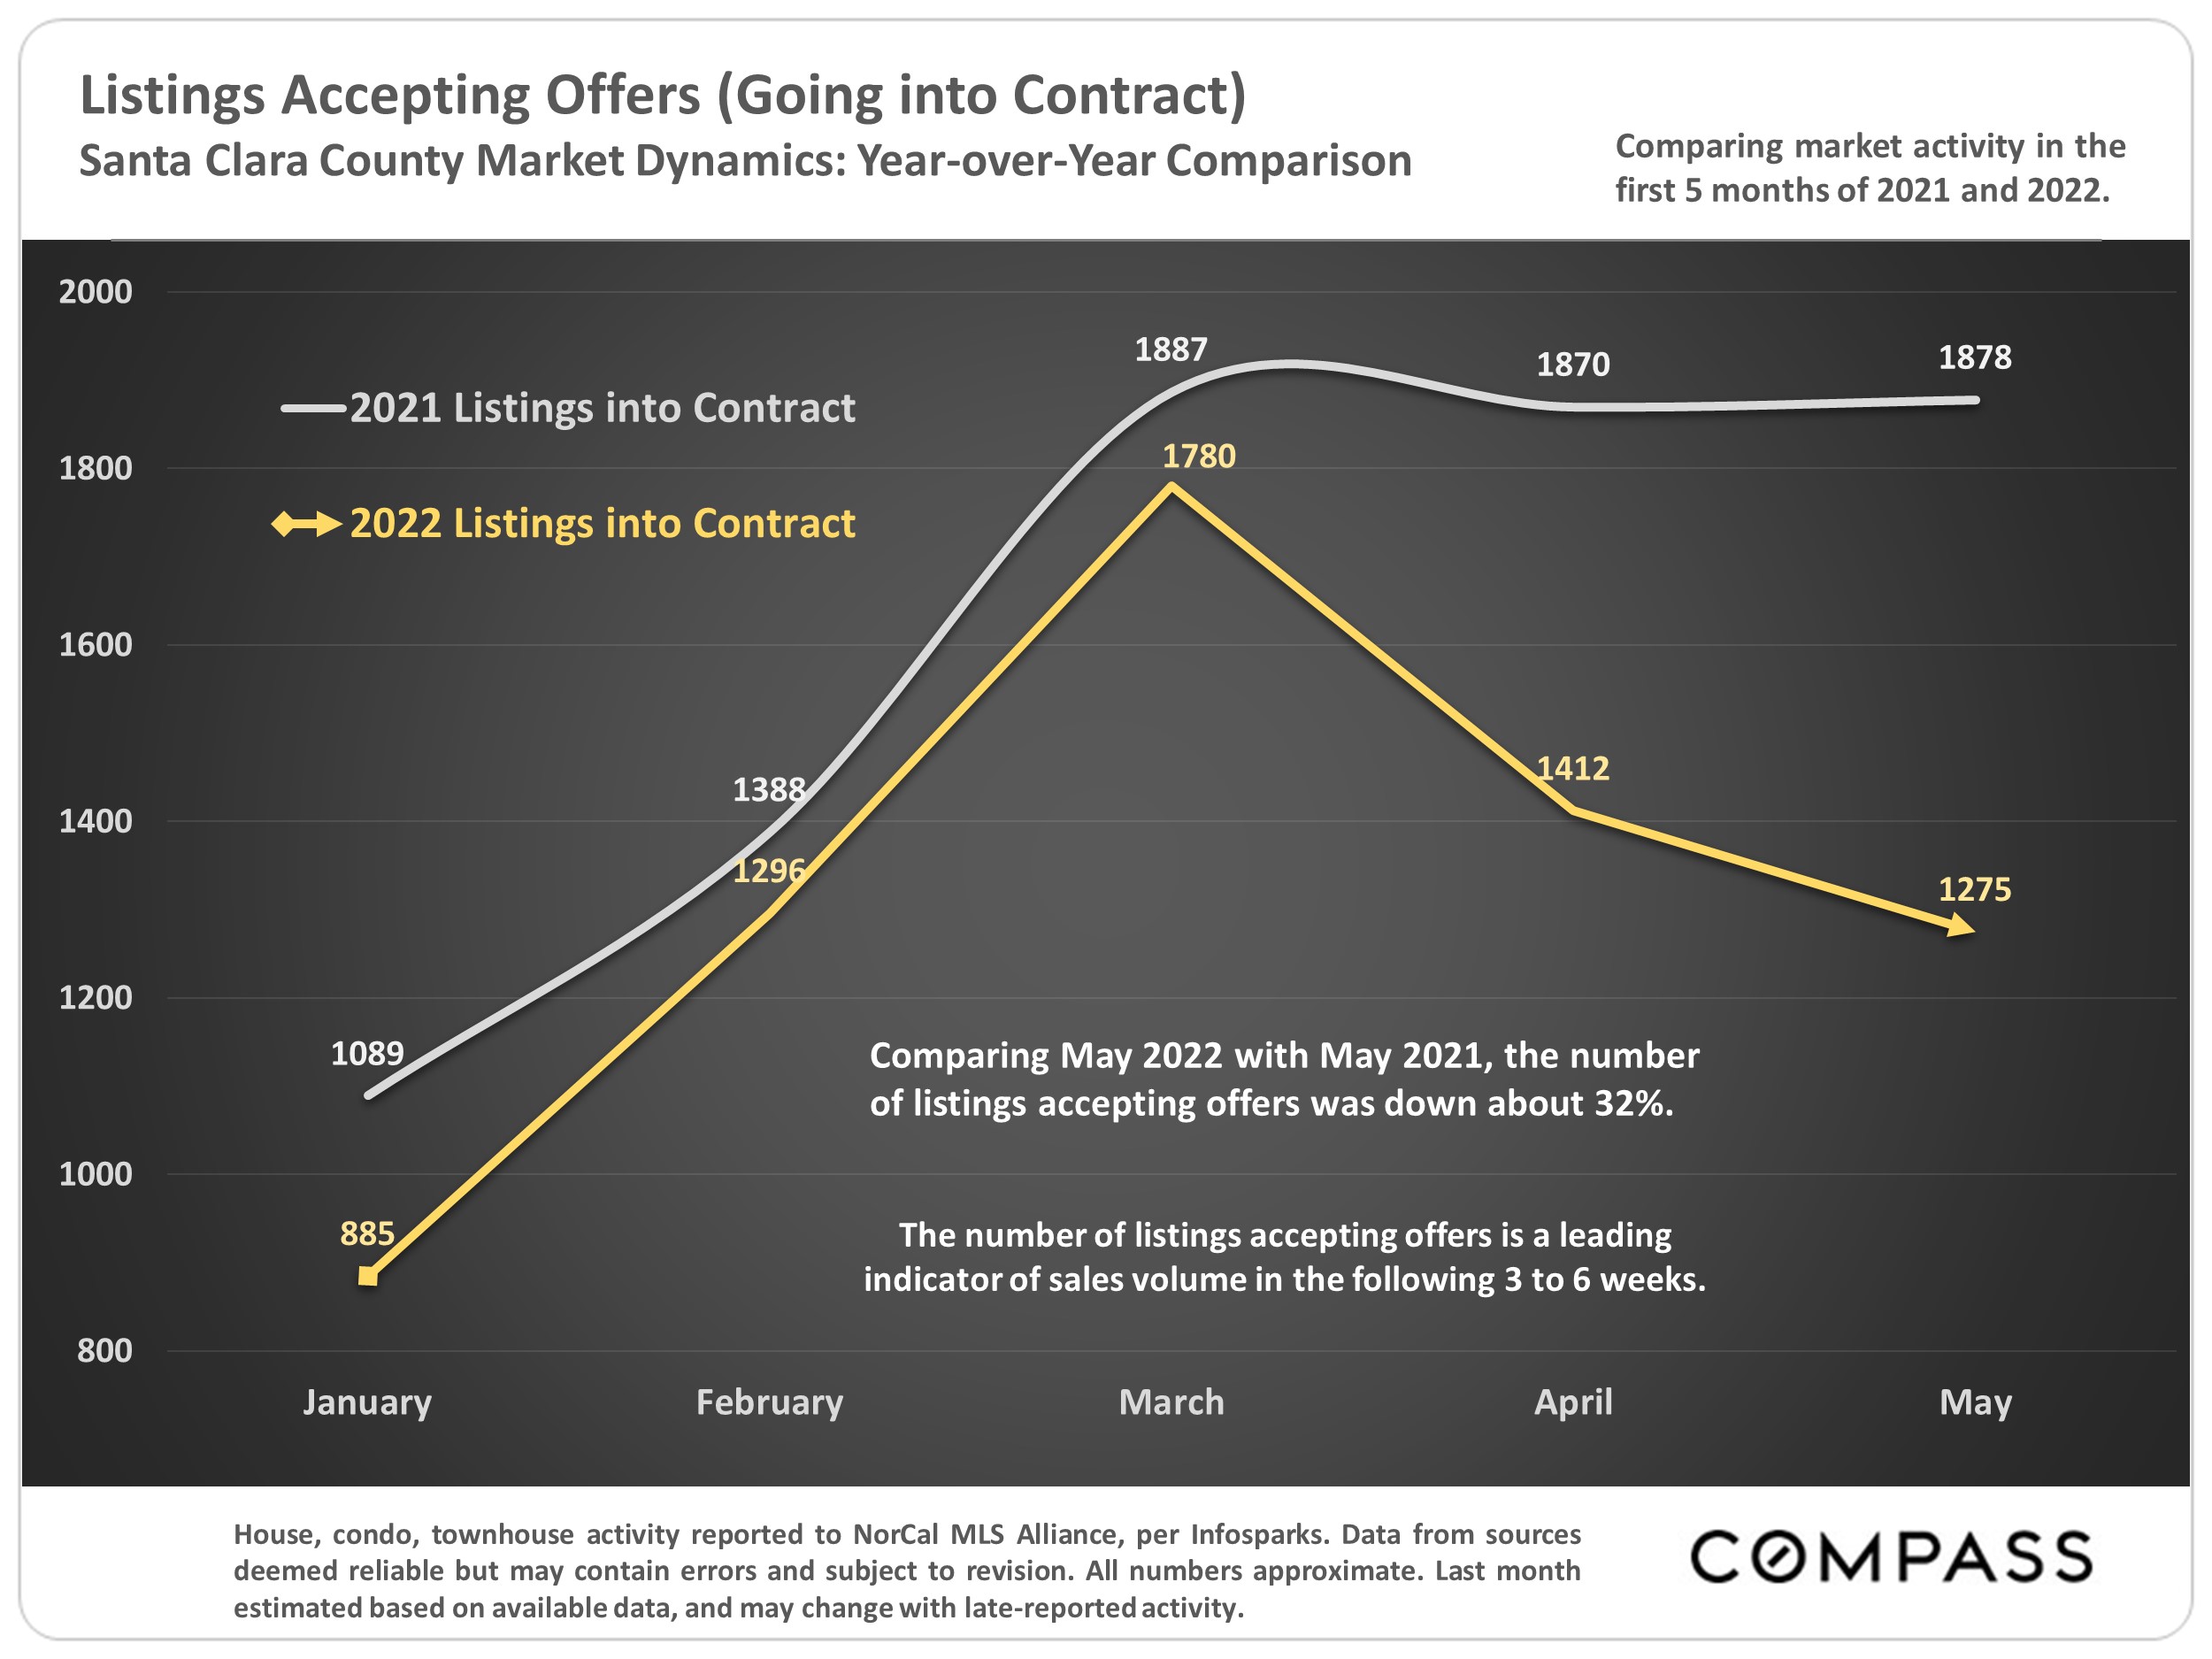
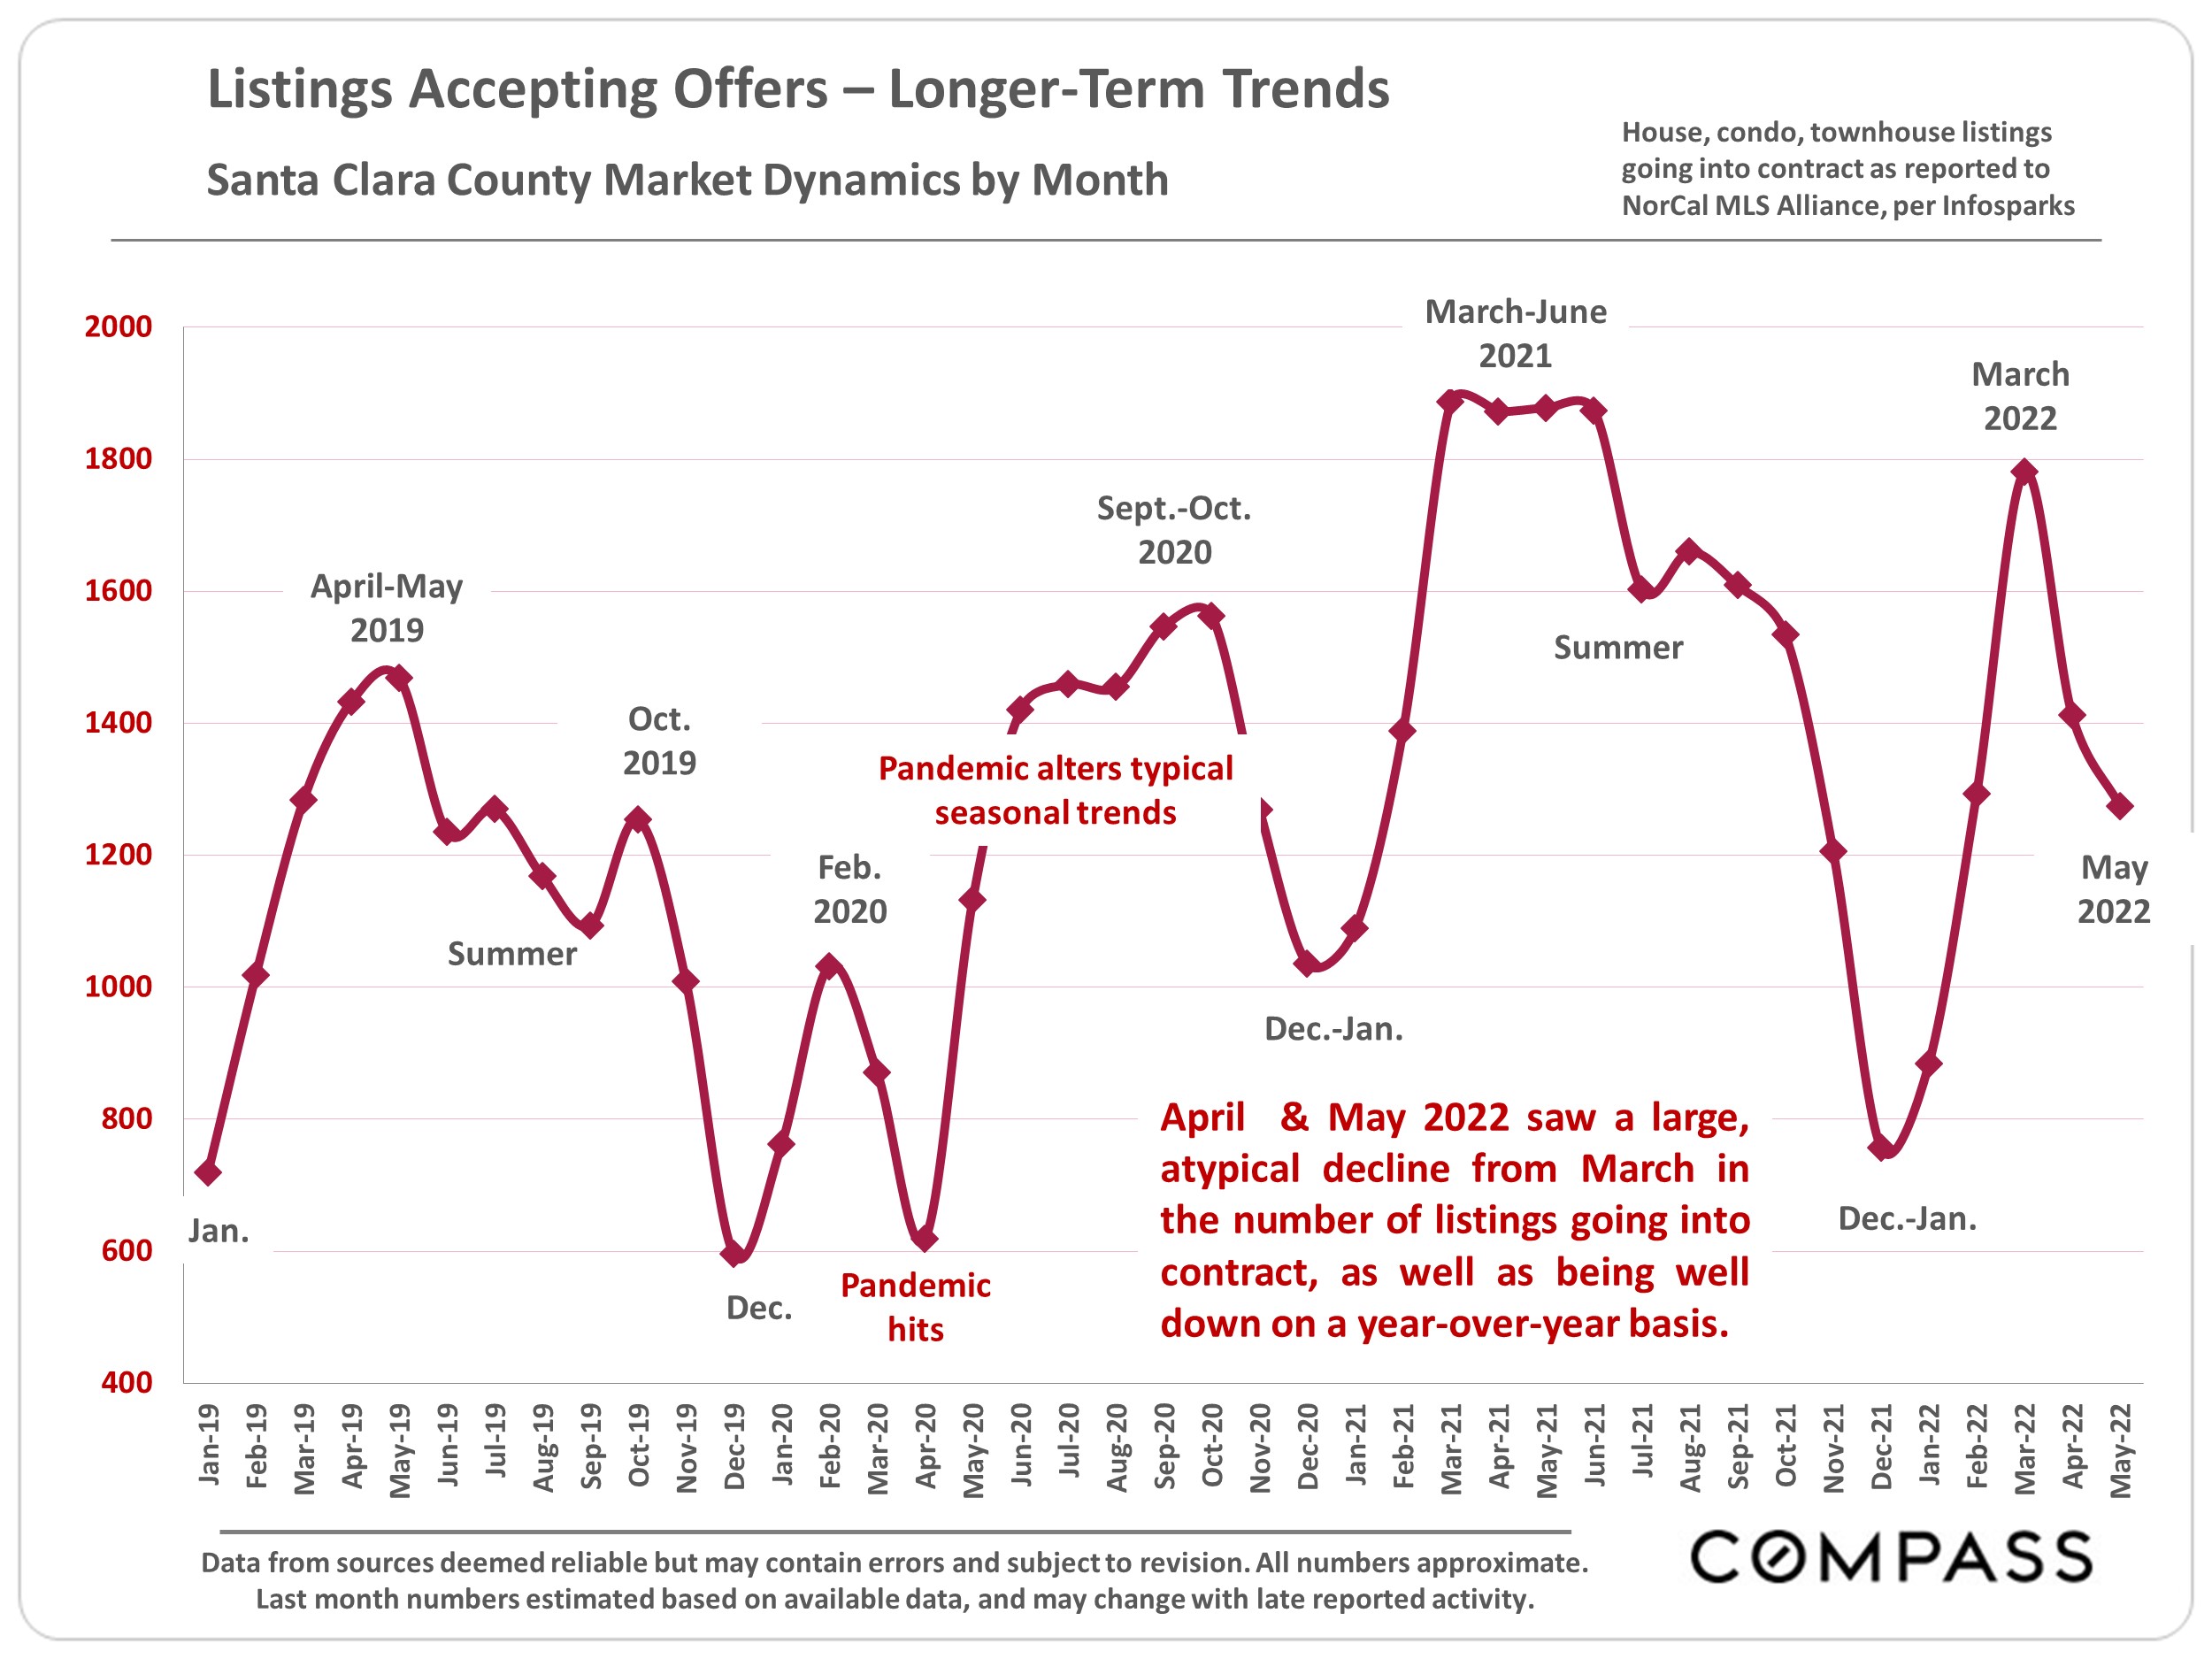
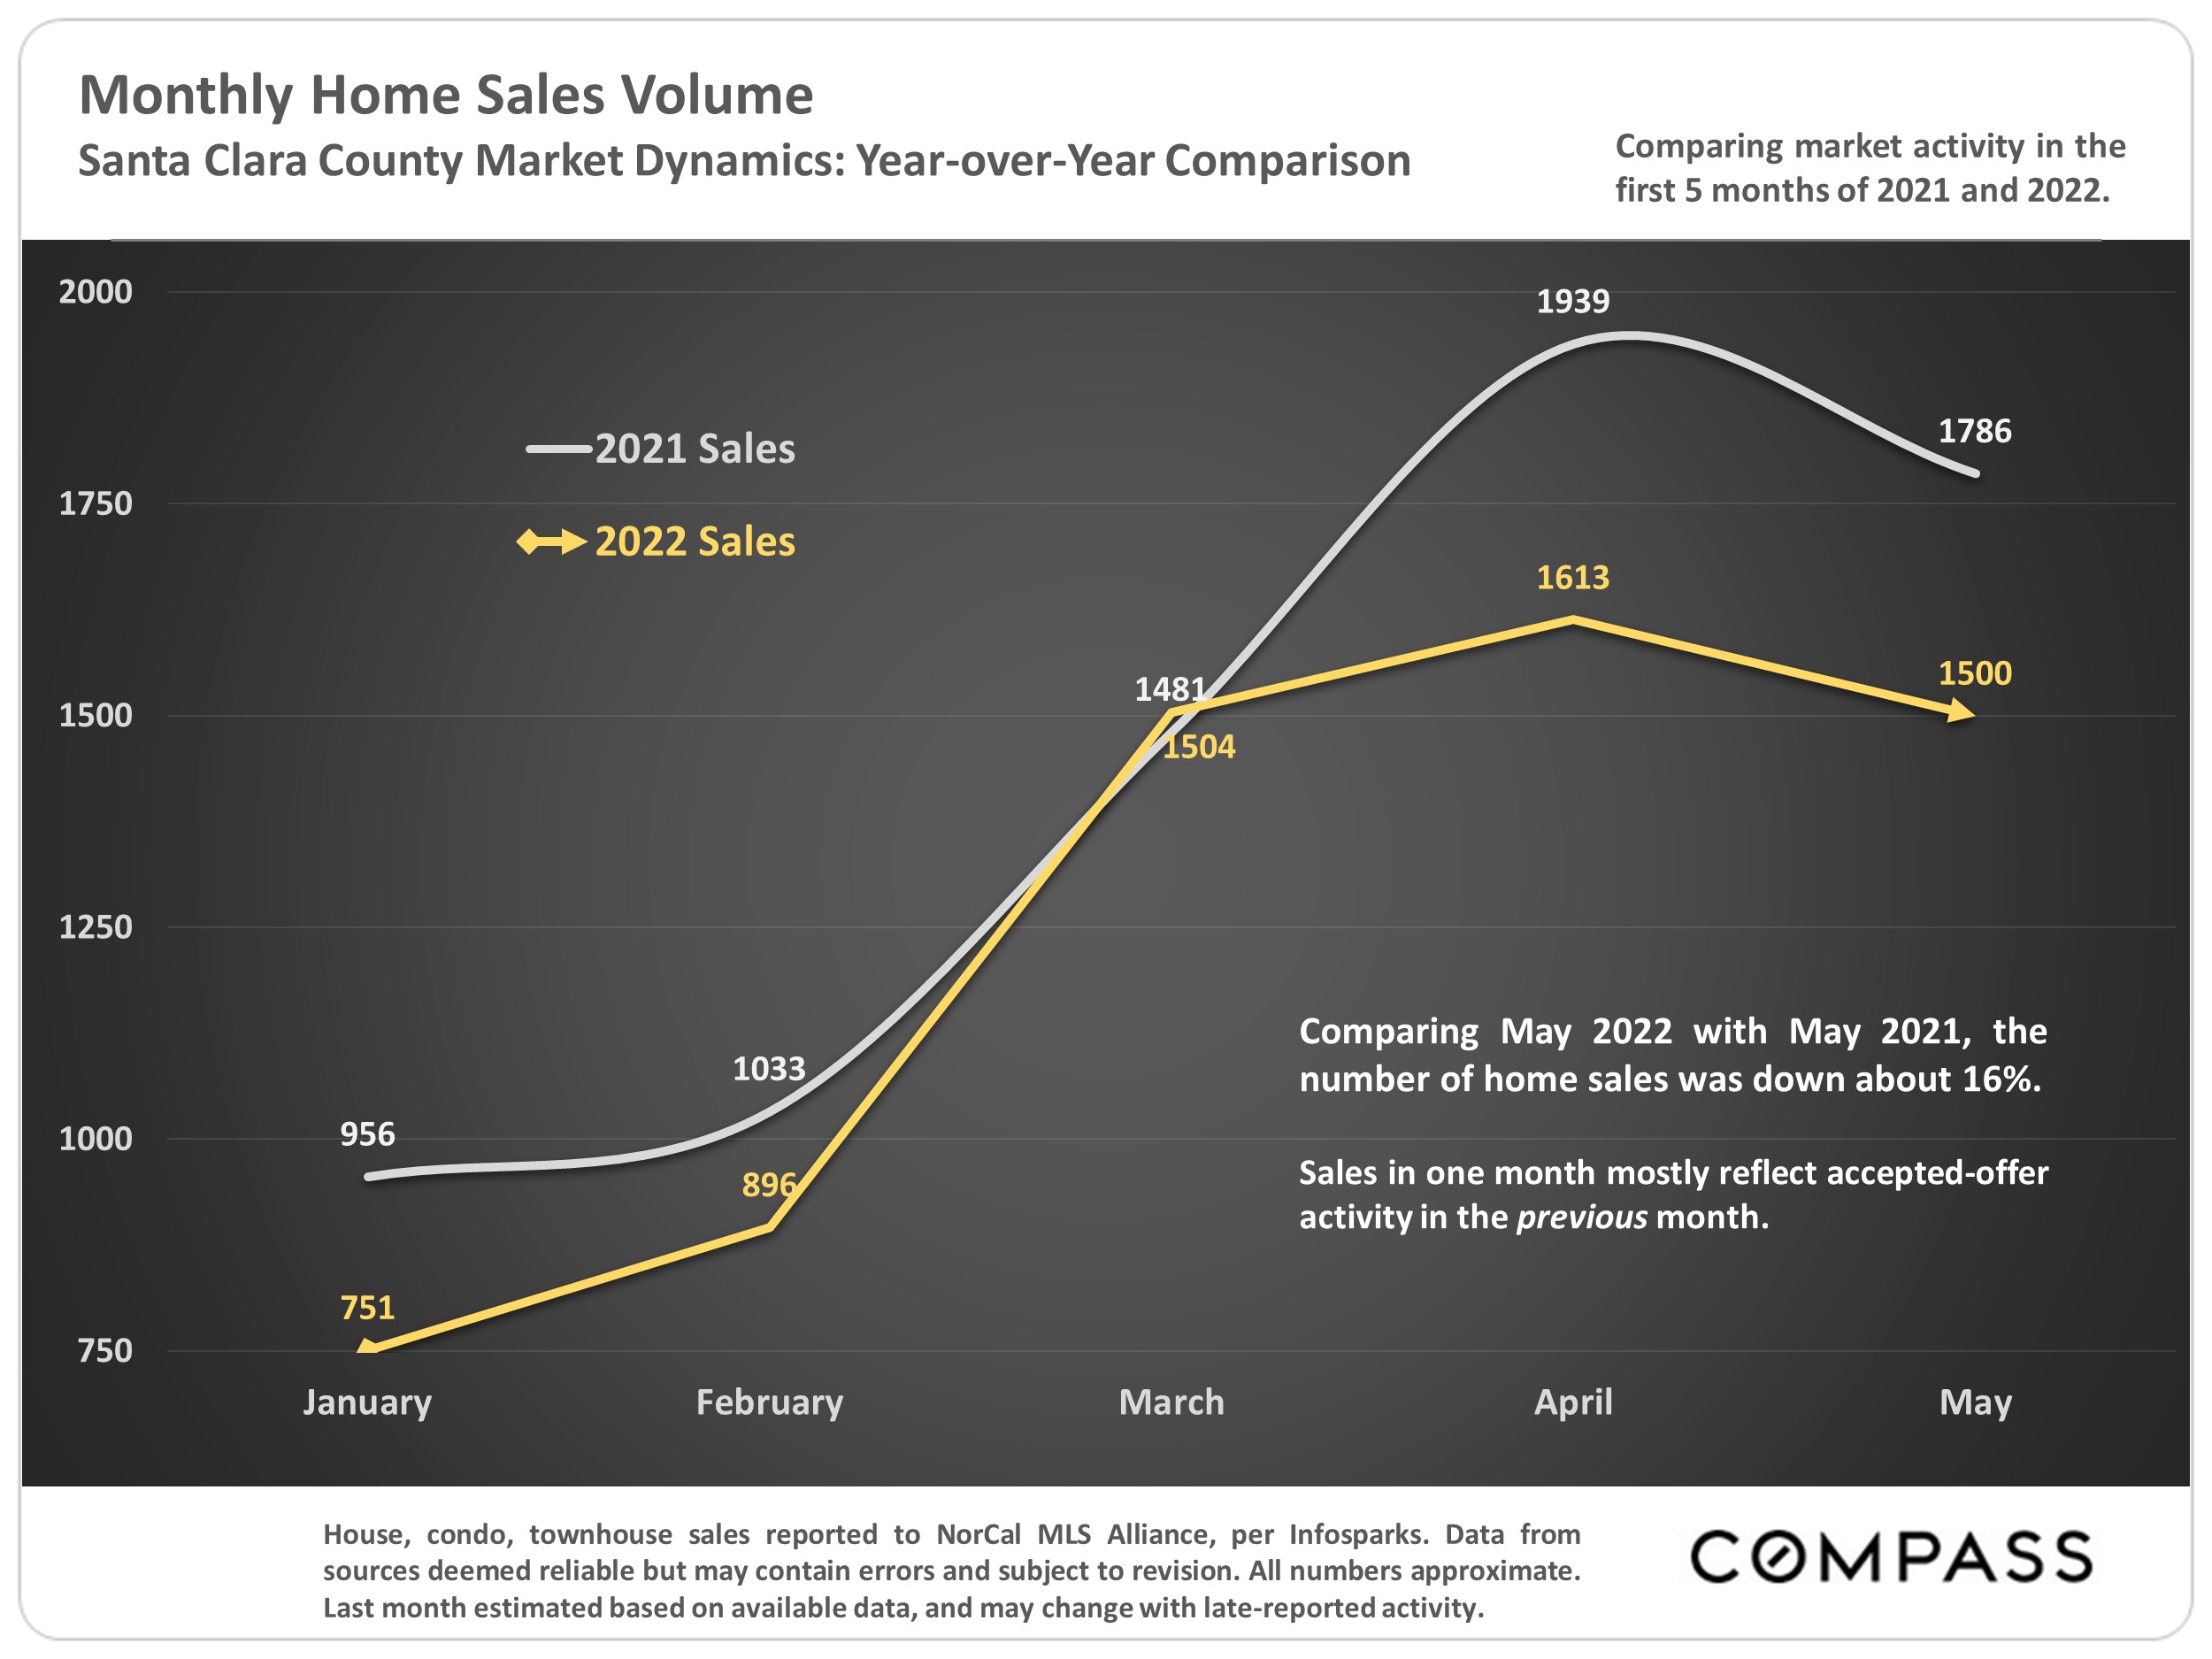
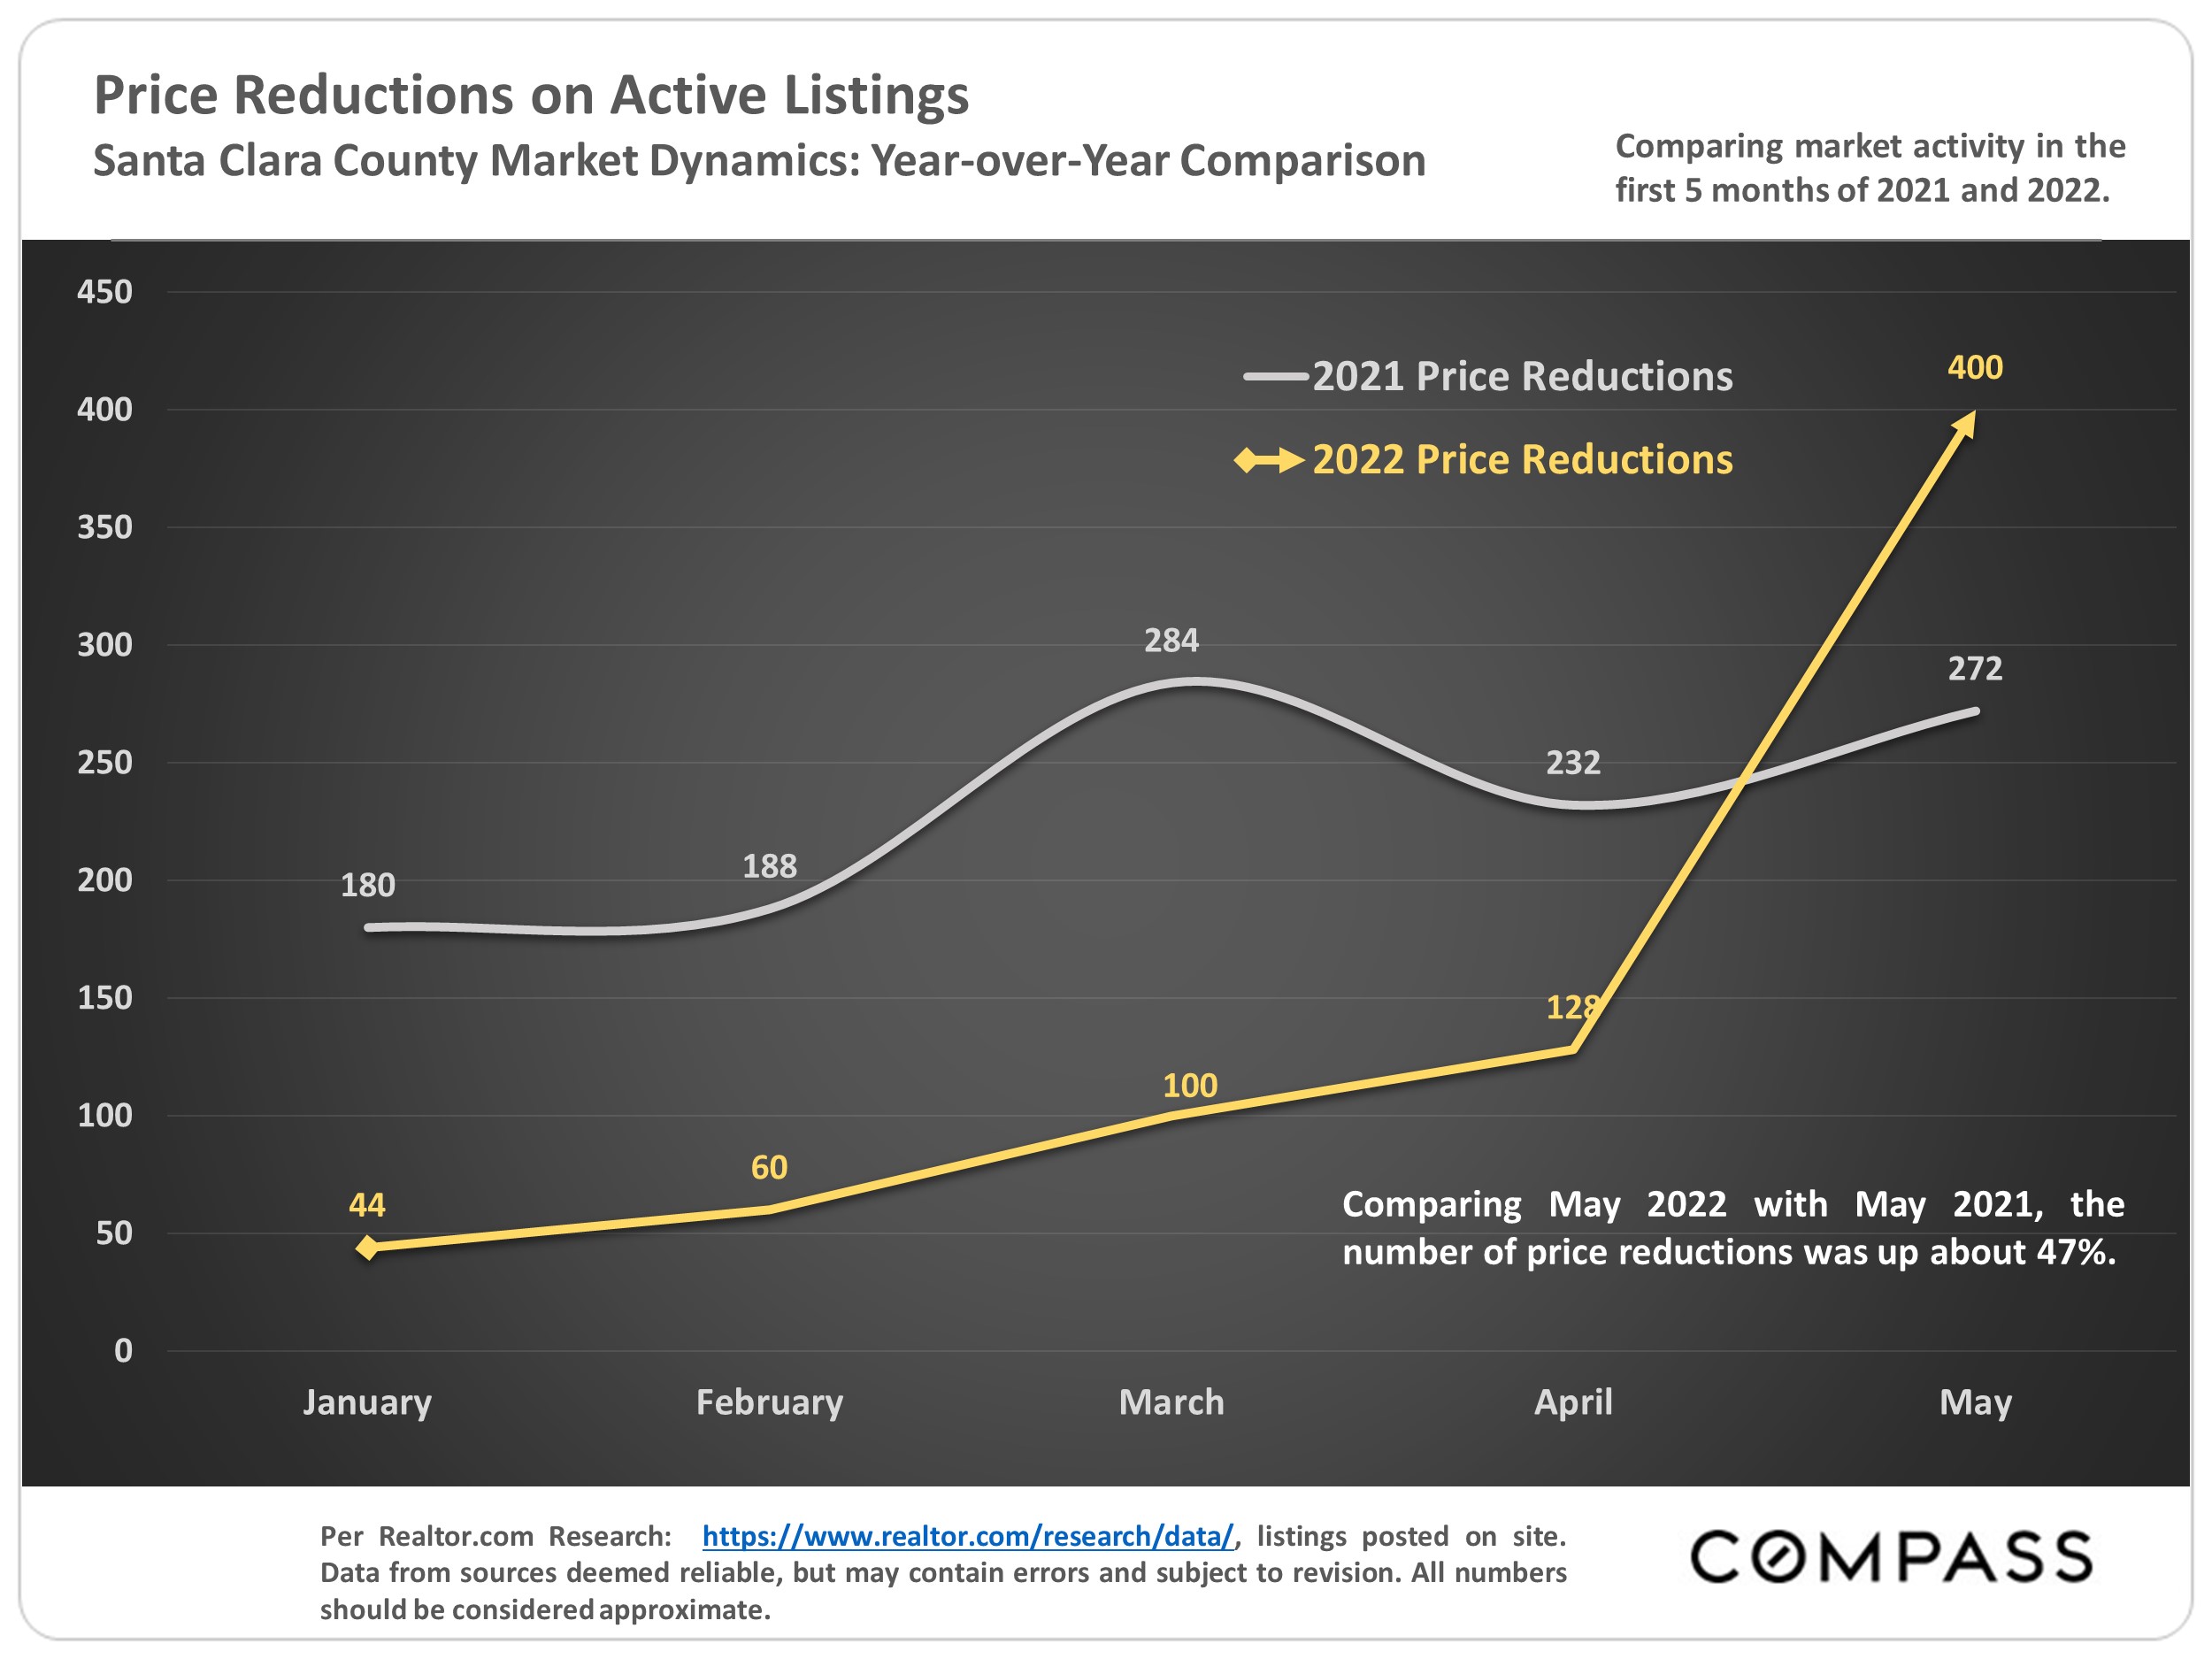
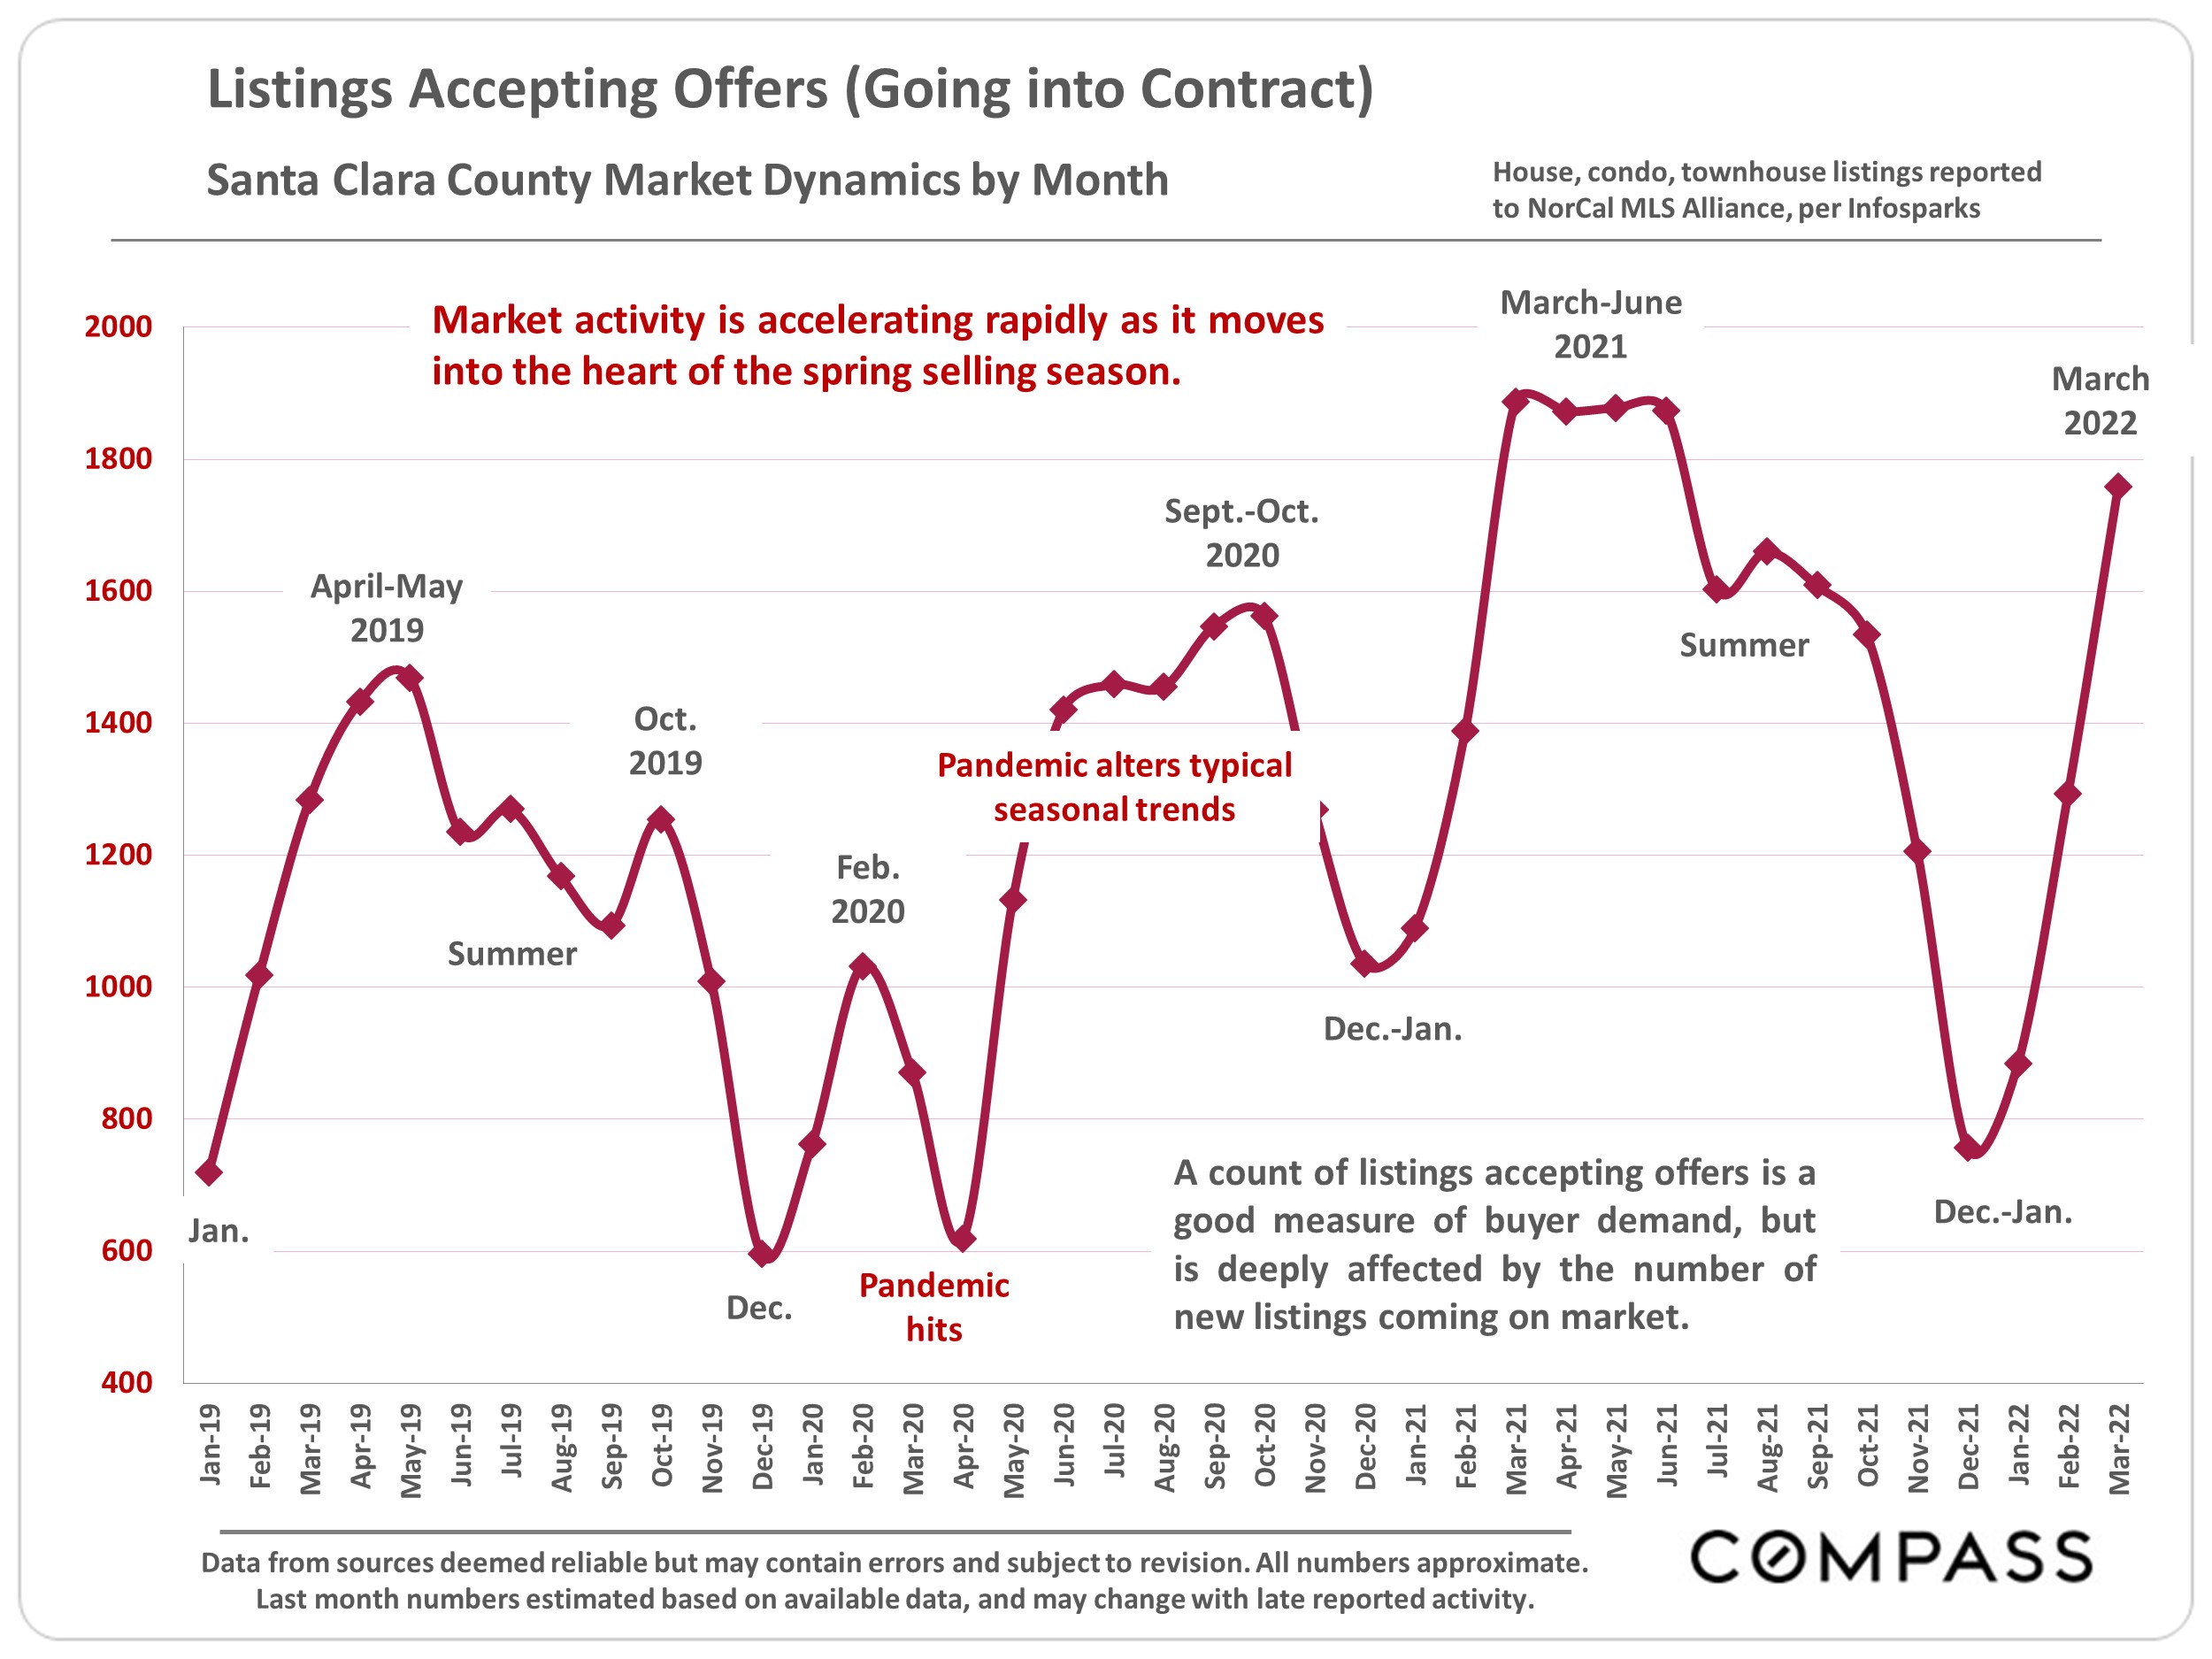
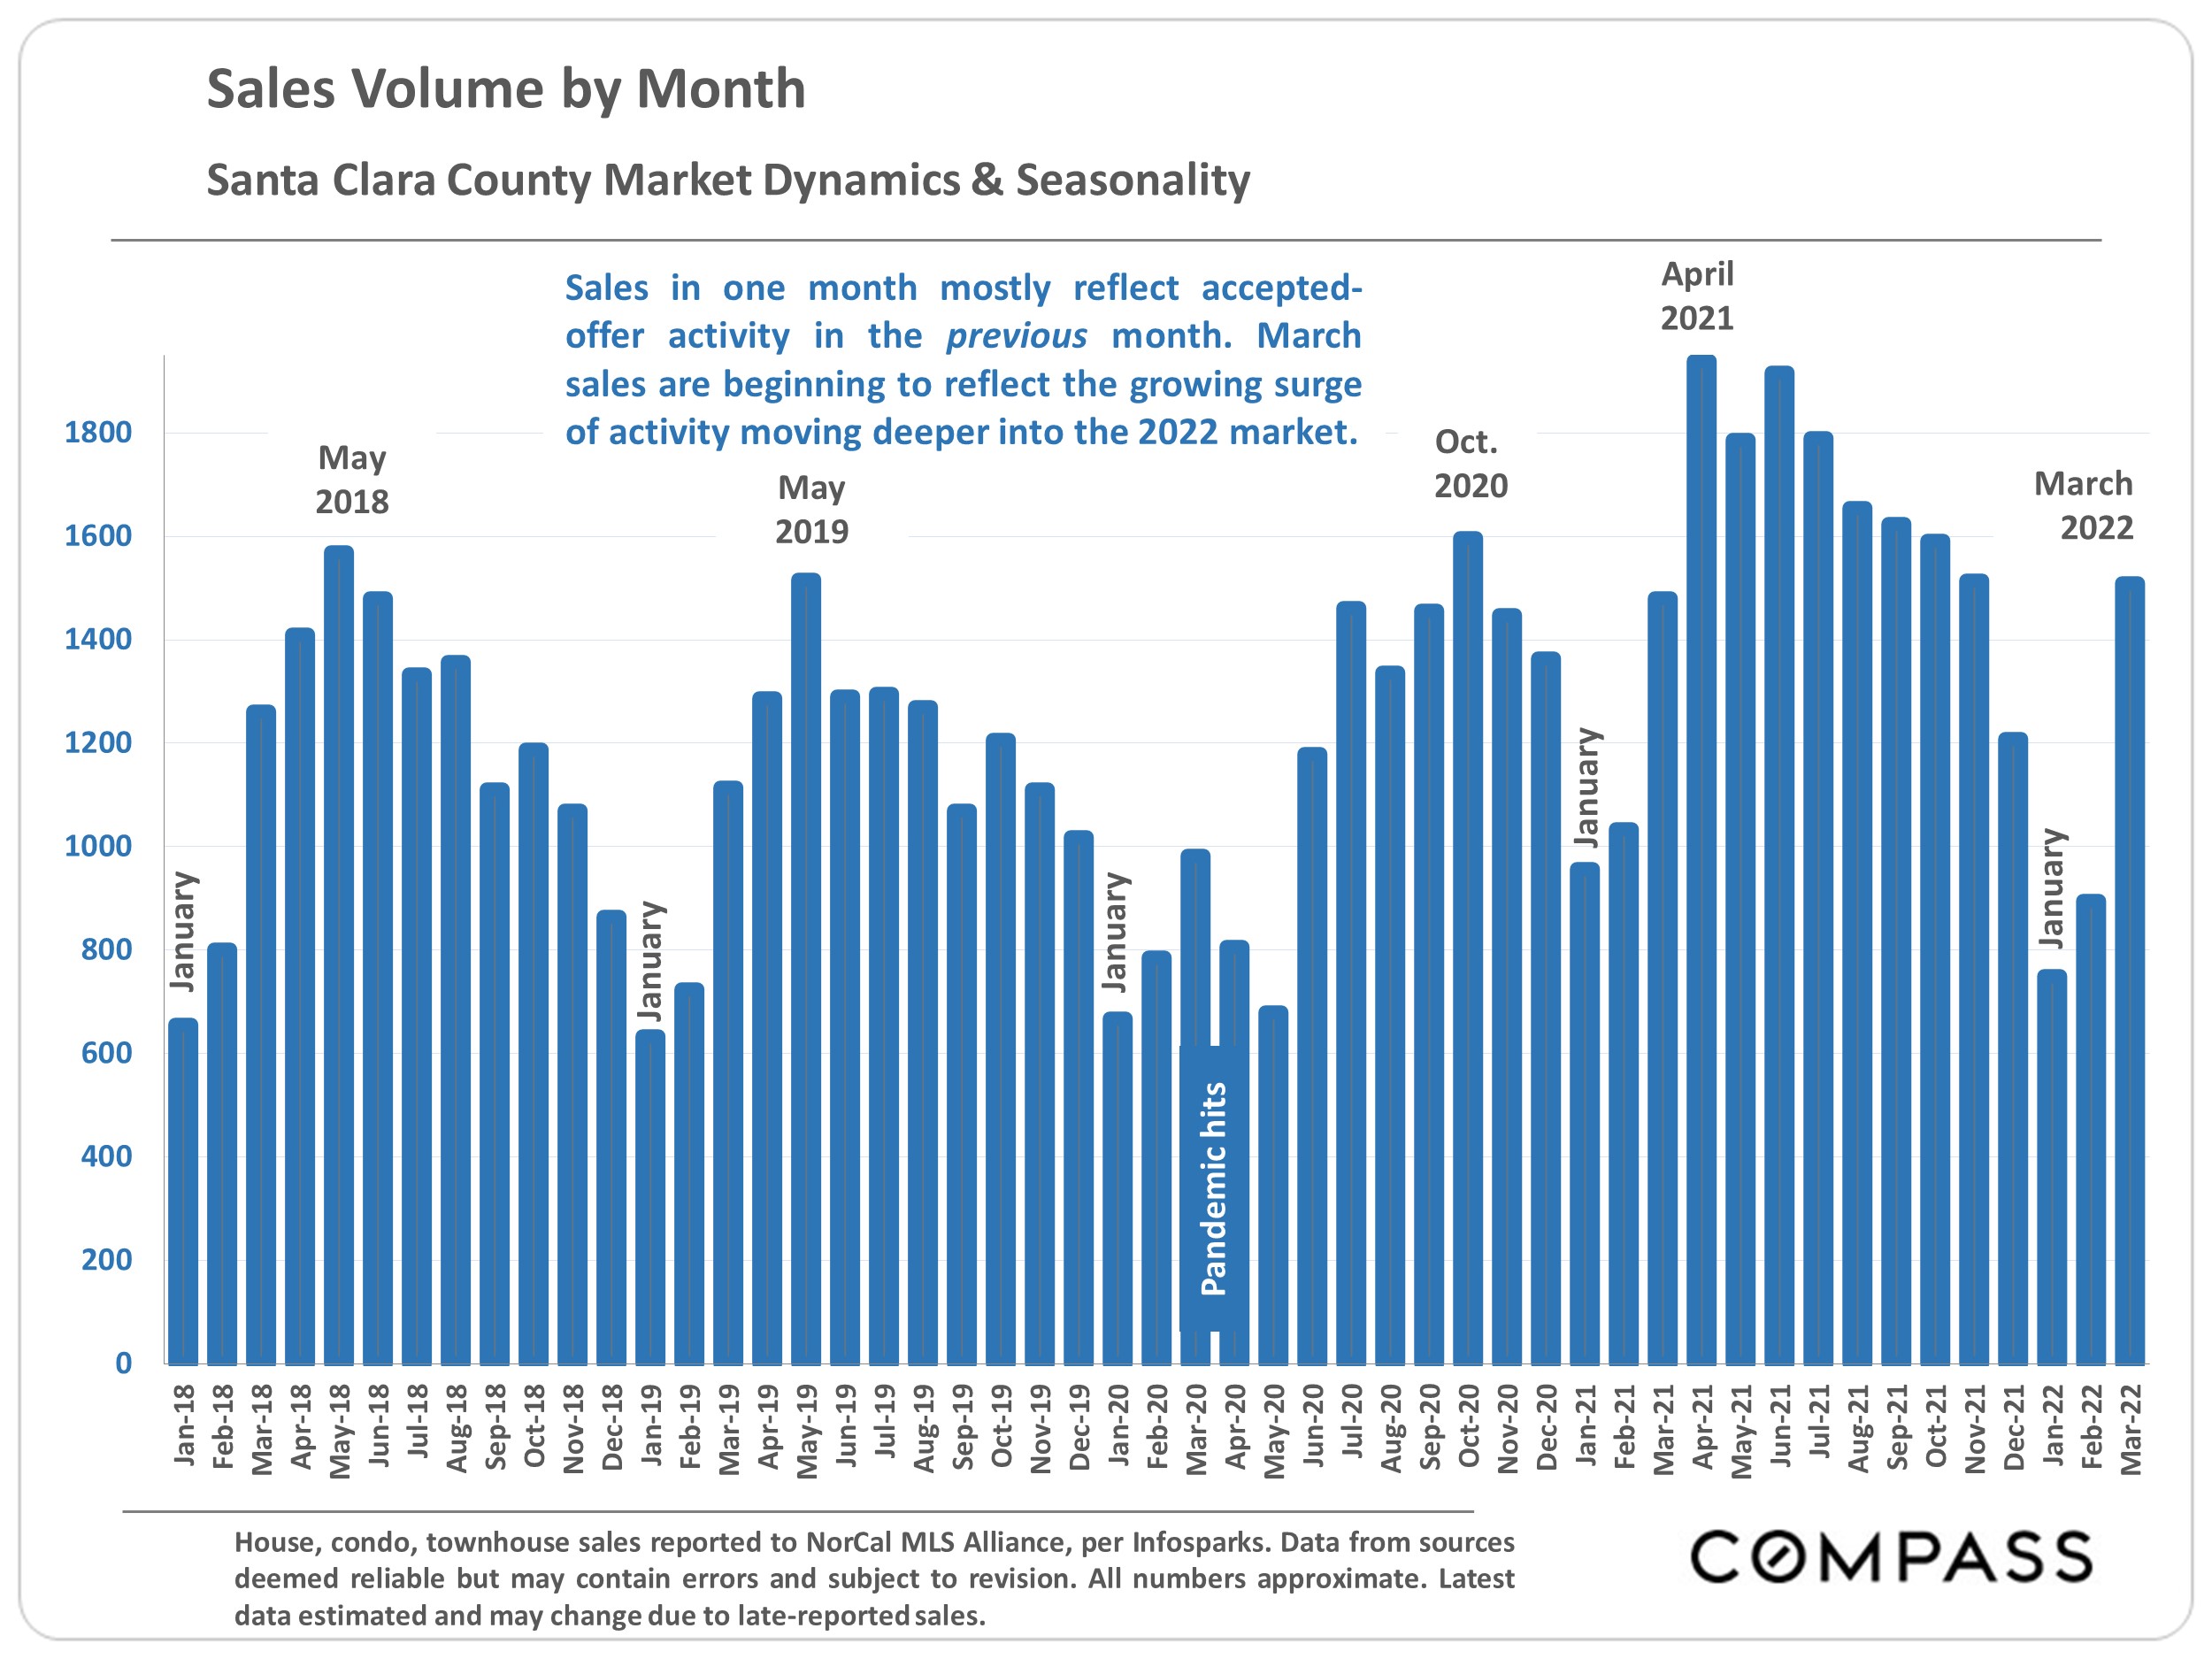
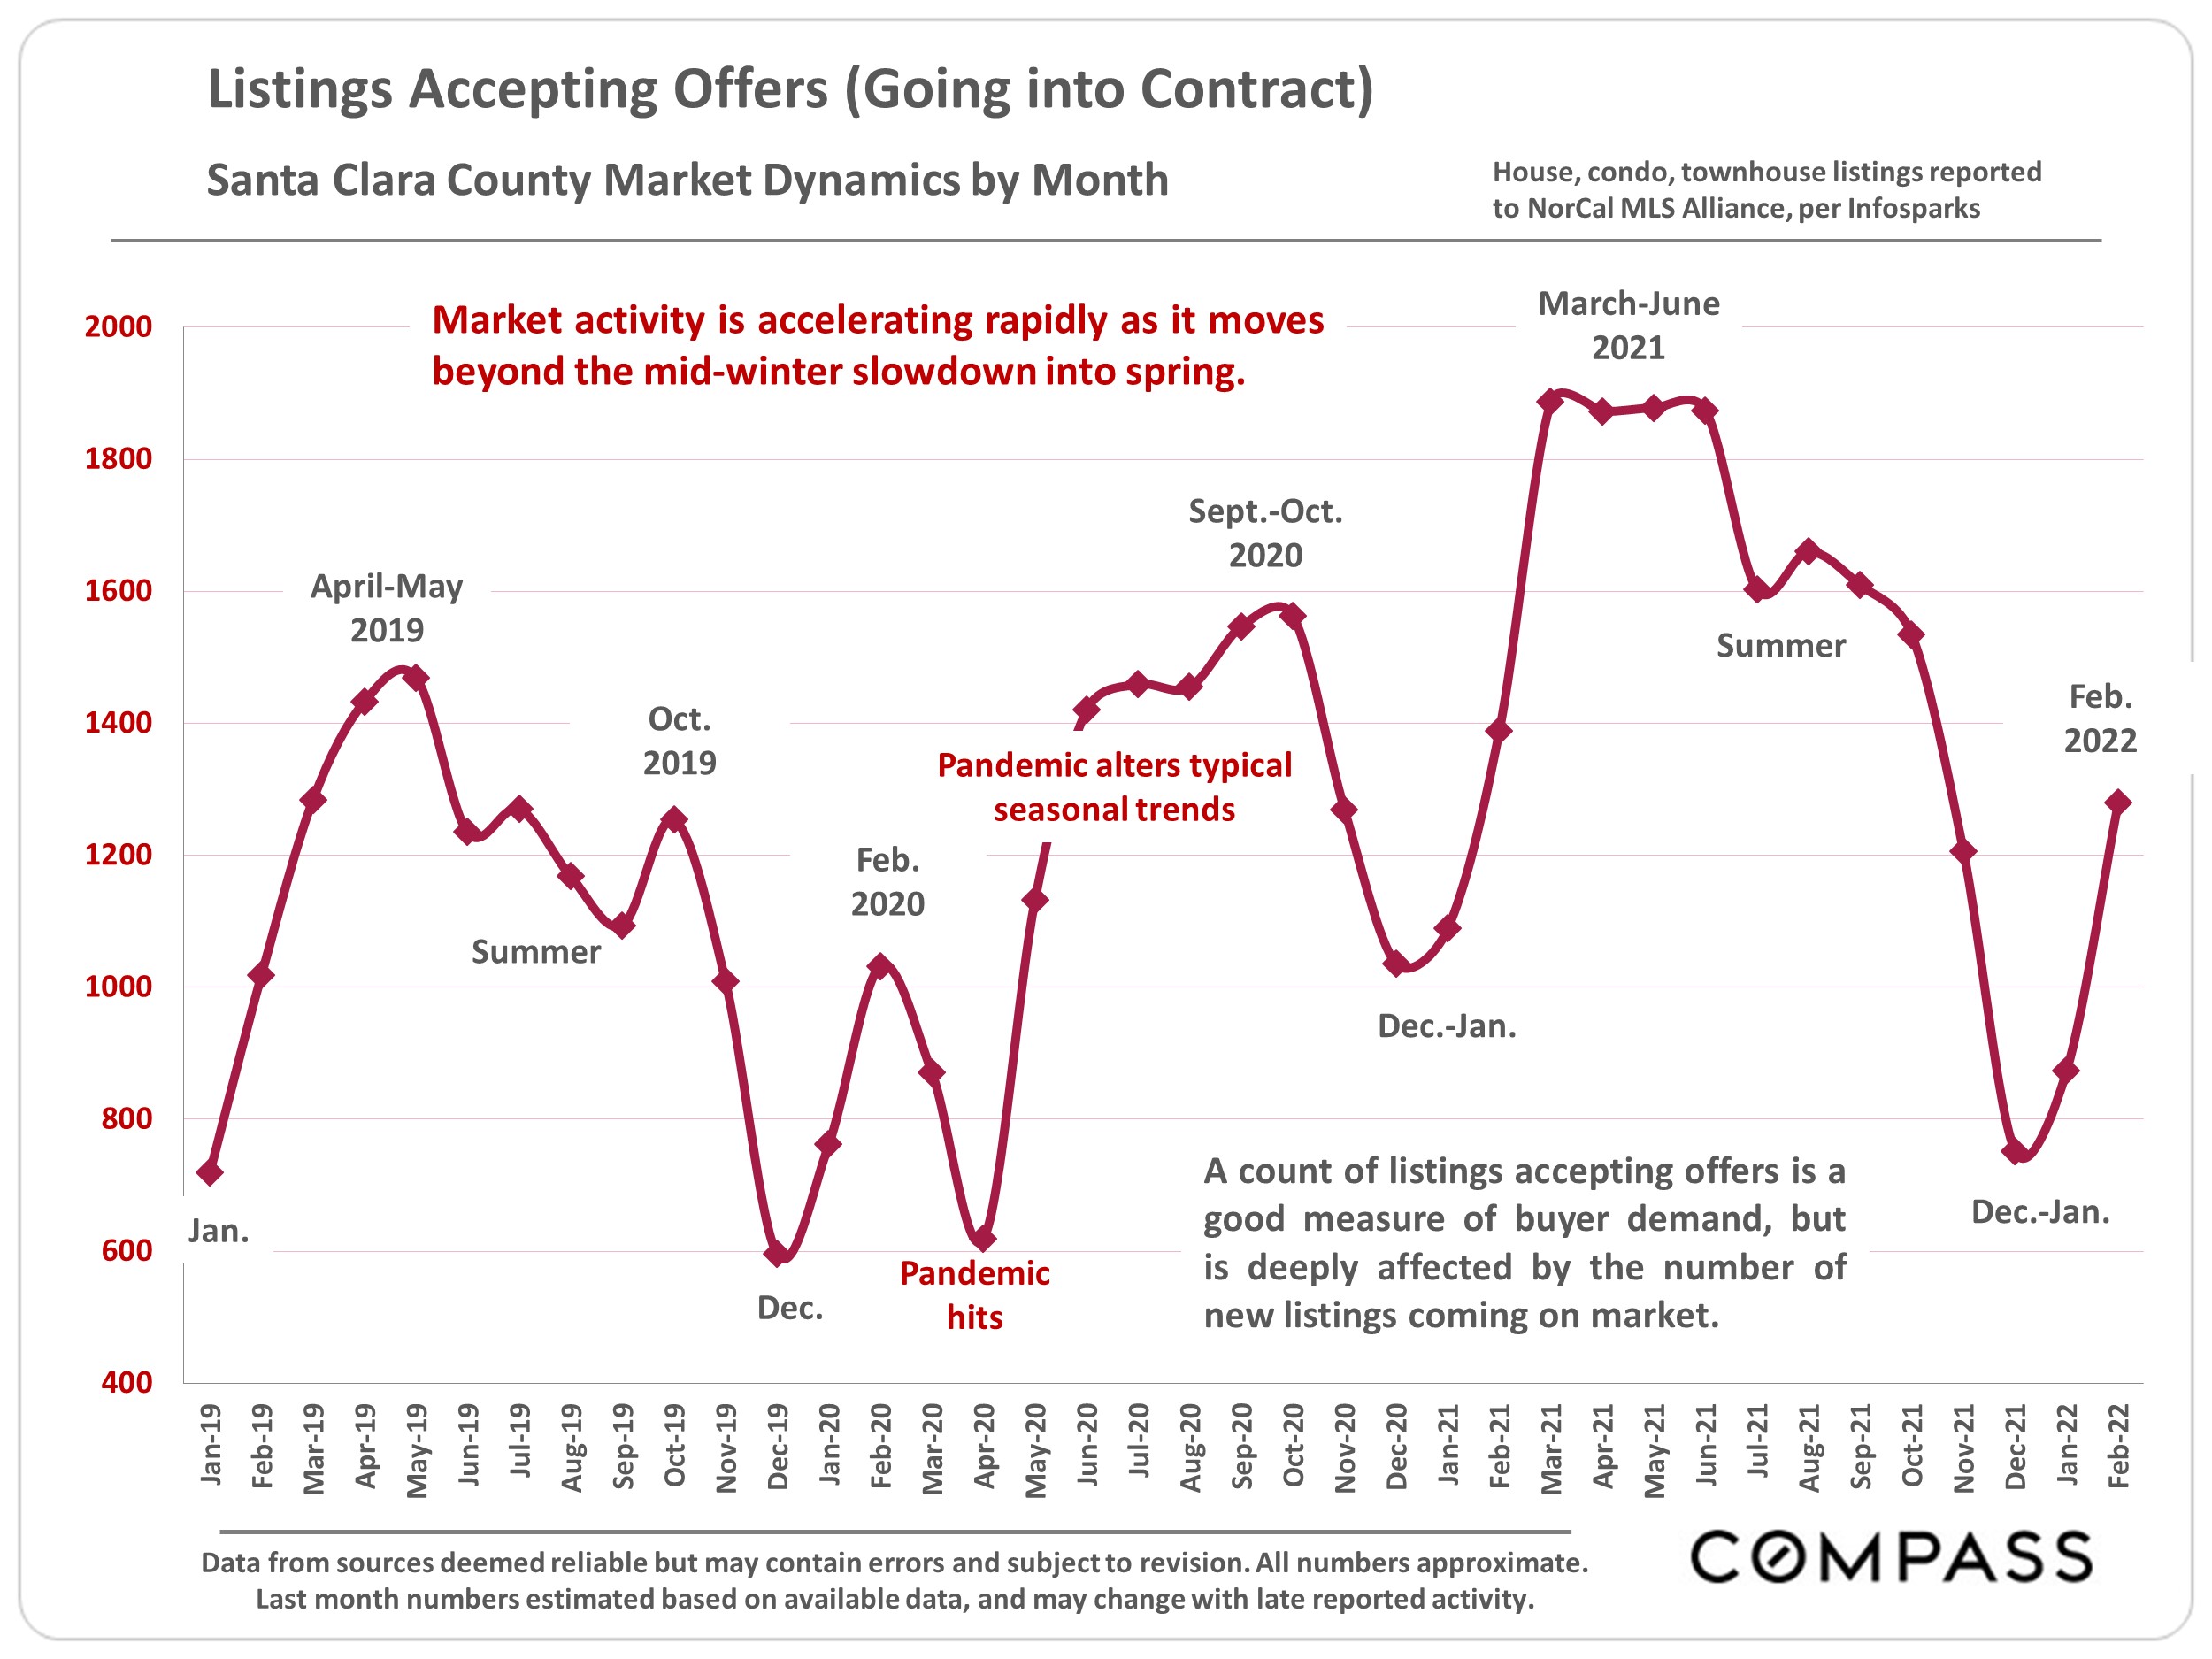
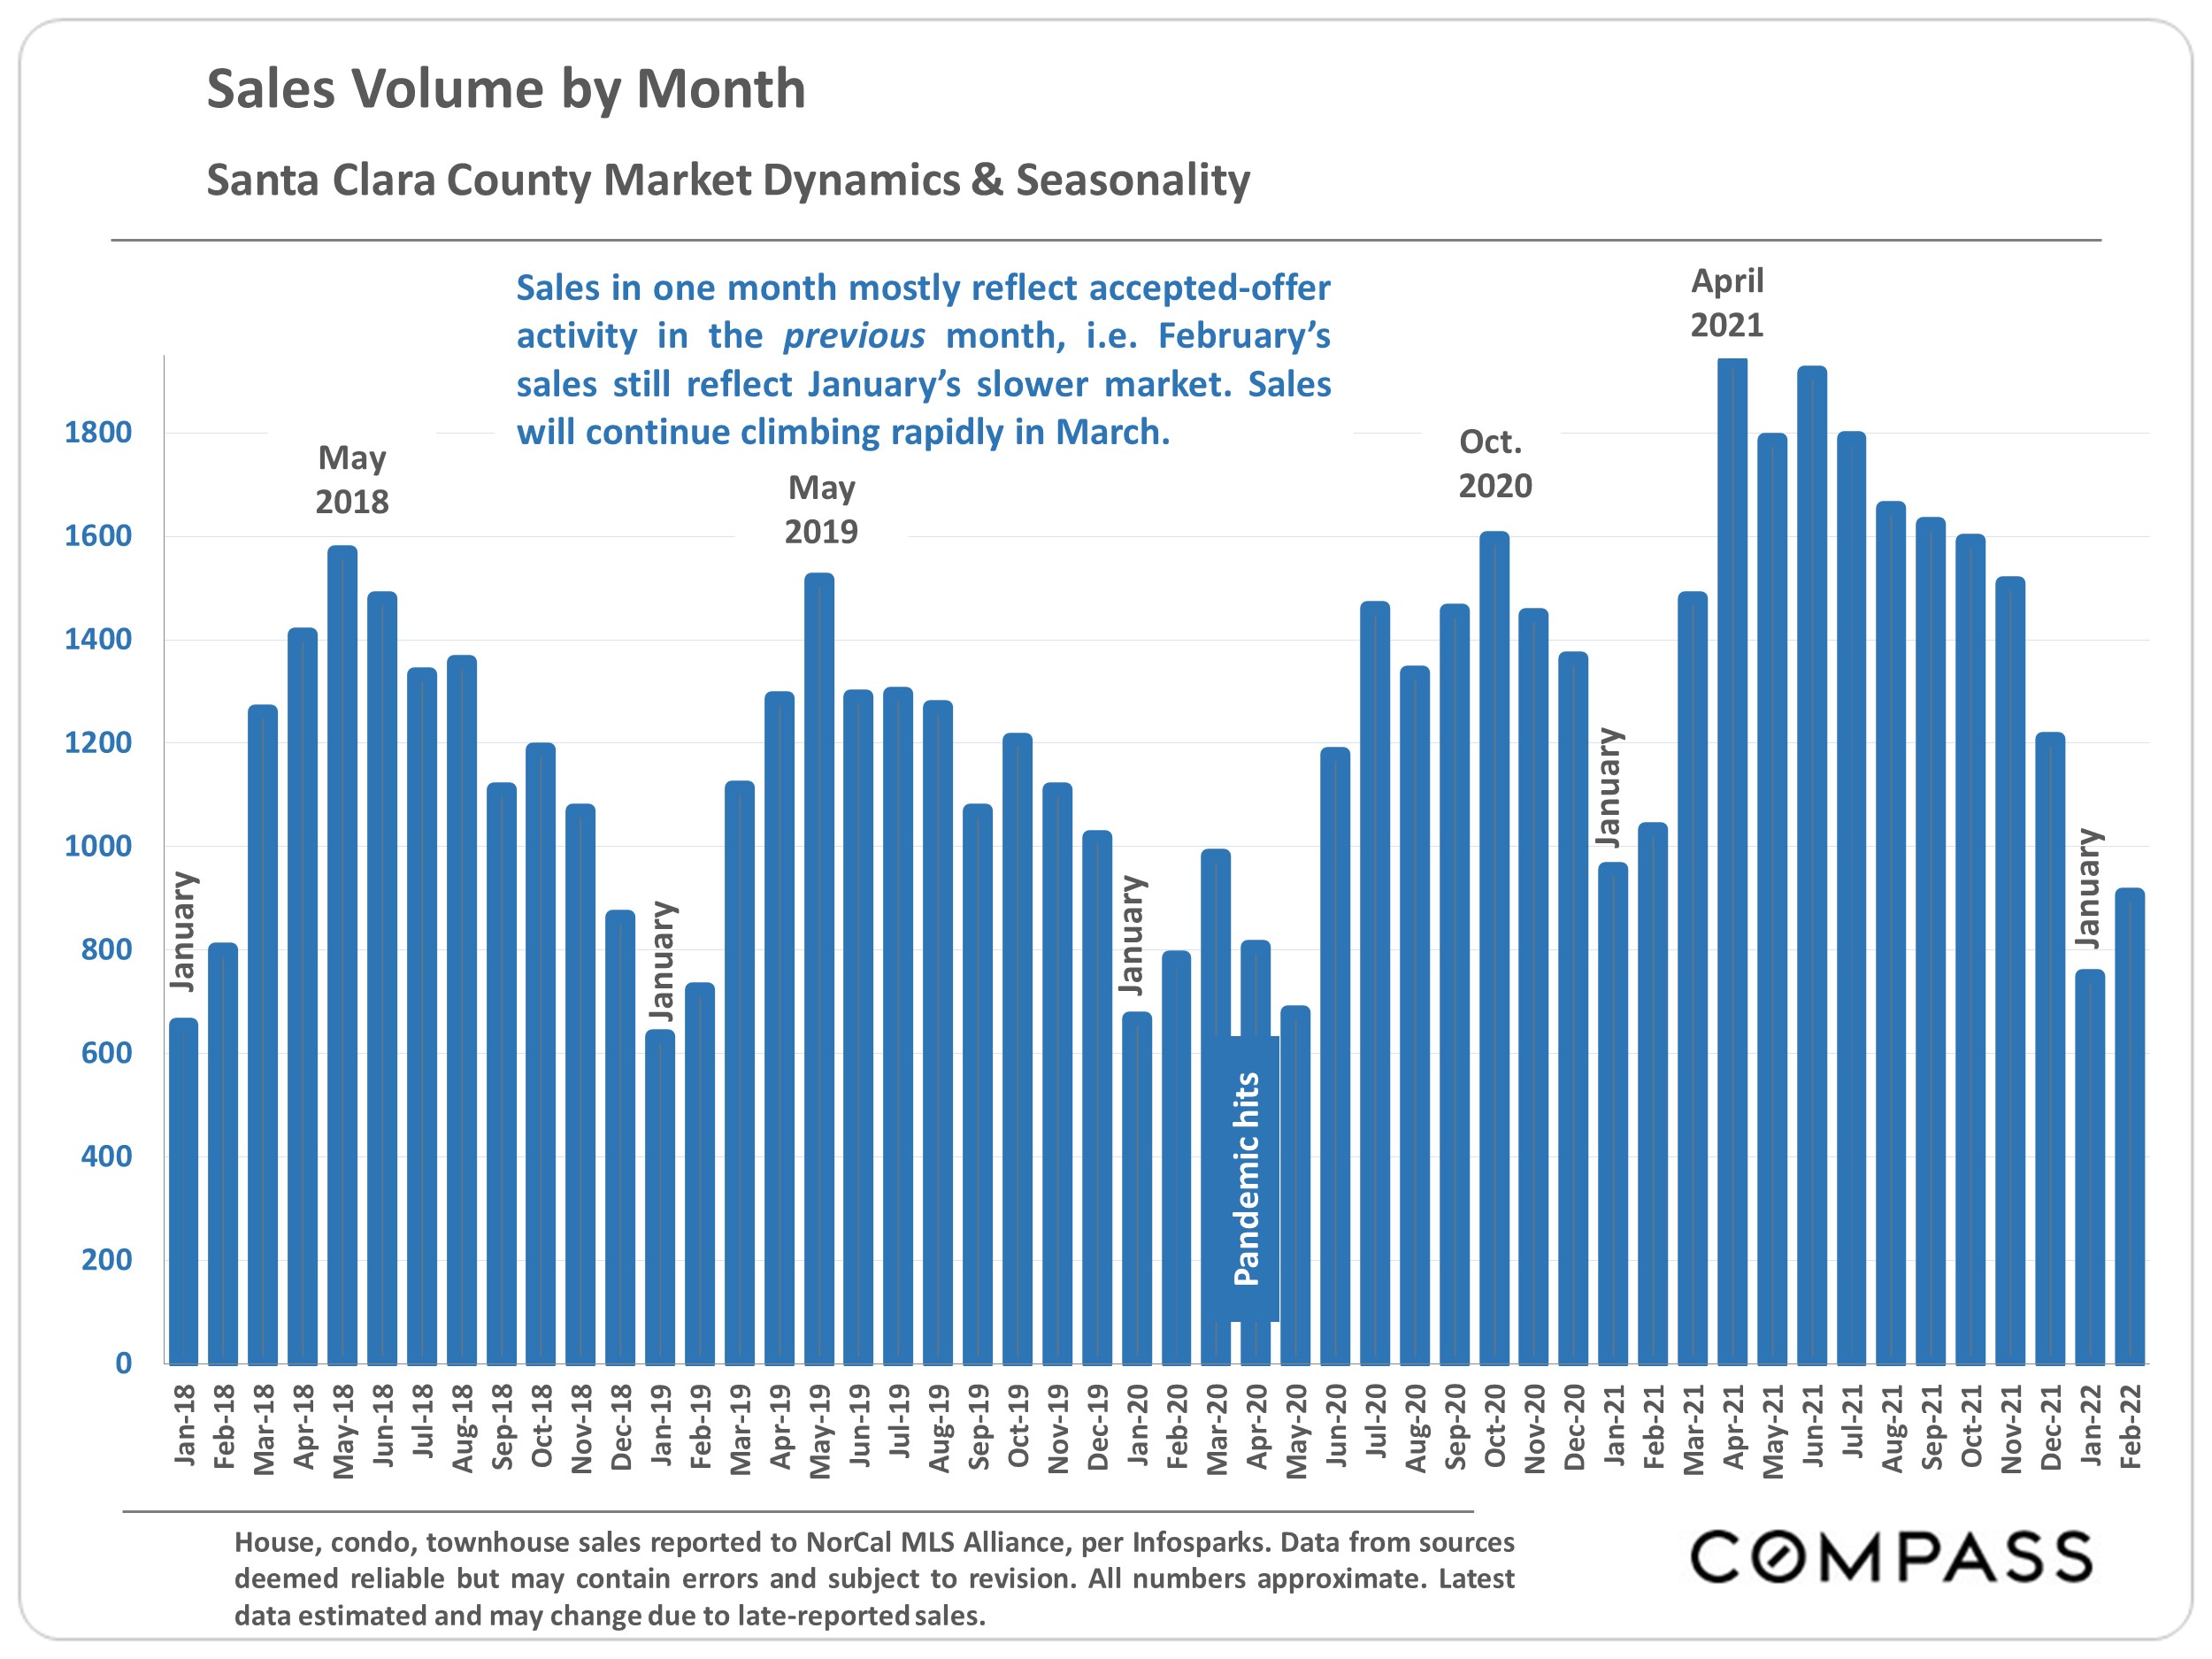
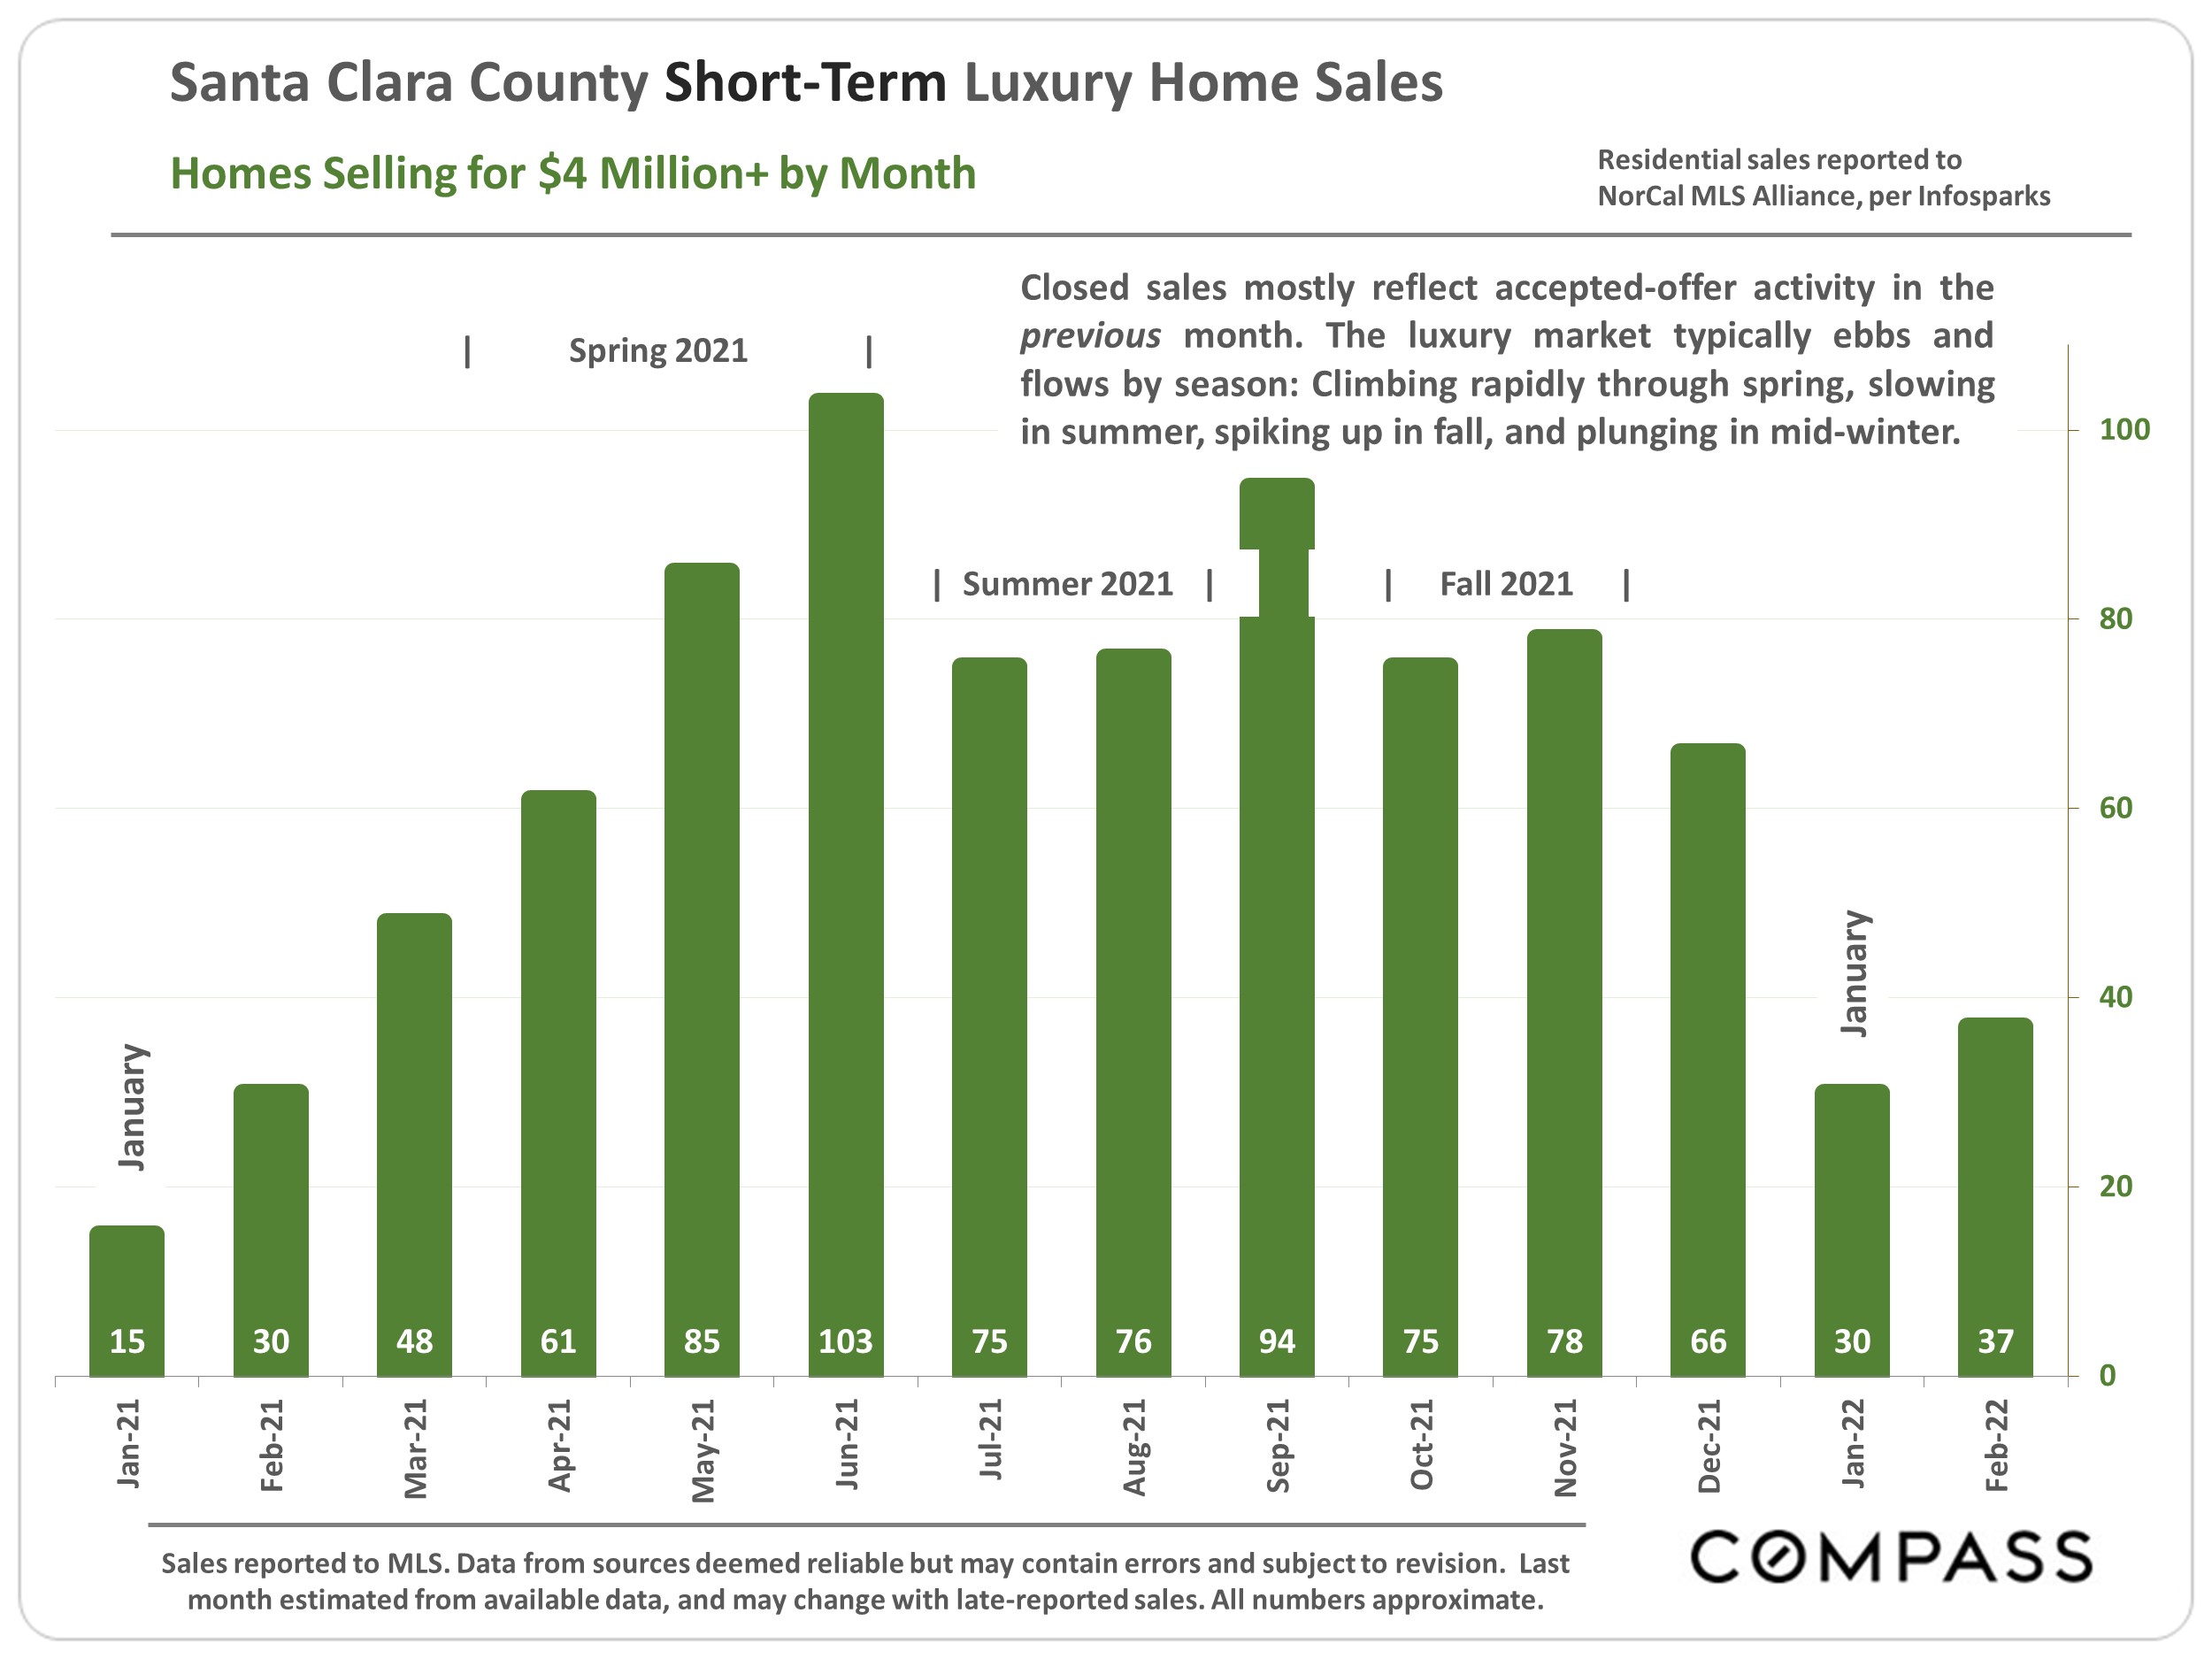
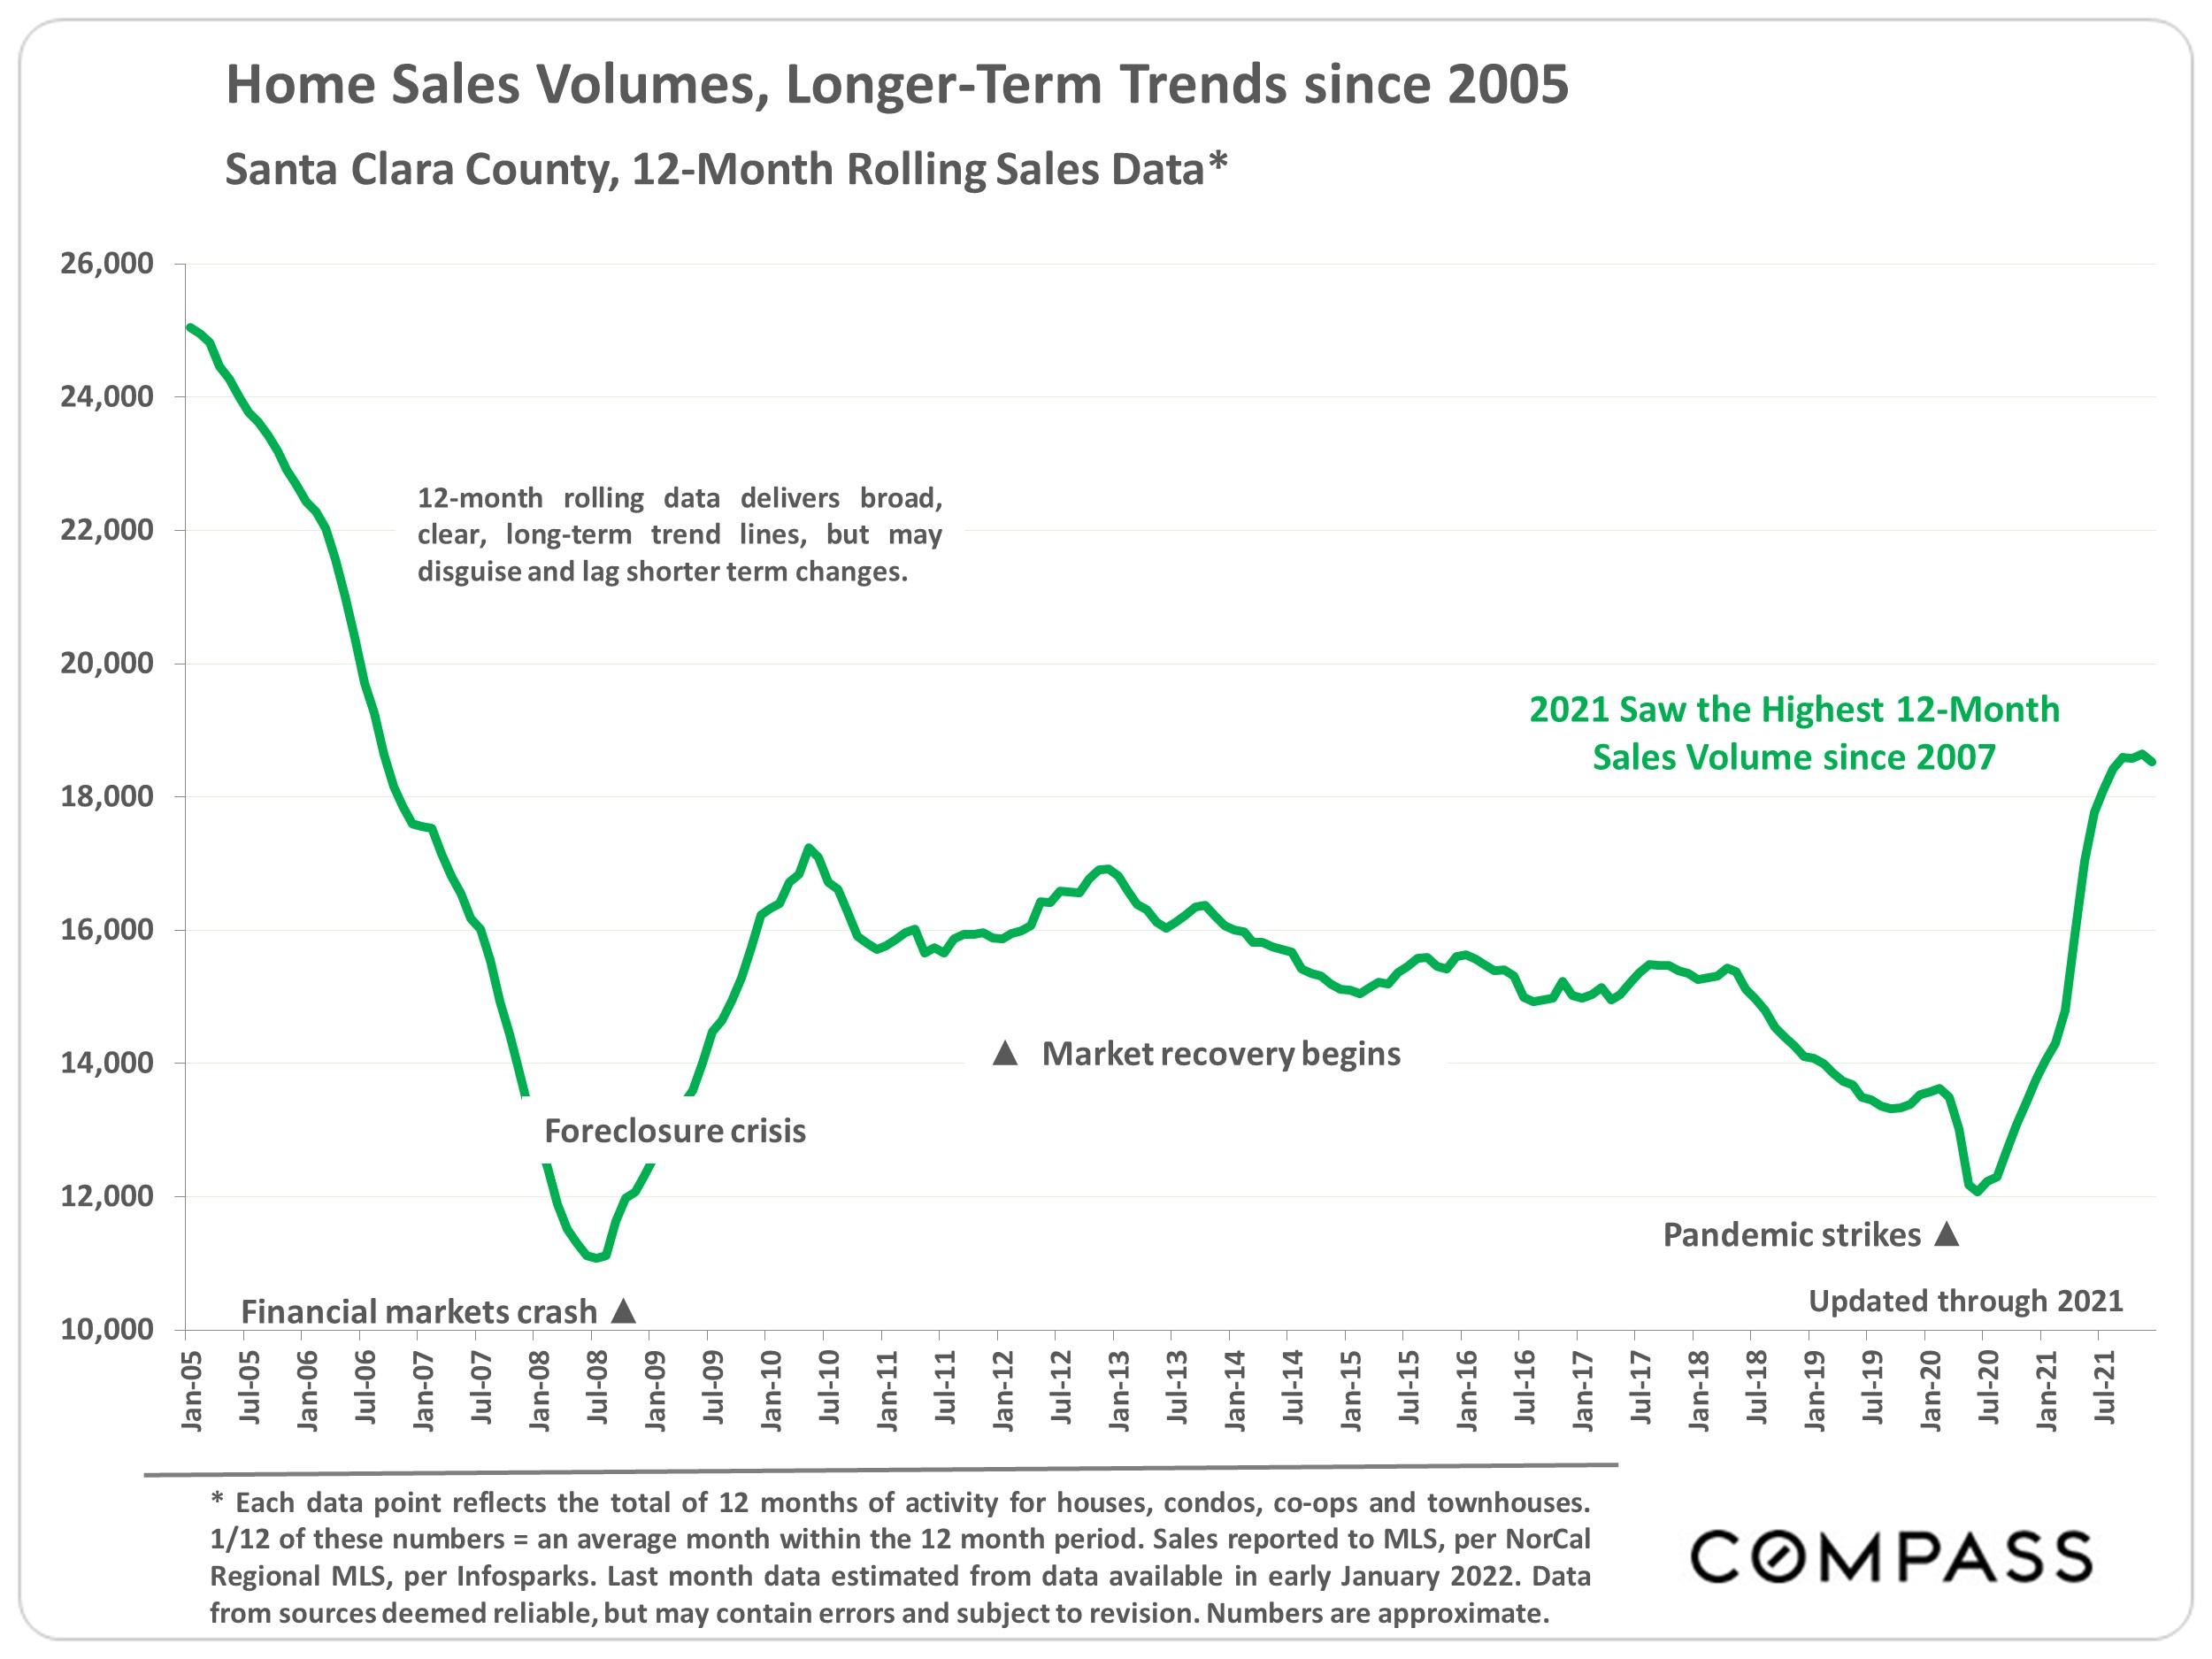
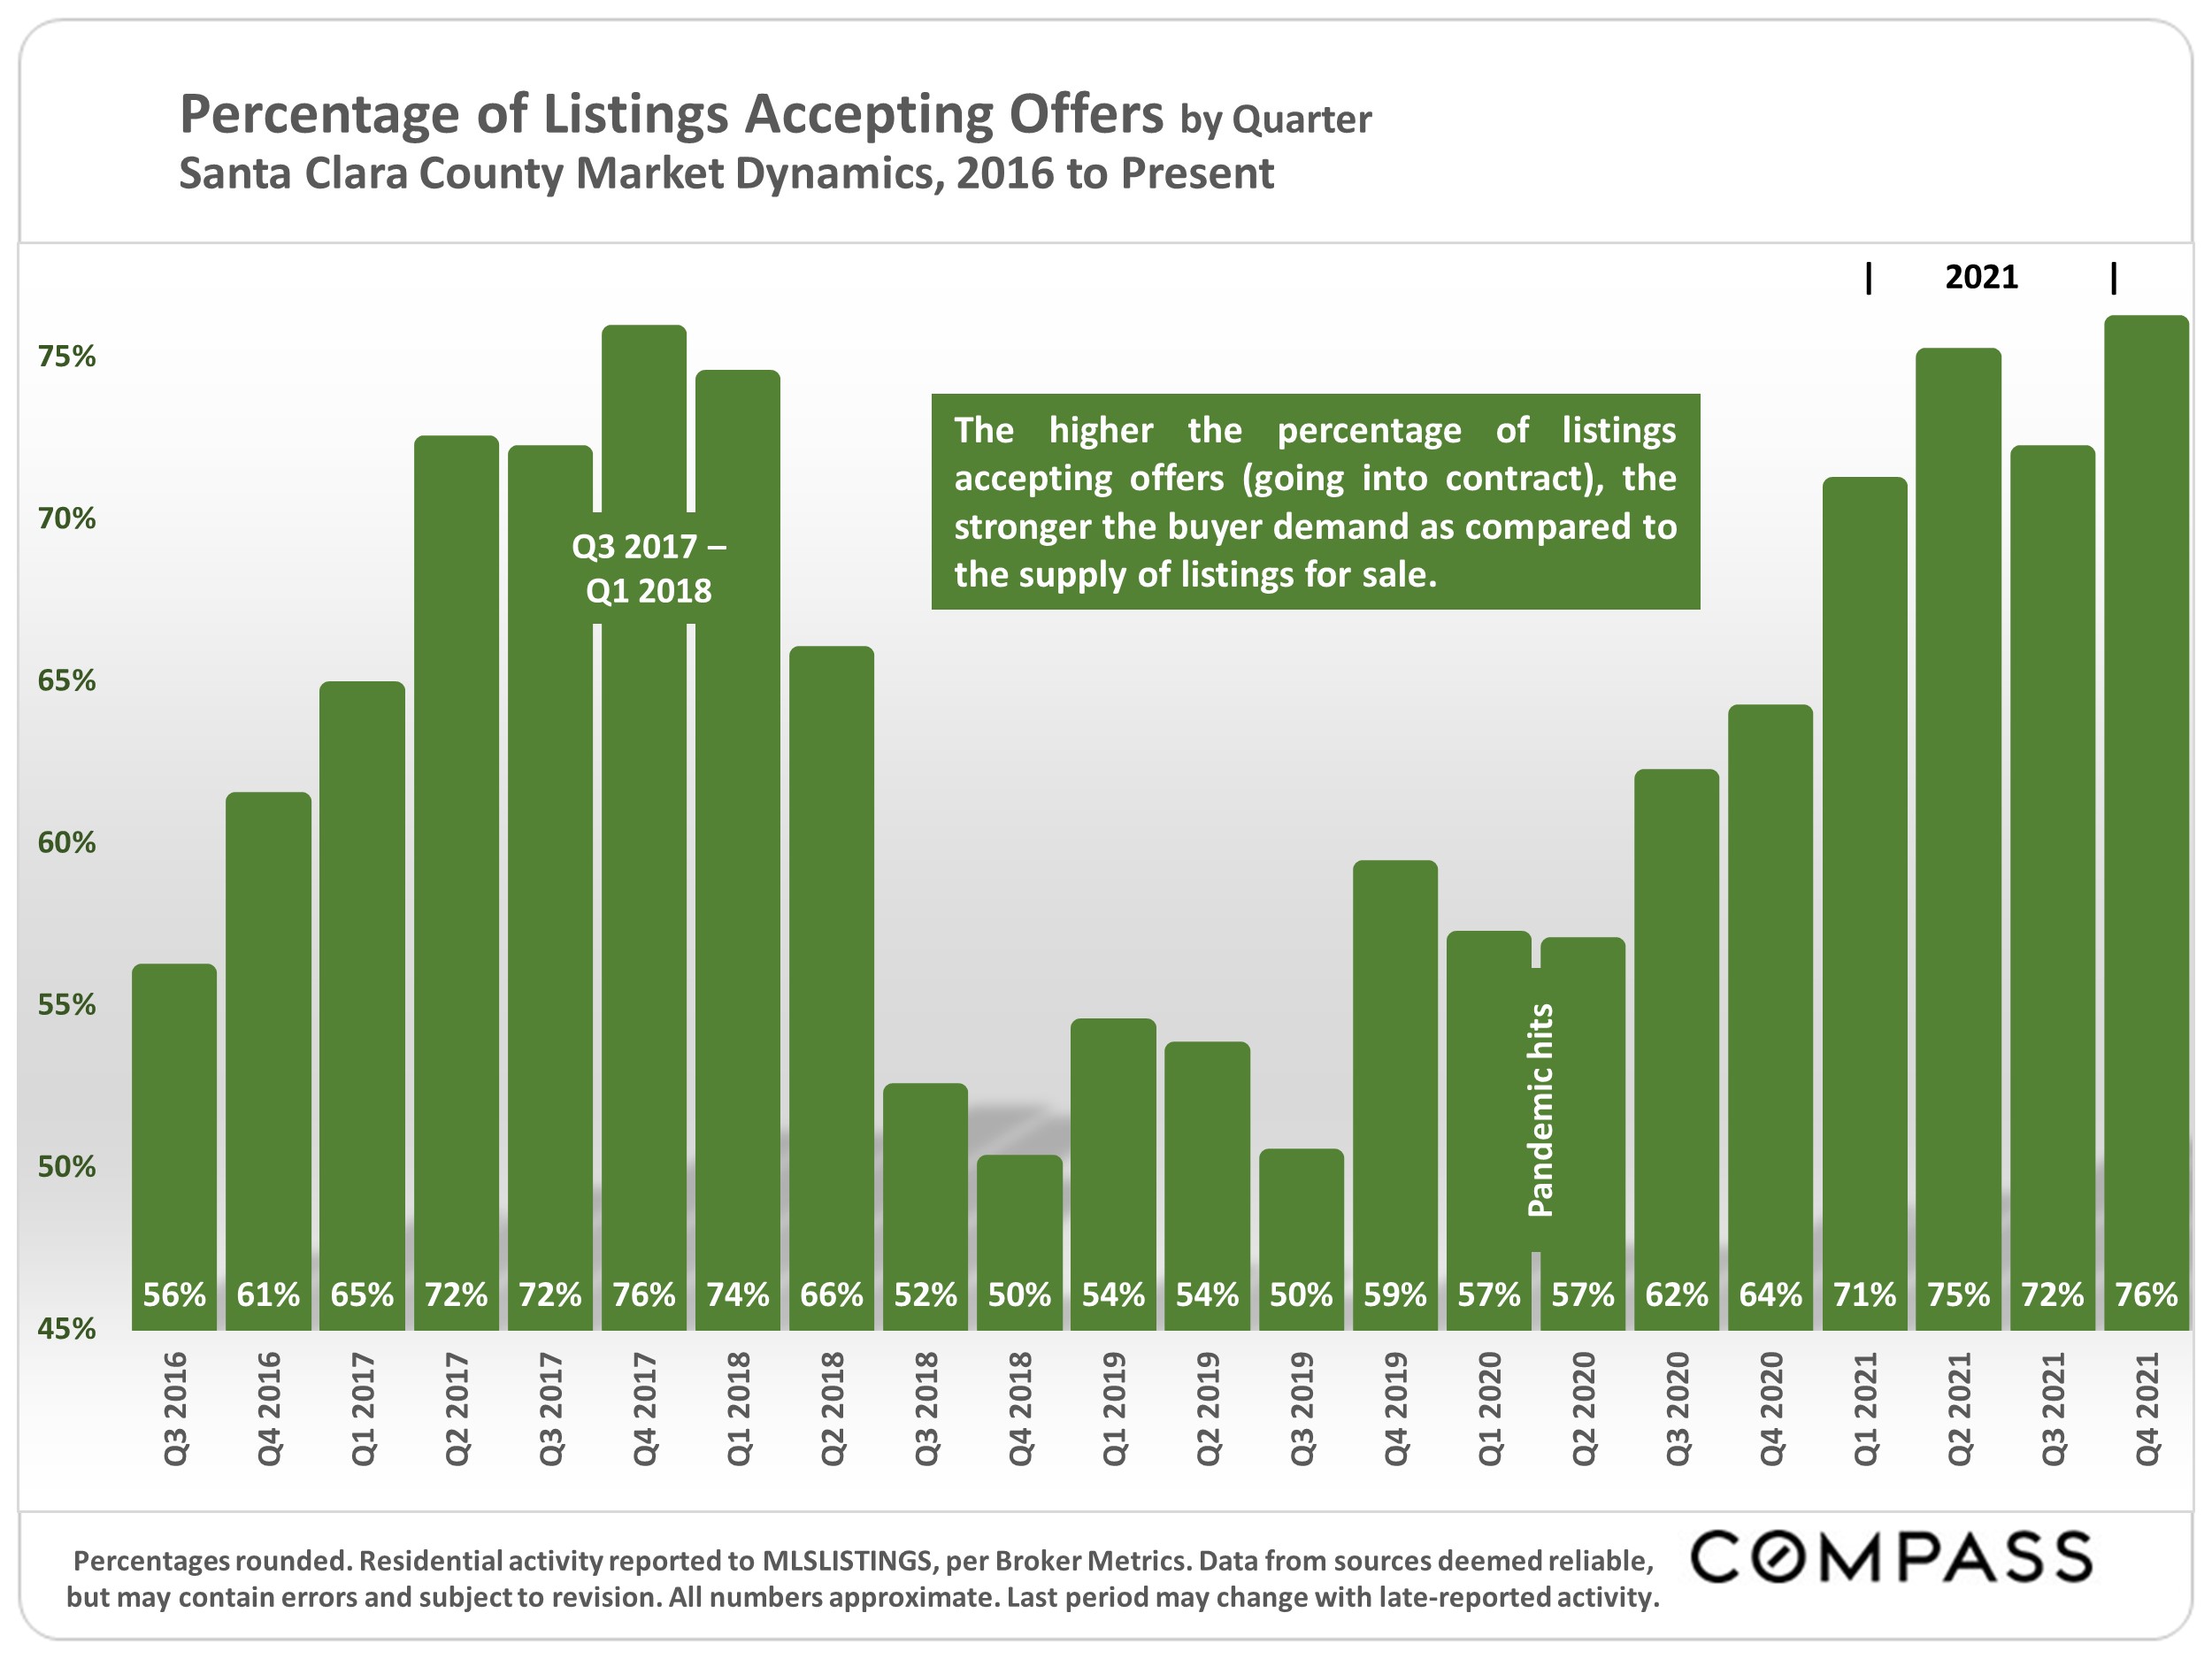
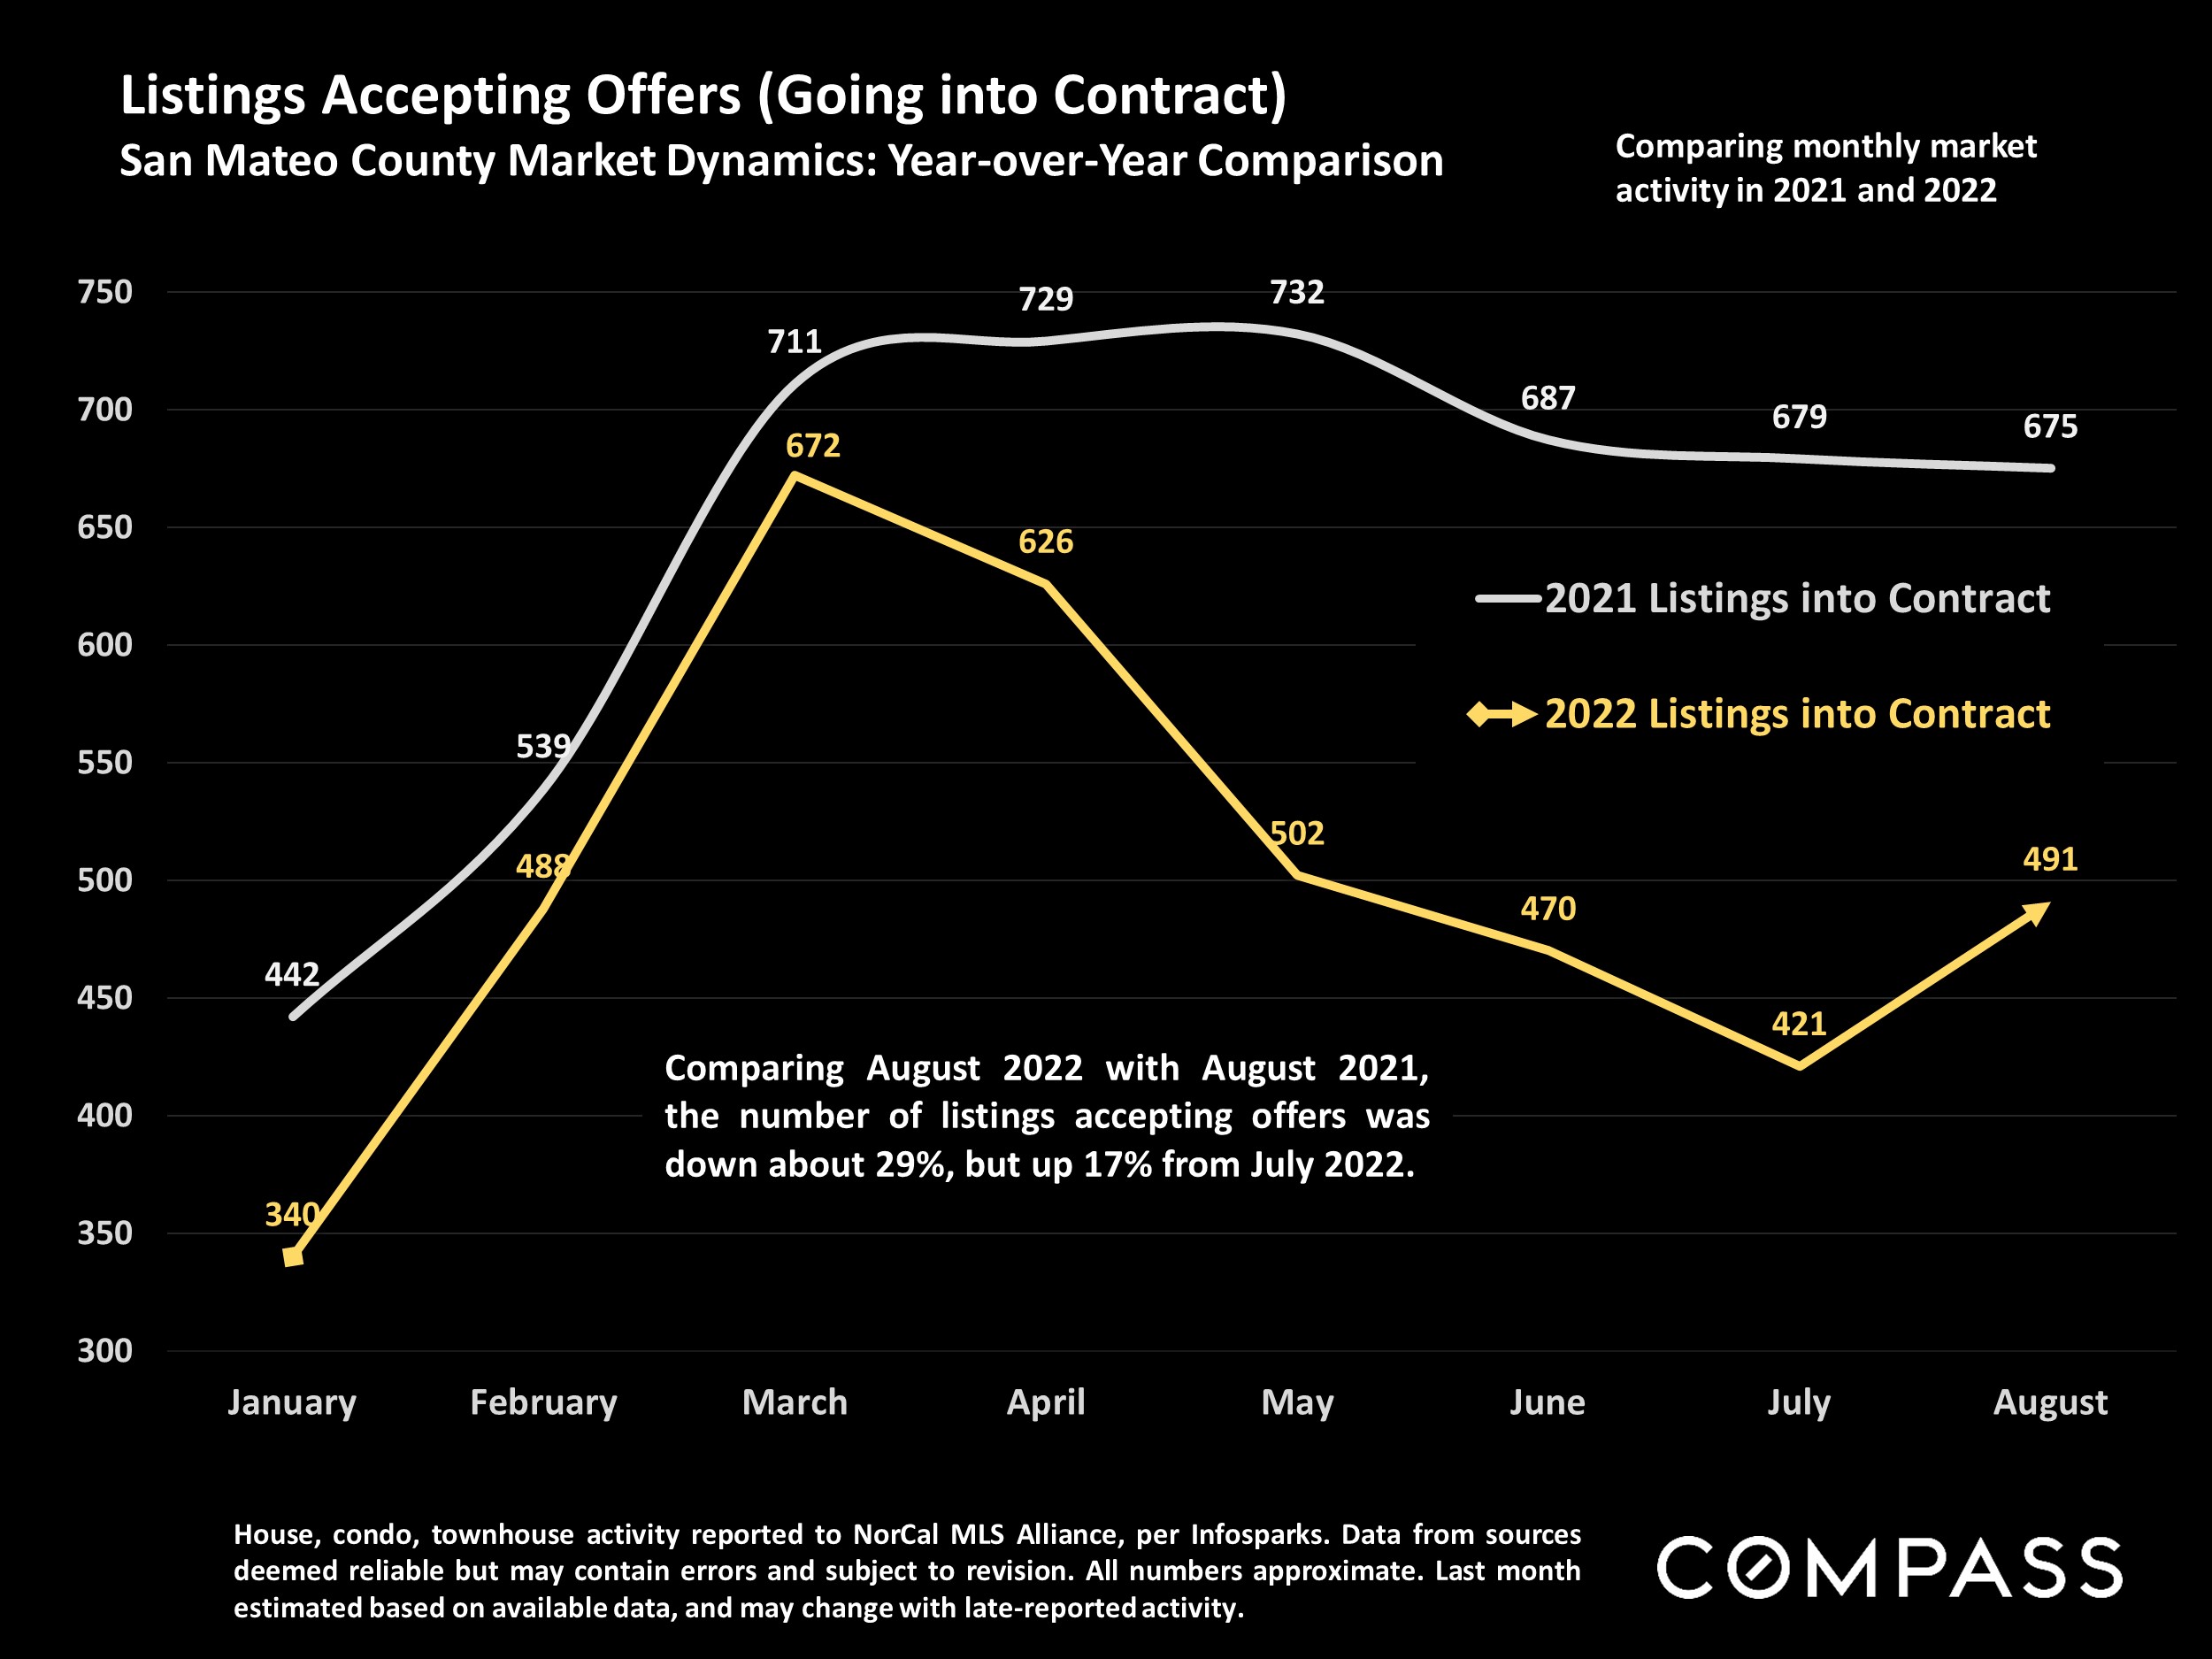
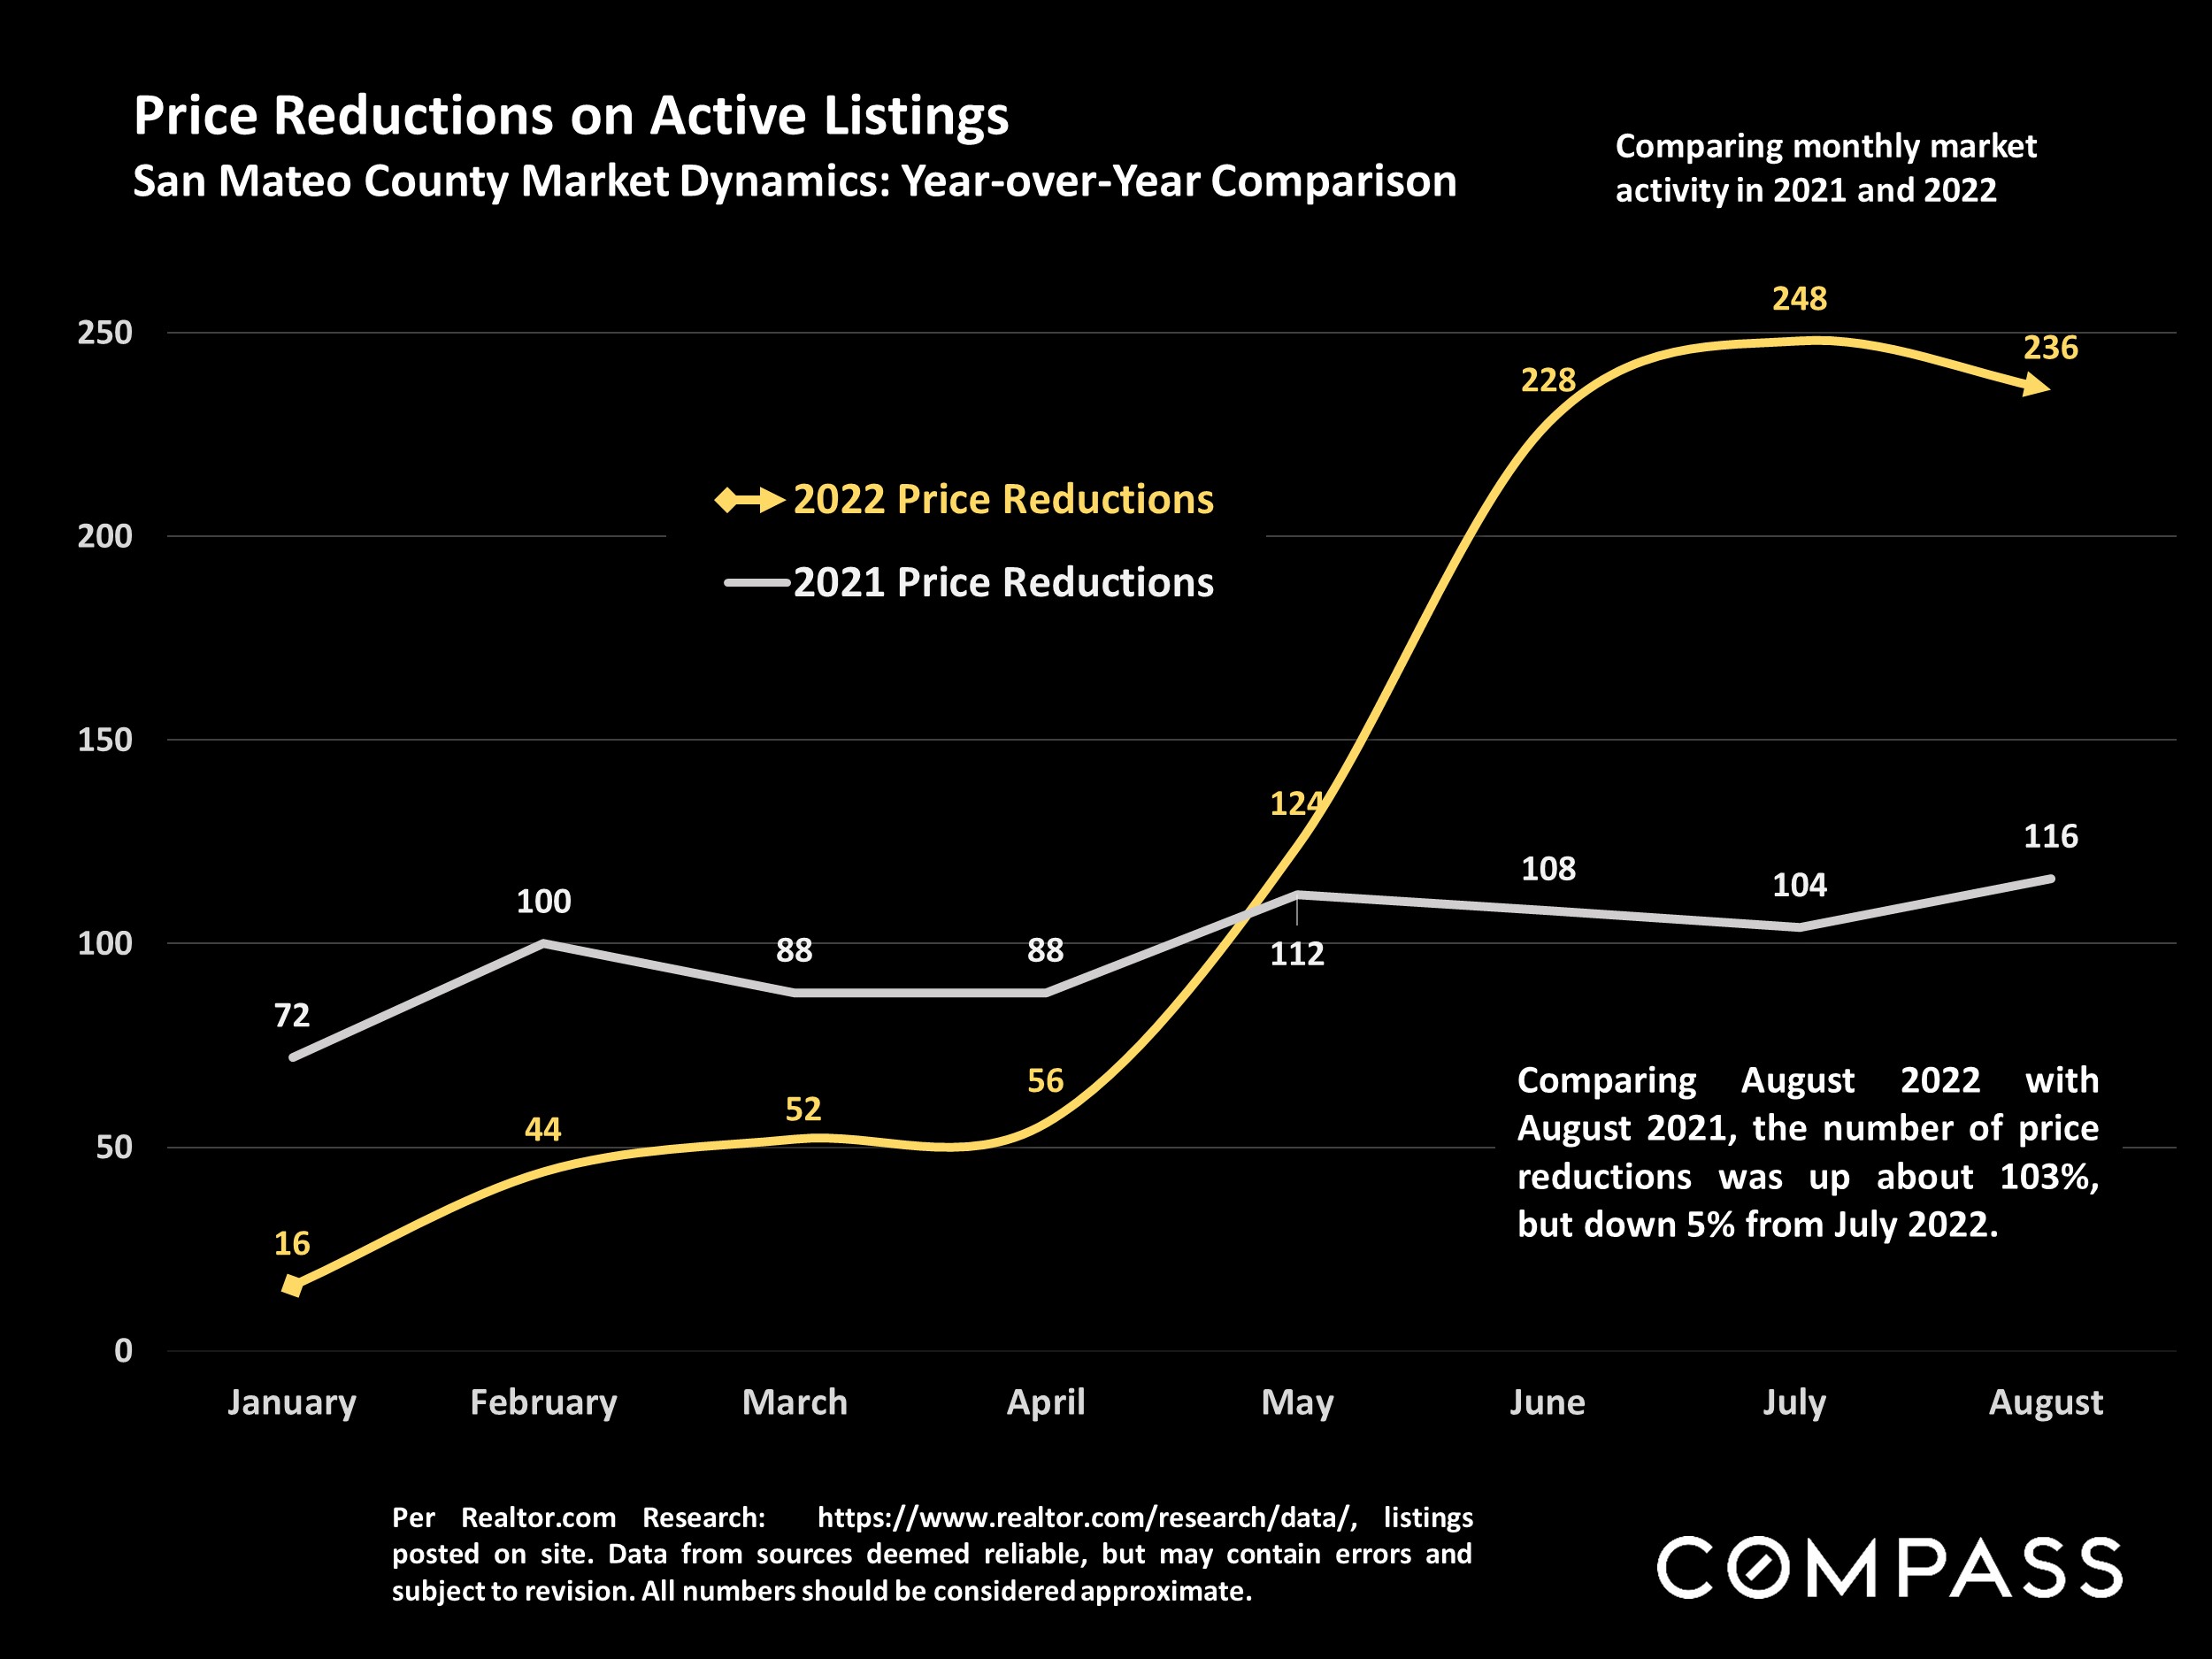
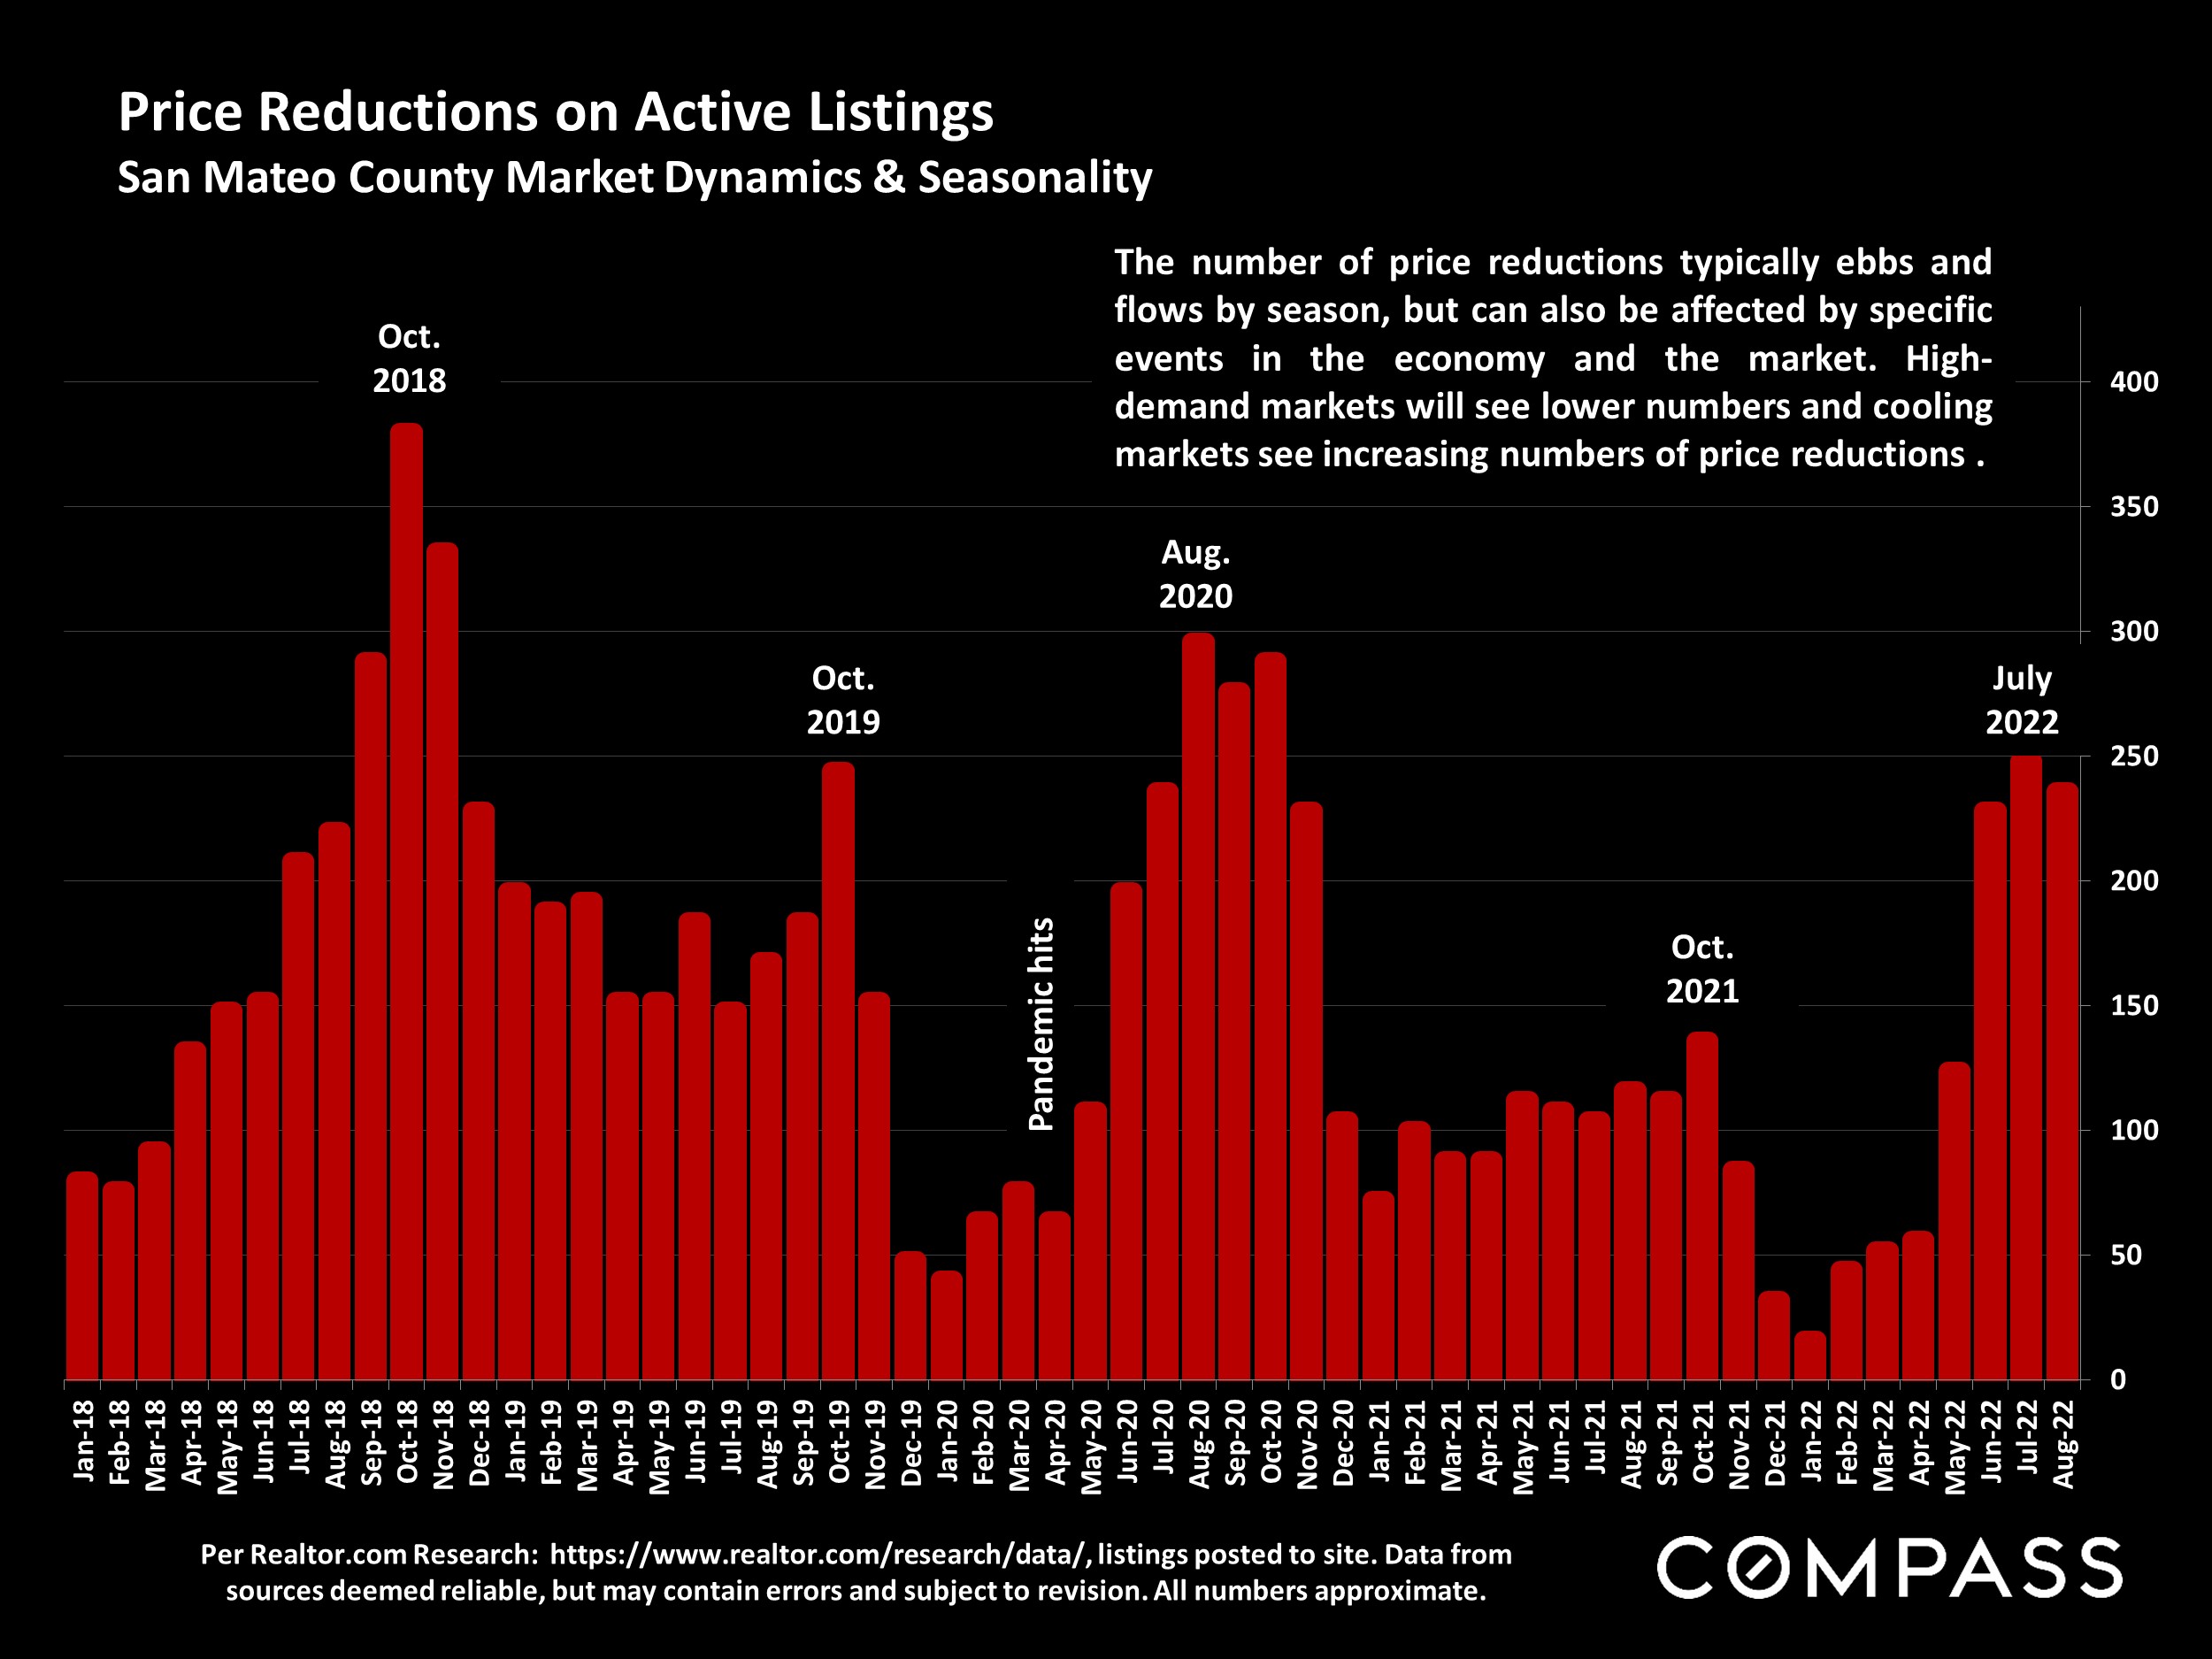
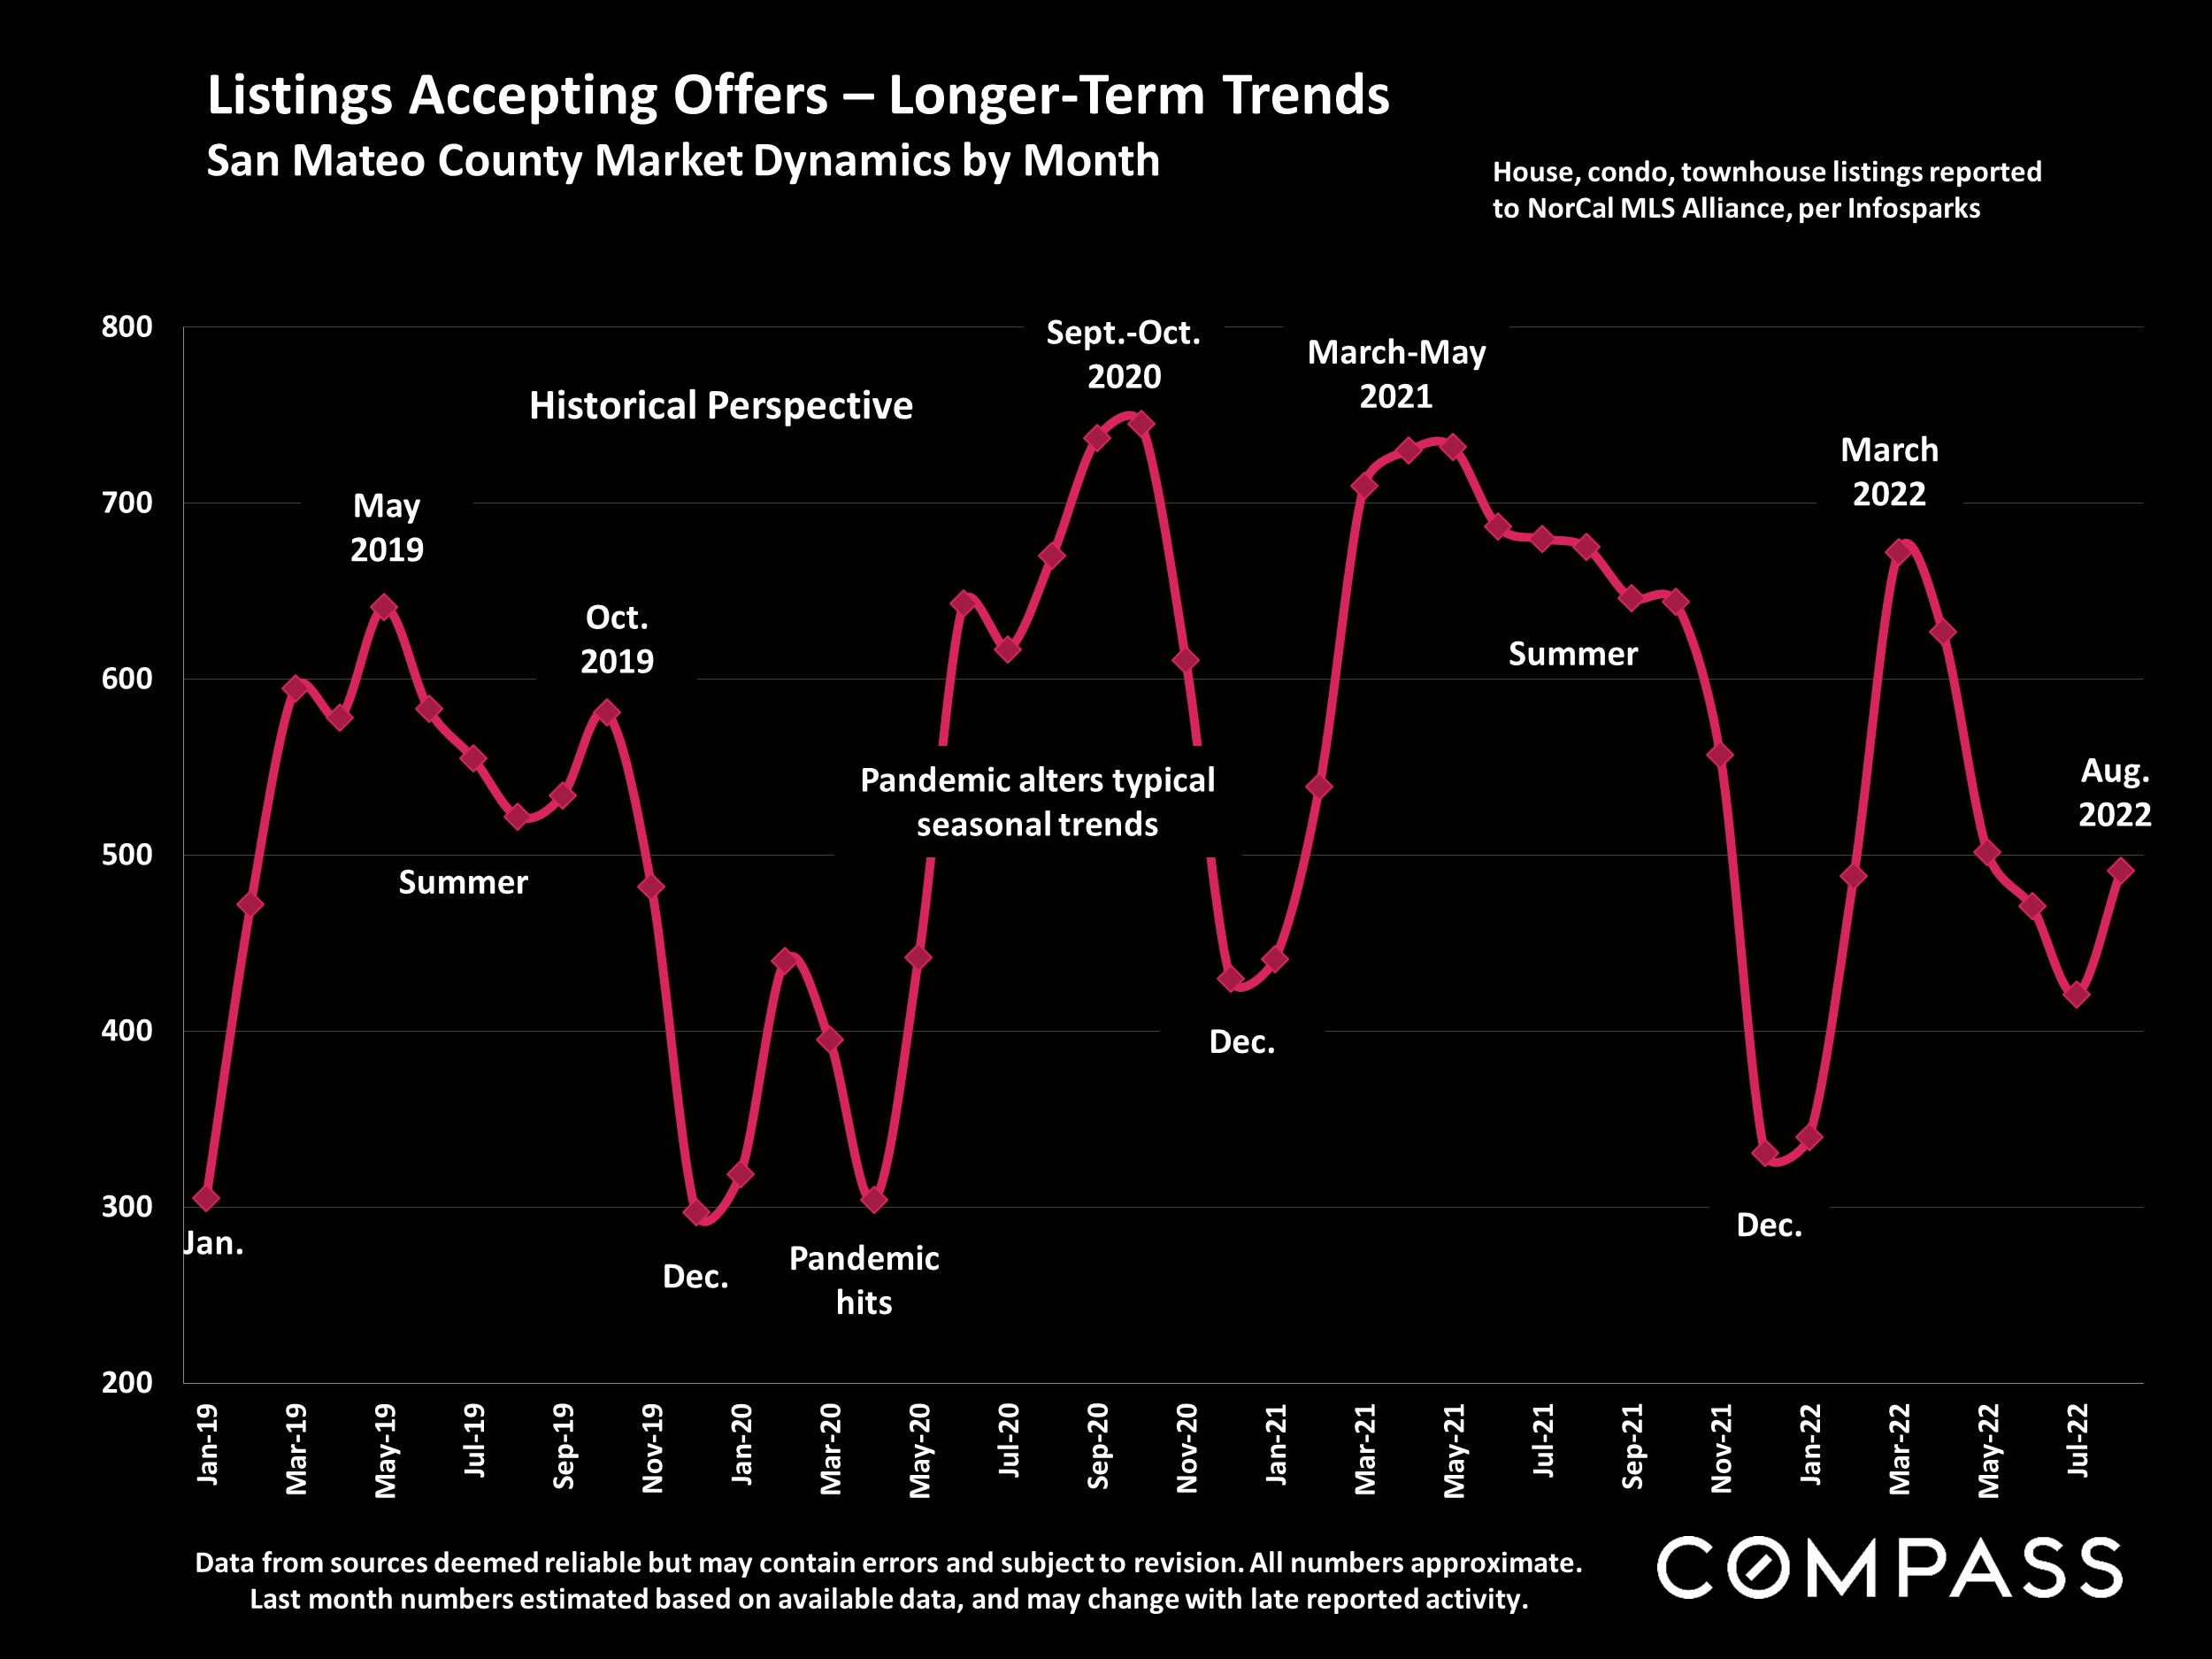
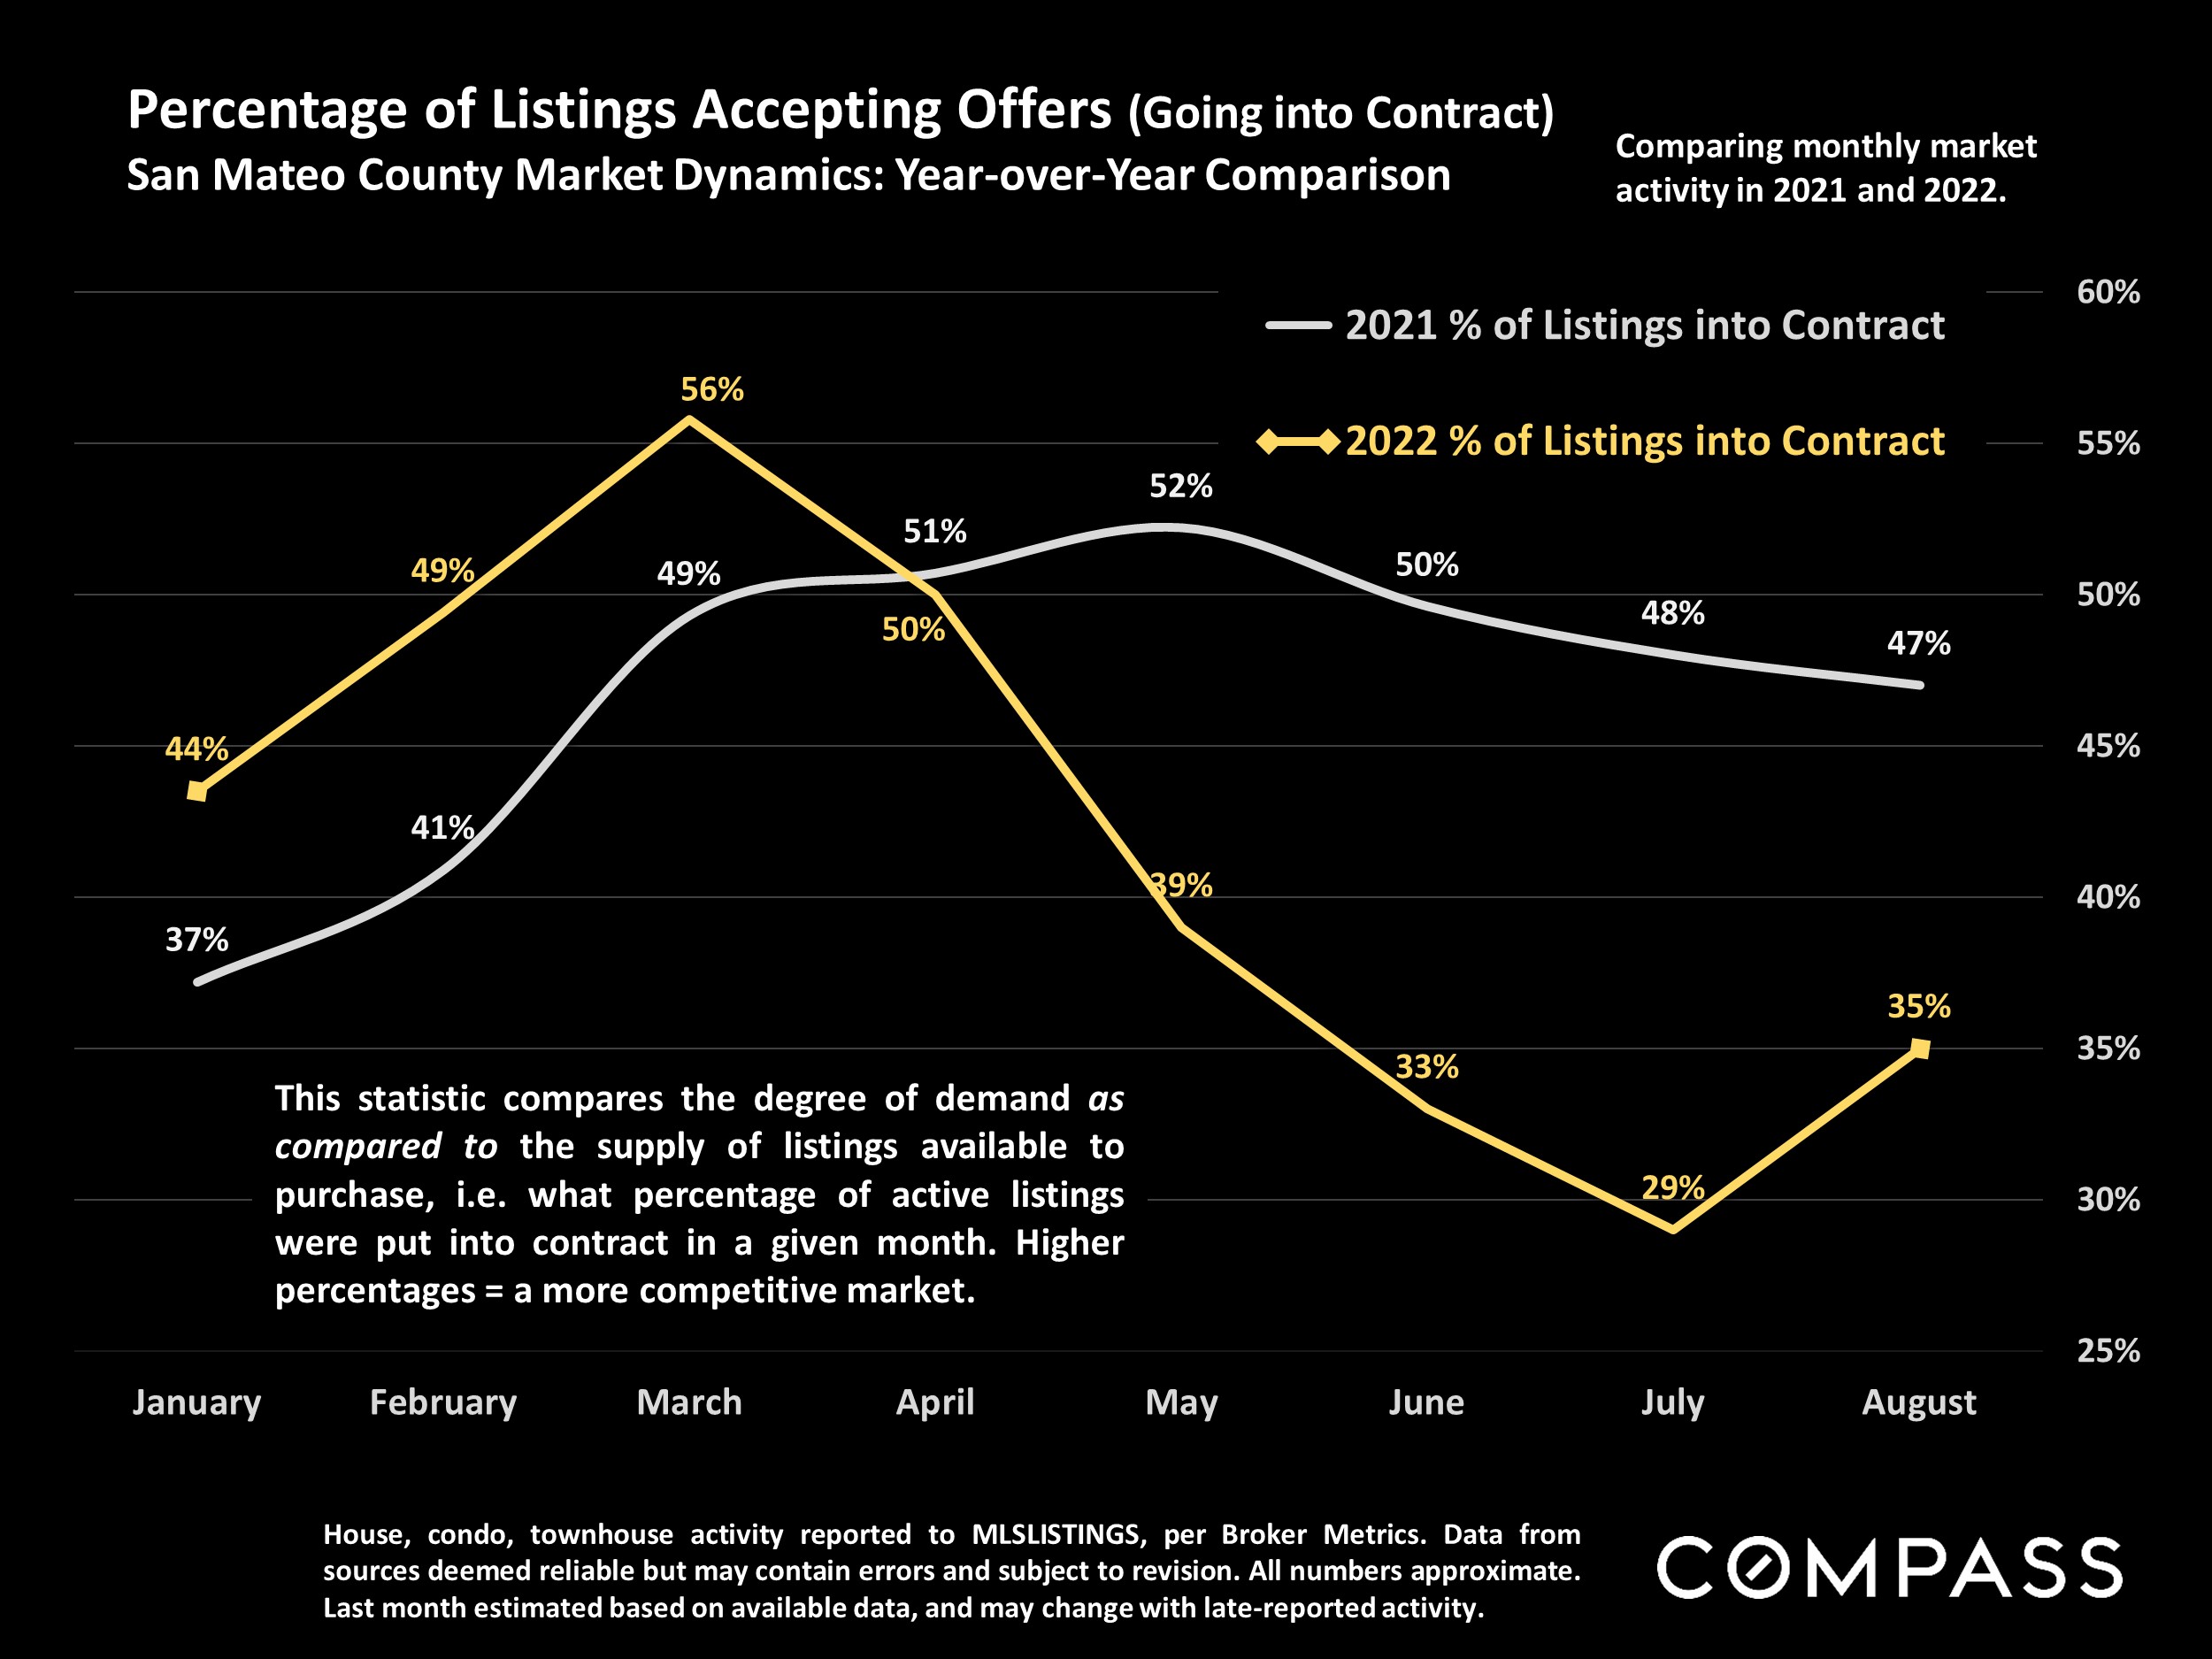
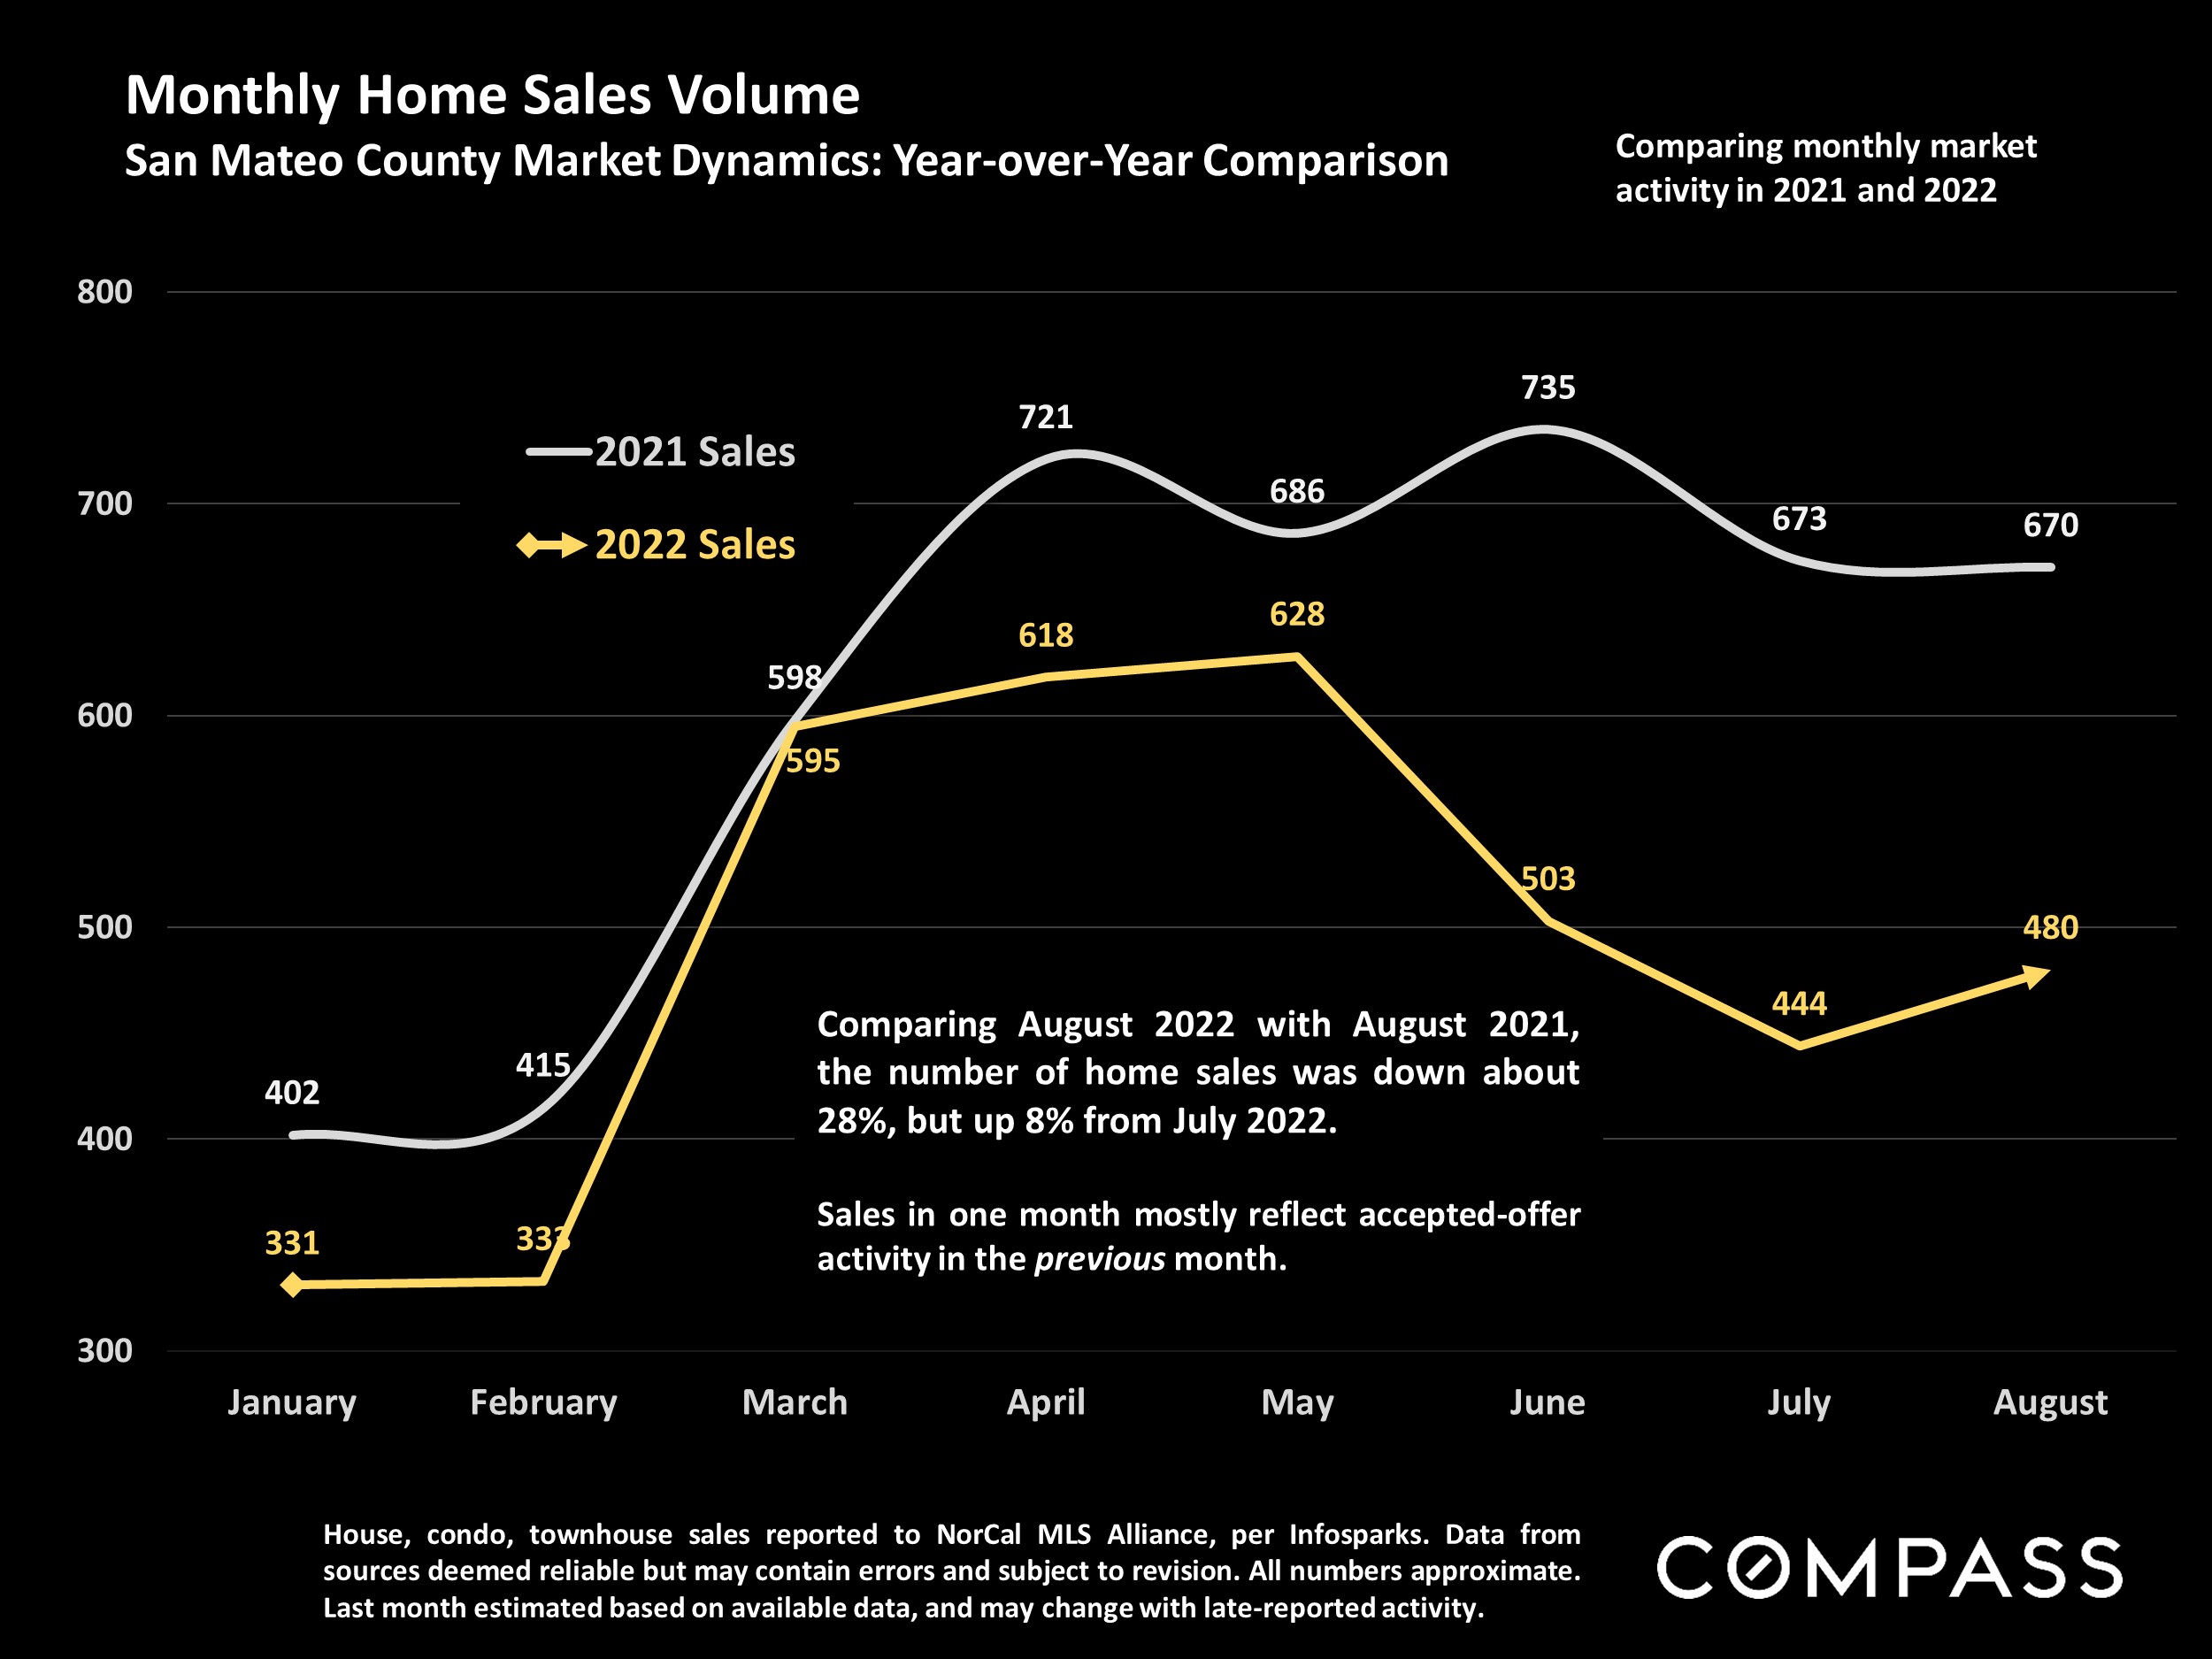
In early August, we mentioned agents reporting that buyer activity – renewed interest in getting back into the market, visits to open houses, and so on – was picking up due to a number of issues: Price reductions, less competition, an increase in listings for sale, the drop in interest rates, and the dramatic recovery in stock markets. And a sizeable rebound in sales and listings going into contract did show up in August data, though volumes were still well below last year at this time.

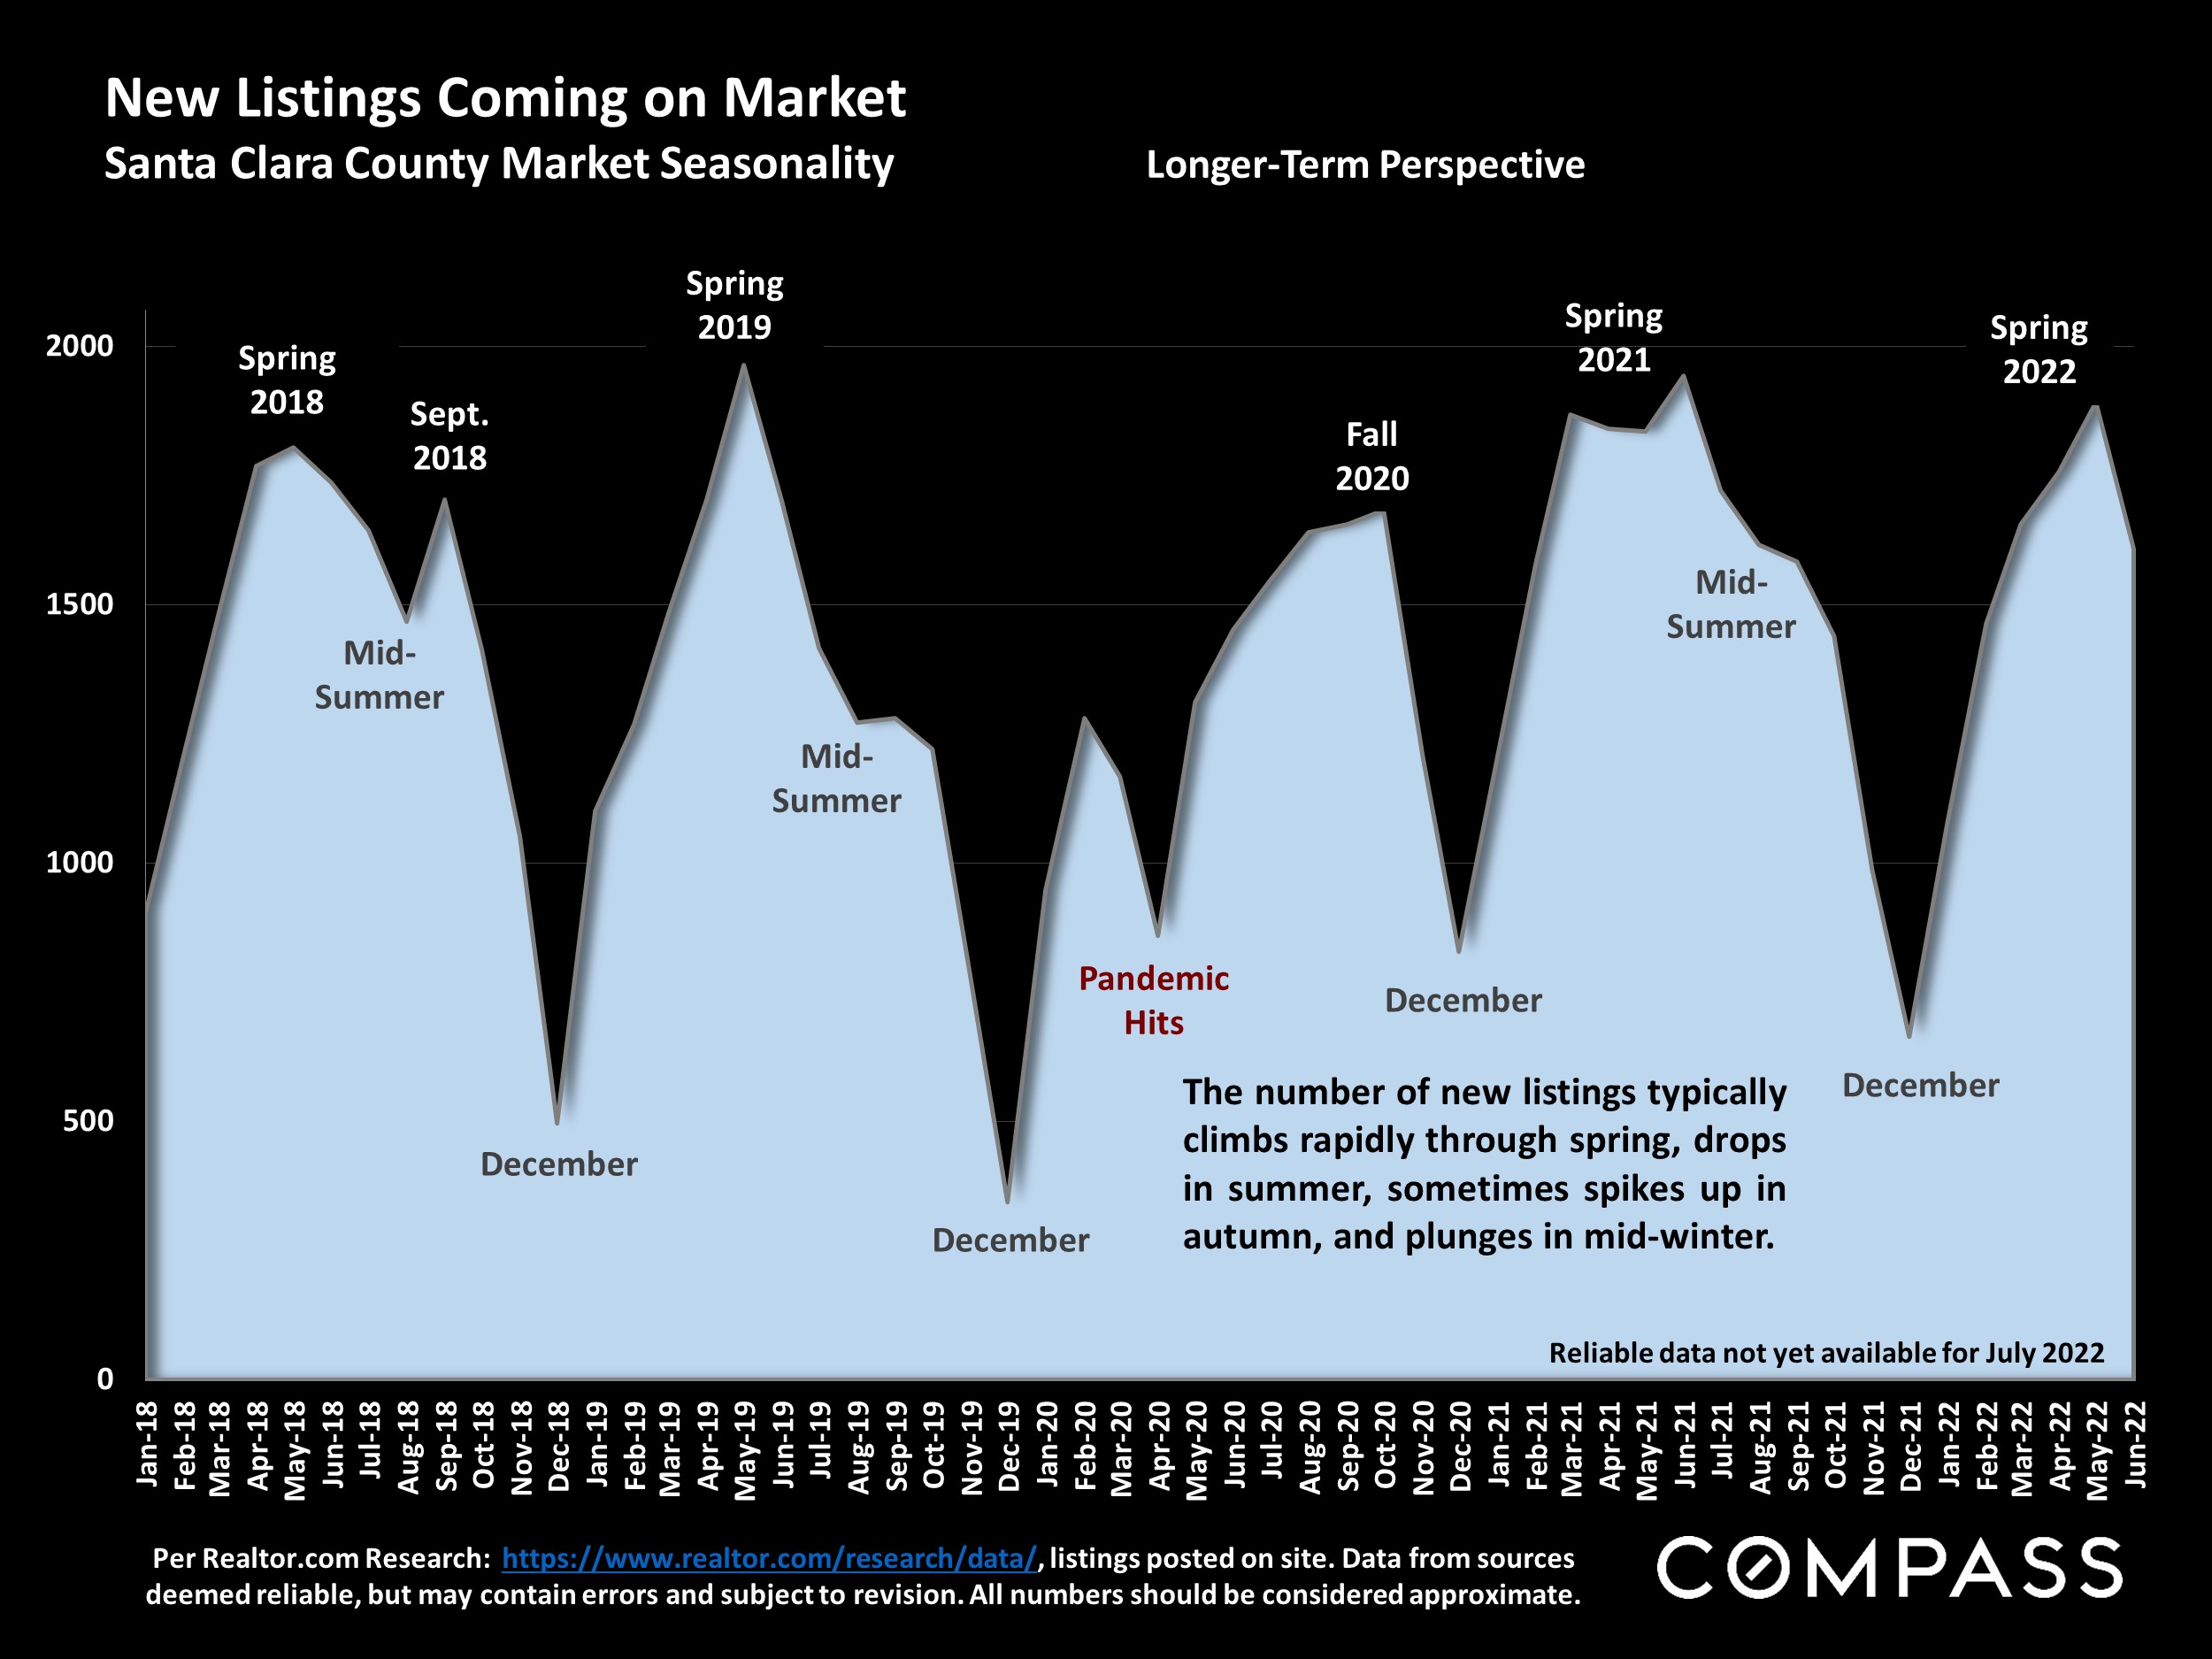
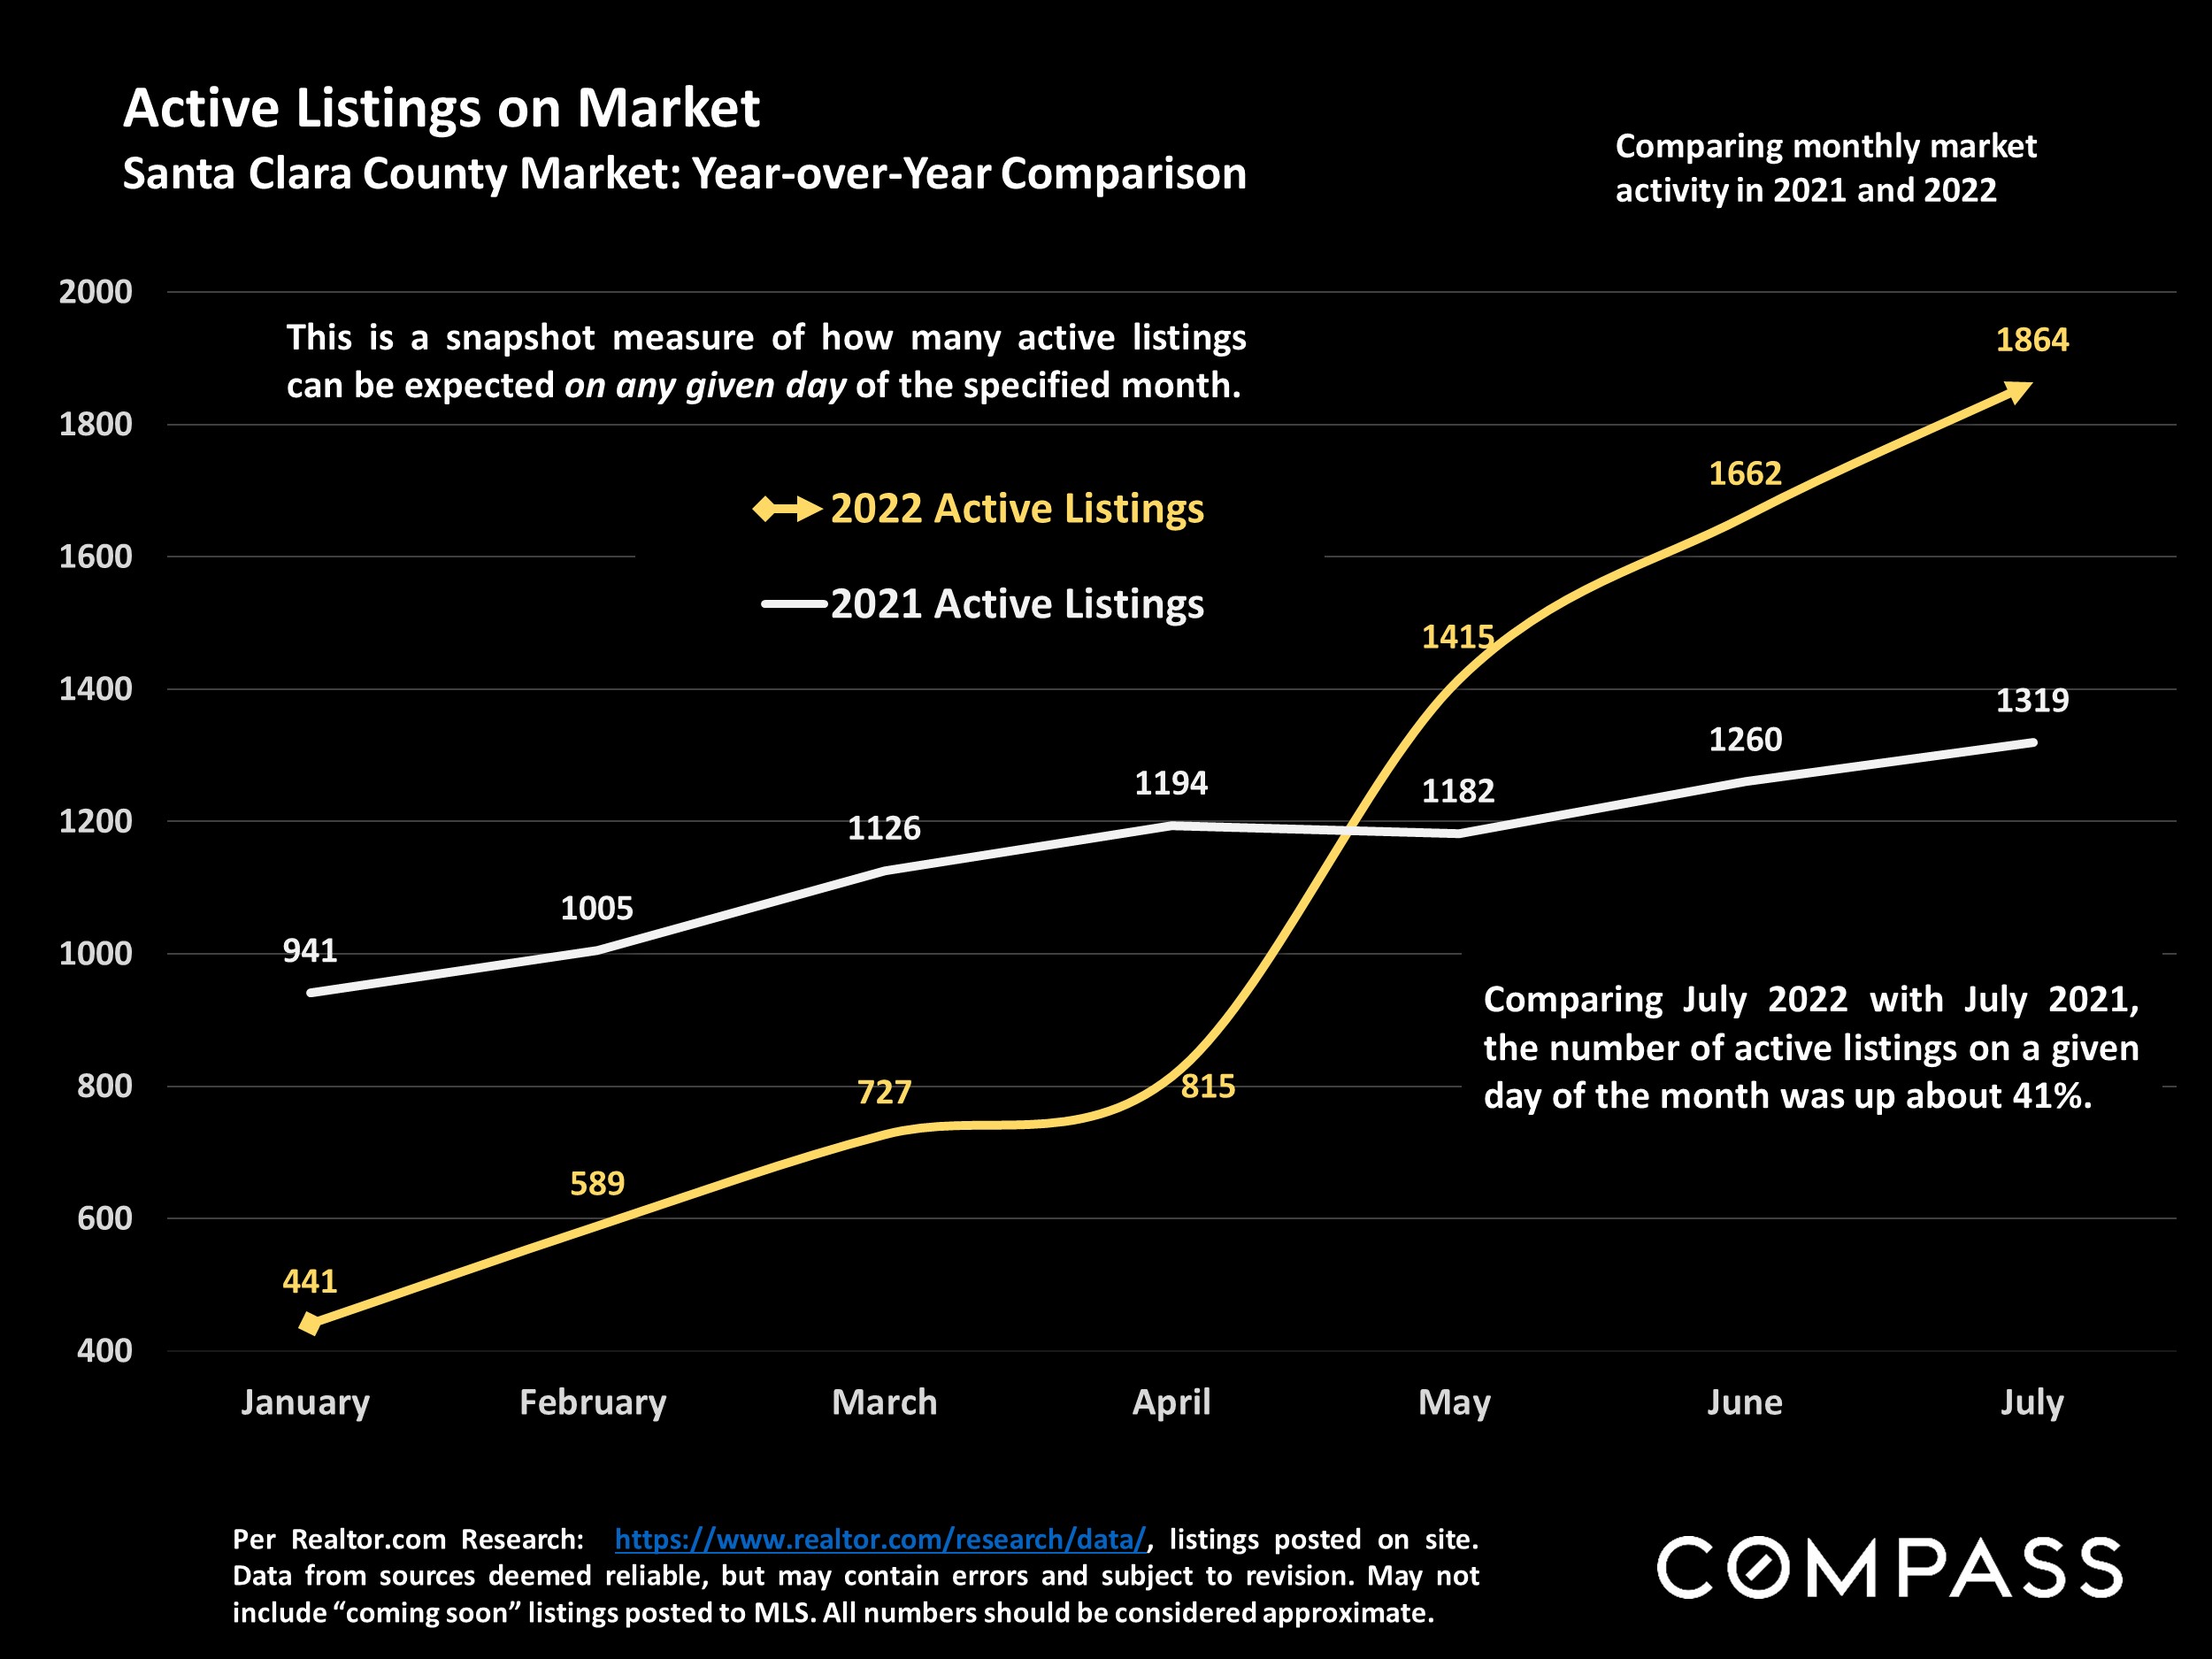
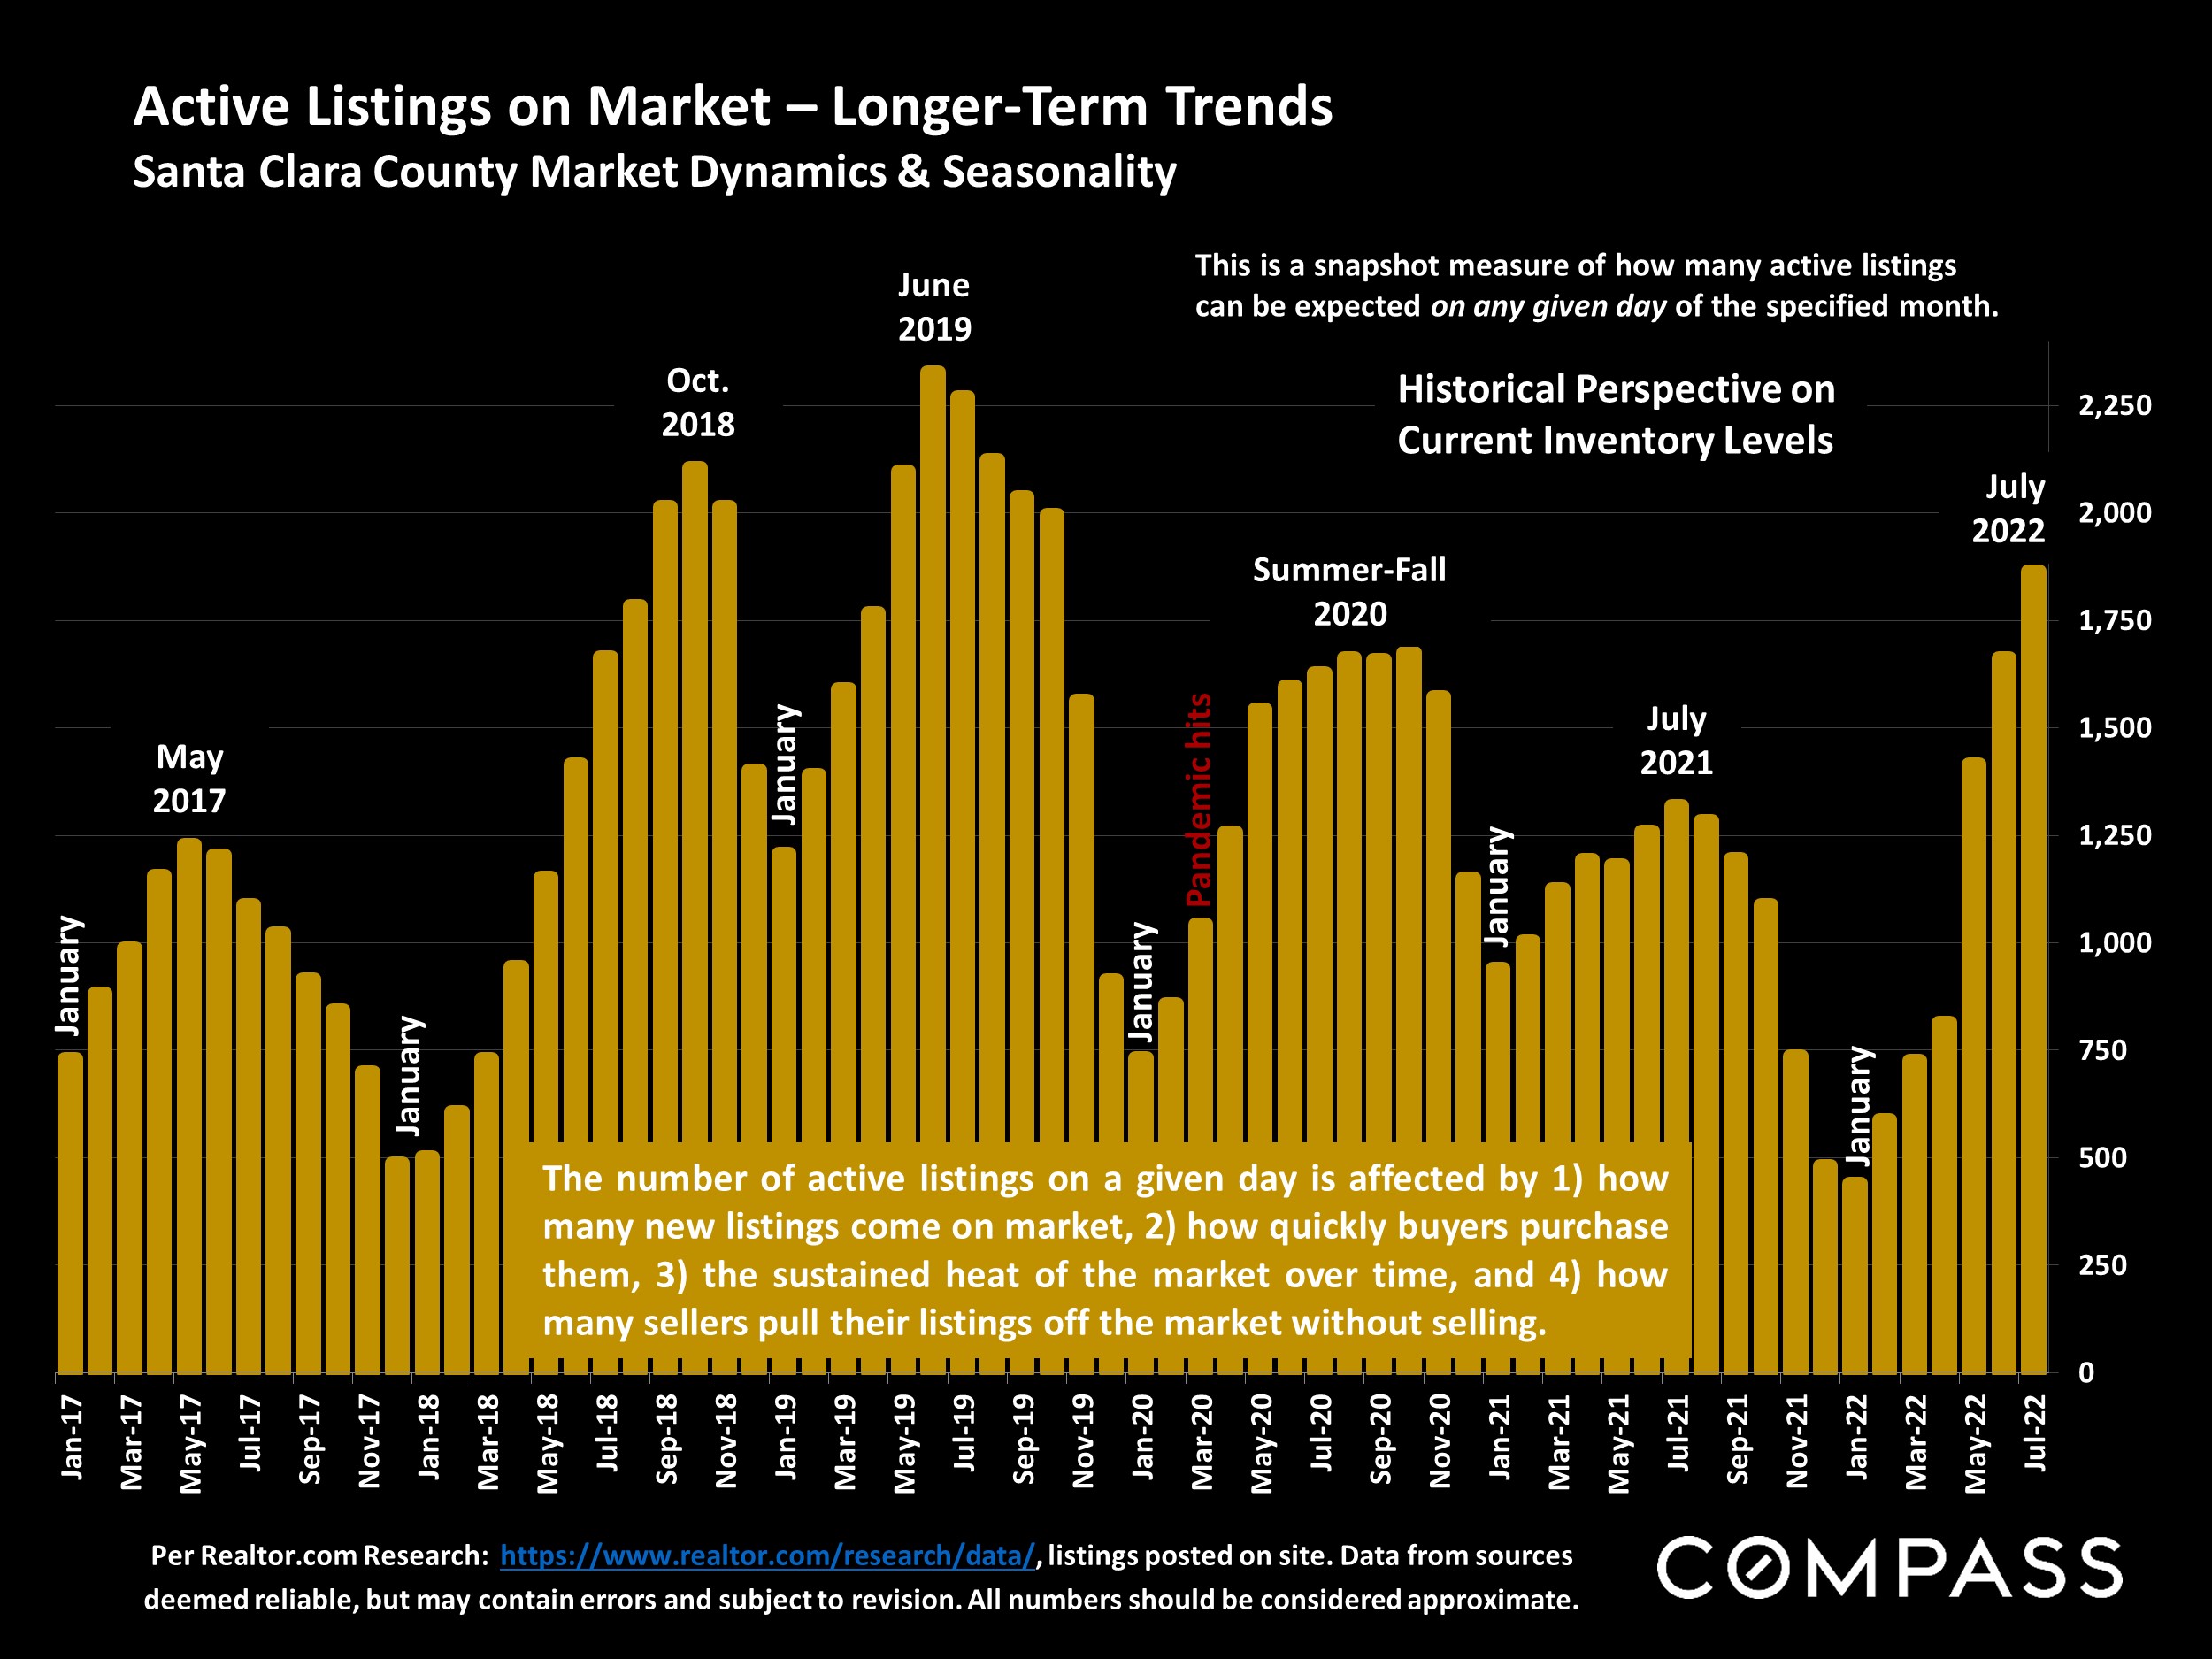
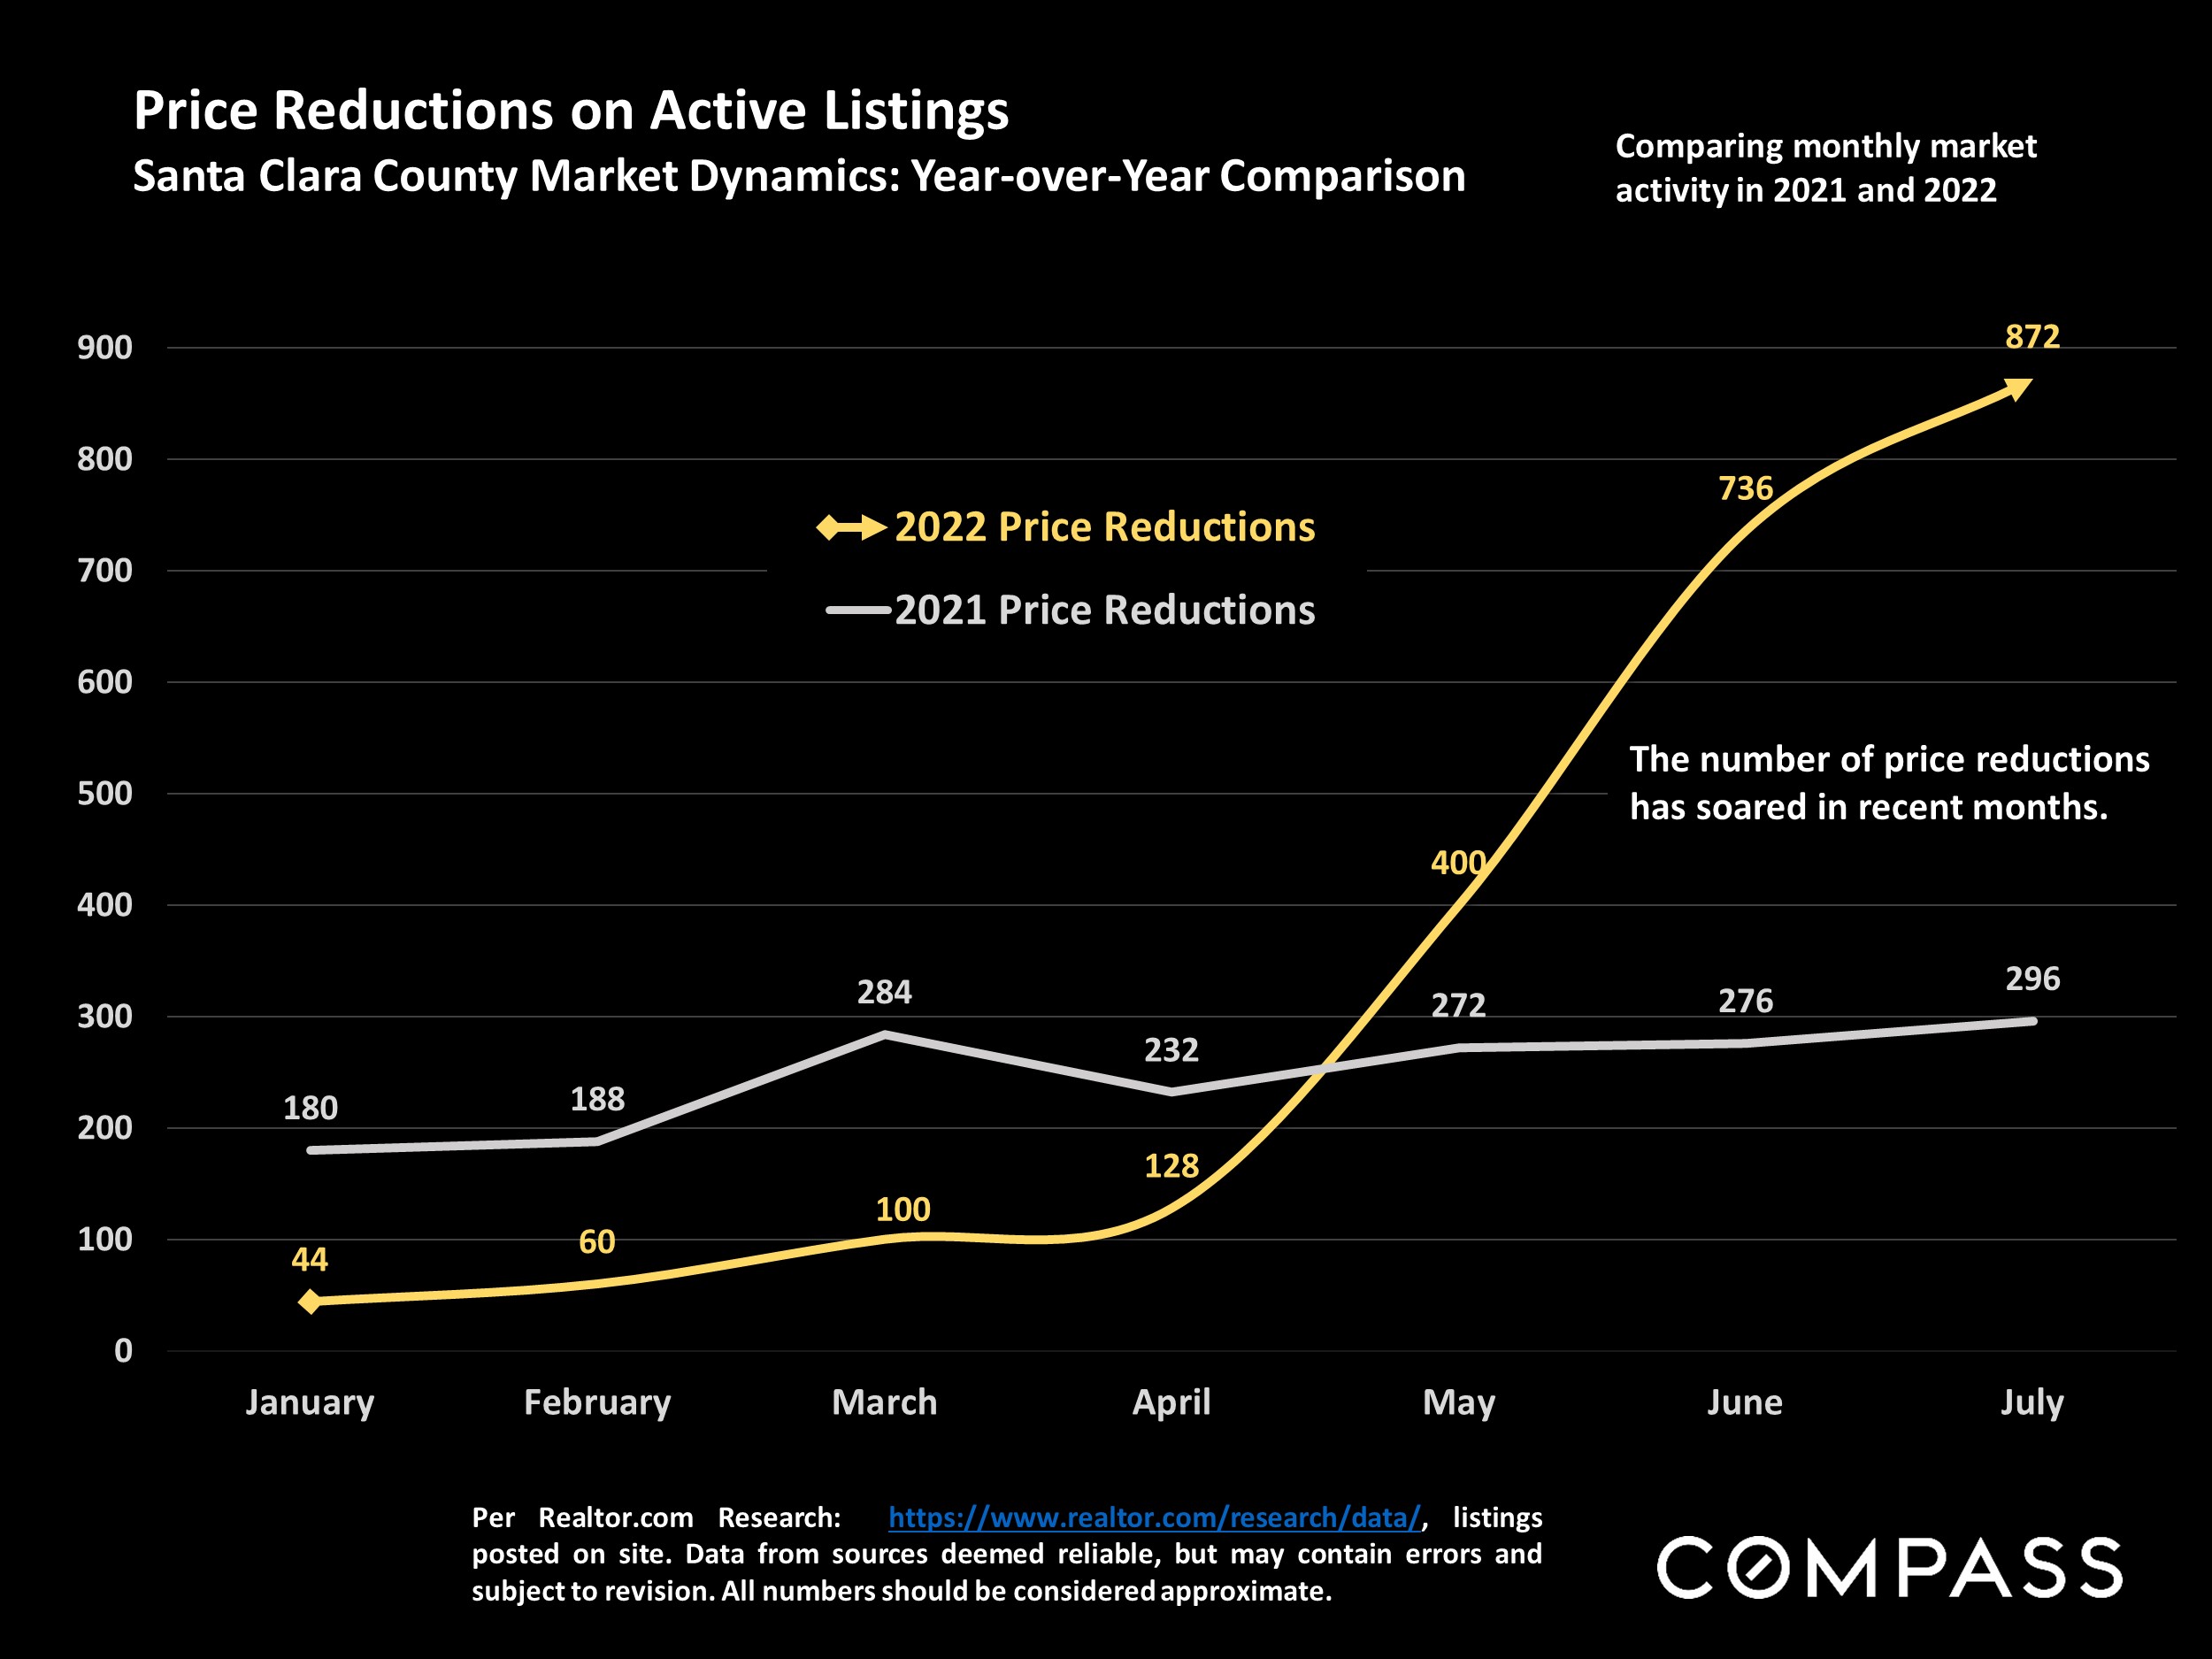
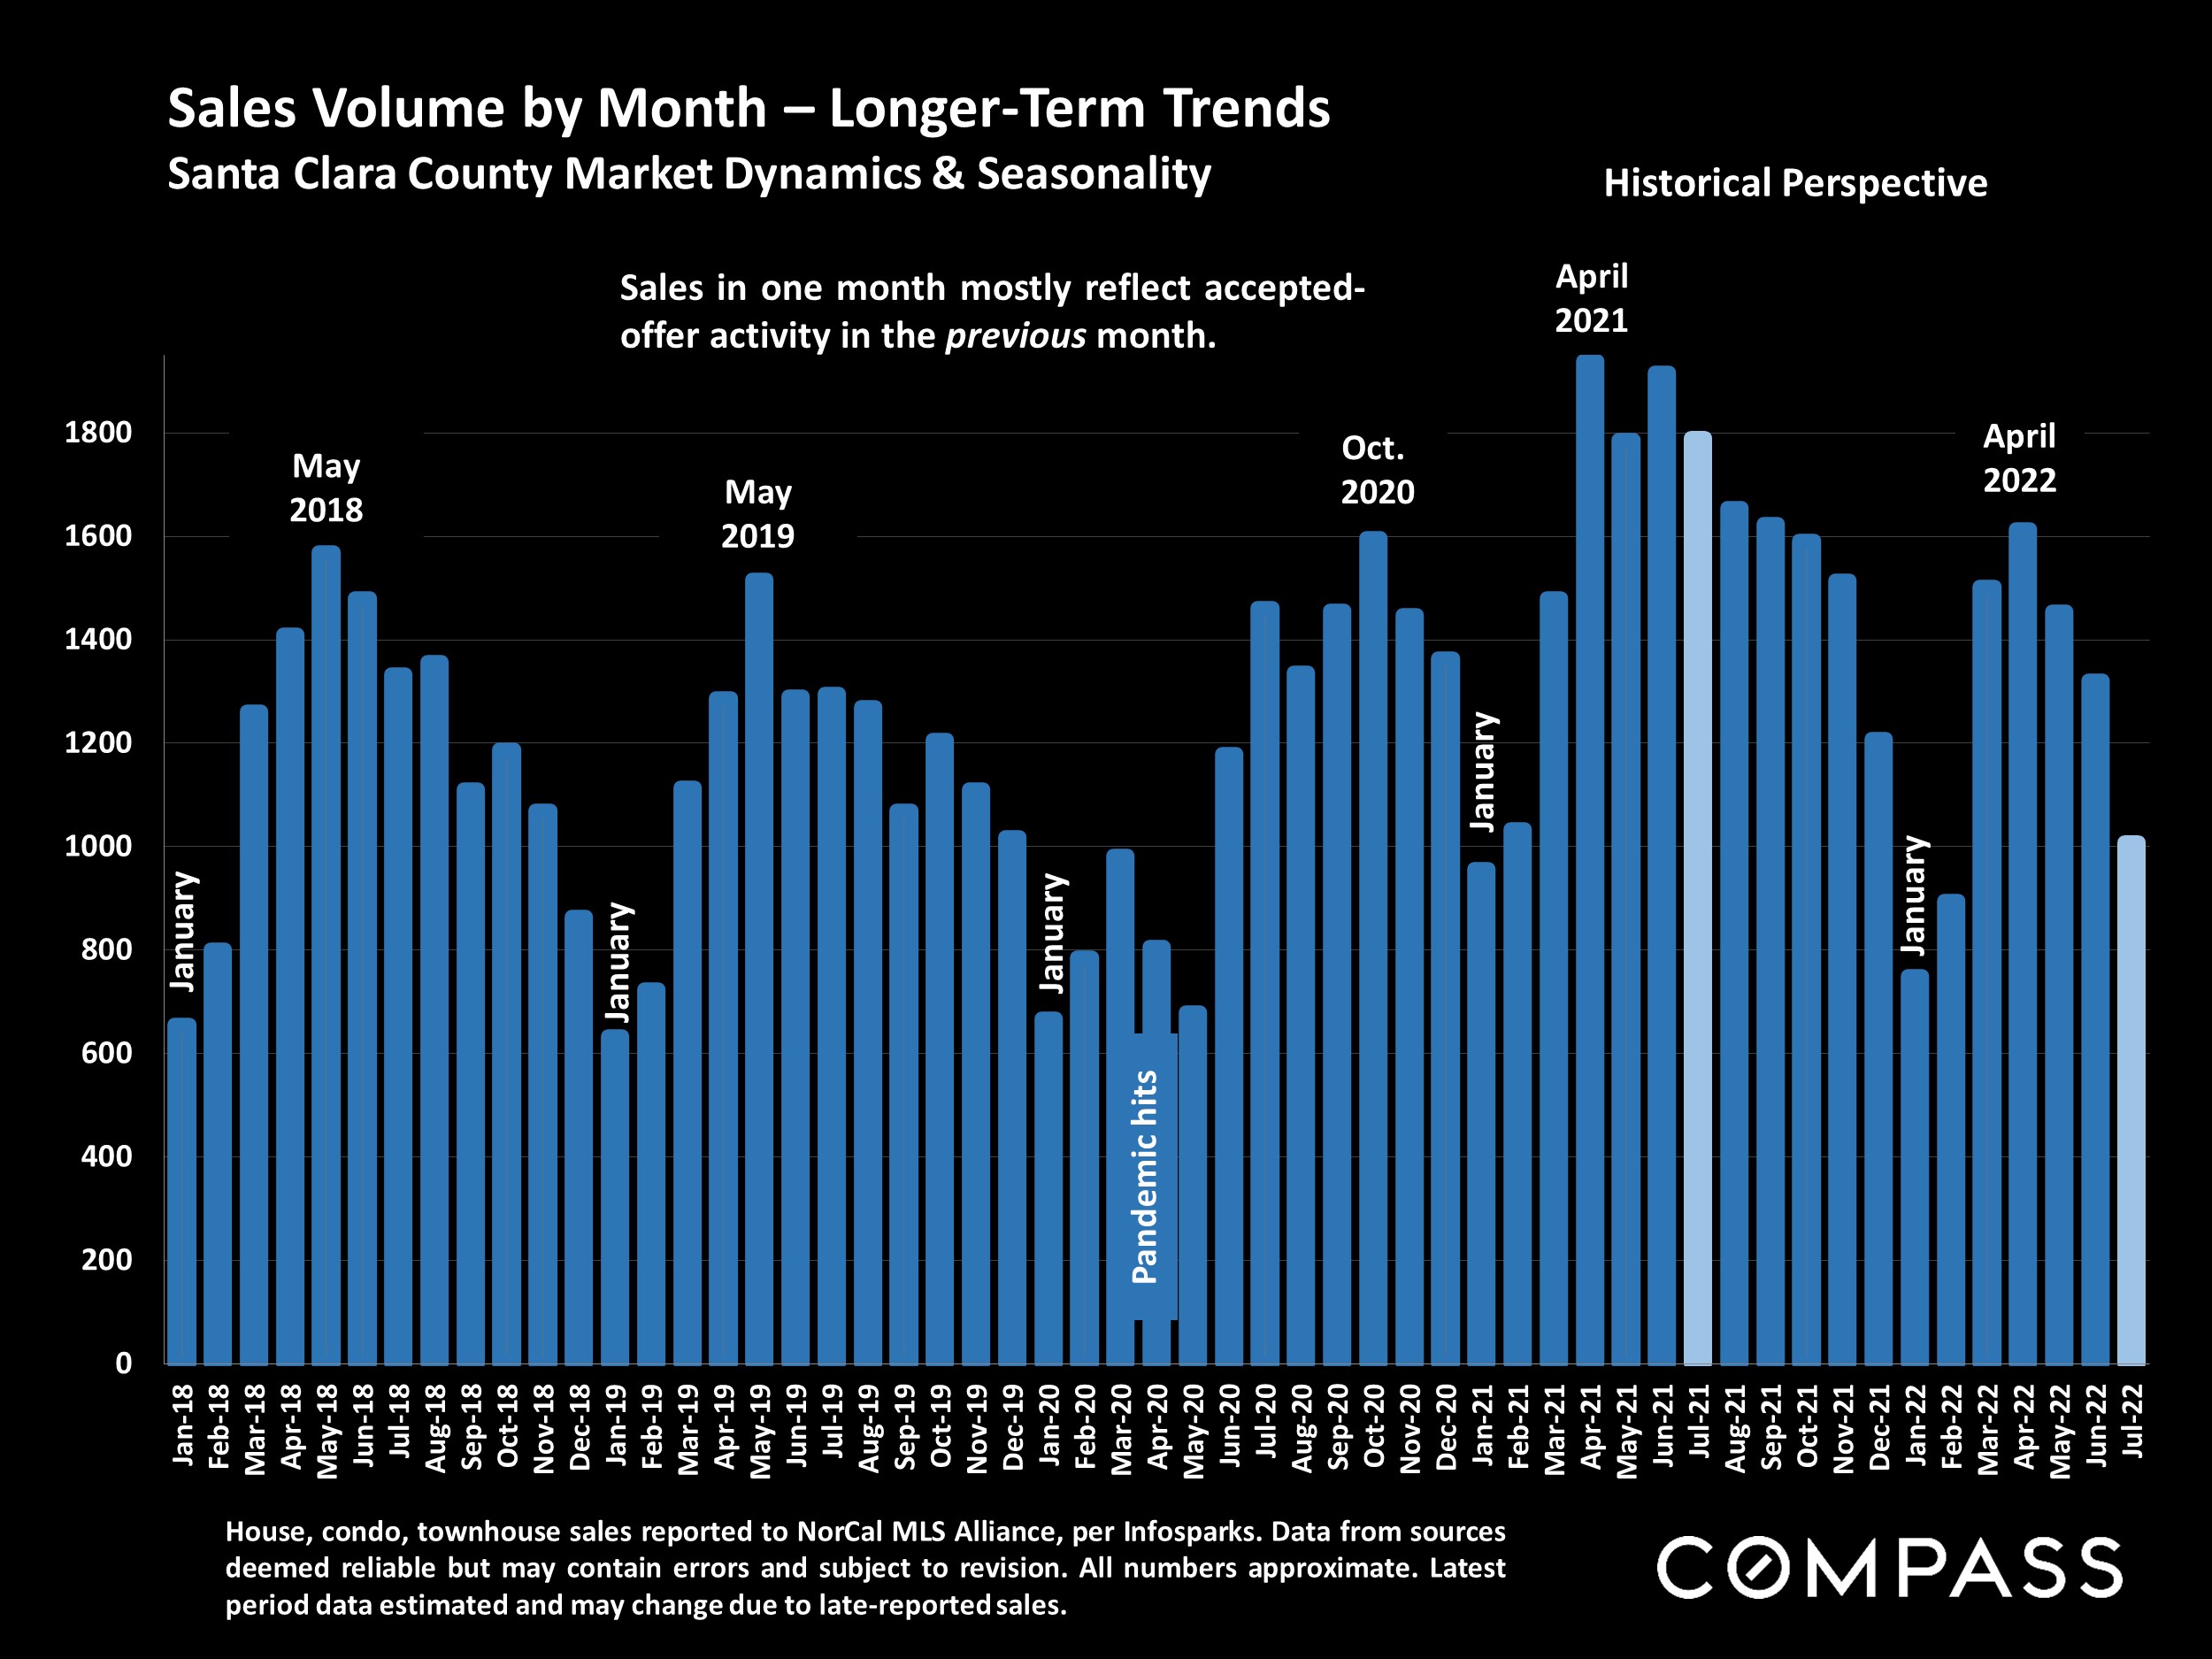
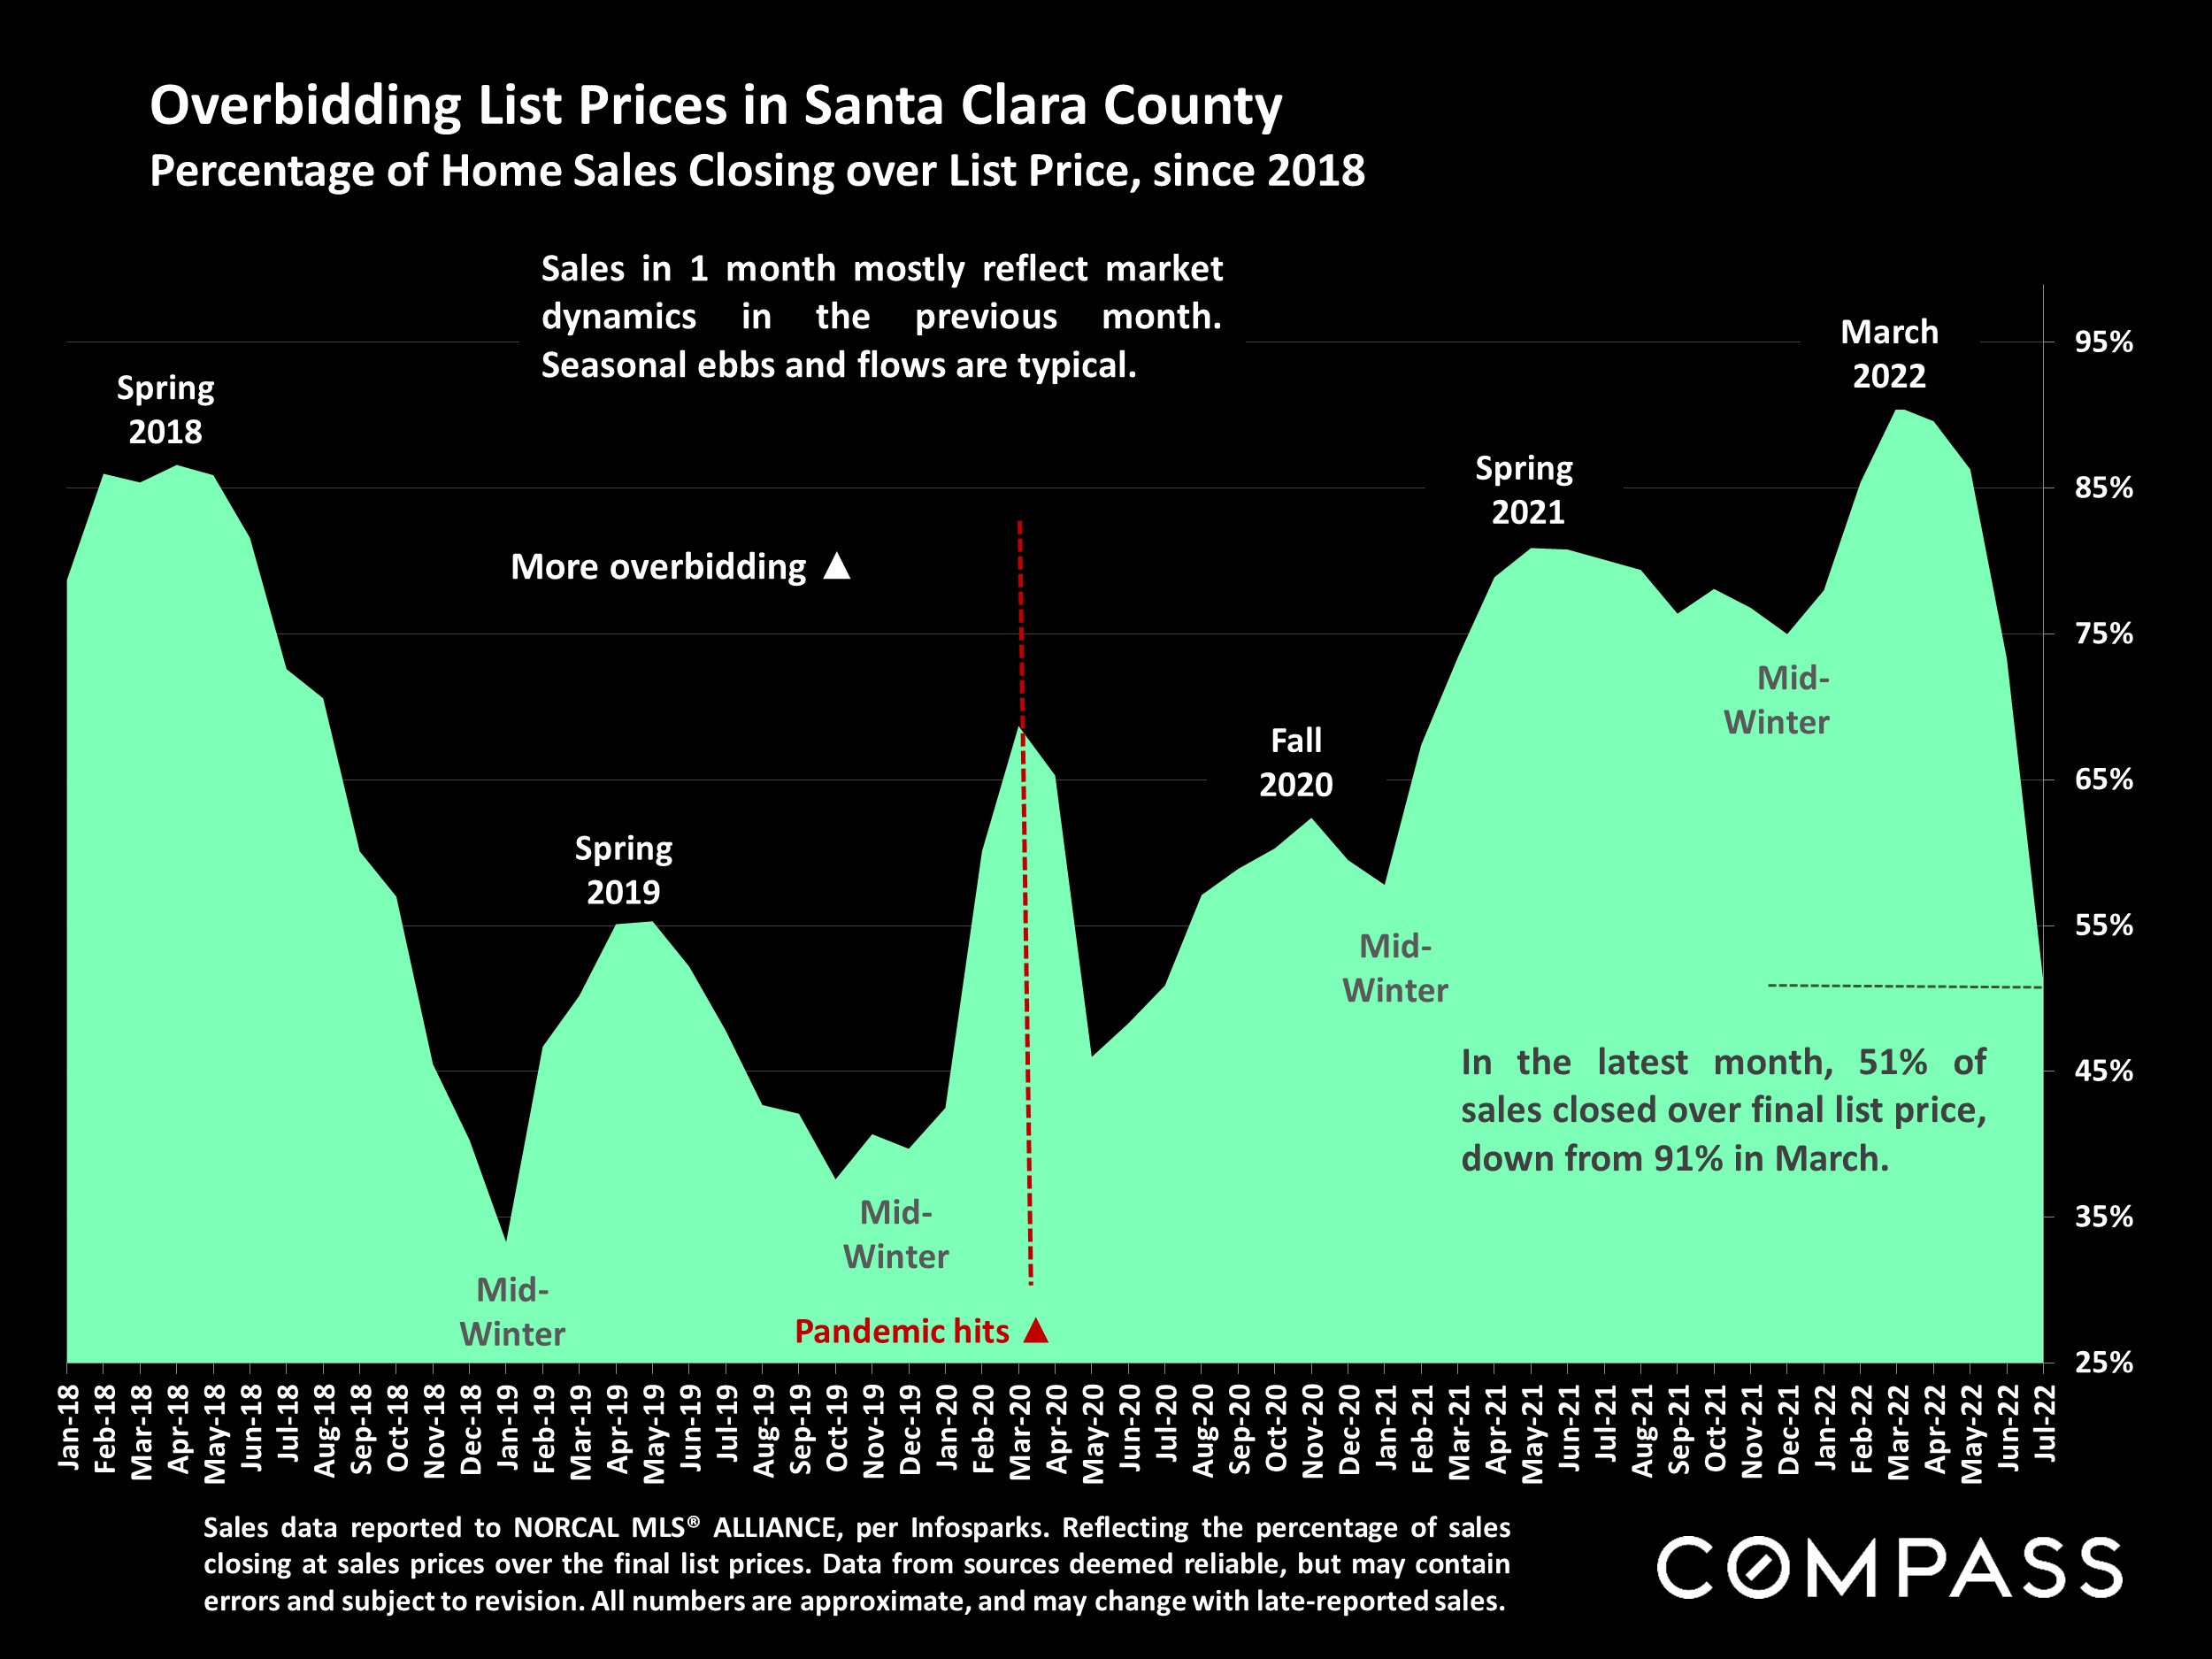
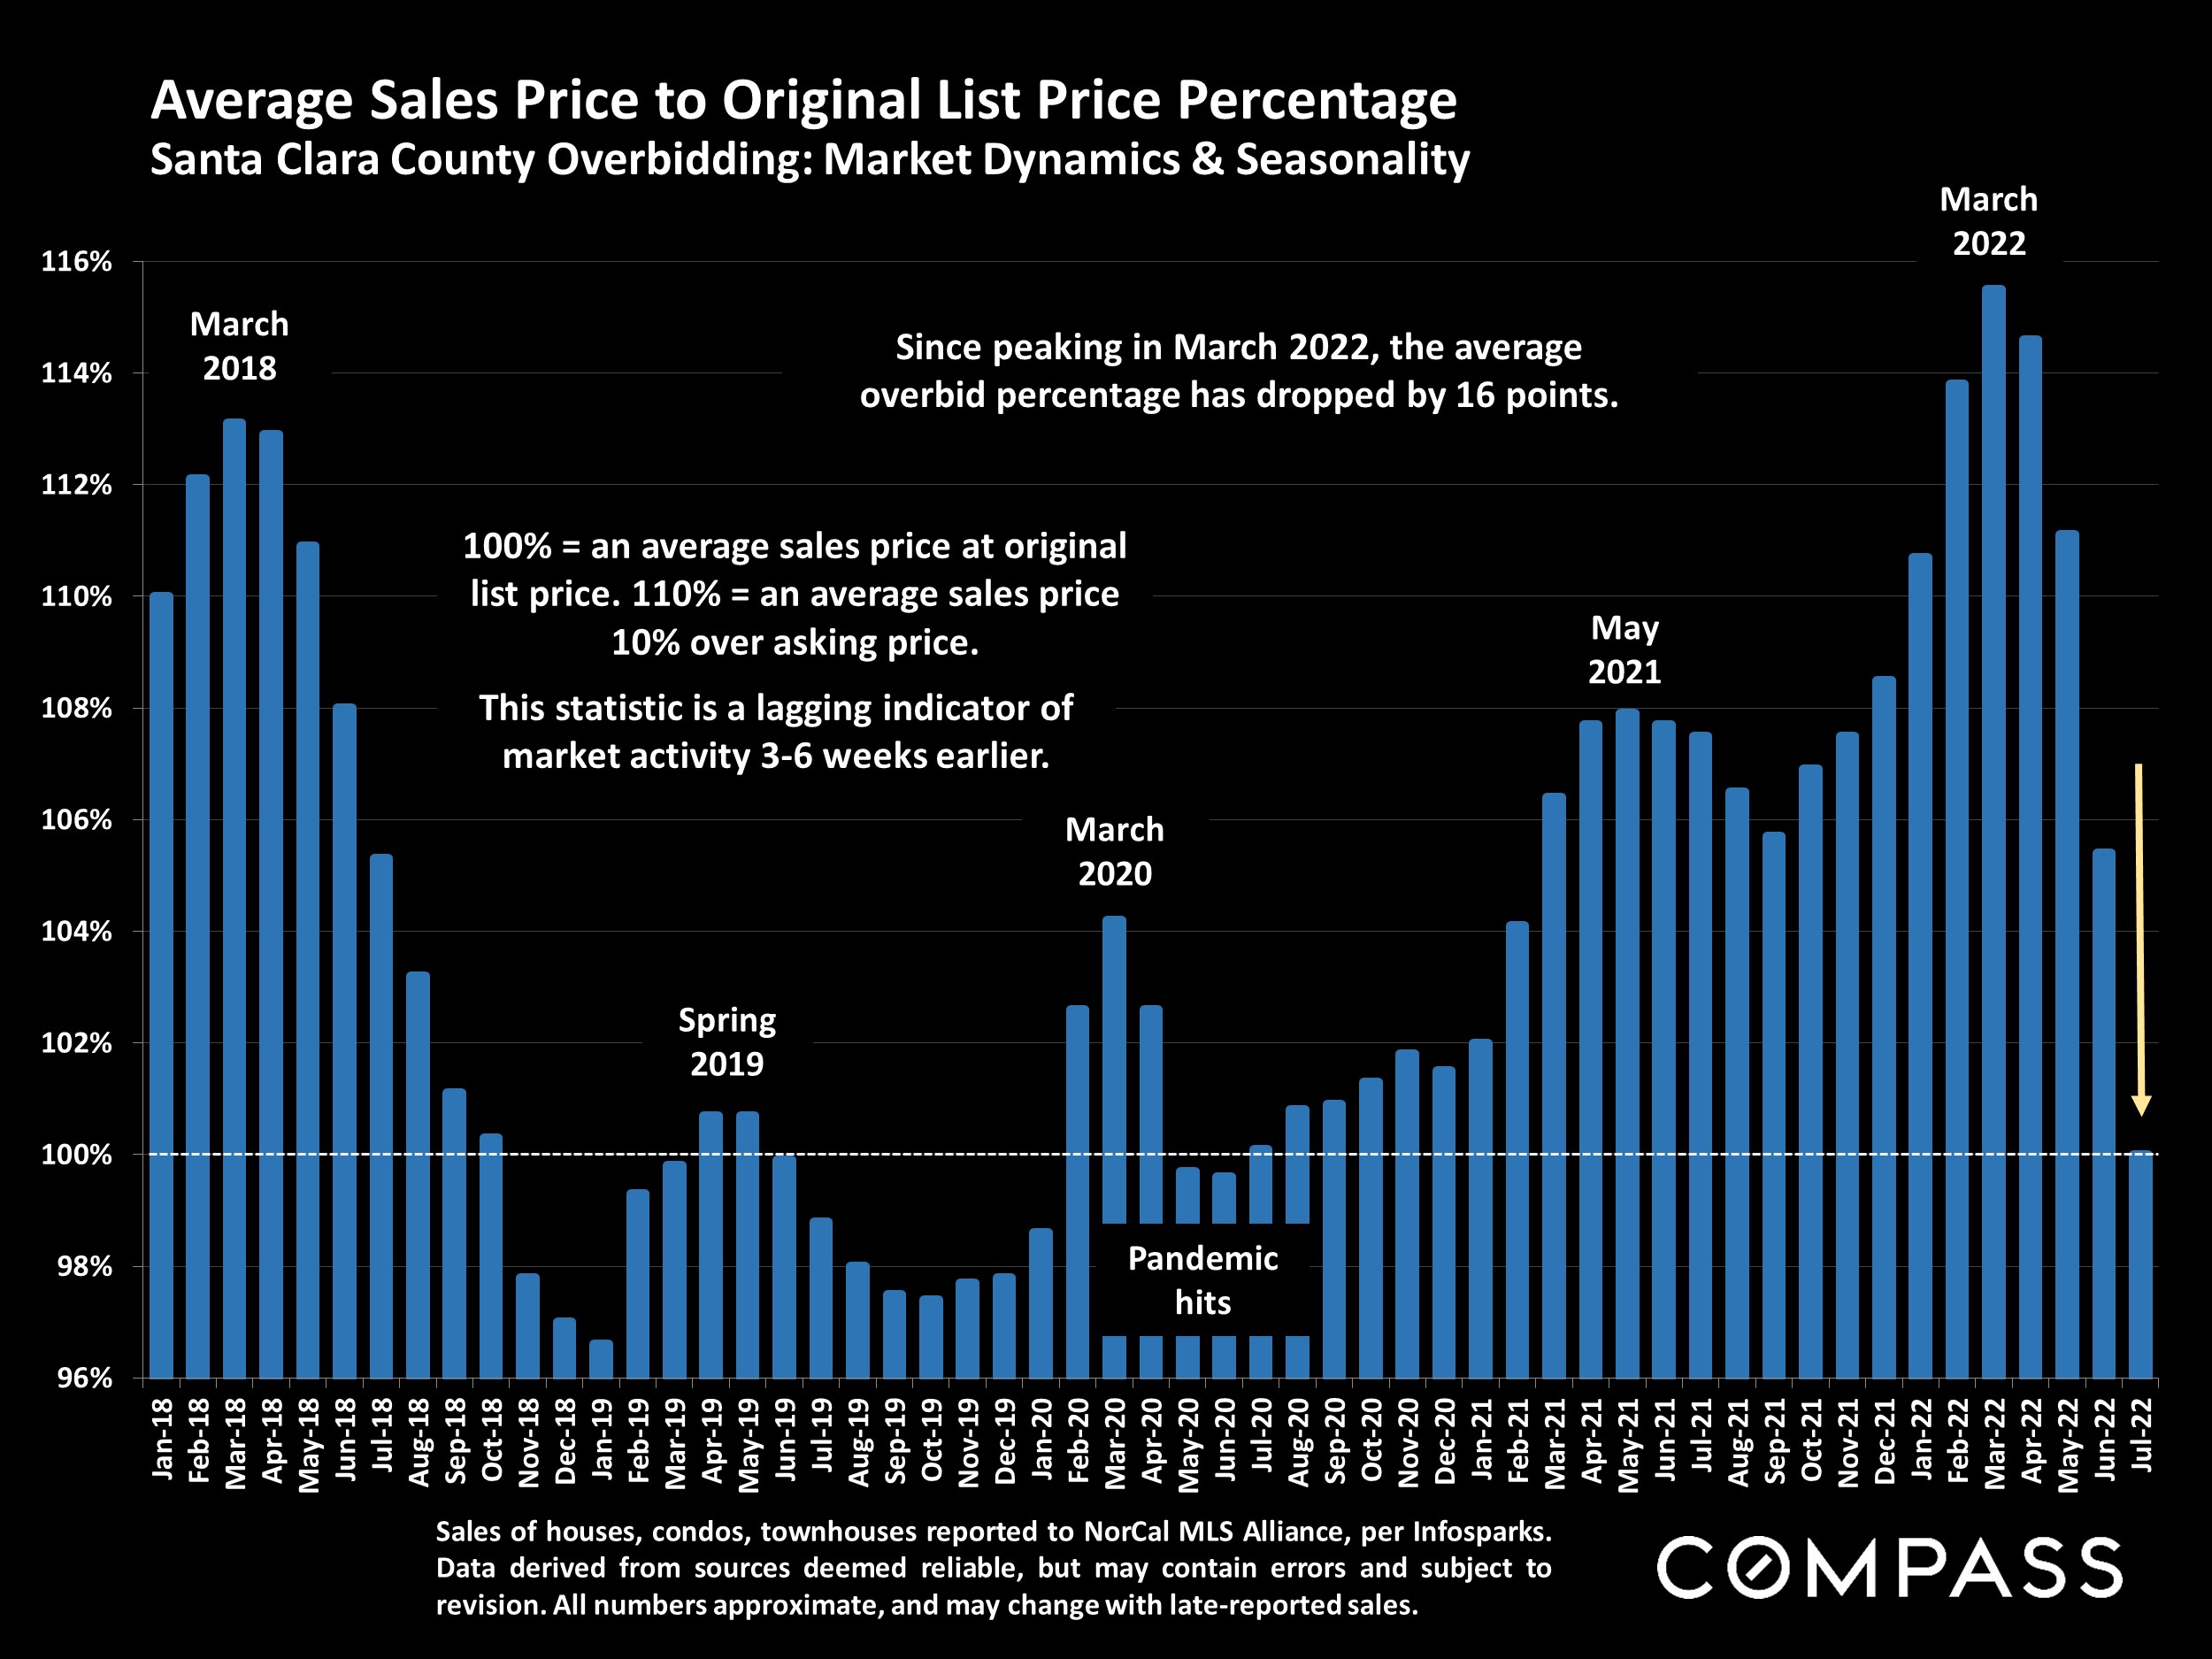
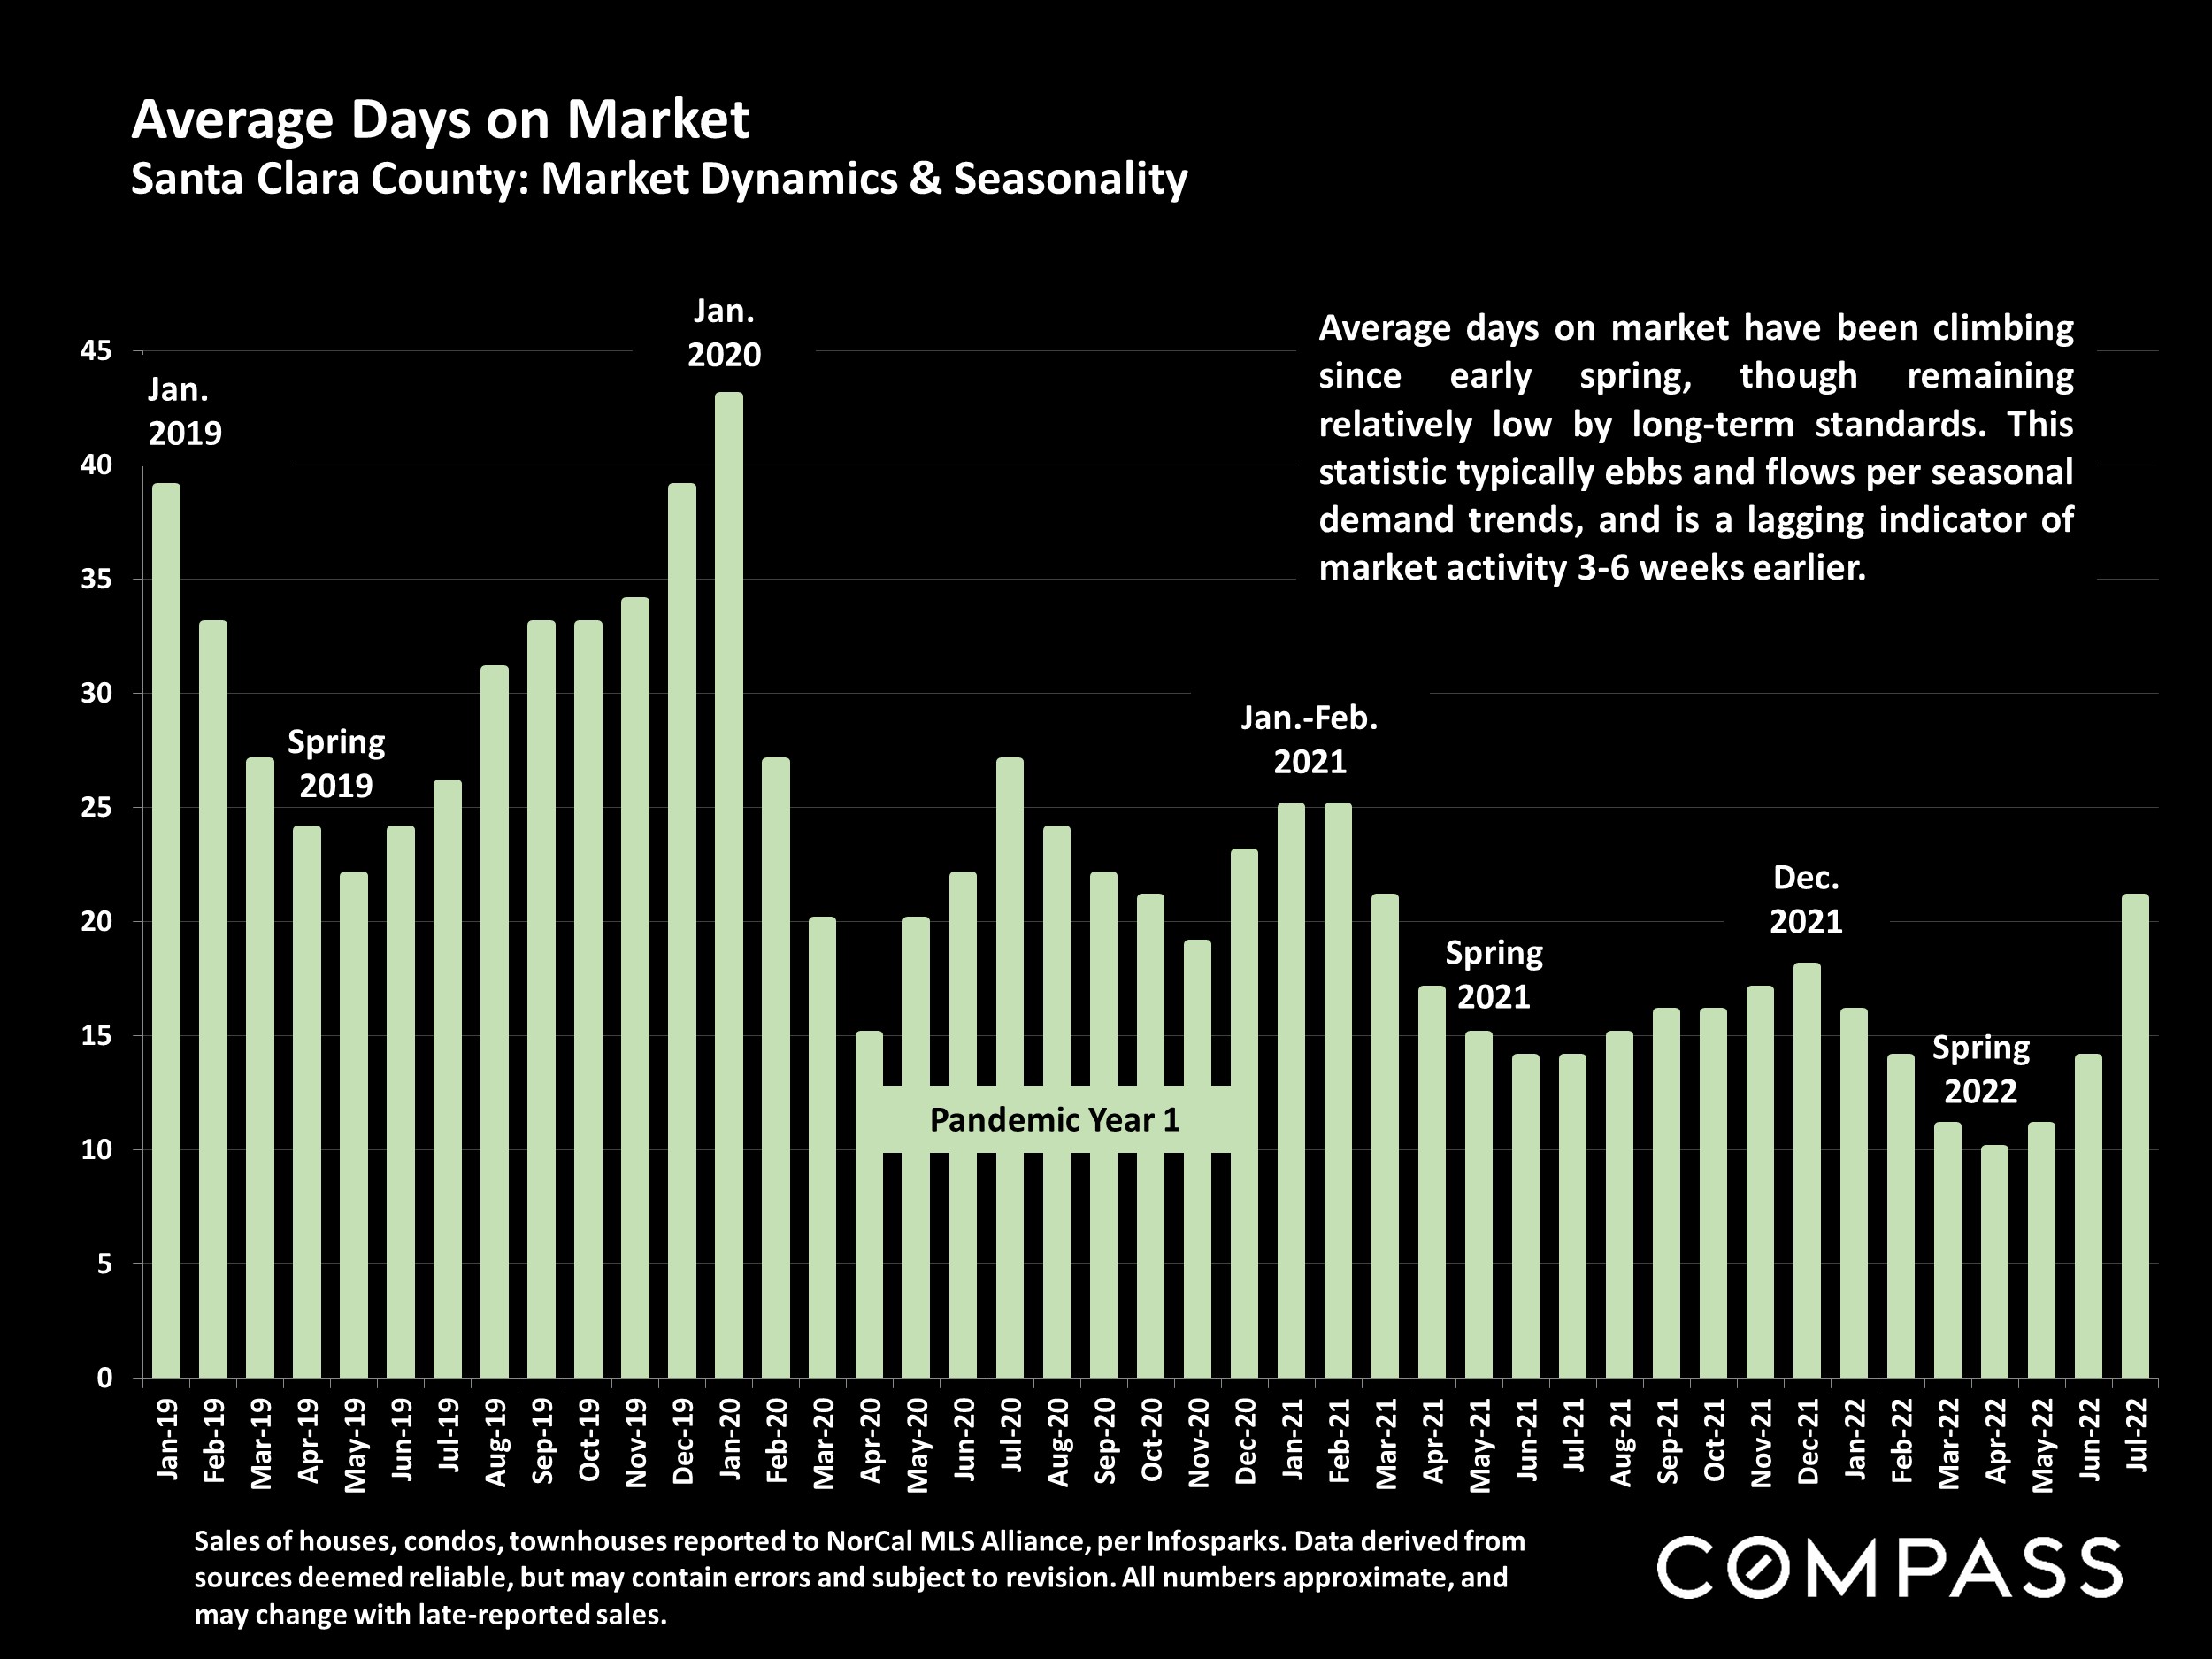
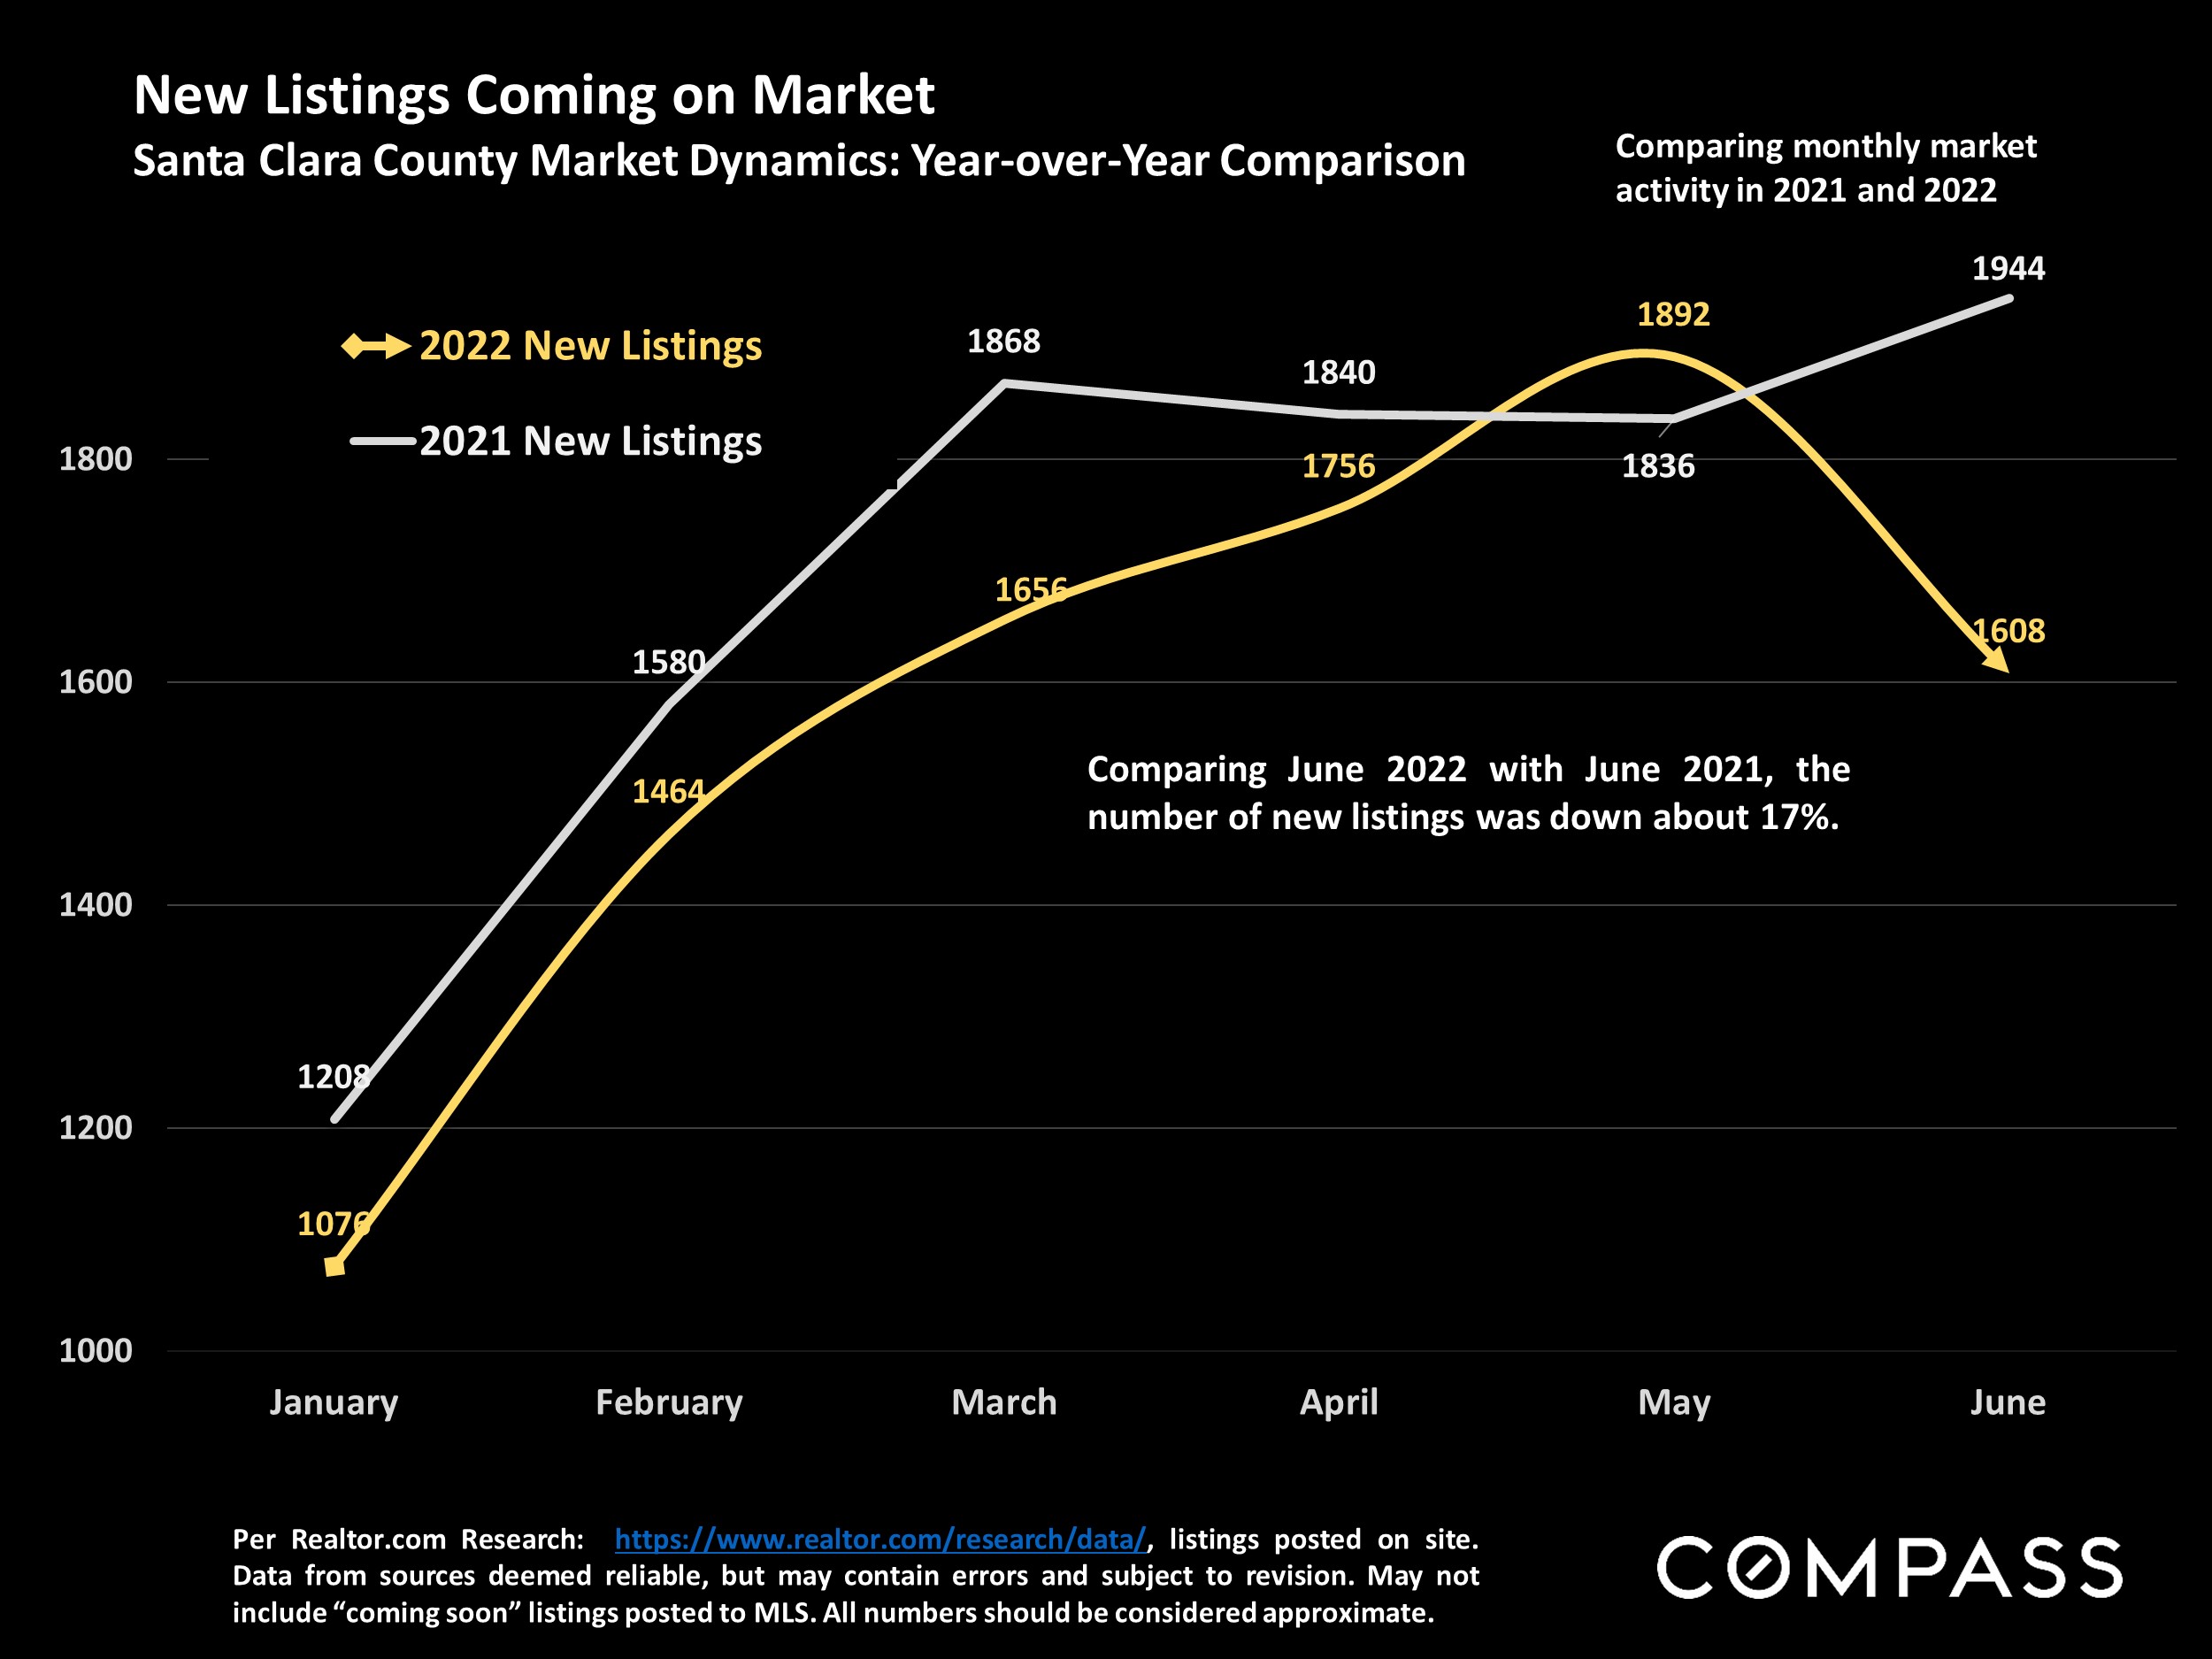
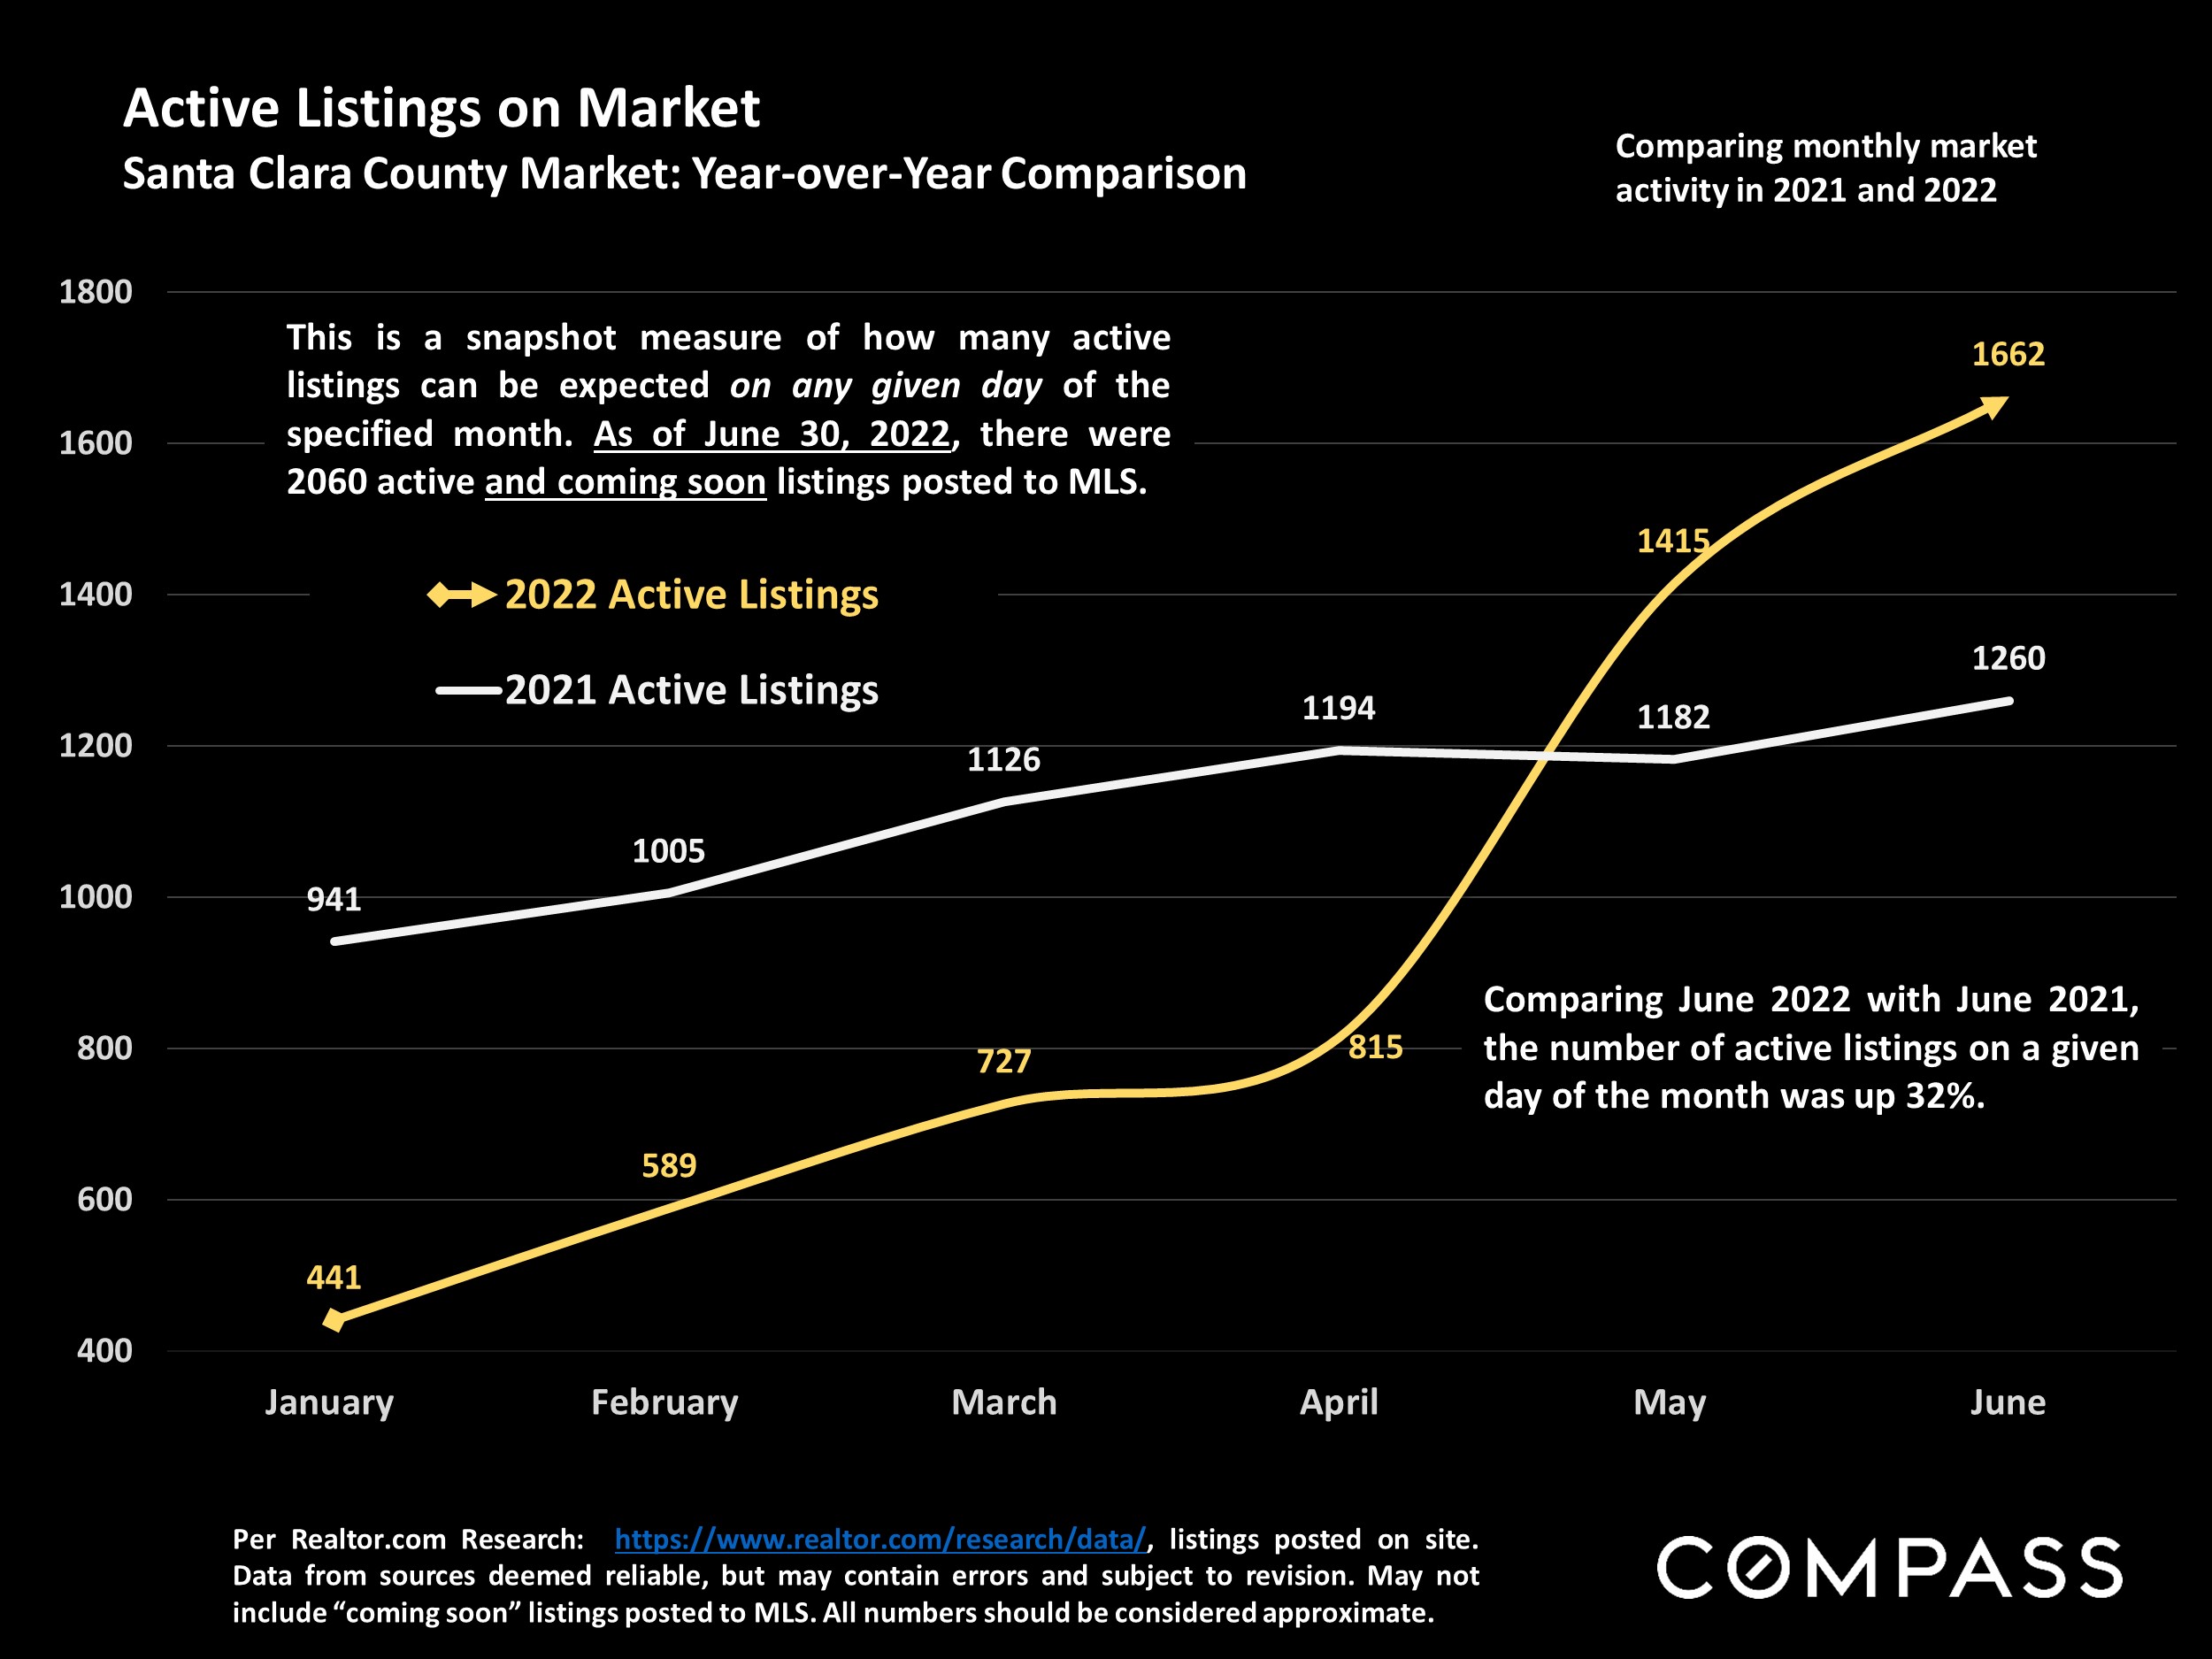
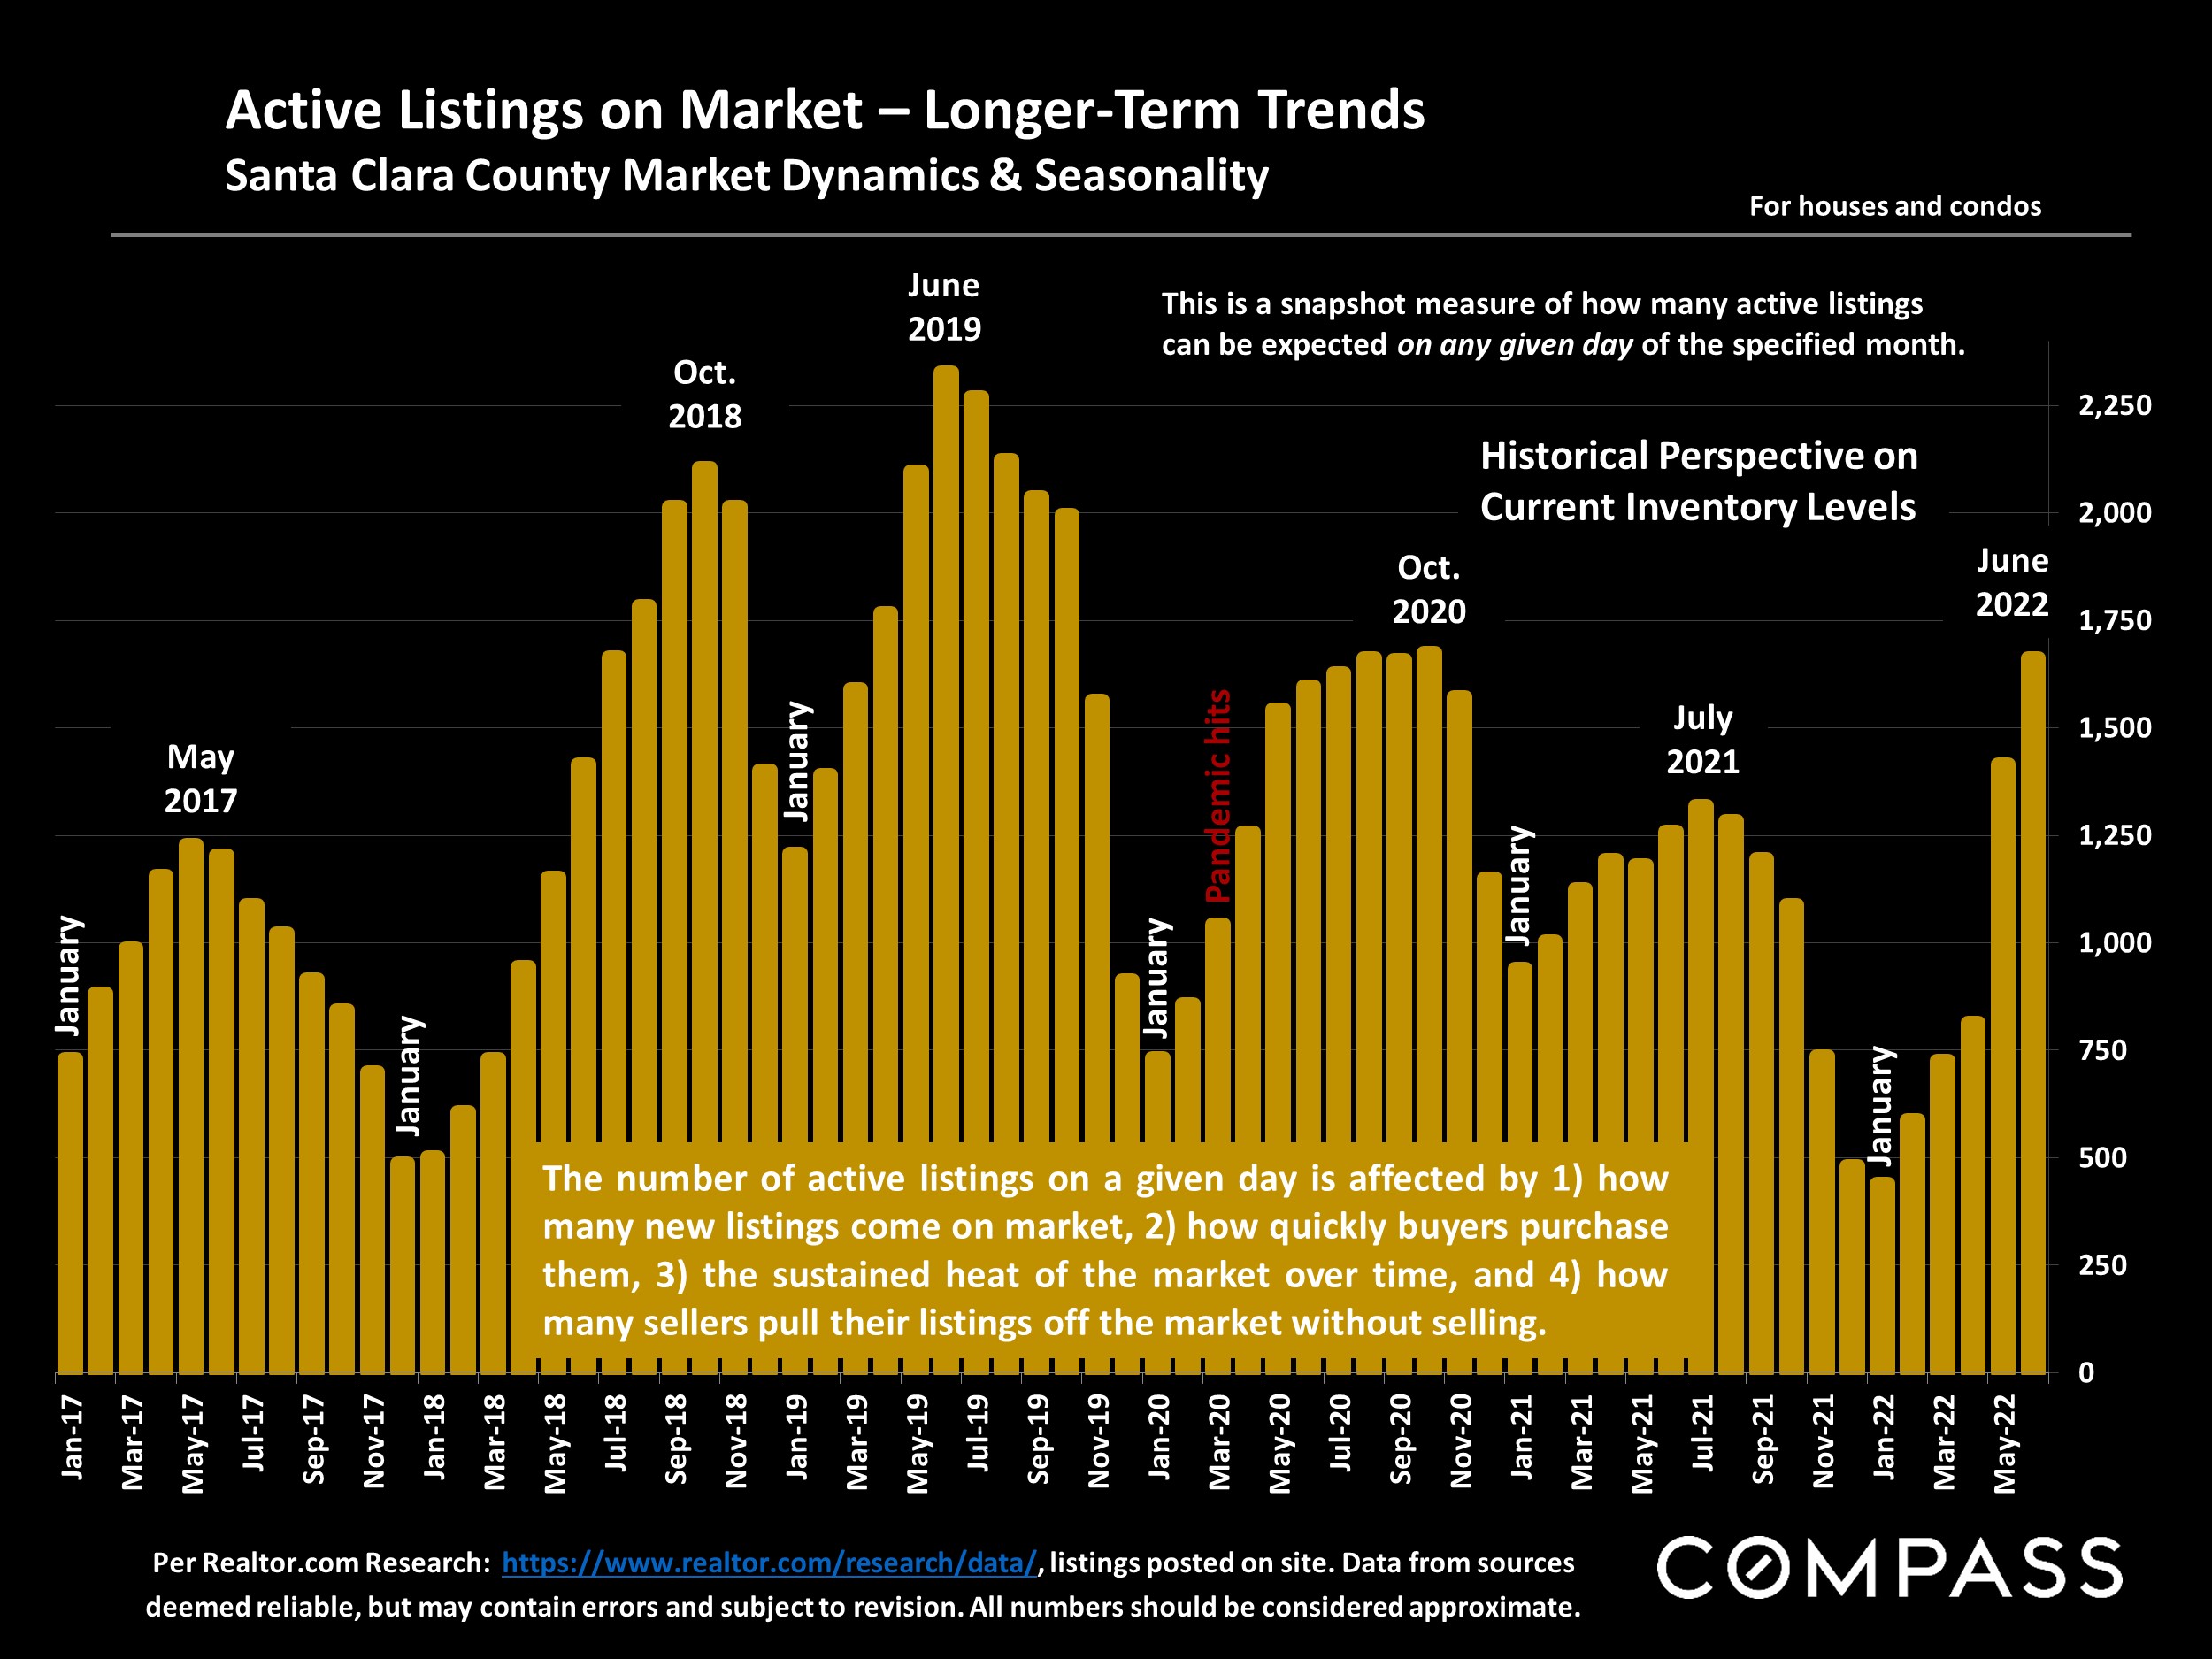
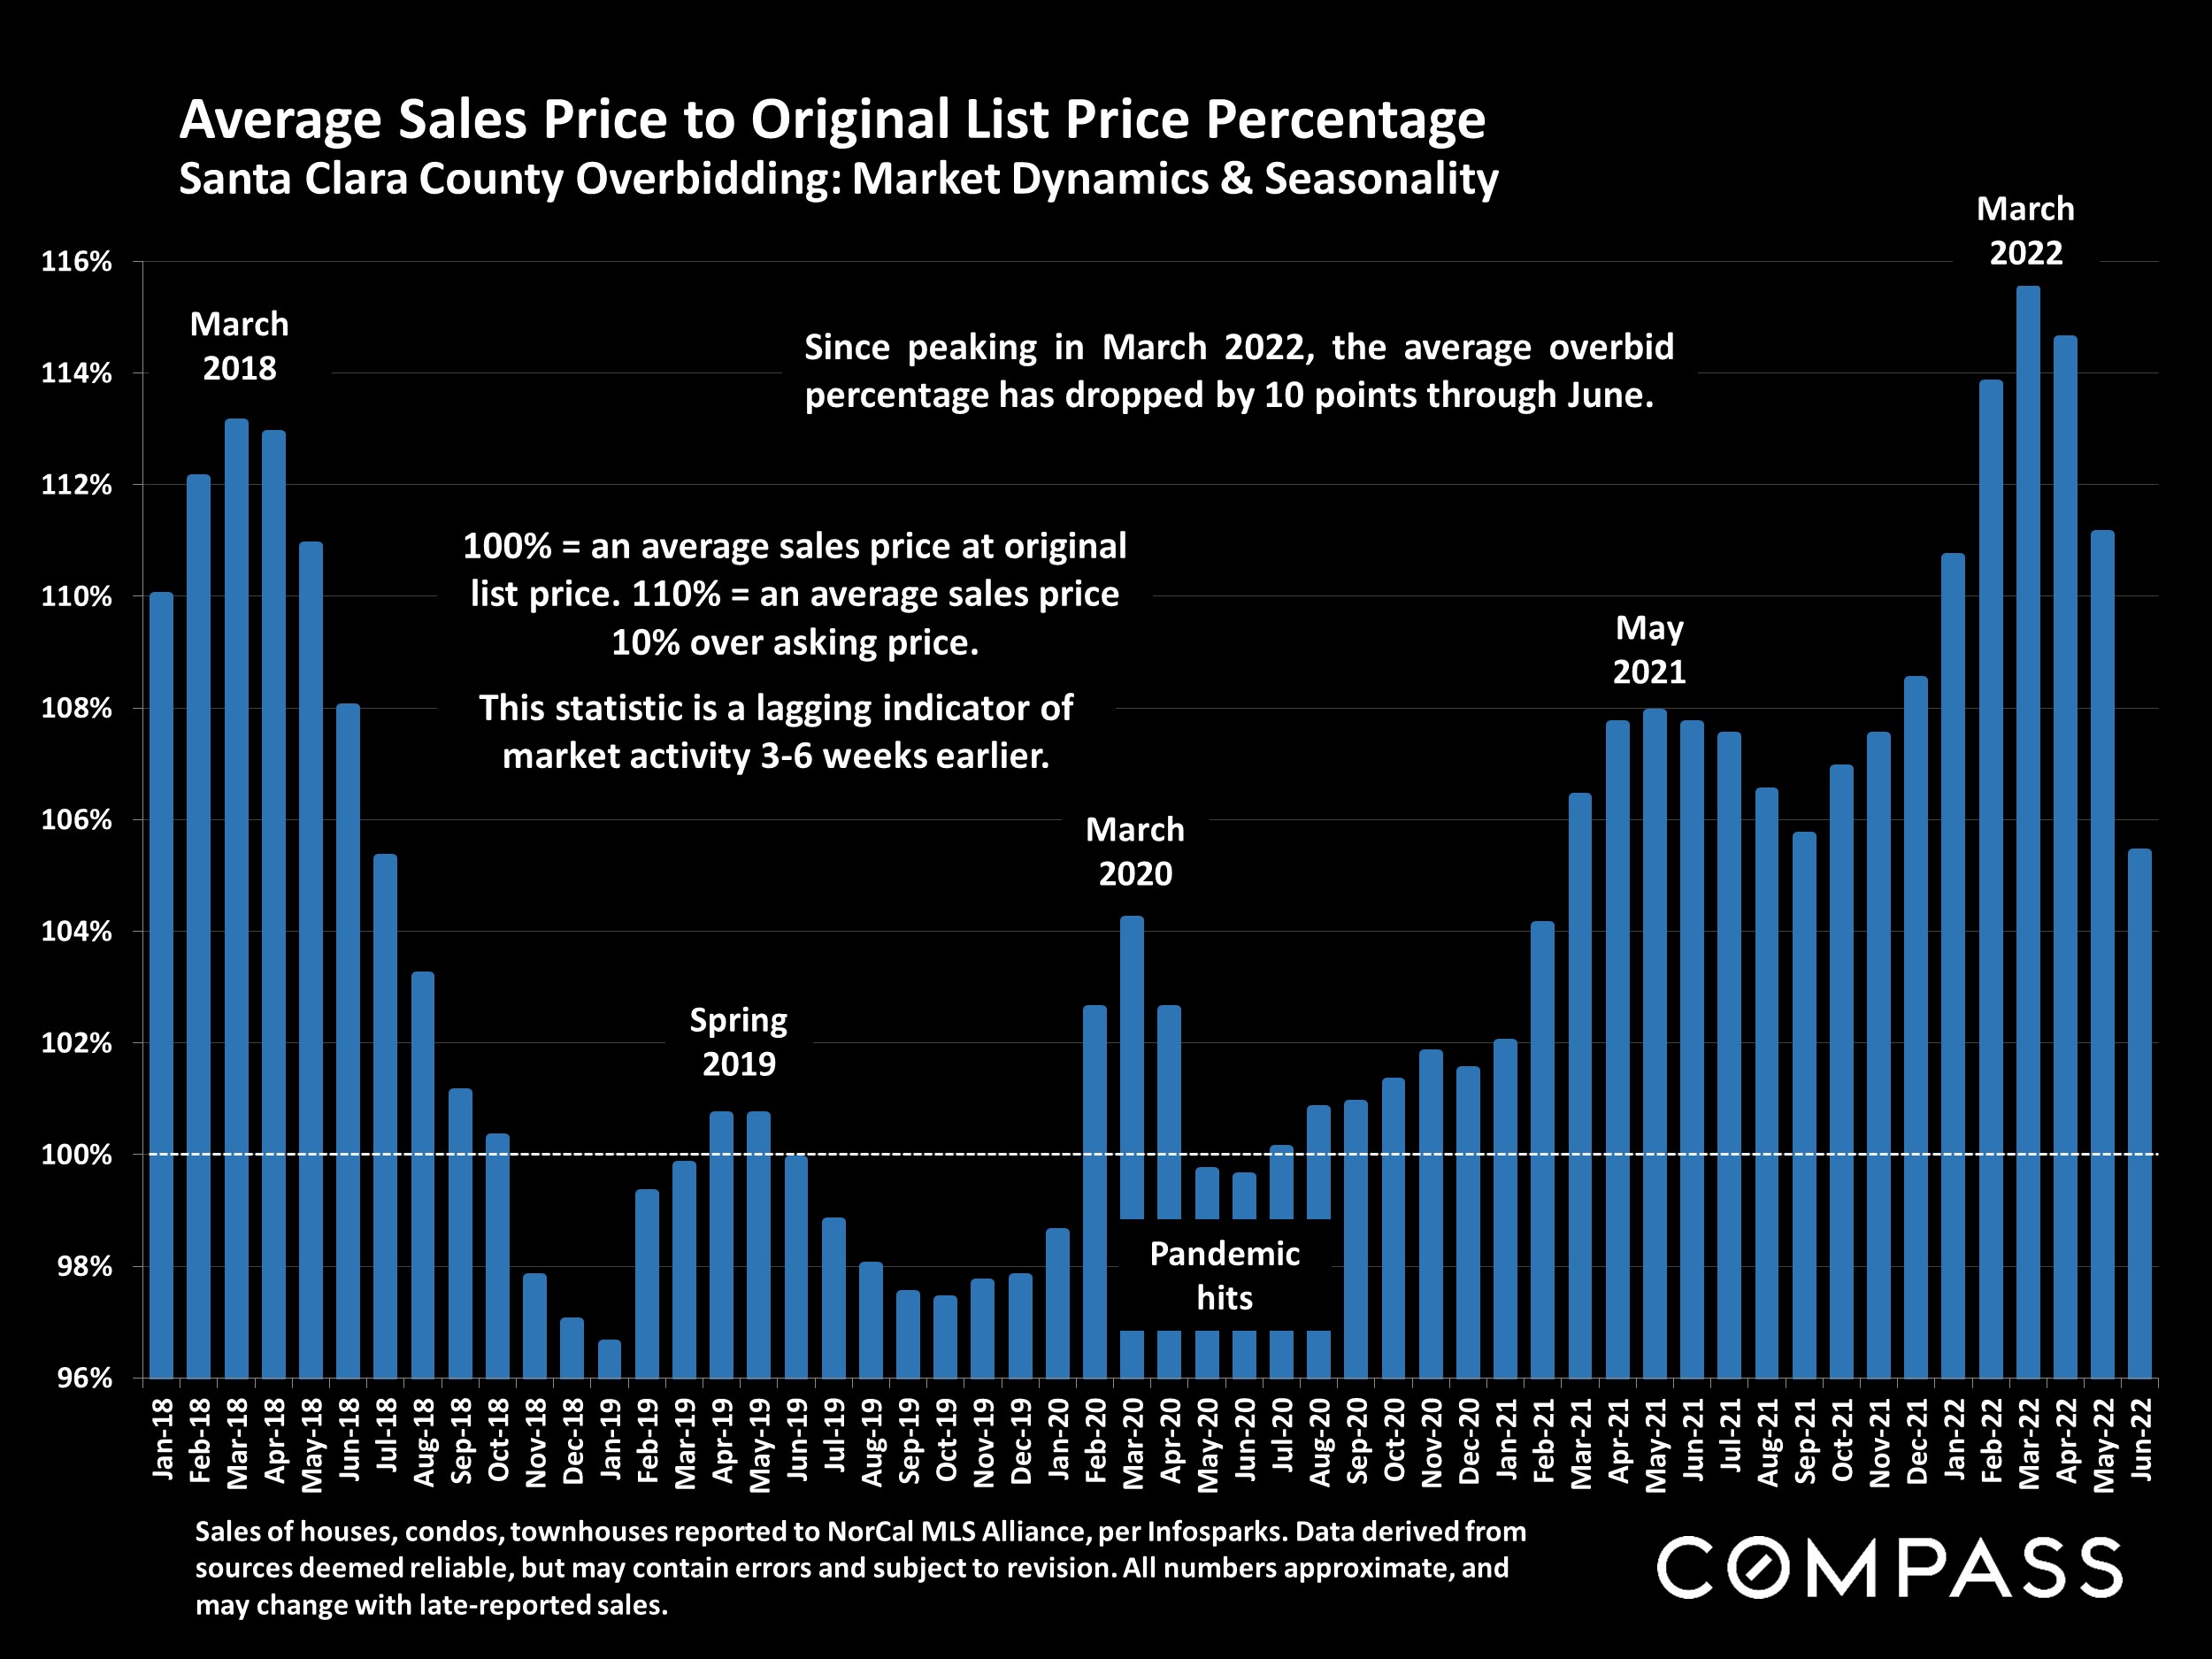
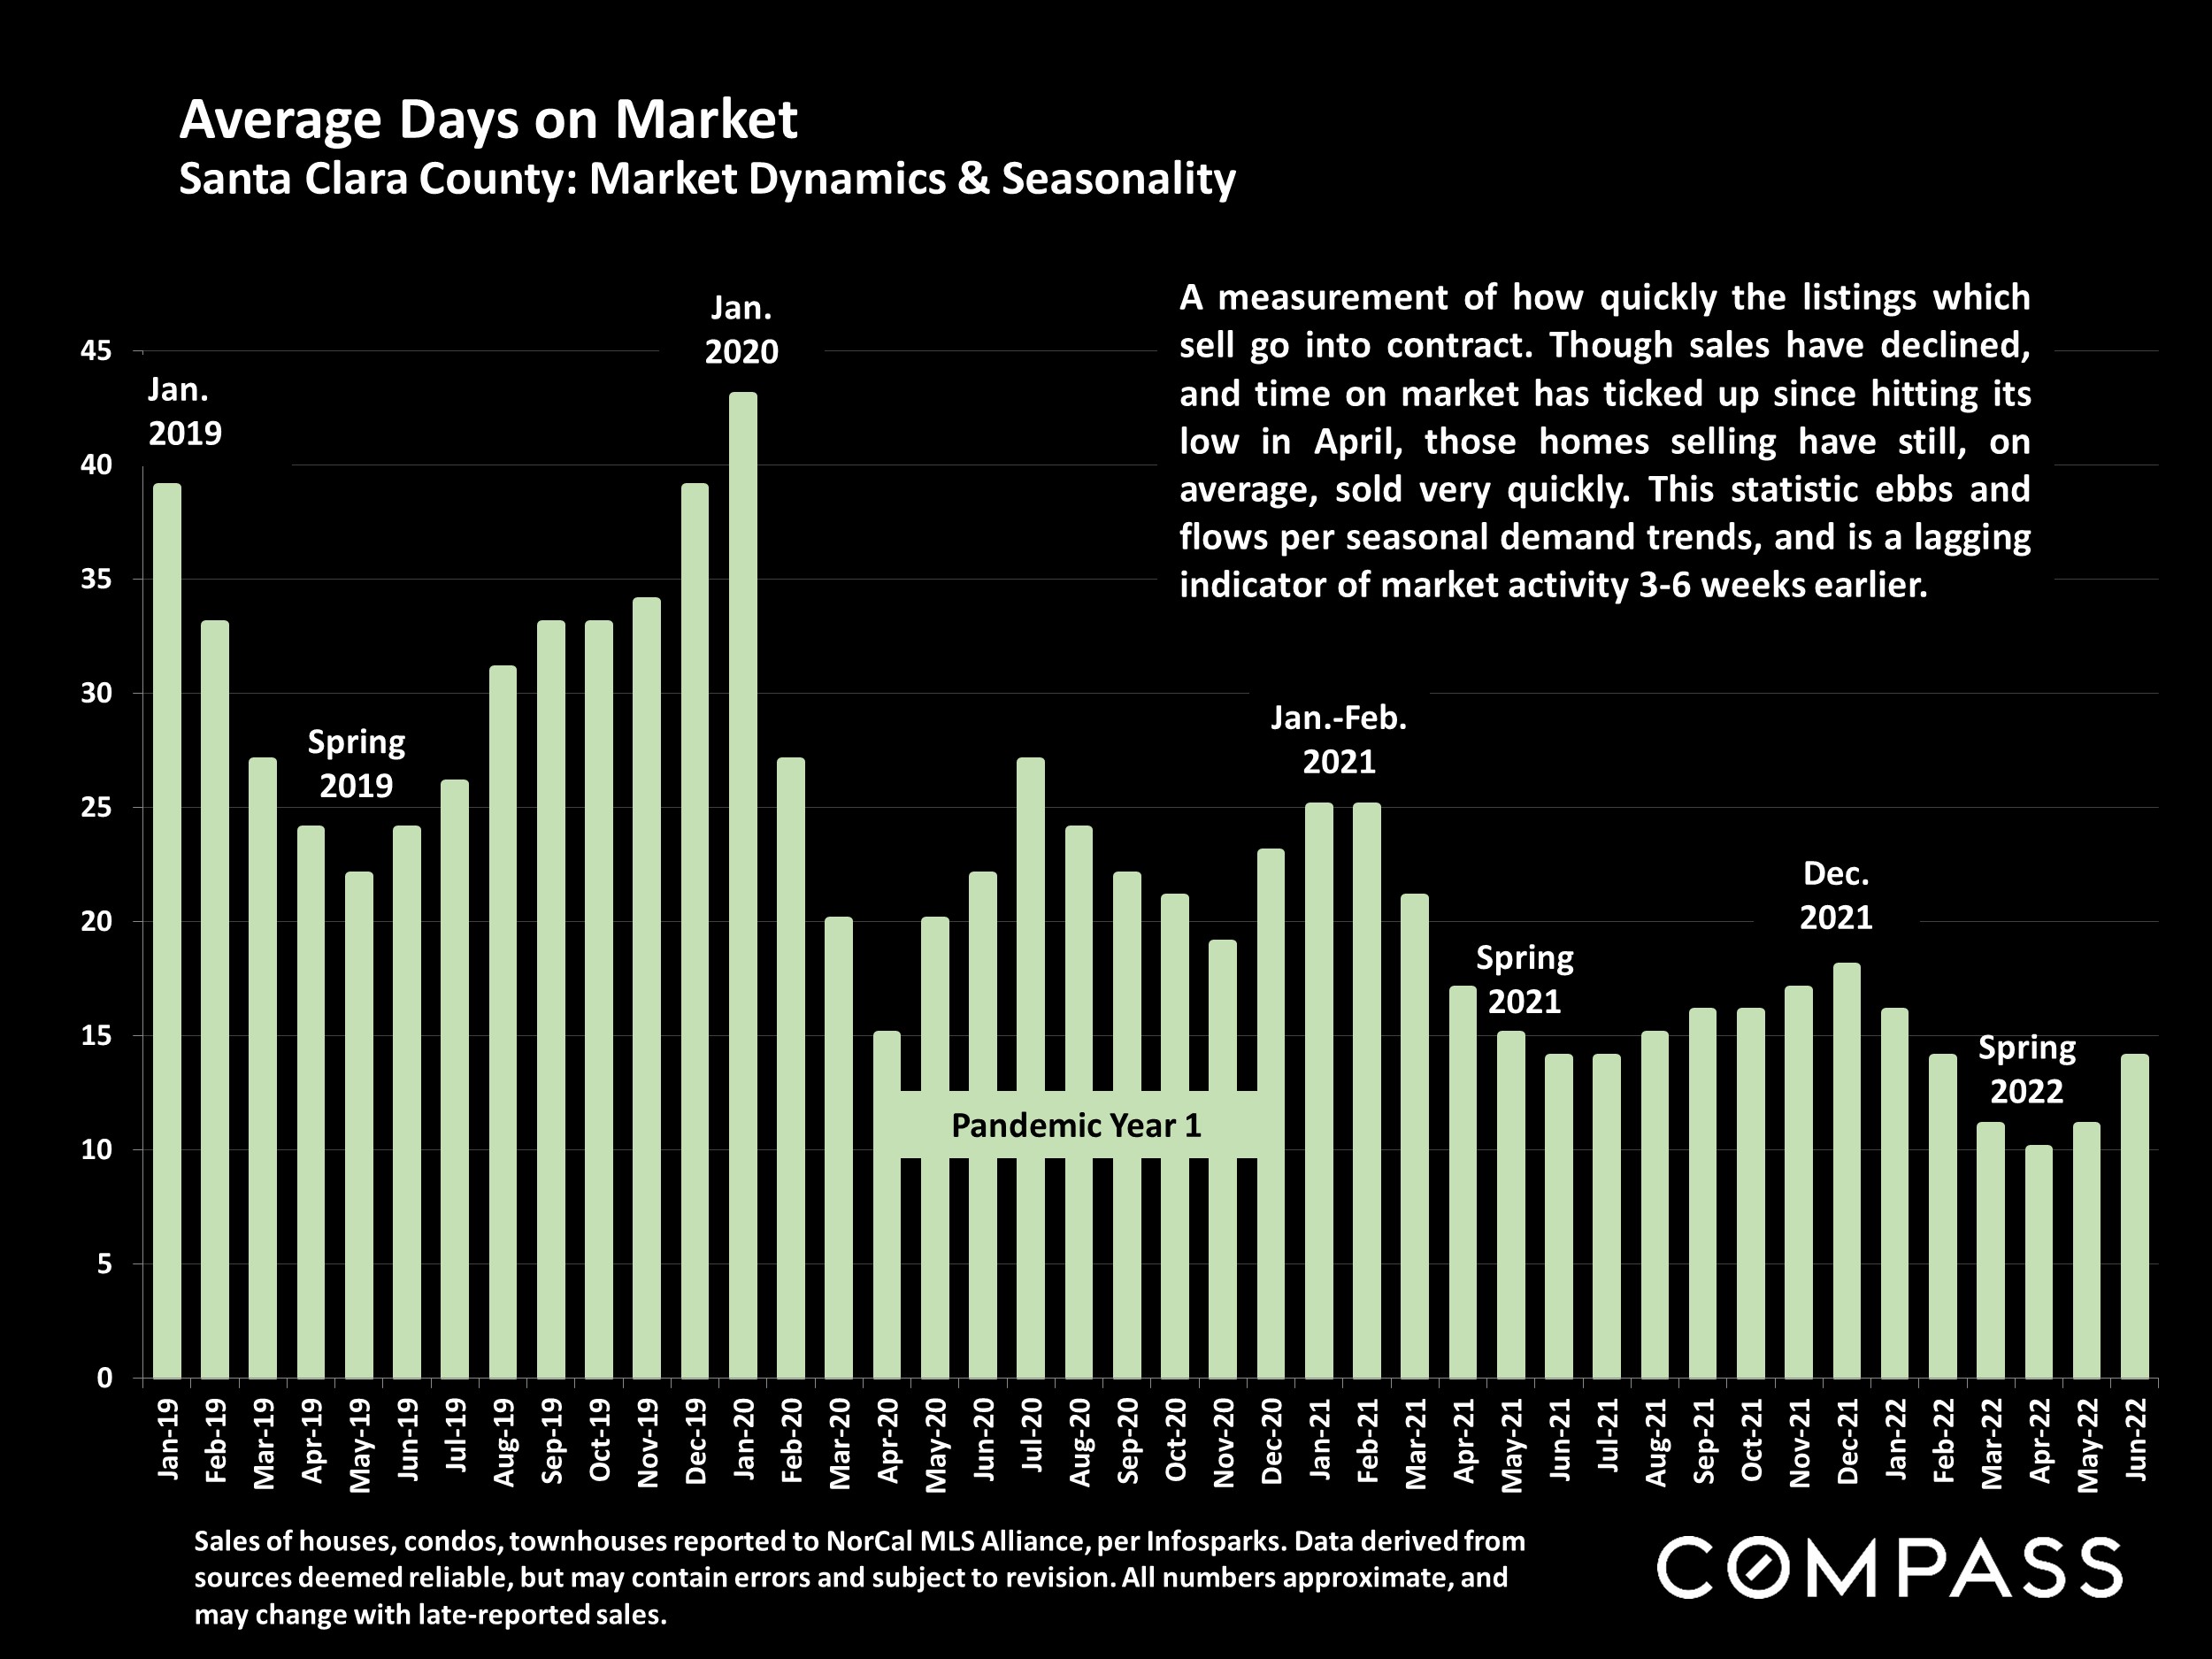
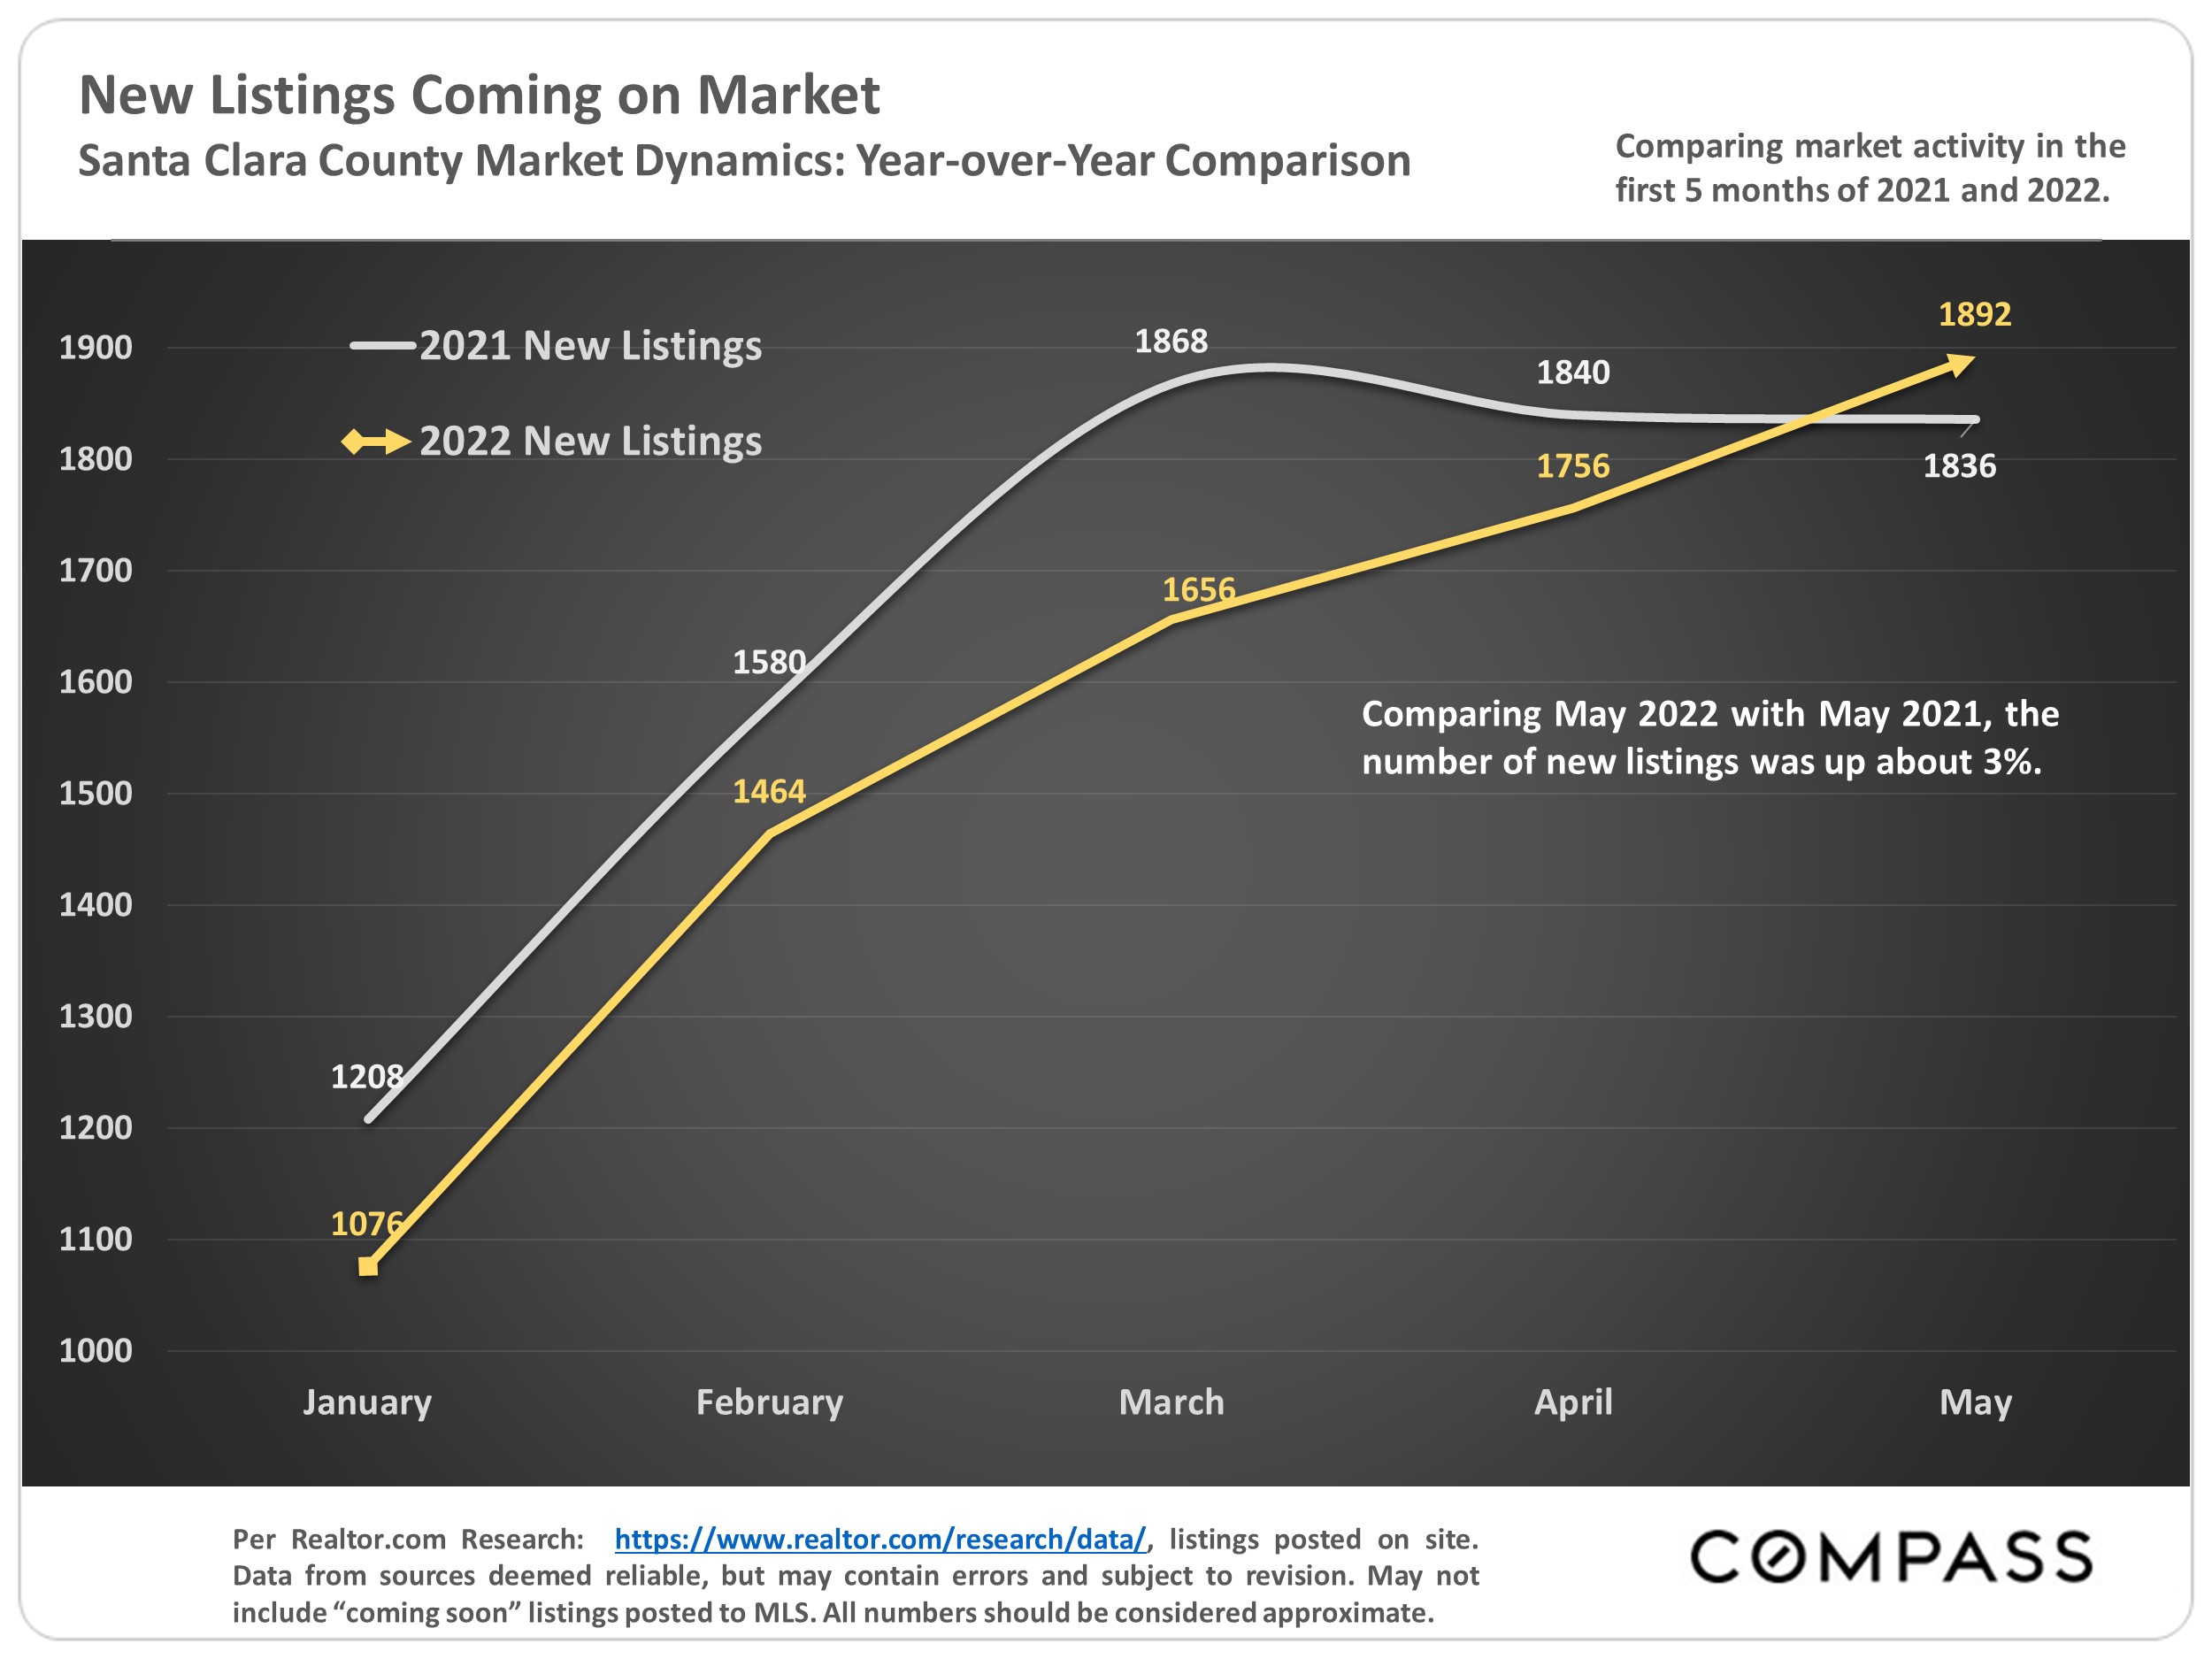
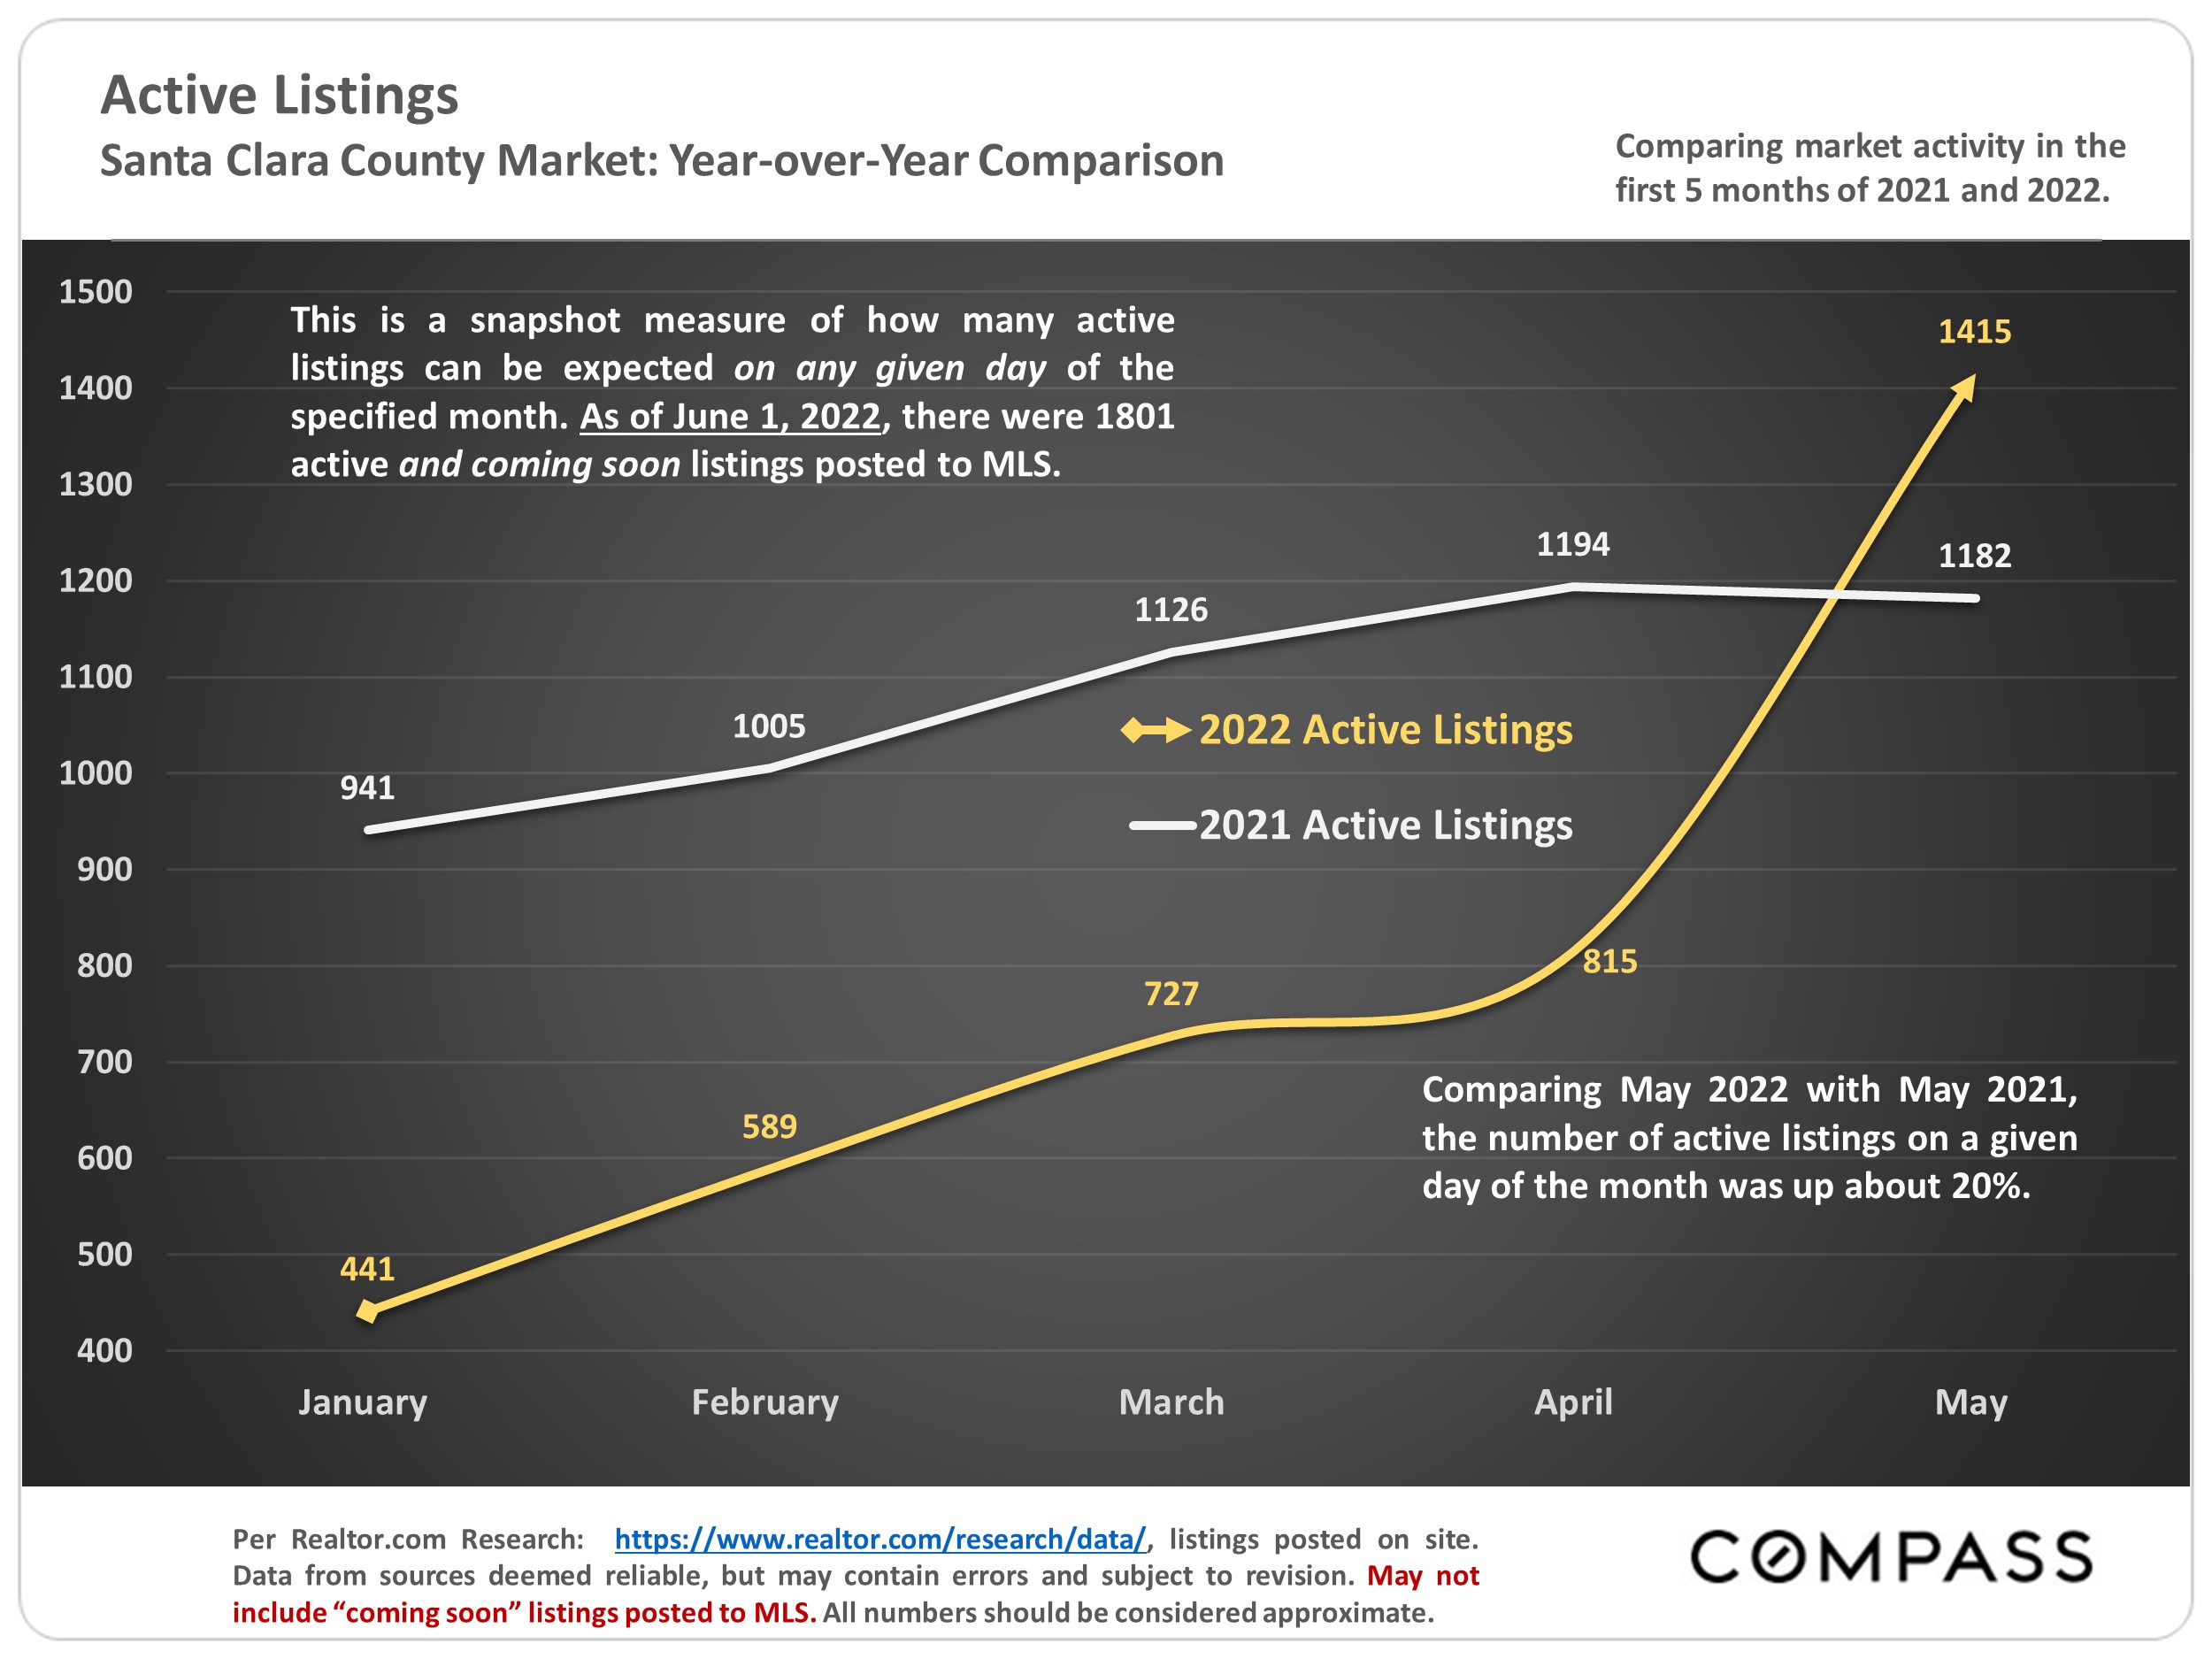
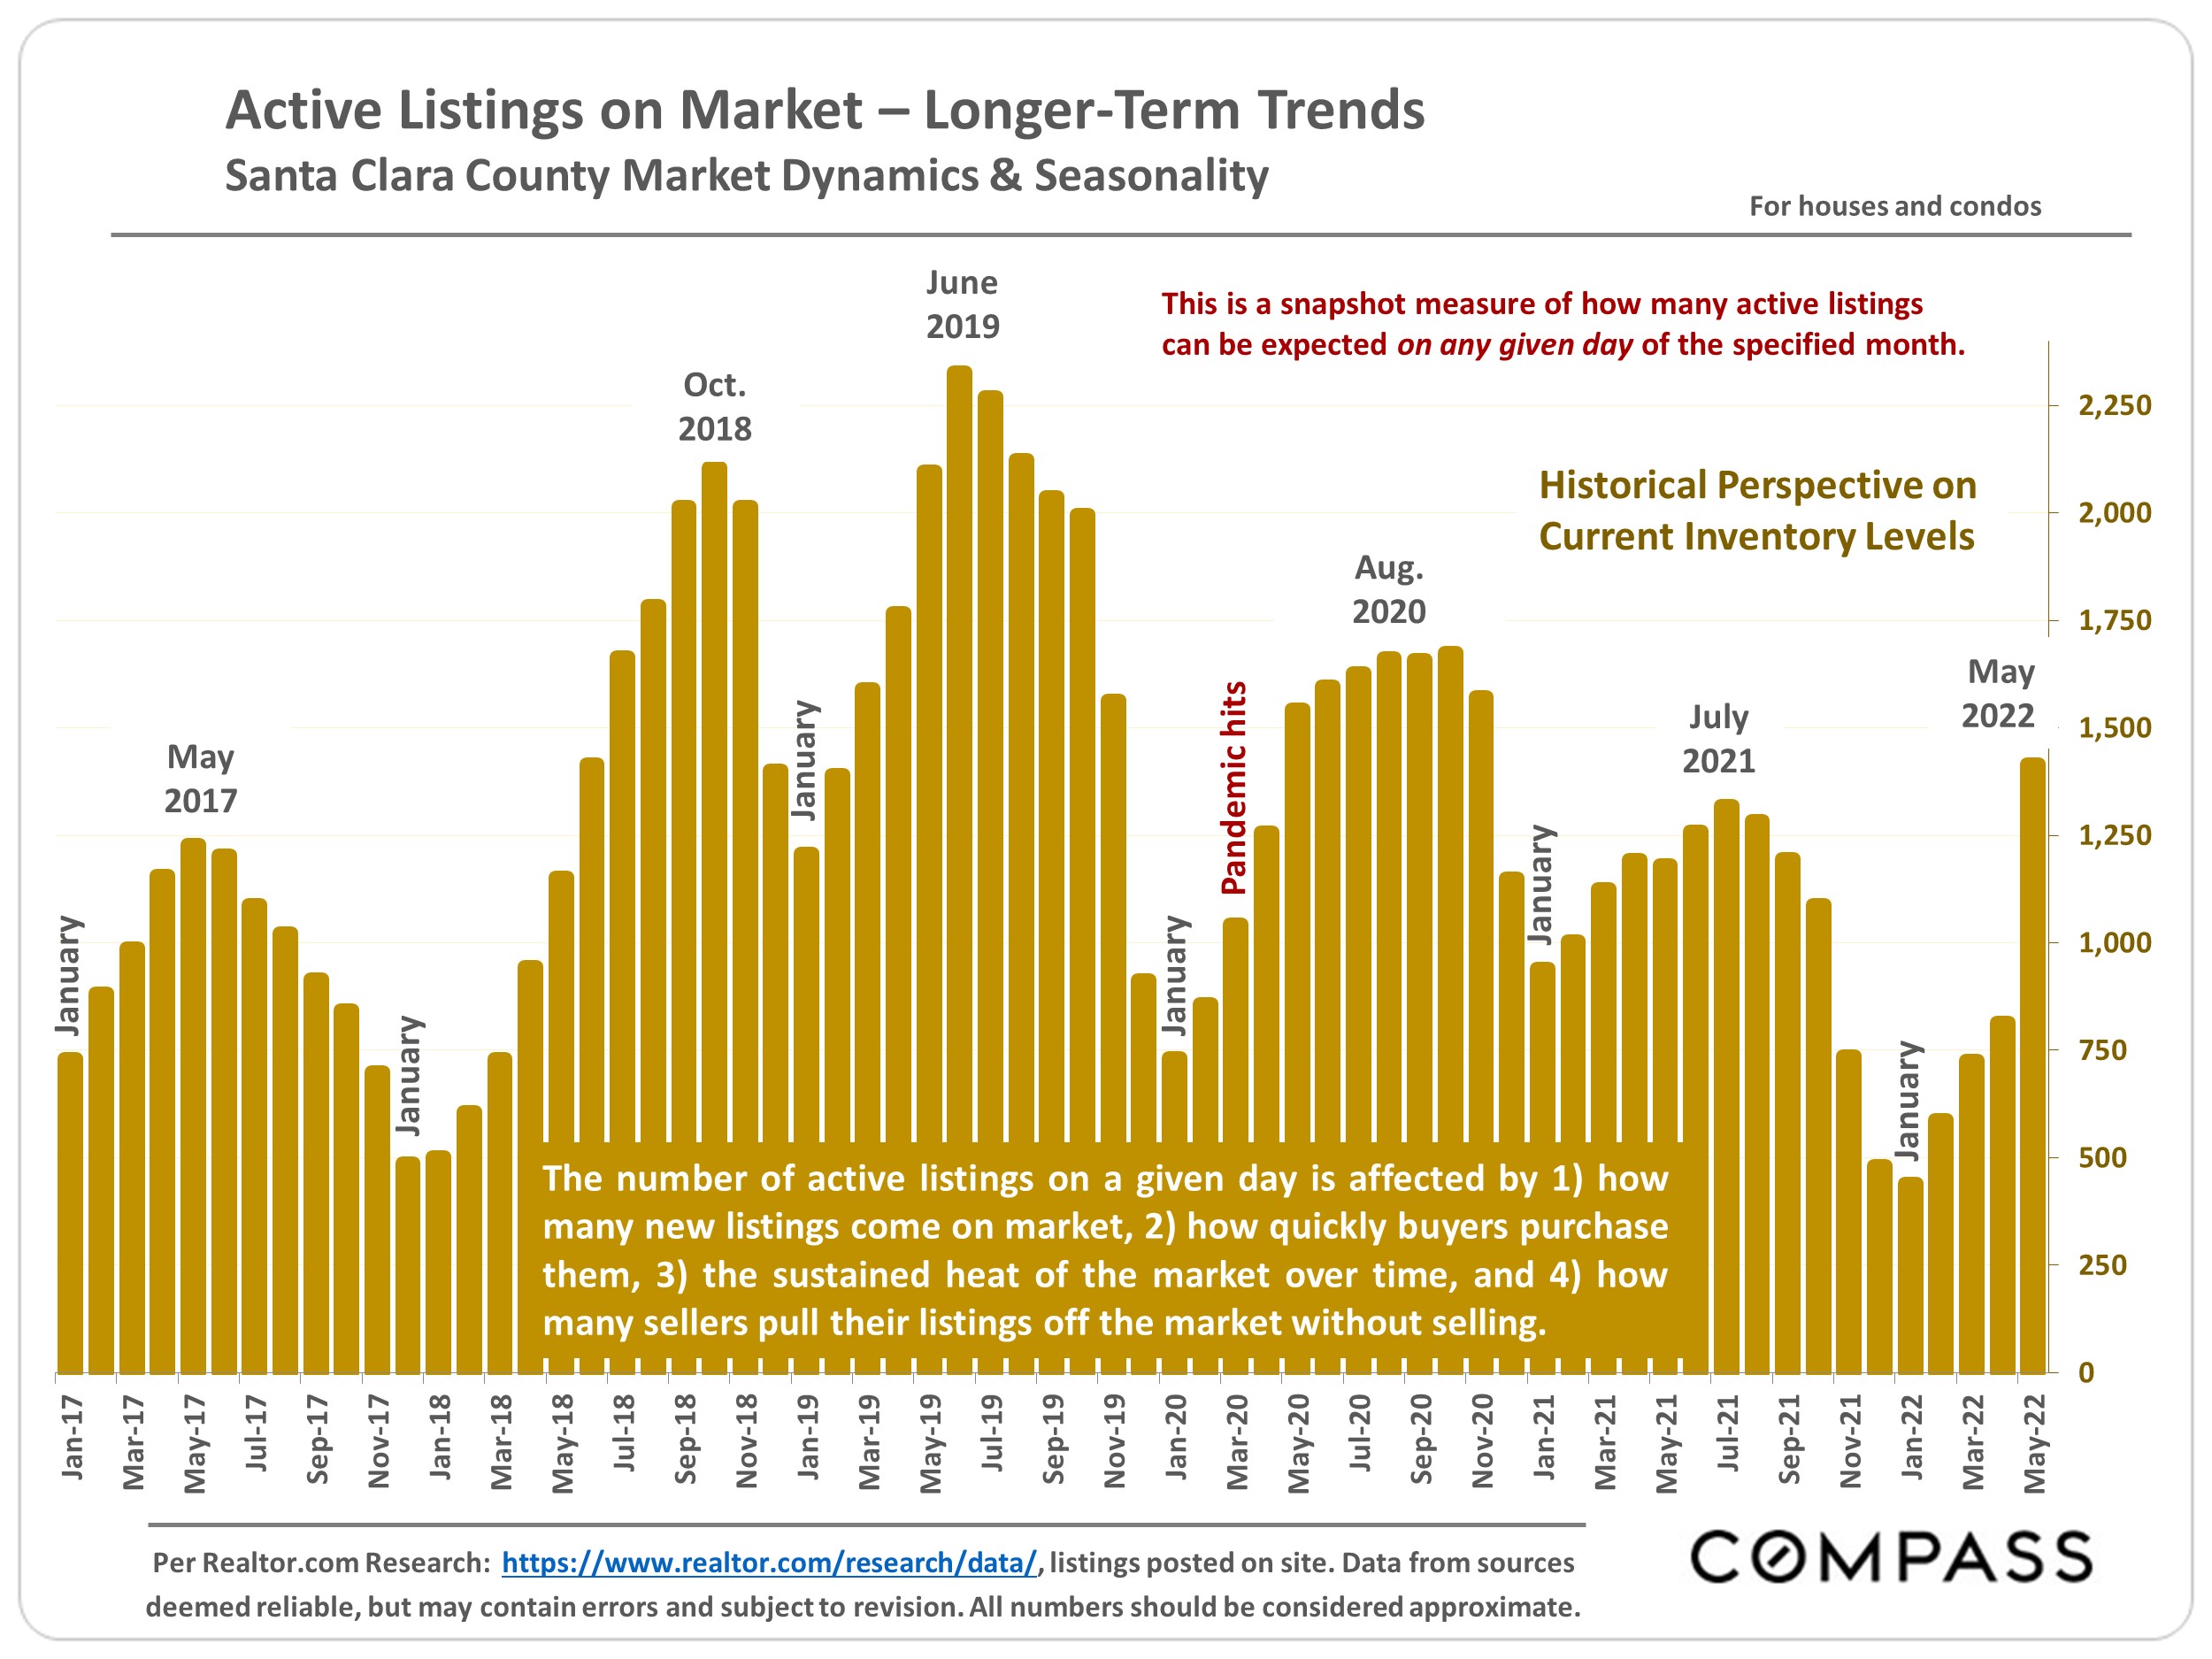
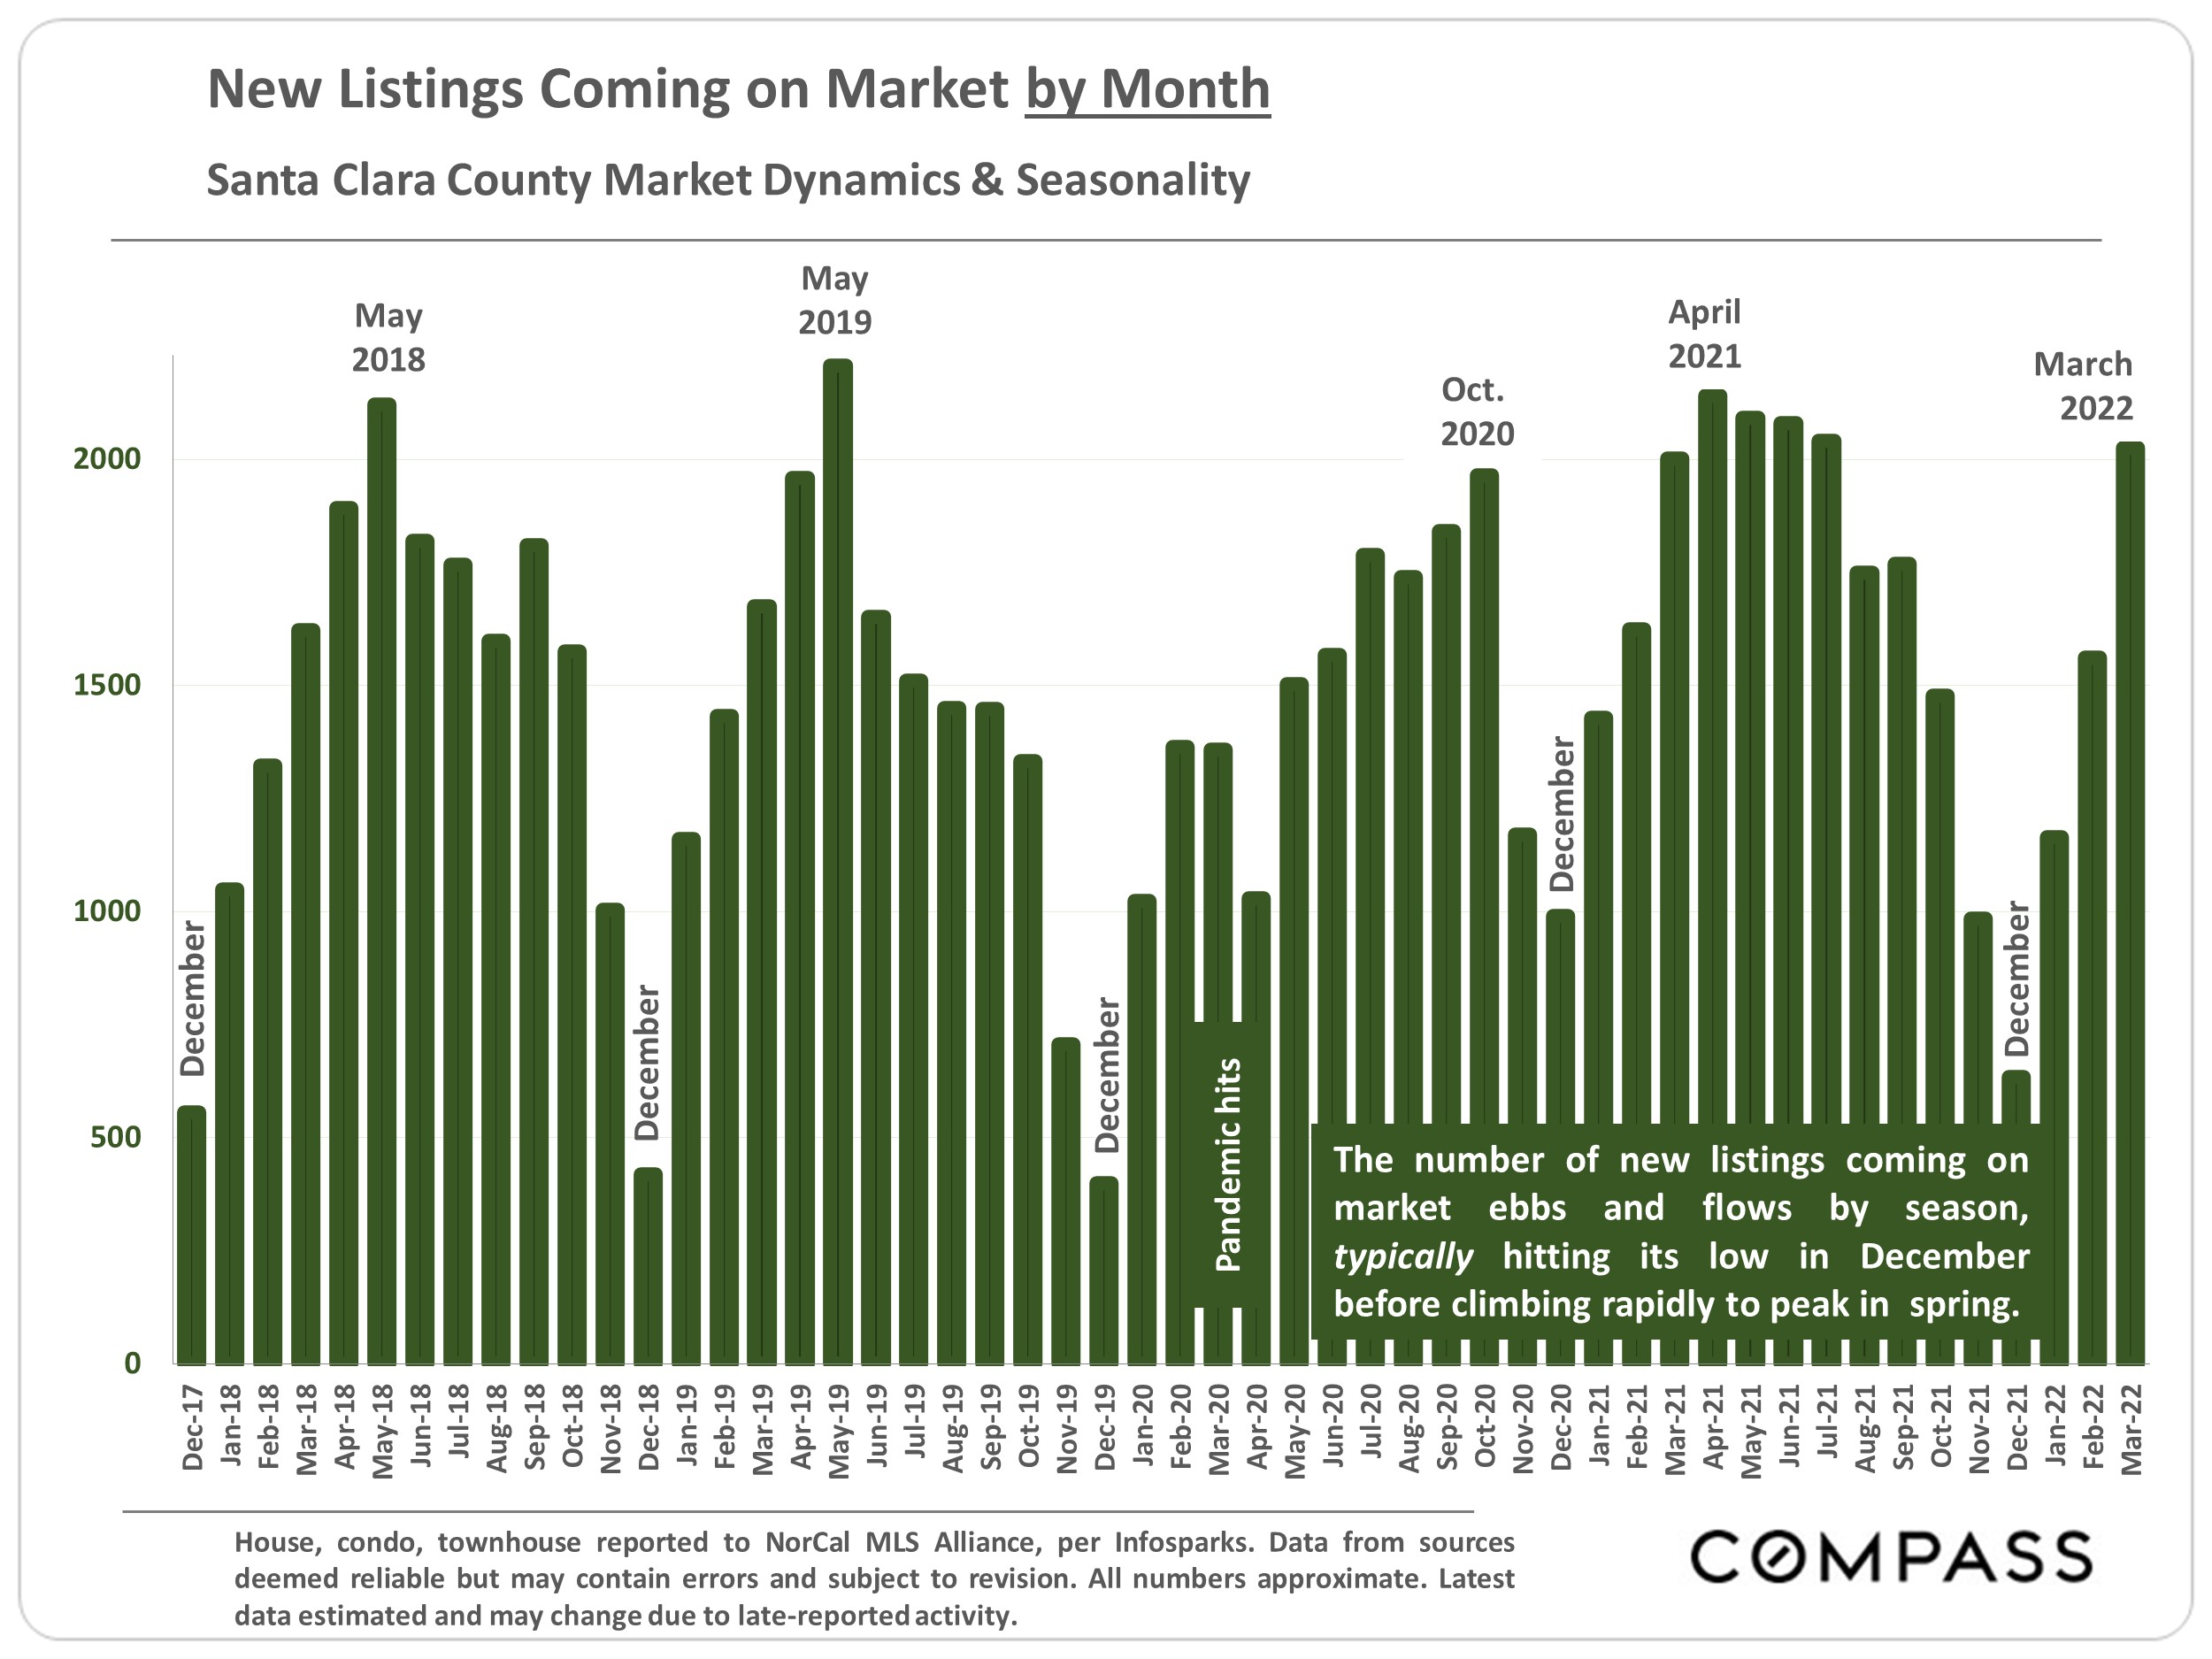
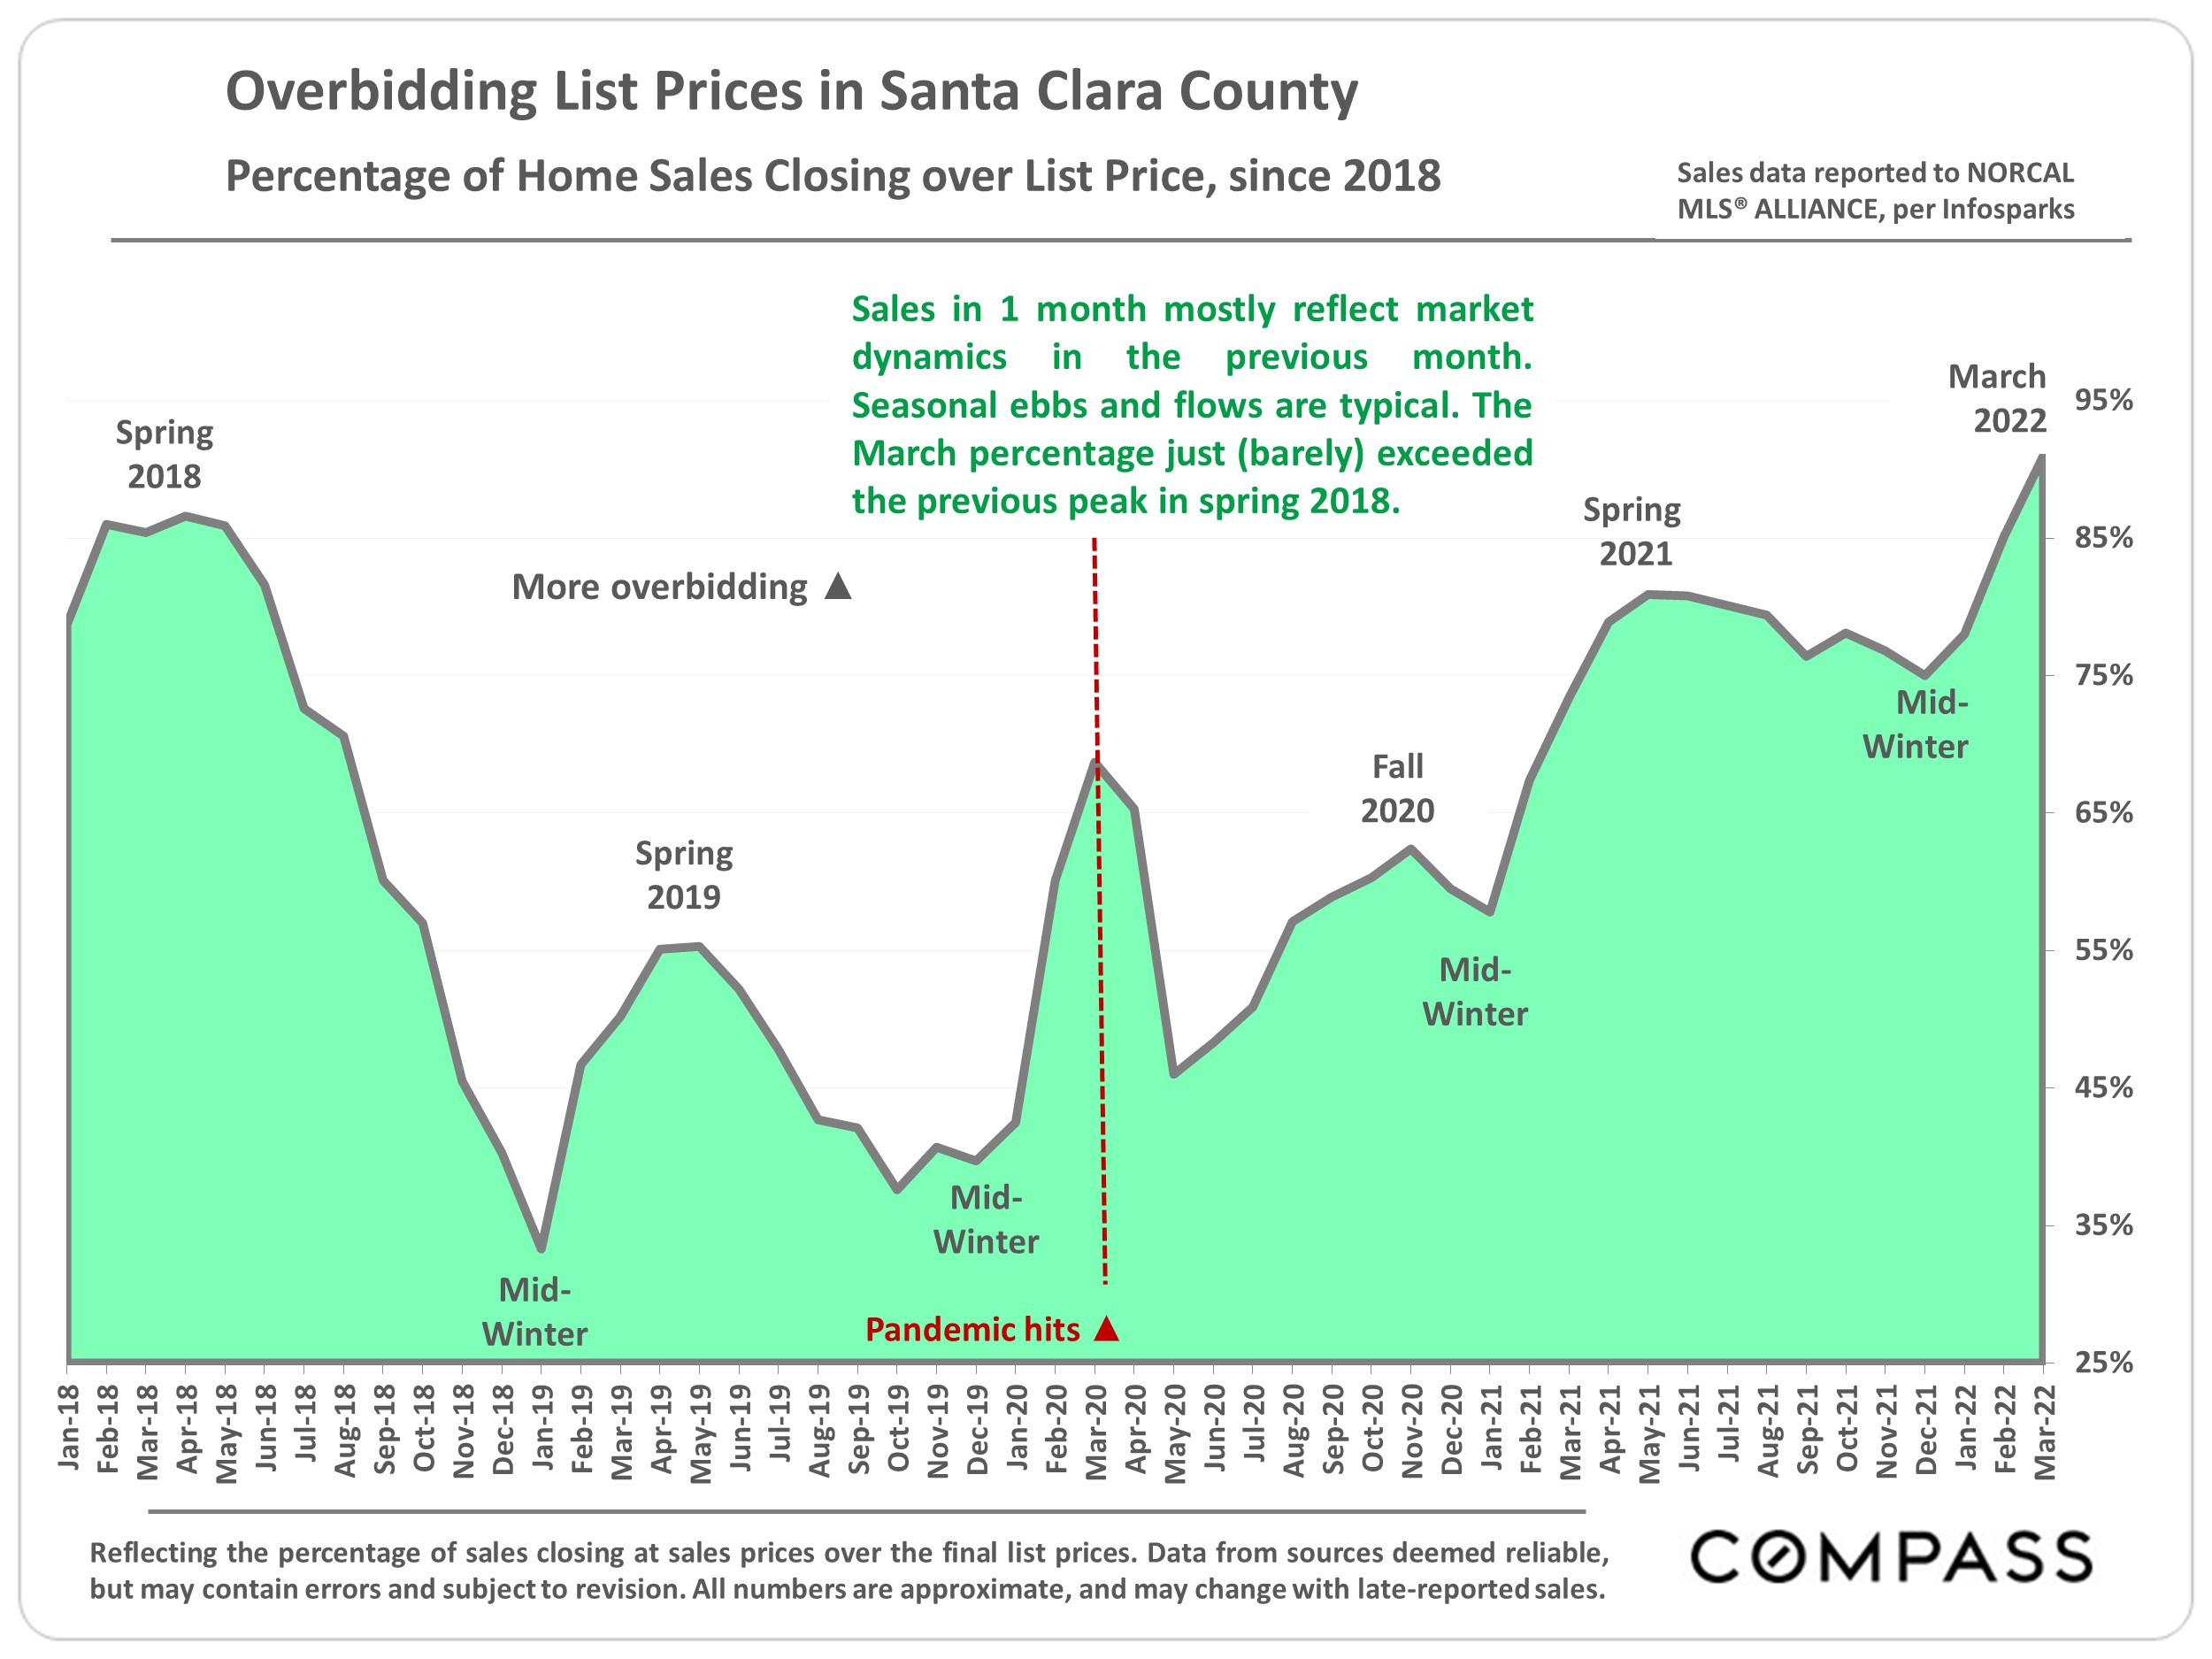
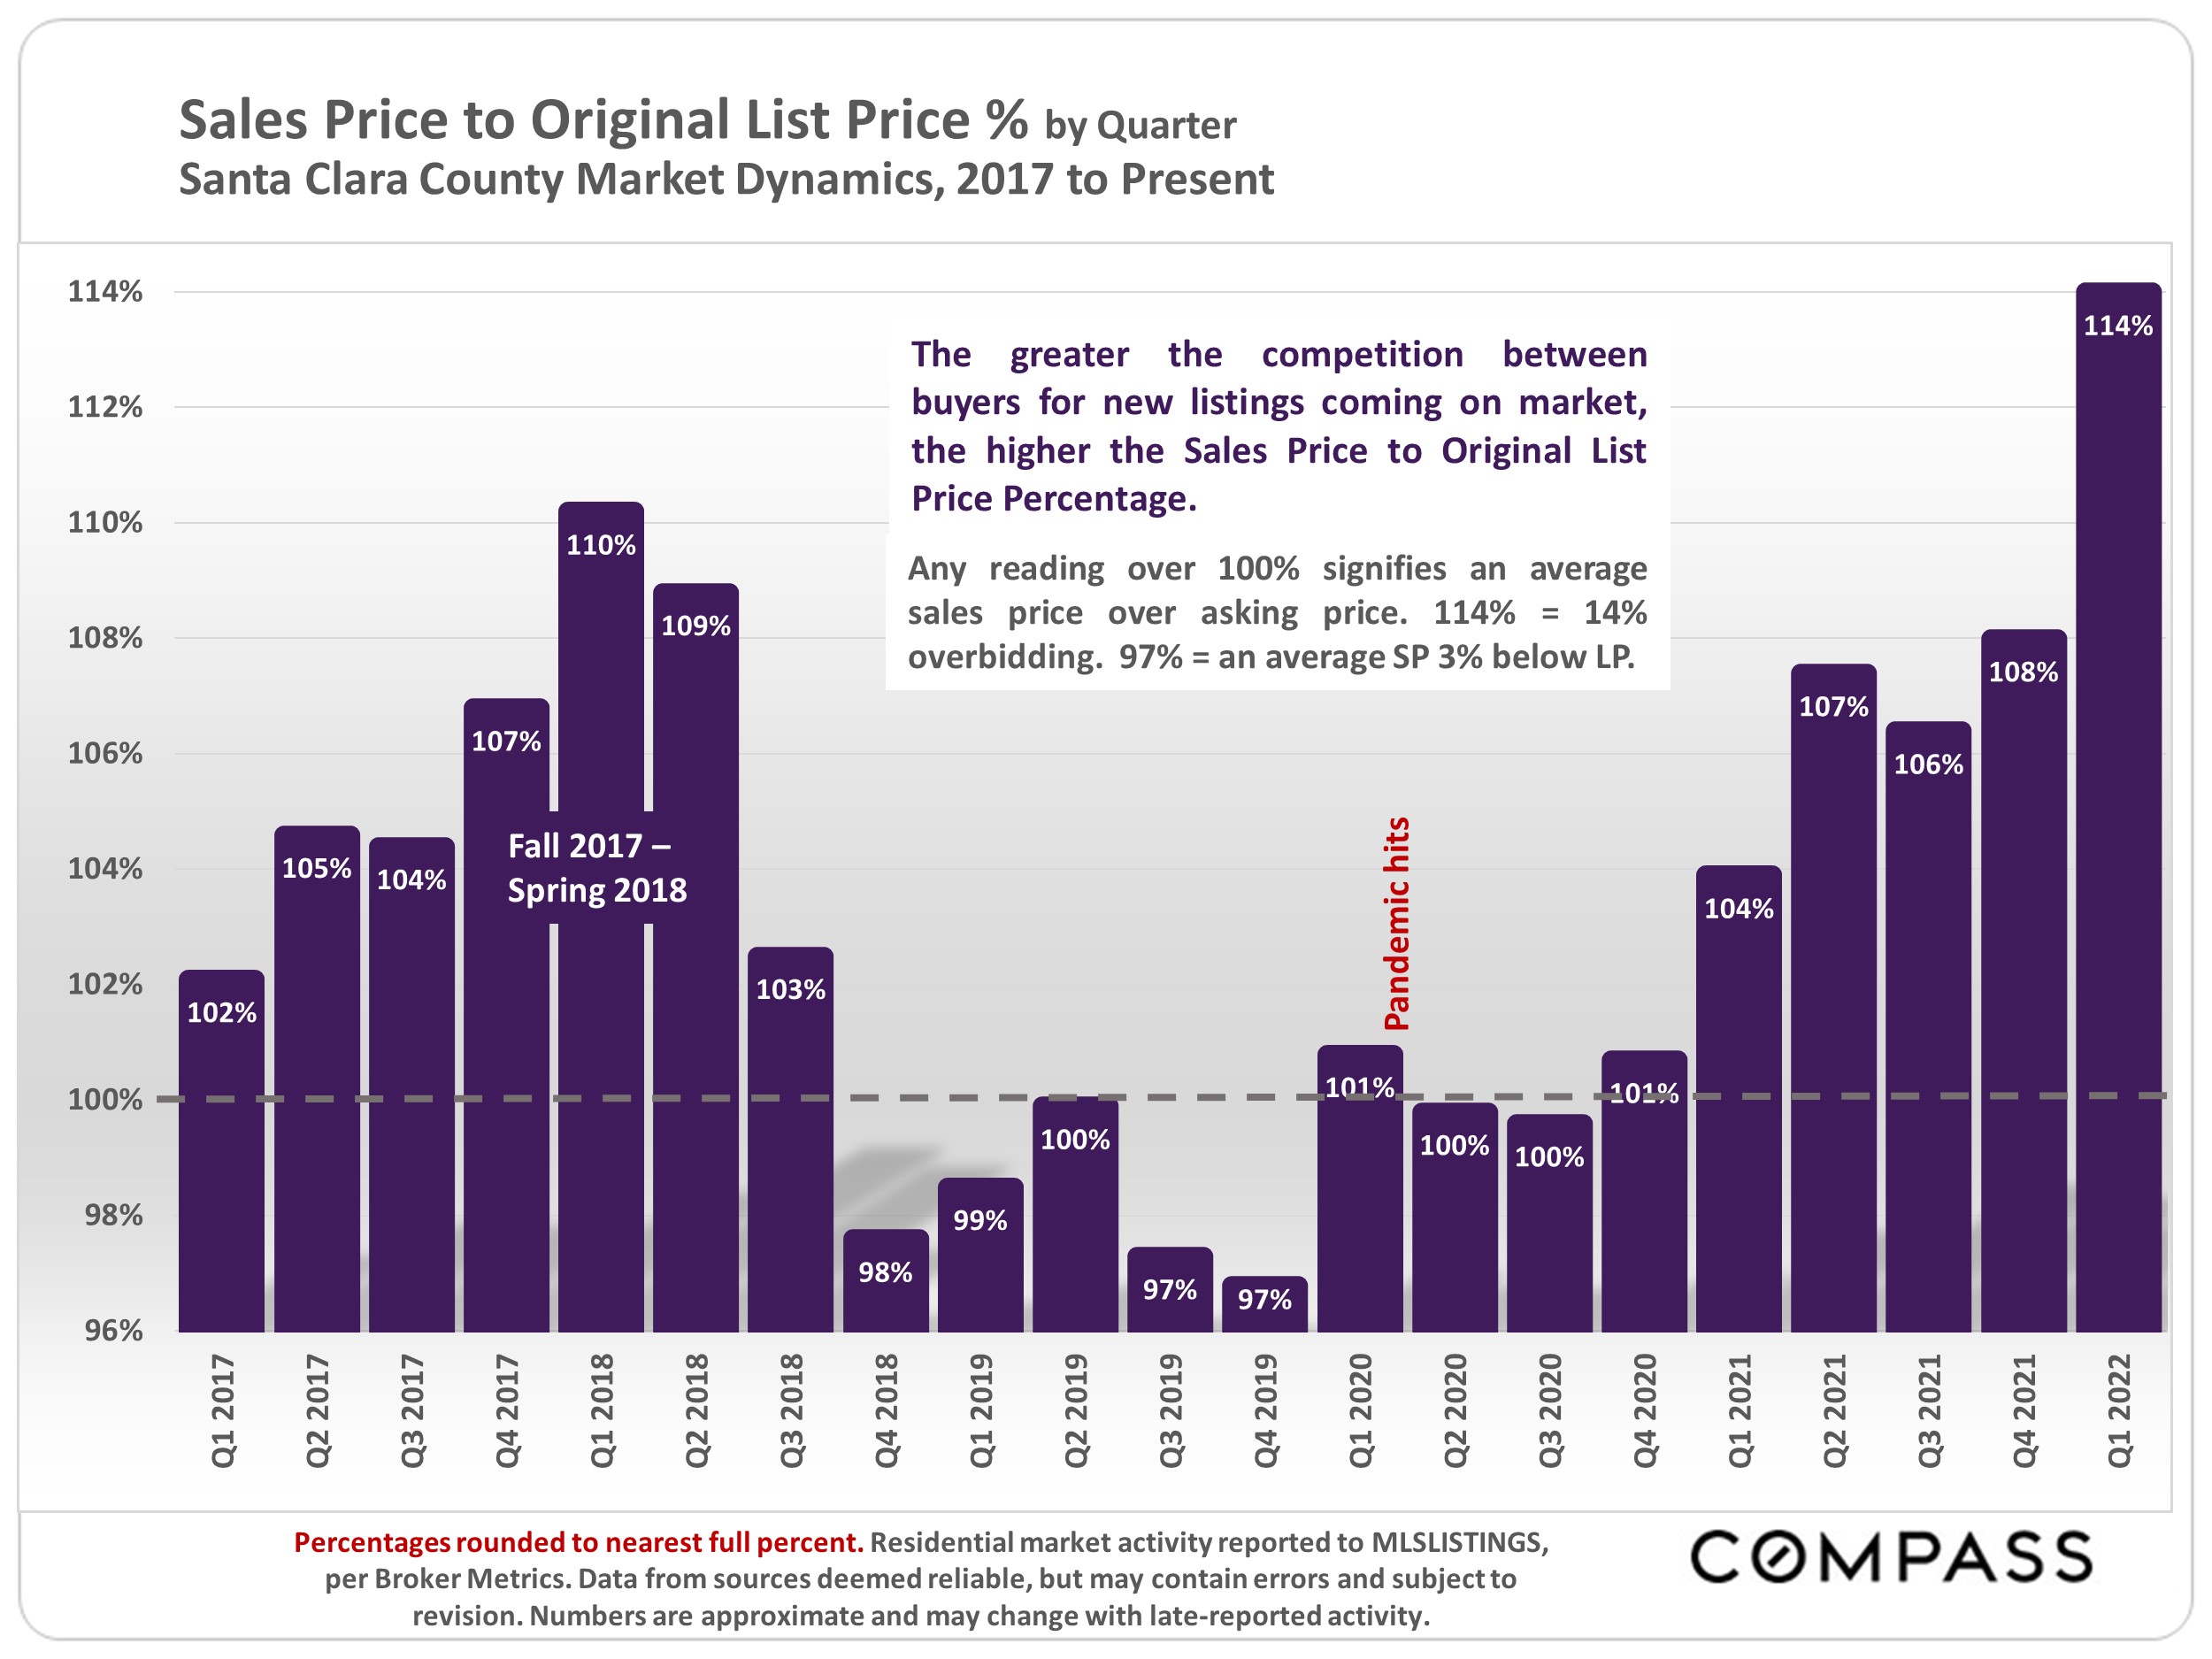
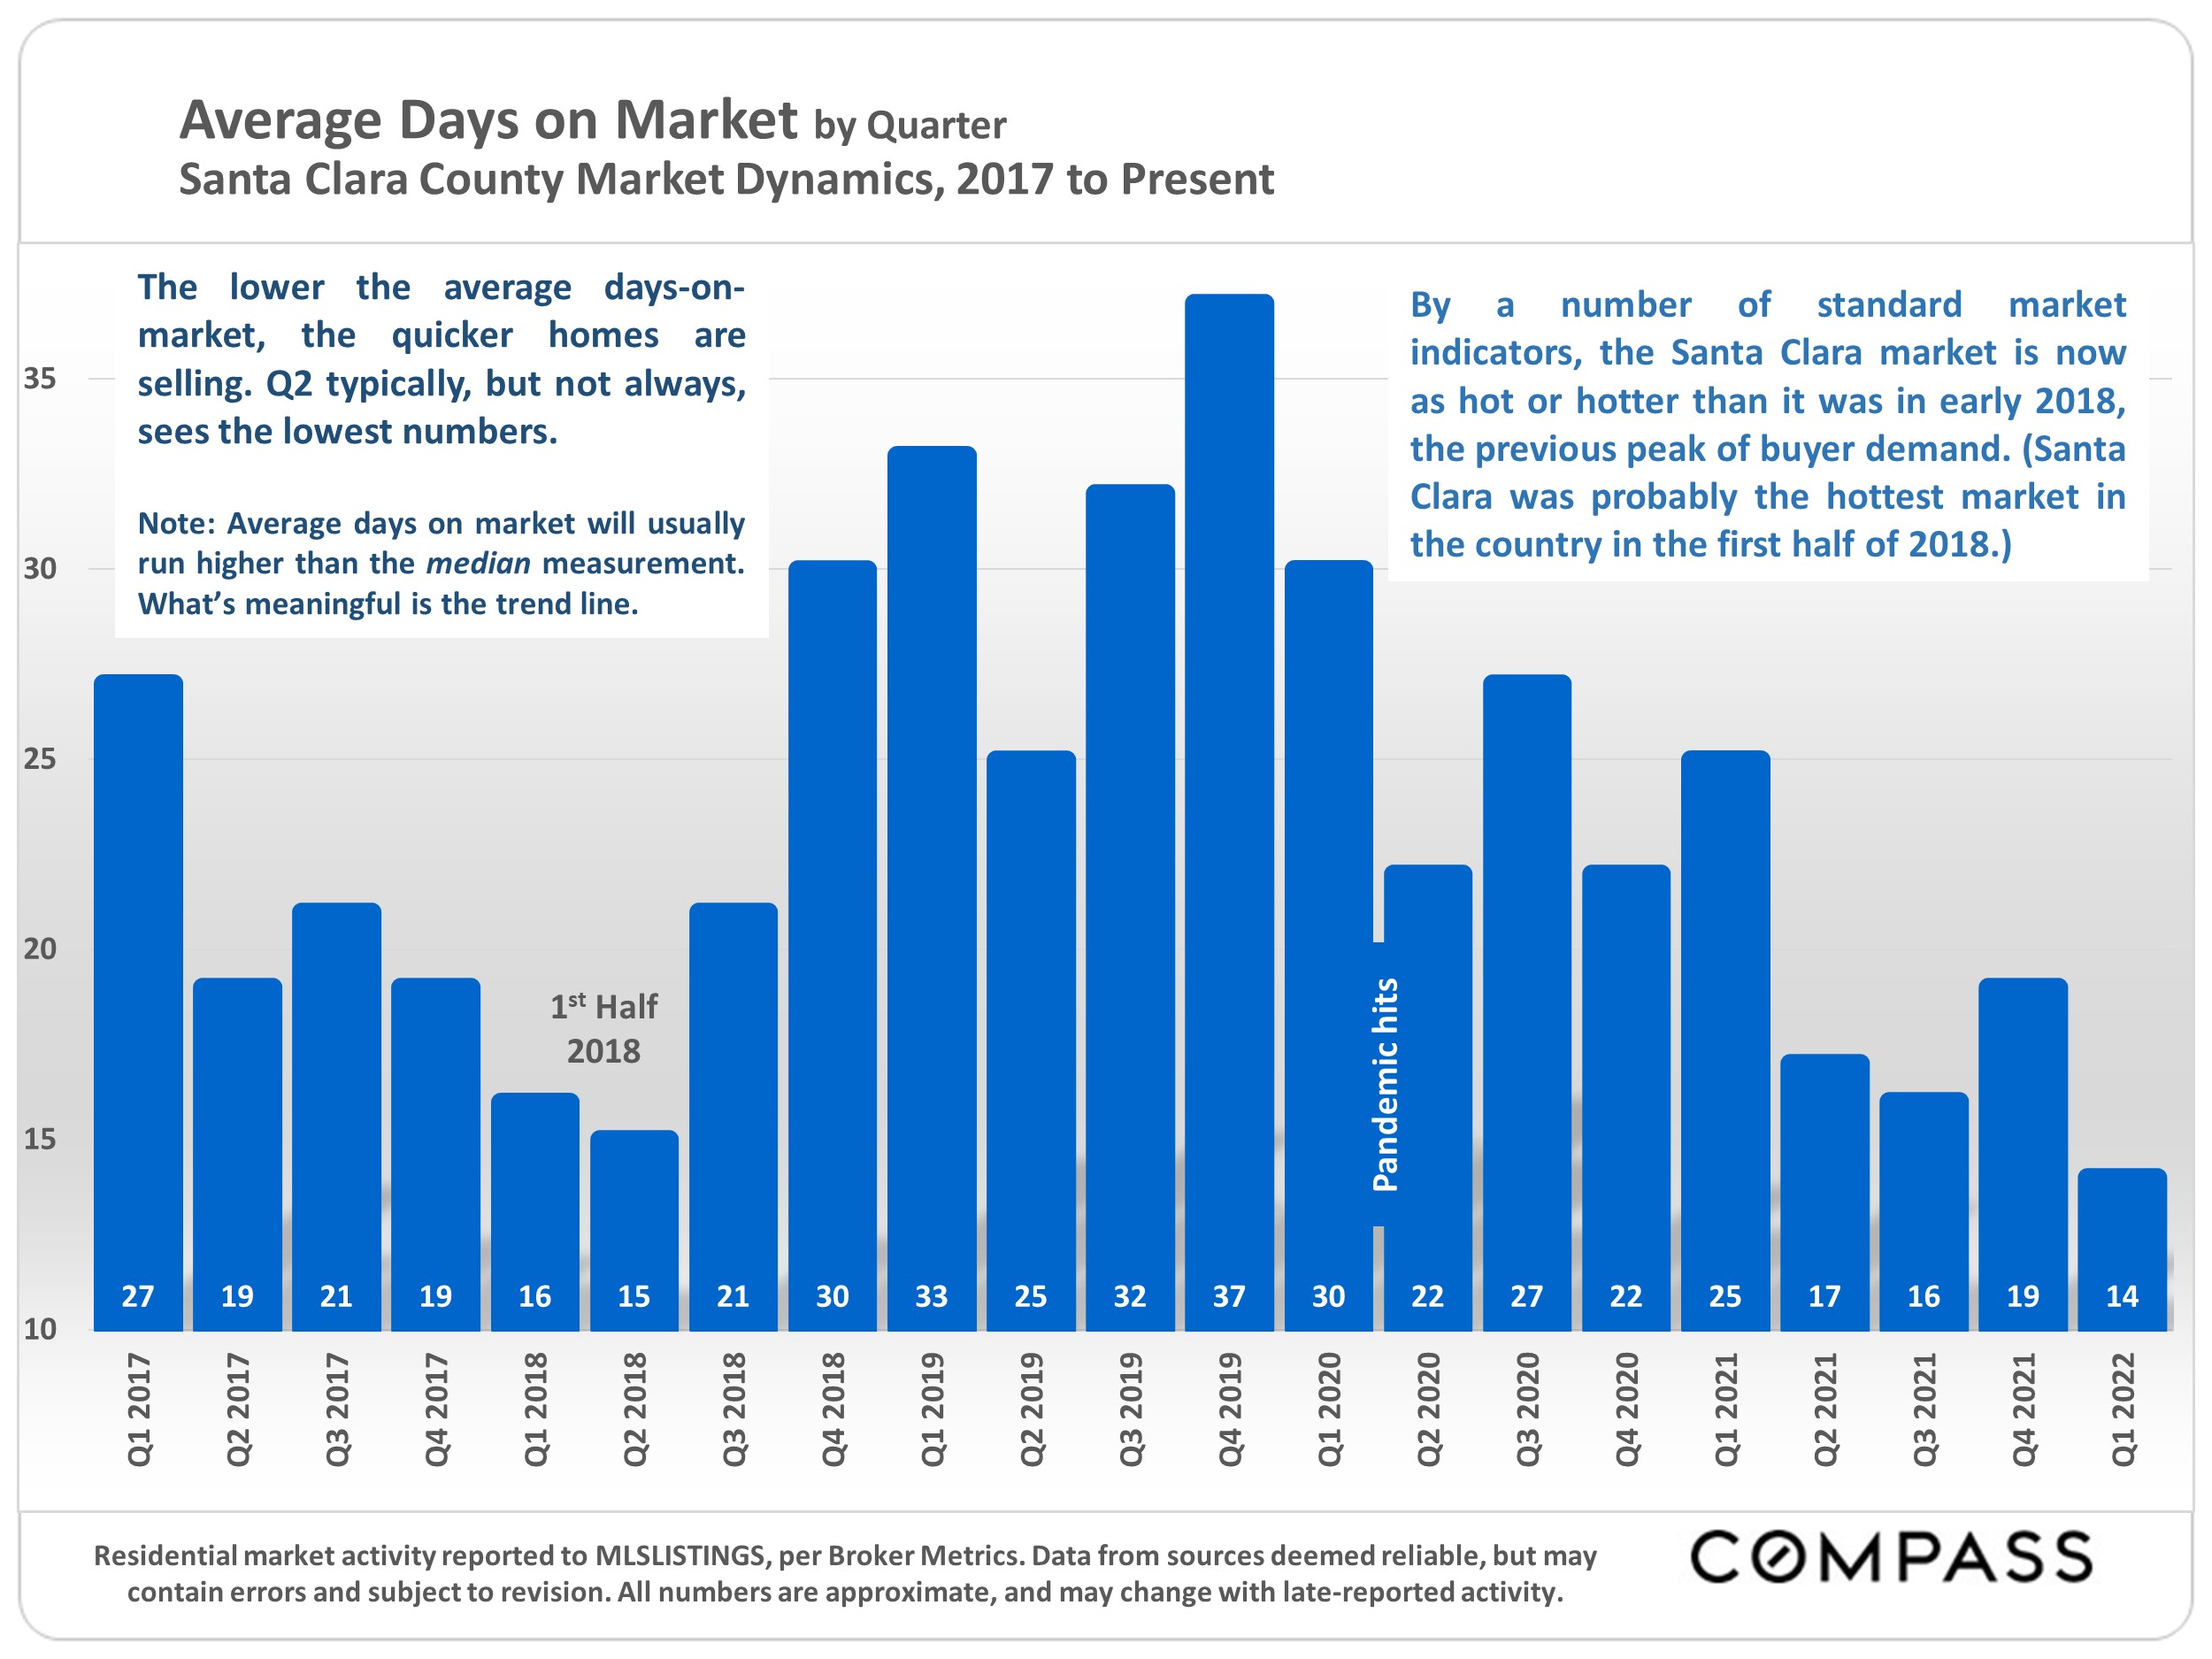
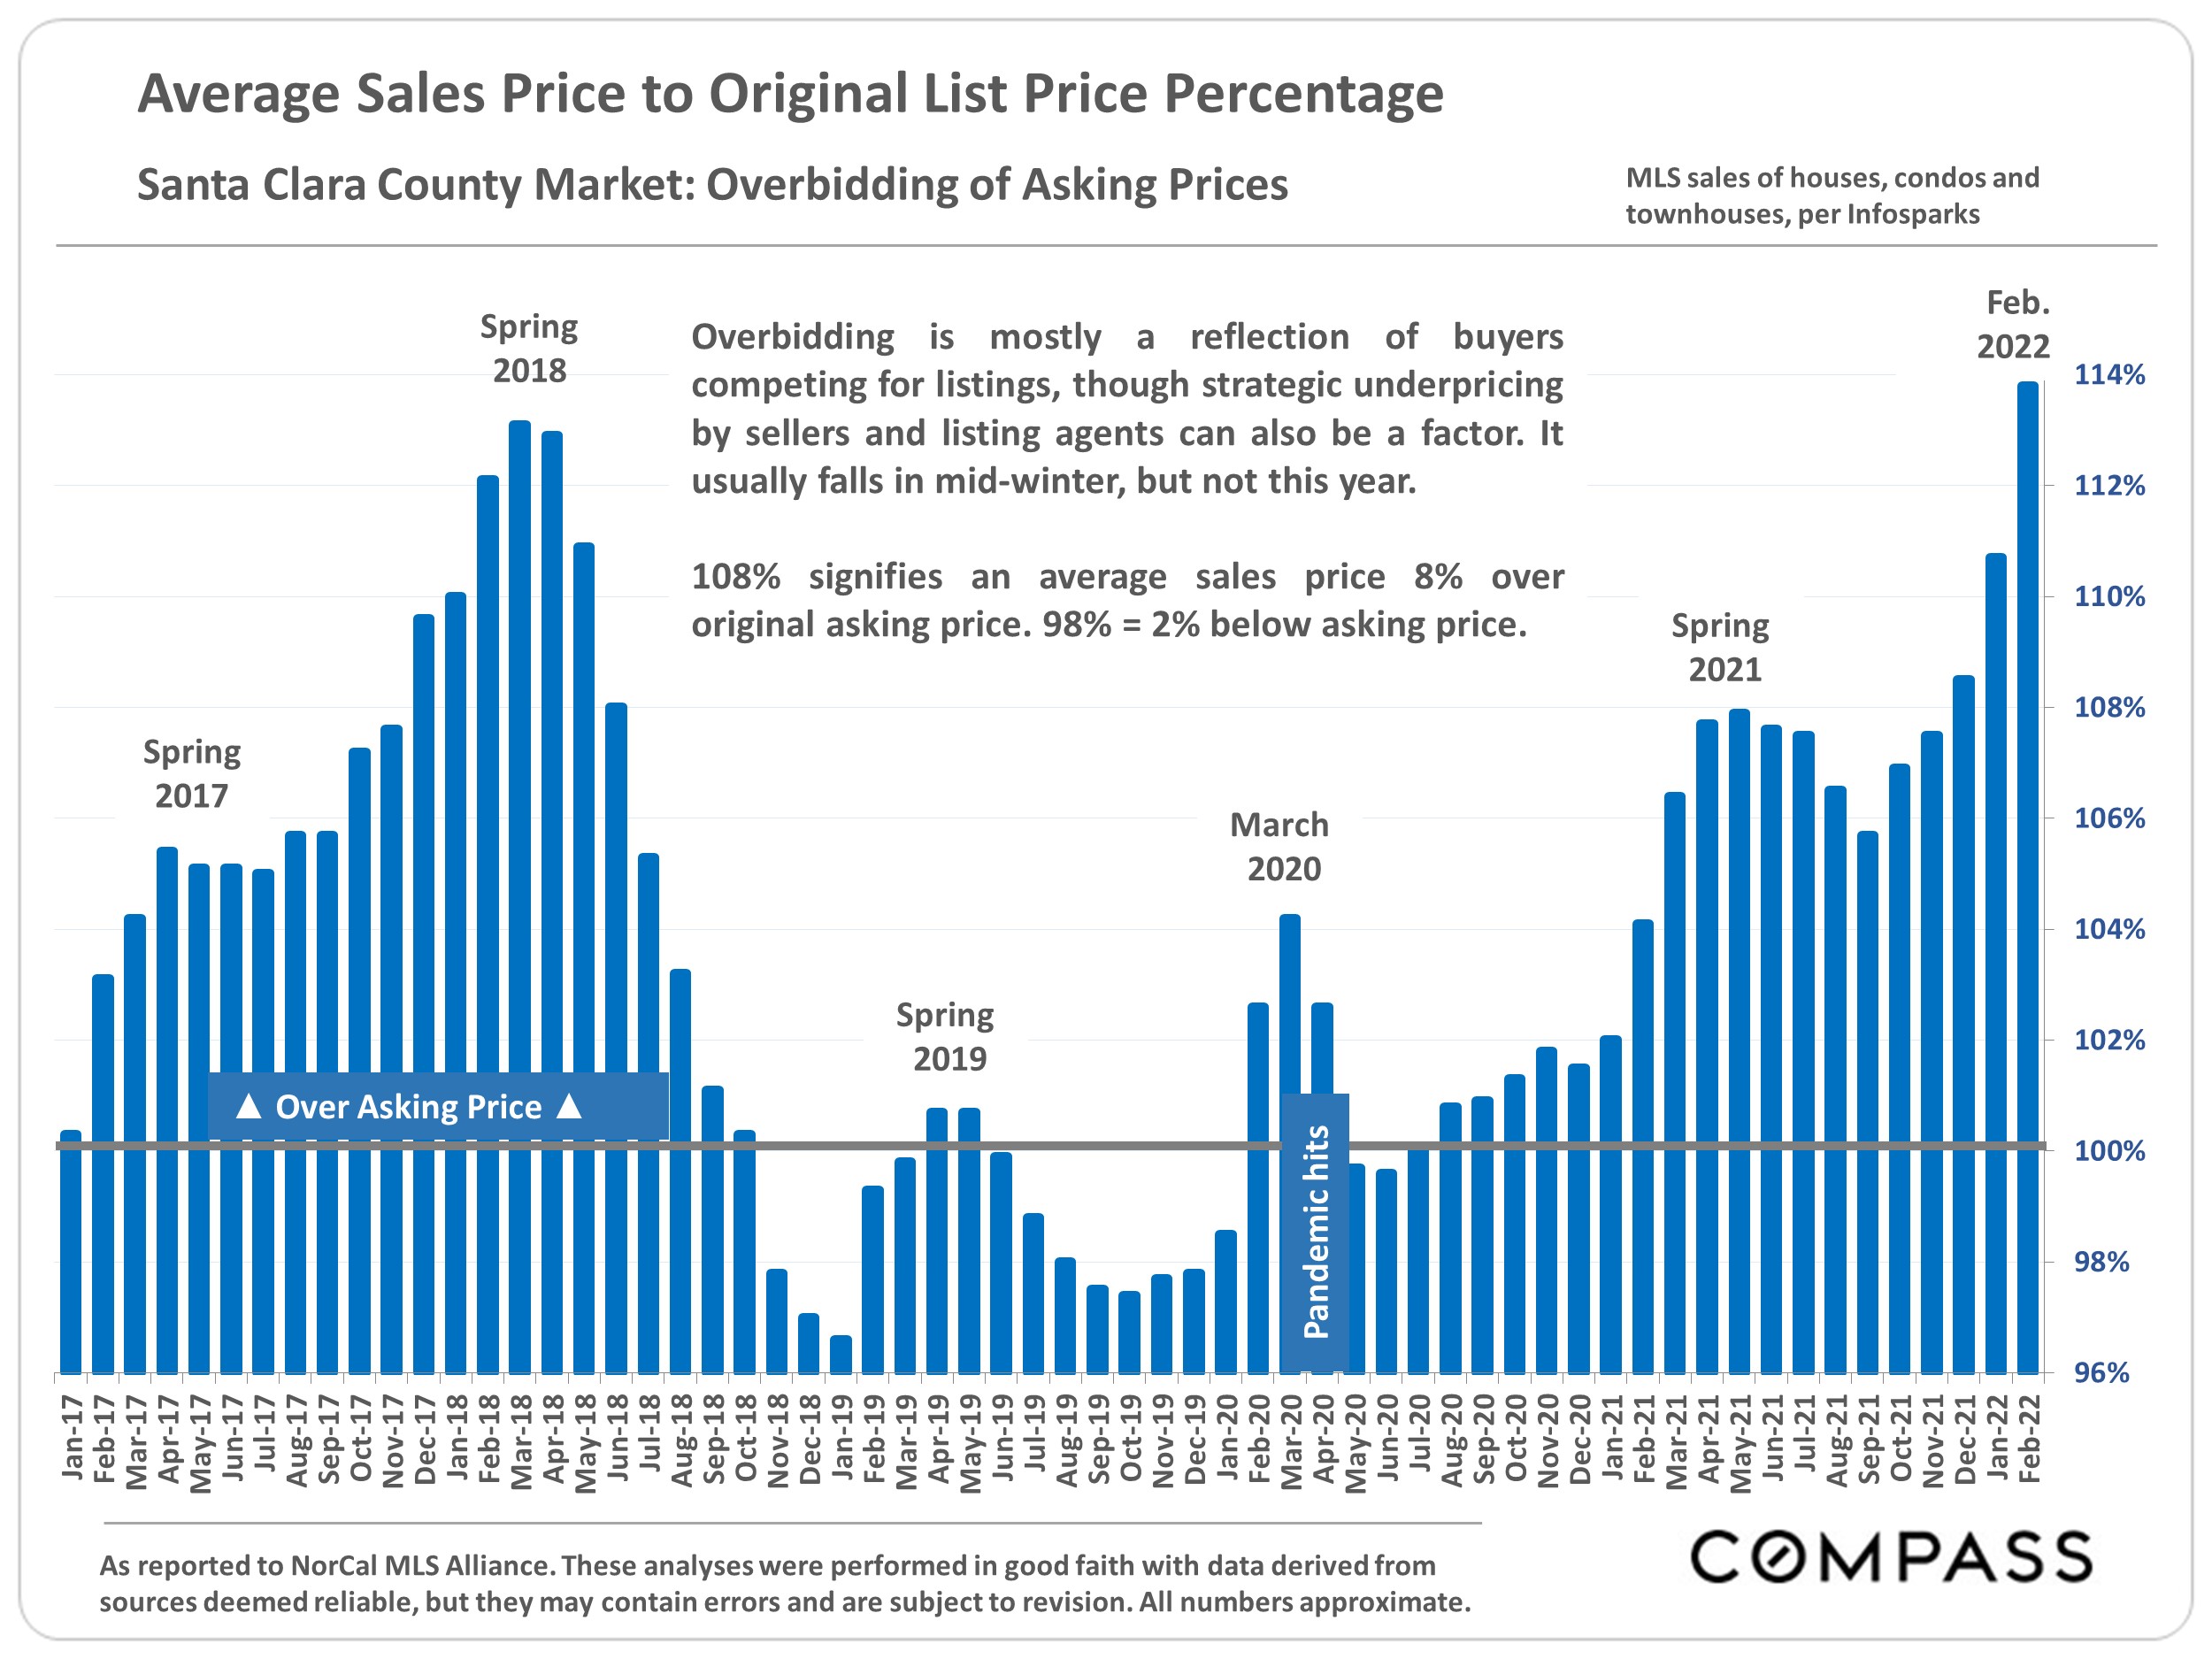
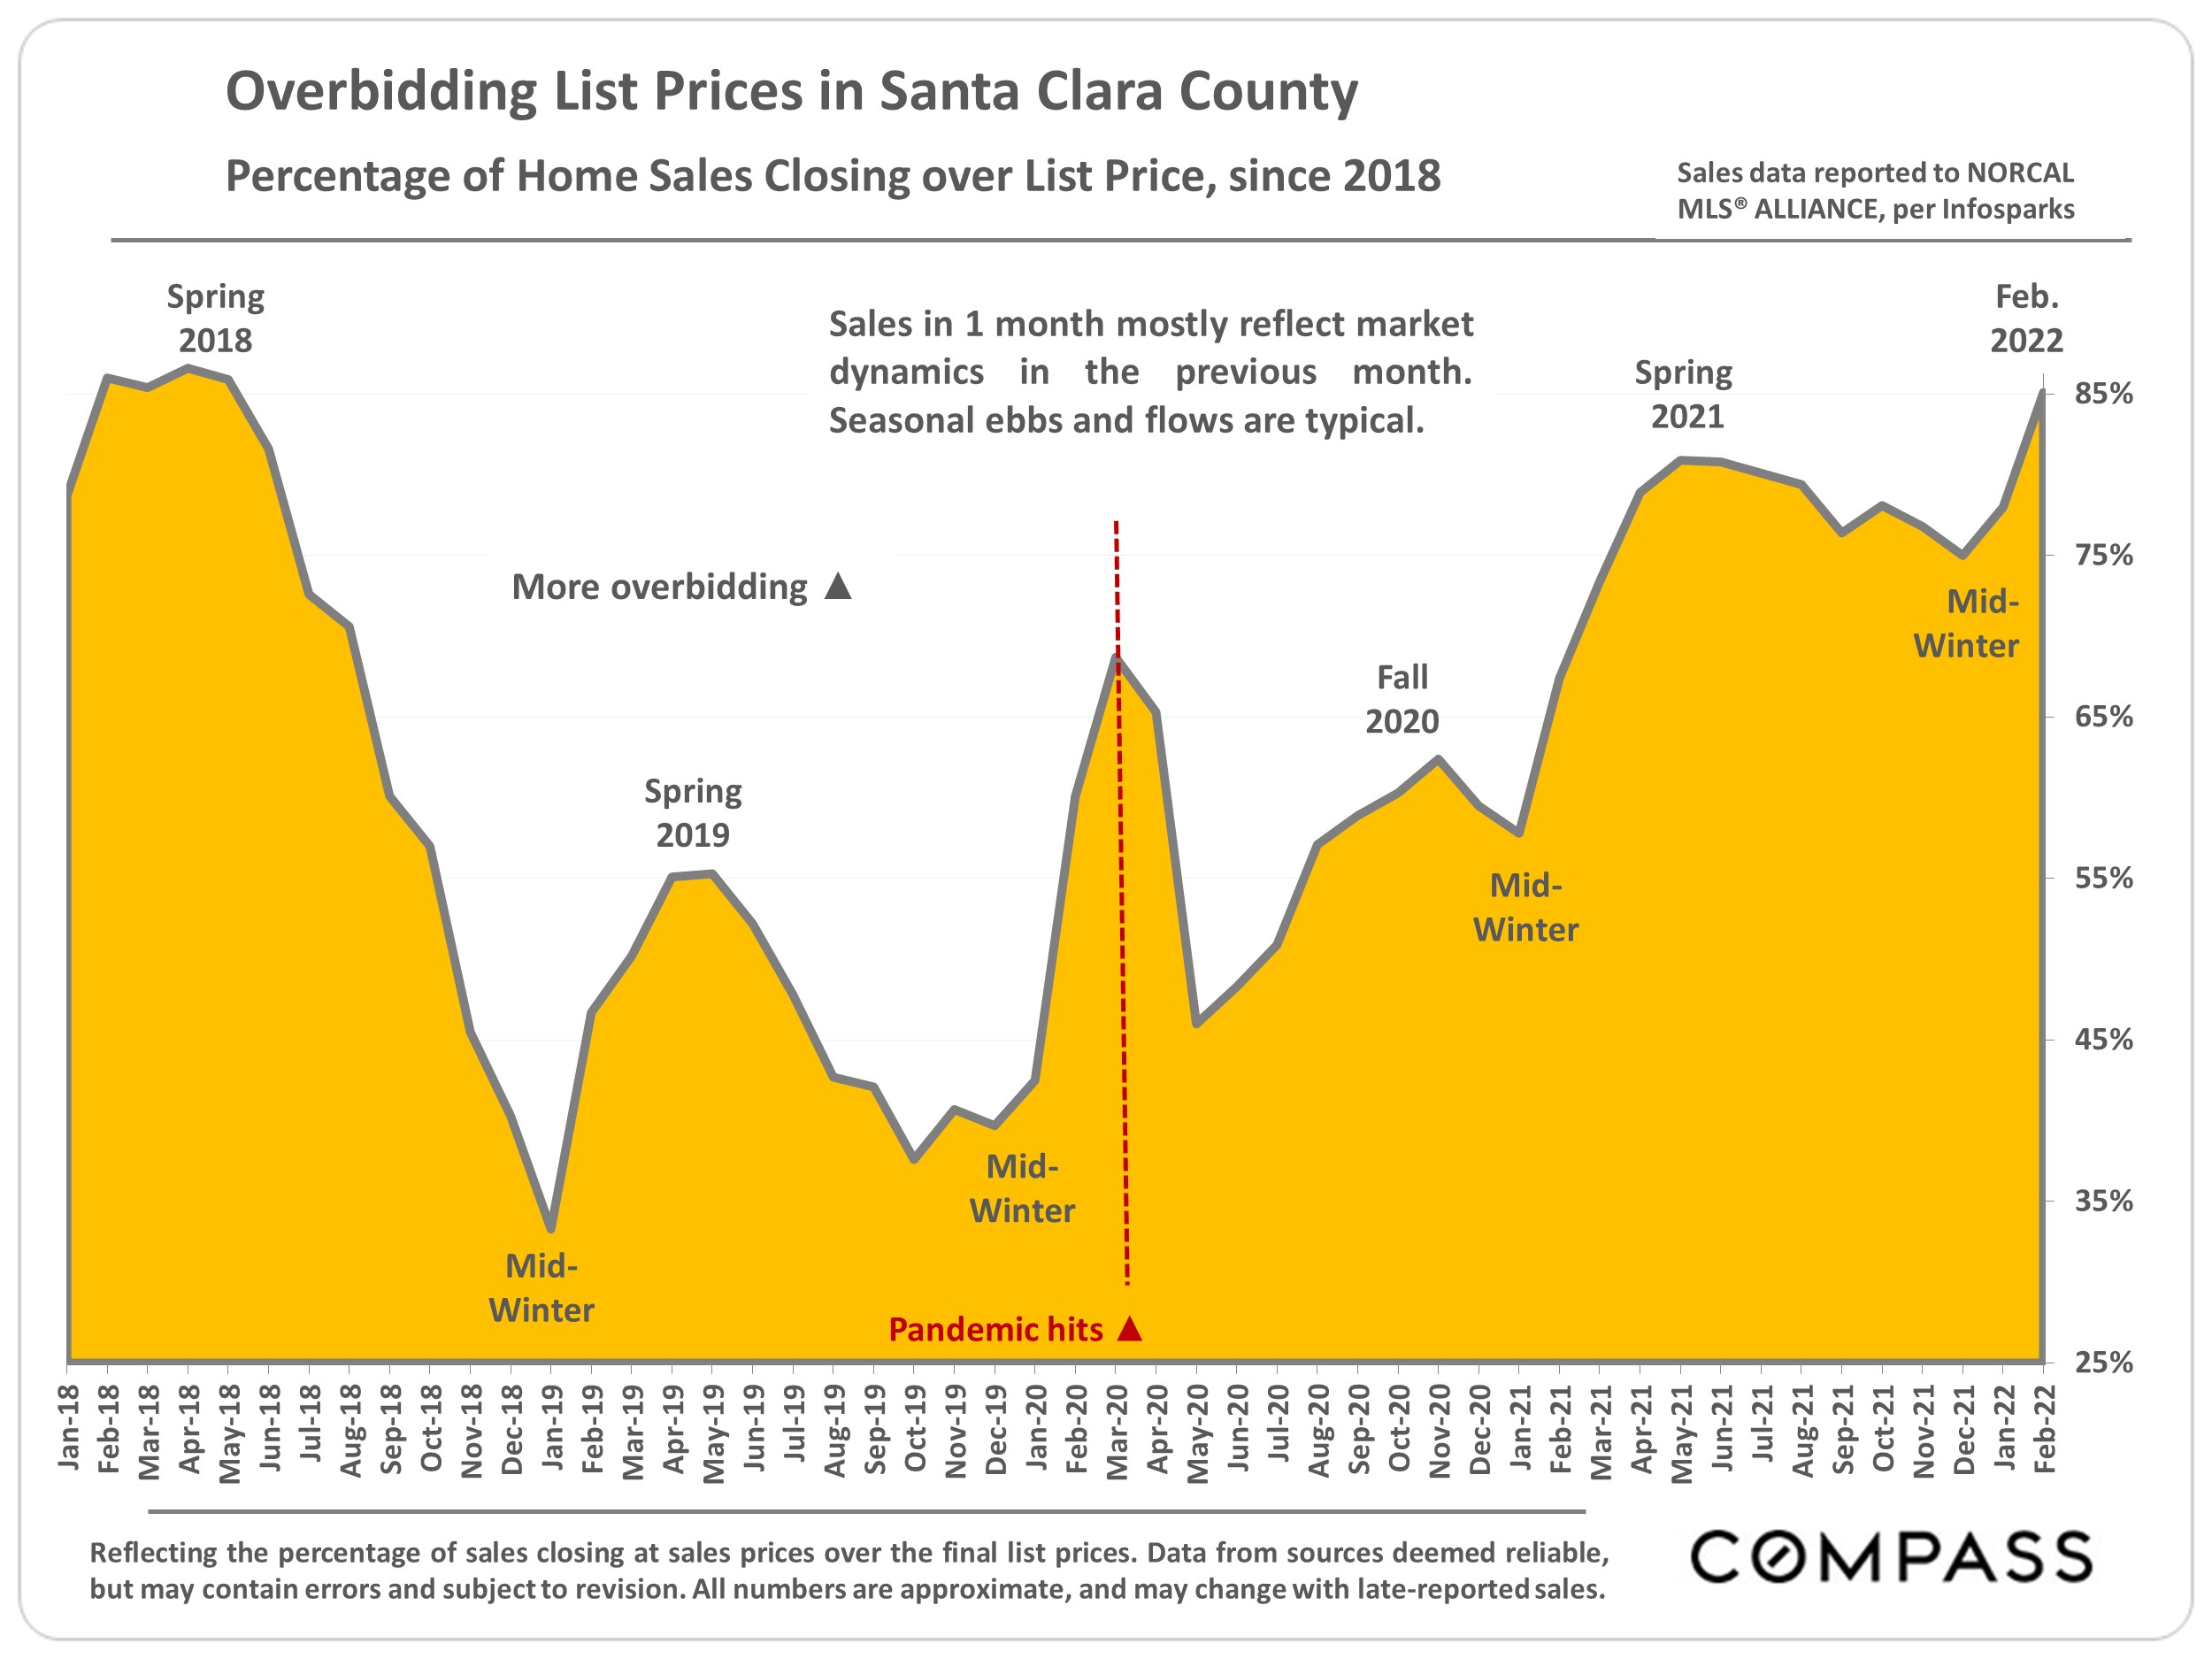
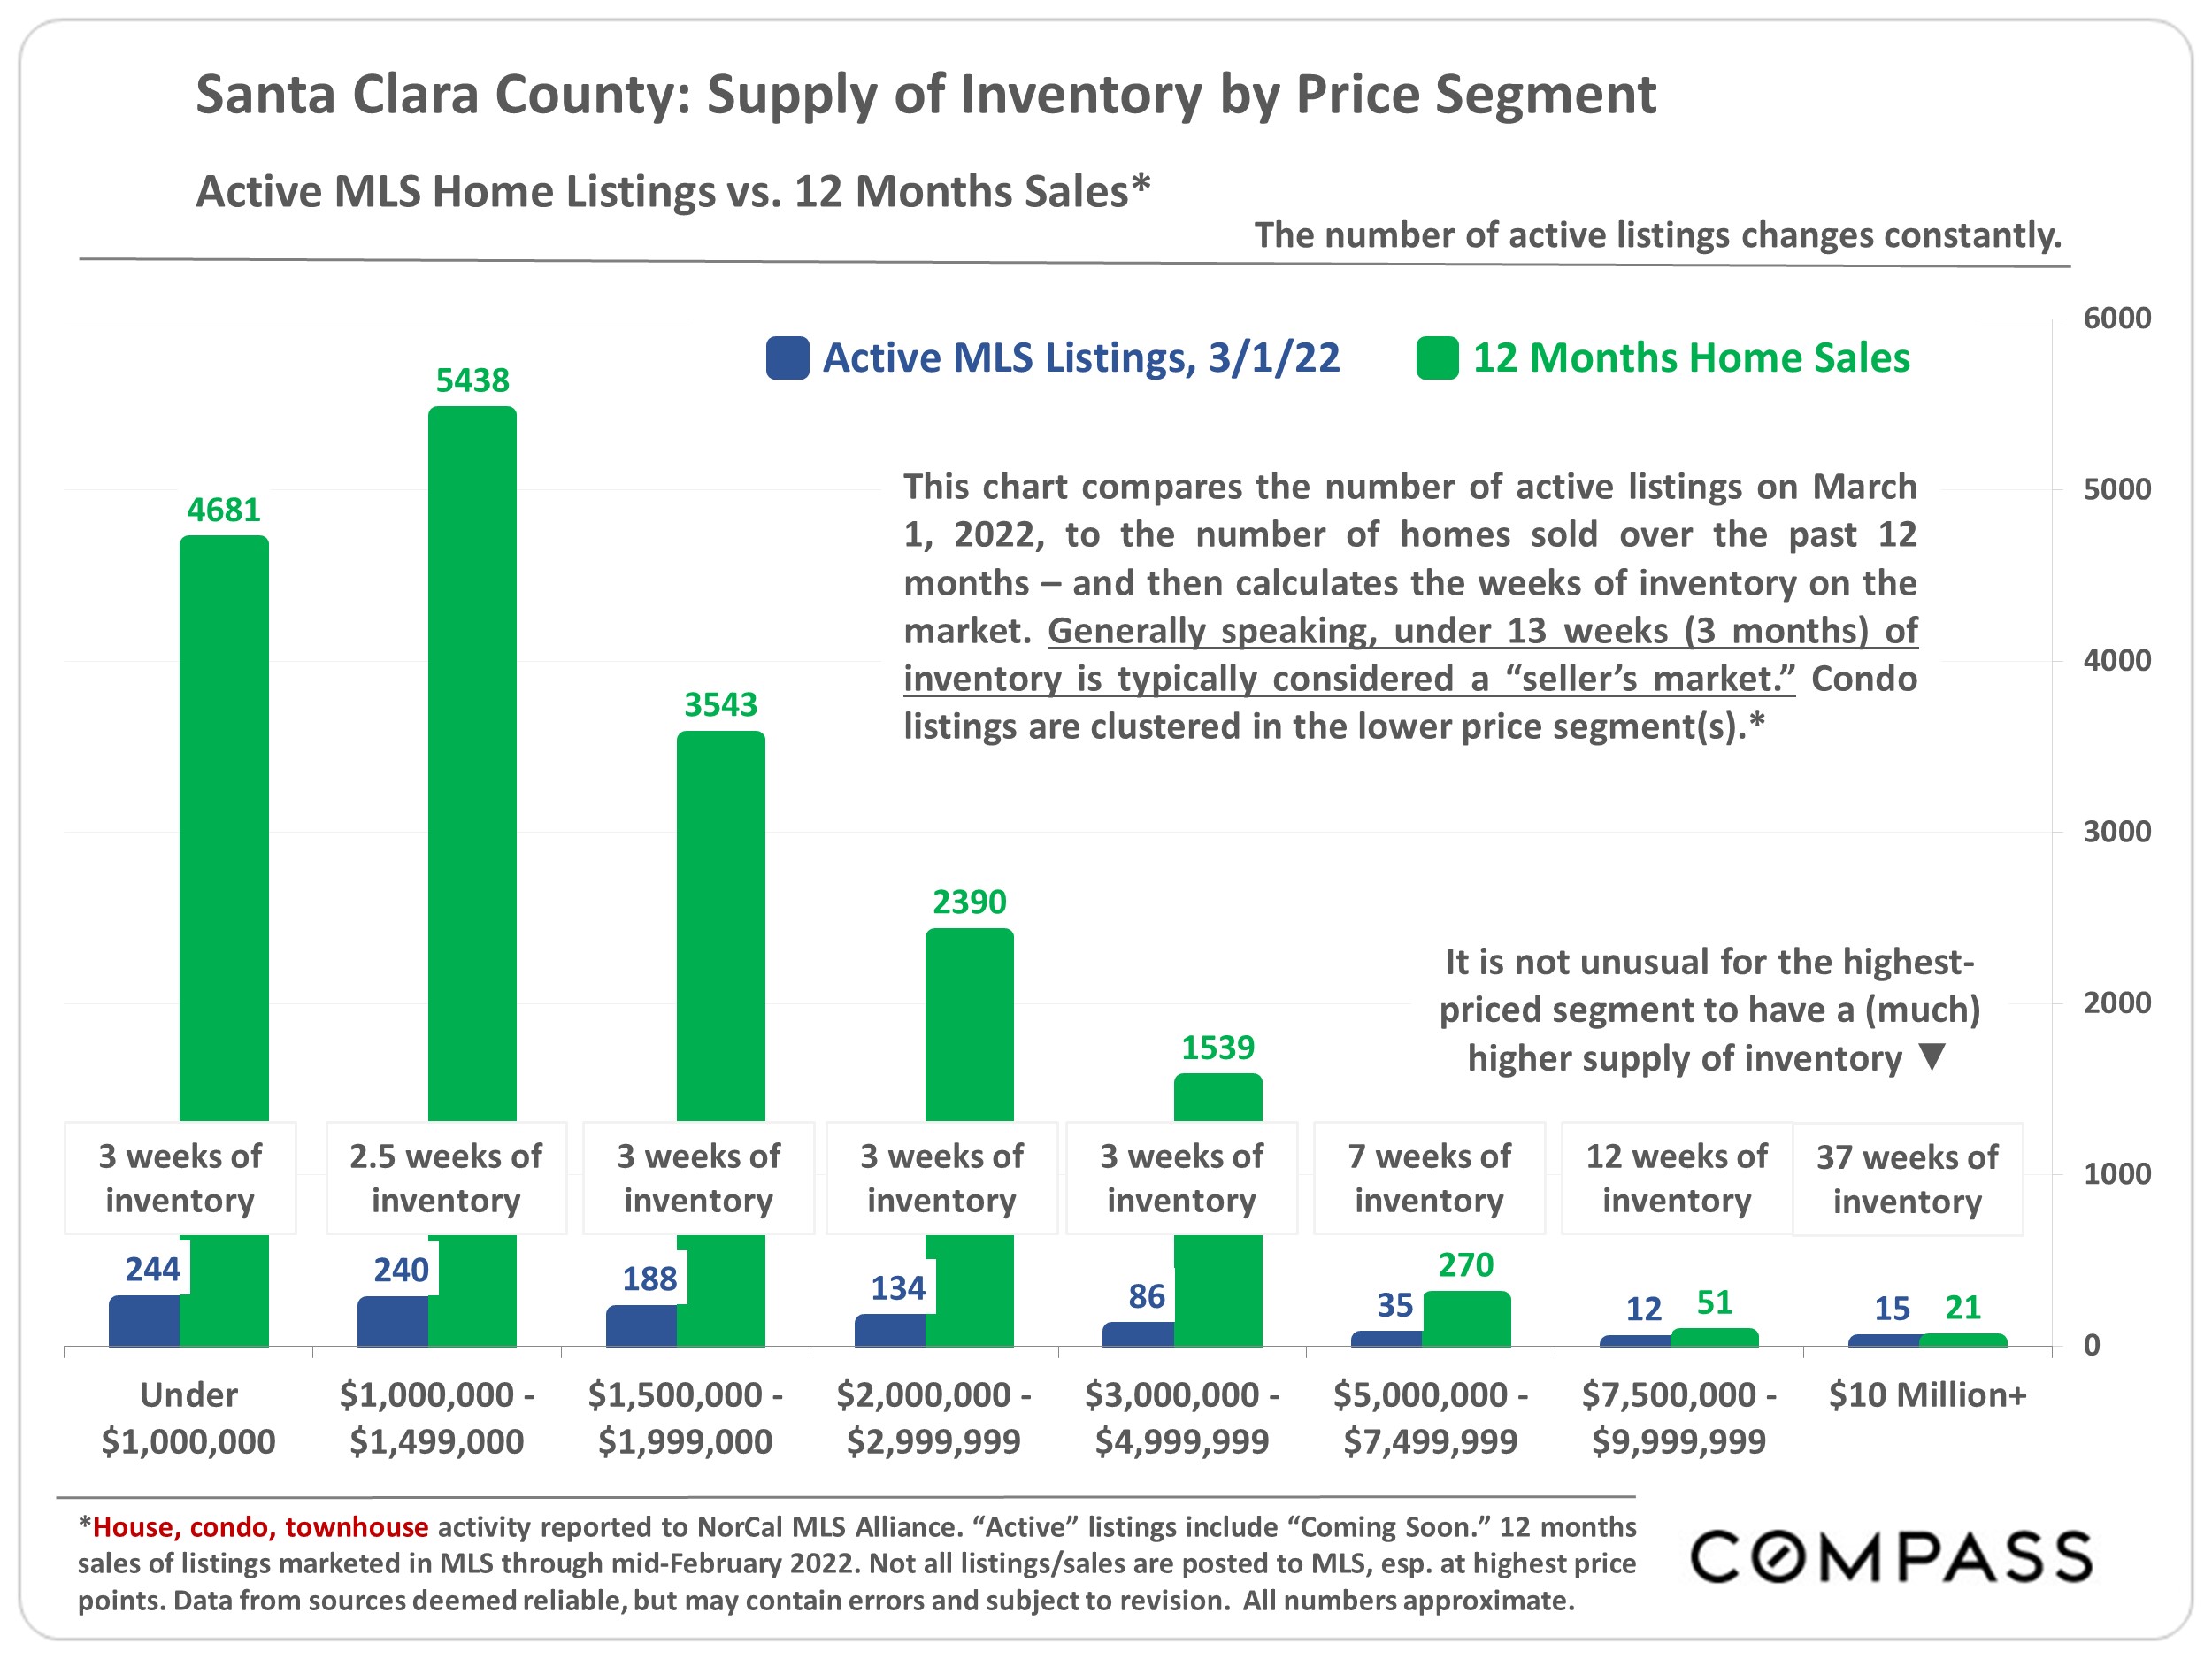
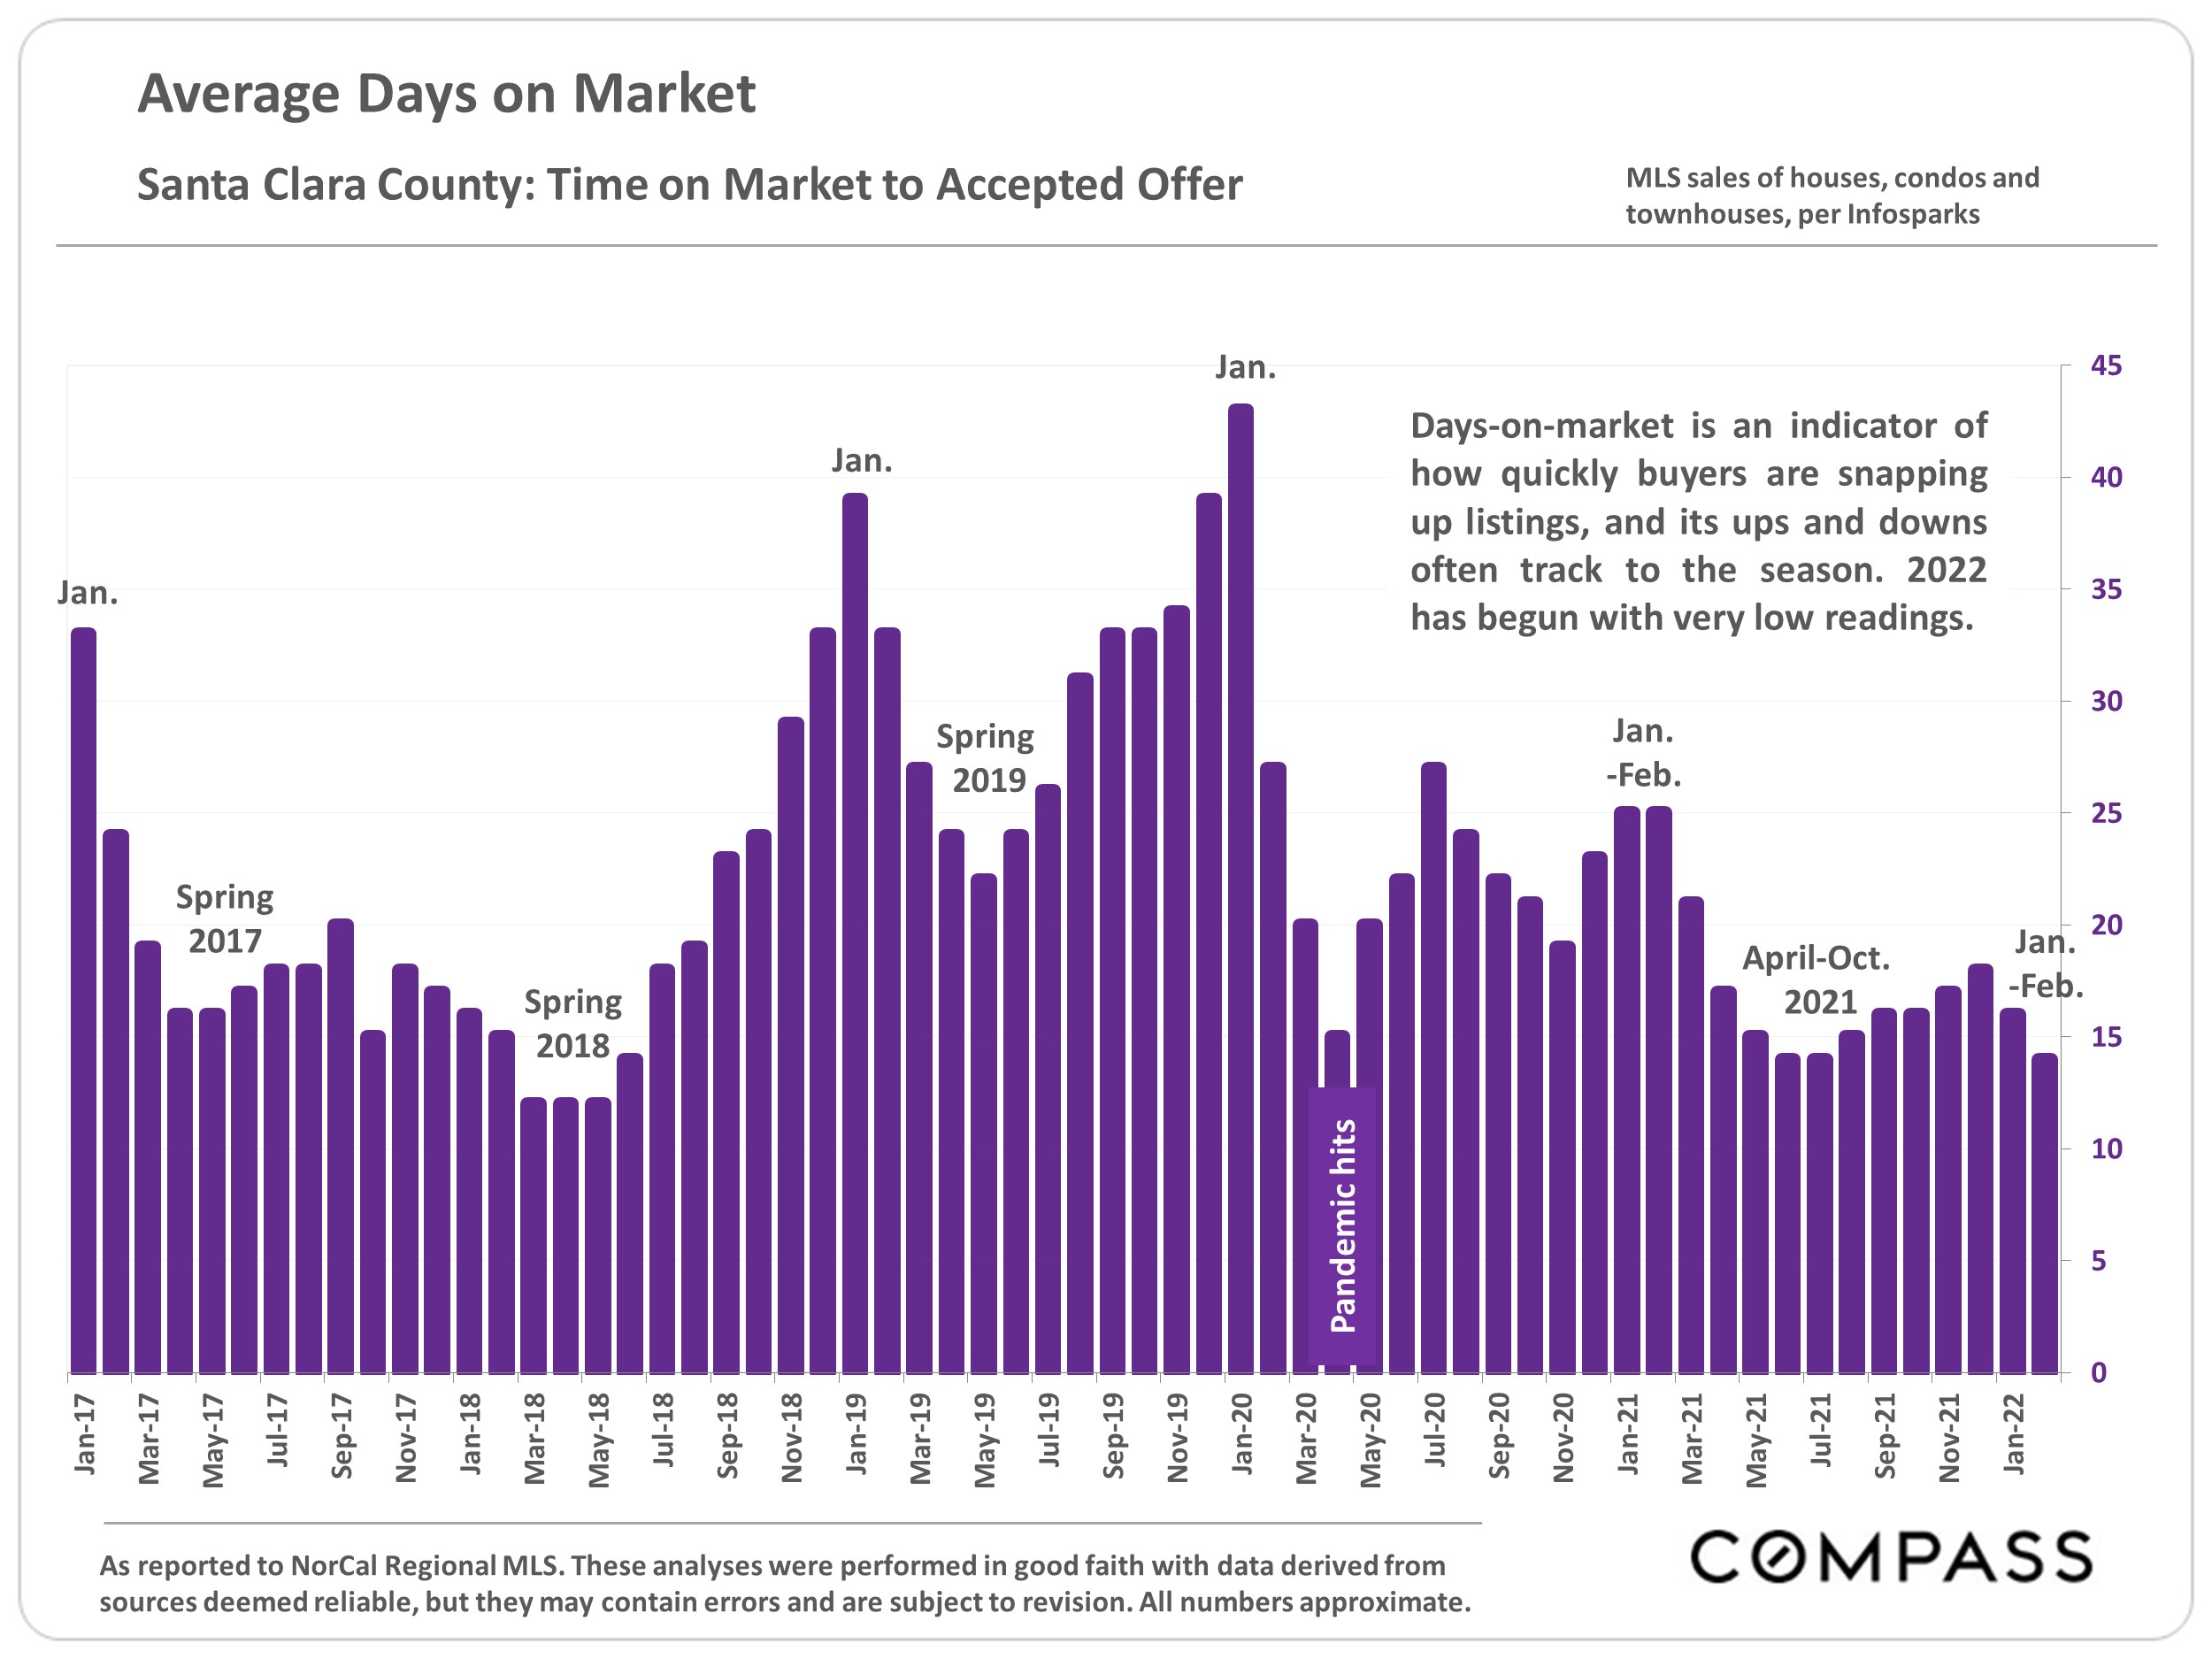
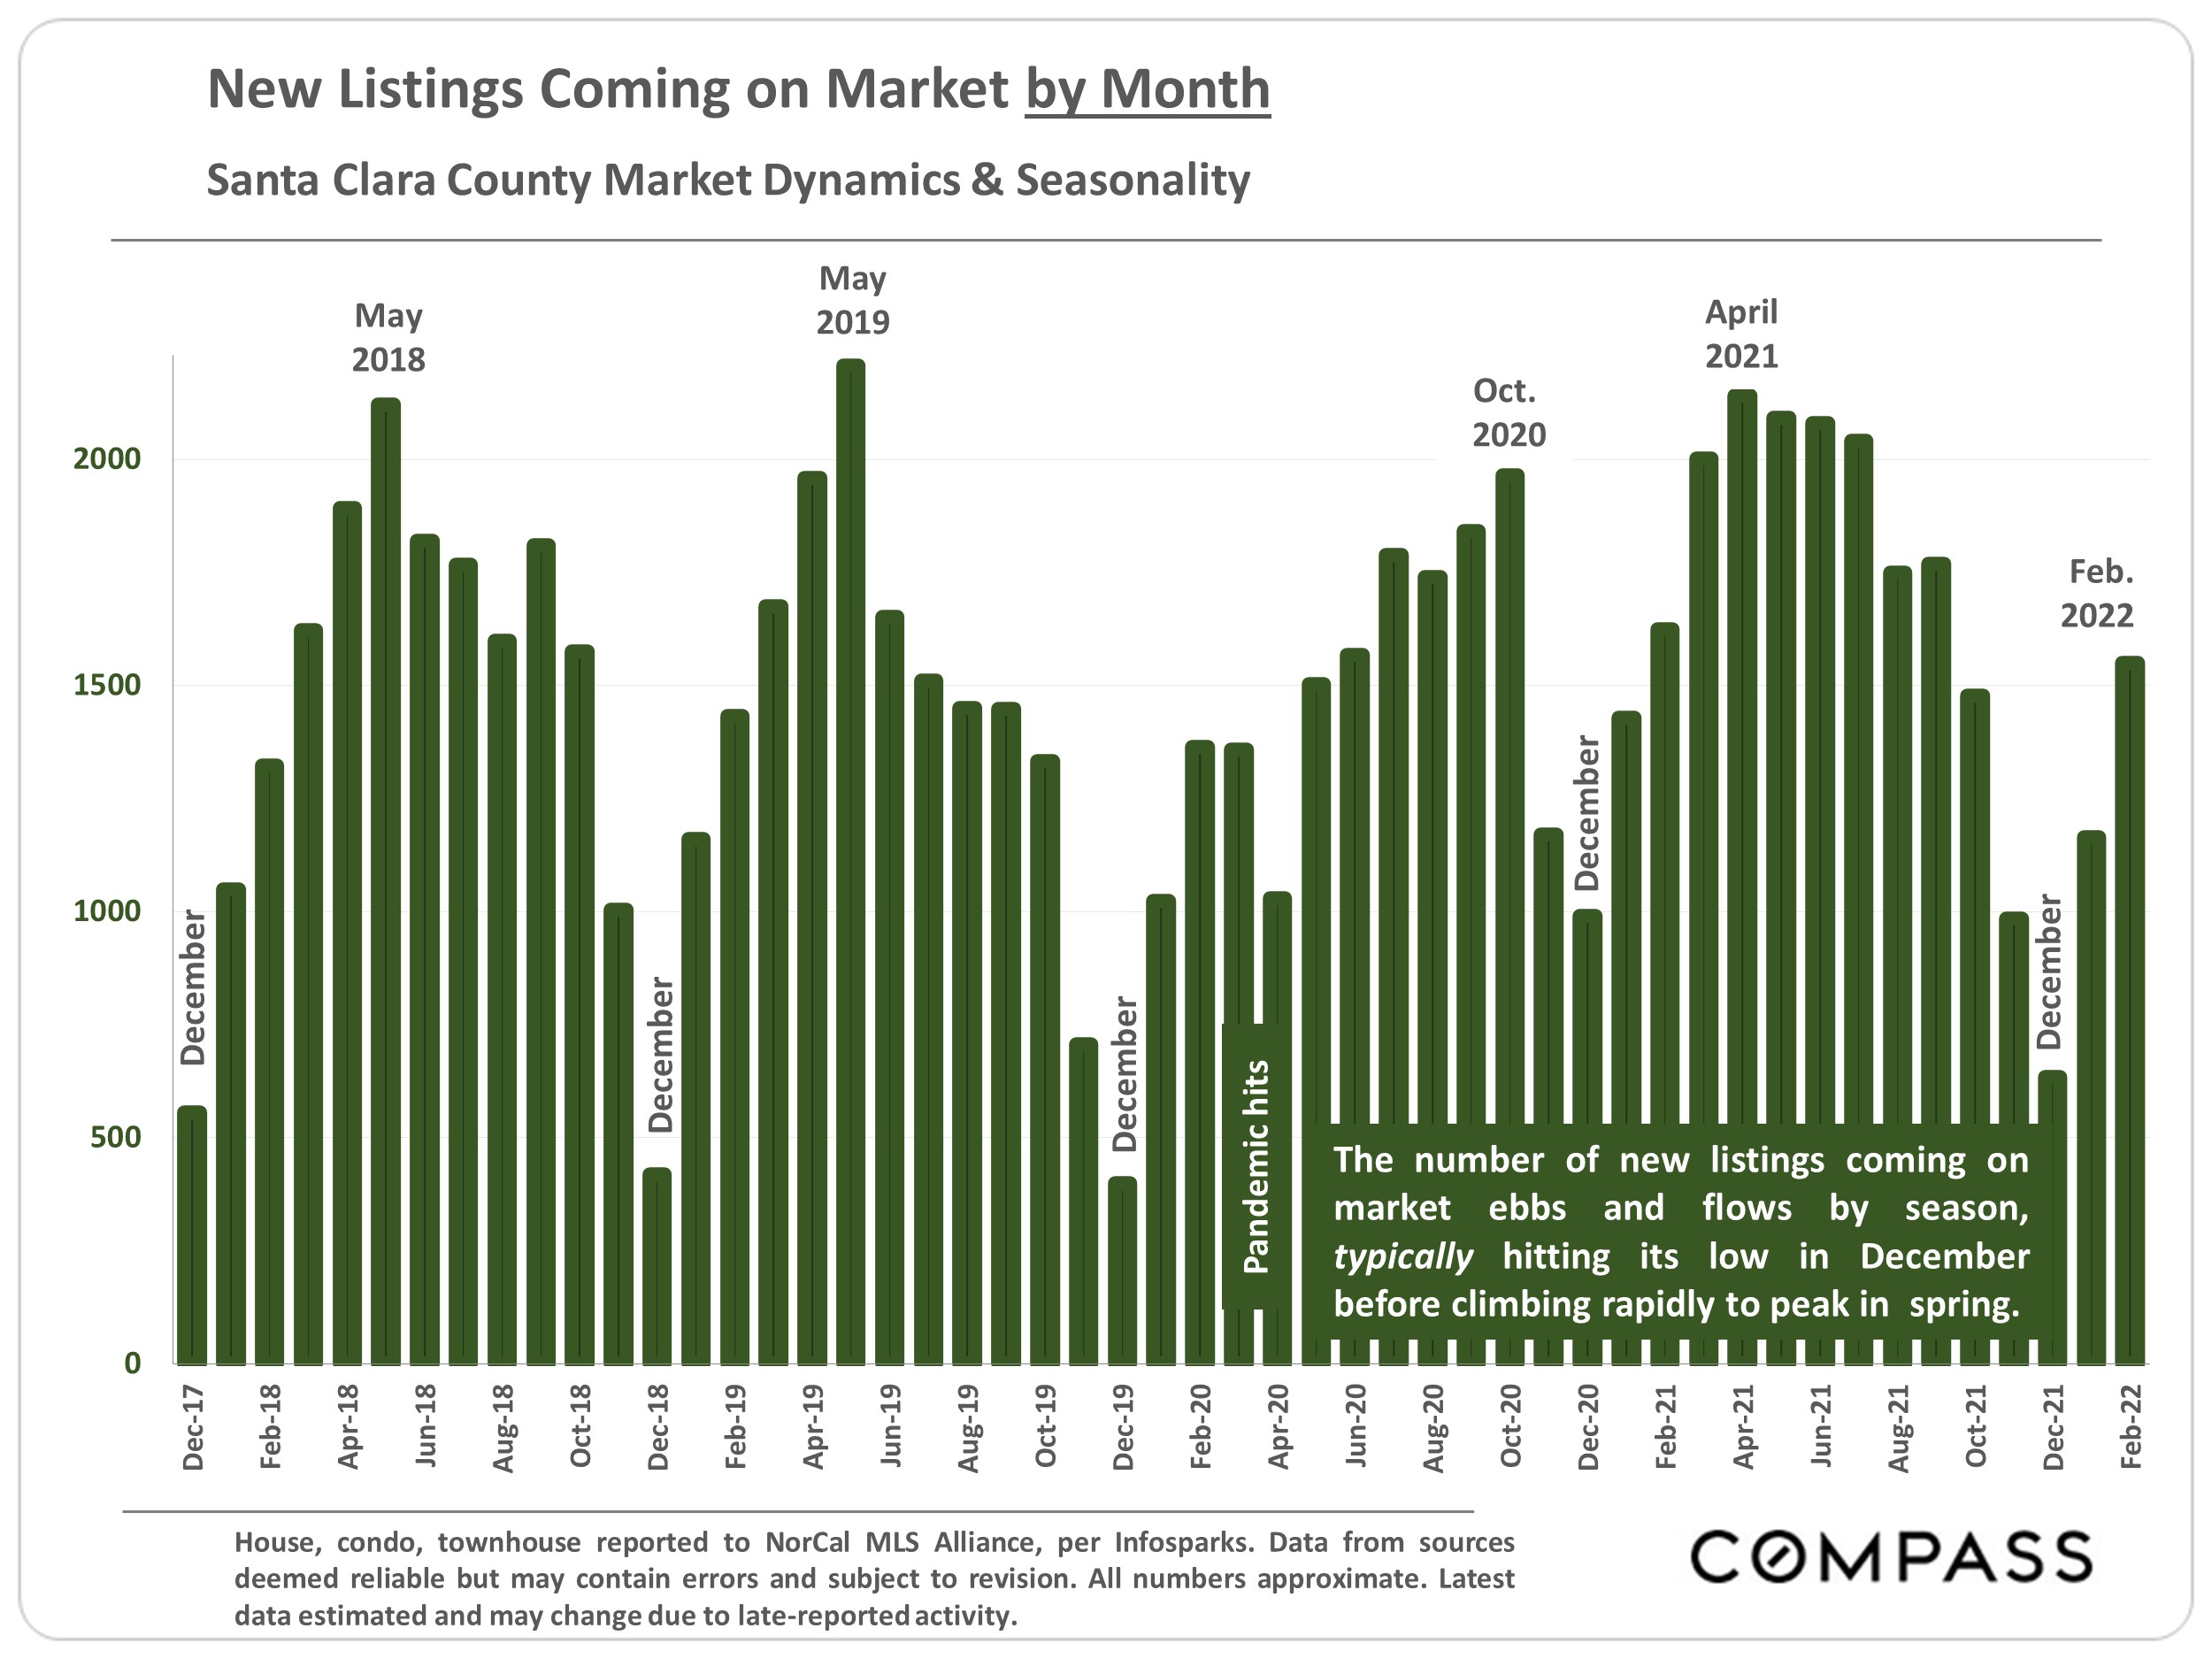
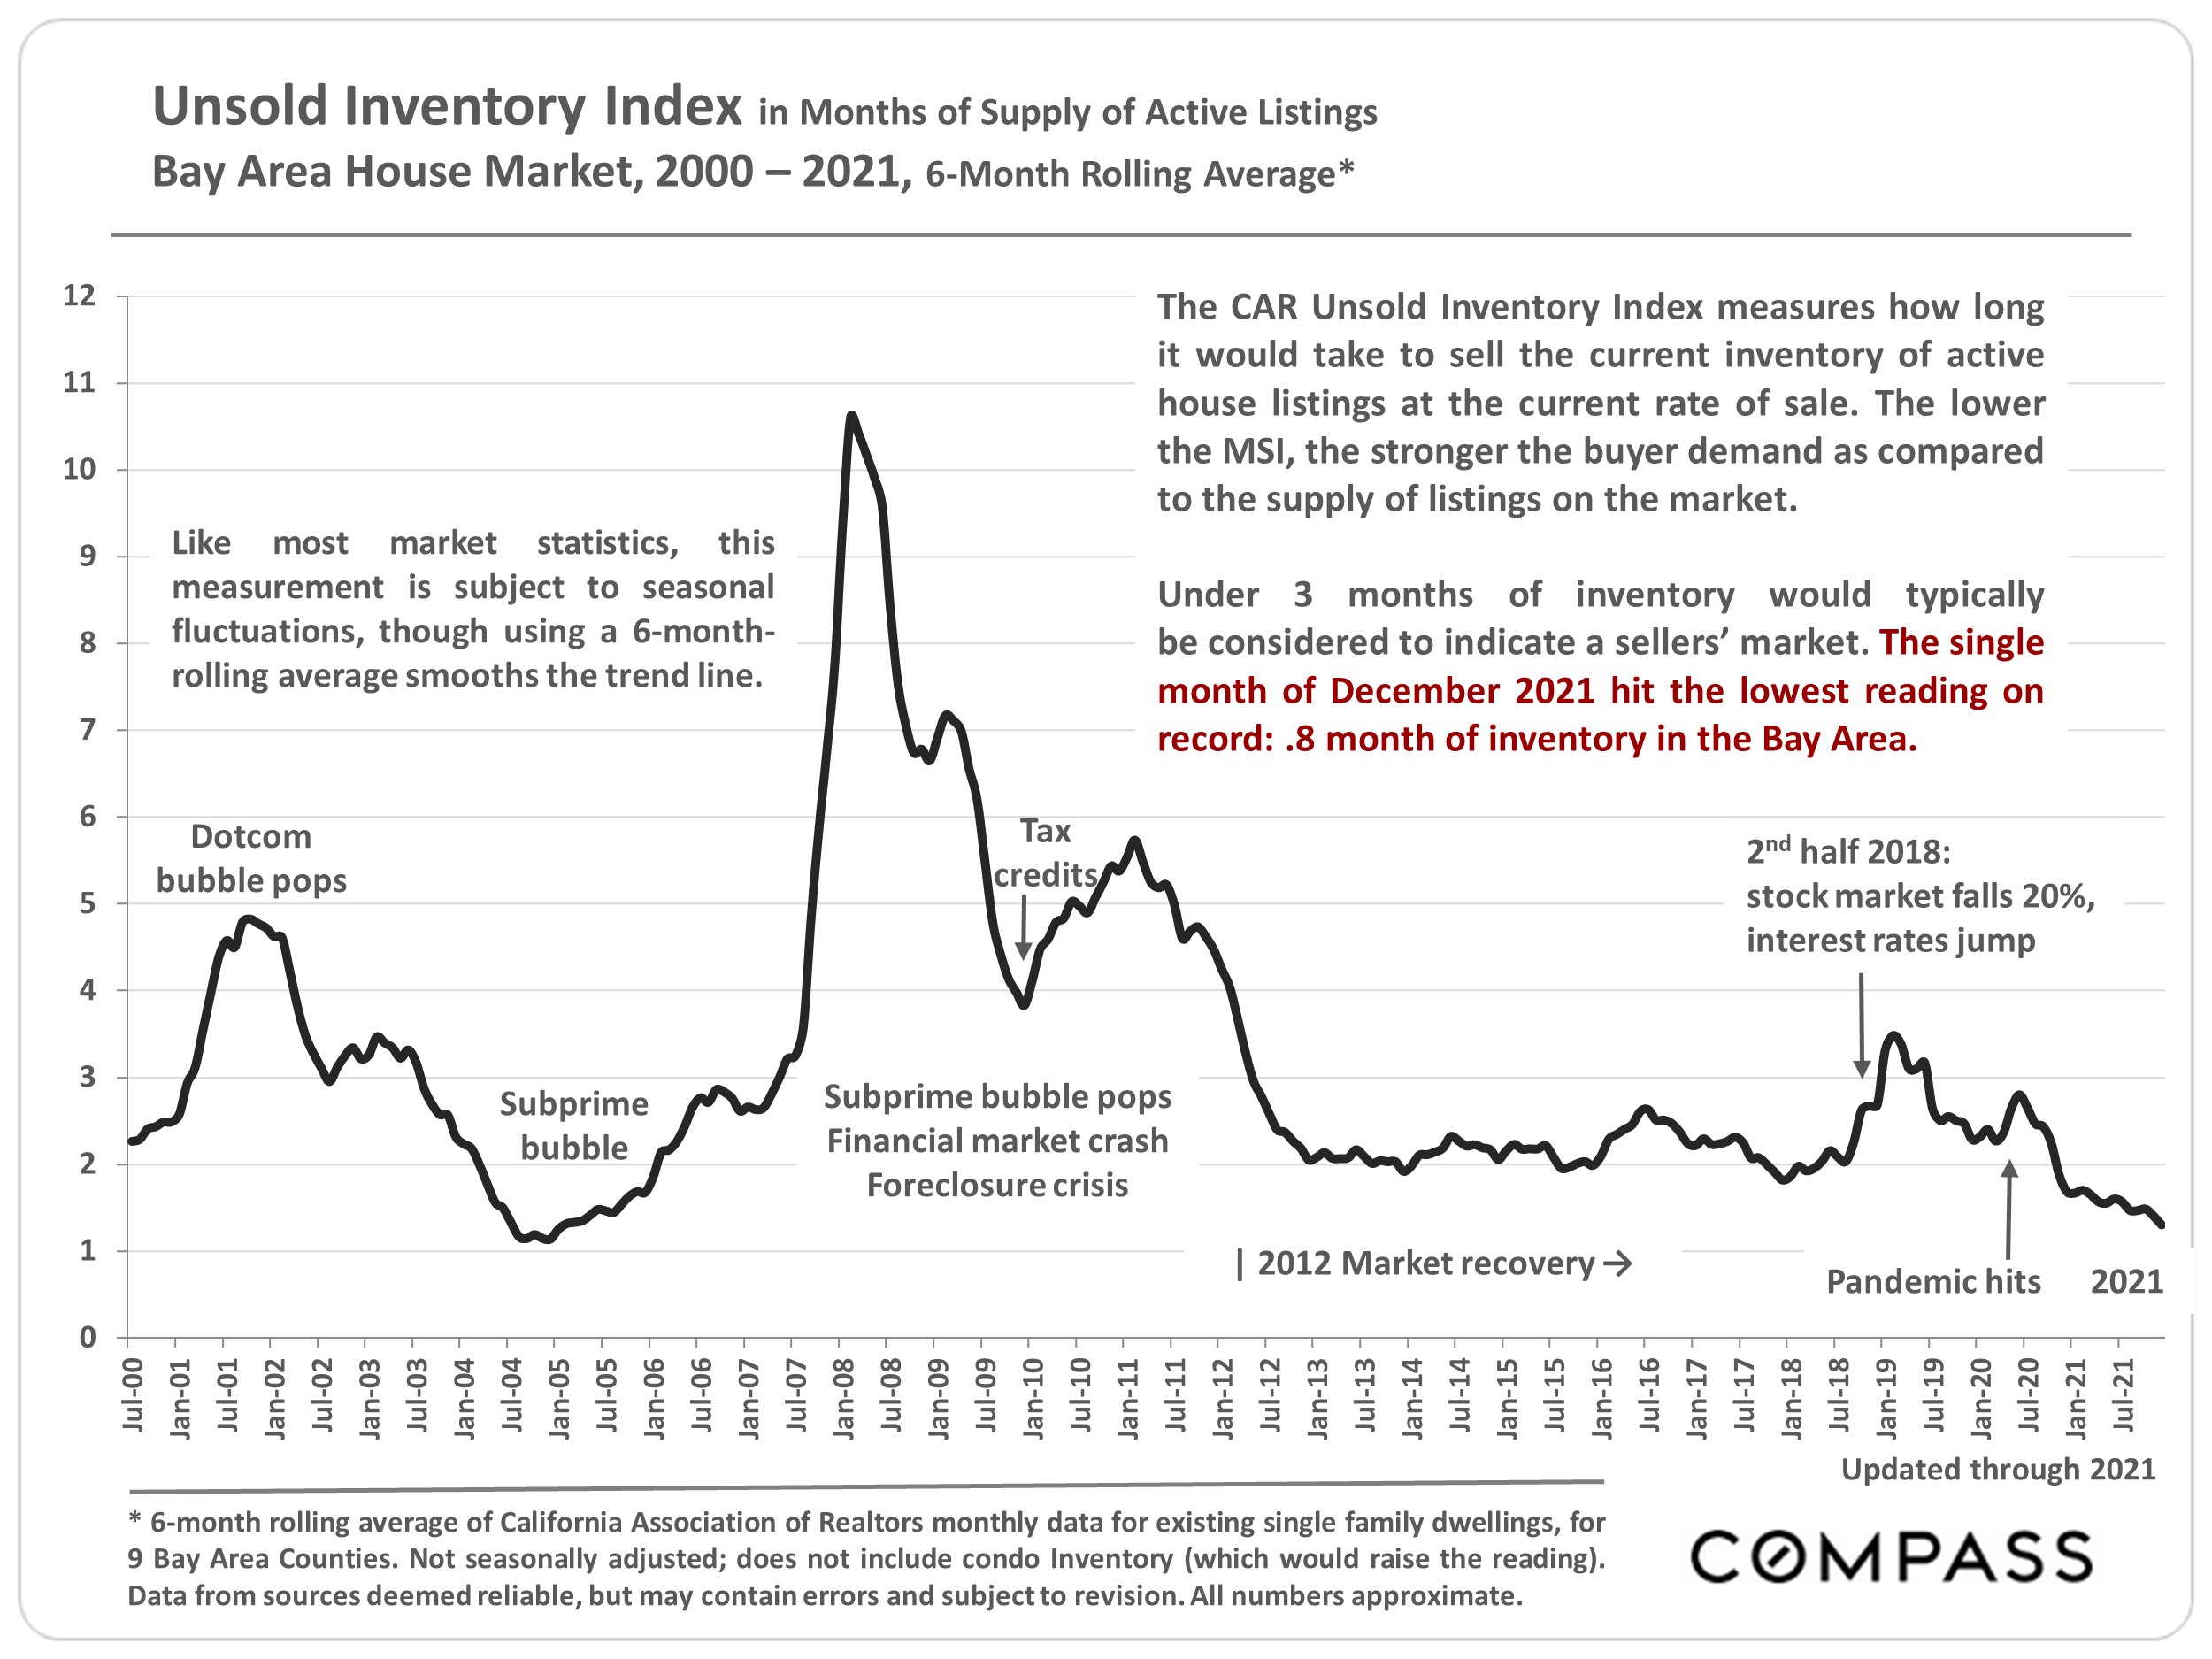
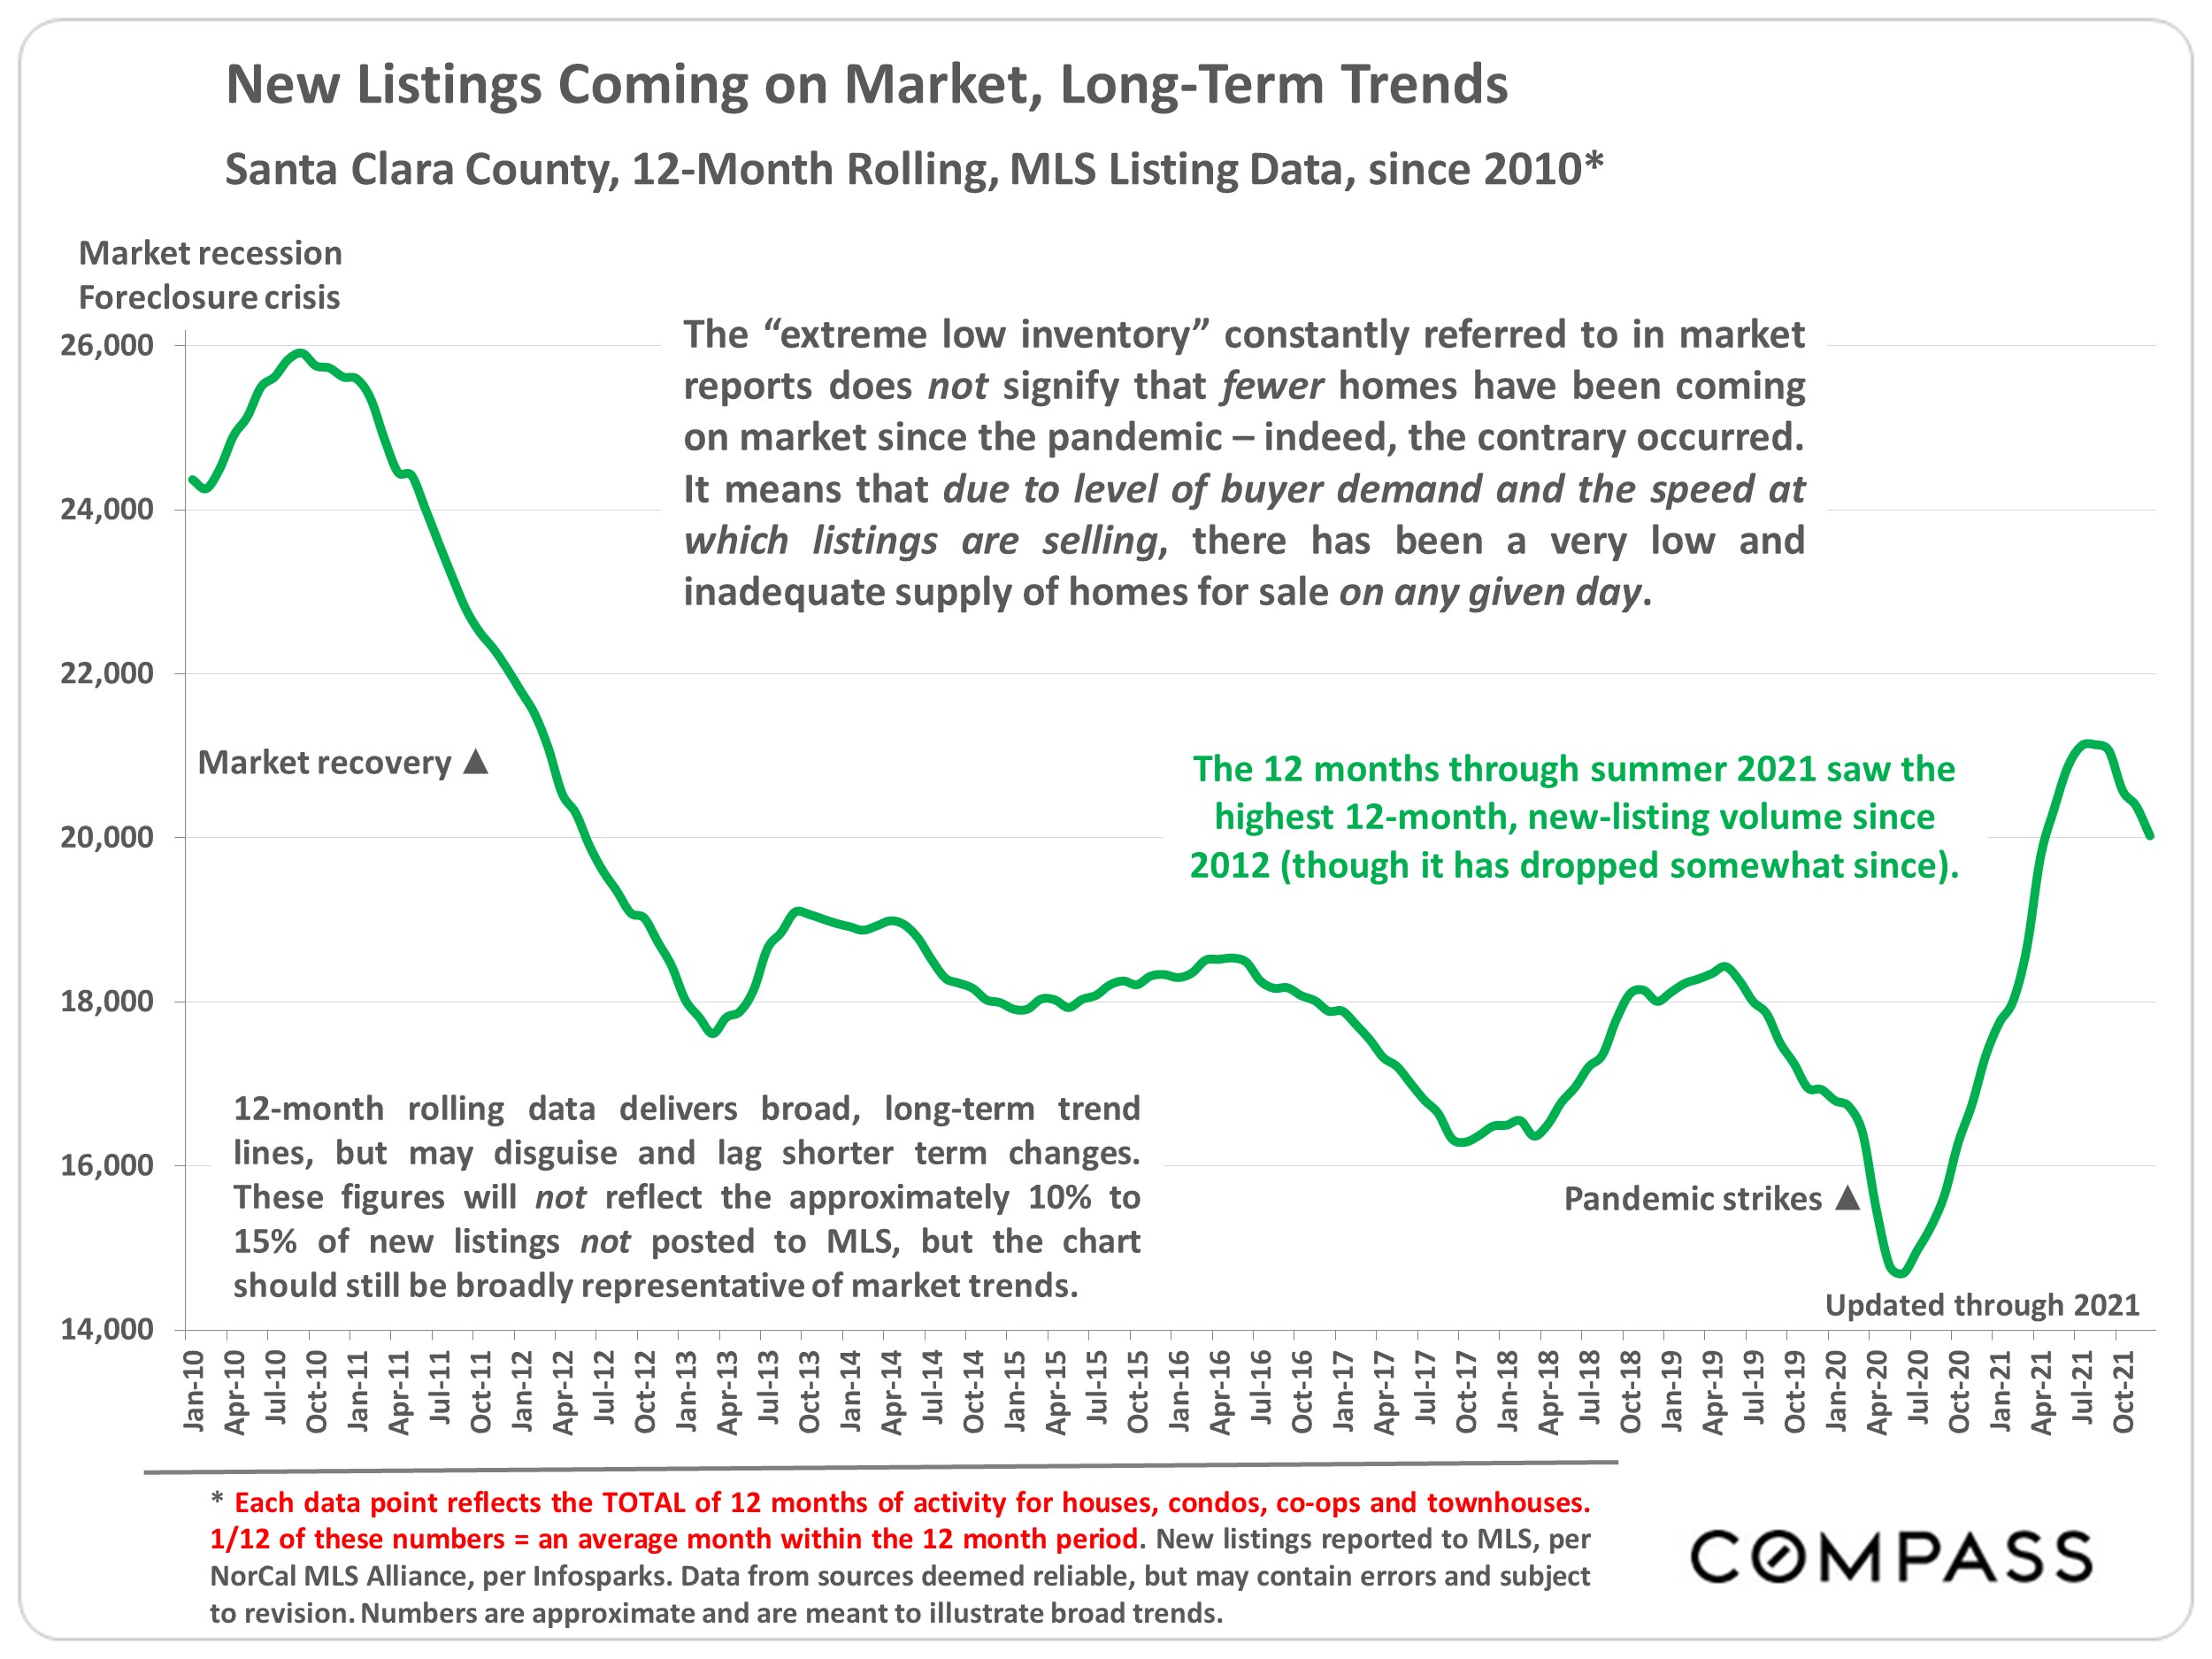
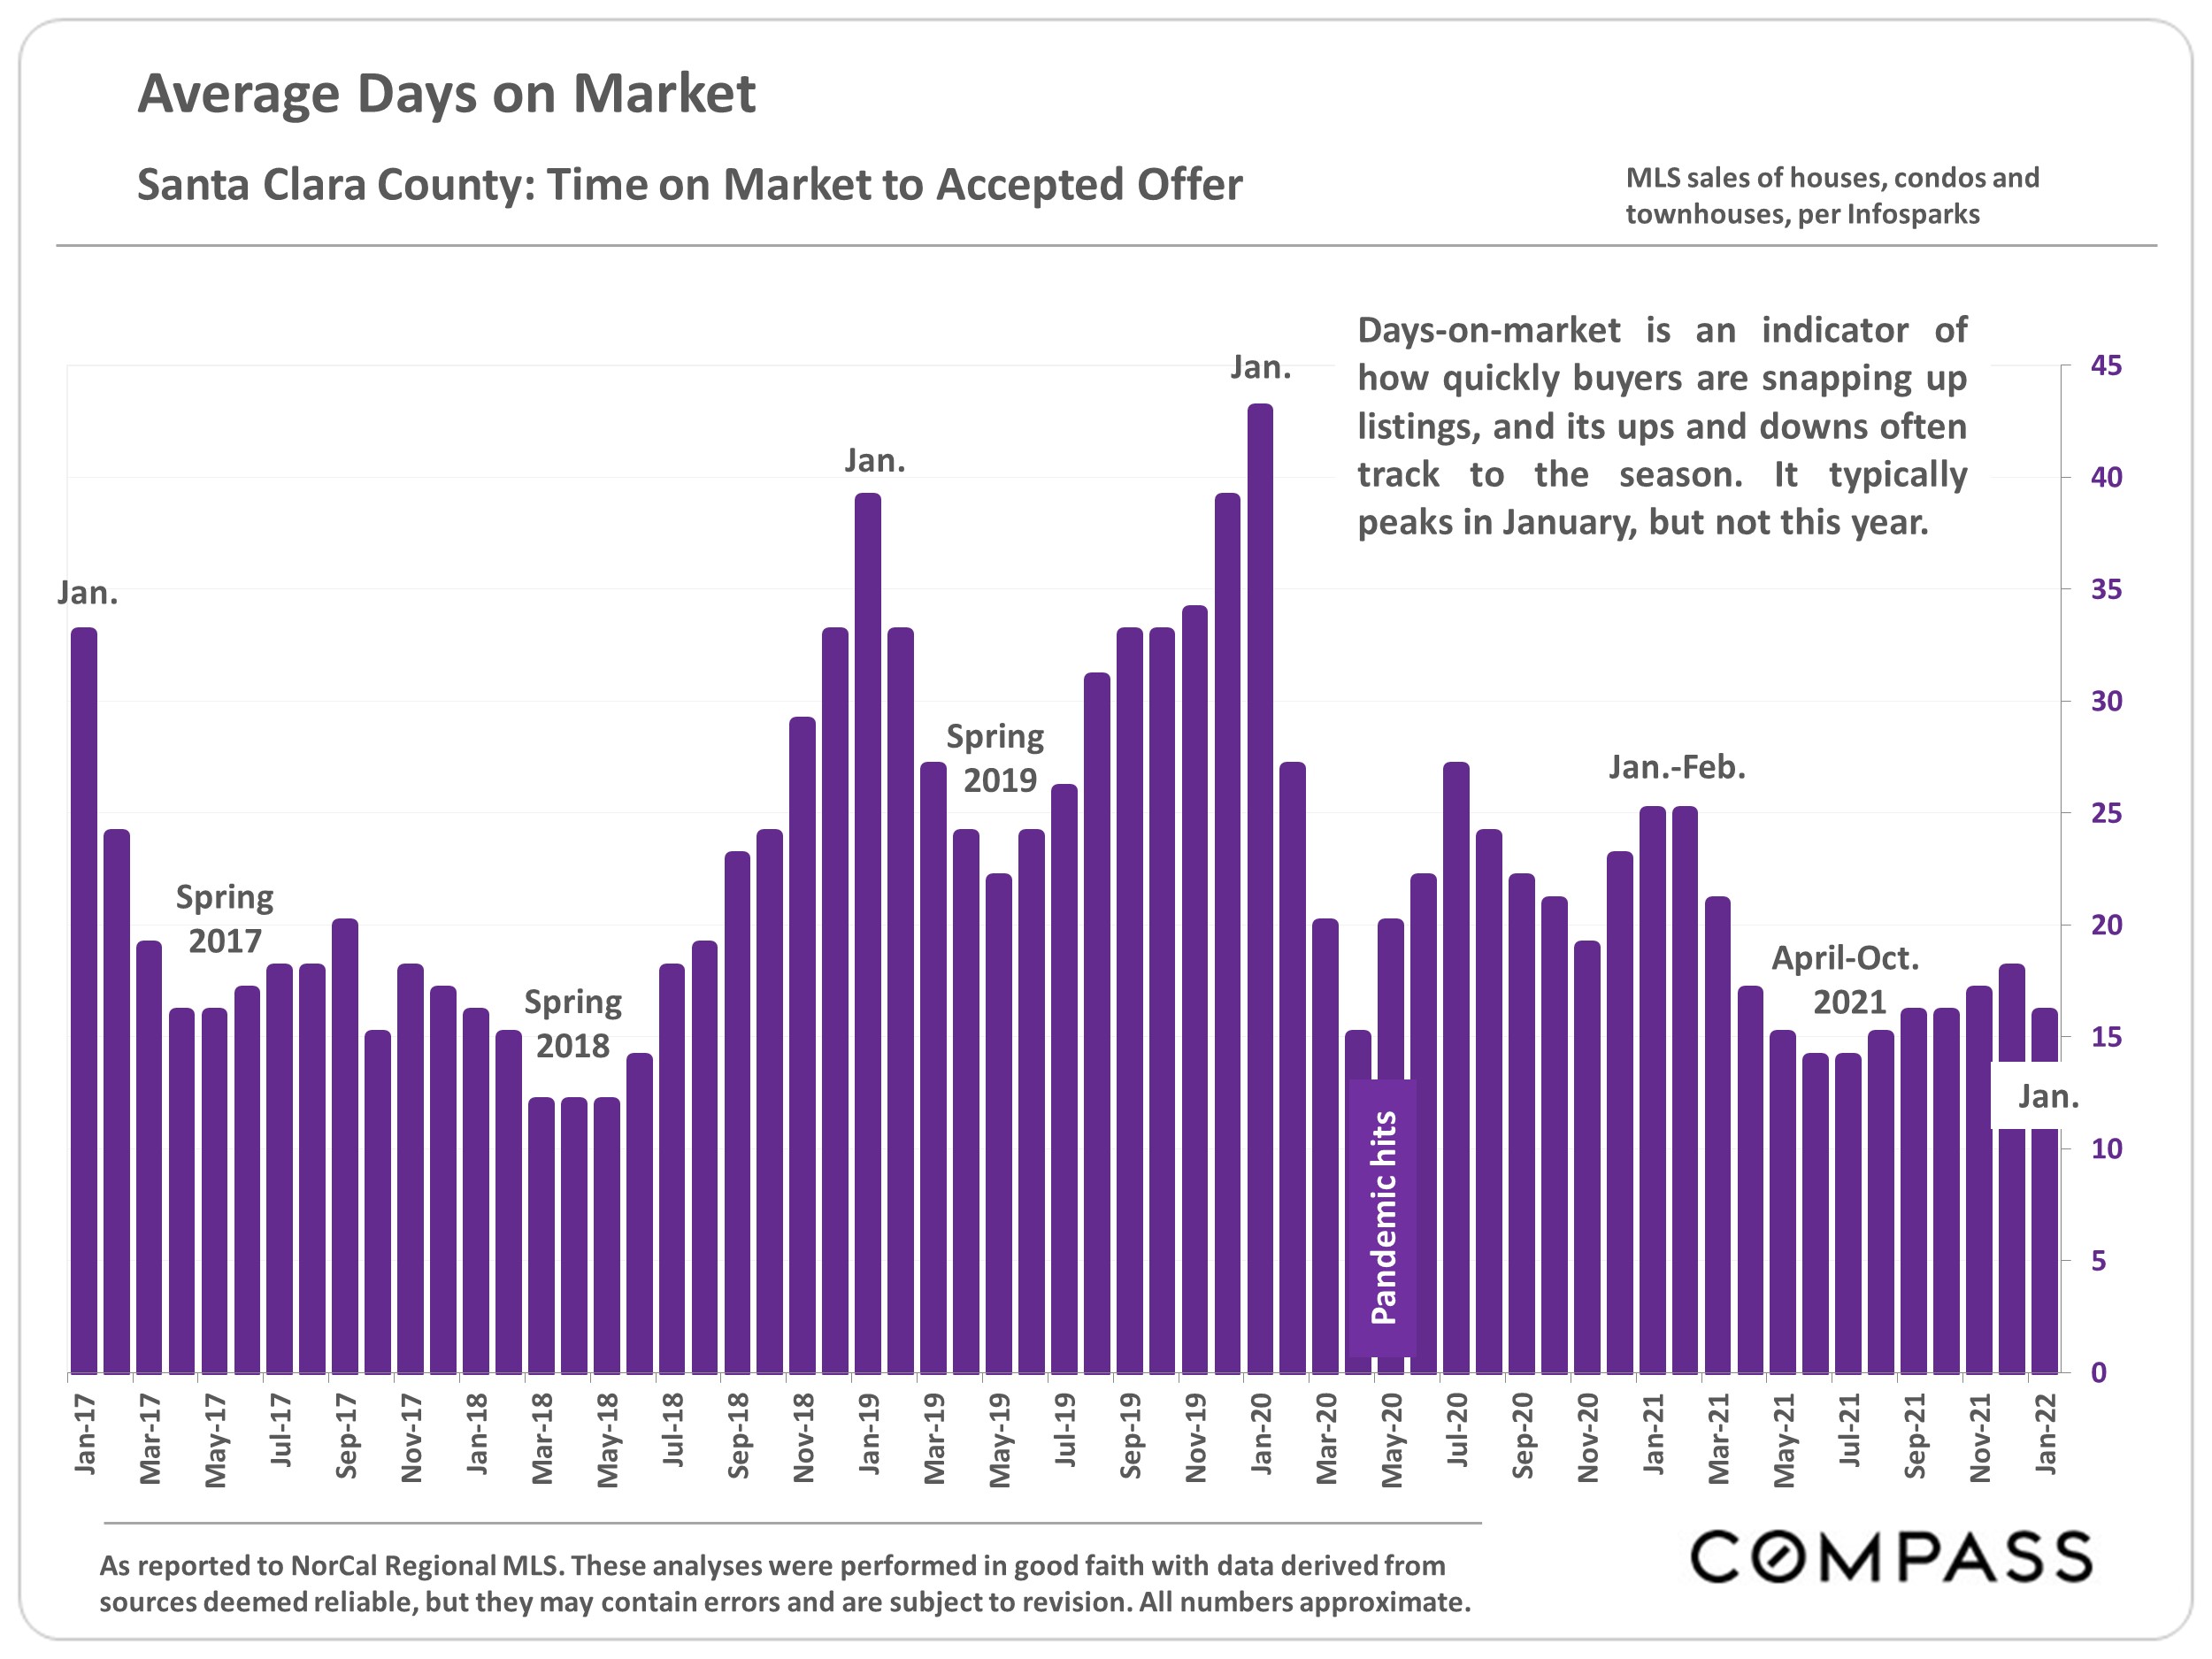
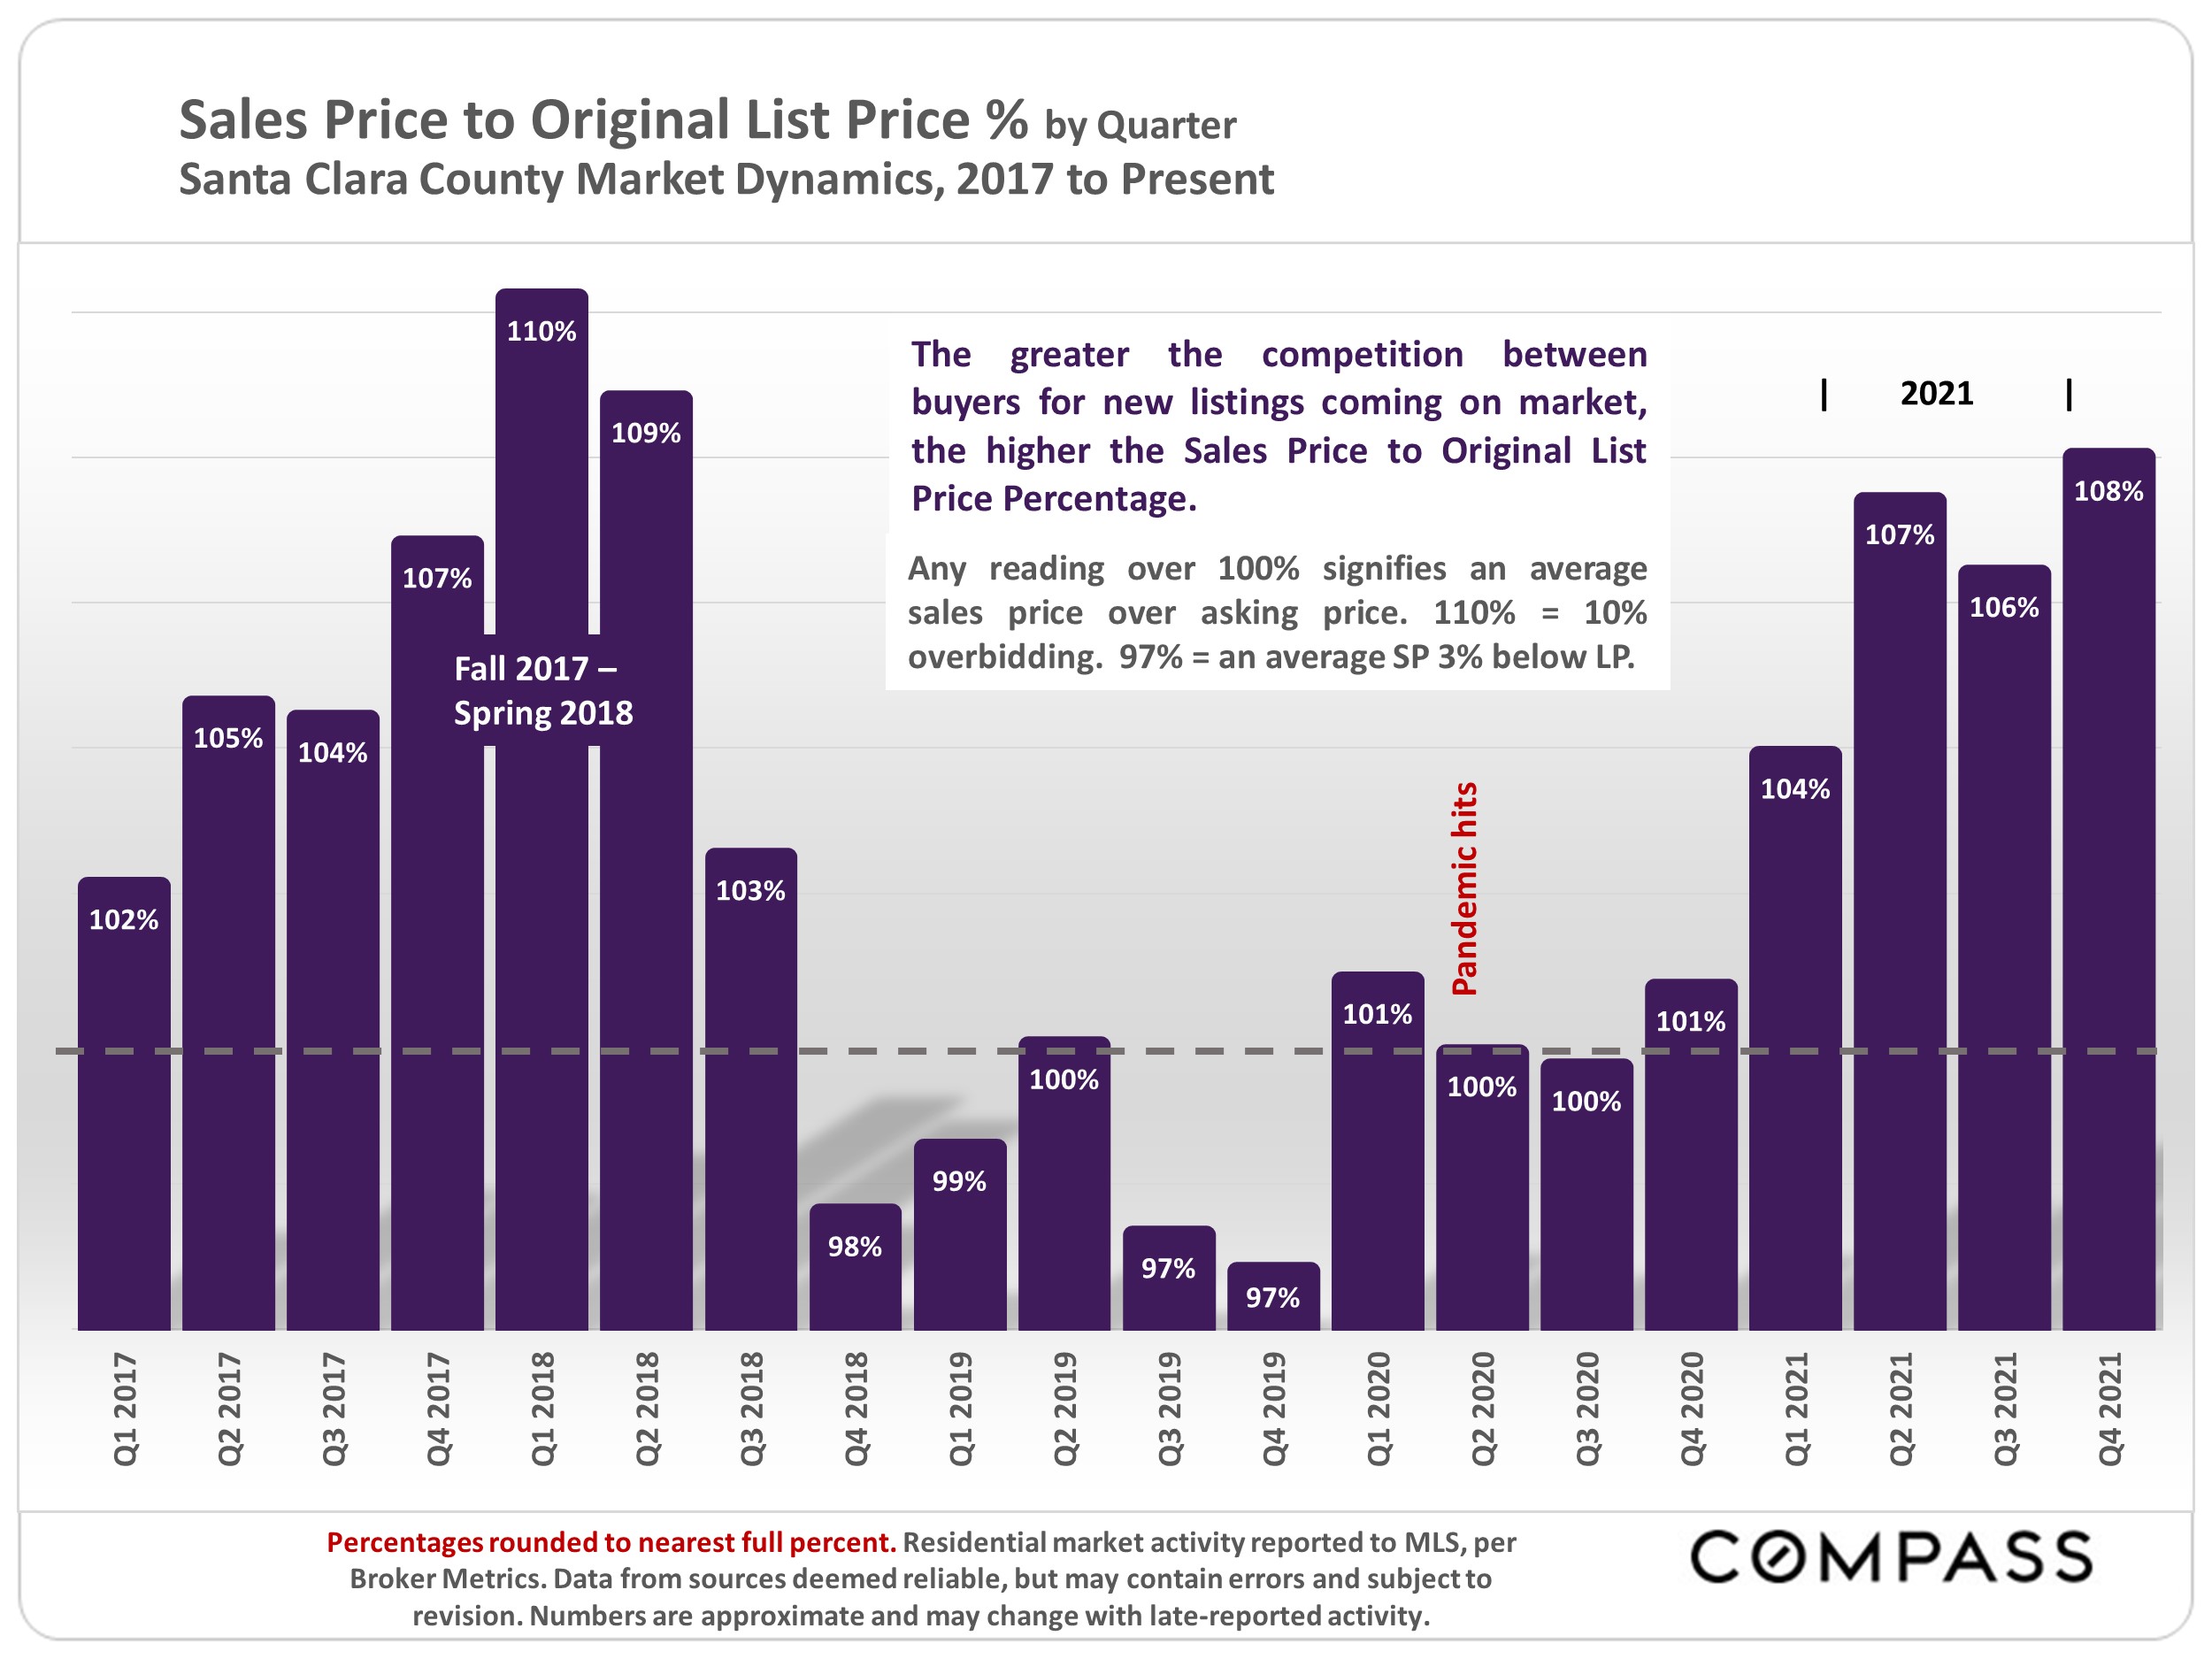
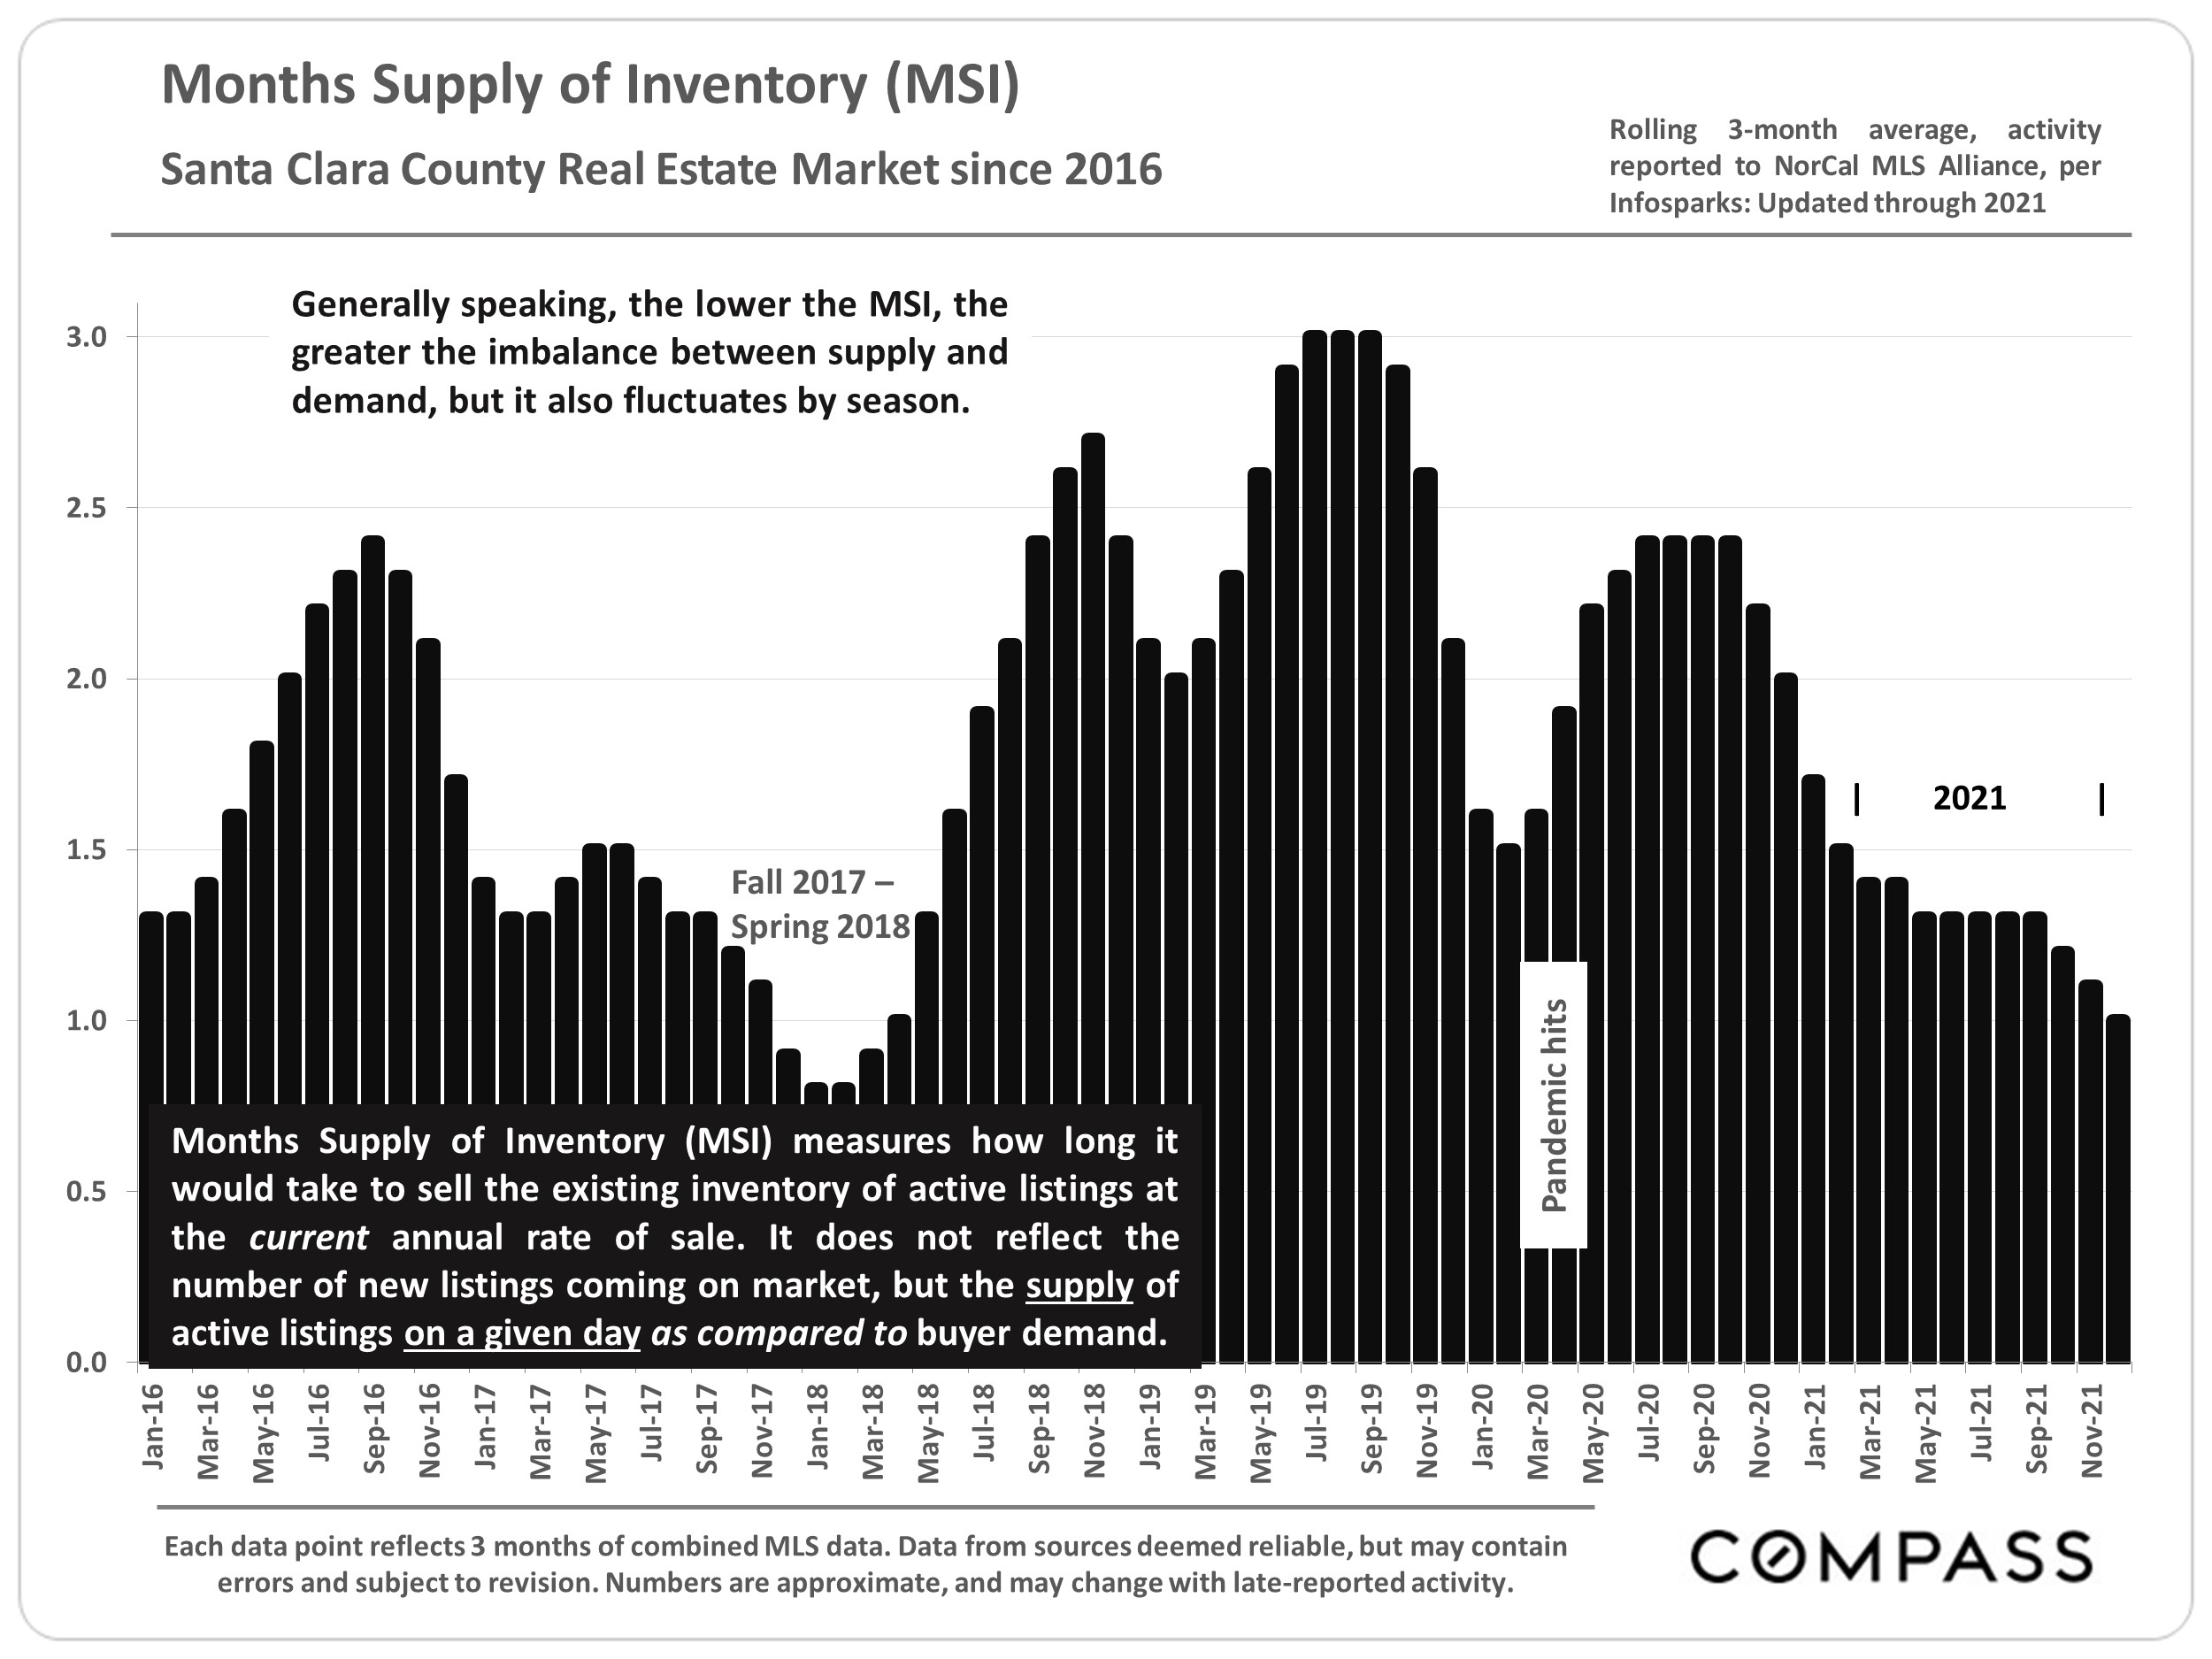
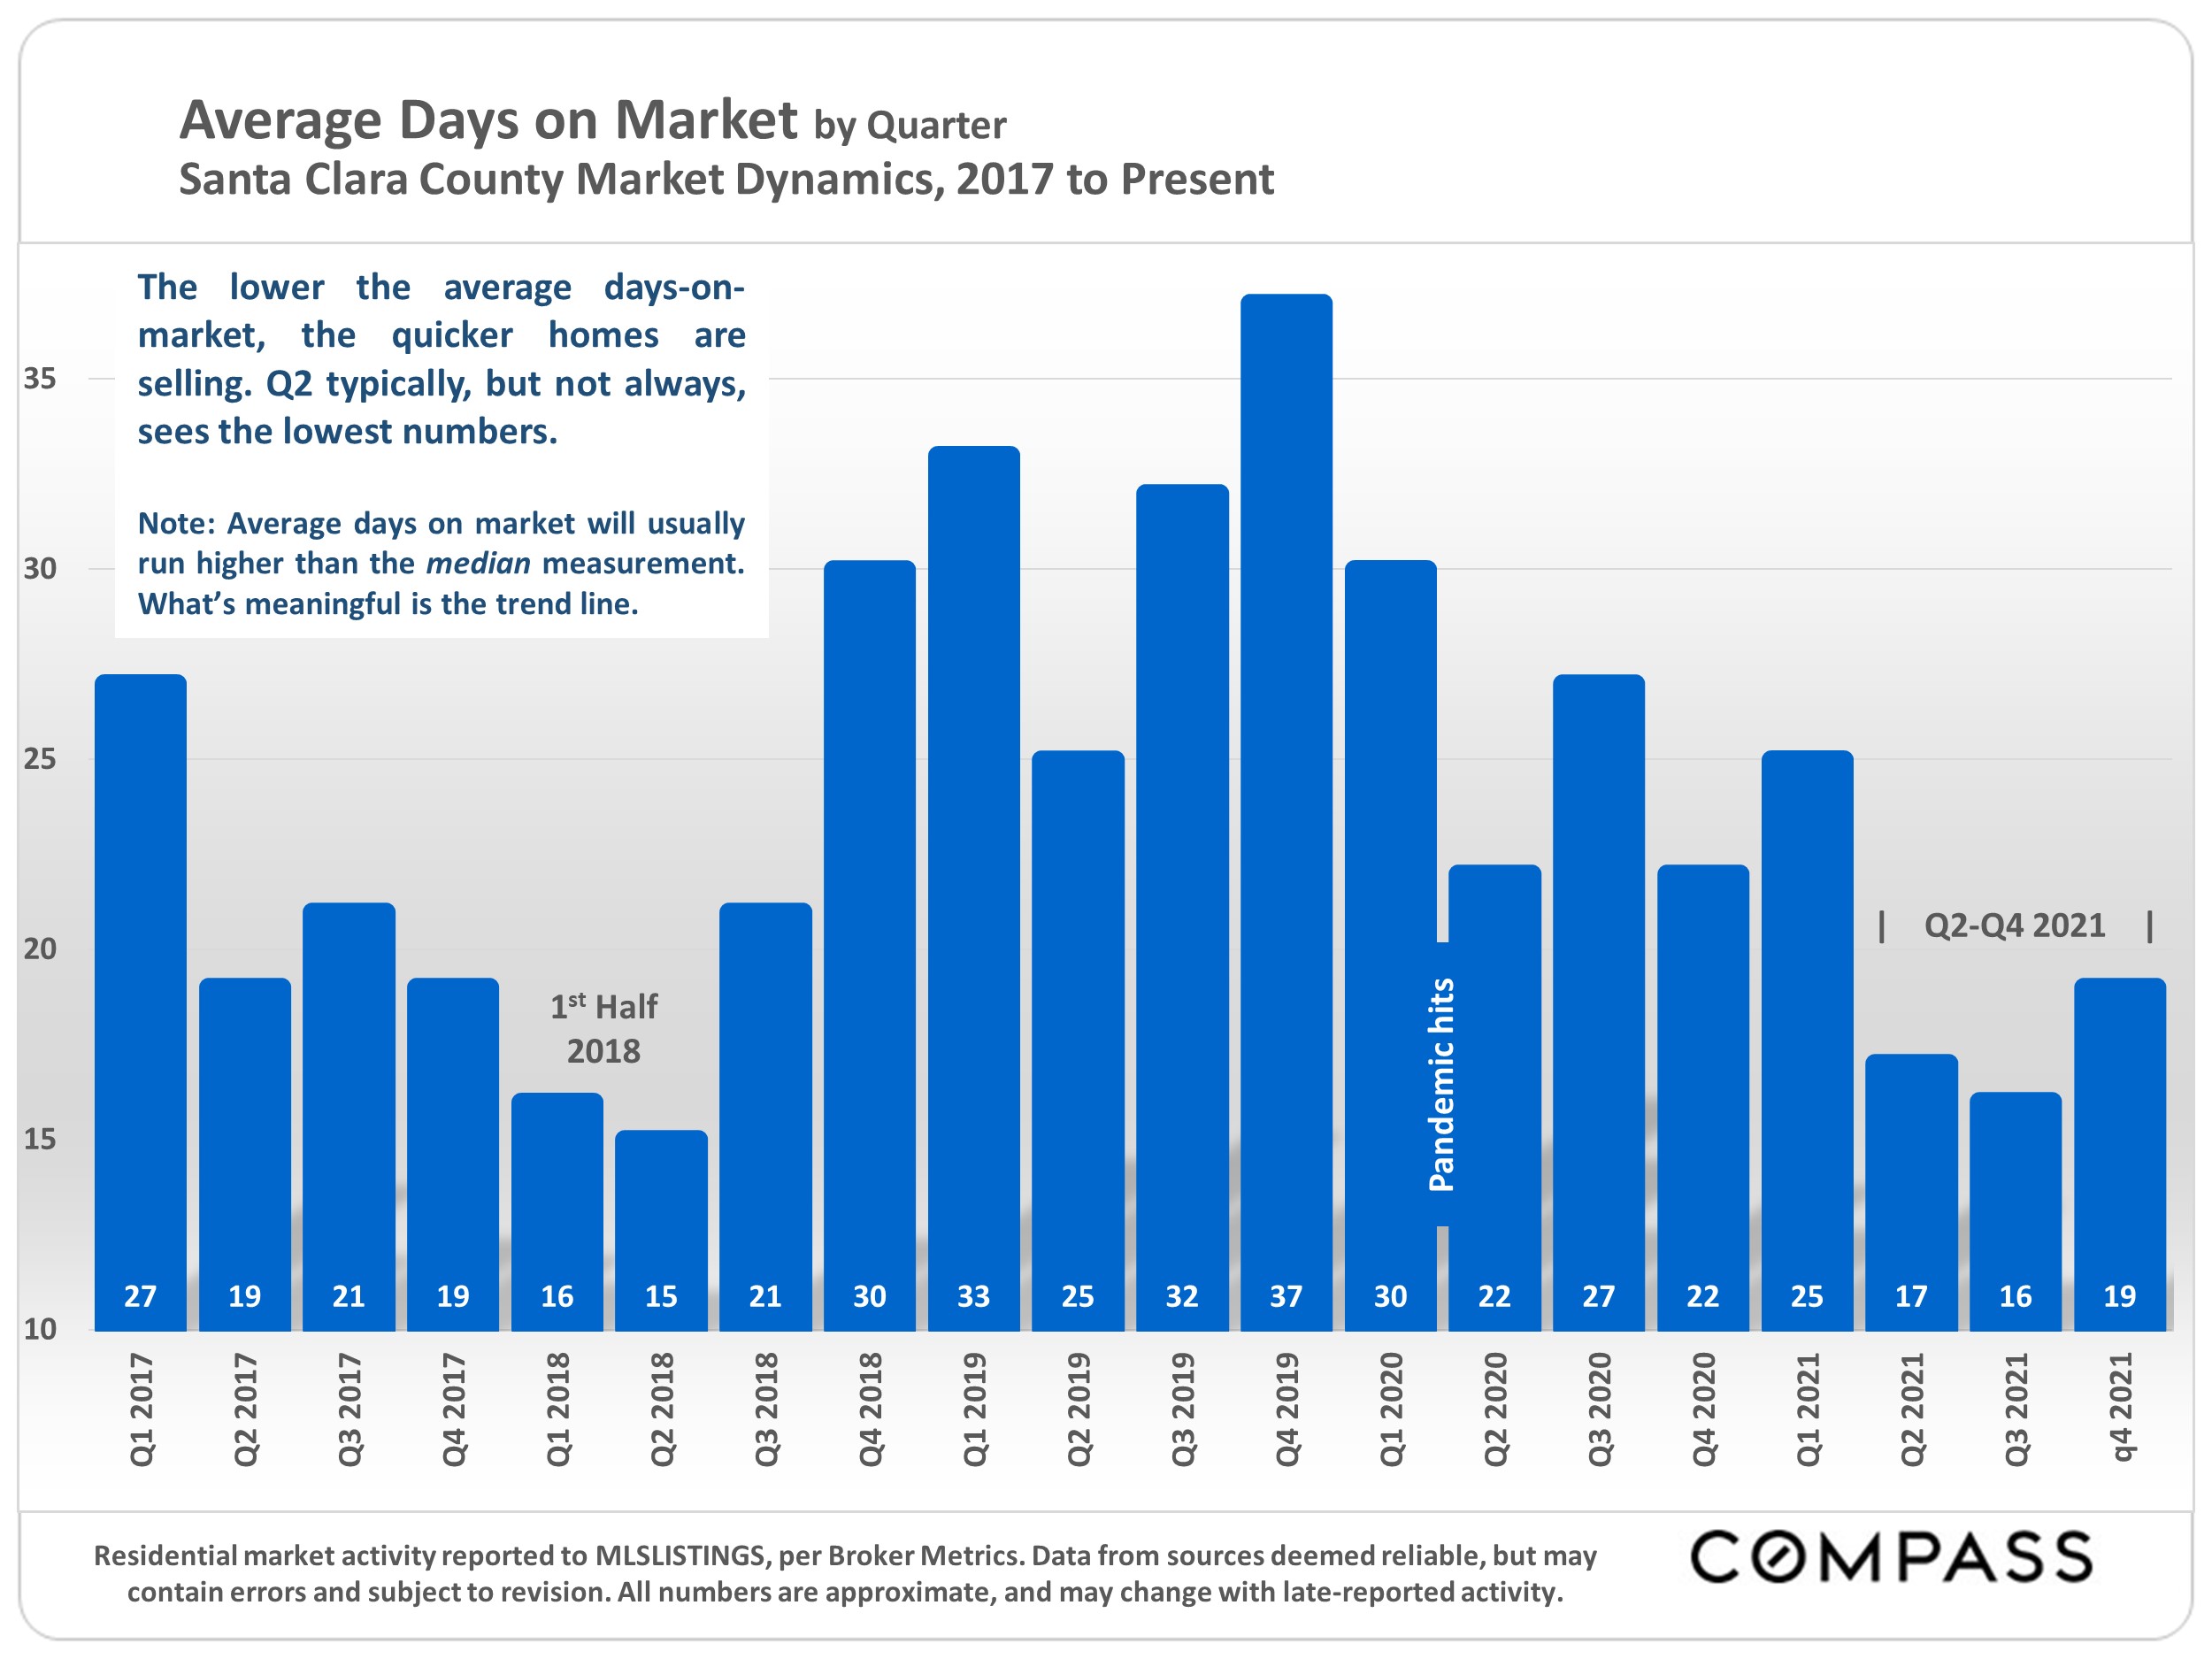
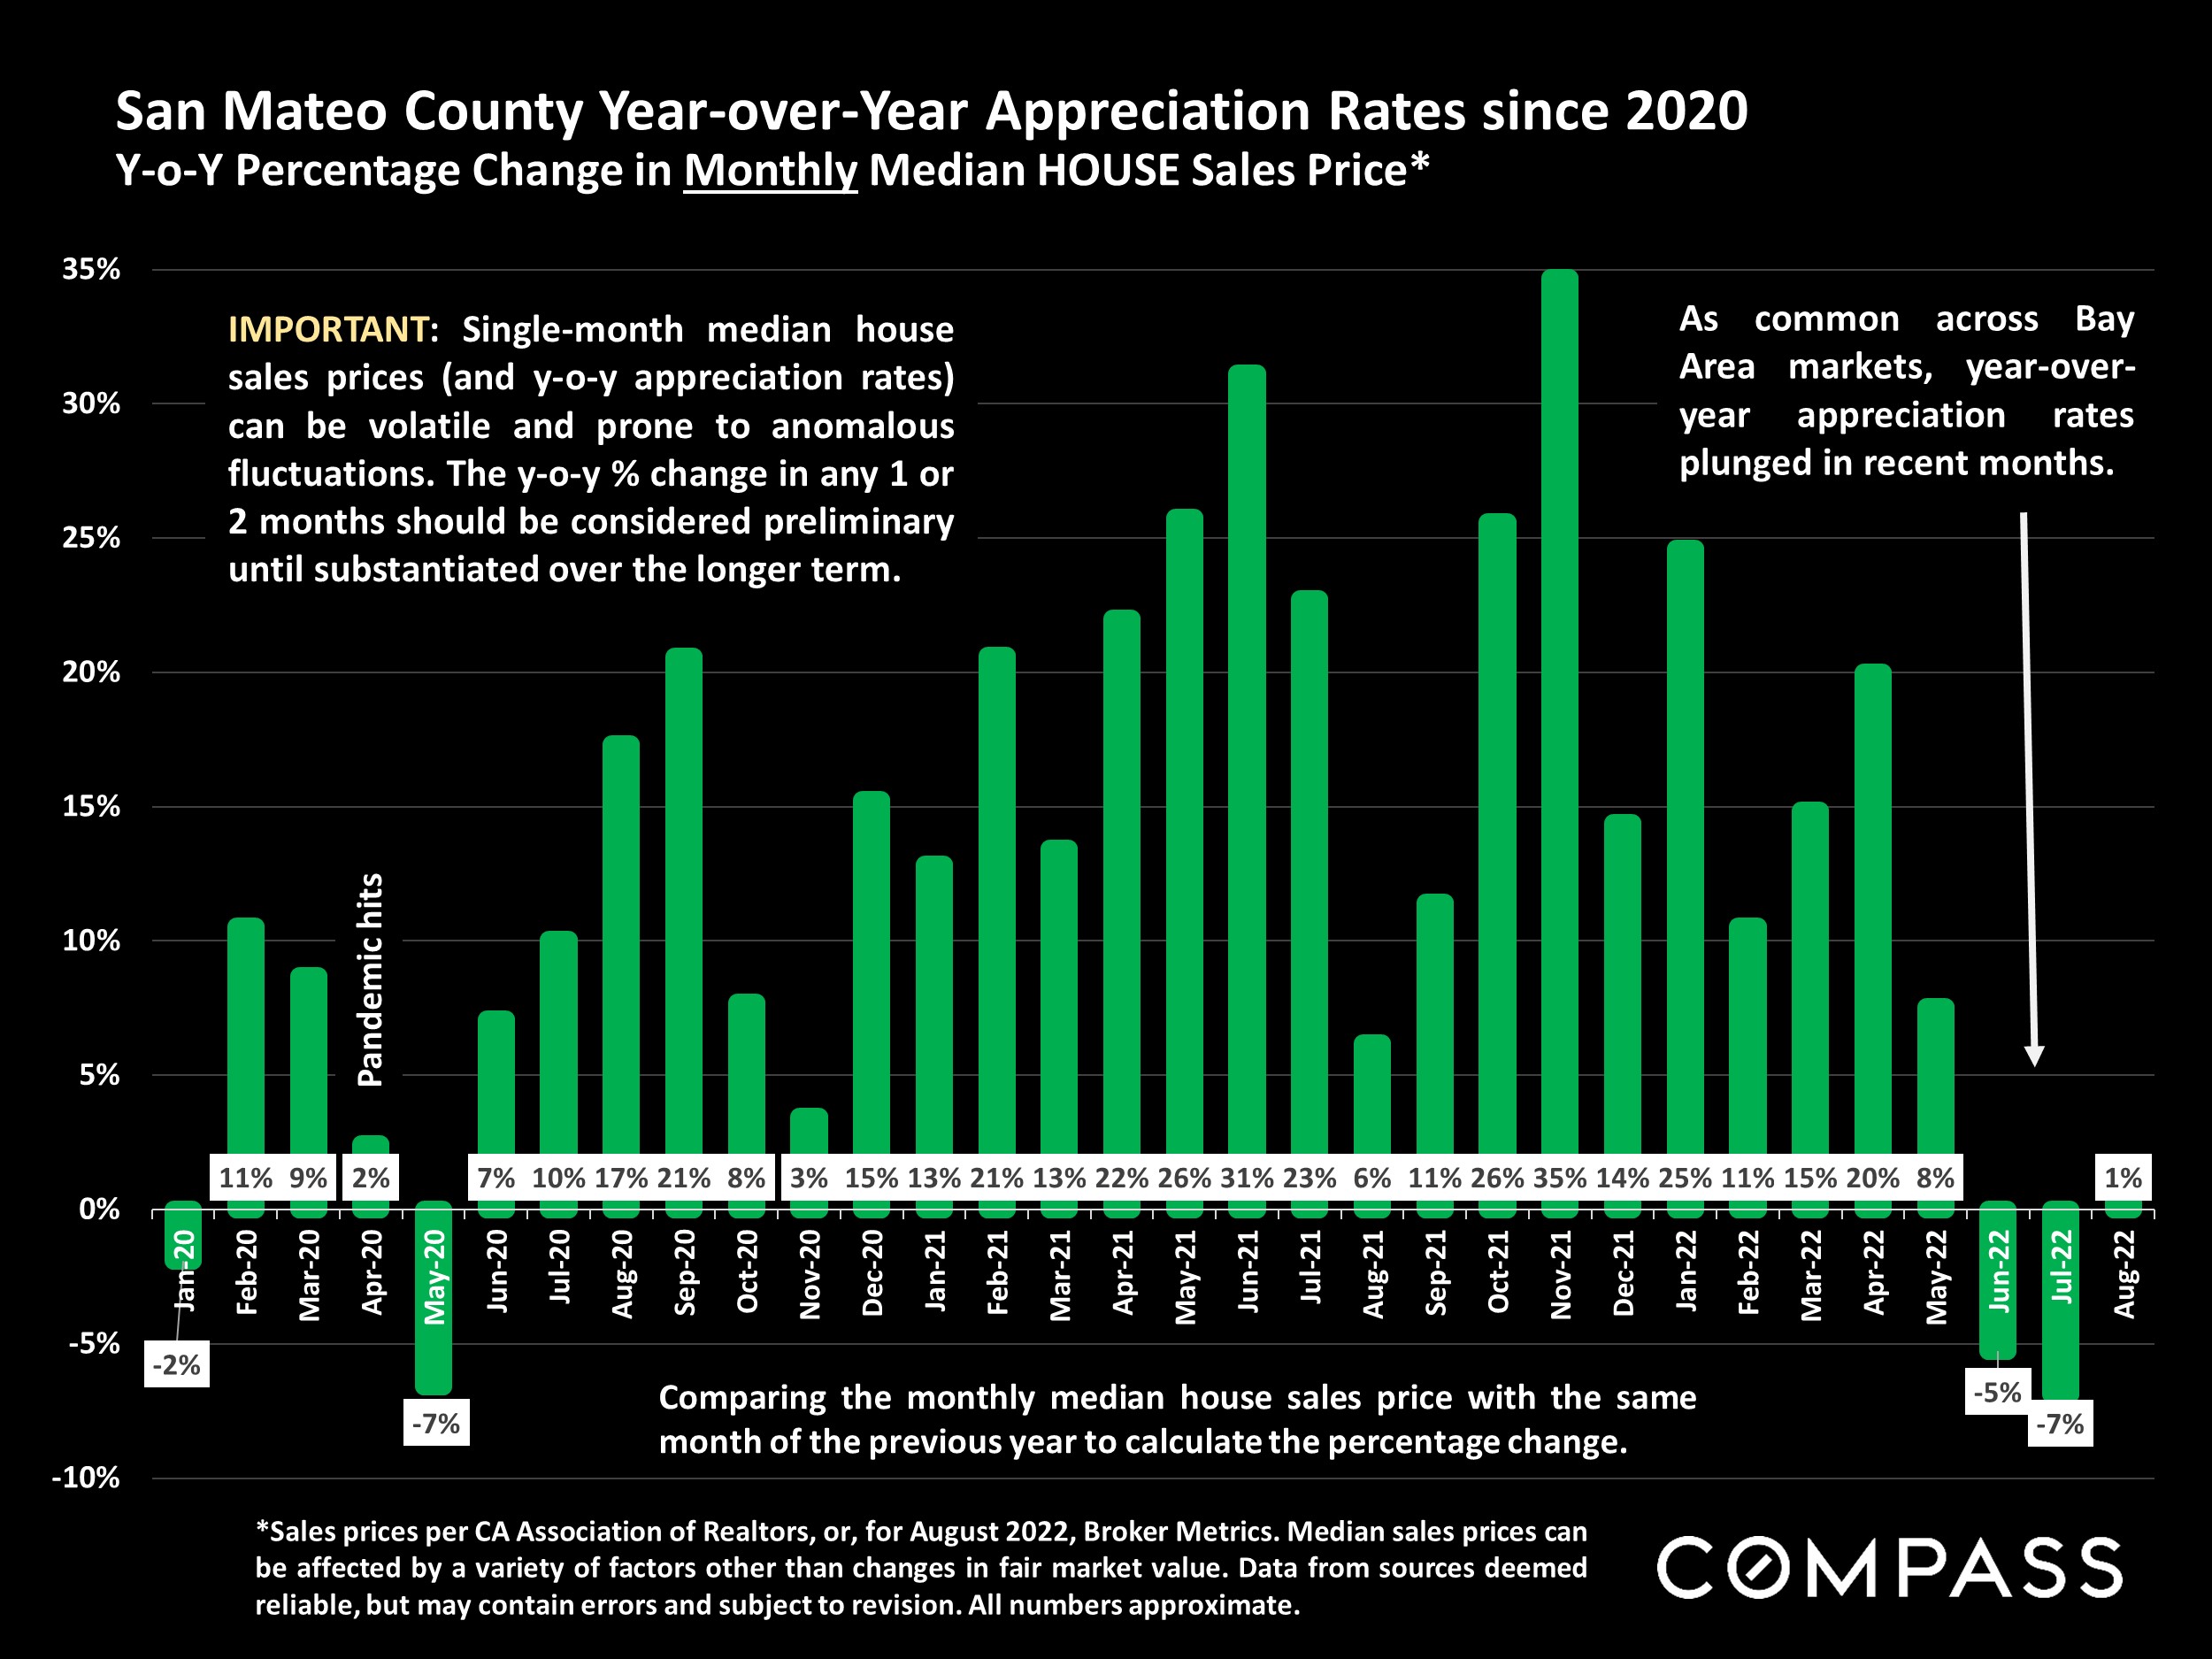
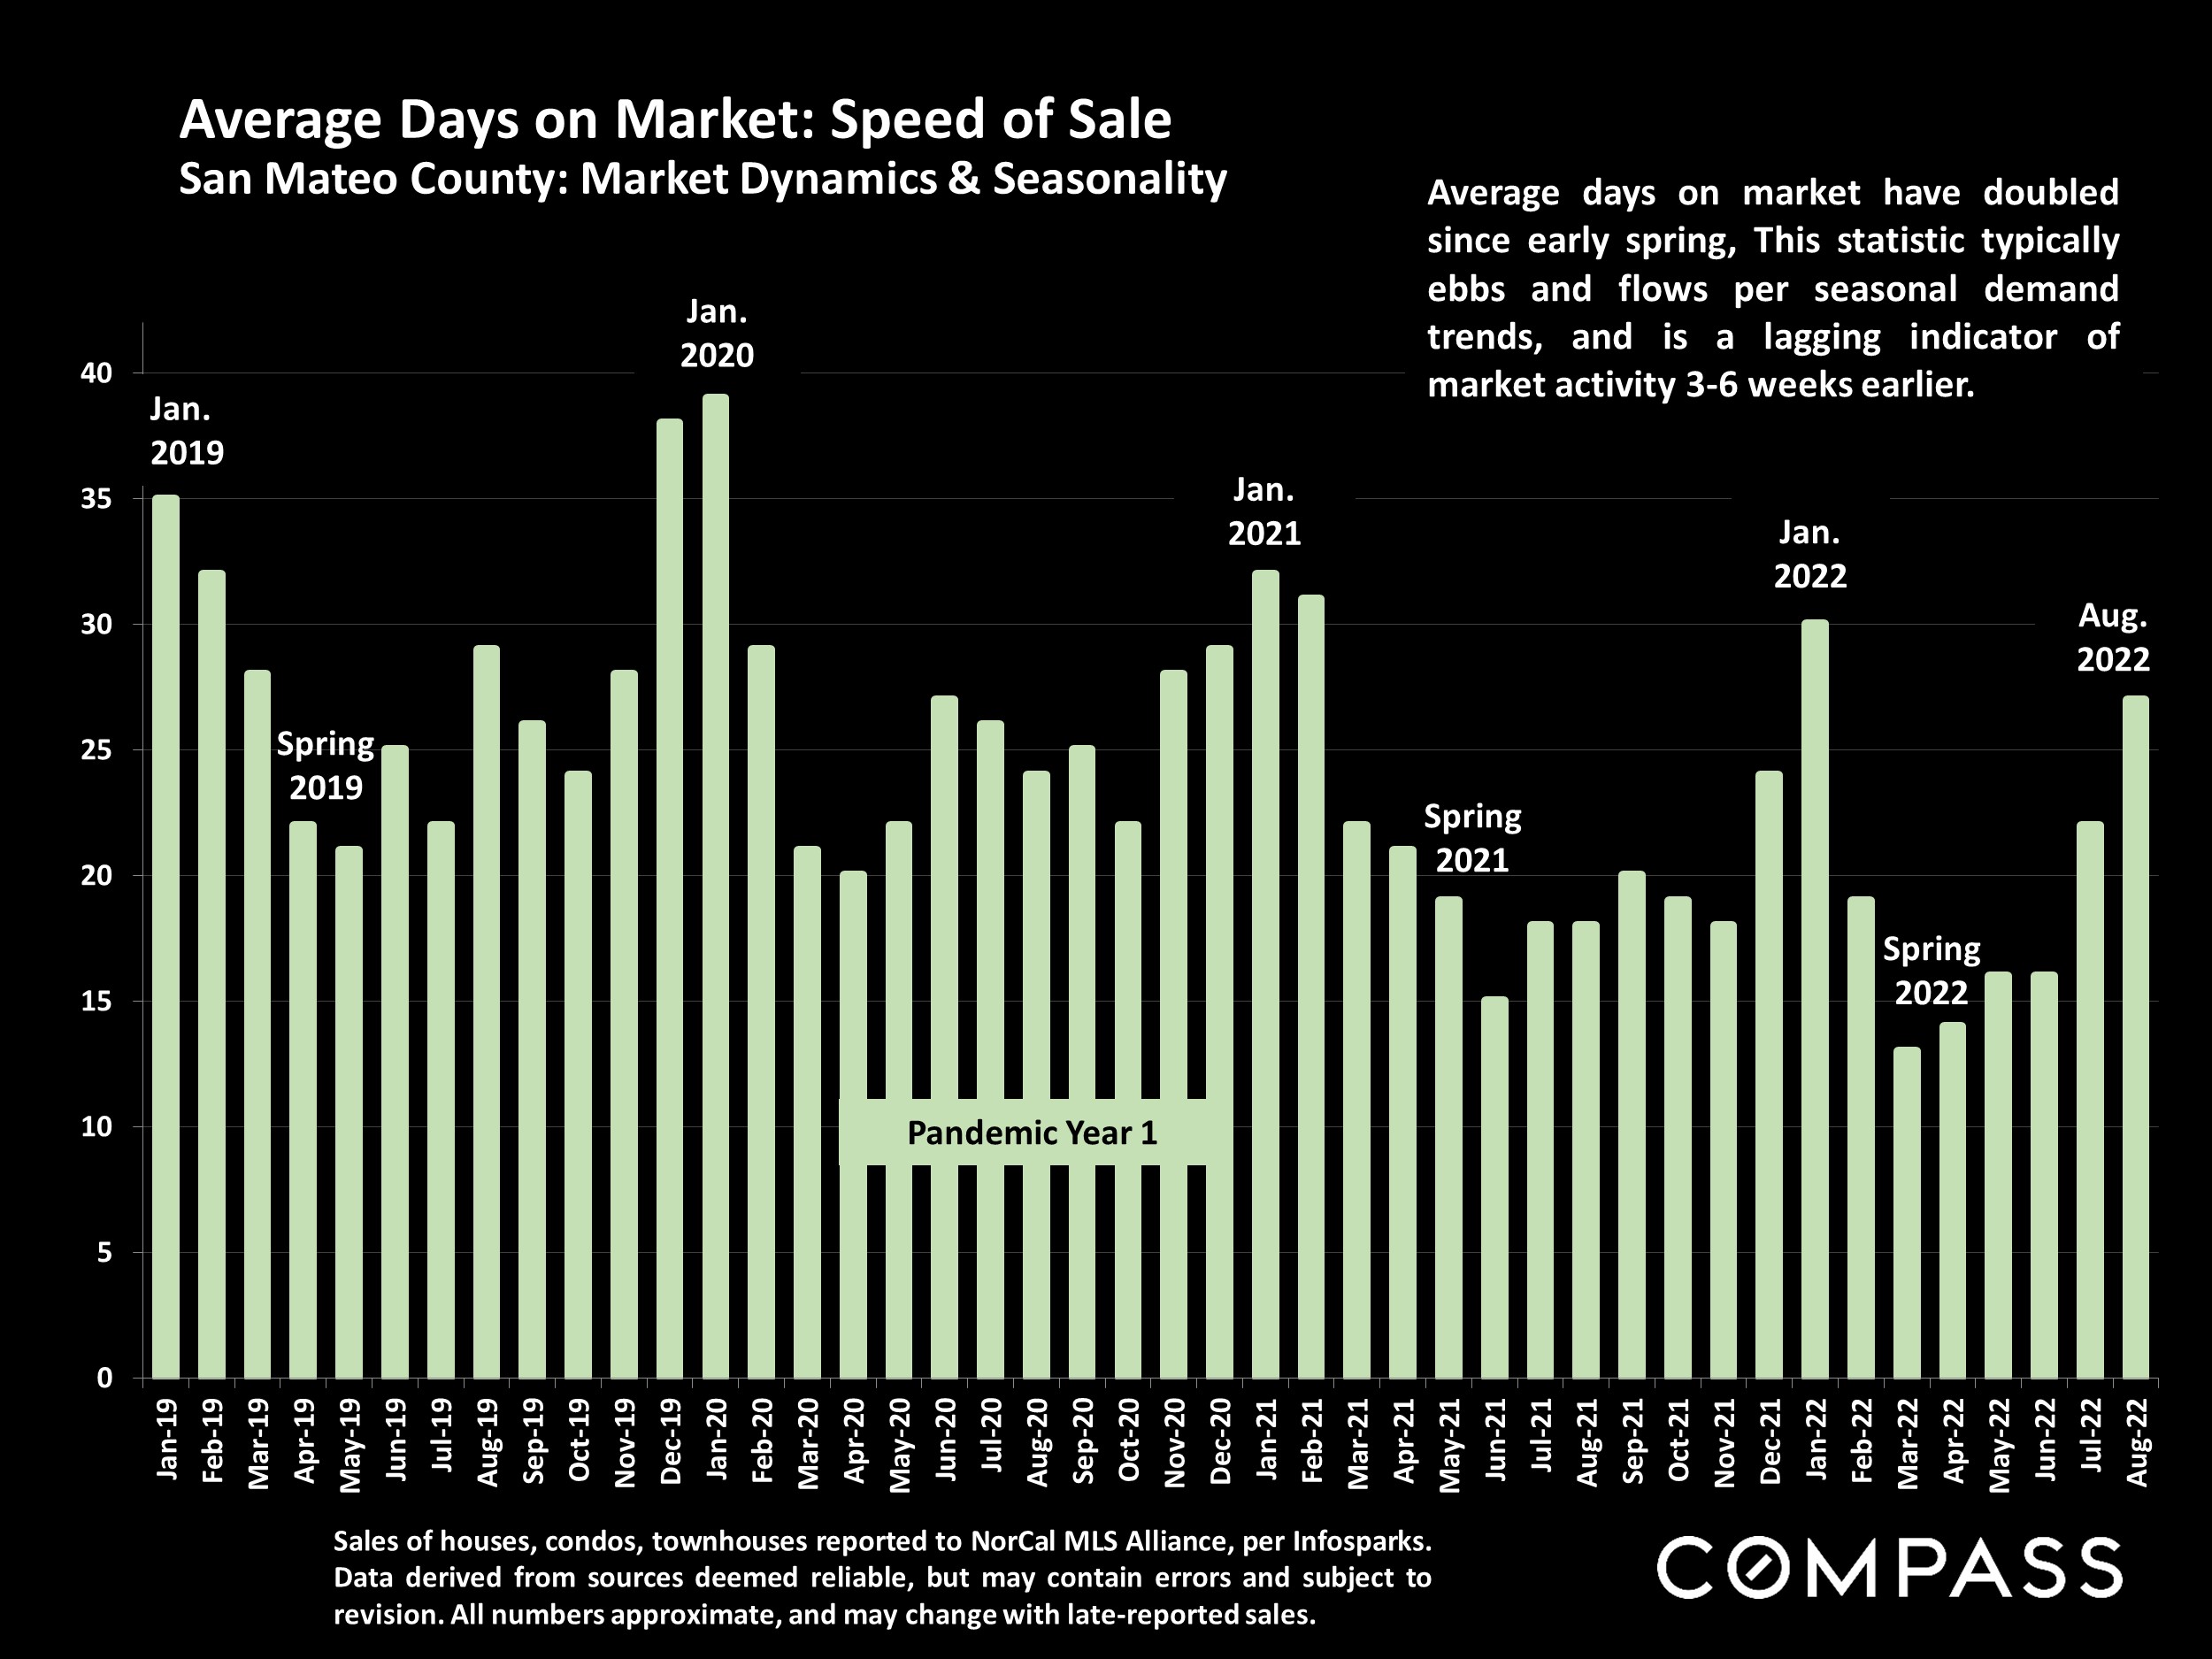
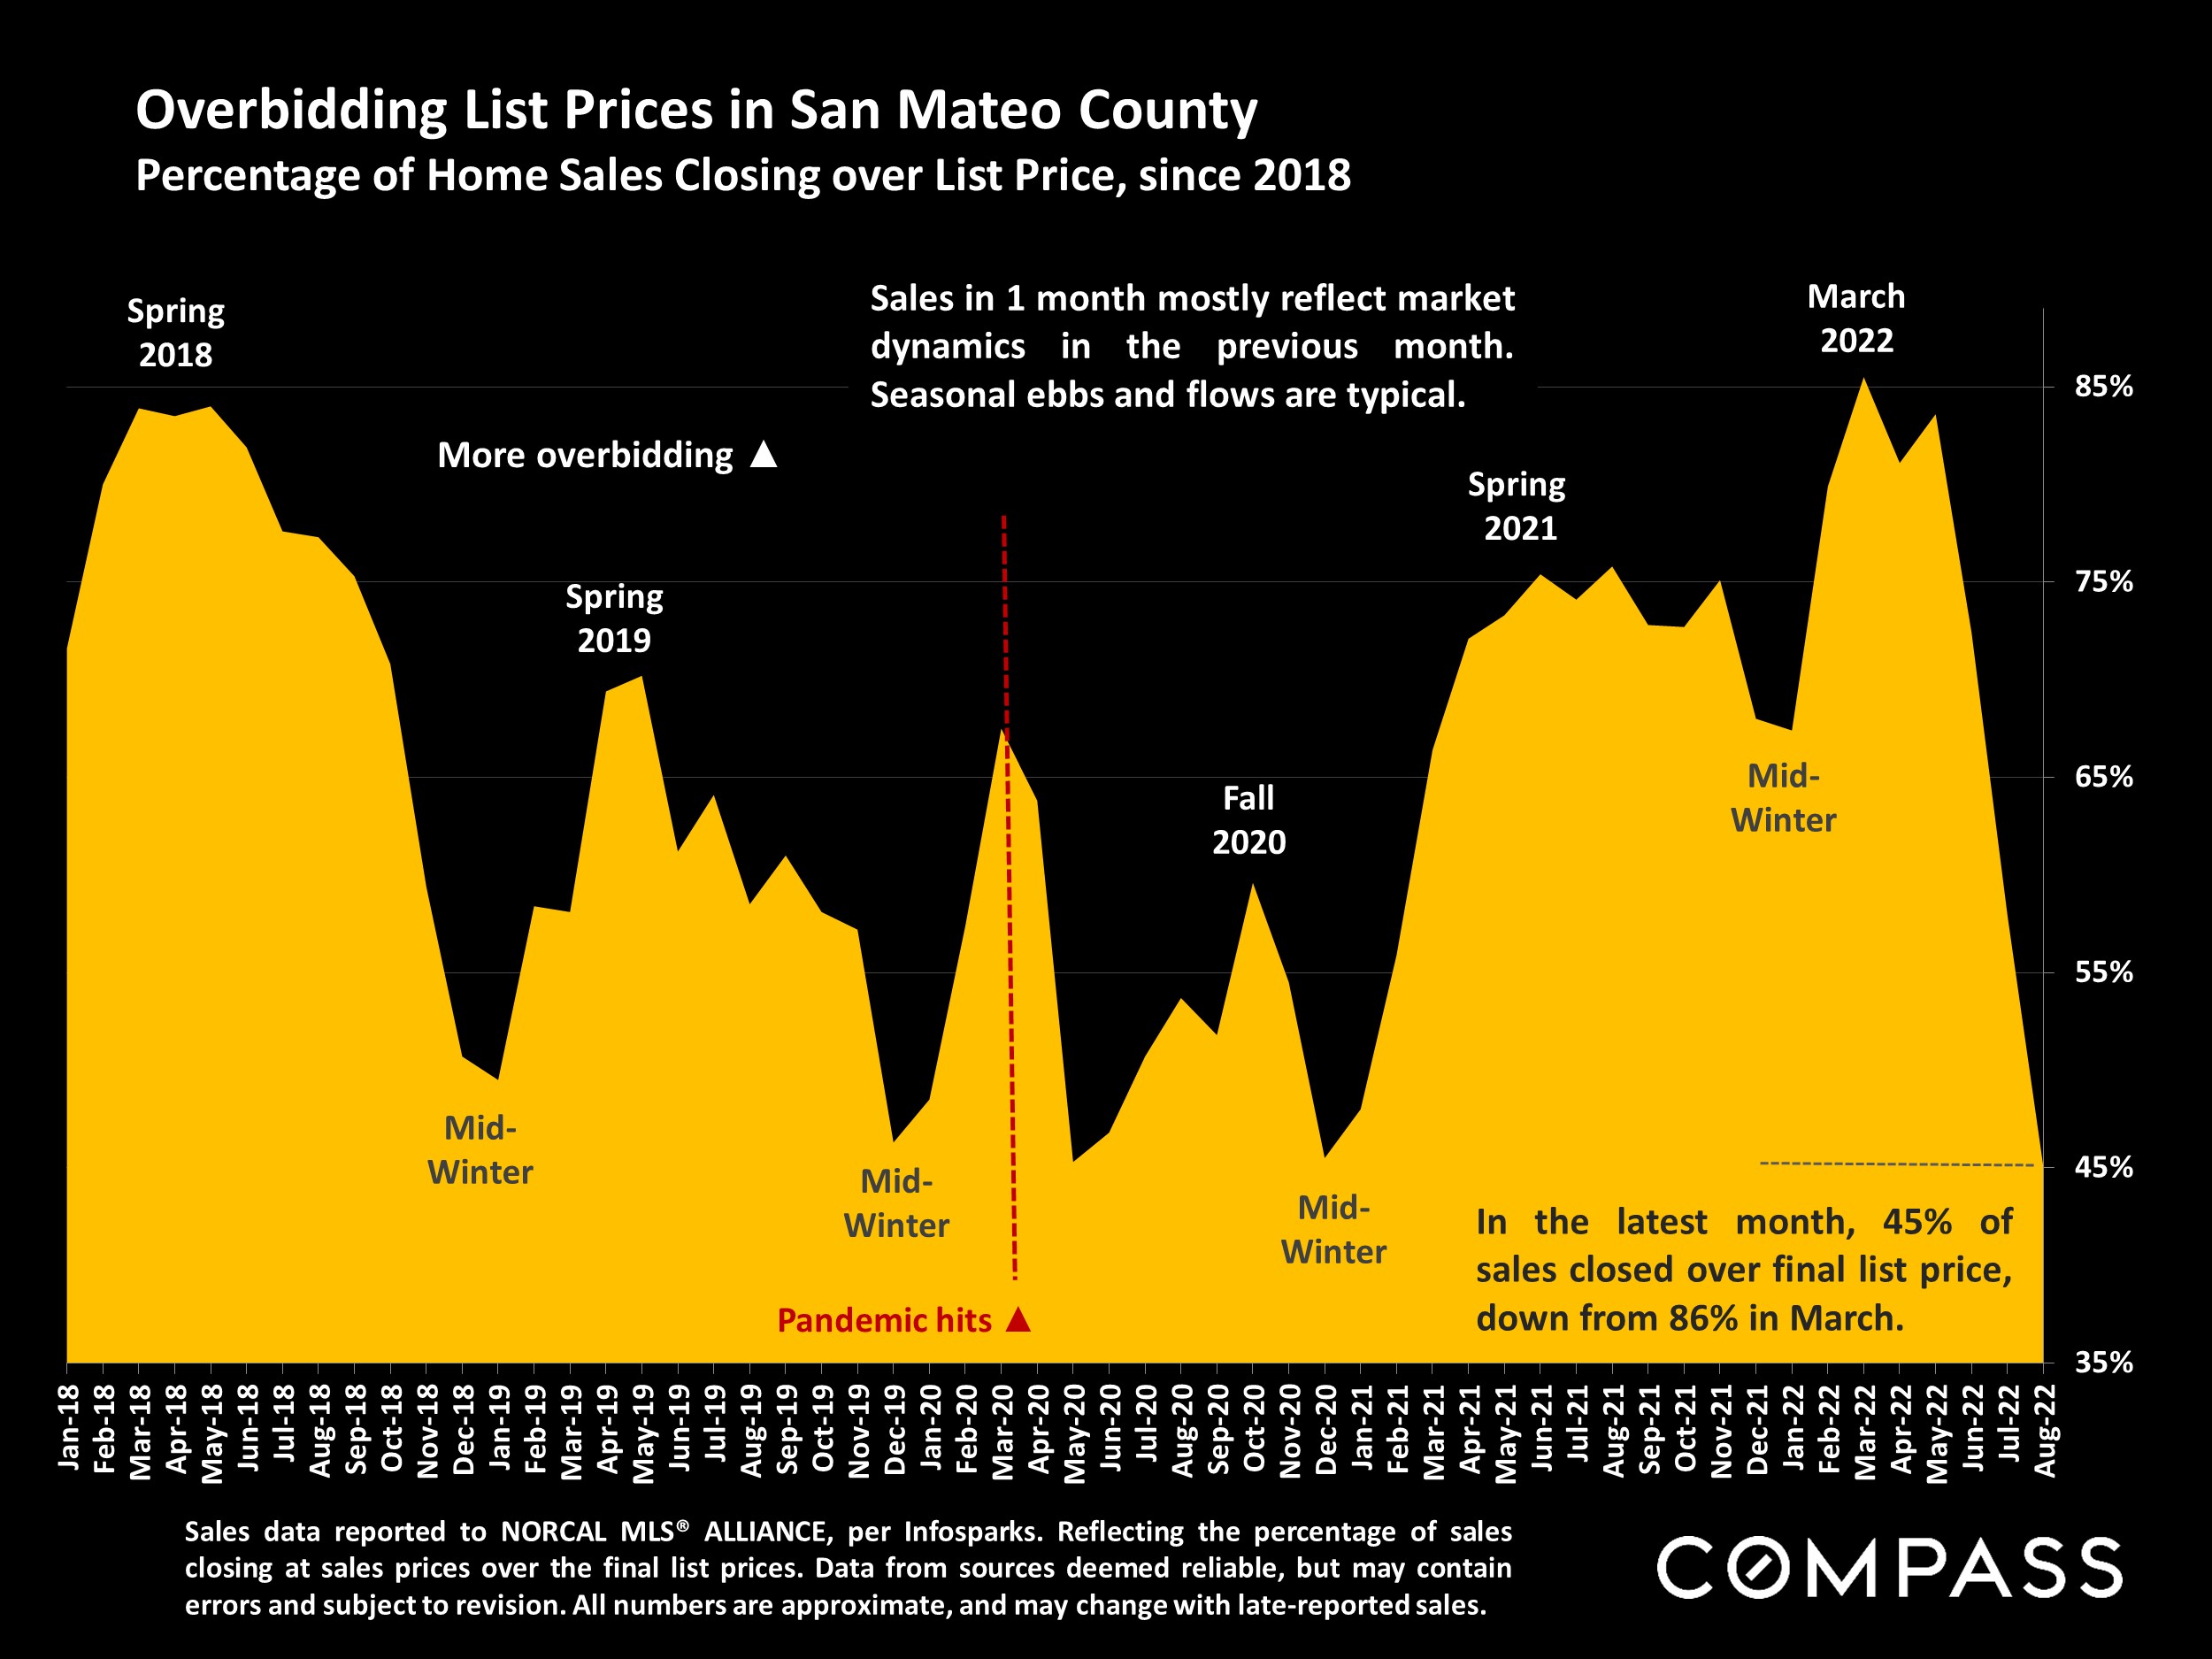
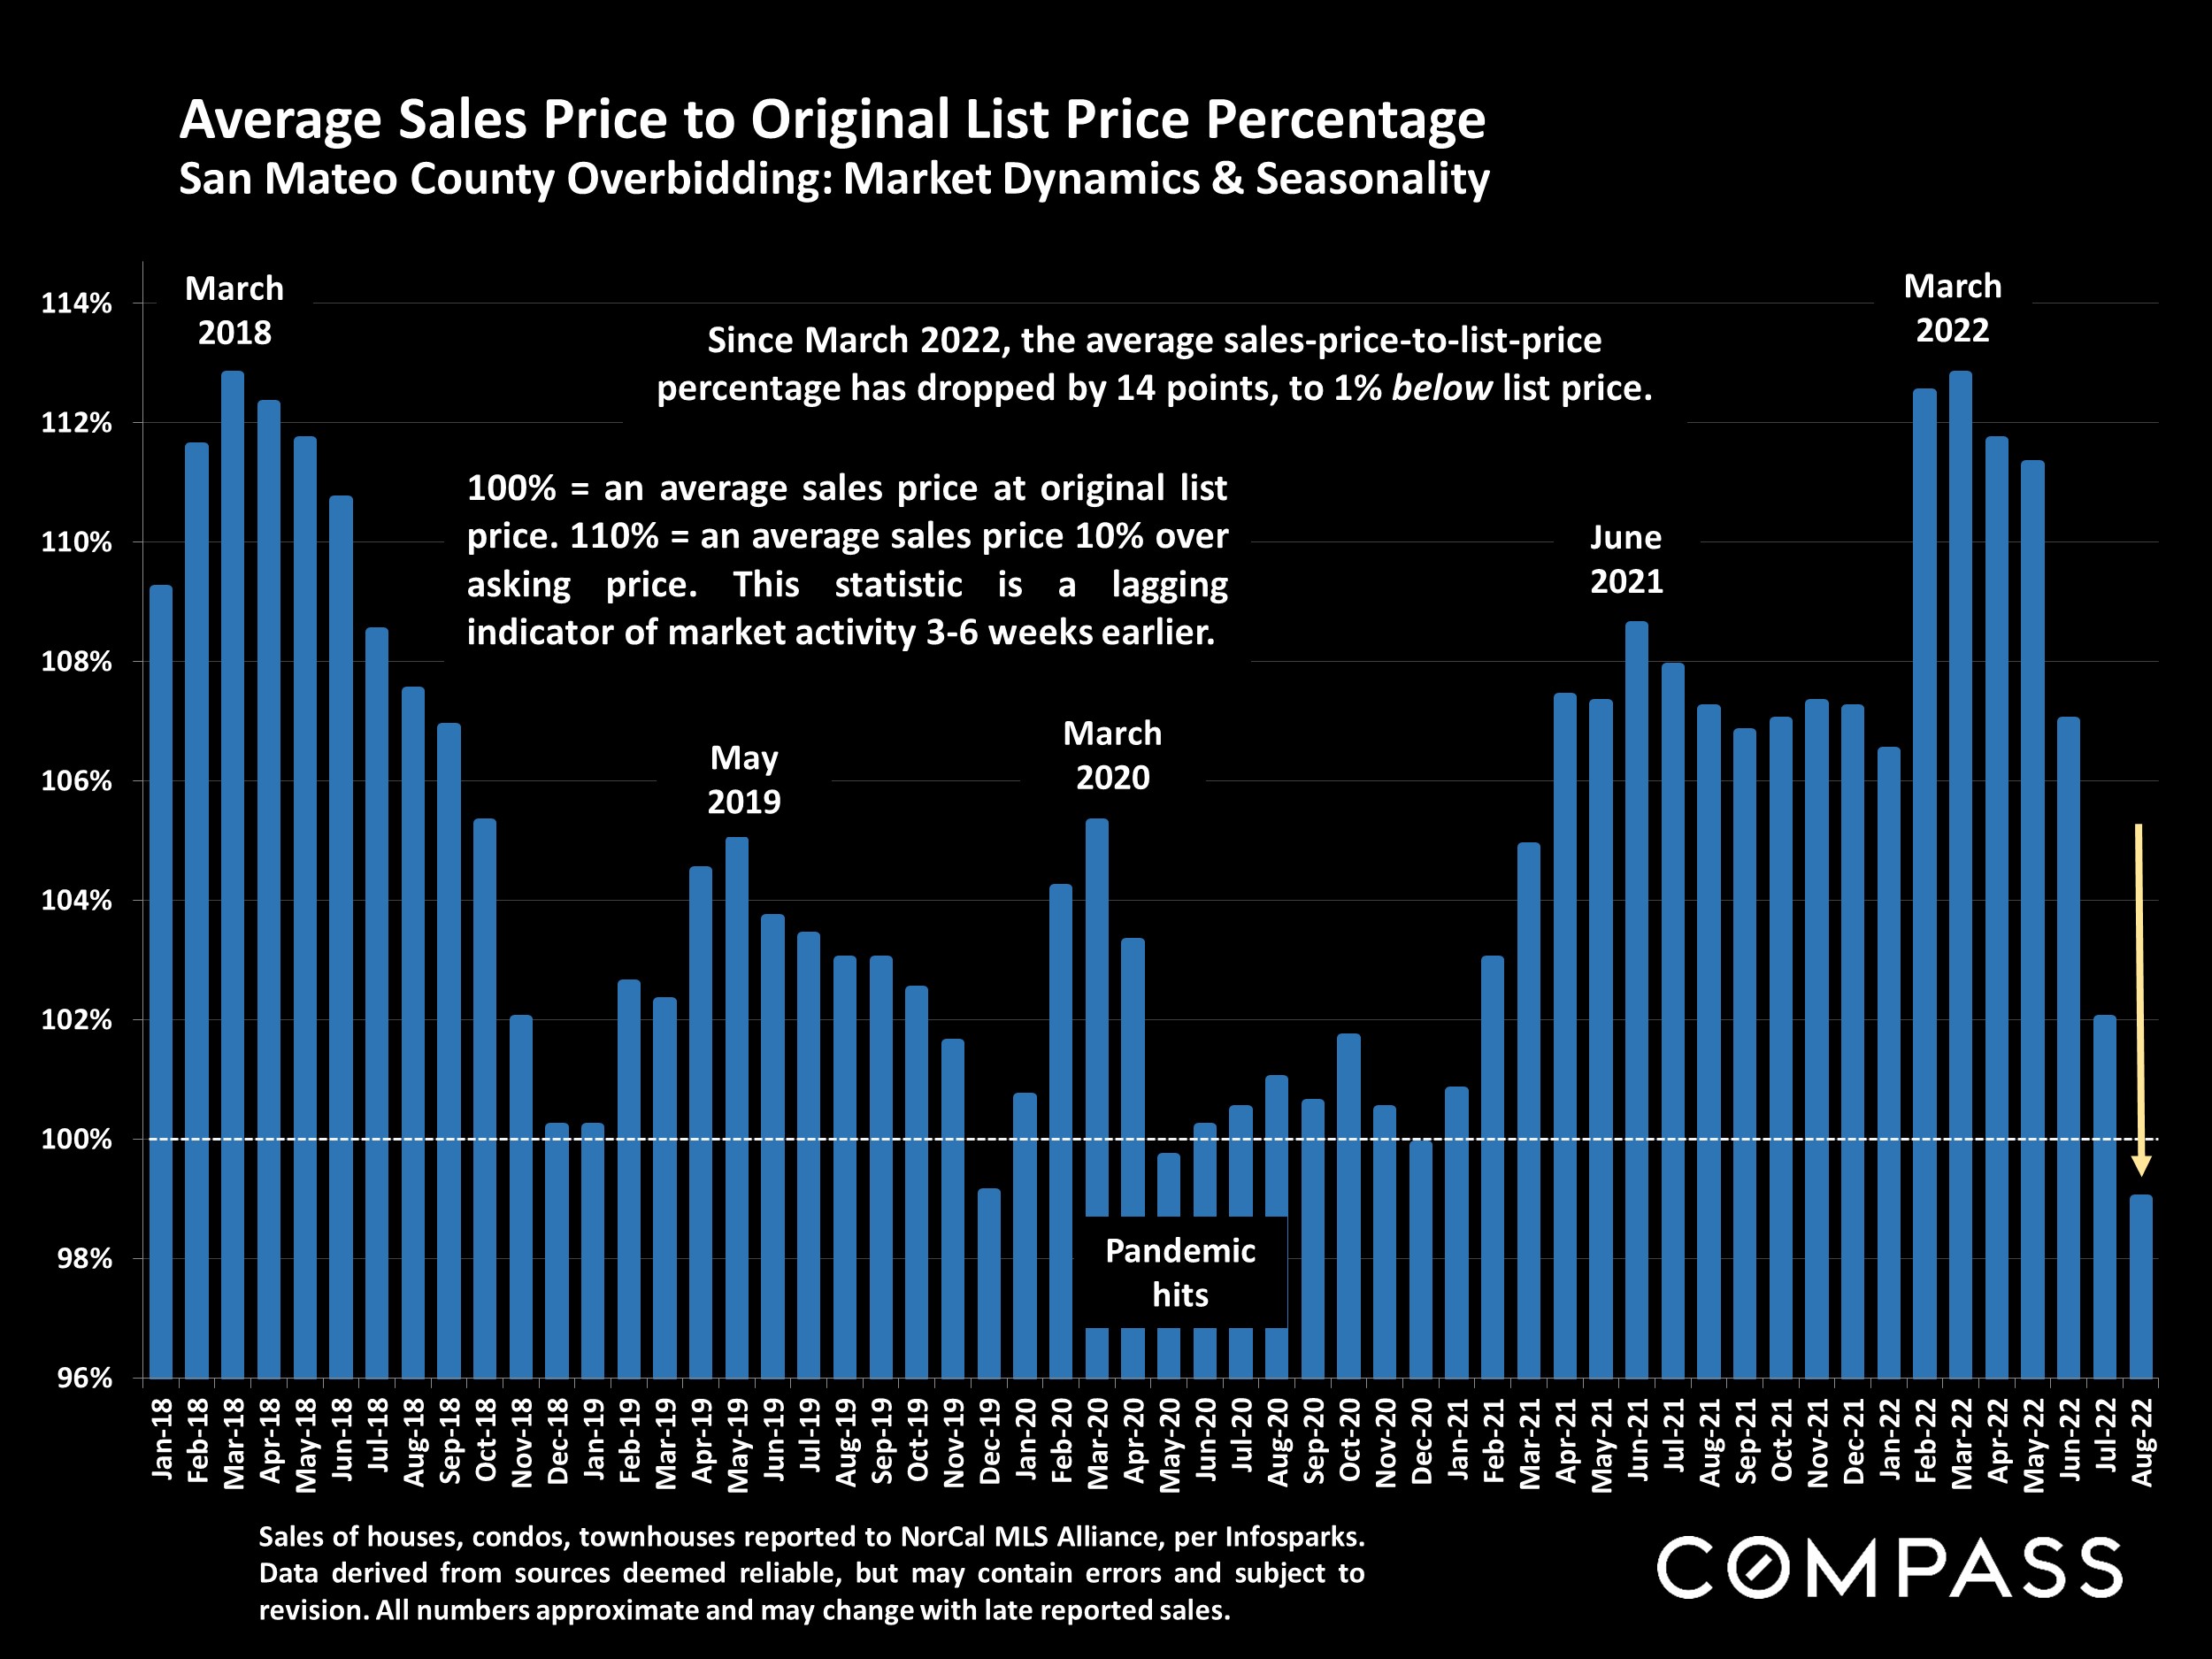
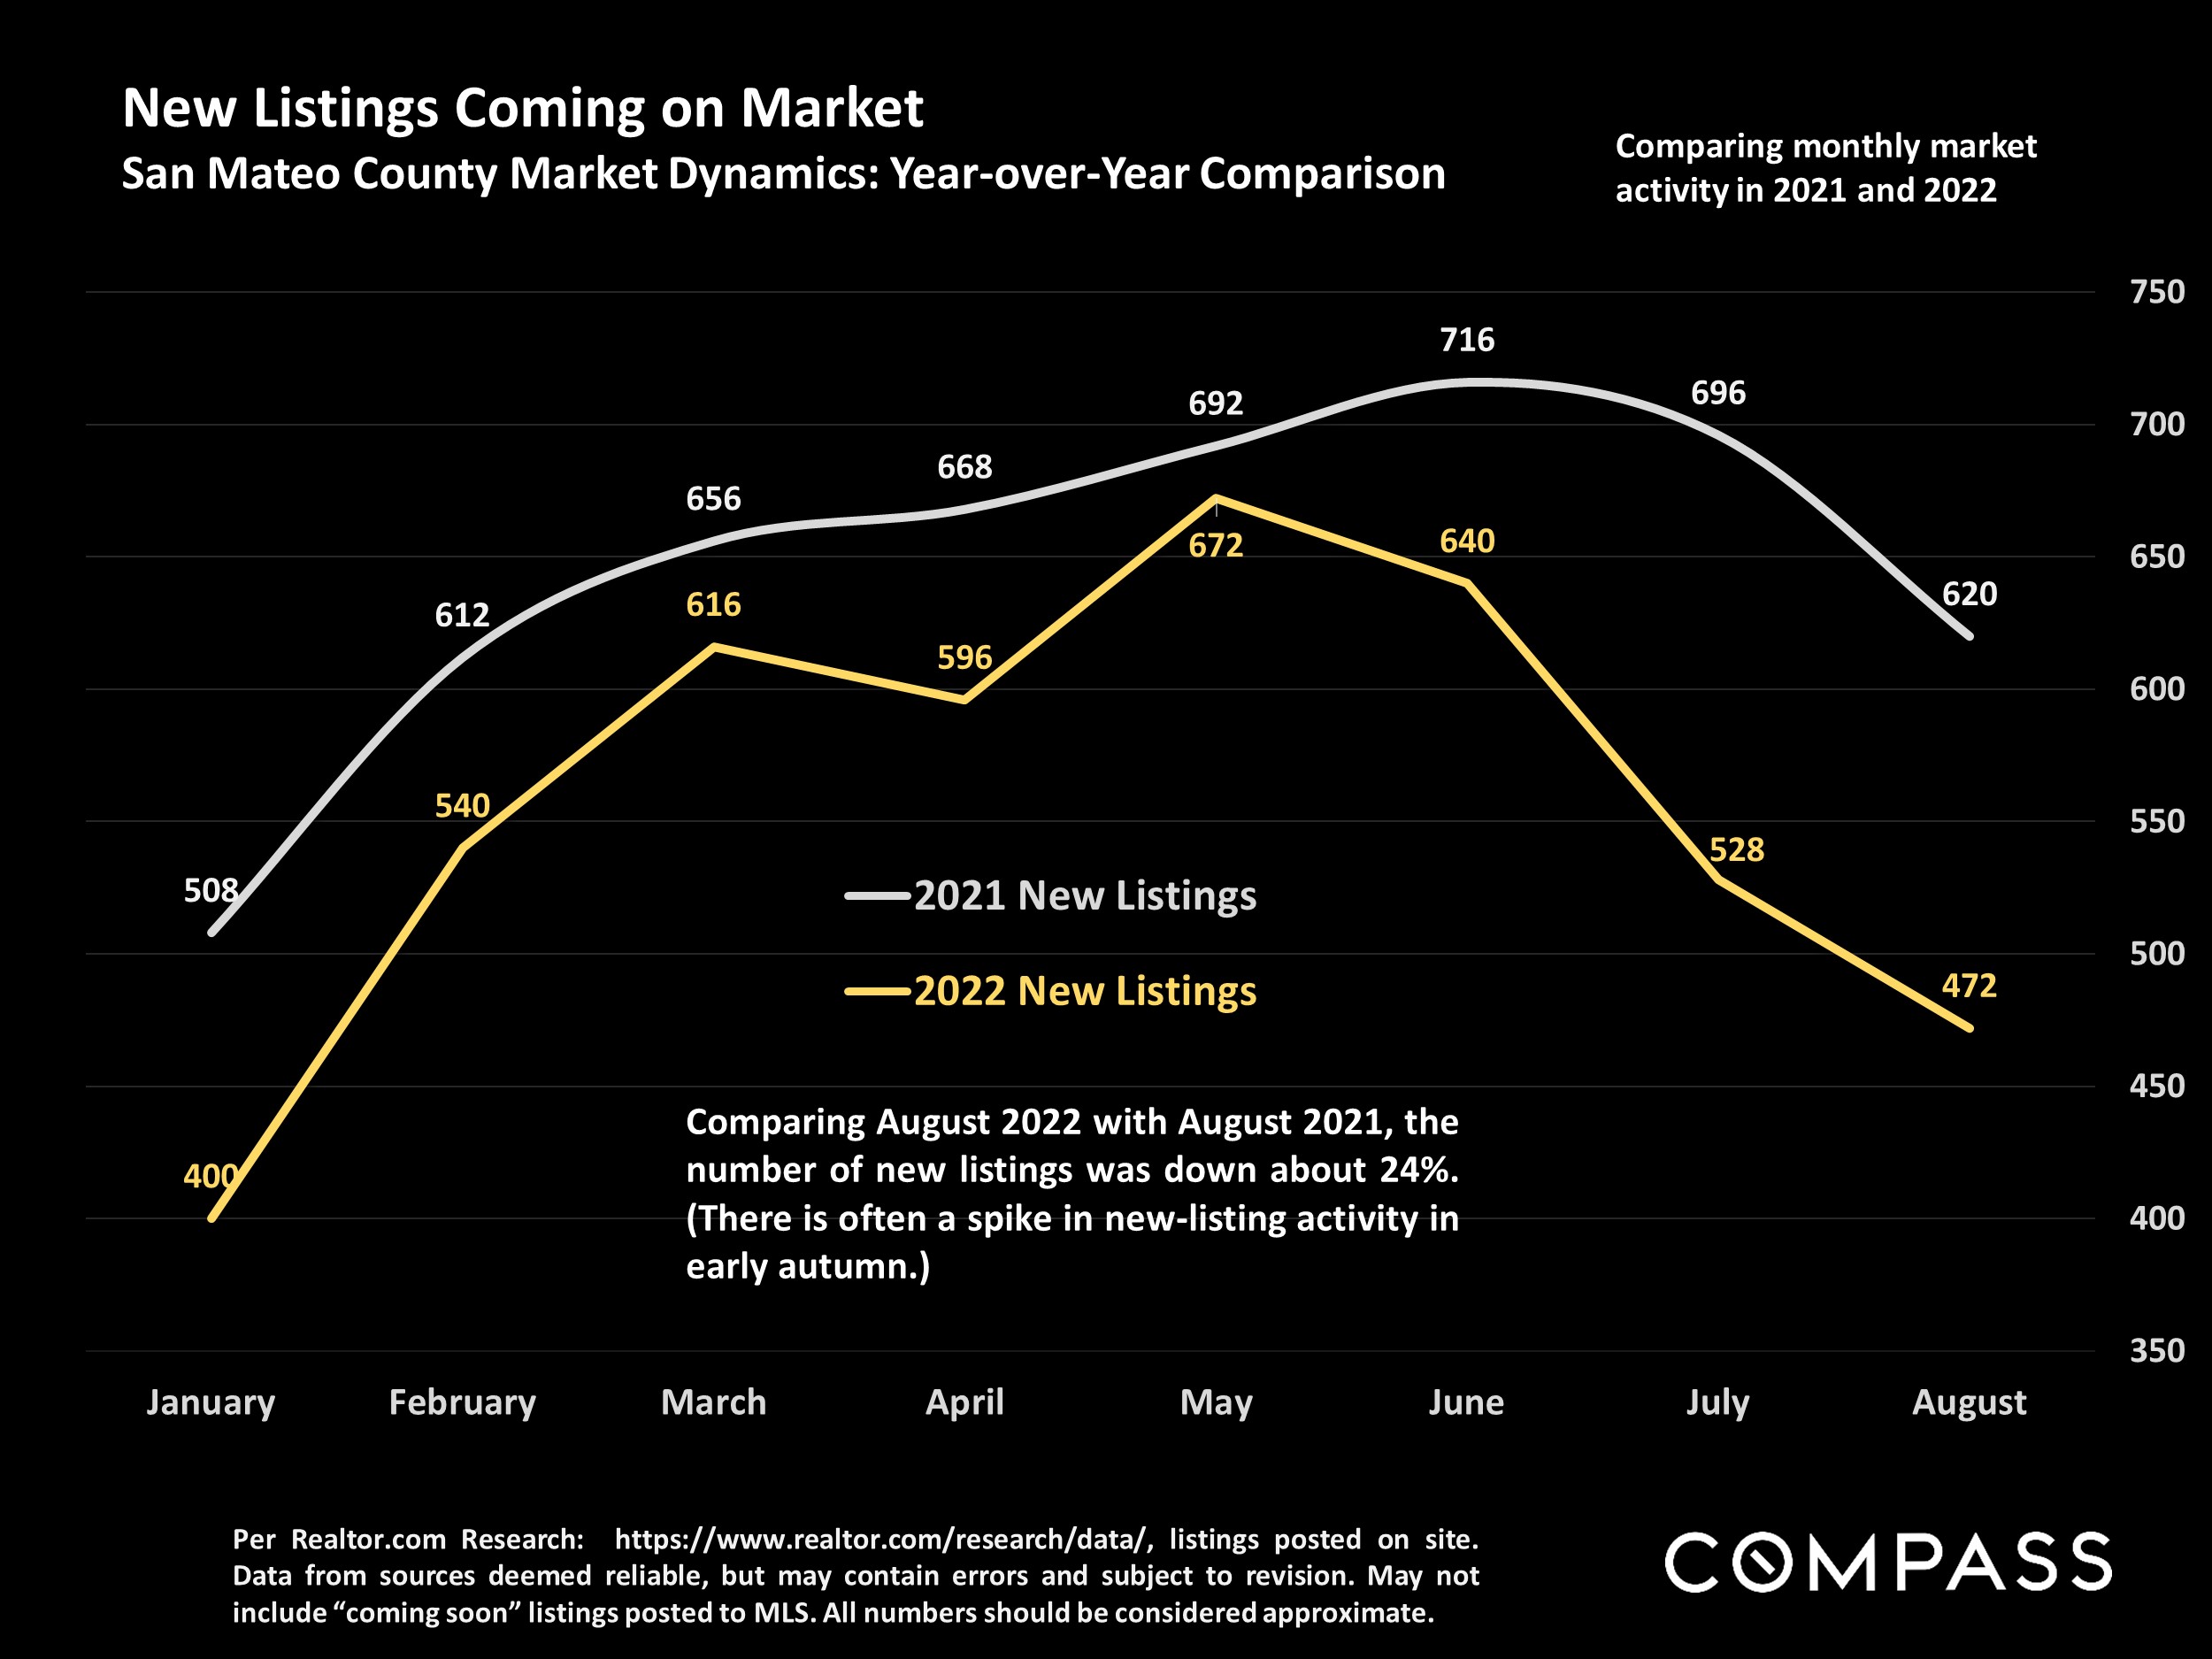
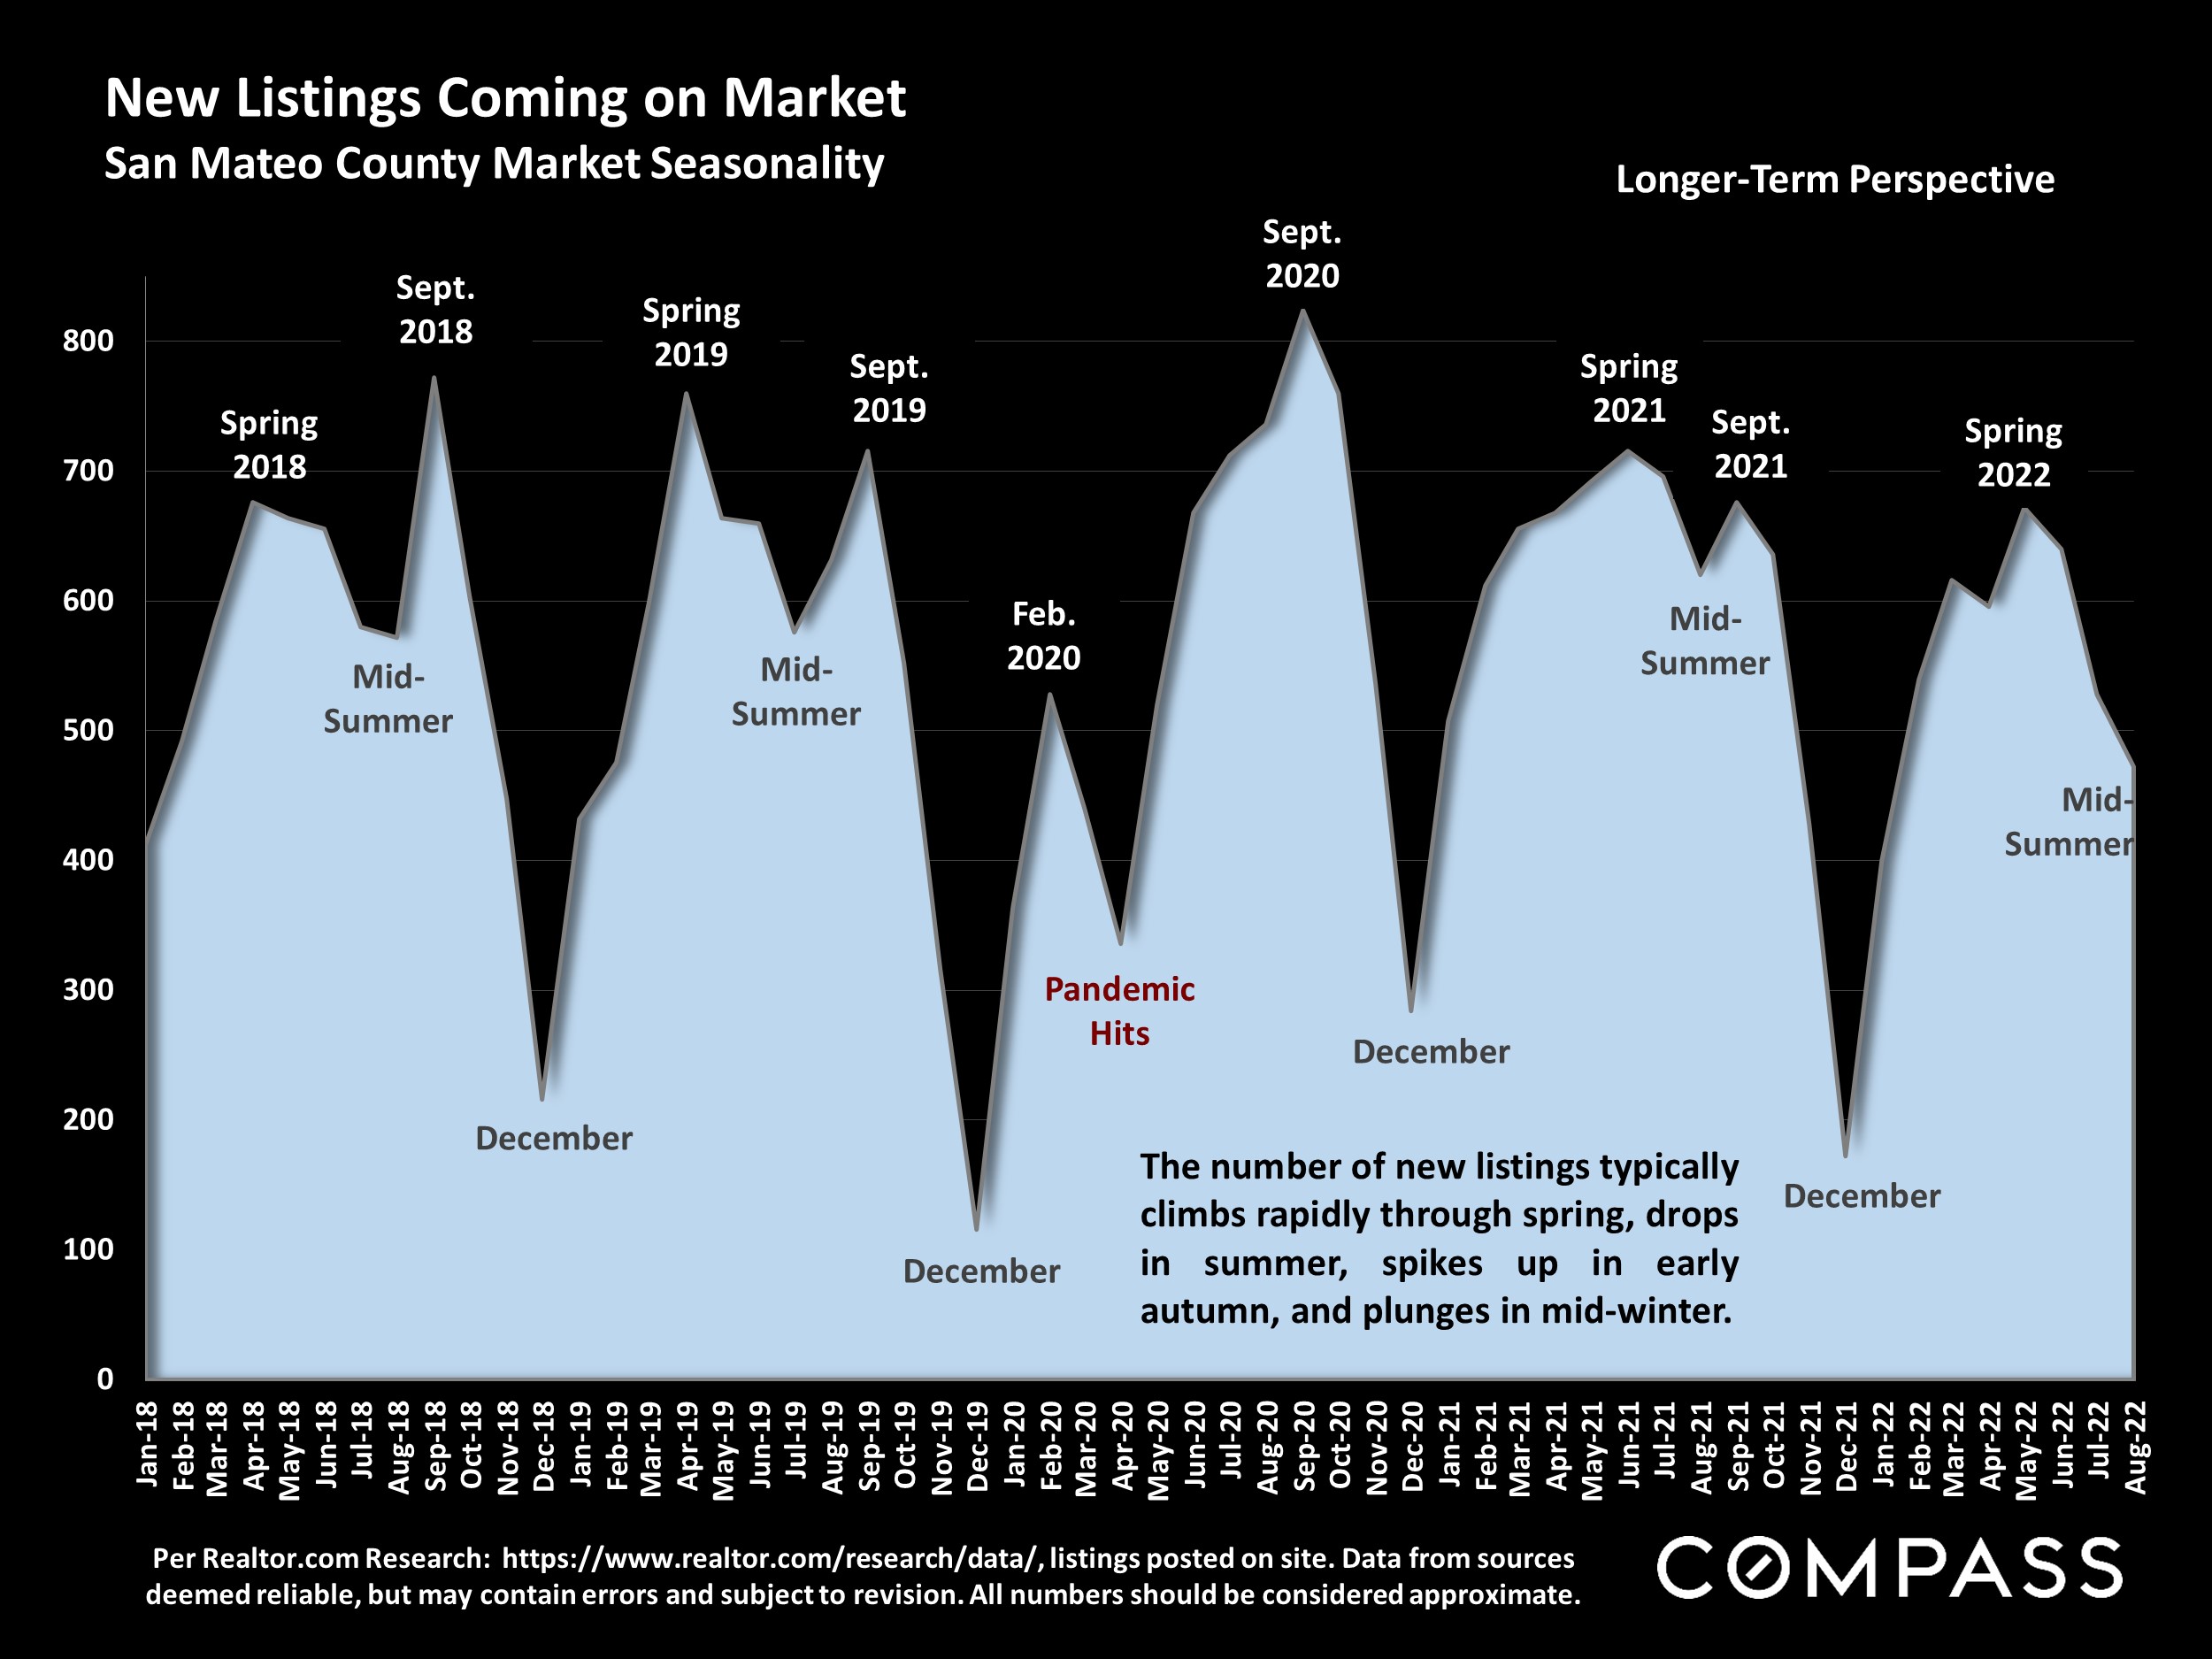
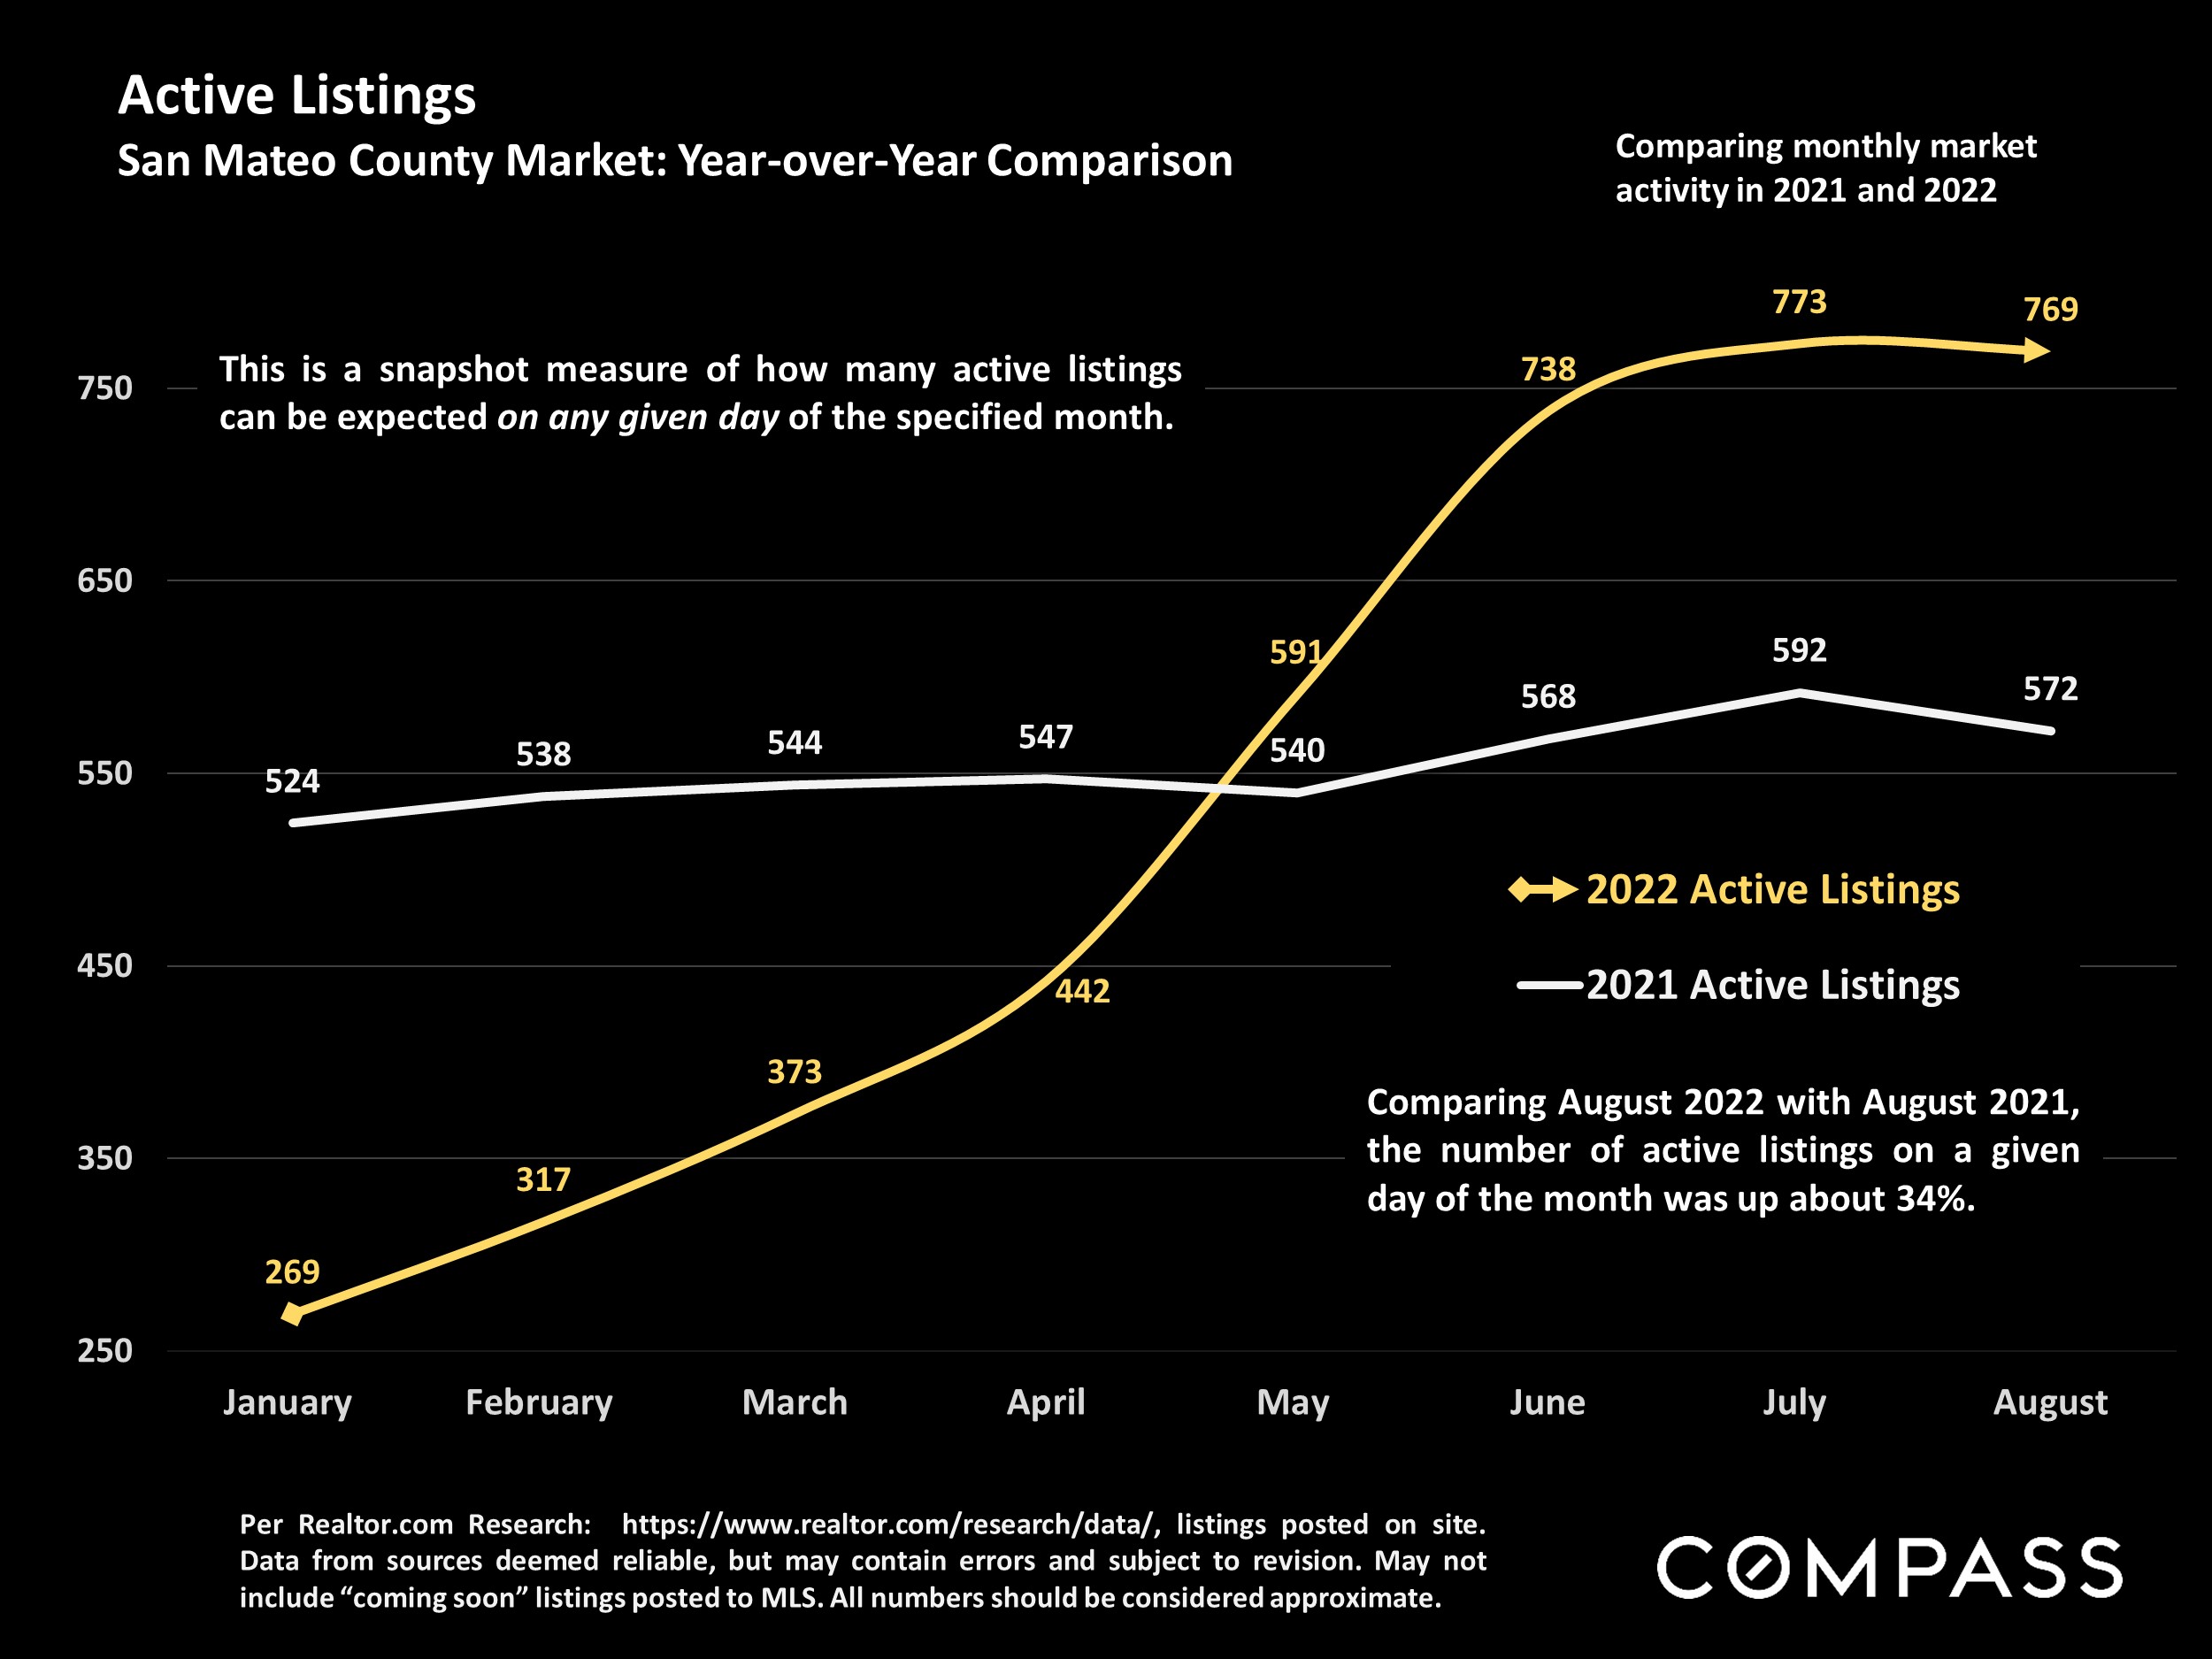
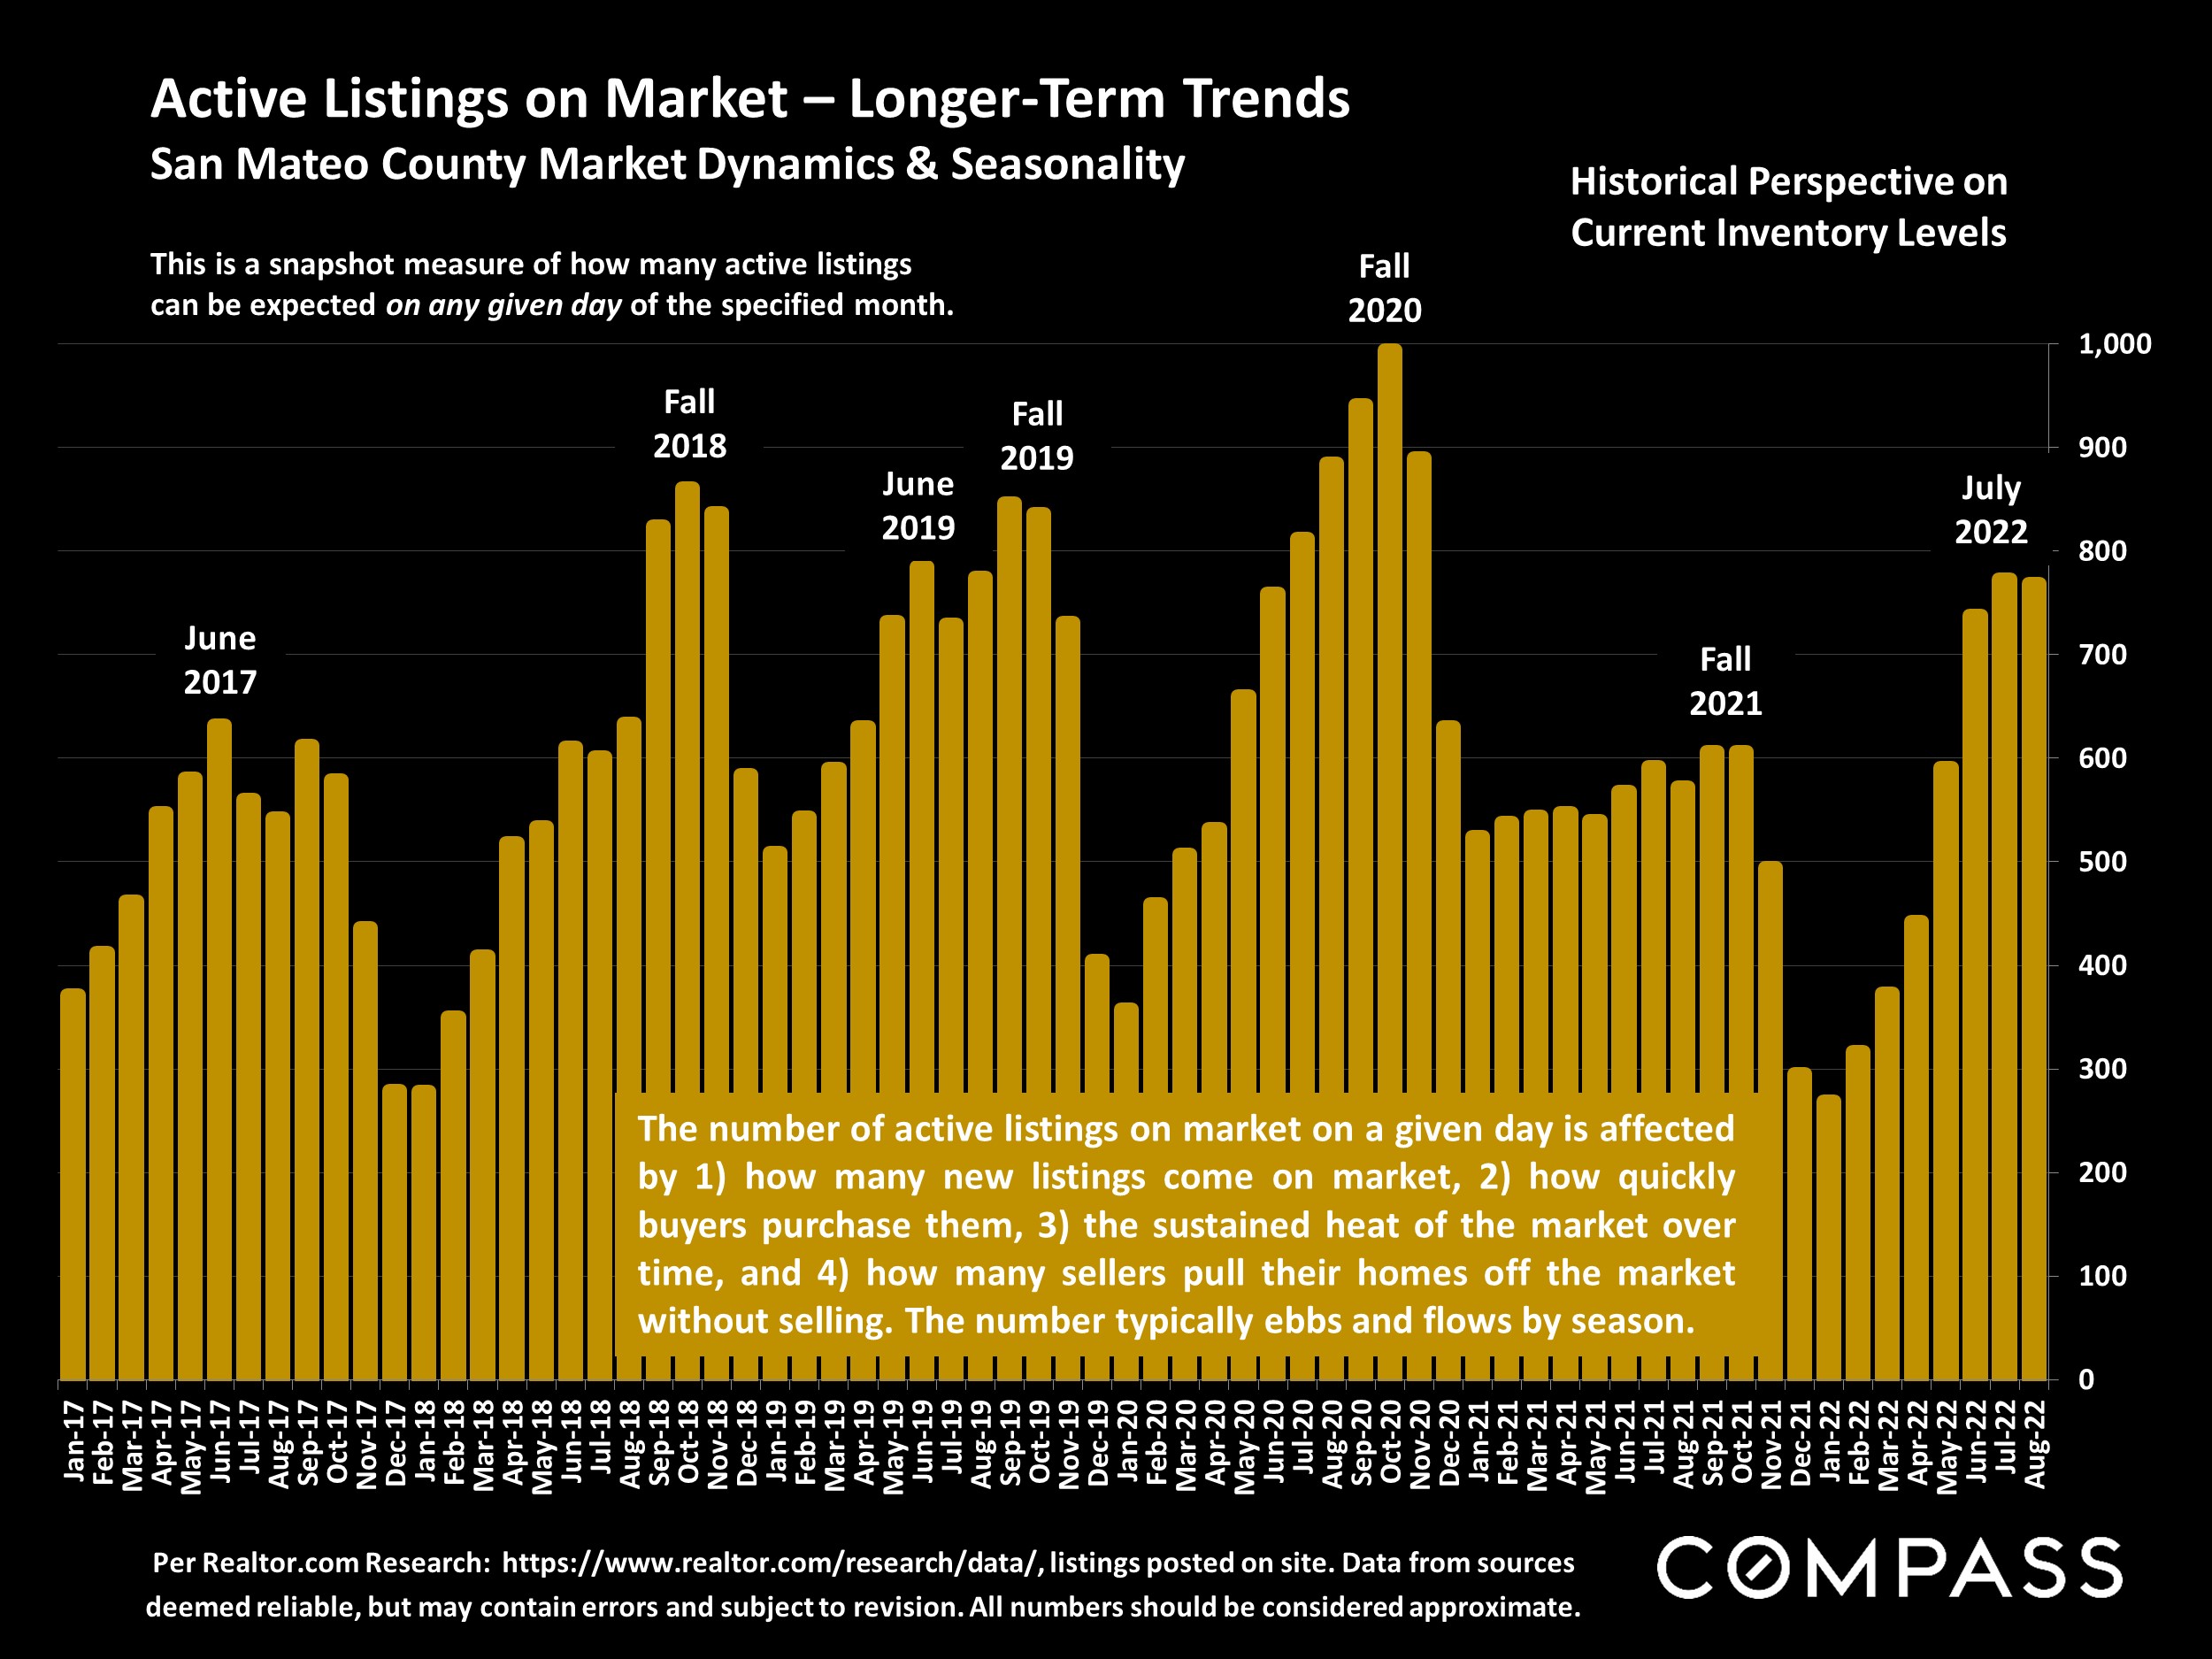
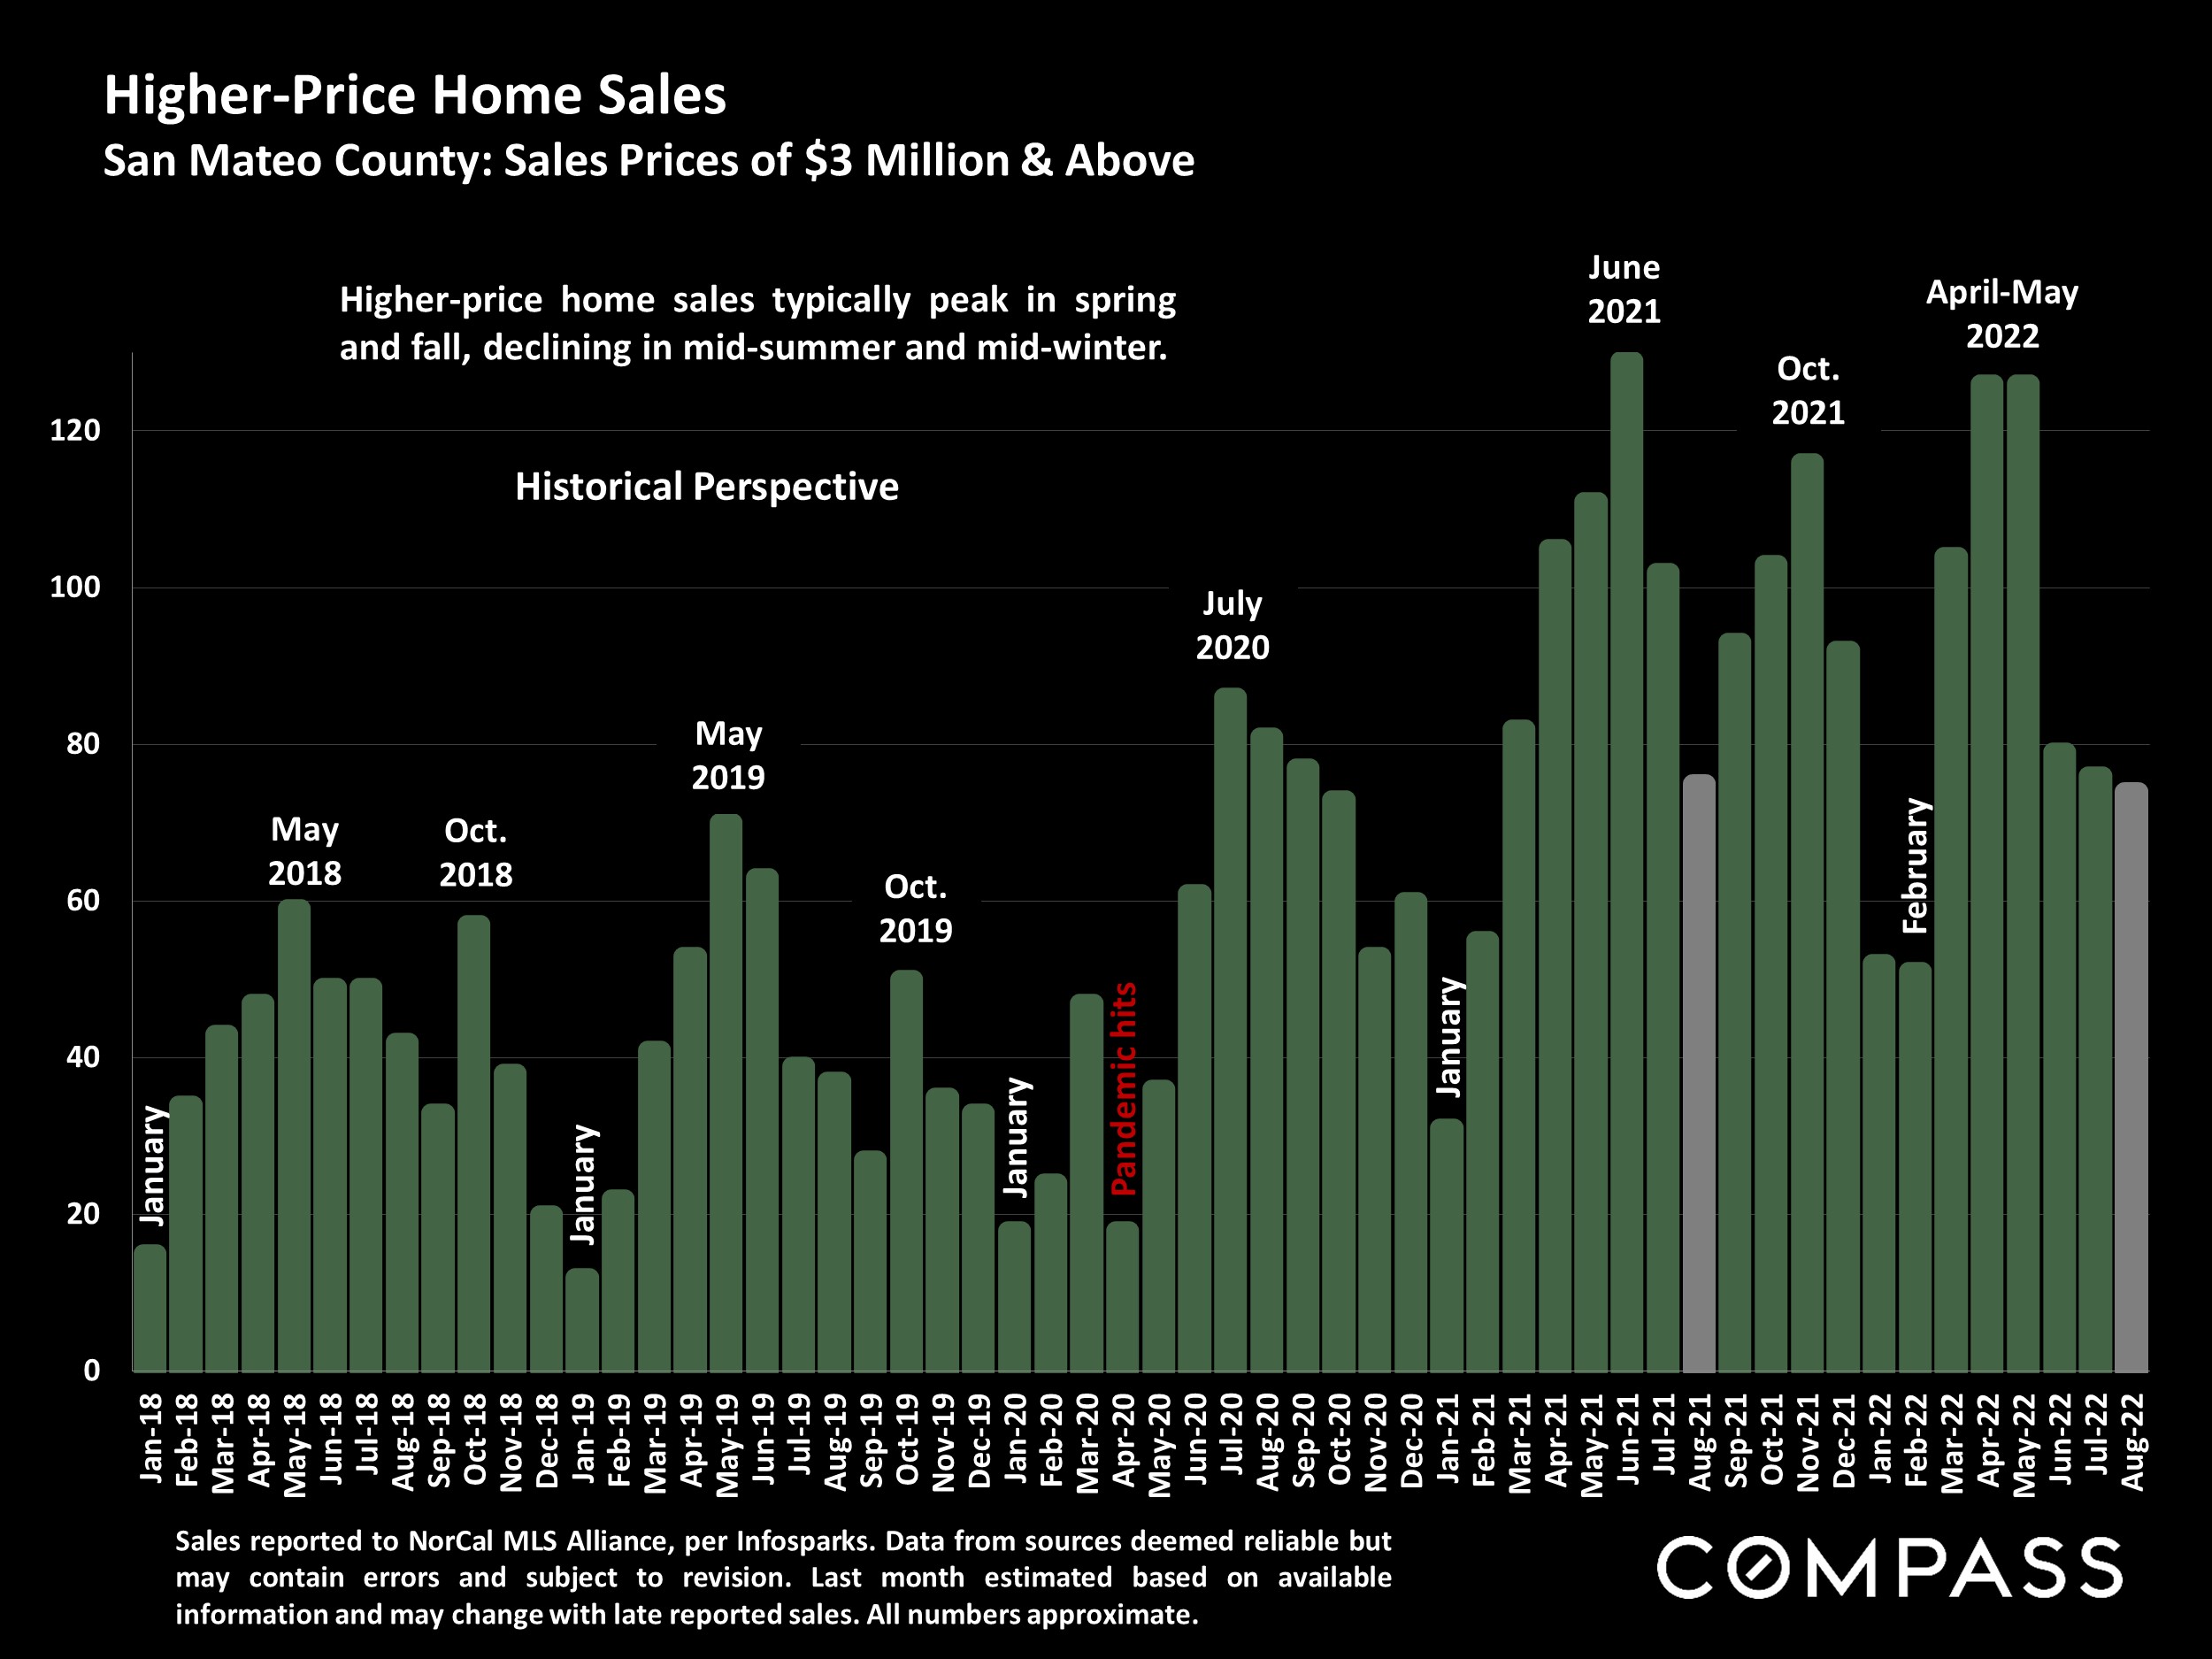
Across the Bay Area, since spring, year-over-year, home-price appreciation rates and overbidding statistics have generally plunged, and days-on-market rapidly climbed. In the midst of the prevailing uncertainty, many sellers have pulled back on listing their homes, with the number of new listings coming on market remaining well down year over year. In August, the number of active listings for sale dropped after 6 months of steady gains, but we may see an increase in new listing activity after Labor Day.

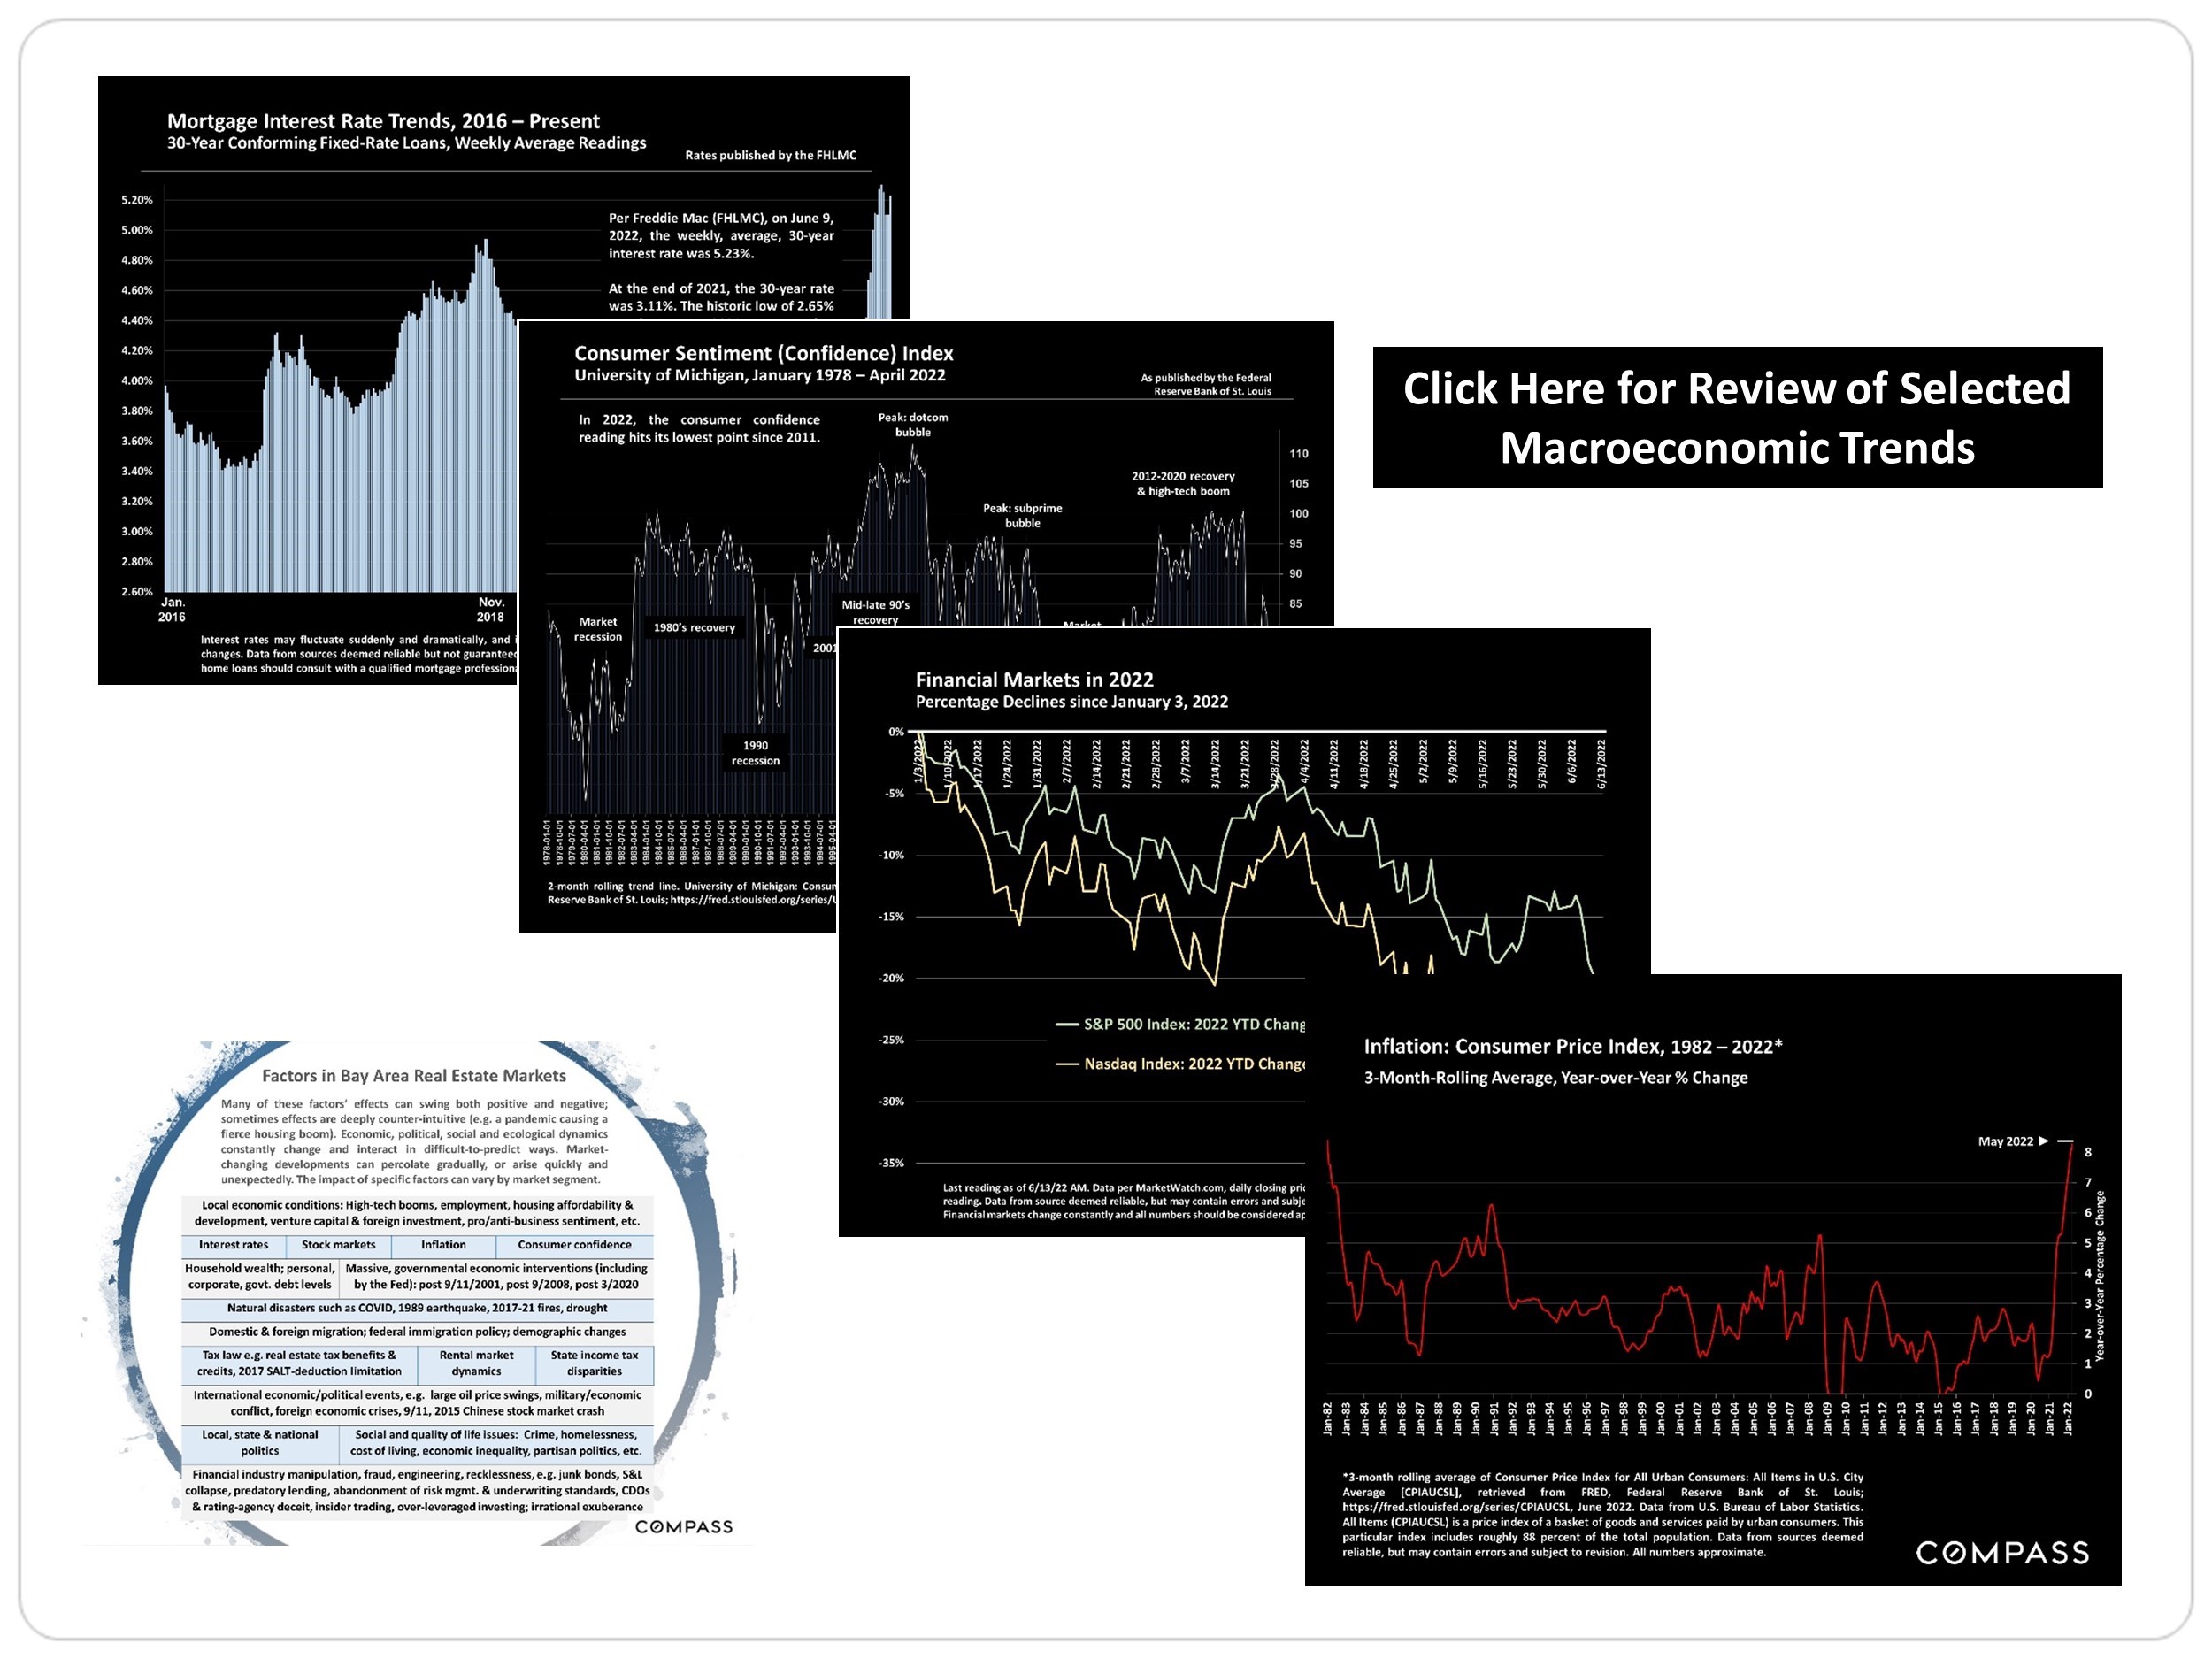
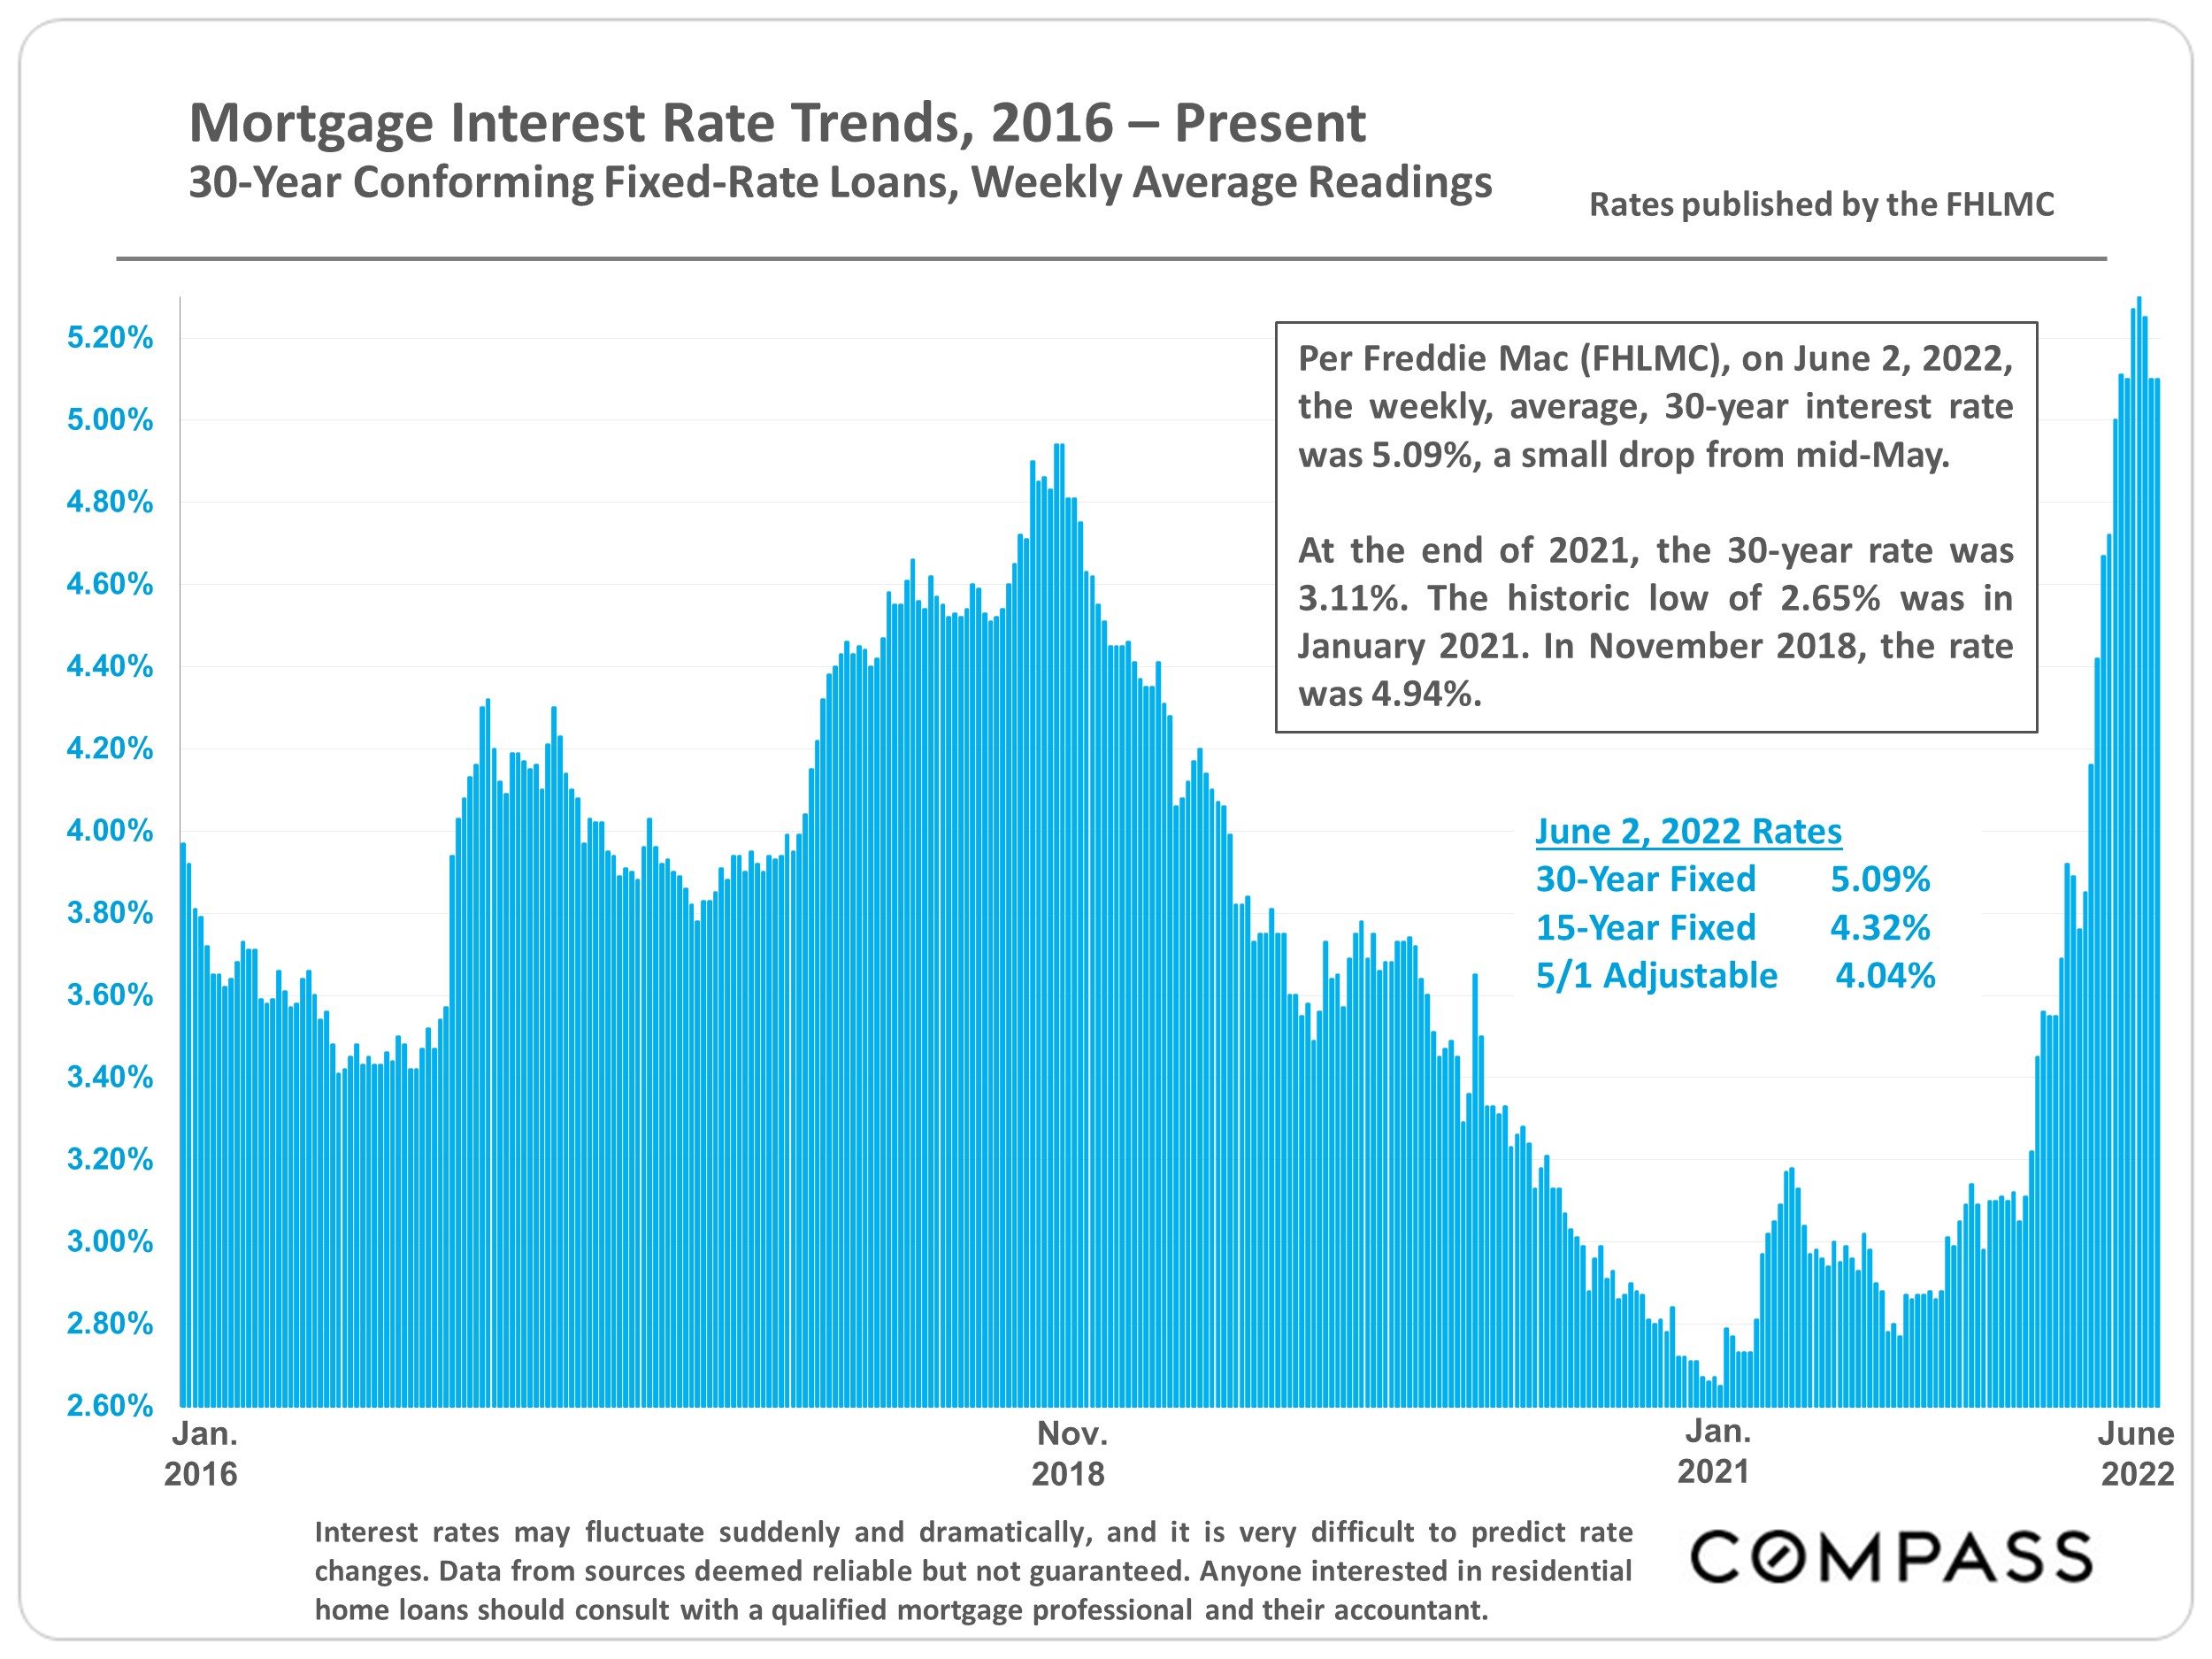
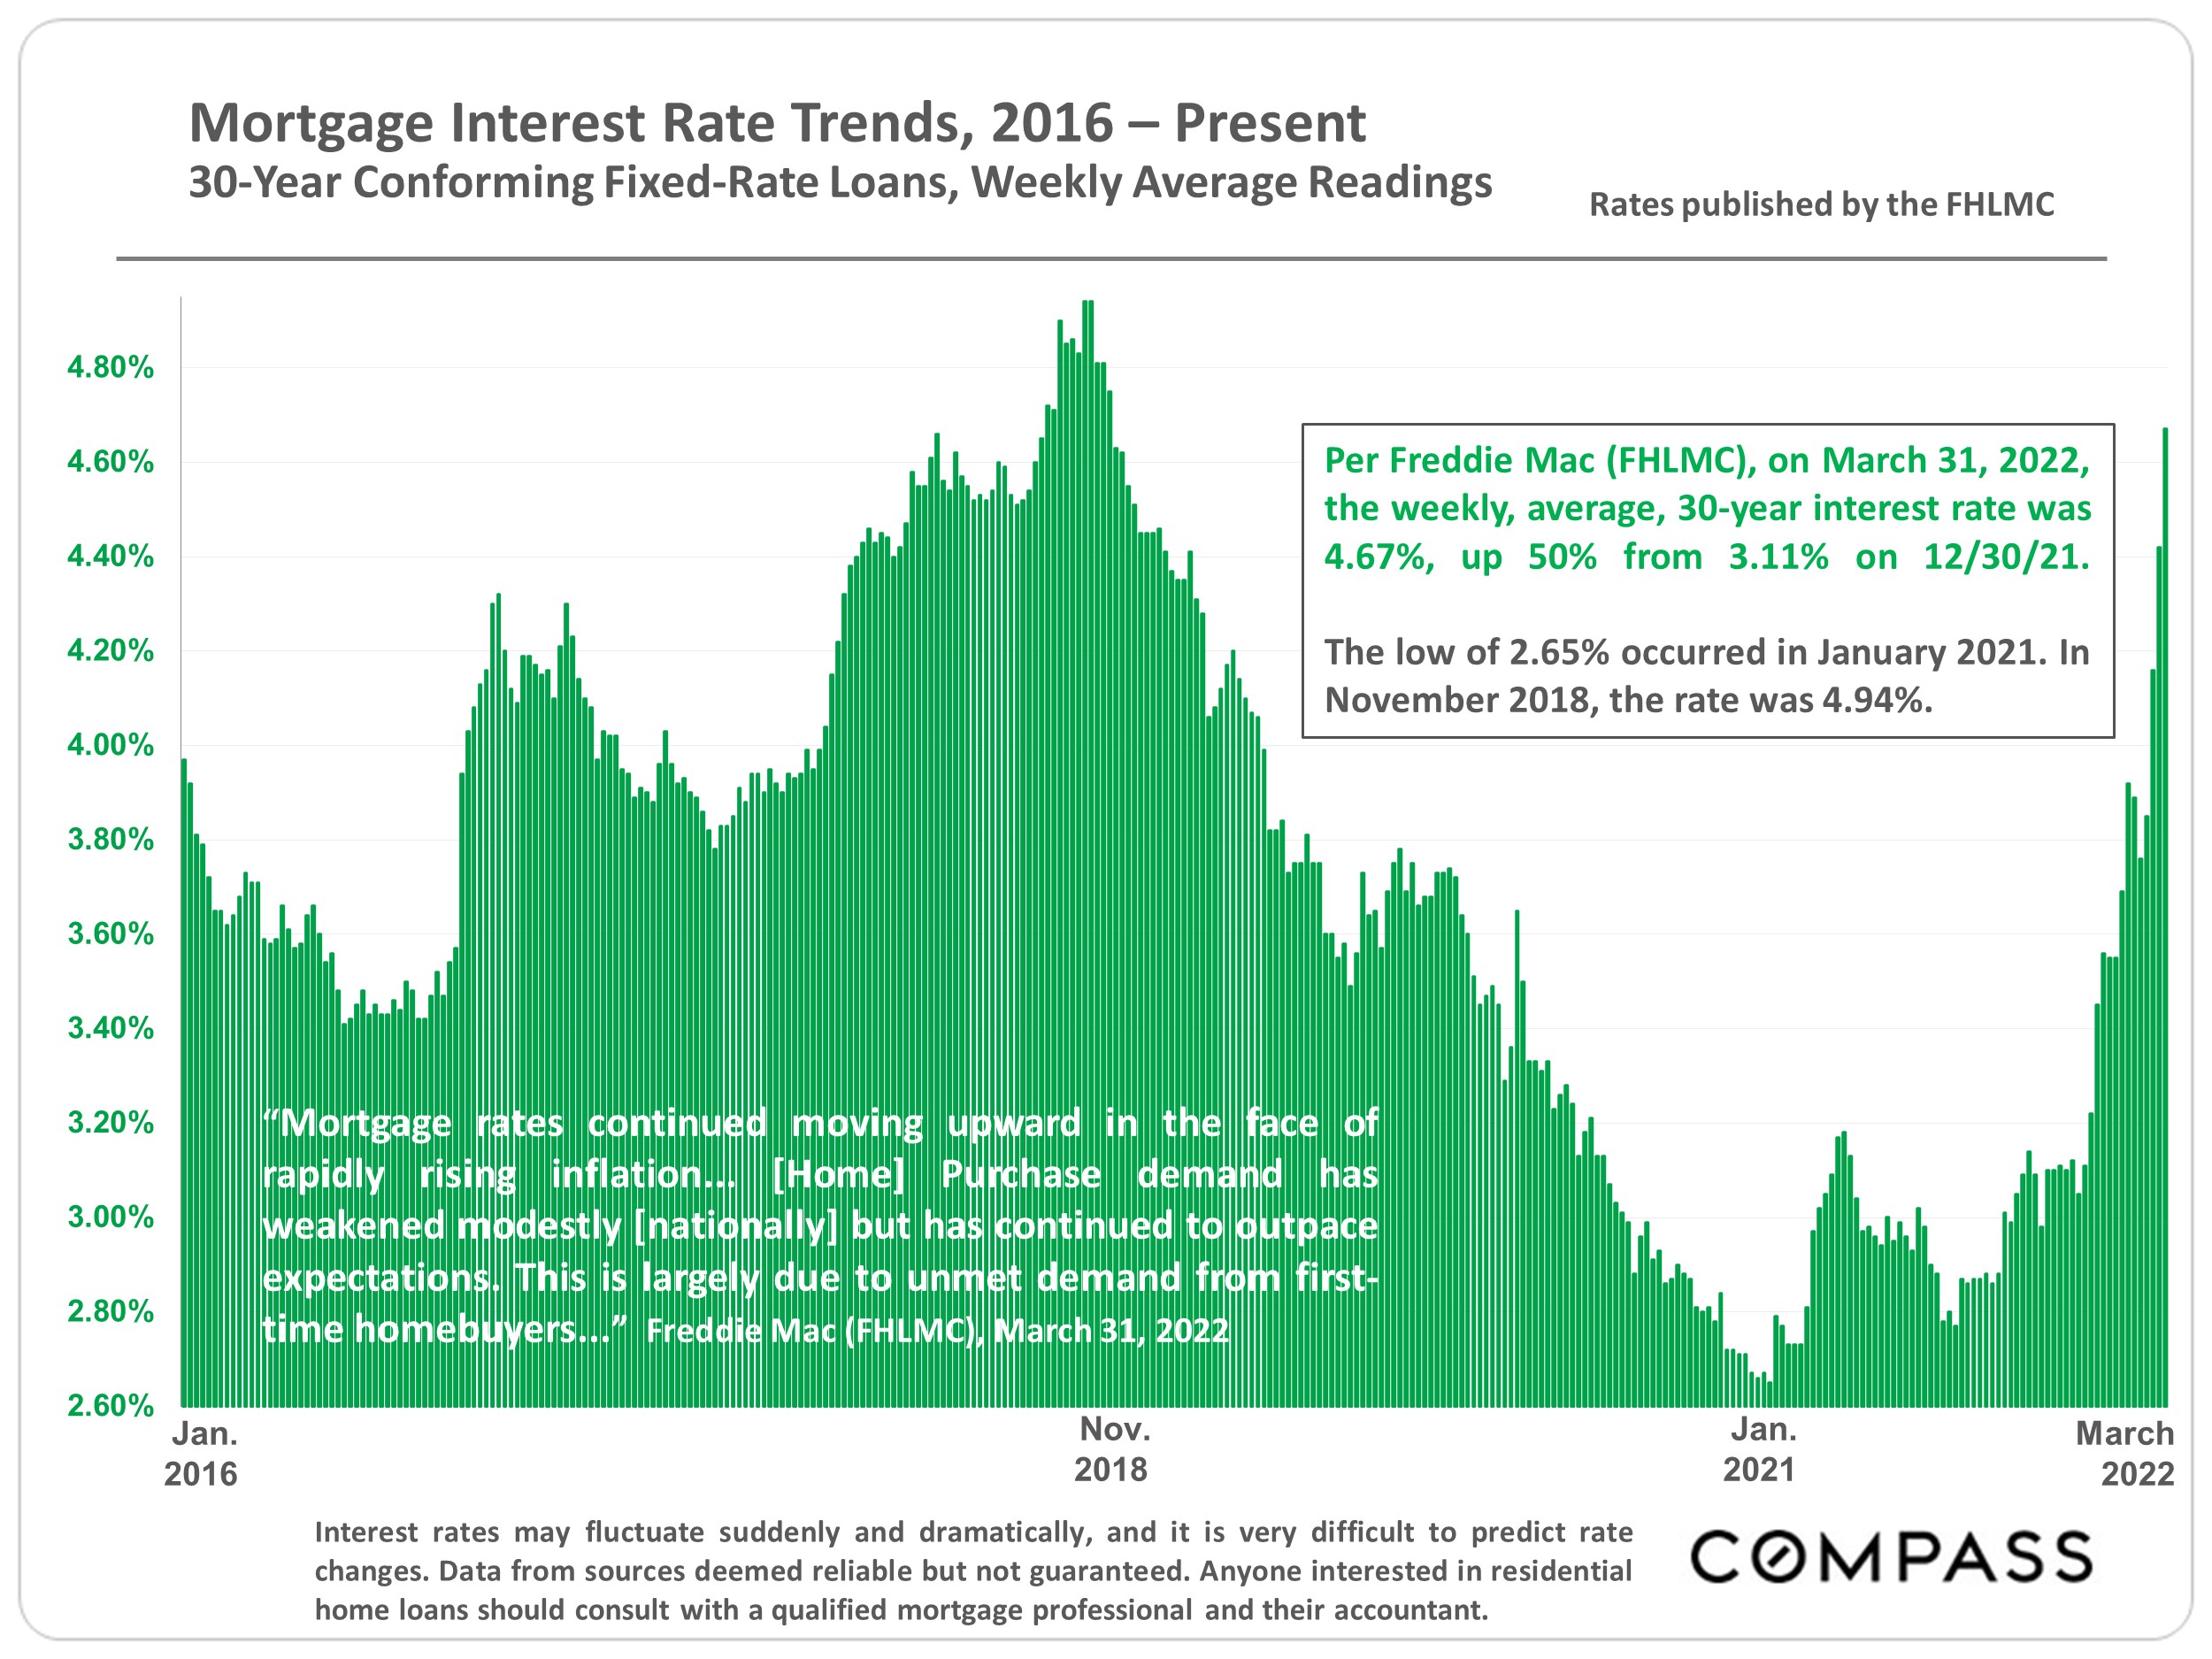
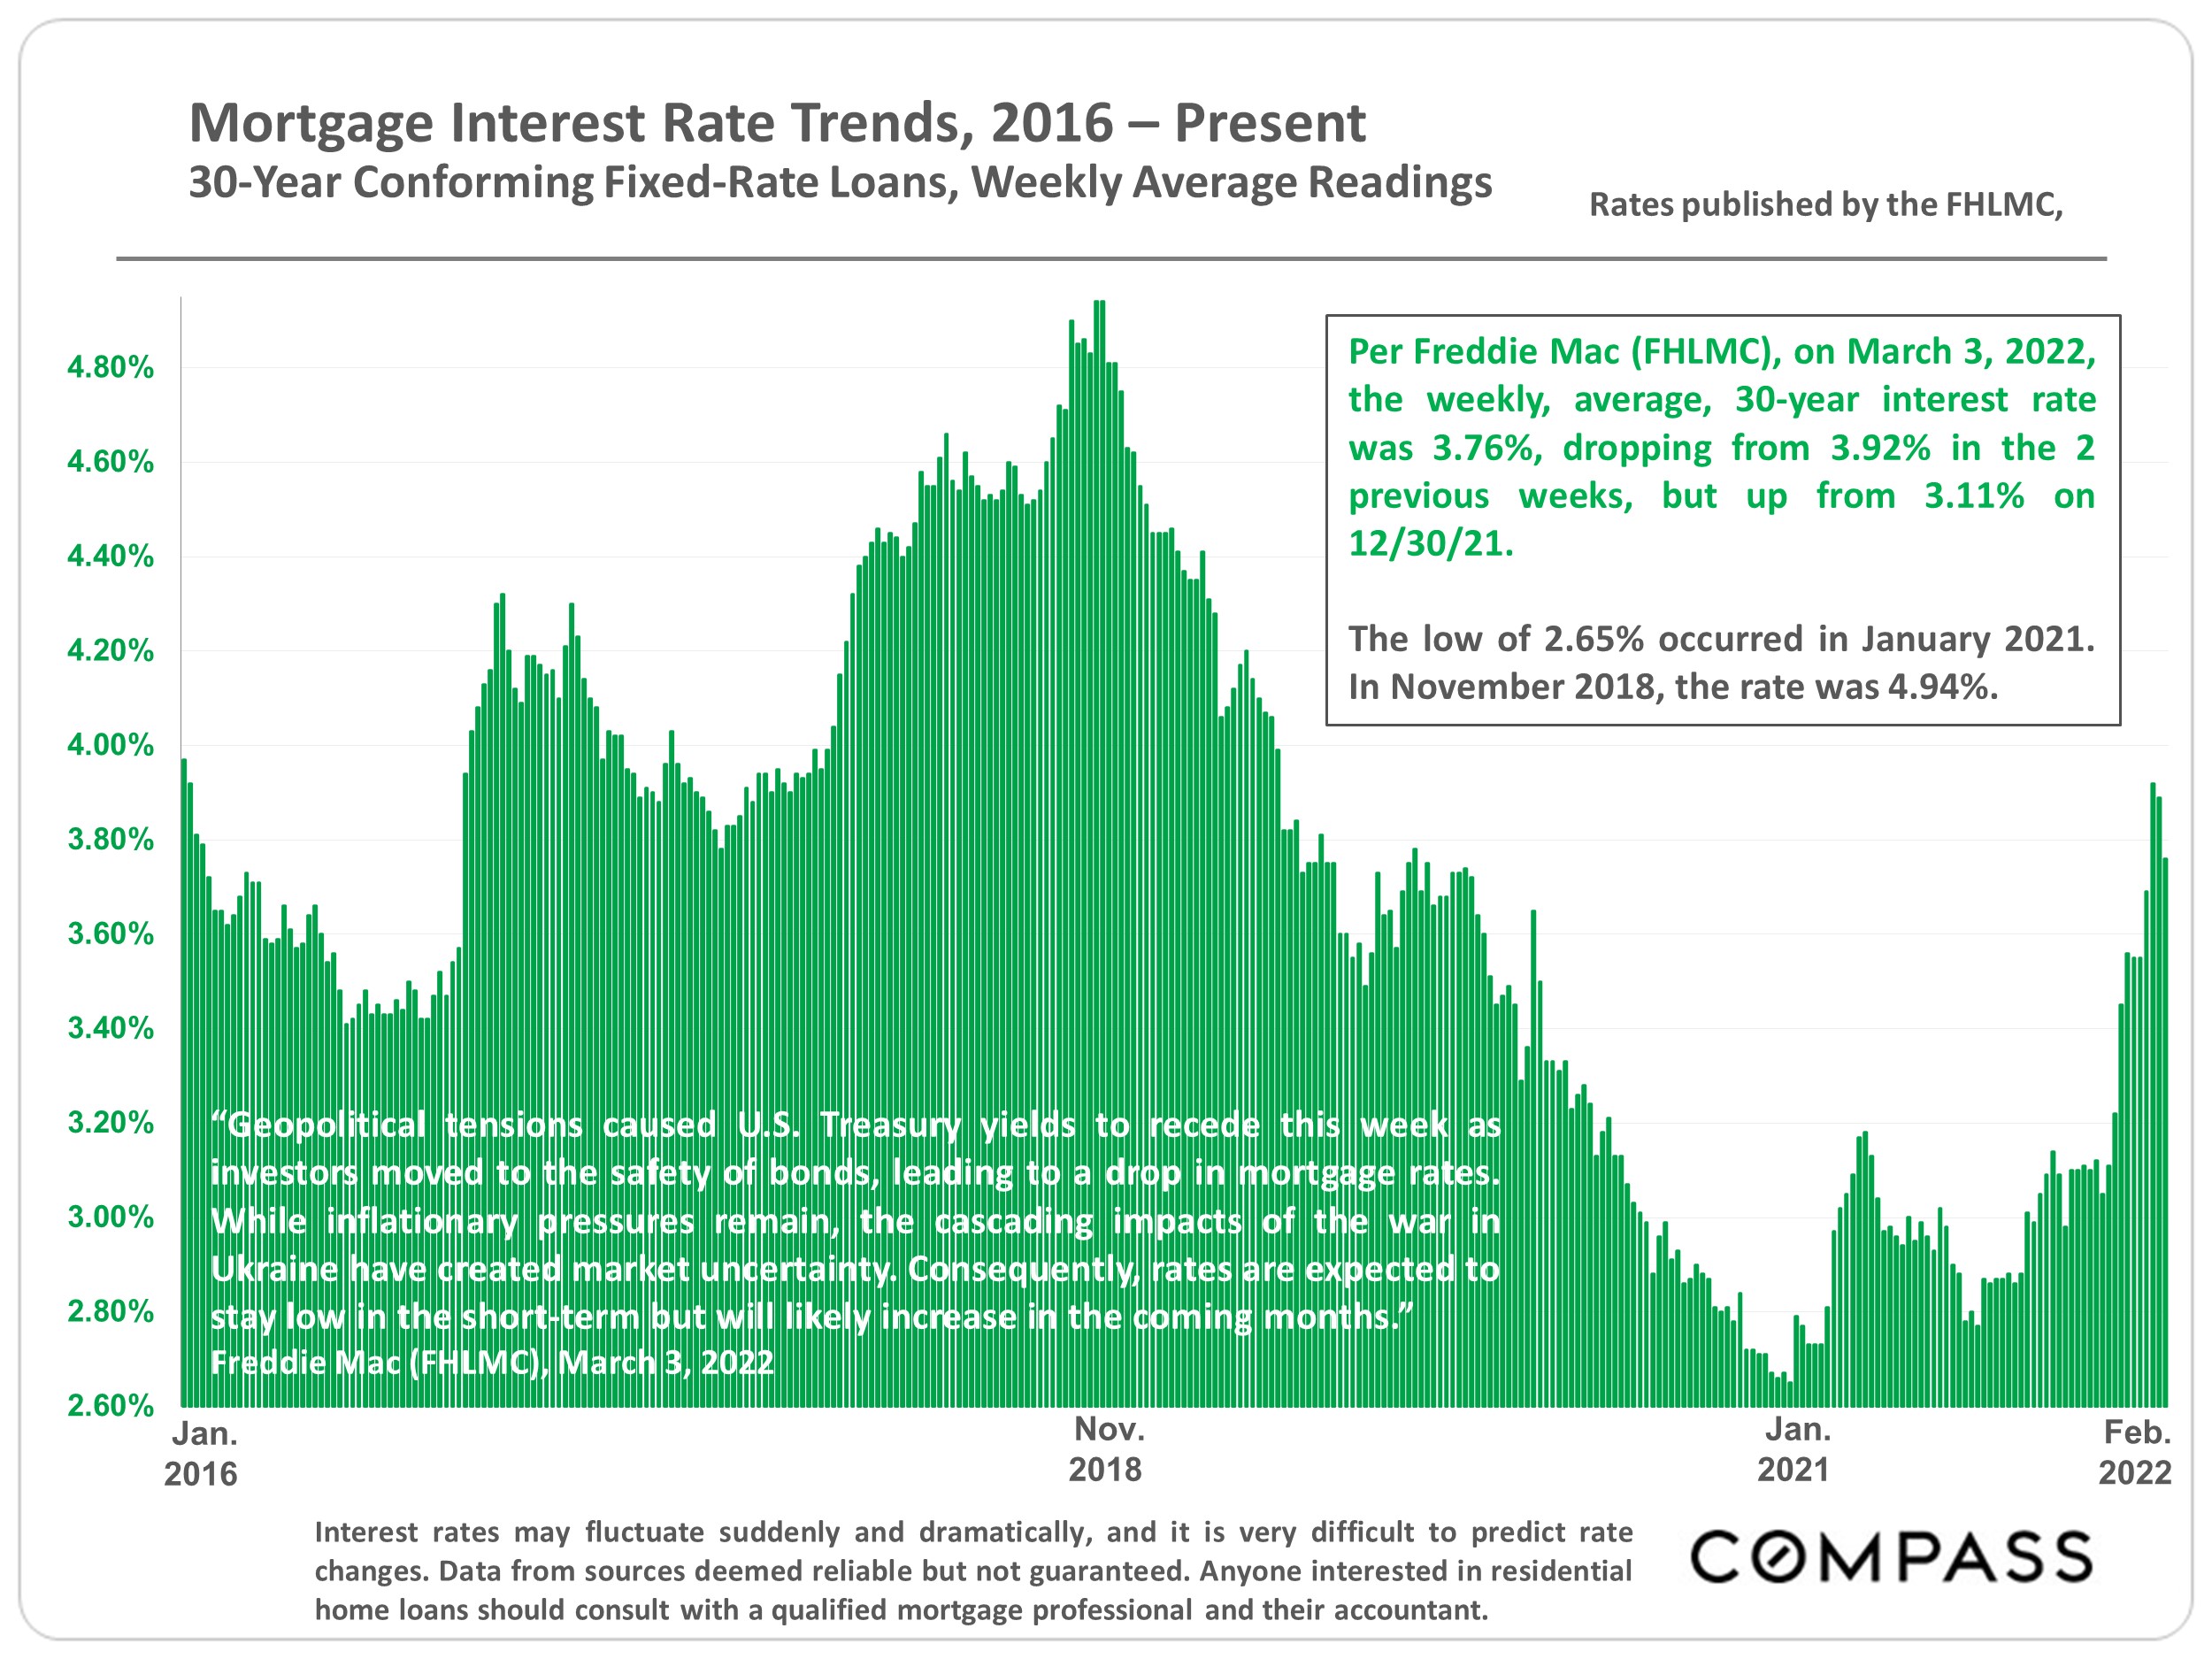
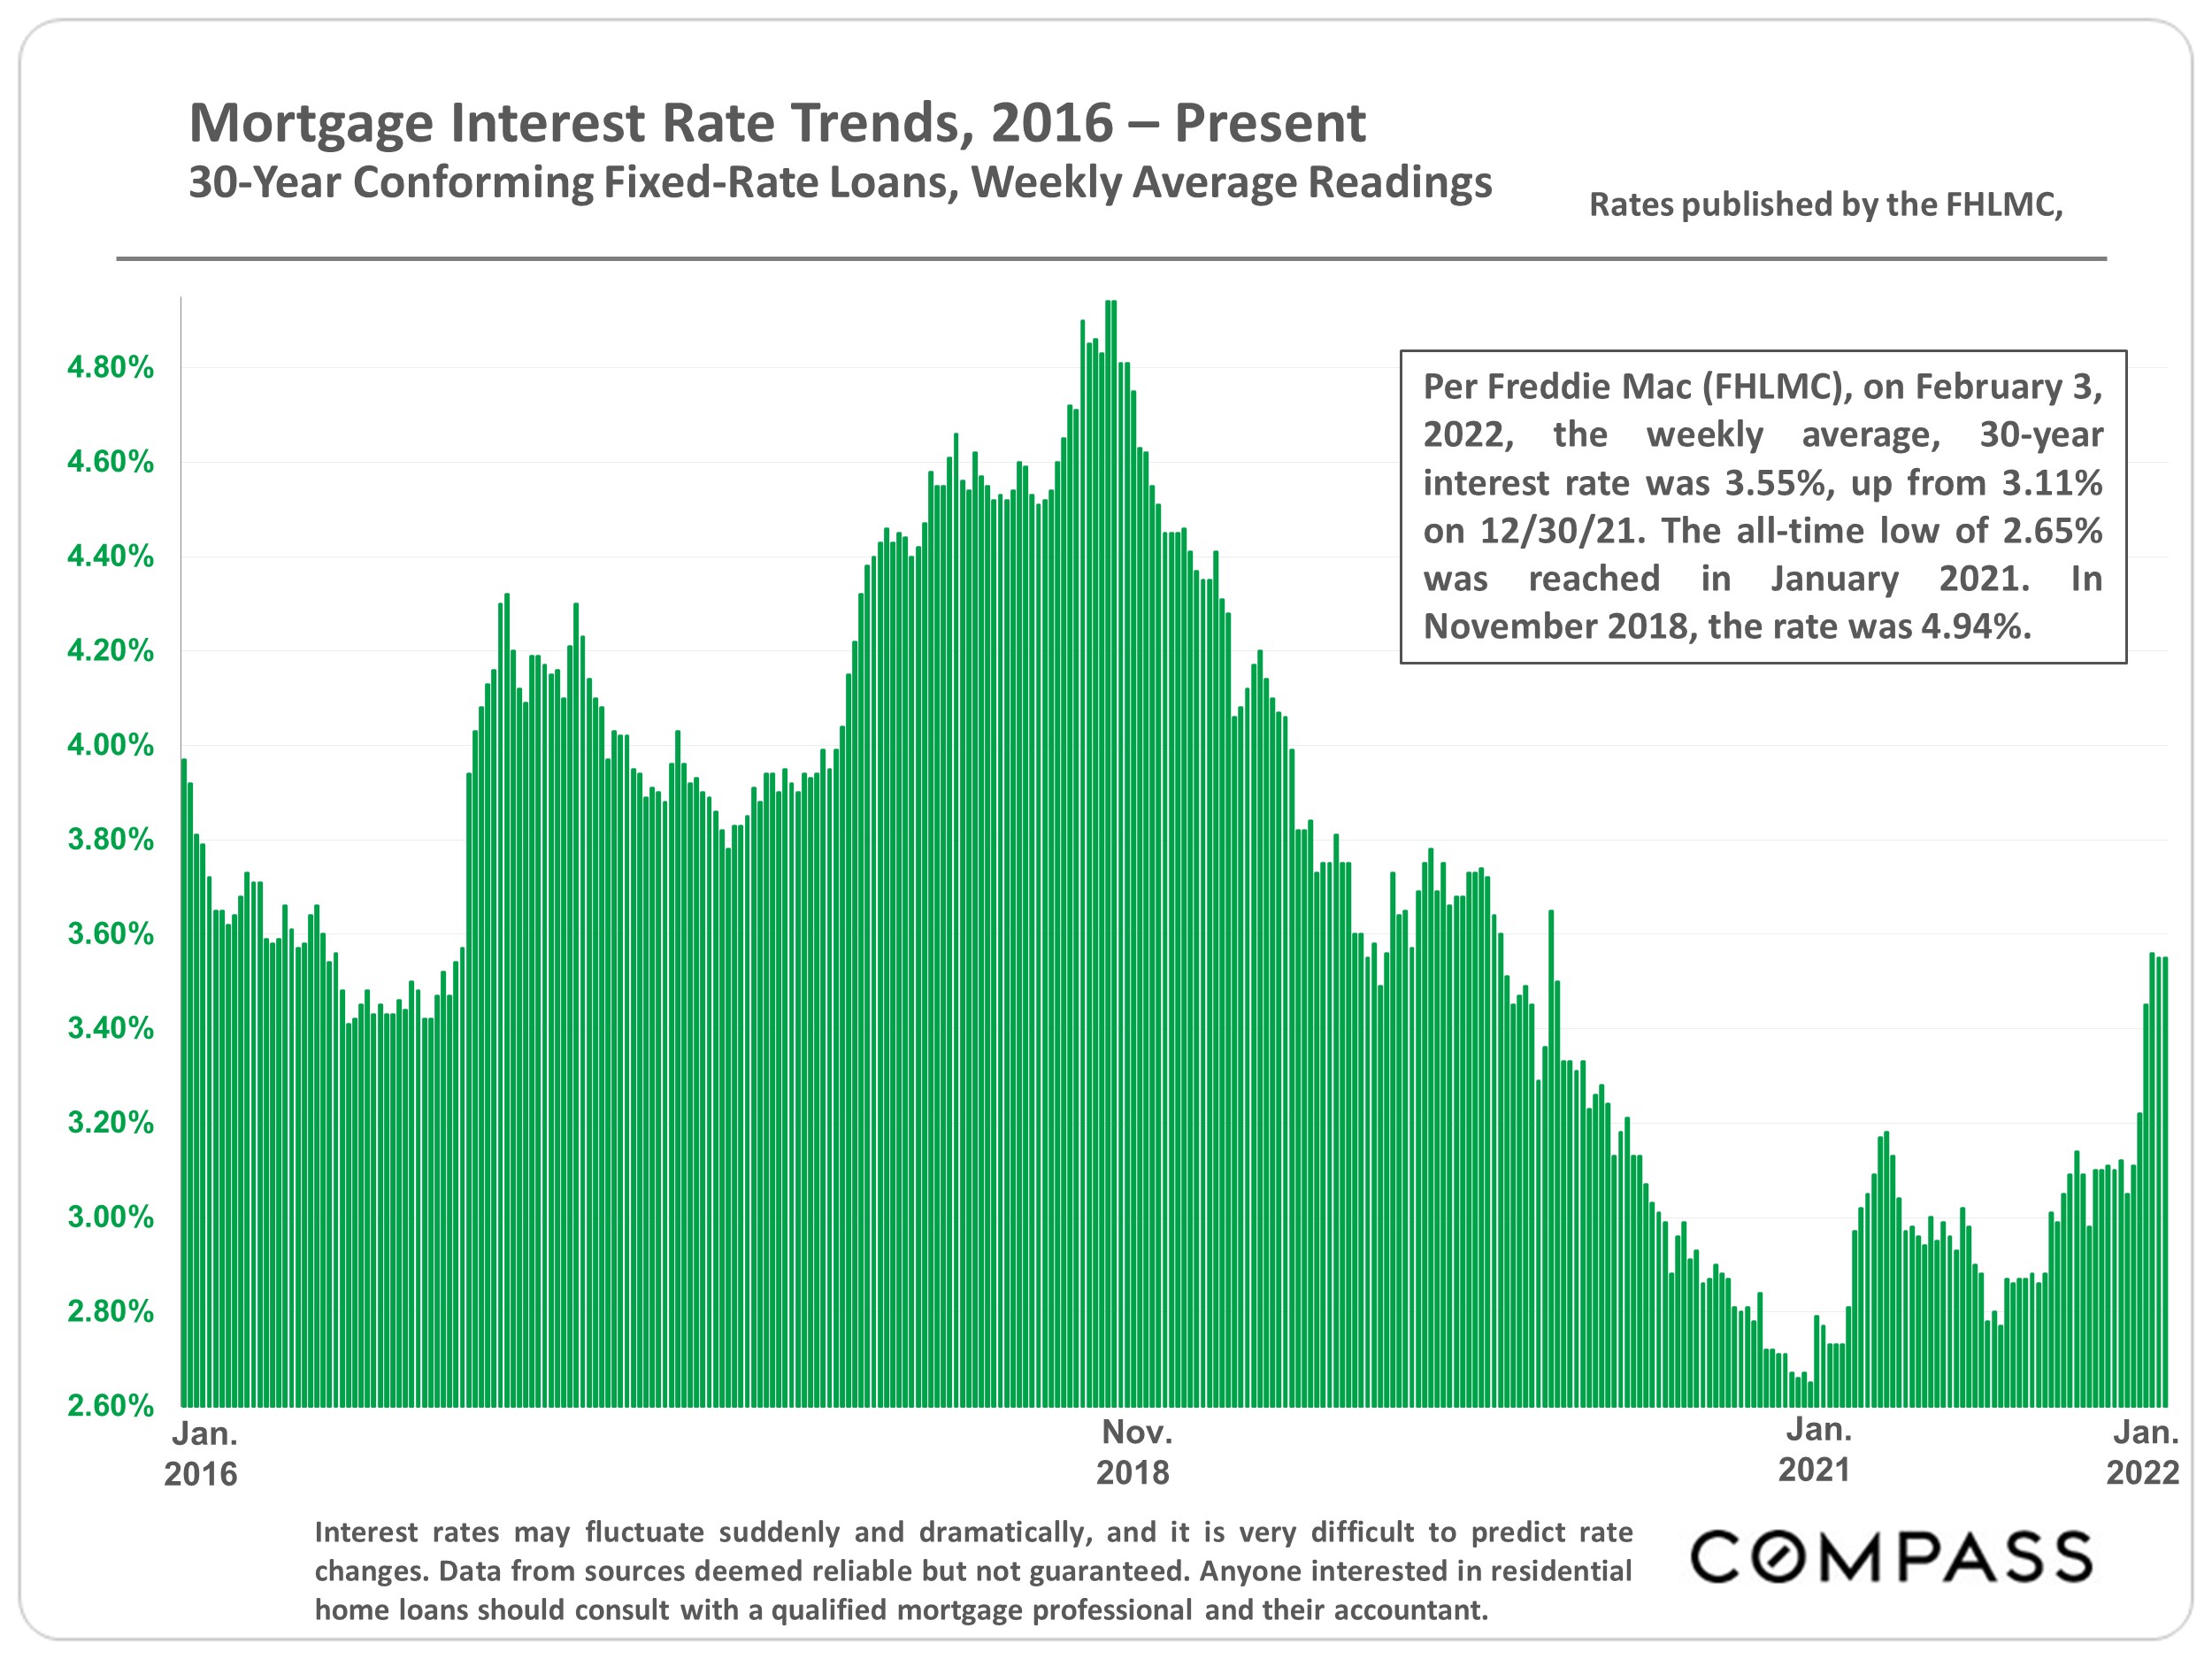
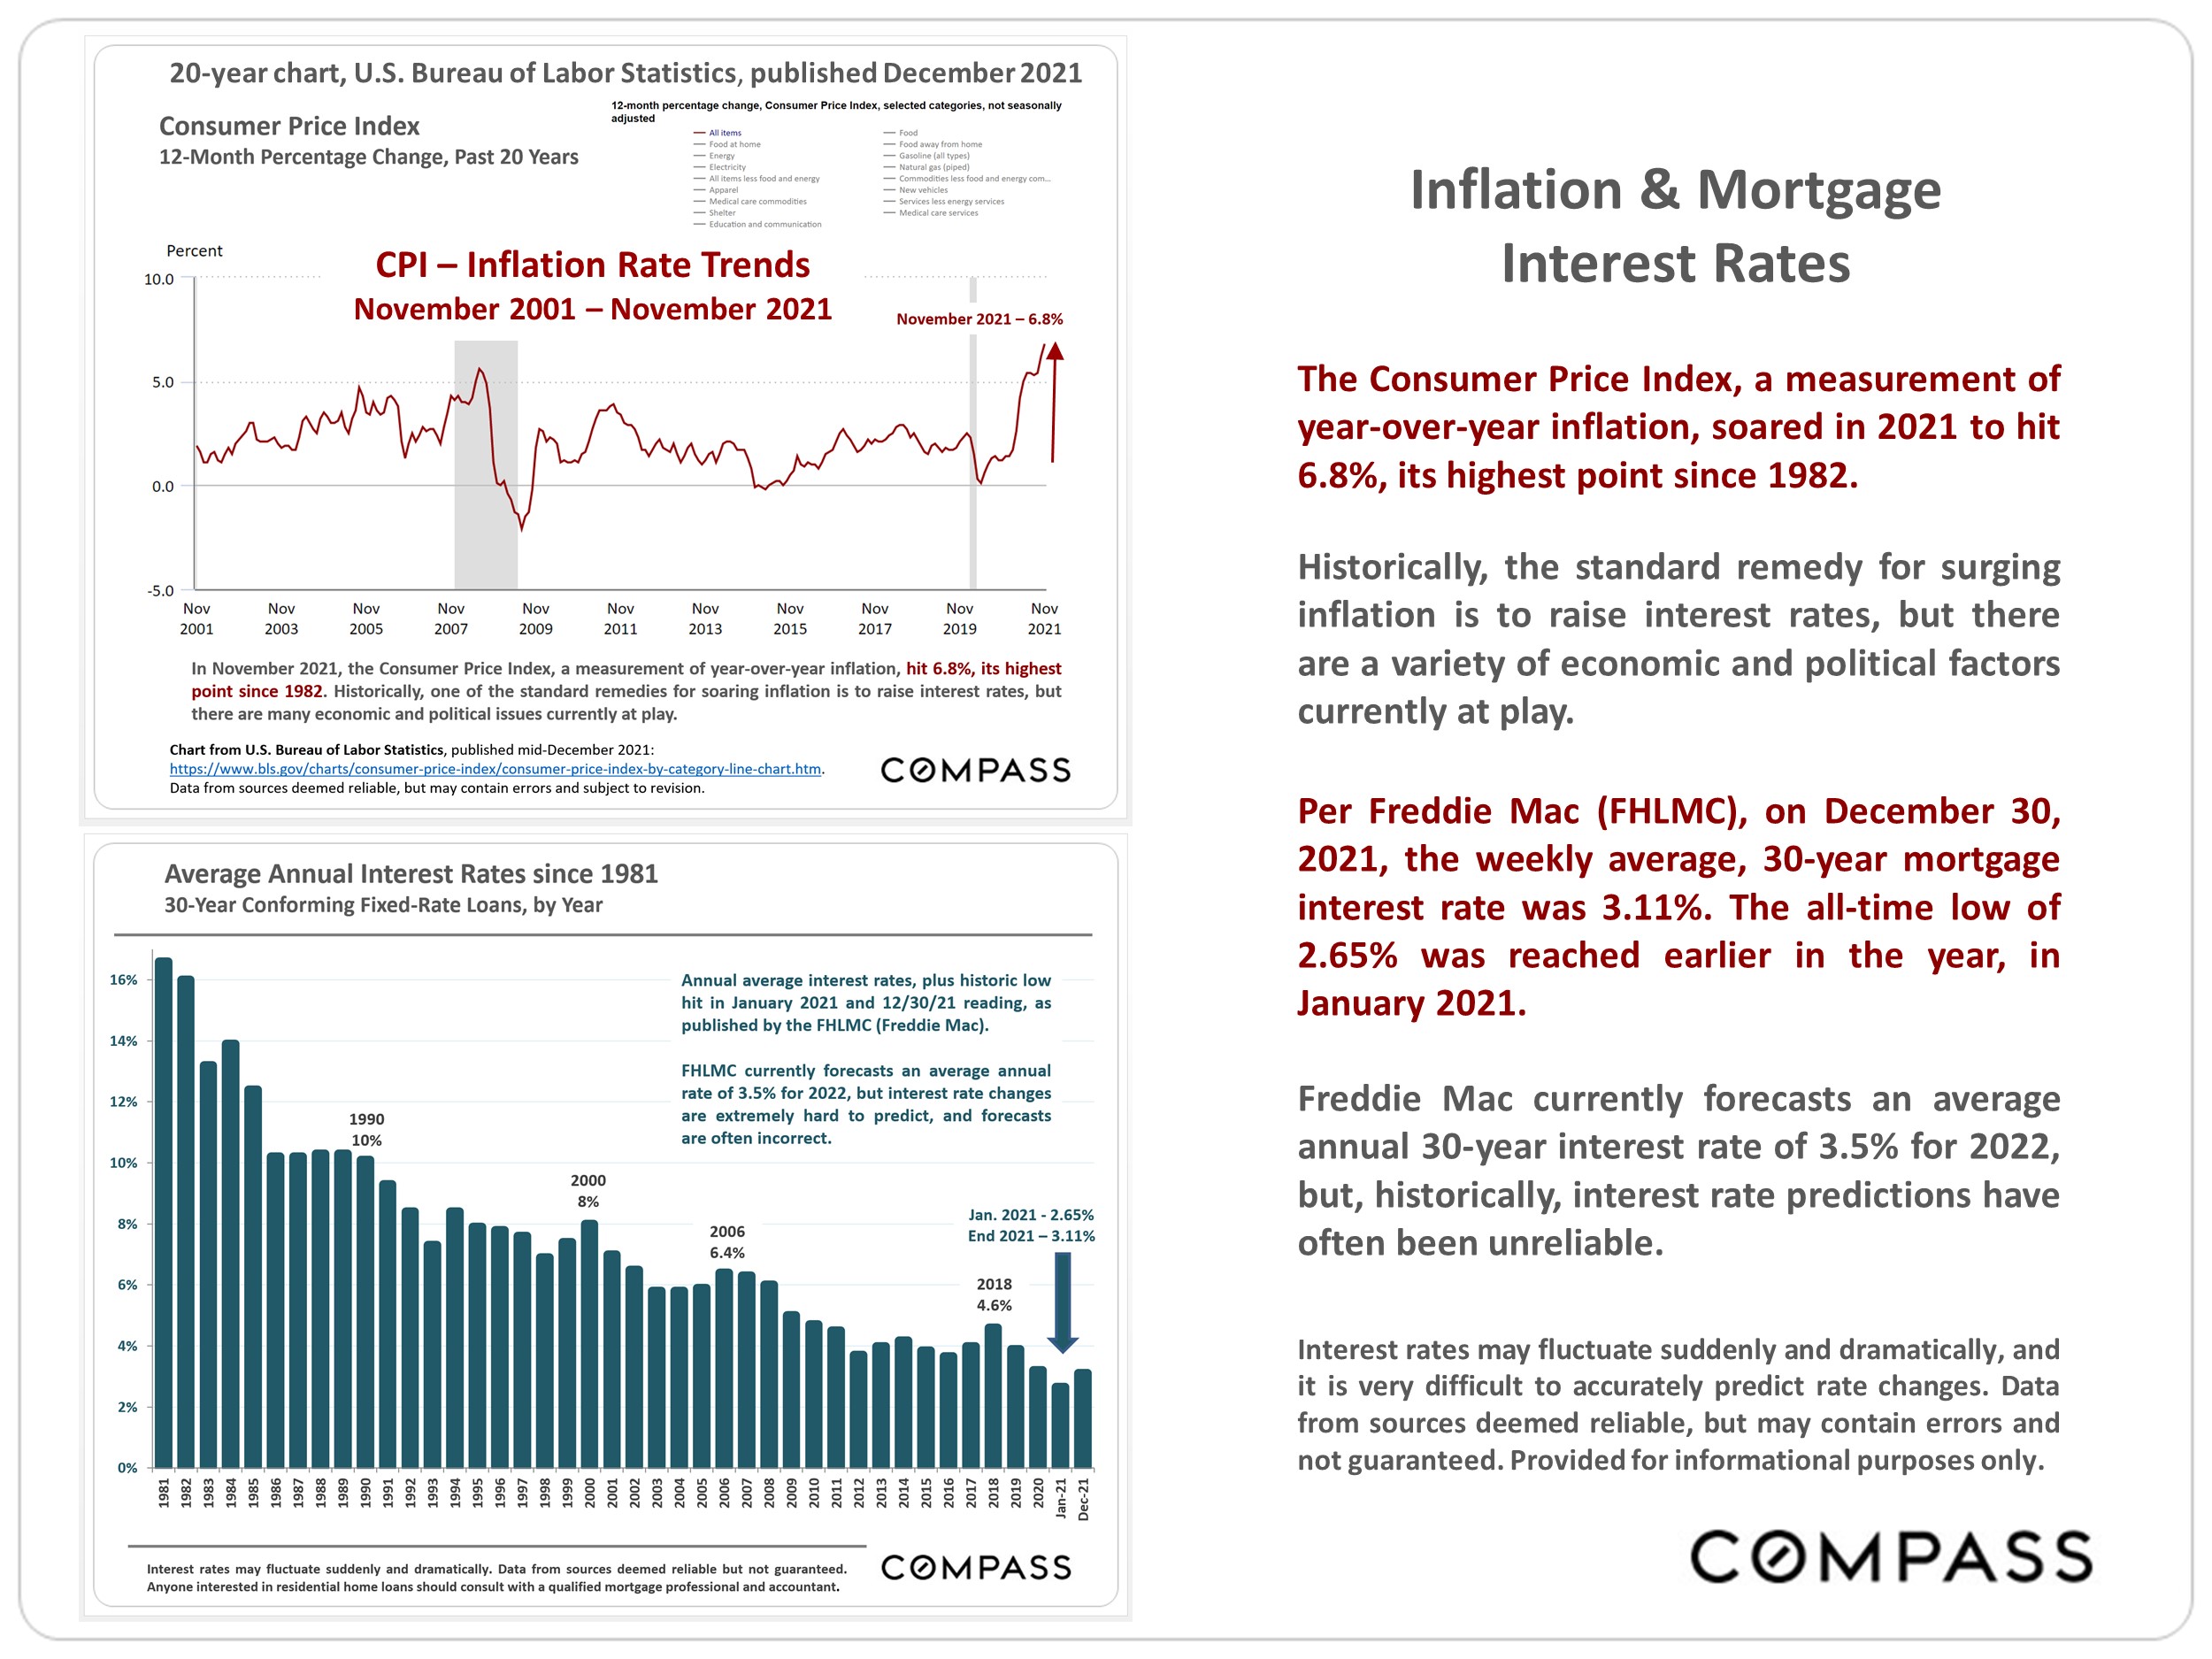
As of early September, interest rates have increased again and stock markets declined once more: They continue to see substantial short-term volatility and it remains difficult to confidently predict their future movements and effects on real estate markets. The next major indicator of buyer and seller psychology and market dynamics will be what occurs during the next 2 months of the autumn selling season, prior to the mid-November to mid-January holiday slowdown, typically the slowest market of the year.

Our reports are not intended to convince you regarding a course of action or to predict the future, but to provide, to the best of our ability, straightforward information and good-faith analysis to assist you in making your own informed decisions. Statistics should be considered very general indicators, and all numbers should be considered approximate. How they apply to any particular property is unknown without a specific comparative market analysis.

Source: Compass

Statistics are generalities, essentially summaries of widely disparate data generated by dozens, hundreds or thousands of unique, individual sales occurring within different time periods. They are best seen not as precise measurements, but as broad, comparative indicators, with reasonable margins of error. Anomalous fluctuations in statistics are not uncommon, especially in smaller, expensive market segments. Last period data should be considered estimates that may change with late-reported data. Different analytics programs sometimes define statistics – such as “active listings,” “days on market,” and “months supply of inventory” – differently: what is most meaningful are not specific calculations but the trends they illustrate. Most listing and sales data derives from the local or regional multi-listing service (MLS) of the area specified in the analysis, but not all listings or sales are reported to MLS and these won’t be reflected in the data. “Homes” signifies real-property, single-household housing units: houses, condos, co-ops, townhouses, duets and TICs (but not mobile homes), as applicable to each market. City/town names refer specifically to the named cities and towns, unless otherwise delineated. Multi-county metro areas will be specified as such. Data from sources deemed reliable, but may contain errors and subject to revision. All numbers to be considered approximate.

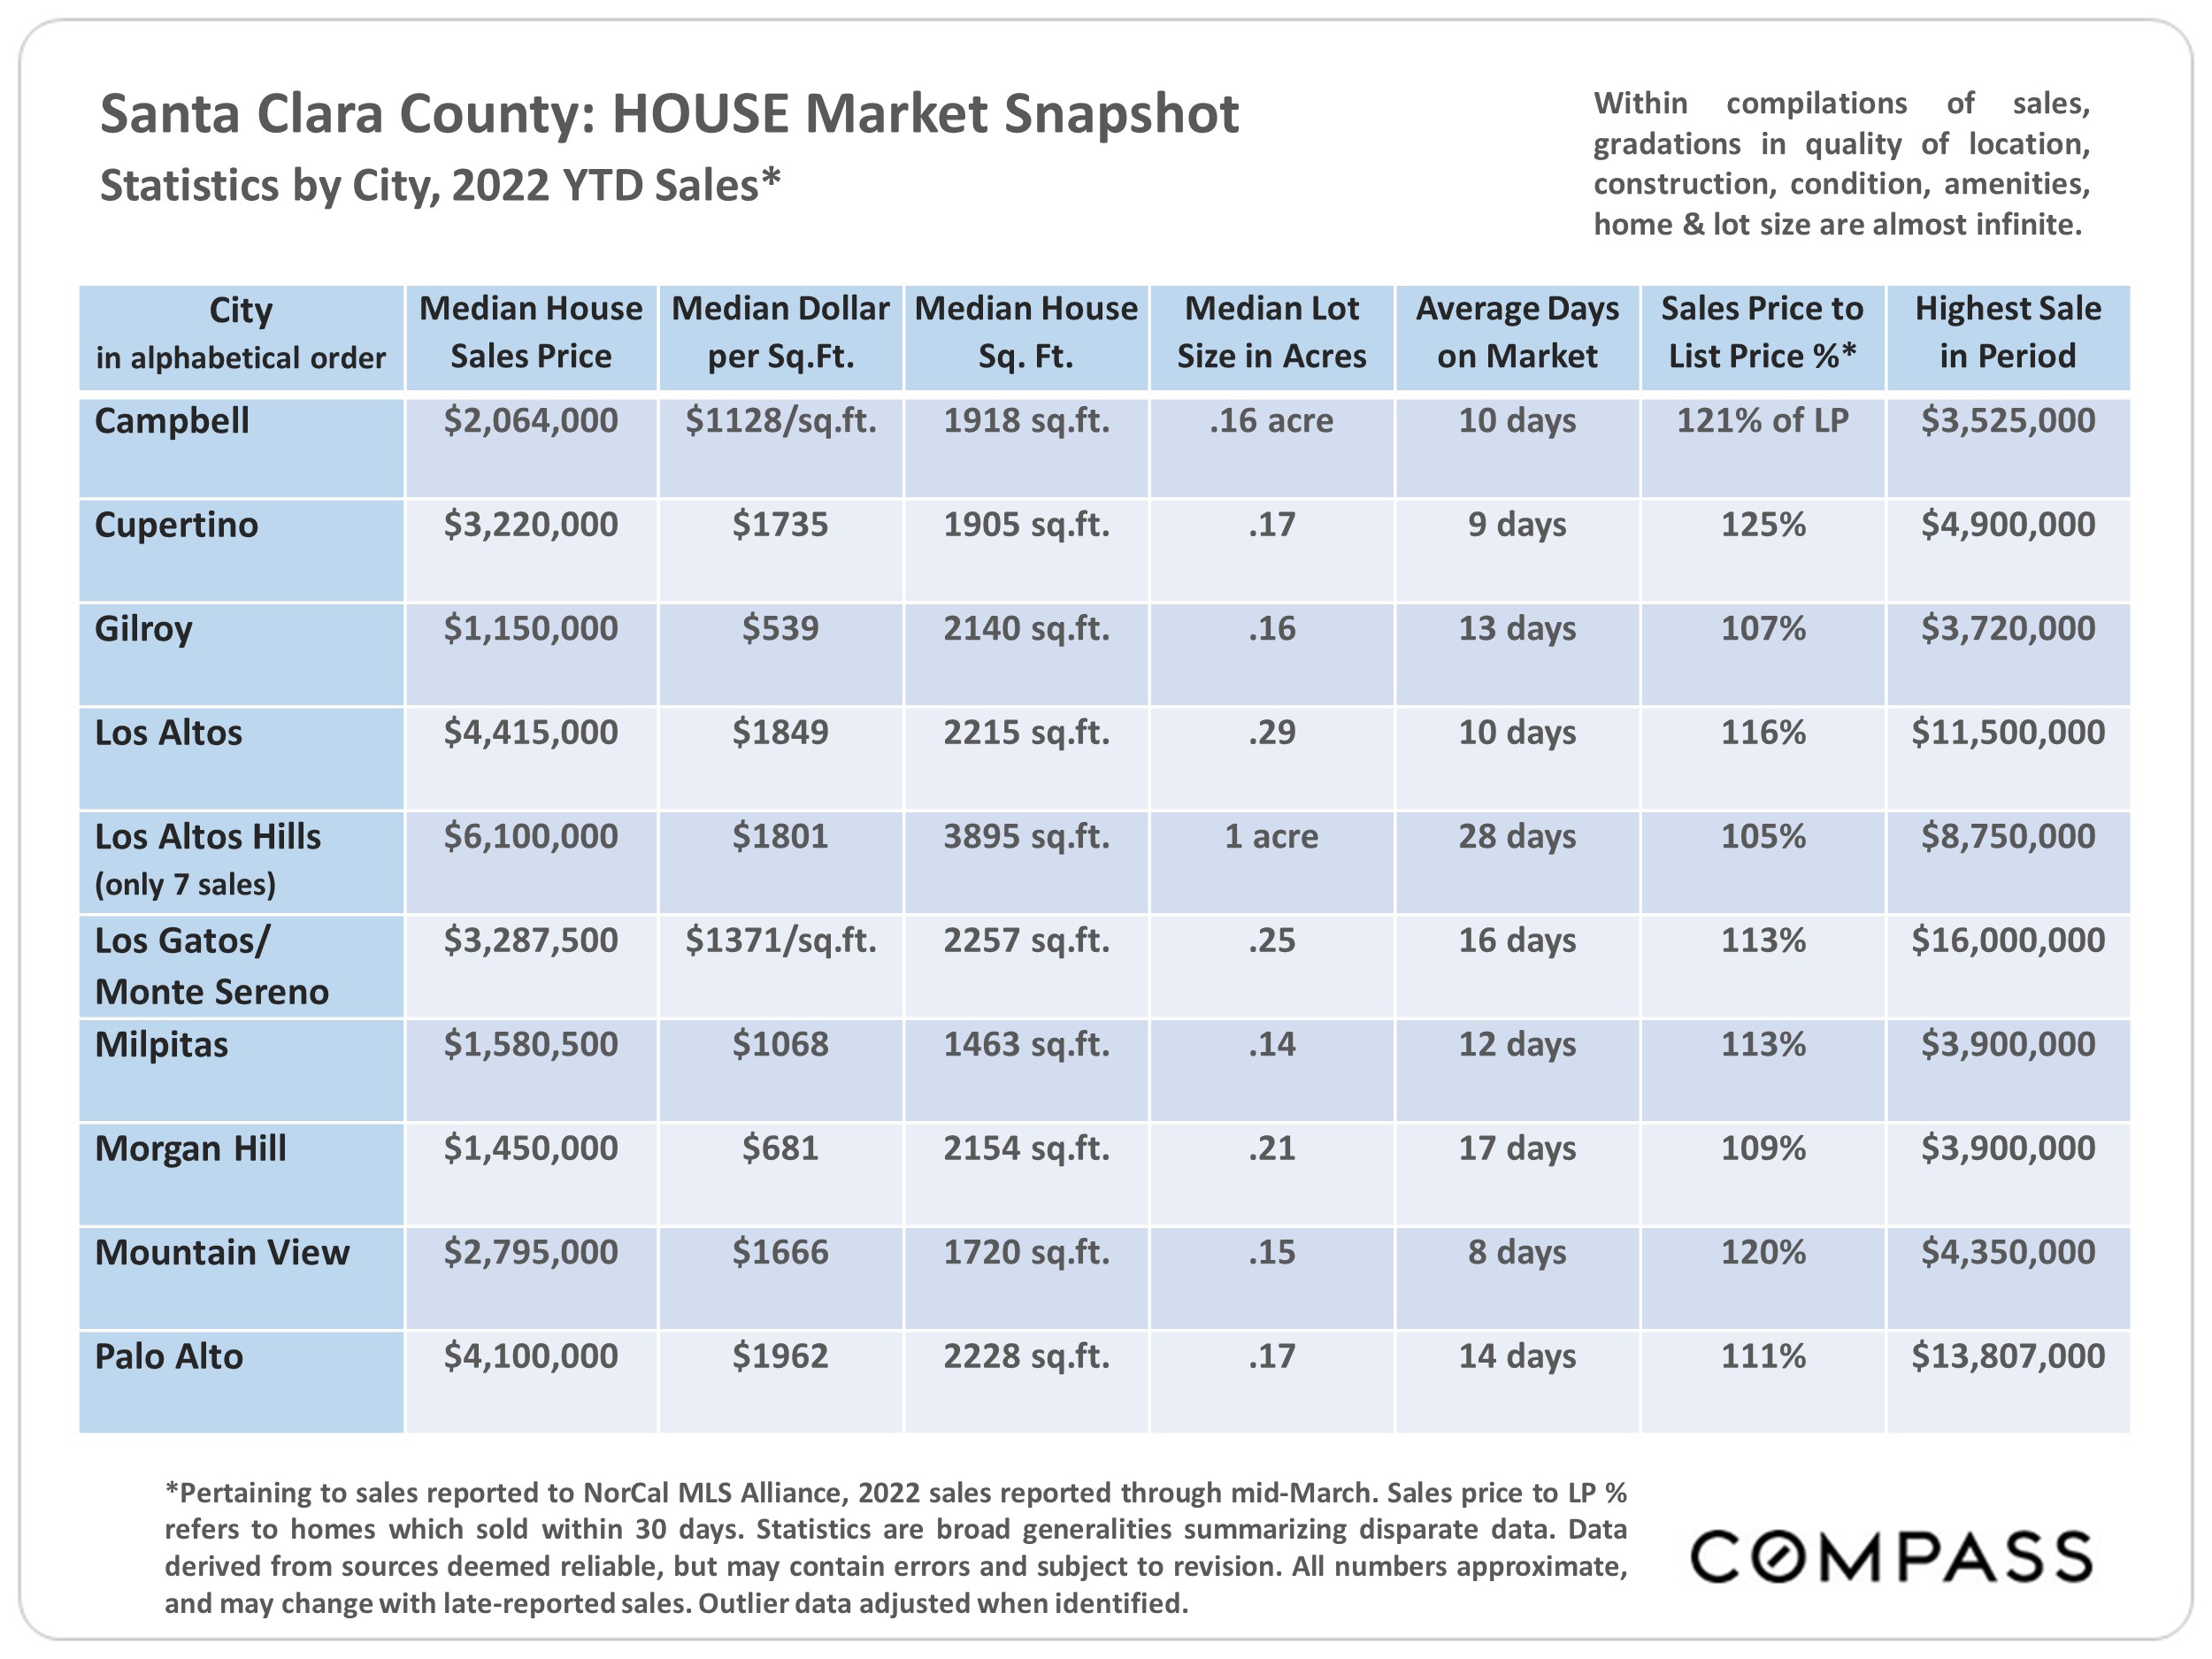
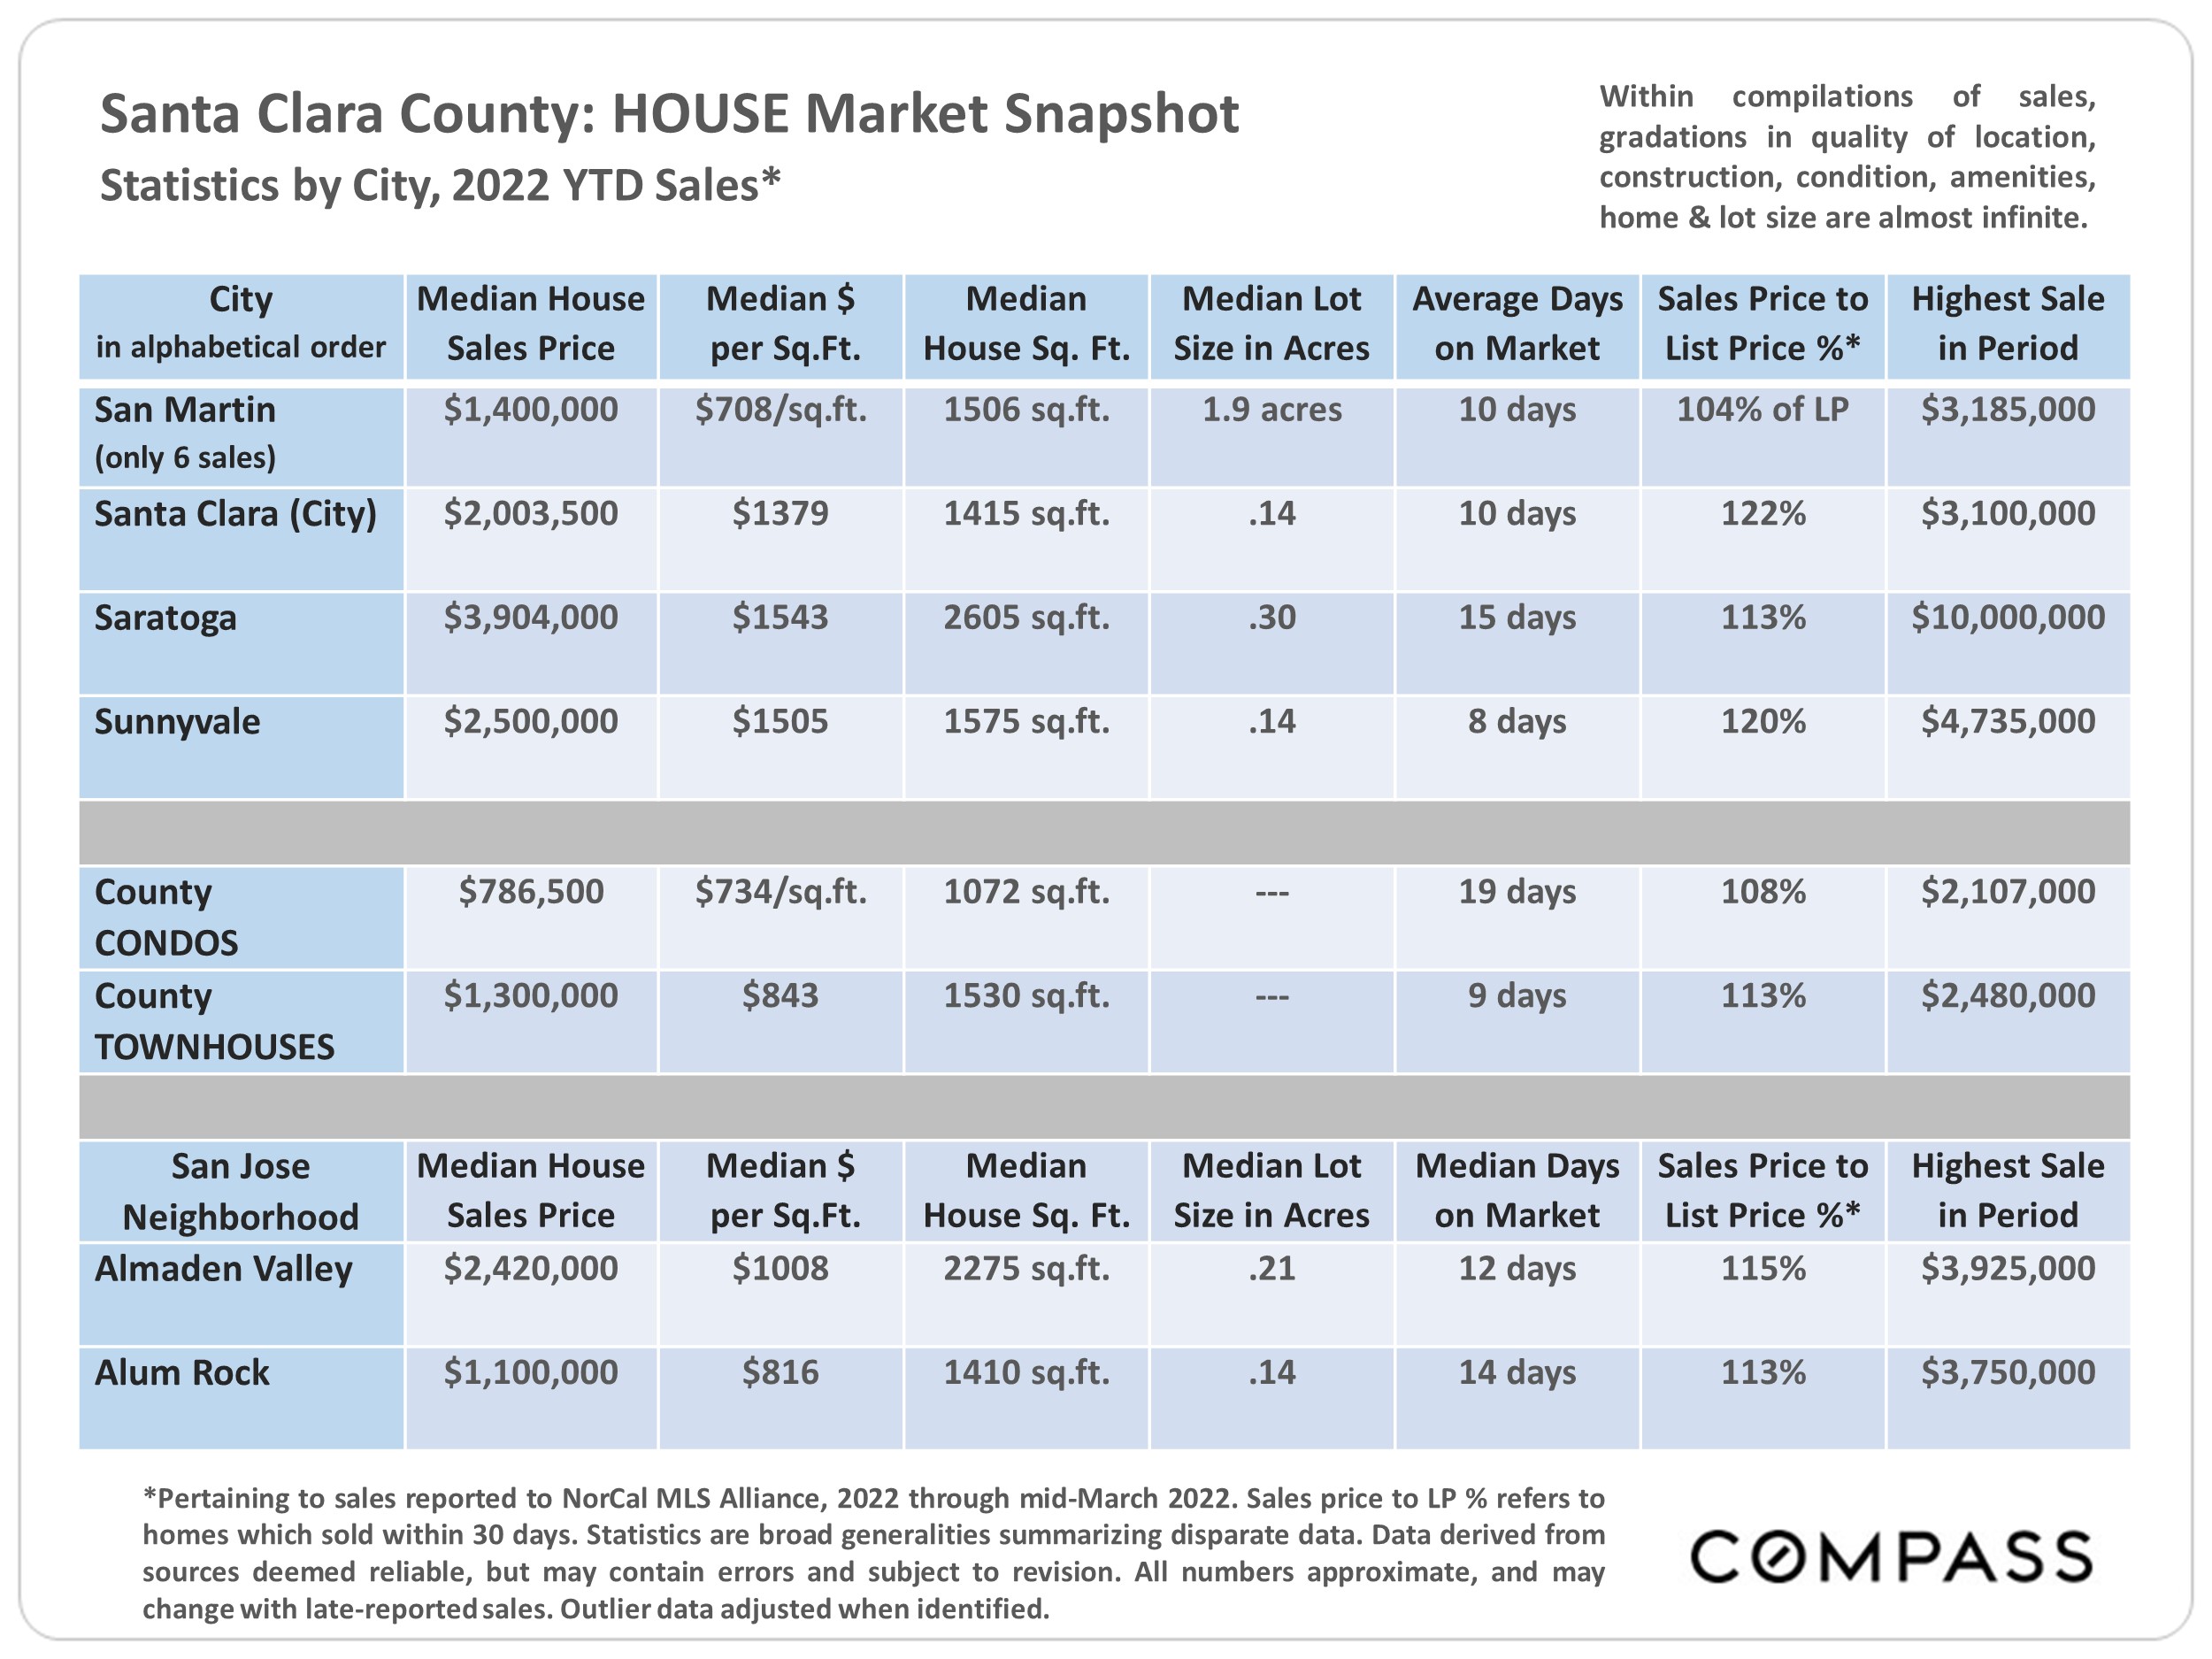
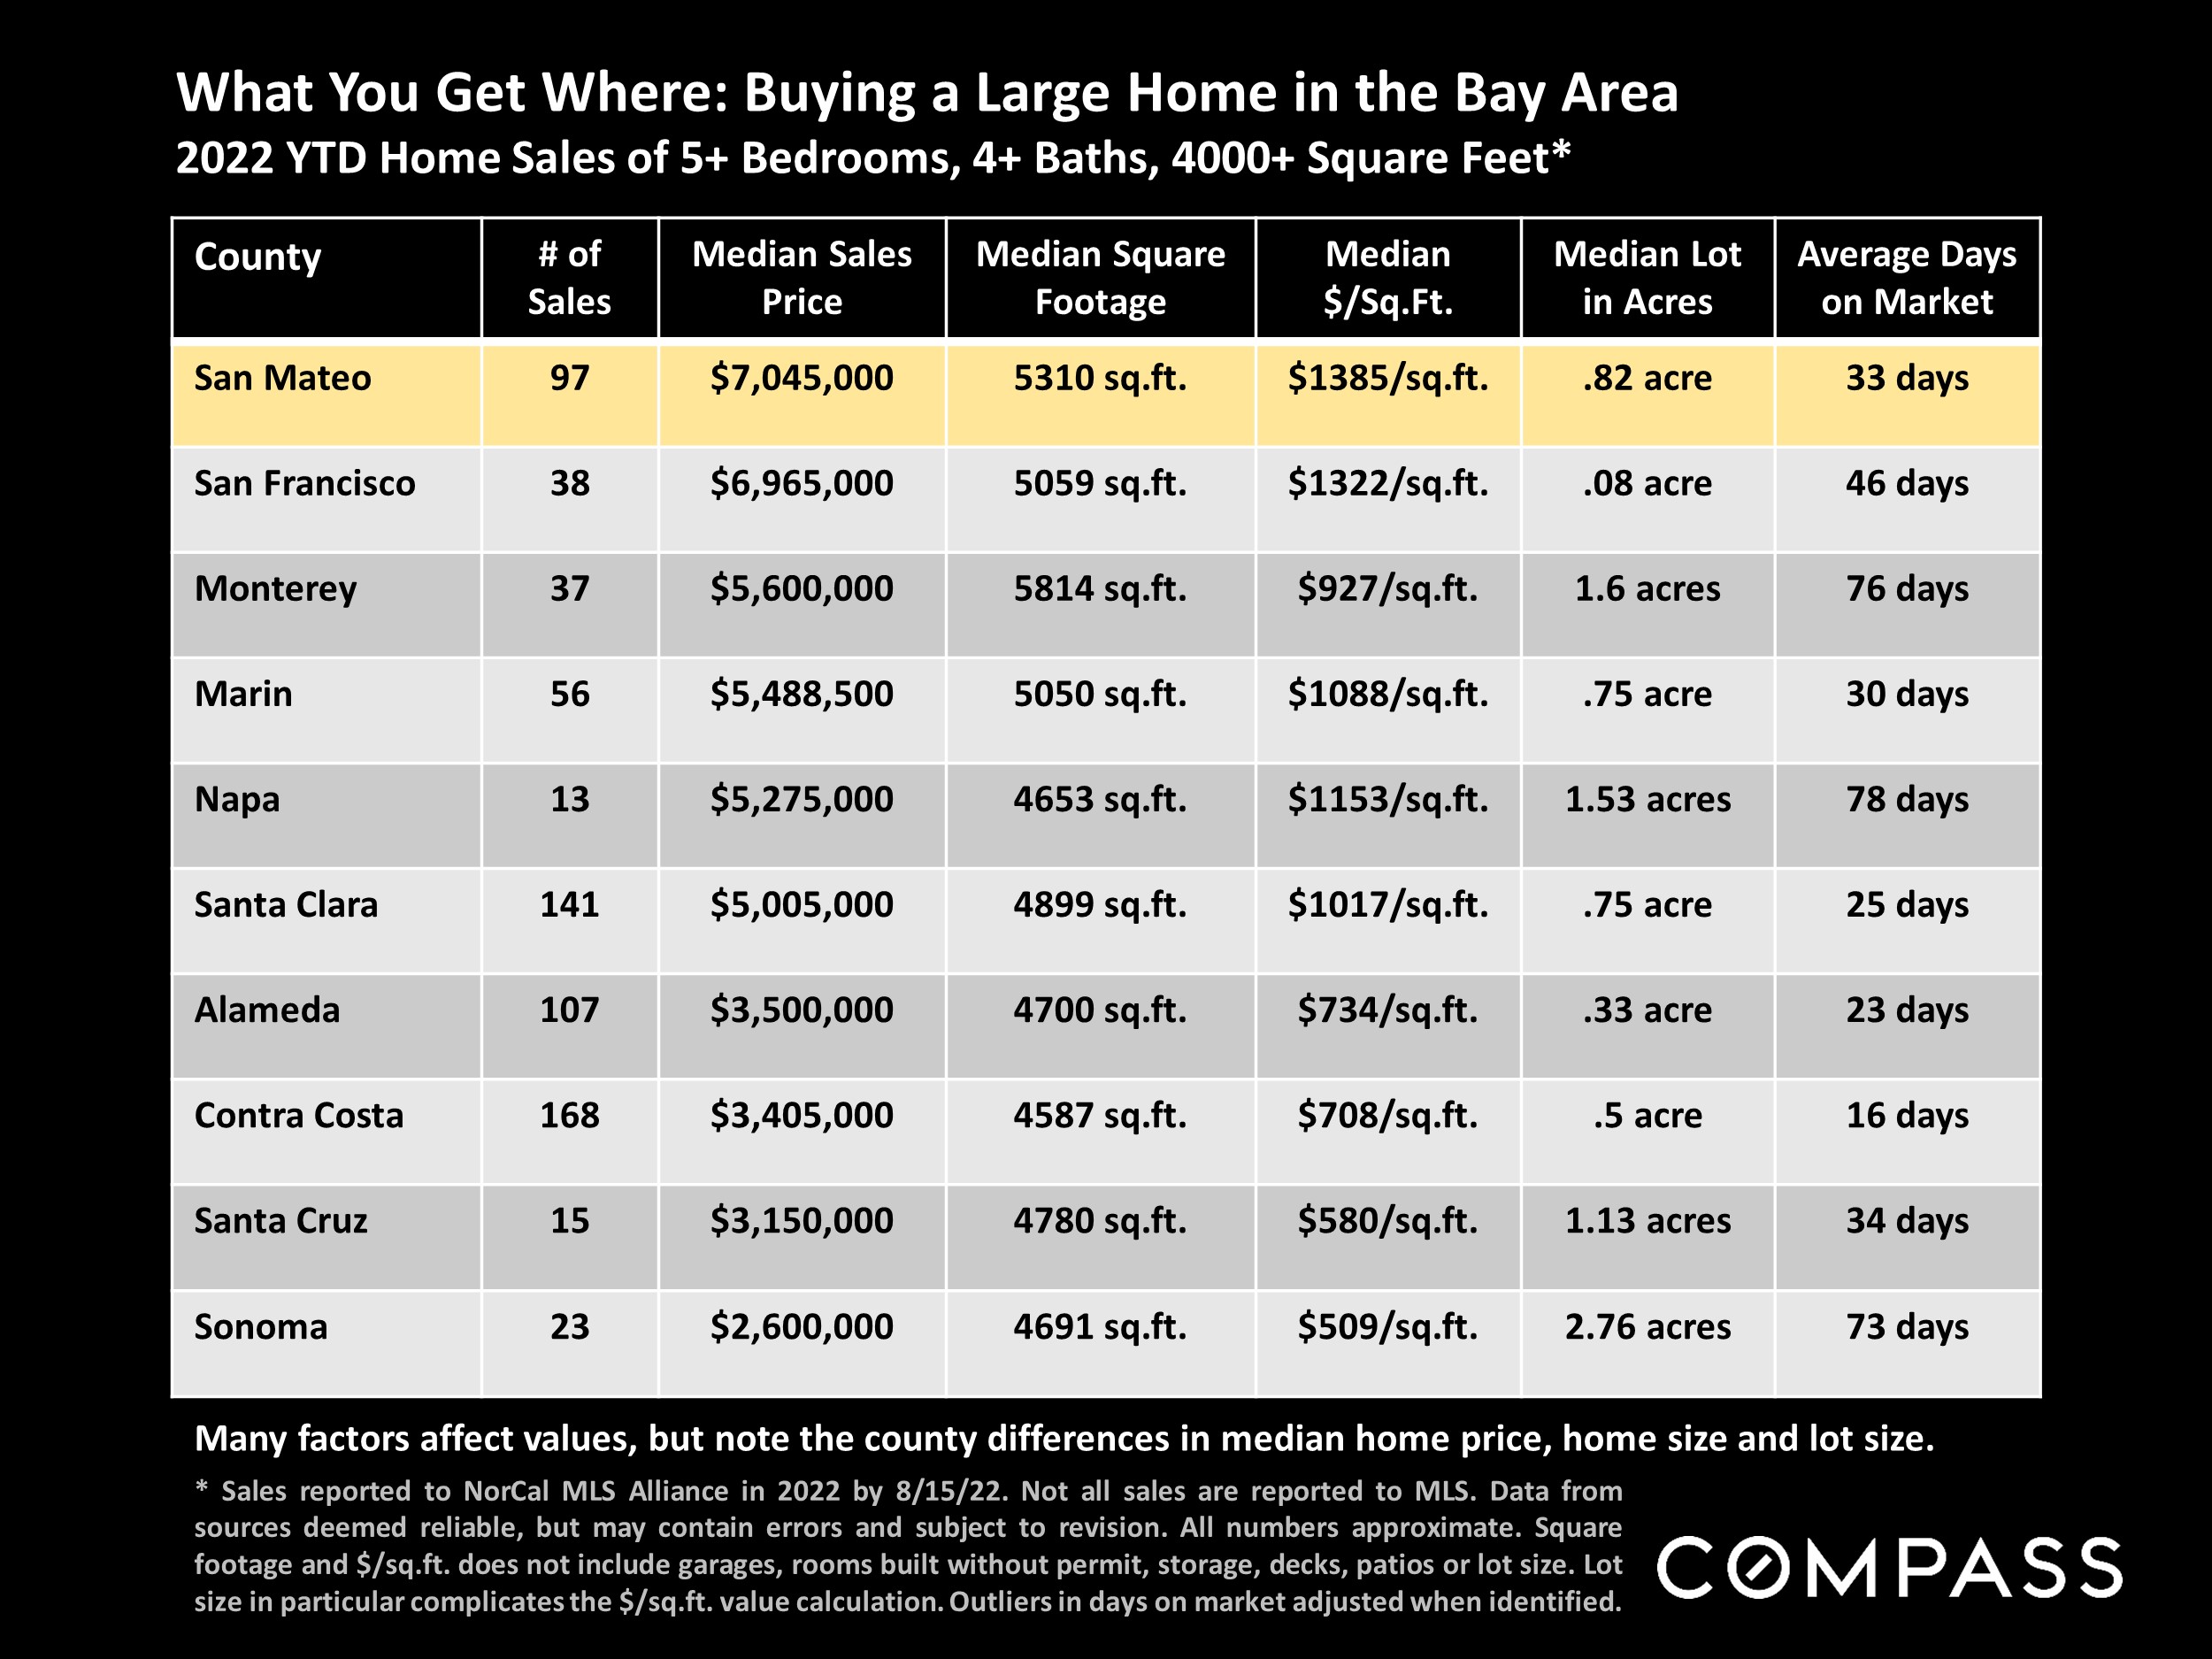
Many aspects of value cannot be adequately reflected in median and average statistics: curb appeal, age, condition, amenities, views, lot size, quality of outdoor space, “bonus” rooms, additional parking, quality of location within the neighborhood, and so on. How any of these statistics apply to any particular home is unknown without a specific comparative market analysis.

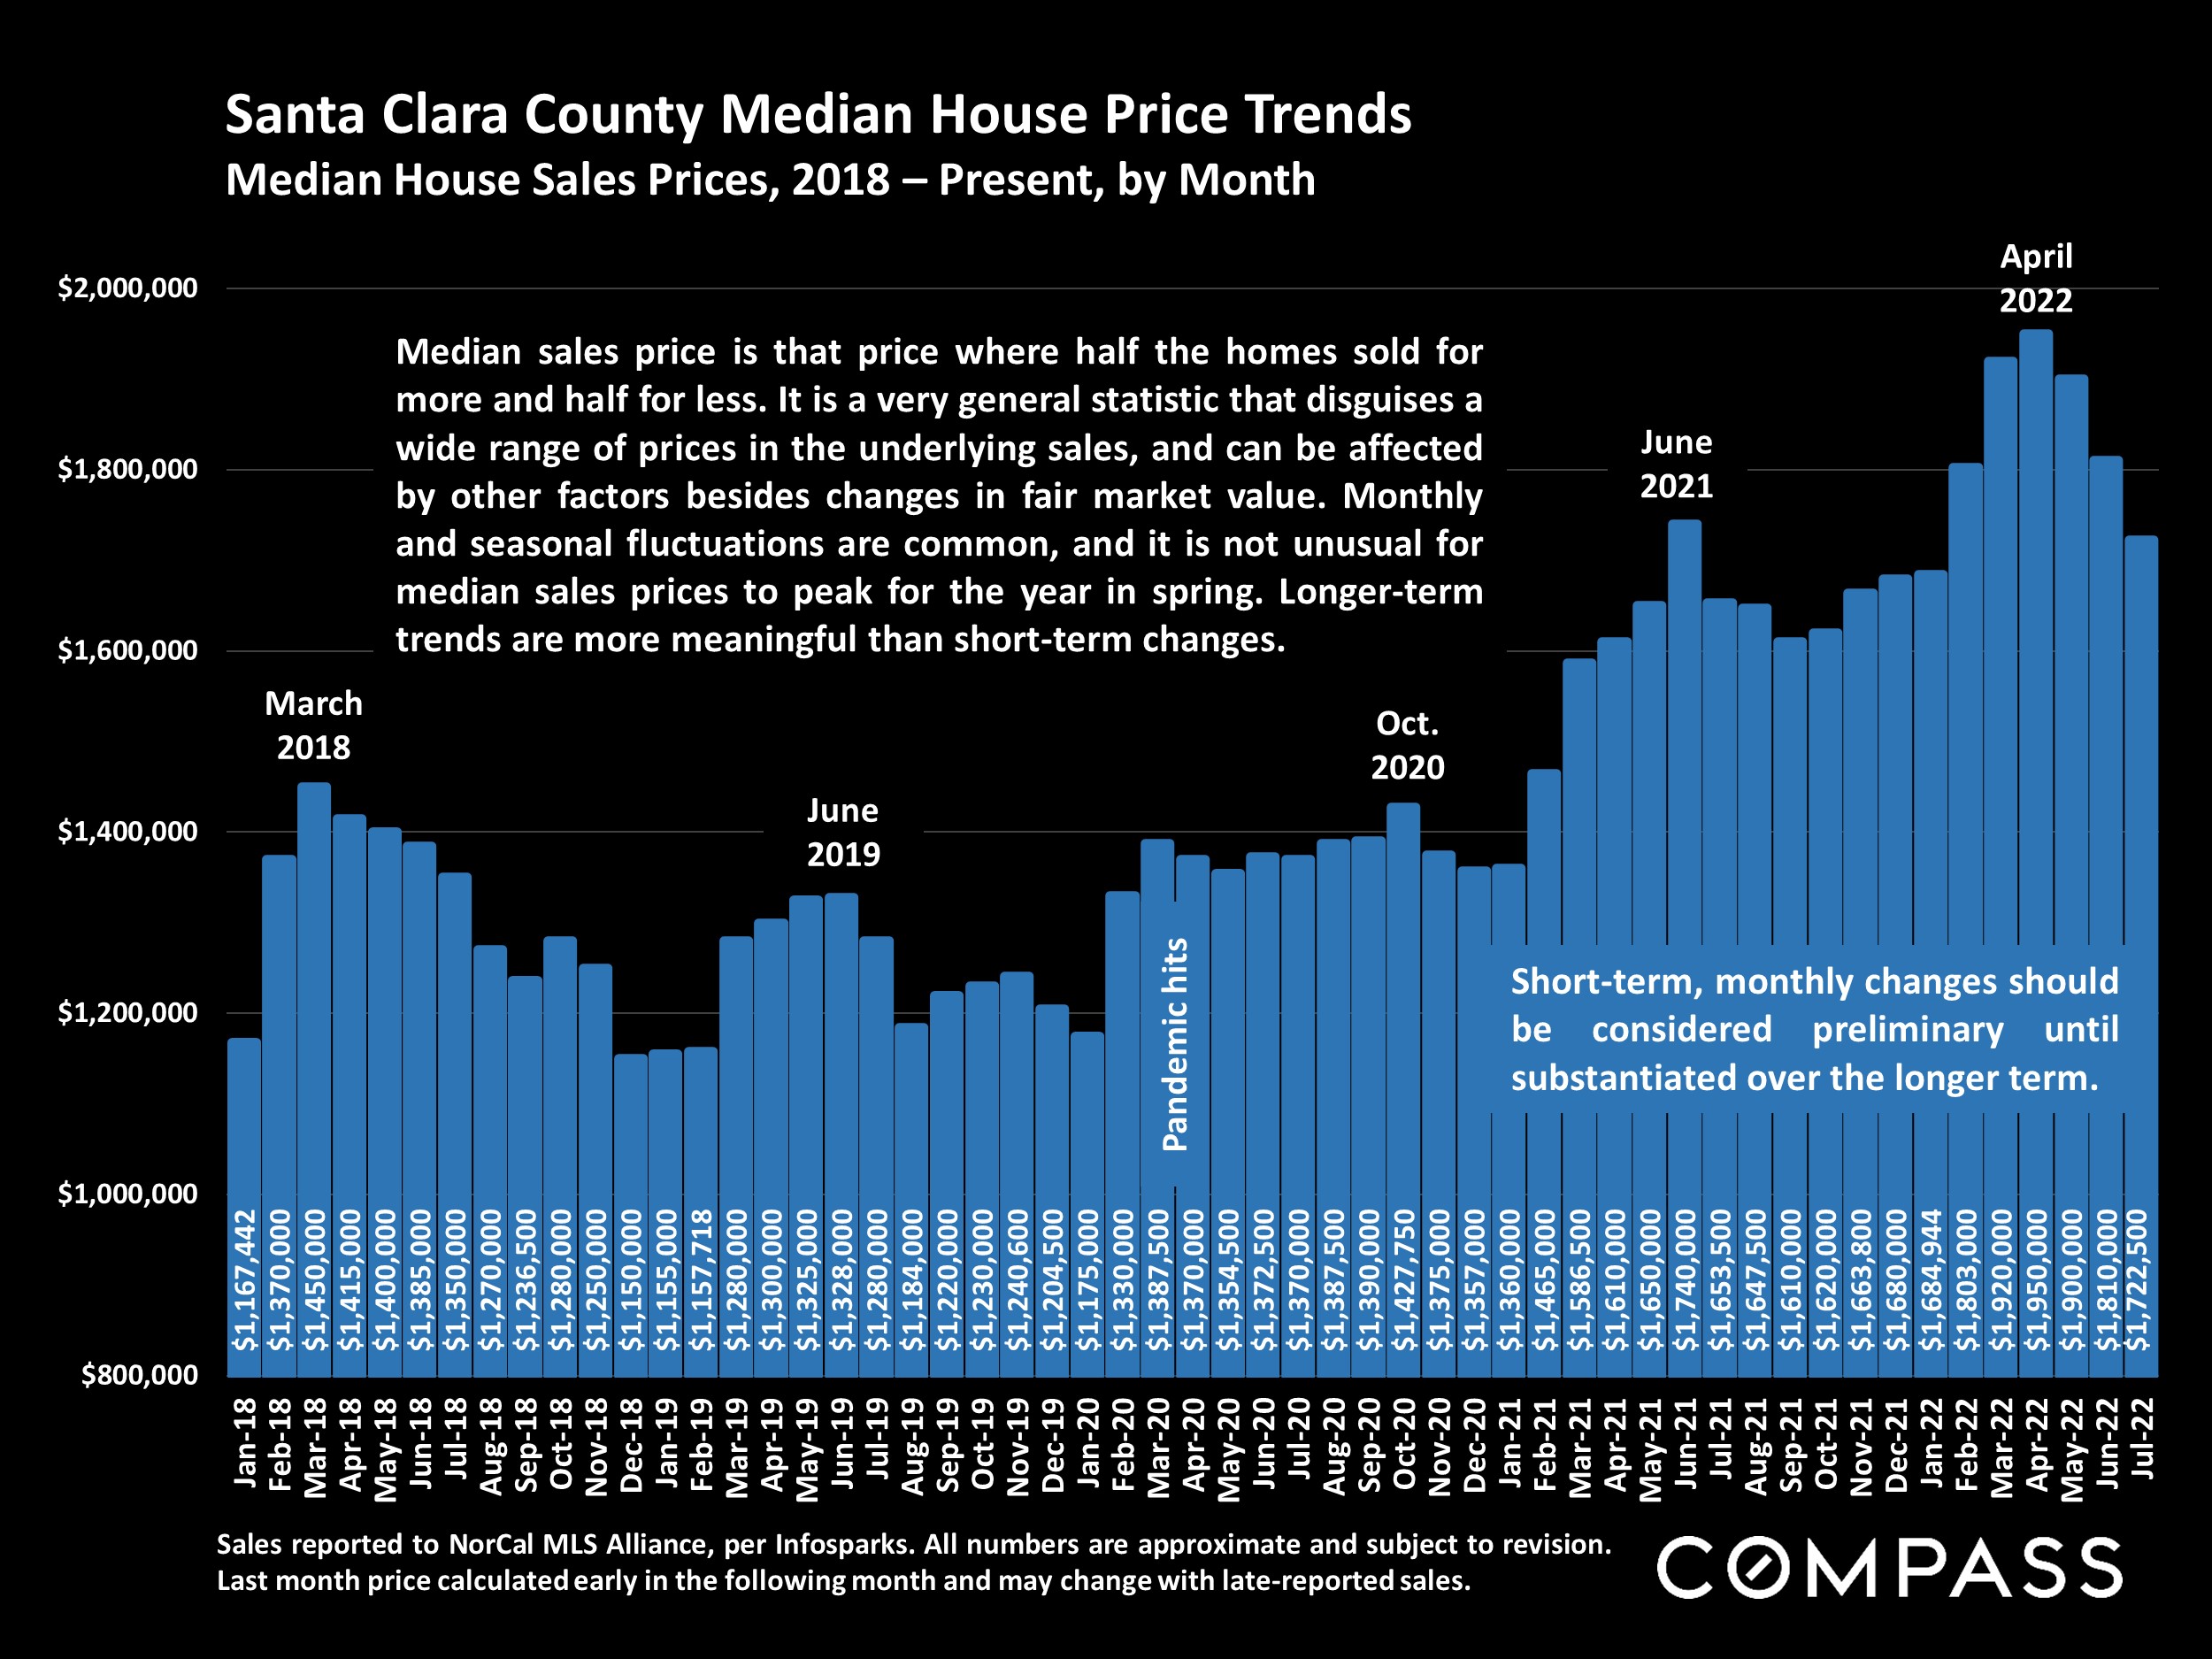
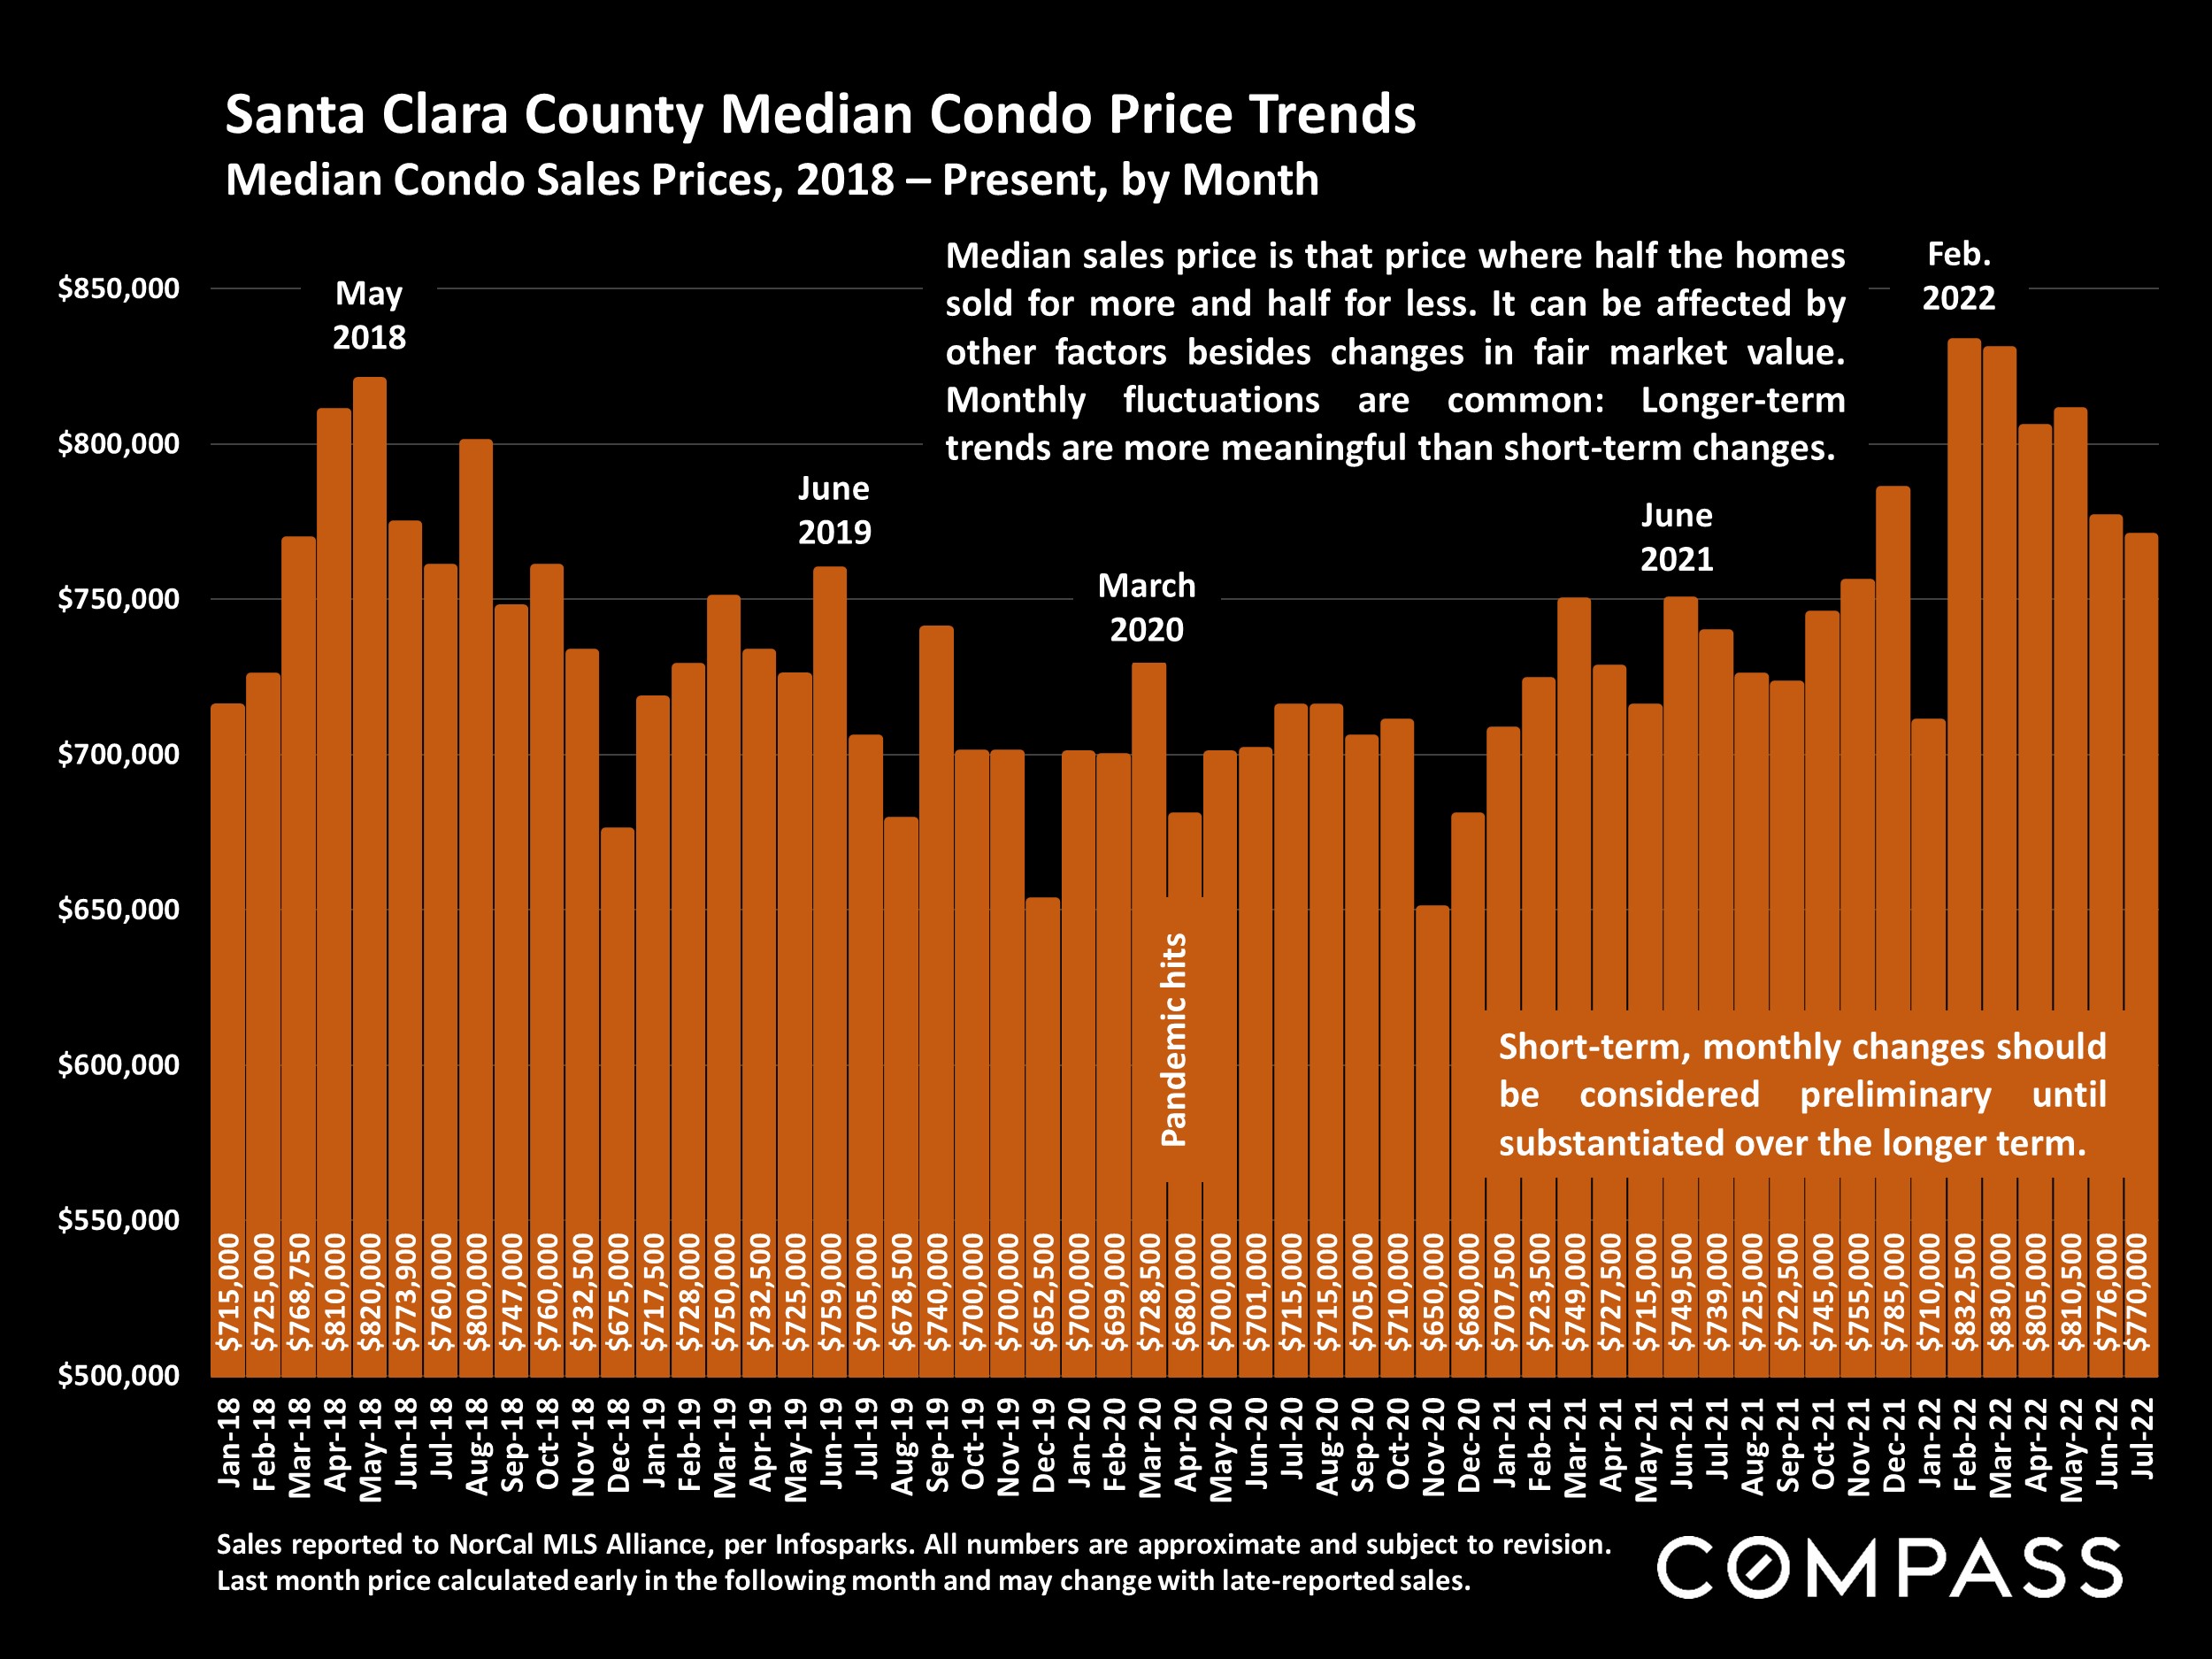
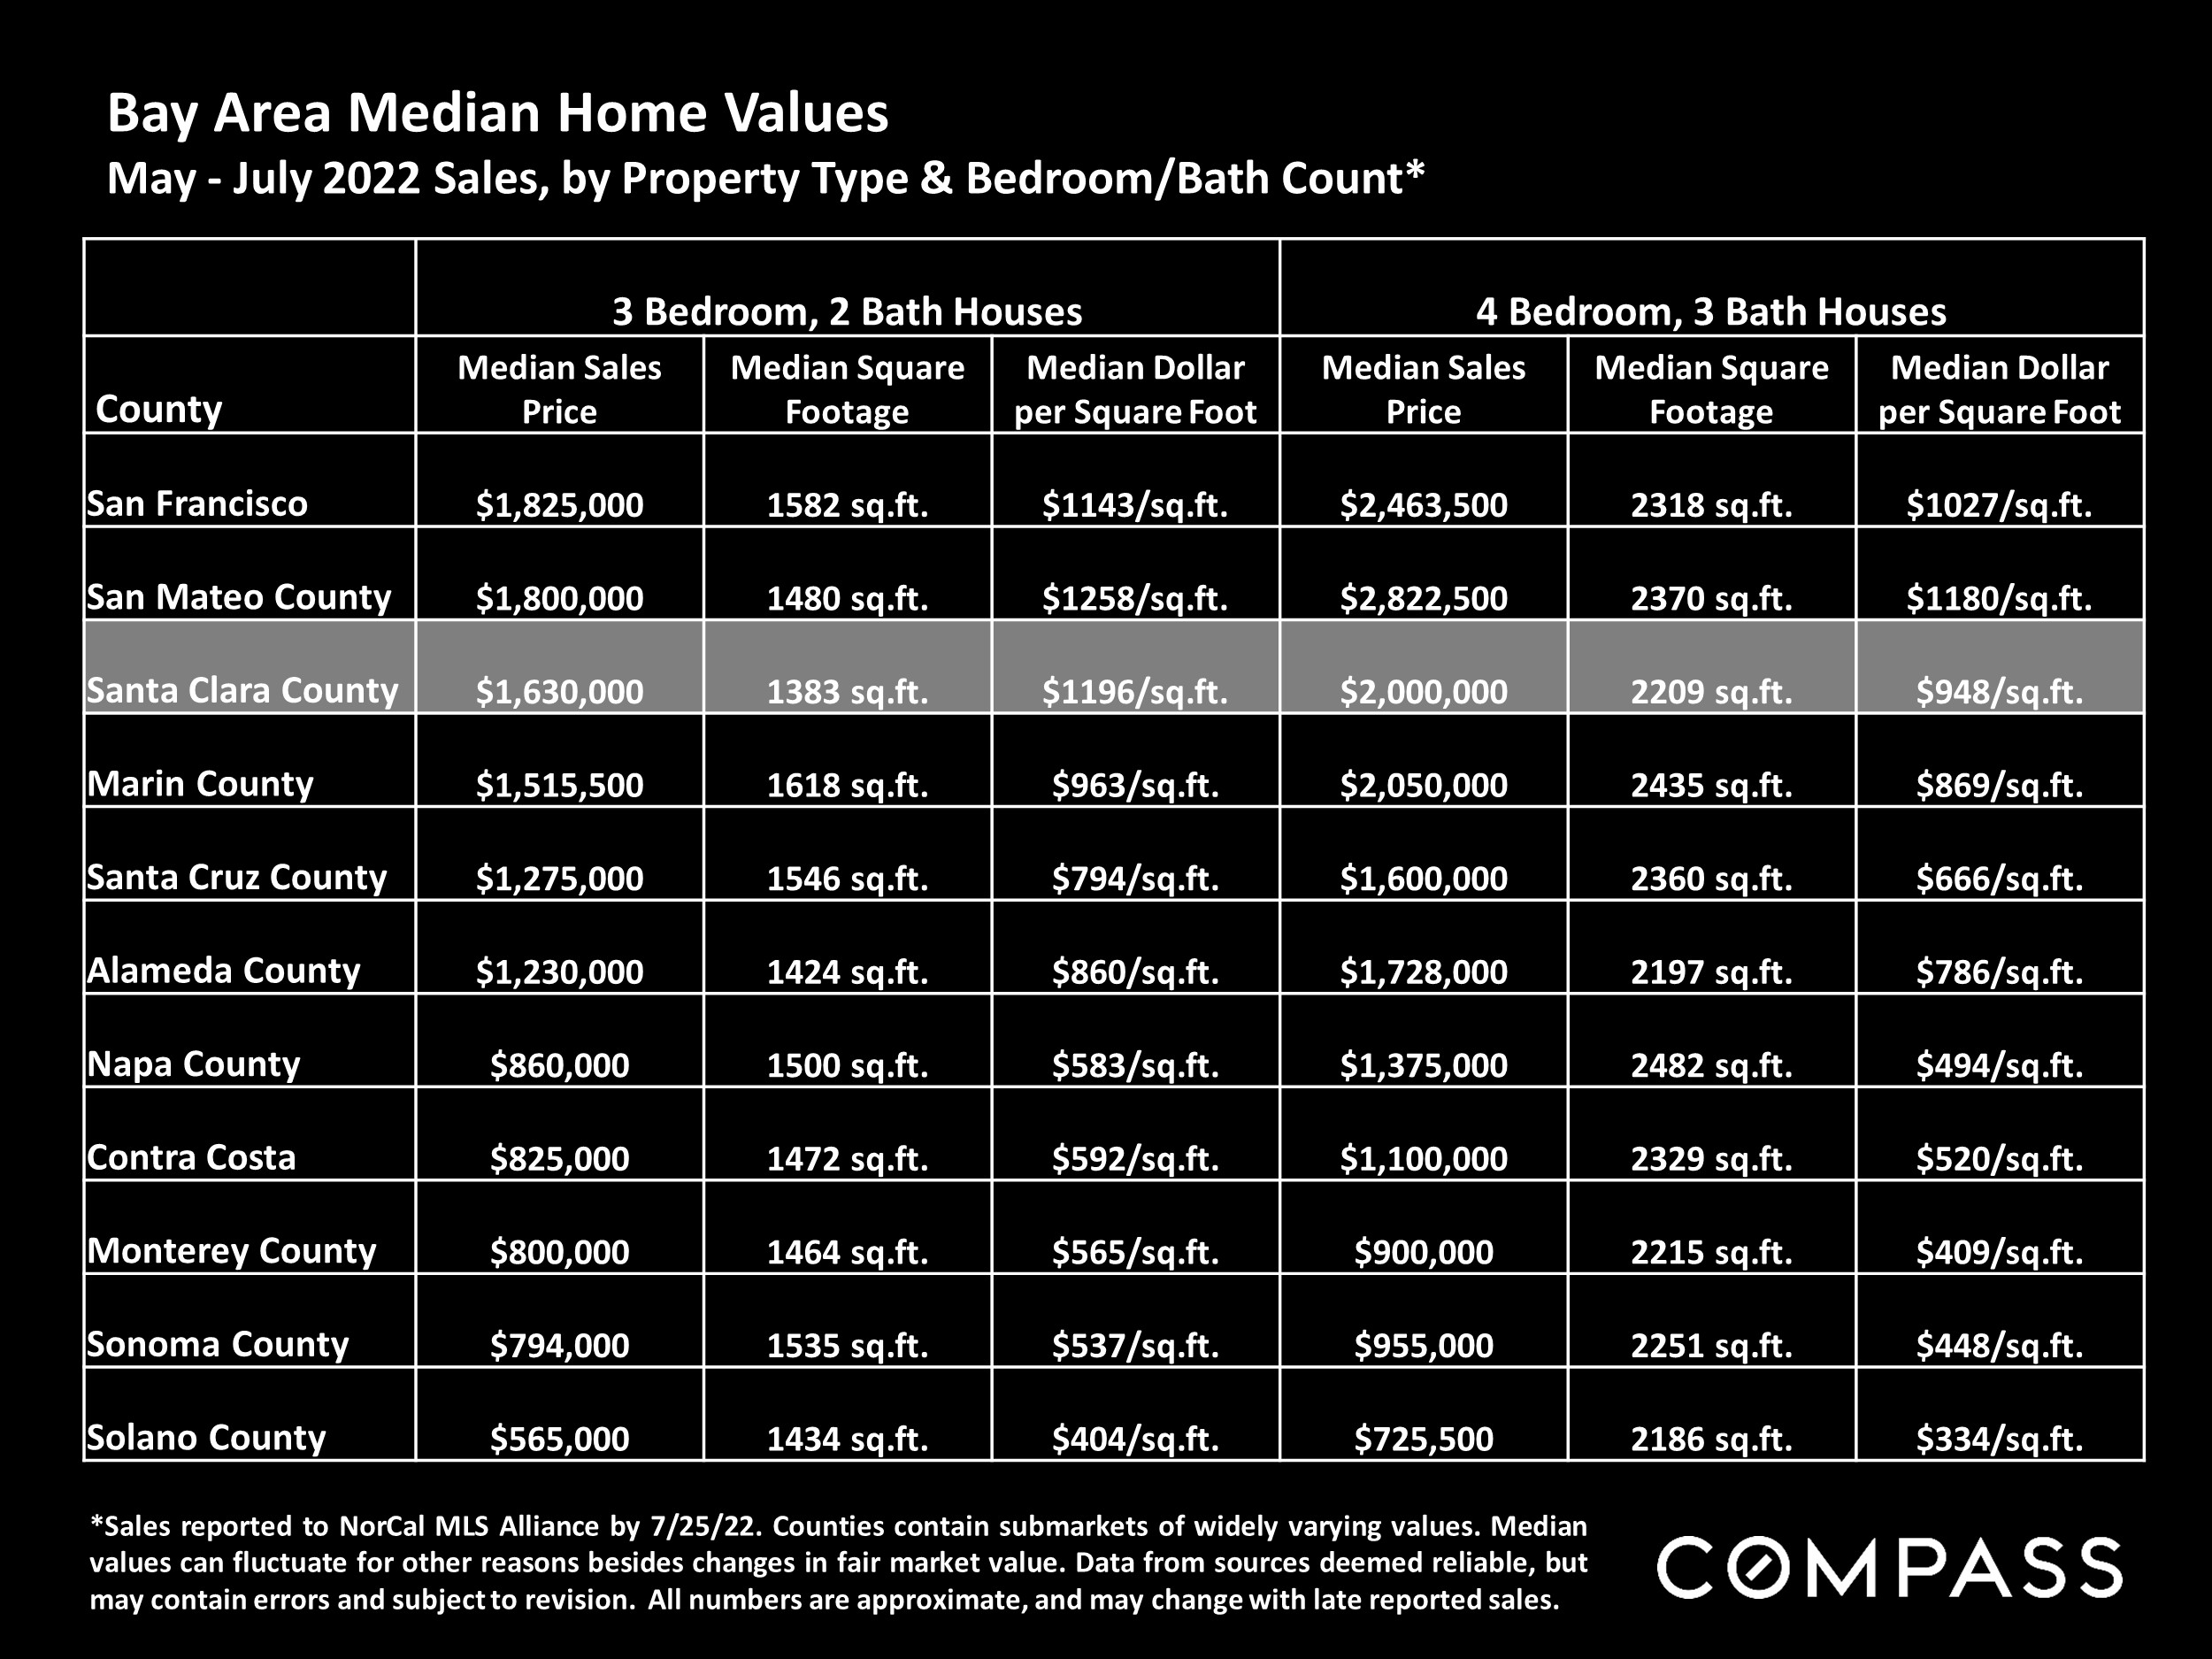
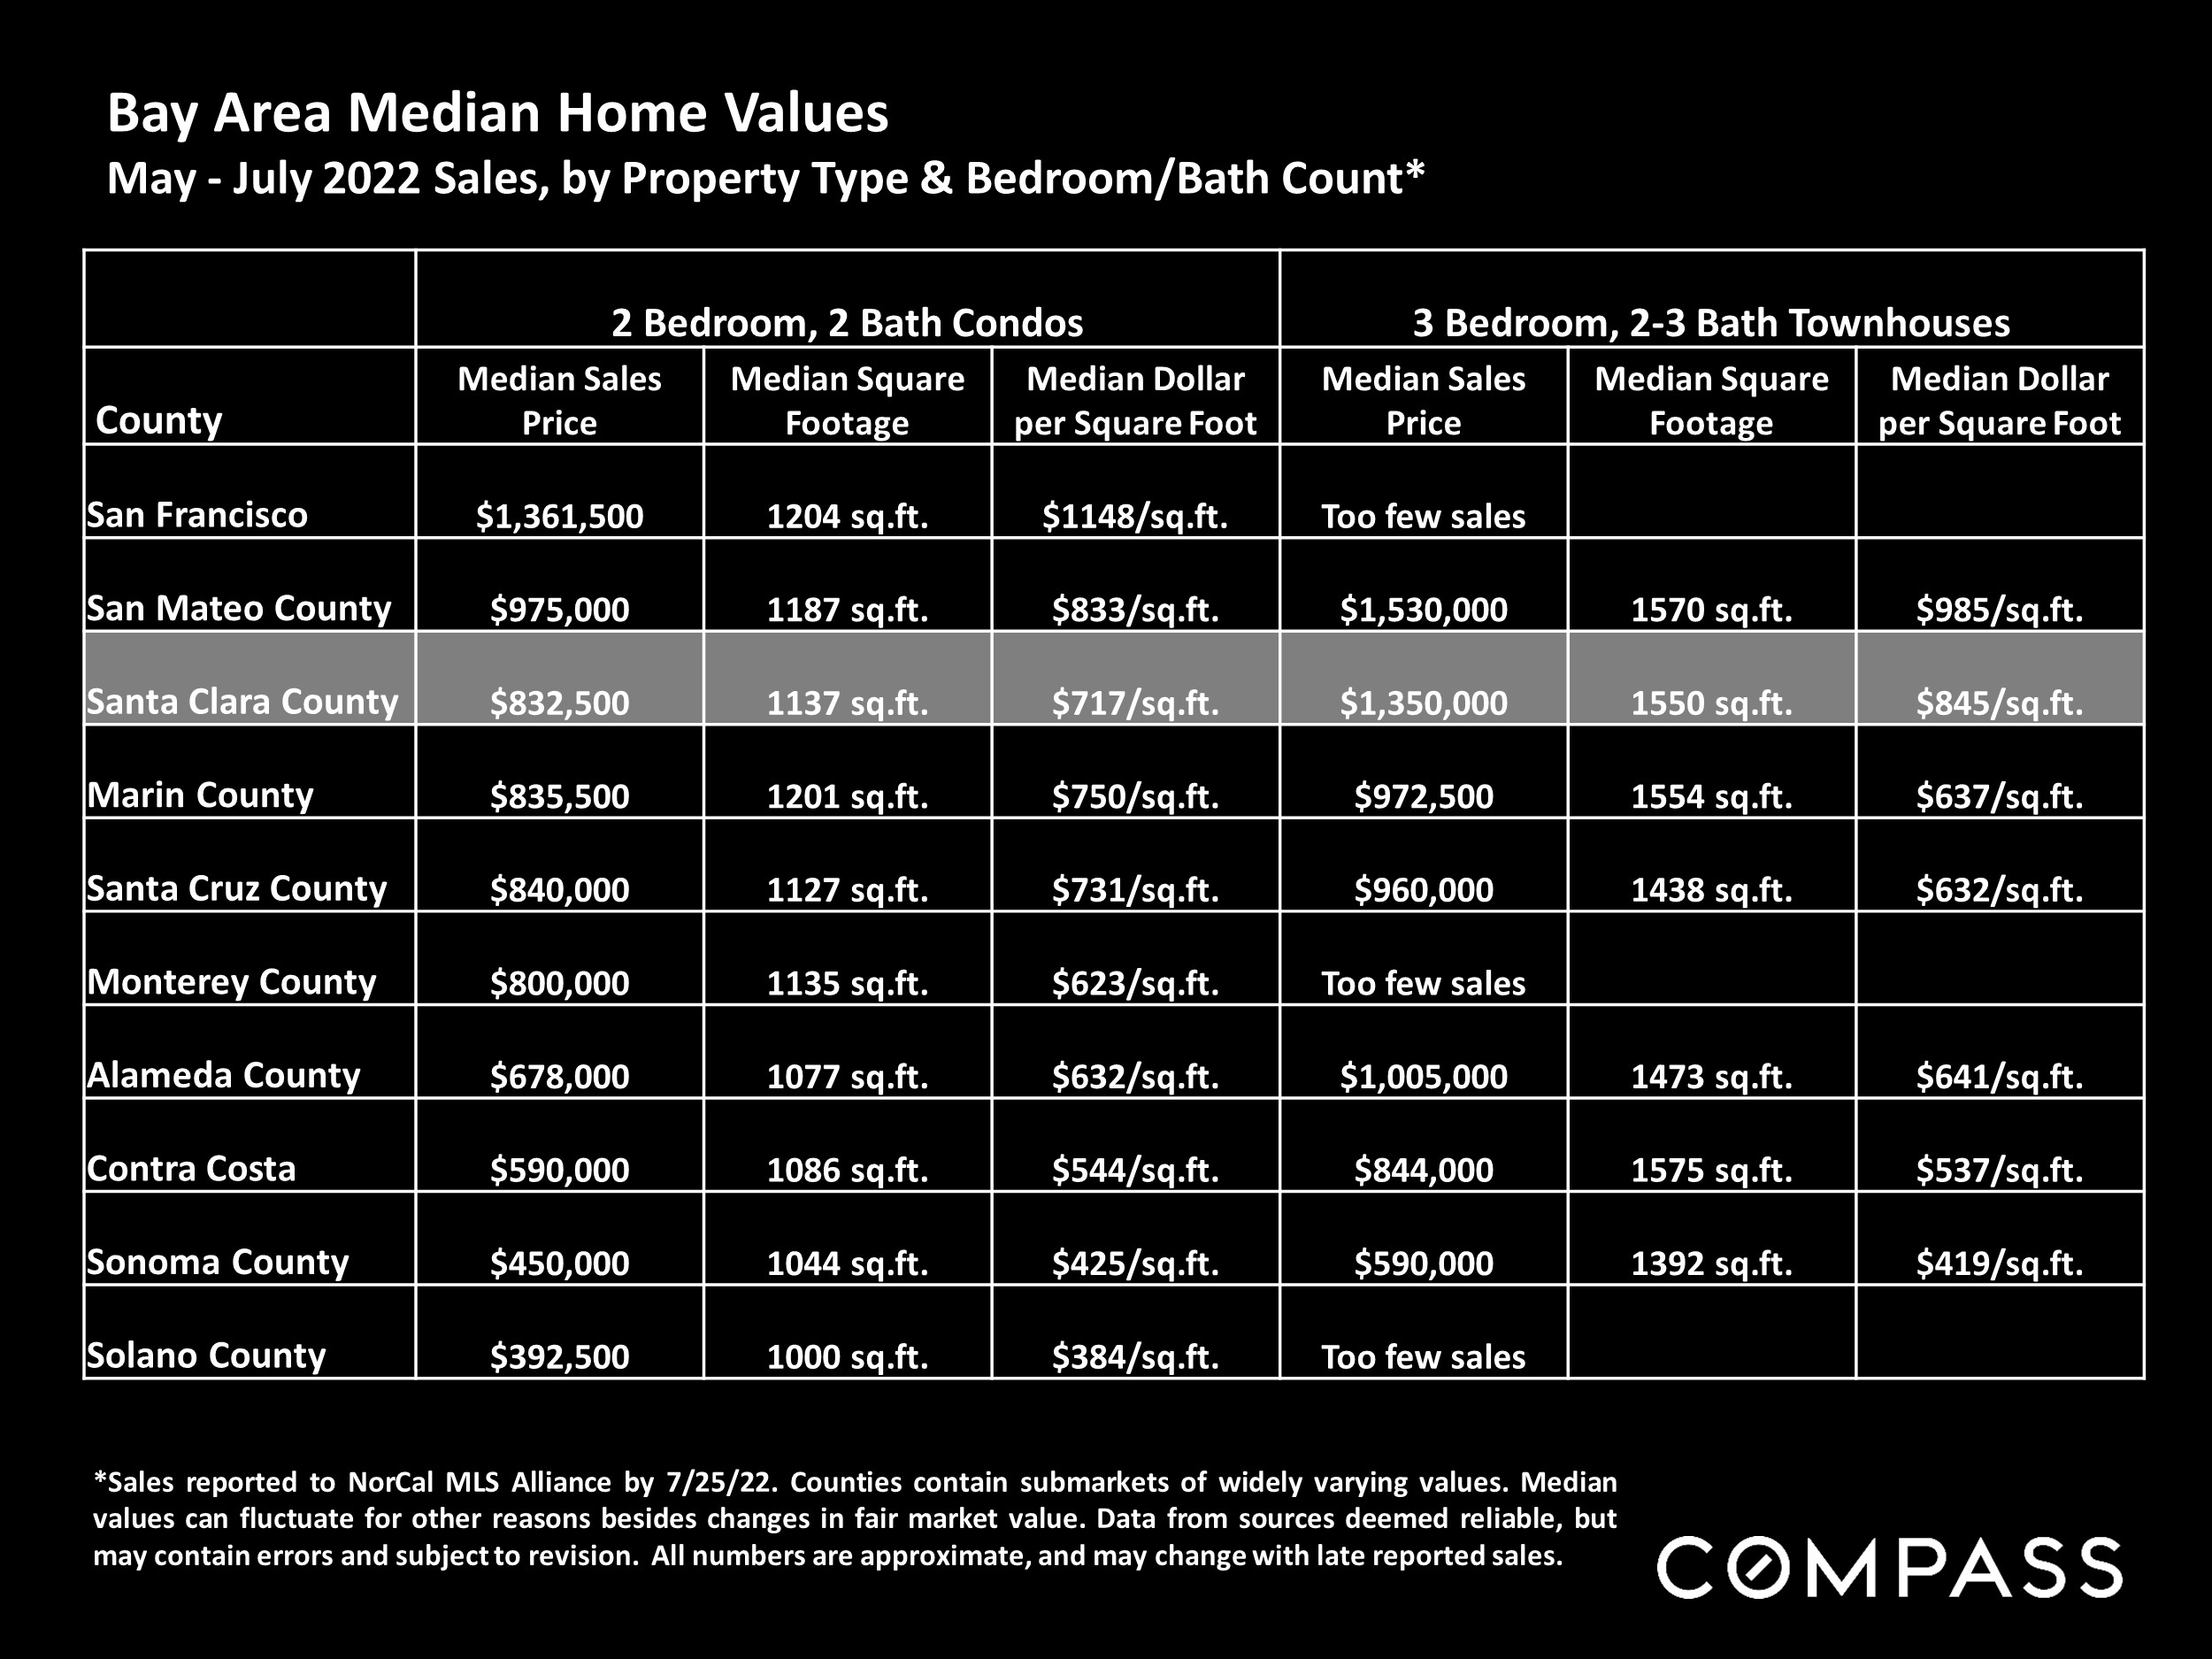
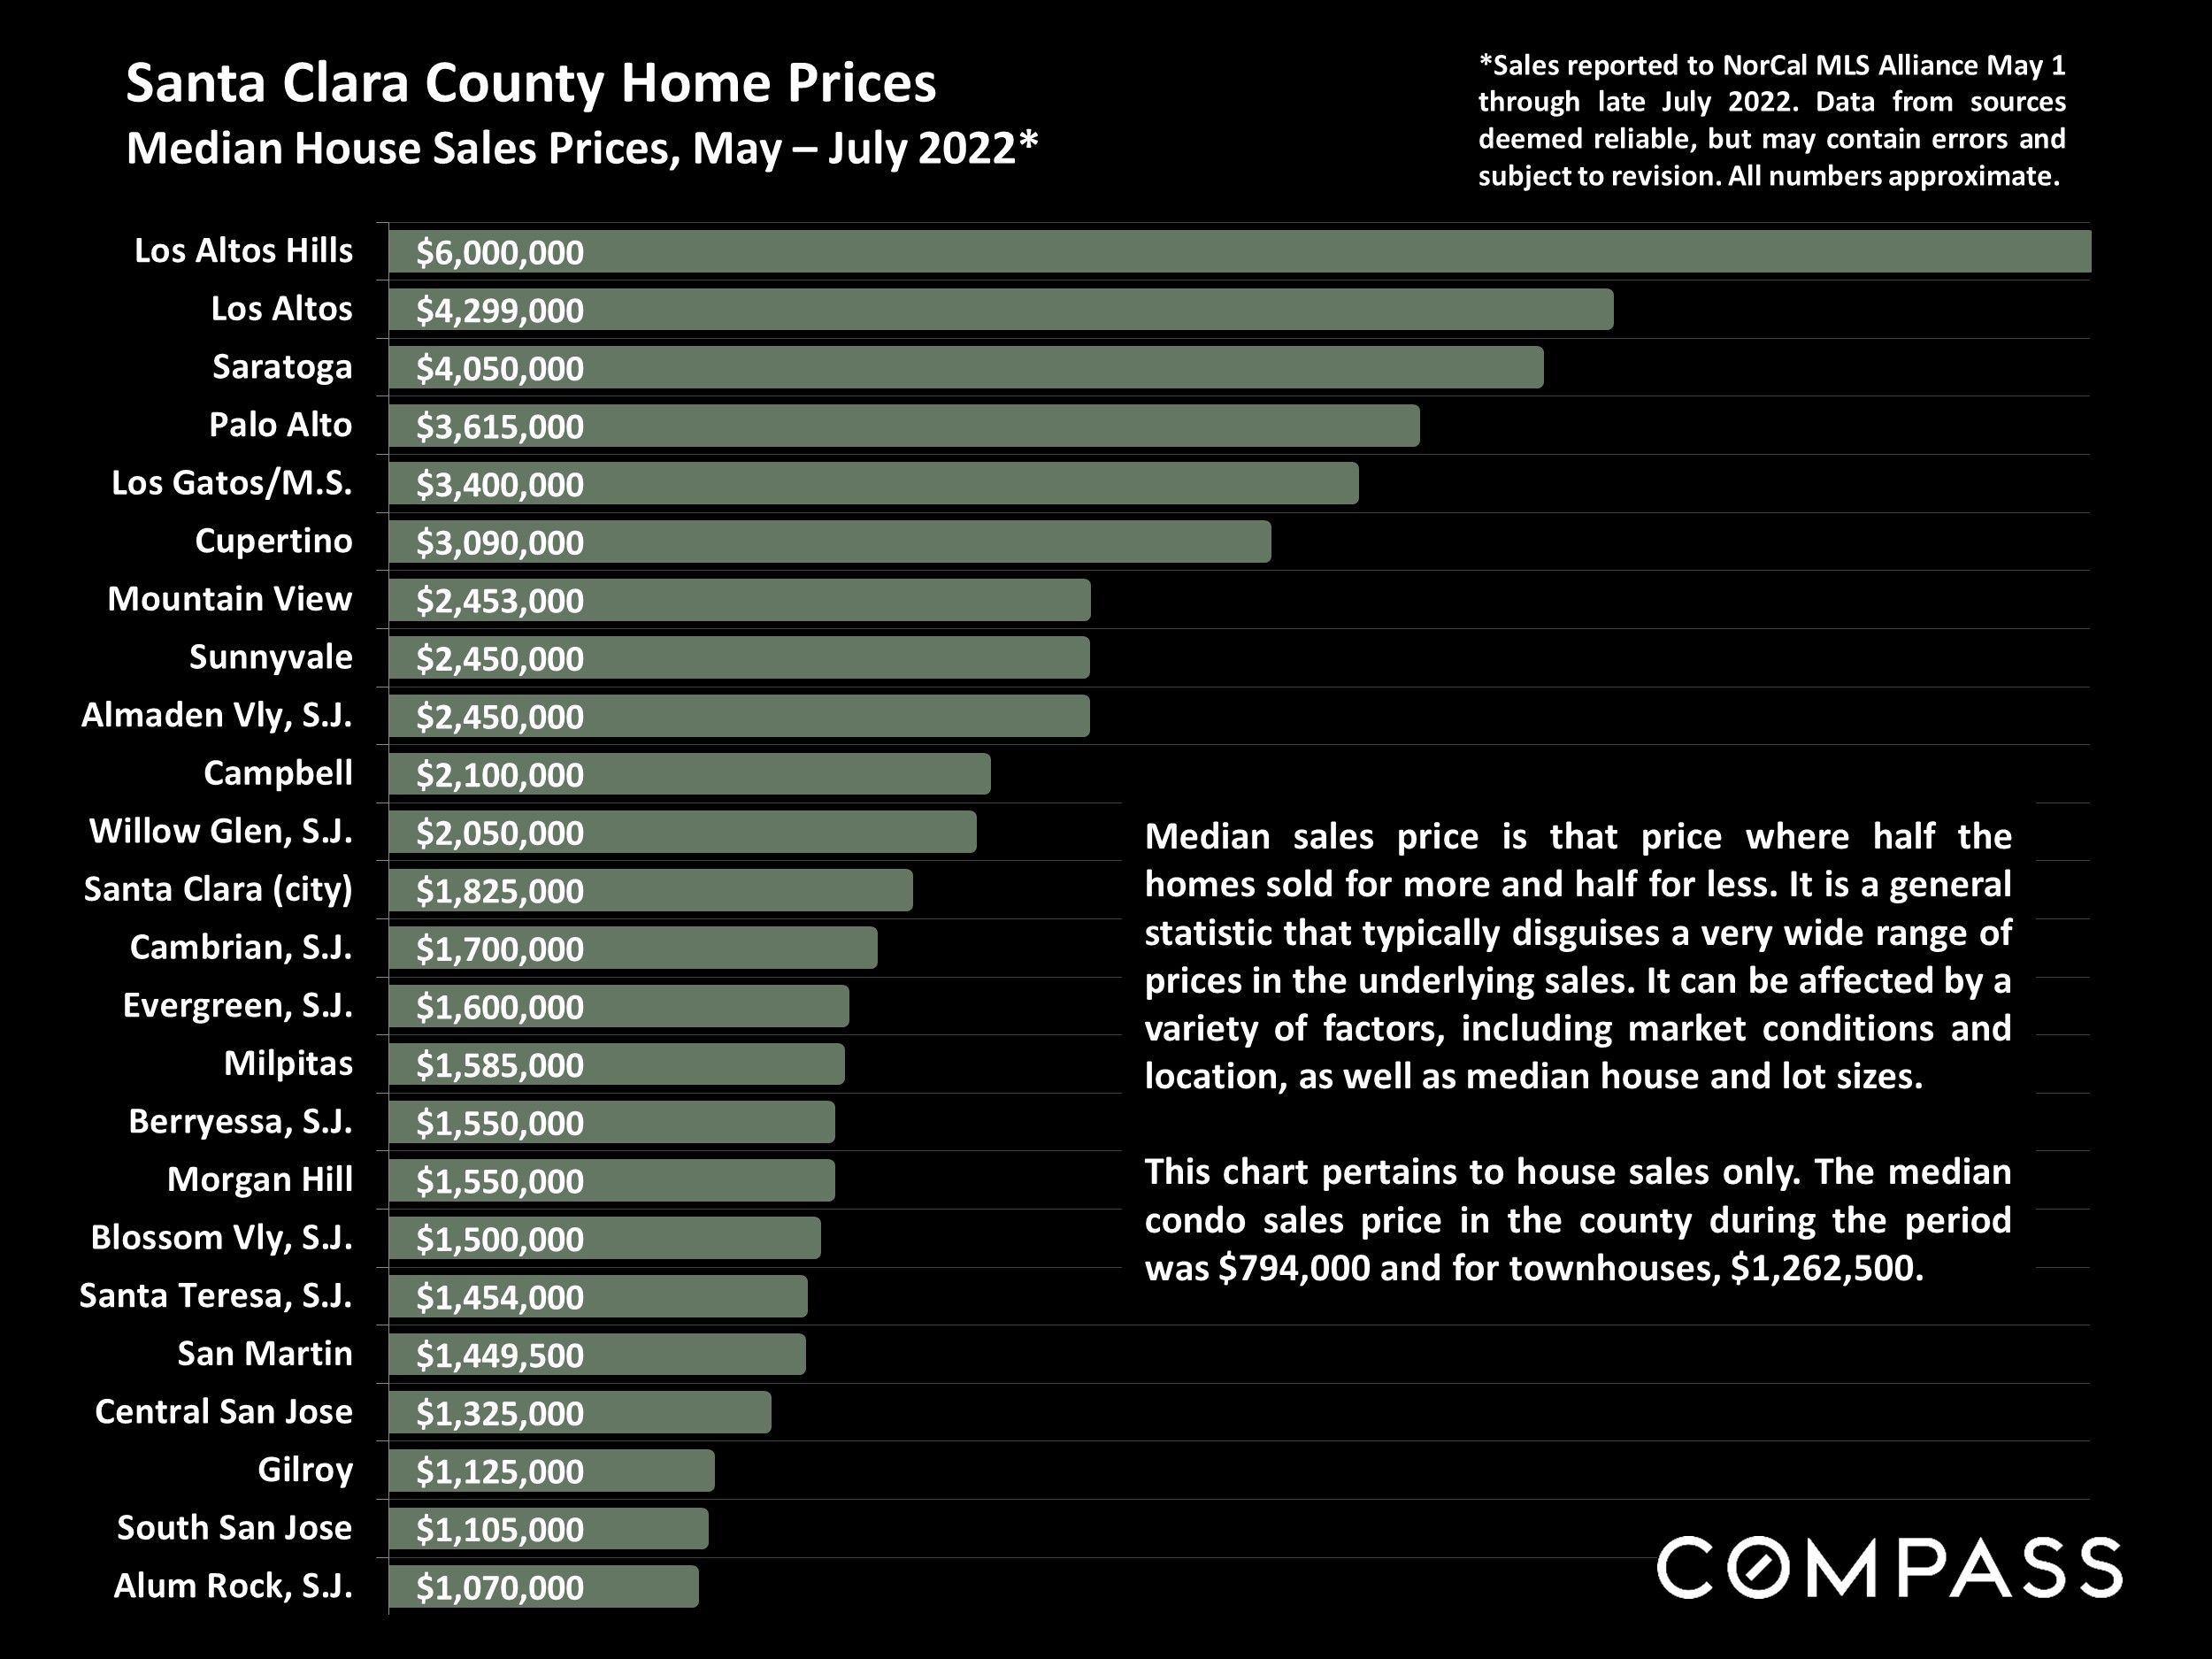
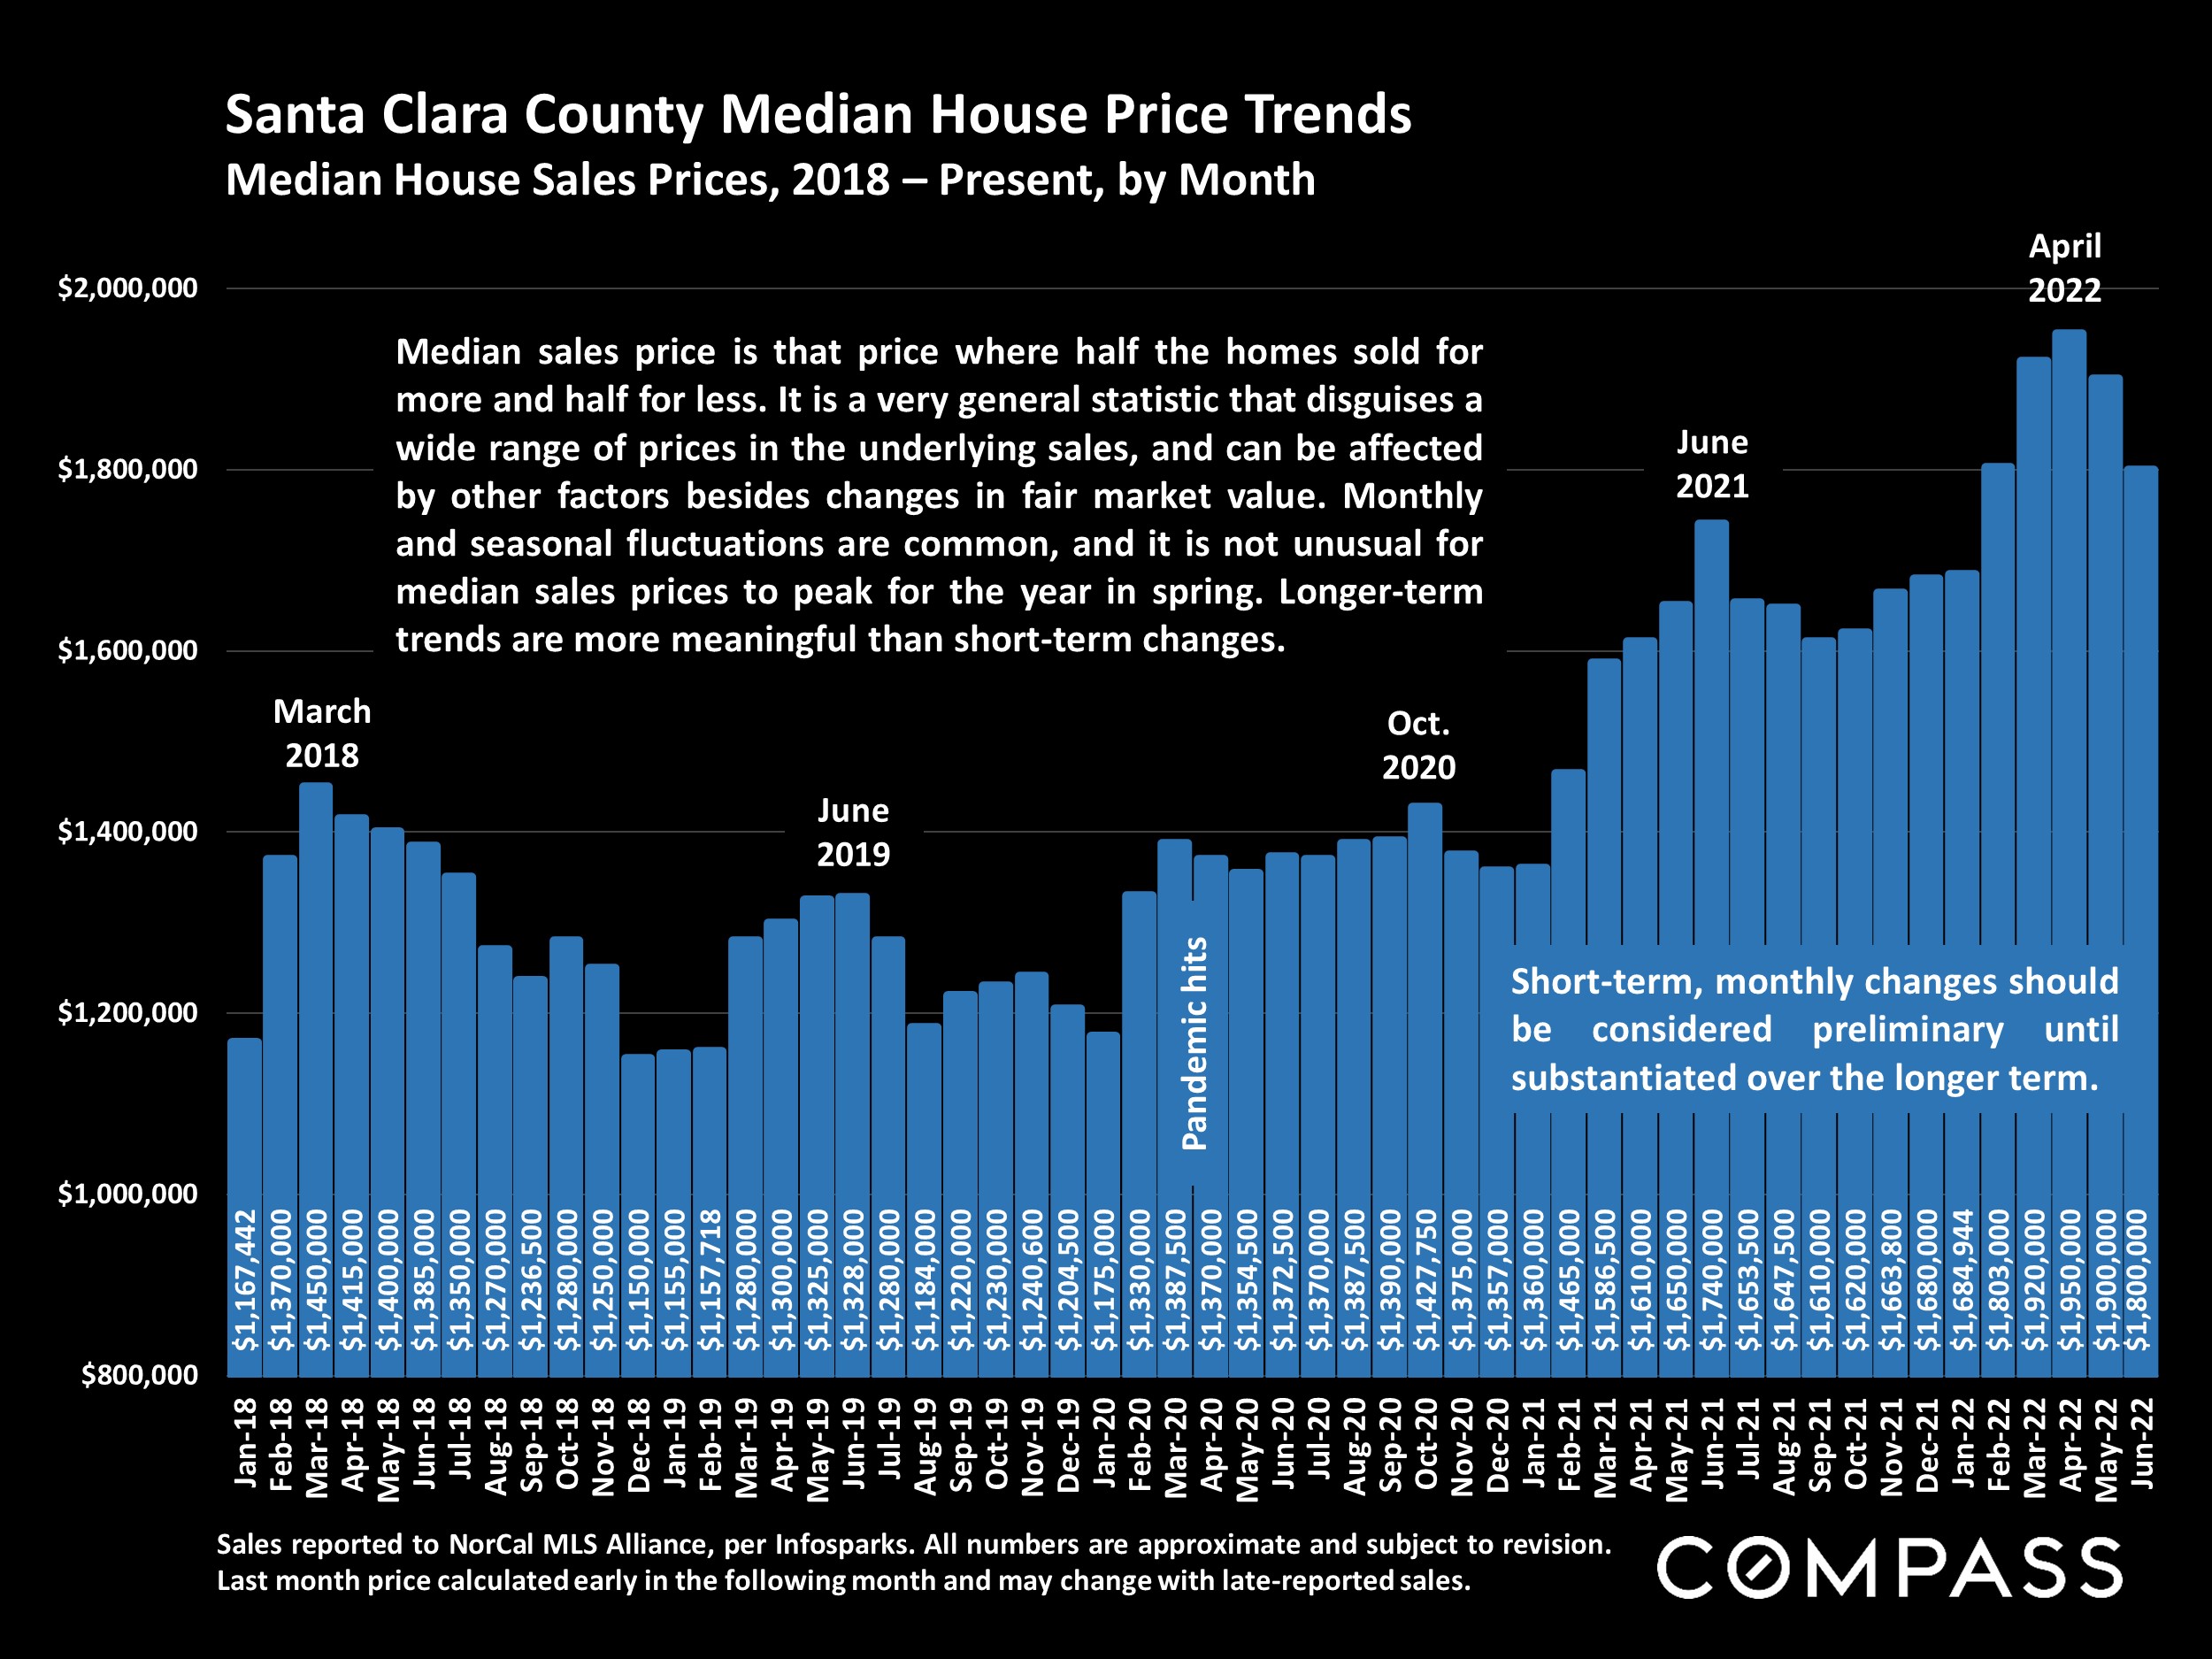
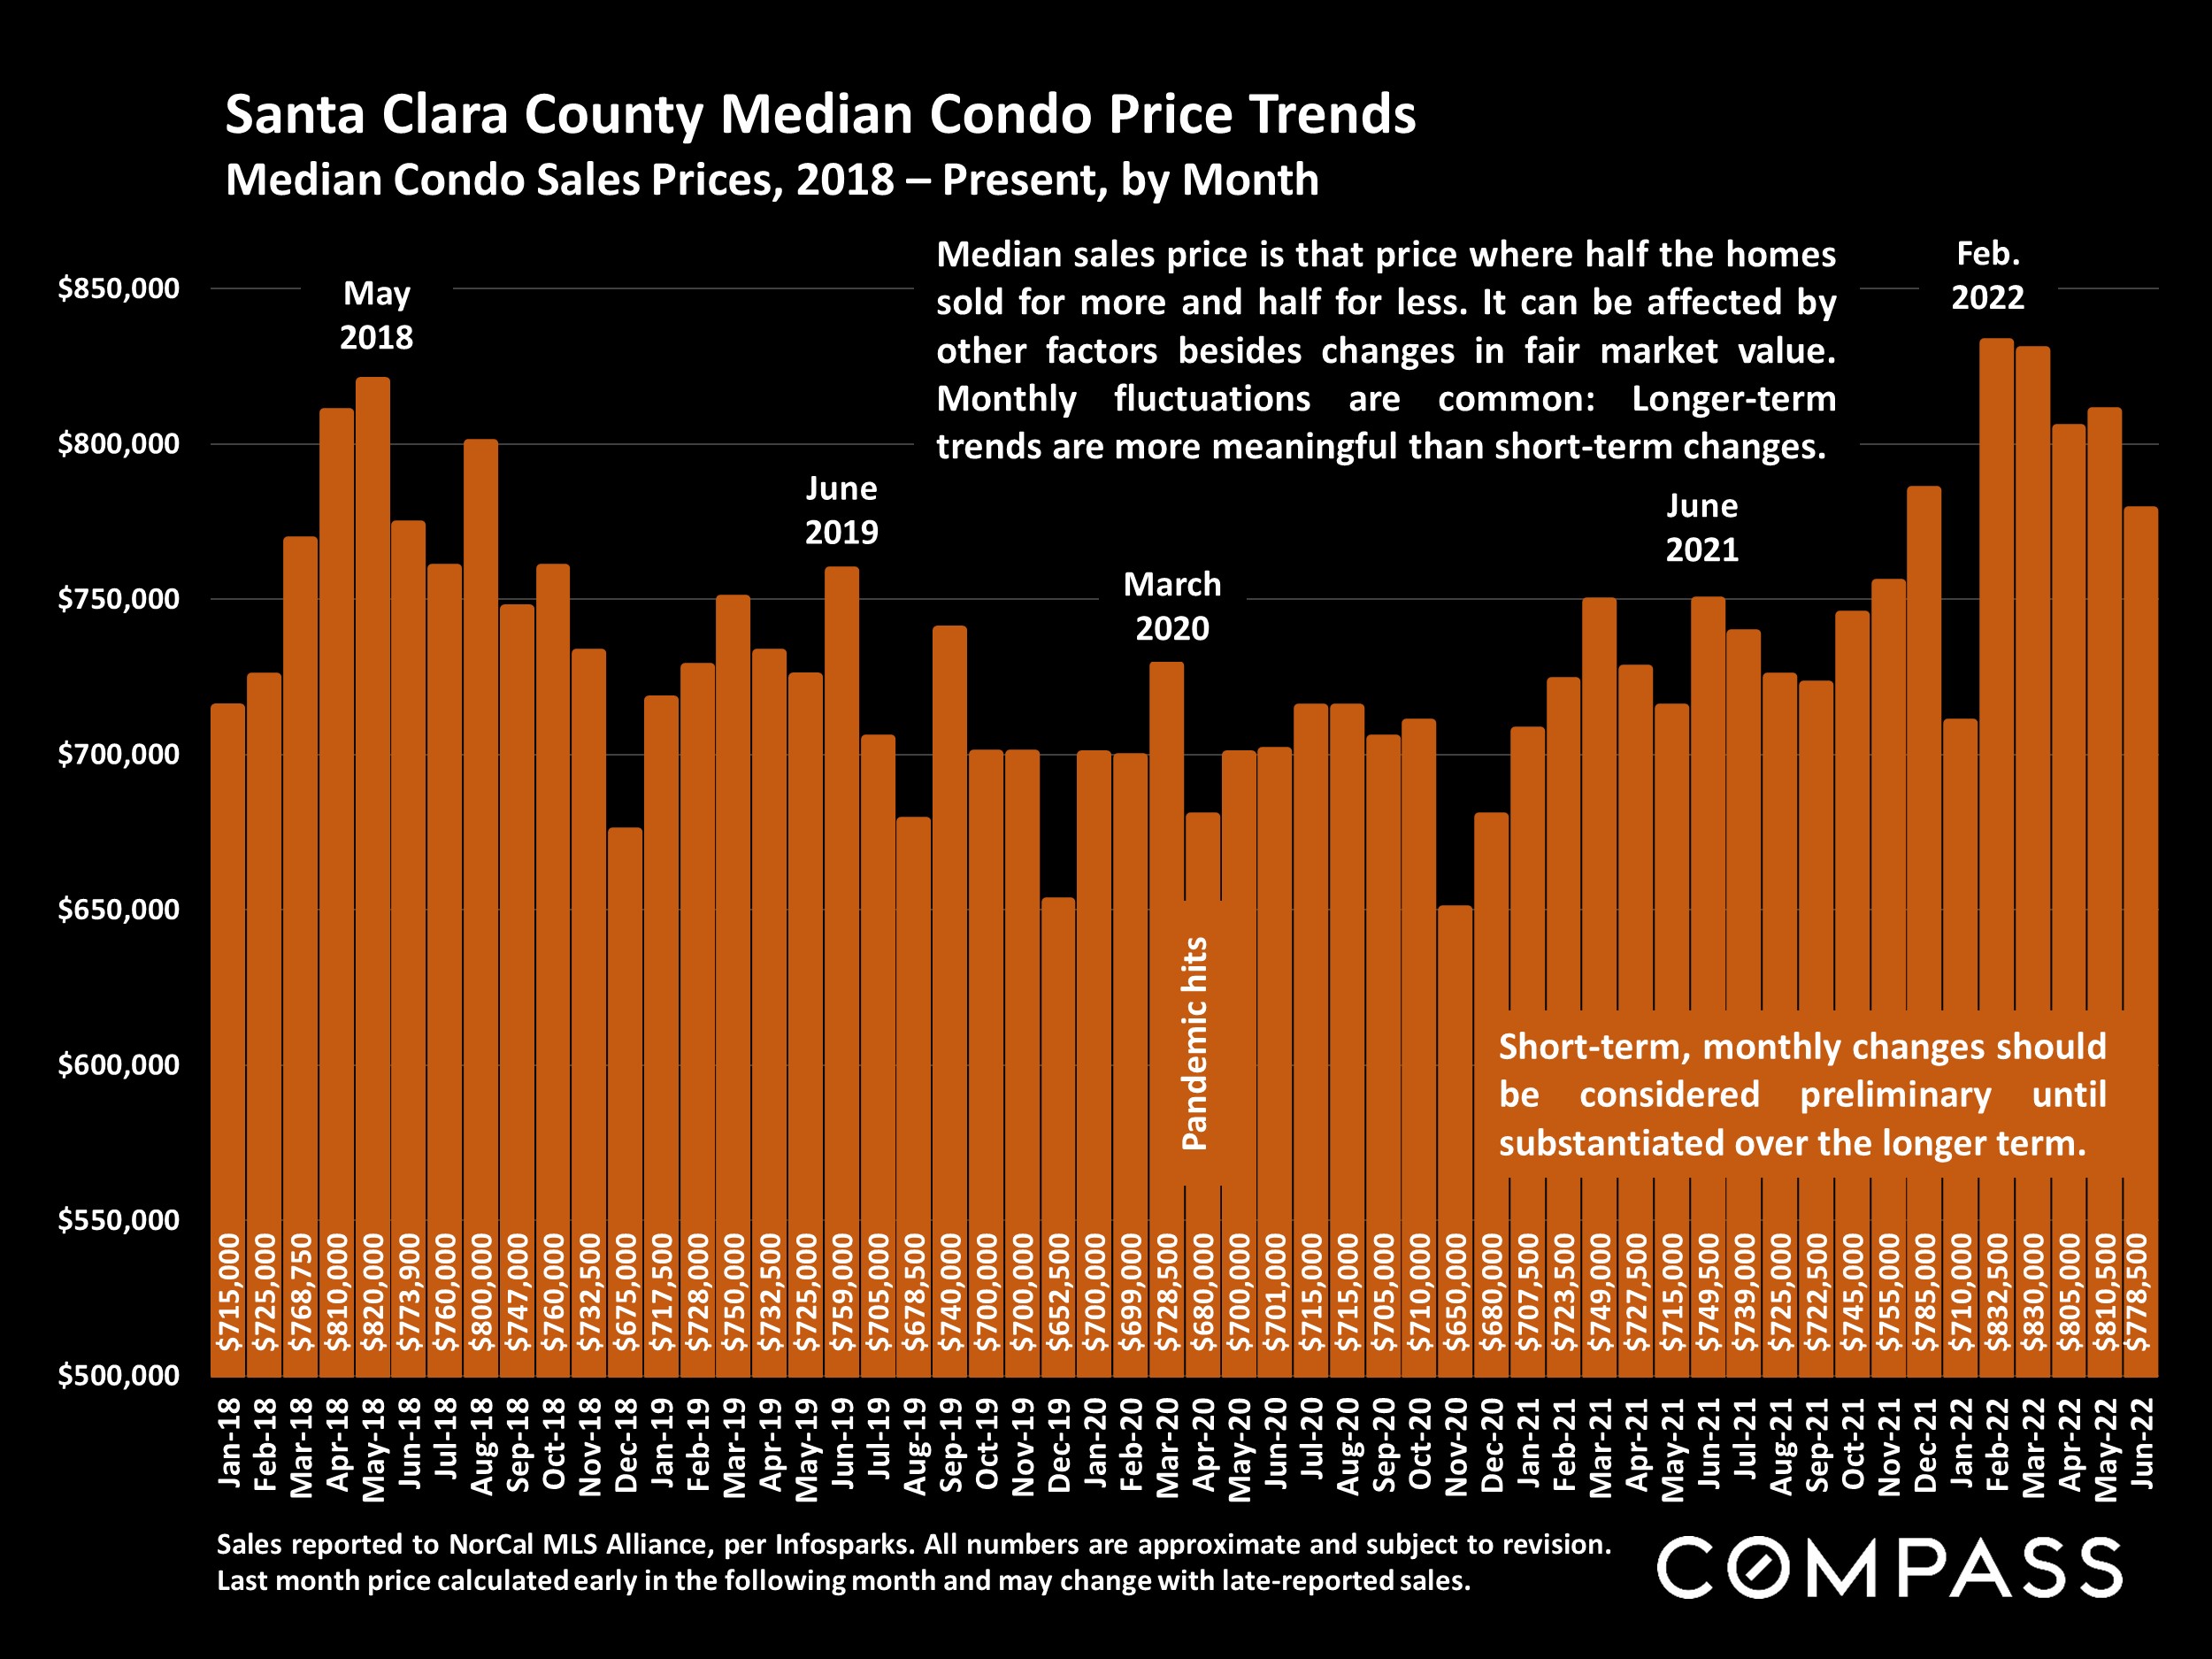
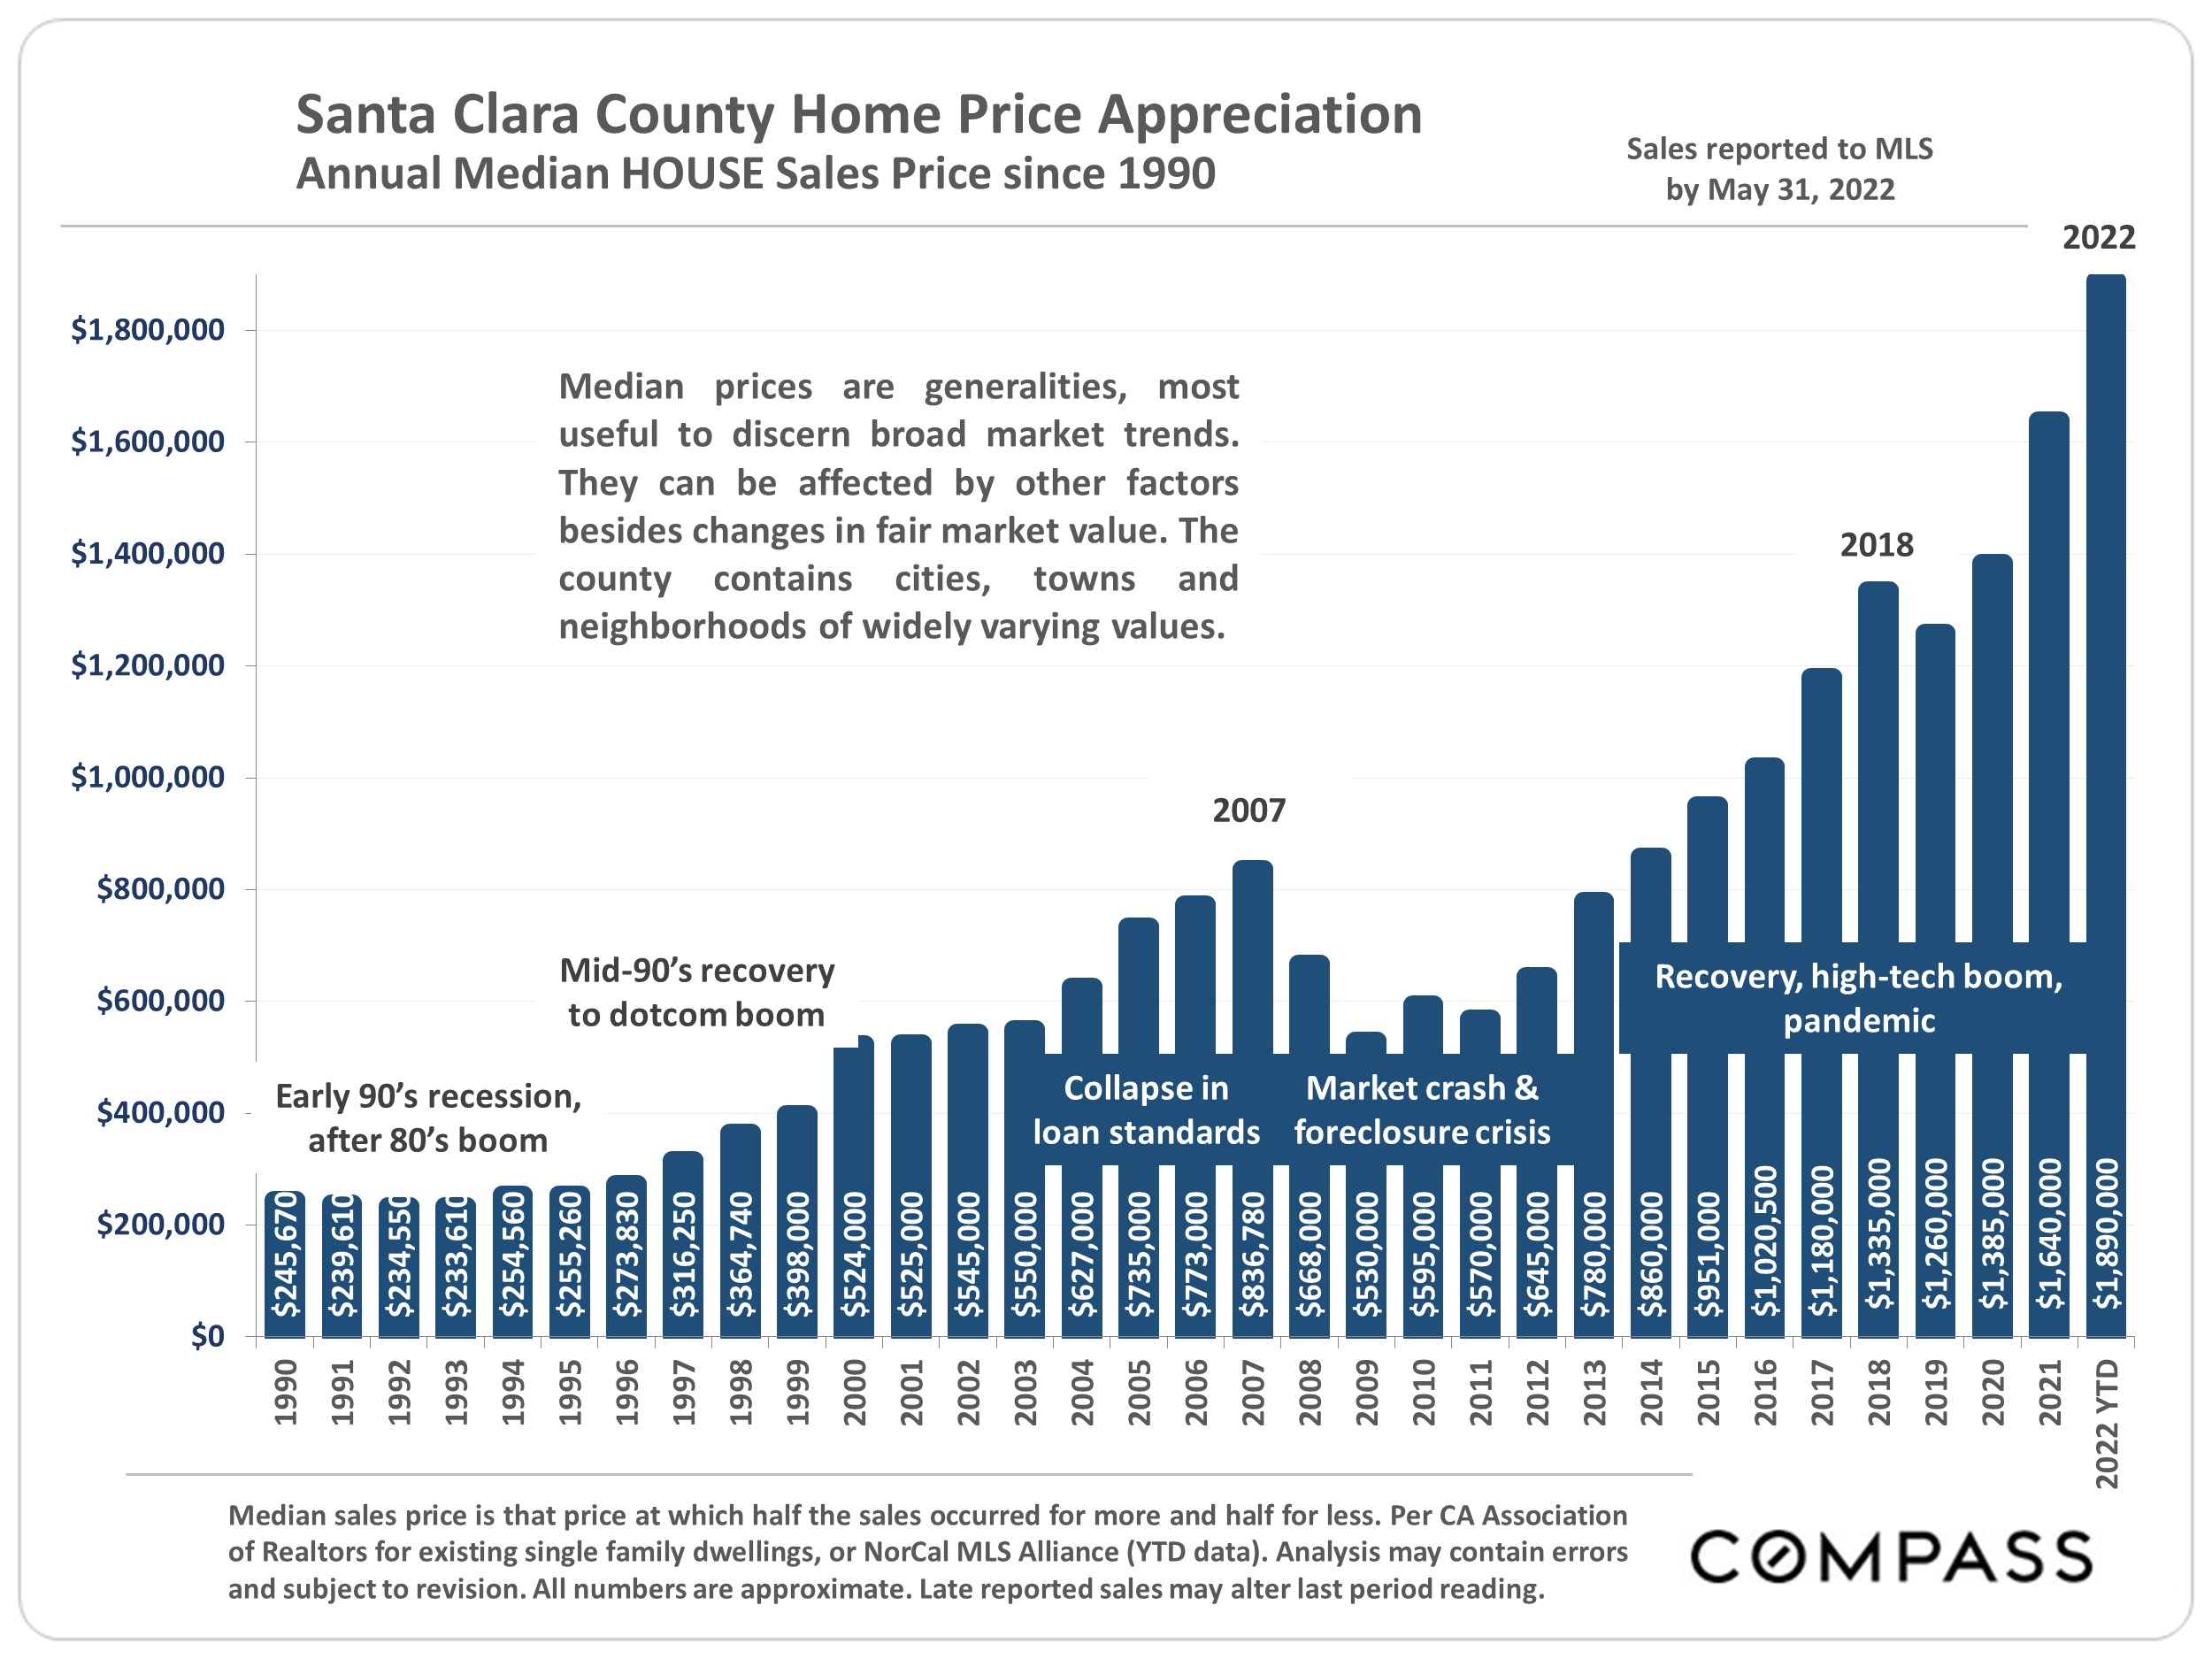
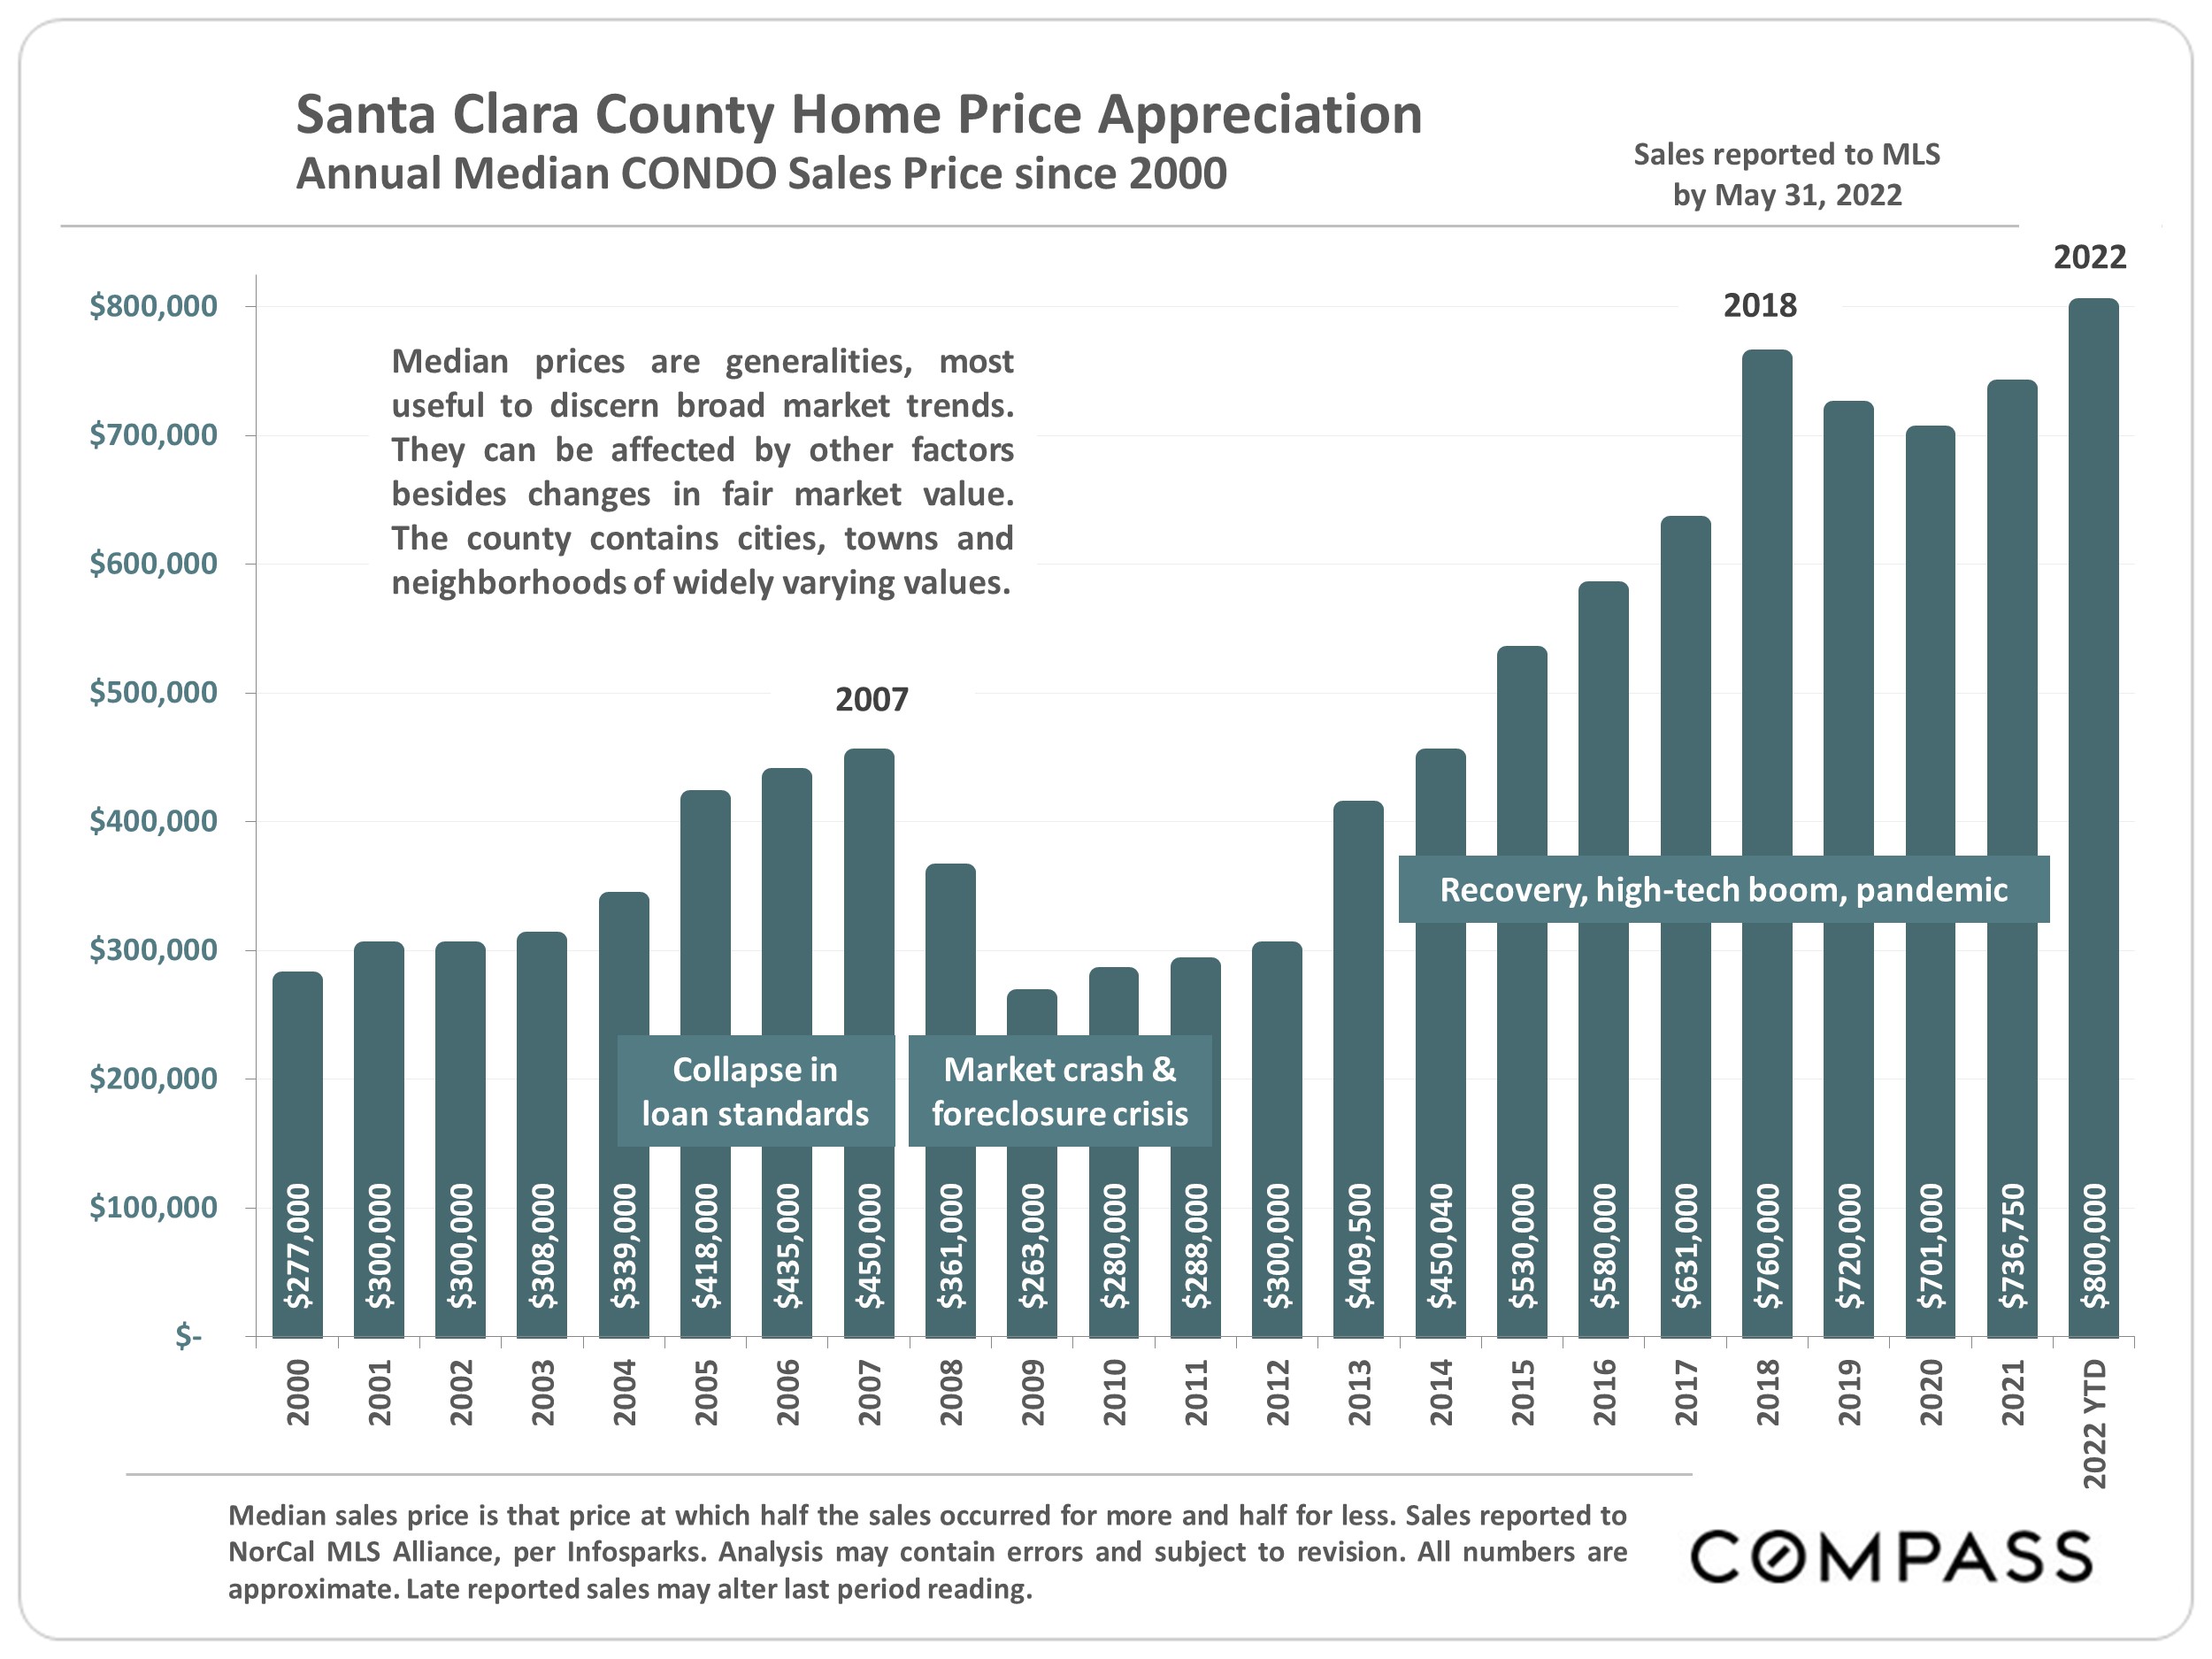
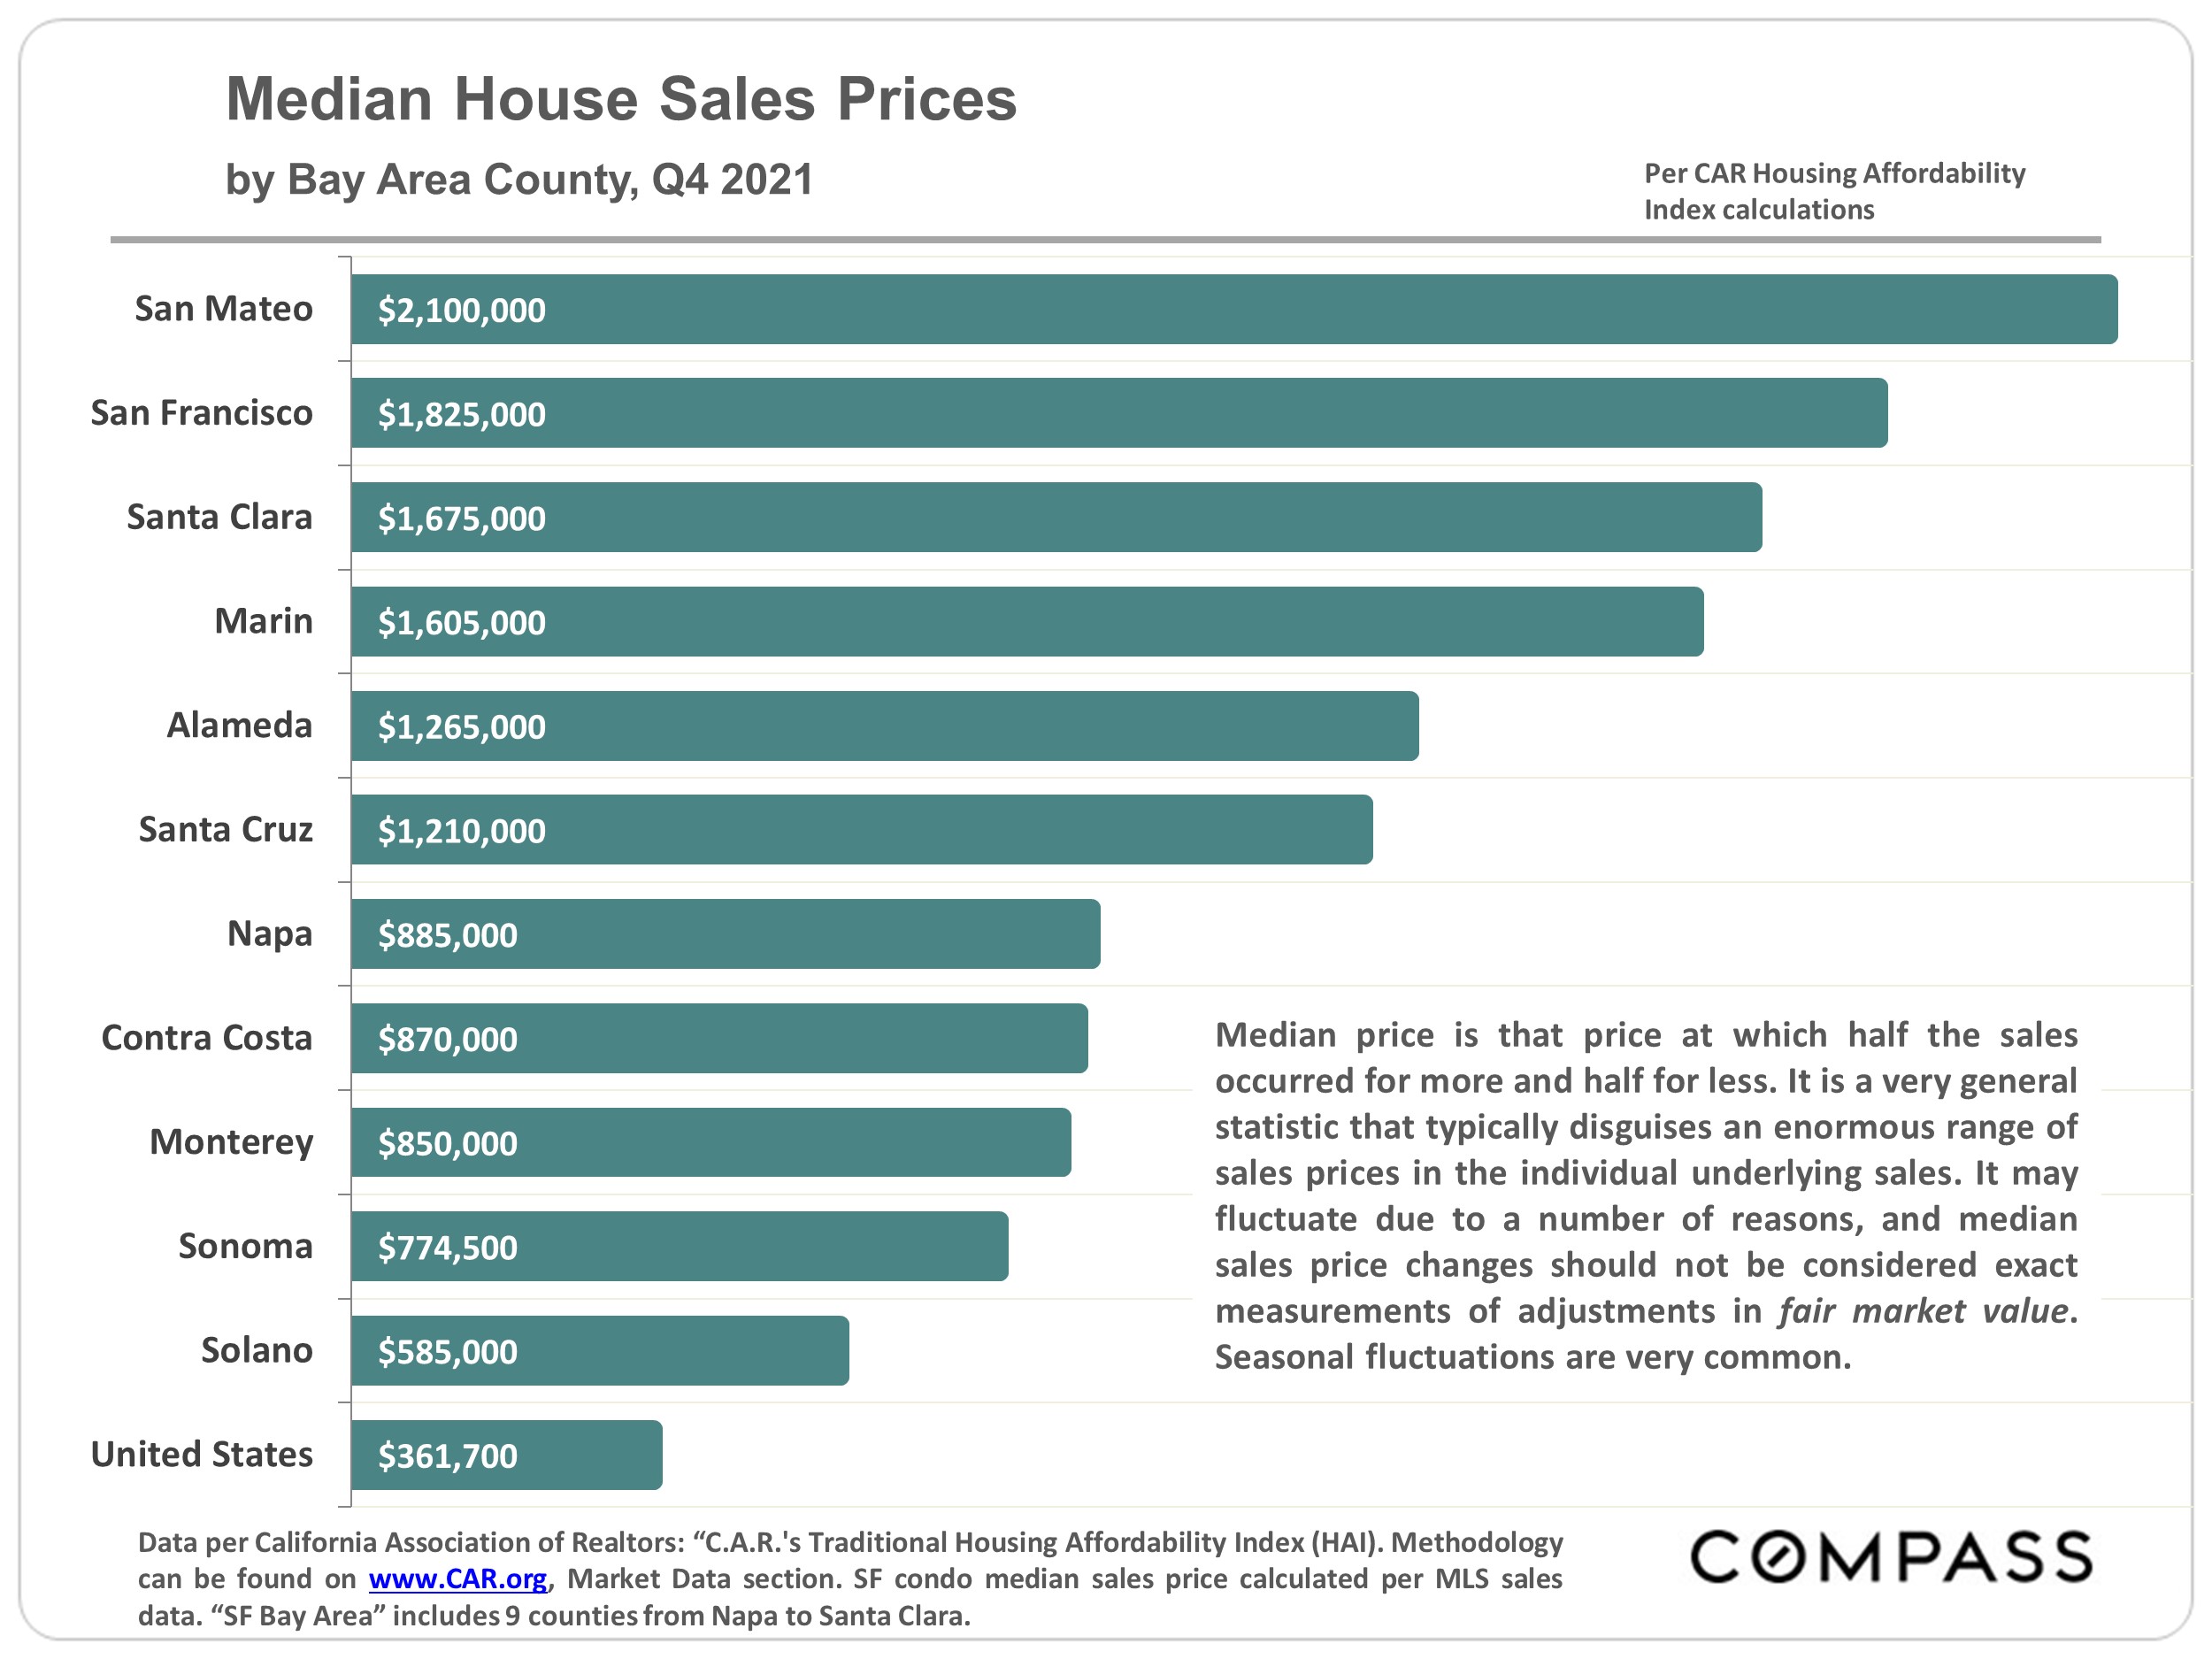
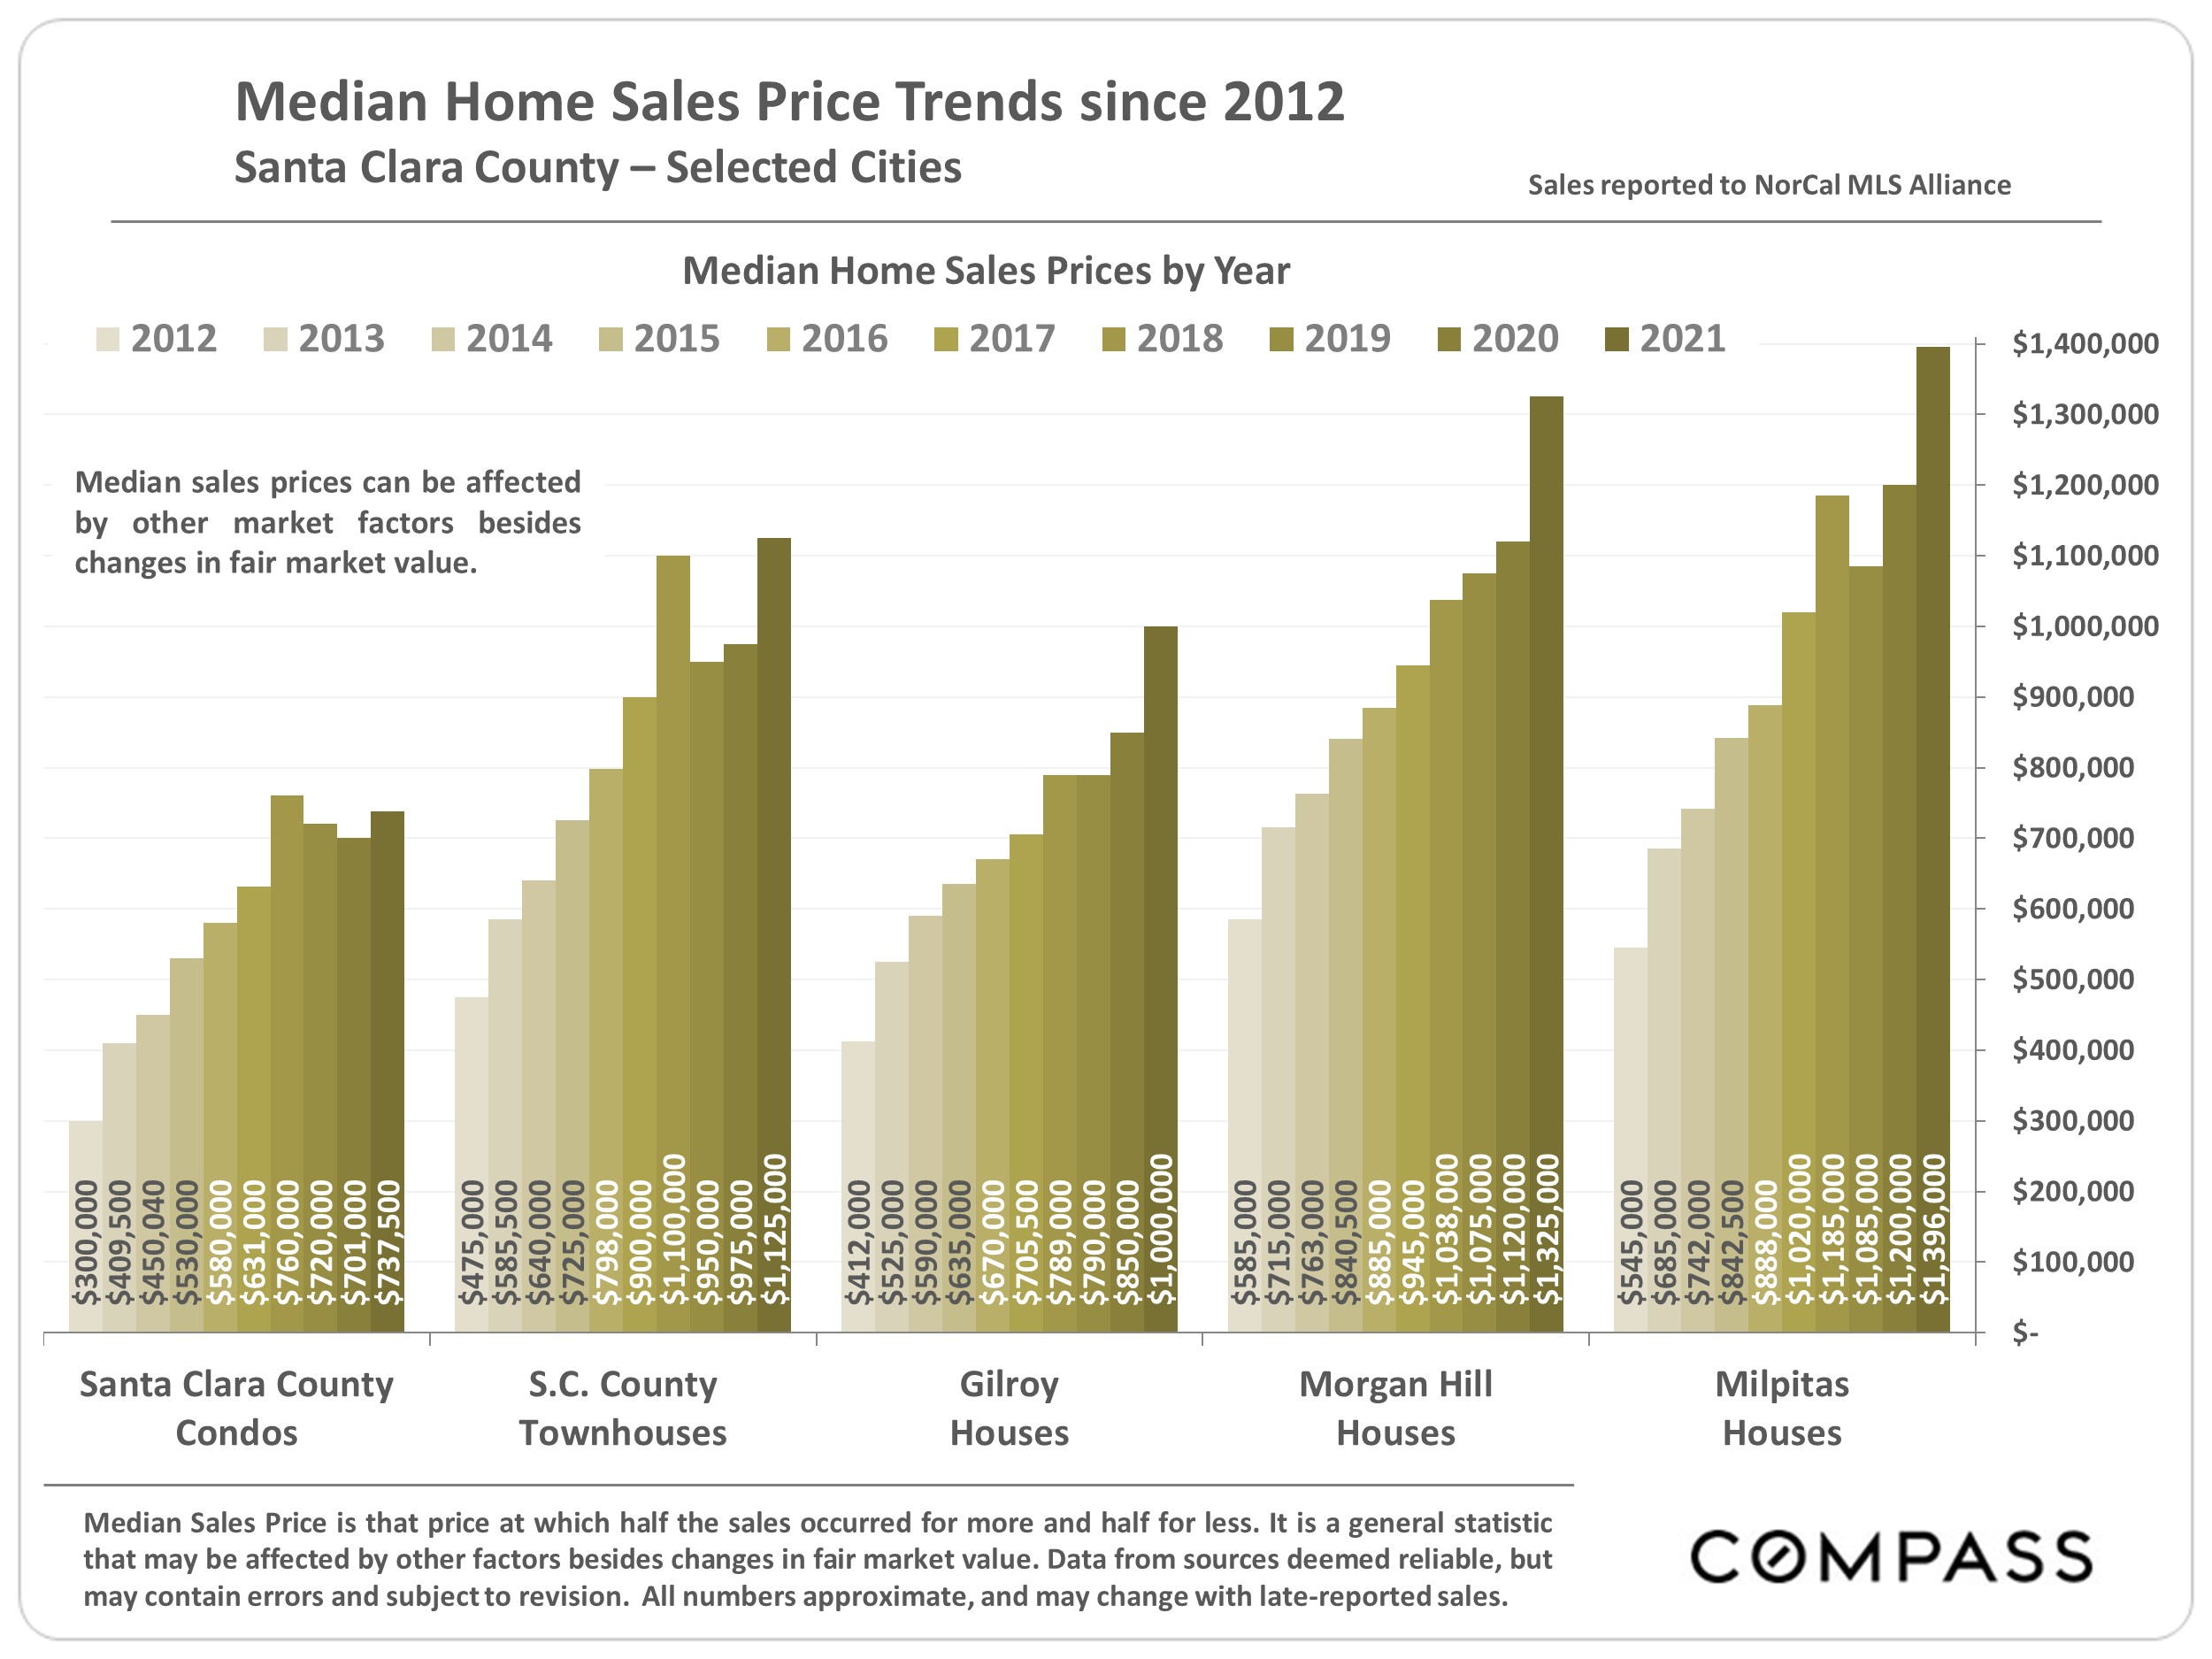
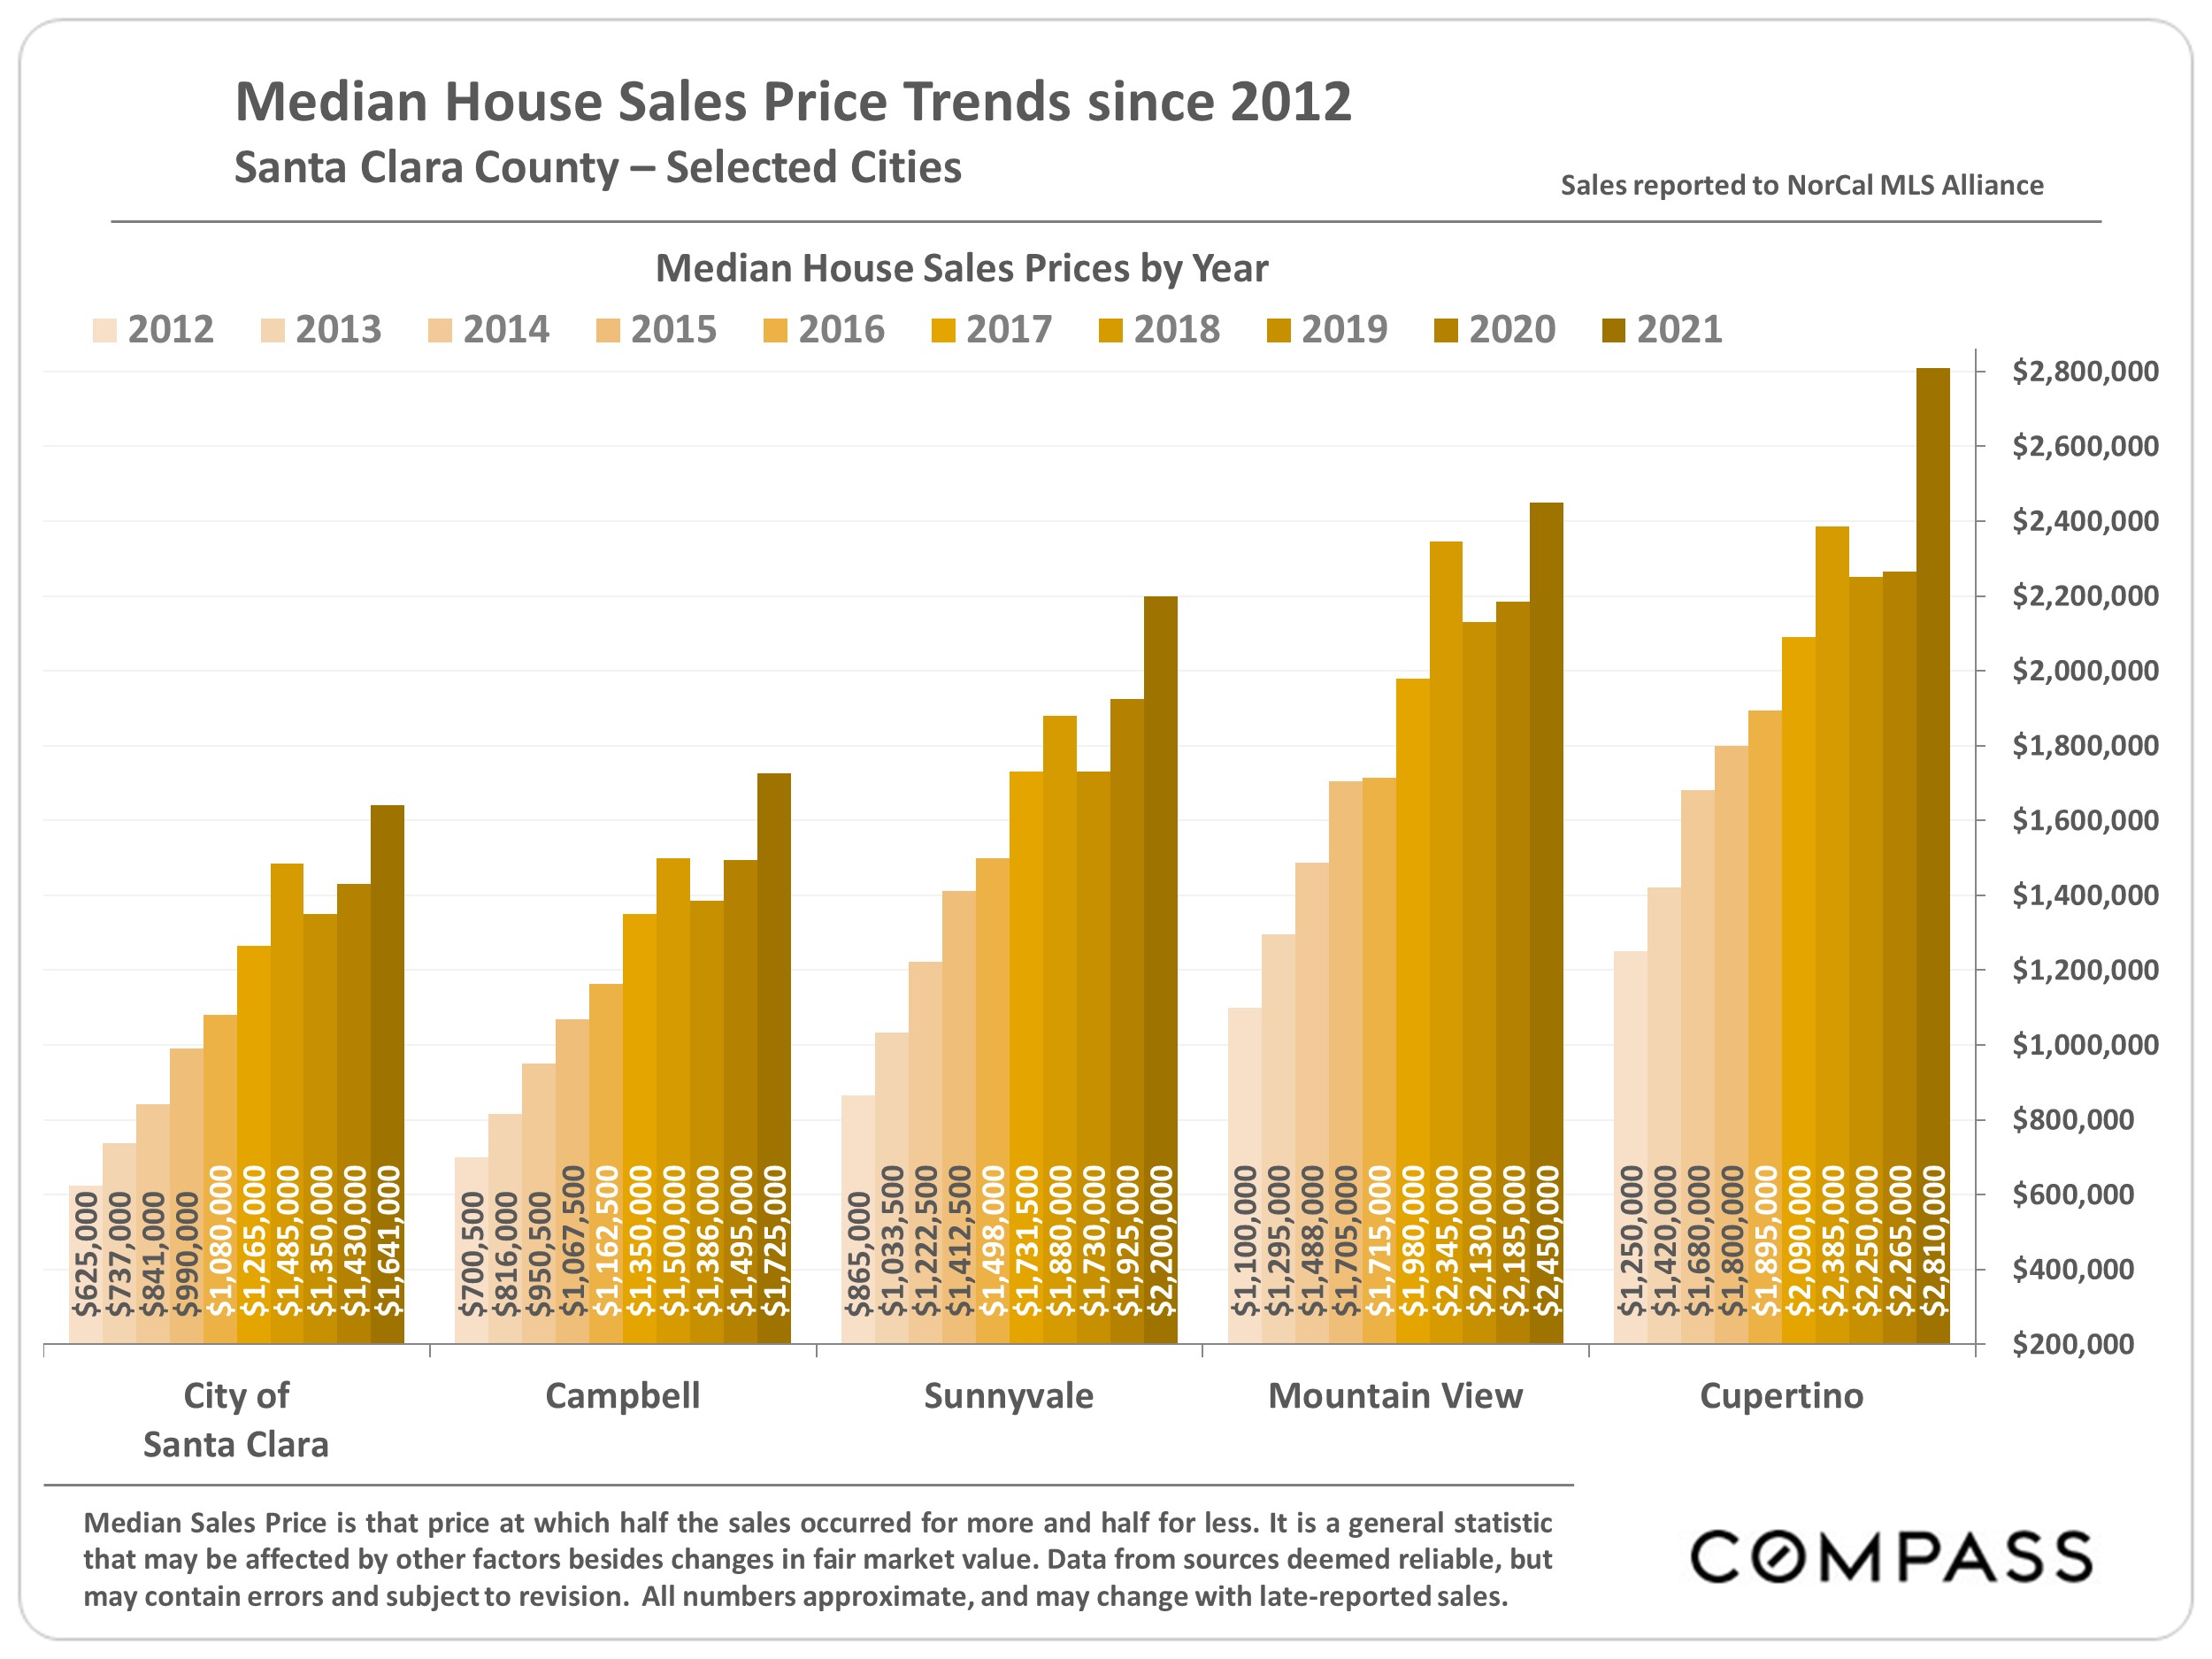
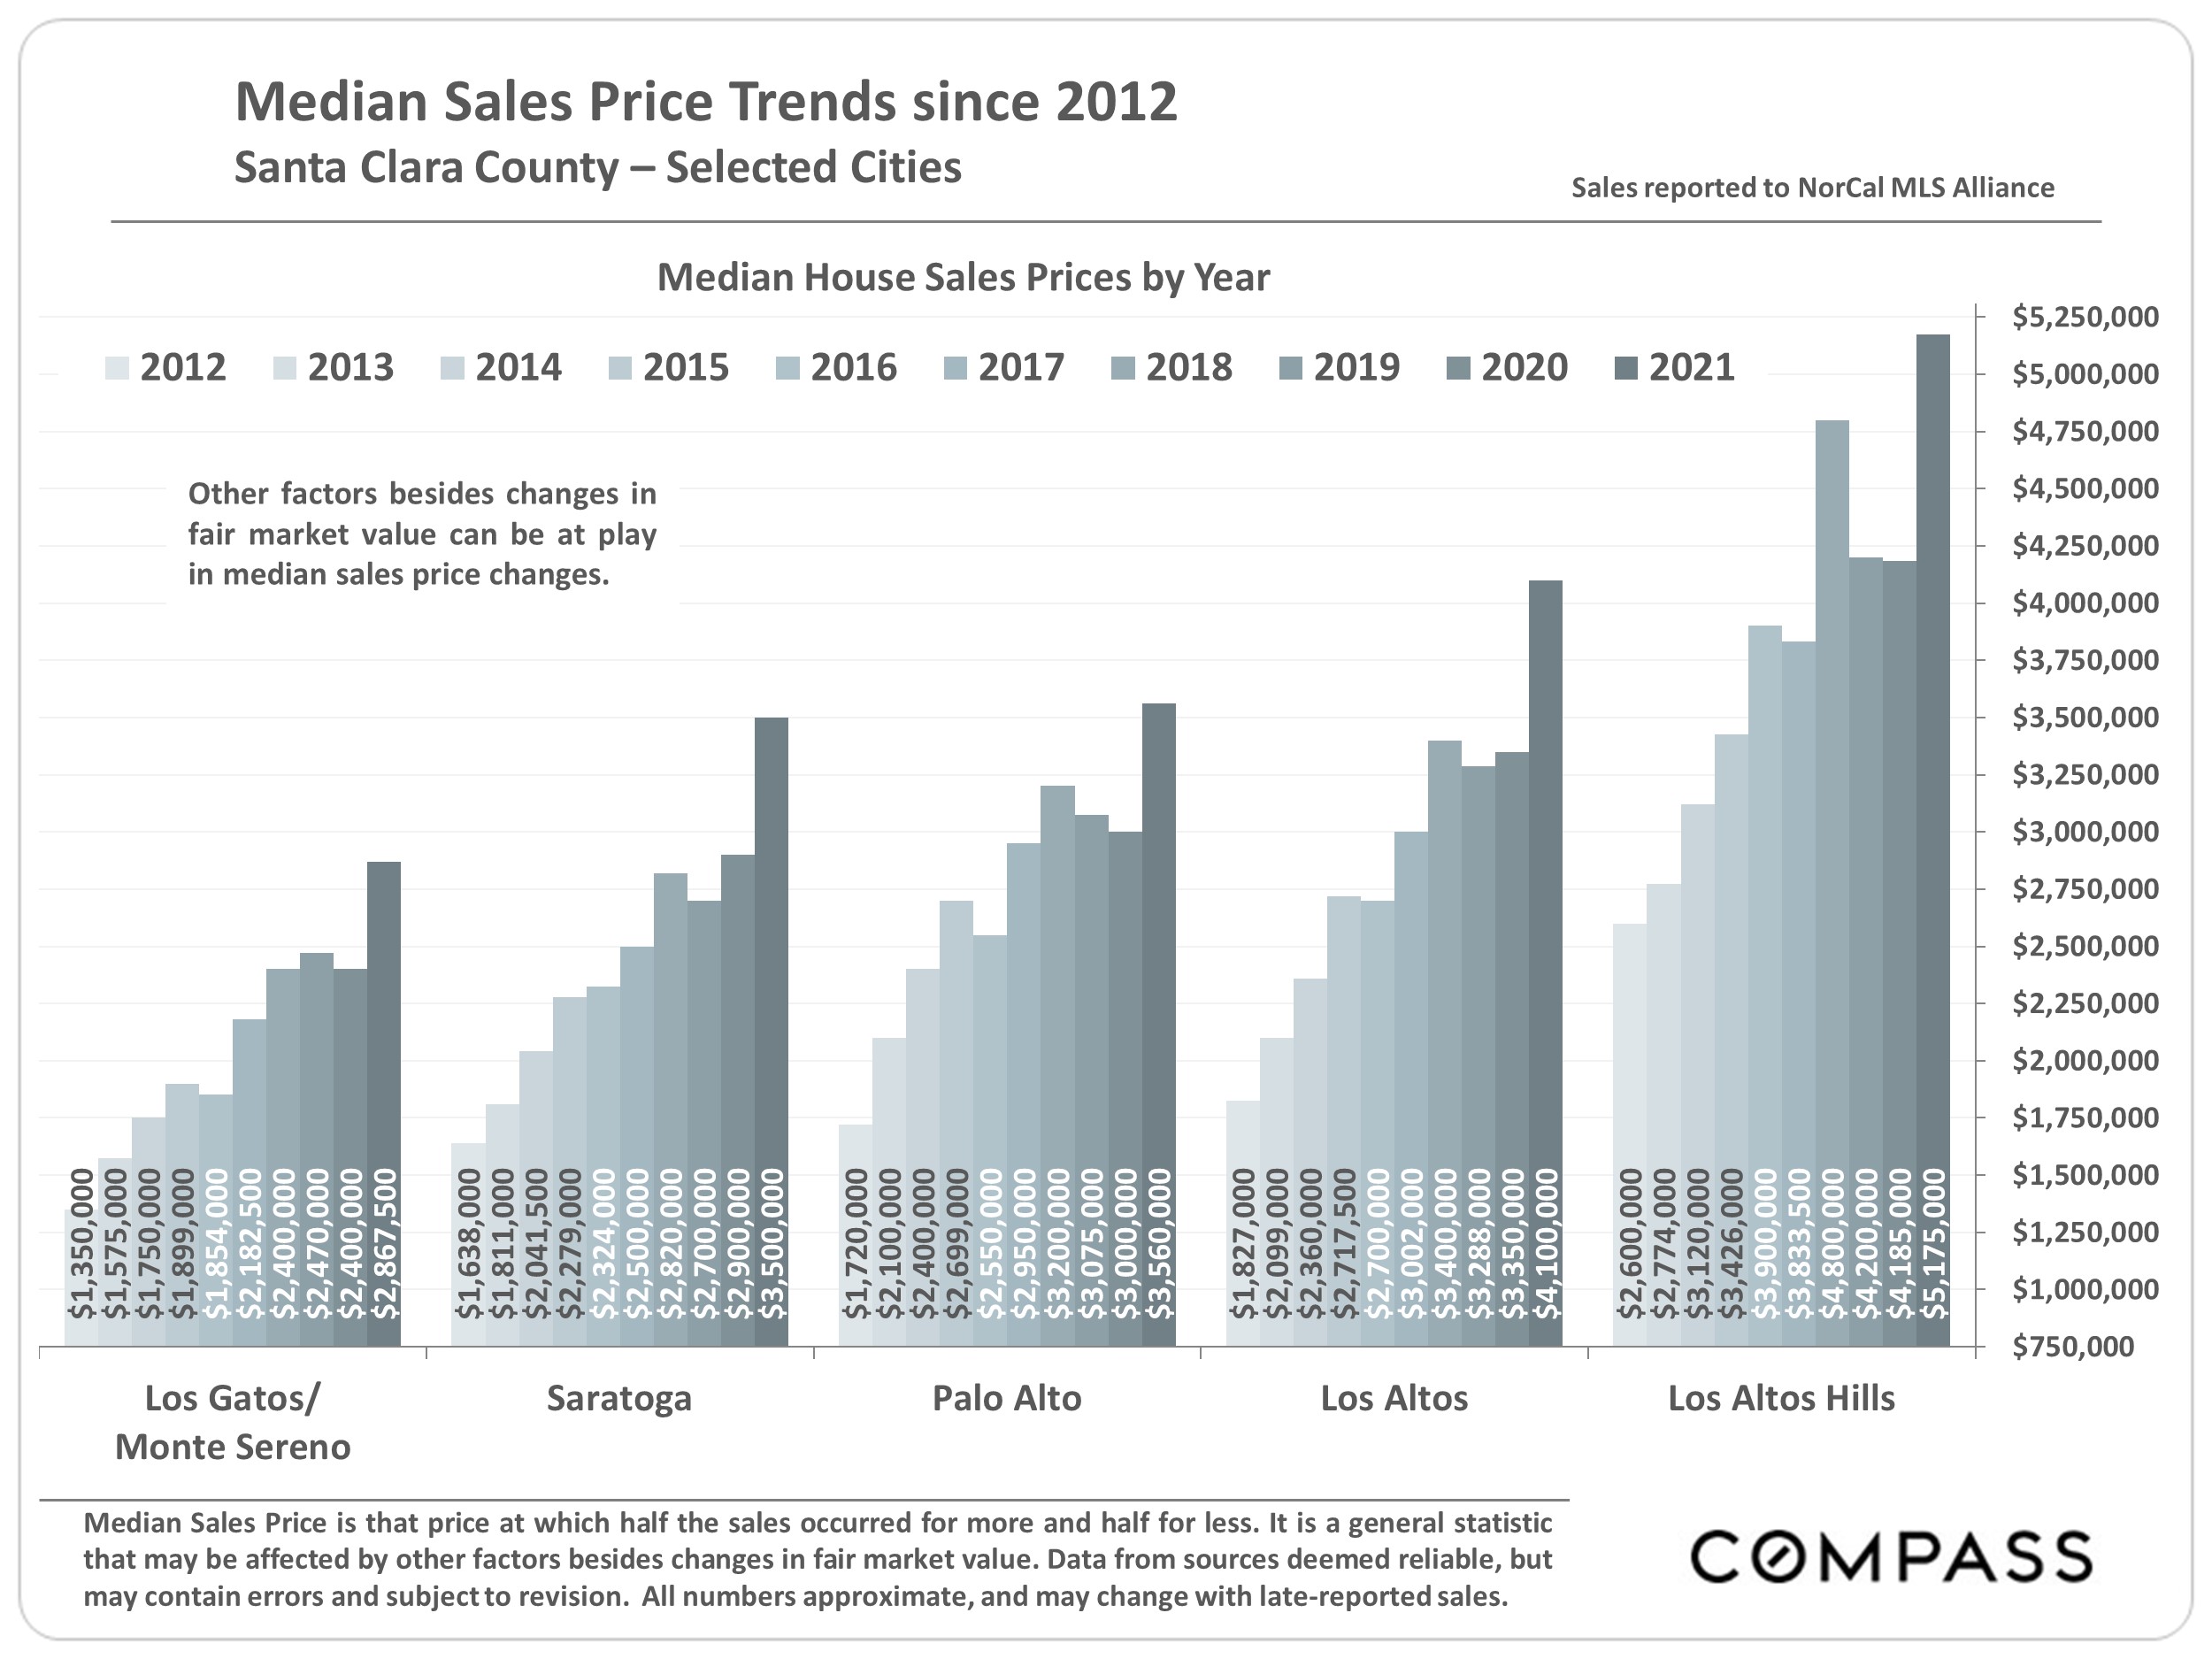
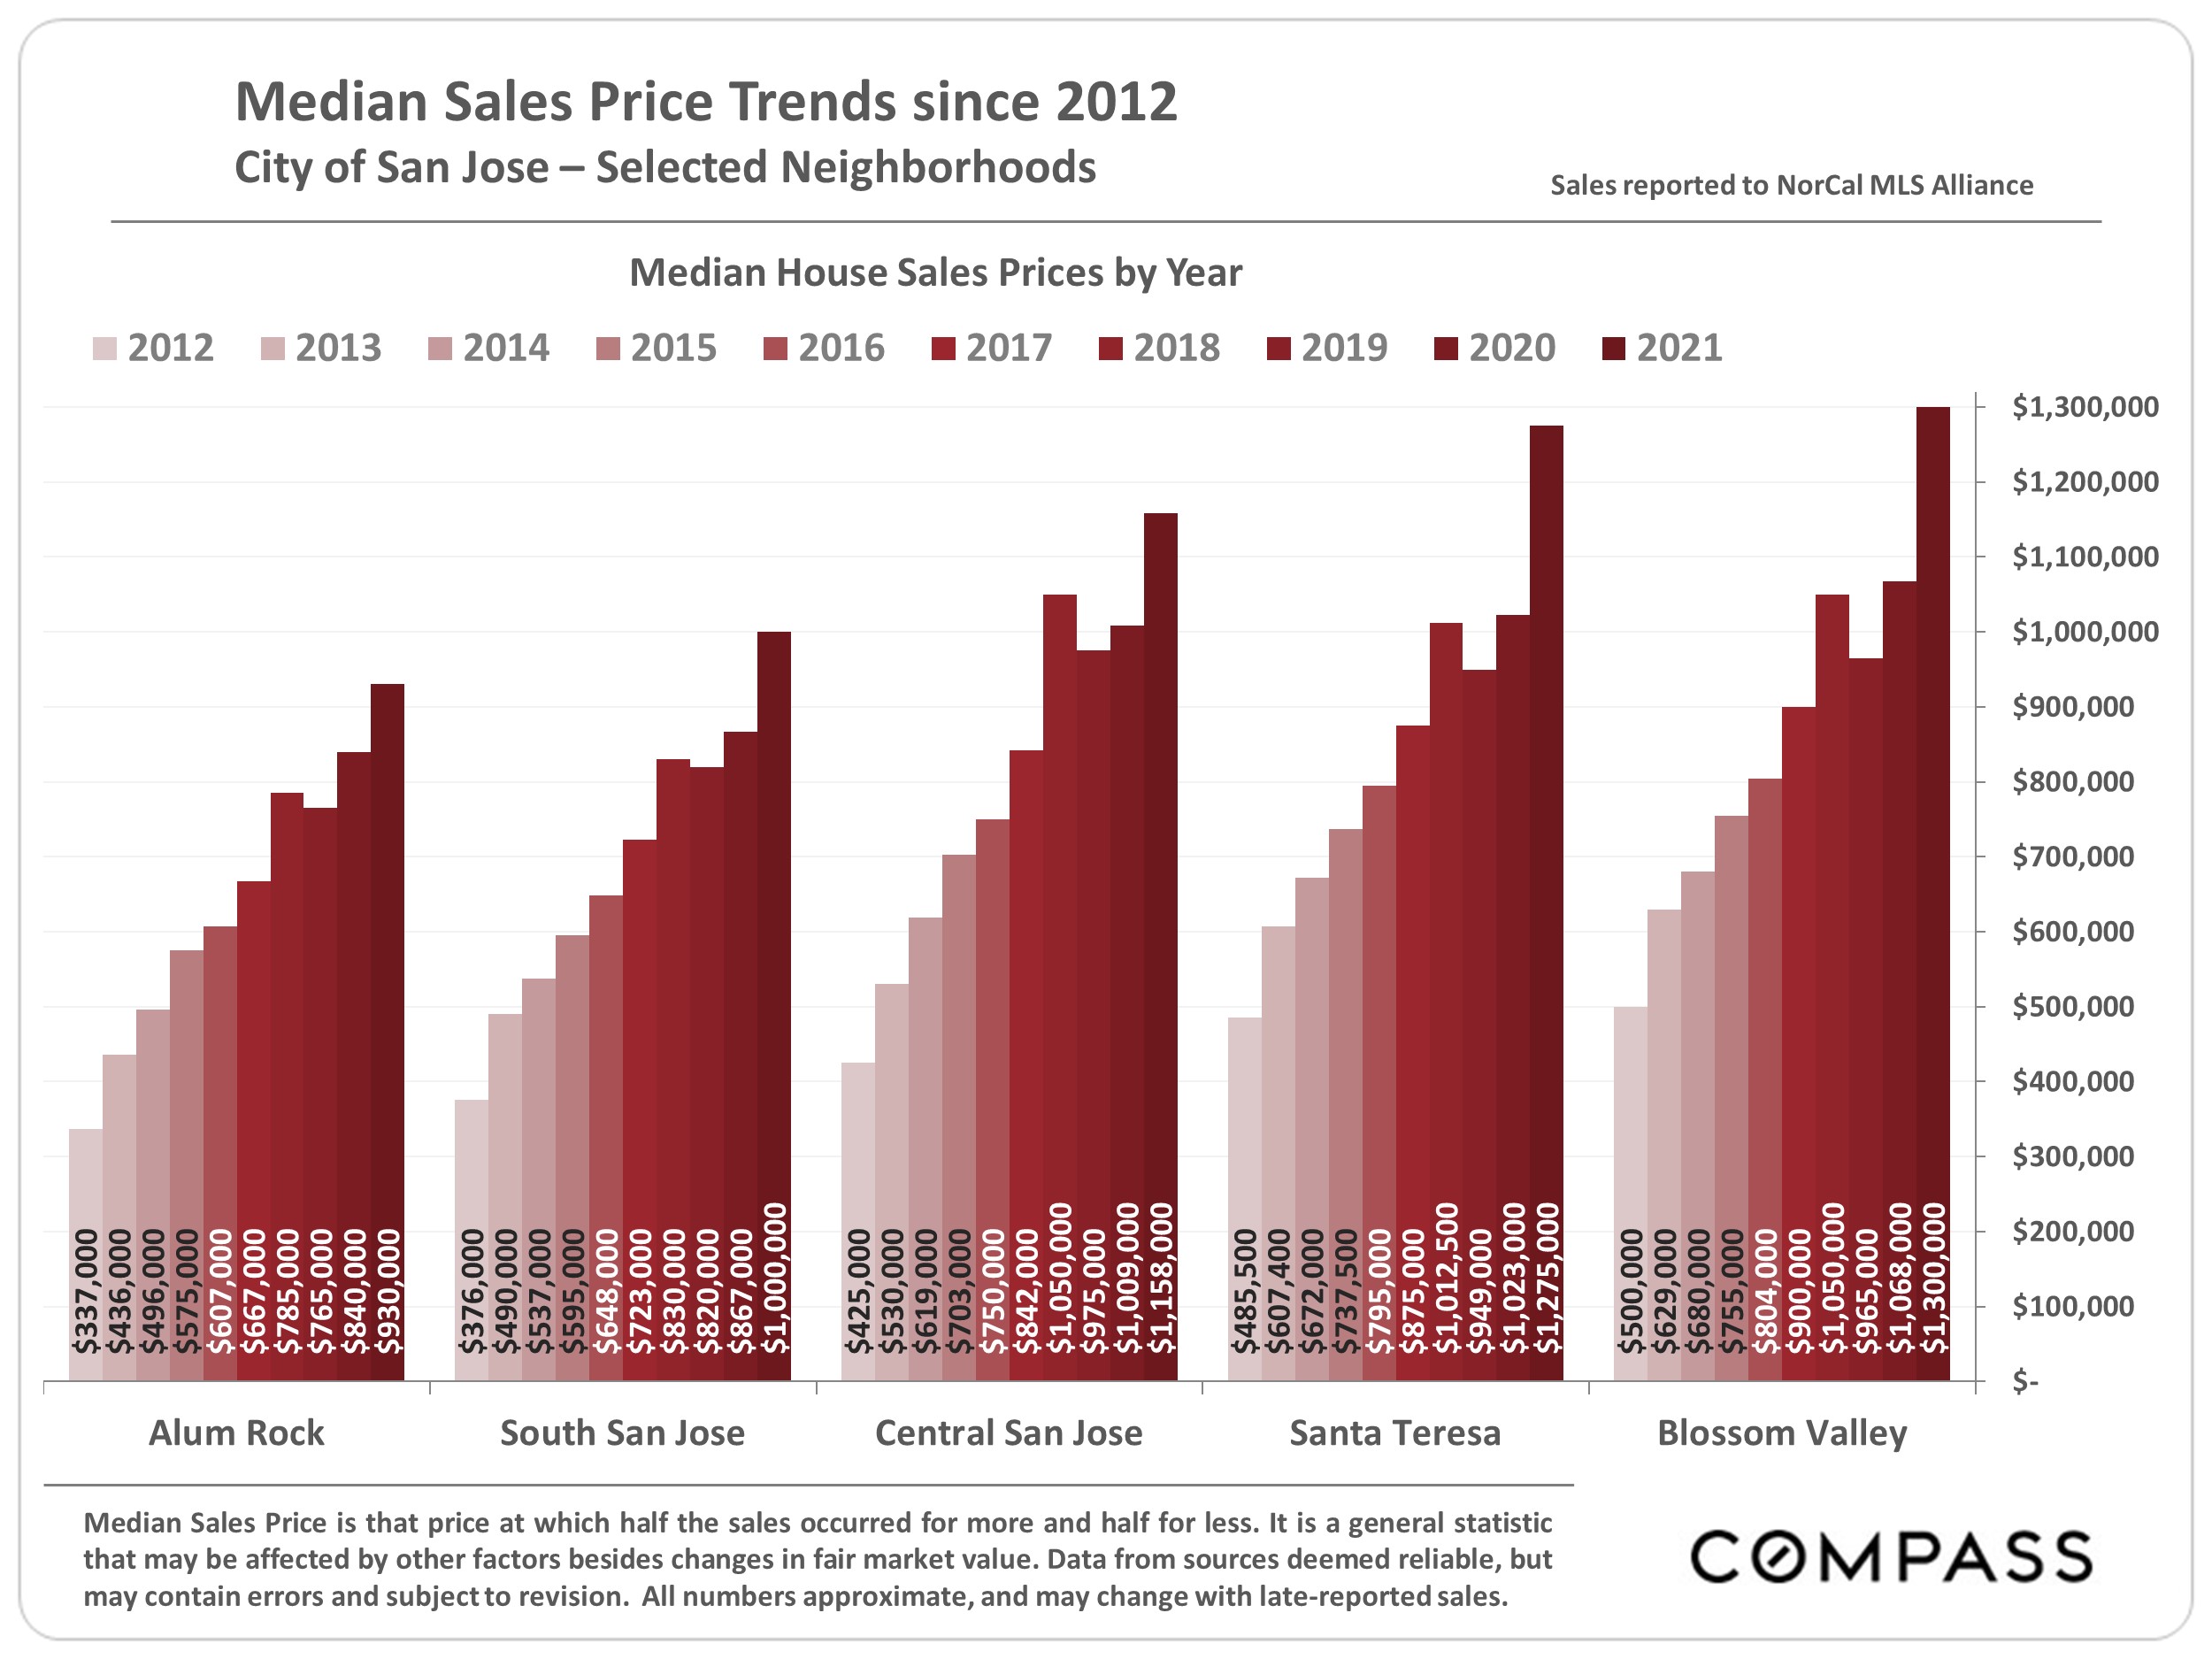
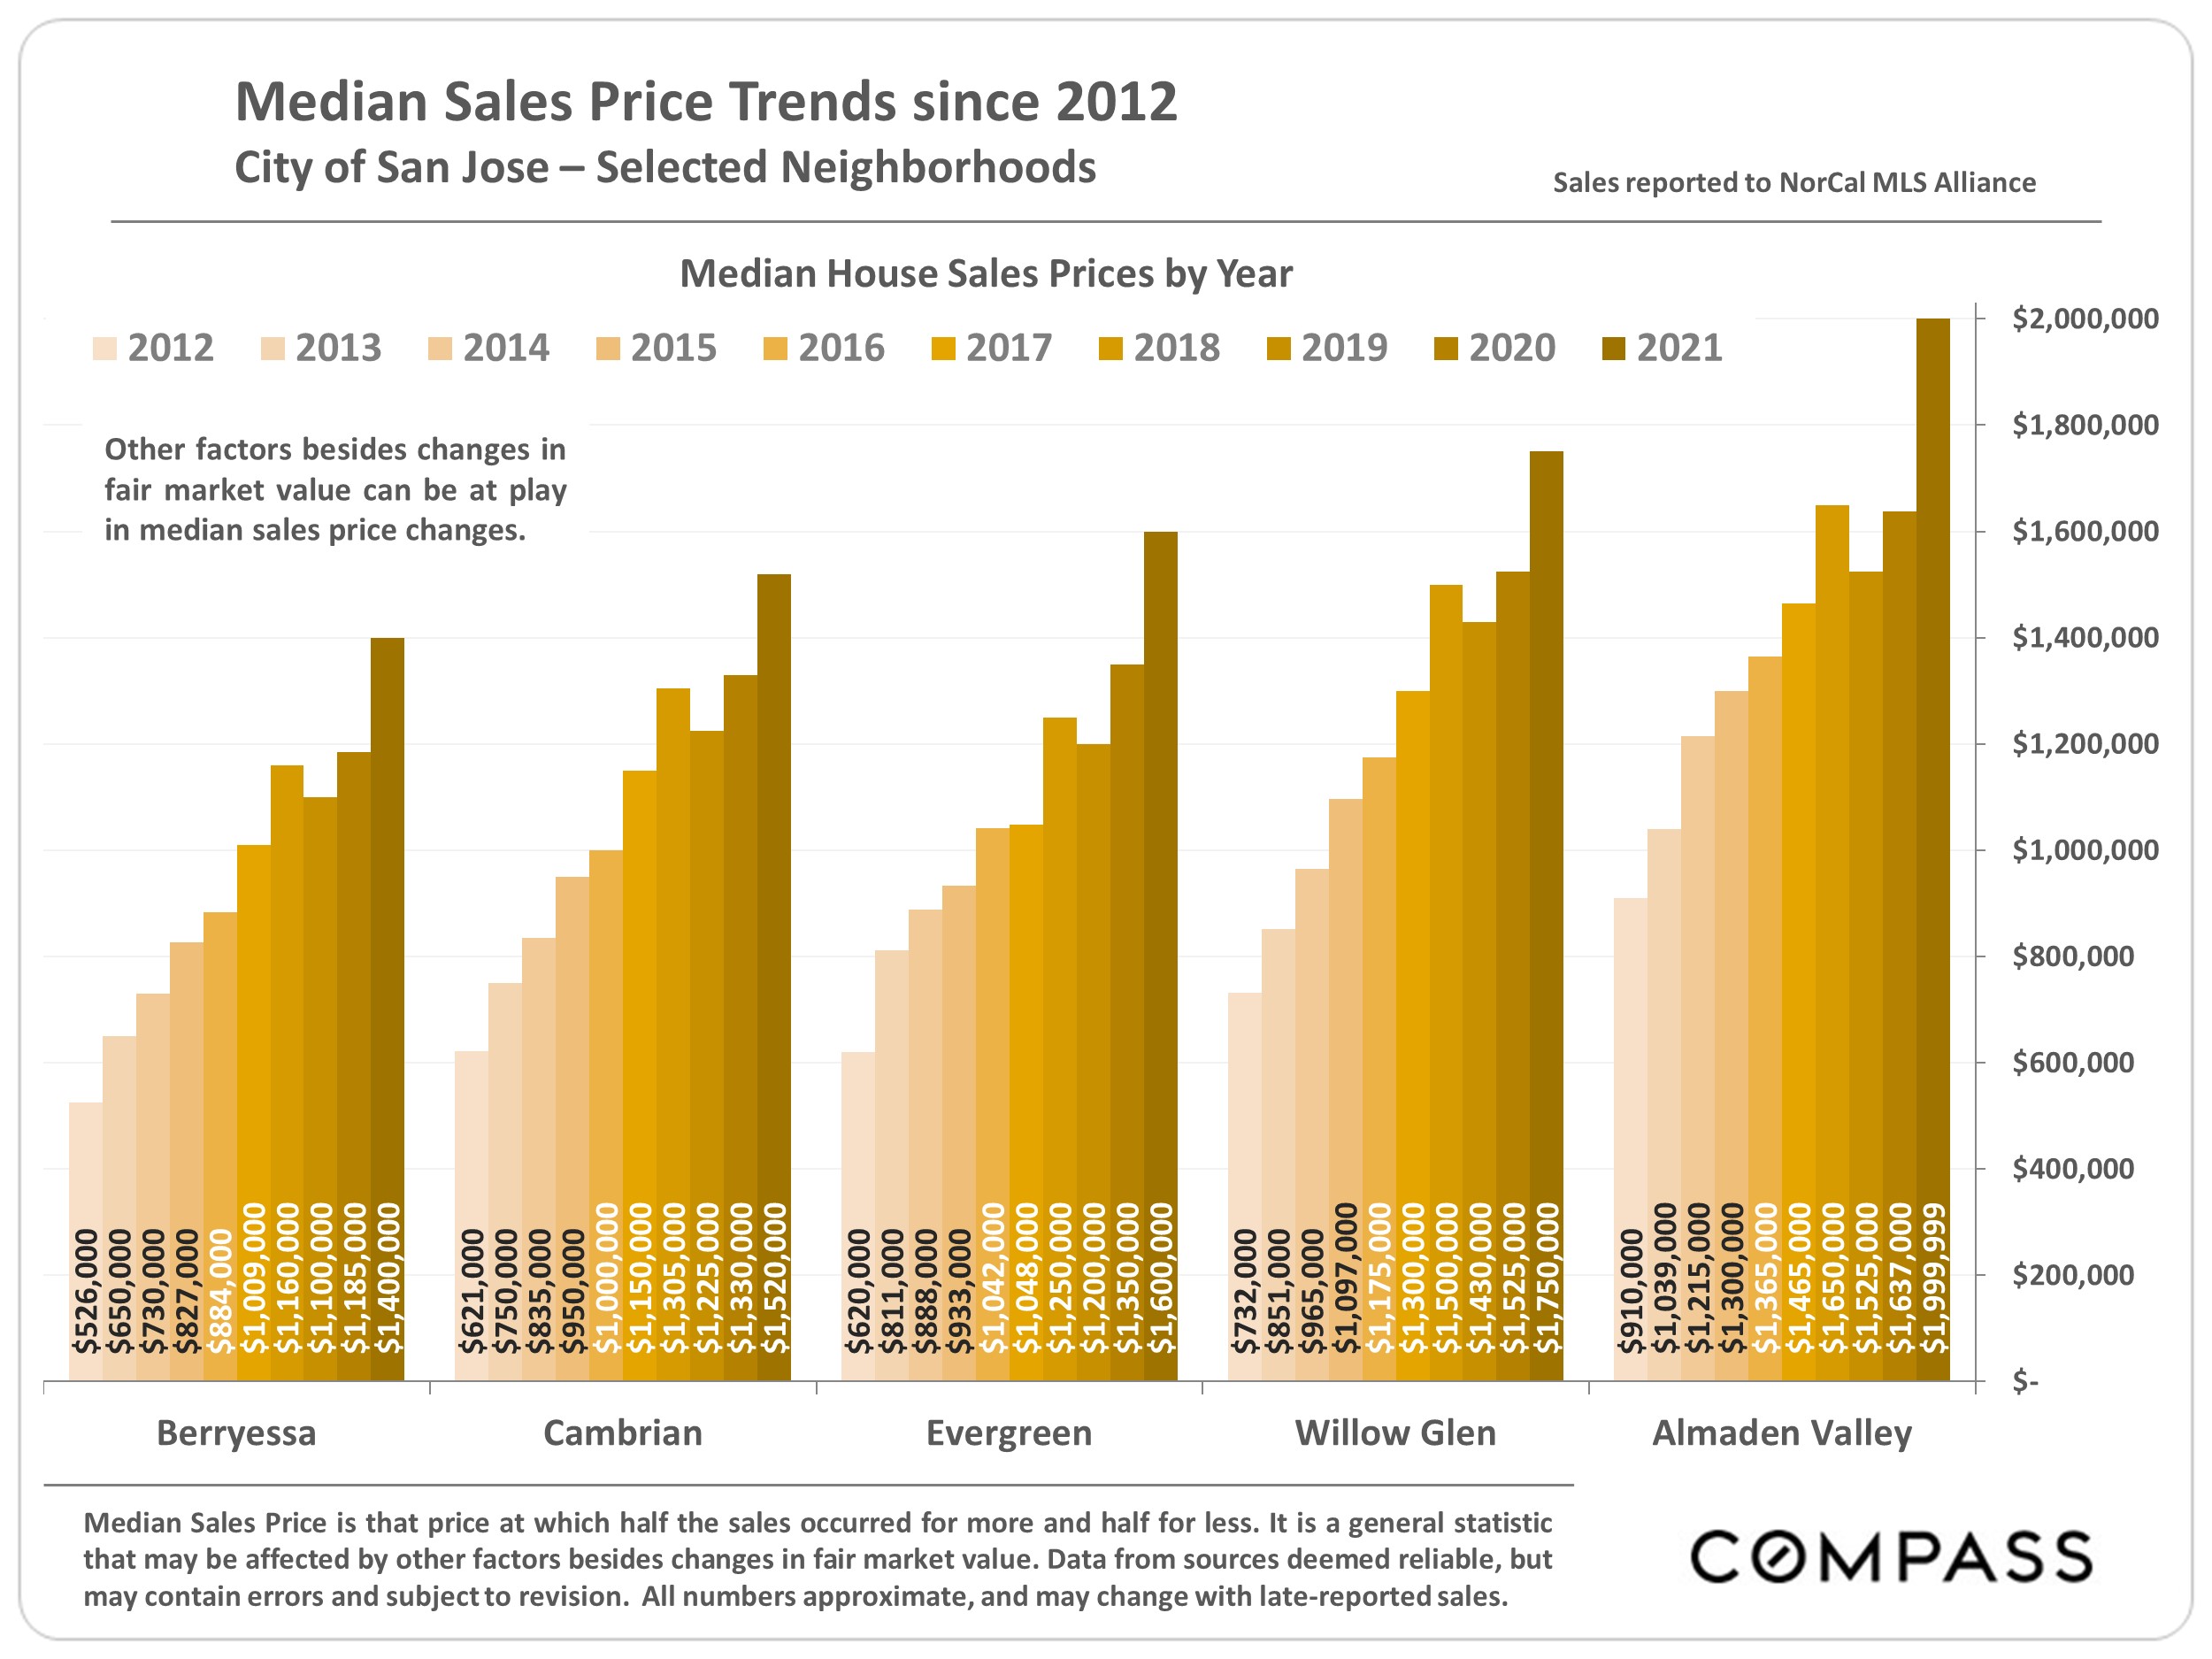
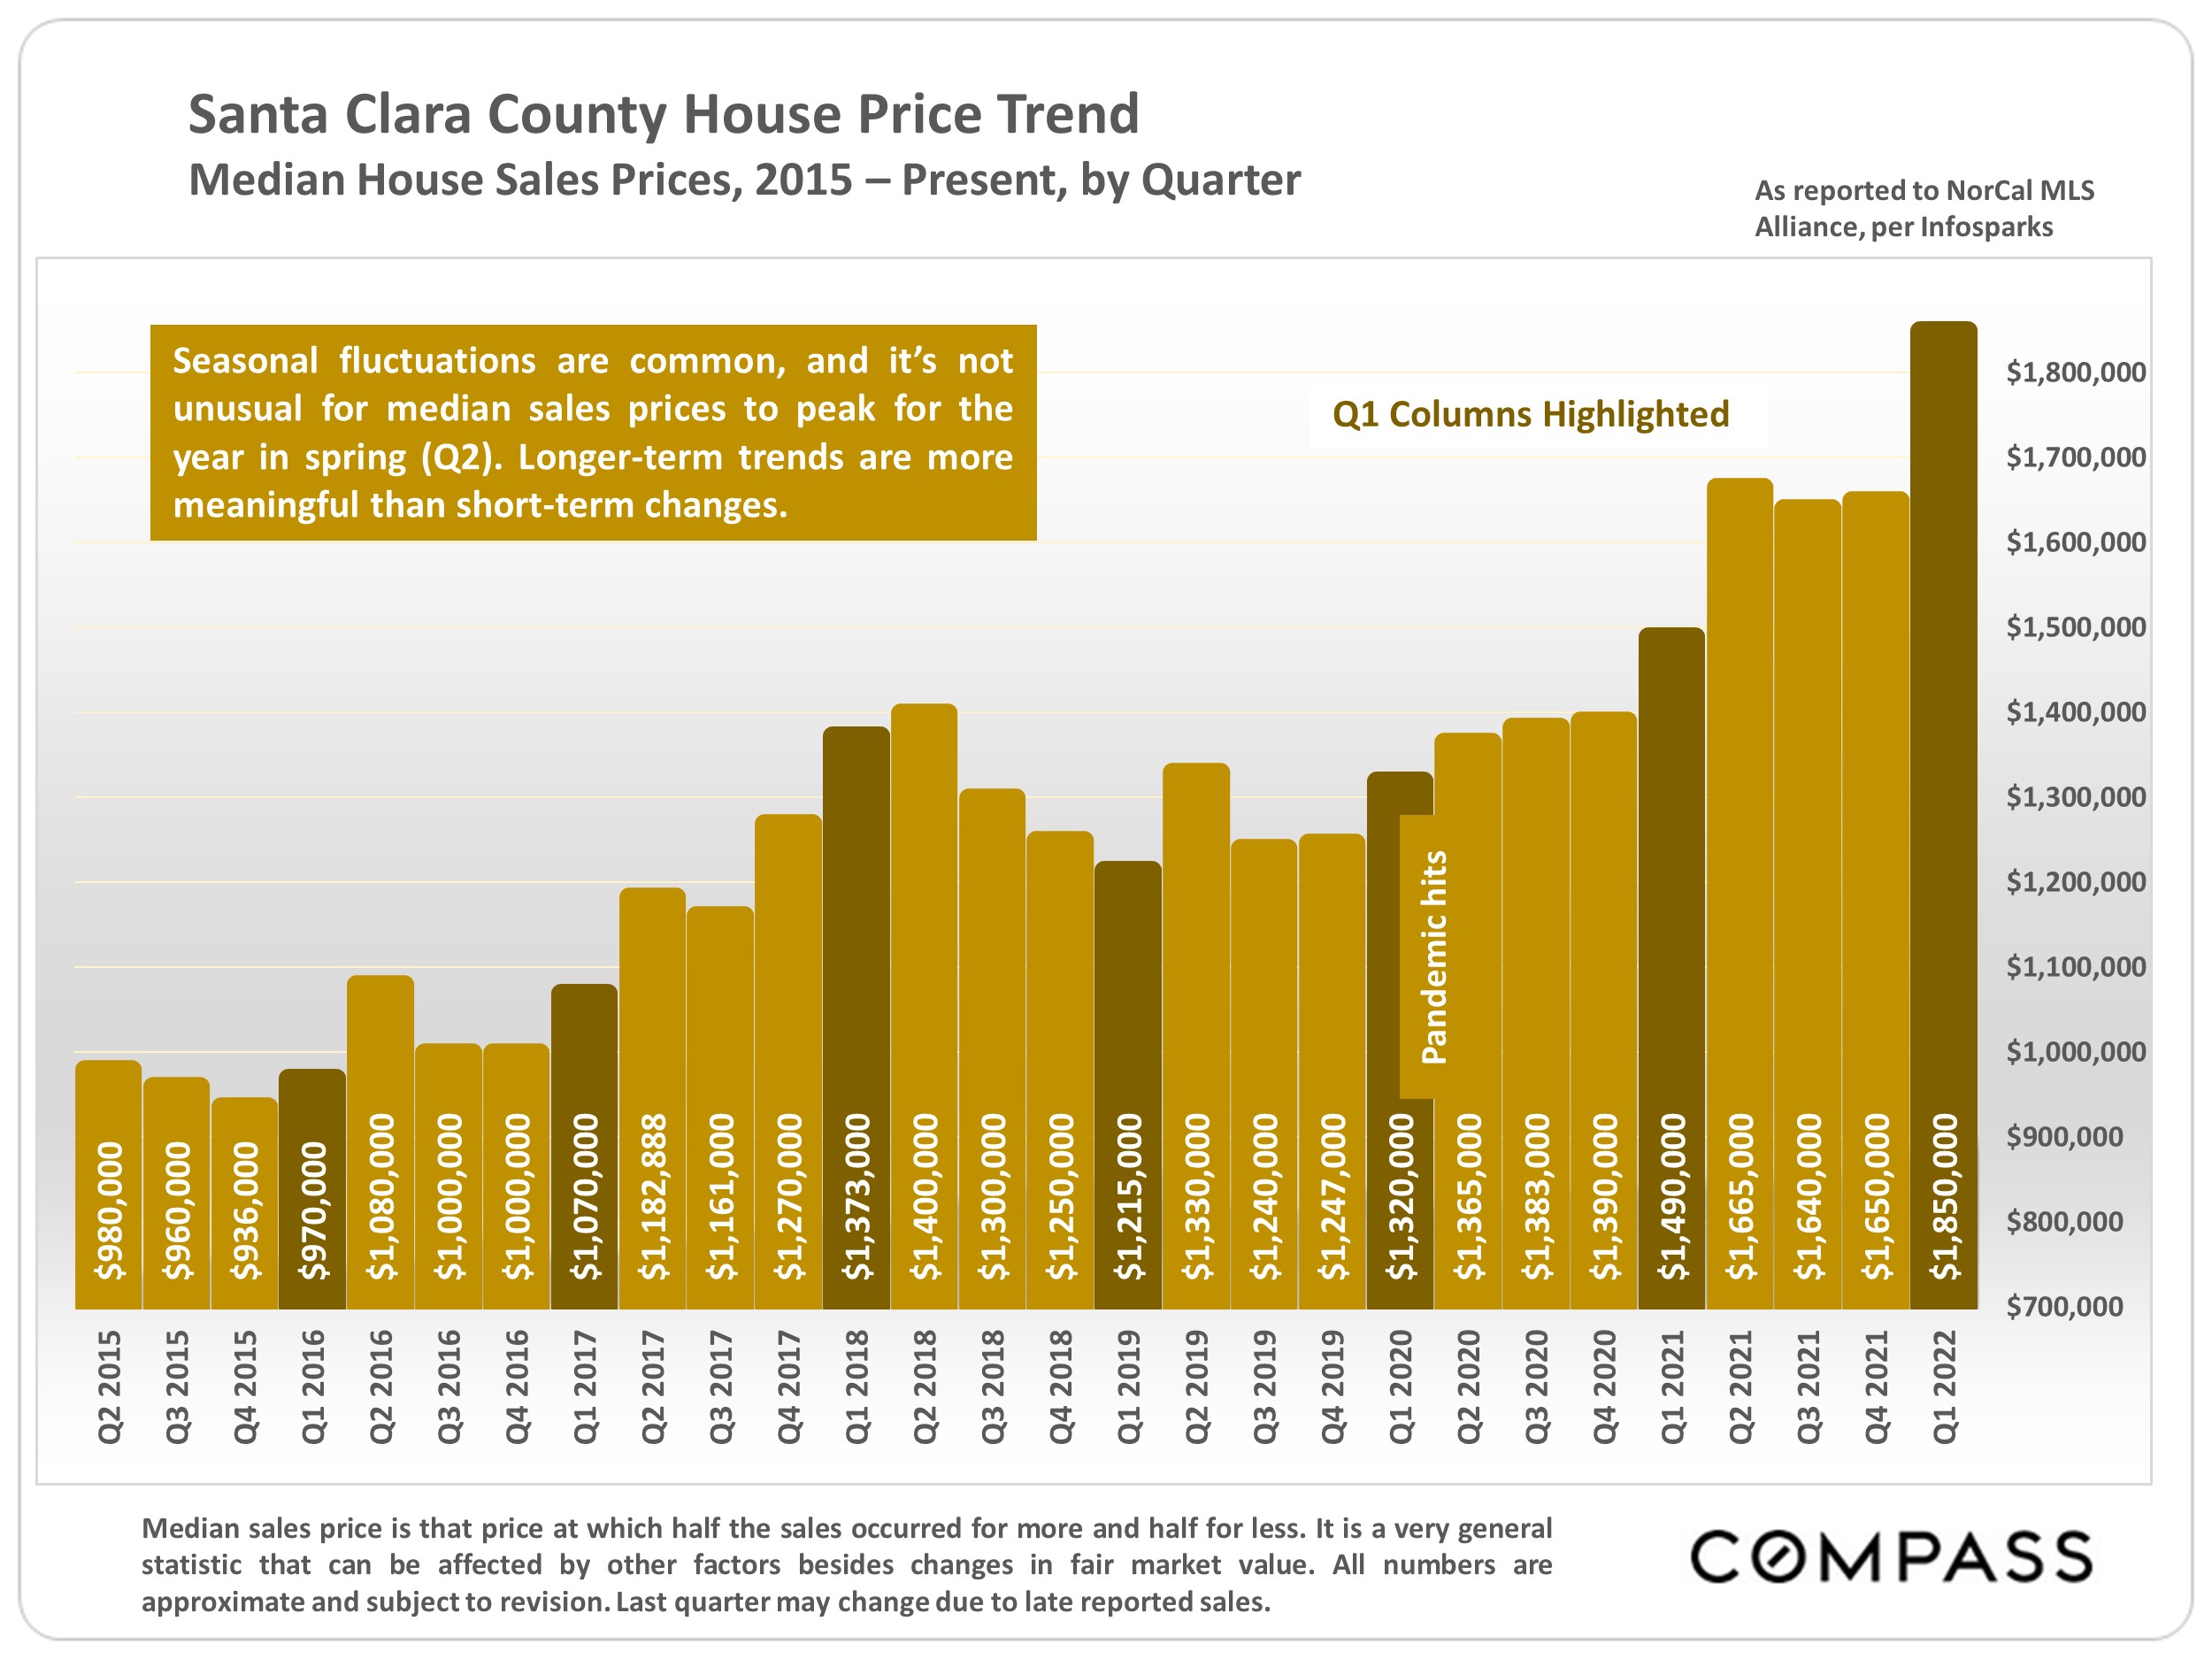
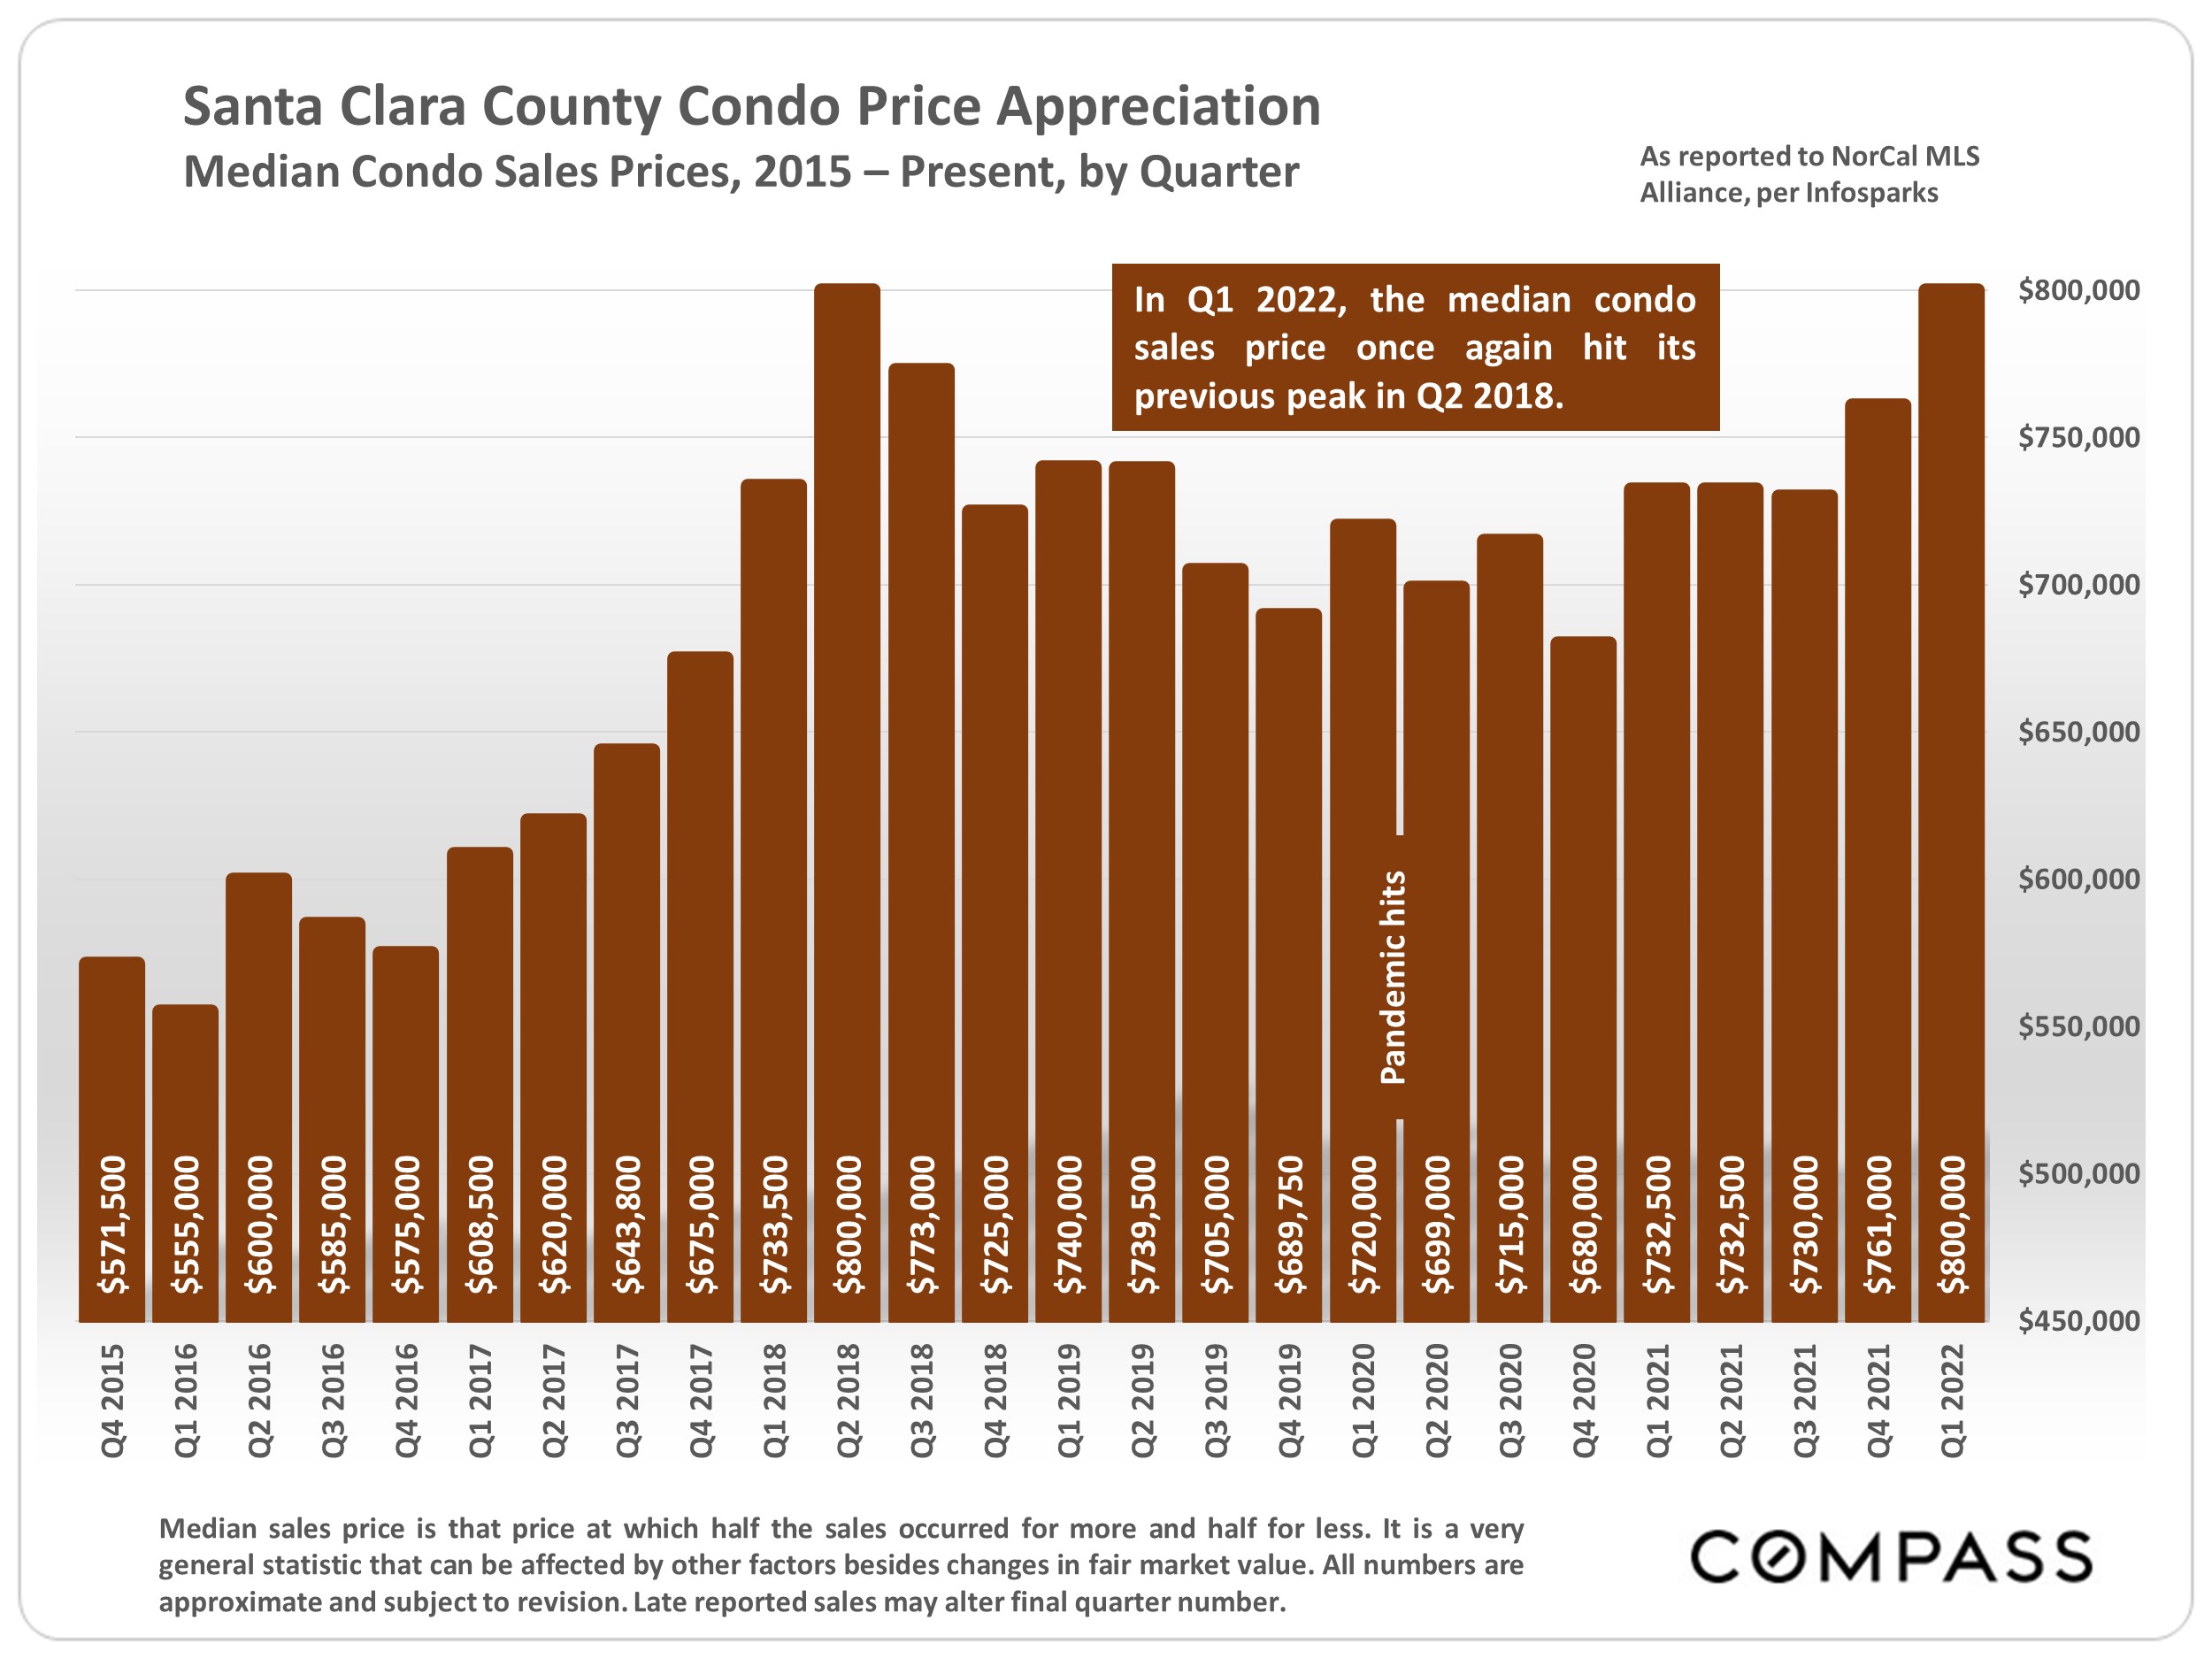
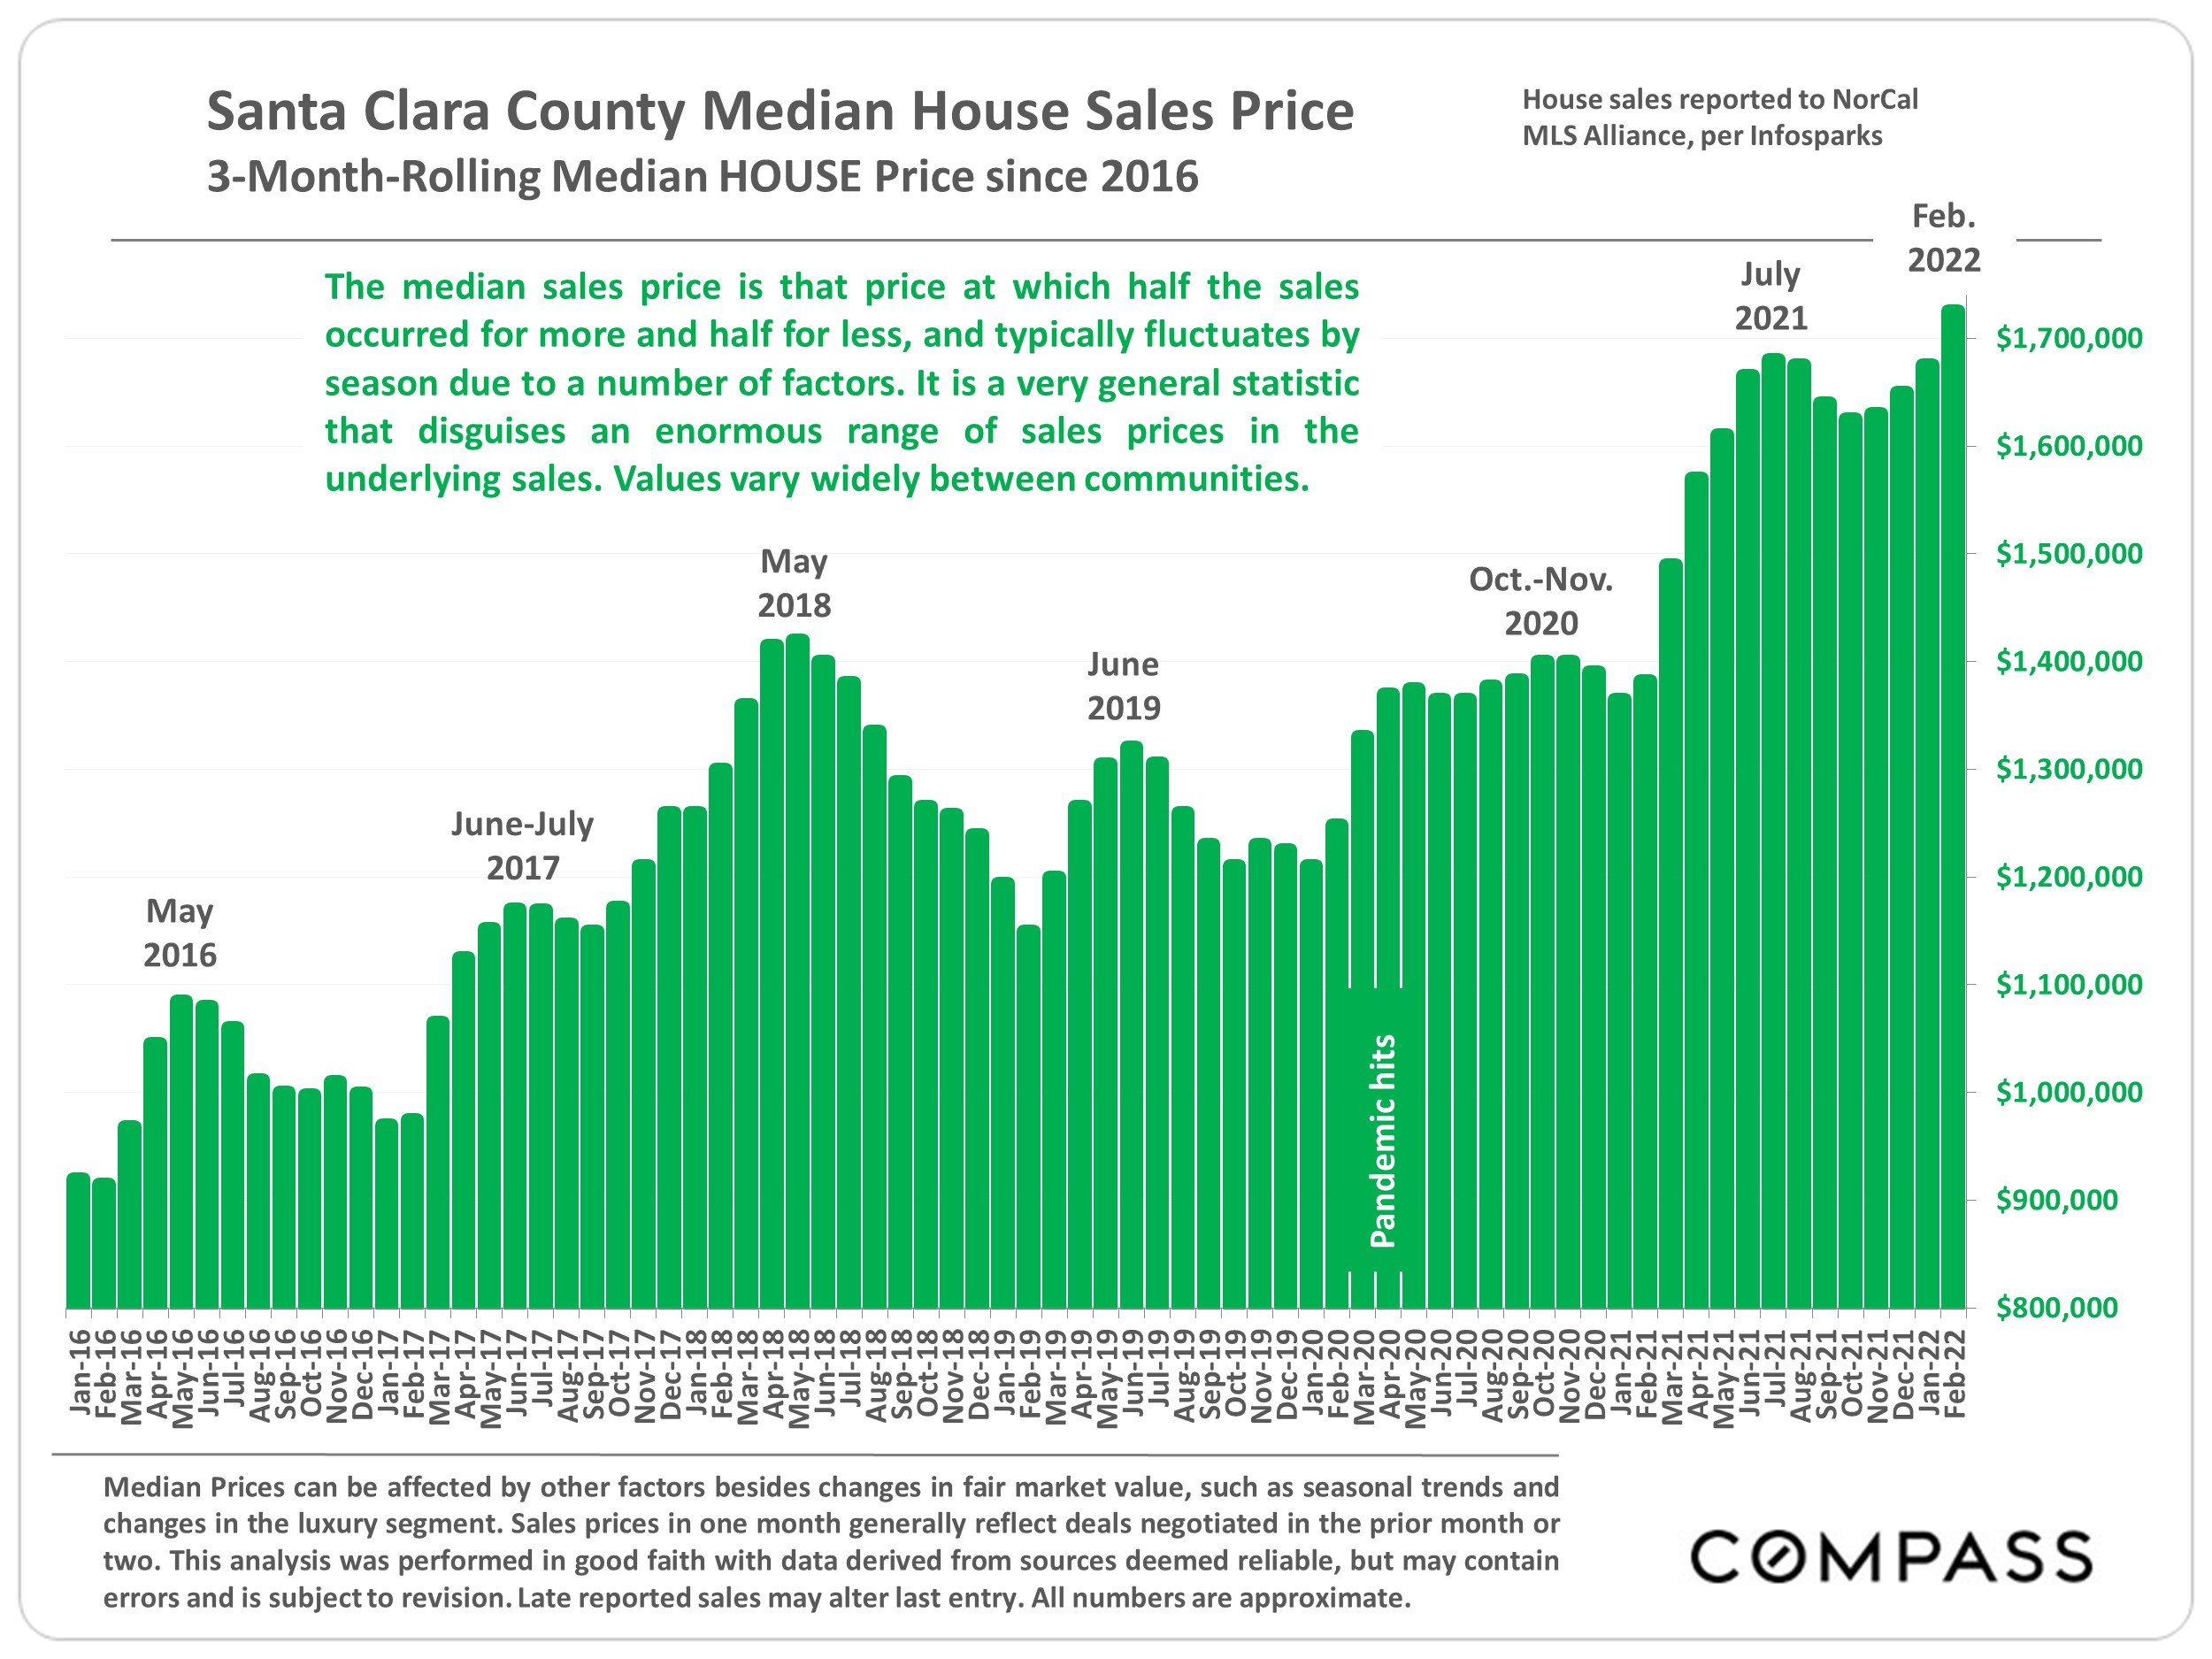
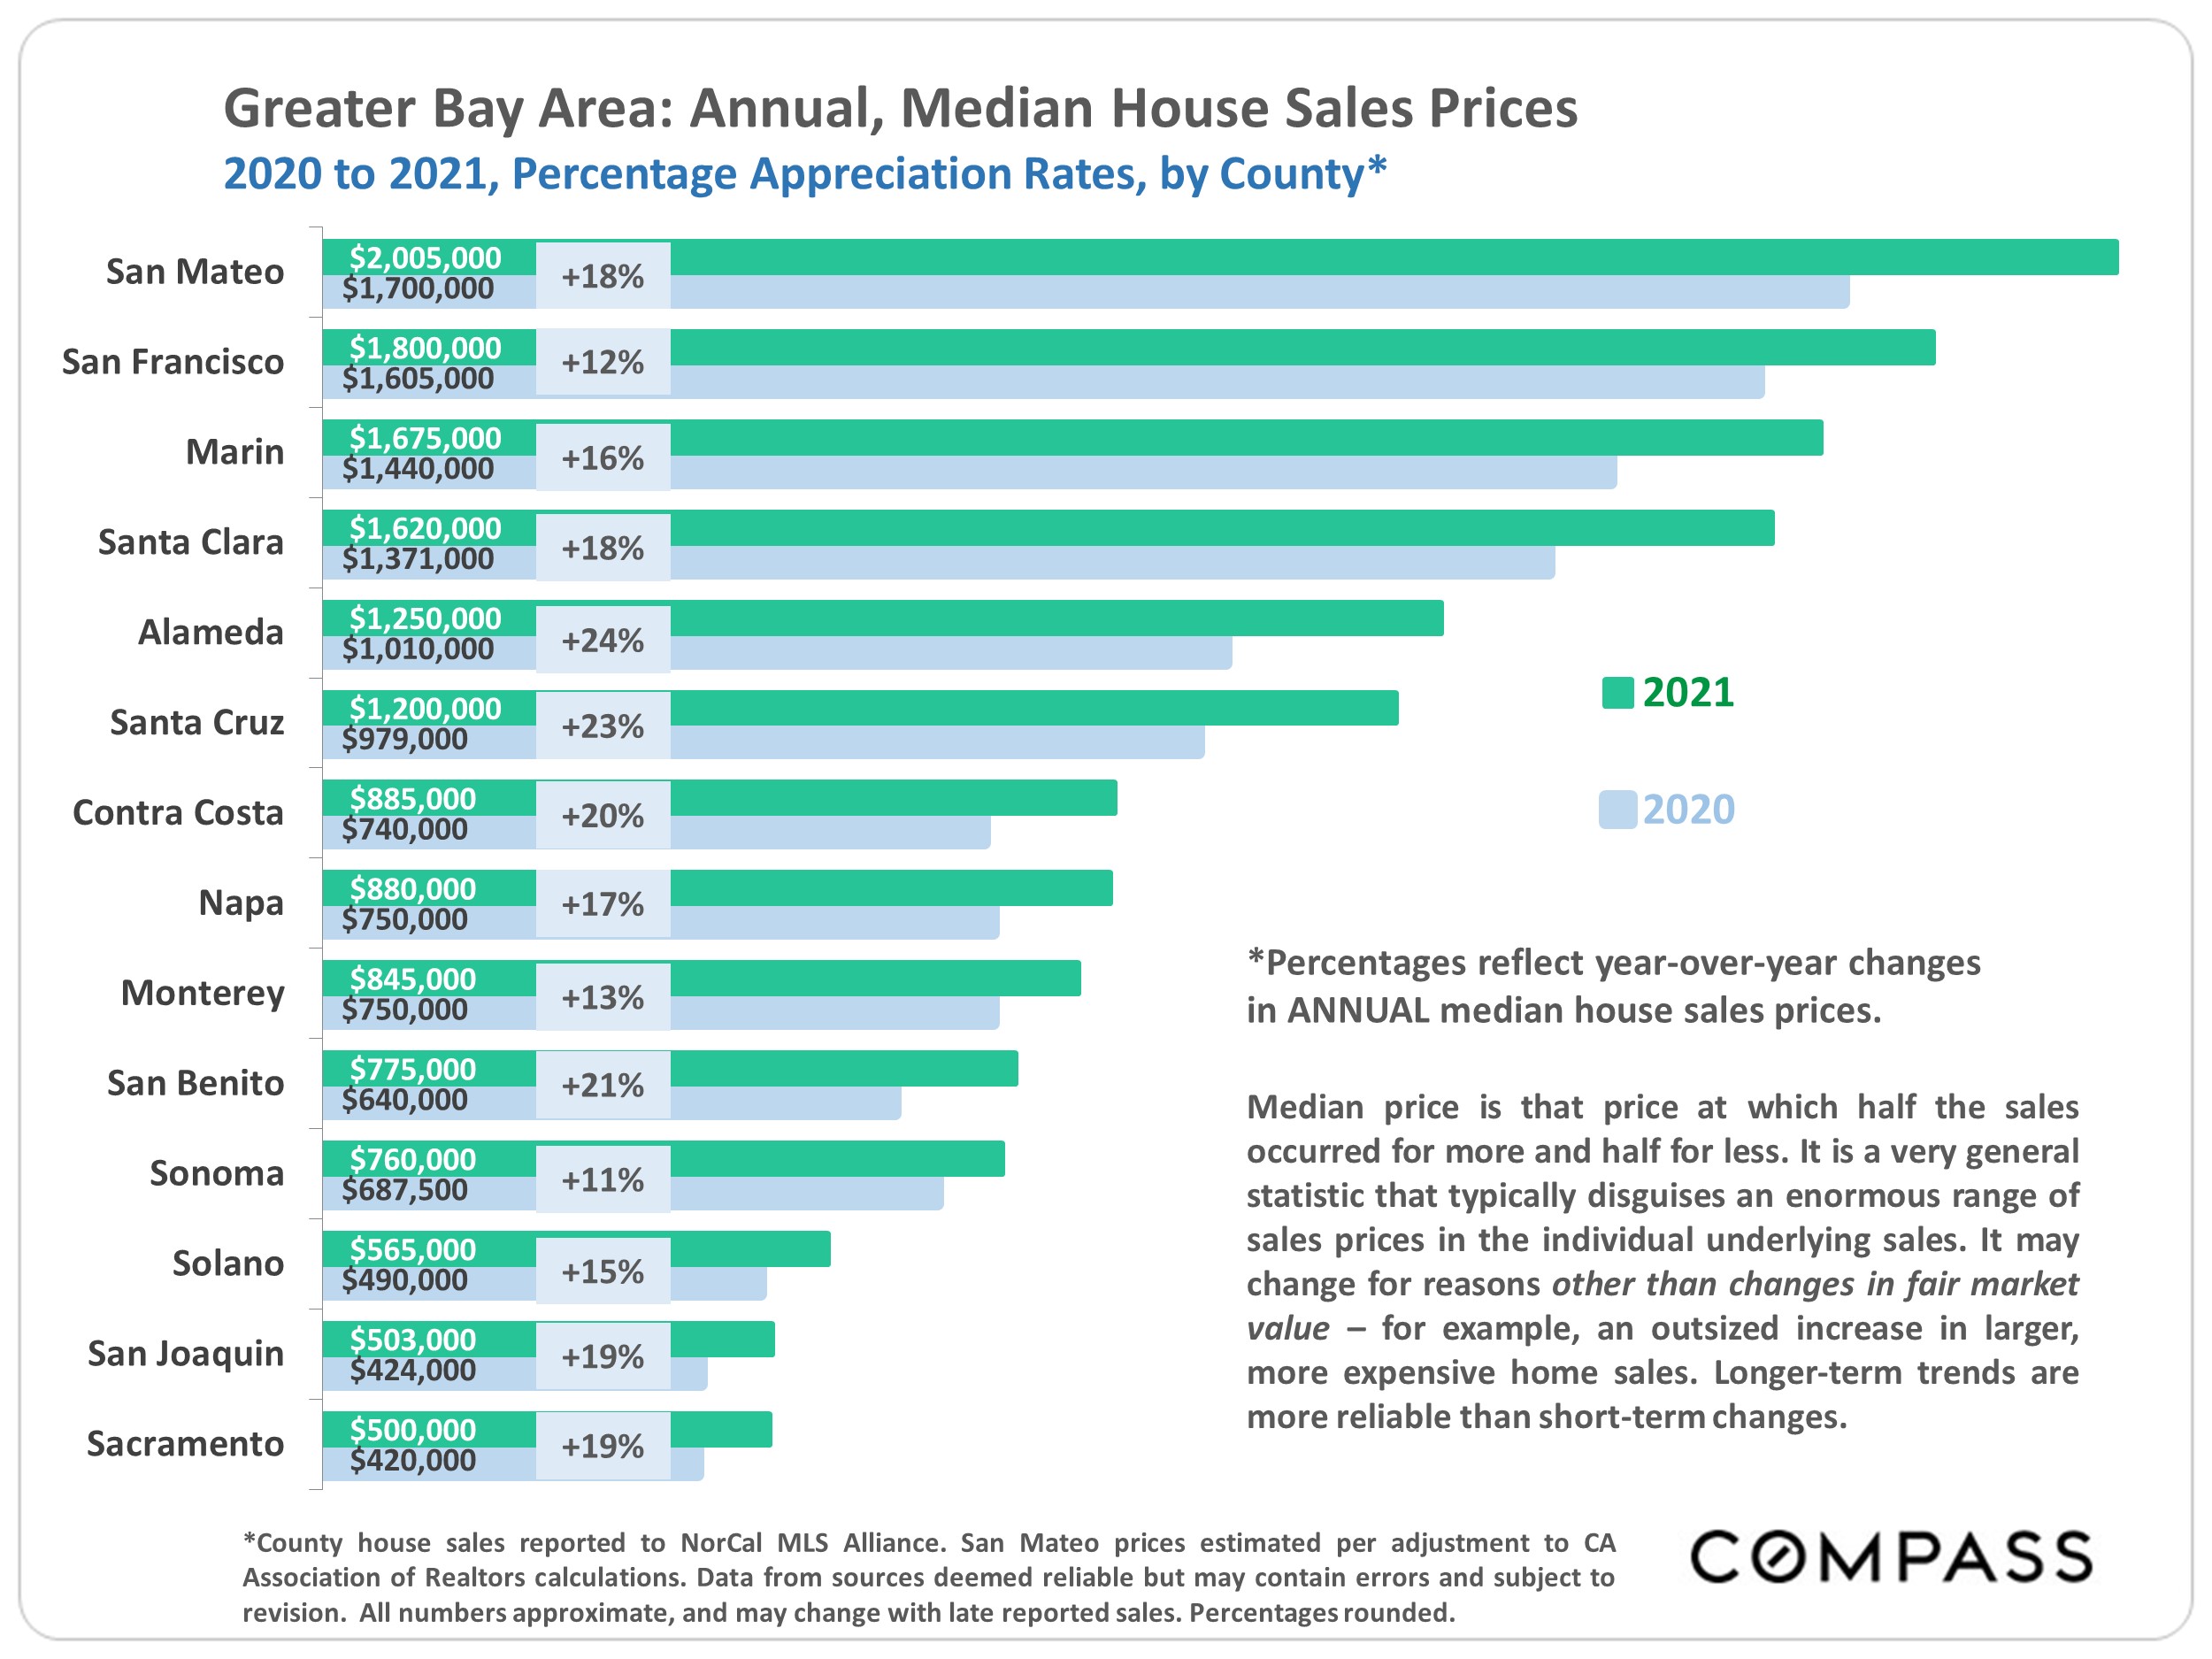
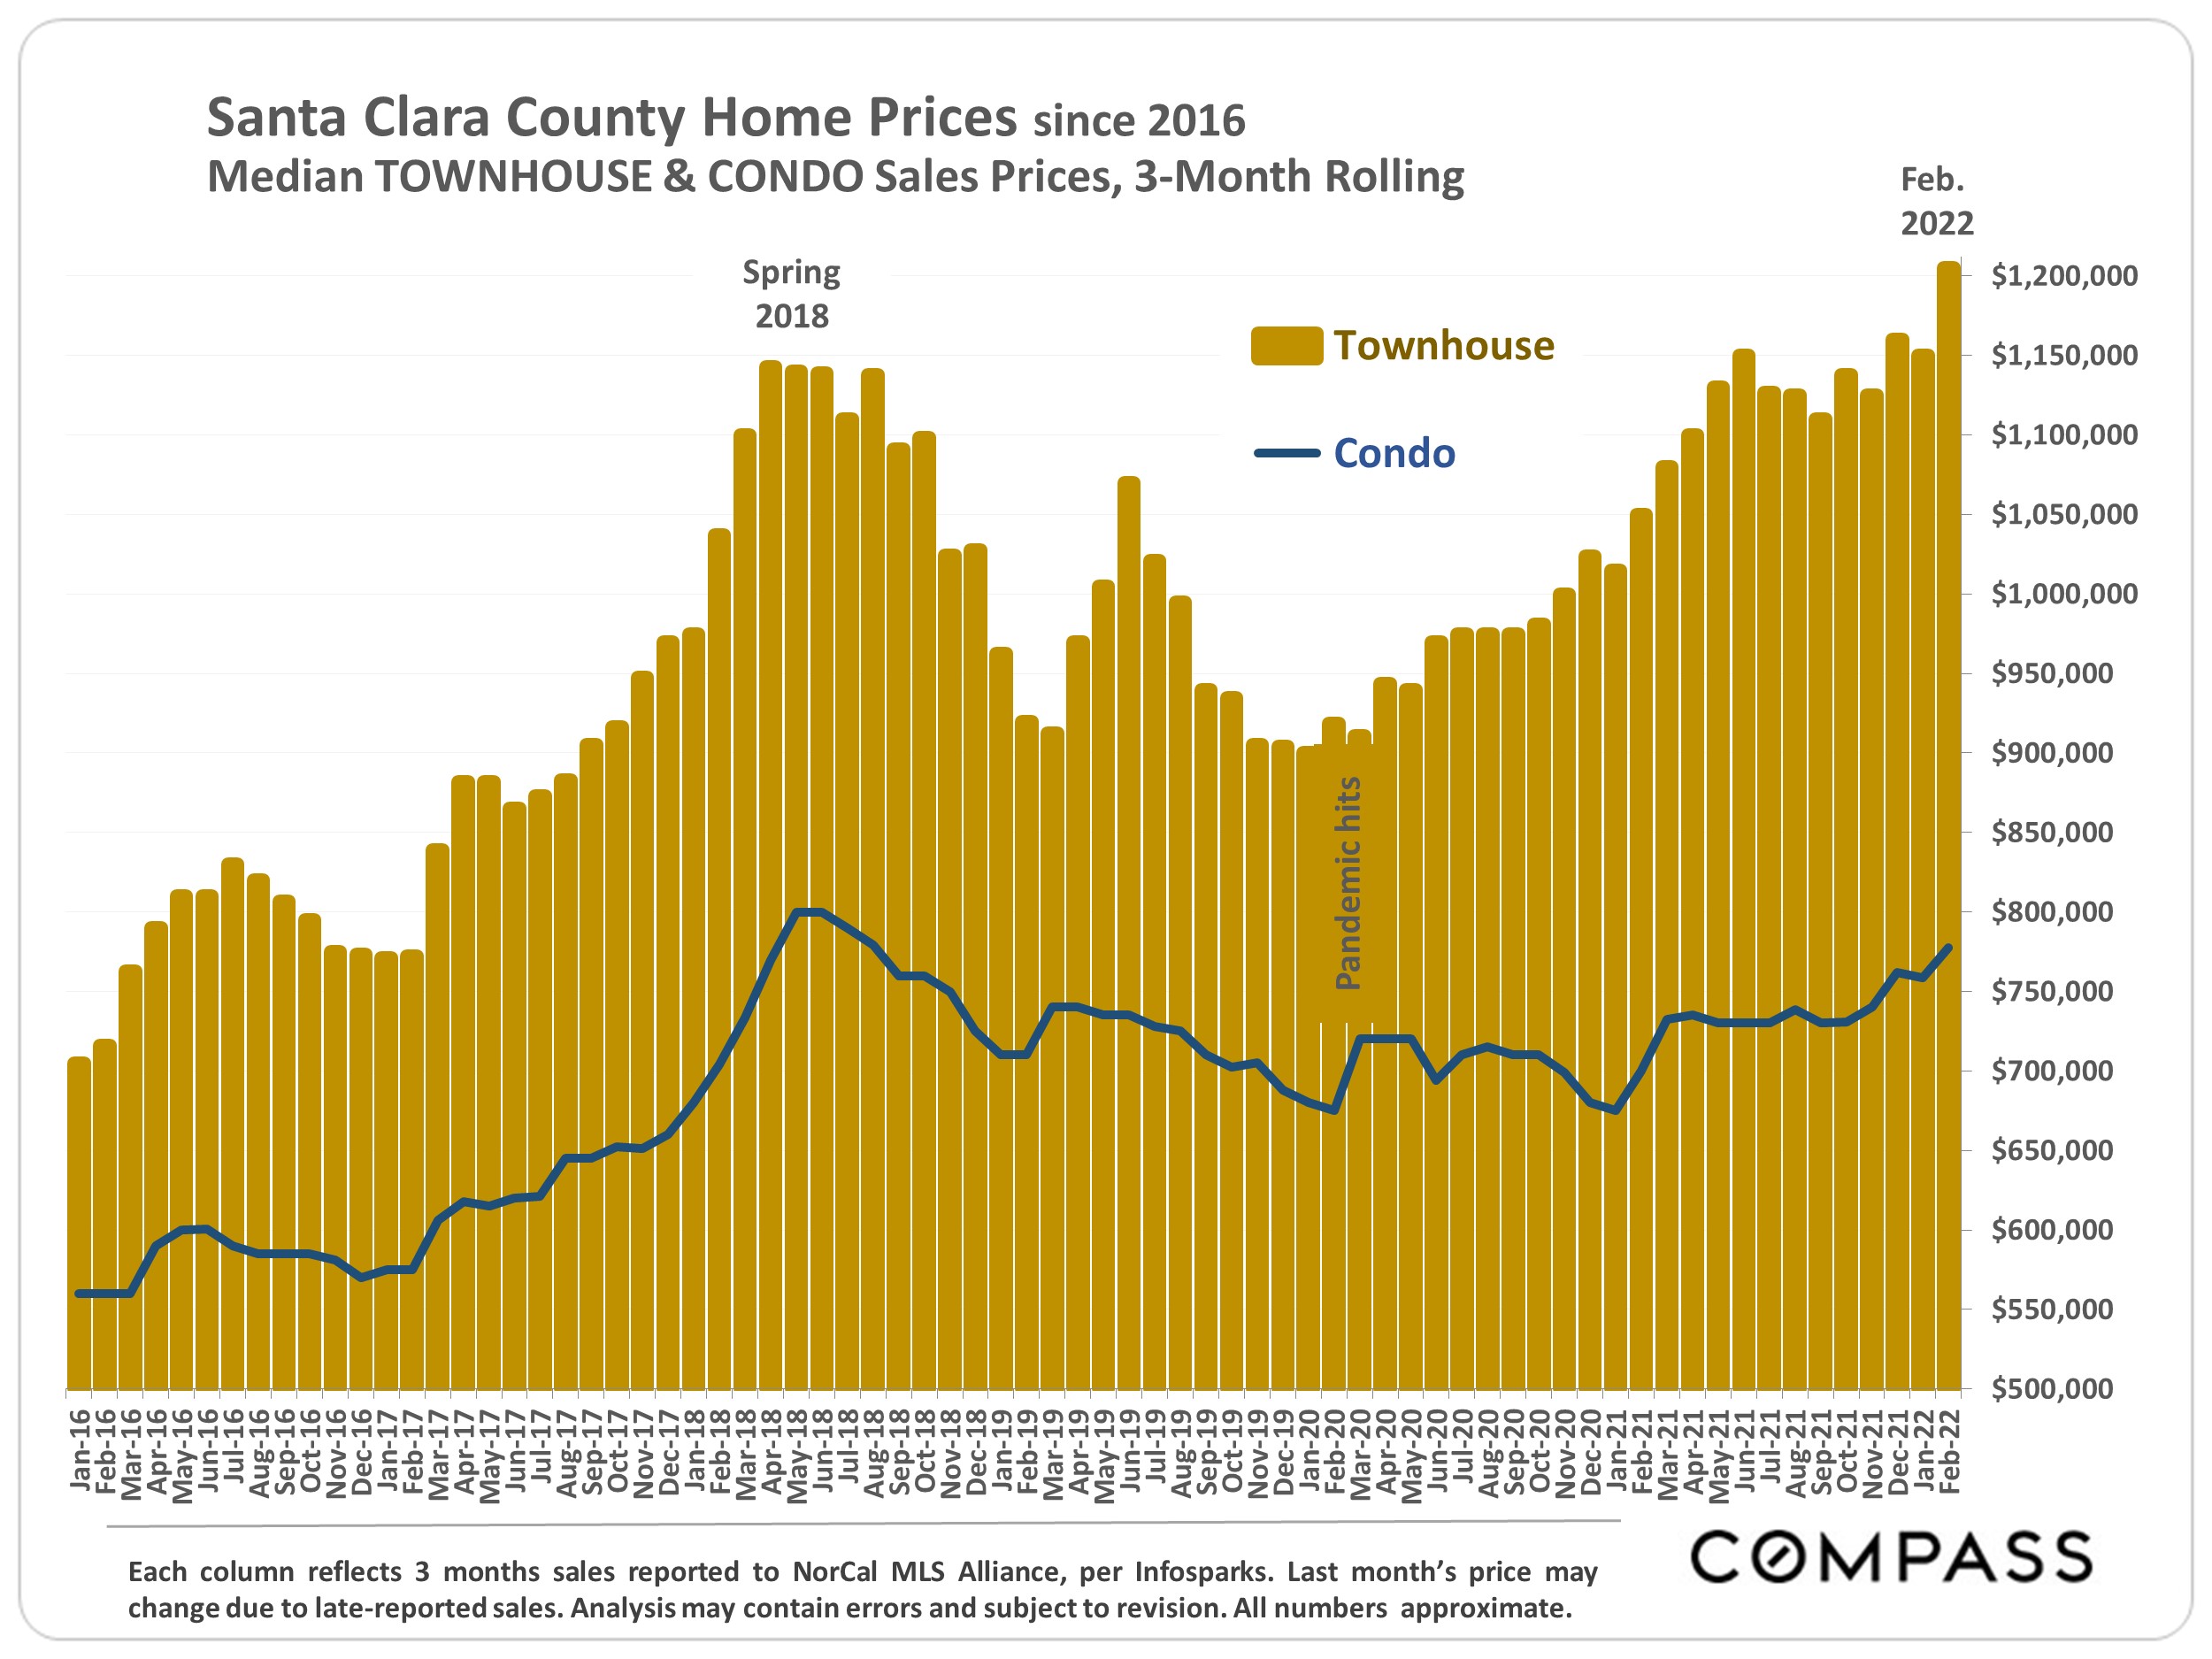
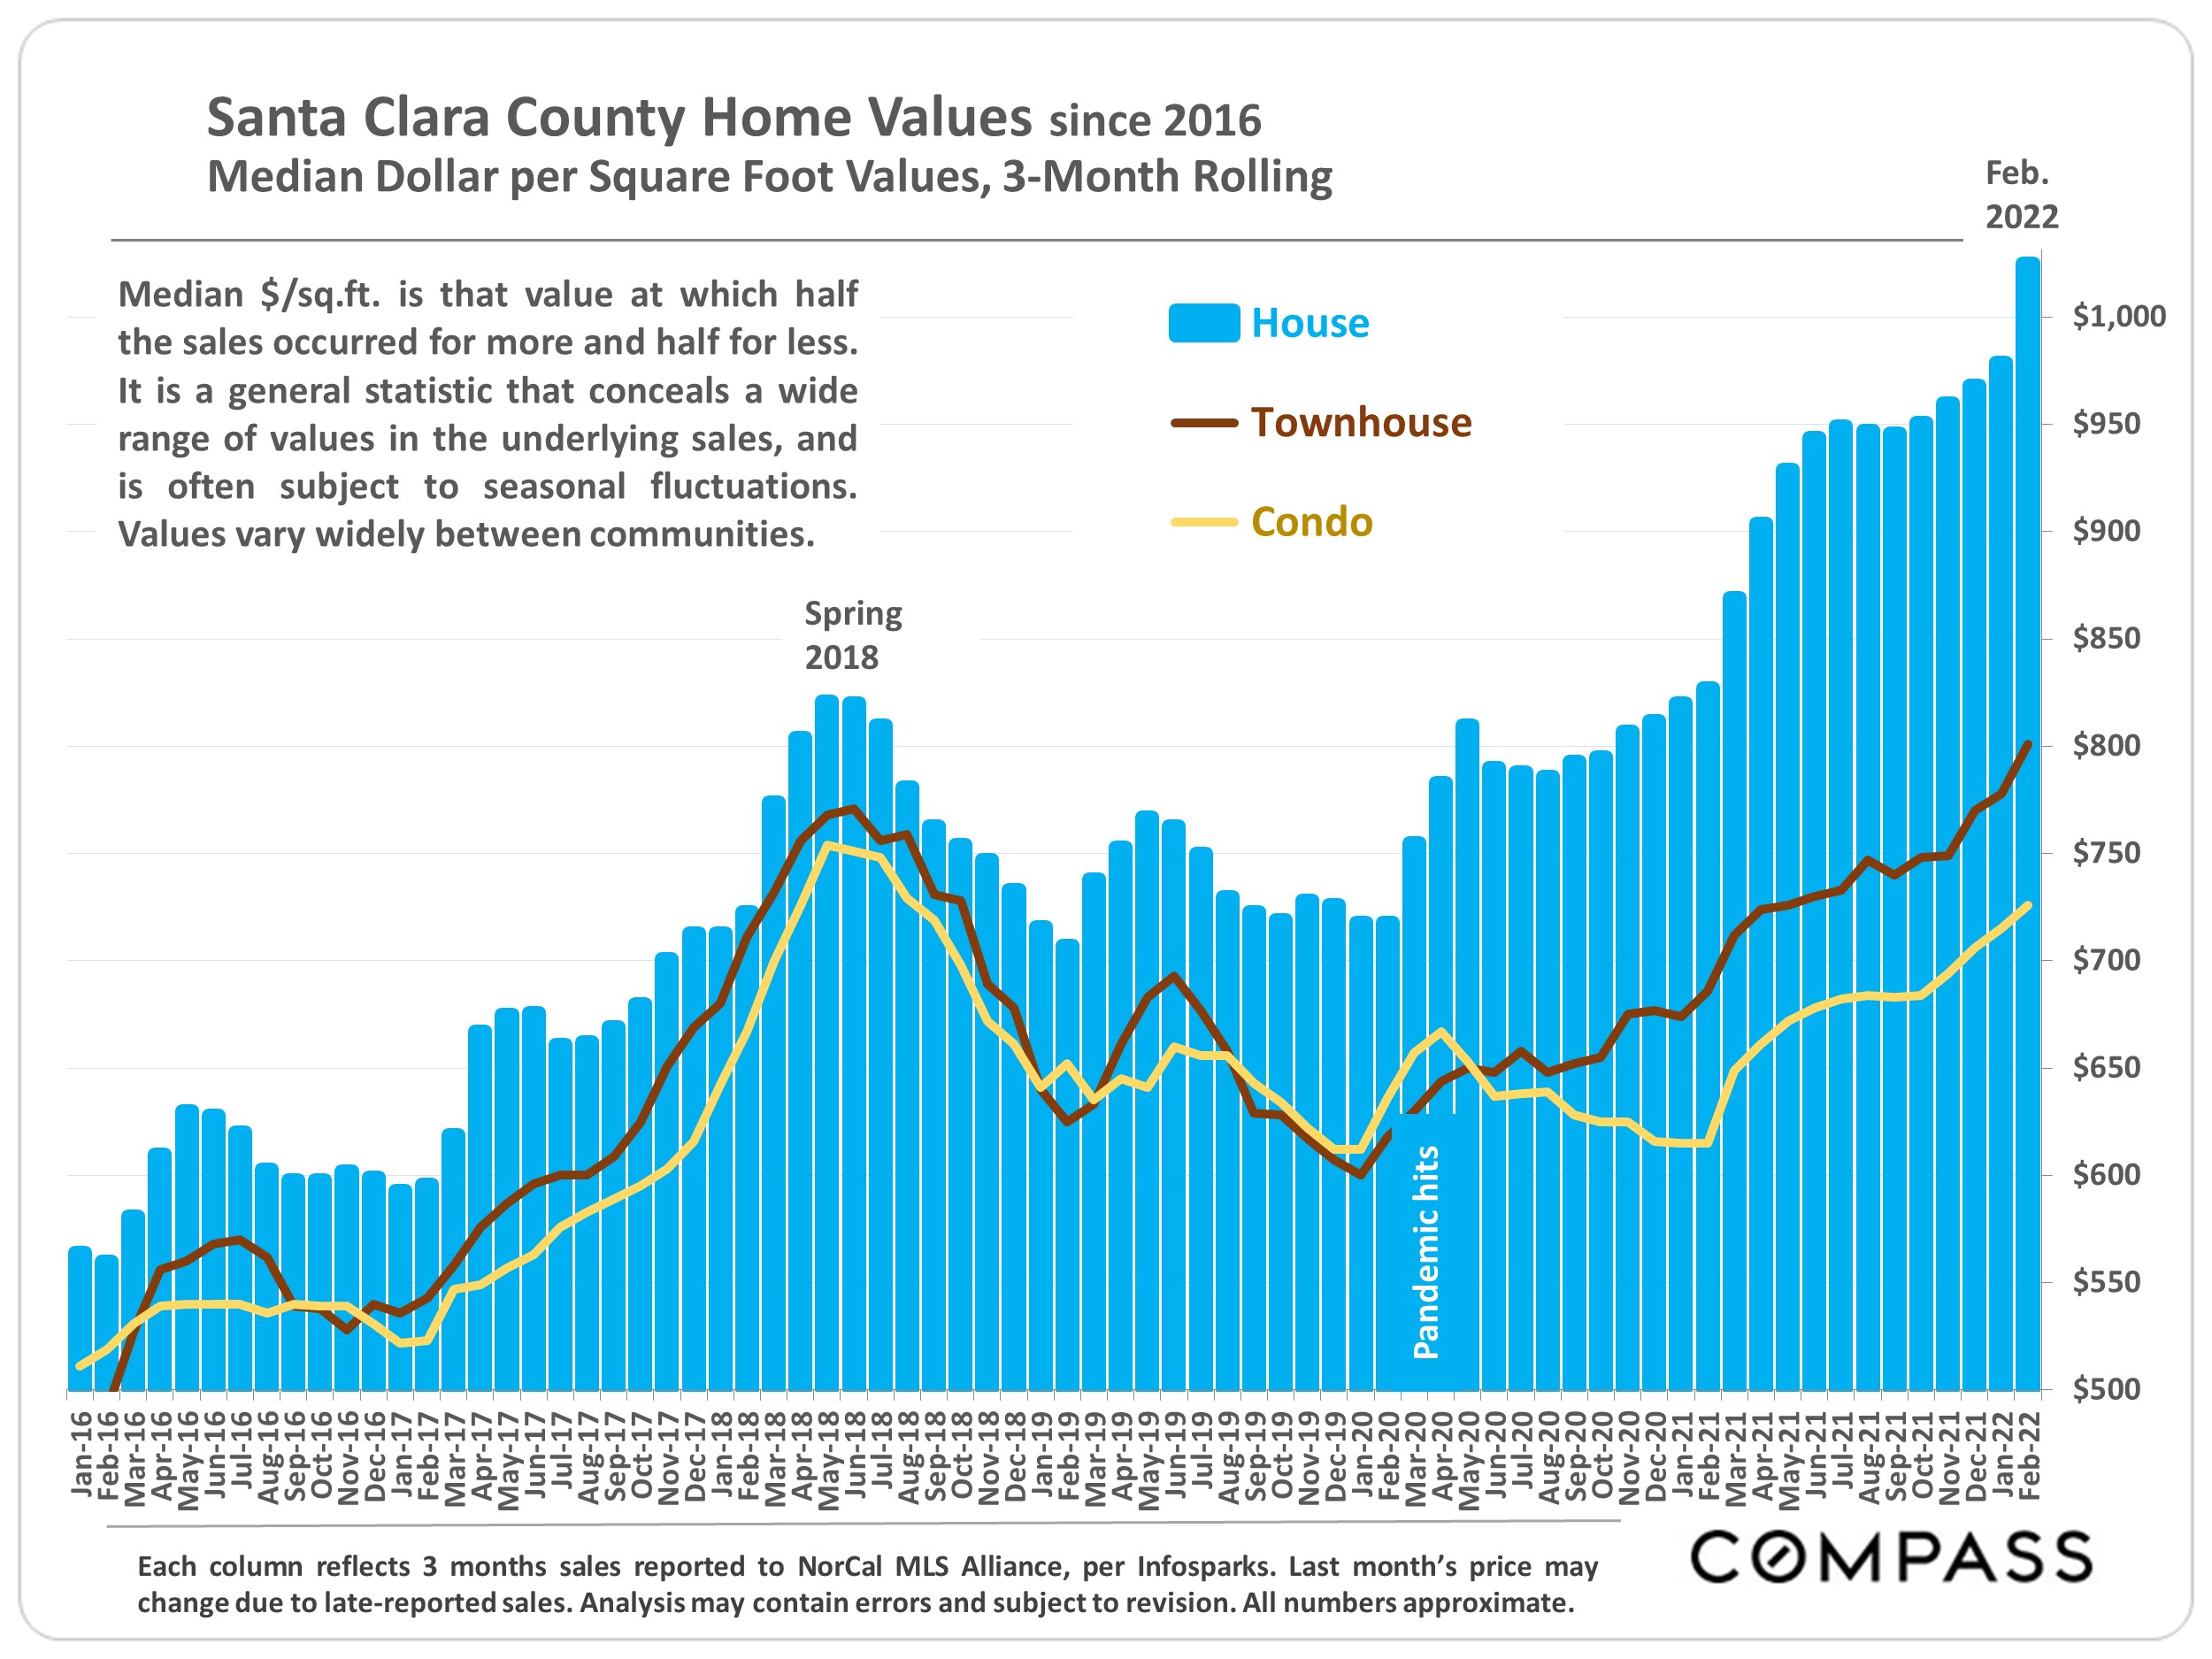
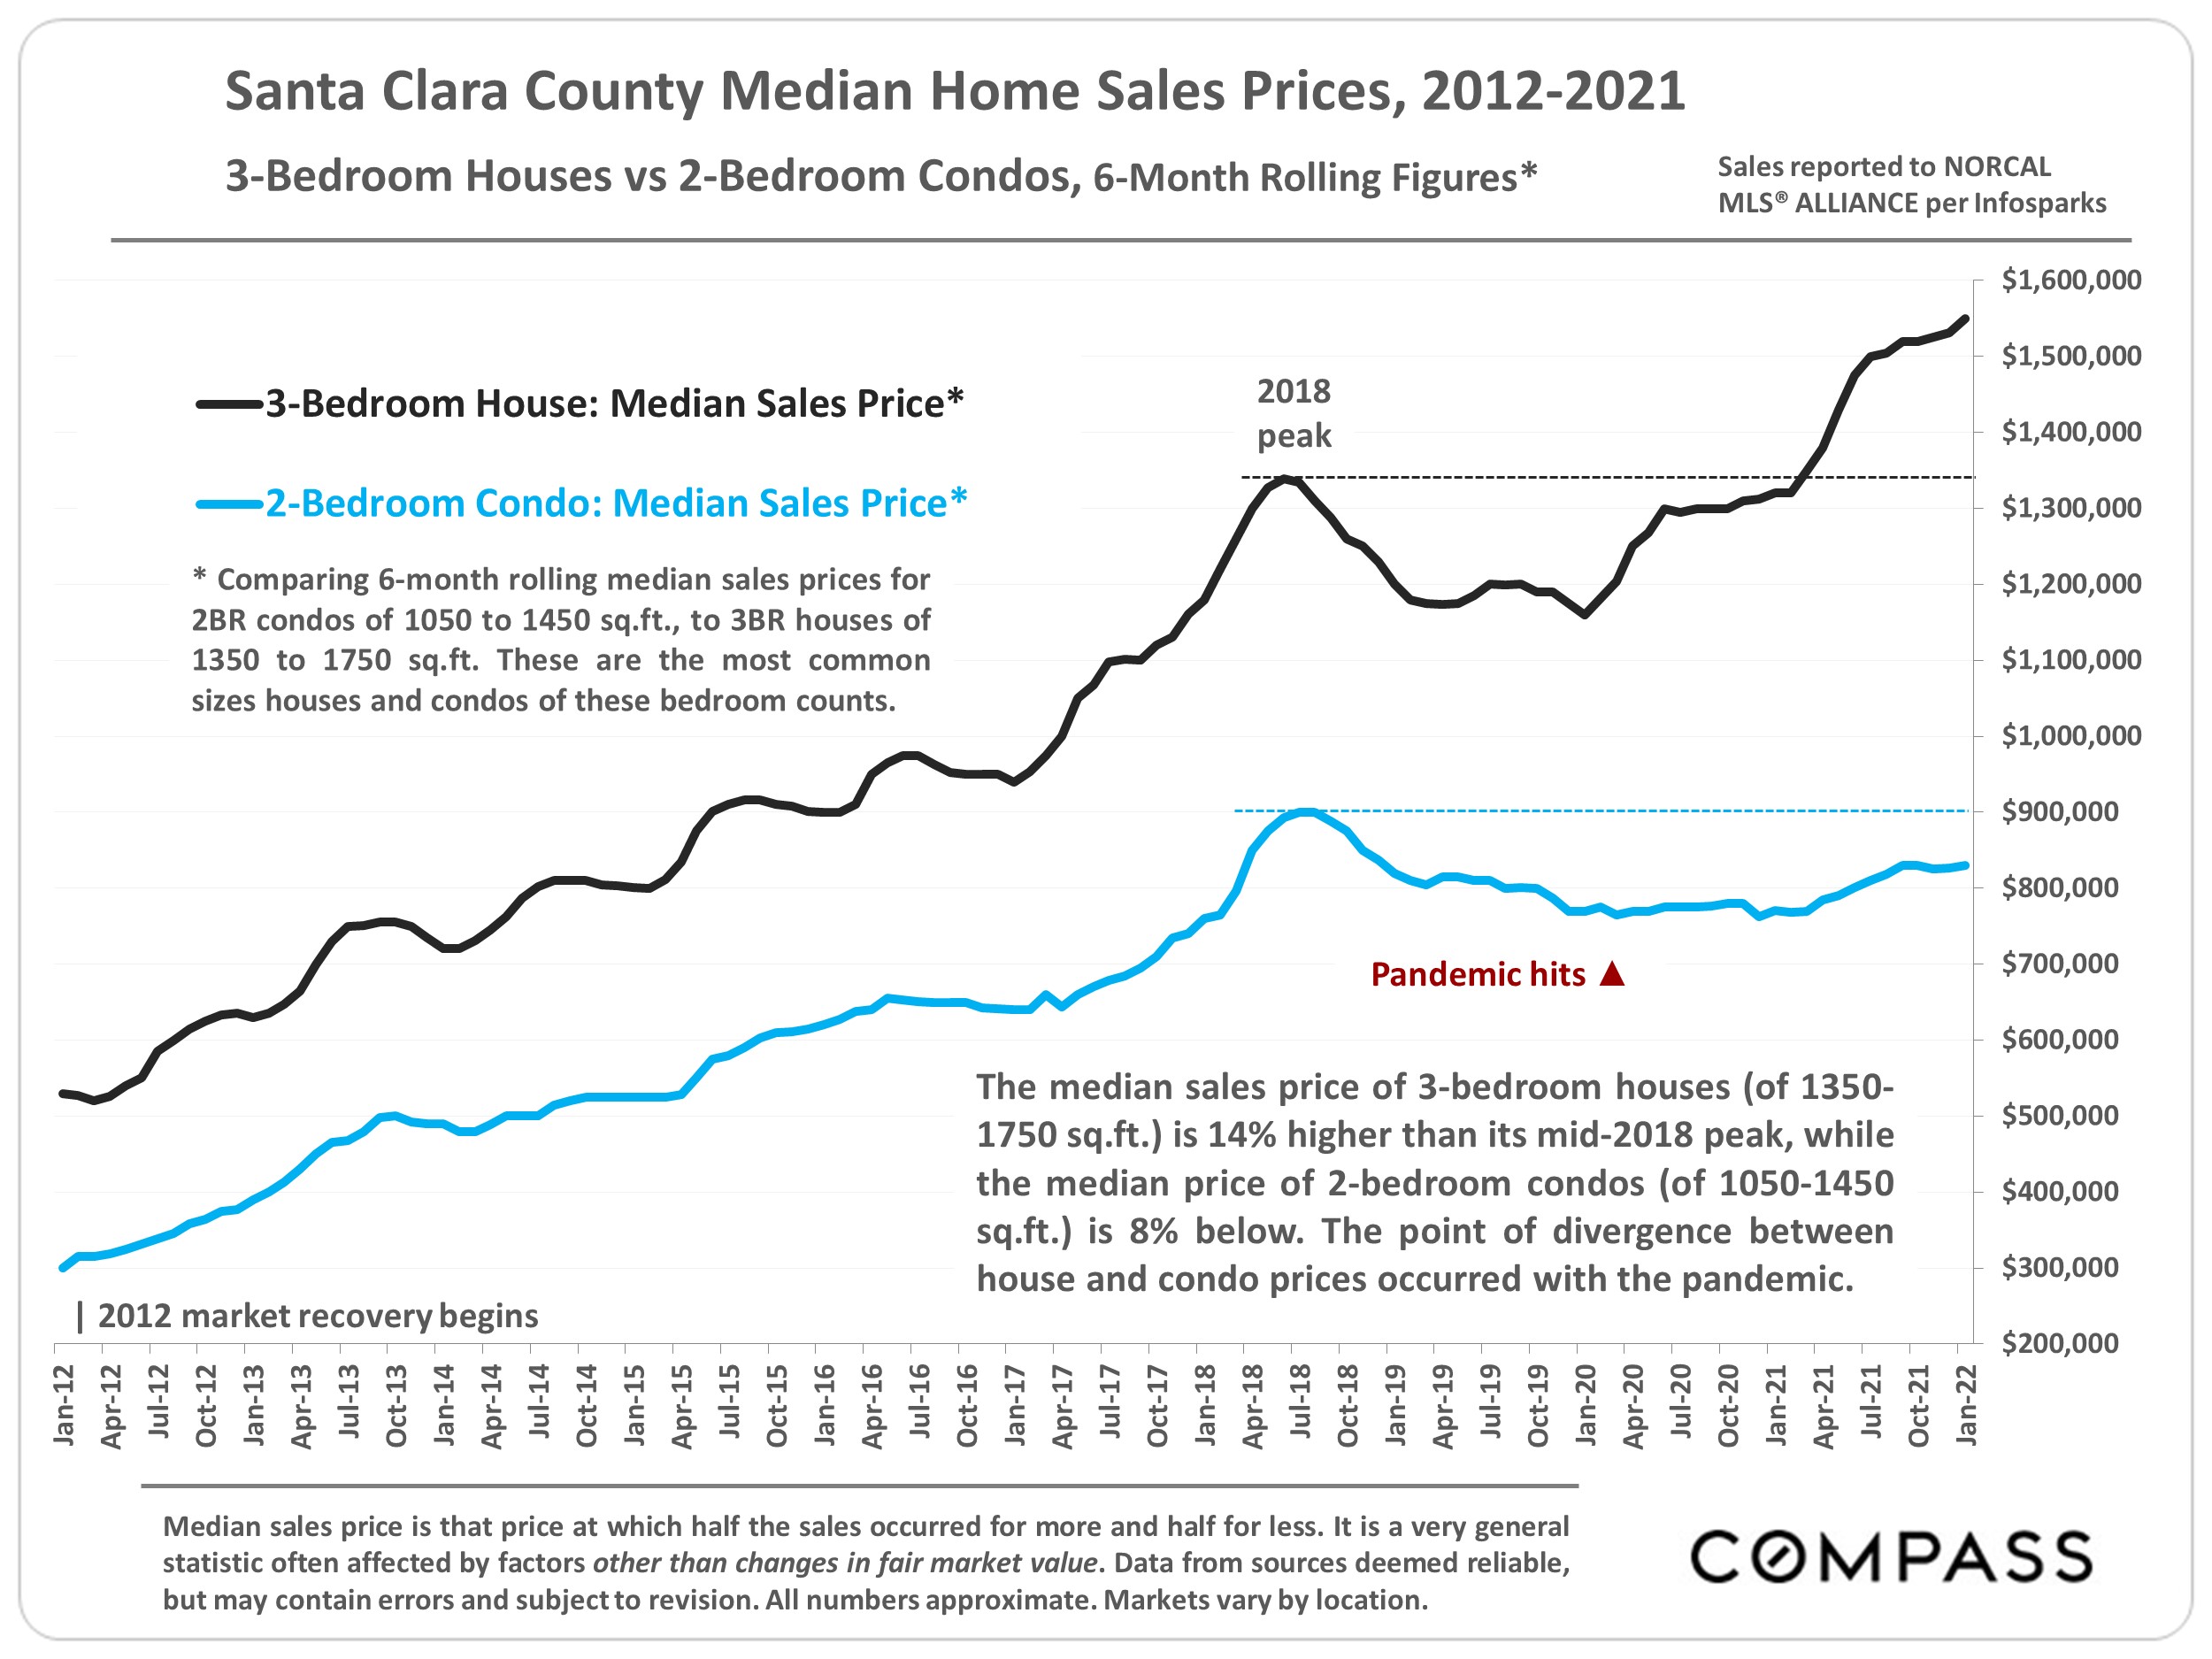
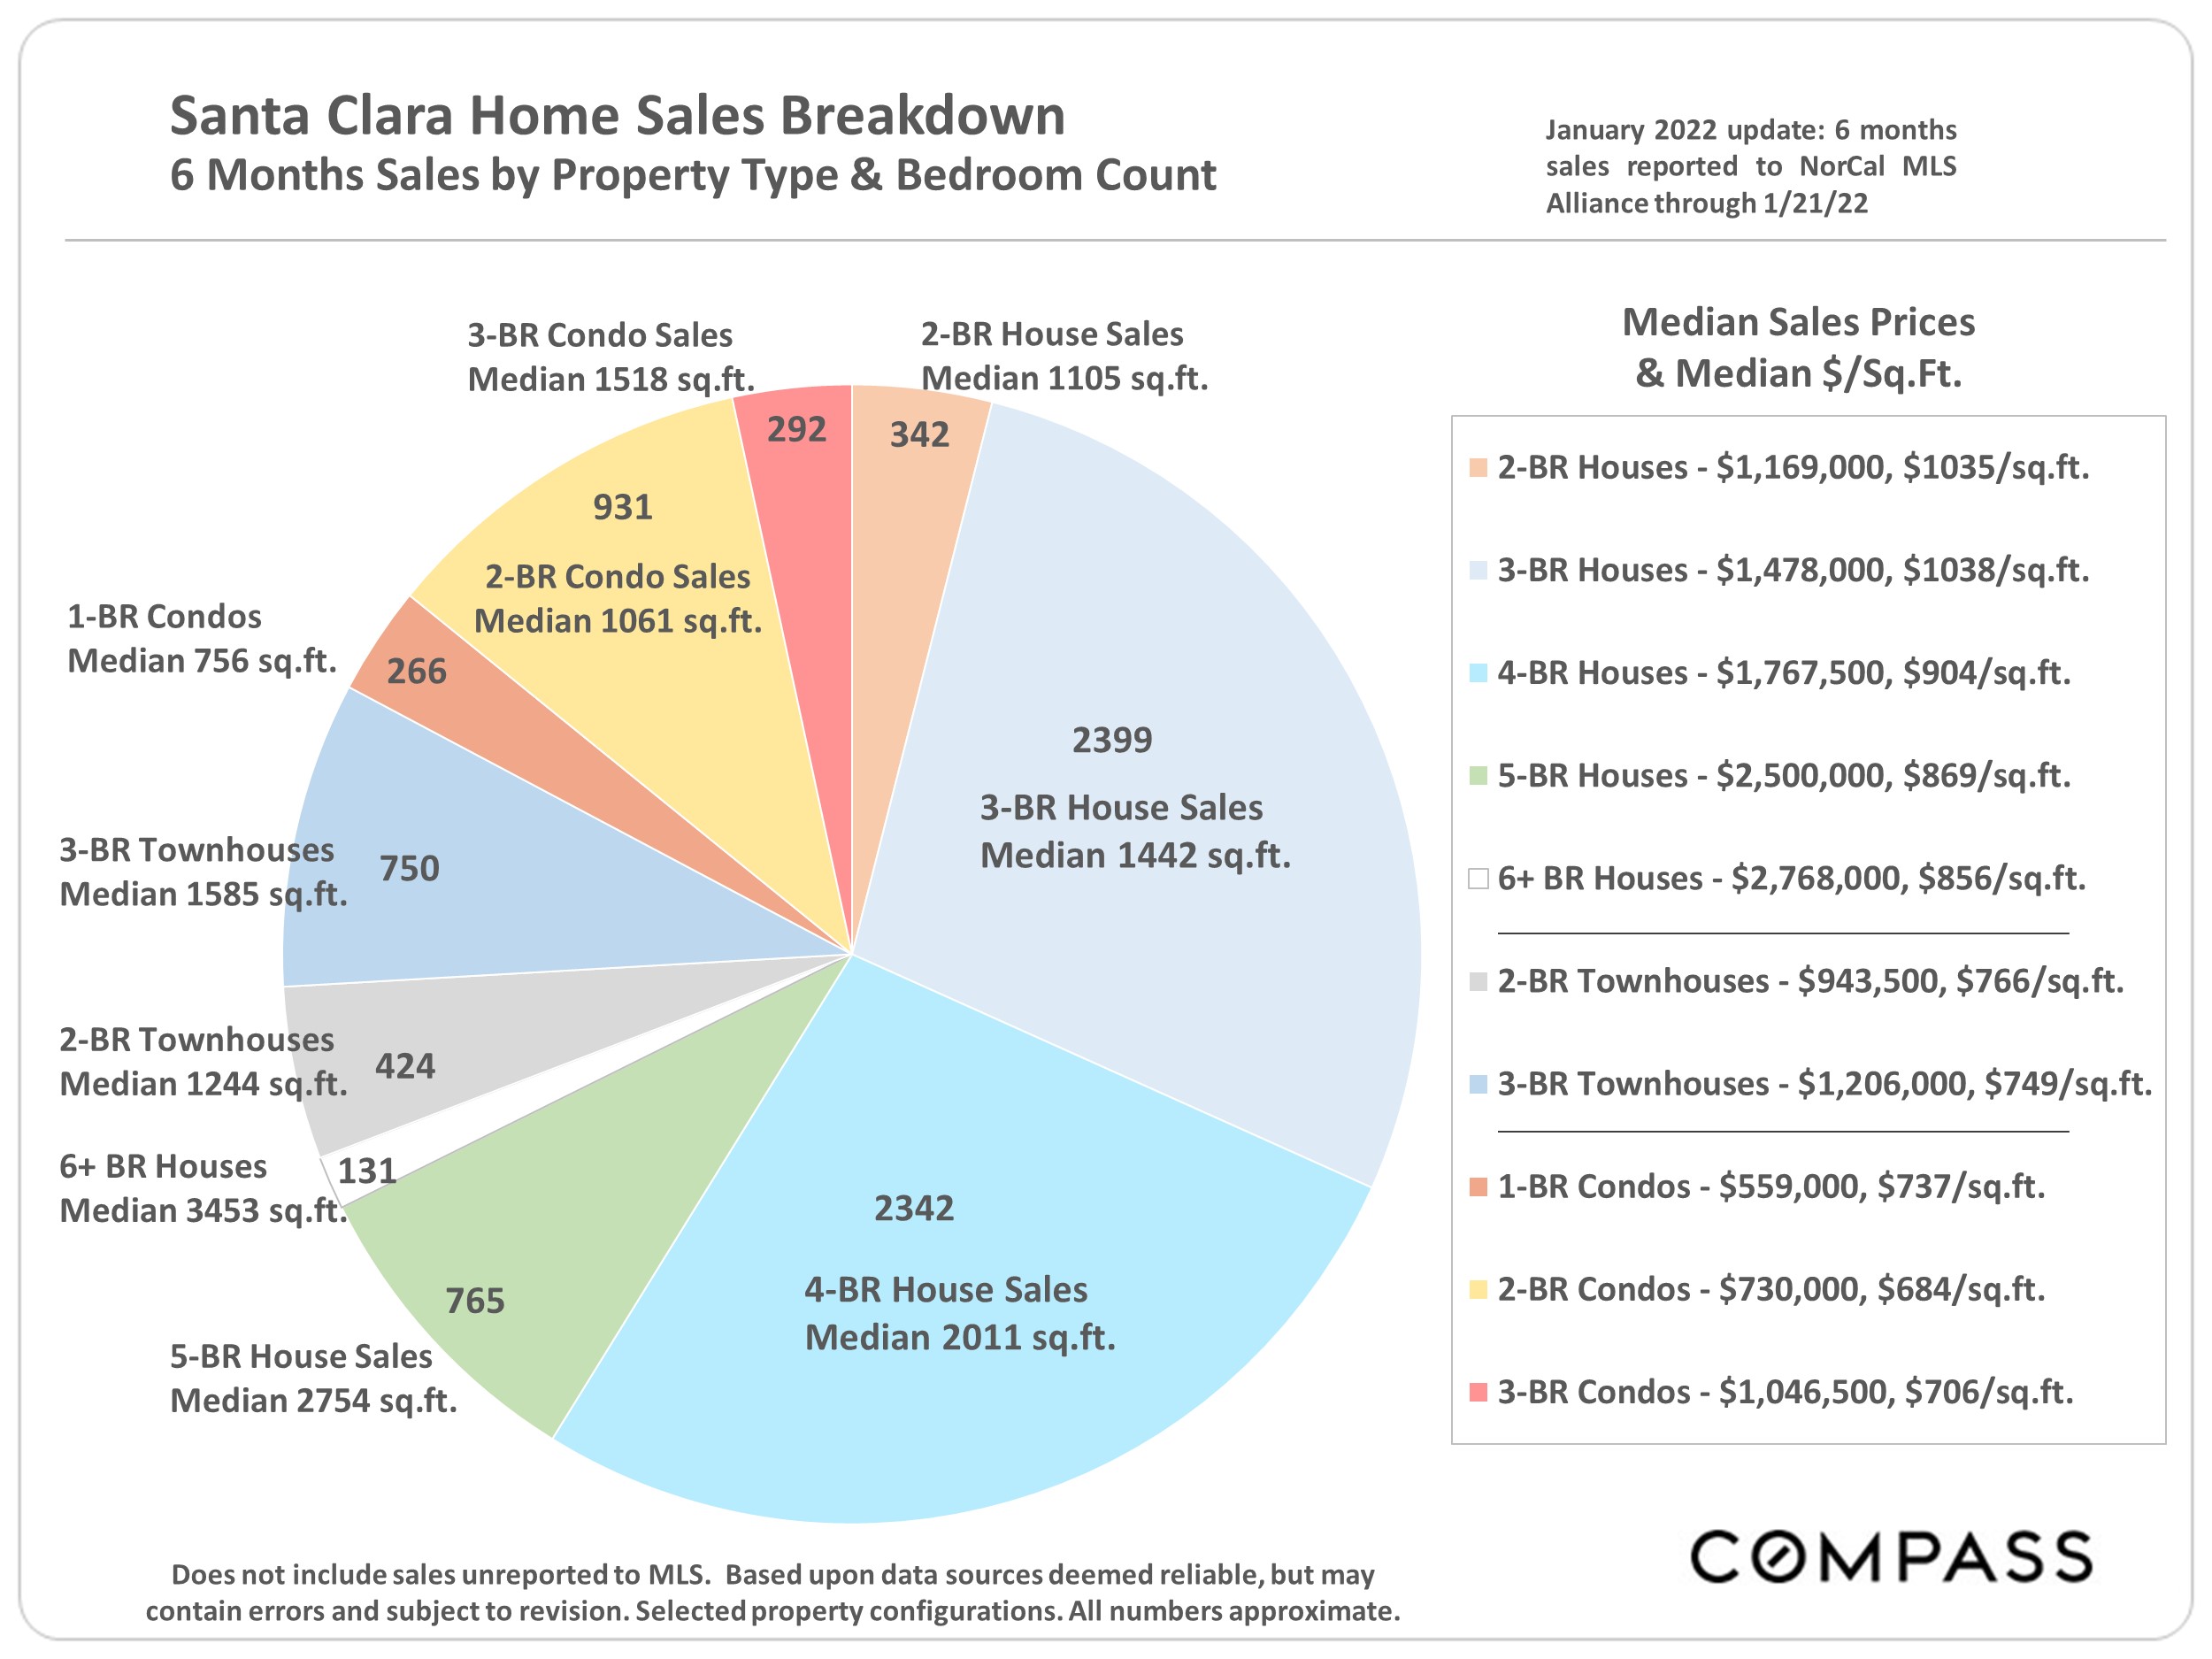
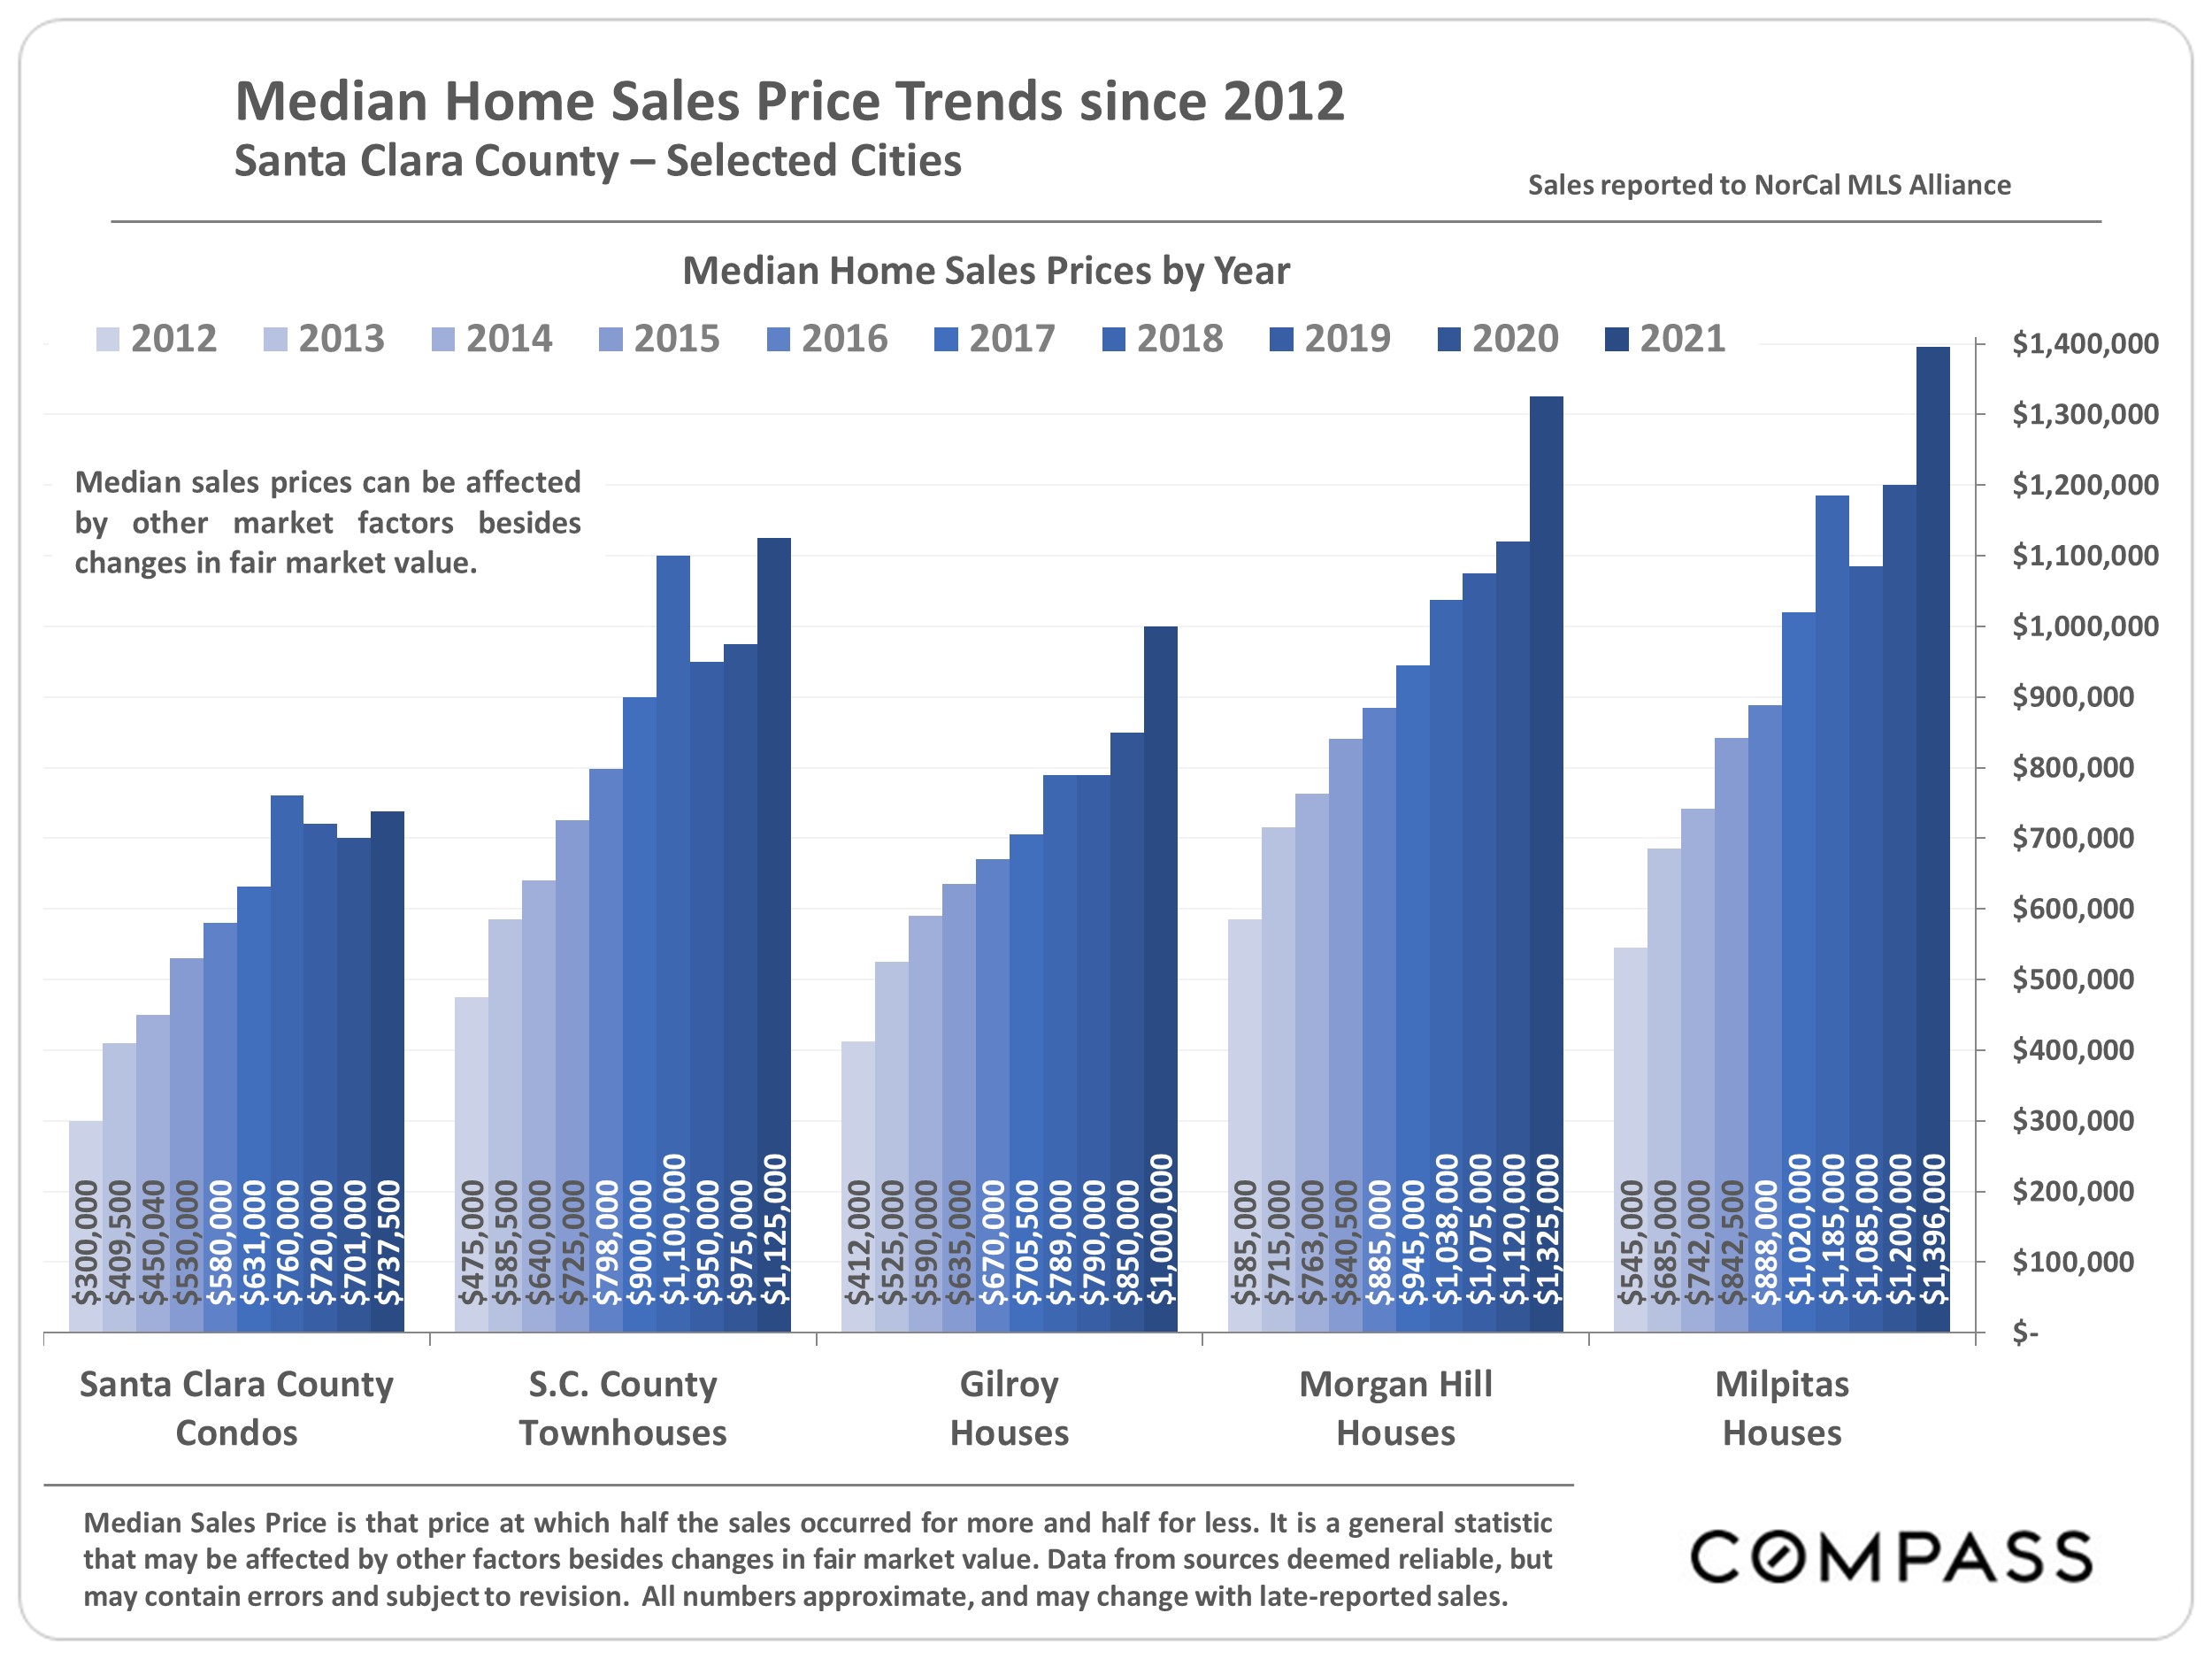
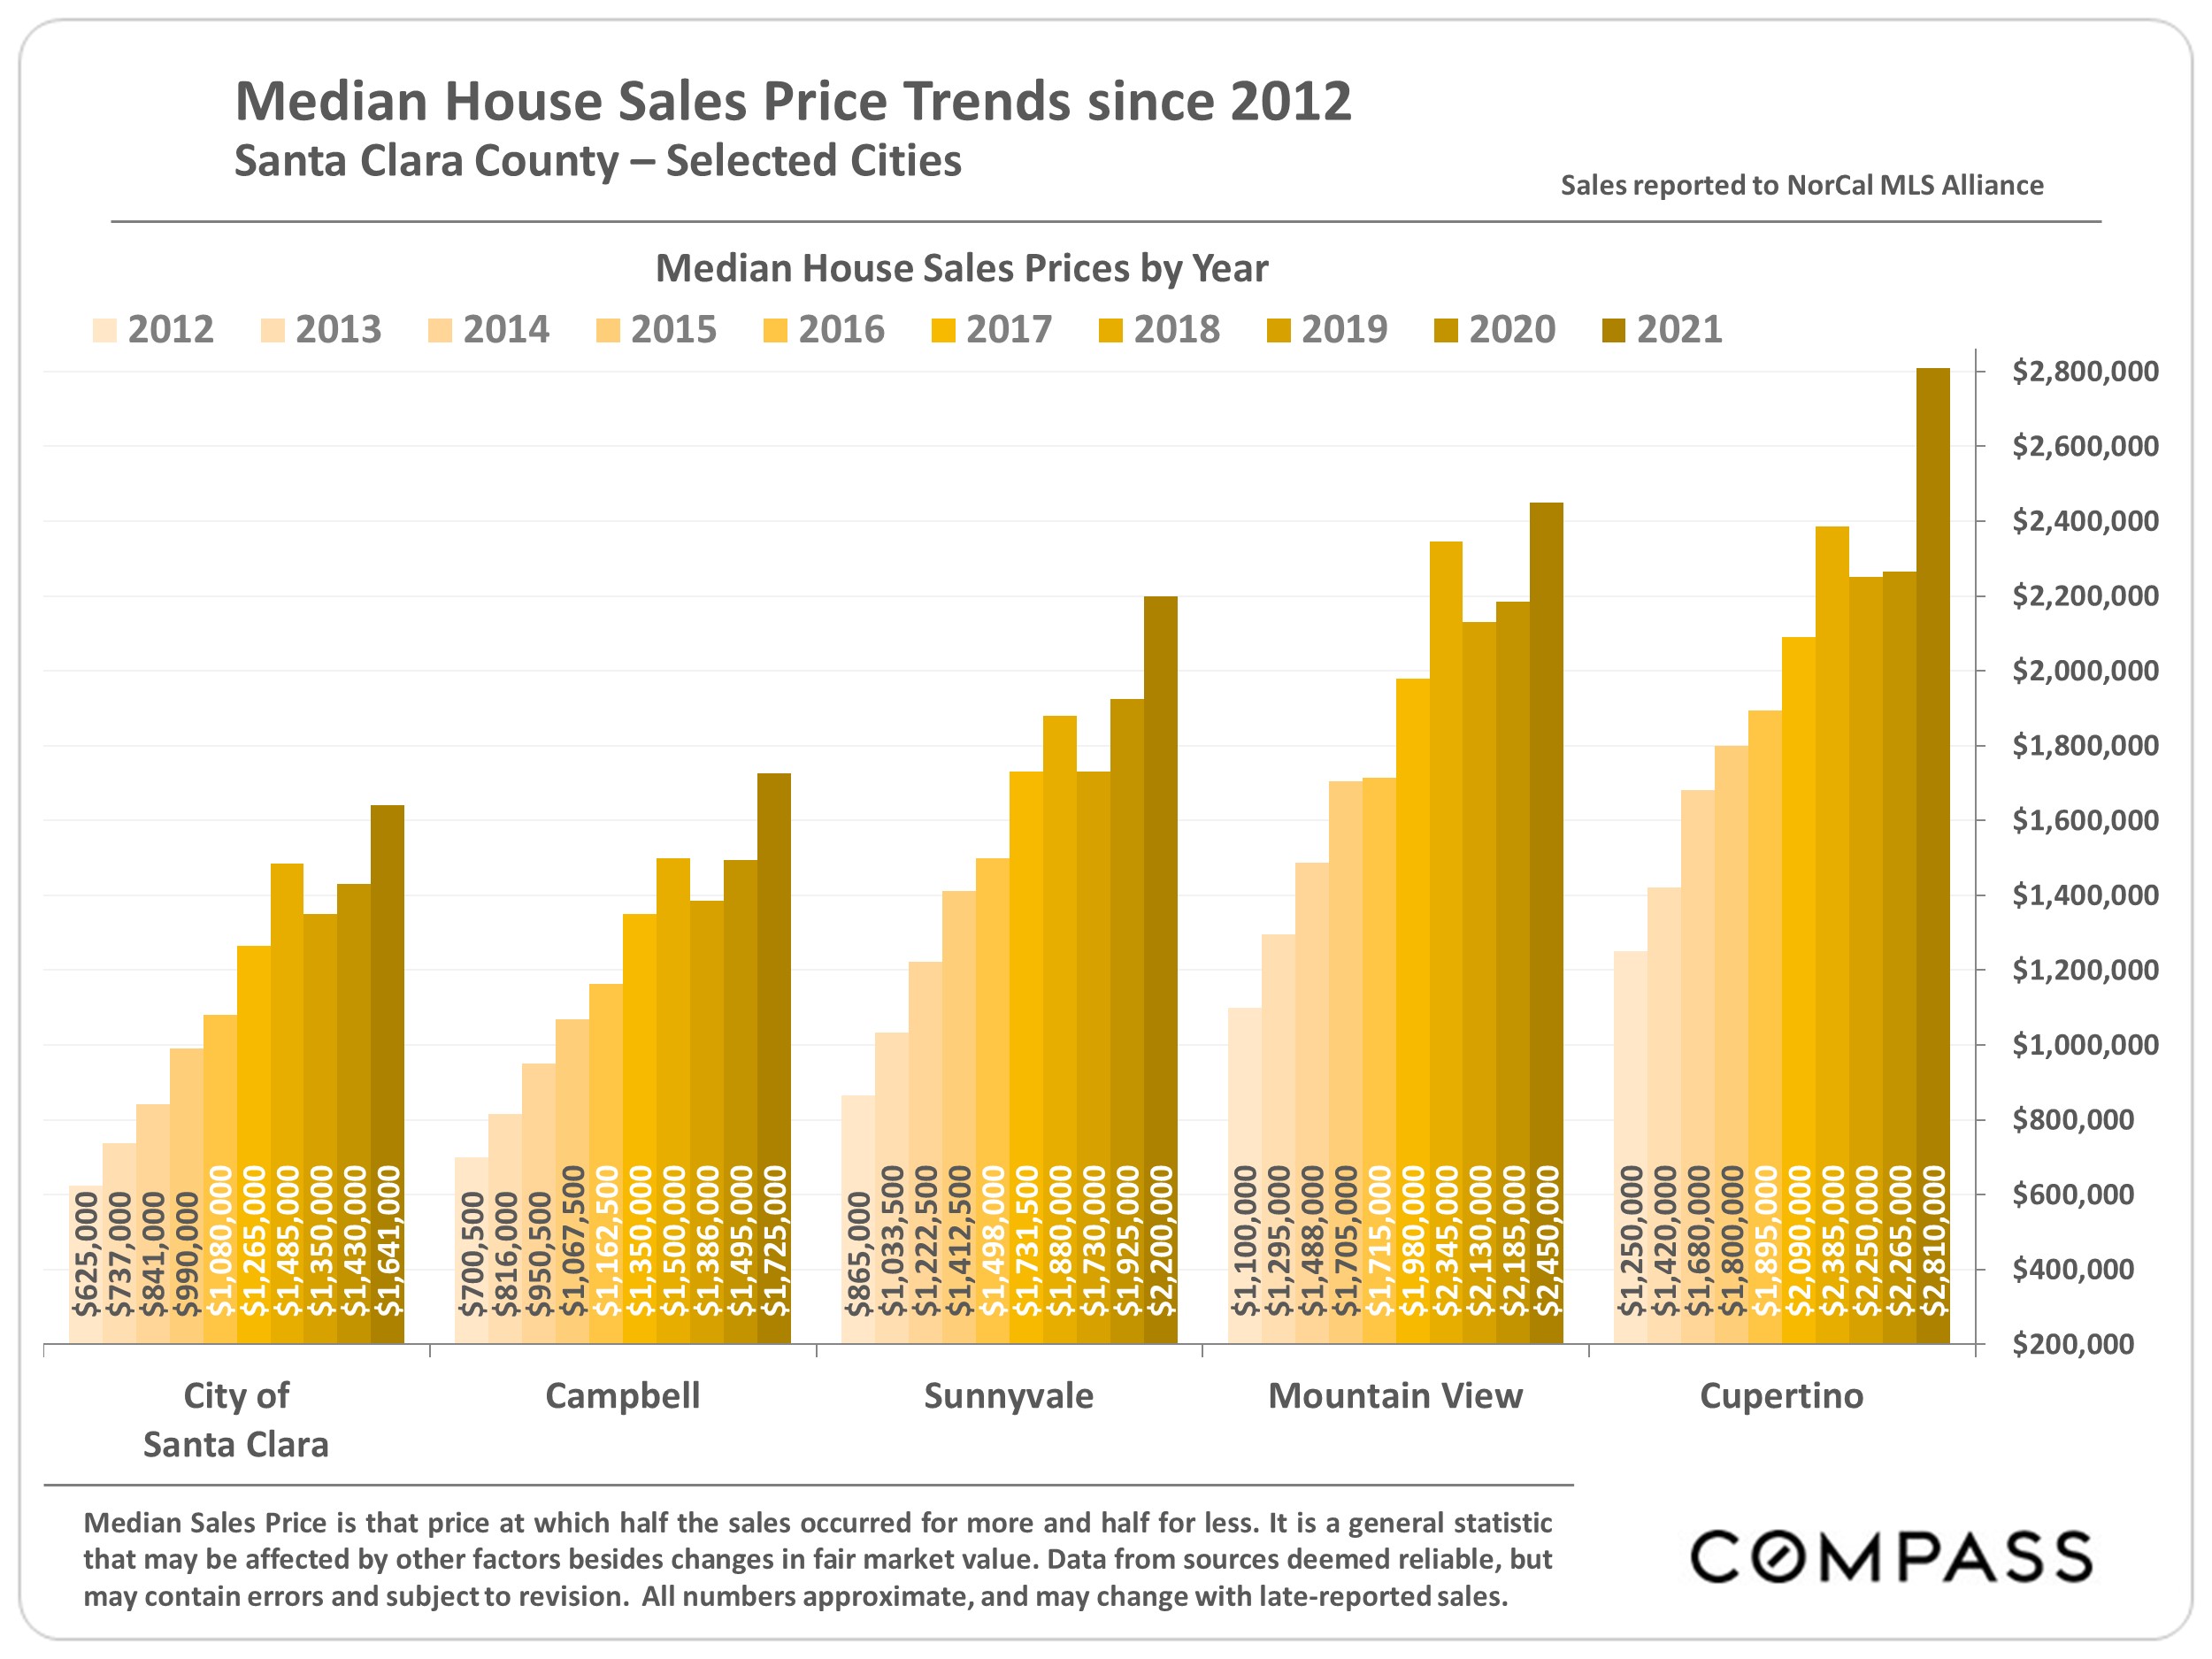
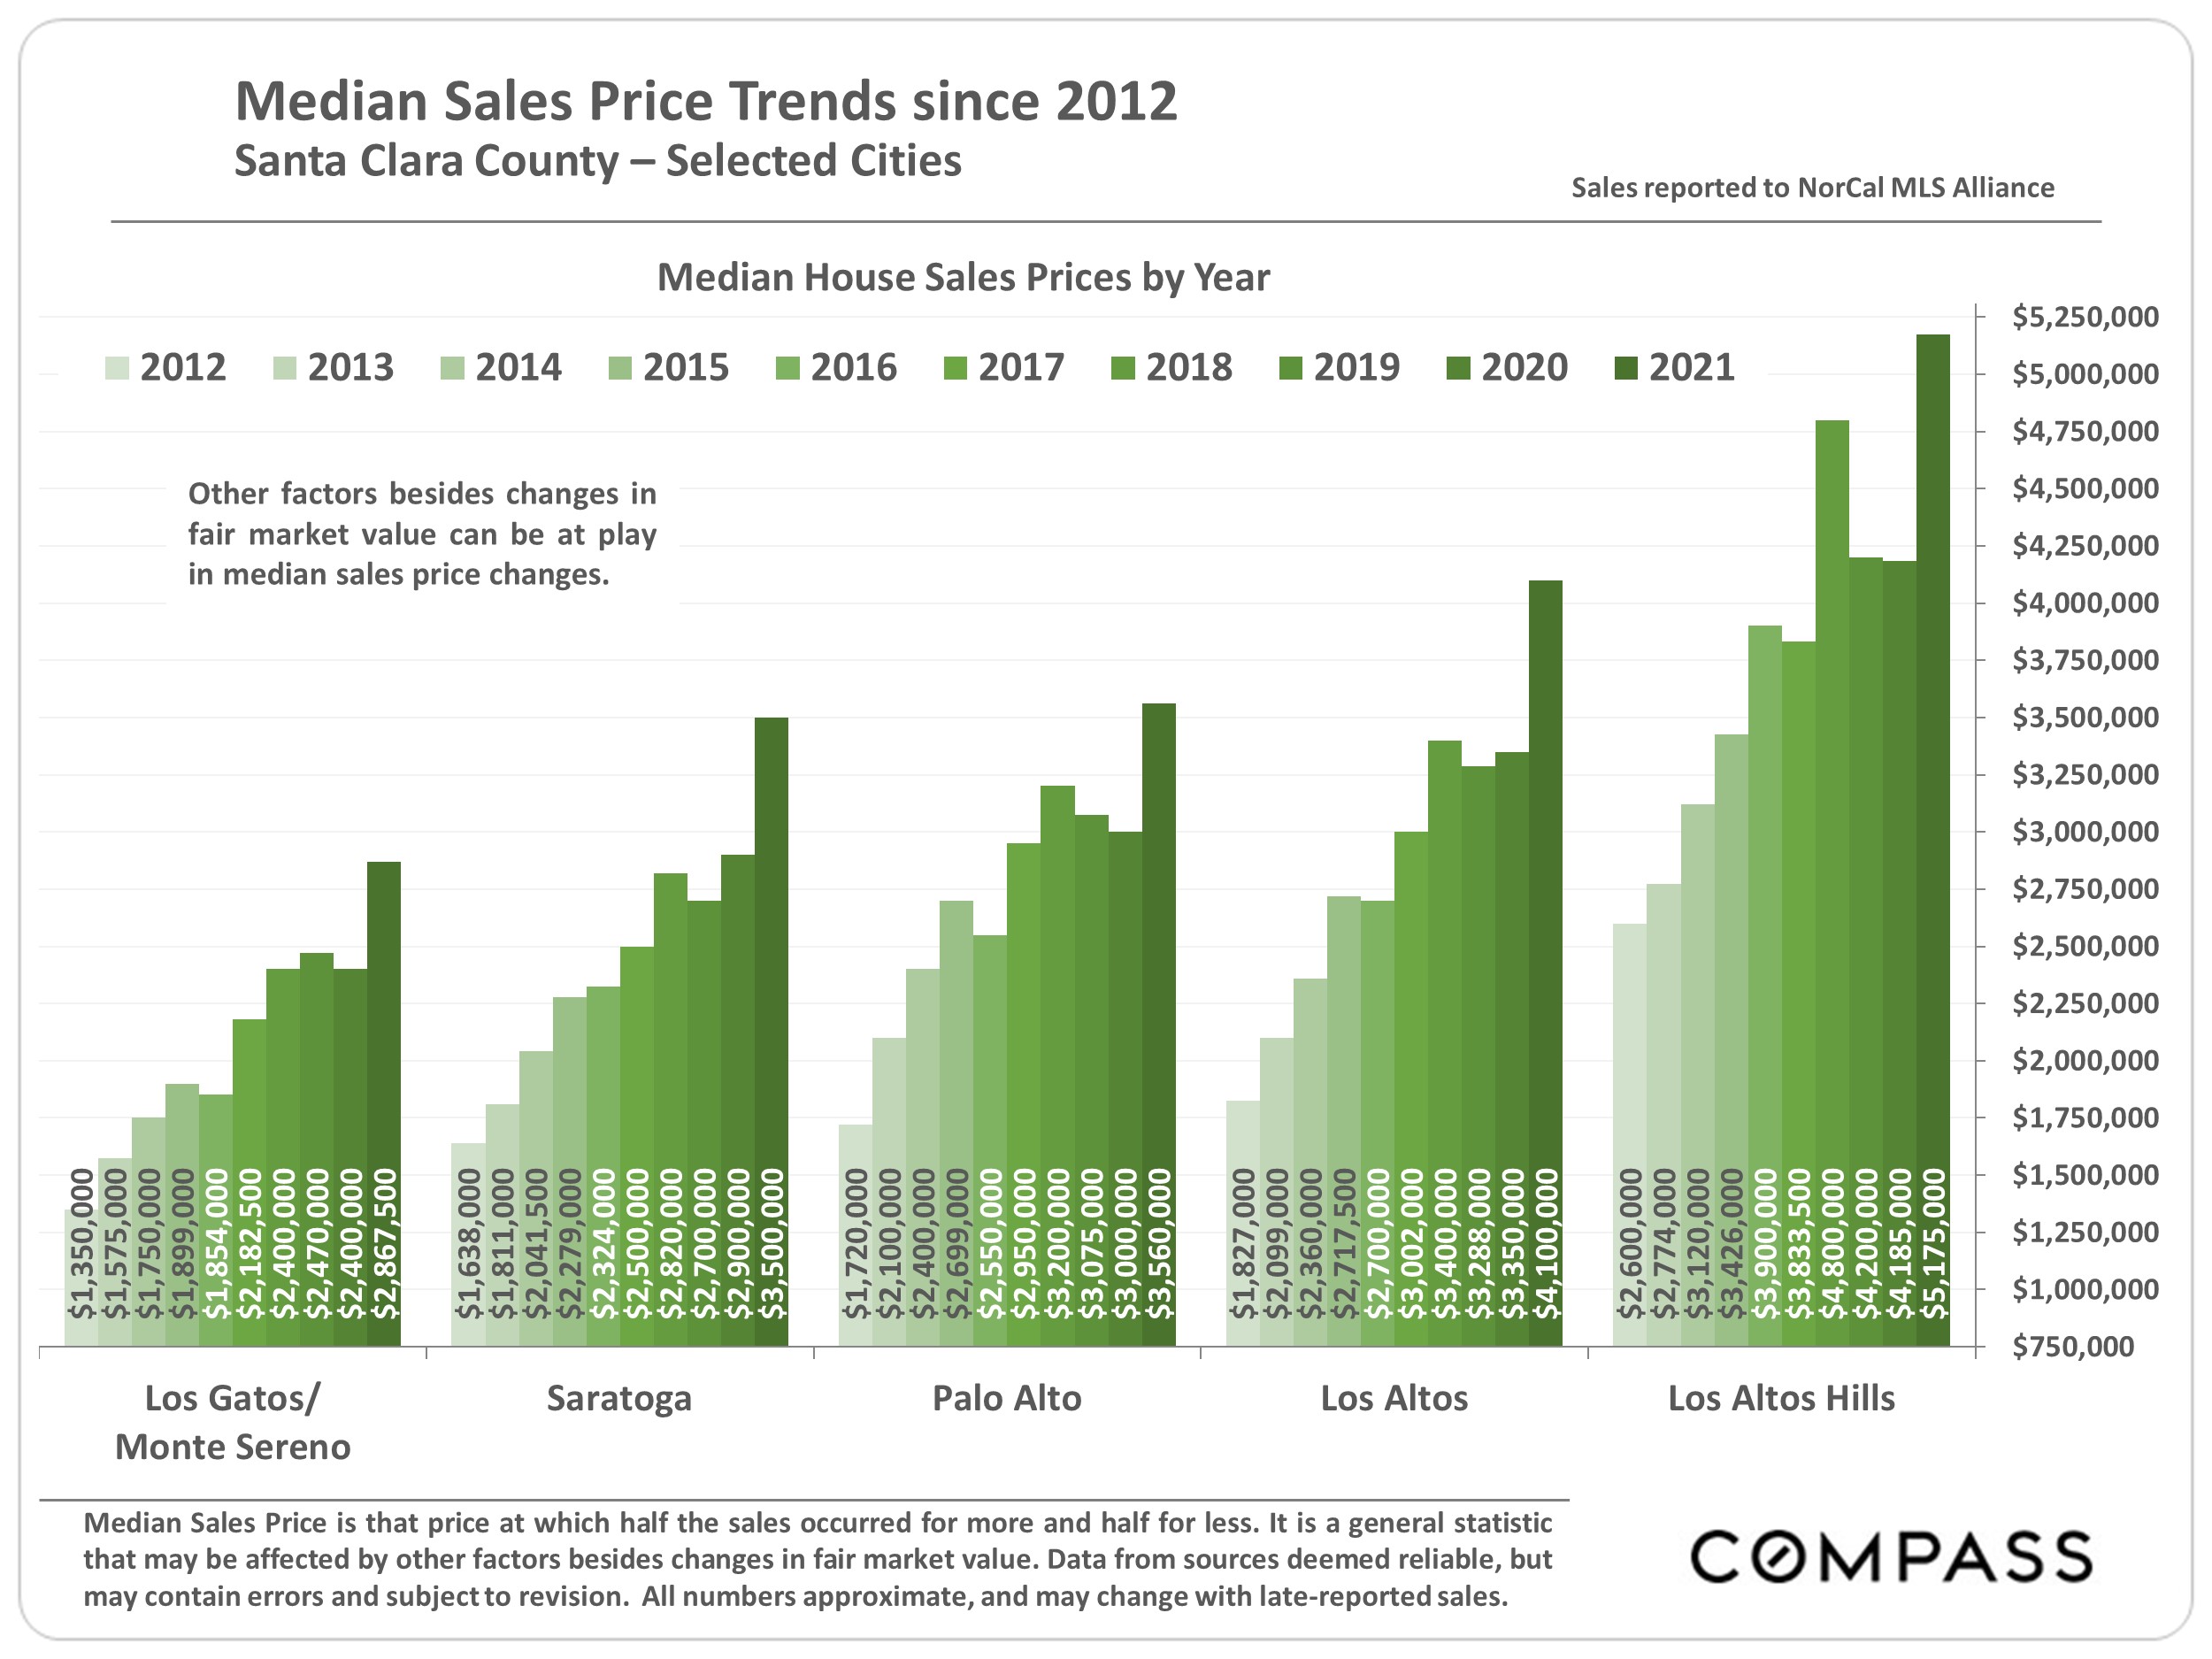
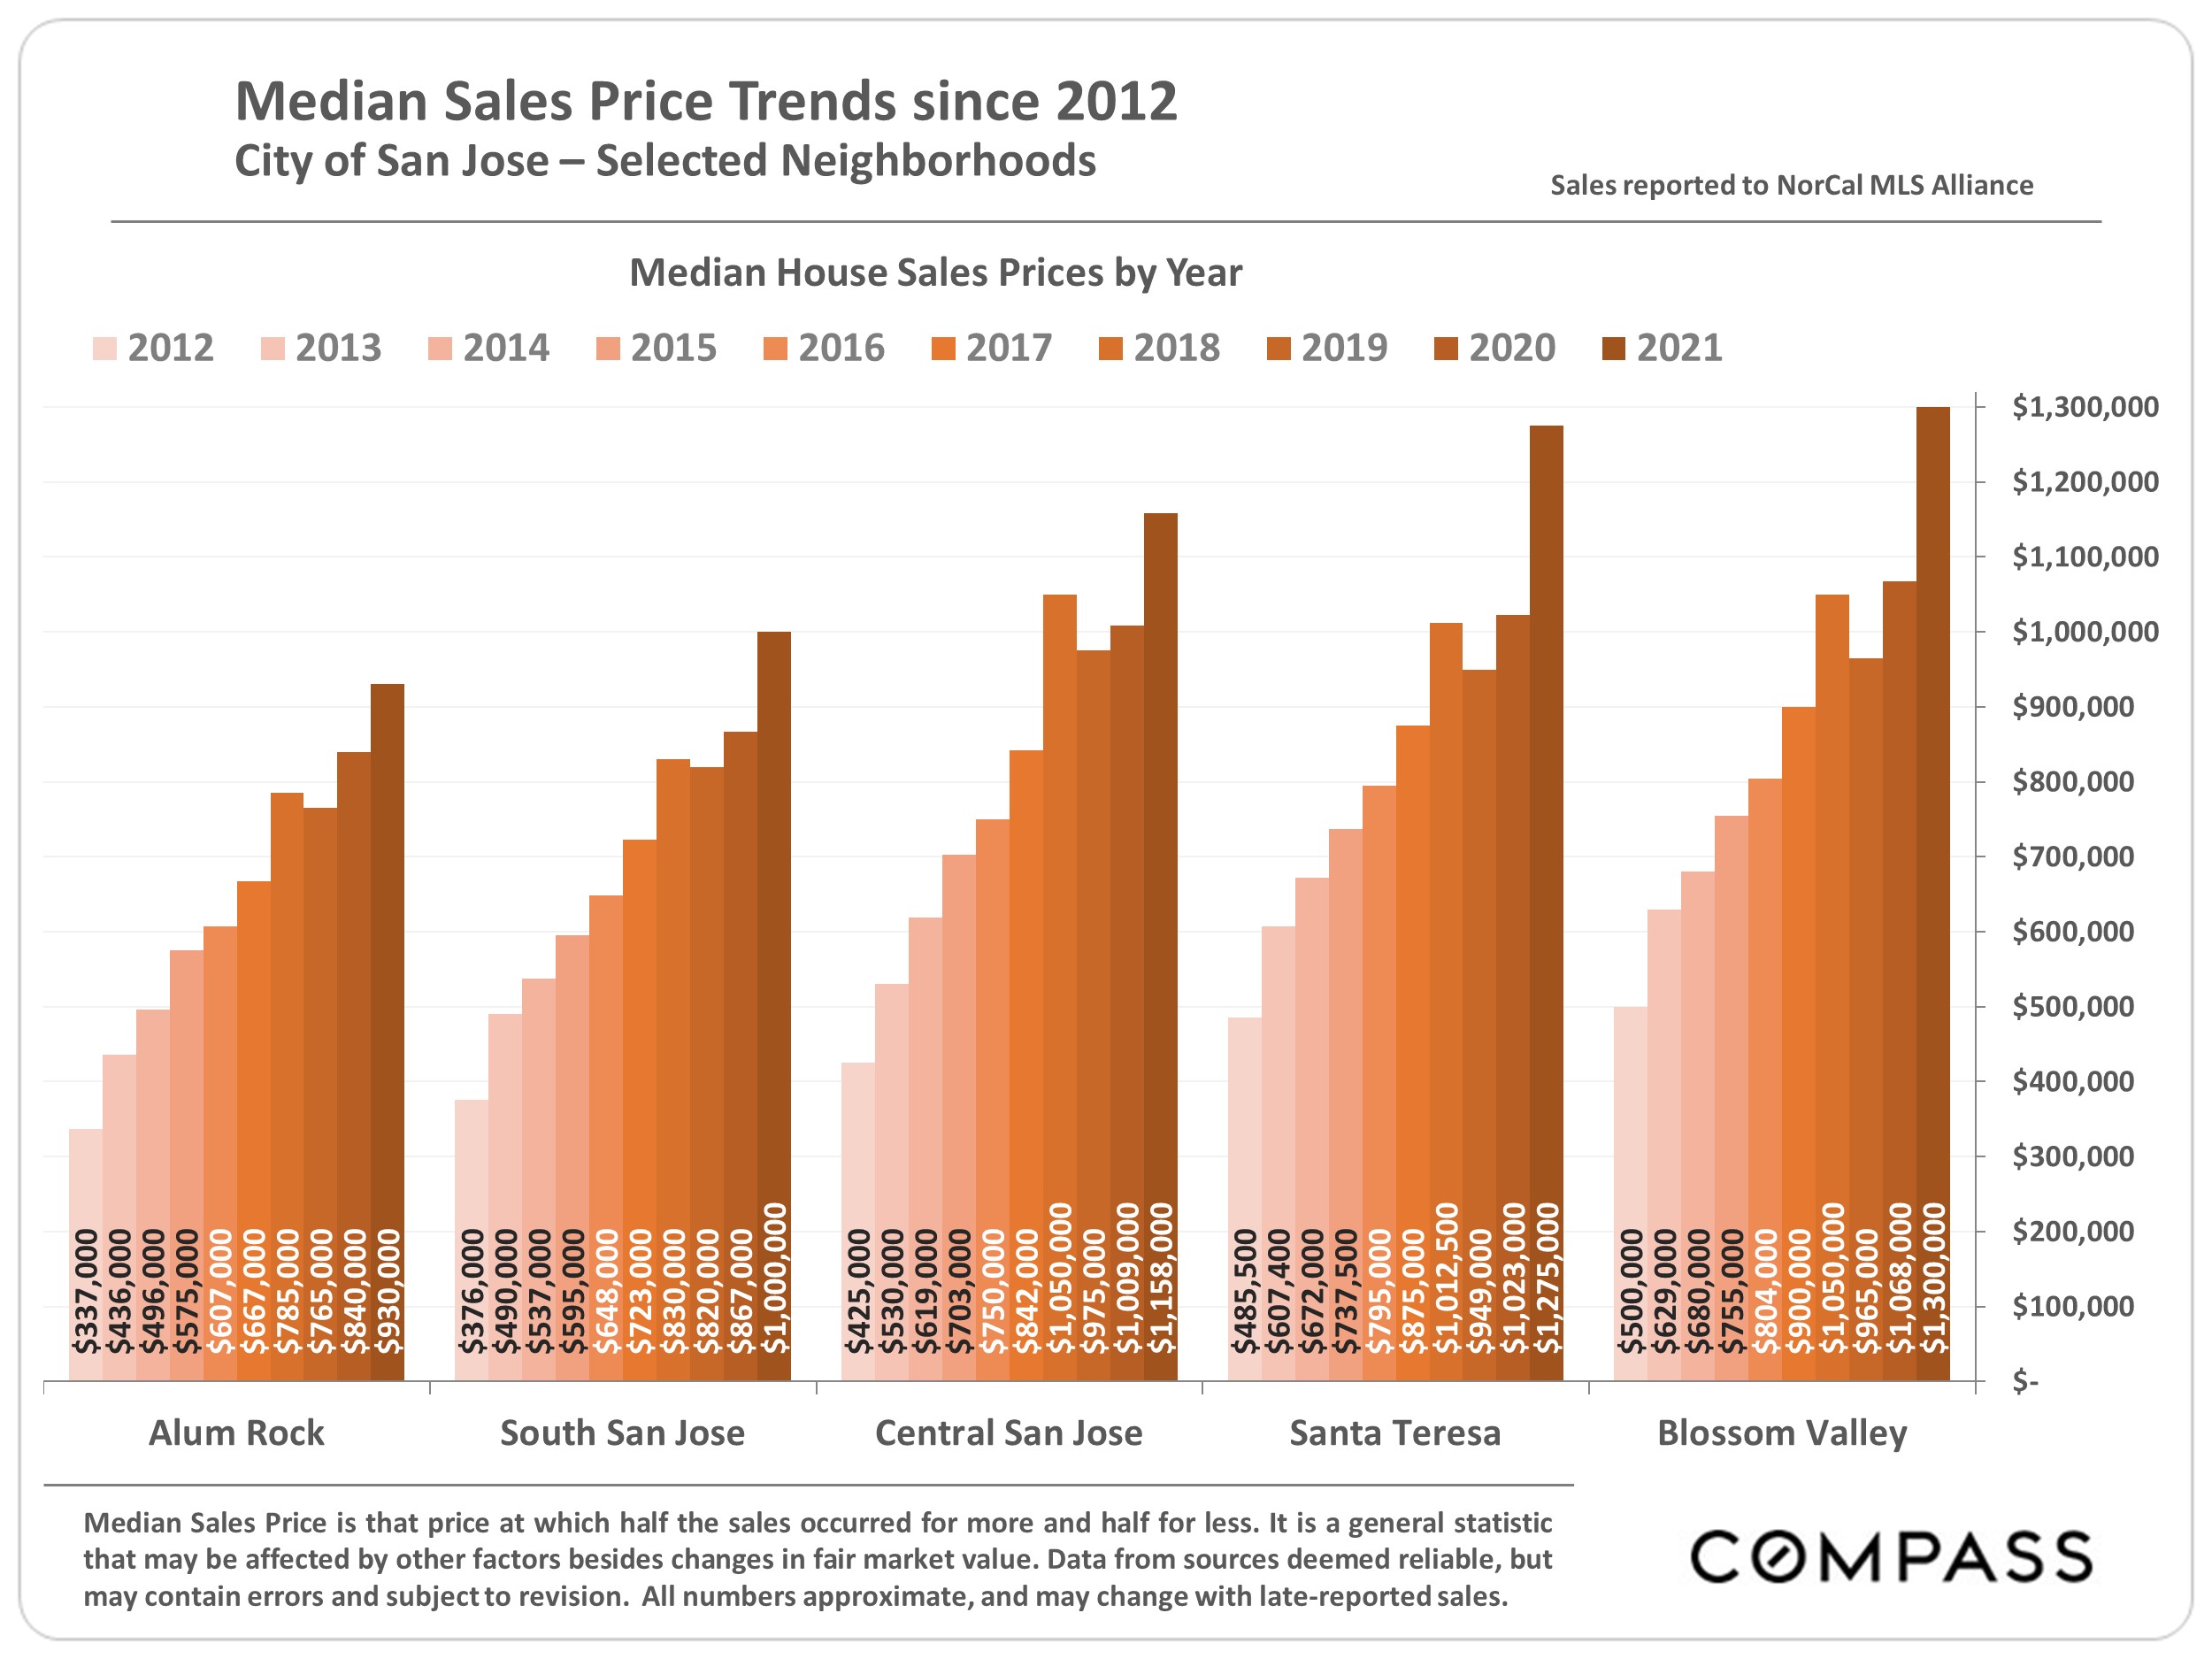
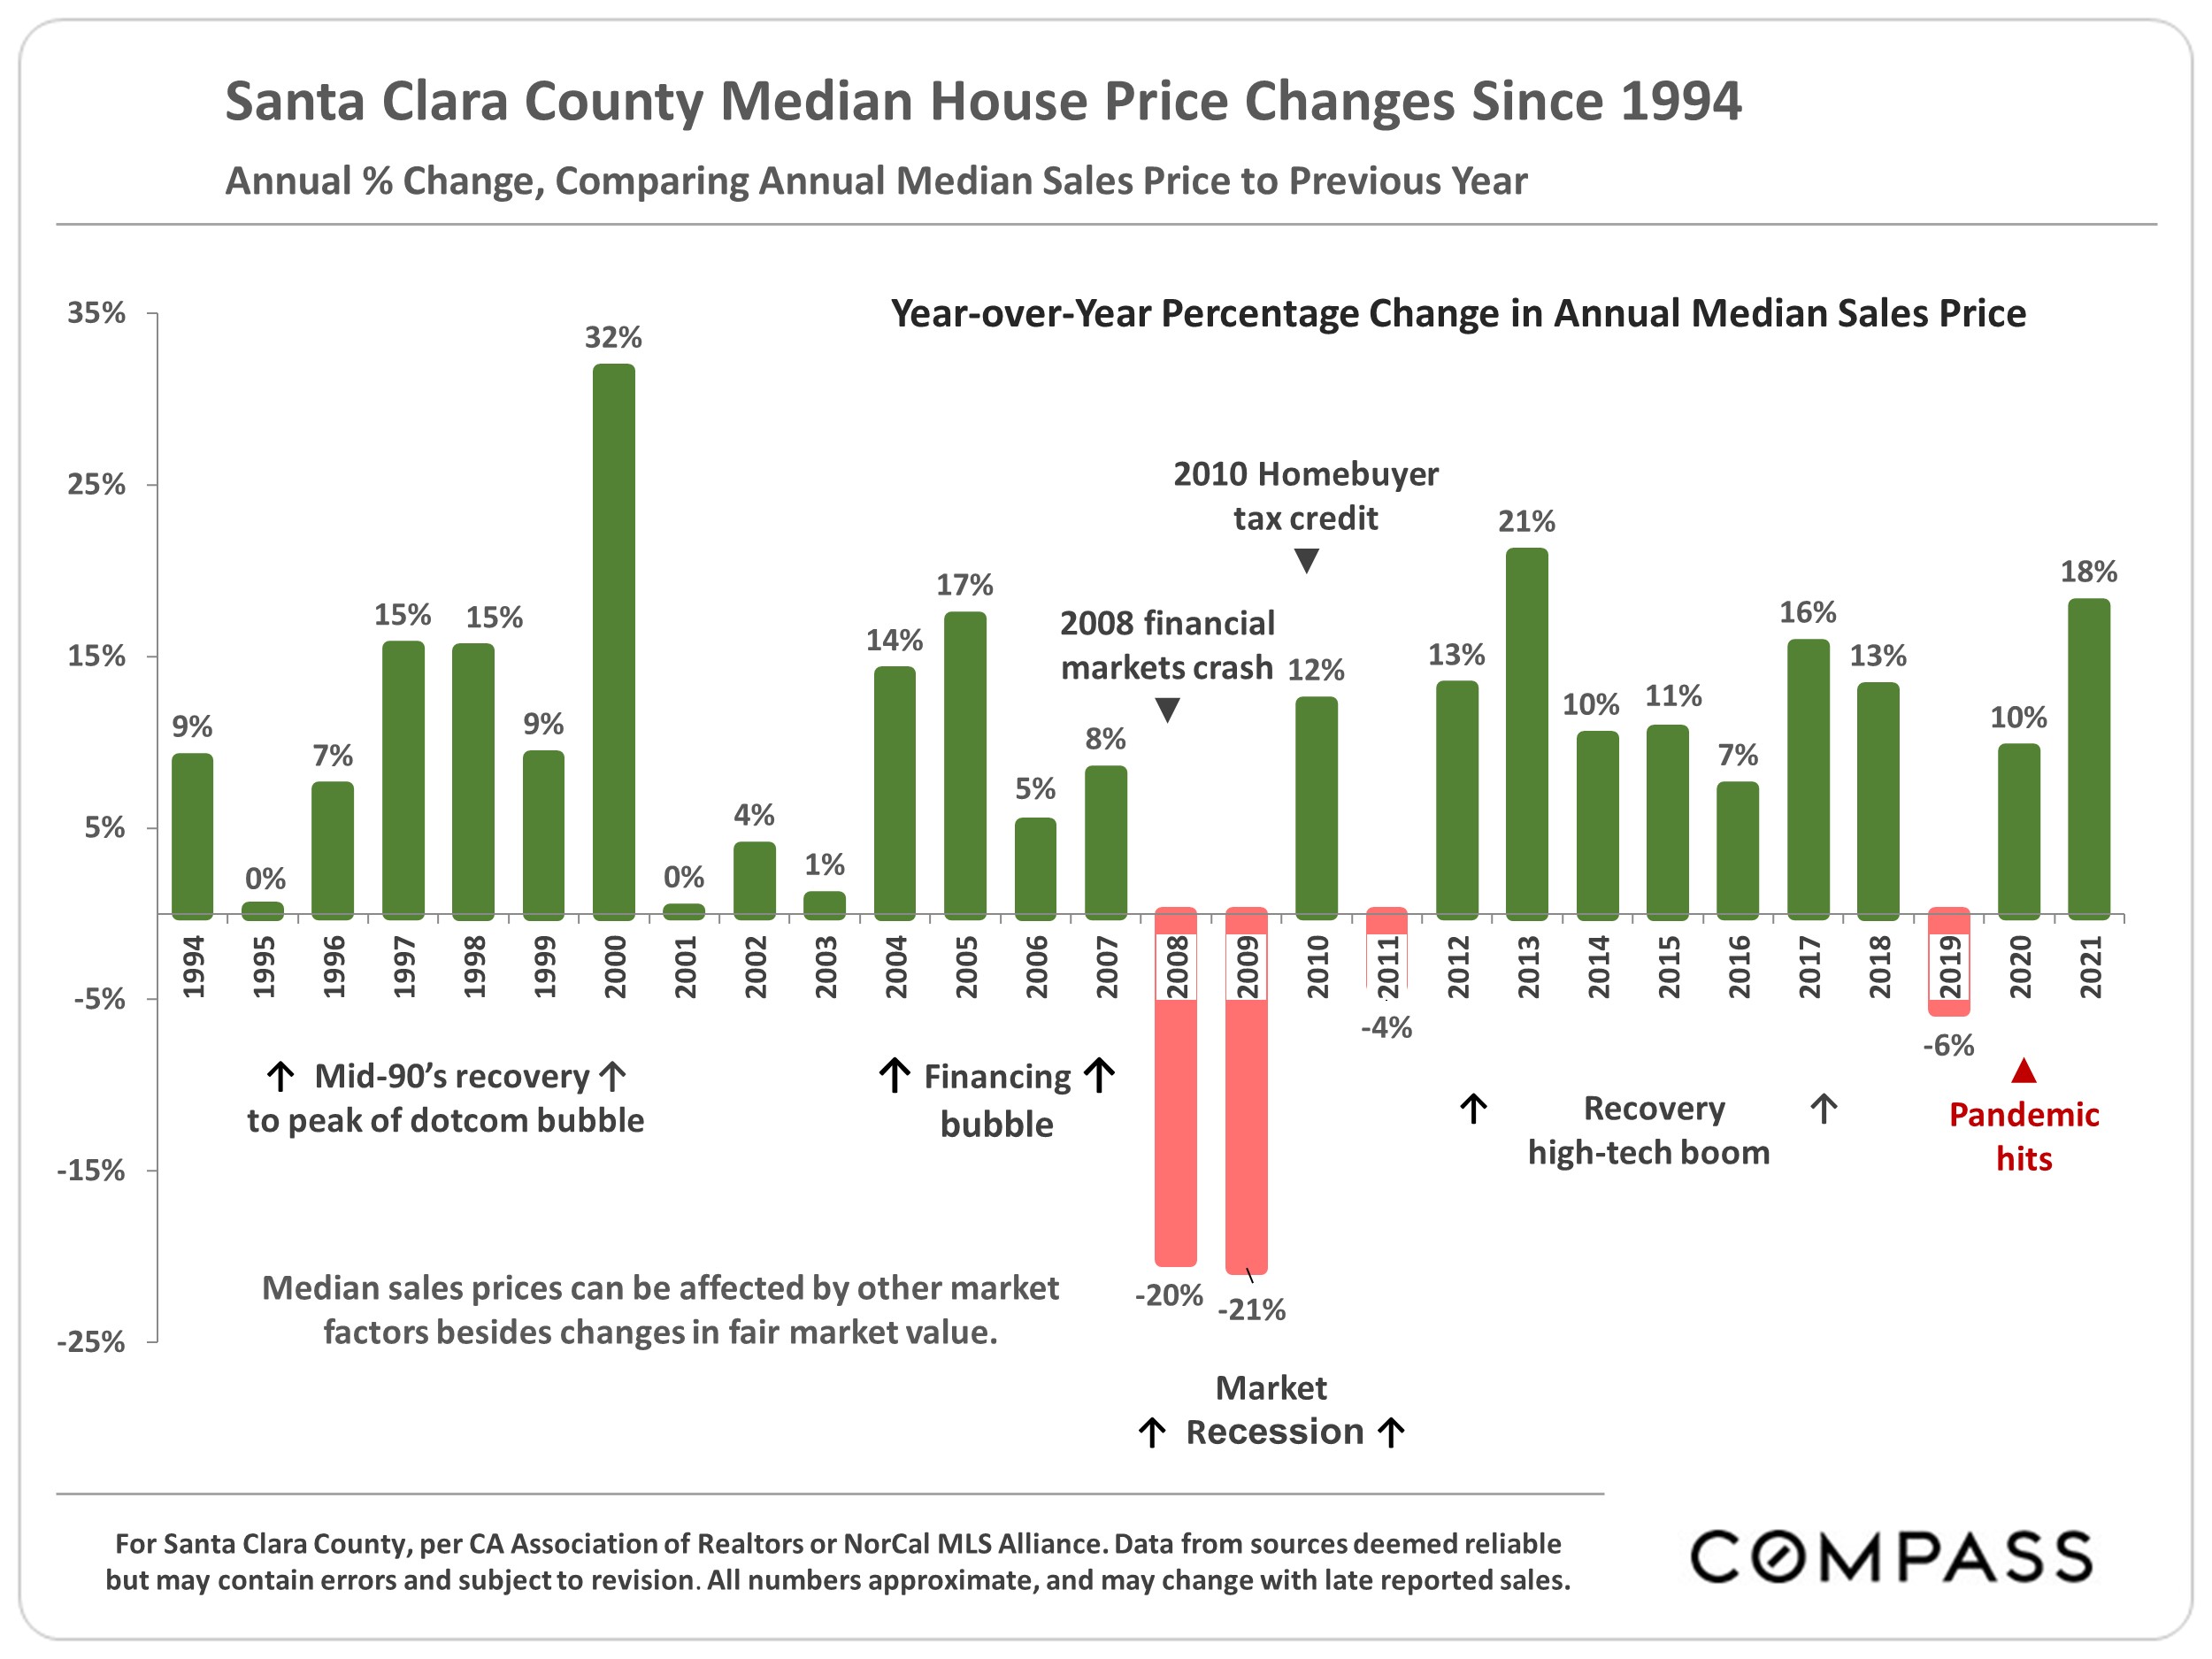
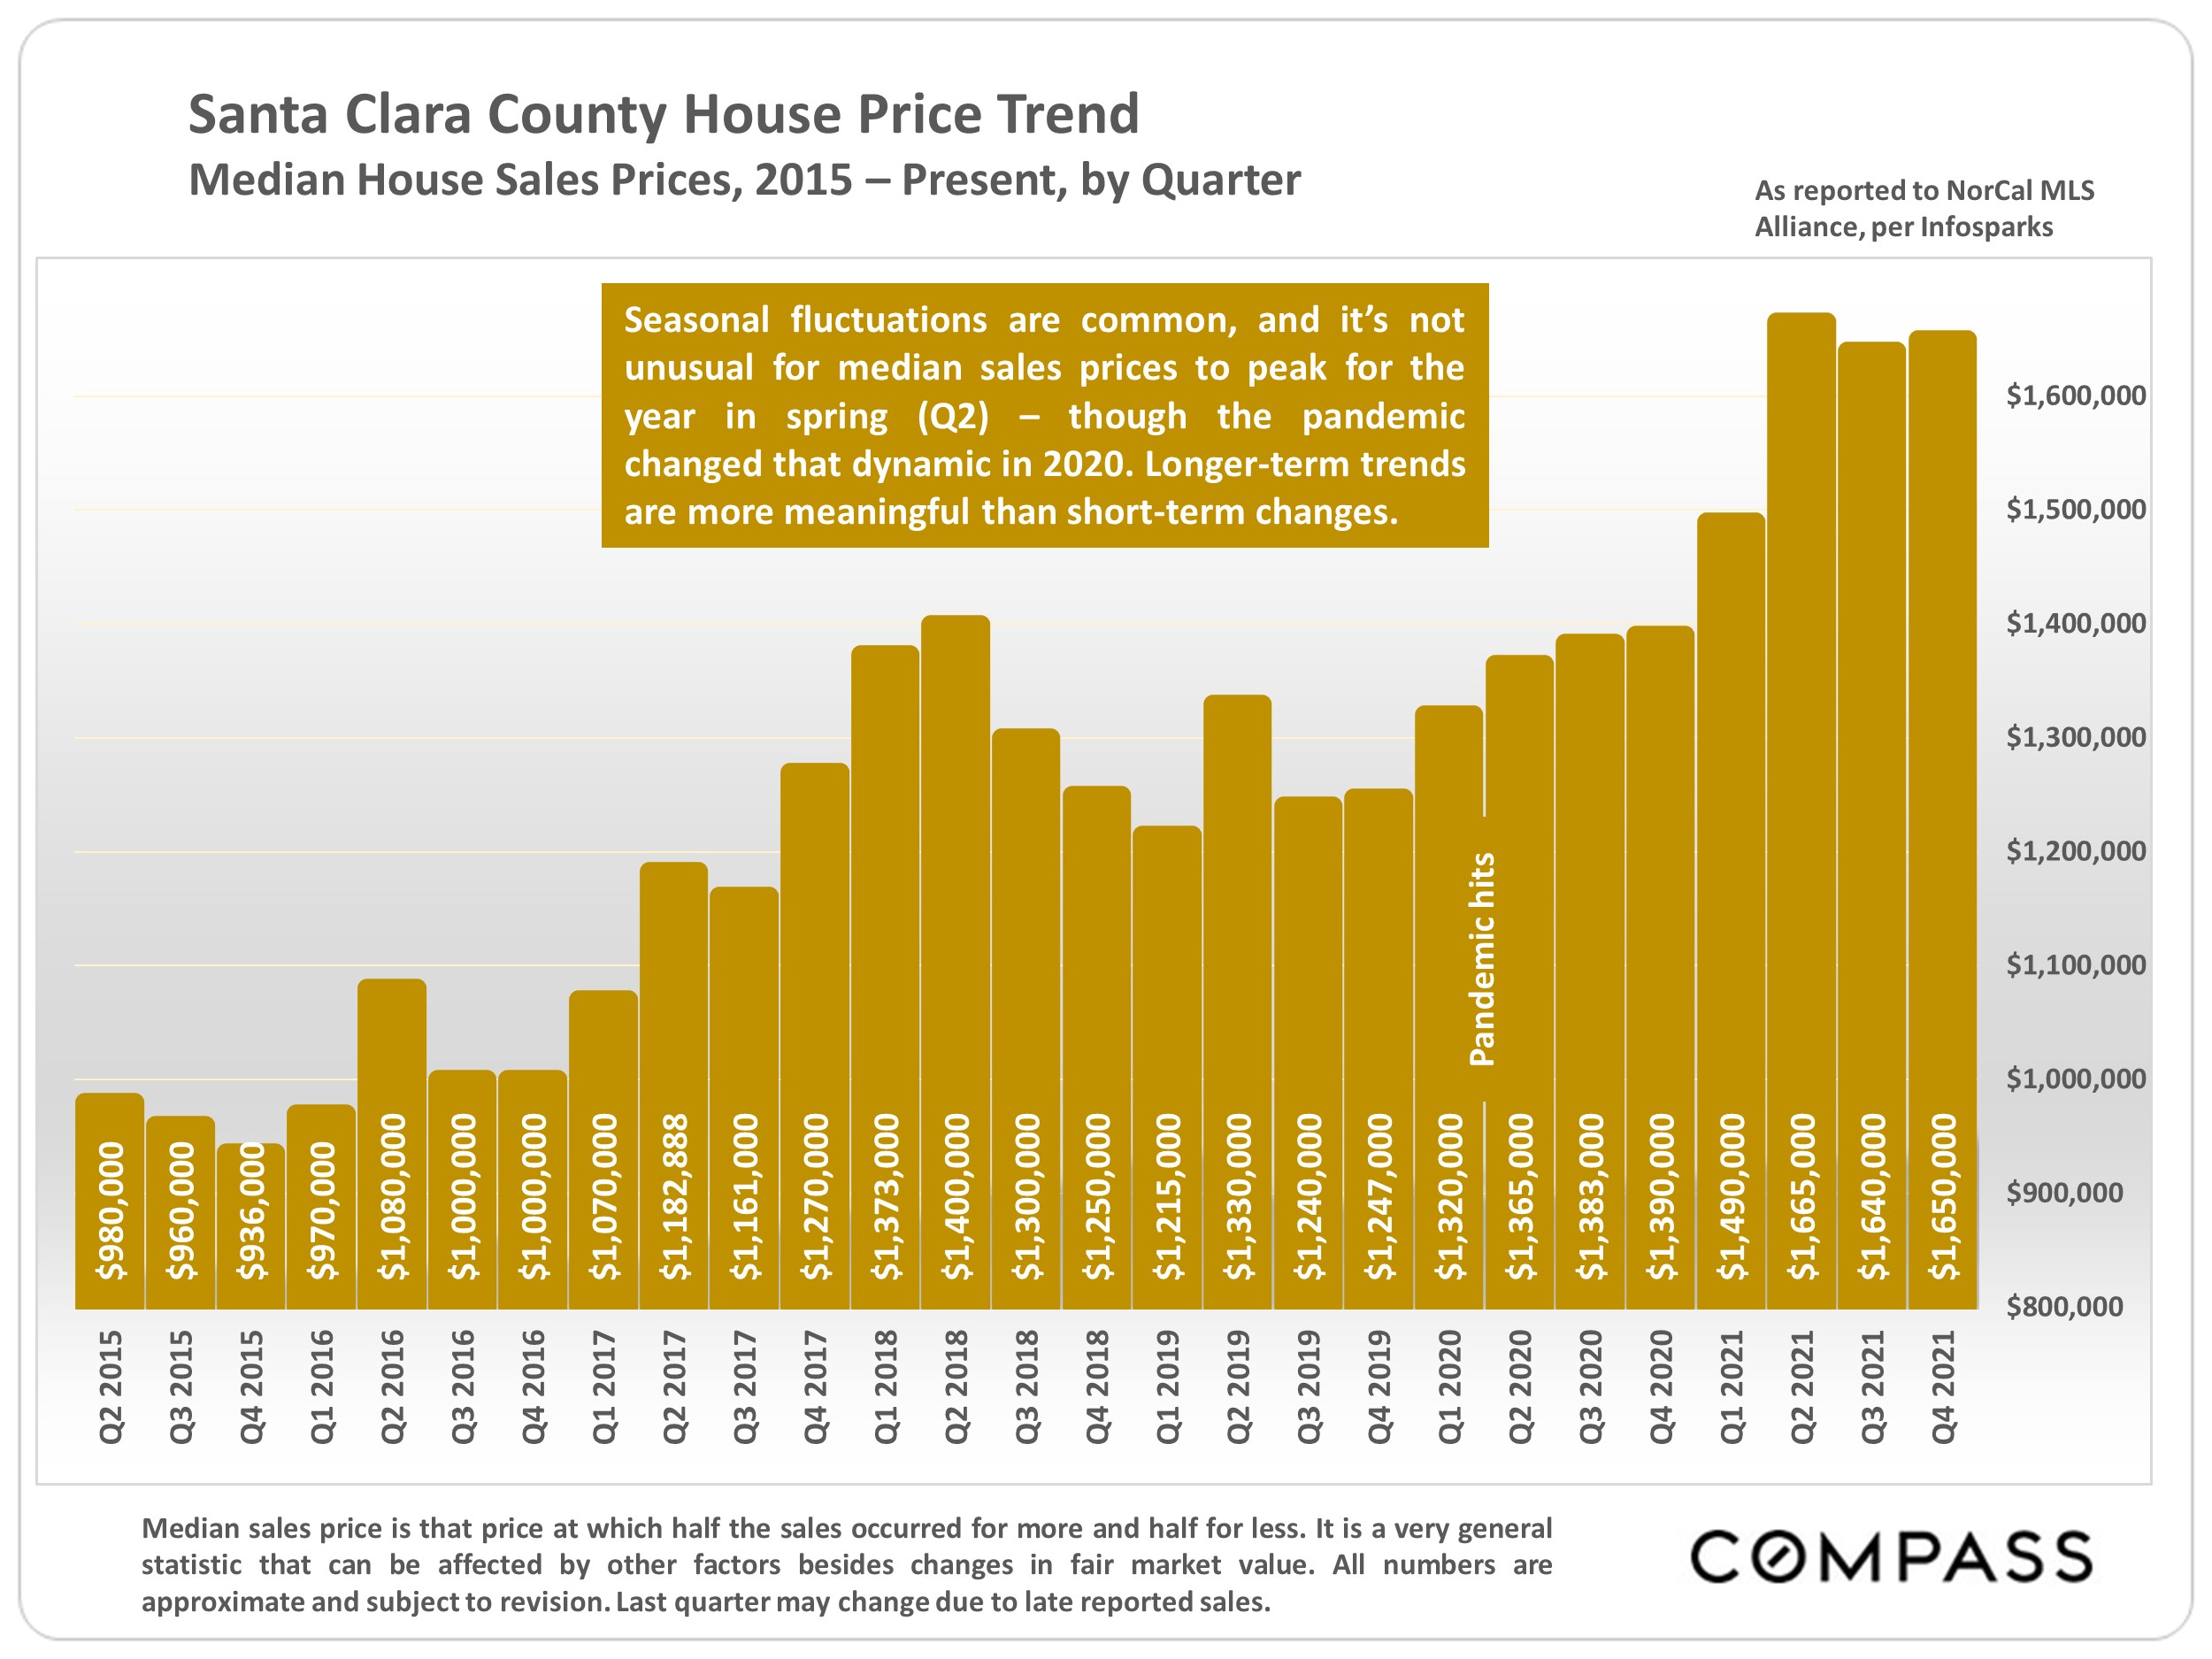
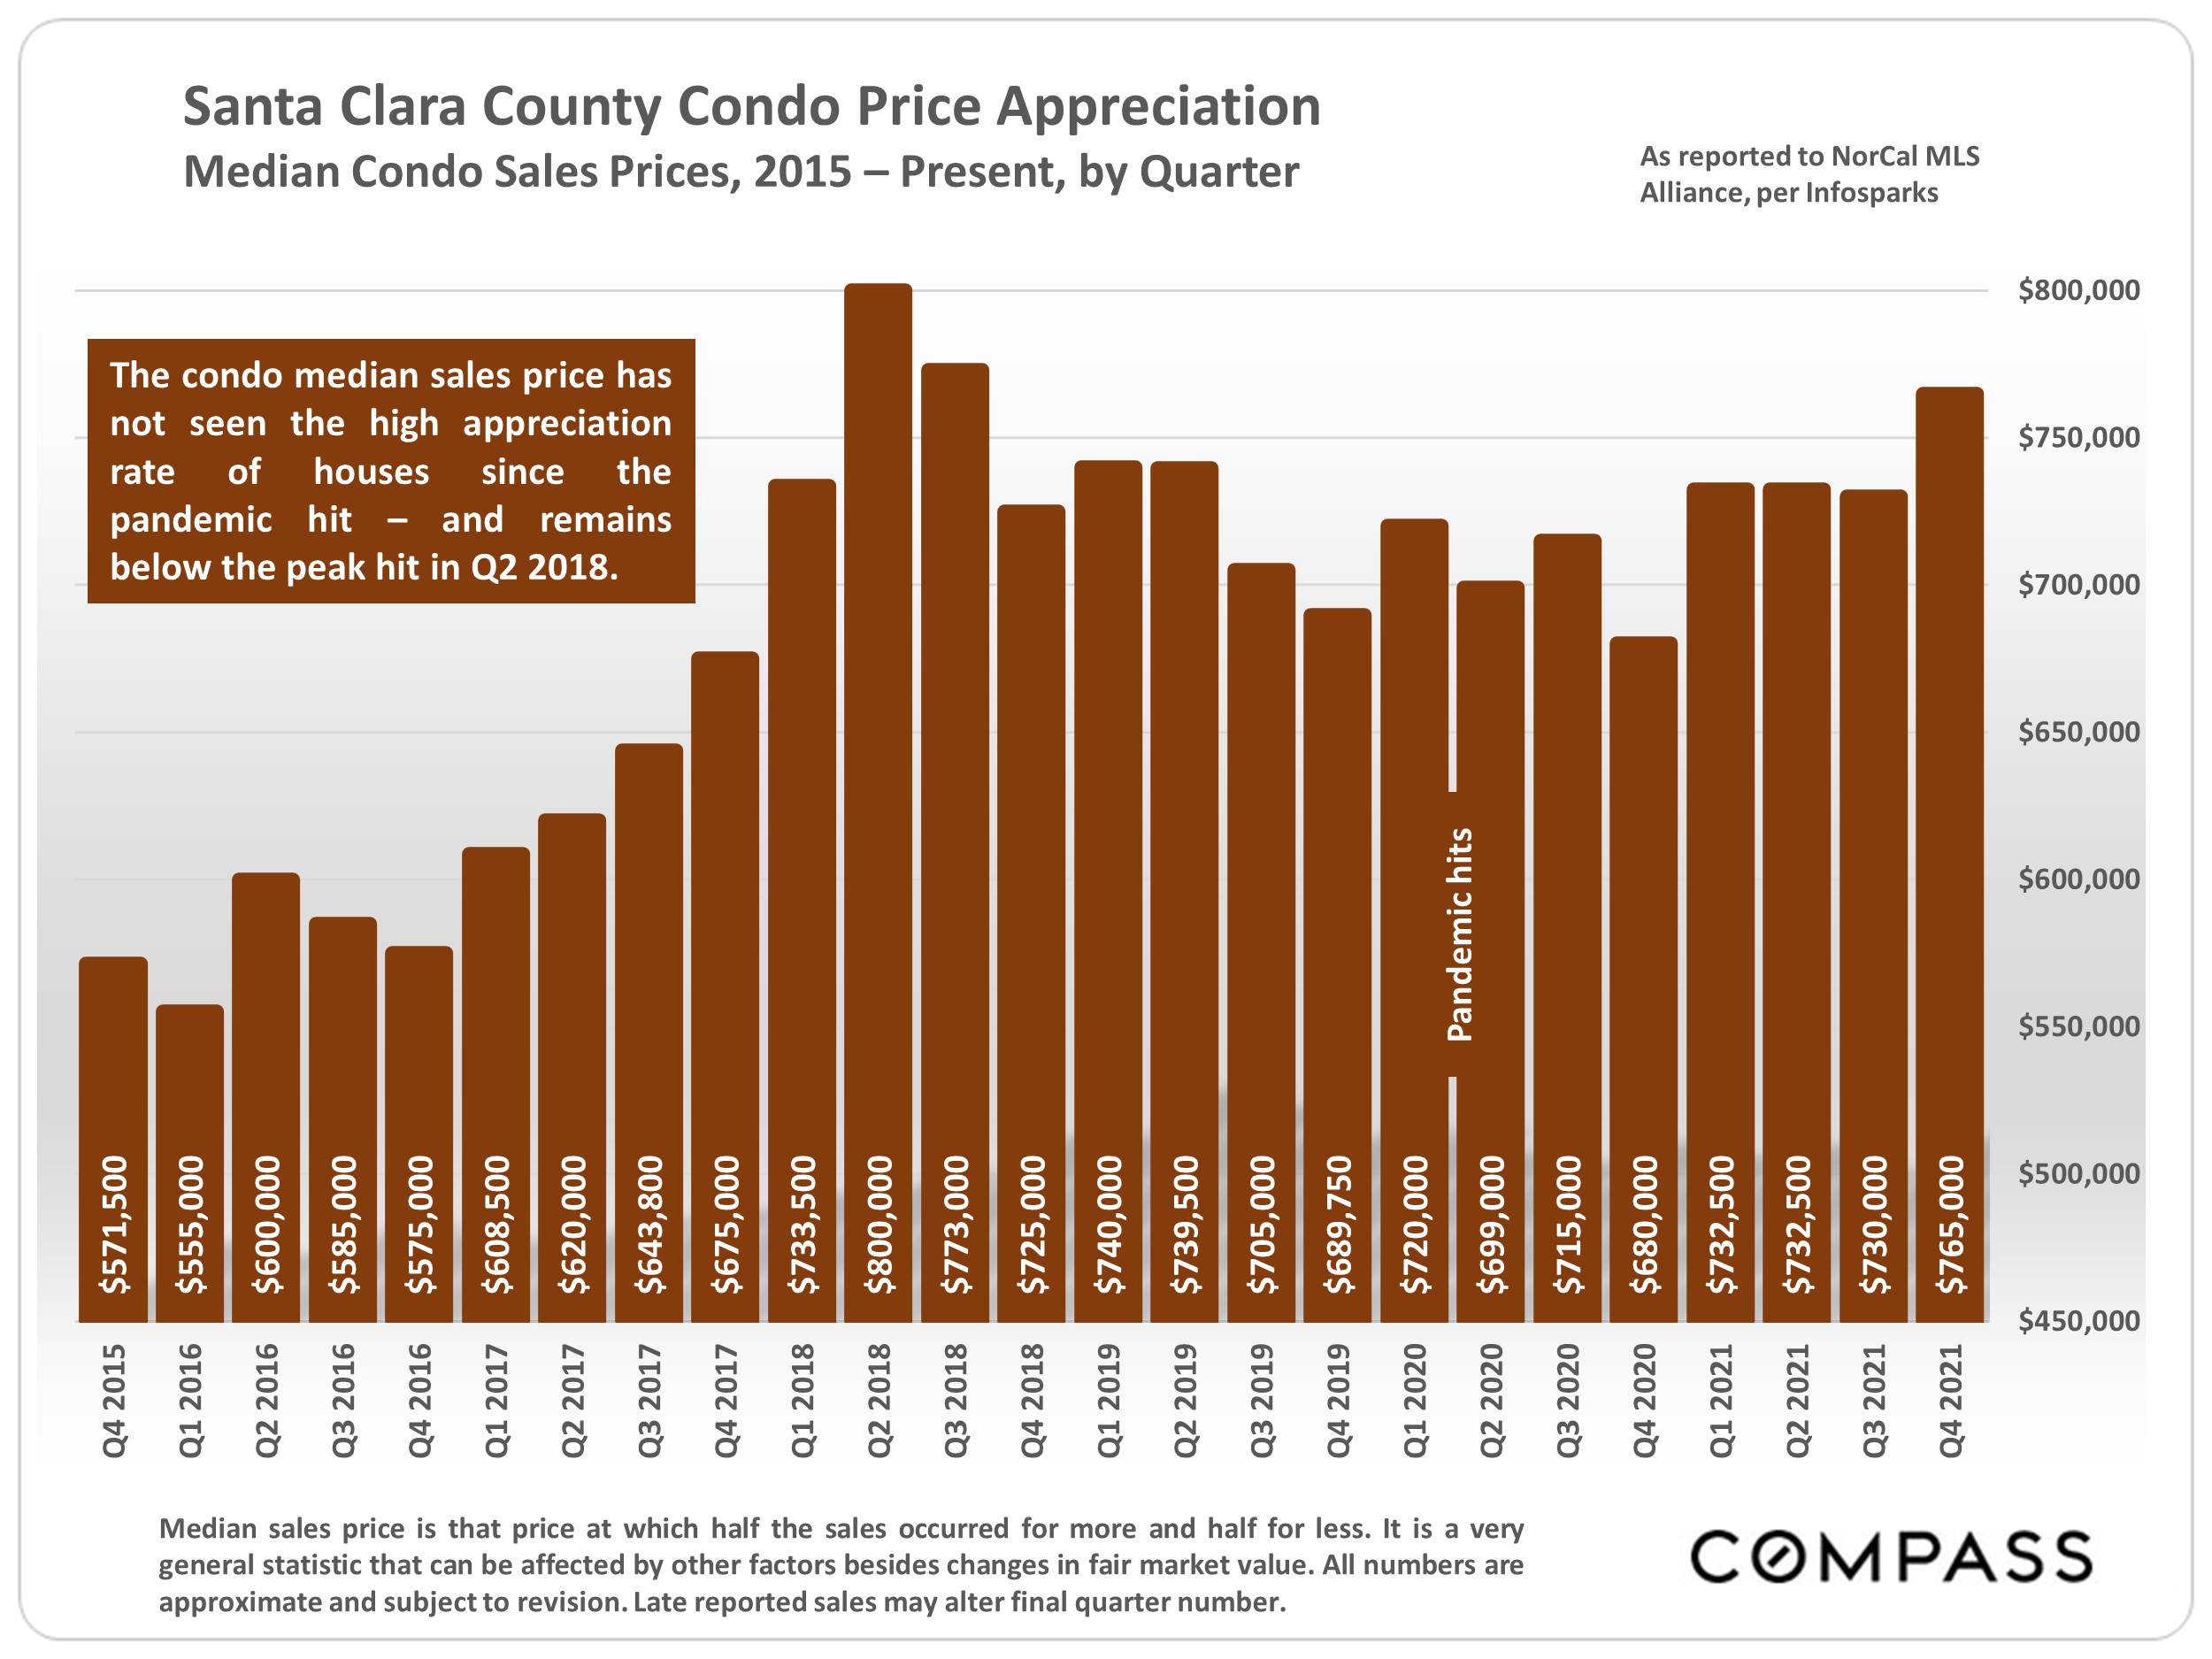
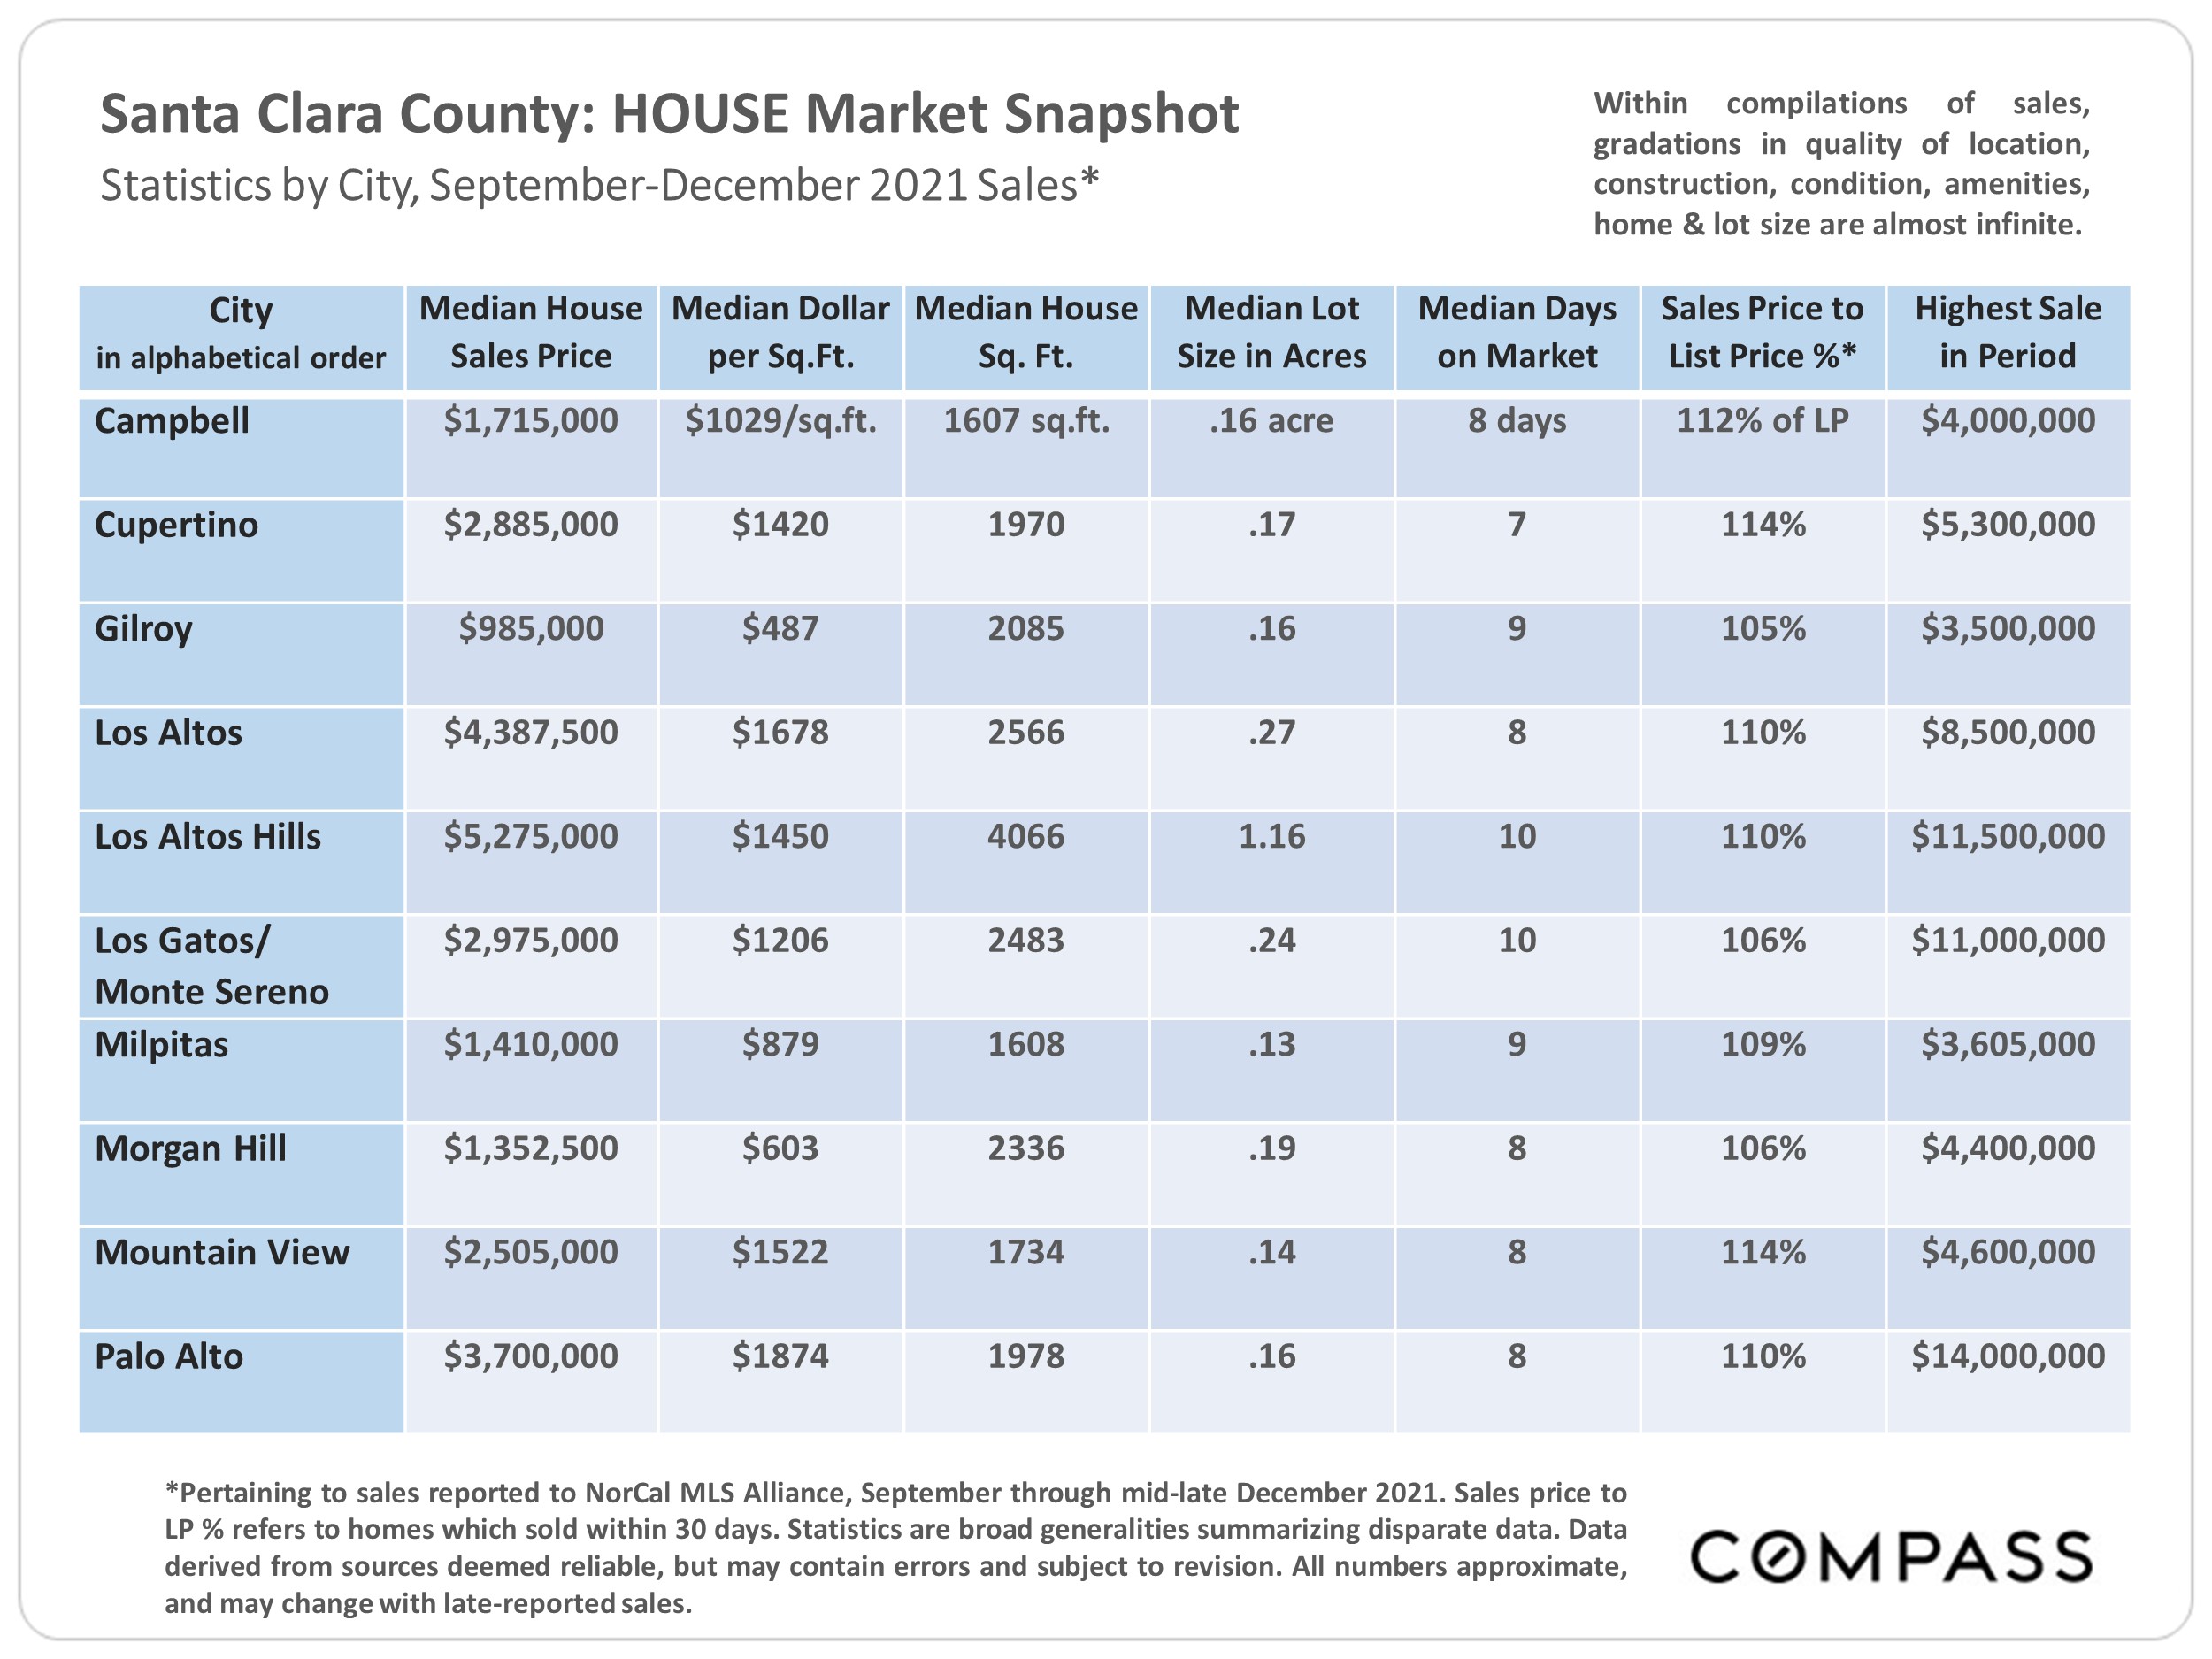
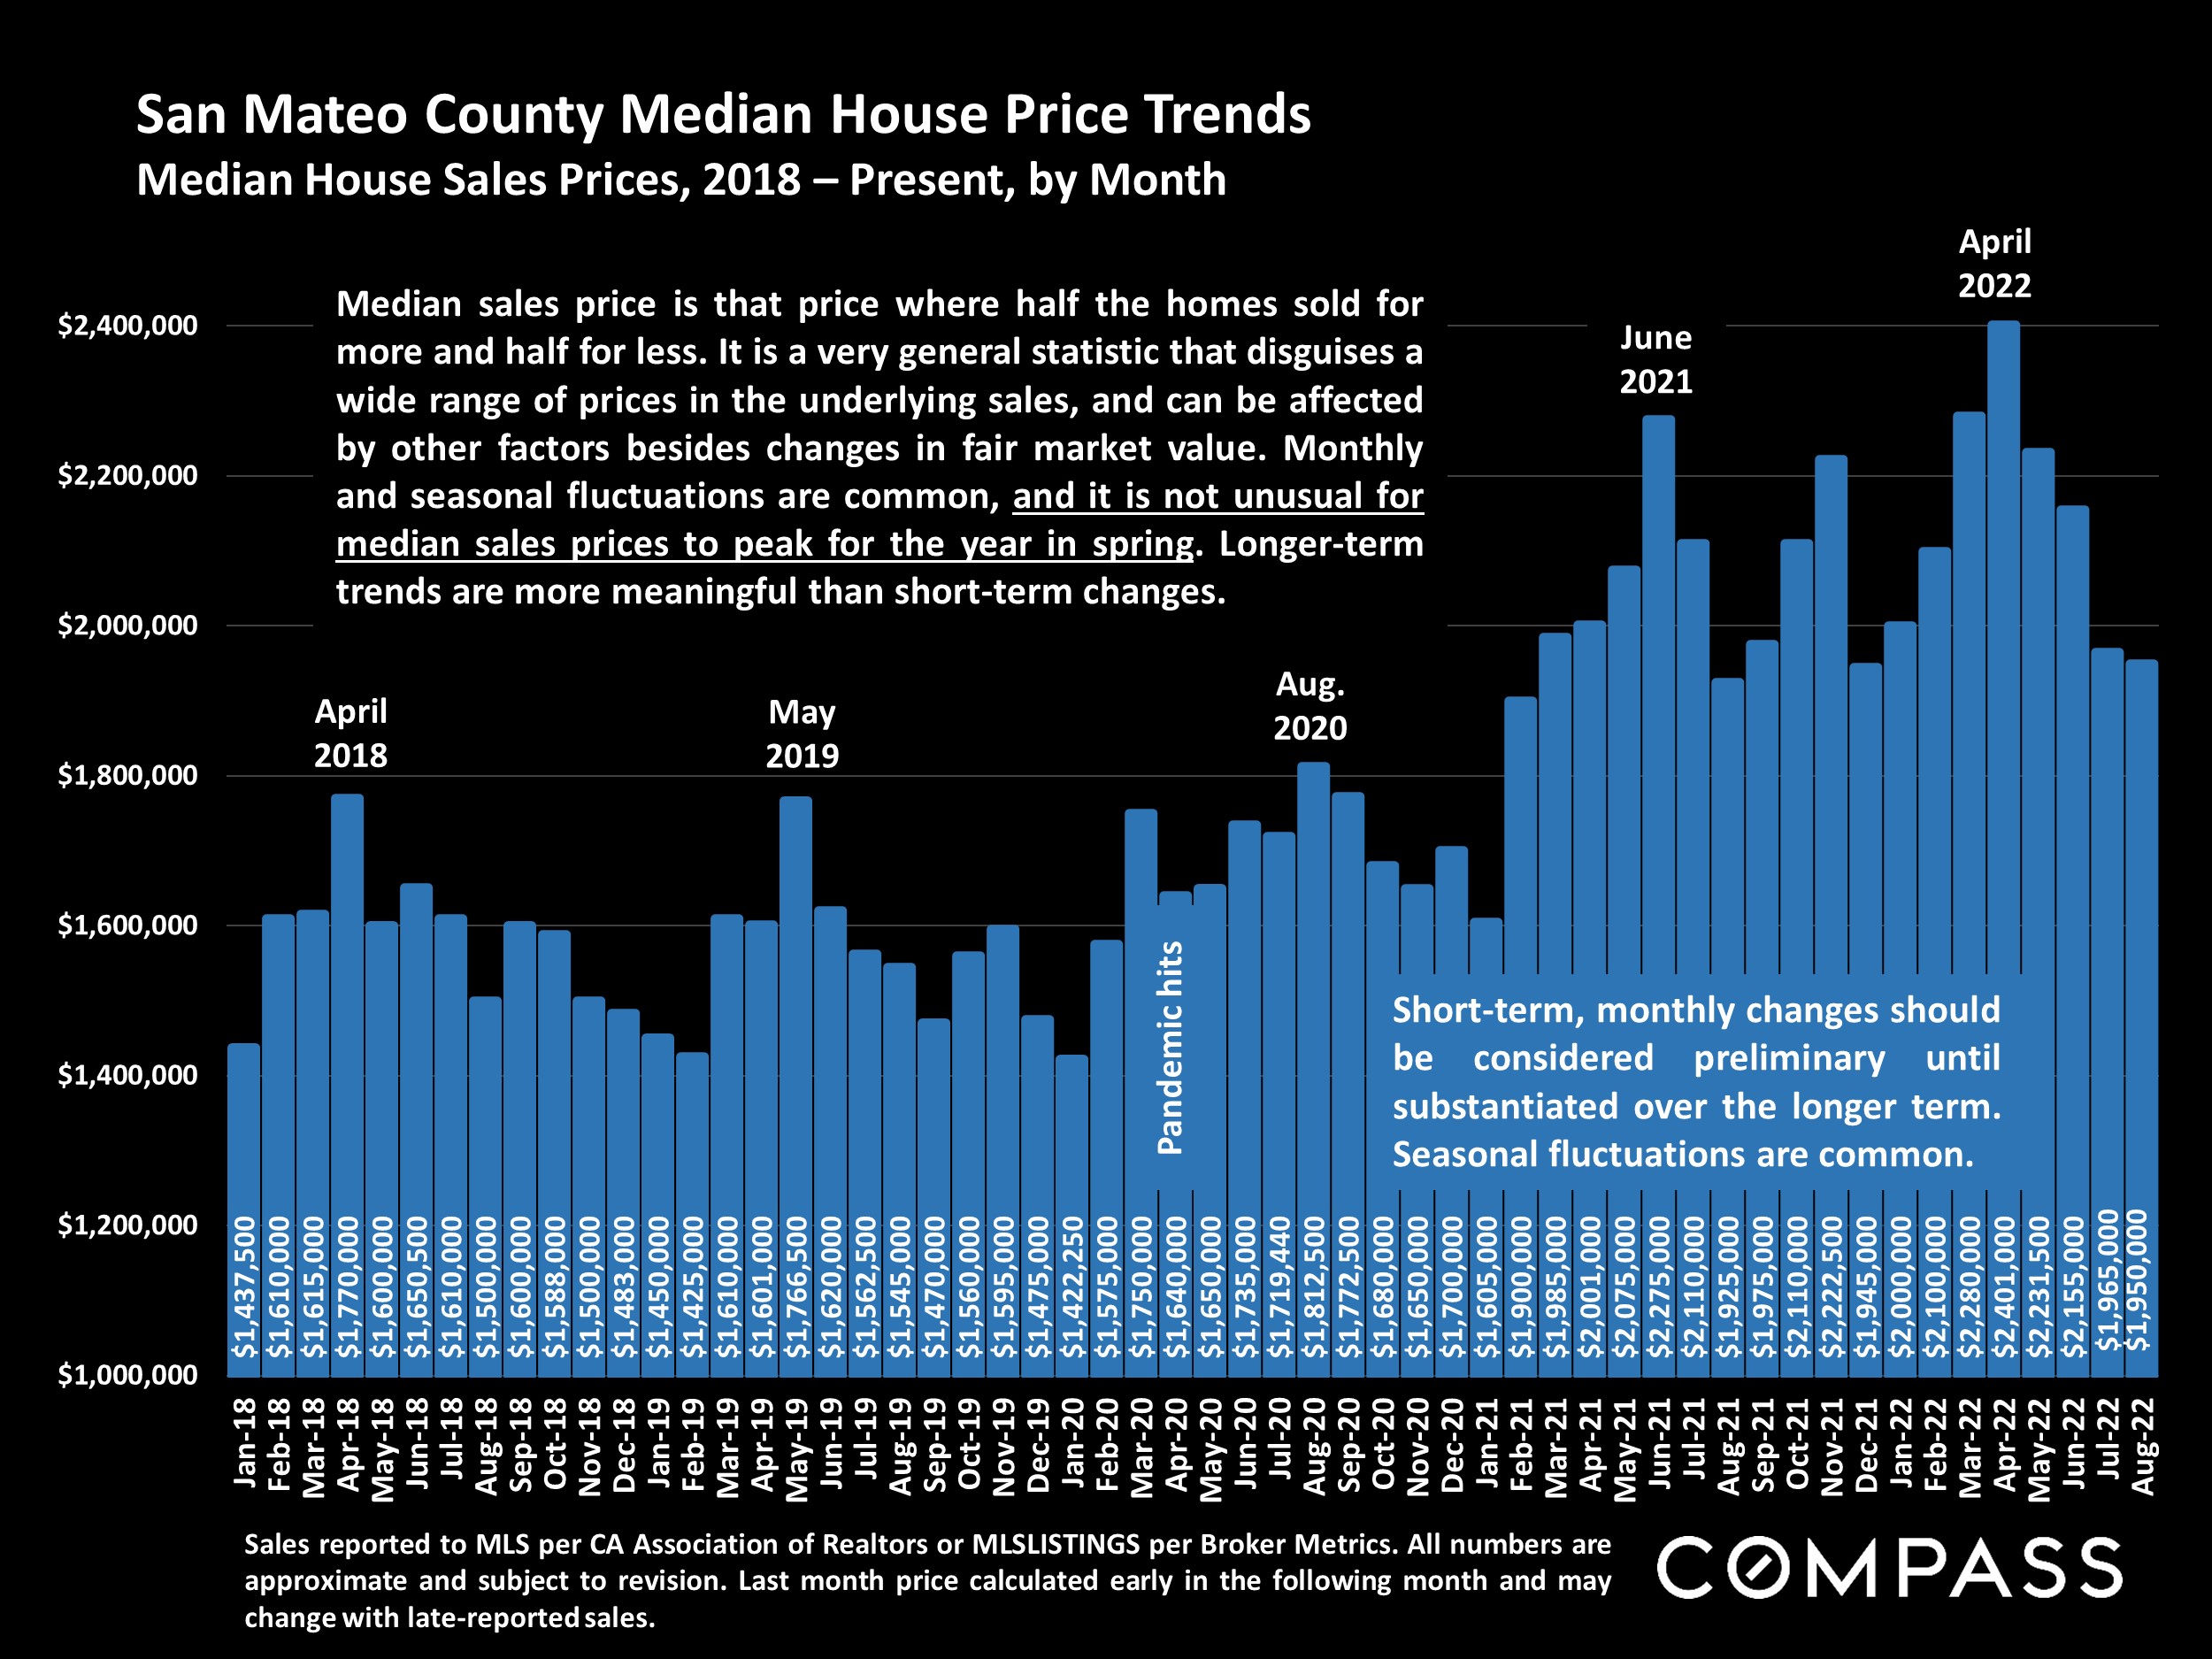
Median Sales Price is that price at which half the properties sold for more and half for less. It may be affected by seasonality, “unusual” events, or changes in inventory and buying trends, as well as by changes in fair market value. The median sales price for an area will often conceal an enormous variety of sales prices in the underlying individual sales.

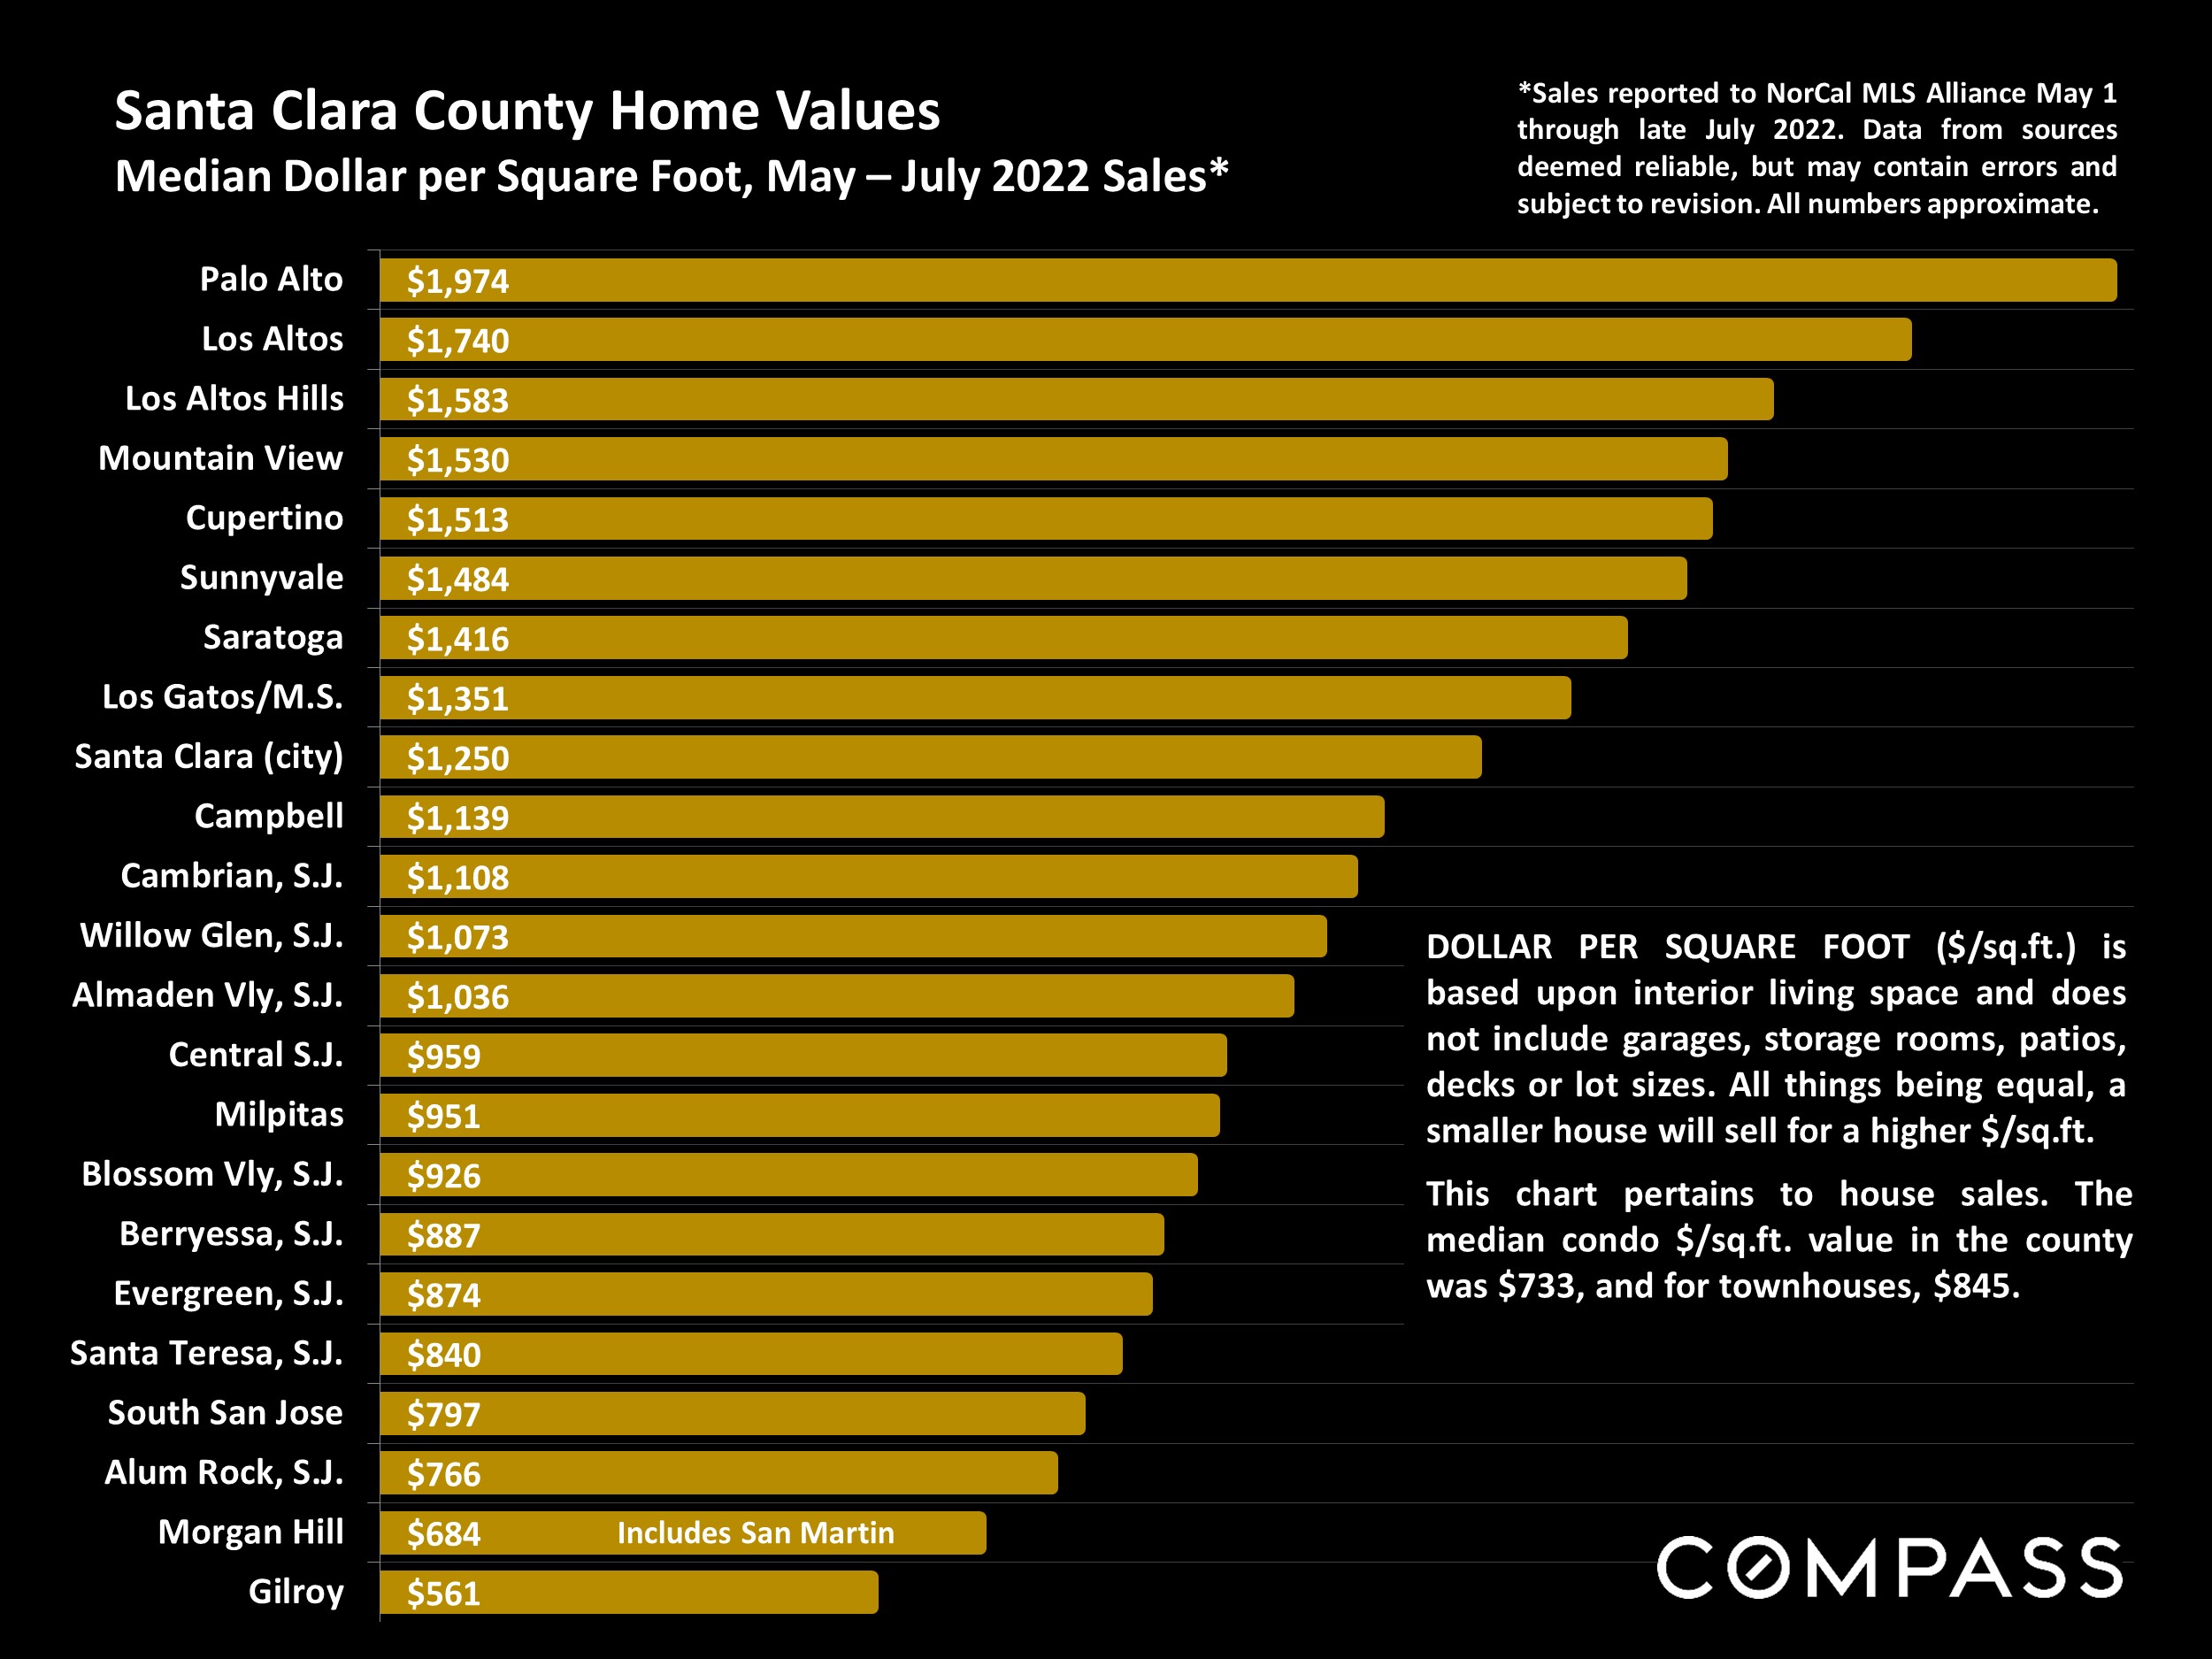
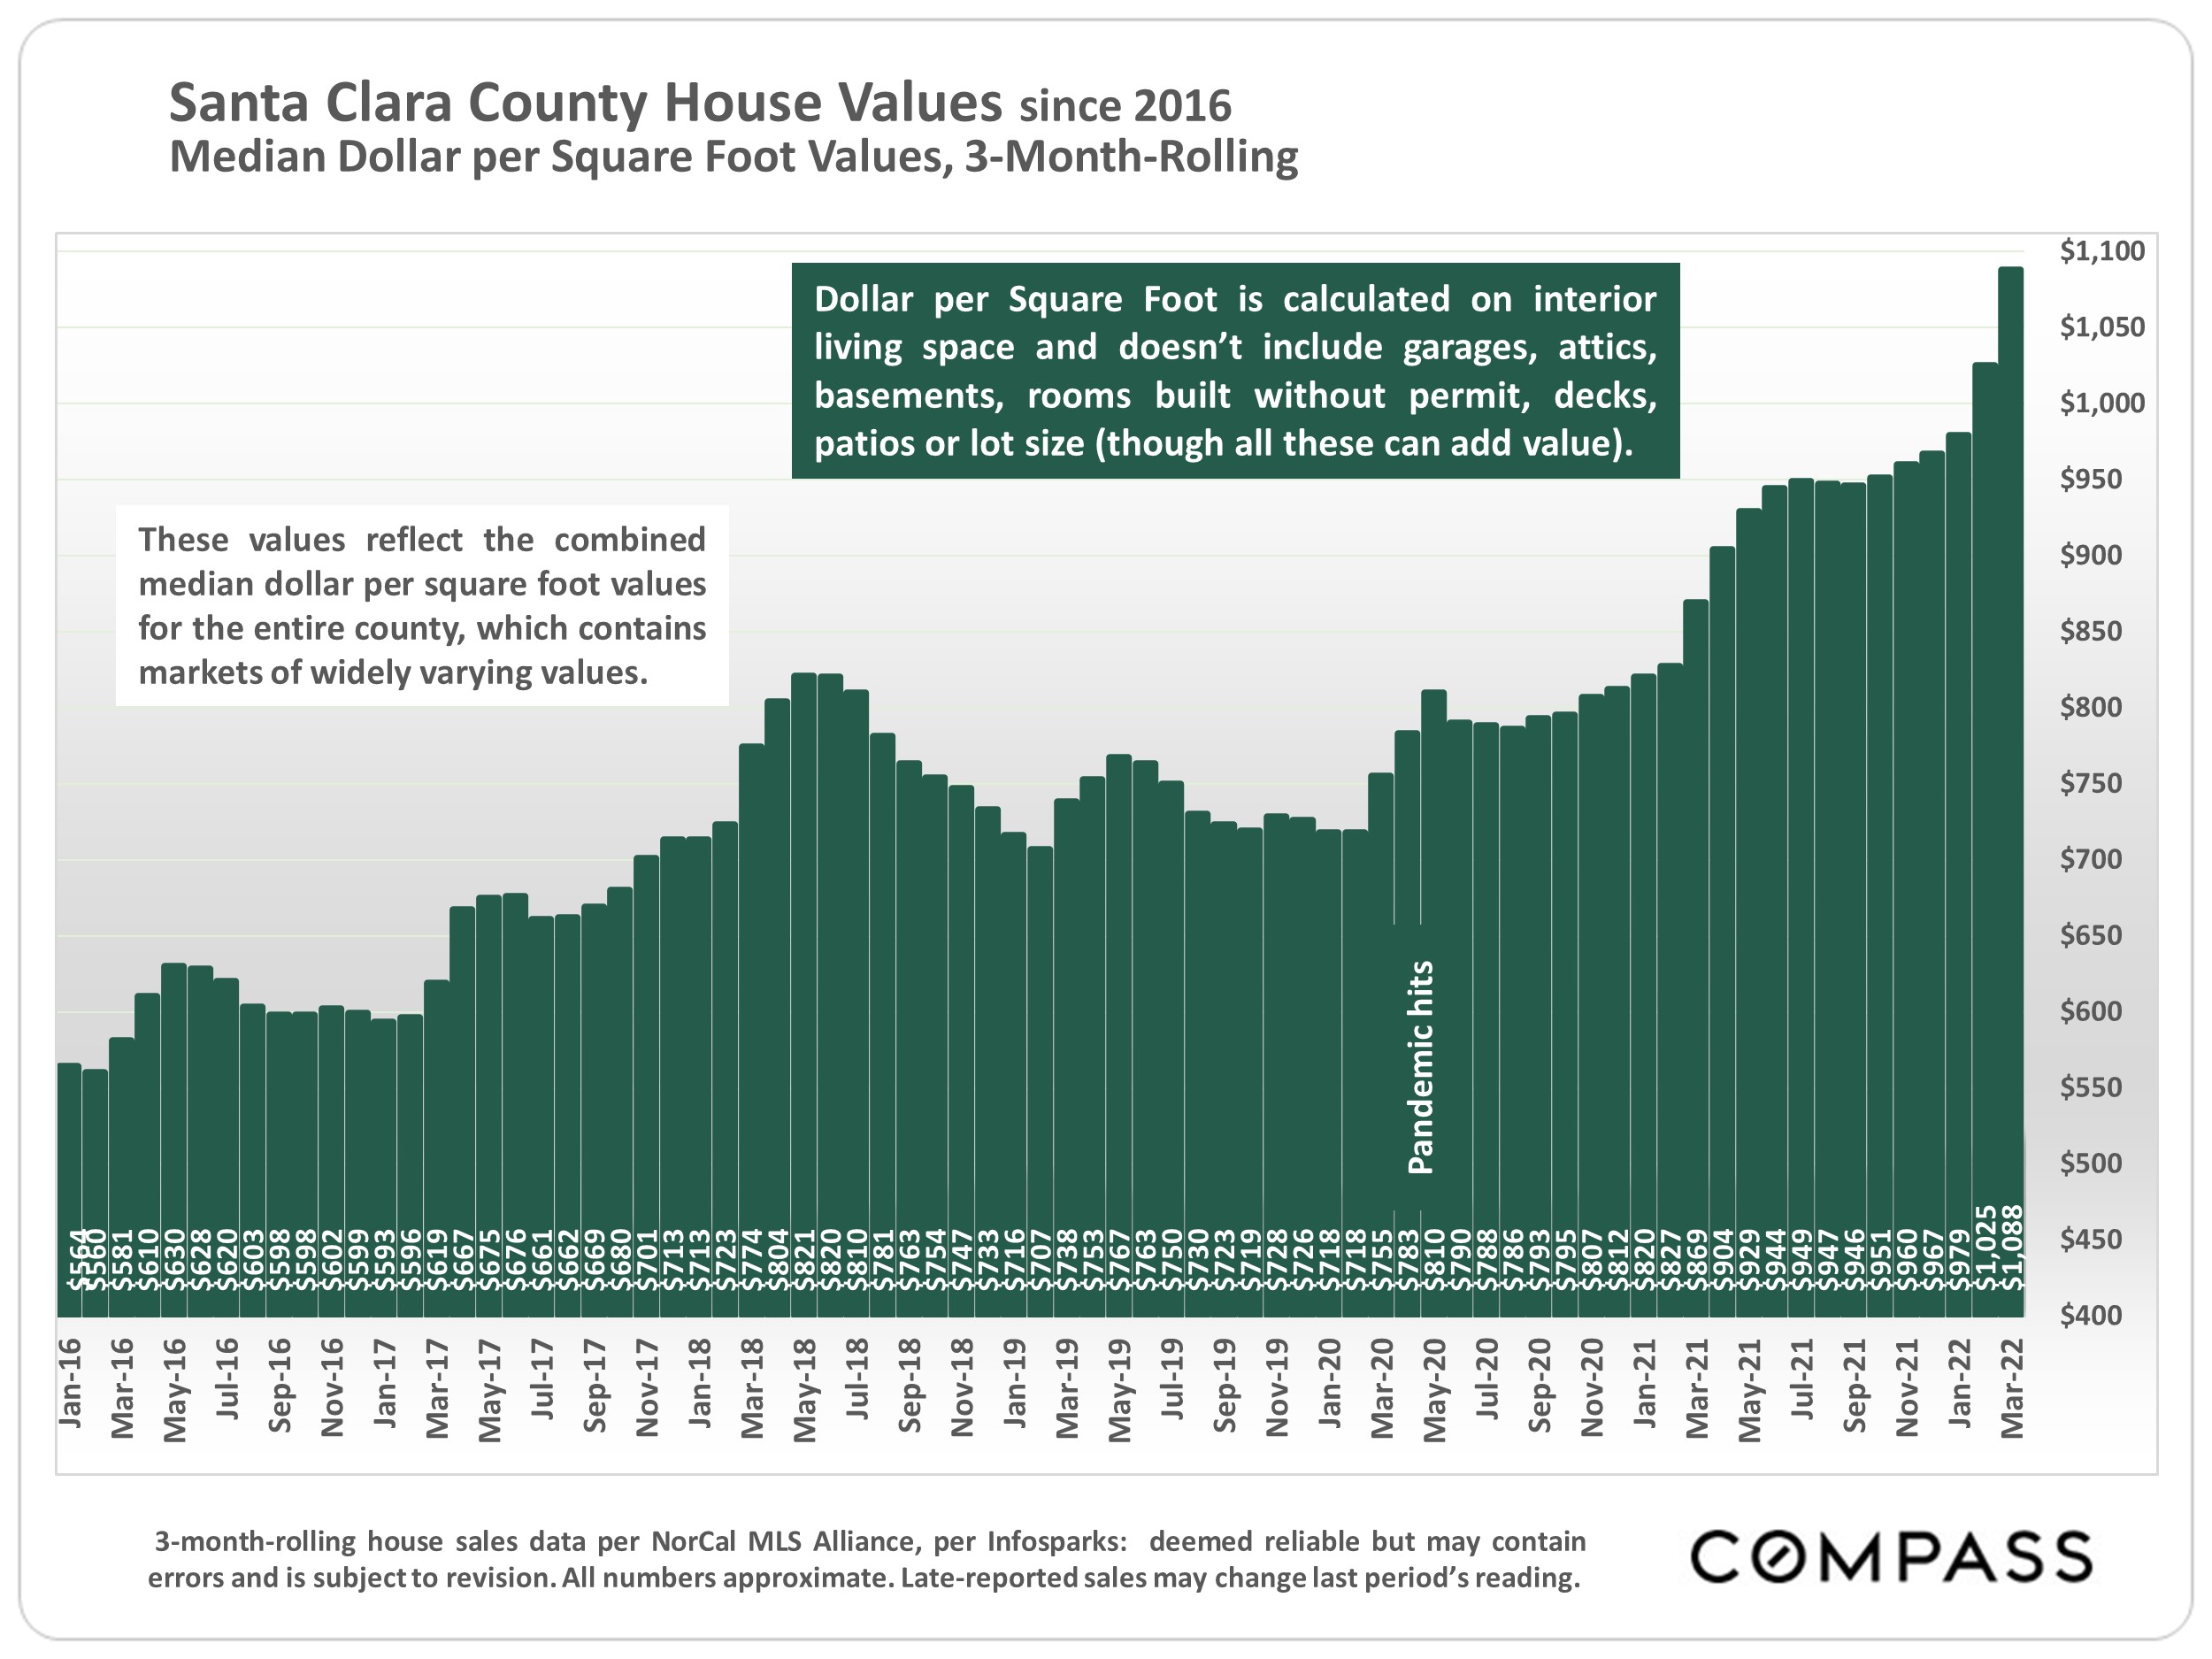
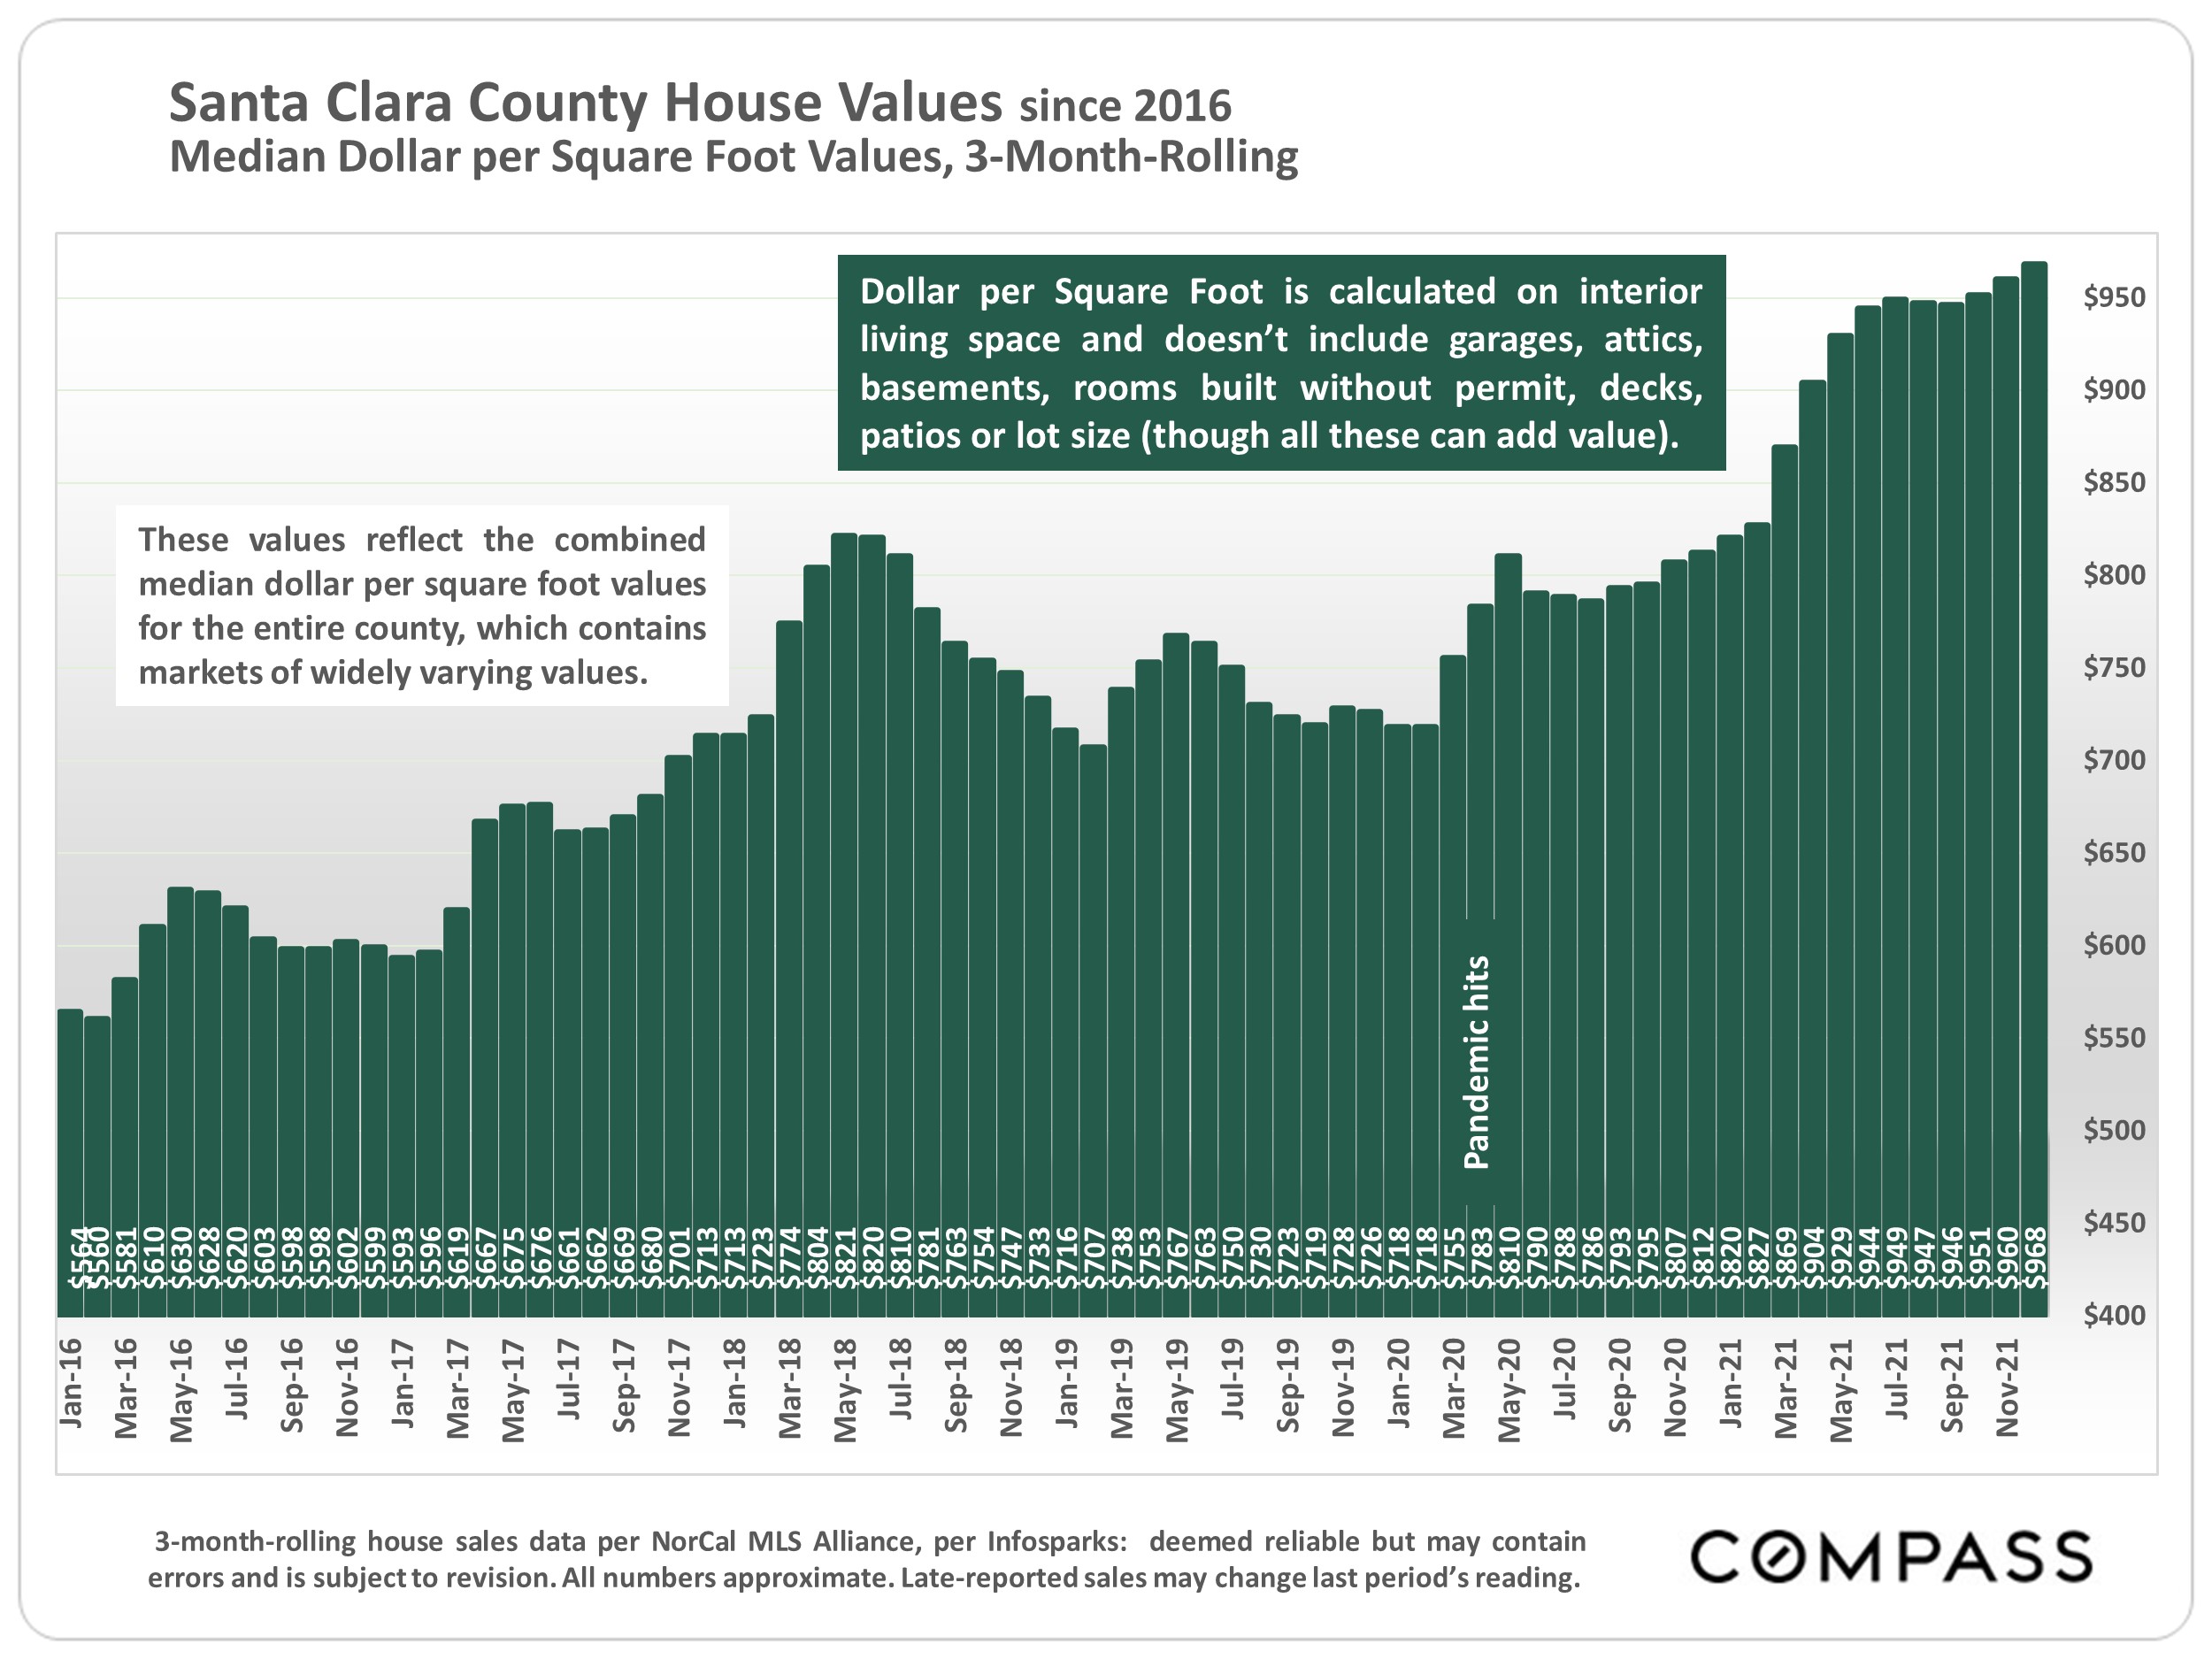
Dollar per Square Foot is based upon the home’s interior living space and does not include garages, unfinished attics and basements, rooms built without permit, patios, decks or yards (though all those can add value to a home). These figures are usually derived from appraisals or tax records, but are sometimes unreliable (especially for older homes) or unreported altogether. The calculation can only be made on those home sales that reported square footage.

Compass is a real estate broker licensed by the State of California, DRE 01527235. Equal Housing Opportunity. This report has been prepared solely for information purposes. The information herein is based on or derived from information generally available to the public and/or from sources believed to be reliable. No representation or warranty can be given with respect to the accuracy or completeness of the information. Compass disclaims any and all liability relating to this report, including without limitation any express or implied representations or warranties for statements contained in, and omissions from, the report. Nothing contained herein is intended to be or should be read as any regulatory, legal, tax, accounting or other advice and Compass does not provide such advice. All opinions are subject to change without notice. Compass makes no representation regarding the accuracy of any statements regarding any references to the laws, statutes or regulations of any state are those of the author(s). Past performance is no guarantee of future results.

Santa Clara County Real Estate, August 2022

Across the Bay Area, markets have continued to slow and cool. As illustrated in this report, dramatic changes in demand, inventory, overbidding, price reductions, and year-over-year appreciation rates have usually occurred. Buying and selling continues: Over 5200 home sales were reported to MLS from Napa County to Monterey in July 2022 – many of them selling quickly for over asking price – but that number was down 38% from last year. Median home price appreciation rates in the Bay Area have seen steep declines from those in 2021/early 2022. All these changes vary in degree by location and market segment, but the direction of these shifts is near universal.

This report will review year-over-year changes in prices, and in supply and demand, reflecting the significant adjustments from the heated (often overheated) conditions recently the norm, but also look at longer-term trends to provide greater historical context. There is also a comparison of home prices within the local market, as well as across the Bay Area.

As of early August, the average, weekly mortgage rate for a 30-year fixed rate loan fell below 5% for the first time since April, and stock markets have seen large rebounds since early July – but these and other indicators have been subject to sudden and often dramatic volatility, and their future directions can’t be taken for granted. Within this report is a link to a review of many of the macroeconomic factors at play.

According to some agents, buyer interest has begun to rekindle with the decline in competition, increase in inventory, and economic changes mentioned above, but if this is part of a broader recovery in demand, it has not yet shown up in the statistics – which are lagging indicators of what’s occurring on the ground right now. Monthly data can be volatile, fluctuating according to a wide variety of factors, including market seasonality. Longer-term trends are more meaningful than short-term fluctuations.

Mid-late summer is typically a slower period compared to the big, spring selling season. Autumn sometimes sees a significant spike in new listings and sales prior to the big mid-winter slowdown.

Our reports are not intended to convince you regarding a course of action or to predict the future, but to provide, to the best of our ability, straightforward information and good-faith analysis to assist you in making your own informed decisions. Statistics should be considered very general indicators, and all numbers should be considered approximate. How they apply to any particular property is unknown without a specific comparative market analysis.

Source: Compass

It is impossible to know how median and average value statistics apply to any particular home without a specific comparative market analysis. These analyses were made in good faith with data from sources deemed reliable, but may contain errors and are subject to revision. It is not our intent to convince you of a particular position, but to attempt to provide straightforward data and analysis, so you can make your own informed decisions. Median and average statistics are enormous generalities: There are hundreds of different markets in San Francisco and the Bay Area, each with its own unique dynamics. Median prices and average dollar per square foot values can be and often are affected by other factors besides changes in fair market value. Longer term trends are much more meaningful than short-term.

Compass is a real estate broker licensed by the State of California, DRE 01527235. Equal Housing Opportunity. This report has been prepared solely for information purposes. The information herein is based on or derived from information generally available to the public and/or from sources believed to be reliable. No representation or warranty can be given with respect to the accuracy or completeness of the information. Compass disclaims any and all liability relating to this report, including without limitation any express or implied representations or warranties for statements contained in, and omissions from, the report. Nothing contained herein is intended to be or should be read as any regulatory, legal, tax, accounting or other advice and Compass does not provide such advice. All opinions are subject to change without notice. Compass makes no representation regarding the accuracy of any statements regarding any references to the laws, statutes or regulations of any state are those of the author(s). Past performance is no guarantee of future results.

Santa Clara County Real Estate, July 2022

Leaning into Market Headwinds, Appreciation Rate Drops

The impacts of this year’s severe economic headwinds – soaring inflation and interest rates, stock market declines, fears of recession – on Bay Area real estate markets are accelerating. The first effect was on buyer demand (fewer buyers, offers and listings into contract), leading to changes in supply (more homes for sale, more price reductions), which began to alter buyer and seller psychology and the balance of power between them. Especially after one of the longest, most dramatic upcycles in history, the psychology, circumstances and plans of individual buyers and sellers shift unevenly in the early months of a transition as they try to make sense of changing market realities. Eventually statistics based on closed sales – prices, appreciation rates, overbidding, days on market – slowly start to adjust. Generally speaking, closed sales are lagging indicators of what occurred in the economy and market weeks and months earlier.

If stock market prices are like a jet skier on a triple-espresso, home prices are like a giant cargo ship, which decelerates and turns slowly. It took a few months from when the big economic changes began, but the high year-over-year appreciation rates of recent years are now dropping fast in Bay Area markets, though the degree of any actual, longer-term “correction” to prices, if it occurs, remains to be seen.
A correction is not a crash. The precipitating factor in the 2008 crash – tens of millions of households talked into home loans they couldn’t afford, forcing frantic sales during a recession – does not apply today. Indeed, mortgage payments as a percentage of income are close to all-time lows (and most homeowners’ mortgages are also at historically low rates). Outside the 2008 crash, market corrections over the last 4 decades typically ran from a simple flattening in appreciation, to price adjustments of 5% to 10% (relatively small compared to the appreciation rates which preceded them). It is far too early, with far too many factors at play, to make predictions.

Our reports are not intended to convince you regarding a course of action or to predict the future, but to provide, to the best of our ability, straightforward information and good-faith analysis to assist you in making your own informed decisions. Statistics should be considered very general indicators, and all numbers should be considered approximate. How they apply to any particular property is unknown without a specific comparative market analysis.

An overheated market cooling or normalizing, slowing from an unsustainable rate of acceleration, does not necessarily imply a weak market by historical standards, even if the speed and scale of the change is startling. This report will review year-over-year changes in supply and demand, reflecting the significant adjustments occurring, but also longer-term trends to provide greater context to these recent changes.

Monthly data can be volatile, fluctuating according to a number of factors, including market seasonality. For example, in most Bay Area markets, it is not unusual for median sales prices to peak for the year in spring or early summer. It is best not to jump to definitive conclusions based on a few months of data: Longer-term data is more meaningful than short-term fluctuations.

Different regions and market segments are cooling at differing speeds and each region has unique conditions – and in the Bay Area, each home is relatively unique as well. But barring very special circumstances, markets across the Bay Area (and the country) can be expected to eventually move in roughly parallel directions because of the broad macroeconomic factors at play. Within this report is a link to a review of many of these factors. As of July 7, 2022, according to FHLMC, the average weekly mortgage rate for a 30-year fixed rate loan fell to 5.3% from 5.81% two weeks earlier.

Our reports are not intended to convince you regarding a course of action or to predict the future, but to provide, to the best of our ability, straightforward information and good-faith analysis to assist you in making your own informed decisions. Statistics should be considered very general indicators, and all numbers should be considered approximate. How they apply to any particular property is unknown without a specific comparative market analysis.

Source: Compass

It is impossible to know how median and average value statistics apply to any particular home without a specific comparative market analysis. These analyses were made in good faith with data from sources deemed reliable, but may contain errors and are subject to revision. It is not our intent to convince you of a particular position, but to attempt to provide straightforward data and analysis, so you can make your own informed decisions. Median and average statistics are enormous generalities: There are hundreds of different markets in San Francisco and the Bay Area, each with its own unique dynamics. Median prices and average dollar per square foot values can be and often are affected by other factors besides changes in fair market value. Longer term trends are much more meaningful than short-term.

Compass is a real estate broker licensed by the State of California, DRE 01527235. Equal Housing Opportunity. This report has been prepared solely for information purposes. The information herein is based on or derived from information generally available to the public and/or from sources believed to be reliable. No representation or warranty can be given with respect to the accuracy or completeness of the information. Compass disclaims any and all liability relating to this report, including without limitation any express or implied representations or warranties for statements contained in, and omissions from, the report. Nothing contained herein is intended to be or should be read as any regulatory, legal, tax, accounting or other advice and Compass does not provide such advice. All opinions are subject to change without notice. Compass makes no representation regarding the accuracy of any statements regarding any references to the laws, statutes or regulations of any state are those of the author(s). Past performance is no guarantee of future results.

Santa Clara County Real Estate, June 2022

Clear Indications of Changing Market Dynamics

Sales are declining, and the number of active listings and price reductions are increasing. But the homes that are selling are still, on average, selling very quickly for well over asking: In May 2022, 86% of sales closed for over list price, at an average overbid of 11%. Median sales prices and year-over-year appreciation rates remain very high. When an overheated market cools, the change is typically gradual (absent a disaster event) and does not mean the market is weak by any normal standard. As an analogy, if traffic is going 120 miles per hour and drops to 75, it feels a lot slower, but cannot reasonably be described as slow. After 2 years of scorching demand, it may be difficult to remember what a more normal market feels like, but people will continue to have excellent personal and financial reasons to buy and sell homes.

As of late spring, across the Bay Area, less expensive home sales have generally been considerably impacted by rising interest rates. Sales of higher-priced homes have held up much better, but cooling demand is beginning to show up in pending-sale data. (Affluent buyers tend to be more affected by financial markets, which became very volatile in May.) Market changes are often very uneven in the early months of a transition, with one home selling in days at 20% over the list price, while next door, the seller has to reduce their price to get an offer. As markets cool, buyers become more discriminating; negative conditions previously ignored are noticed; more negotiation occurs; multiple offers and overbidding decline. Listings that are well prepared, show well, and are priced right will have an increasing advantage.

The homes that are not selling quickly won’t affect overbid and days-on-market statistics until future months. The high appreciation rates of the last 2 years will almost certainly start to decline (which is not the same thing as an imminent decline in prices). After peaking in spring, activity in the county typically gradually slows through summer and fall prior to the mid-winter slowdown. Sometimes, autumn sees a small, short spike up. These are common seasonal dynamics, though other factors can come into play.
This report will look at recent, year-over-year changes in inventory and demand, while also reviewing longer-term trends for more context. Included is a link to a report reviewing city/town submarkets.

Santa Clara County Real Estate, May 2022

Amid Dramatic Home-Price Gains to New Peaks,
Preliminary Signs of Markets Shifting Cooler

In April 2022, the Bay Area continued to see appreciation, overbidding and days-on-market reflecting extremely intense demand. But sales are a lagging indicator reflecting offers accepted 3-6 weeks earlier. April sales mostly reflect buyers who locked in mortgage rates before the big late-March/April jumps, buyers highly motivated to buy before their interest rate locks expired, adding short-term pressure to demand.

Declining interest rates stimulate demand: In recent years, large rate declines subsidized much of the surge in home prices. Escalating interest rates initially fueled demand in early 2022 as buyers rushed to avoid further rises, but at a certain point, big increases, especially if coupled with peak prices, batter affordability. And all buyers – even all-cash buyers – can be affected financially and psychologically by stock market declines and economic uncertainty. If continuing, these factors can be expected to dampen purchase activity.

As of May 5, mortgage rates were up 69% in 2022, and the scale and speed of the increase make it difficult to predict precise effects; inflation is at a 40-year high; the S&P 500 is down 14% and the Nasdaq, 22%. *The housing market is beginning to show preliminary, but not universal reactions. Accounts of less crowded open houses and fewer offers on new listings are becoming more common. Some buyers are dropping out or becoming more selective; some sellers are moving listing dates forward. In many markets, declines in listings going into contract occurred in April. But some agents report no change, so far, in client plans or motivation. Due to the time involved in the home search/closing process, and the extremely heated conditions of early 2022, substantial changes in closed-sales statistics, if coming, won’t appear until later in Q2 or Q3.

Even the hottest markets eventually cool. This does not necessarily imply a large “bubble and crash” (terms much overused). Over the past 4 decades, a cooling shift has typically meant a gradual decline in sales activity, then either a leveling off in appreciation or price declines of 5% to 10%: More like a slow leak in an over-pressurized tire than a blowout at high speed. The 2008 subprime crisis – a true bubble & crash – was an extreme event brought about by a massive failure of ethics, underwriting standards and risk management in the loan, banking, investment and ratings industries.

*Markets have been volatile: Interest rates and stock markets are subject to sudden, dramatic changes.

When hot markets shift cooler, effects are typically first reflected in reductions in multiple offers, overbidding and the number of homes going into contract; gradual increases in active listings and time-on-market; and gradual declines in year-over-year appreciation rates. Historically, after a down cycle runs its course, the market moves into the next upcycle and home prices climb (often relatively quickly) above previous peaks. Over the longer term, past appreciation trends – magnified by tax breaks & financing options – have typically made Bay Area real estate an excellent, and often spectacular investment.

Looking back to spring 2018, 6 years into the market recovery from the foreclosure crisis, after an enormous boom in high-tech hiring, immigration and wealth, and dramatic home-price appreciation, Bay Area markets (and especially Santa Clara County) generally hit an intense peak in demand. In the second half of 2018, interest rates climbed 31% over the 2017 low, the S&P 500 dropped almost 20%, and supply and demand indicators swiftly cooled. By spring 2019, county median house sales prices were down about 7%: Not a huge drop, but after the high appreciation rates of previous years, a distinct shift in the psychology of the market. In Q3 2019, the Fed began lowering interest rates again. Then the pandemic struck in spring 2020, with profound social/economic effects, interest rates plunged, stock markets soared, and house prices rapidly climbed far above 2018 peaks. (Condo markets saw somewhat different pandemic-era dynamics.)

Many economic, political and demographic factors affect housing markets. What occurs with inflation, interest rates and stock markets will certainly be important. How the media covers the market will influence buyer and seller psychology. And major events often arise from off the radar (e.g. the pandemic, the war in Ukraine). The speed and scale of market changes often vary by region, price segment and property type. Less expensive homes may be more affected initially by rising interest rates, while affluent markets tend to be more influenced by sustained changes in financial markets. But over time, broad market trends tend to end up running roughly parallel across the Bay Area.

As always, analysts, economists and industry commentators are making diverging forecasts. Sales data in coming months should soon provide more concrete indications of market direction.

Not intended to convince anyone to take a specific course of action, or to predict the future, but only to provide, to the best of our ability, a straightforward analysis of market conditions and trends.

National Housing Market Reports

Being the center of high-tech industry and other unique local factors have certainly had deep effects on Bay Area real estate markets, but over the past 20 years, the differences between local and national trends have generally been more of degree than direction: General economic conditions and market ups and downs run on similar tracks — which makes it useful to look at national data indicators as well.

“National housing market indicators available as of April showed activity in housing markets slowed overall… Sales of existing homes declined to the slowest pace since June 2020… The inventory of homes for sale rose [month over month, and year-over-year].” U.S. Department of Housing and Urban Development, Housing Market Indicators Monthly Update for April 2022, published May 5, 2022

“Tin March 2022] All regions [of the country] reported decreases in year-over-year contract activity. Sales were down across each region year-over-year.” National Association of Realtors, April 27, 2022

“On the seller side, the number of new listings grew this week and there’s some evidence that the number of potential buyers is shrinking as high costs derail some buying plans. As new listings grow and home sales slow… we expect active inventory to surpass year ago levels in the next few months. [As] home sales lose momentum, price growth is likely to follow suit.” Realtor.com National Report, May 2, 2022

“The combination of swift home price growth and the fastest mortgage rate increase in over forty years is finally affecting purchase demand. Homebuyers… are coping in a variety of ways, including switching to adjustable-rate mortgages… We expect the decline in demand to soften home price growth… later this year.” Freddie Mac (FHLMC), April 28, 2022

“With mortgage rates increasing… [loan] applications continued to decline… to the lowest level since 2018.” Mortgage Bankers Association, April 27, 2022


Source: Compass

Demographic, Economic & Real Estate Market Snapshots for Santa Clara County & the San Francisco Bay Area – March 2022

Income, education, employment, population, migration, housing, language, life expectancy, home ownership, home prices, selected market statistics, and other angles on the county and the greater Bay Area.

New 2020 U.S. Census estimates were released on March 17, 2022. Within this report are analyses using data from this release, as well as from earlier releases, and many other data sources besides. The data included here generally reflects conditions and circumstances in the recent past: By its very nature, it is constantly changing (including changes still evolving due to the pandemic). Data from sources deemed to be reliable, but may contain errors and subject to revision. Analyses date to various time periods as delineated on each chart or table. All numbers should be considered approximate, good-faith estimates.

Compass Bay Area real estate market reports: https://www.bayareamarketreports.com/

Source: Compass

It is impossible to know how median and average value statistics apply to any particular home without a specific comparative market analysis. These analyses were made in good faith with data from sources deemed reliable, but may contain errors and are subject to revision. It is not our intent to convince you of a particular position, but to attempt to provide straightforward data and analysis, so you can make your own informed decisions. Median and average statistics are enormous generalities: There are hundreds of different markets in San Francisco and the Bay Area, each with its own unique dynamics. Median prices and average dollar per square foot values can be and often are affected by other factors besides changes in fair market value. Longer term trends are much more meaningful than short-term.

Compass is a real estate broker licensed by the State of California, DRE 01527235. Equal Housing Opportunity. This report has been prepared solely for information purposes. The information herein is based on or derived from information generally available to the public and/or from sources believed to be reliable. No representation or warranty can be given with respect to the accuracy or completeness of the information. Compass disclaims any and all liability relating to this report, including without limitation any express or implied representations or warranties for statements contained in, and omissions from, the report. Nothing contained herein is intended to be or should be read as any regulatory, legal, tax, accounting or other advice and Compass does not provide such advice. All opinions are subject to change without notice. Compass makes no representation regarding the accuracy of any statements regarding any references to the laws, statutes or regulations of any state are those of the author(s). Past performance is no guarantee of future results.

Santa Clara County Real Estate, April 2022

Source: Compass

It is impossible to know how median and average value statistics apply to any particular home without a specific comparative market analysis. These analyses were made in good faith with data from sources deemed reliable, but may contain errors and are subject to revision. It is not our intent to convince you of a particular position, but to attempt to provide straightforward data and analysis, so you can make your own informed decisions. Median and average statistics are enormous generalities: There are hundreds of different markets in San Francisco and the Bay Area, each with its own unique dynamics. Median prices and average dollar per square foot values can be and often are affected by other factors besides changes in fair market value. Longer term trends are much more meaningful than short-term.

Compass is a real estate broker licensed by the State of California, DRE 01527235. Equal Housing Opportunity. This report has been prepared solely for information purposes. The information herein is based on or derived from information generally available to the public and/or from sources believed to be reliable. No representation or warranty can be given with respect to the accuracy or completeness of the information. Compass disclaims any and all liability relating to this report, including without limitation any express or implied representations or warranties for statements contained in, and omissions from, the report. Nothing contained herein is intended to be or should be read as any regulatory, legal, tax, accounting or other advice and Compass does not provide such advice. All opinions are subject to change without notice. Compass makes no representation regarding the accuracy of any statements regarding any references to the laws, statutes or regulations of any state are those of the author(s). Past performance is no guarantee of future results.

Santa Clara County Real Estate, March 2022

Moving into Spring, Markets Remain Very Heated

So far in 2022, Bay Area real estate markets appear largely unfazed by higher interest rates, volatility in financial markets, and troubling international events. The prevailing dynamic remains one of strong buyer demand competing for an inadequate inventory of listings for sale: Crowded open houses, multiple offers, fierce overbidding, fast sales, and rising prices remain the norm. That is not to say there haven’t been buyers negatively impacted by higher loan rates and/or recent declines in stock portfolios; and some buyers and sellers have become more hesitant or paused their plans, awaiting more clarity amid recent developments. But not enough to move the needle on the fundamentally very-high-demand/very-low-­supply conditions which dominated 2021.

As typical at the start of the year, the number of new listings coming on market and the number of listings going into contract continue to rise. These normally climb rapidly through spring, characteristically the biggest selling season of the year.

This report will review a number of standard indicators, as well as home values, interest rates, factors that can affect real estate markets, and how market cycles have broadly played out over the last 4 decades. March and April data will soon provide further indications of the market’s direction in 2022.

Sales in one month mostly reflect market dynamics in the previous month, and activity typically ebbs and flows by season. Data from sources deemed reliable, but may contain errors and subject to revision. All numbers approximate, and may change with late-reported activity.

Source: Compass

It is impossible to know how median and average value statistics apply to any particular home without a specific comparative market analysis. These analyses were made in good faith with data from sources deemed reliable, but may contain errors and are subject to revision. It is not our intent to convince you of a particular position, but to attempt to provide straightforward data and analysis, so you can make your own informed decisions. Median and average statistics are enormous generalities: There are hundreds of different markets in San Francisco and the Bay Area, each with its own unique dynamics. Median prices and average dollar per square foot values can be and often are affected by other factors besides changes in fair market value. Longer term trends are much more meaningful than short-term.

Compass is a real estate broker licensed by the State of California, DRE 01527235. Equal Housing Opportunity. This report has been prepared solely for information purposes. The information herein is based on or derived from information generally available to the public and/or from sources believed to be reliable. No representation or warranty can be given with respect to the accuracy or completeness of the information. Compass disclaims any and all liability relating to this report, including without limitation any express or implied representations or warranties for statements contained in, and omissions from, the report. Nothing contained herein is intended to be or should be read as any regulatory, legal, tax, accounting or other advice and Compass does not provide such advice. All opinions are subject to change without notice. Compass makes no representation regarding the accuracy of any statements regarding any references to the laws, statutes or regulations of any state are those of the author(s). Past performance is no guarantee of future results.

Santa Clara County Real Estate, February 2022

2022 Begins with Mixed Economic Indicators

2021 was one of the most frenzied real estate markets ever, with buyer demand far exceeding the supply of listings available to buy — and all the usual indicators, including home price appreciation trends, reflected this severe imbalance. As is the normal seasonal trend, listing and offer activity dropped substantially mid- November through early January, resulting in very low sales volume in the year’s first month.

As of 2/3/22, mortgage interest rates have risen 14% in 2022, putting them 34% above the low 1 year ago. Inflation is at a 40-year high, and the Fed plans to make major changes to its interest-rate policies and its interventions in the economy generally. Consumer confidence has been dropping, and financial markets have seen considerable turbulence in the new year. Geopolitical risks of major-power conflict appear to be rising.

On the other hand, employment, GDP, and household-wealth indicators are quite positive; by historical standards, interest rates remain very low and stock markets very high; COVID infections are falling. The Bay Area is home to many of the world’s most innovative and successful companies; there is an enormous concentration of local wealth; and a staggering amount of money sloshing around the economy looking for somewhere to invest. Many believe real estate to be an excellent hedge against inflation, and an excellent long-term investment generally (heightened by tax advantages).

In the Bay Area, real estate market indicators remain very strong: demand for homes still very high, inventory still very low. So far, buyers do not seem to be significantly rattled by stock market gyrations, and increasing interest rates may be motivating some to buy sooner than later. As the new year wakes up, a common dynamic in heated markets is for buyers to jump back in much faster than sellers: Demand outpaces supply right from the start, with all the usual results (multiple offers, overbidding, fast sales), even as the number of new listings starts climbing. This describes 2022 to date, but more will be known once the spring selling season — typically the biggest of the year — really gets underway. (In the Bay Area, the “spring” market can begin in February.)

As an aside: Compared to the general market, luxury home buyers tend to be less sensitive to interest rate movements, but more sensitive to turbulence and uncertainty in financial markets.

Santa Clara County Real Estate, January 2022

Source: Compass

It is impossible to know how median and average value statistics apply to any particular home without a specific comparative market analysis. These analyses were made in good faith with data from sources deemed reliable, but may contain errors and are subject to revision. It is not our intent to convince you of a particular position, but to attempt to provide straightforward data and analysis, so you can make your own informed decisions. Median and average statistics are enormous generalities: There are hundreds of different markets in San Francisco and the Bay Area, each with its own unique dynamics. Median prices and average dollar per square foot values can be and often are affected by other factors besides changes in fair market value. Longer term trends are much more meaningful than short-term.

Compass is a real estate broker licensed by the State of California, DRE 01527235. Equal Housing Opportunity. This report has been prepared solely for information purposes. The information herein is based on or derived from information generally available to the public and/or from sources believed to be reliable. No representation or warranty can be given with respect to the accuracy or completeness of the information. Compass disclaims any and all liability relating to this report, including without limitation any express or implied representations or warranties for statements contained in, and omissions from, the report. Nothing contained herein is intended to be or should be read as any regulatory, legal, tax, accounting or other advice and Compass does not provide such advice. All opinions are subject to change without notice. Compass makes no representation regarding the accuracy of any statements regarding any references to the laws, statutes or regulations of any state are those of the author(s). Past performance is no guarantee of future results.

Skip to content