Year-to-Date, Year- over-Year Changes
Comparing Jan.-April 2021 with Jan.-April 2020
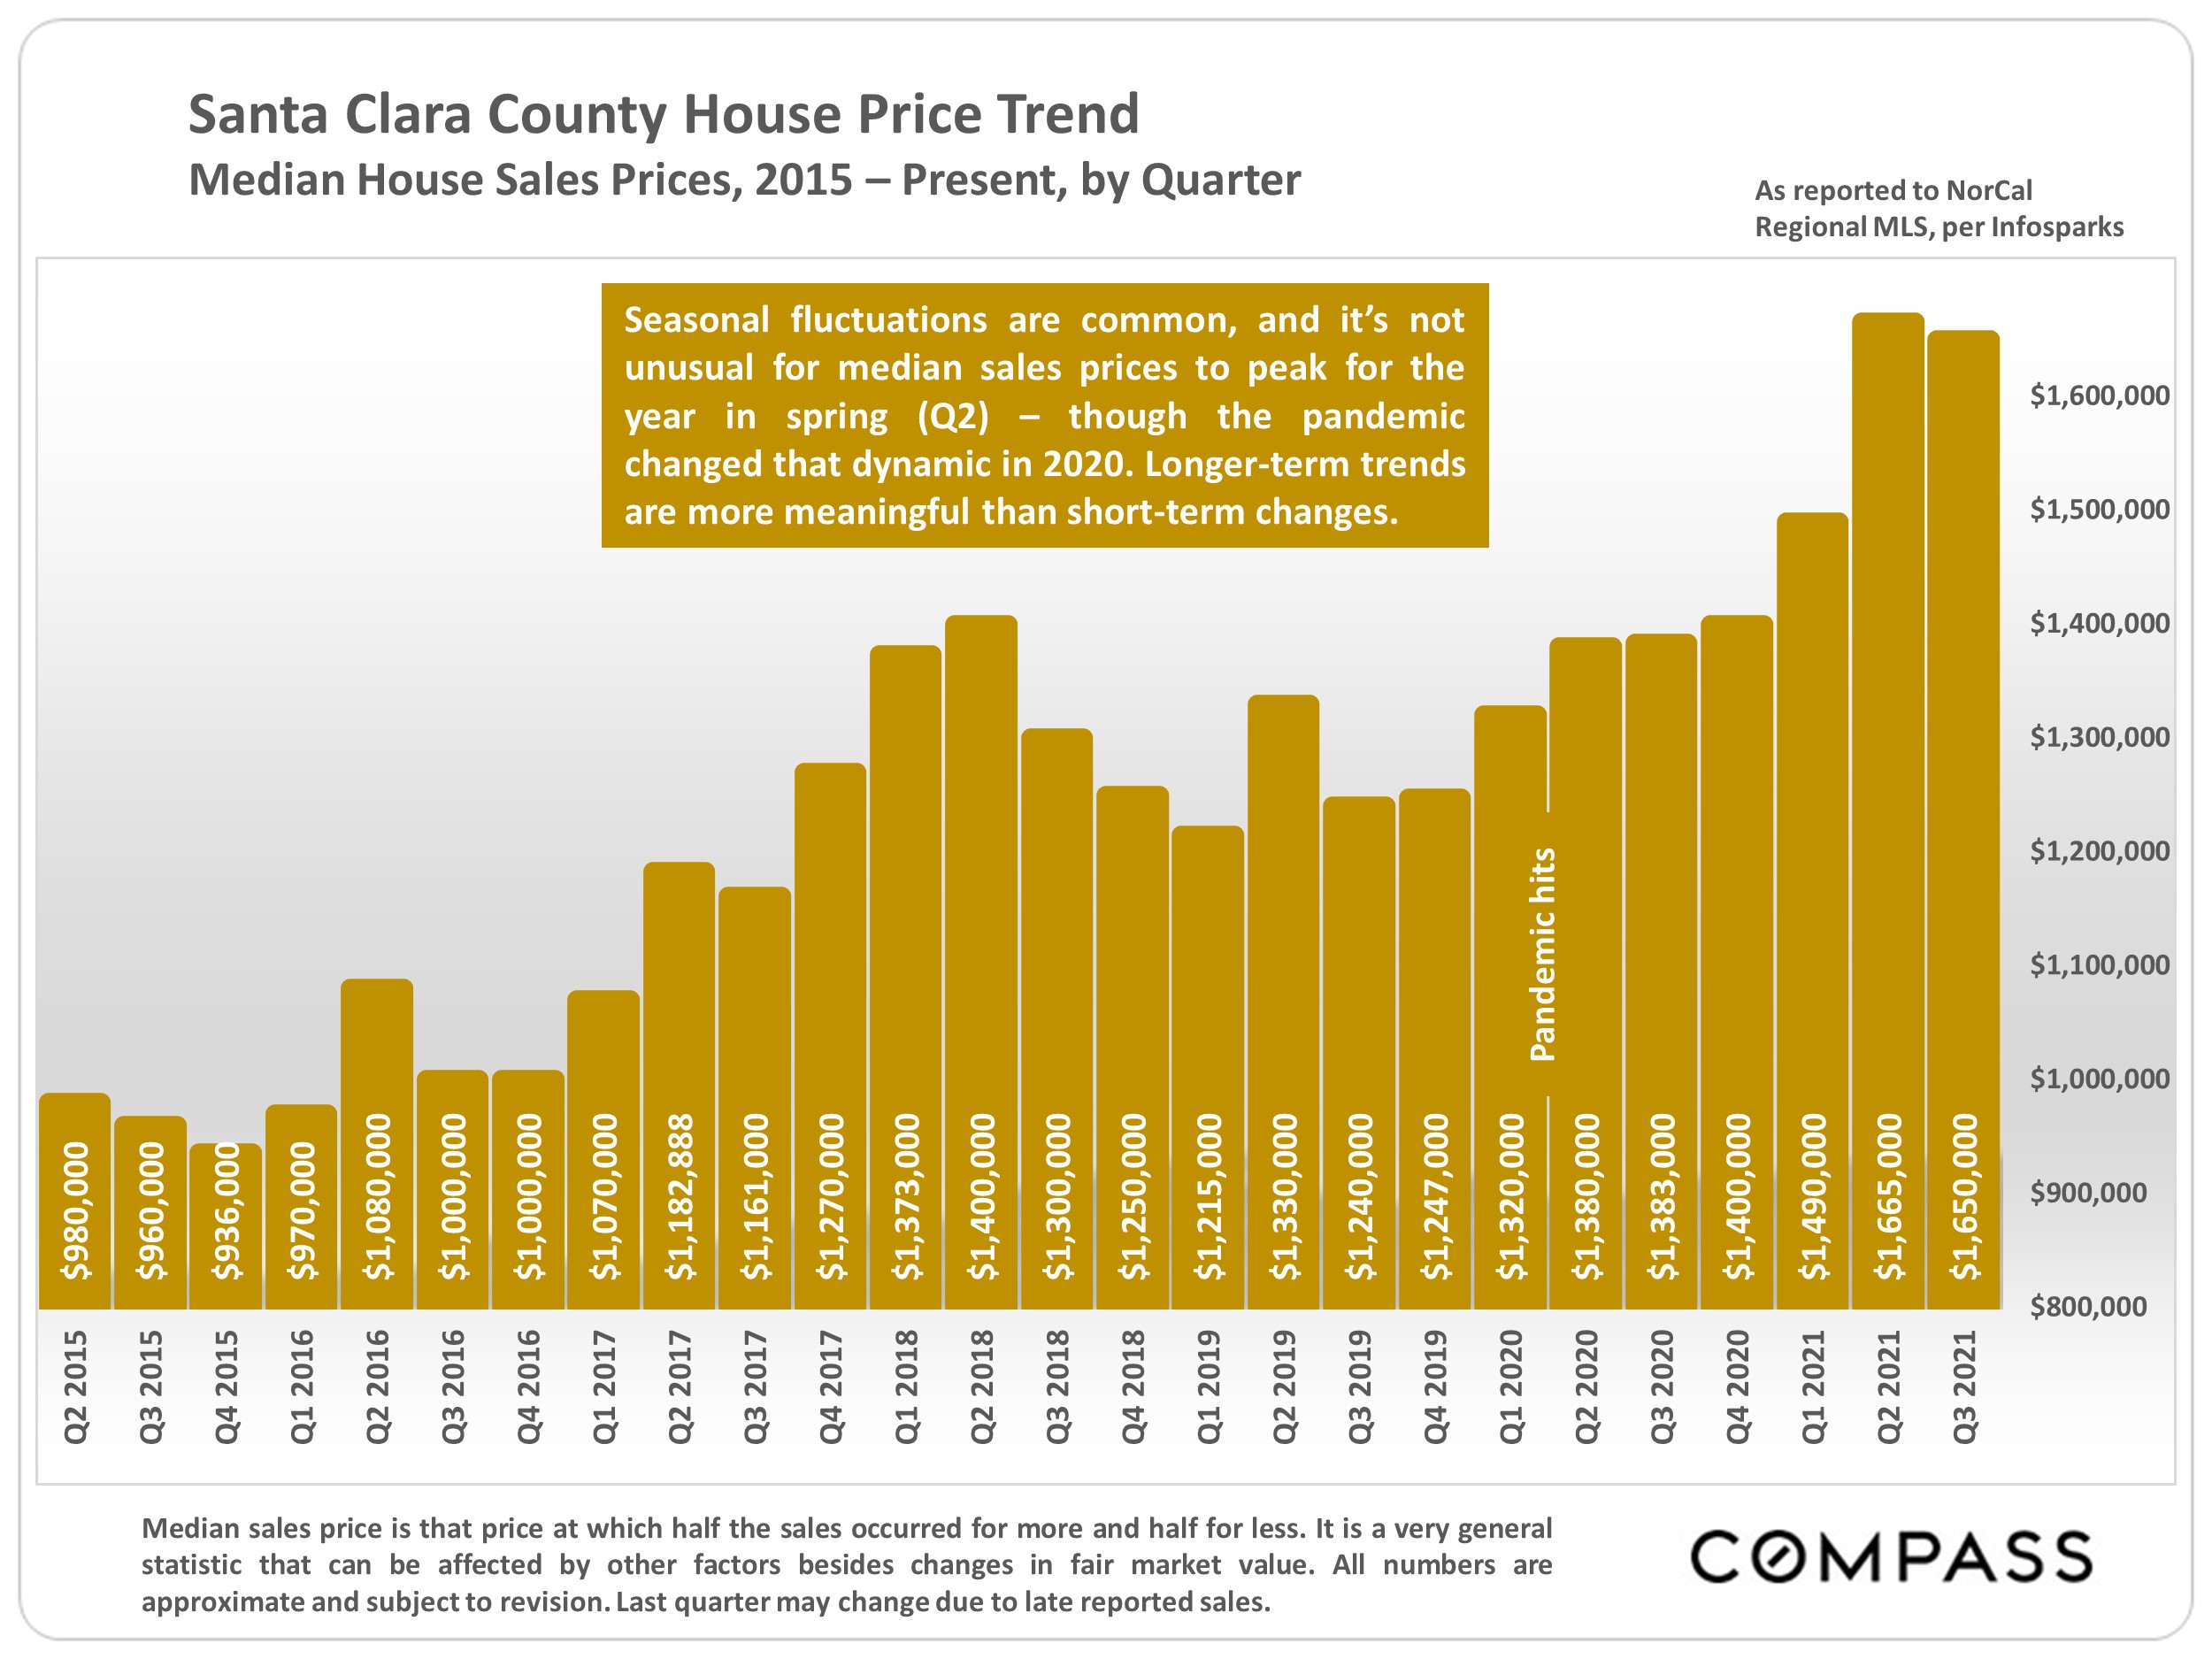
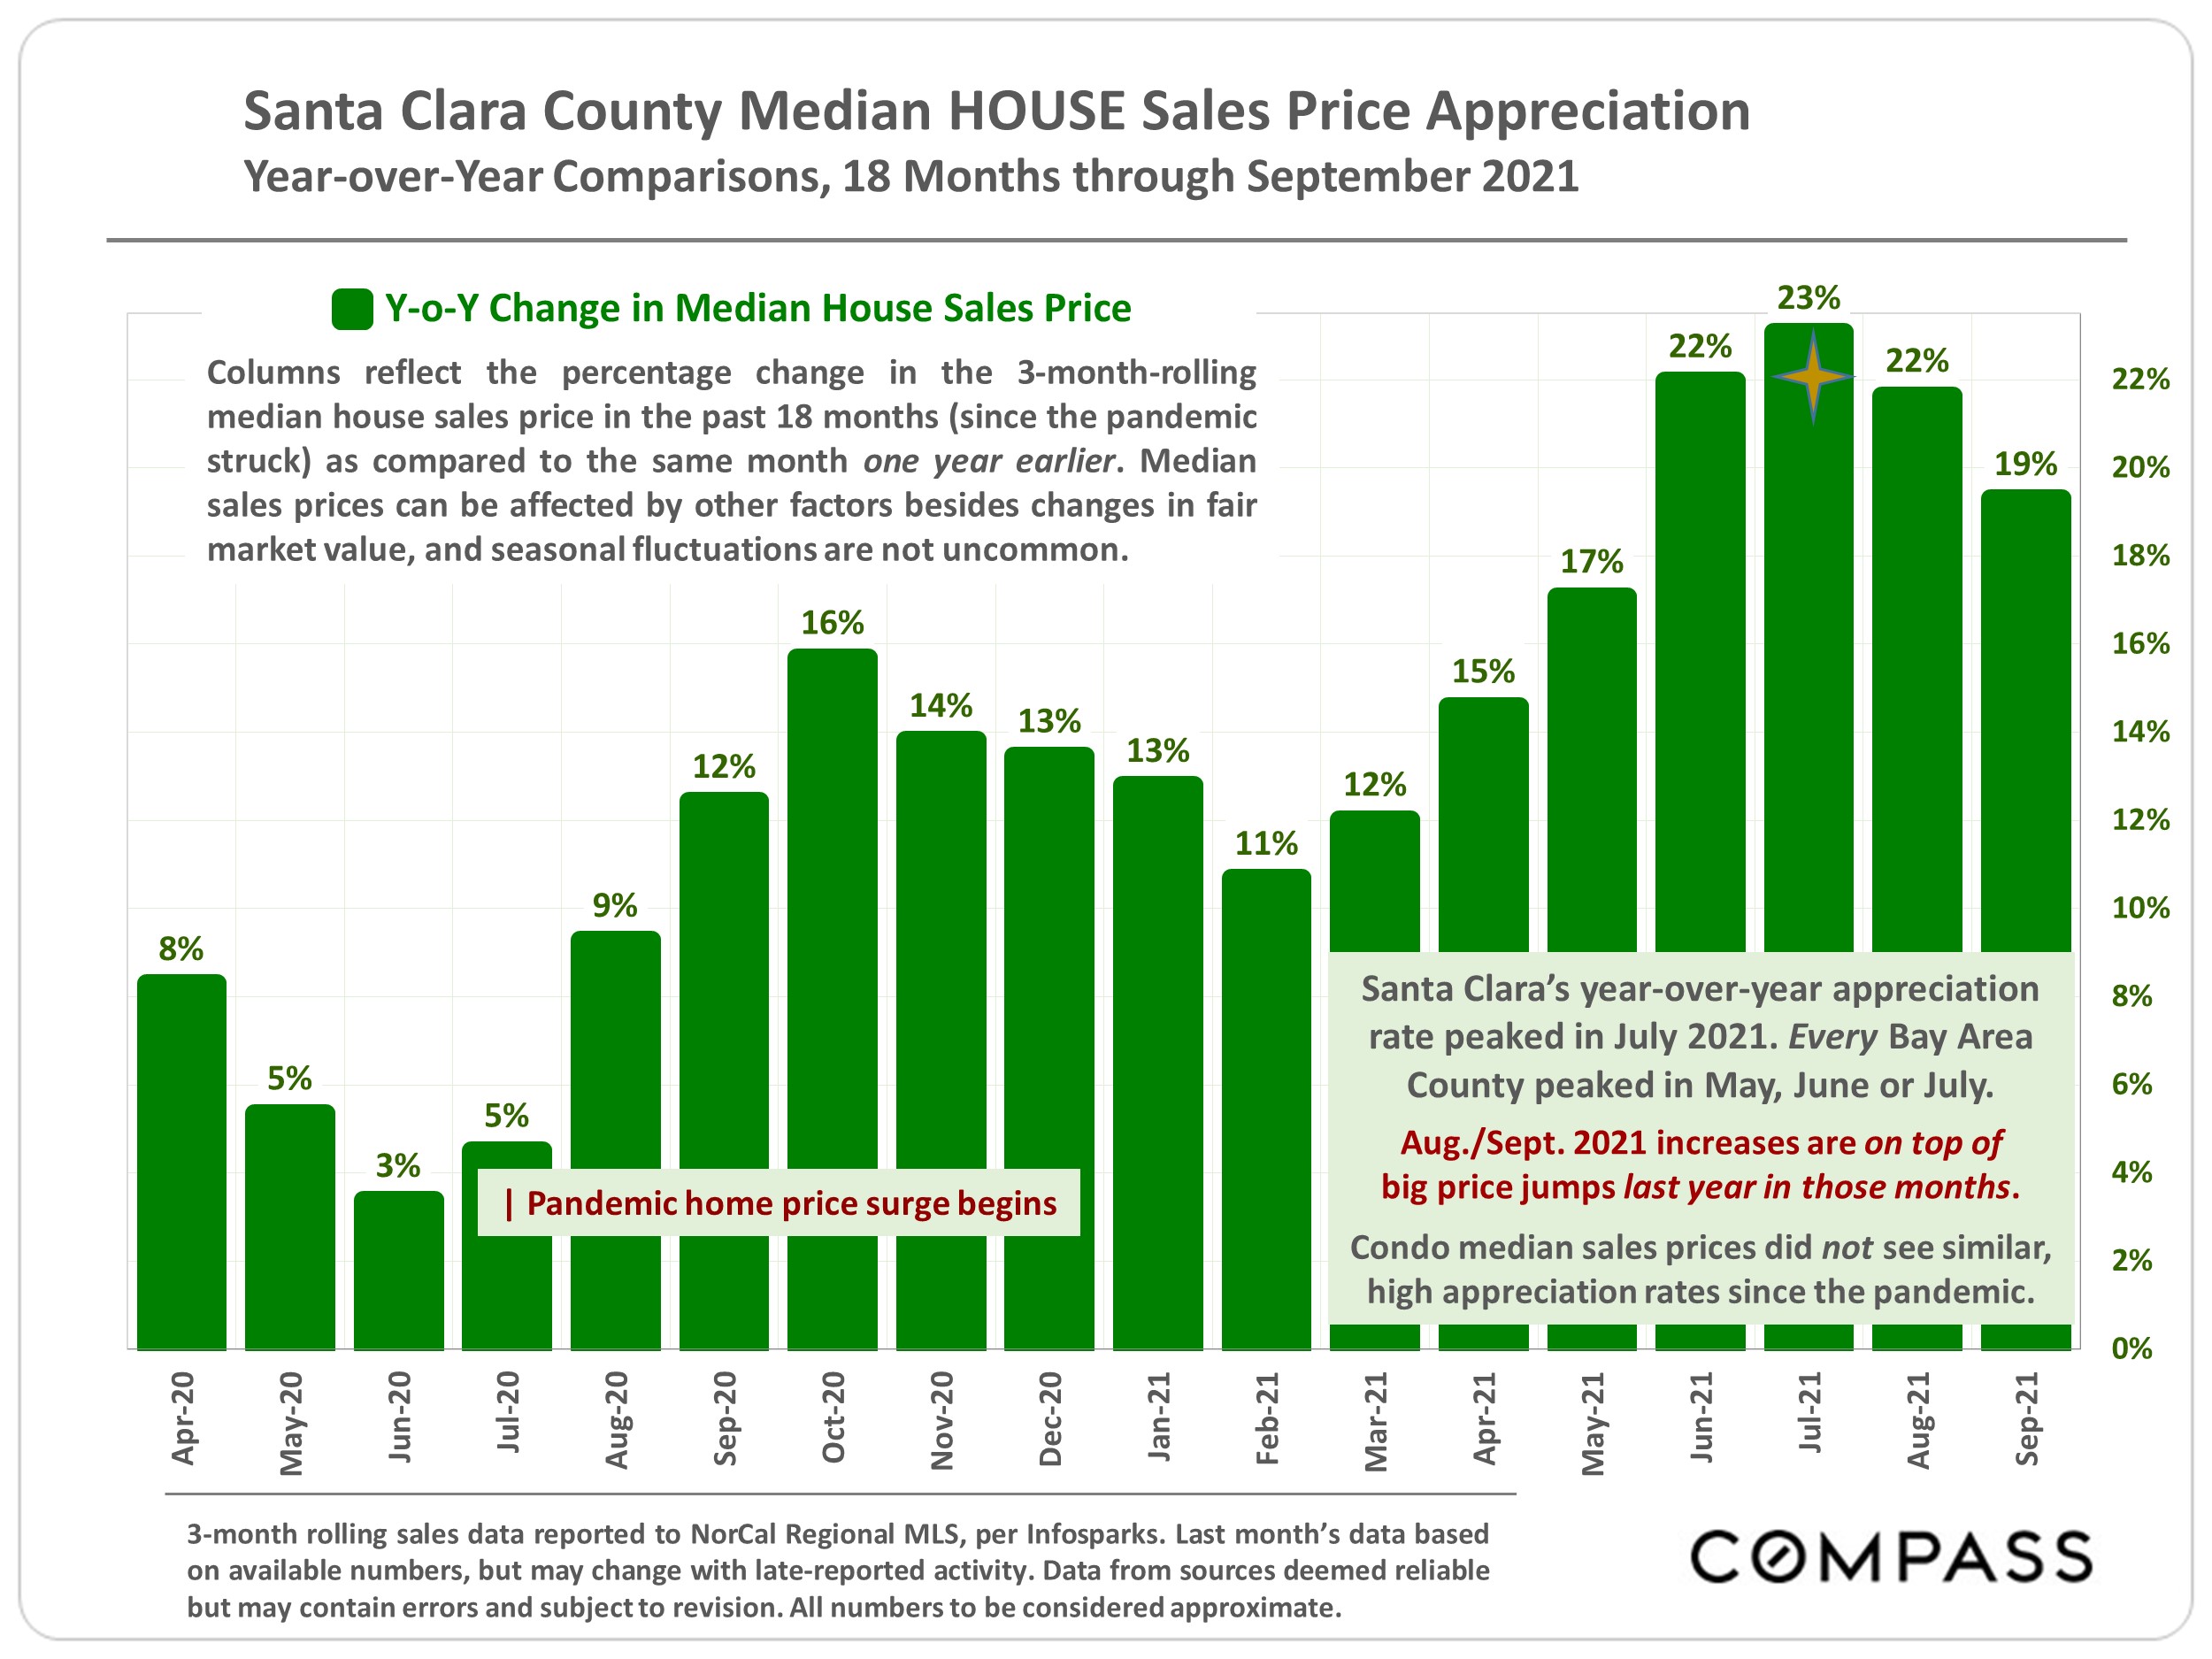
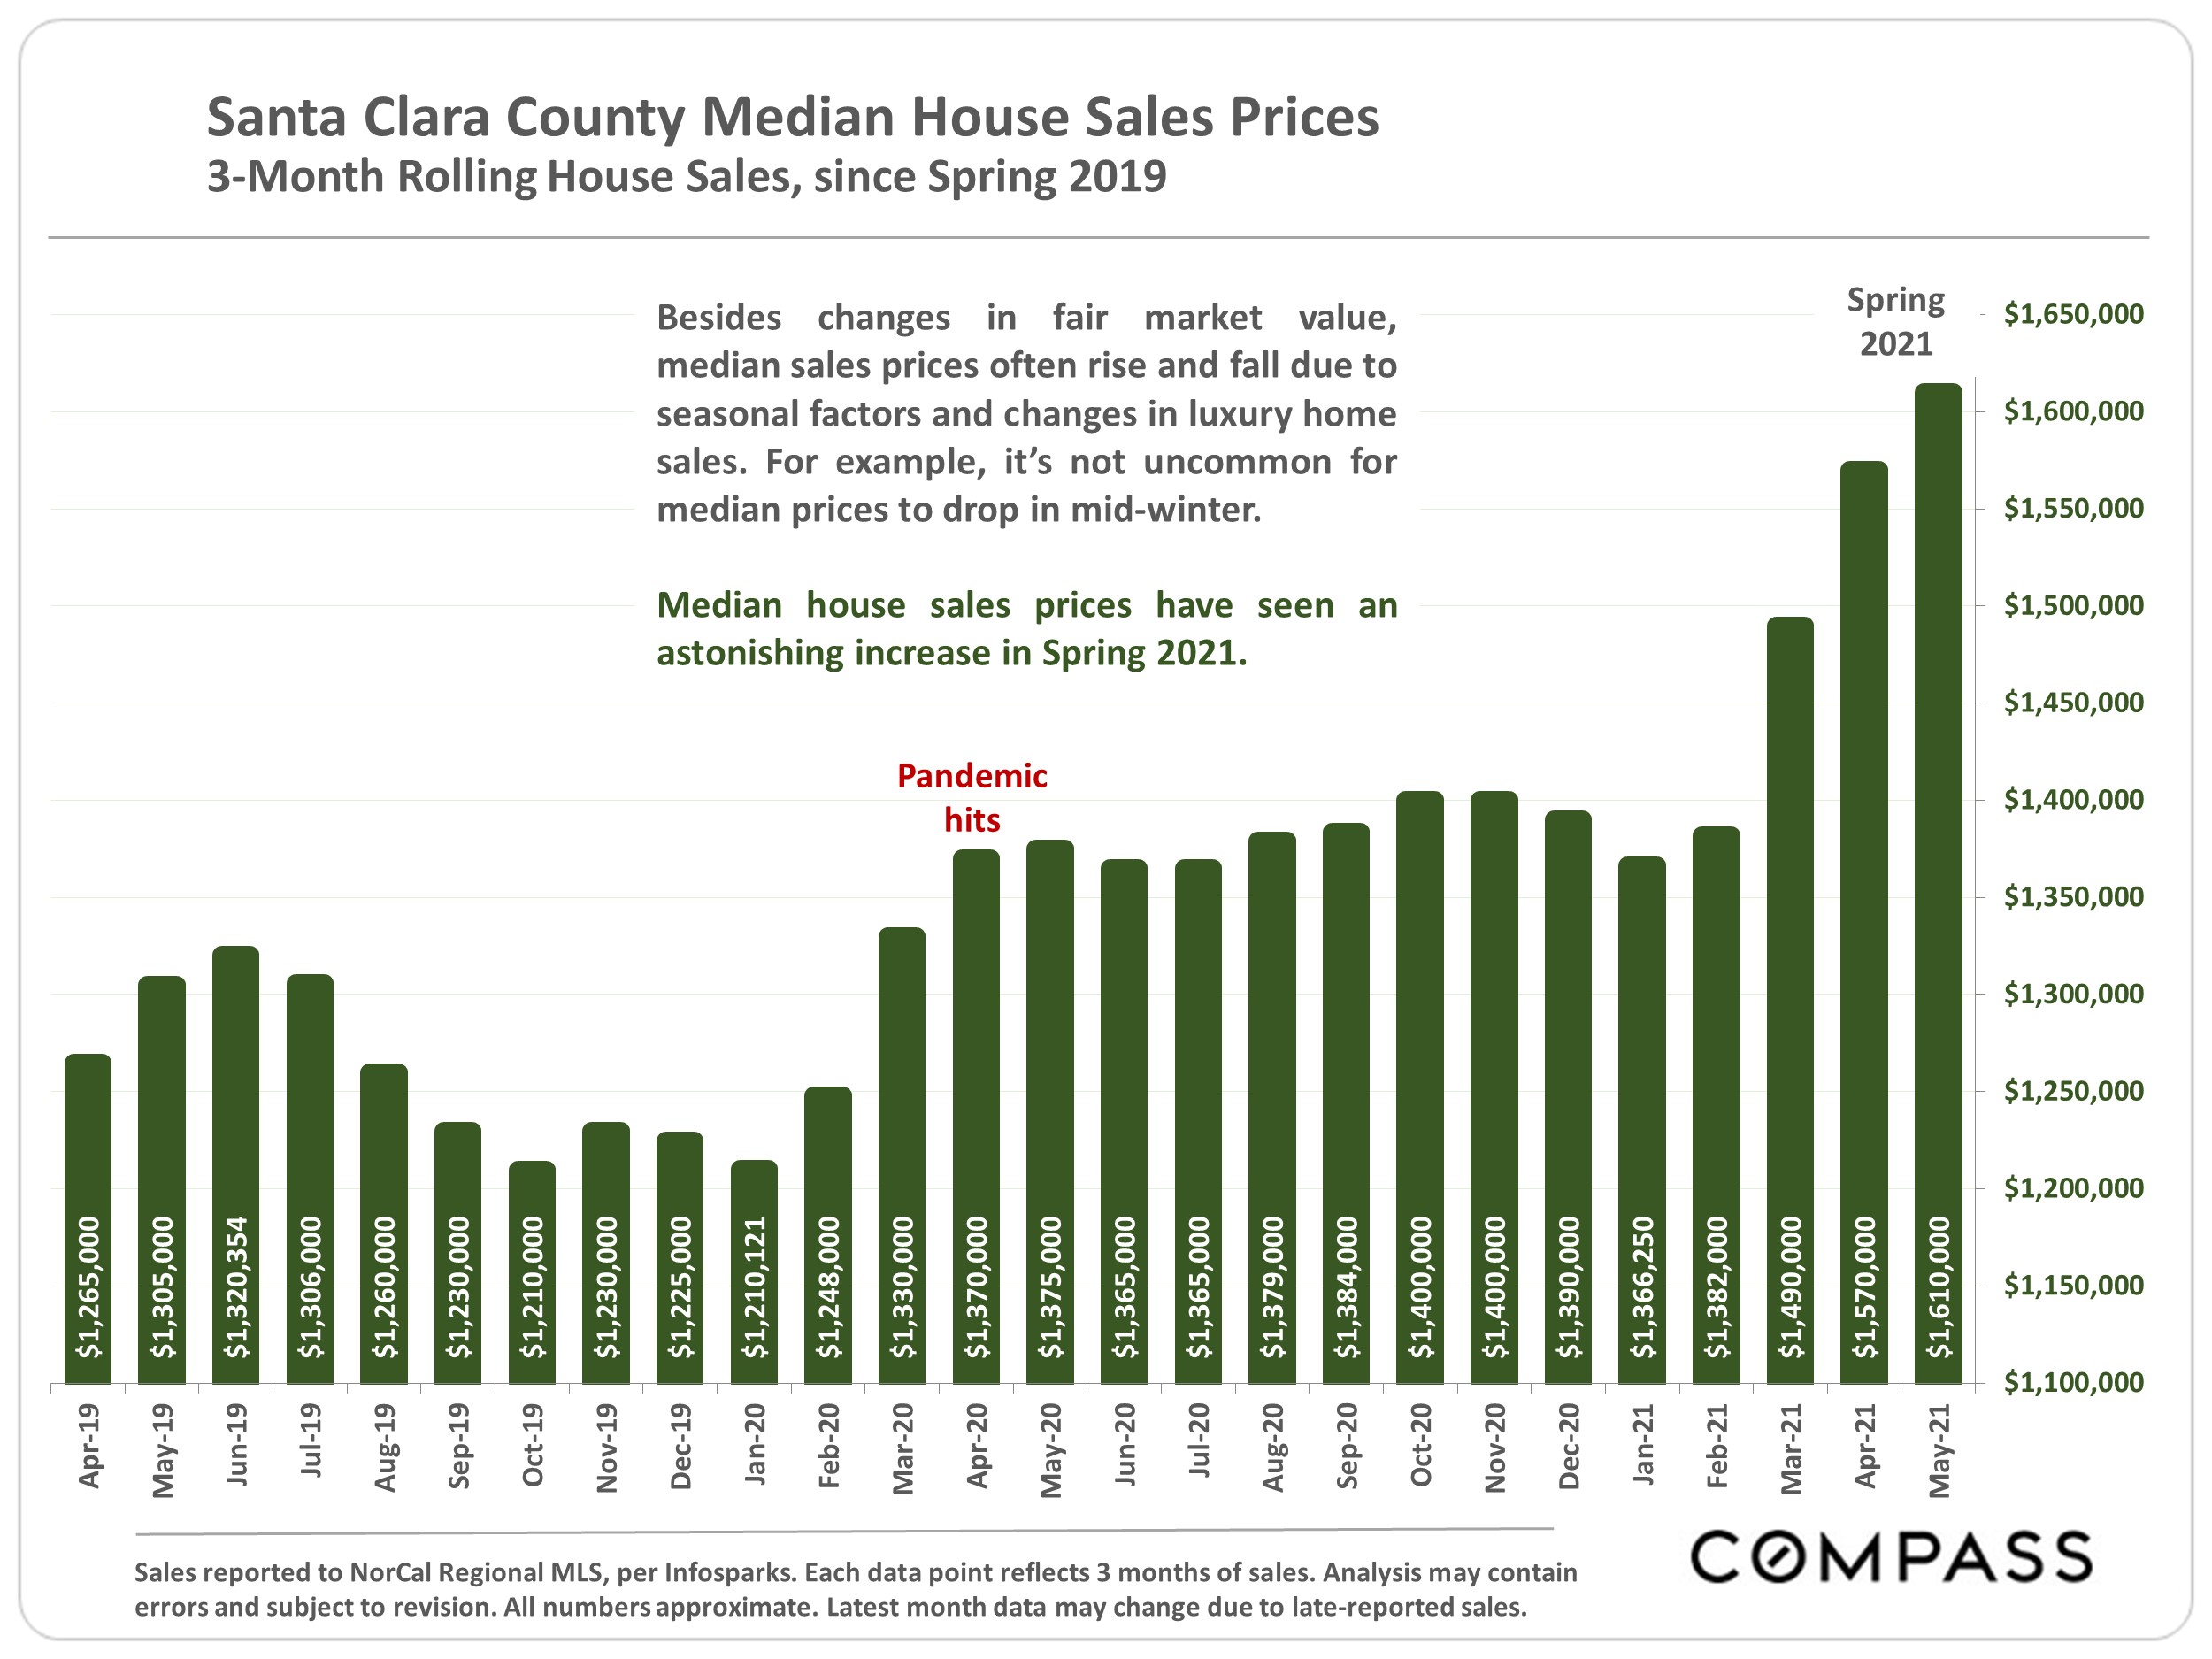
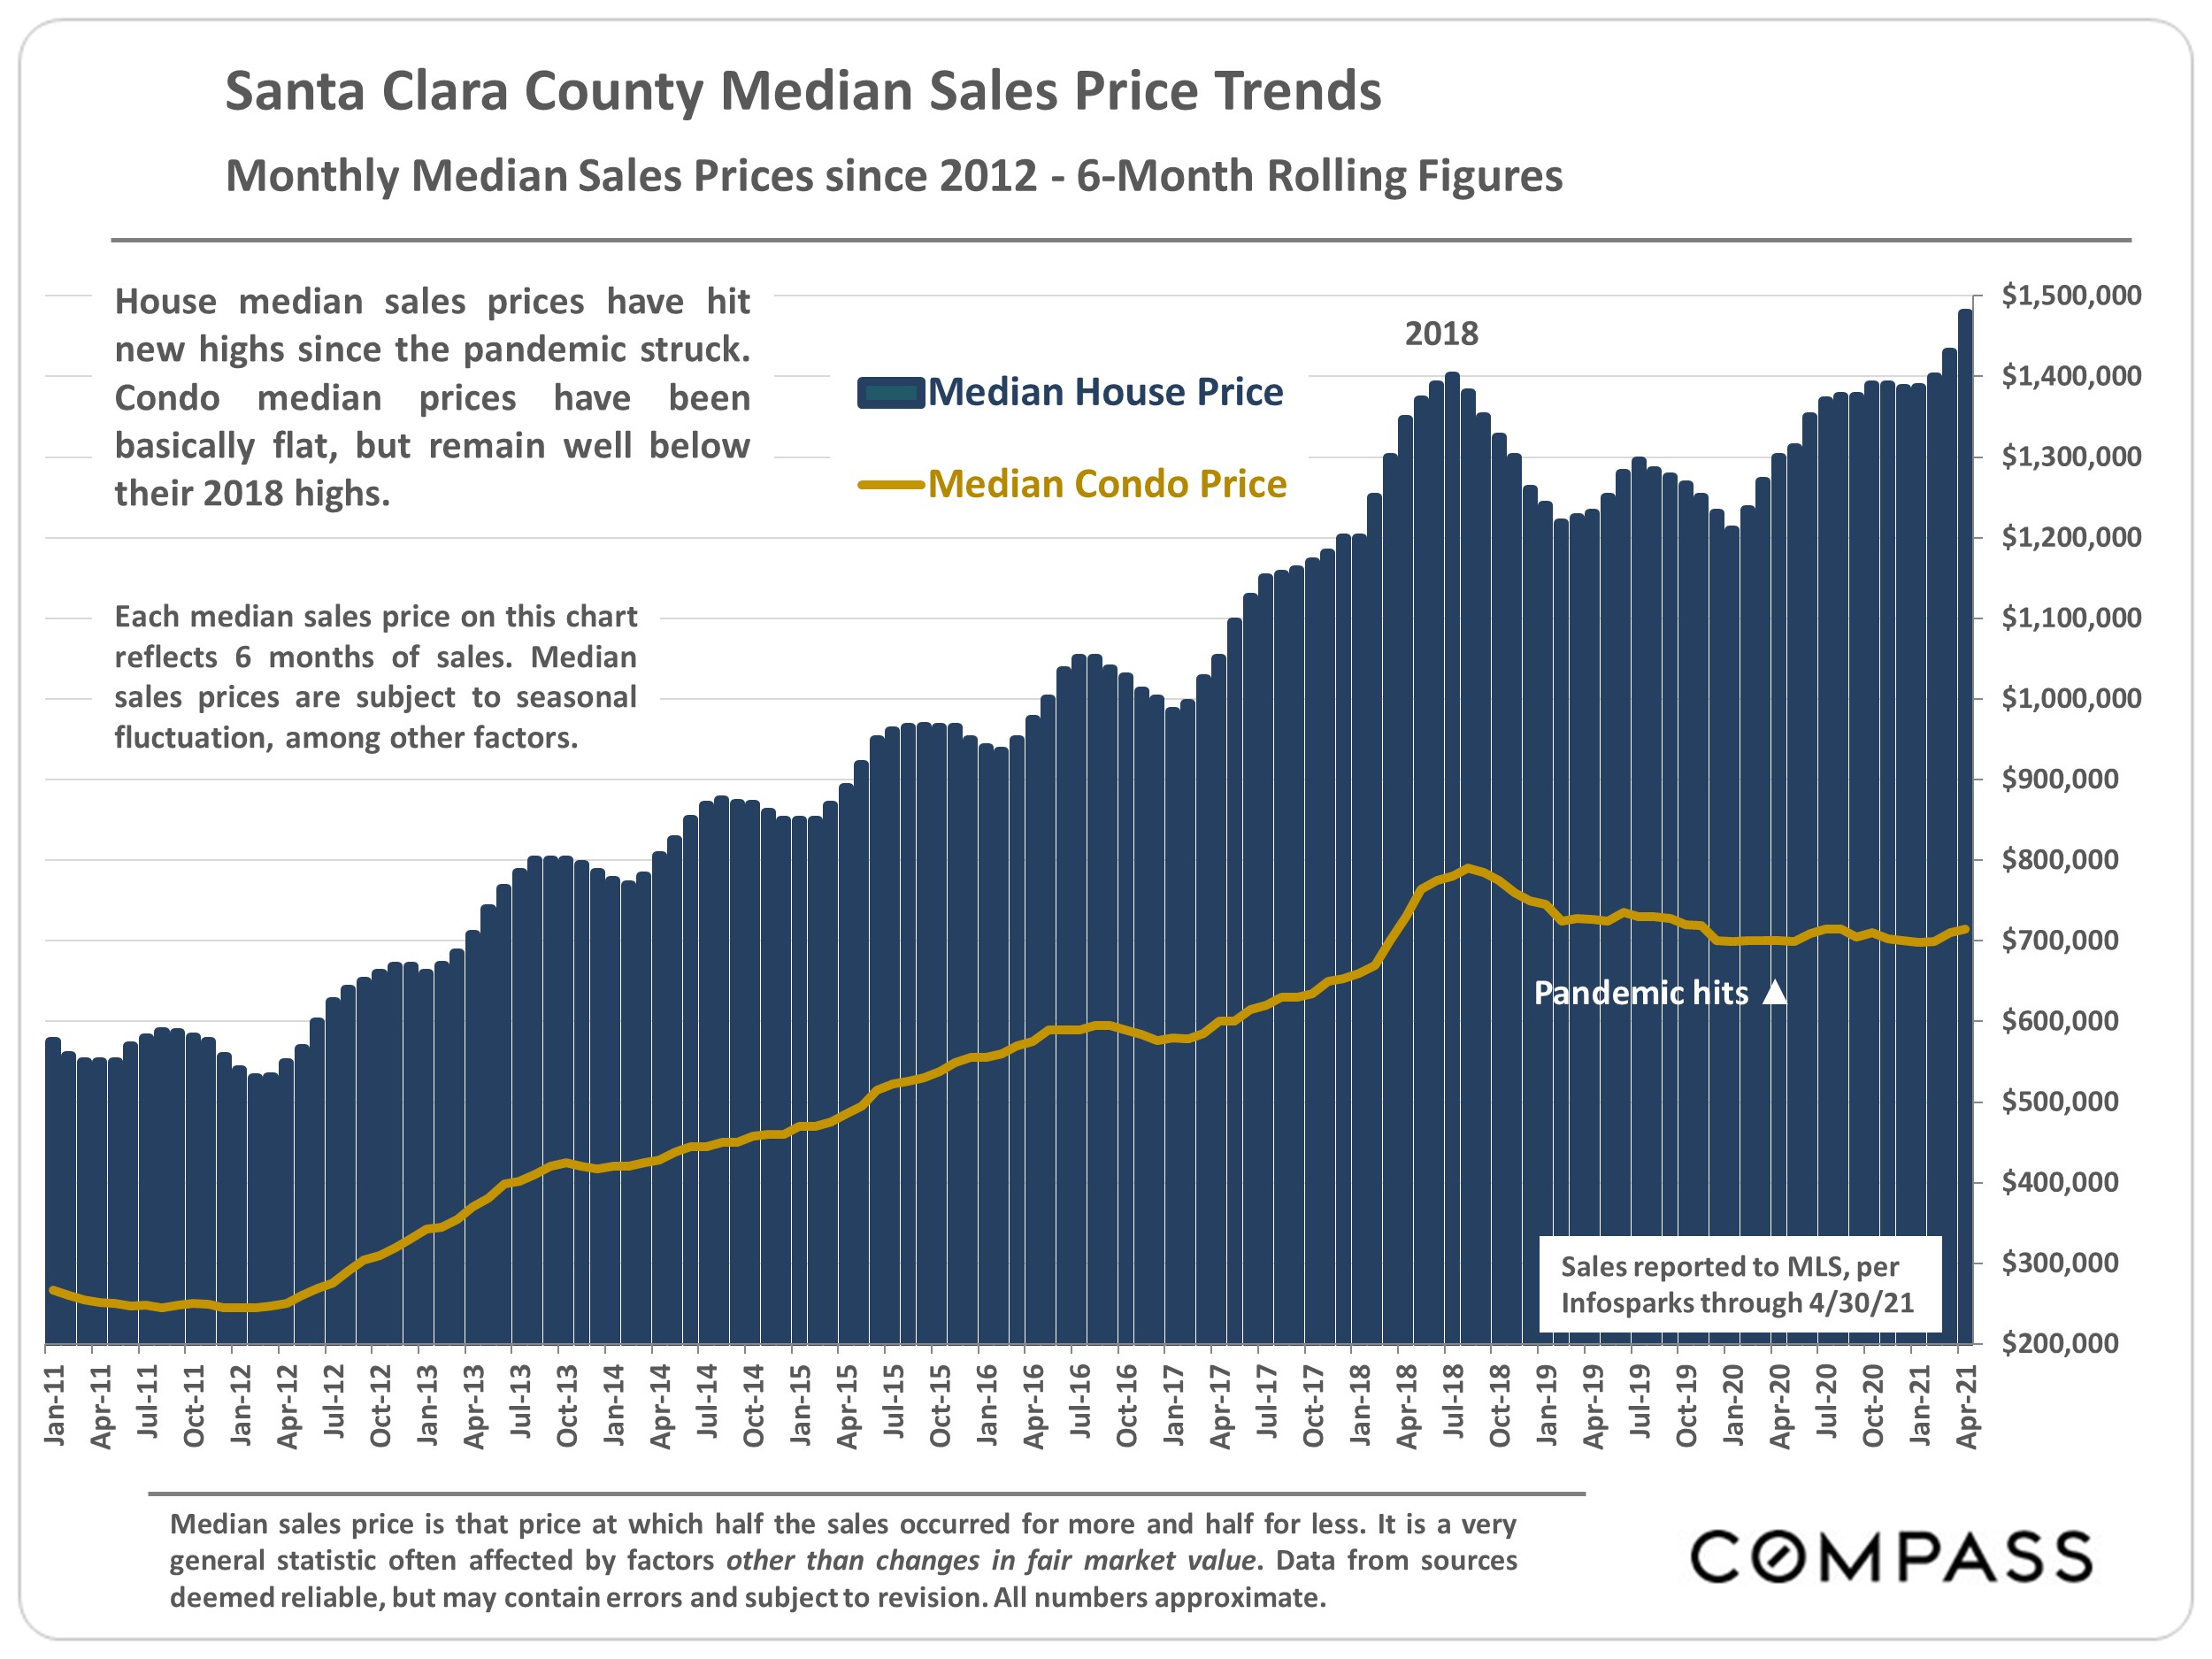
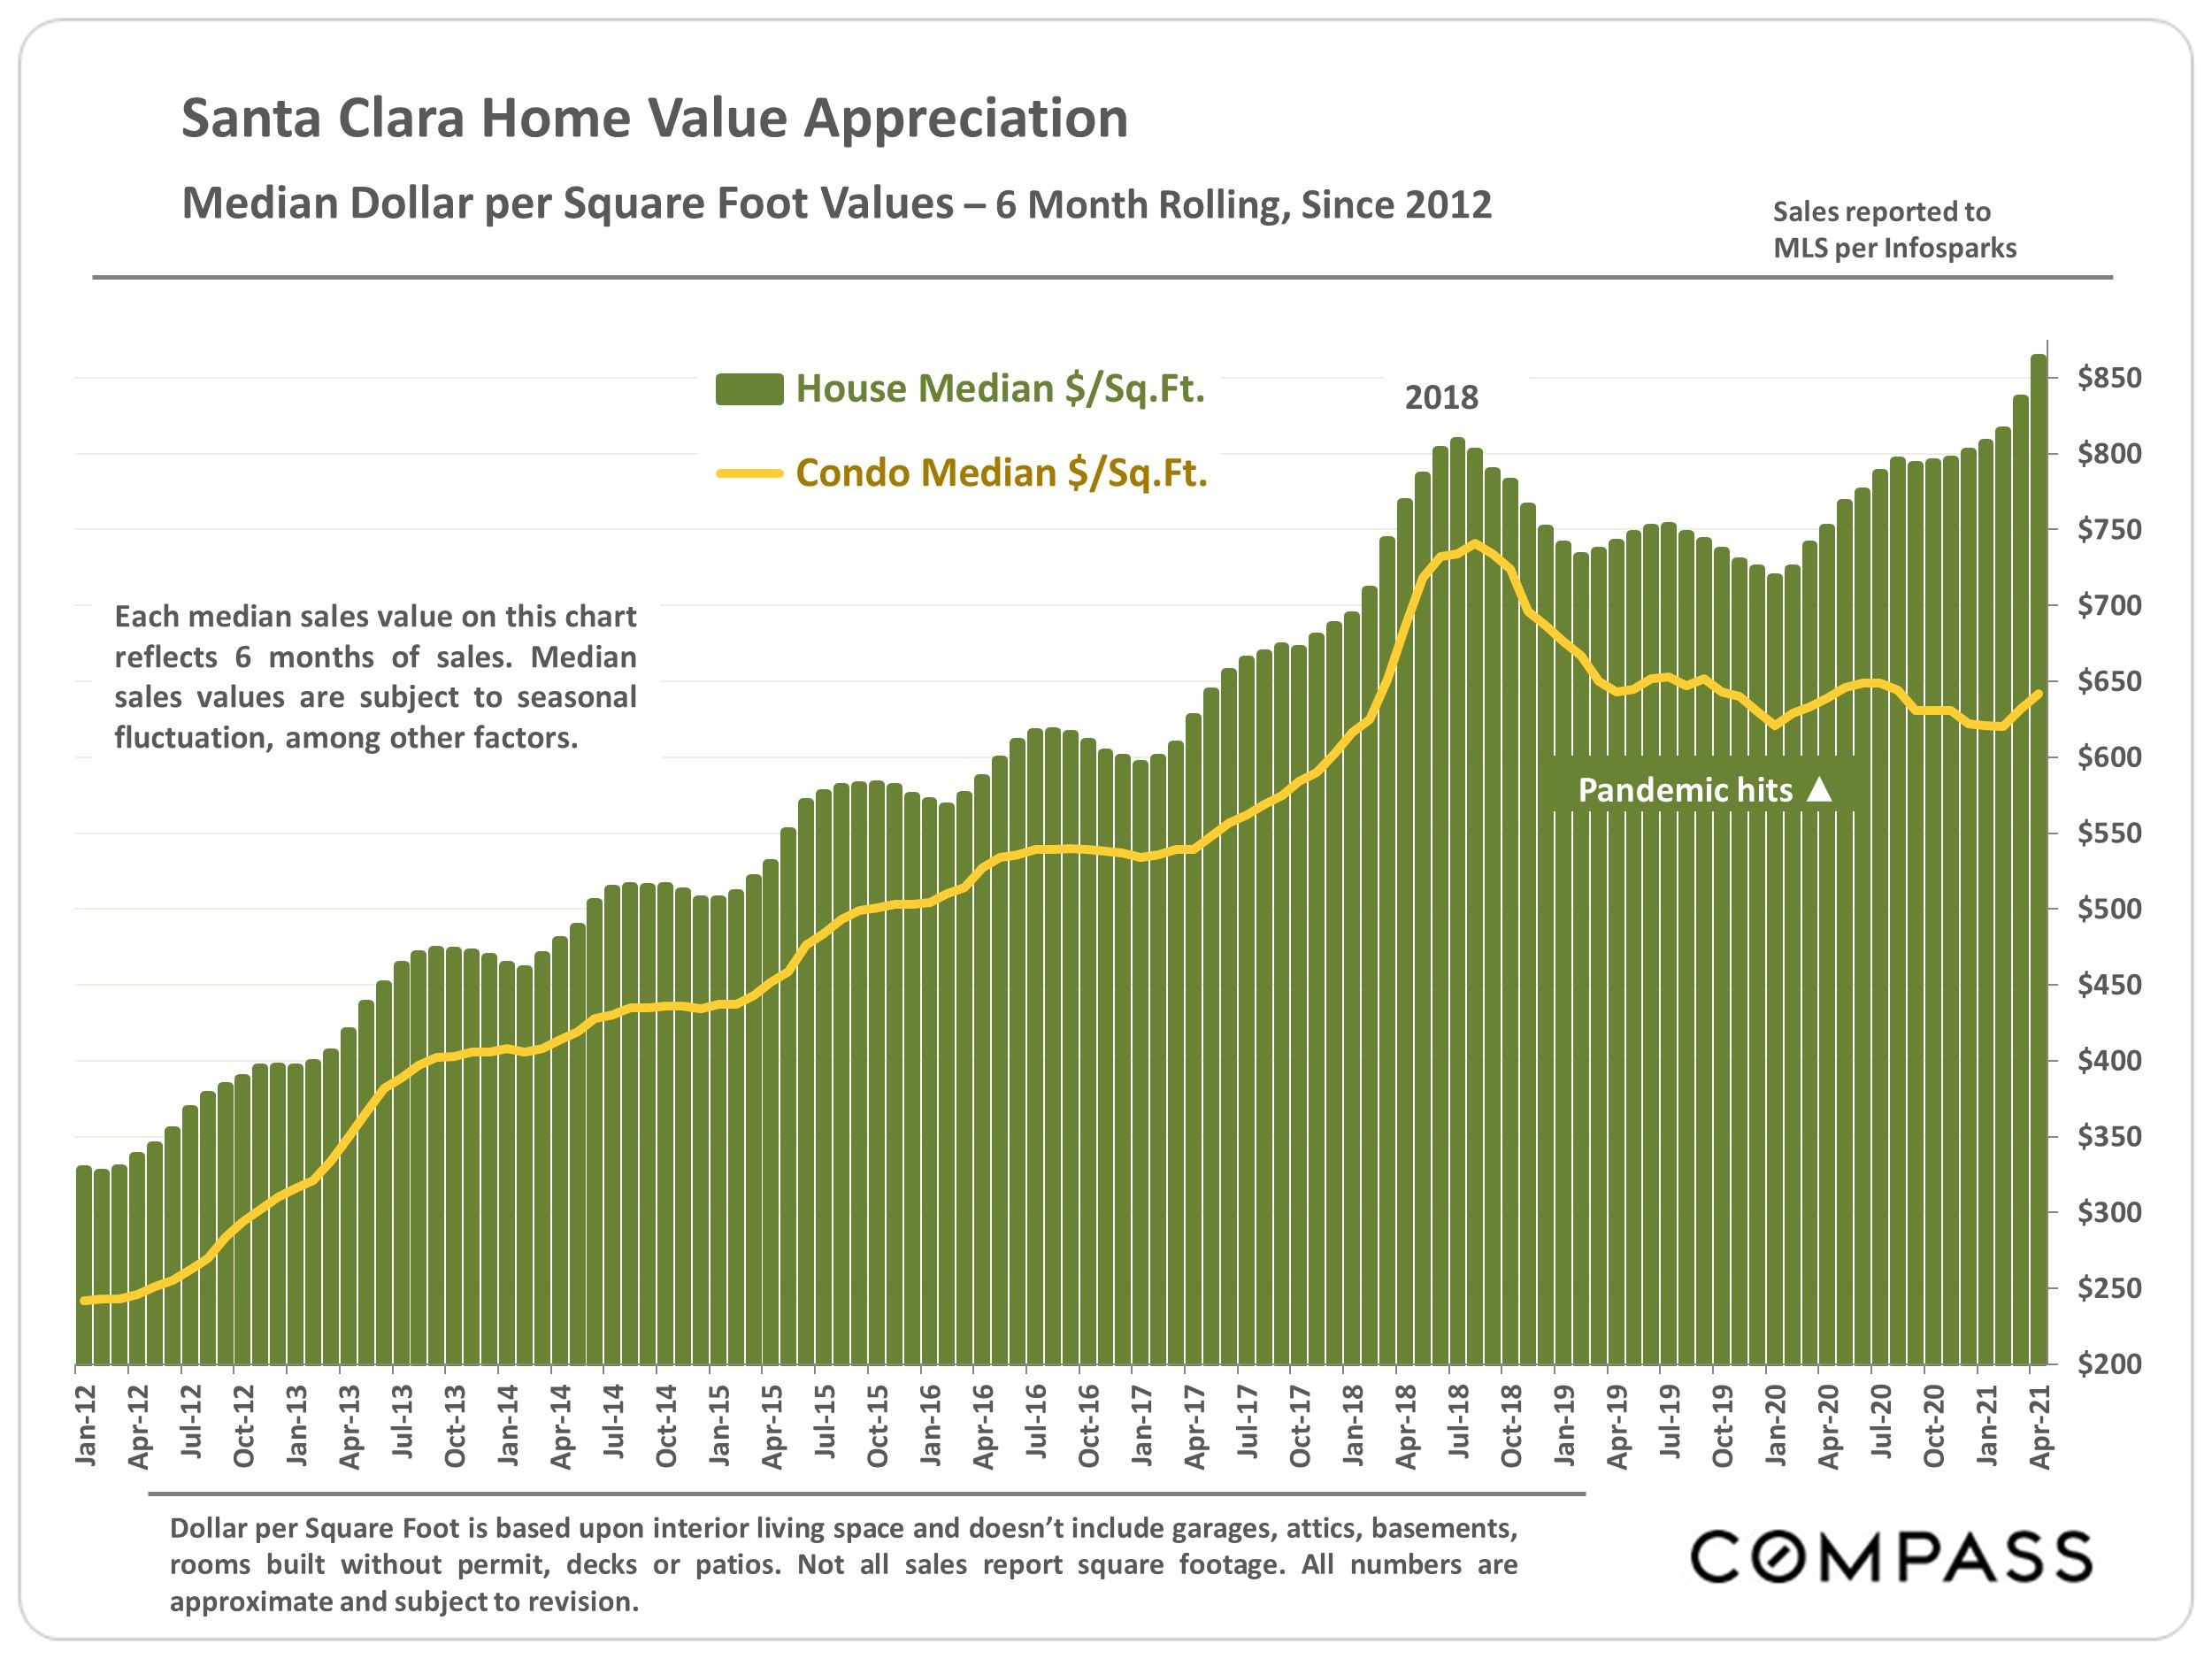
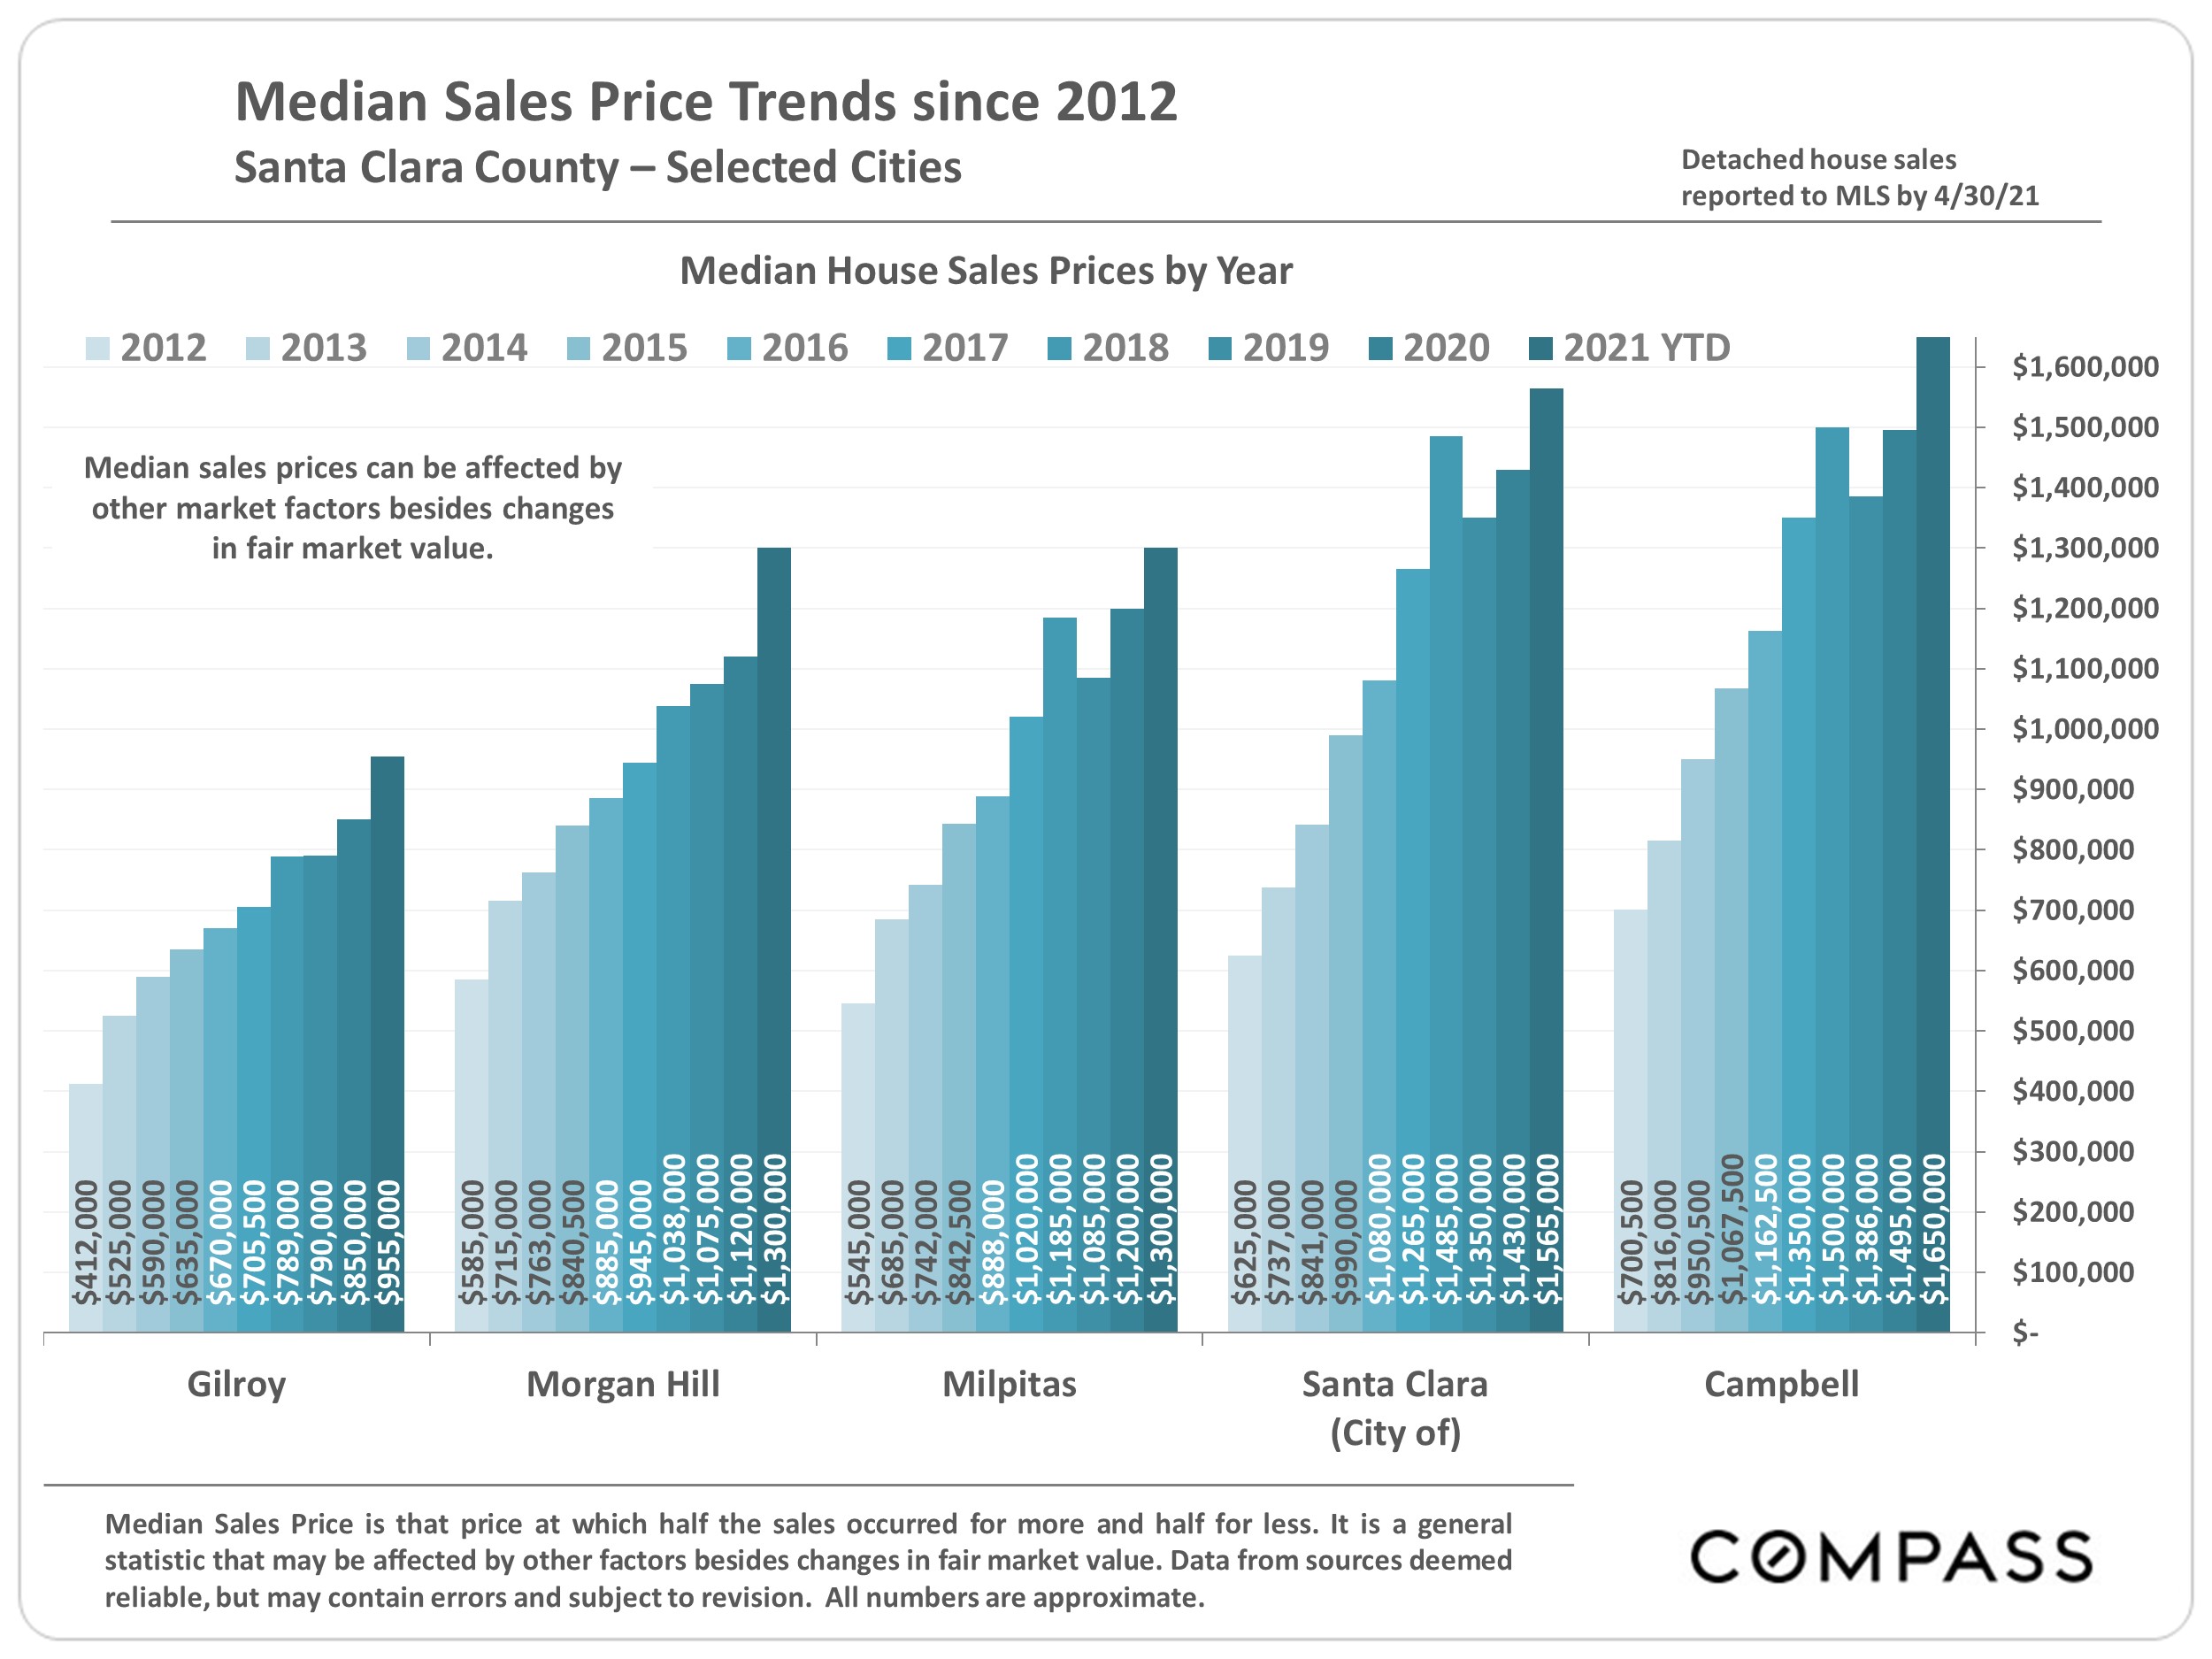
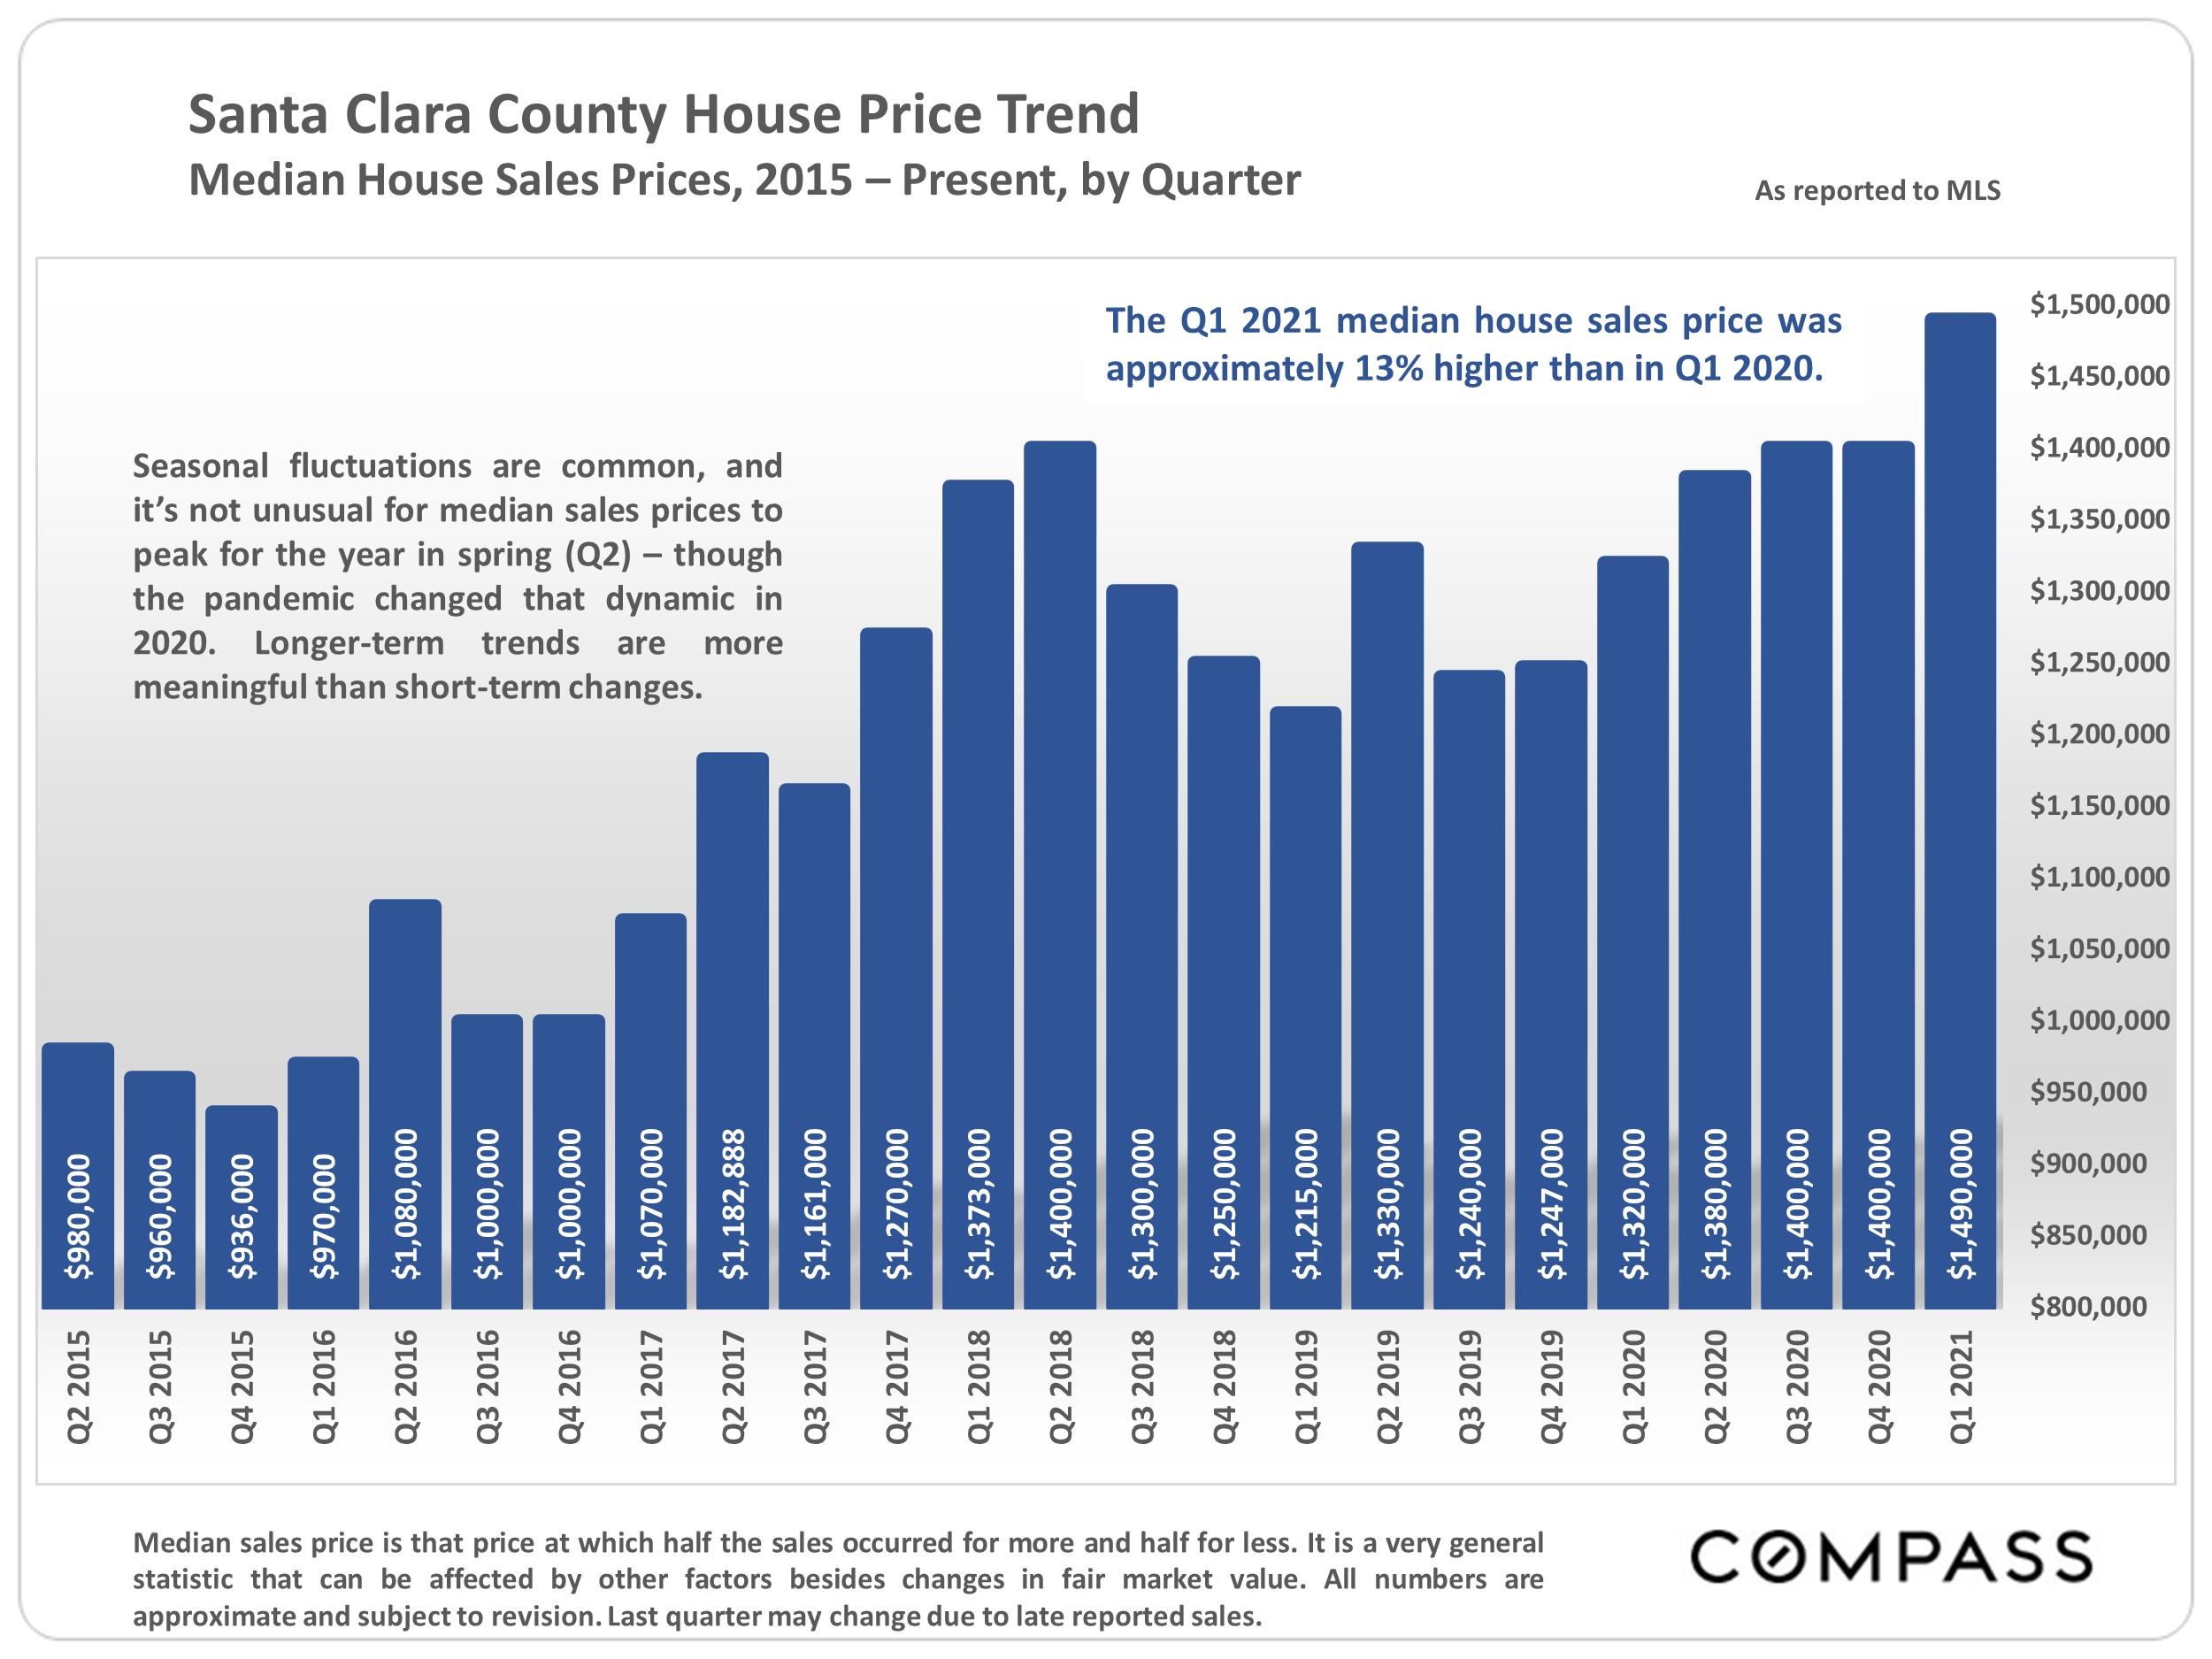
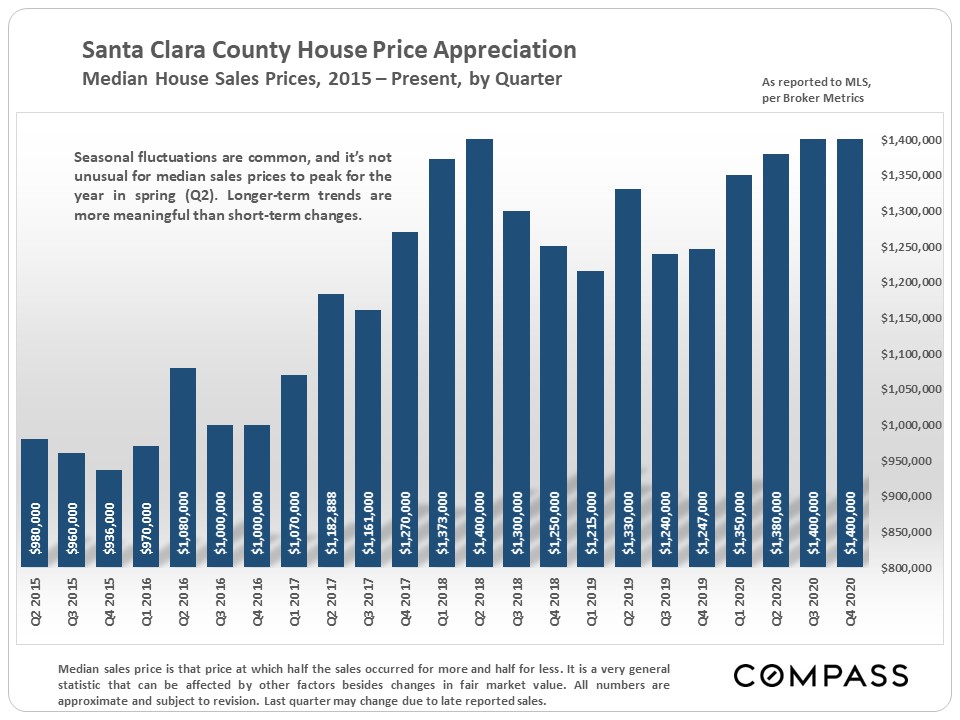
Median house sales price: + 14%, $1,528,000 in 2021 YTD
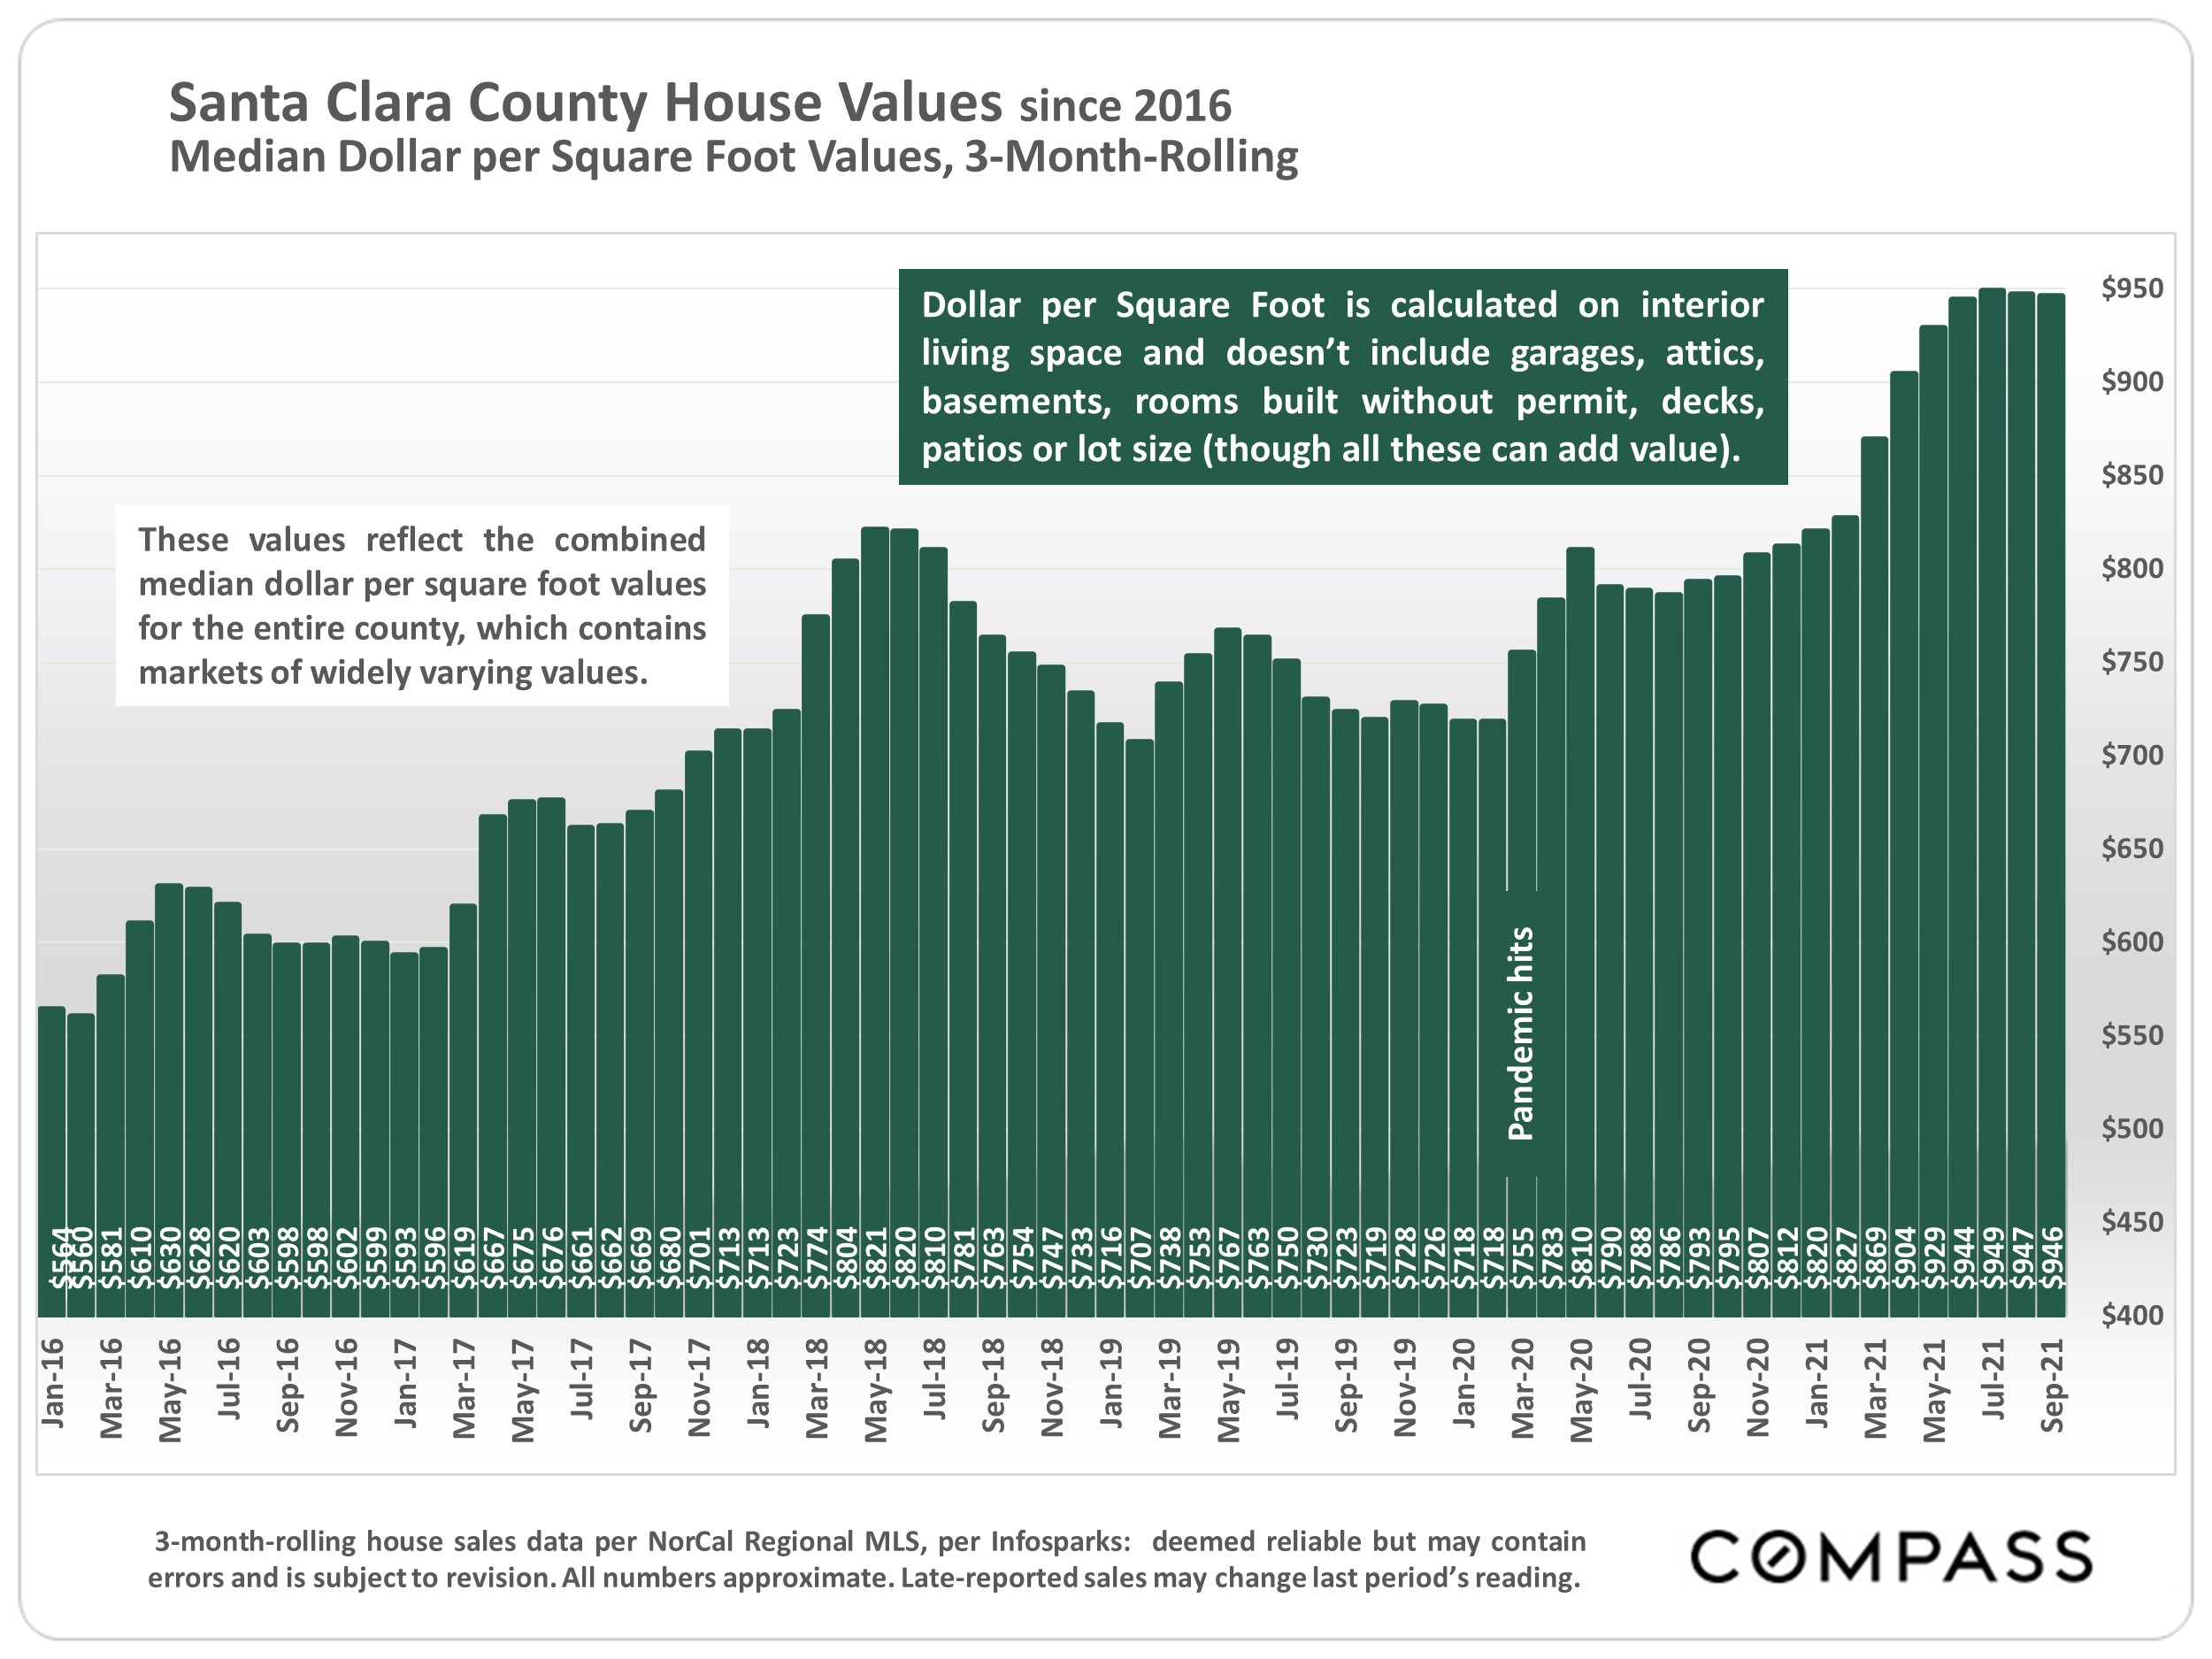
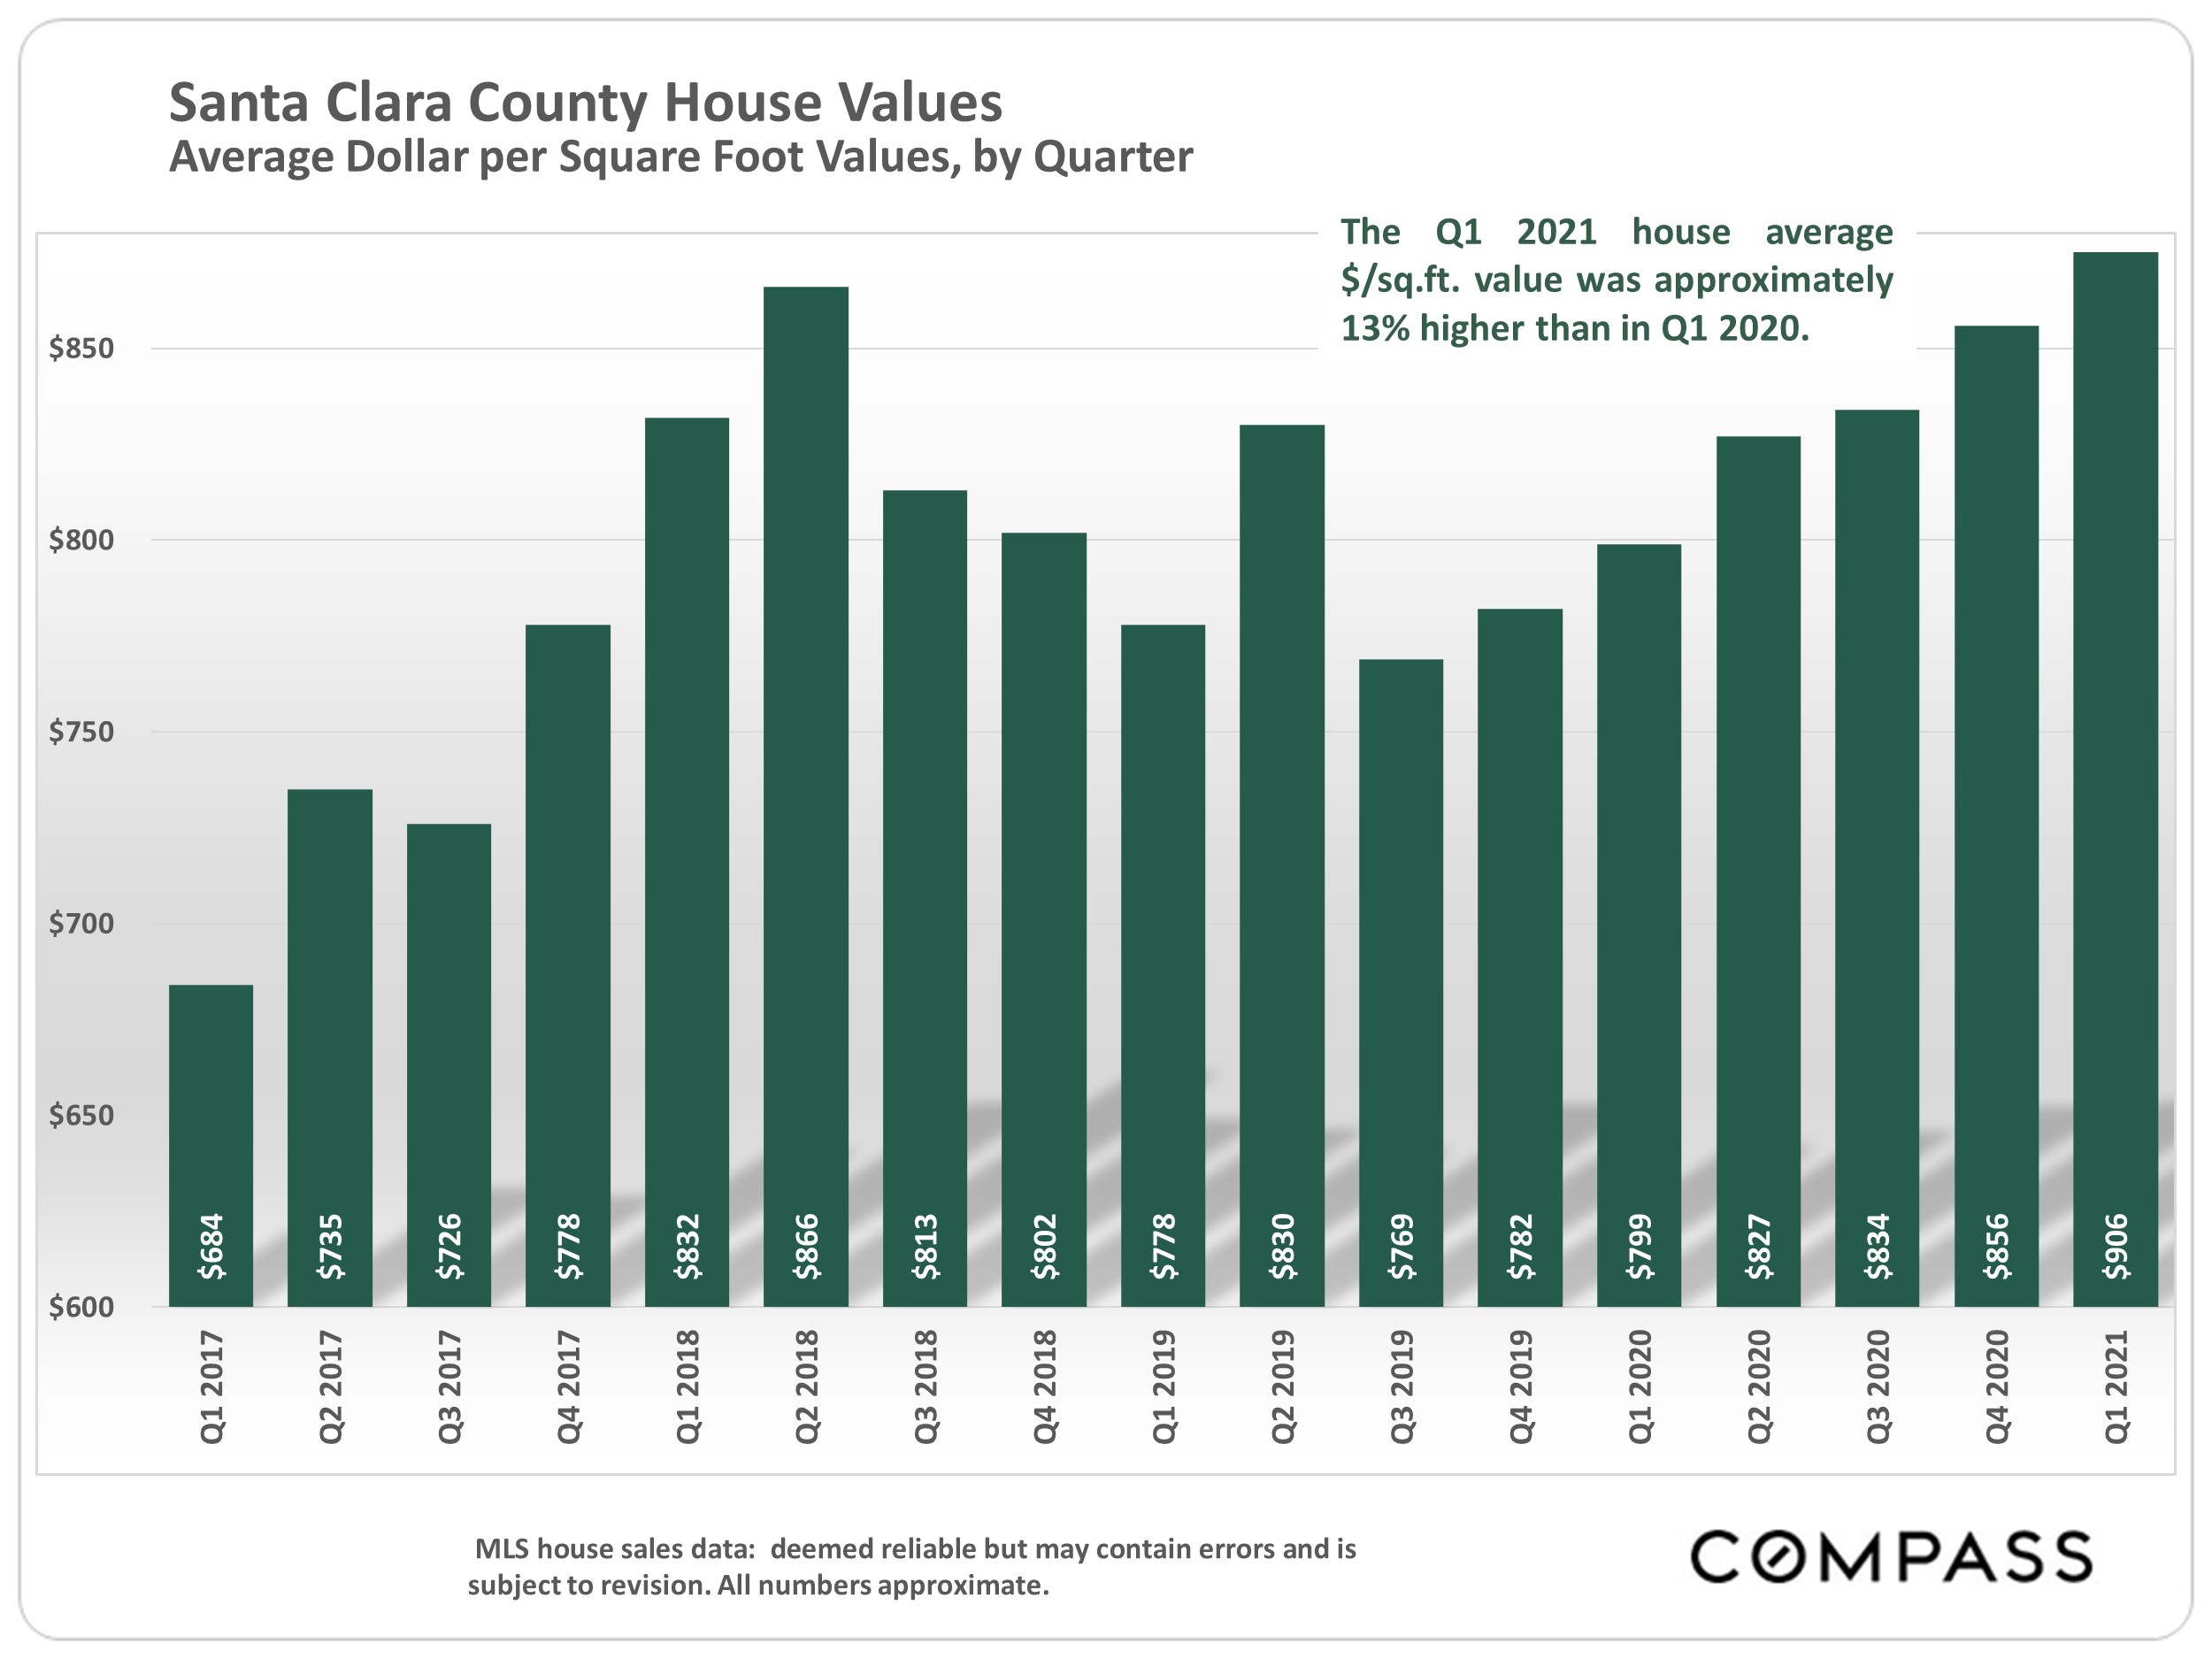
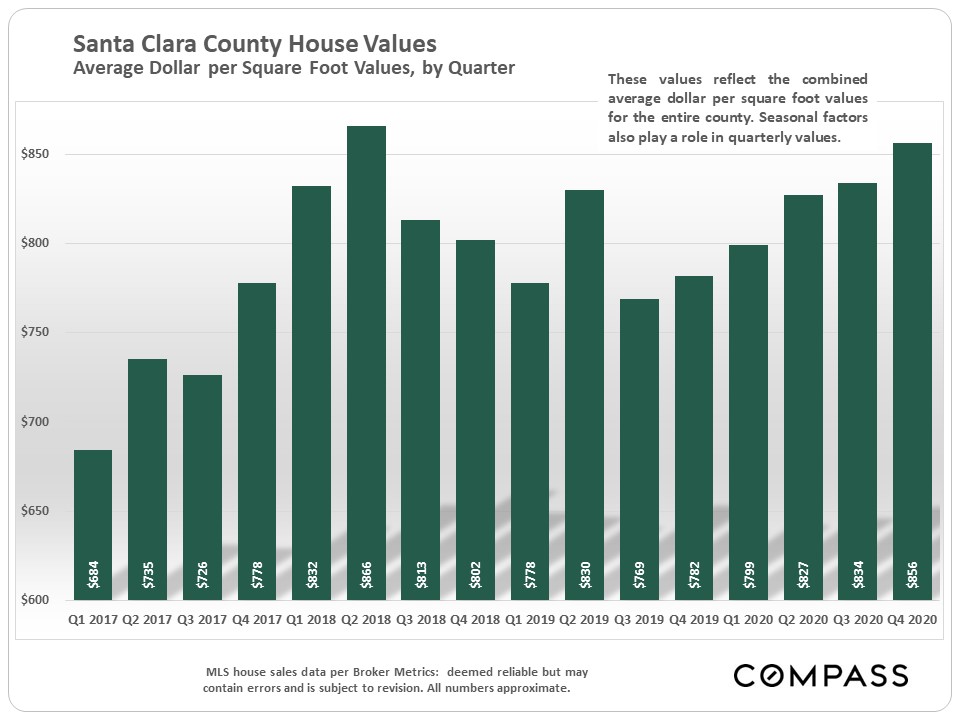
Median house $/sq.ft. value + 15%
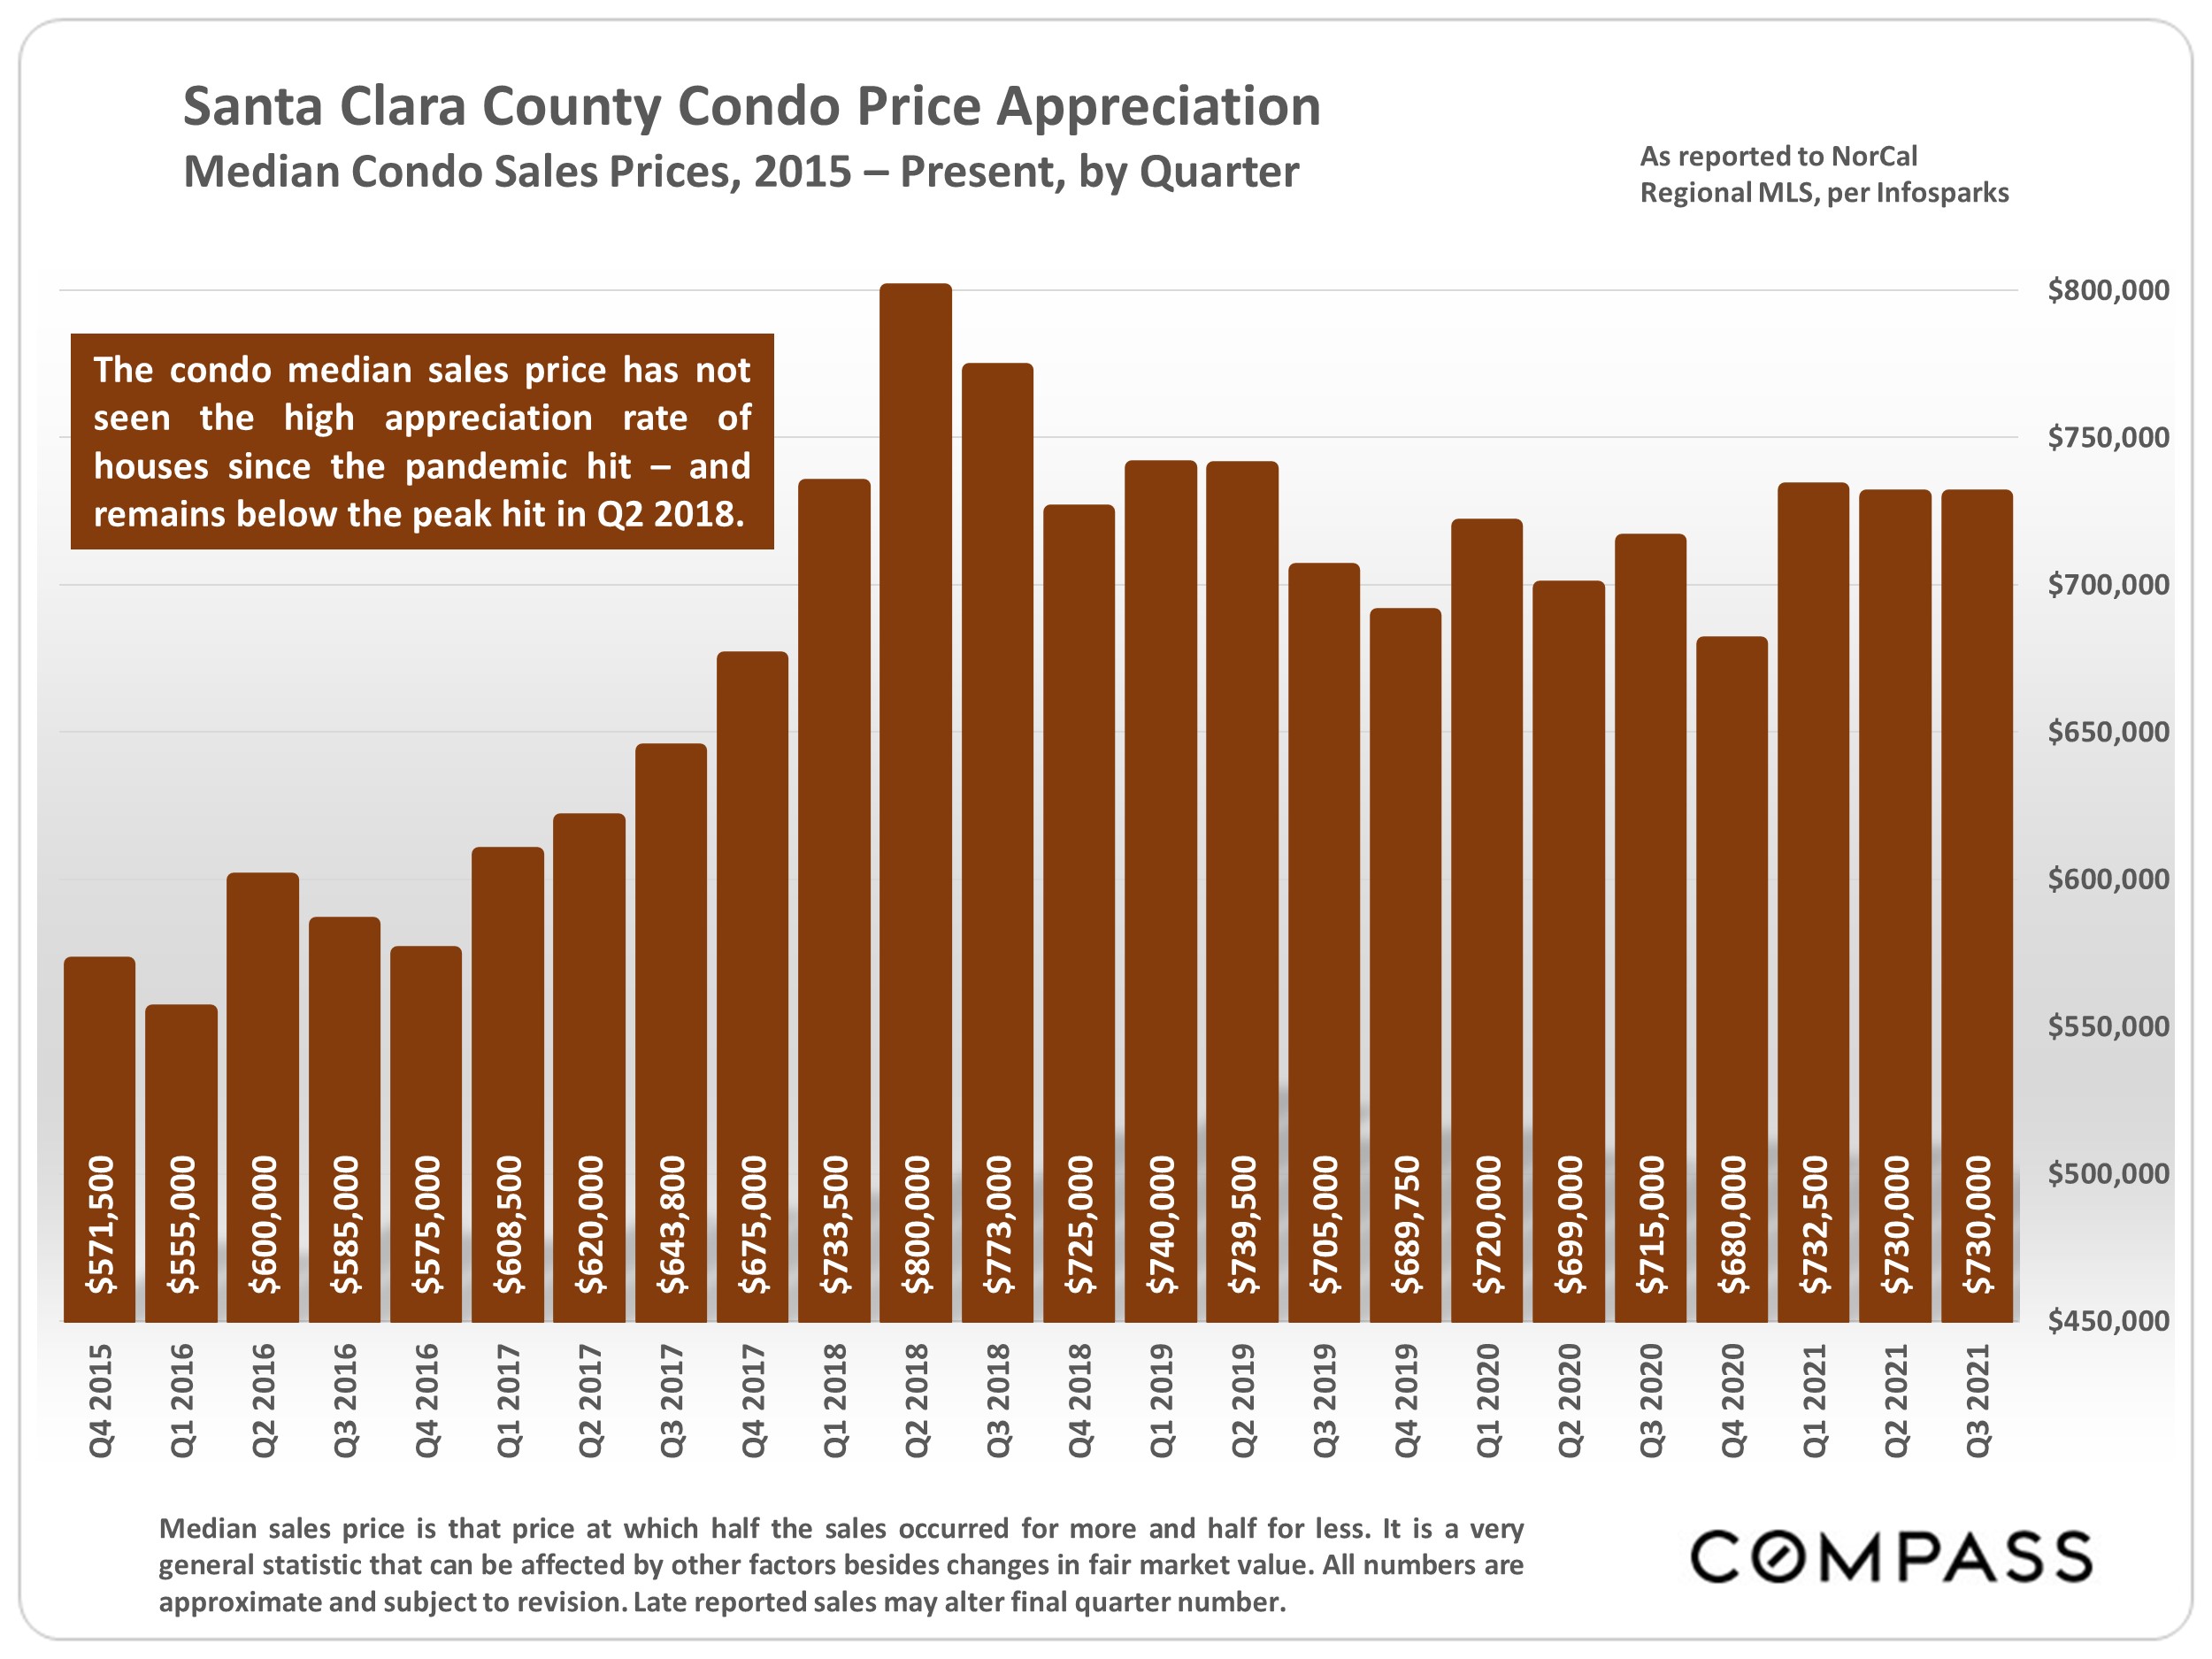
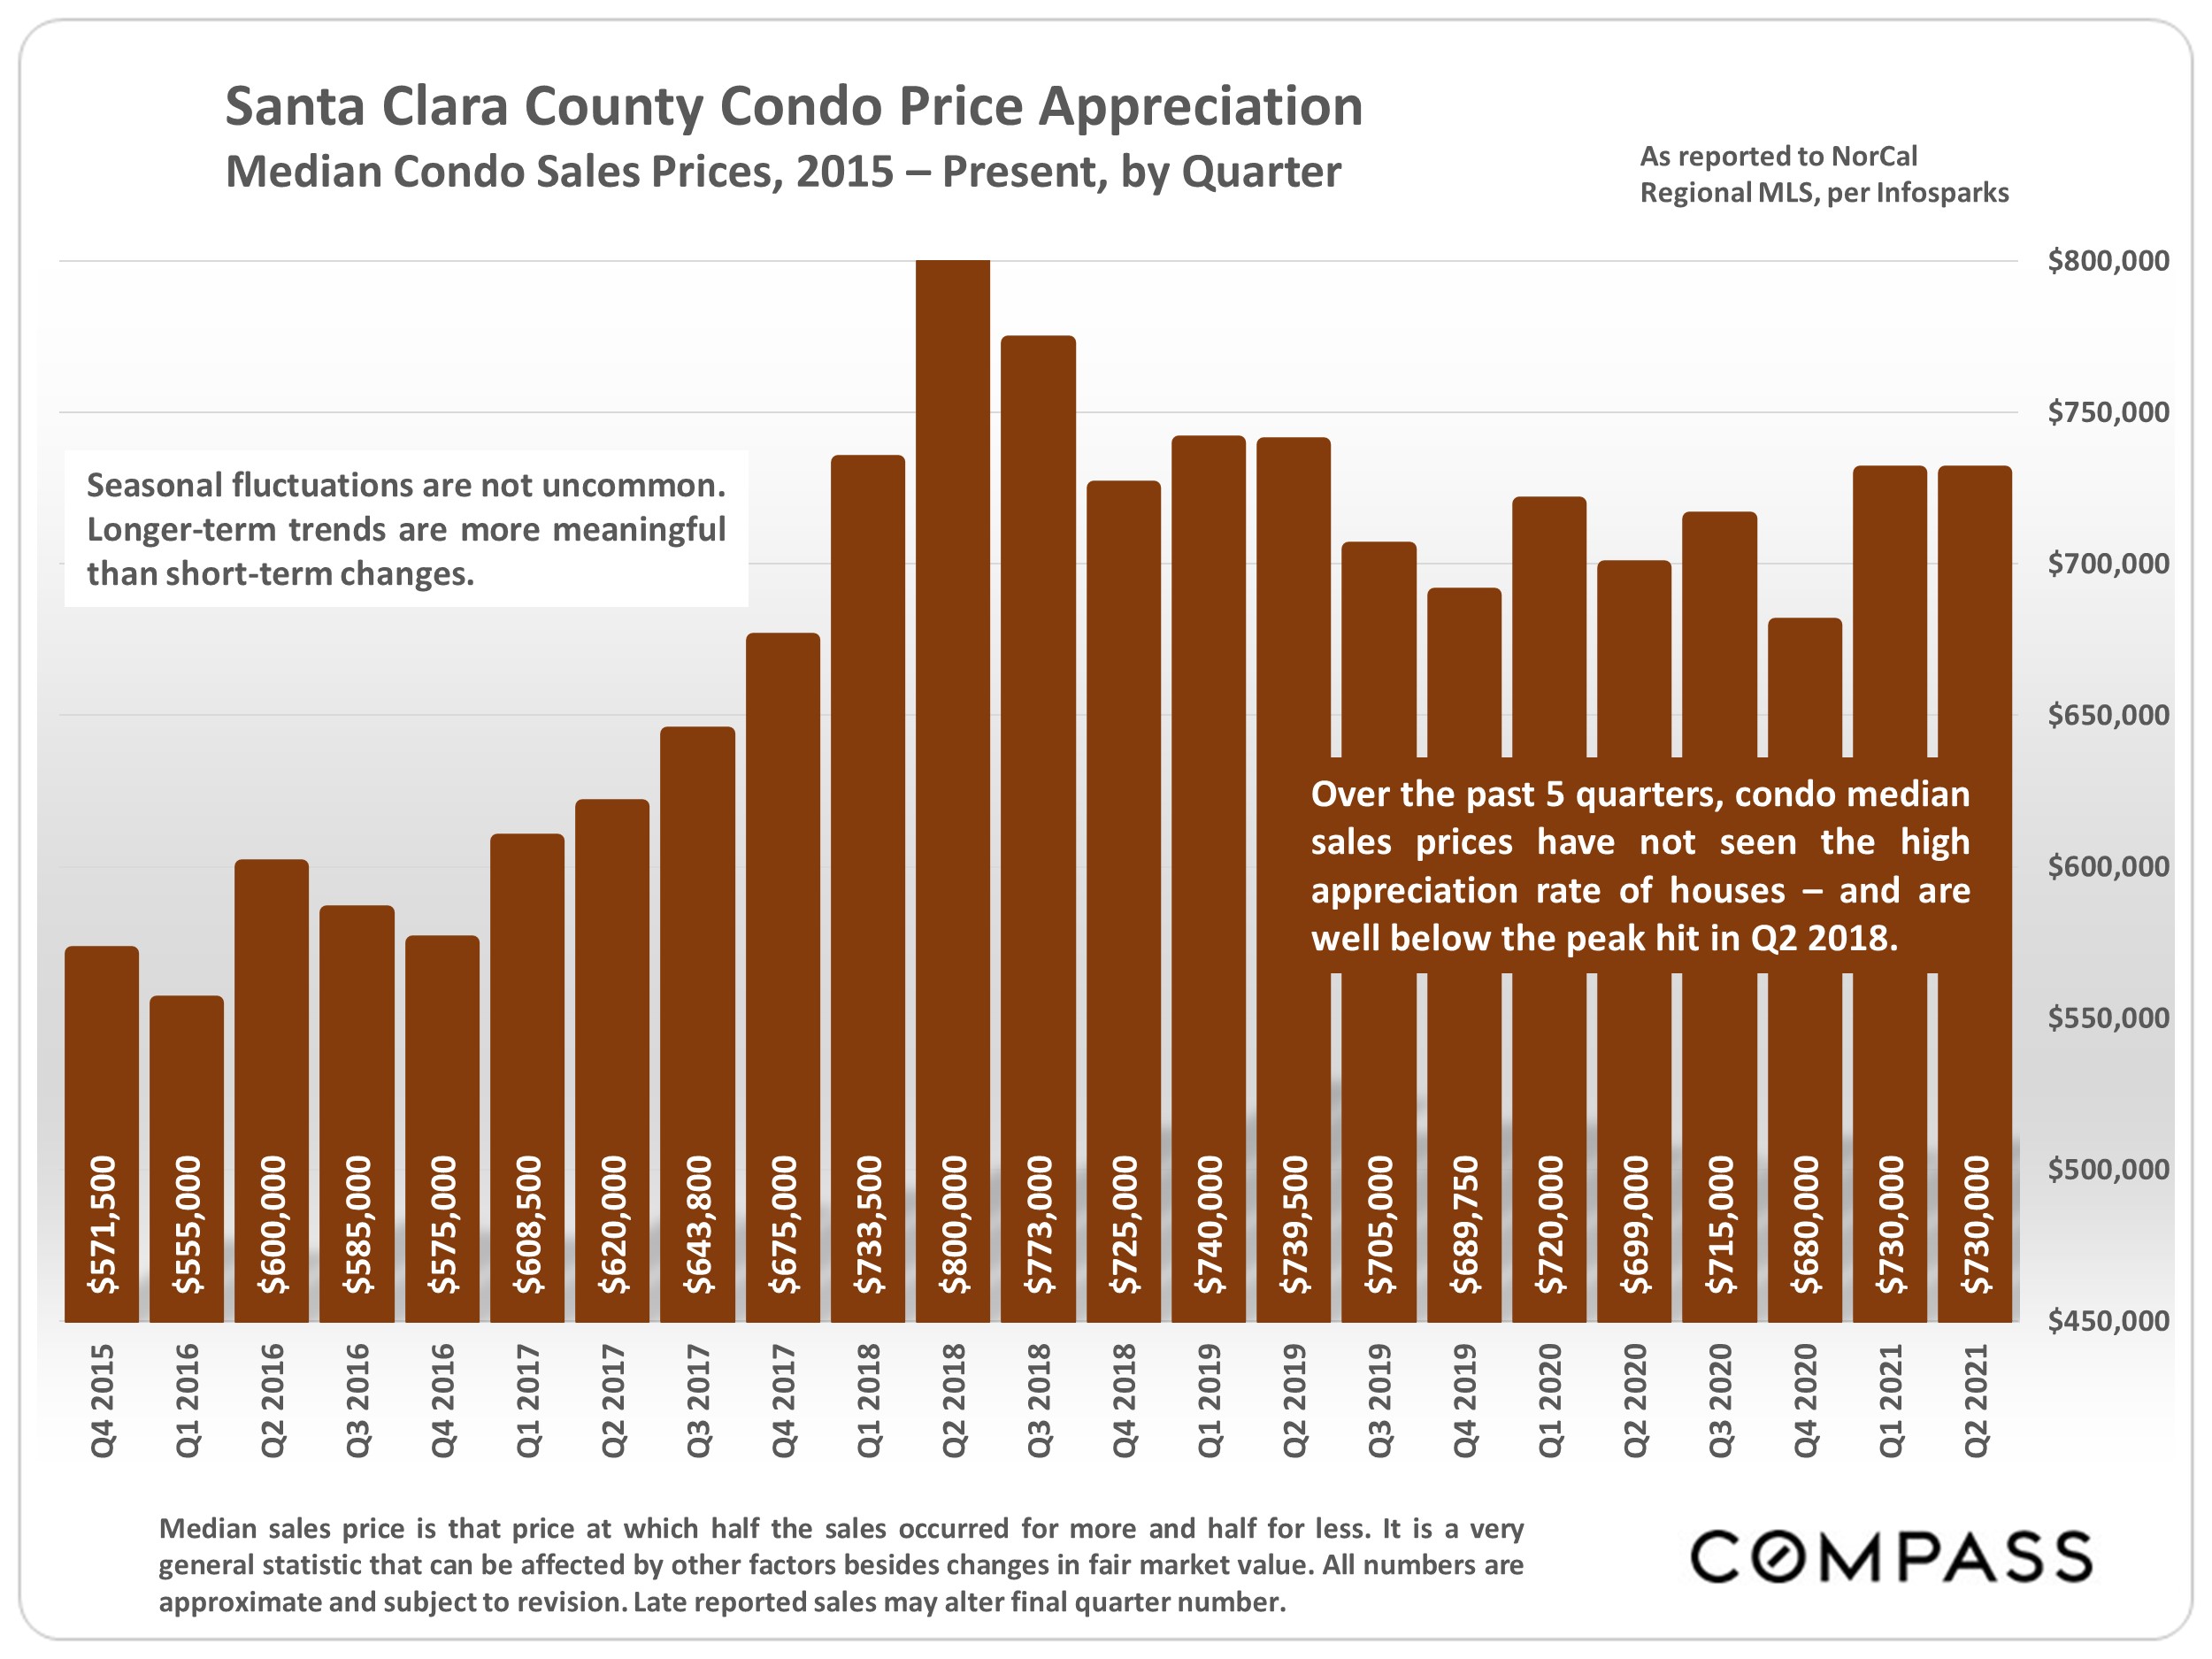
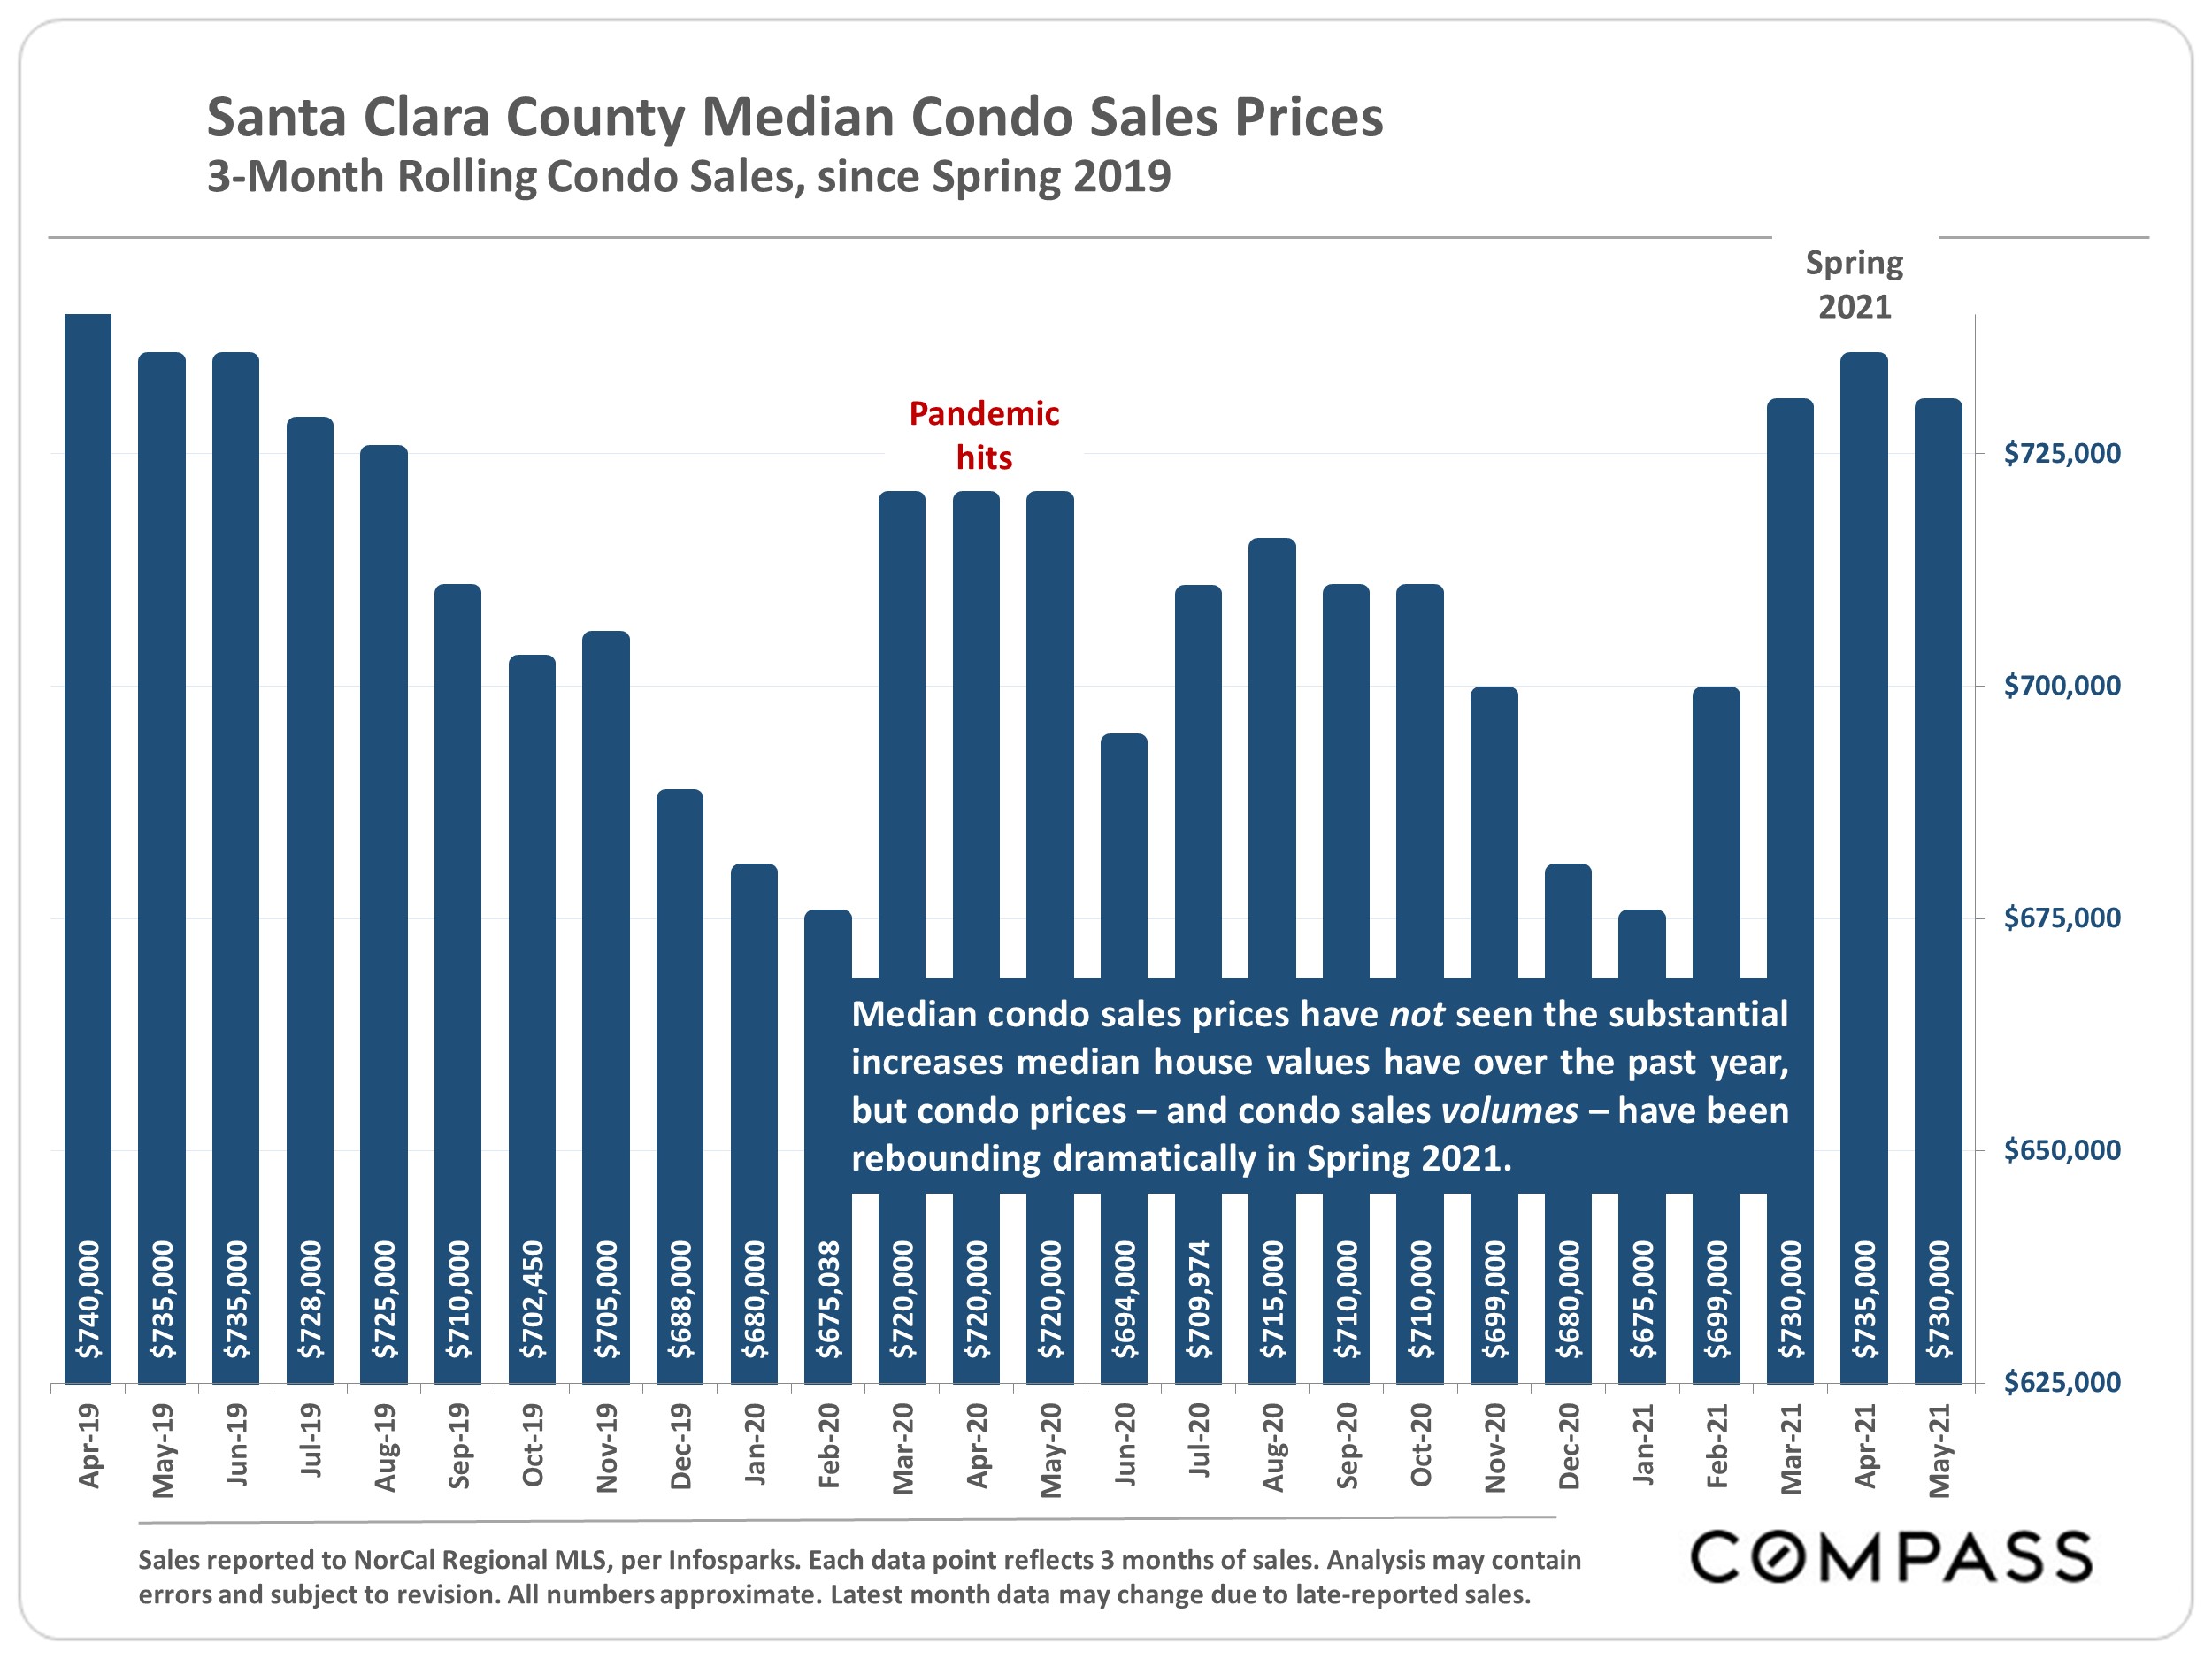
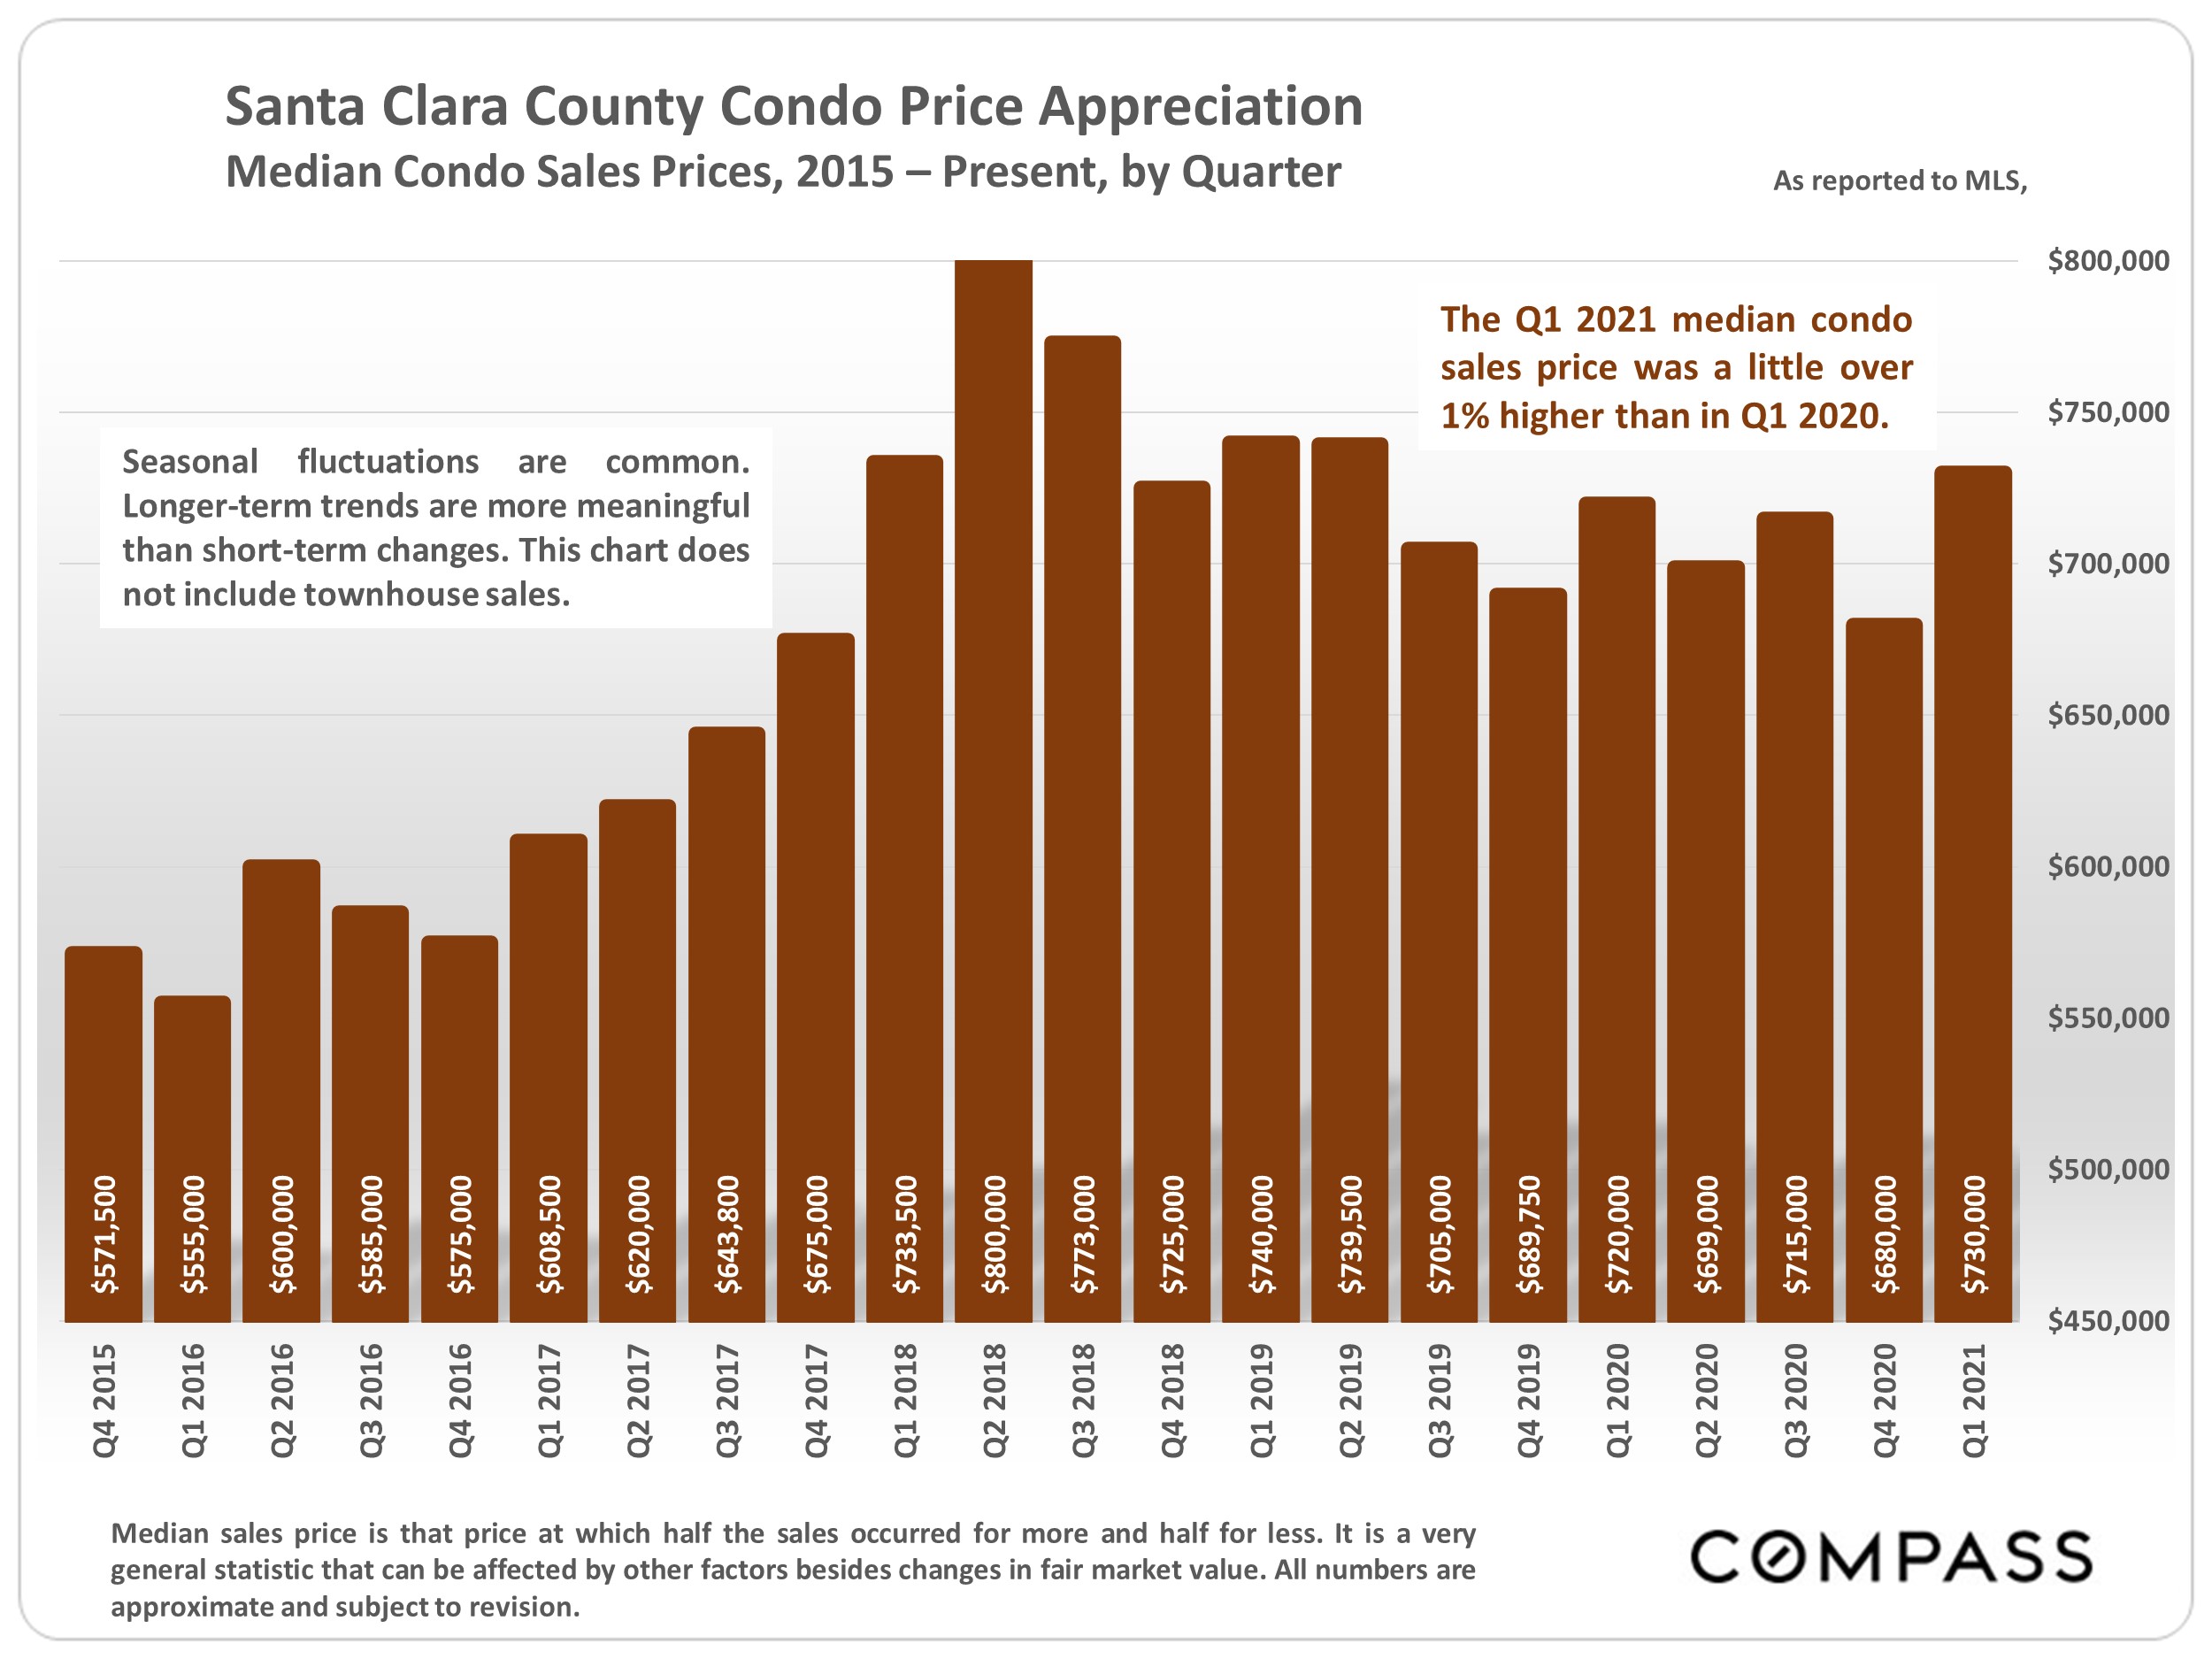
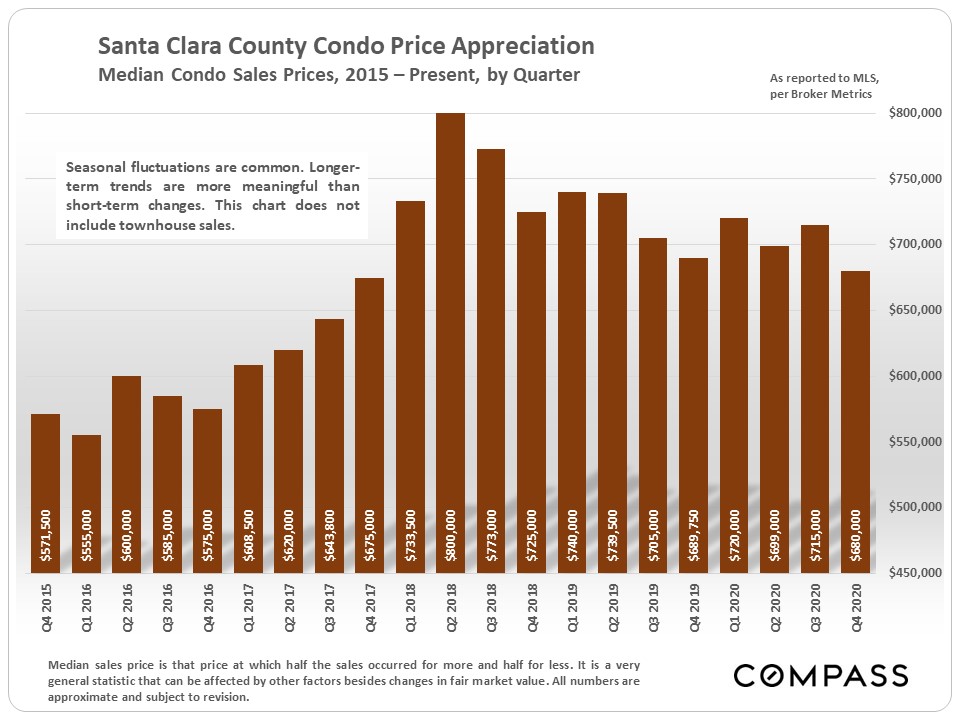
Median condo condo sales price: +2%, $730,000 in 2021 YTD
Median condo $/sq.ft. value: no change
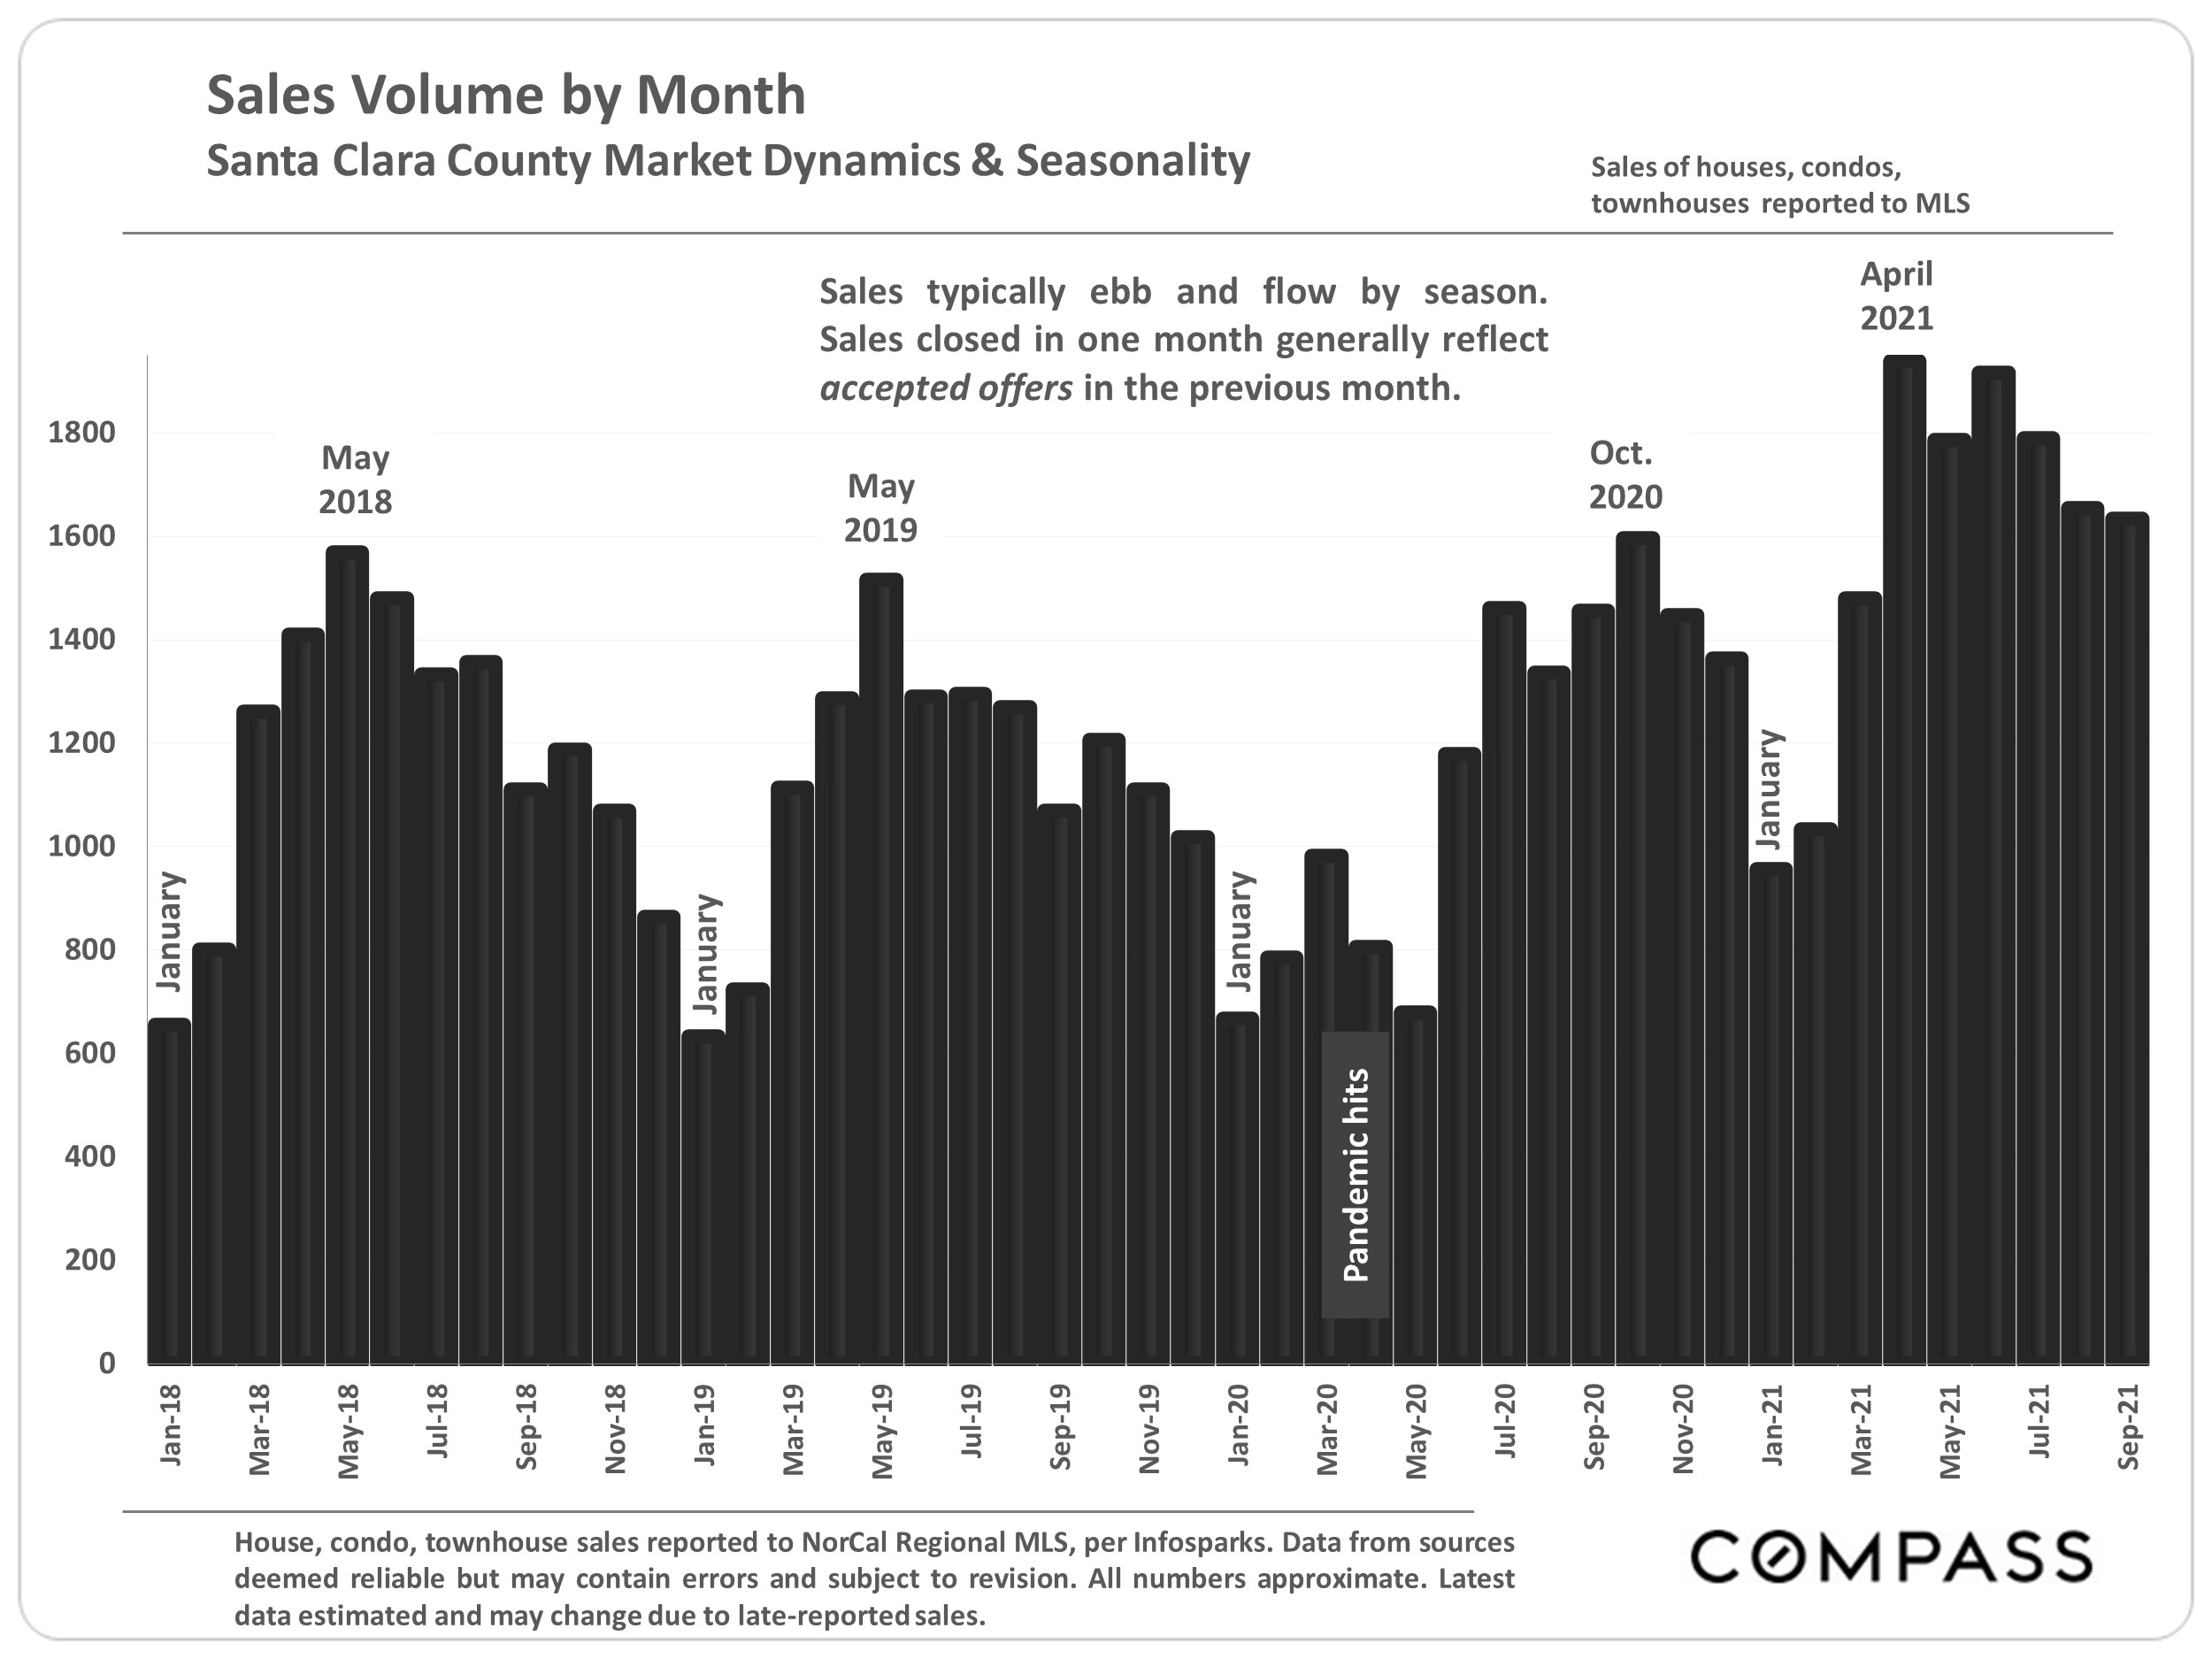
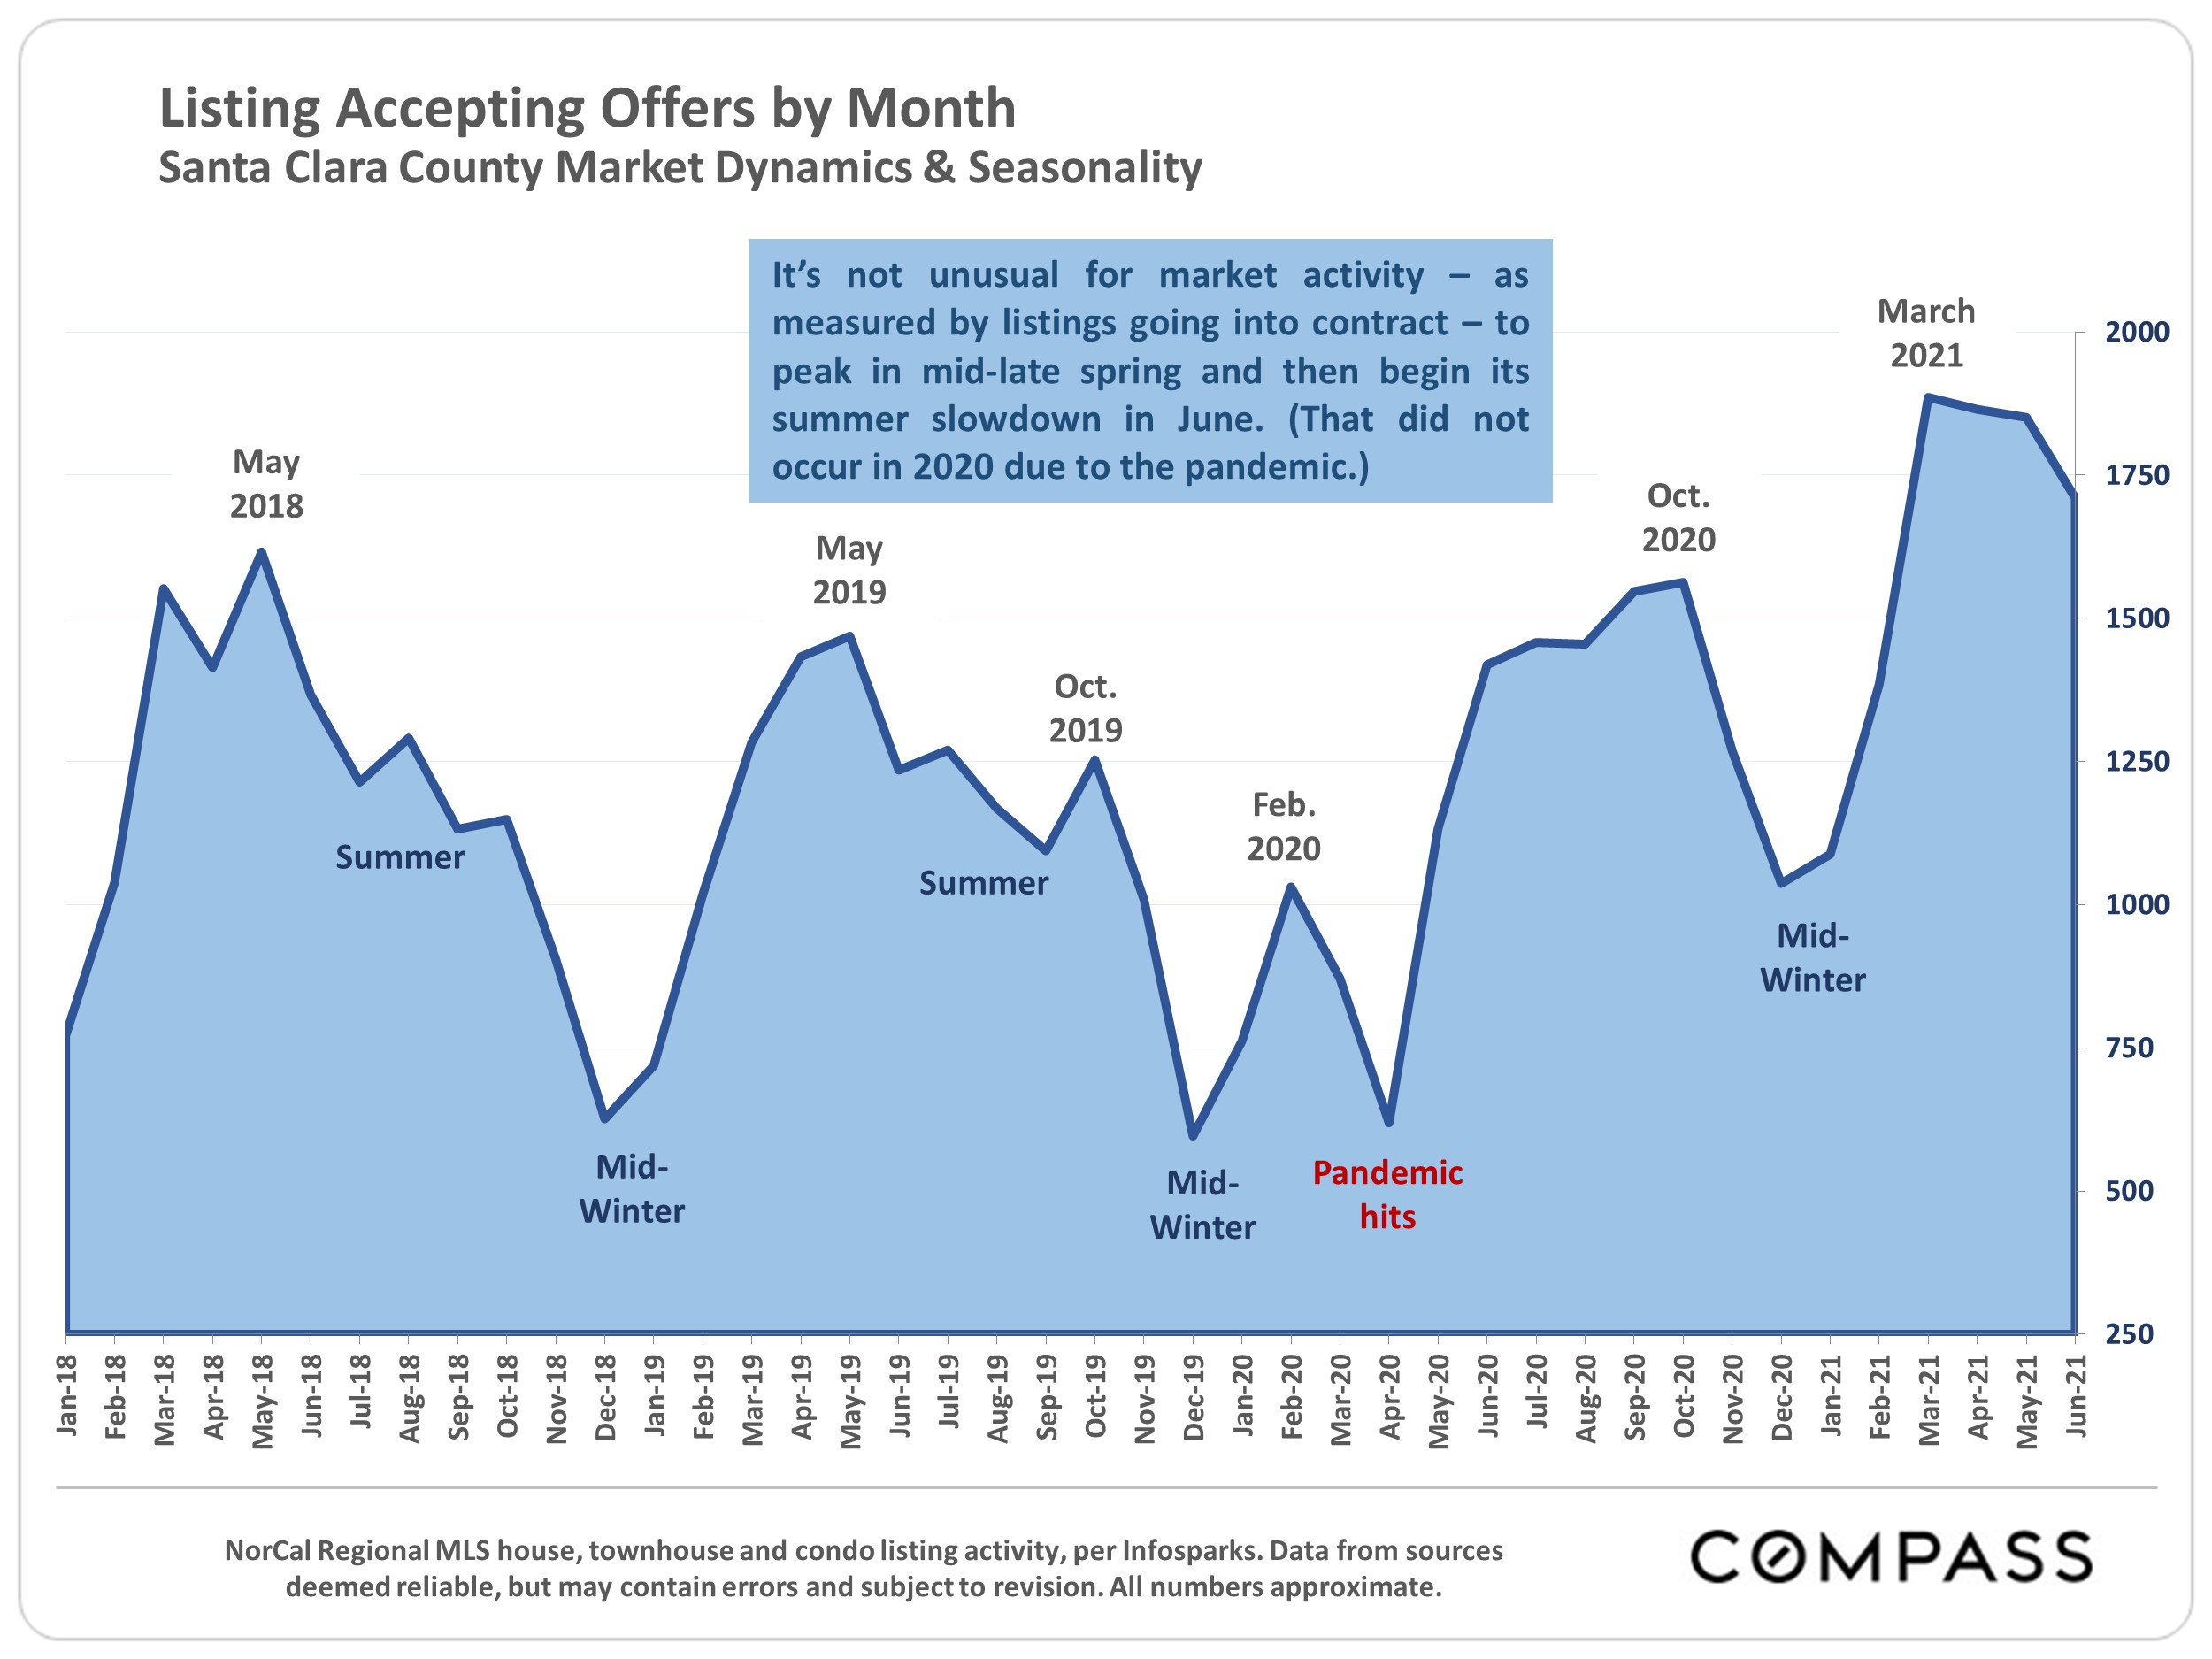
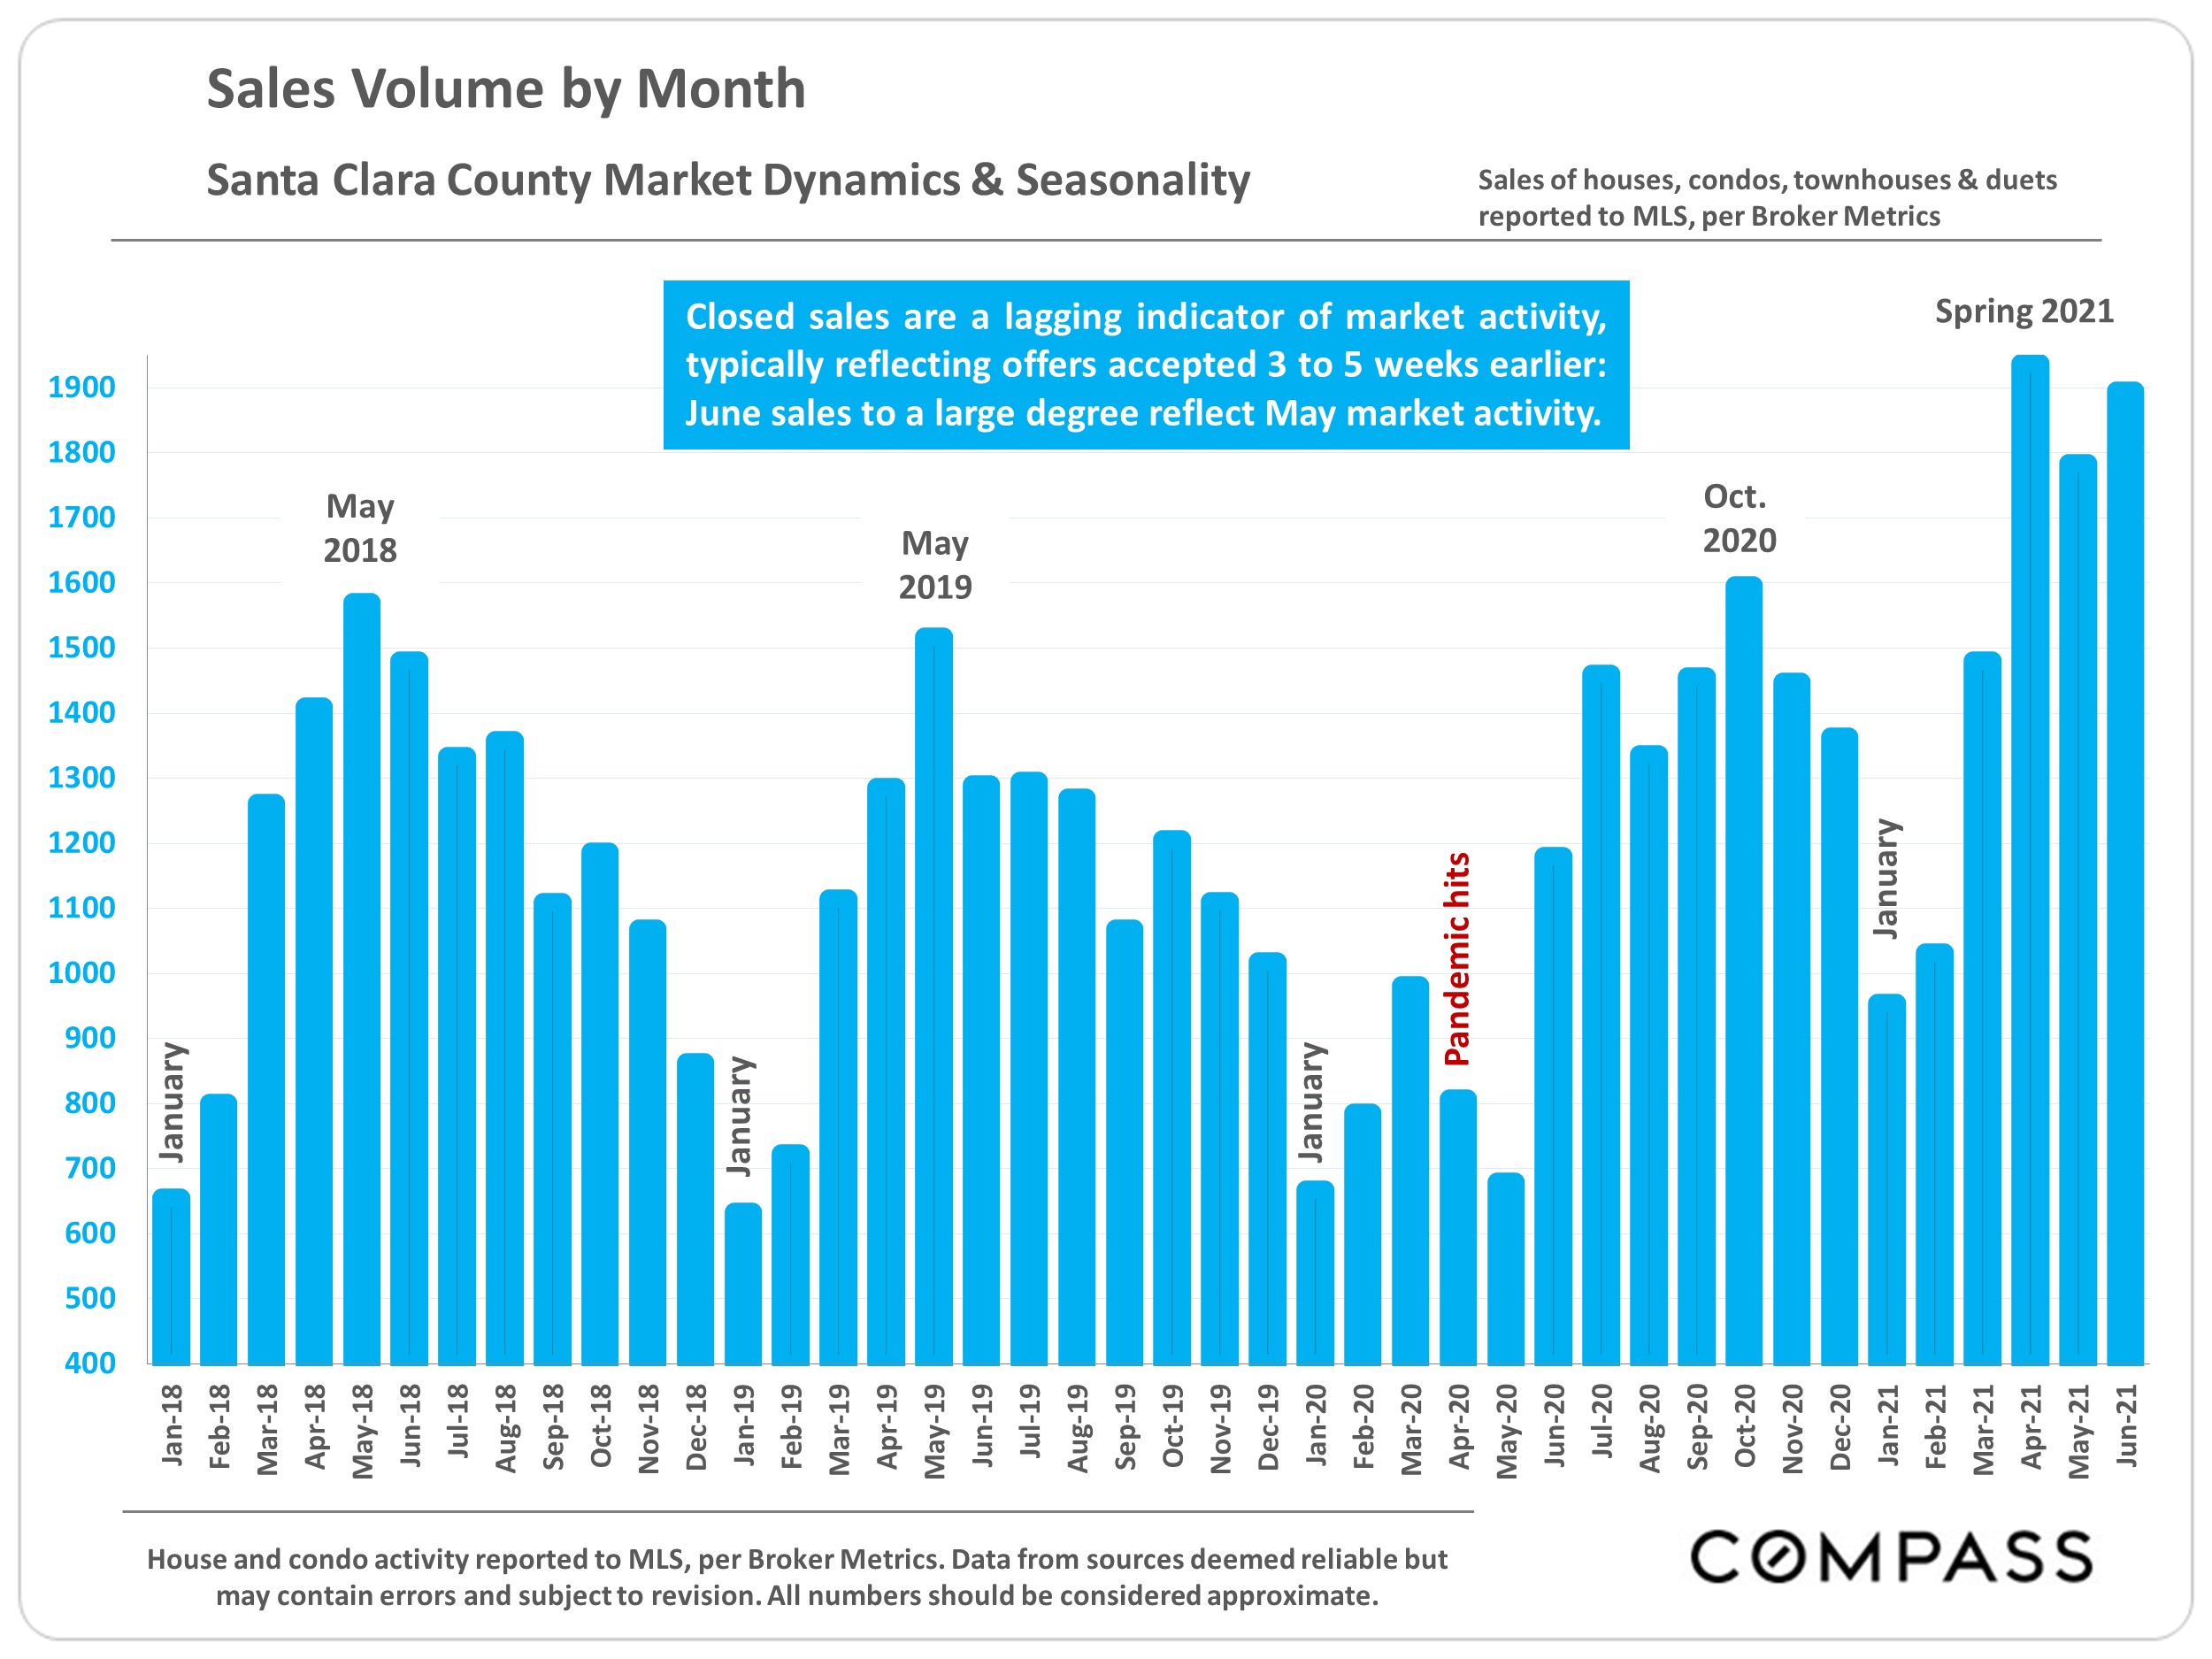
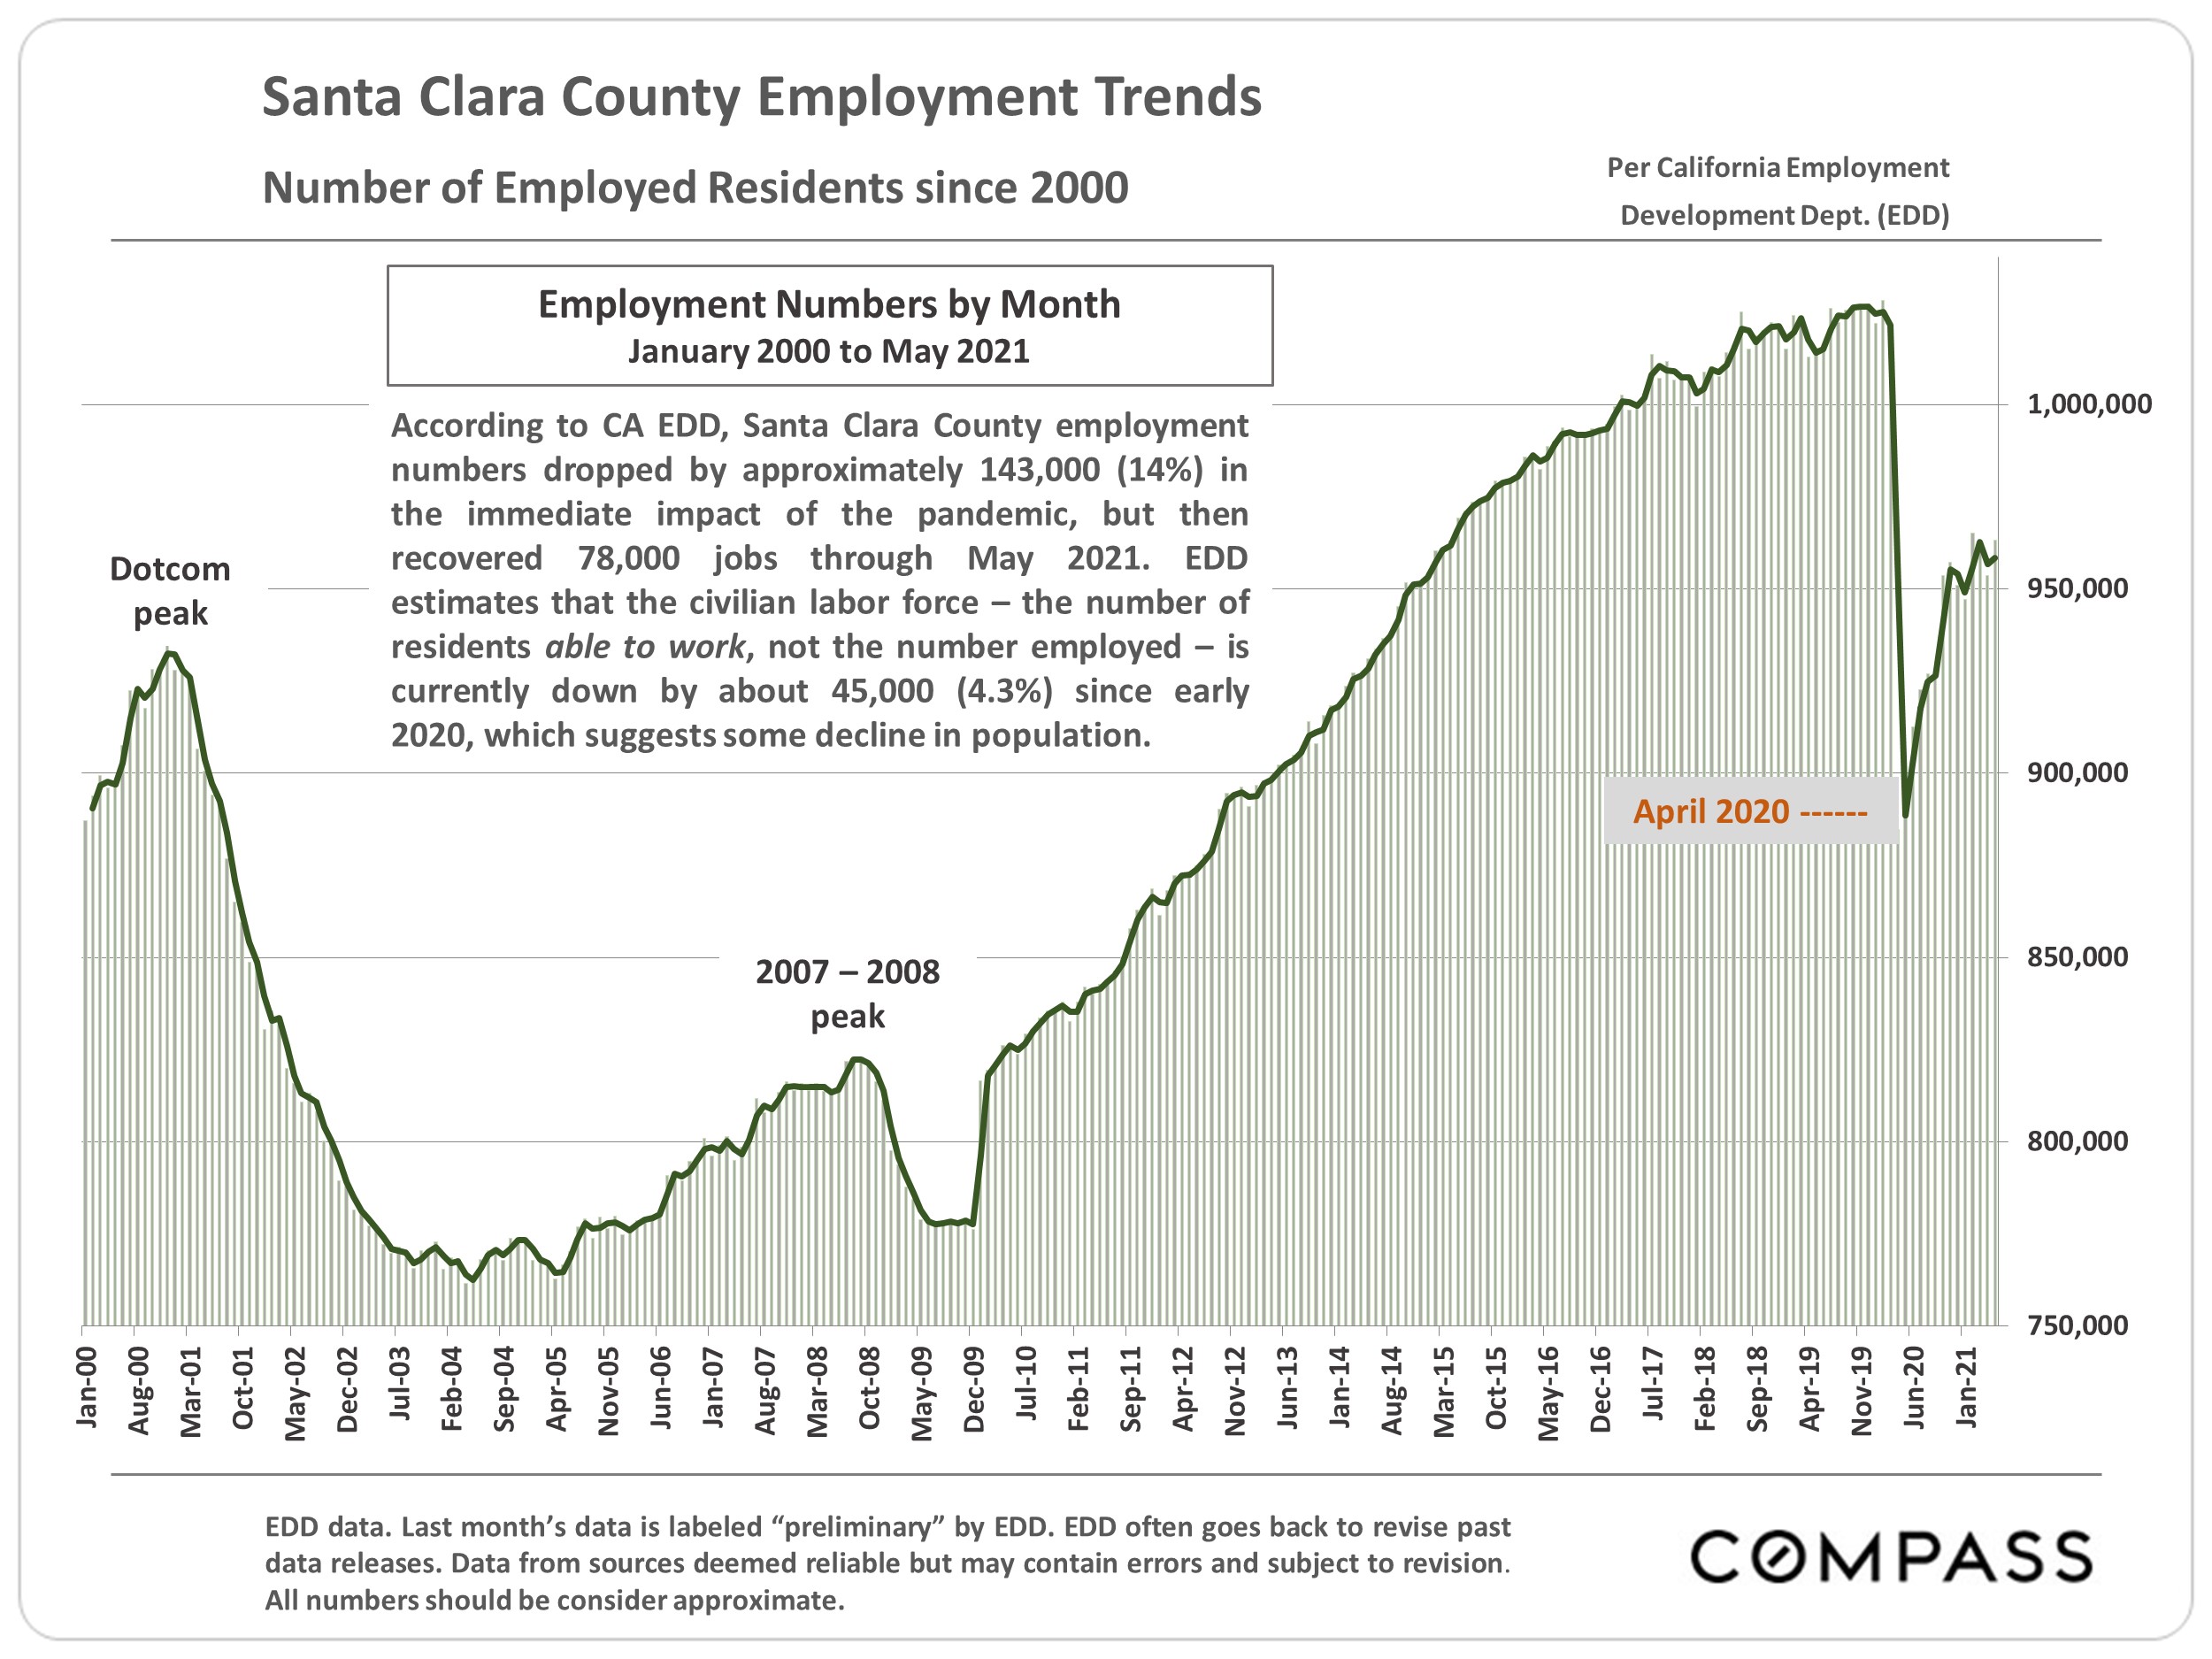
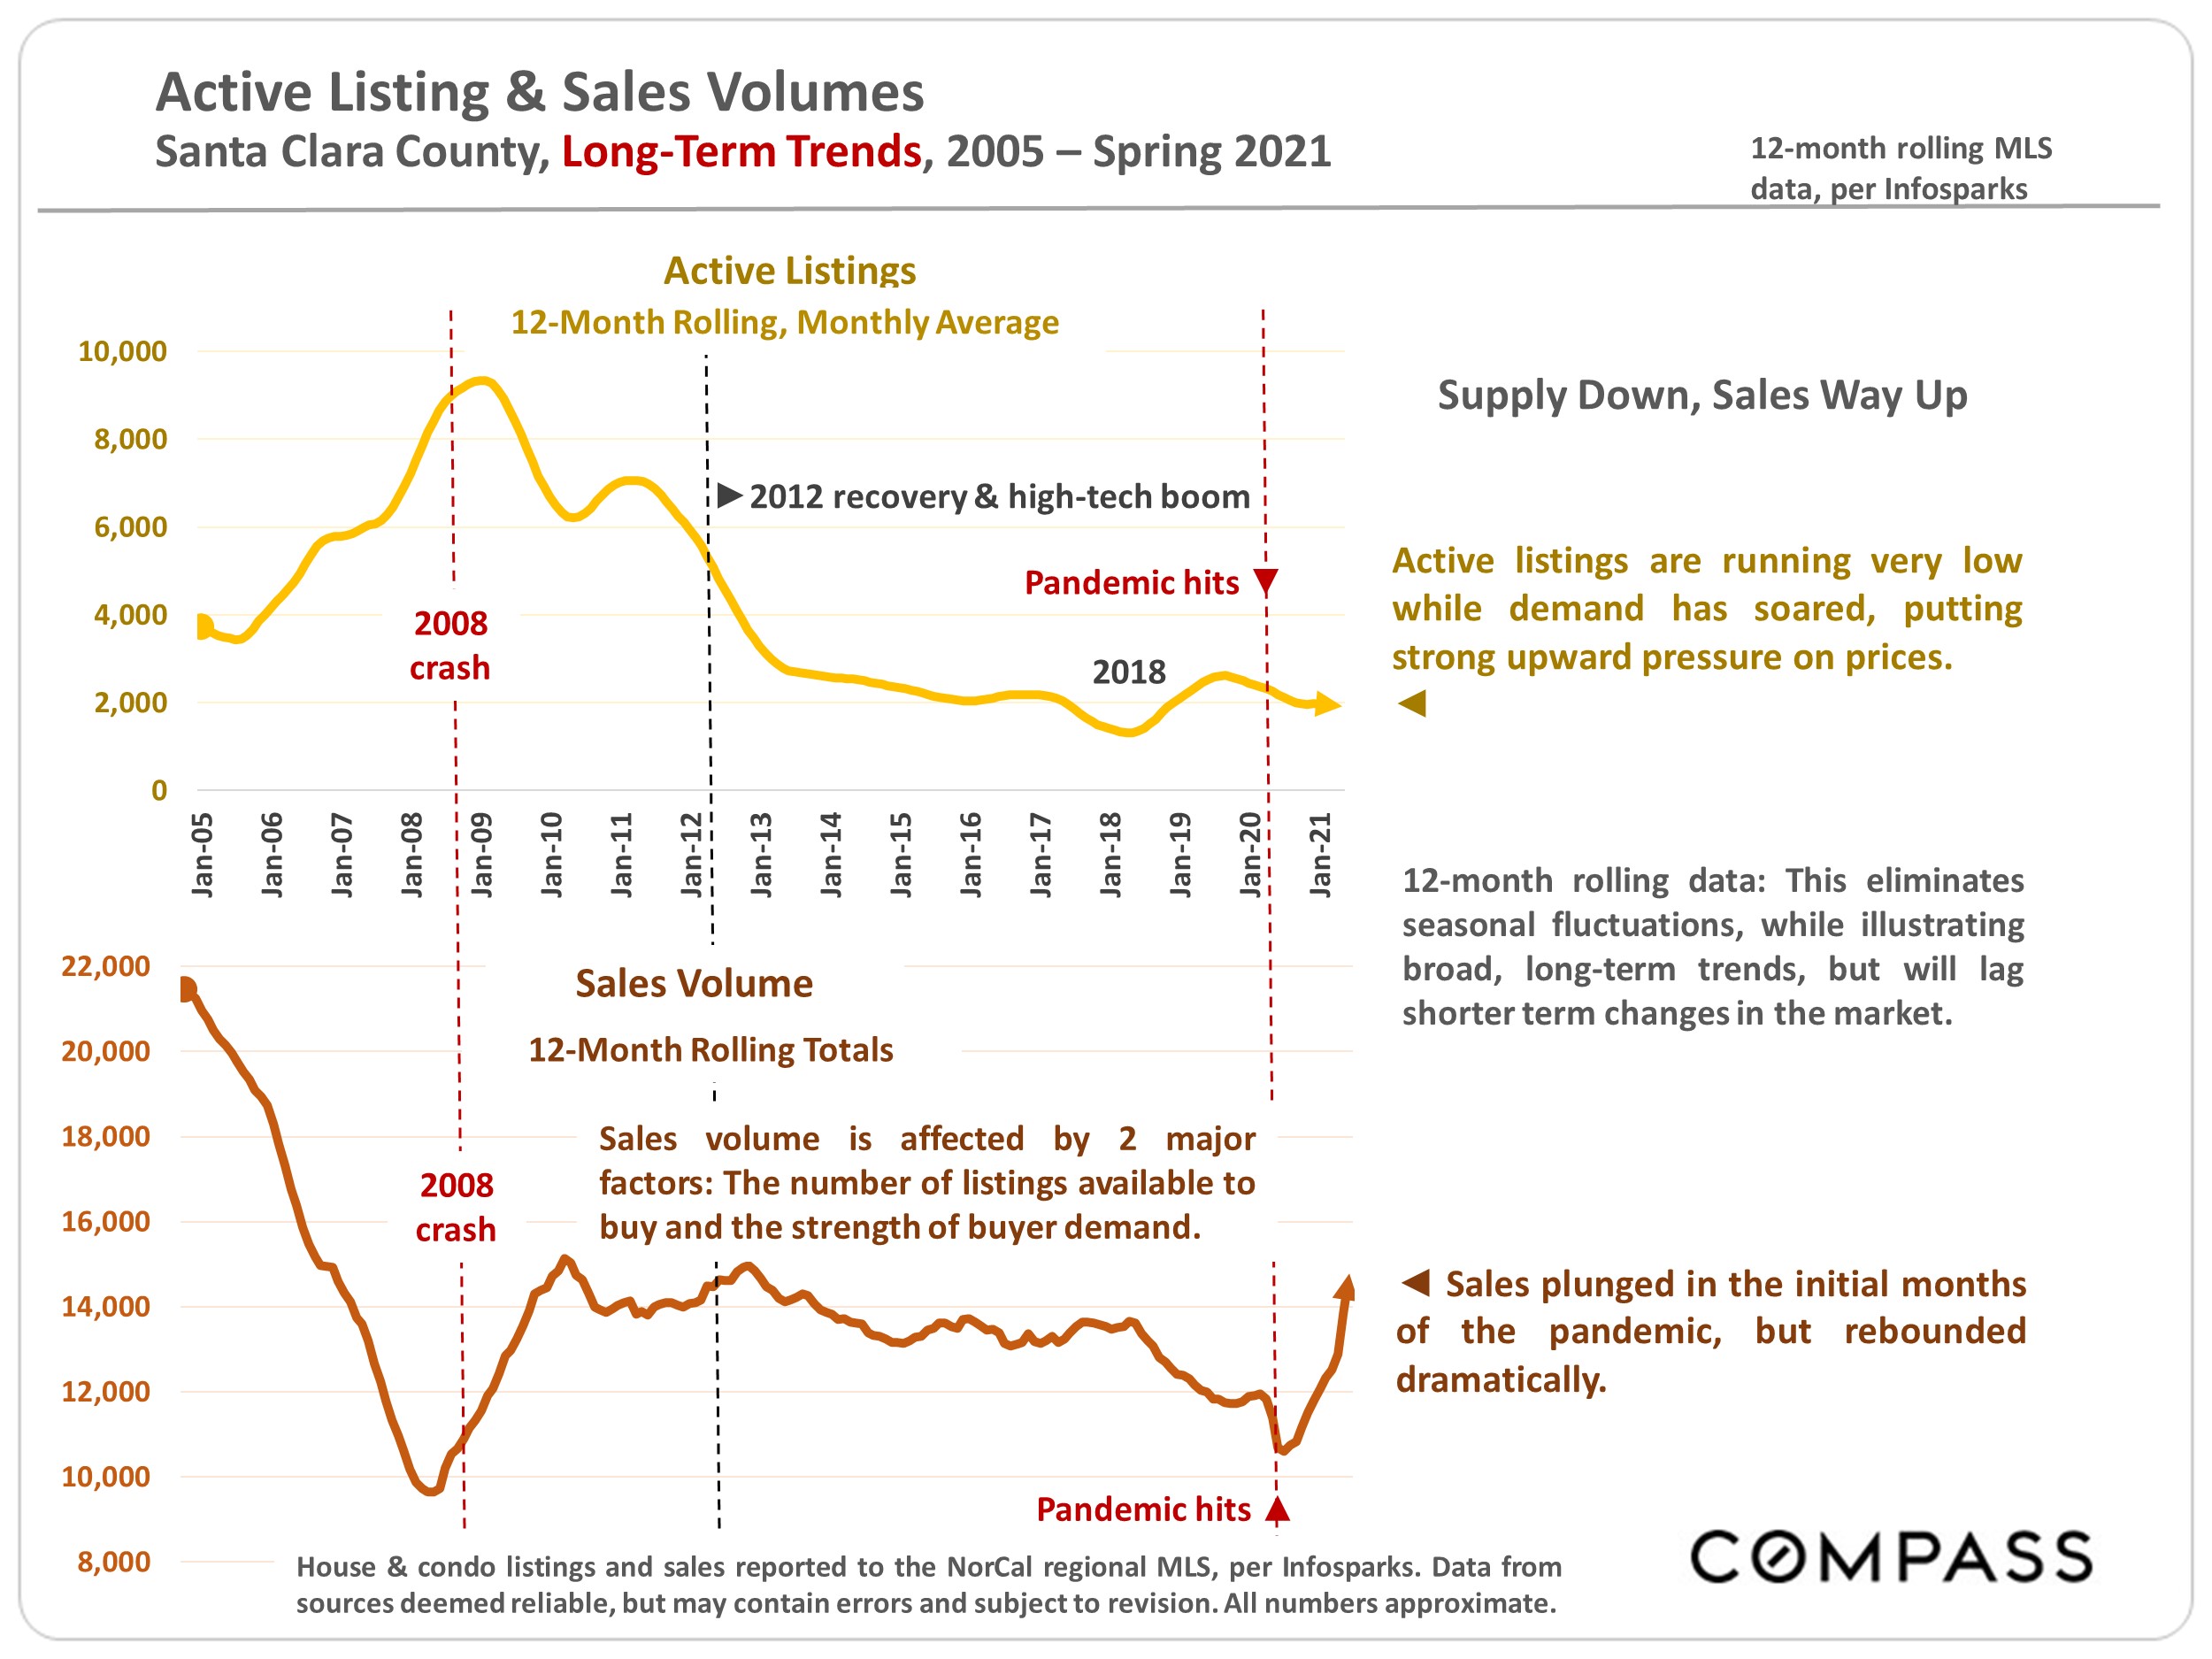
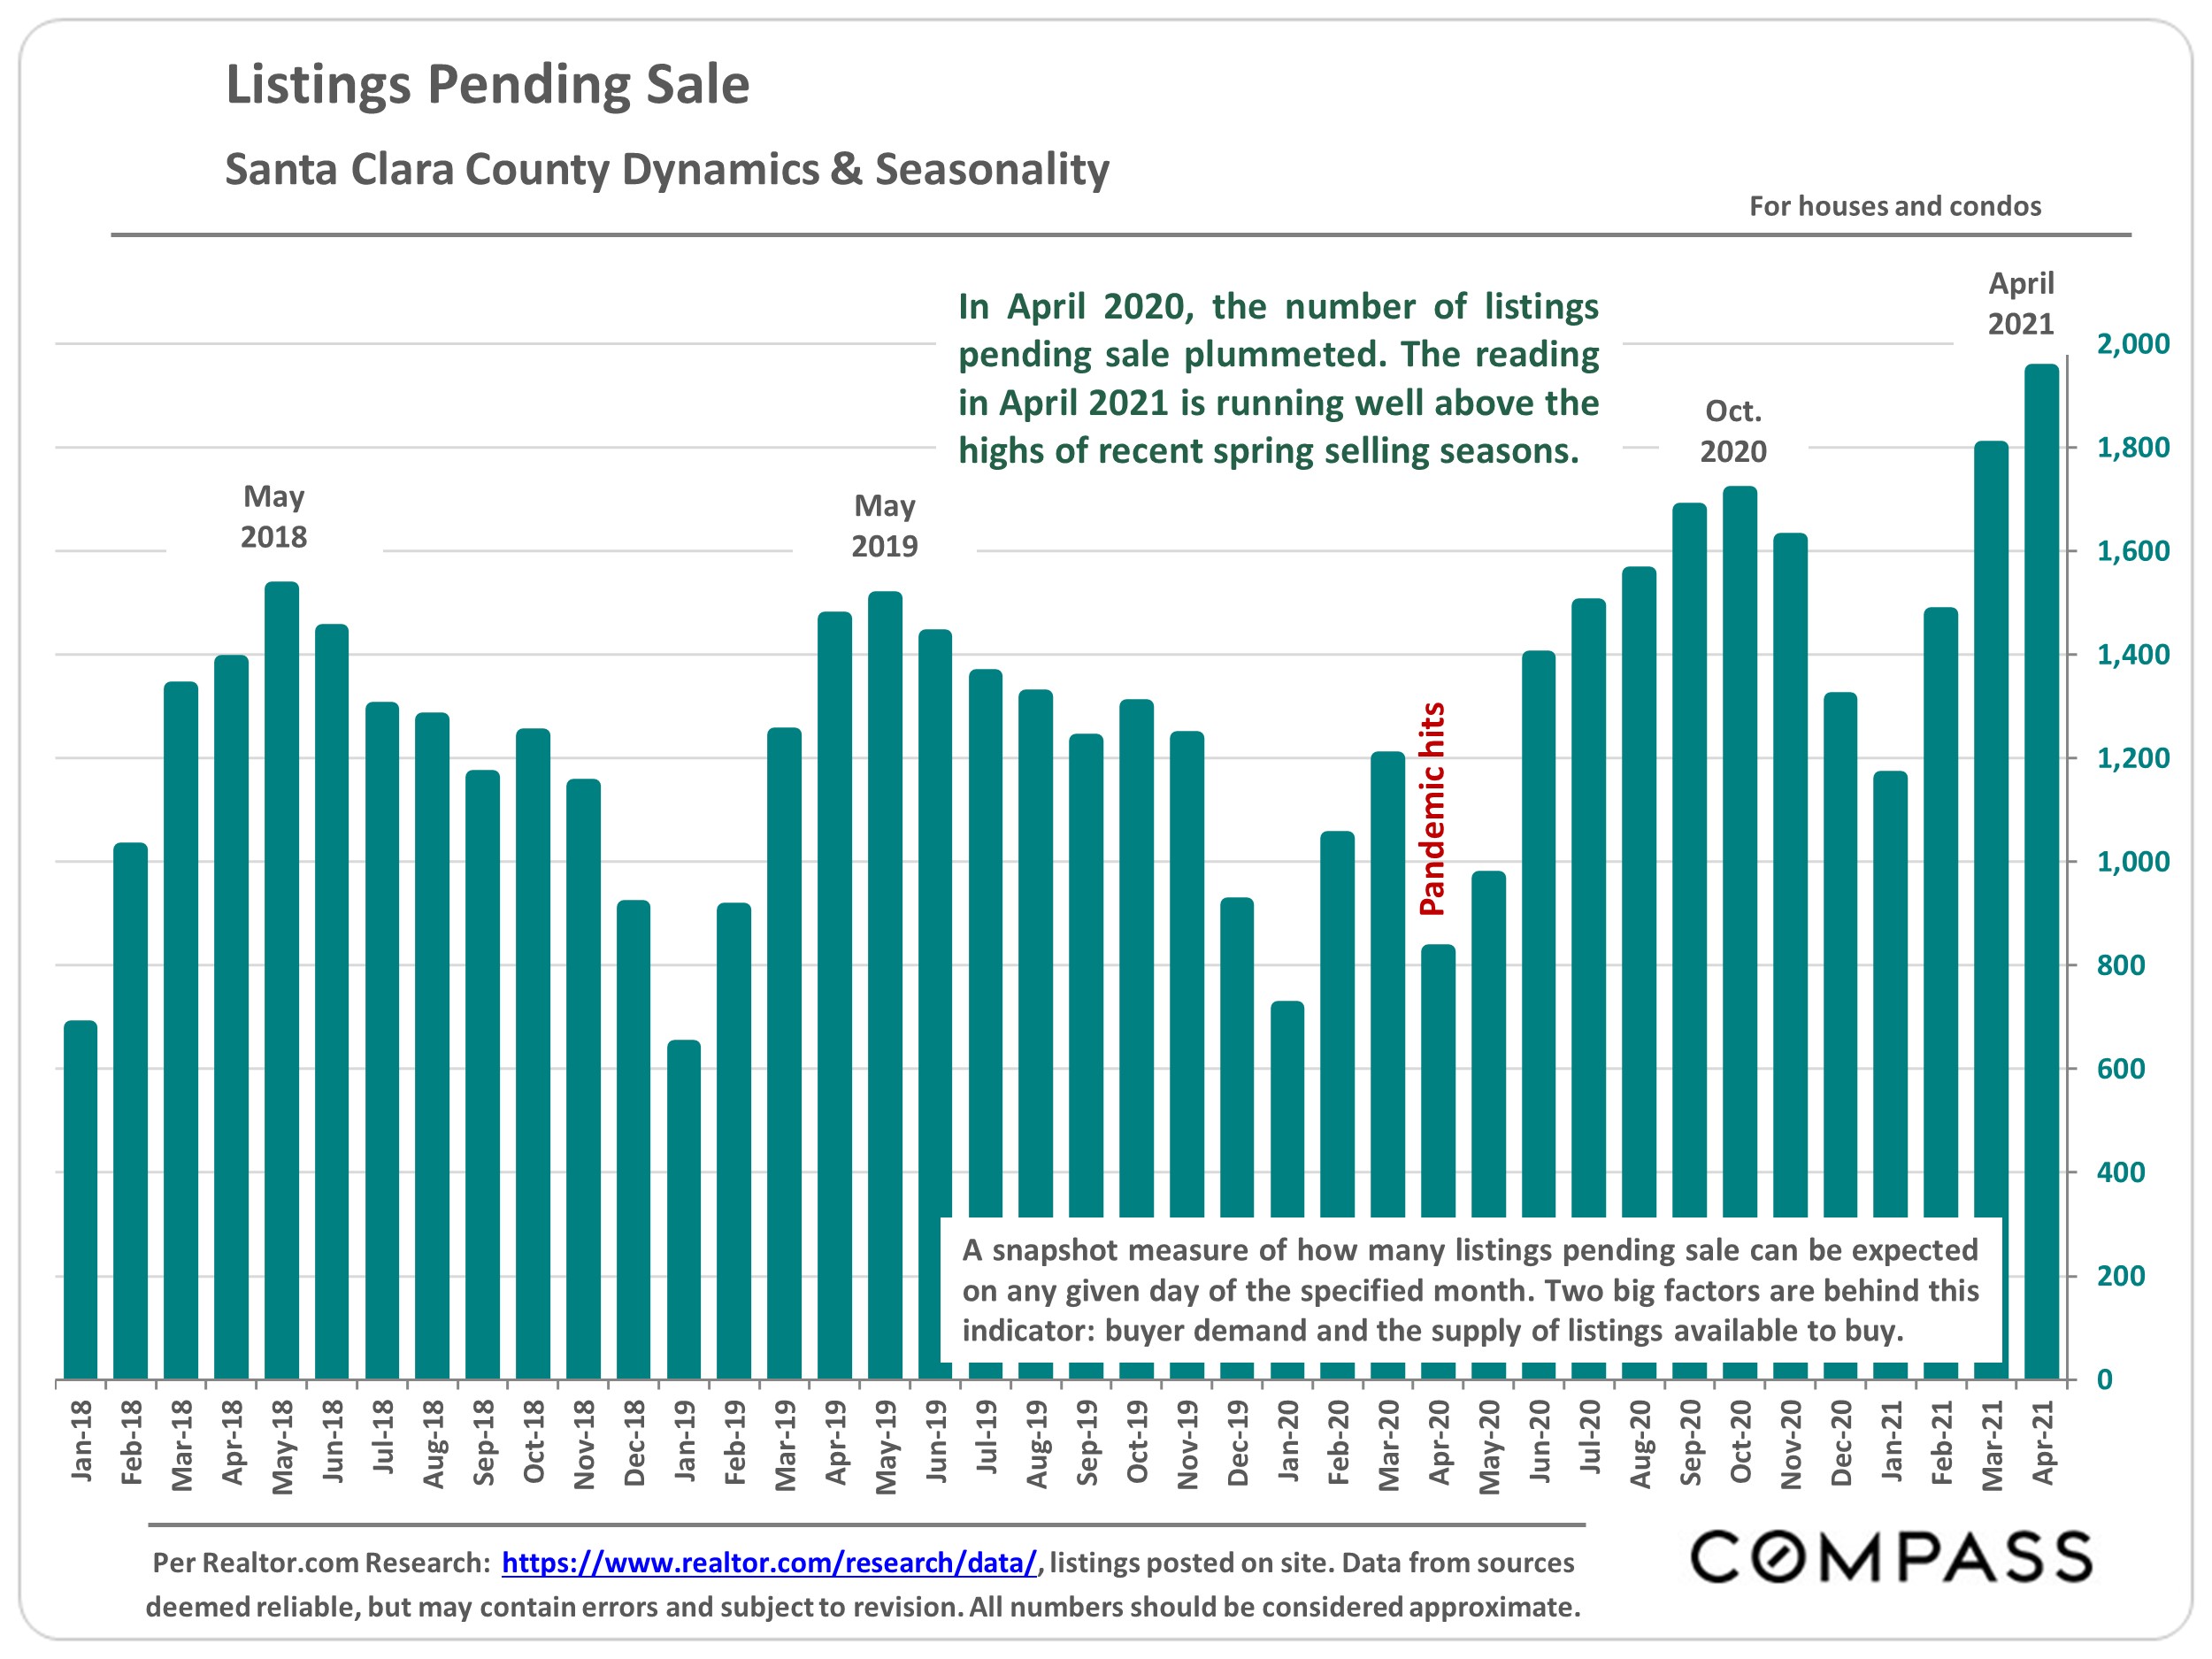
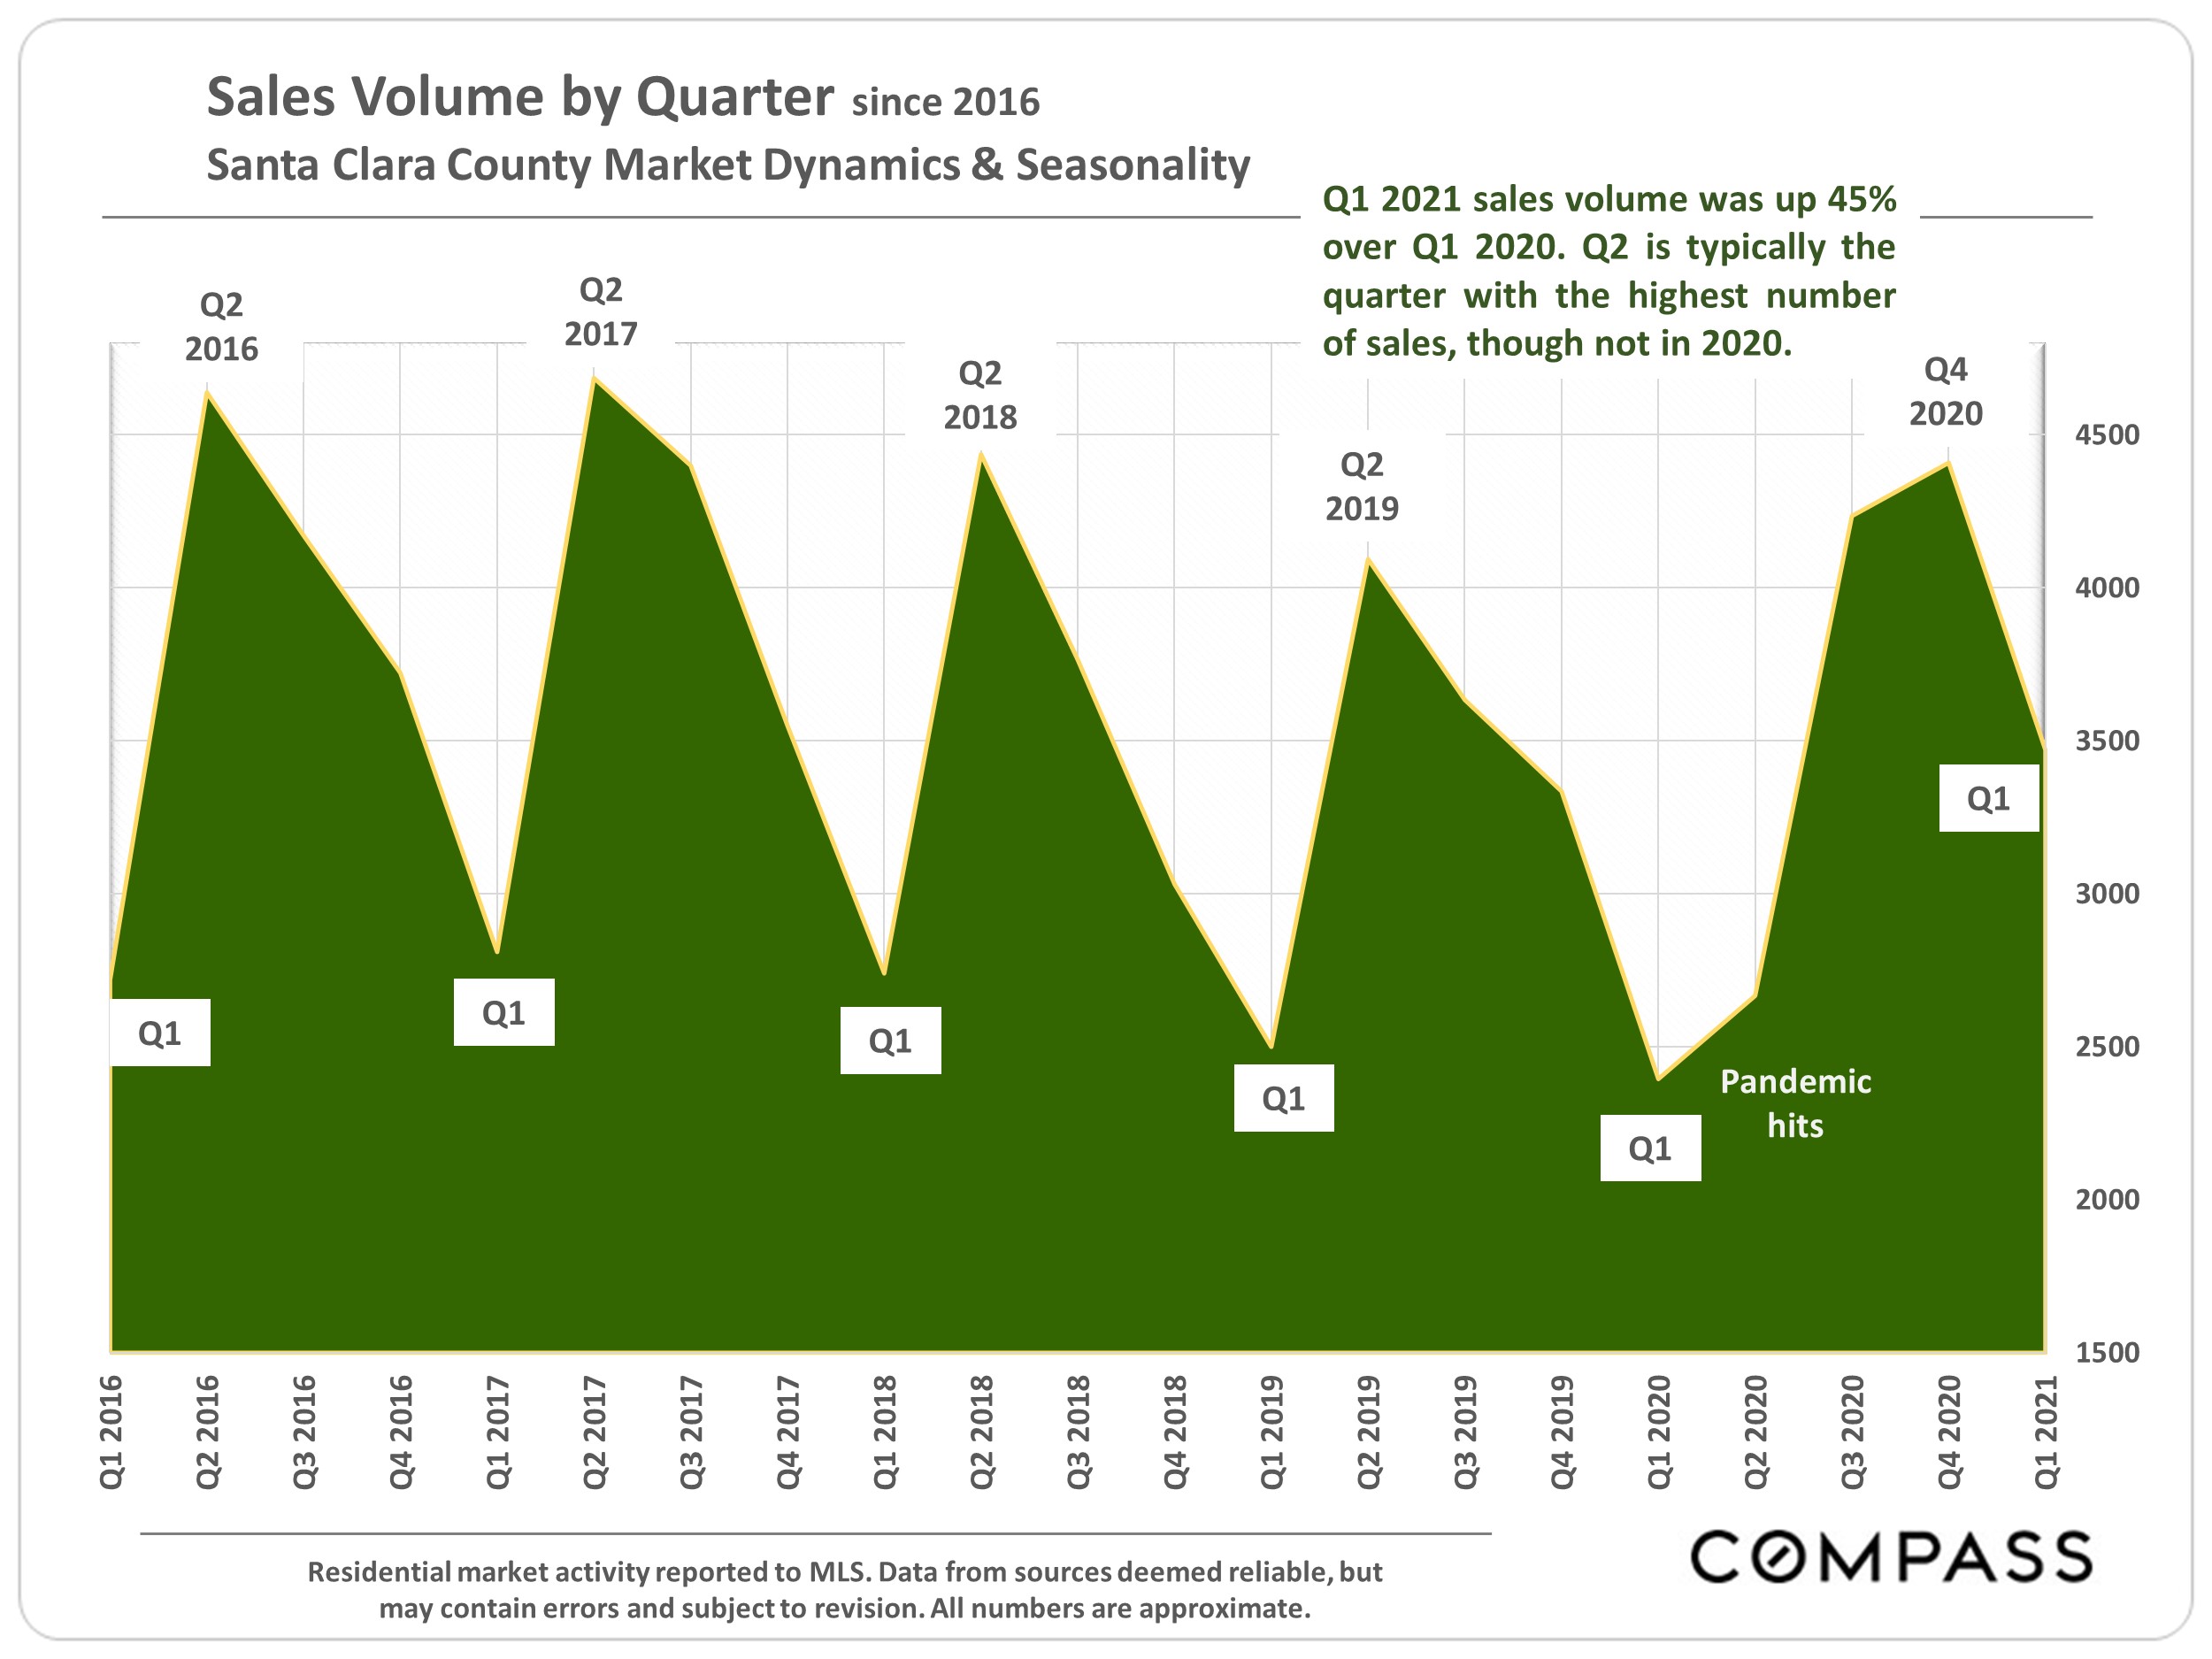
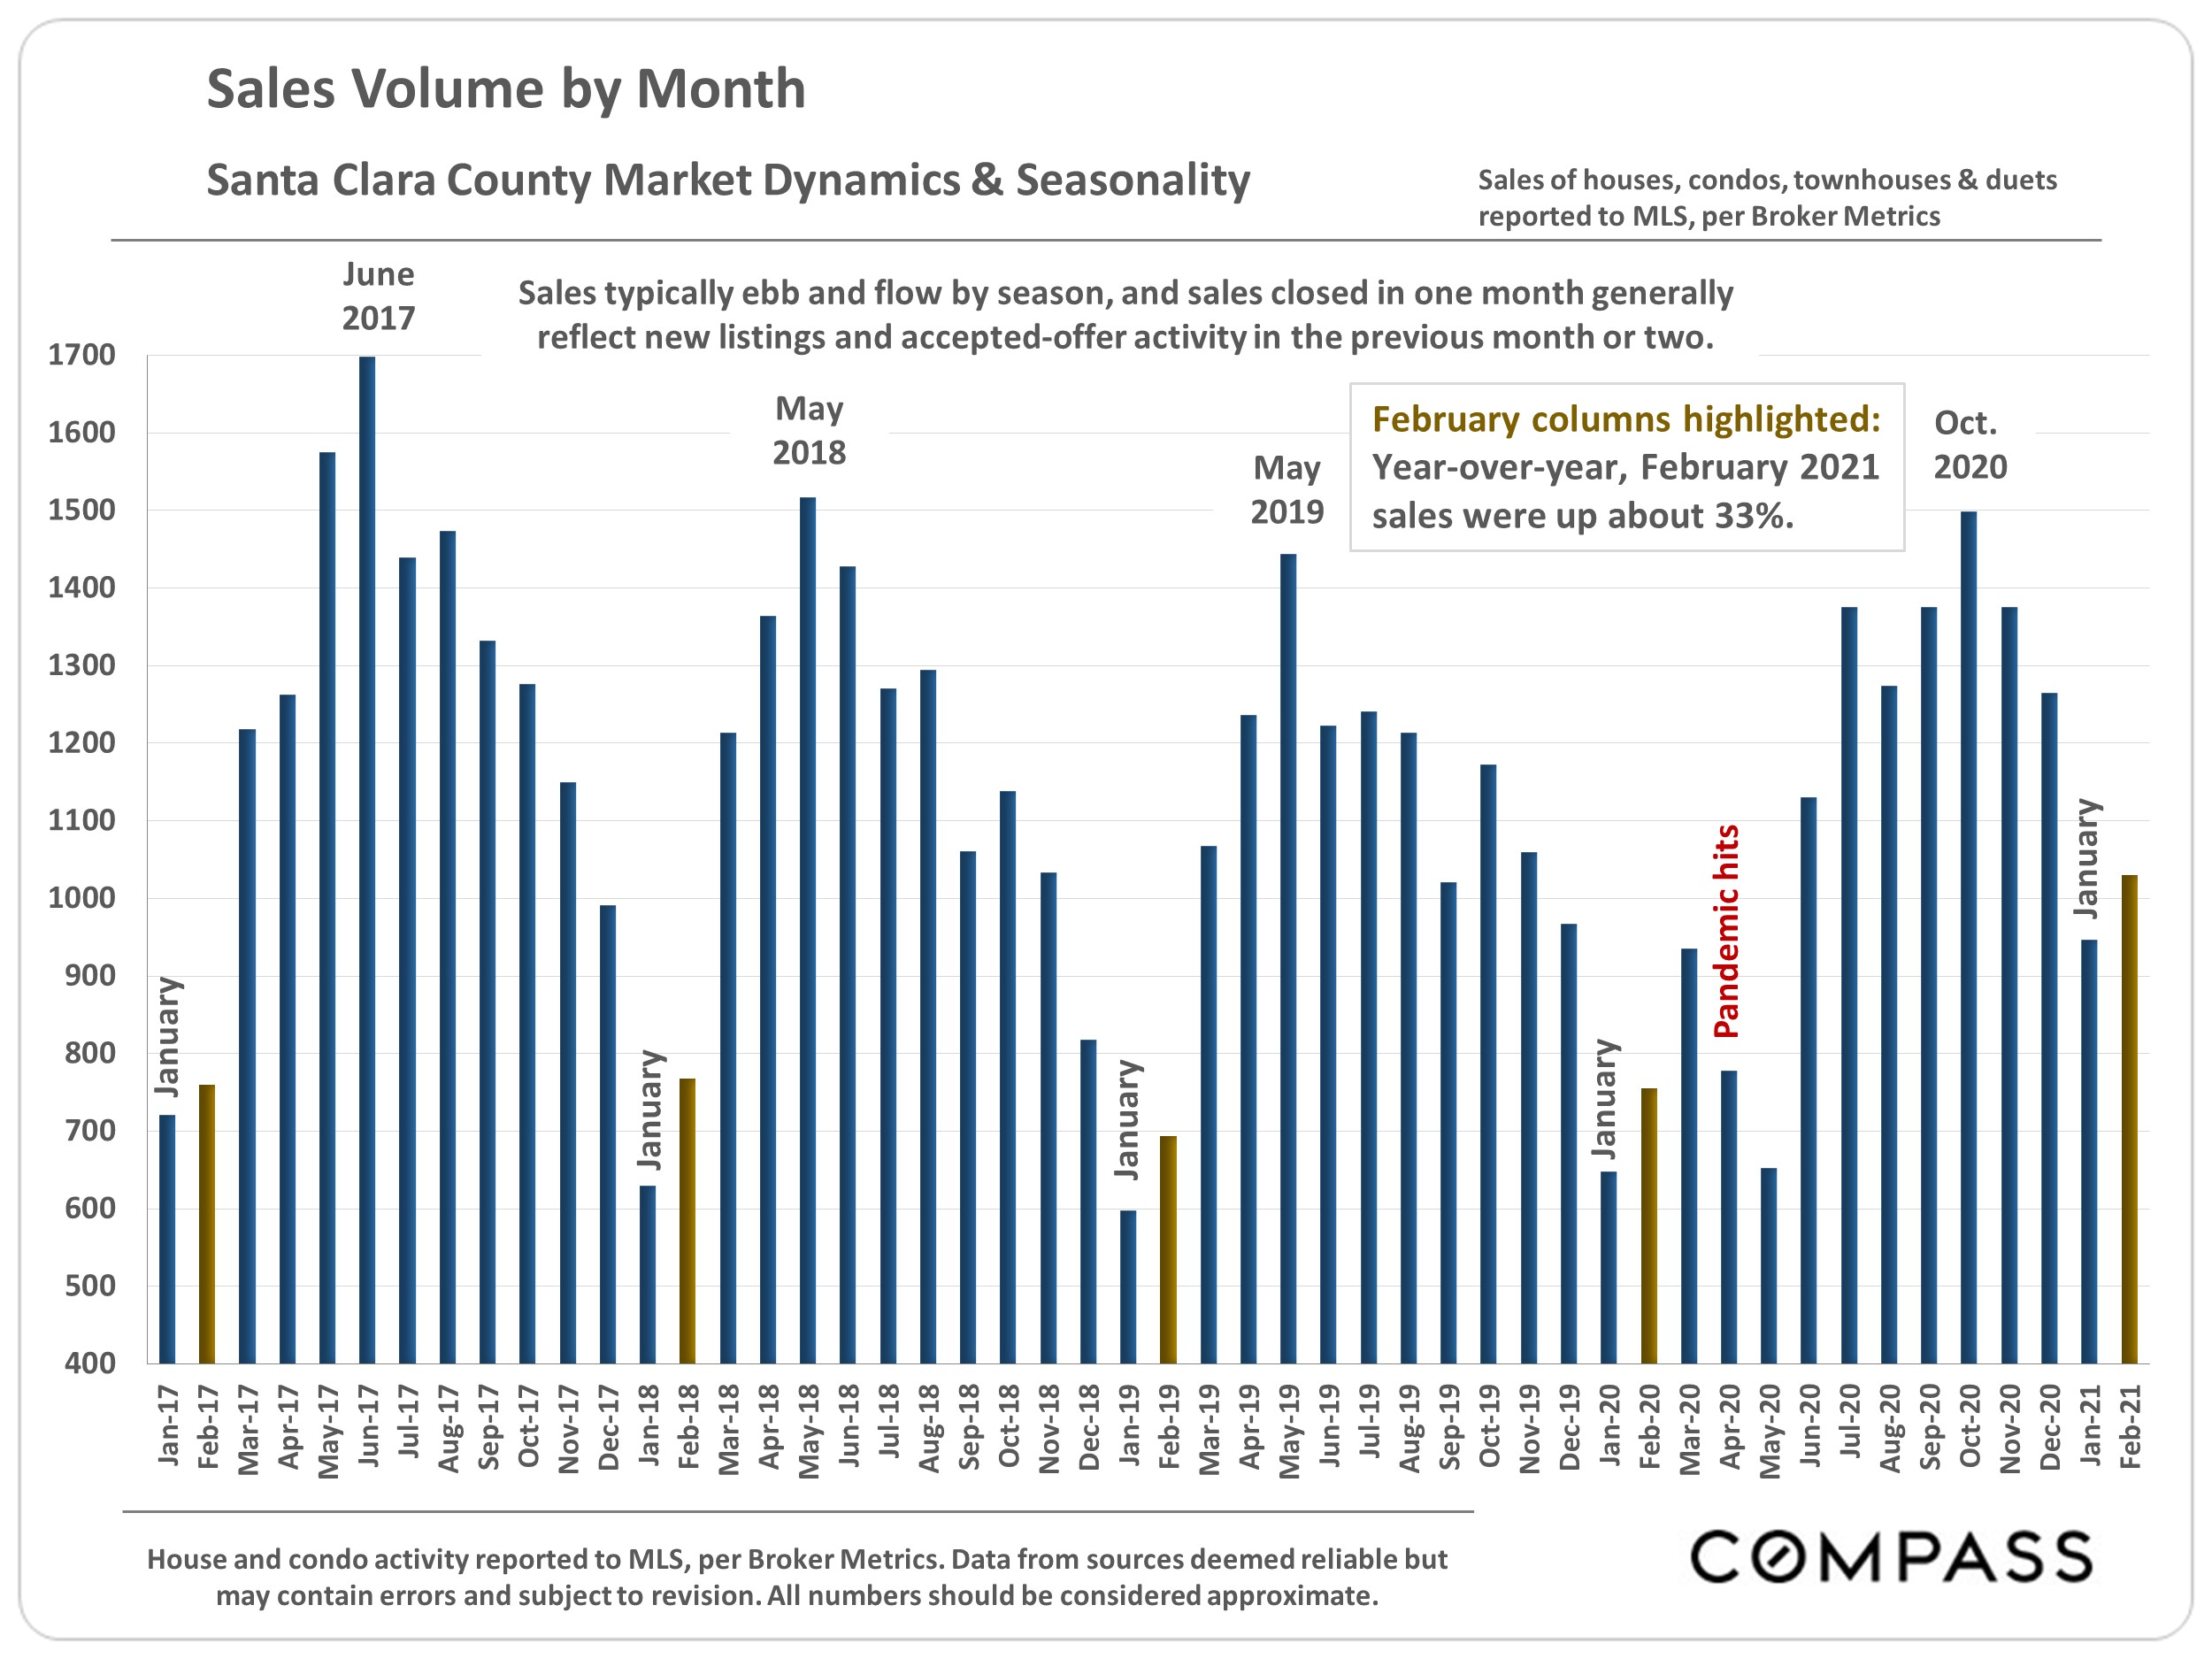
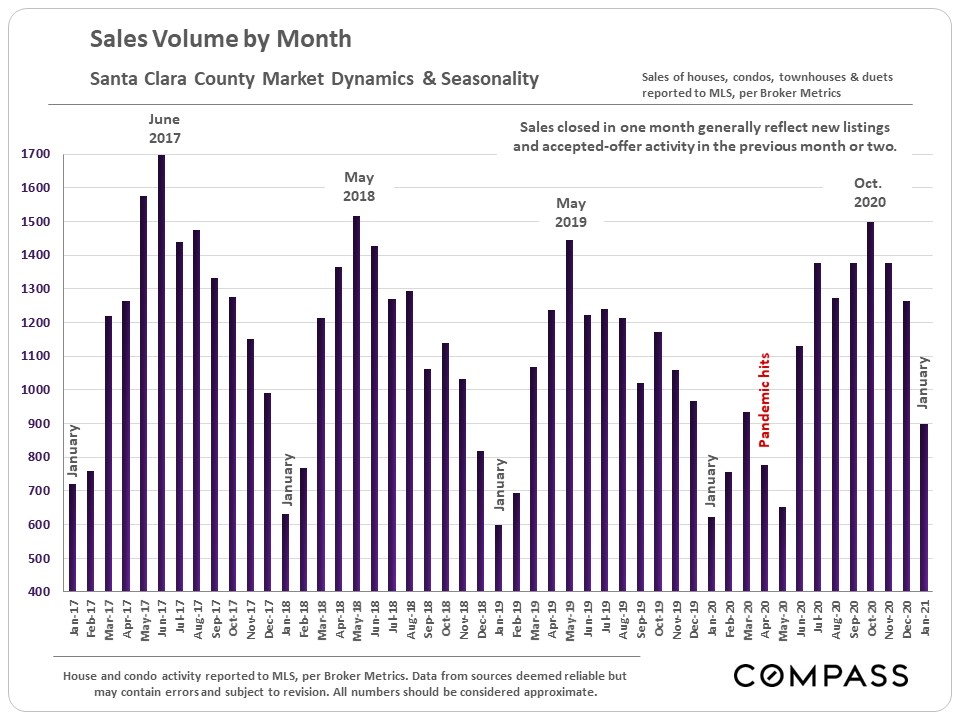
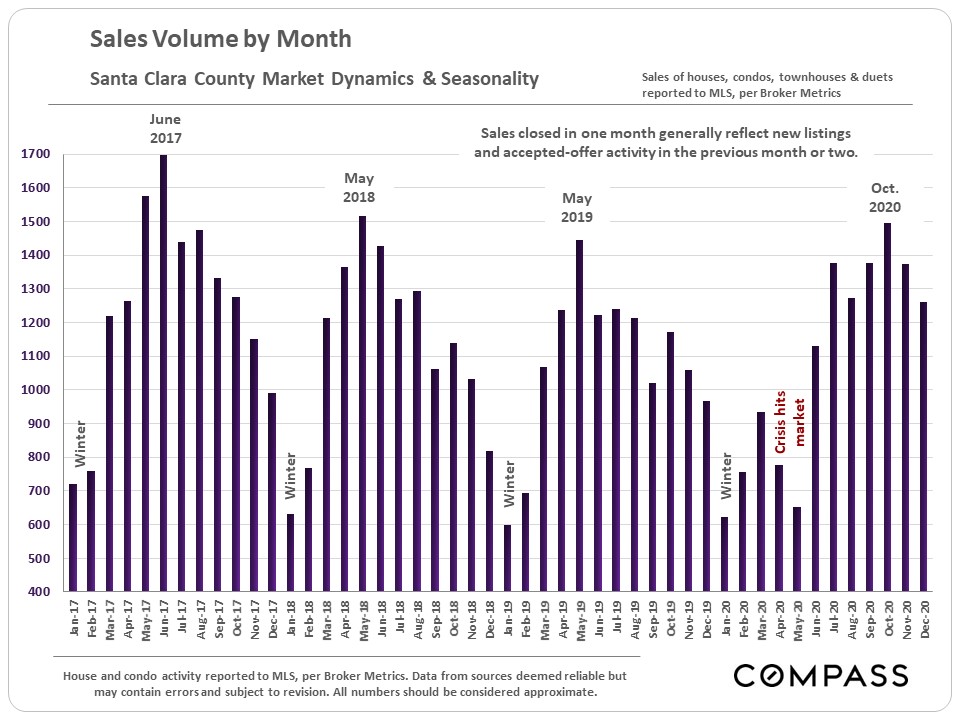
Total sales volume: +66%
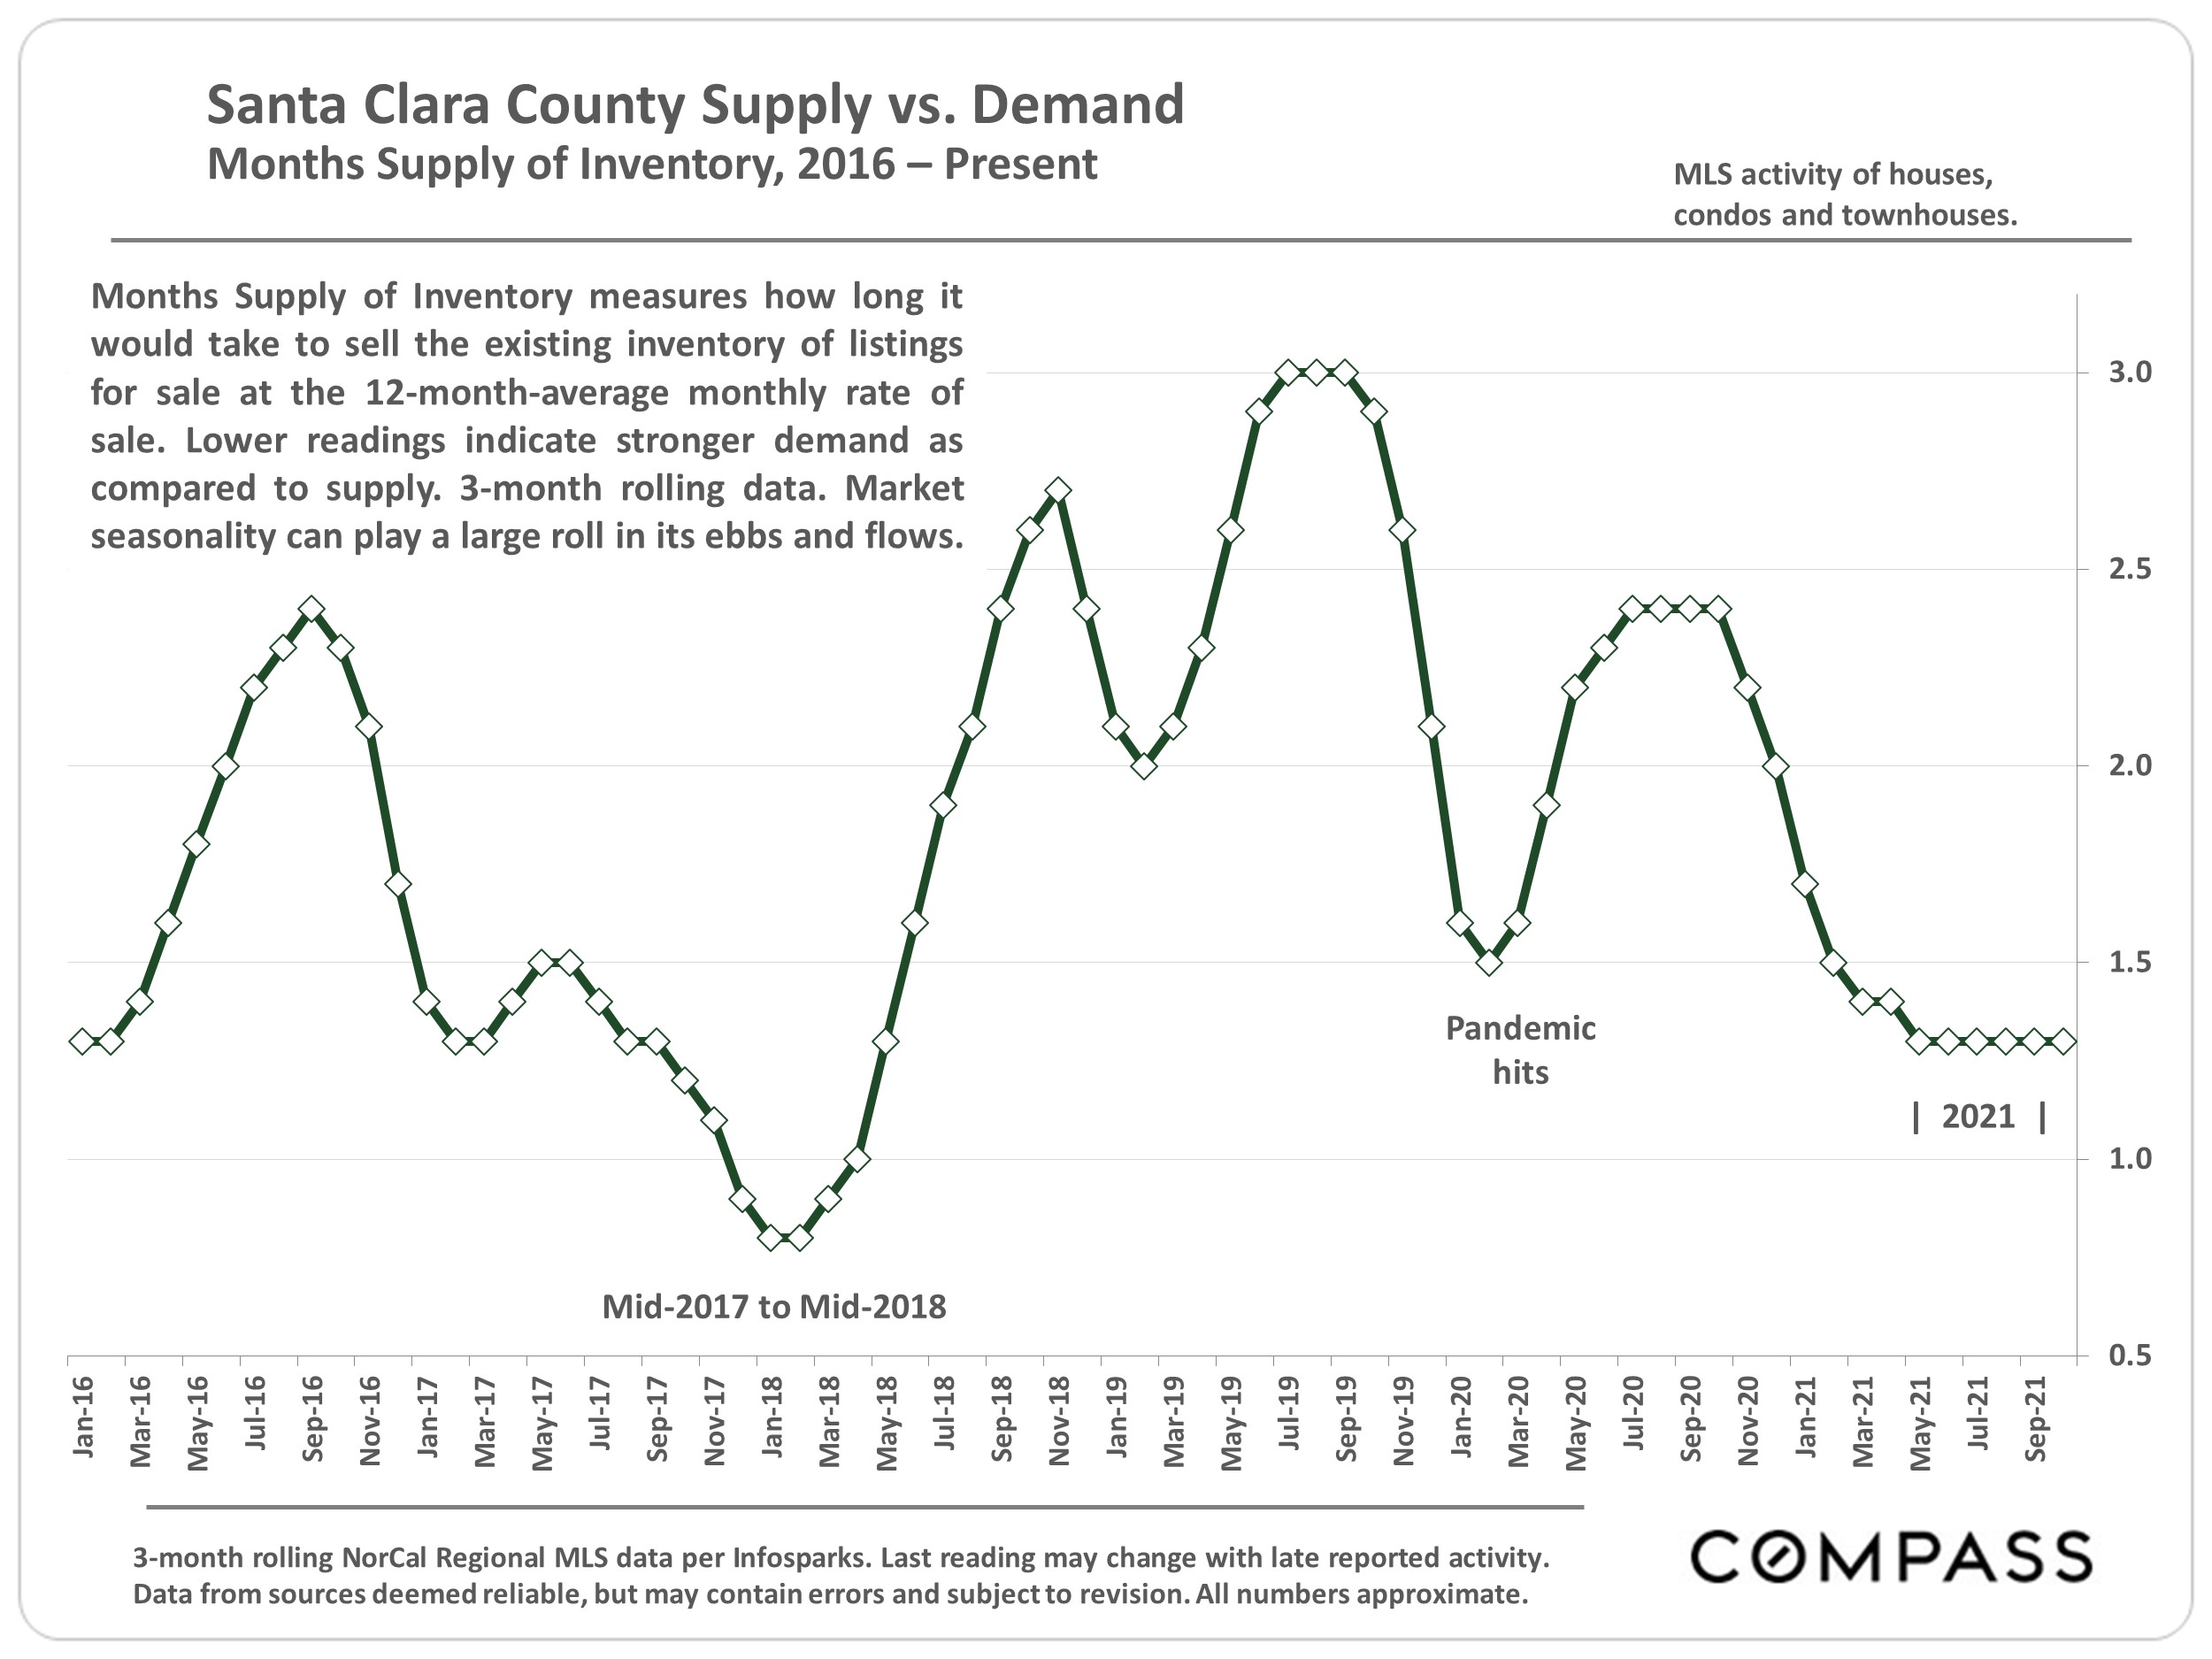
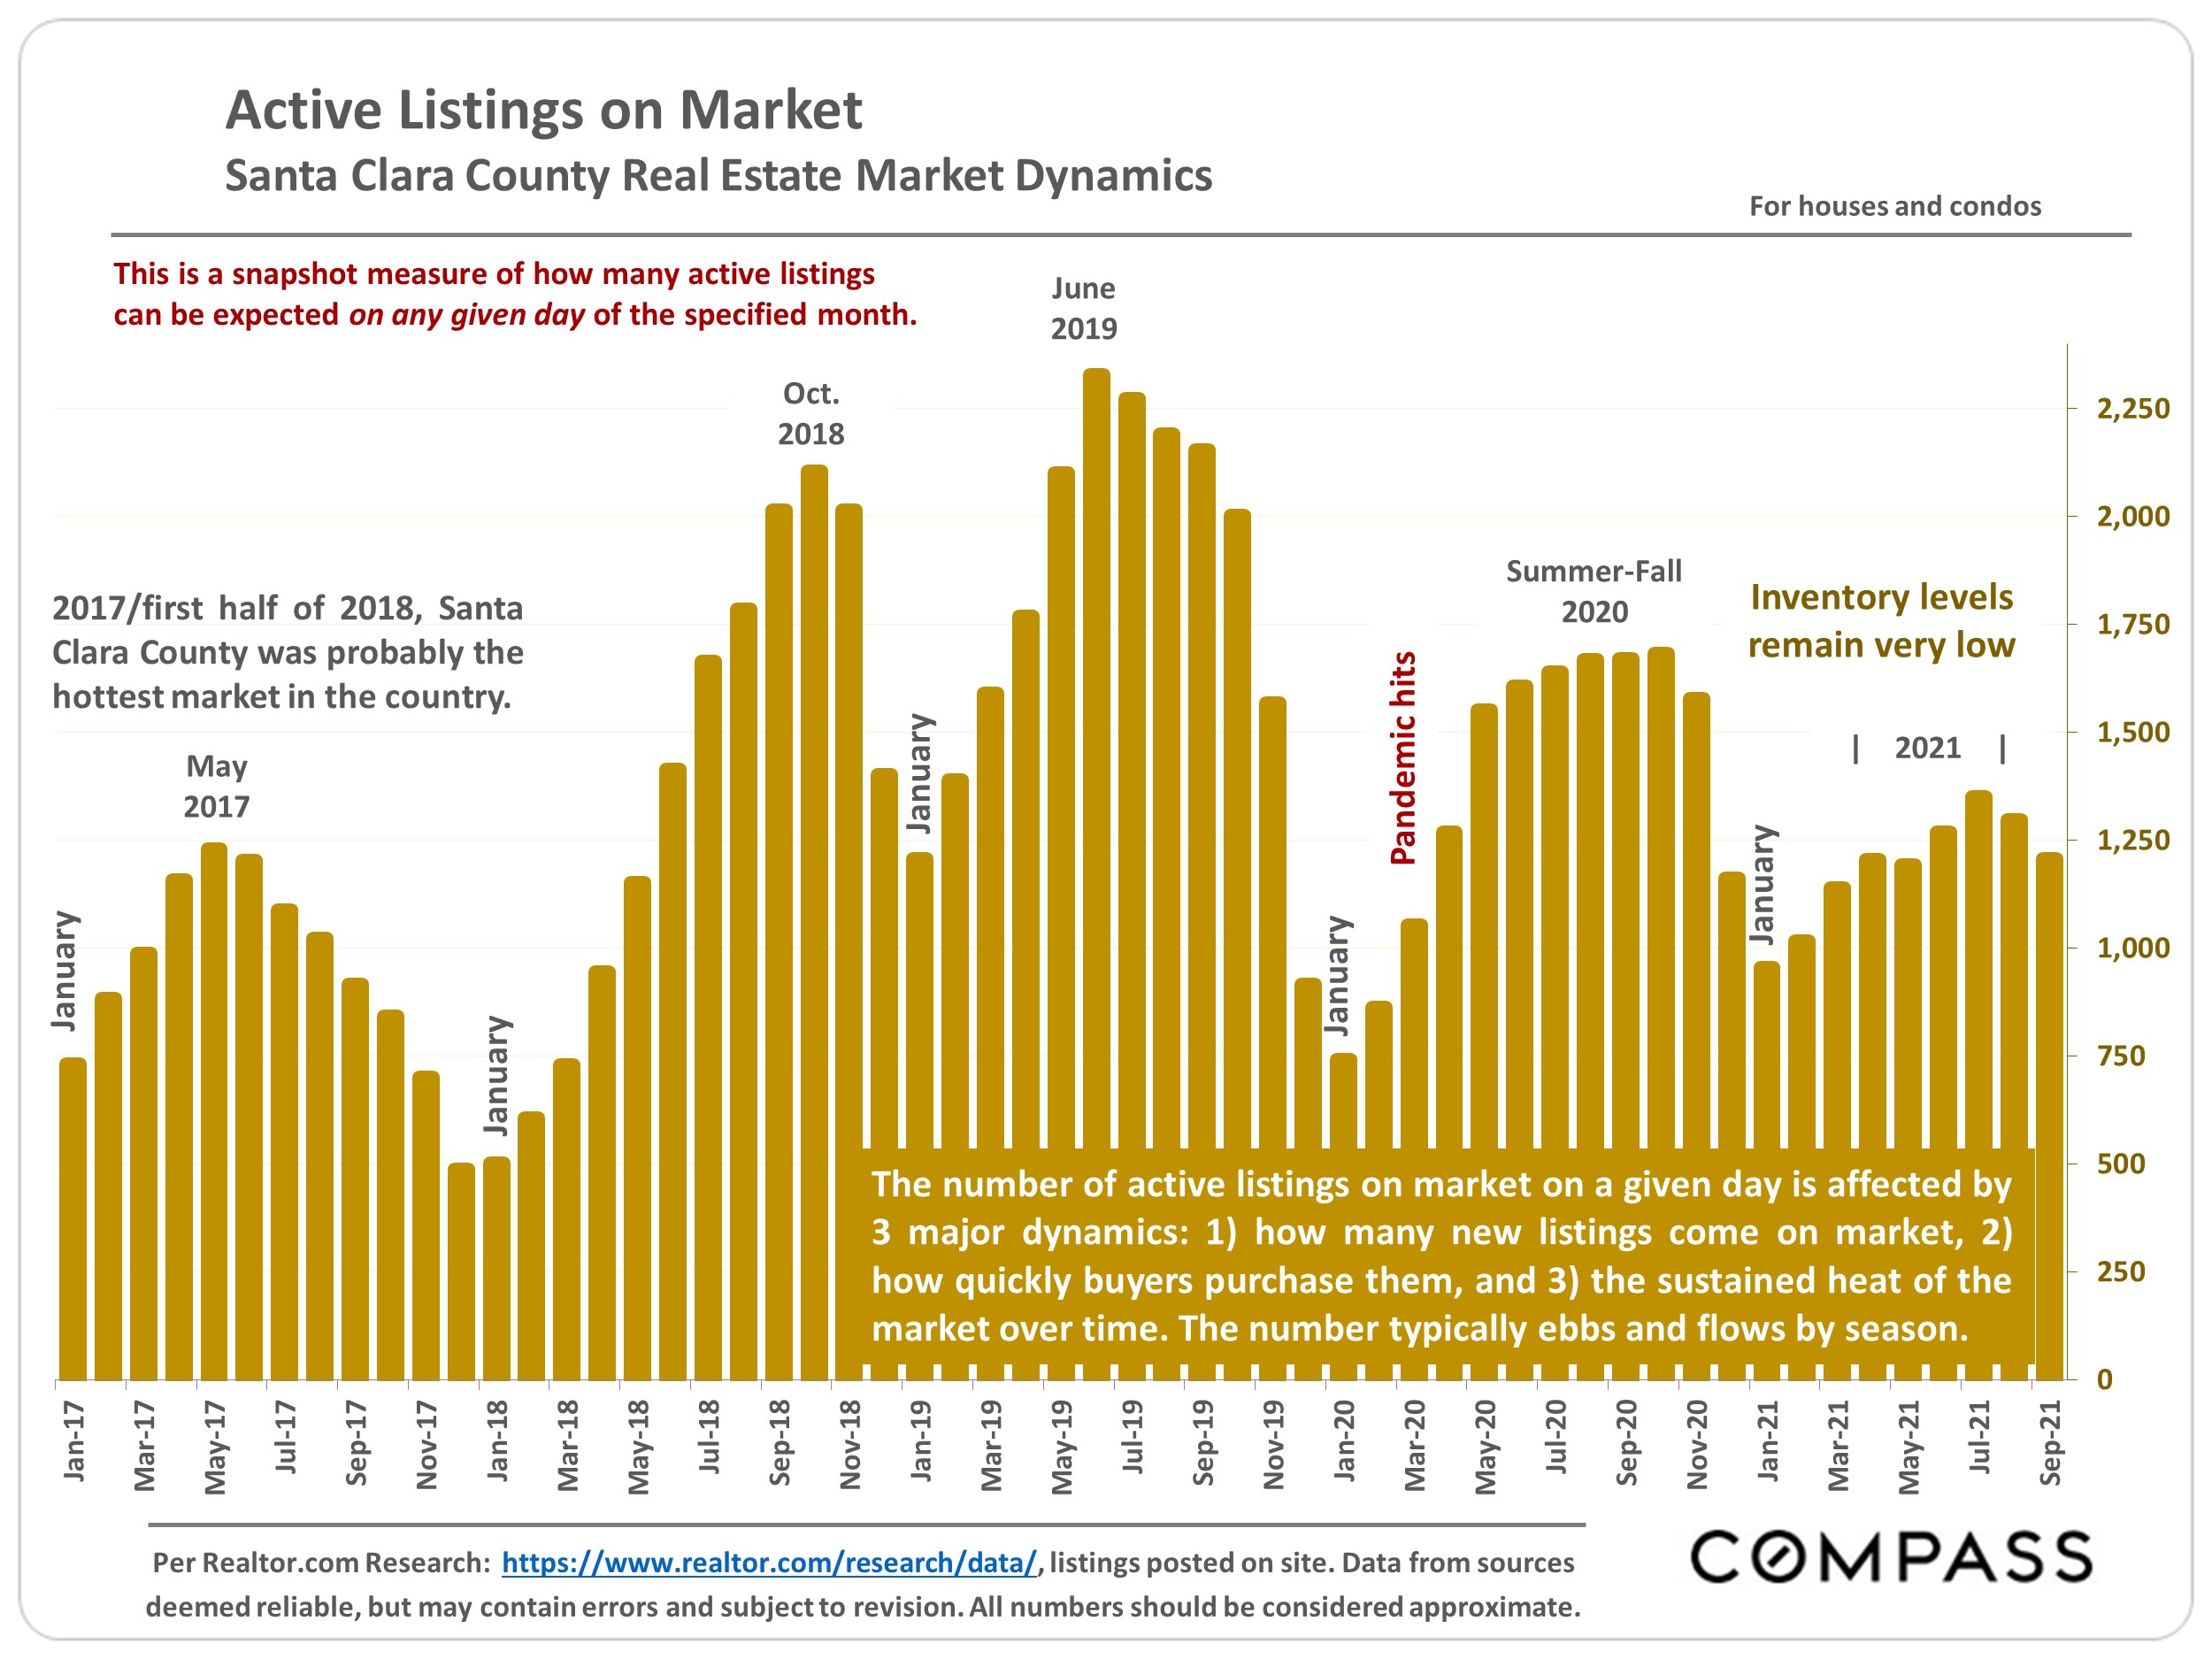
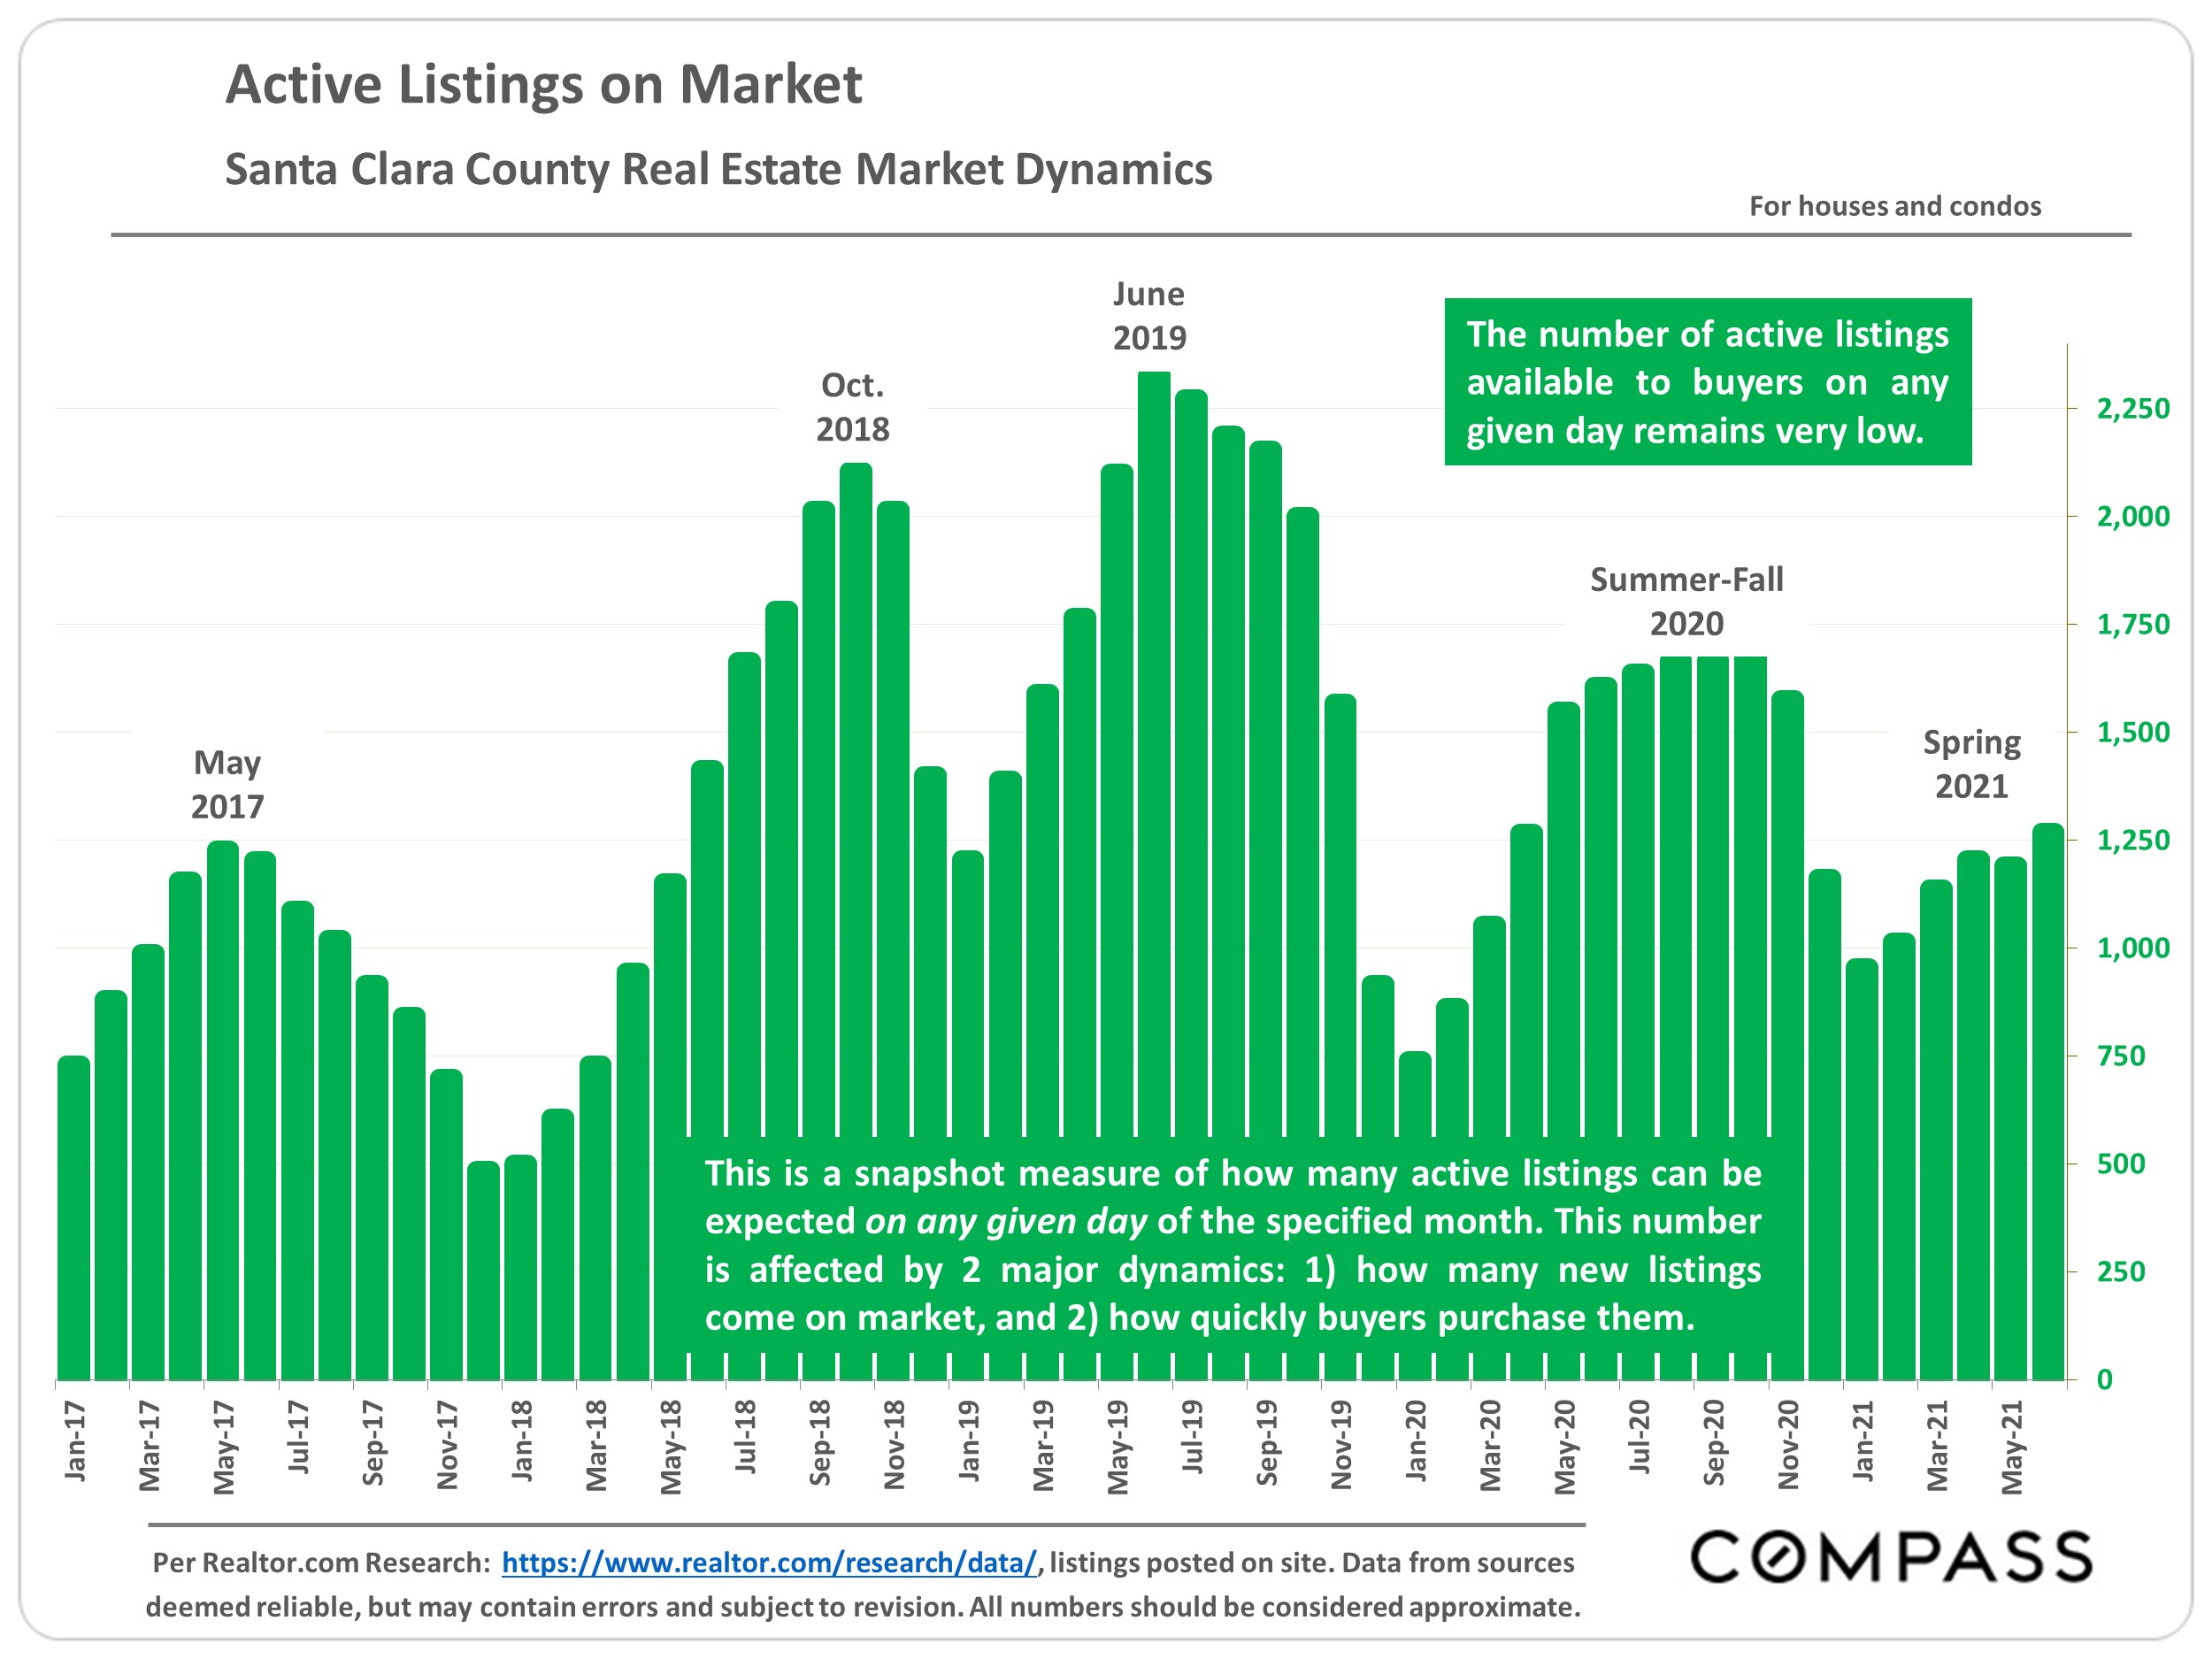
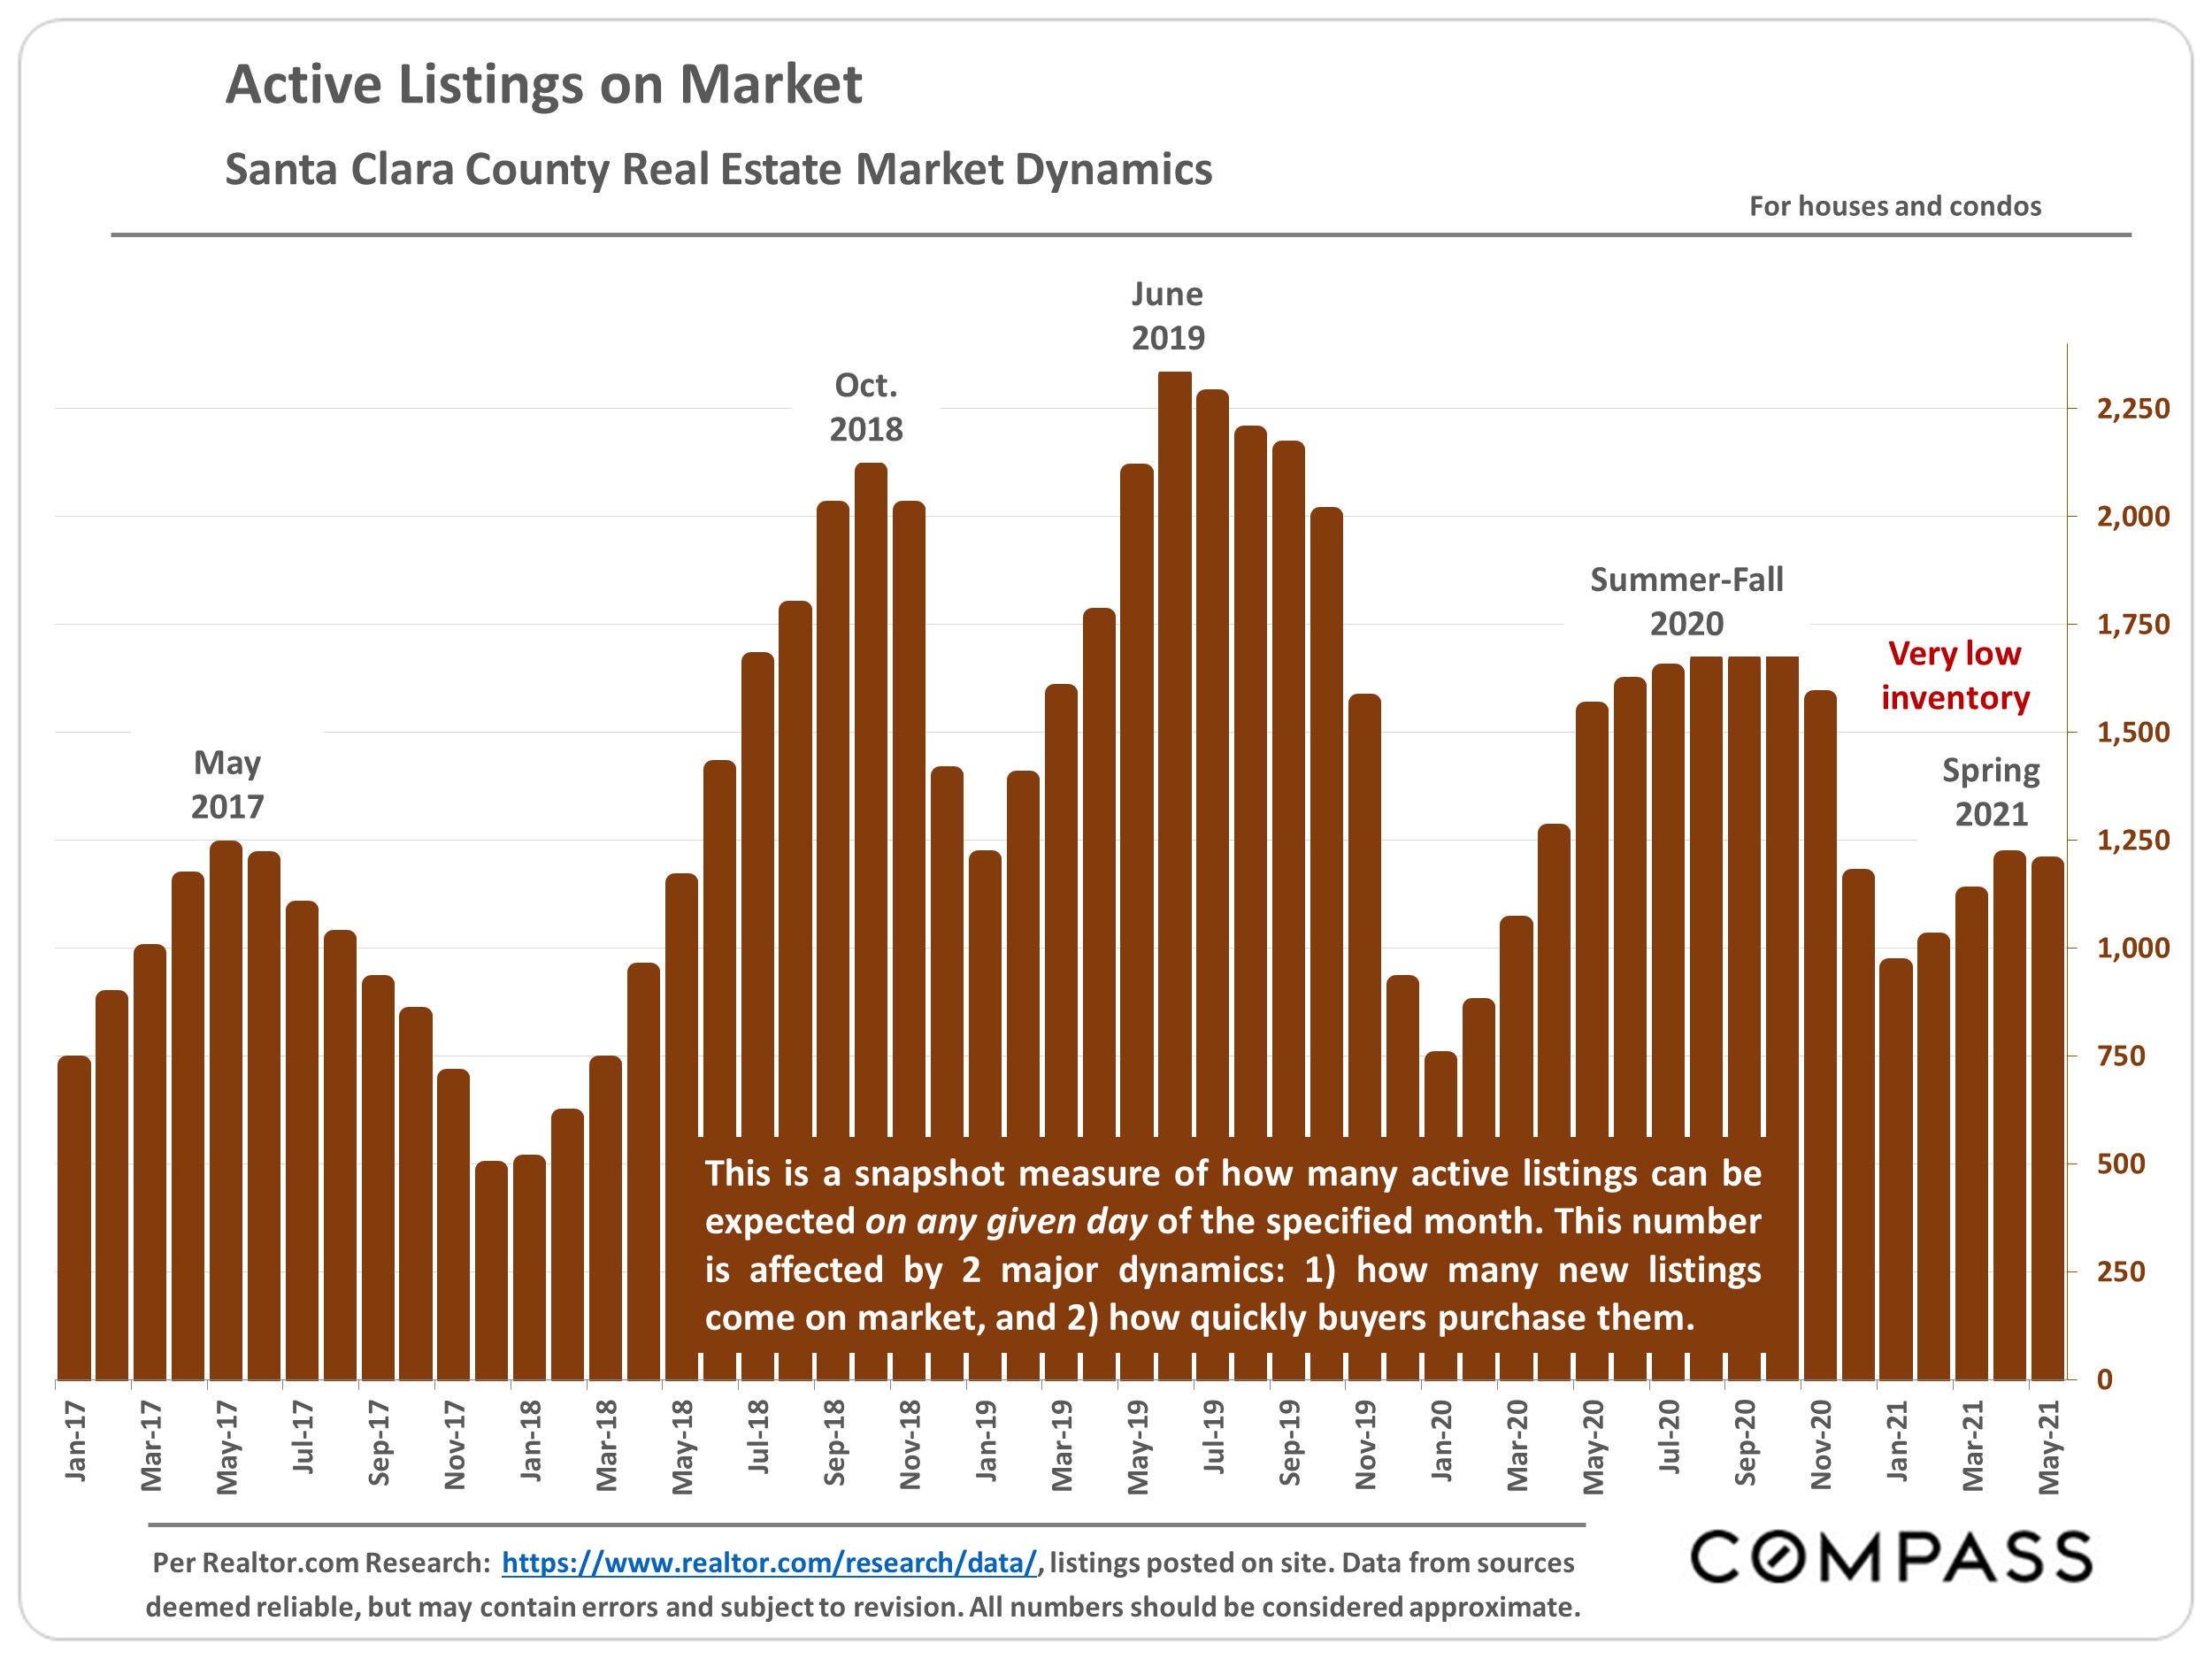
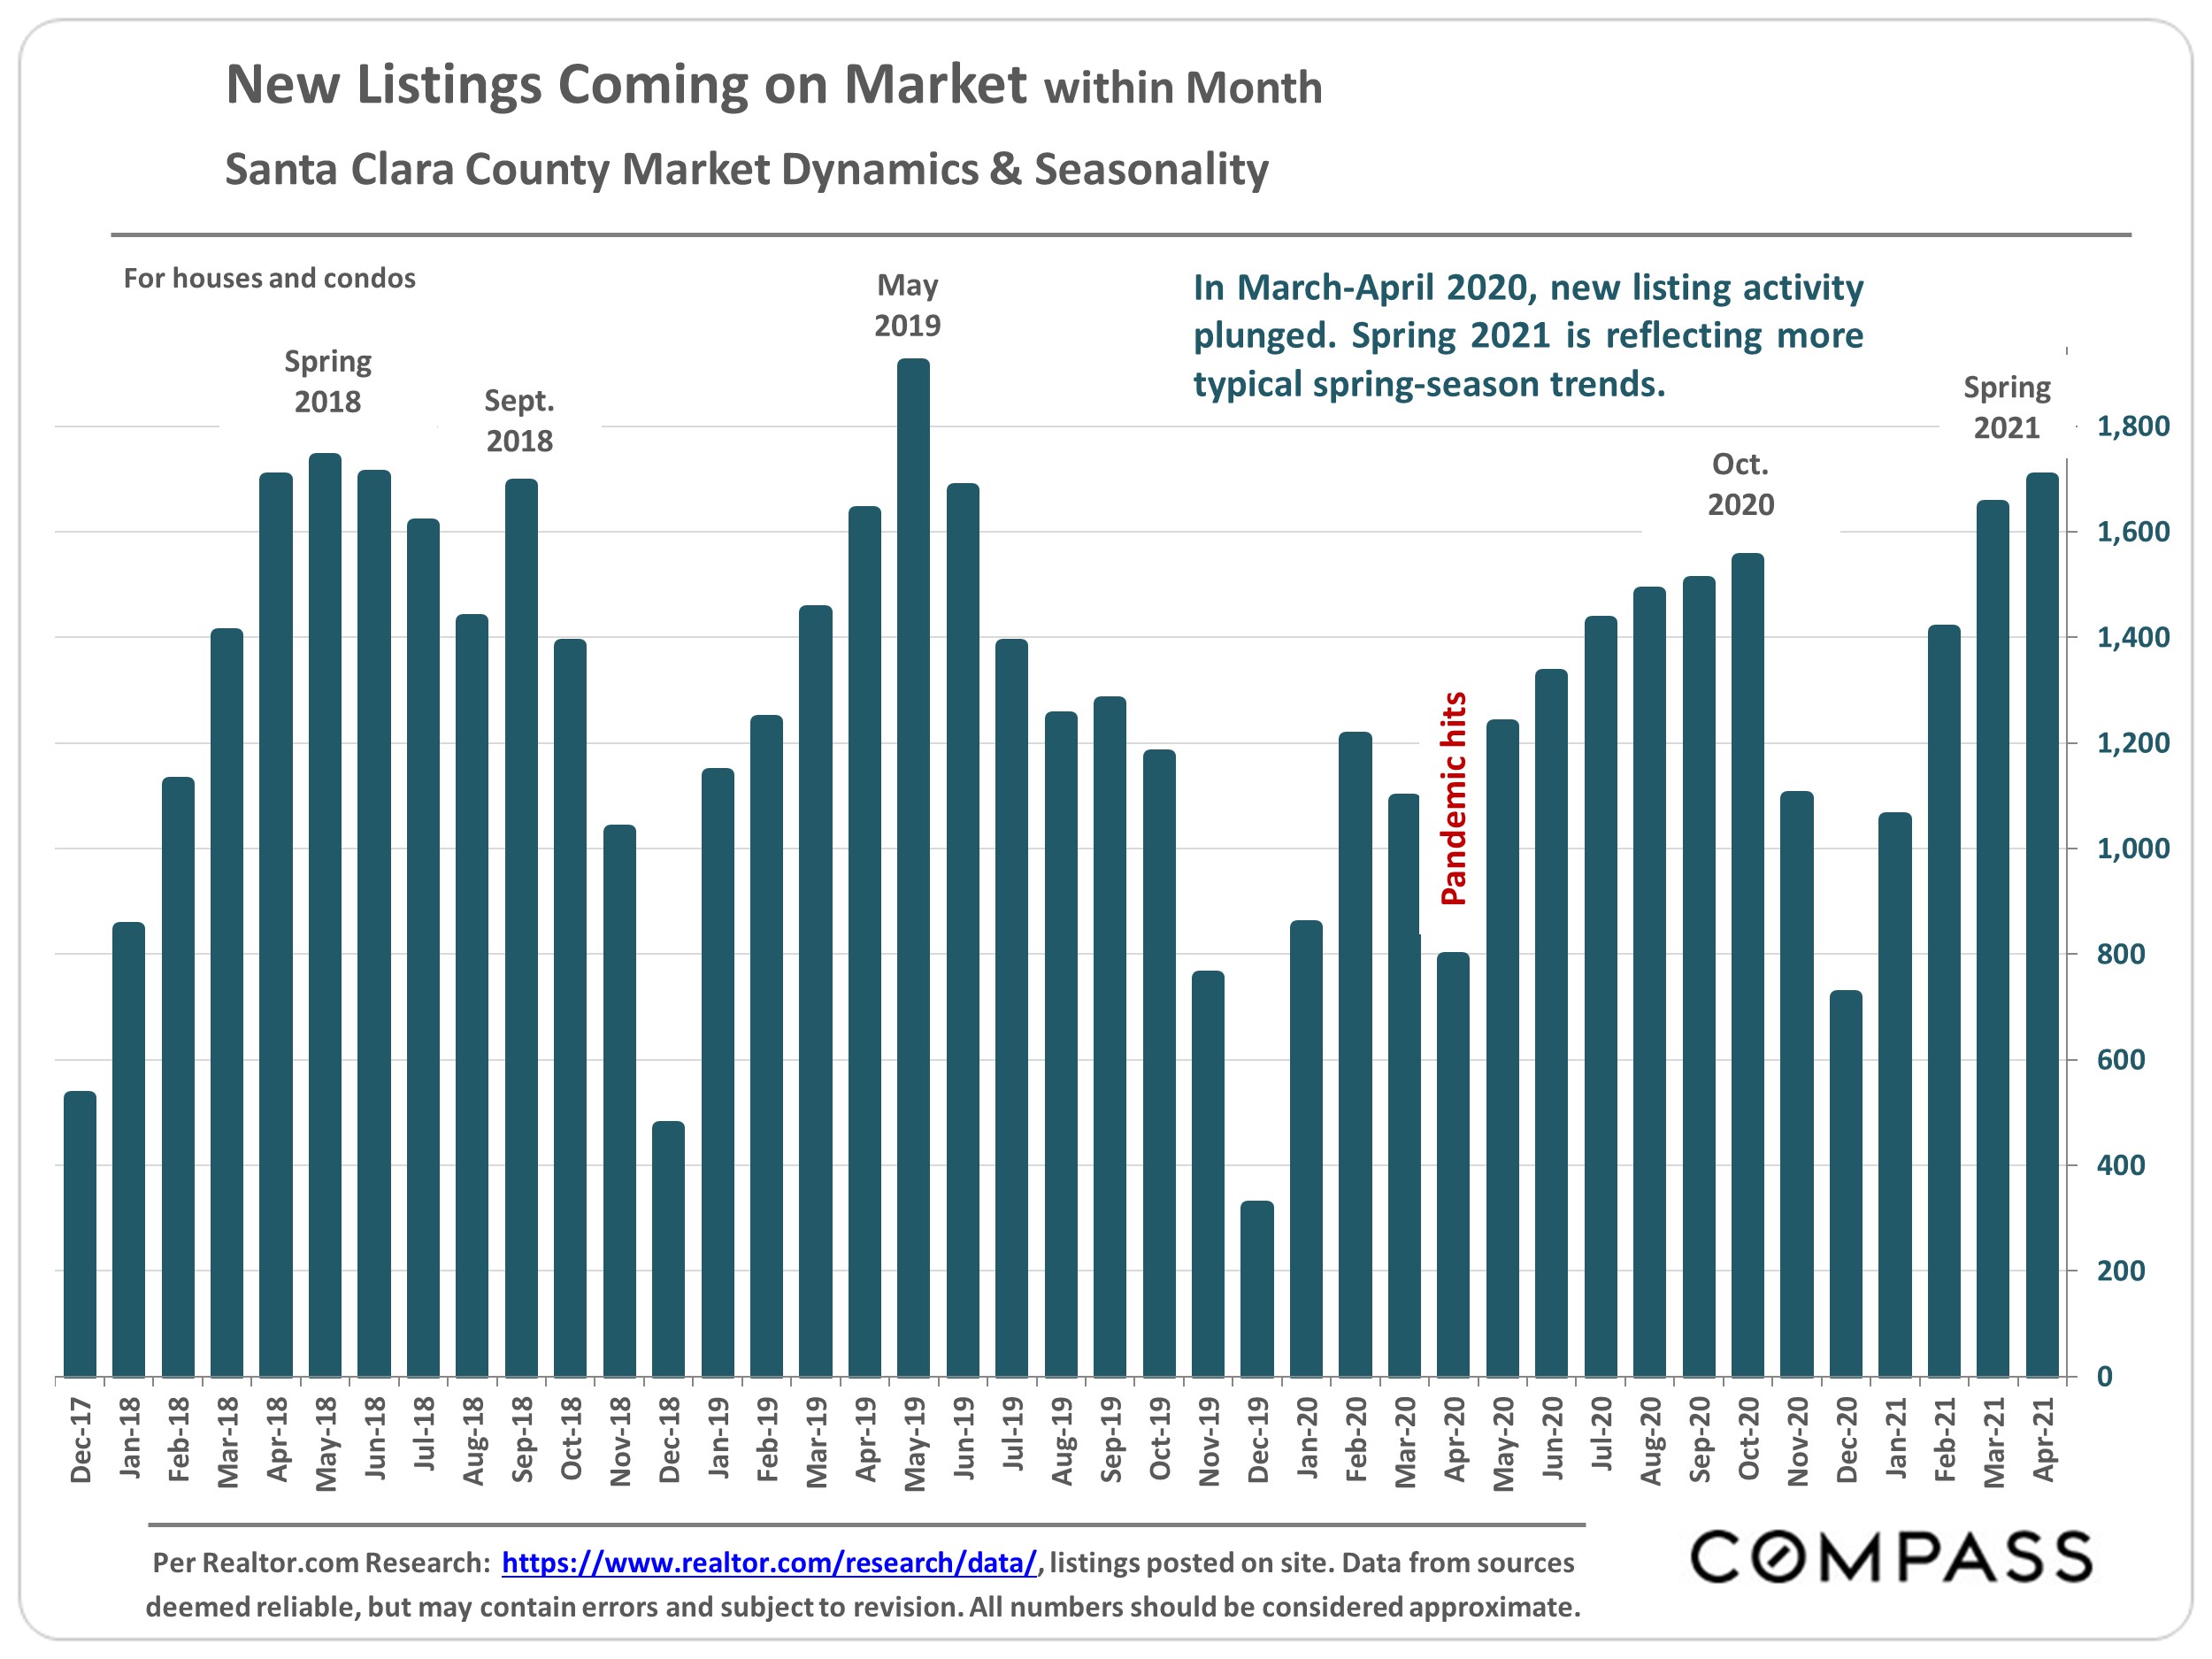
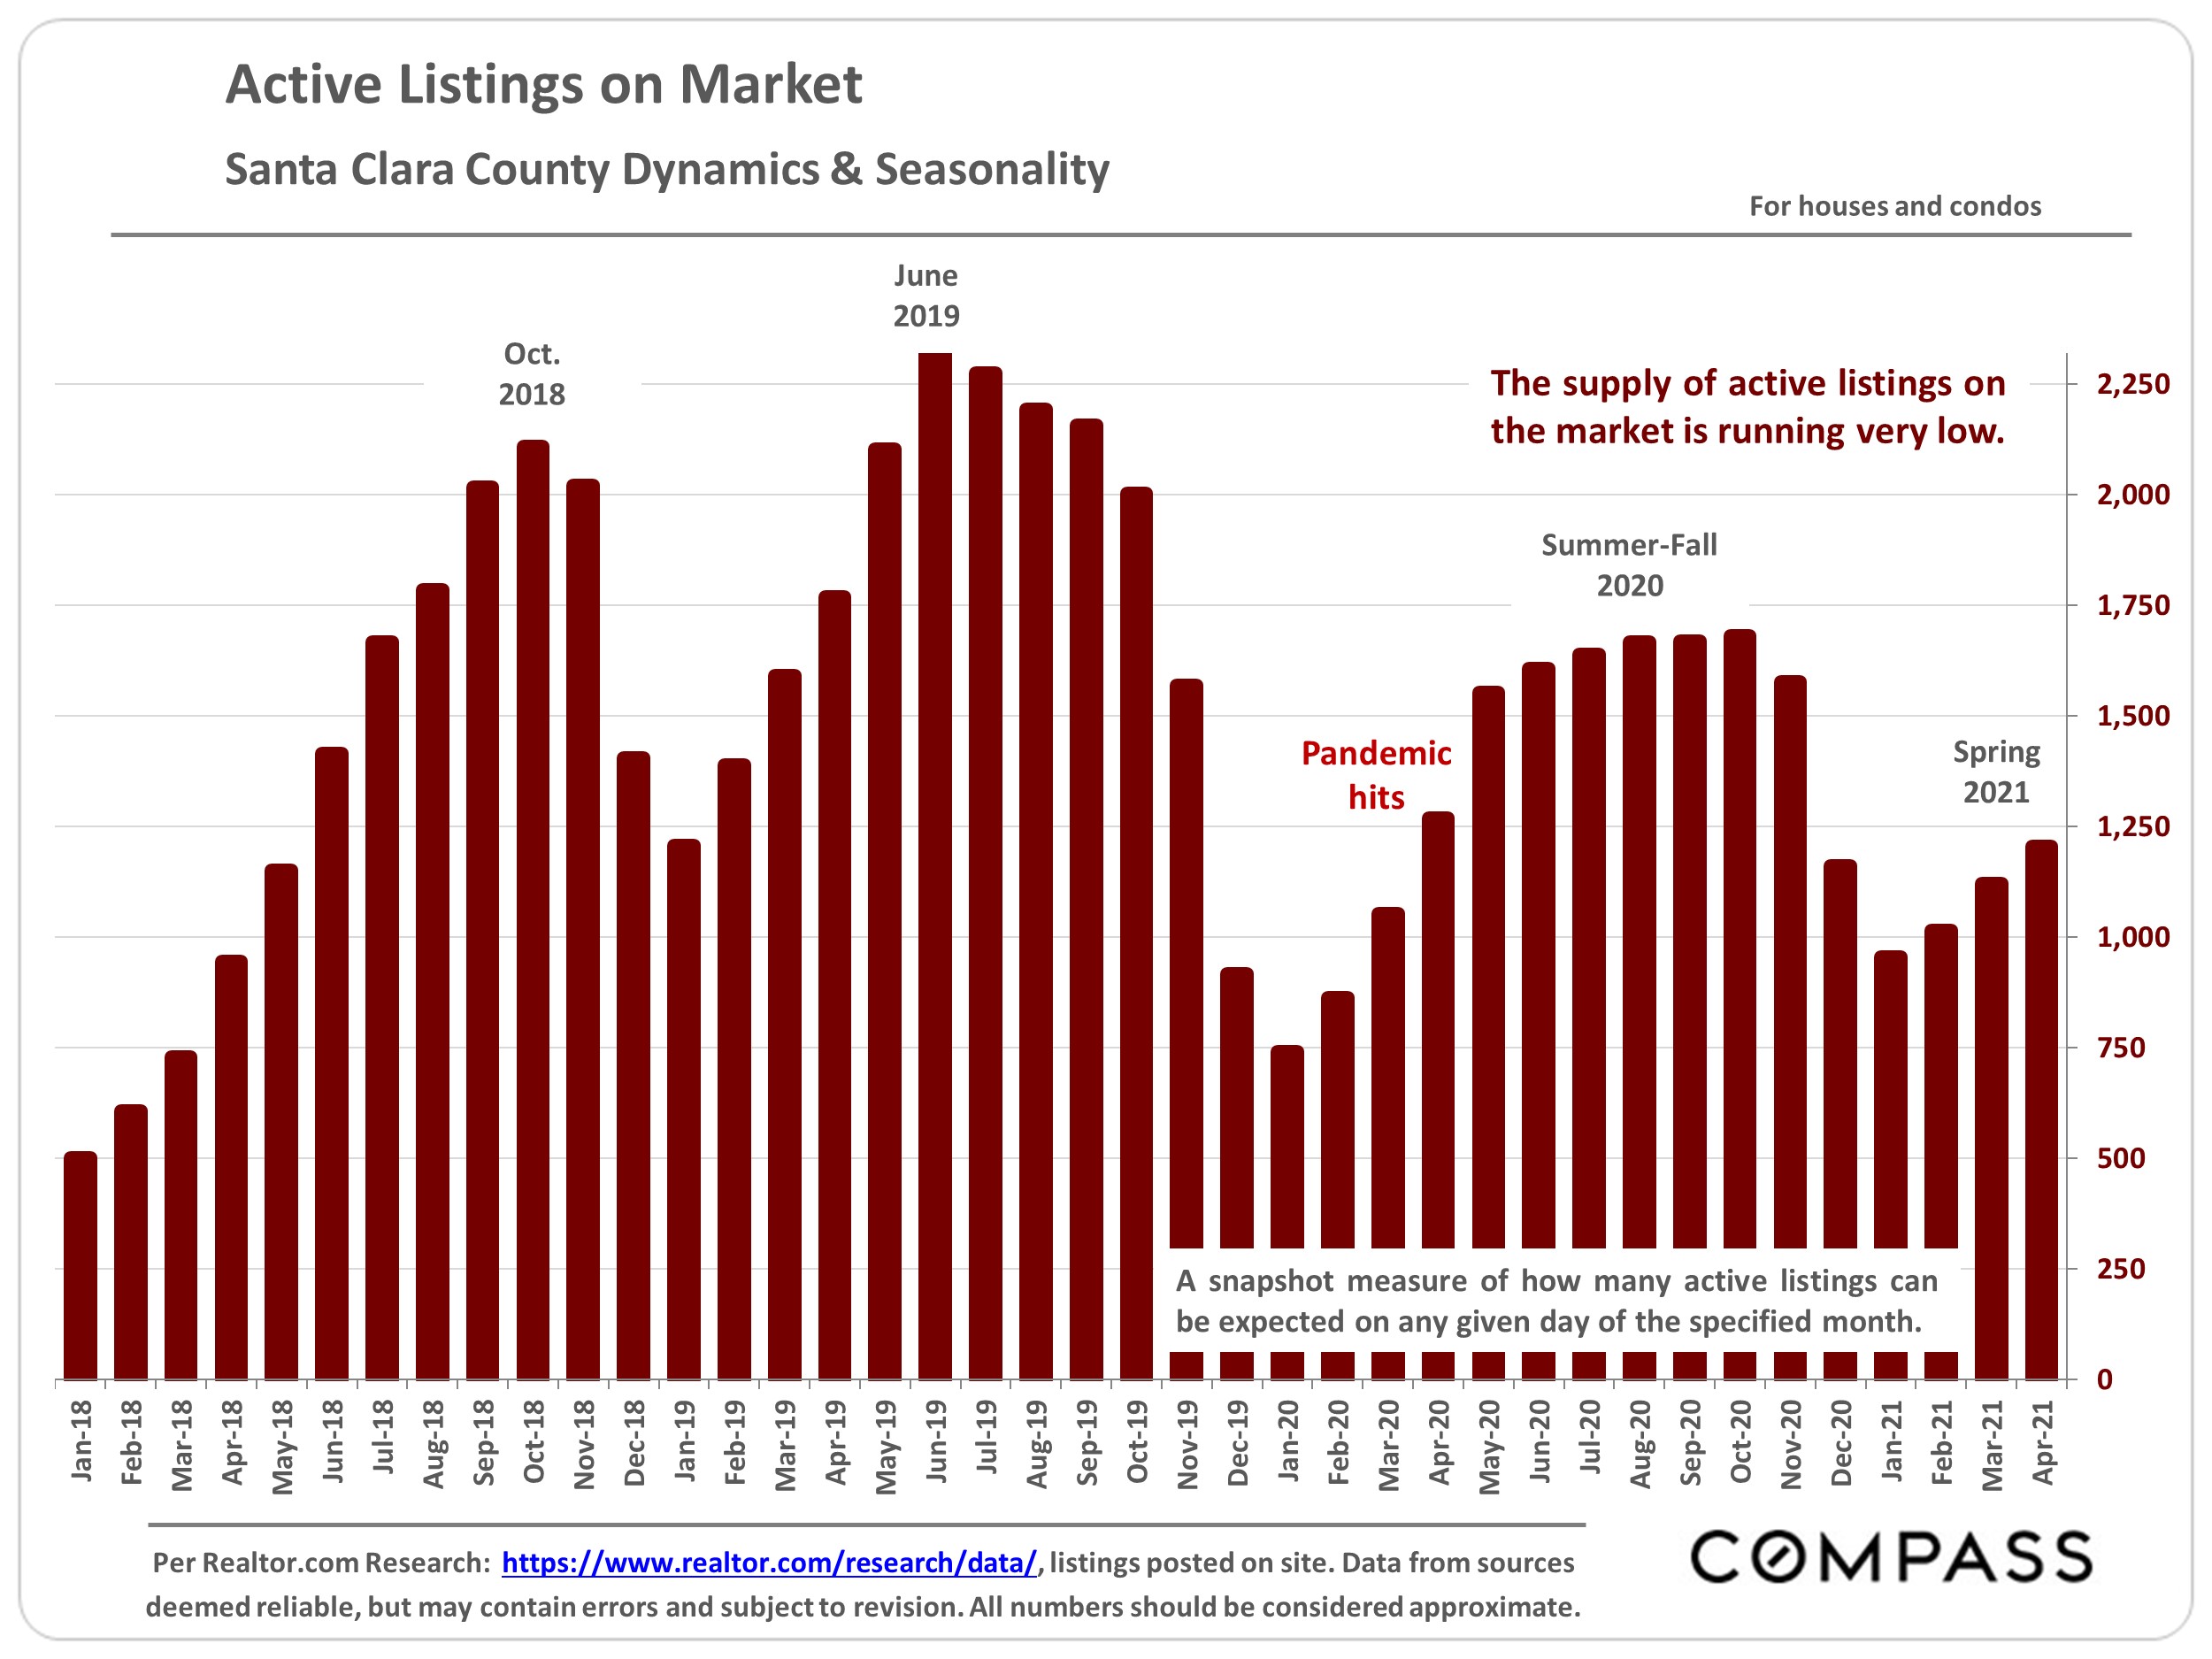
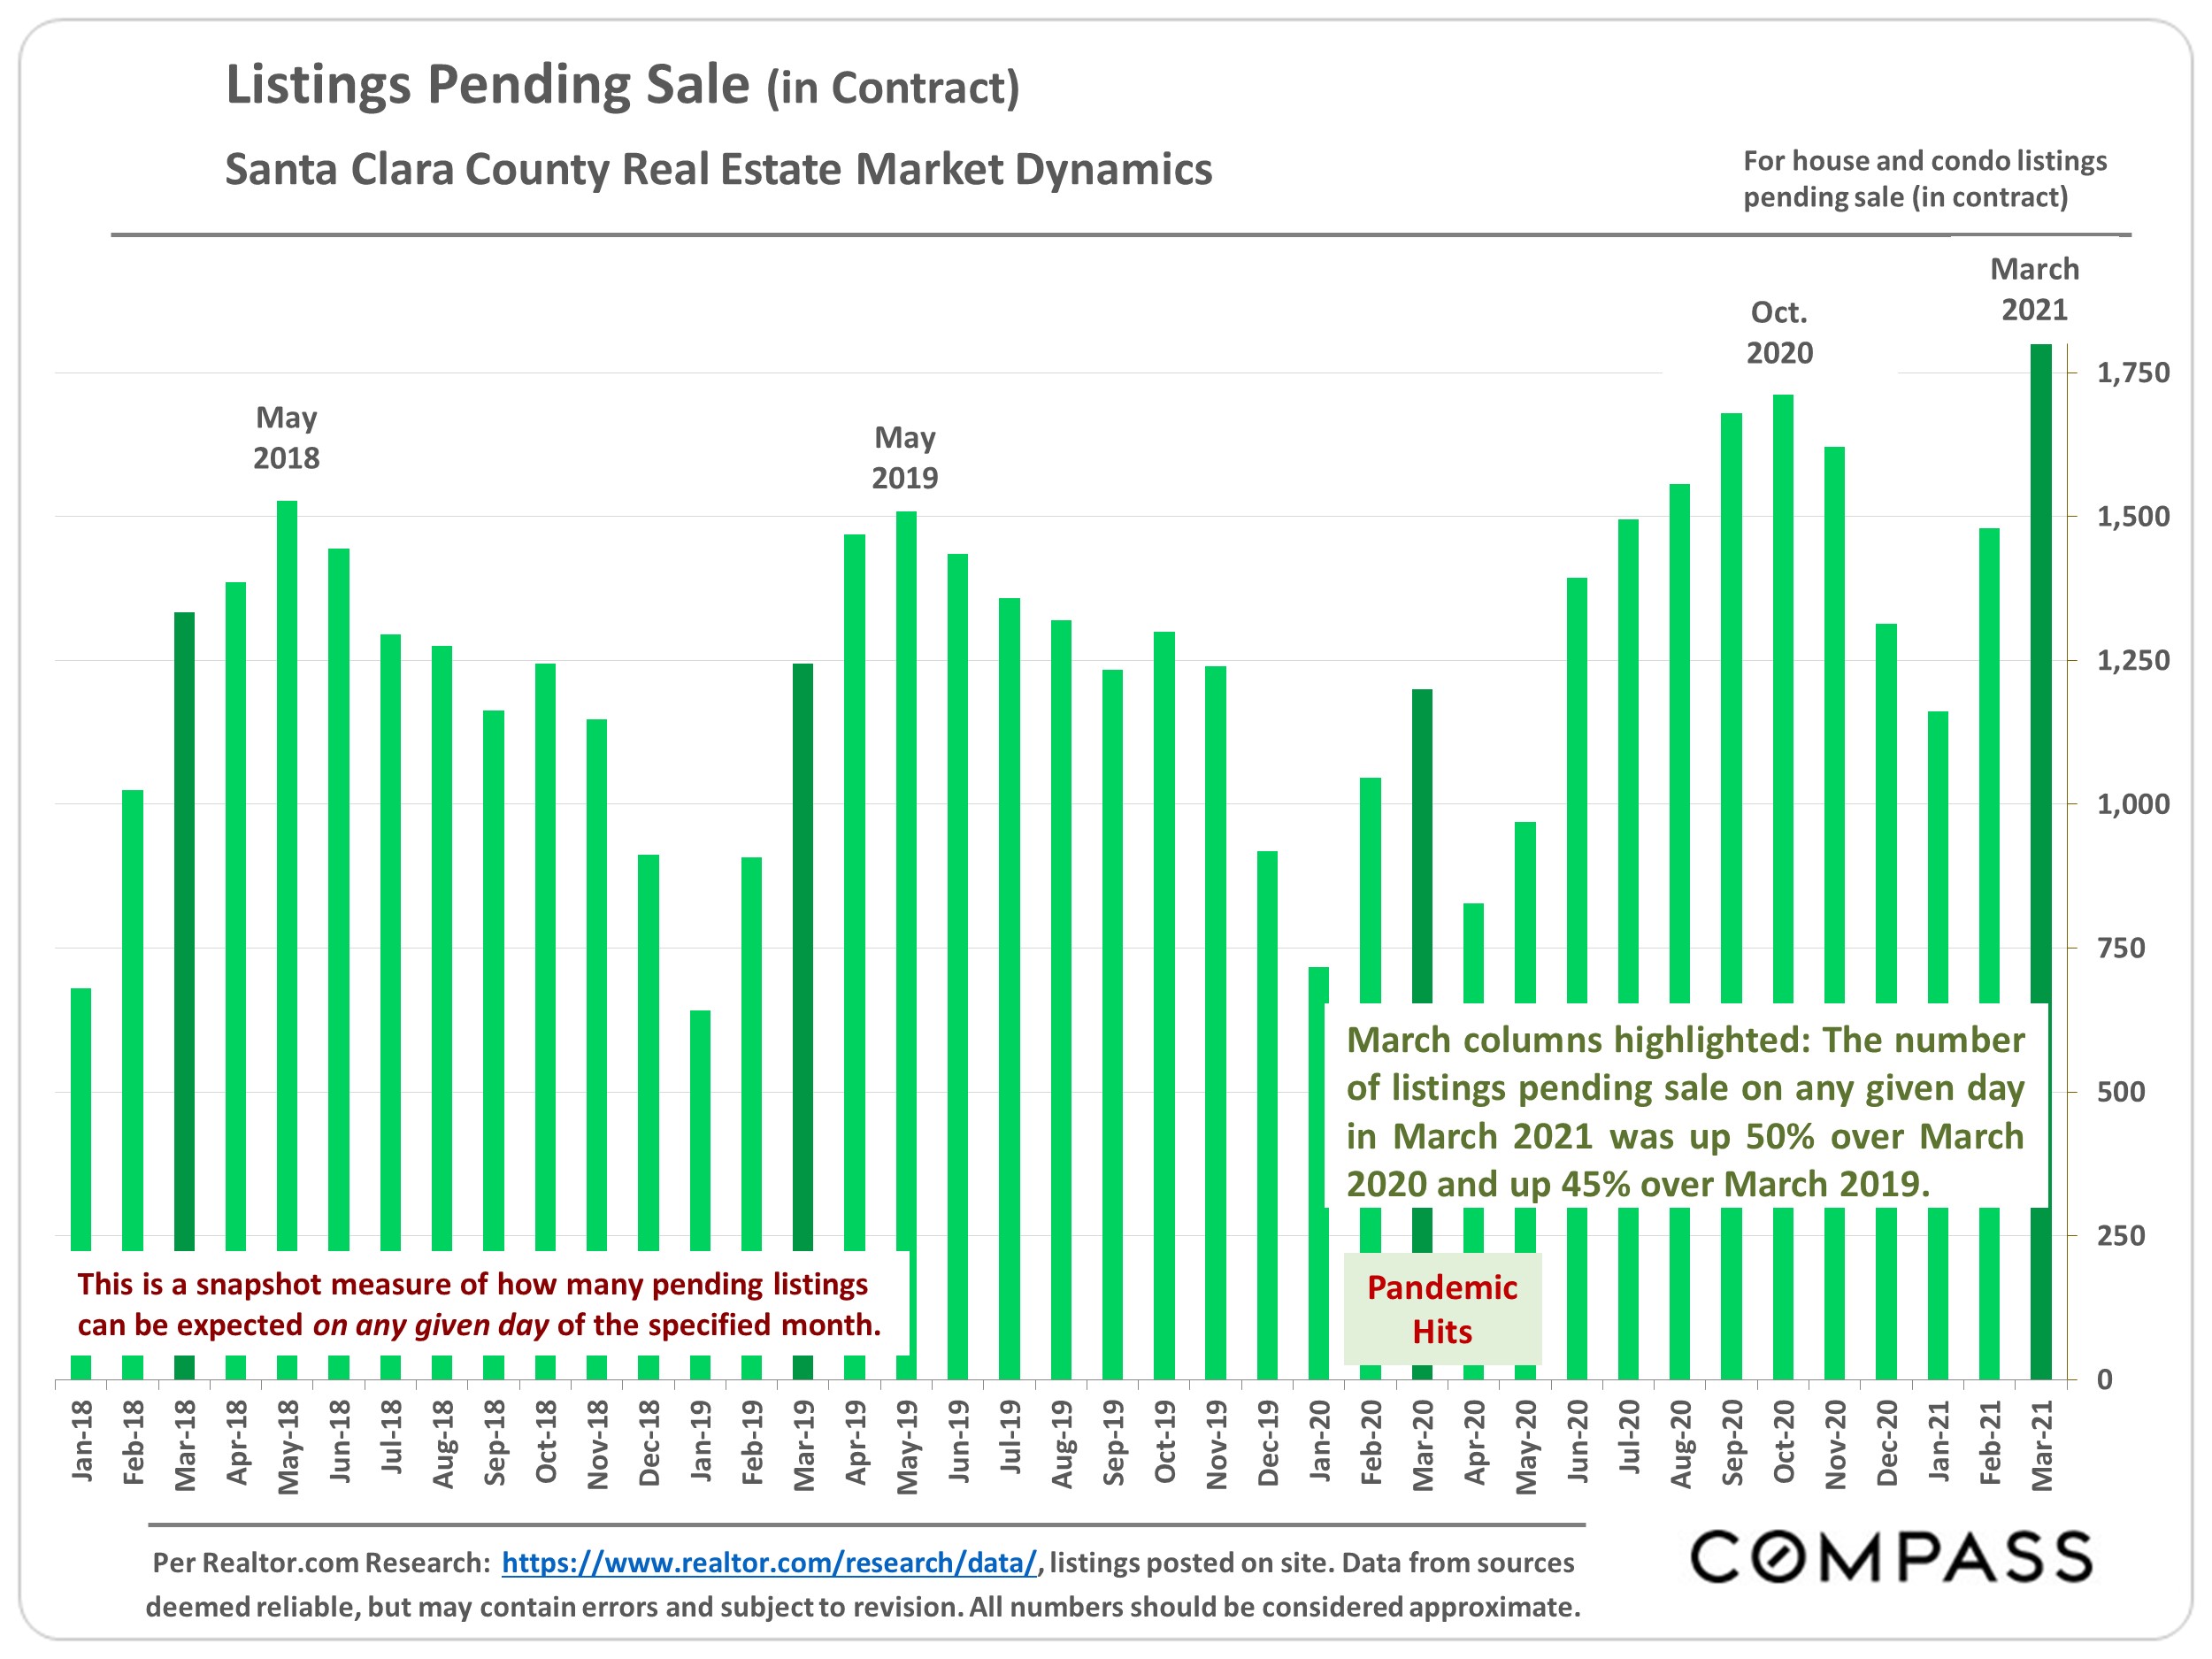
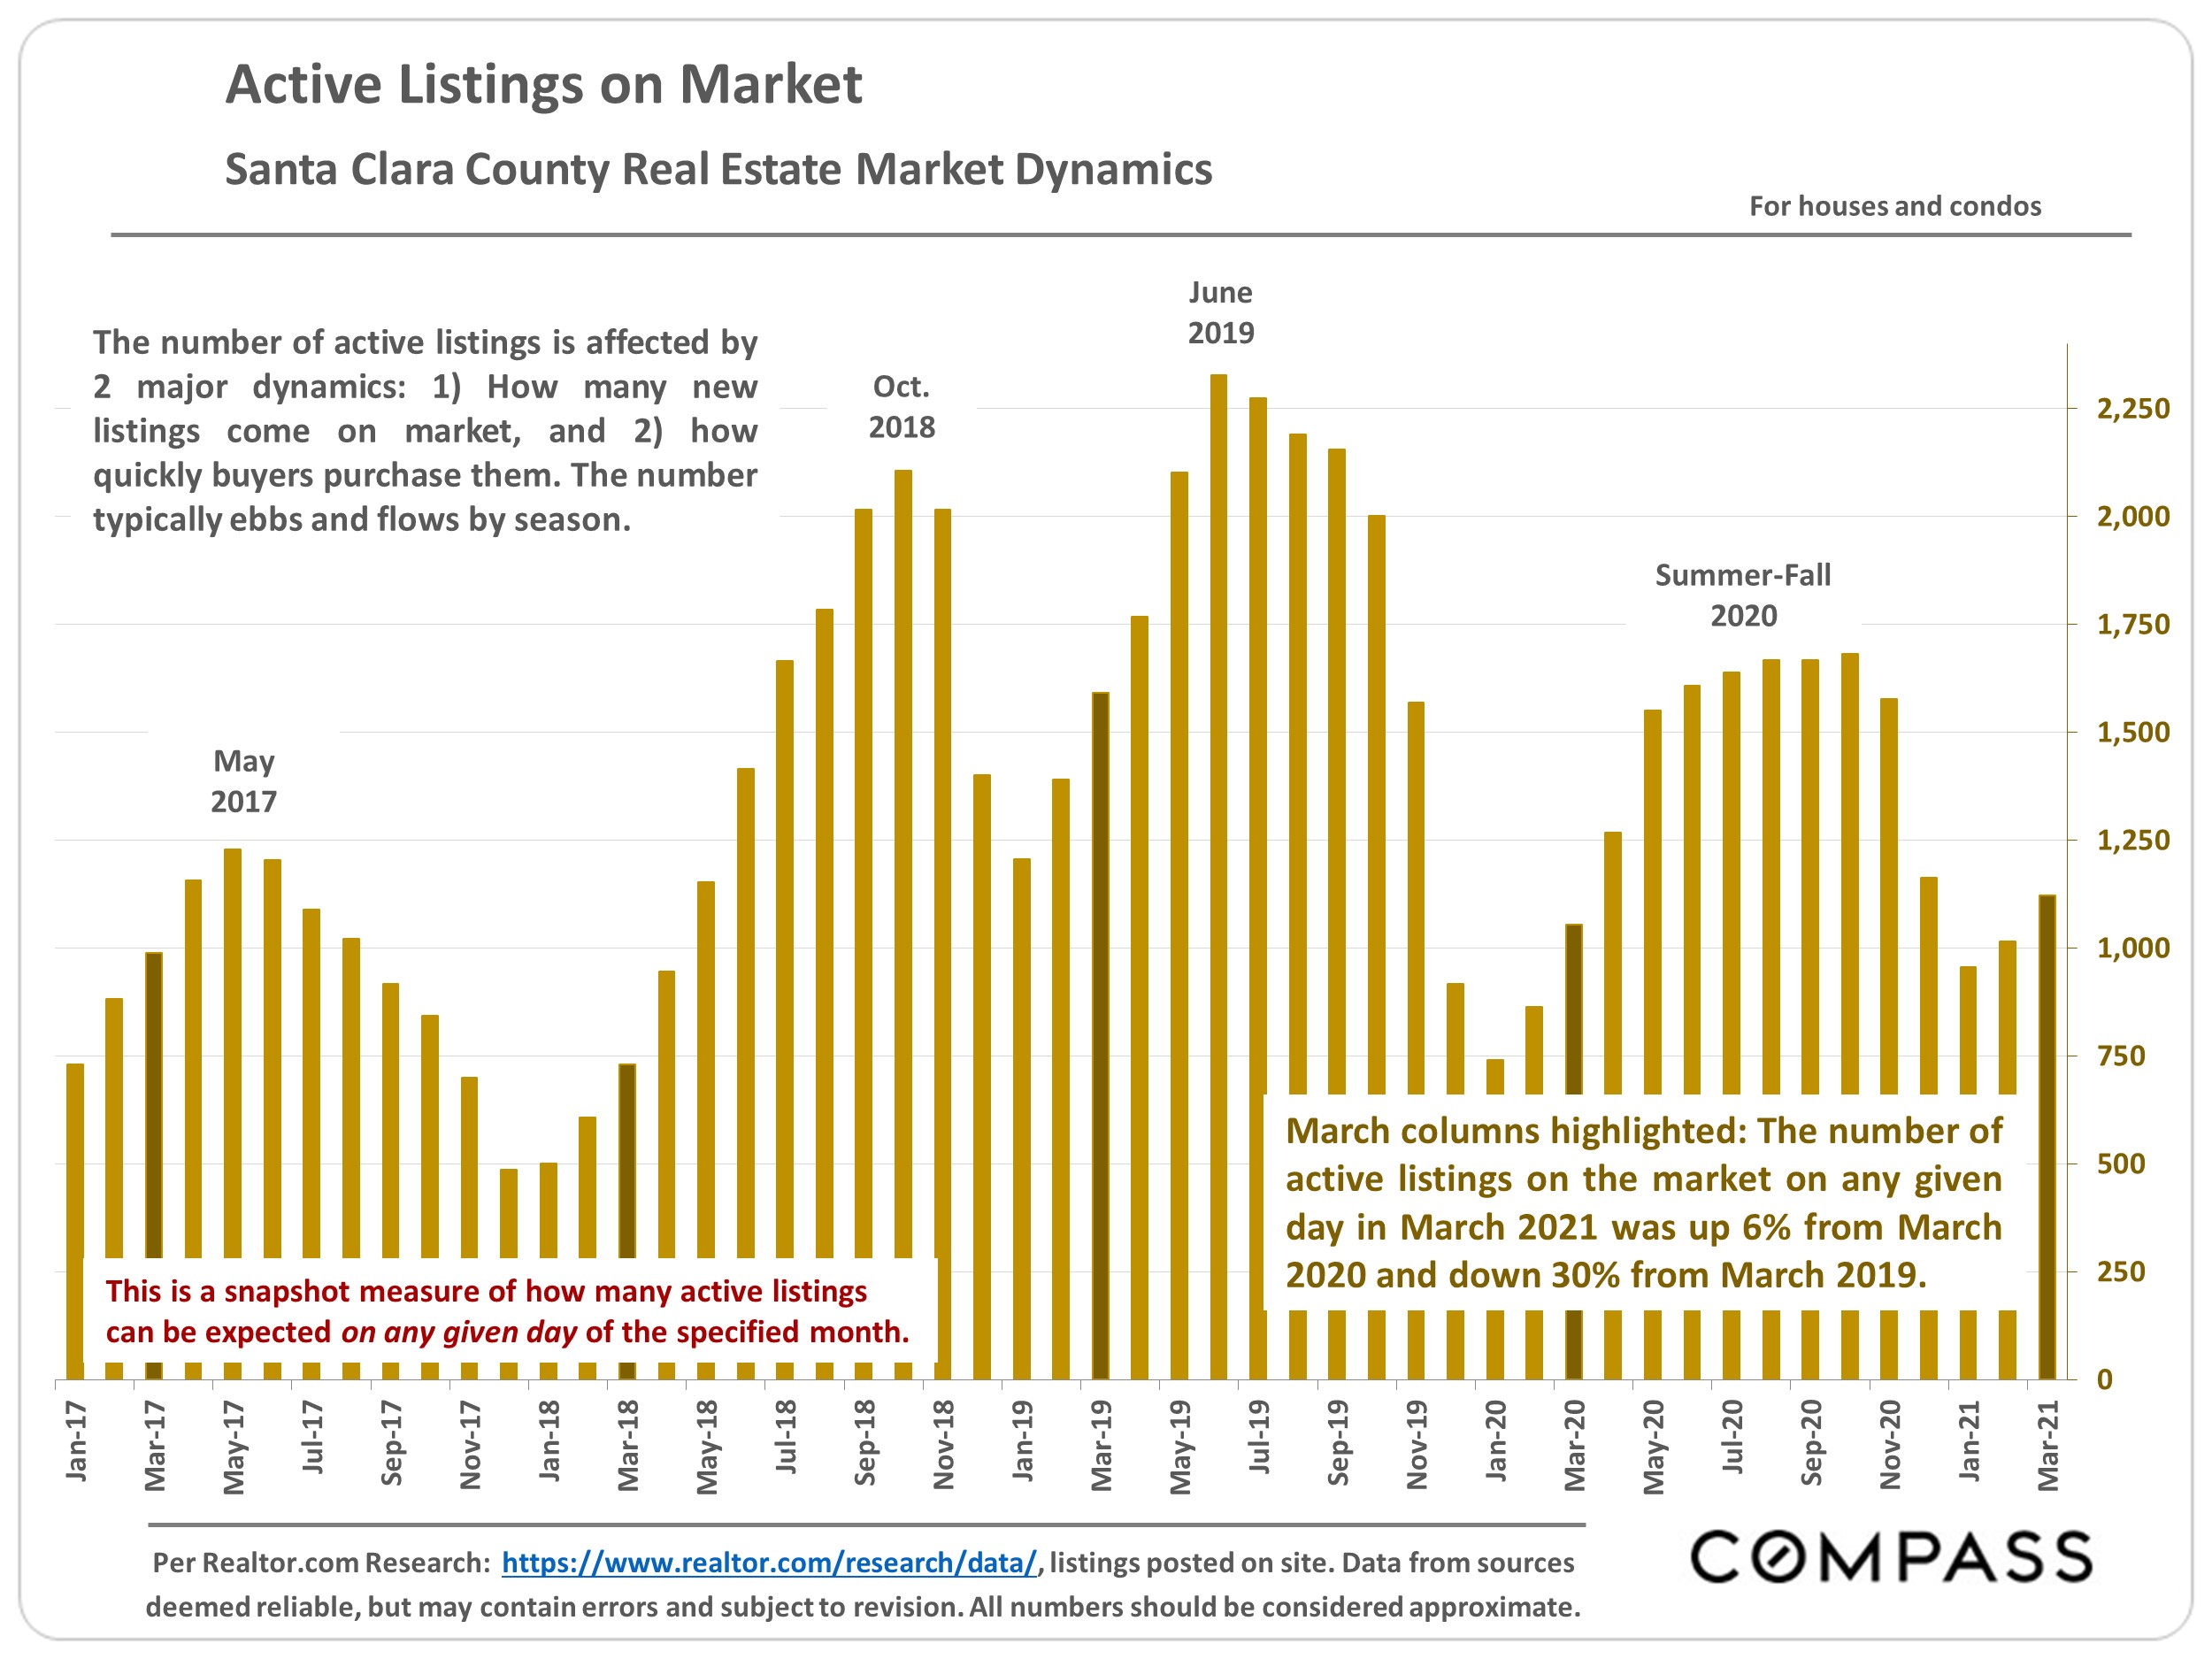
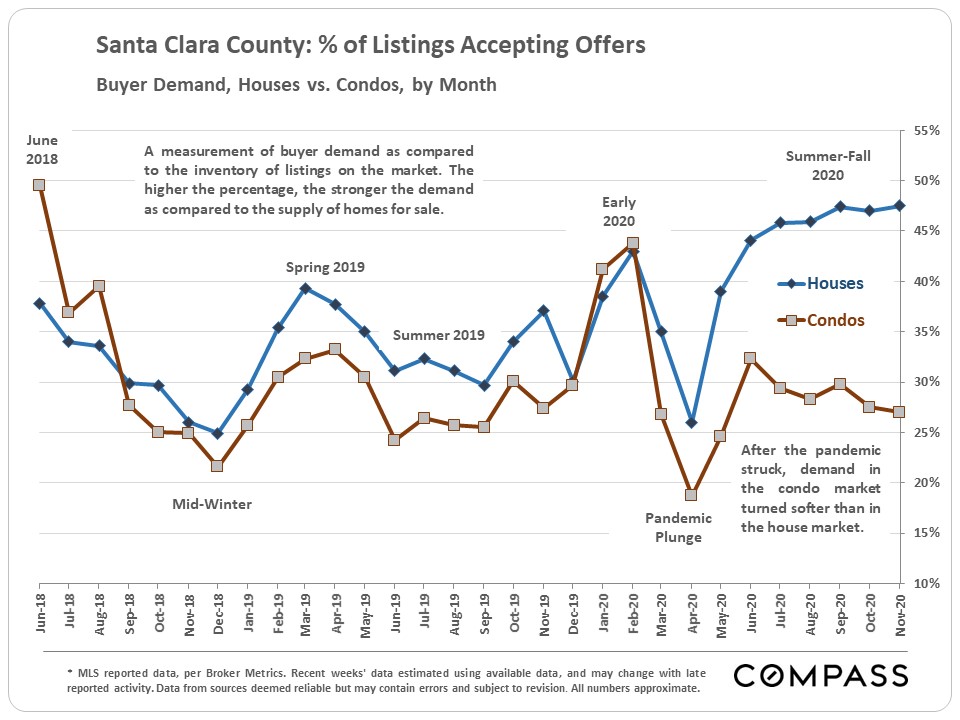
Actives listings at end of the month: -6% (4-month average)
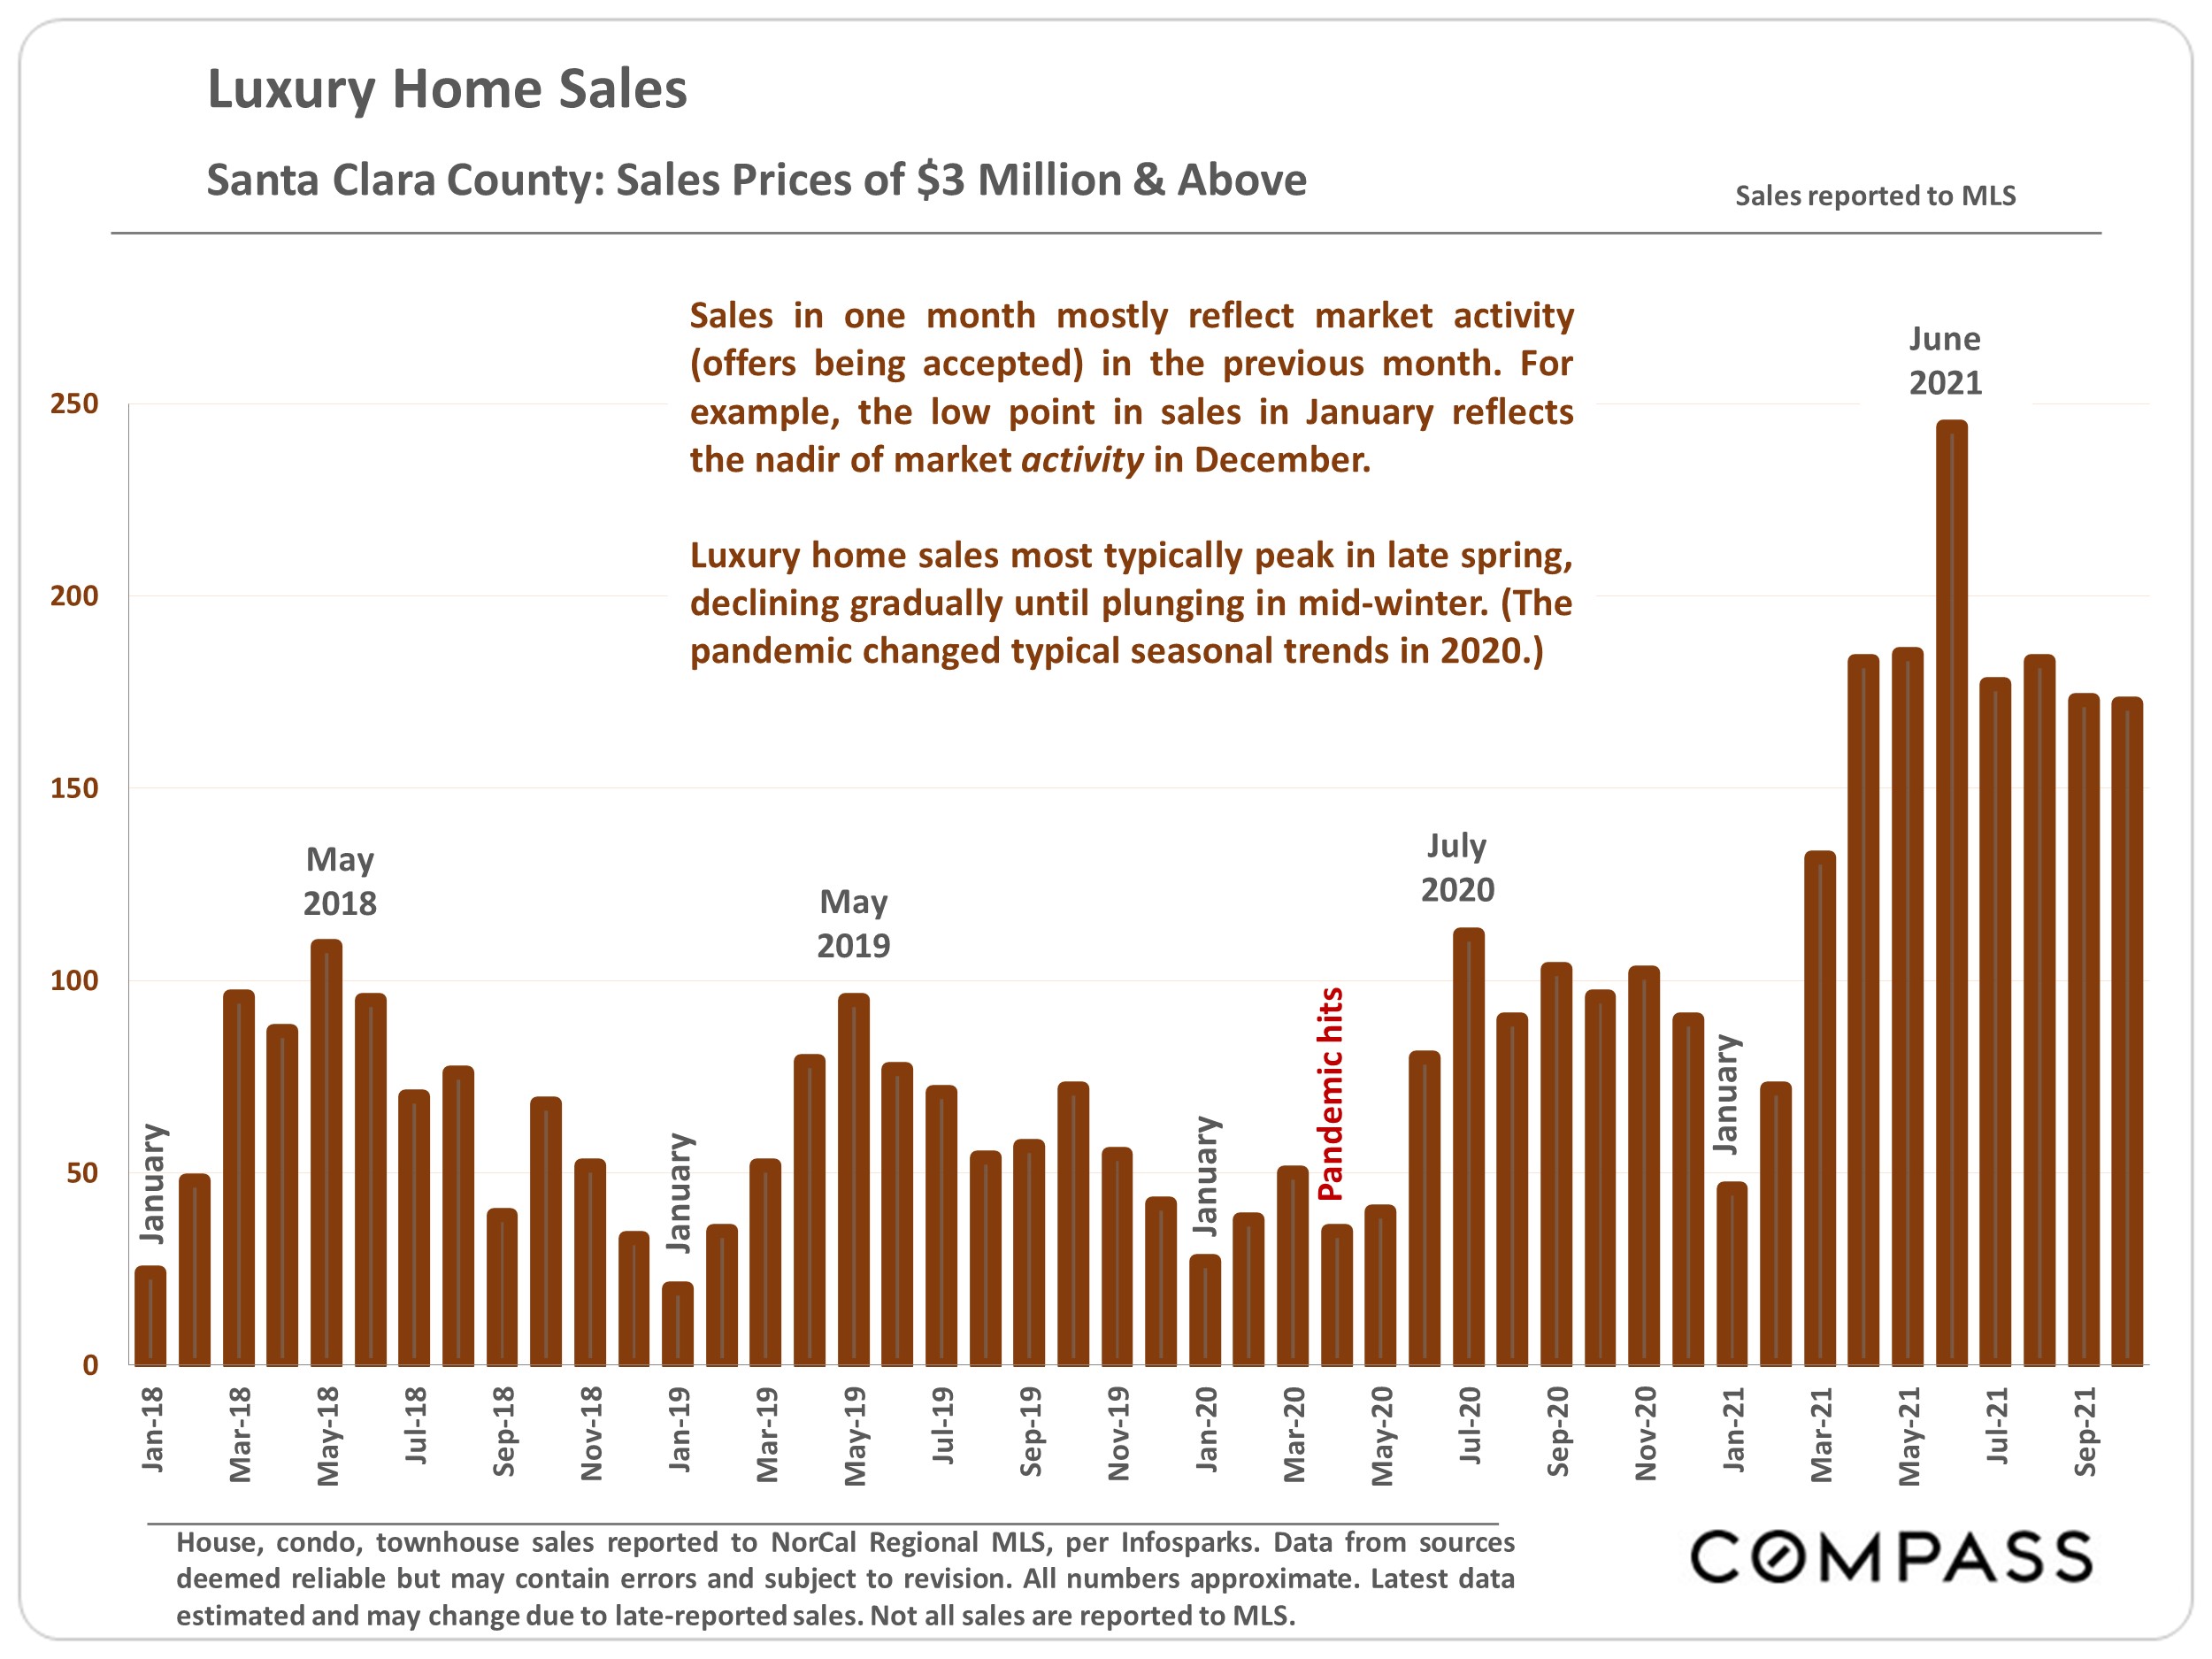
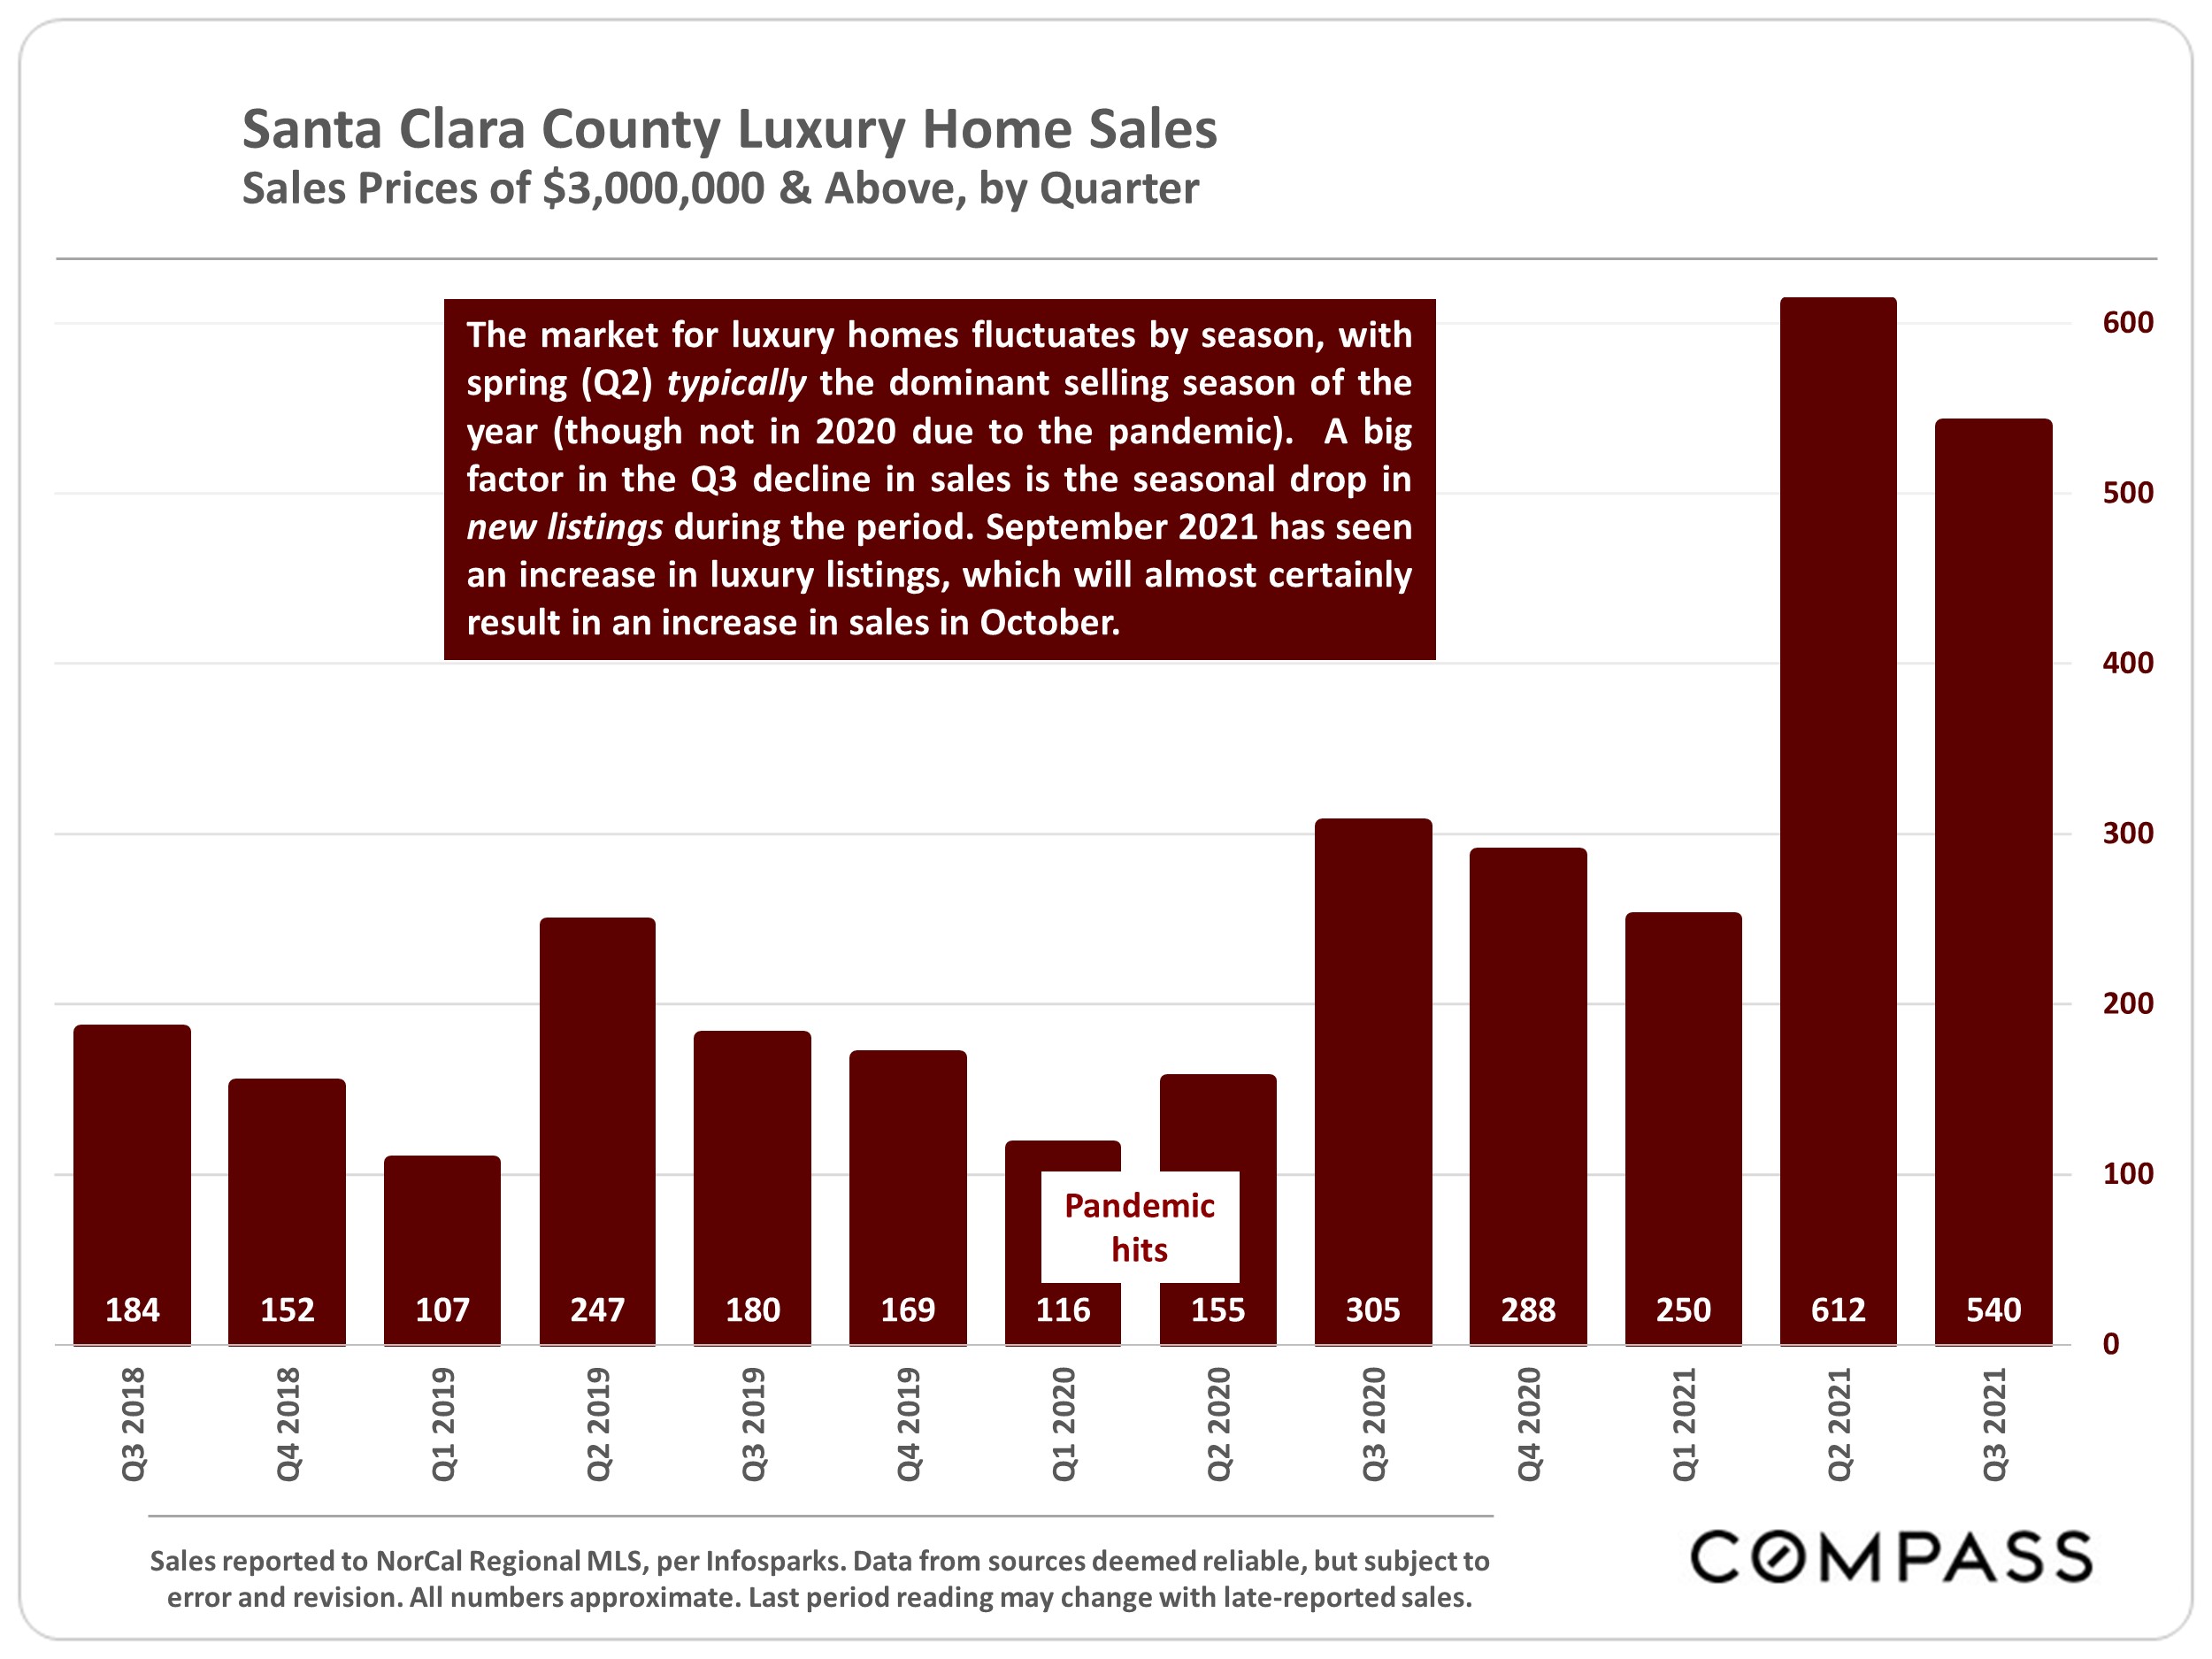
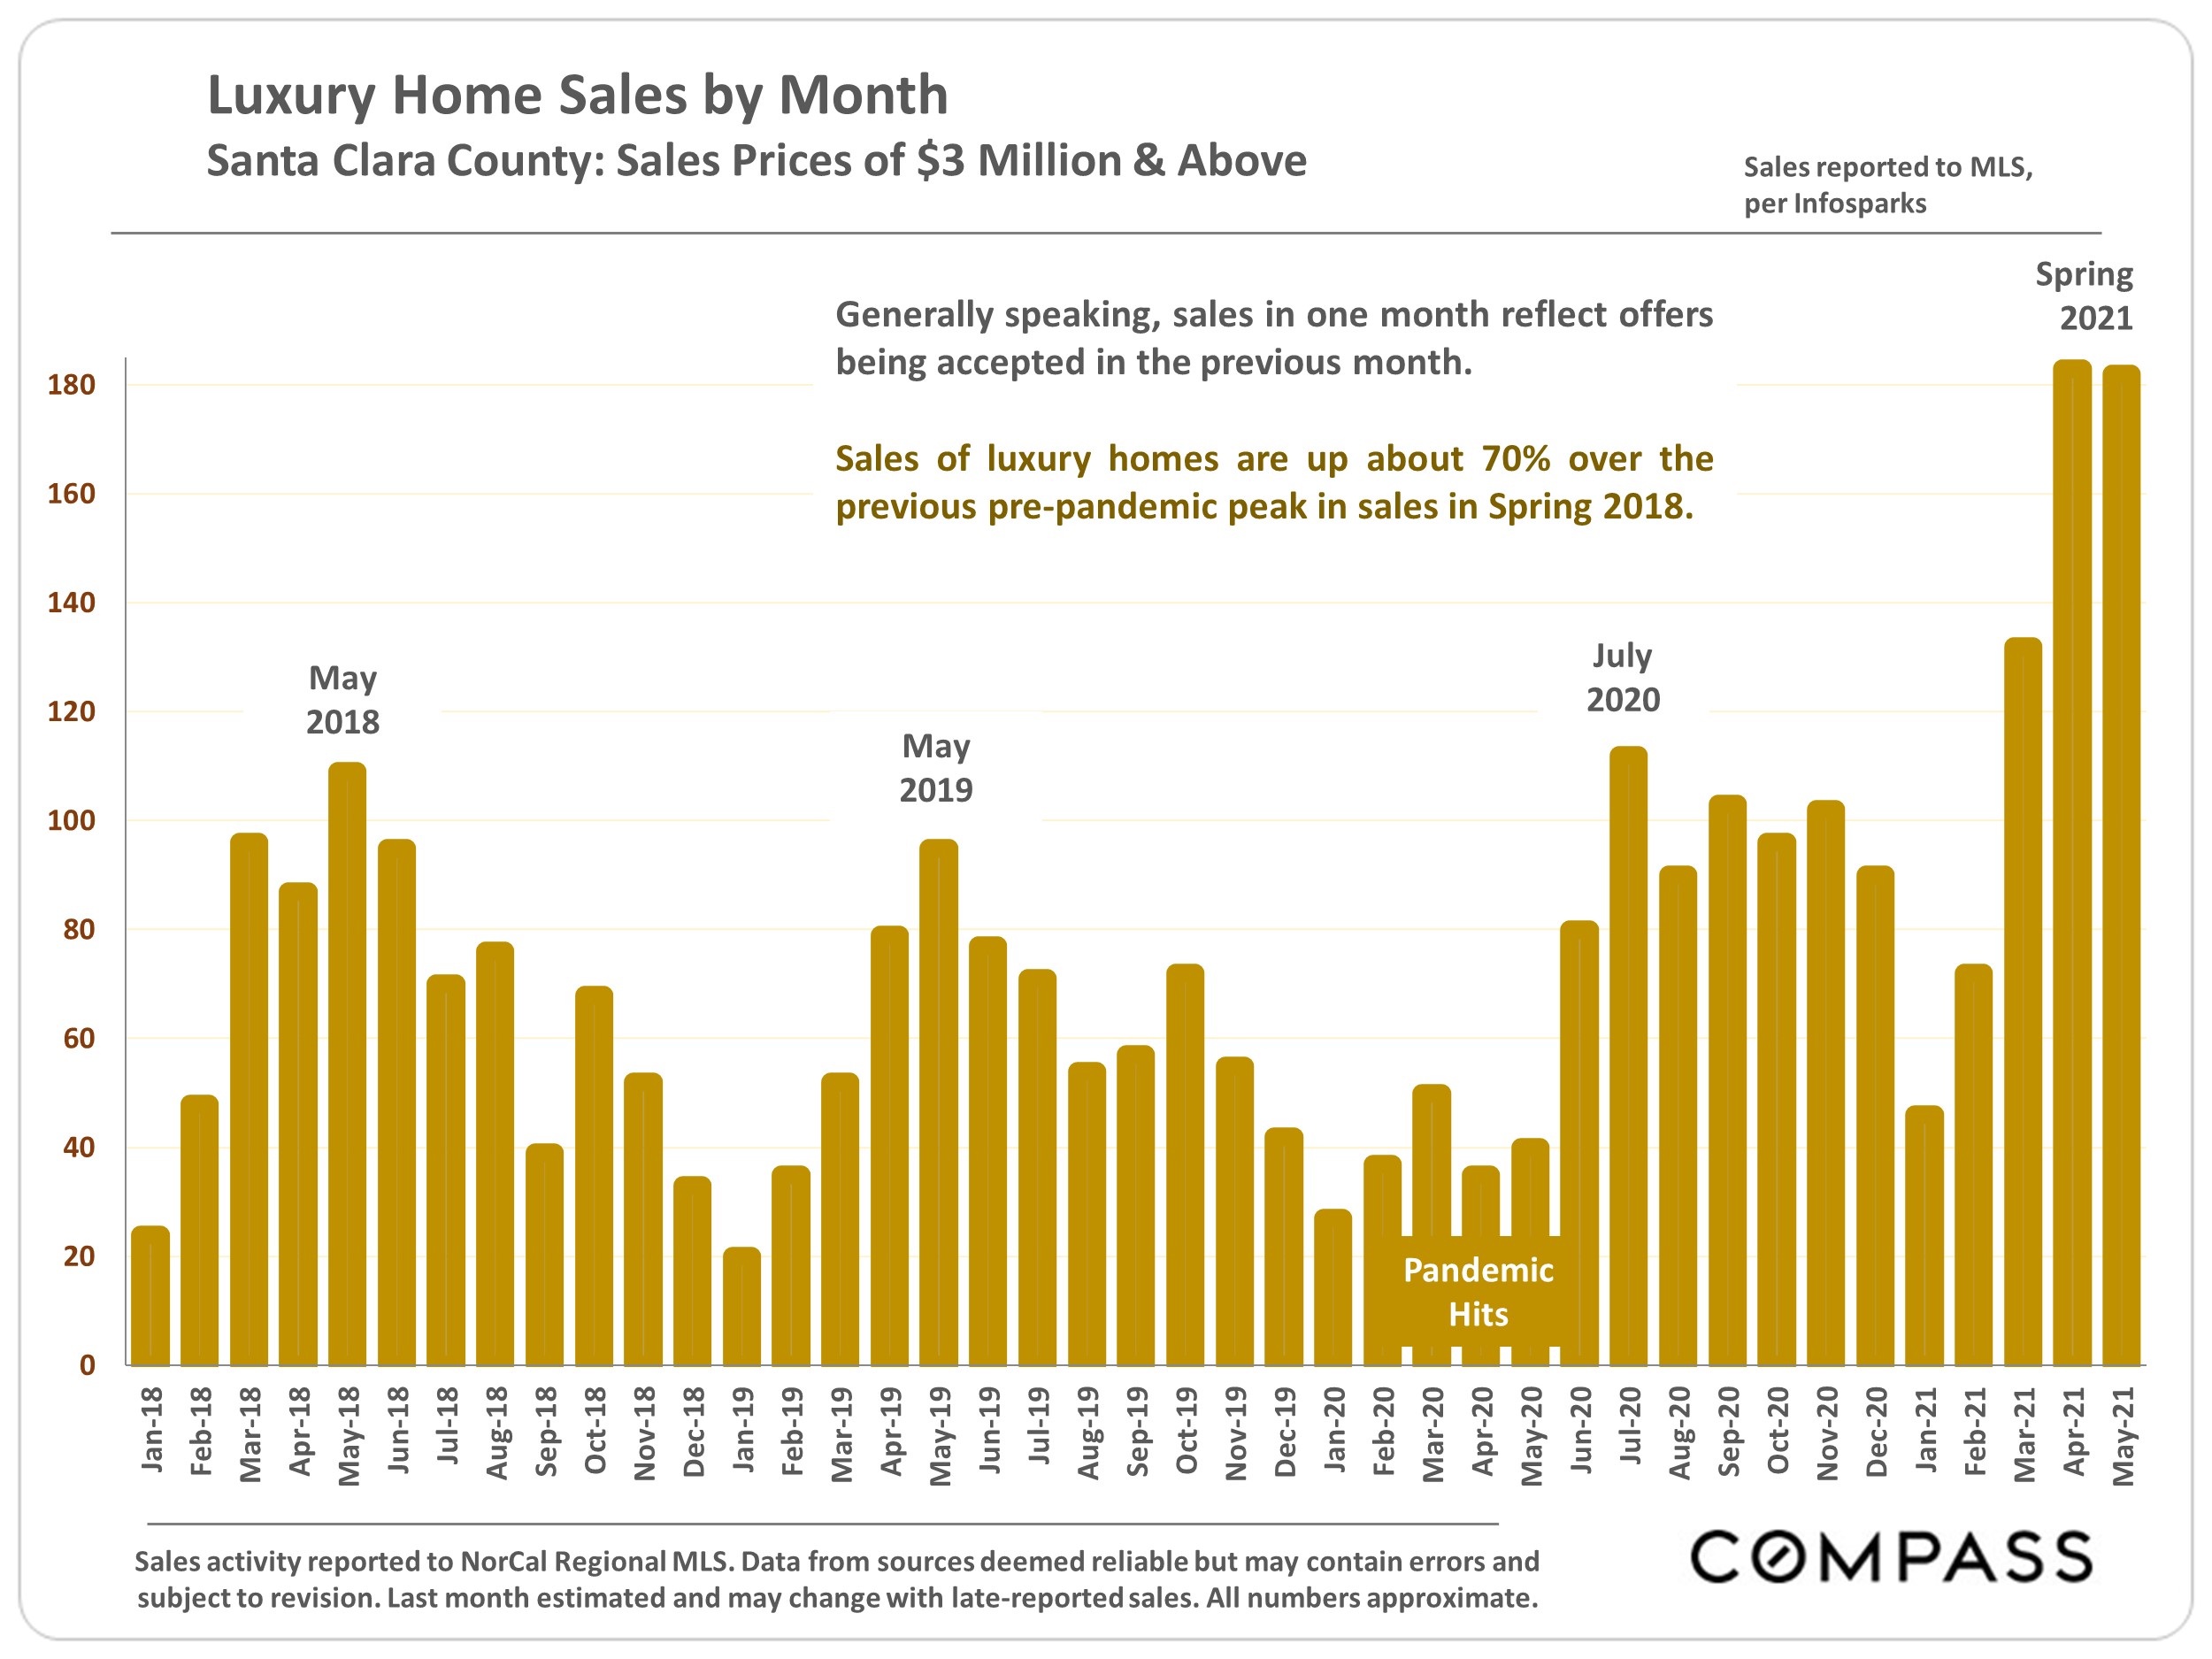
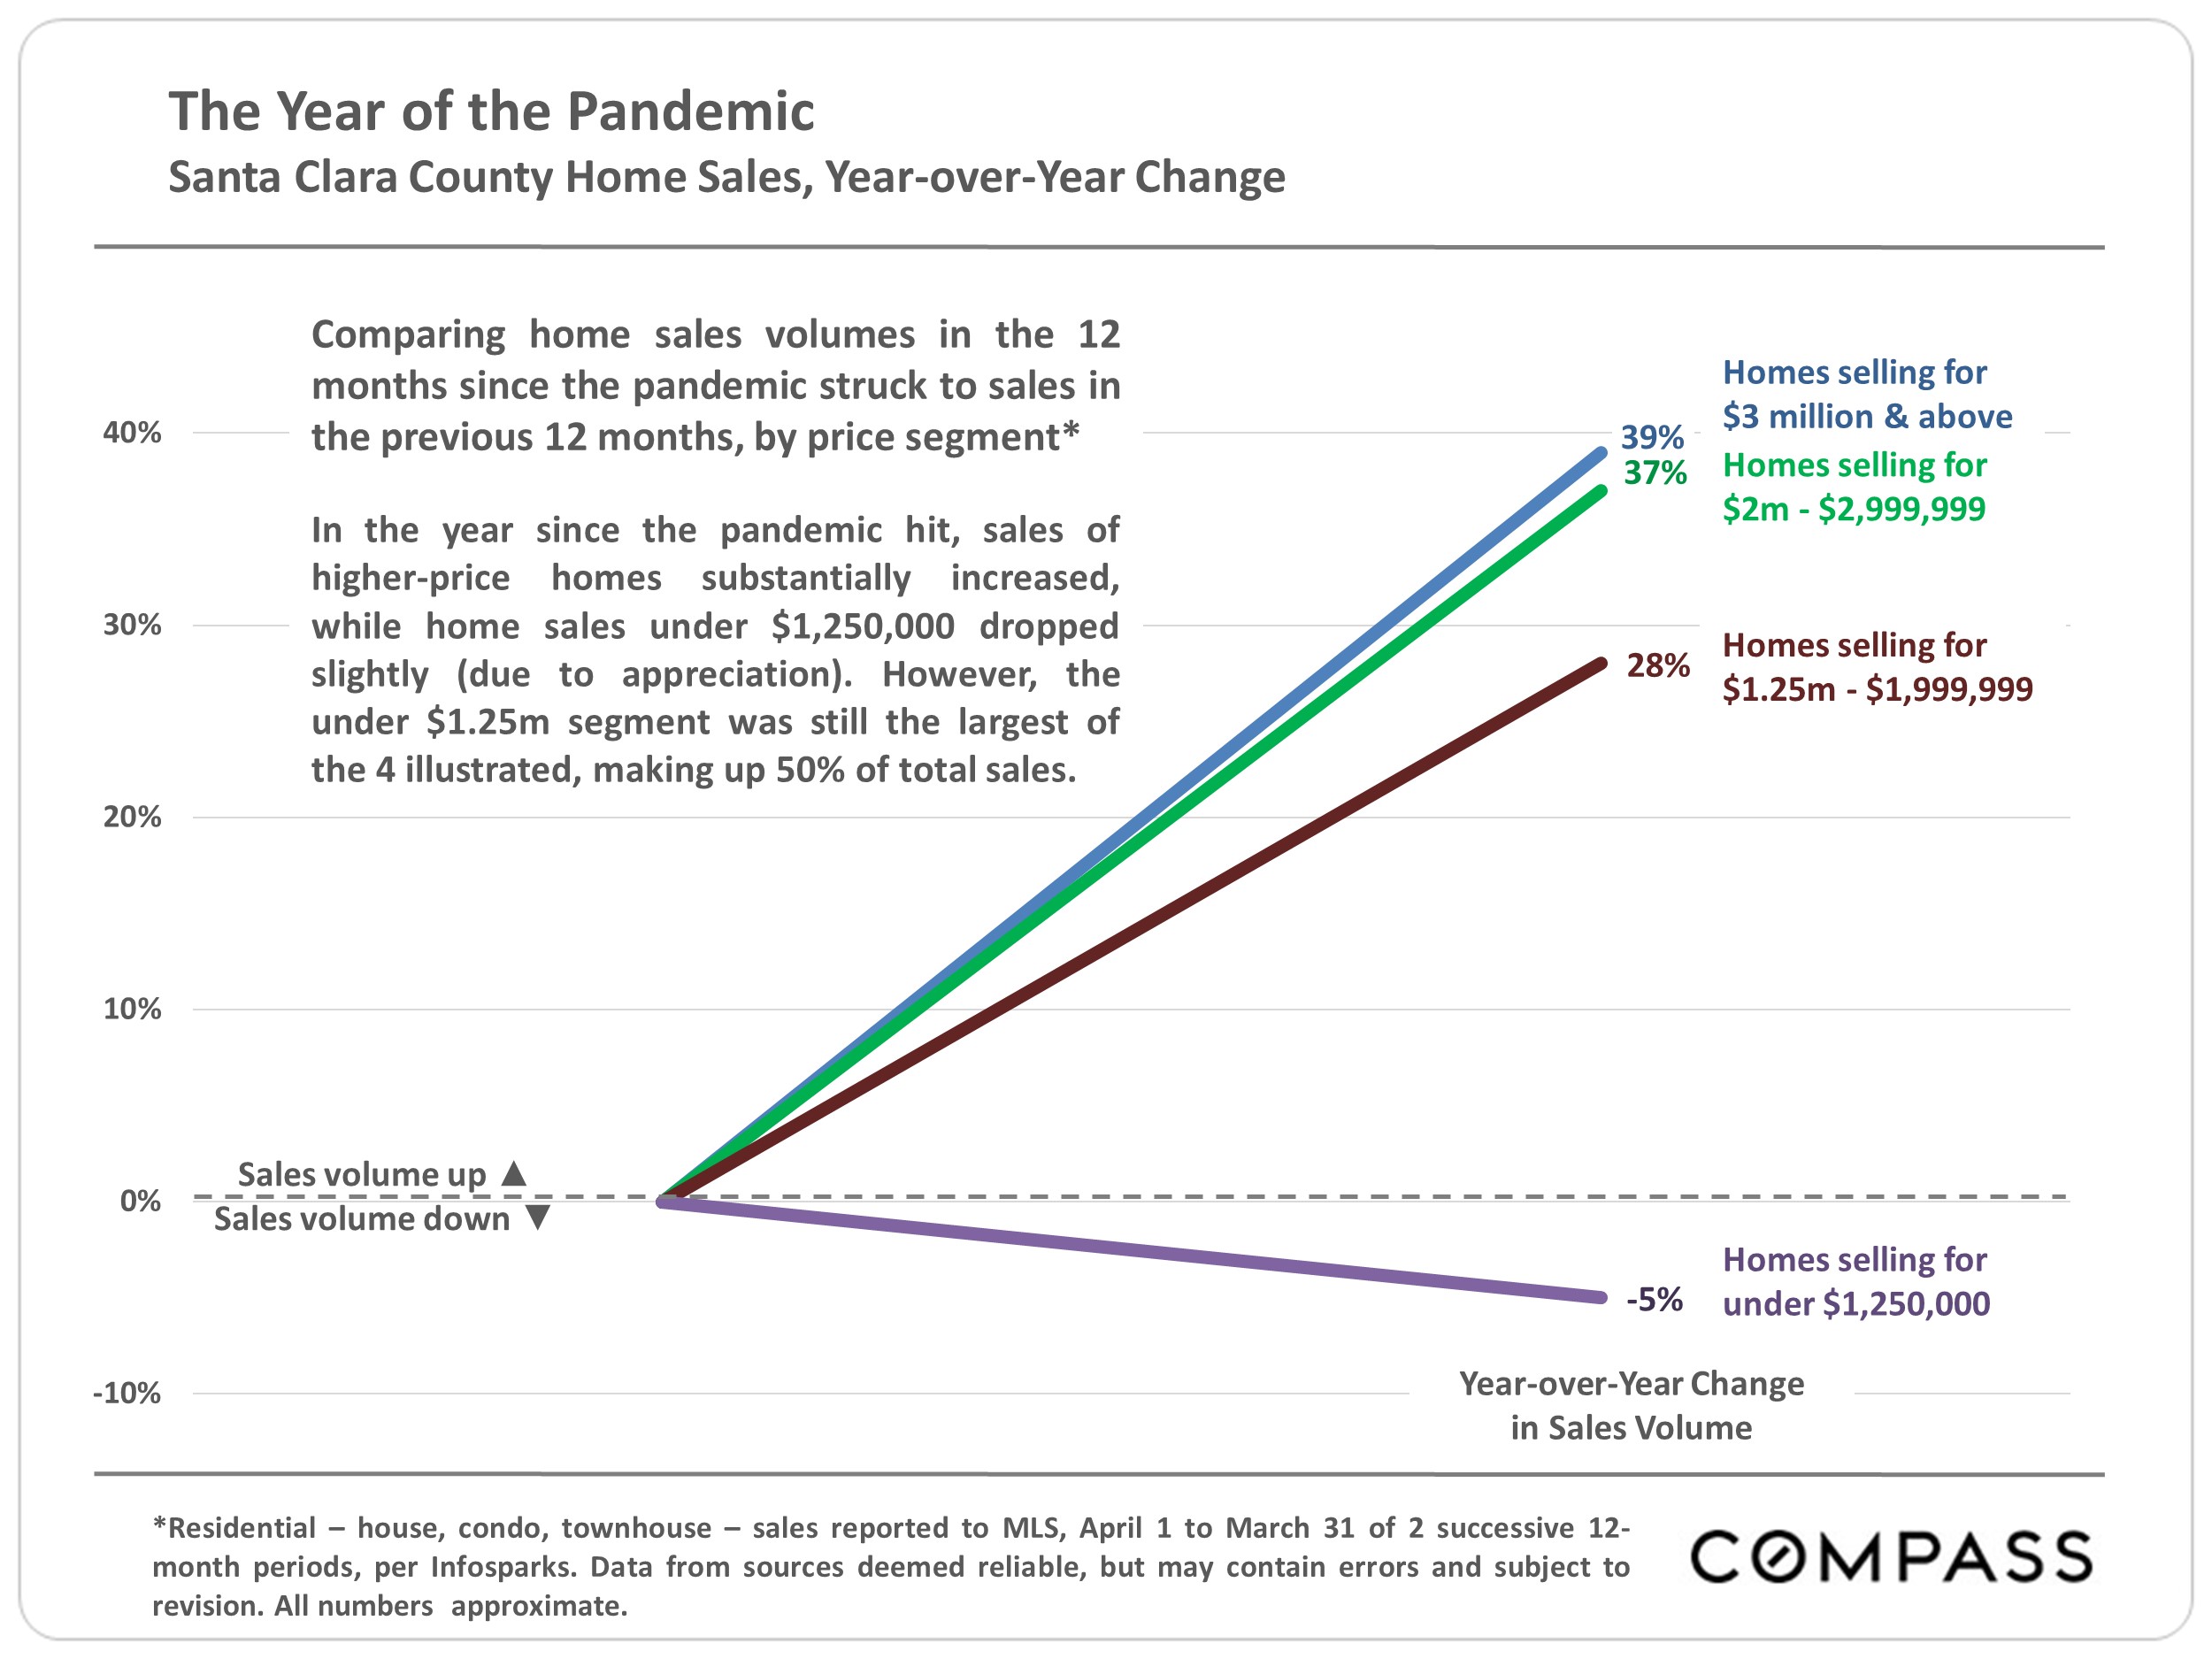
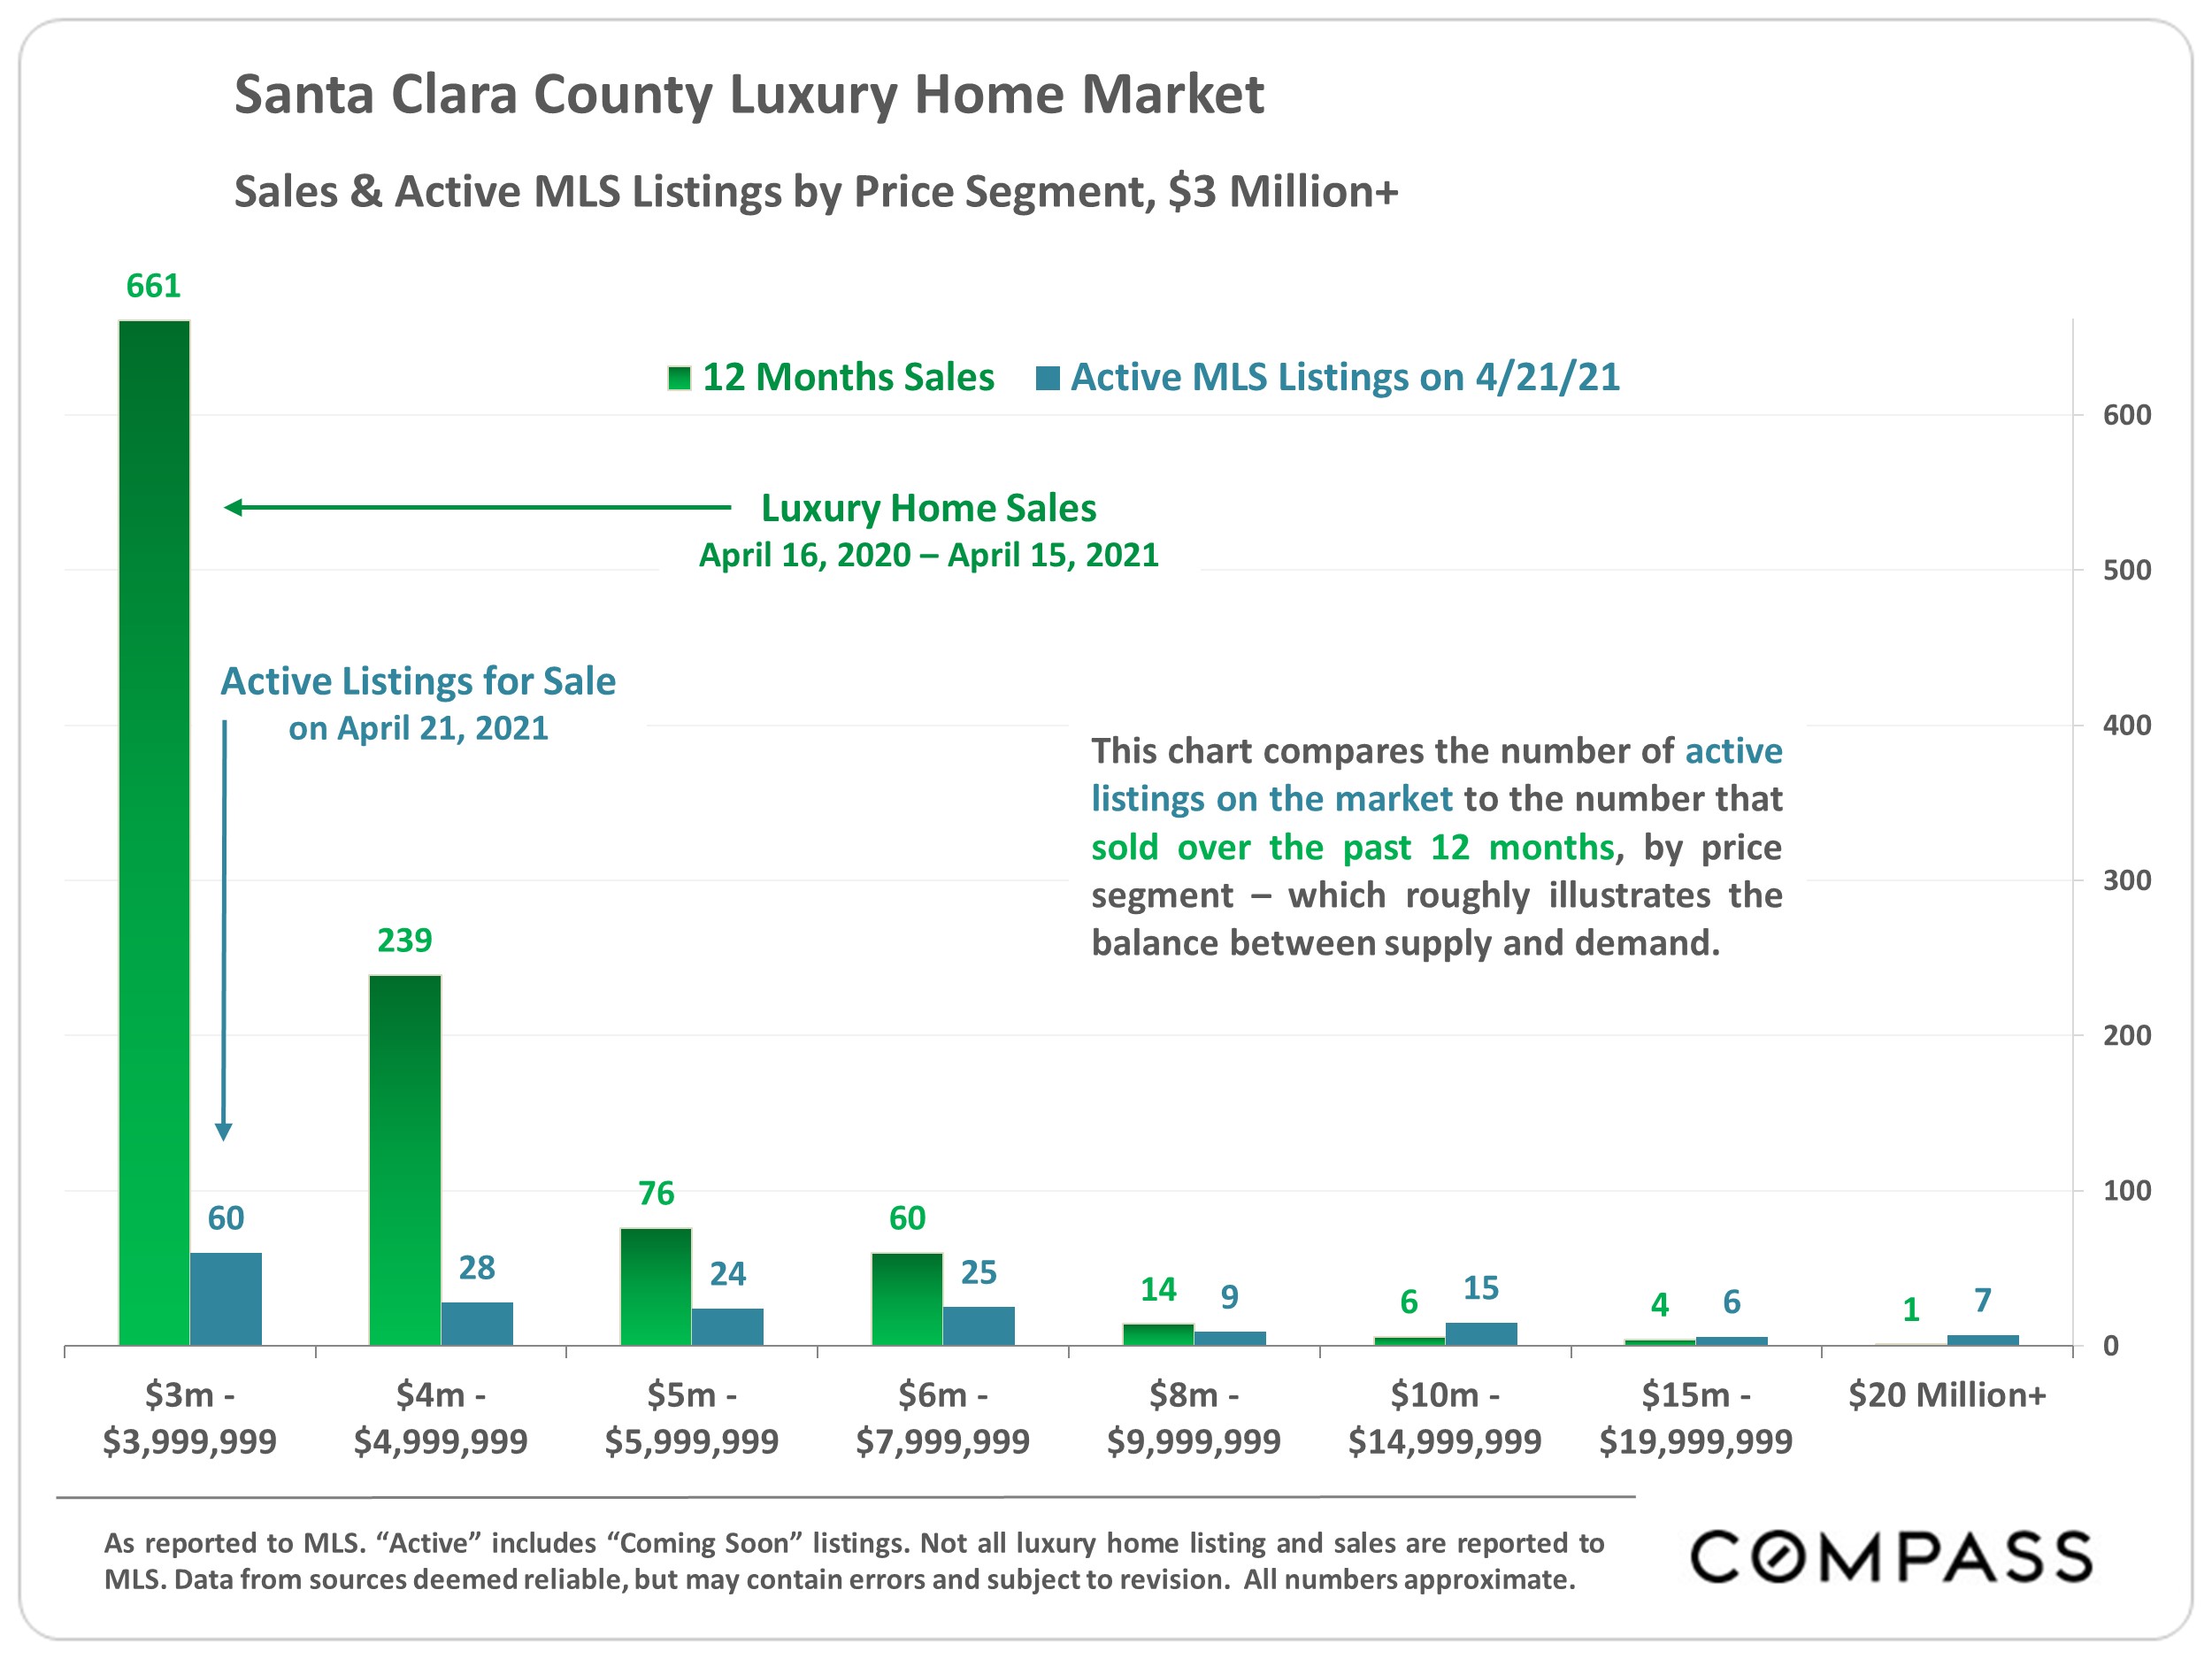
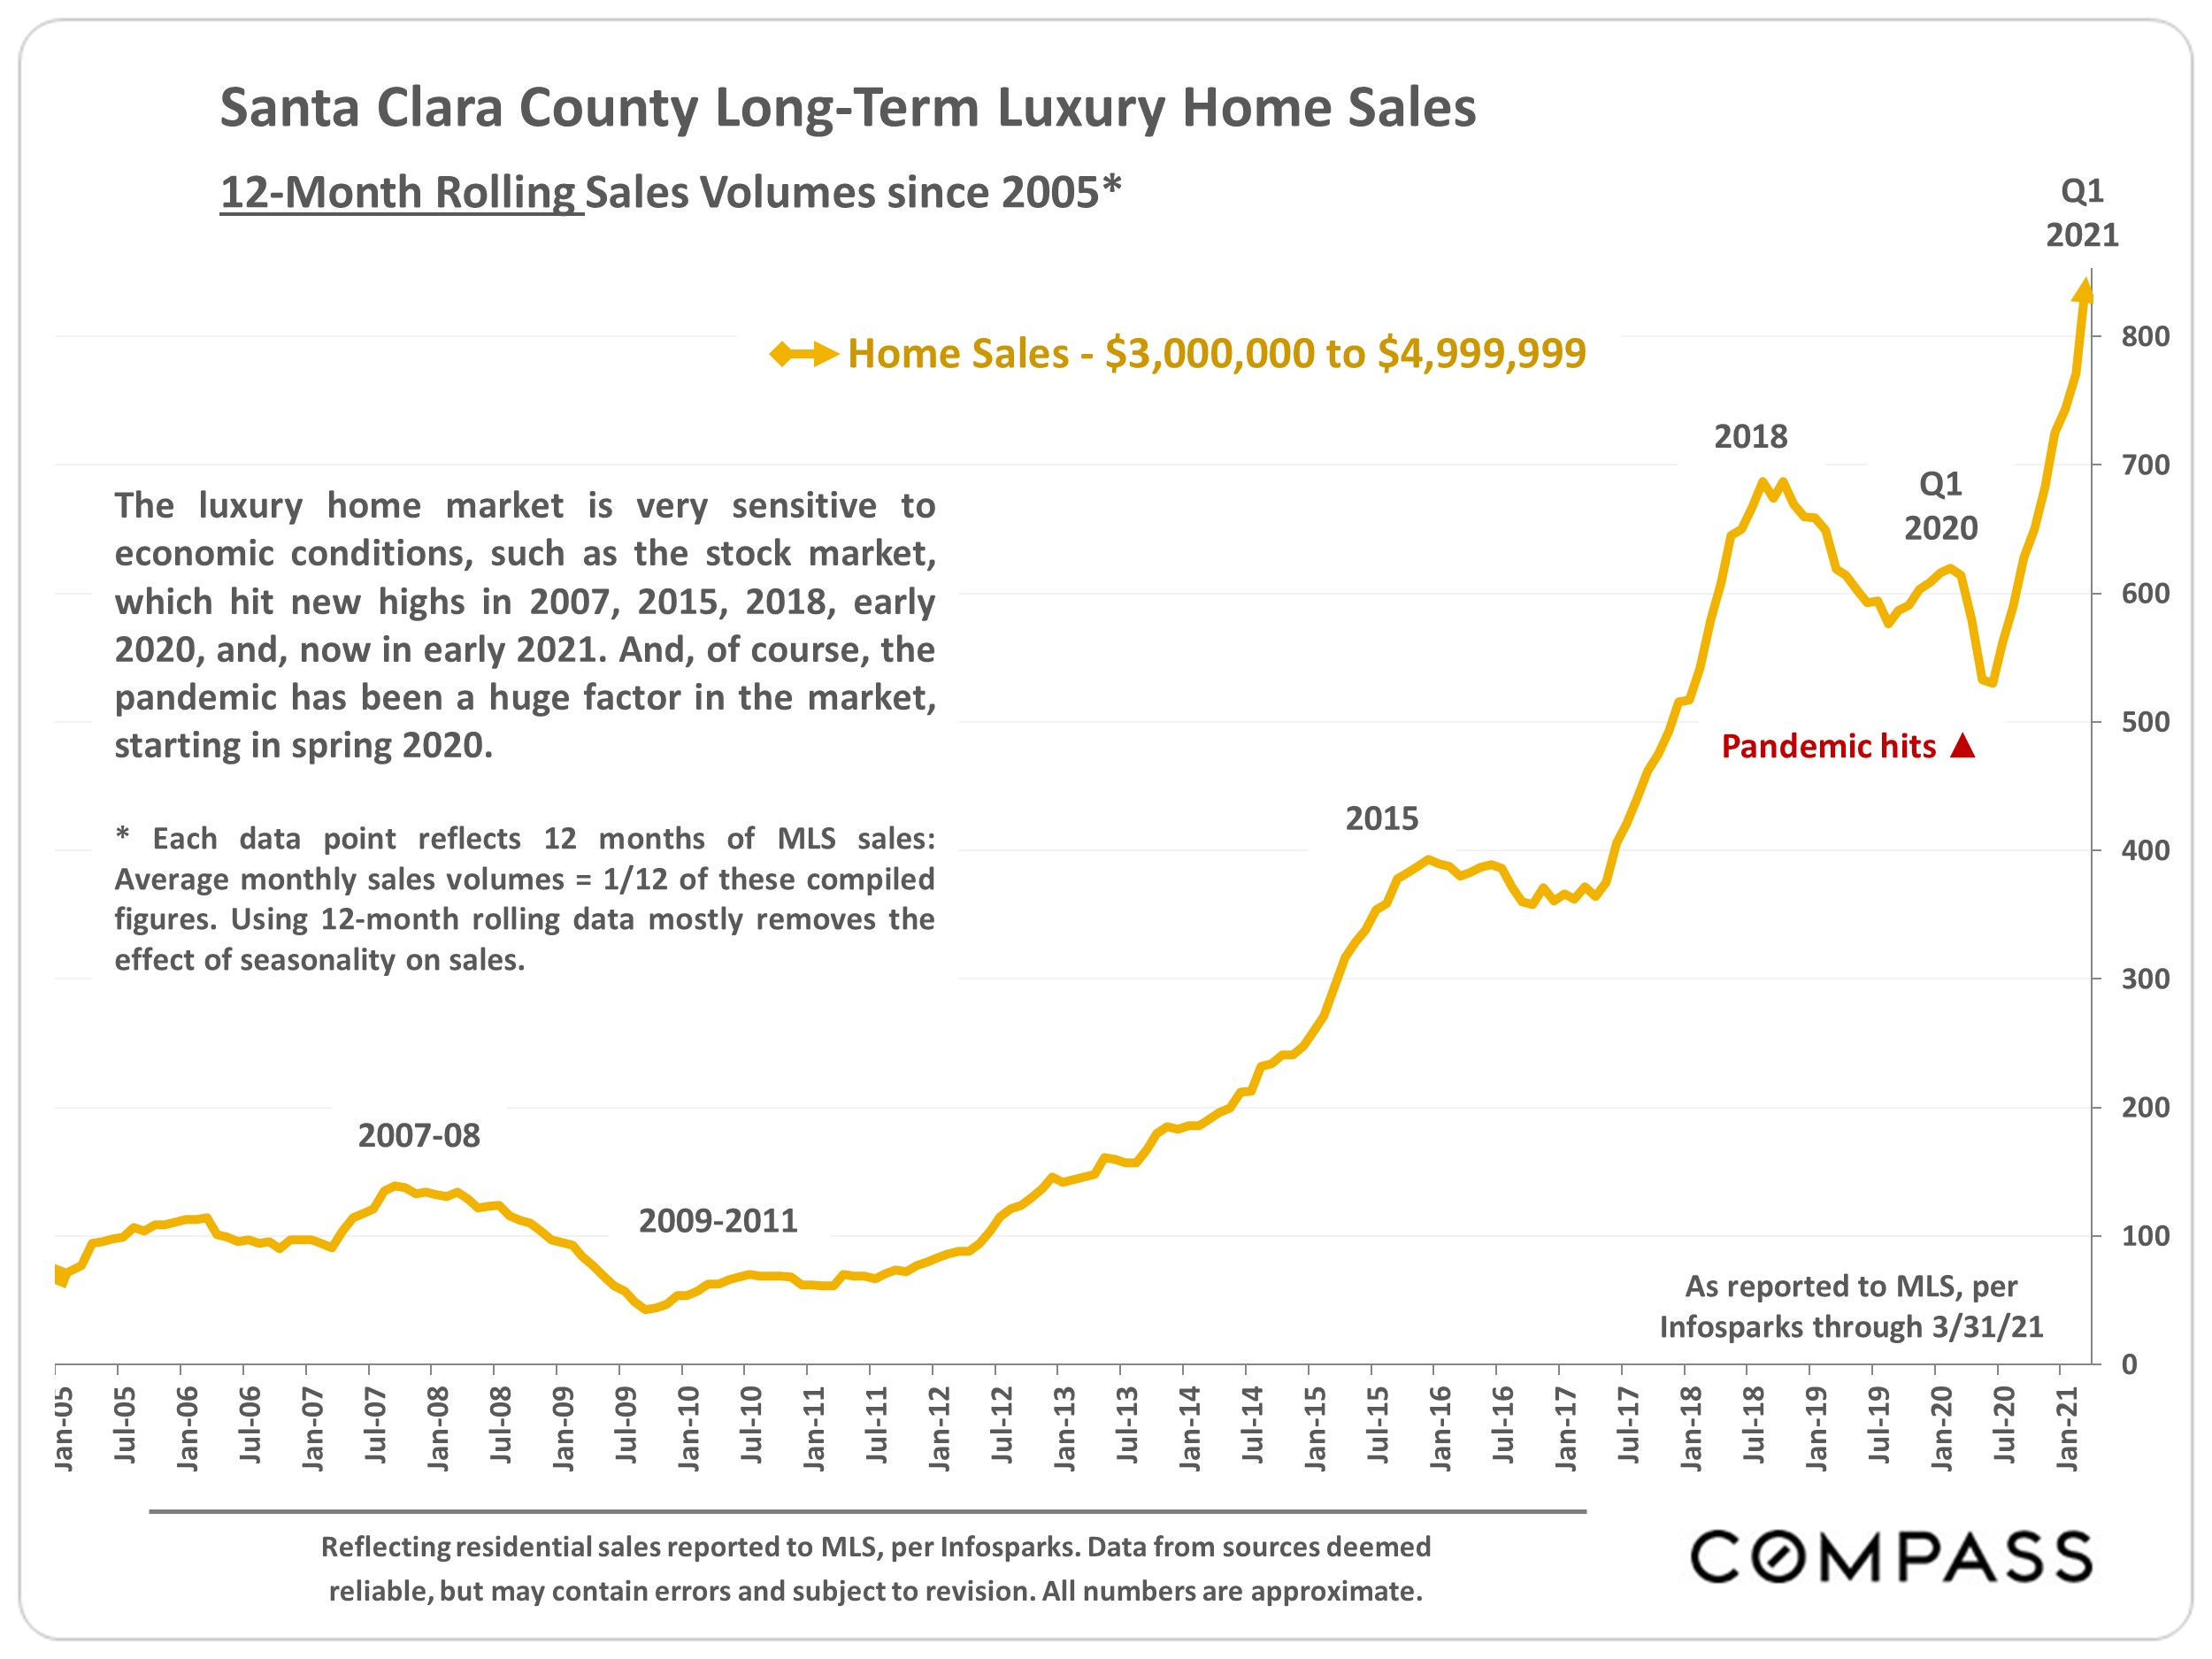
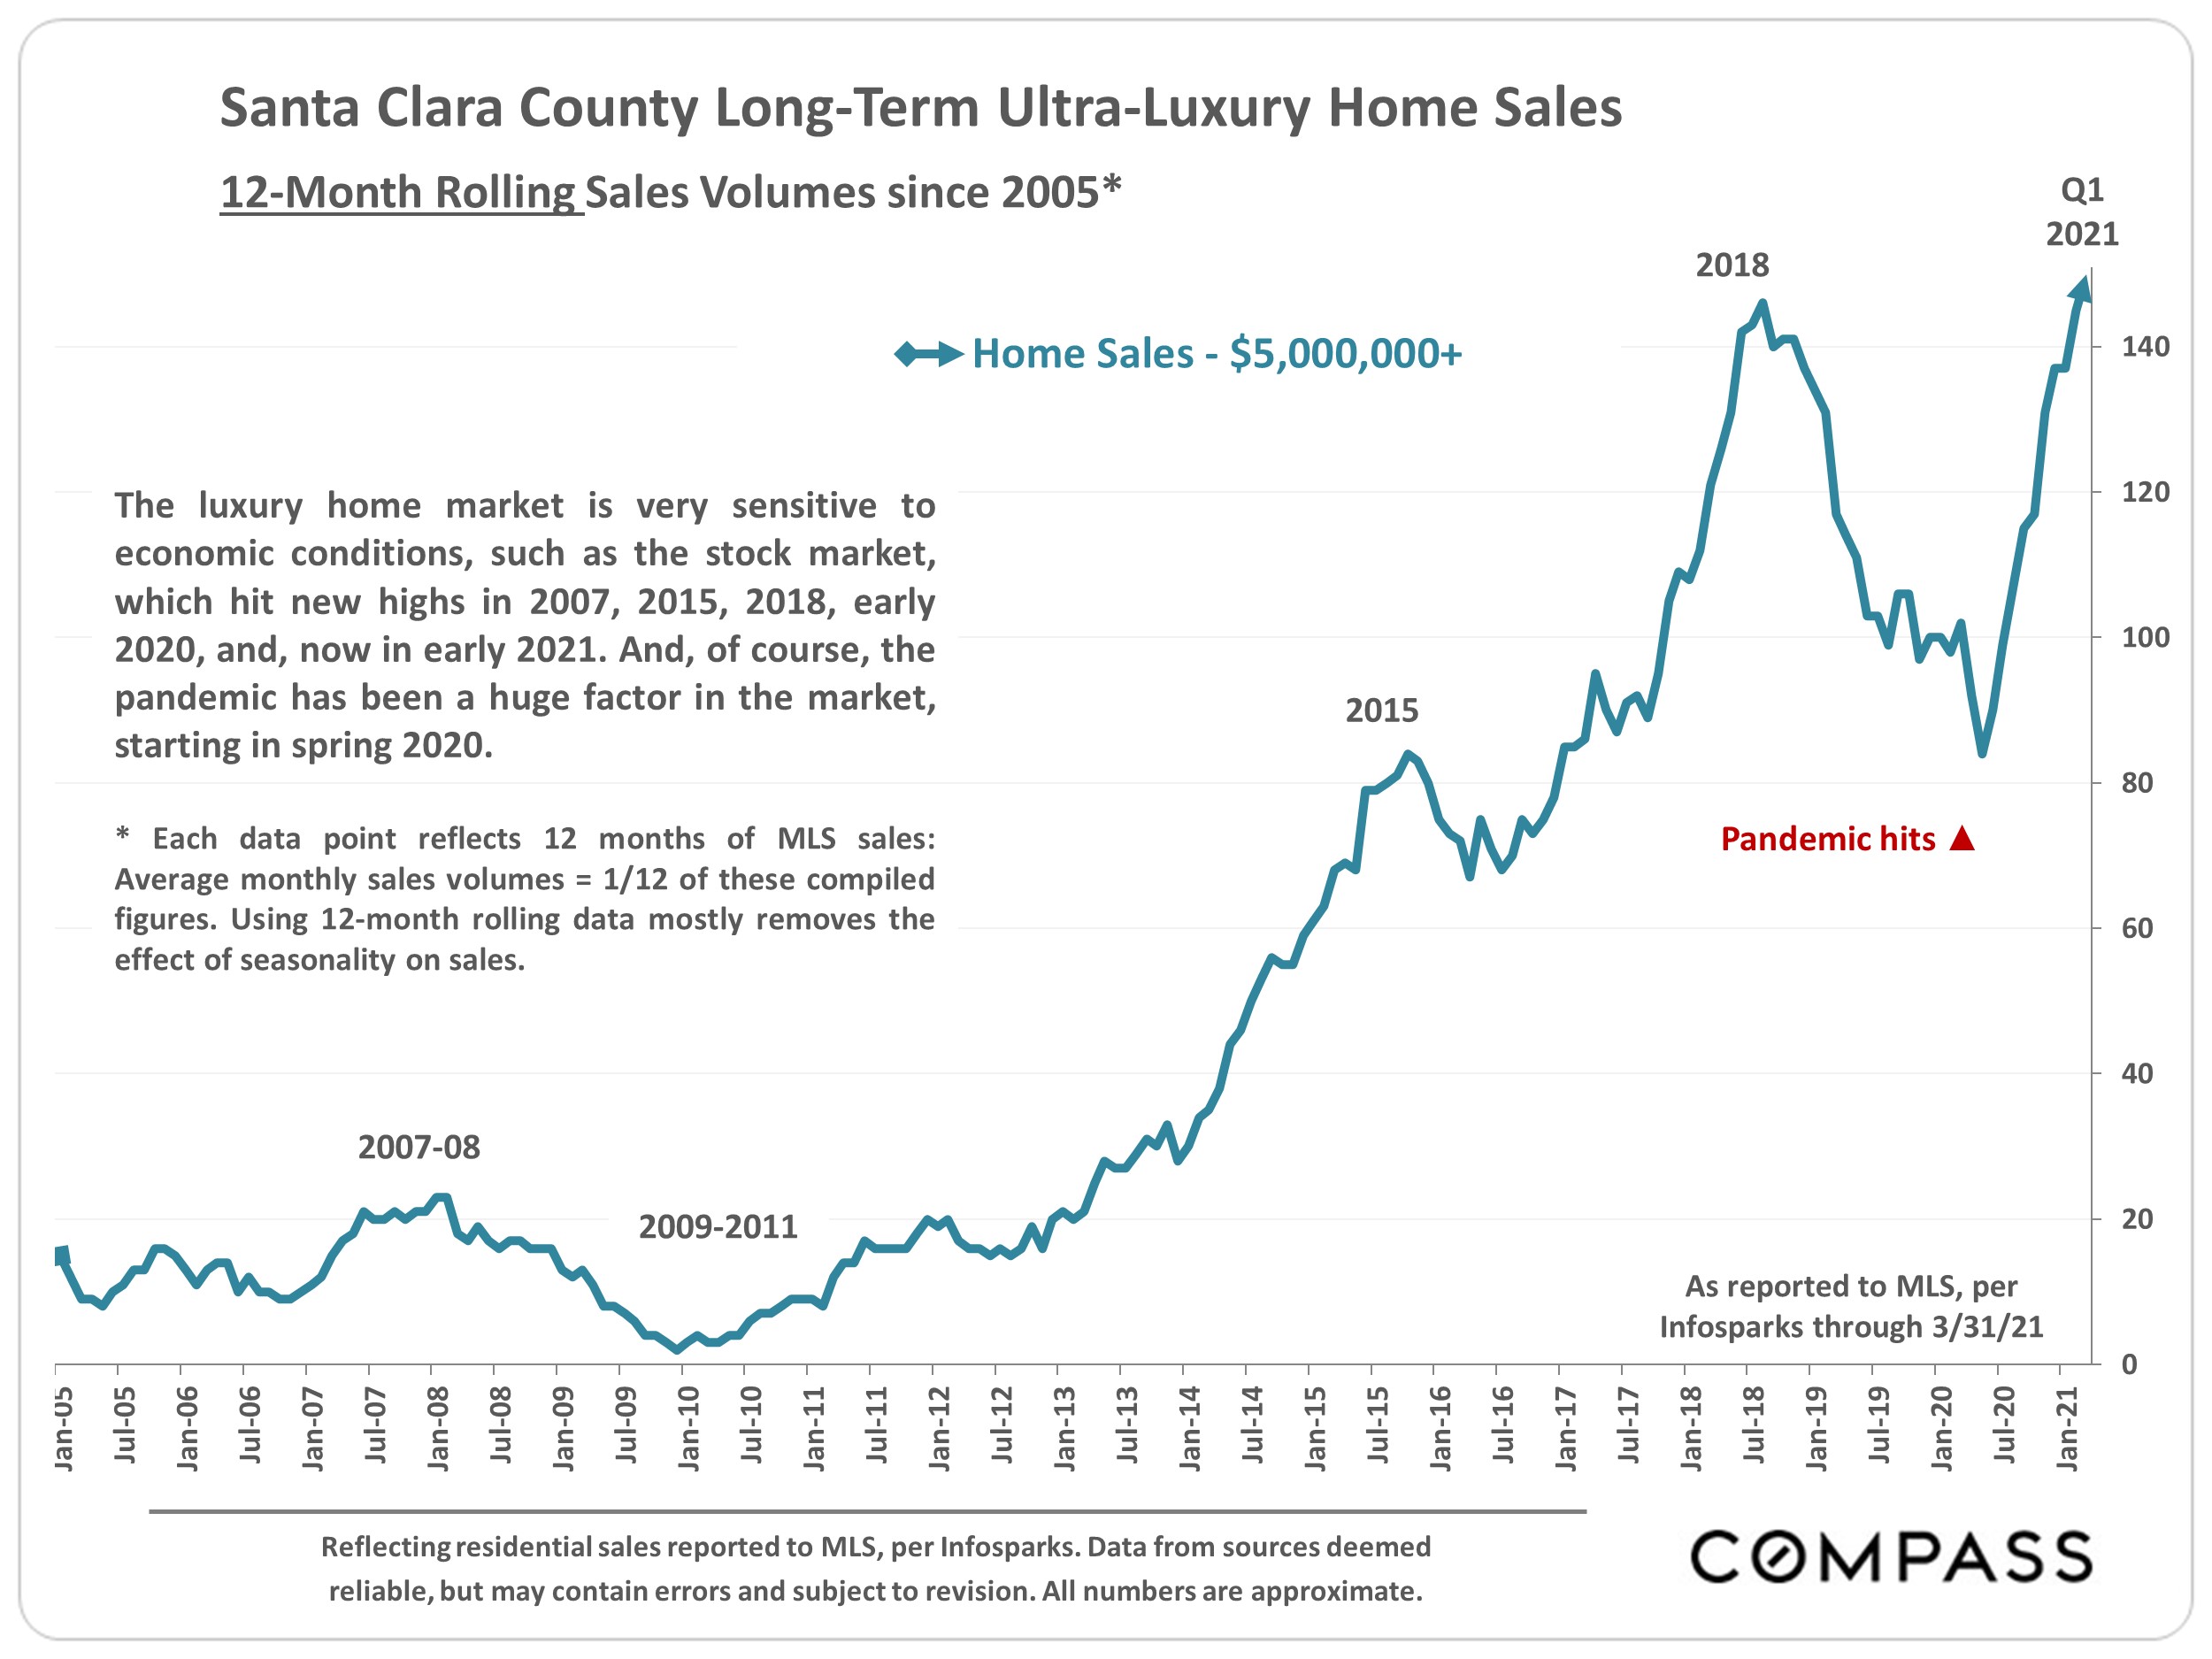
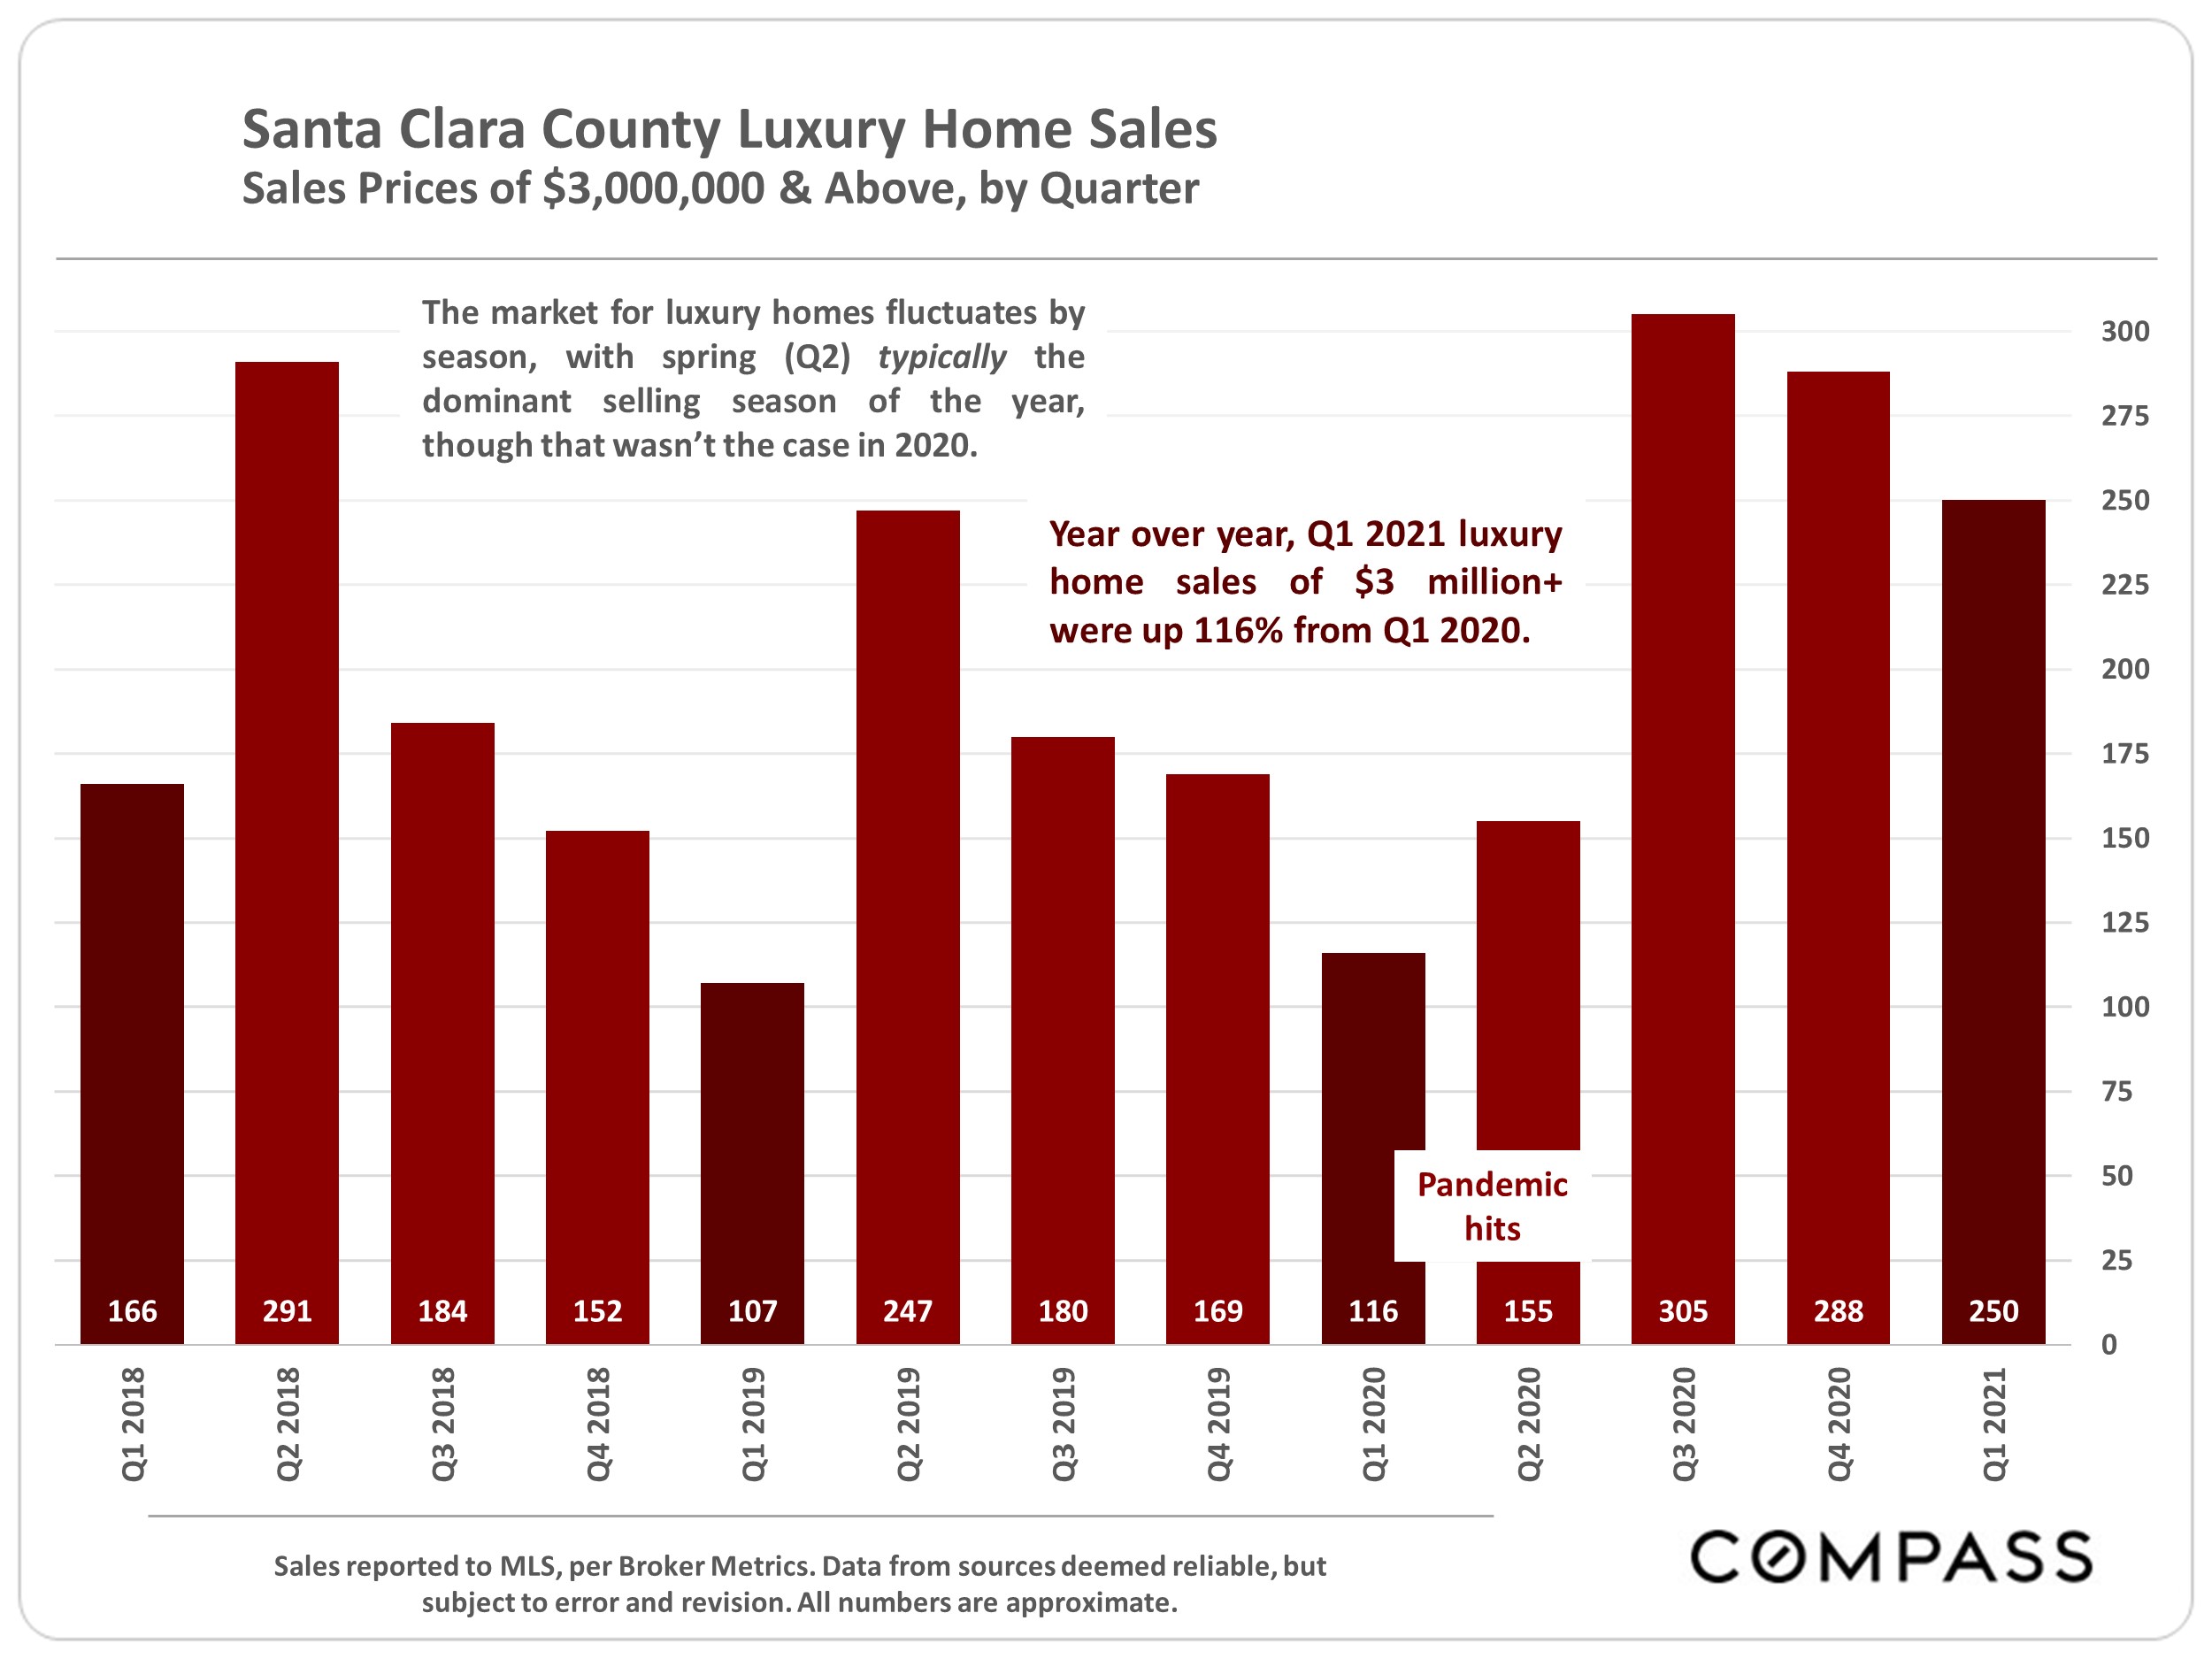
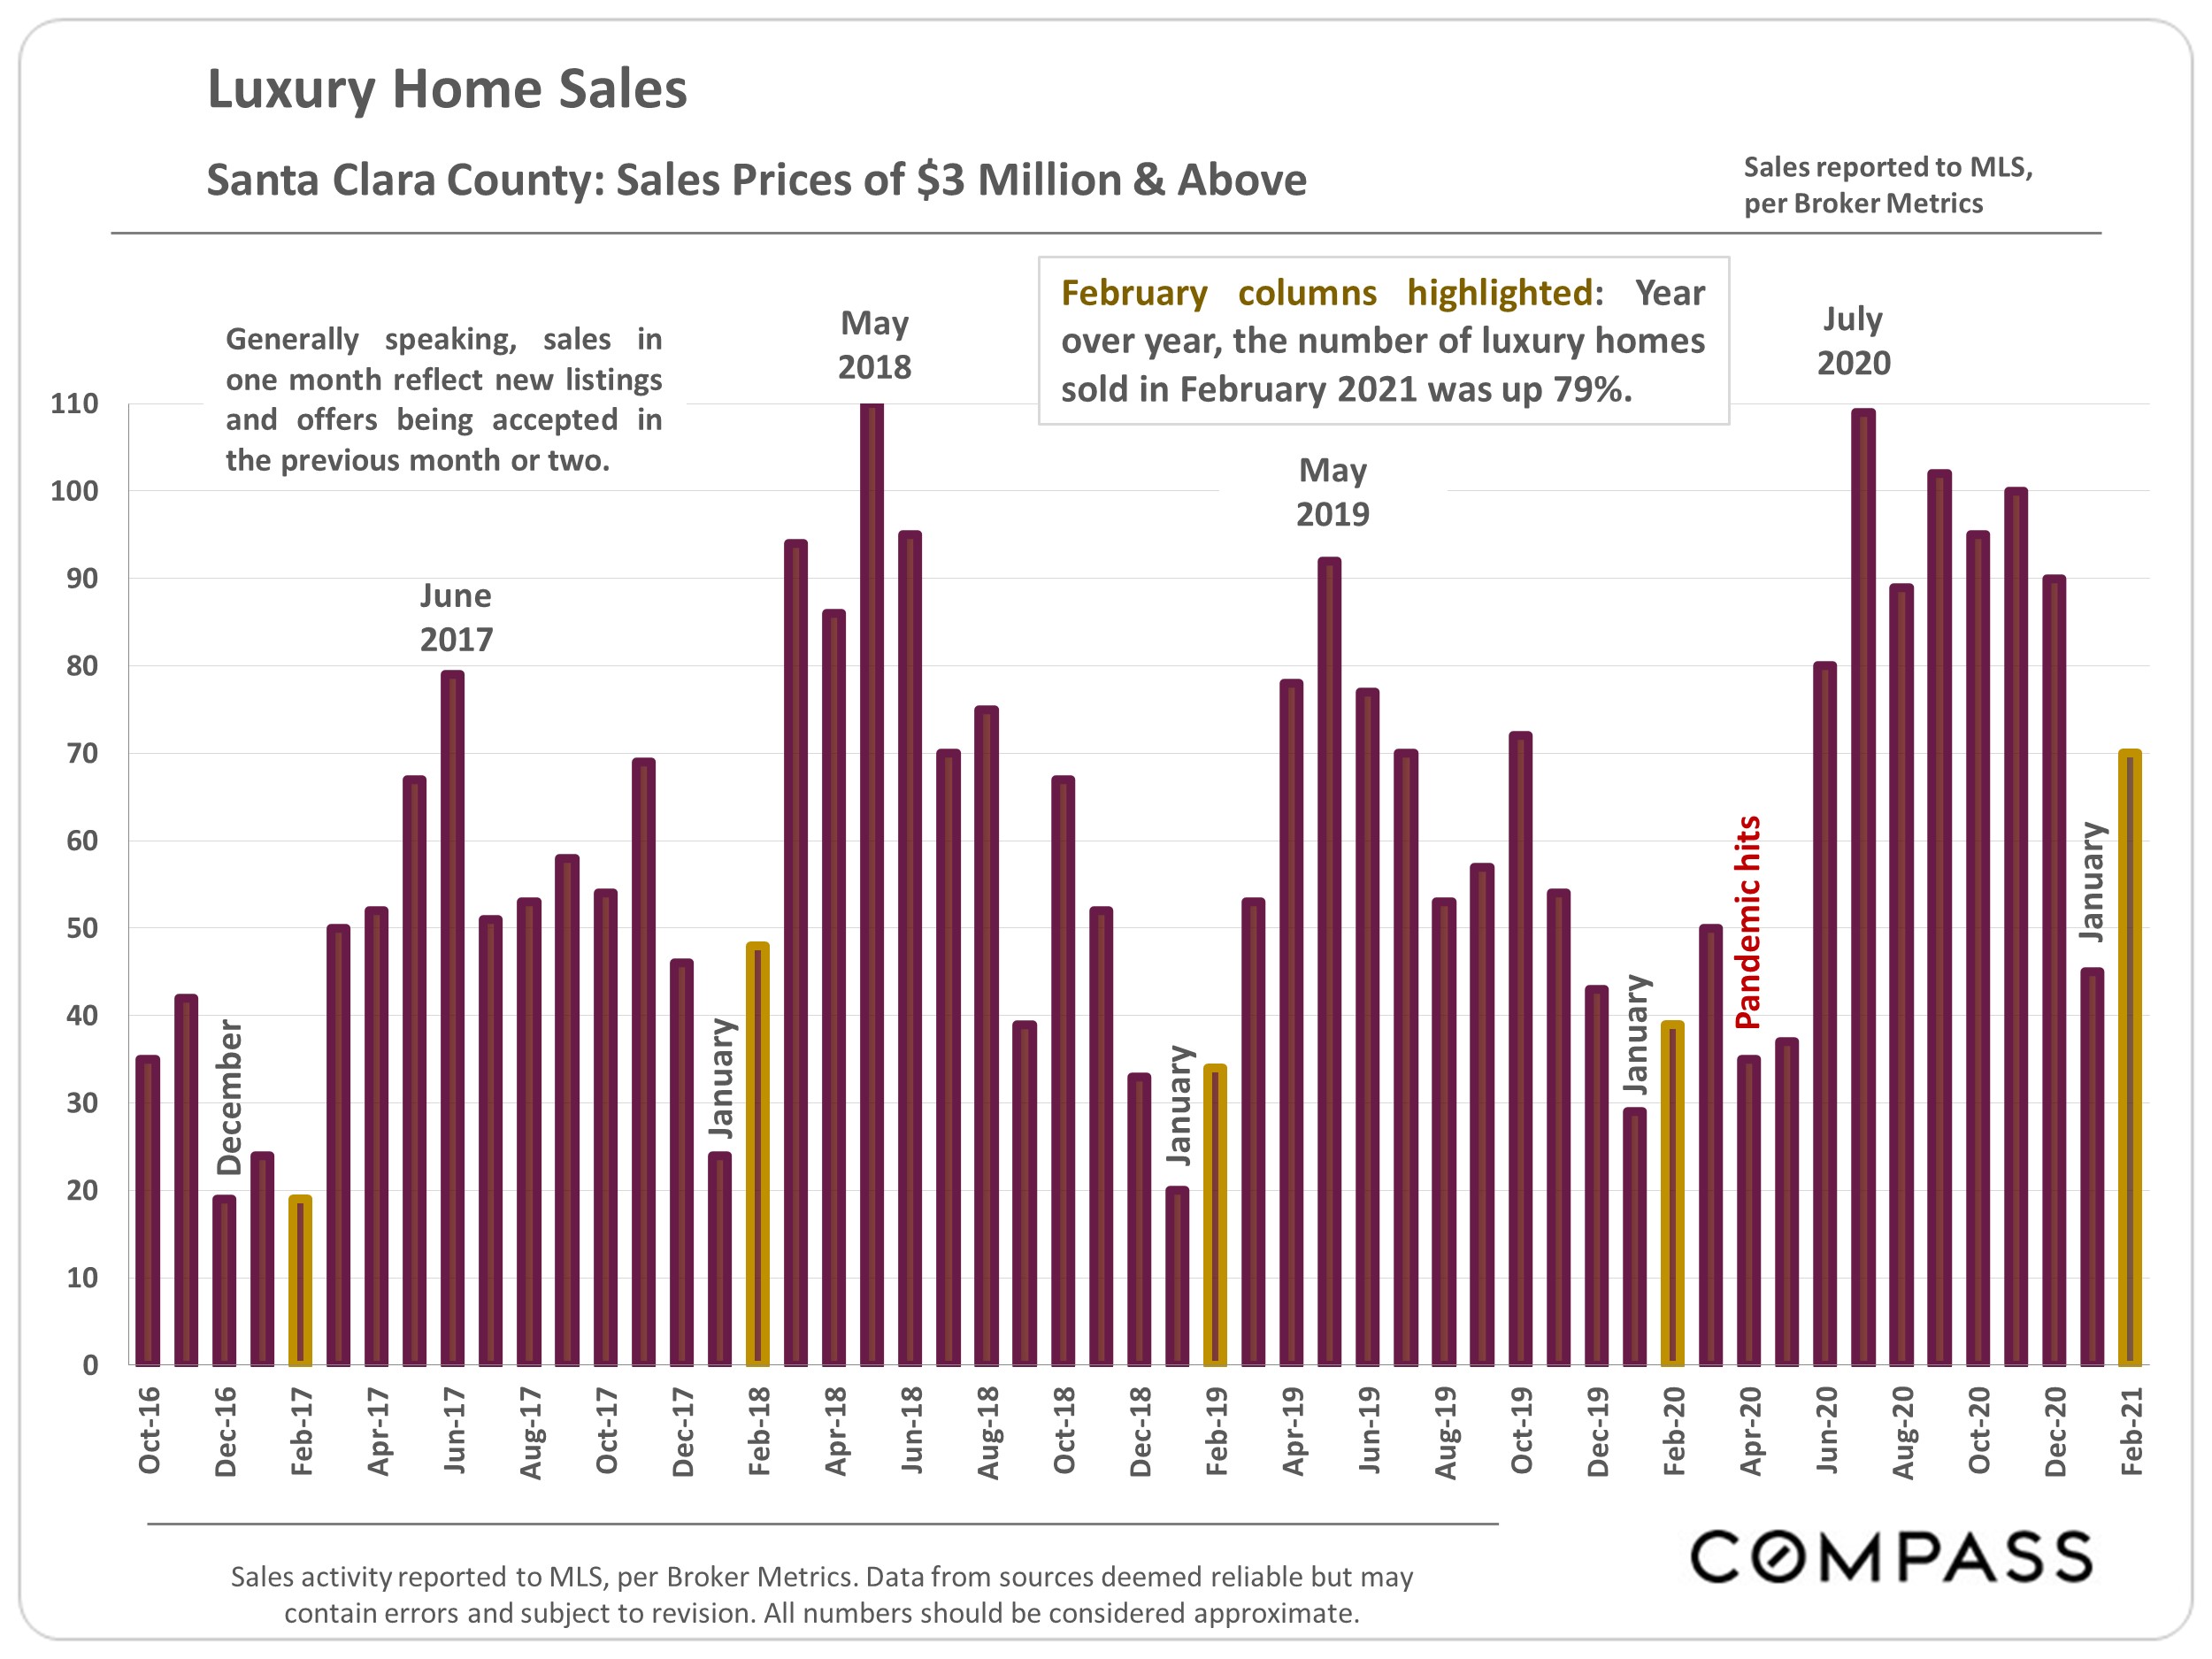
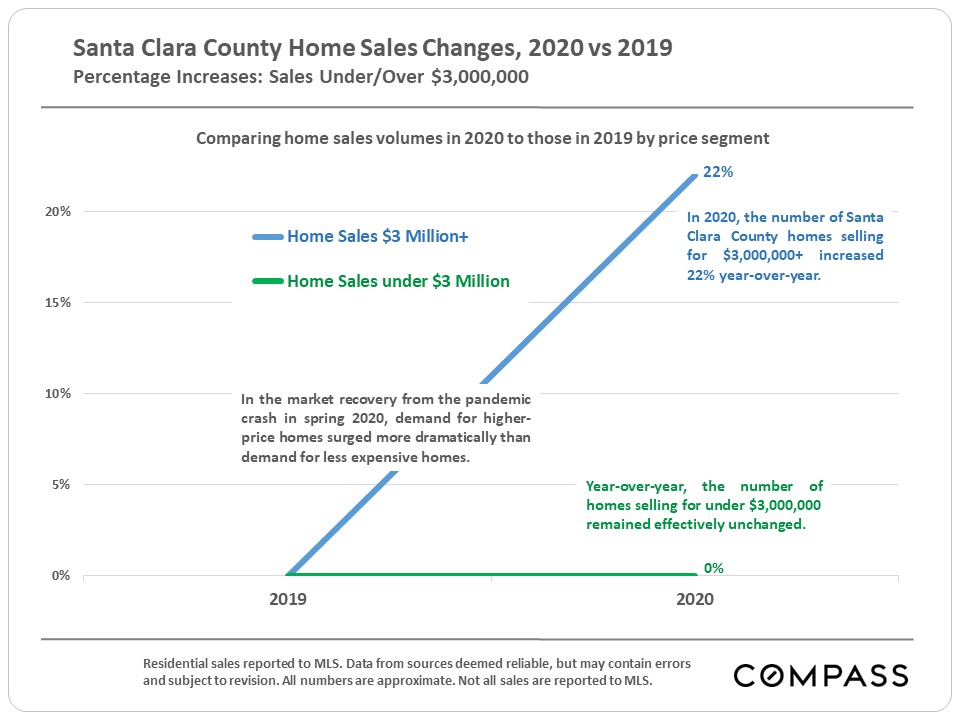
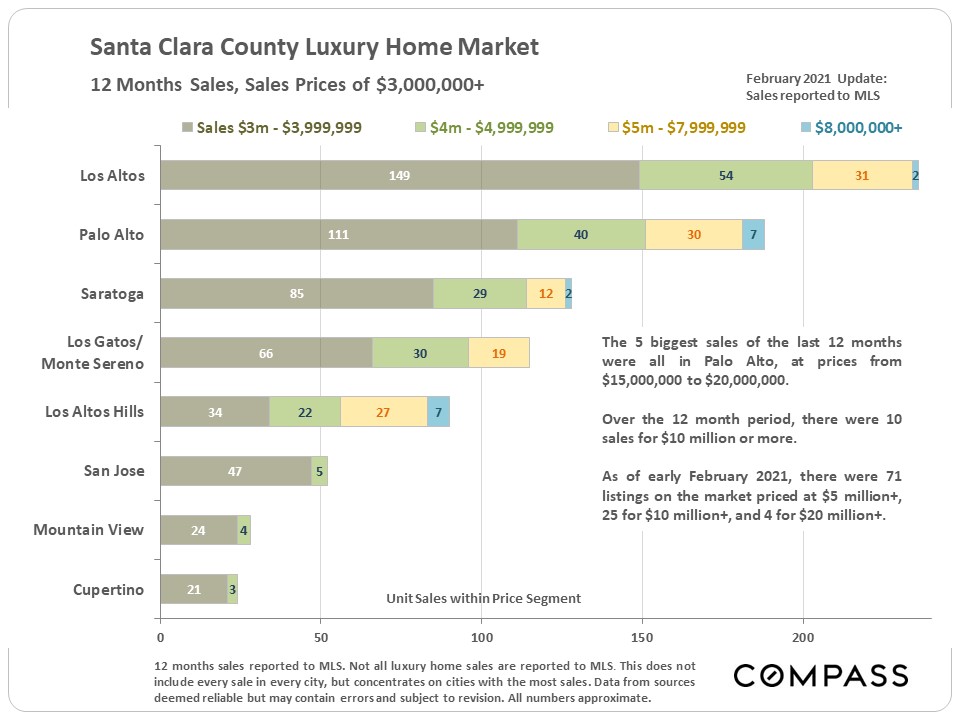
Luxury house sales, $3,000,000+: +189%*
Ultra-Luxury home sales, $5,000,000: +200%
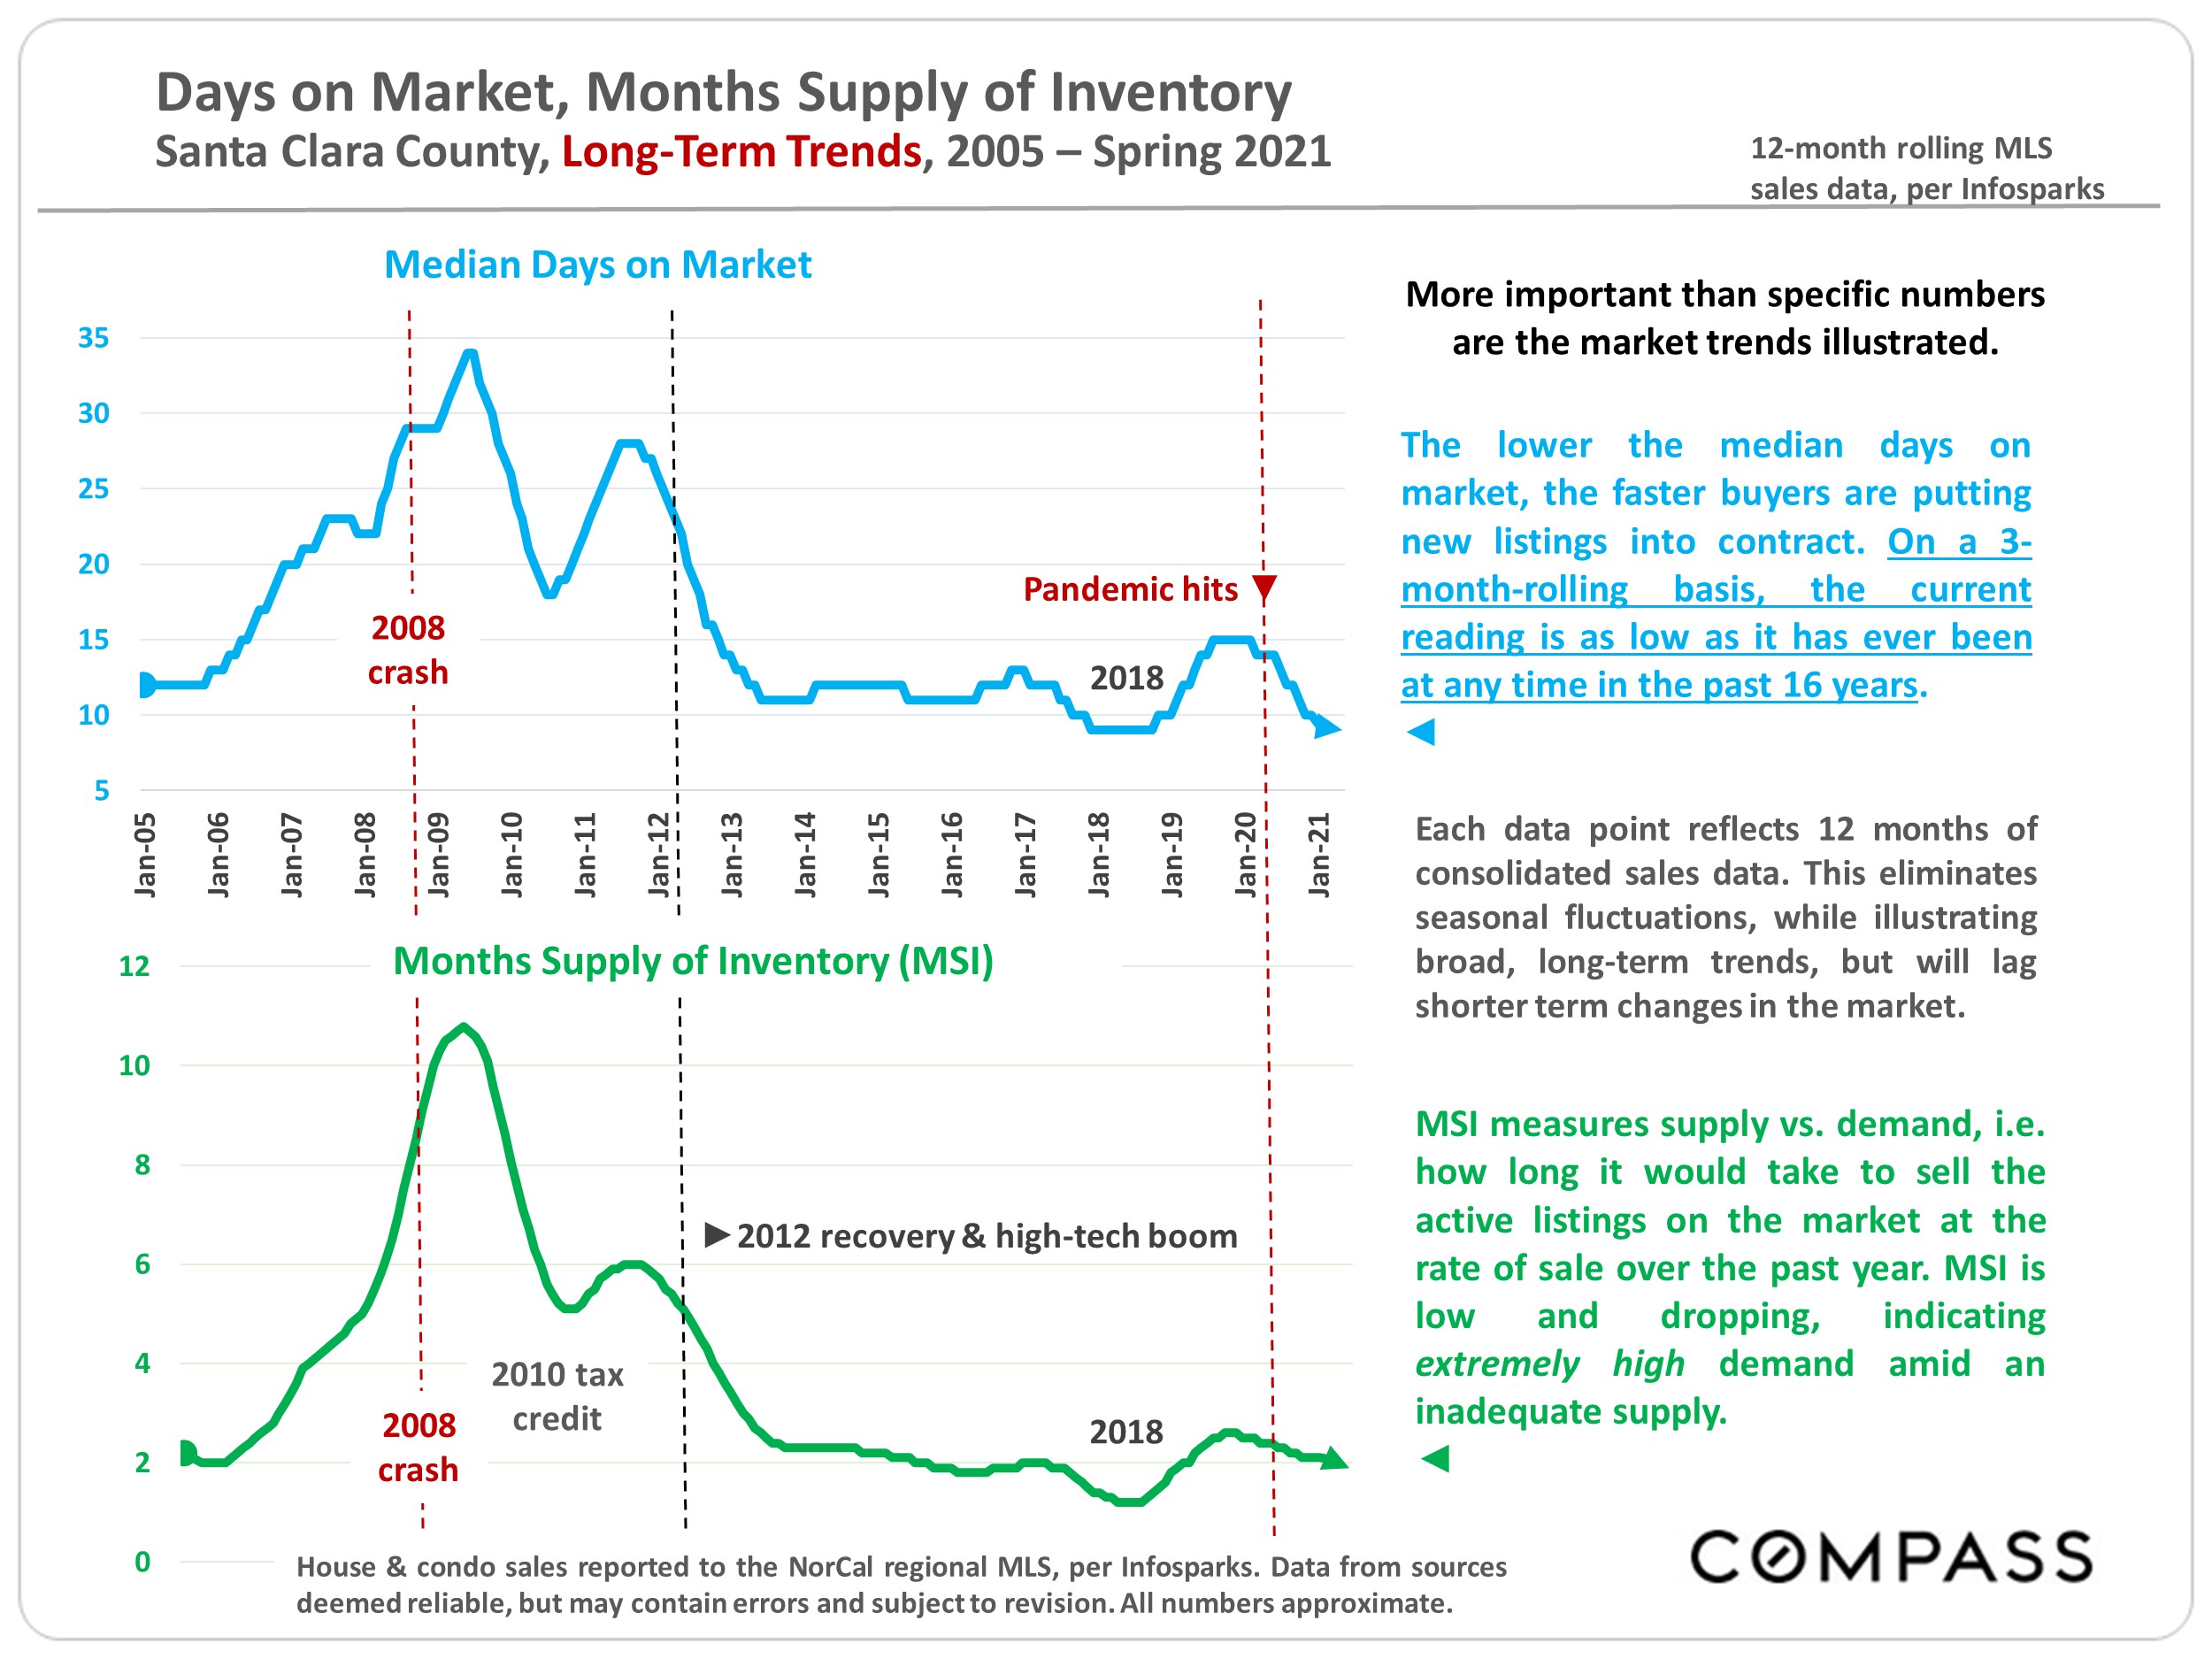
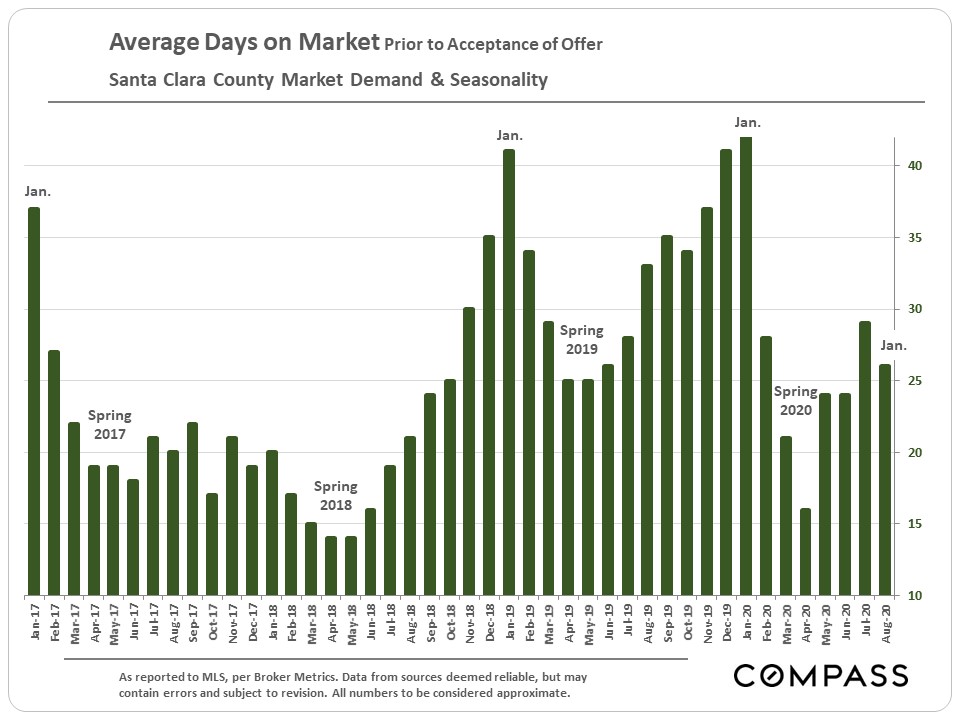
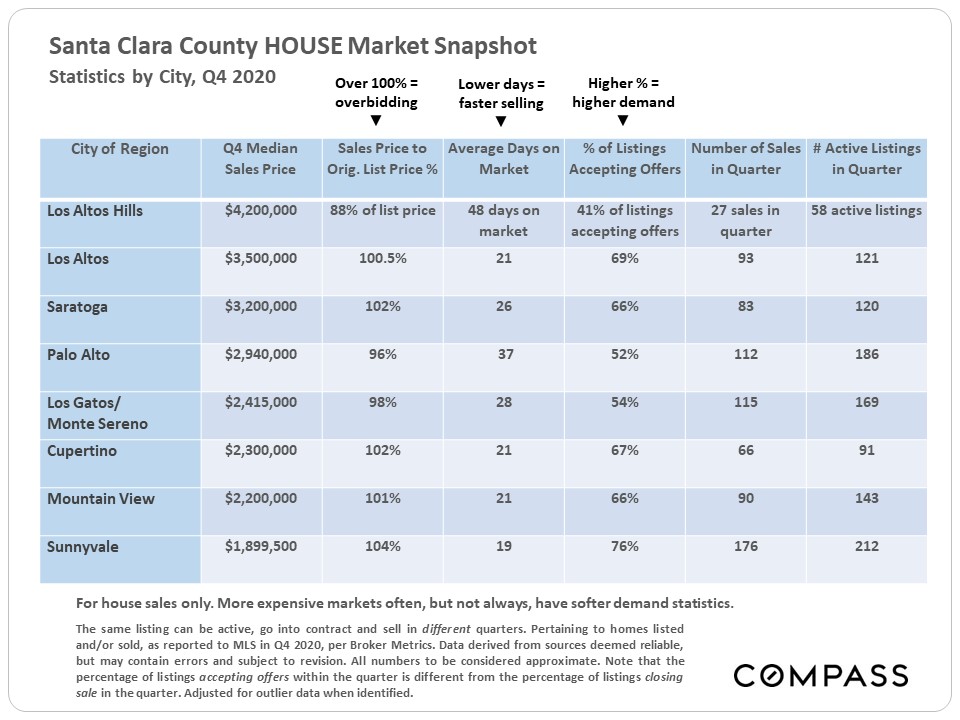
House median days on market: no change from 8 days
Condo median days on market: up to 16 from 13 days
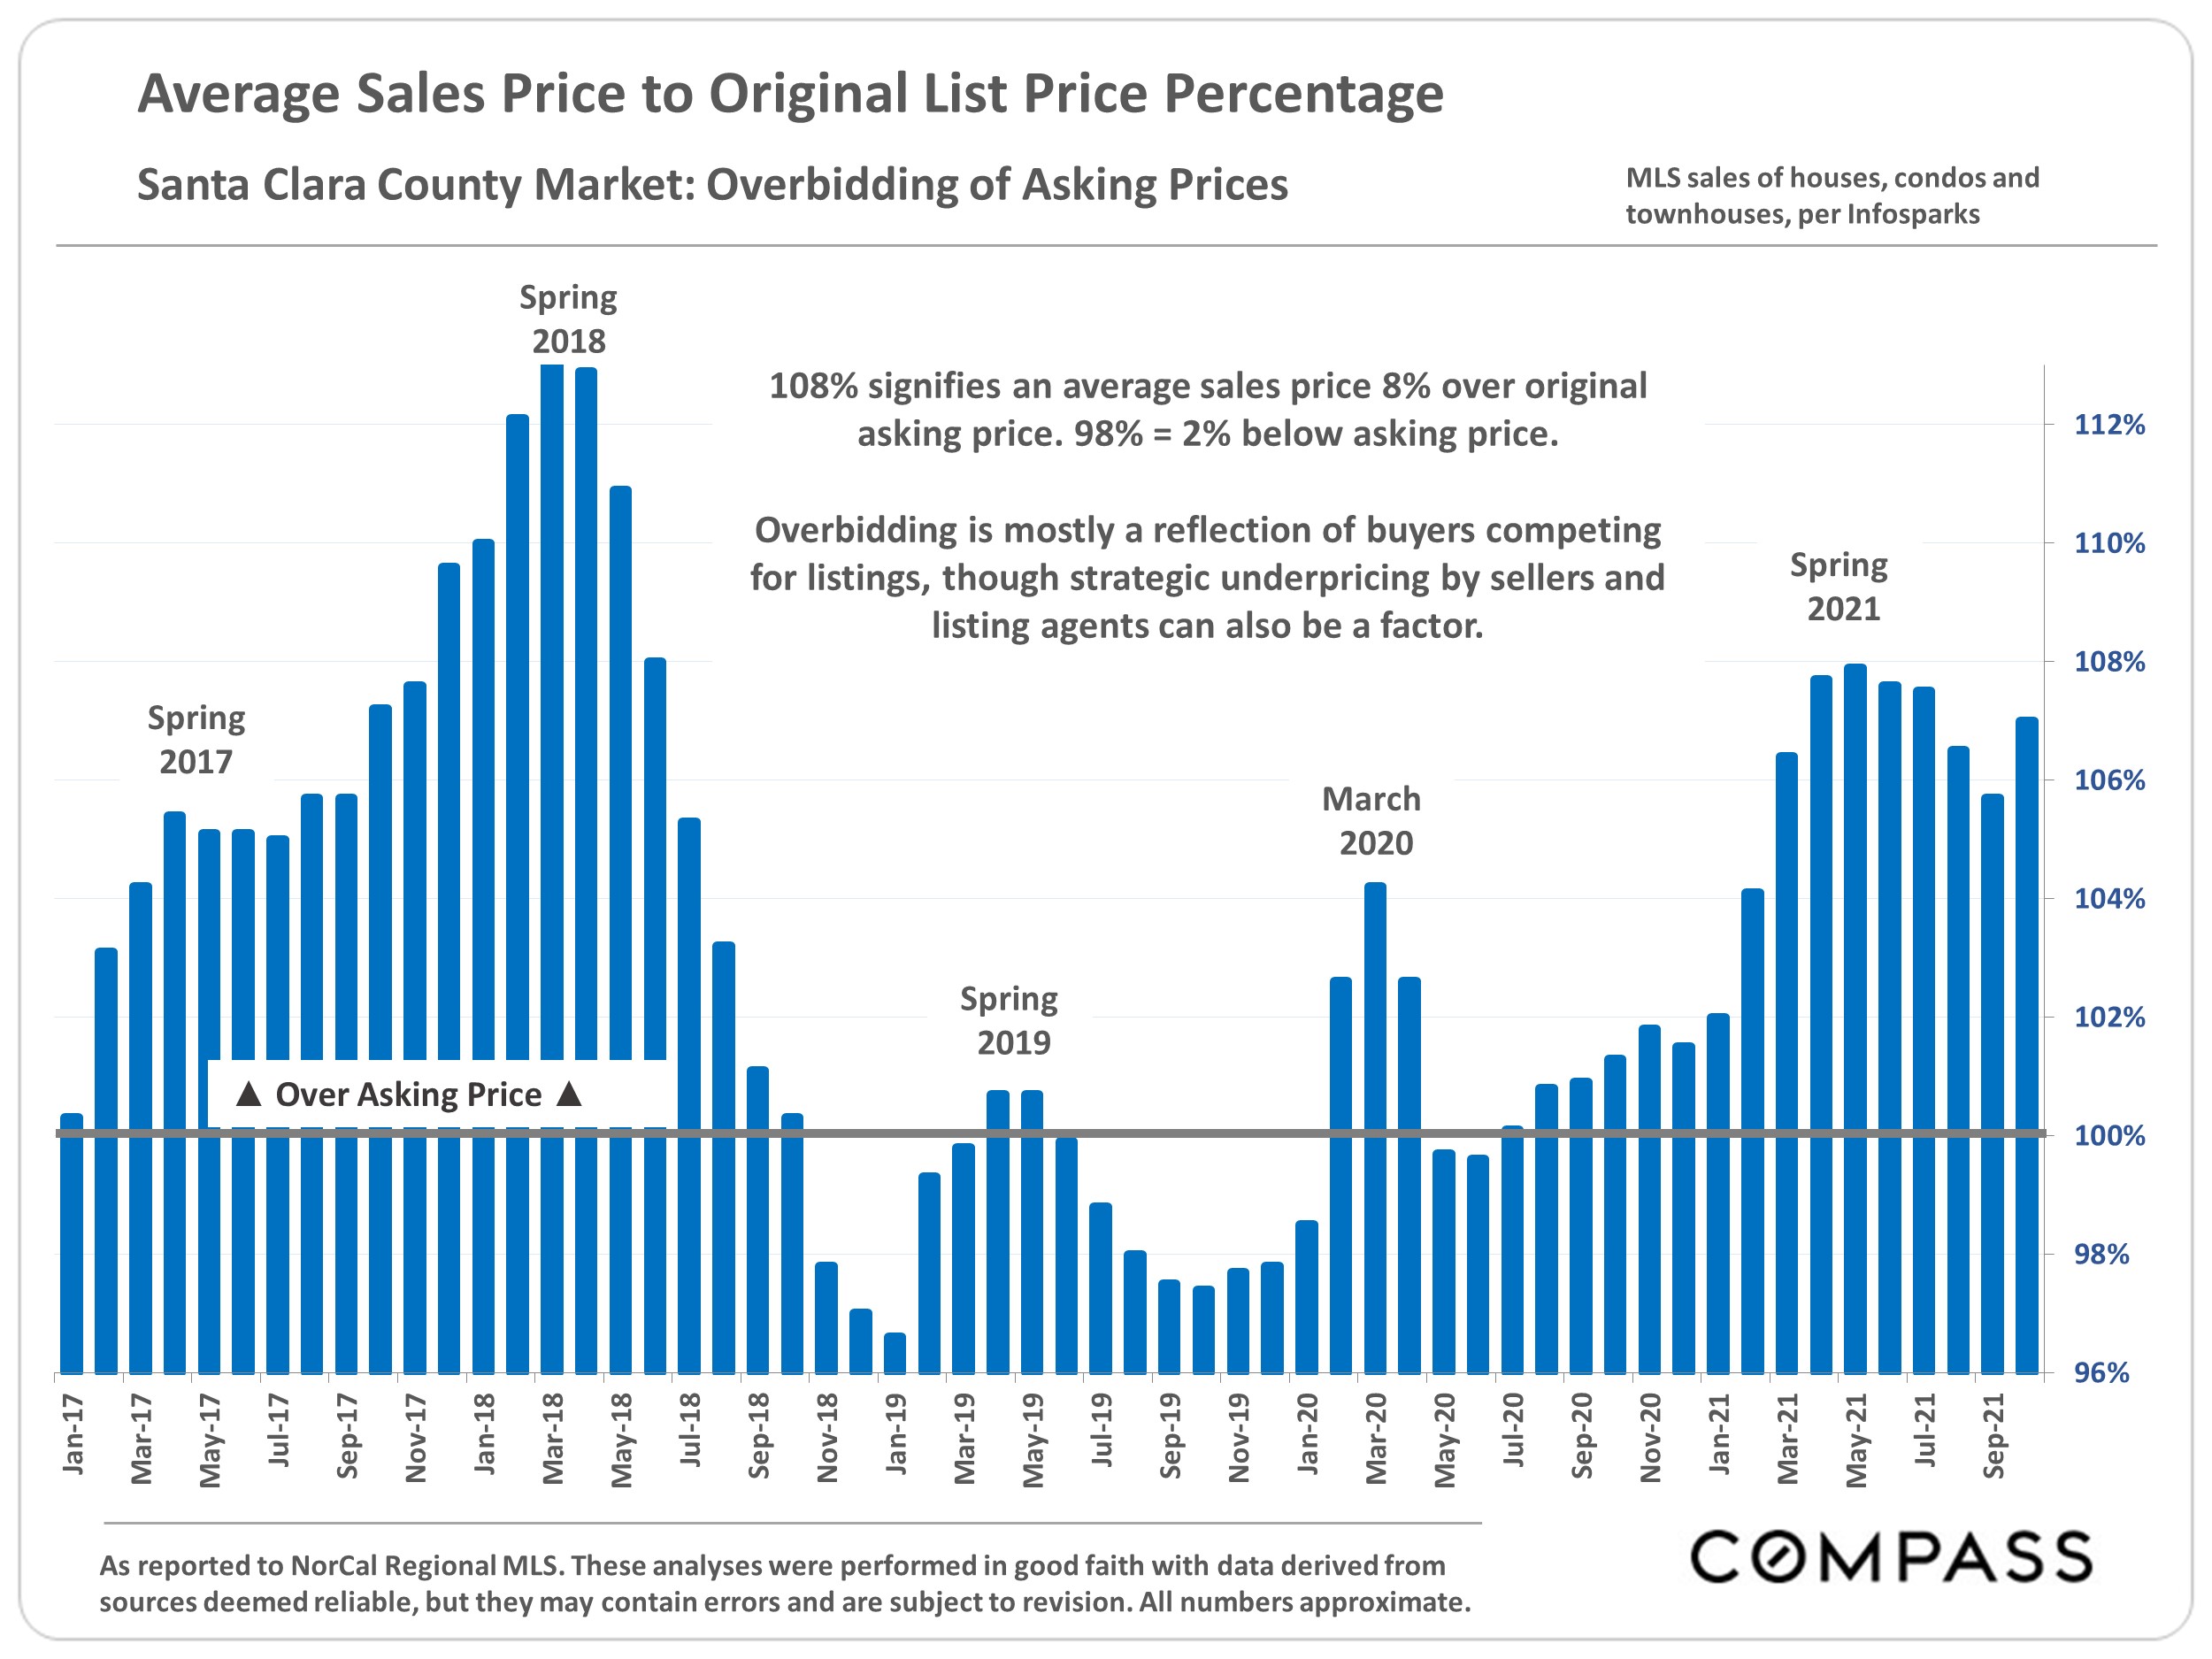
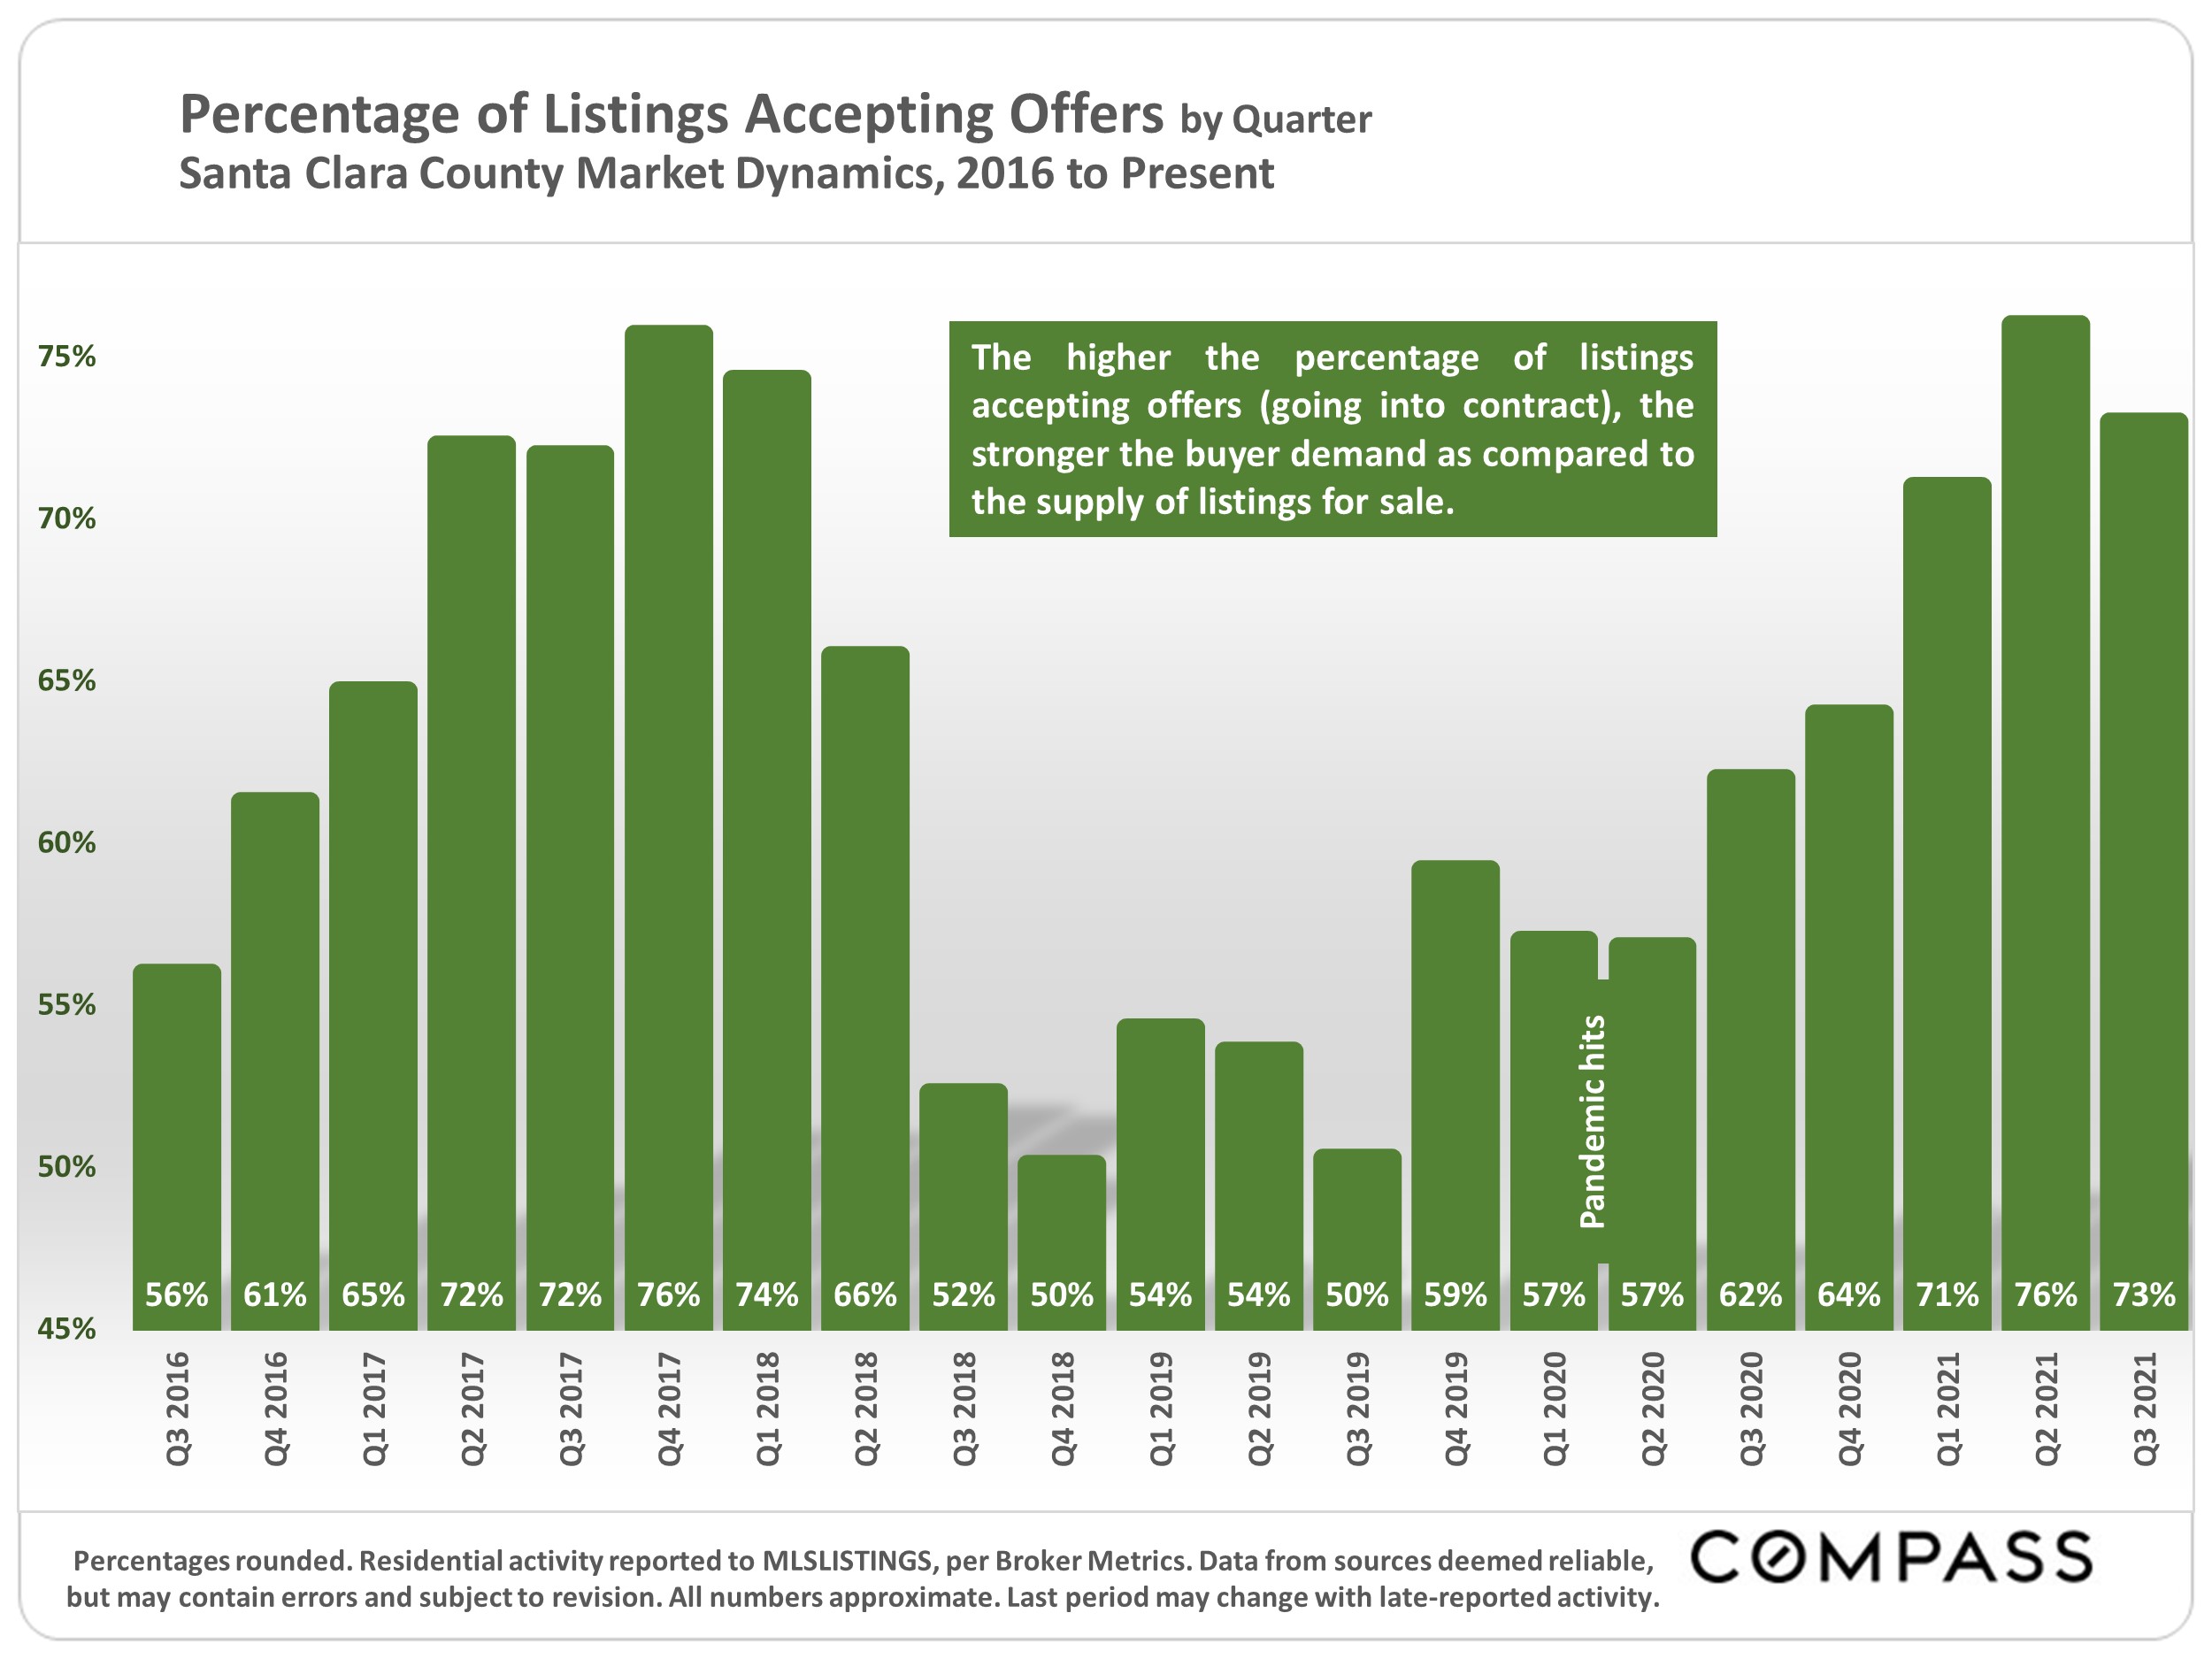
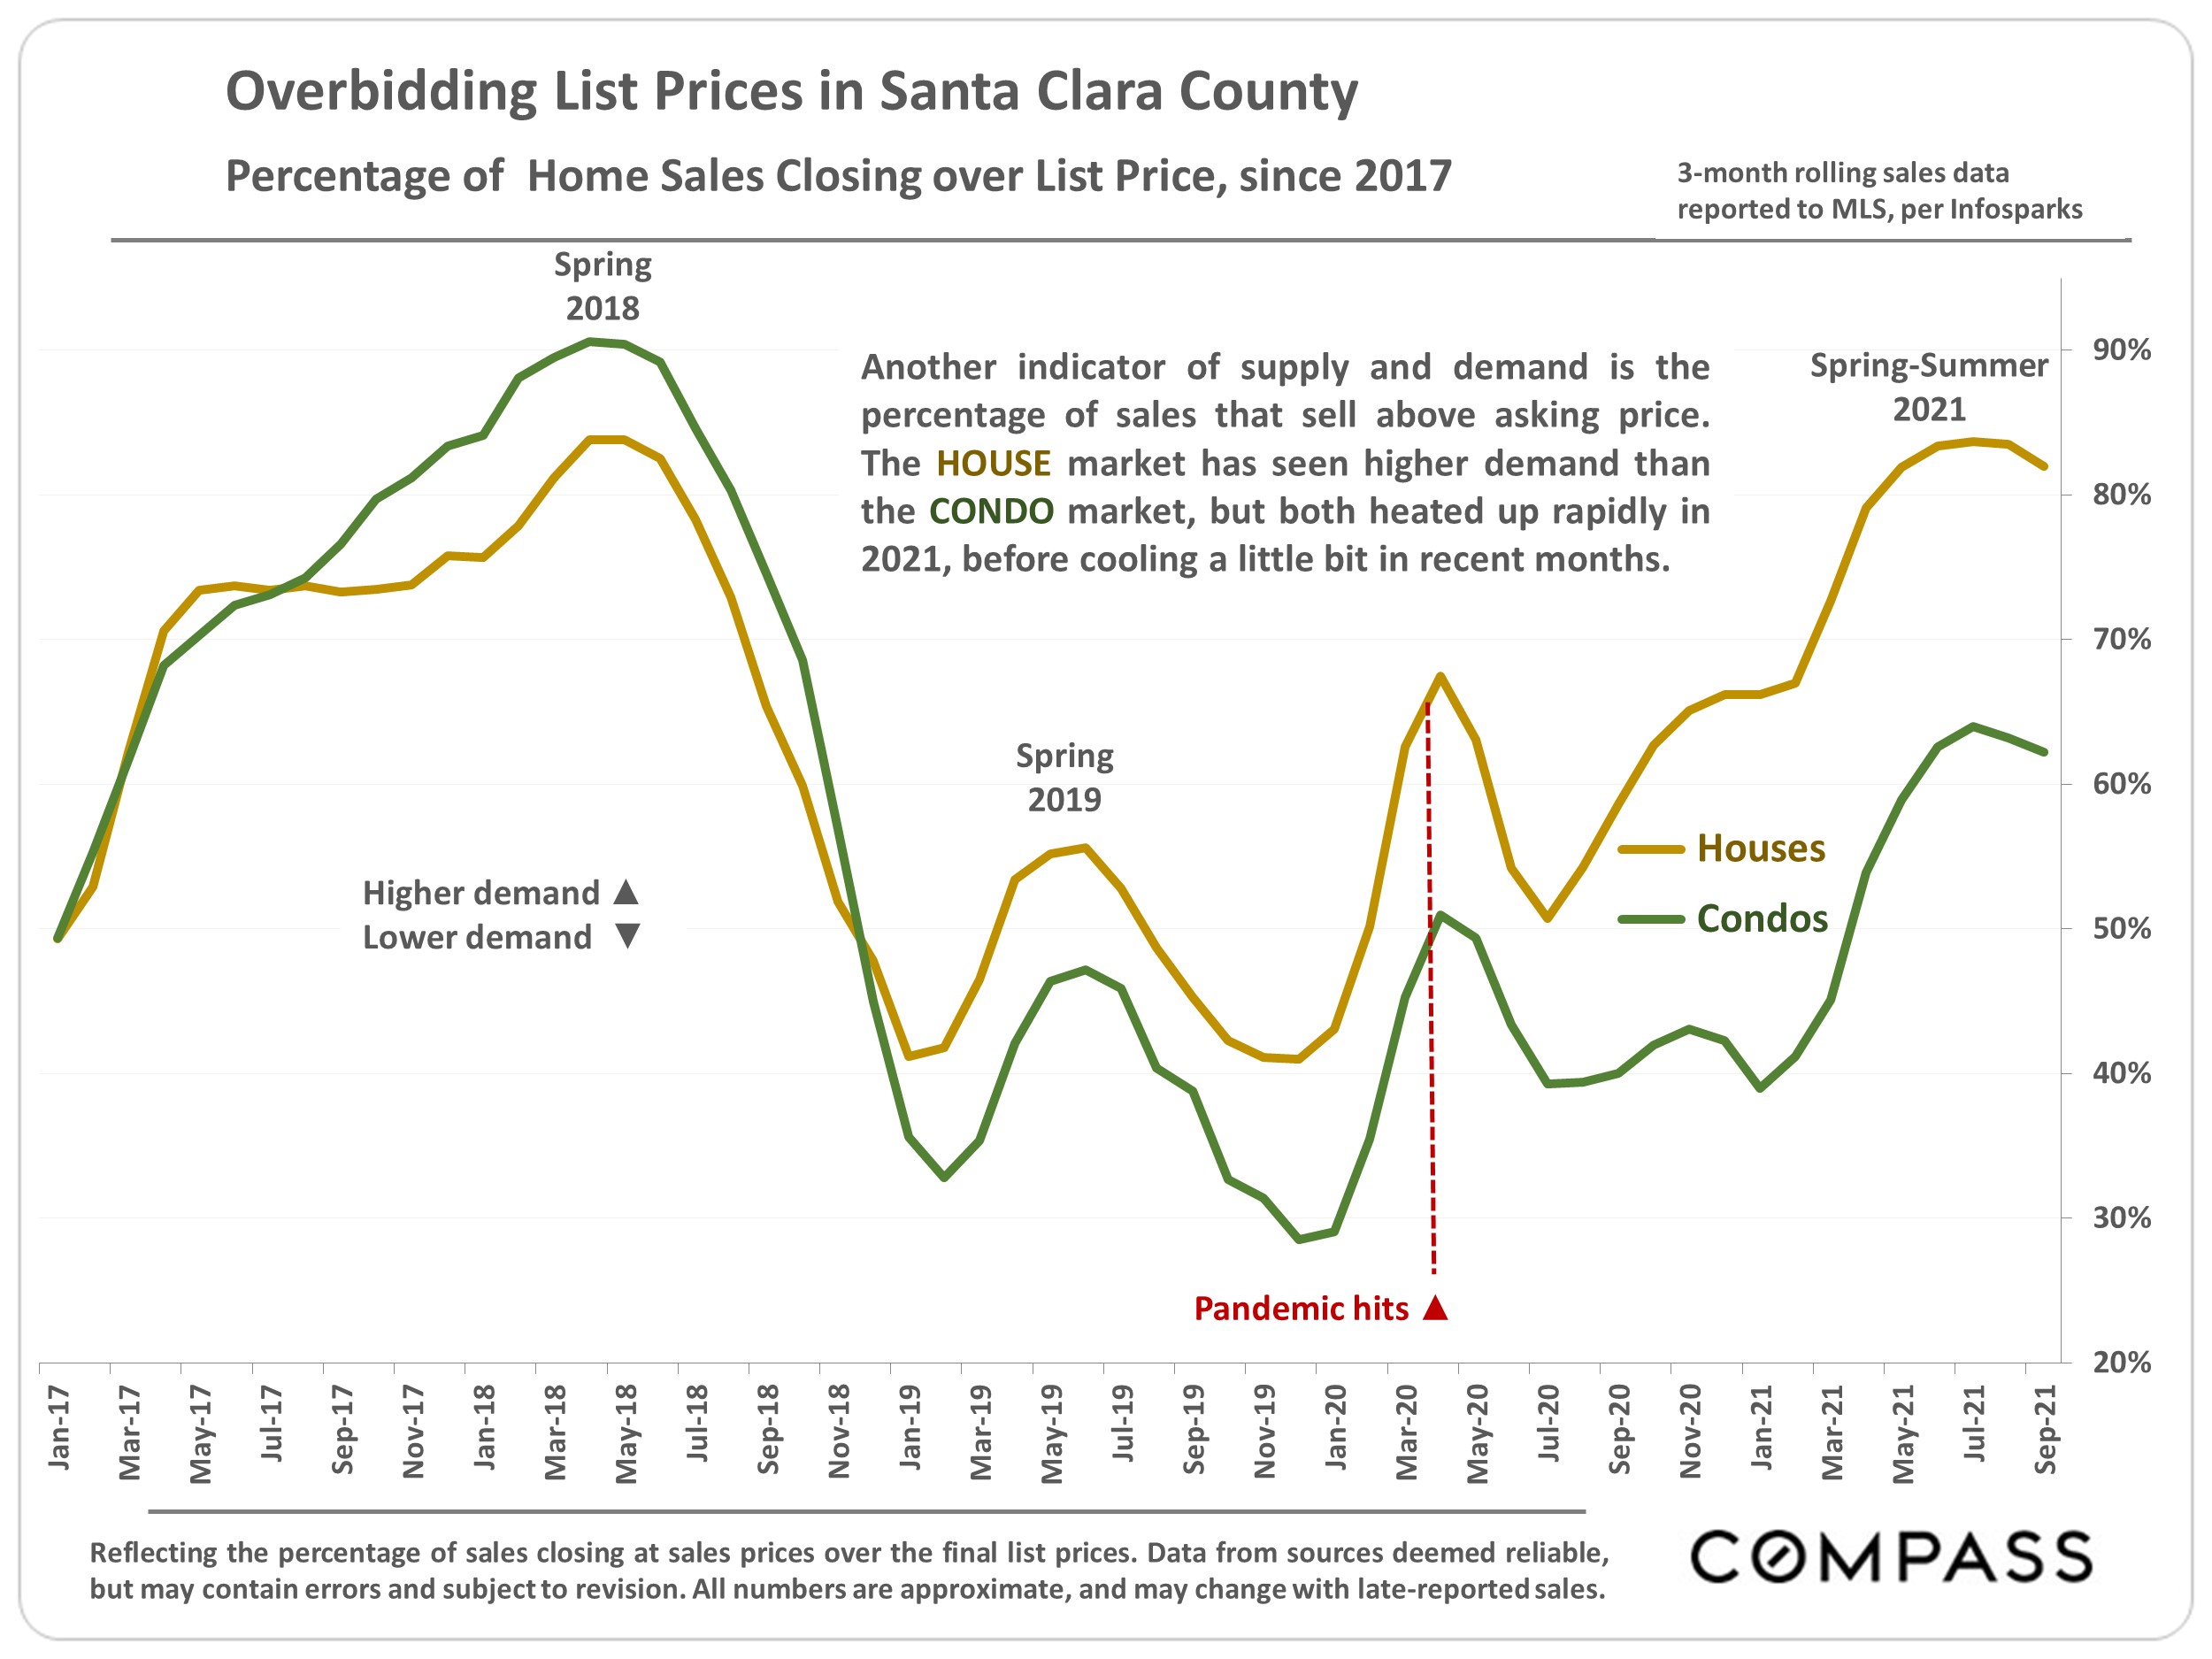
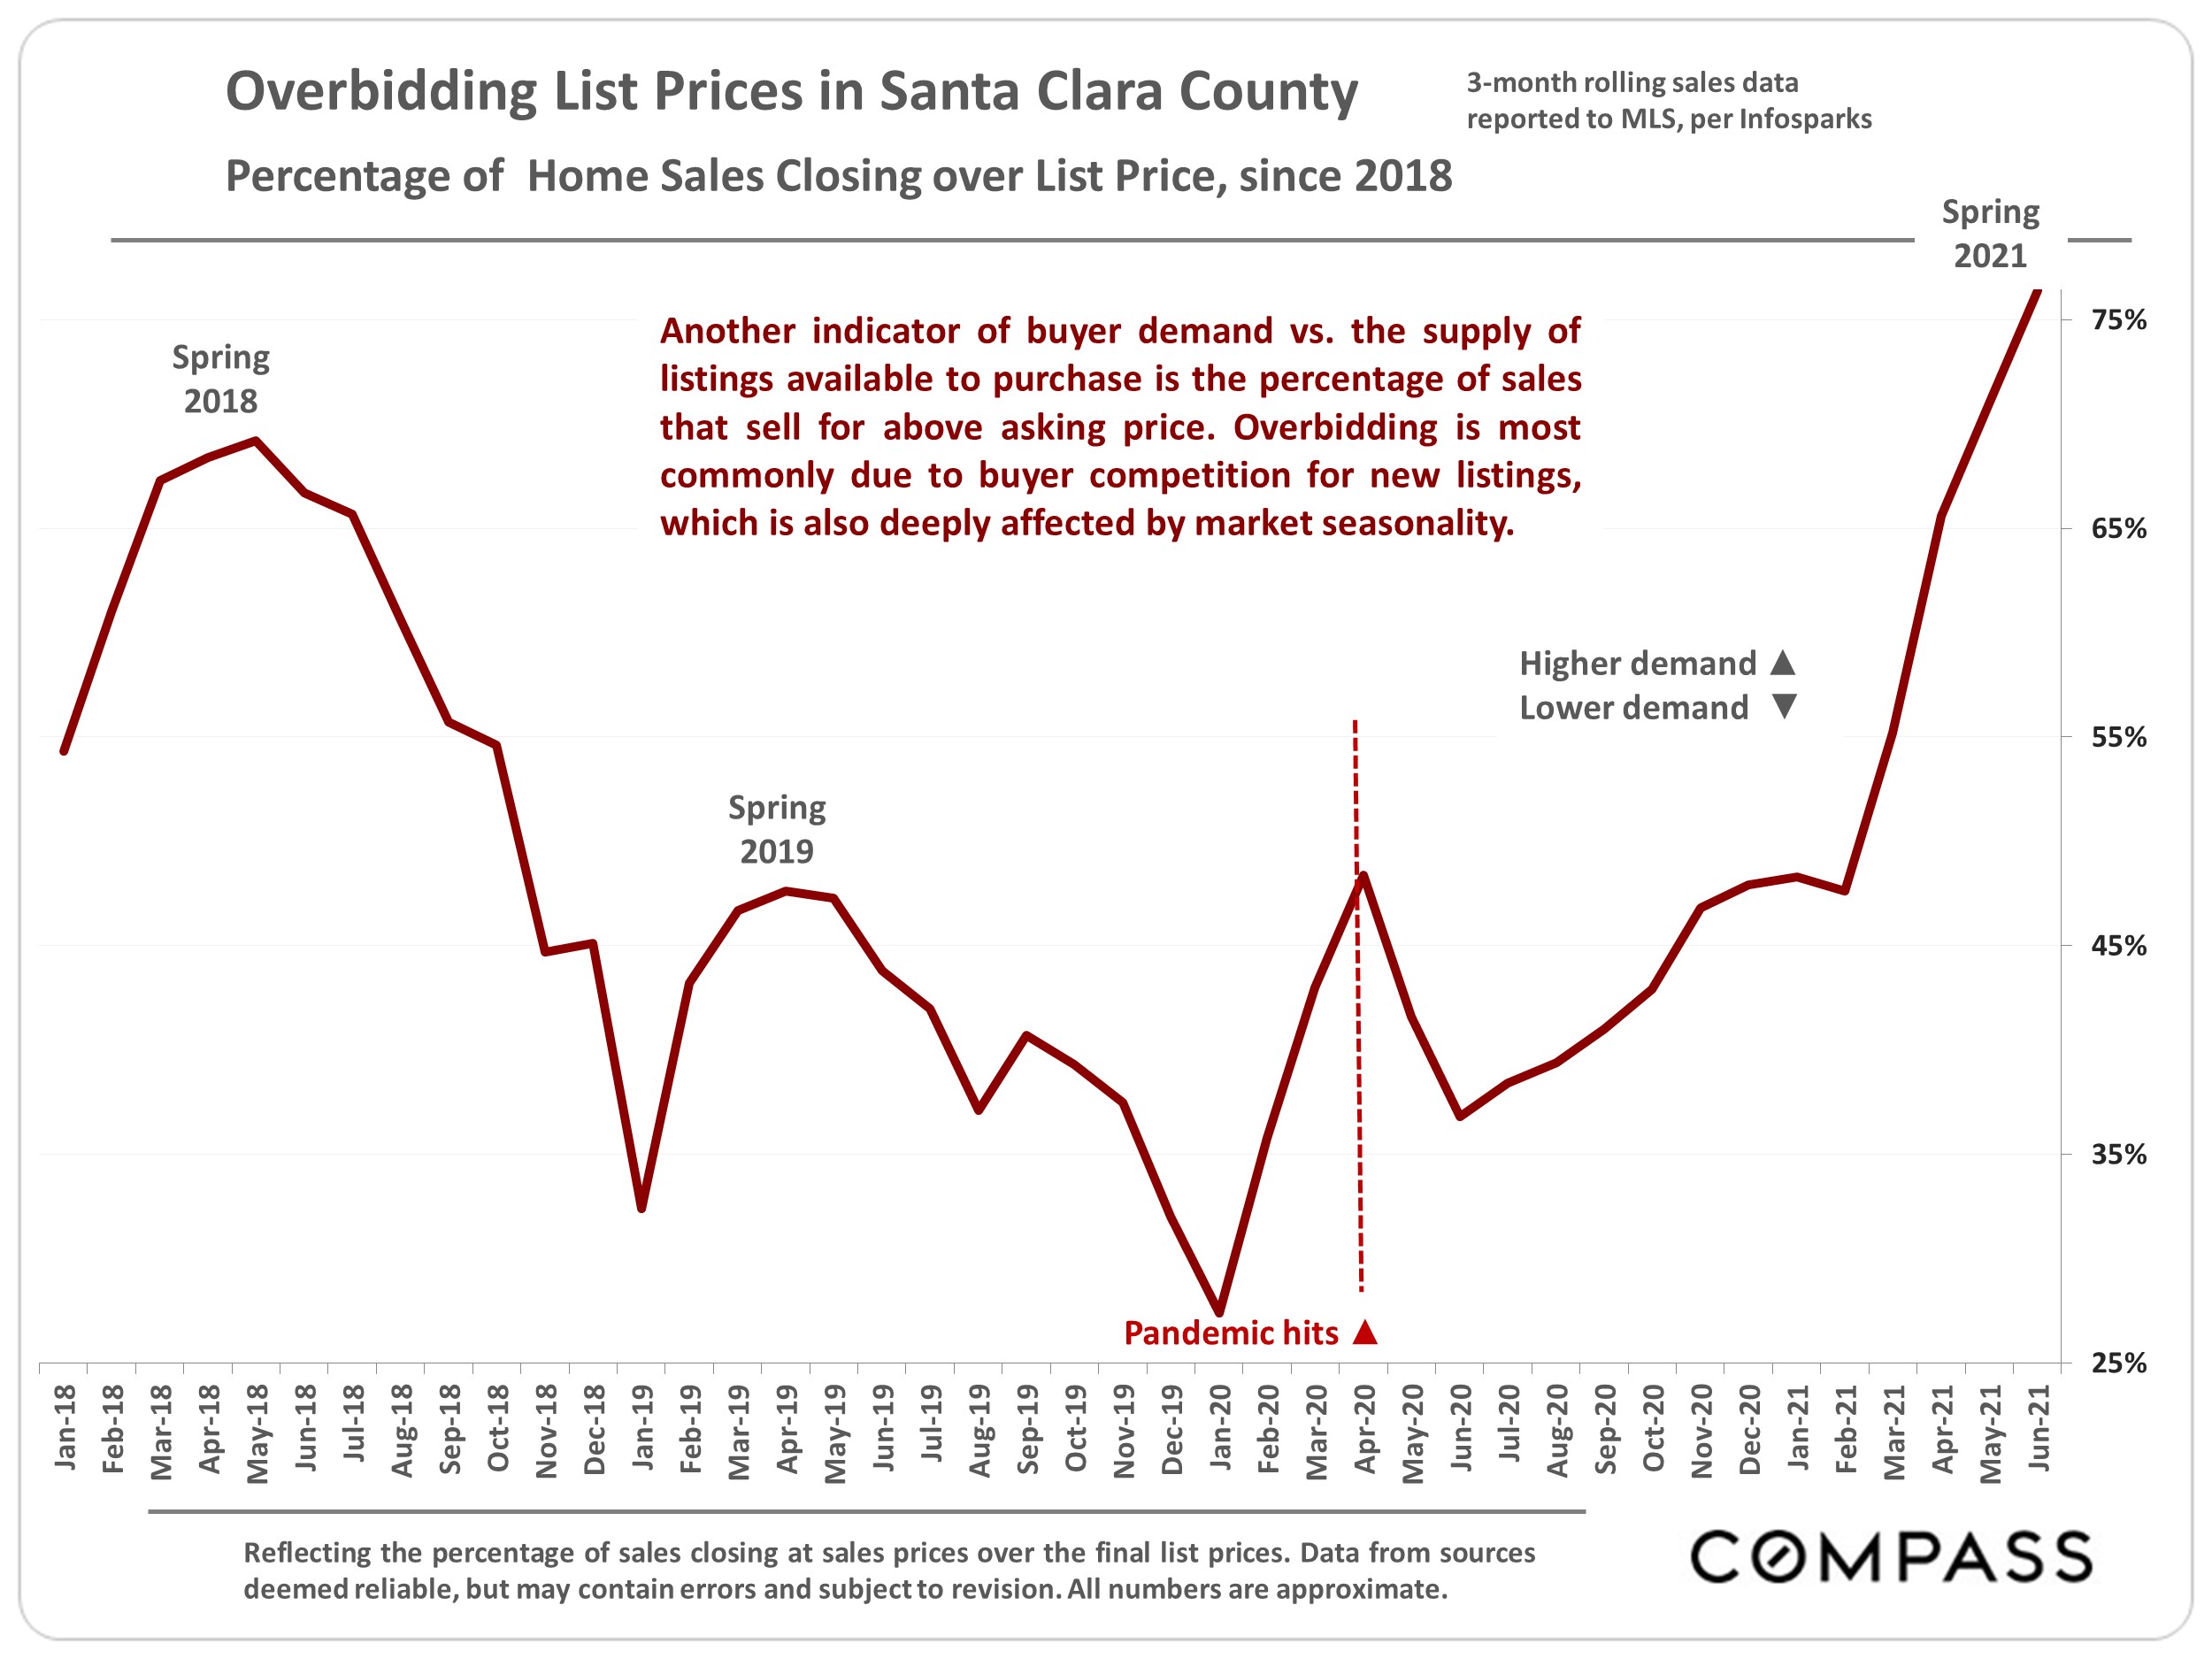
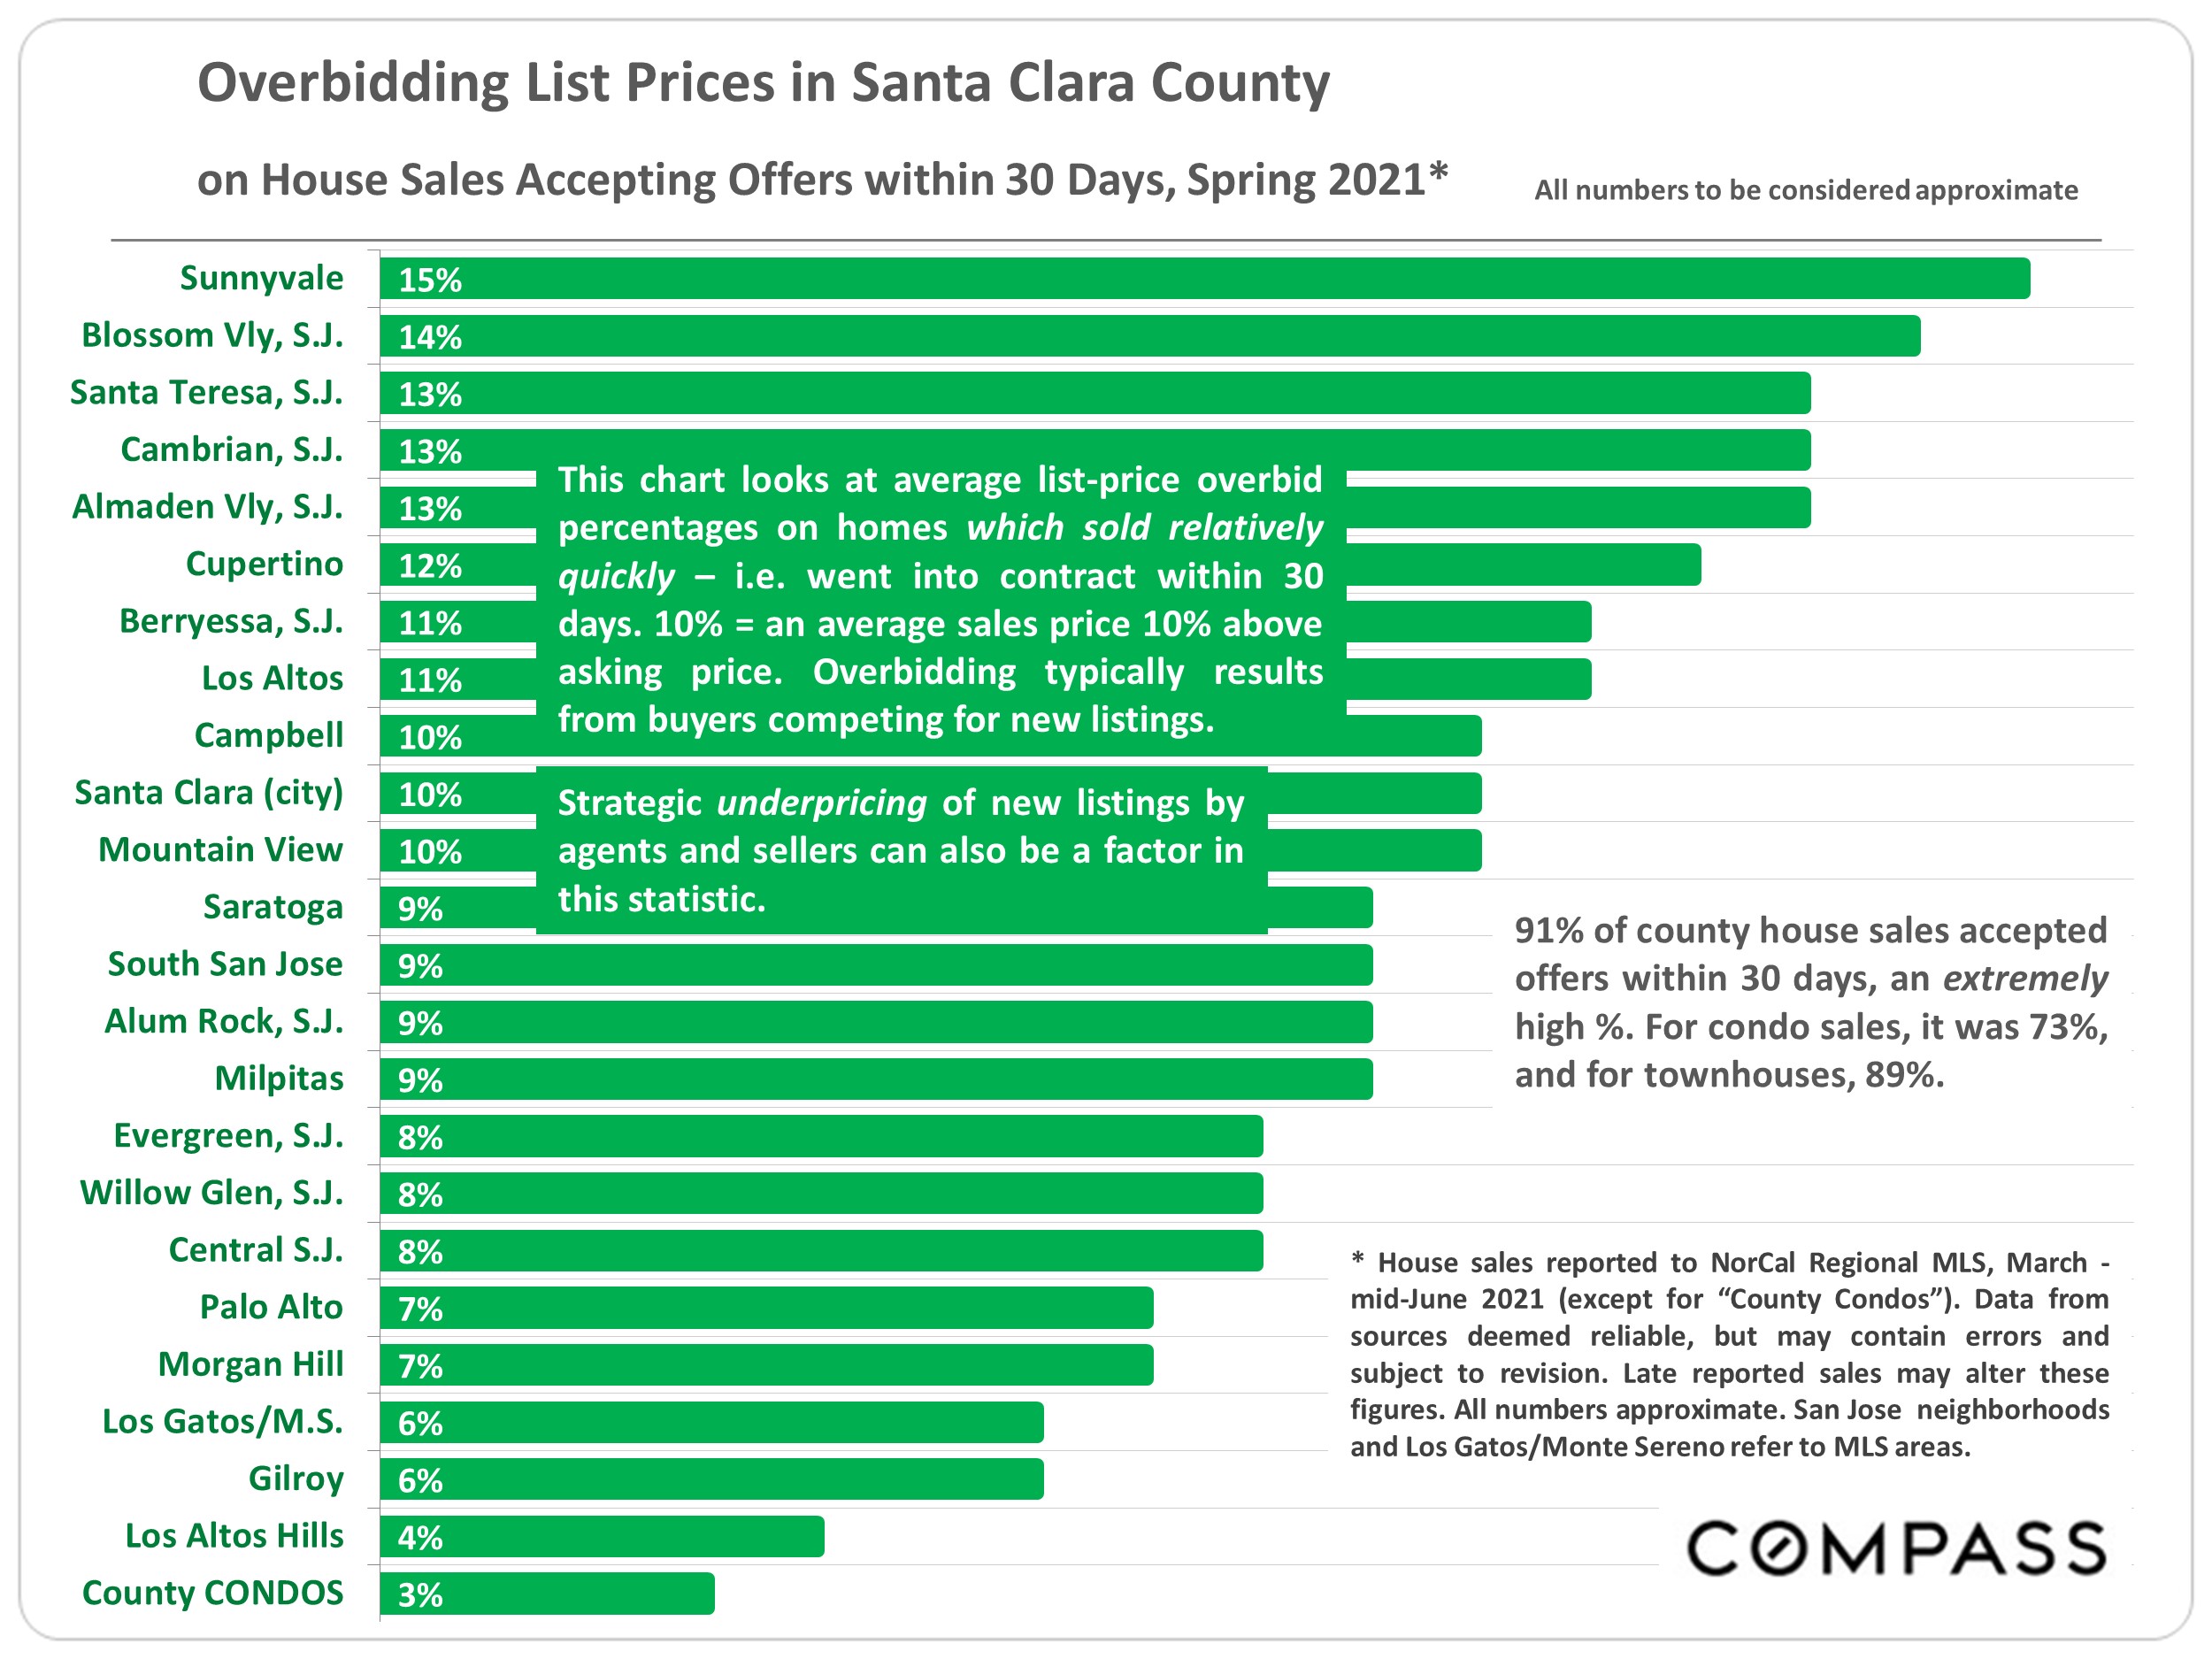
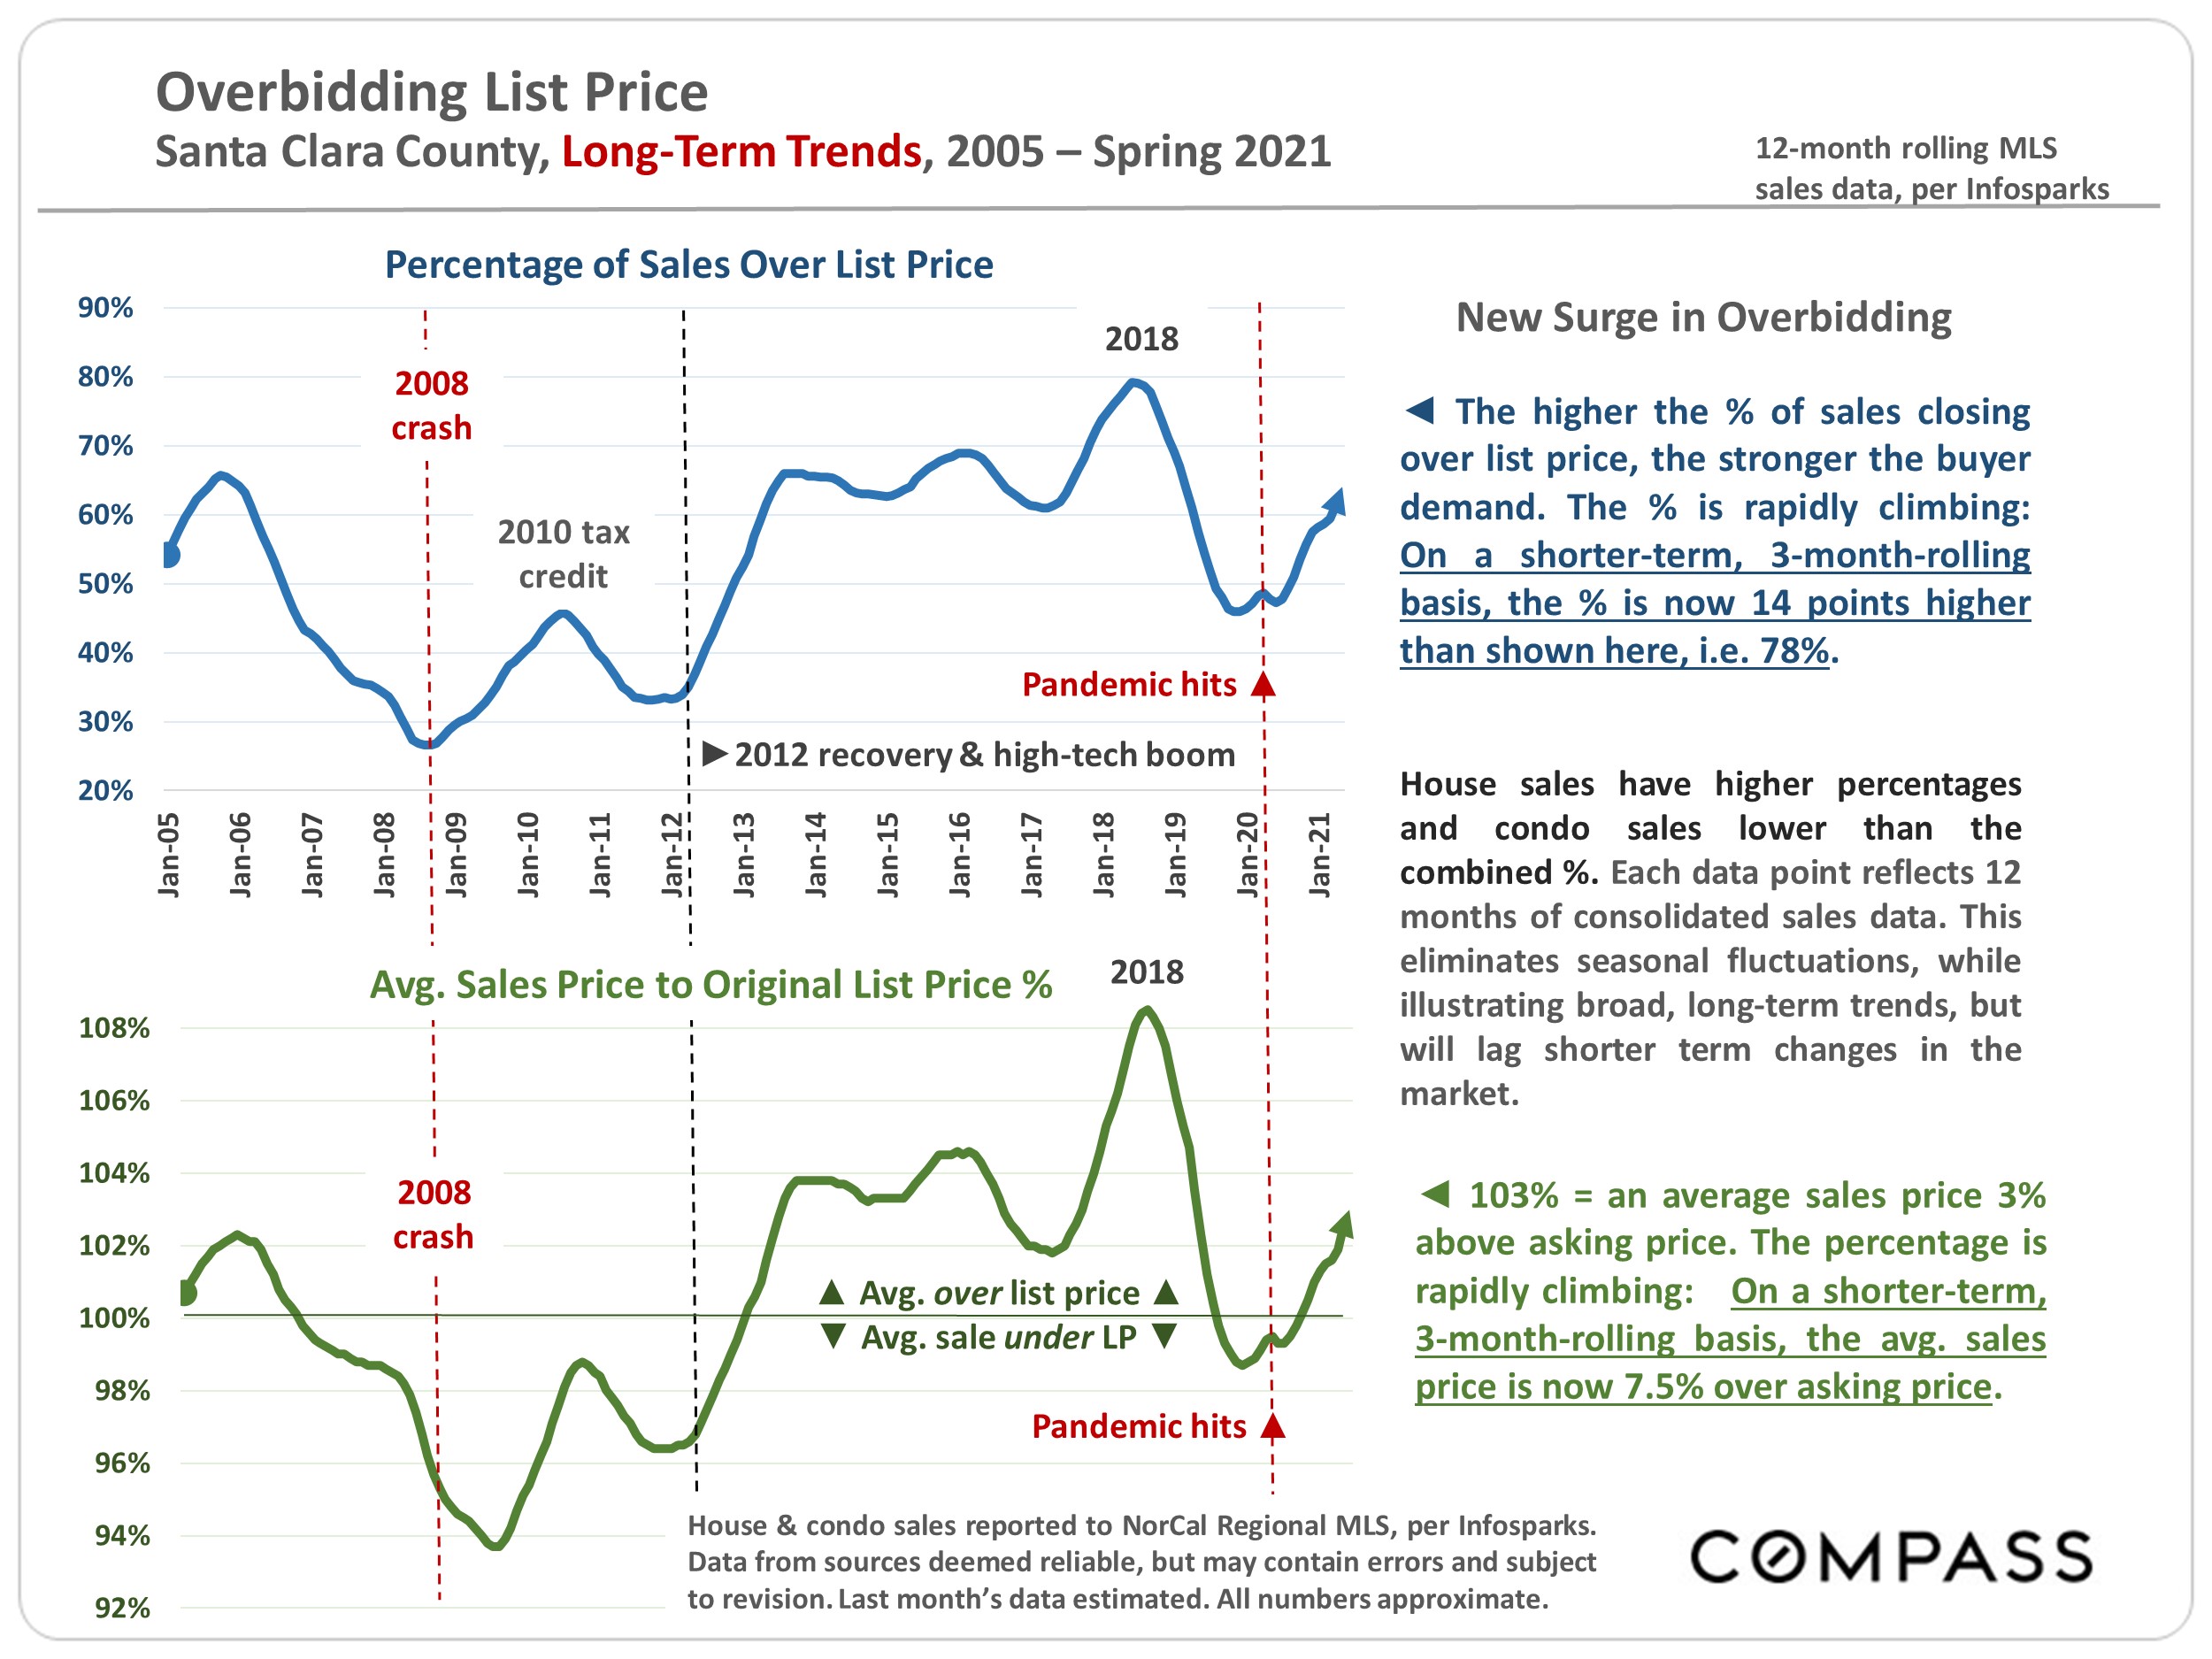
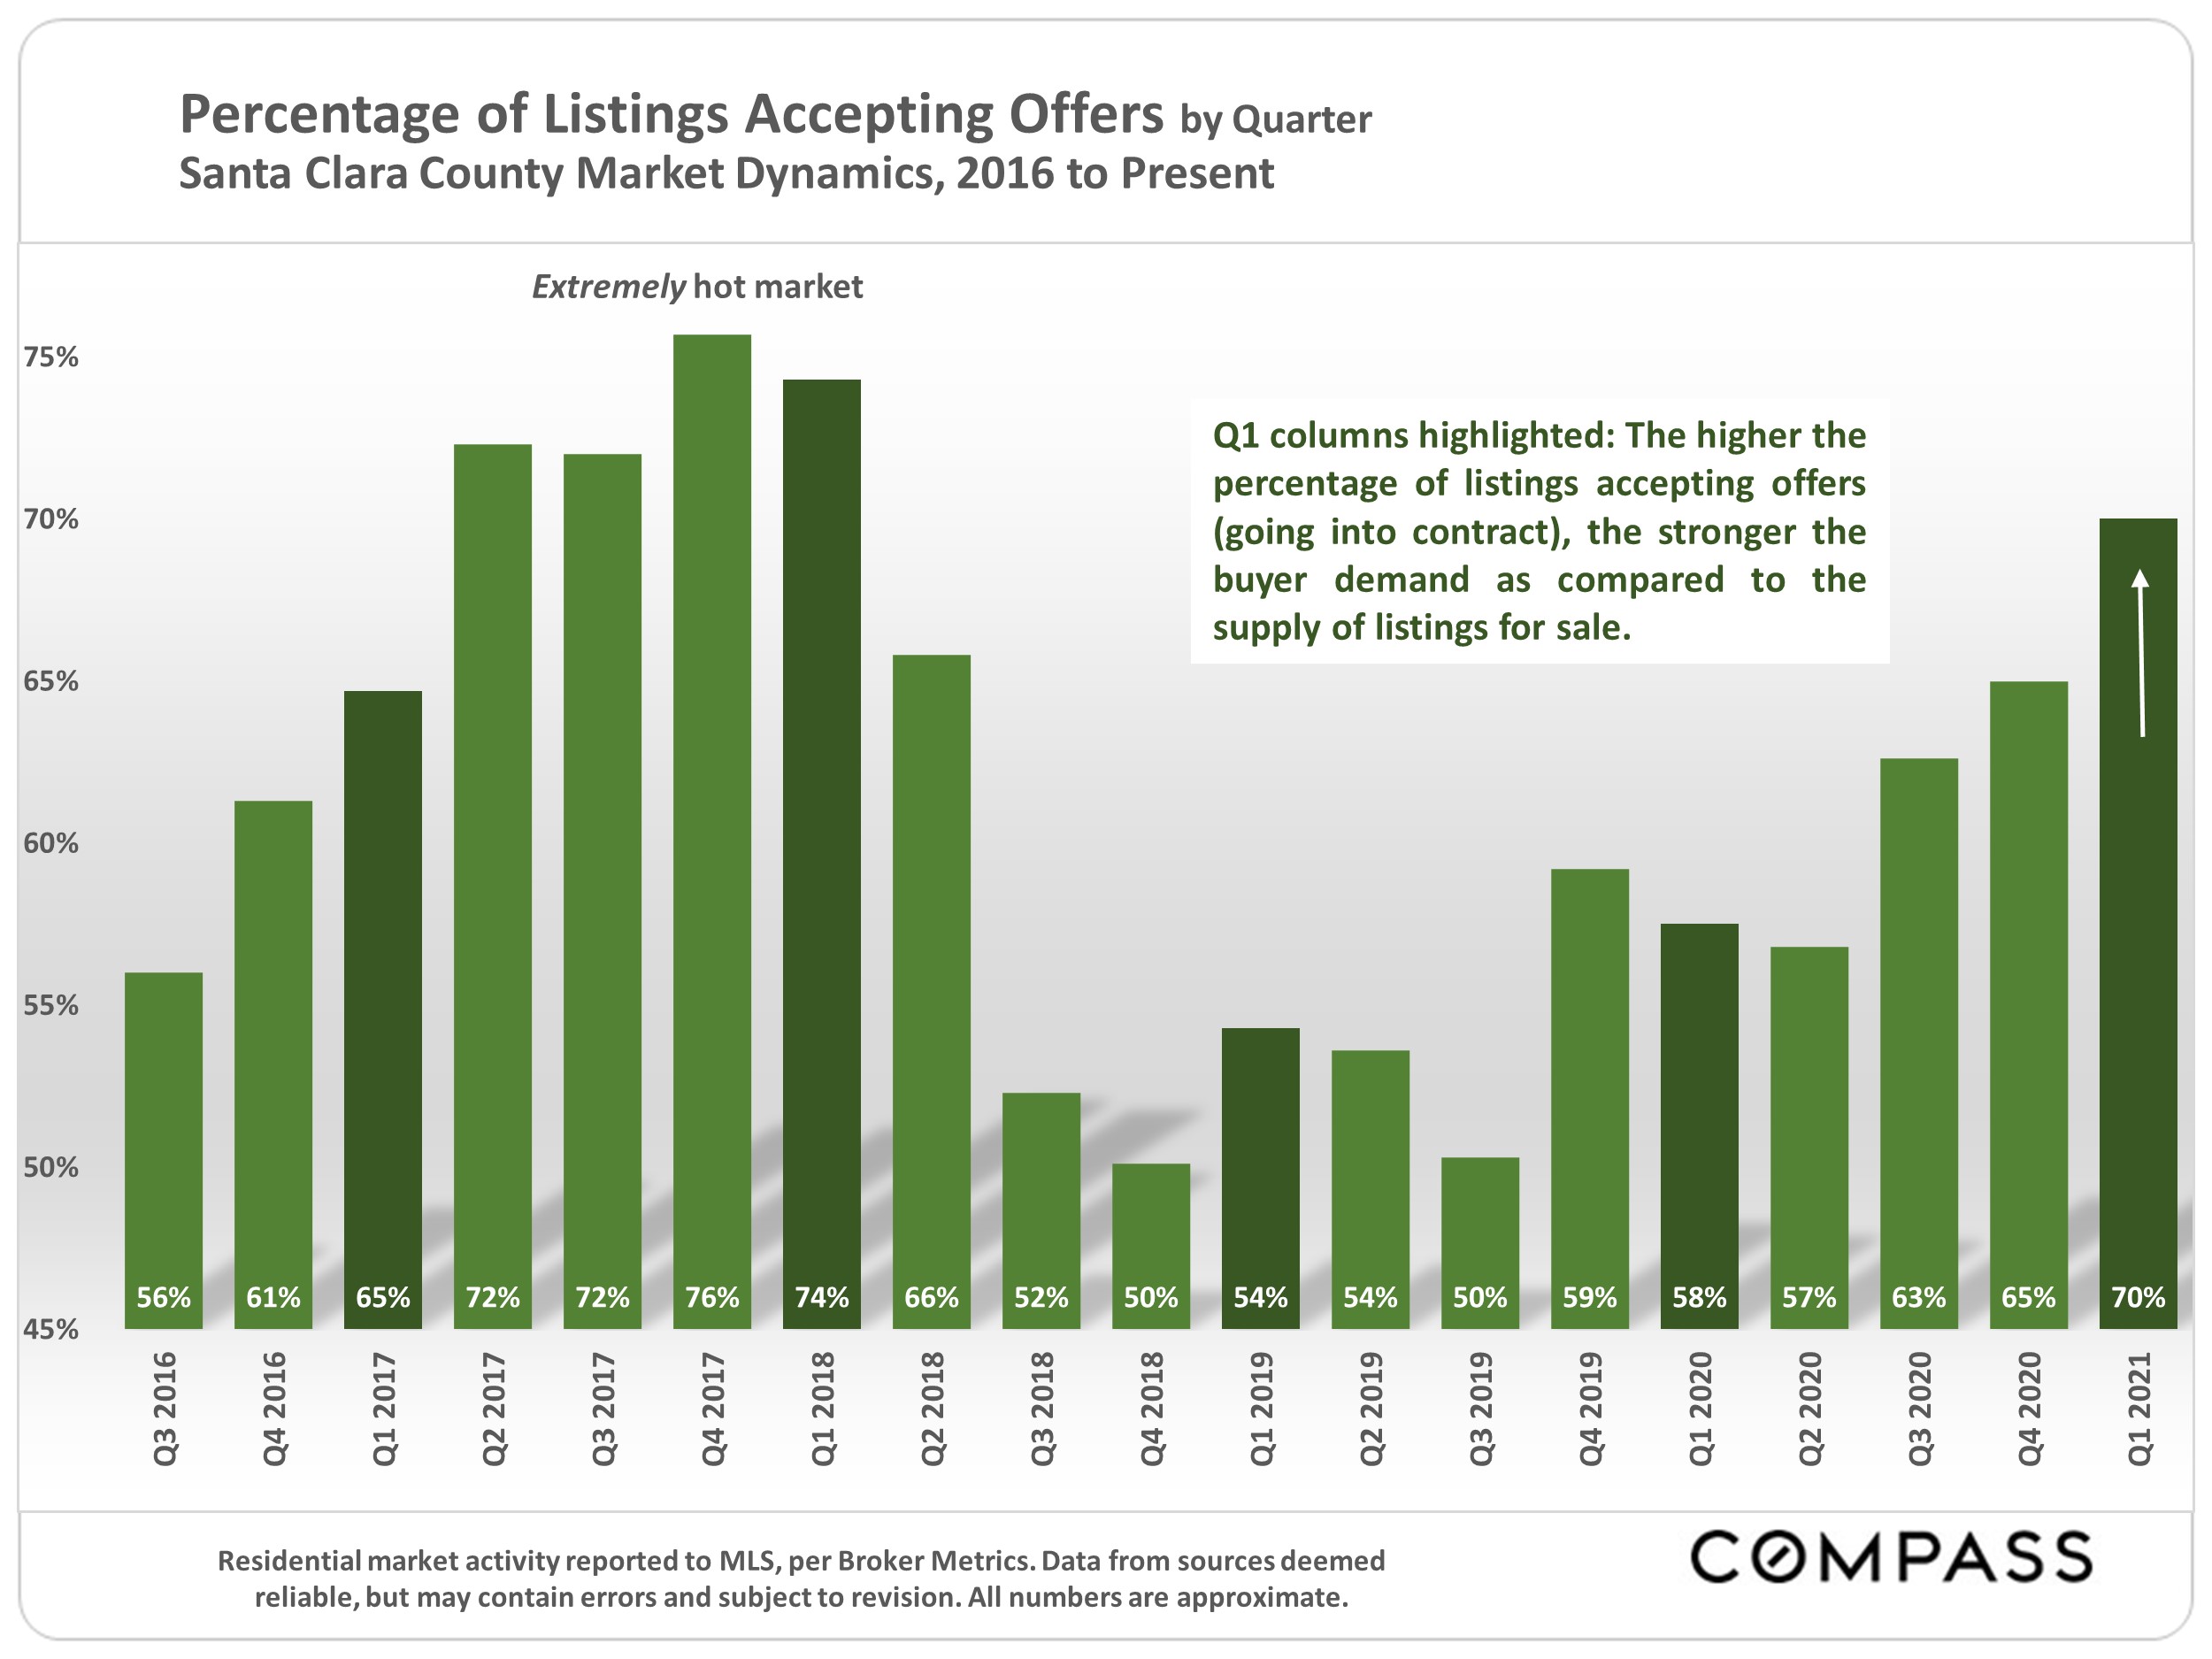
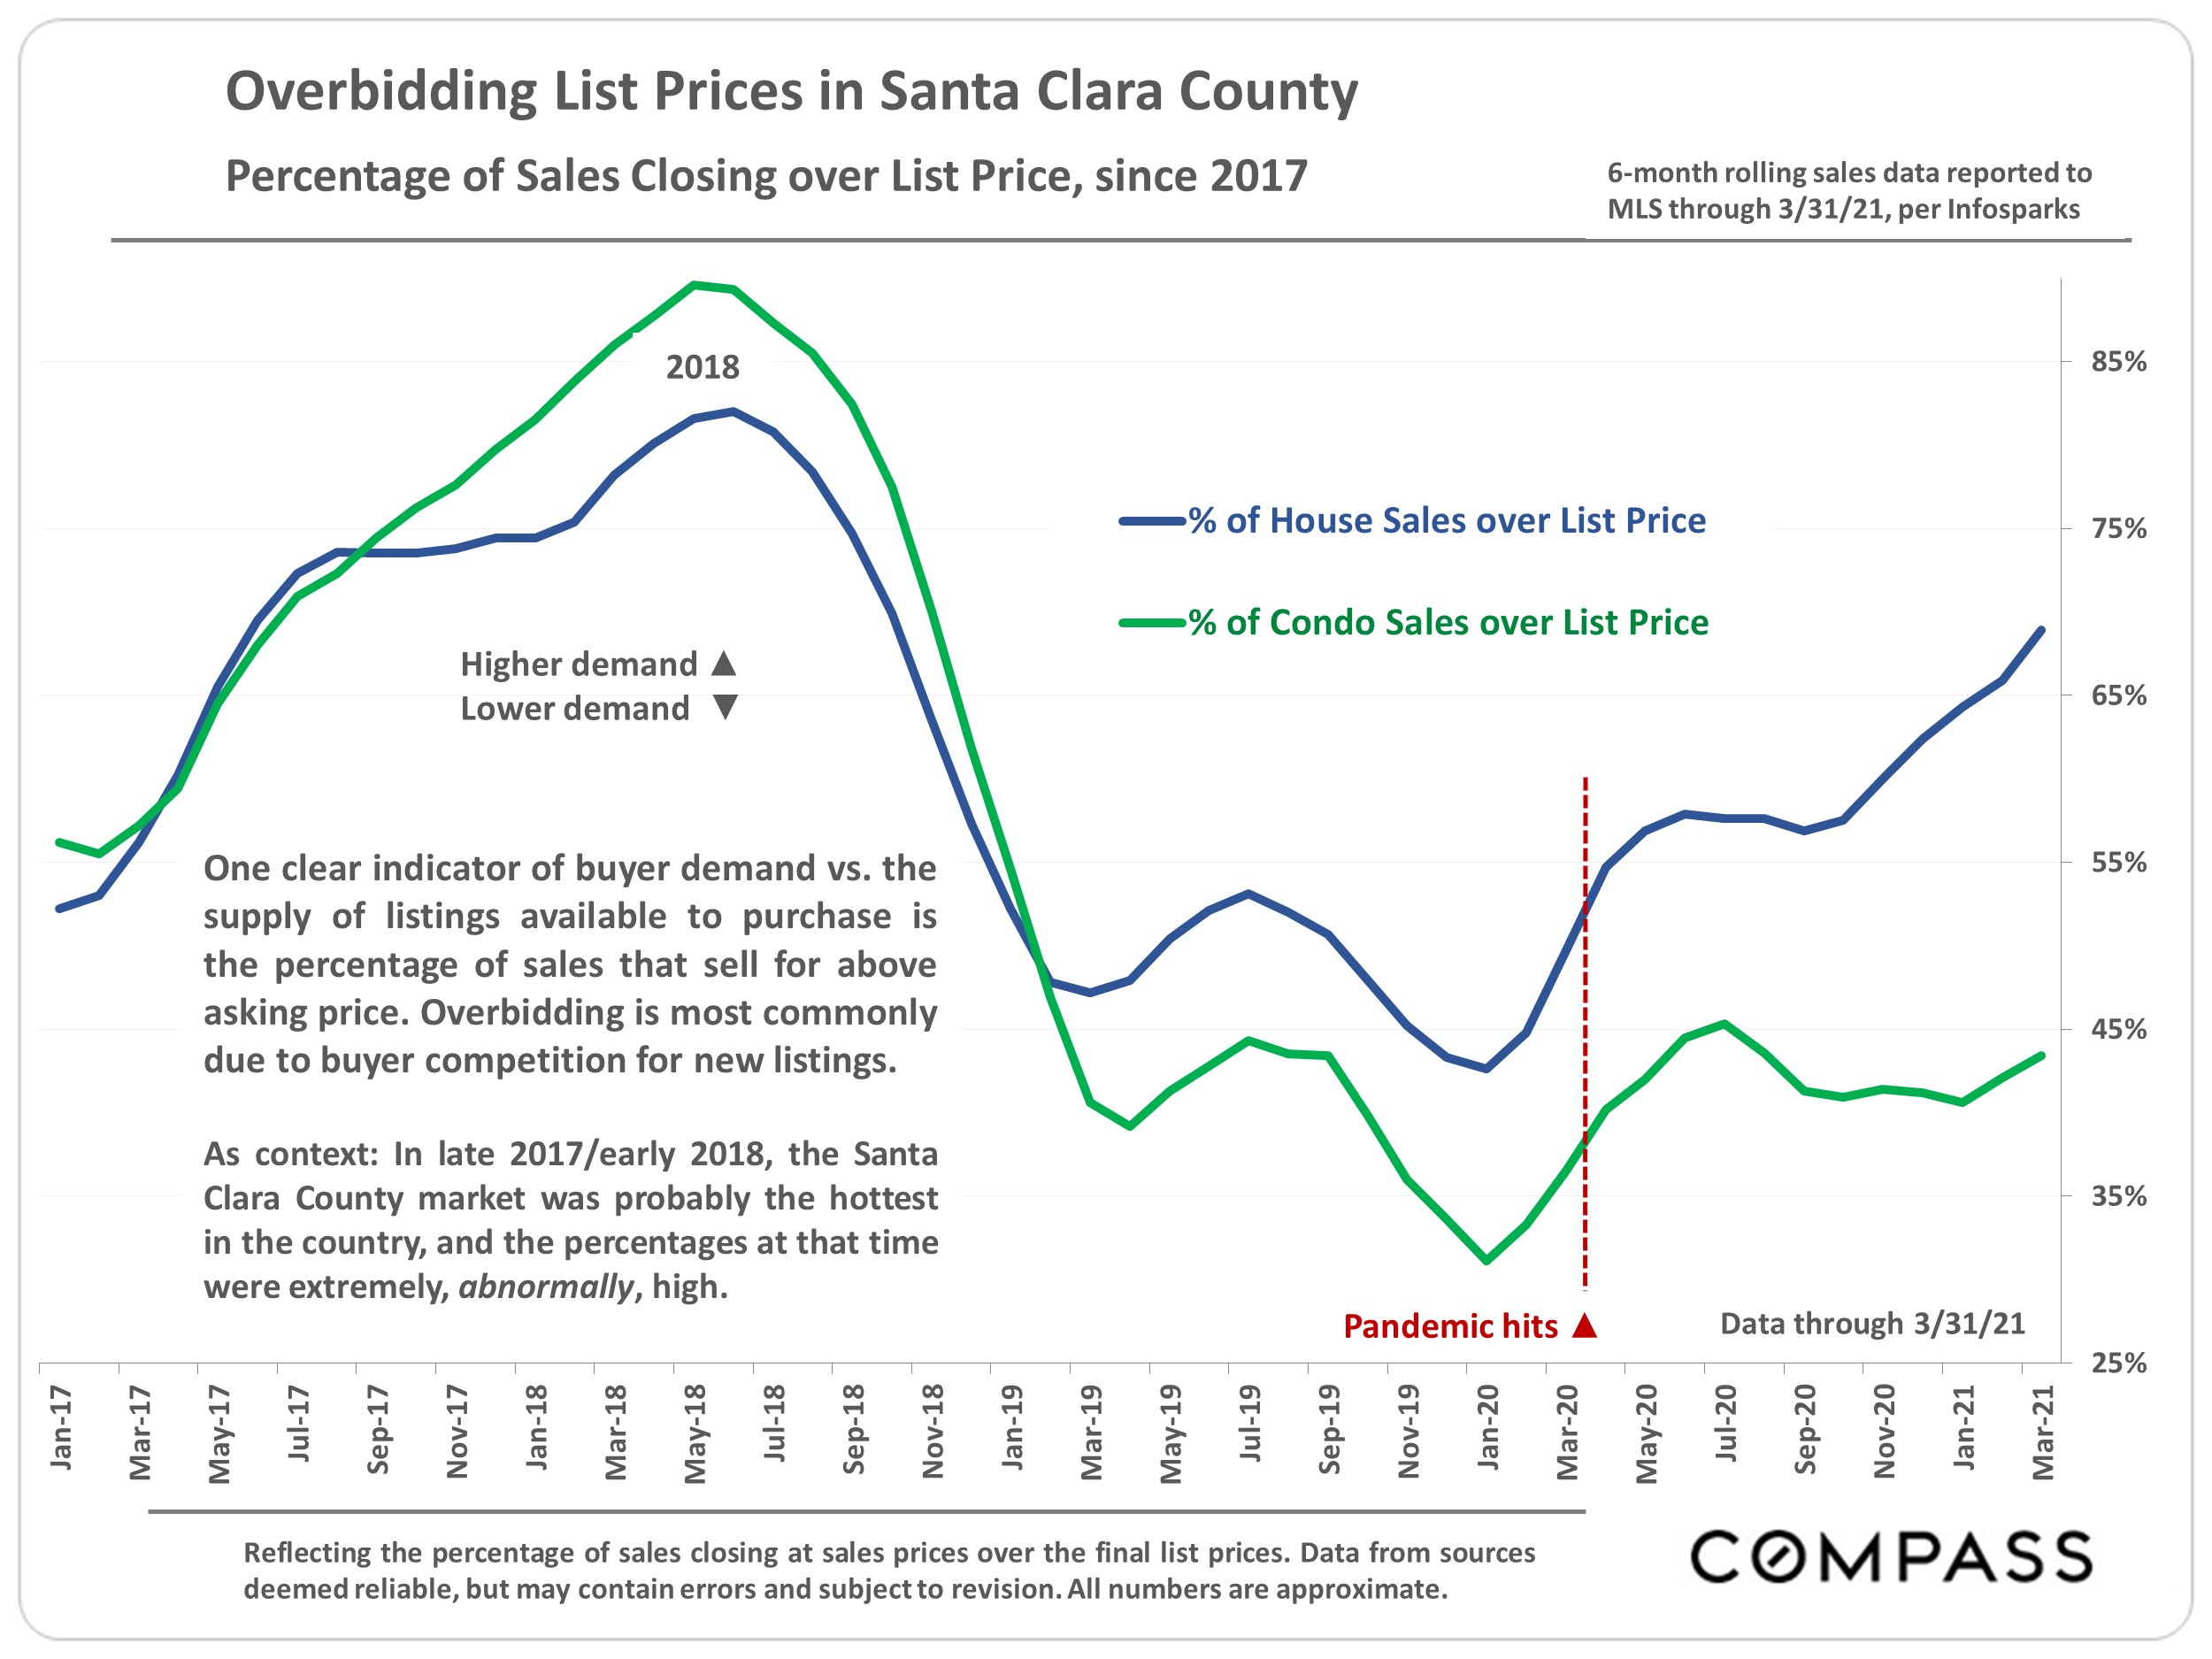
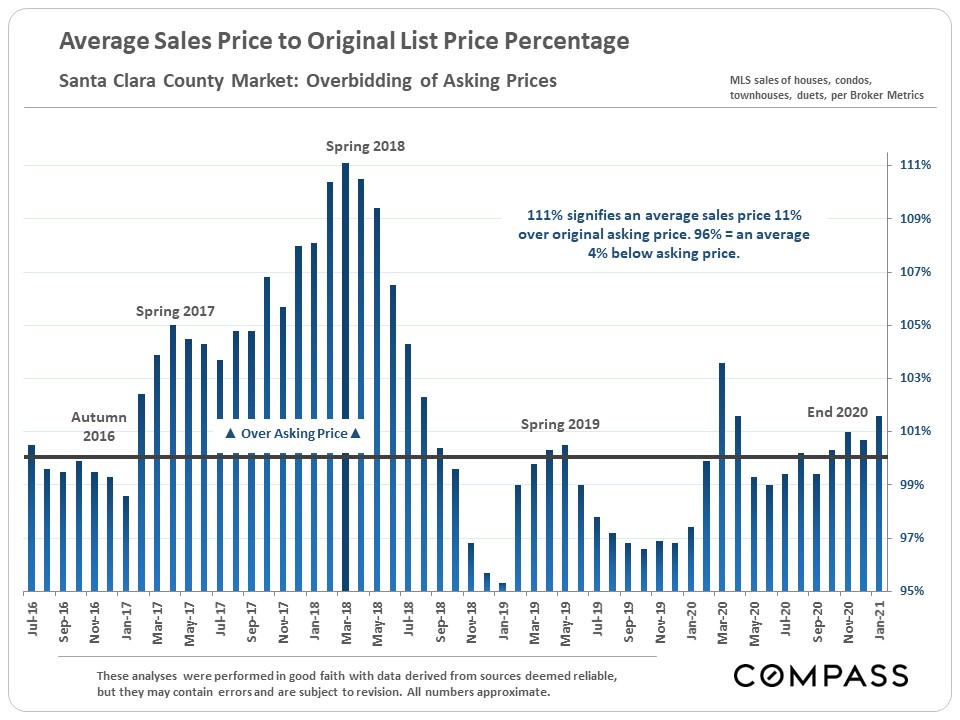
House – % of sales over list price: up to 76% from 64% of sales
Condo – % of sales over list price: up to 50% from 46% of sales
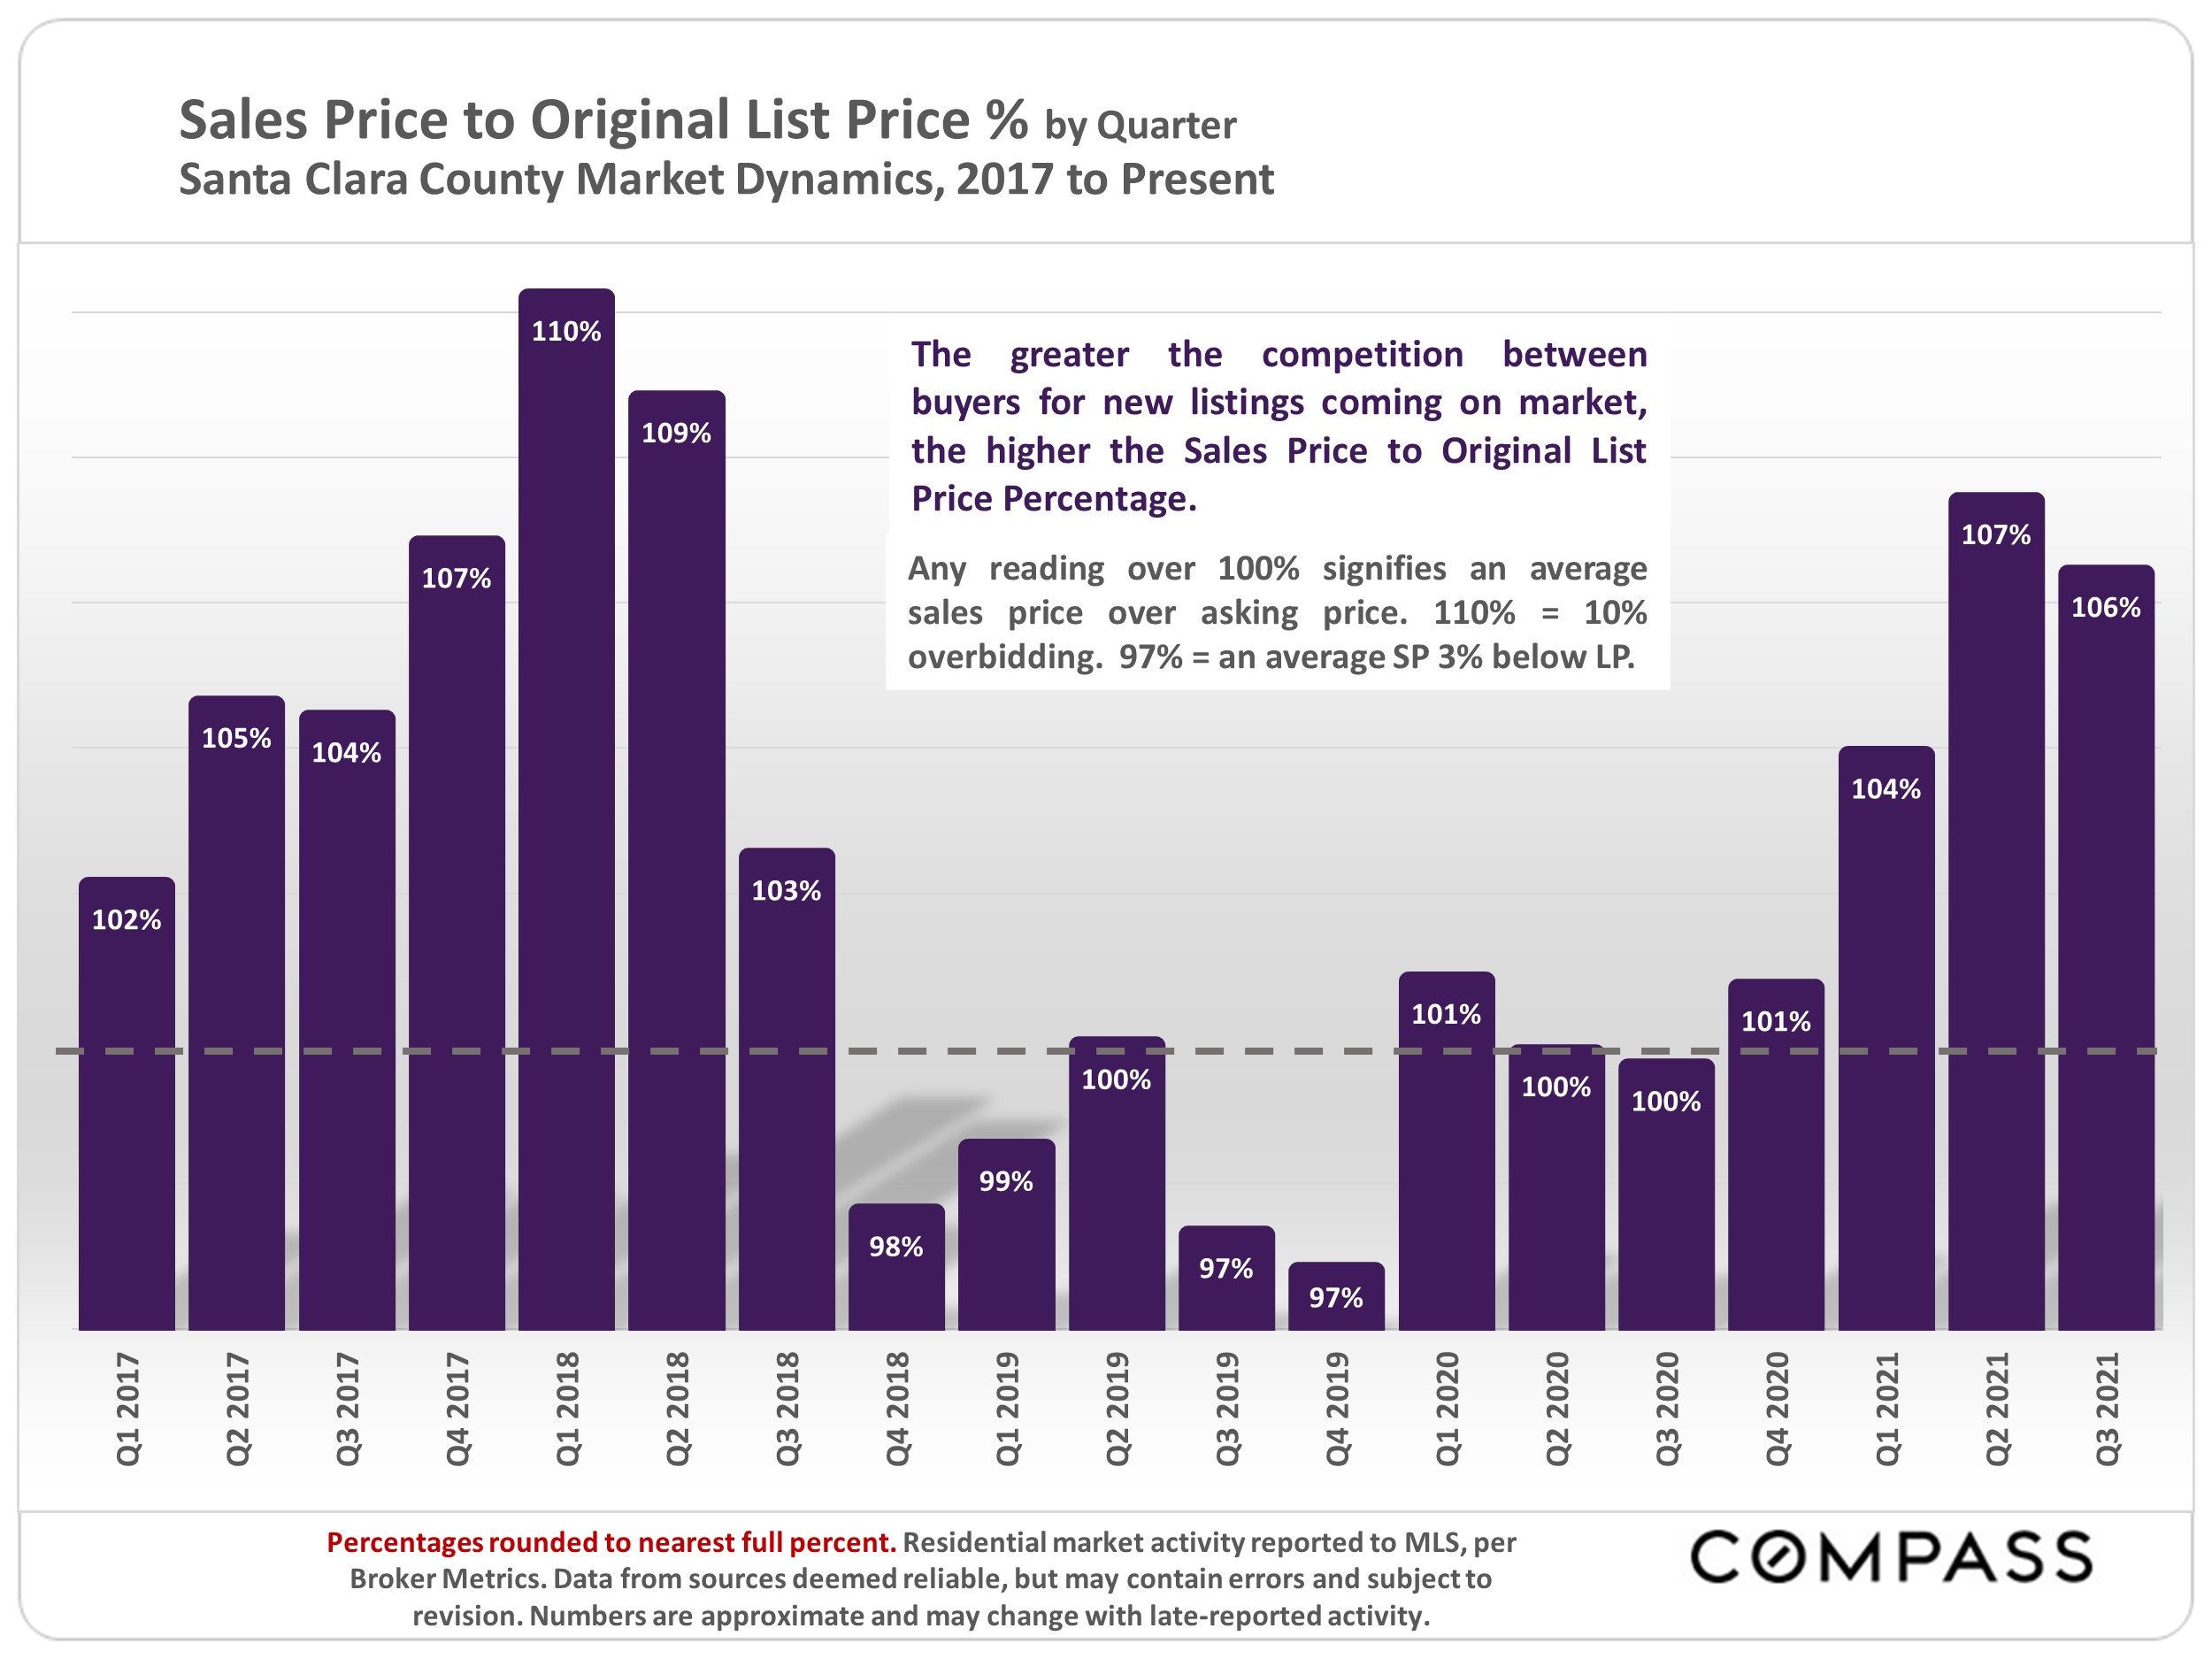
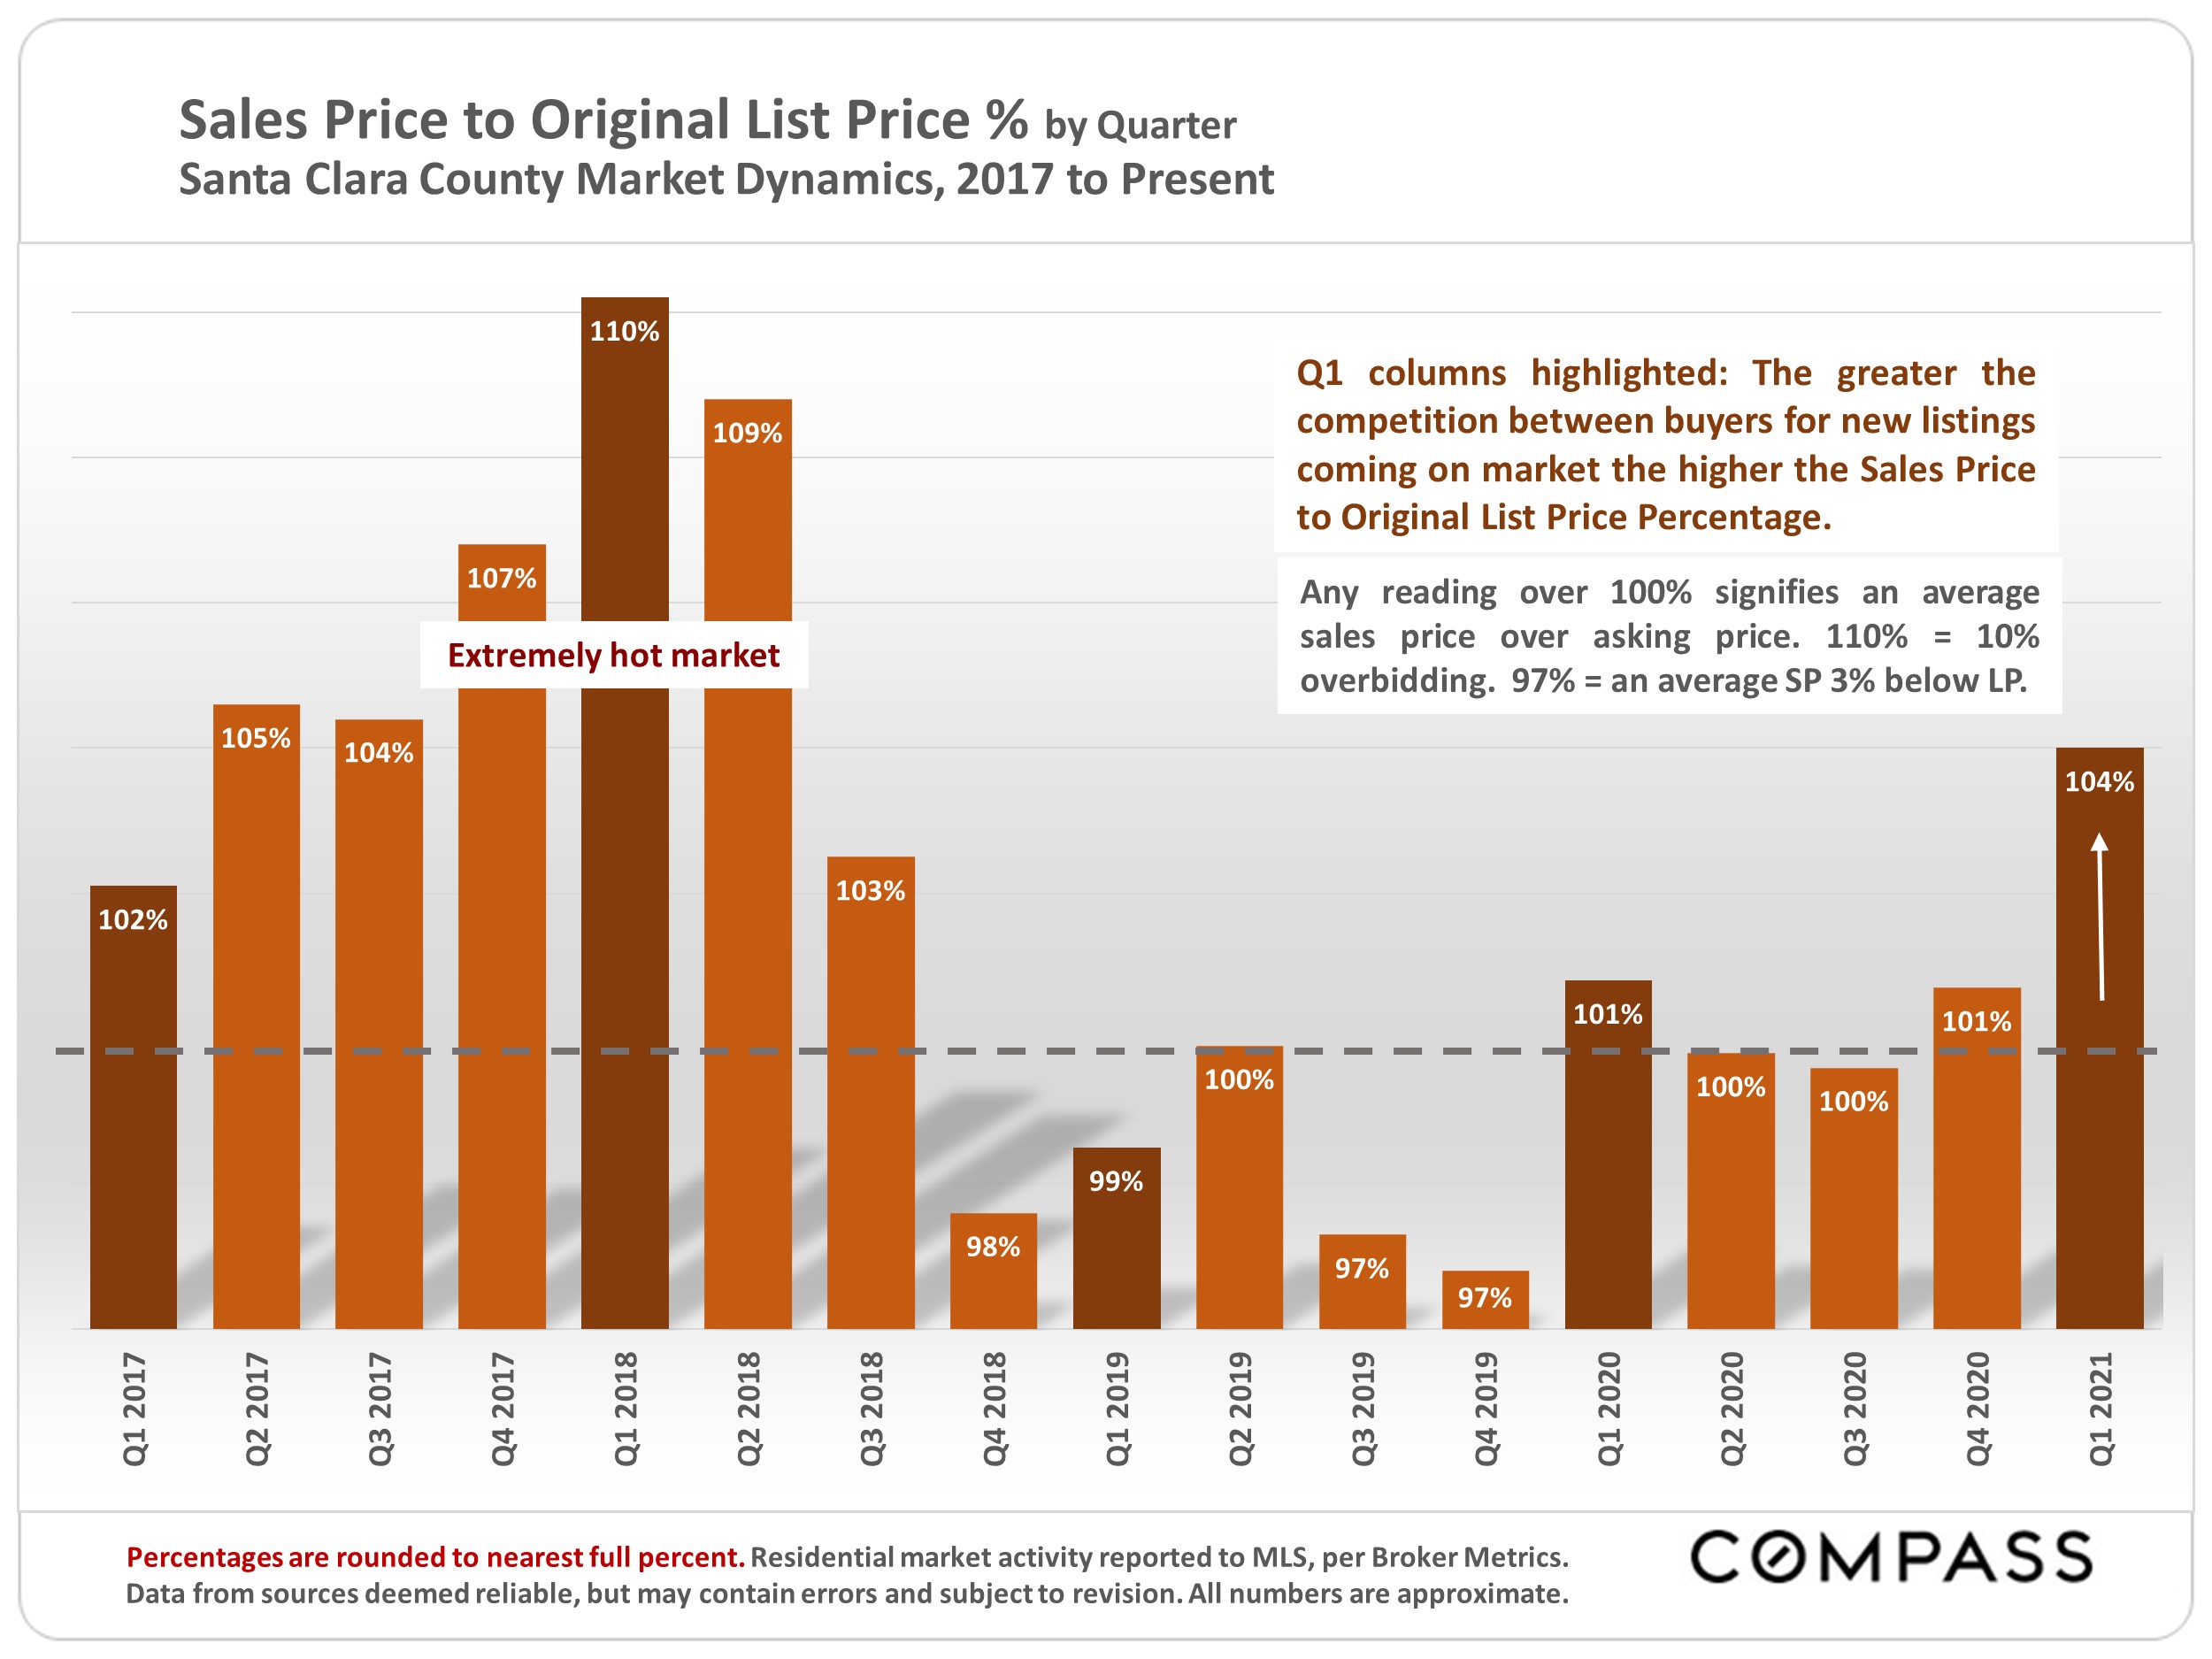
House – median SP to LP %: up to 107% from 102% of list price*
Condo – median SP to LP %: no change from 100% of list price
* The pandemic and shelter-in-place had a large impact on April 2020 sales figures.
* “SP” = sales; “LP” = list price – percentage over 100% indicate overbidding (on average transaction)
Source: Compass
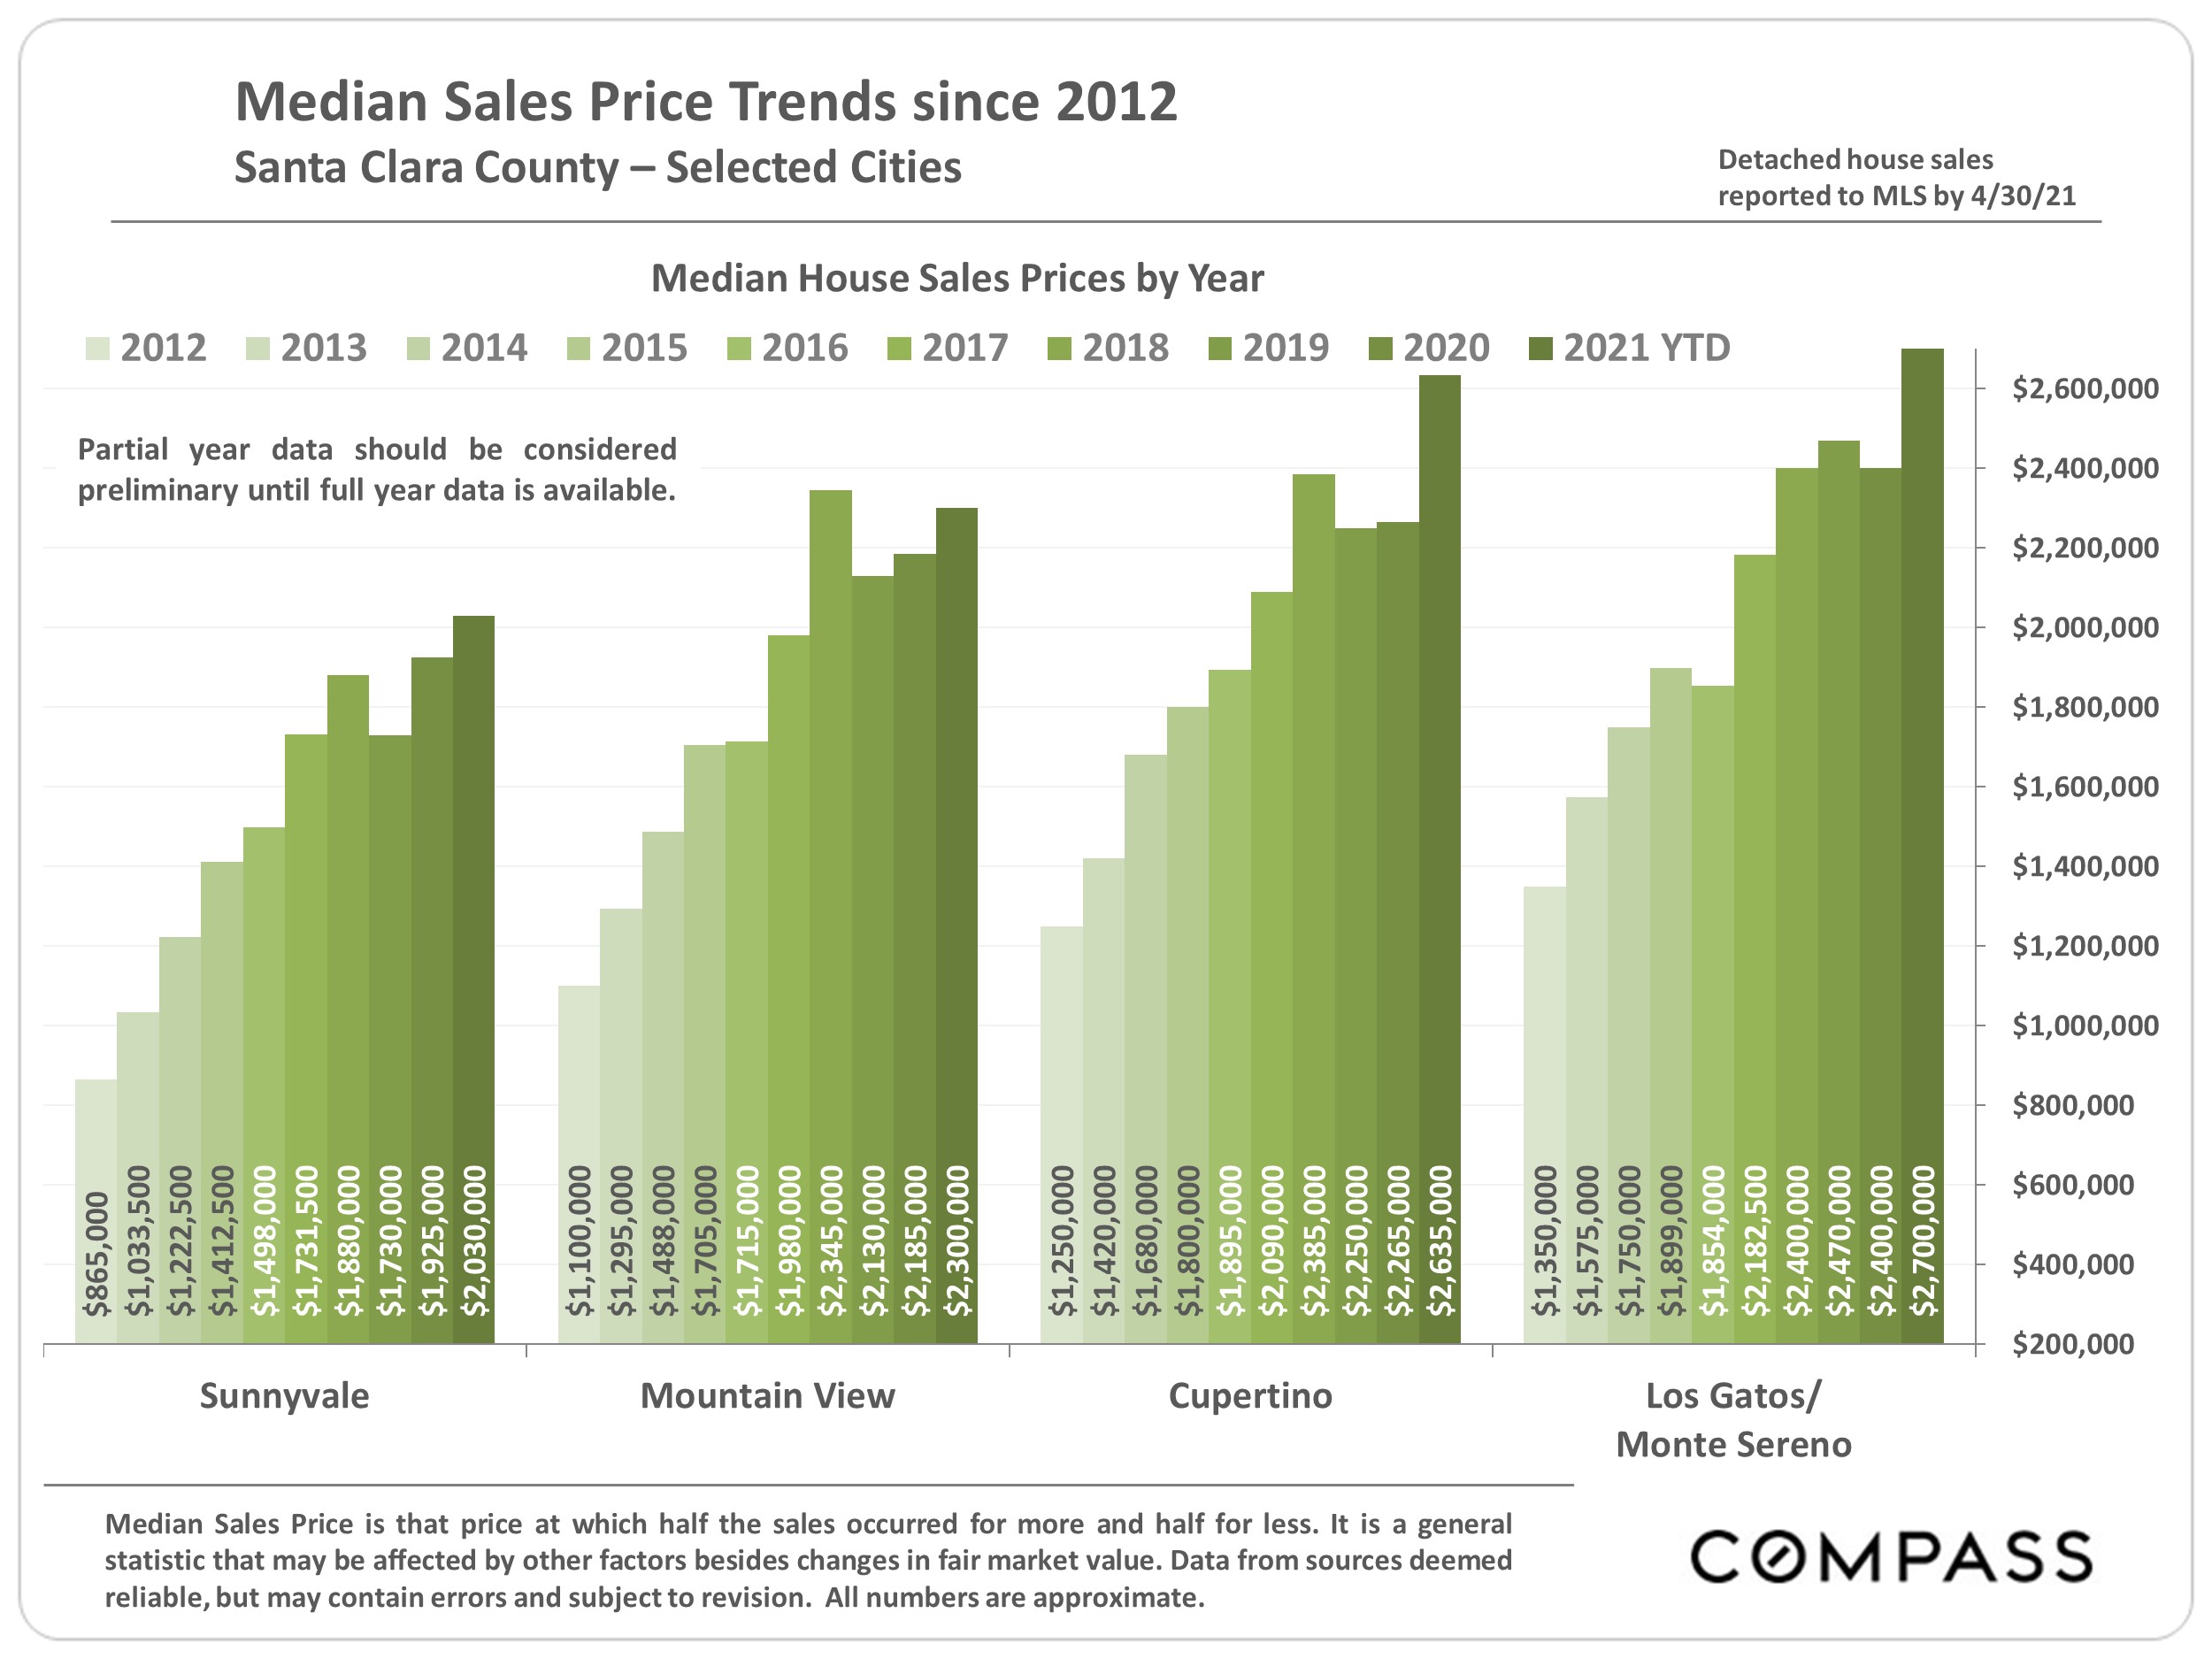
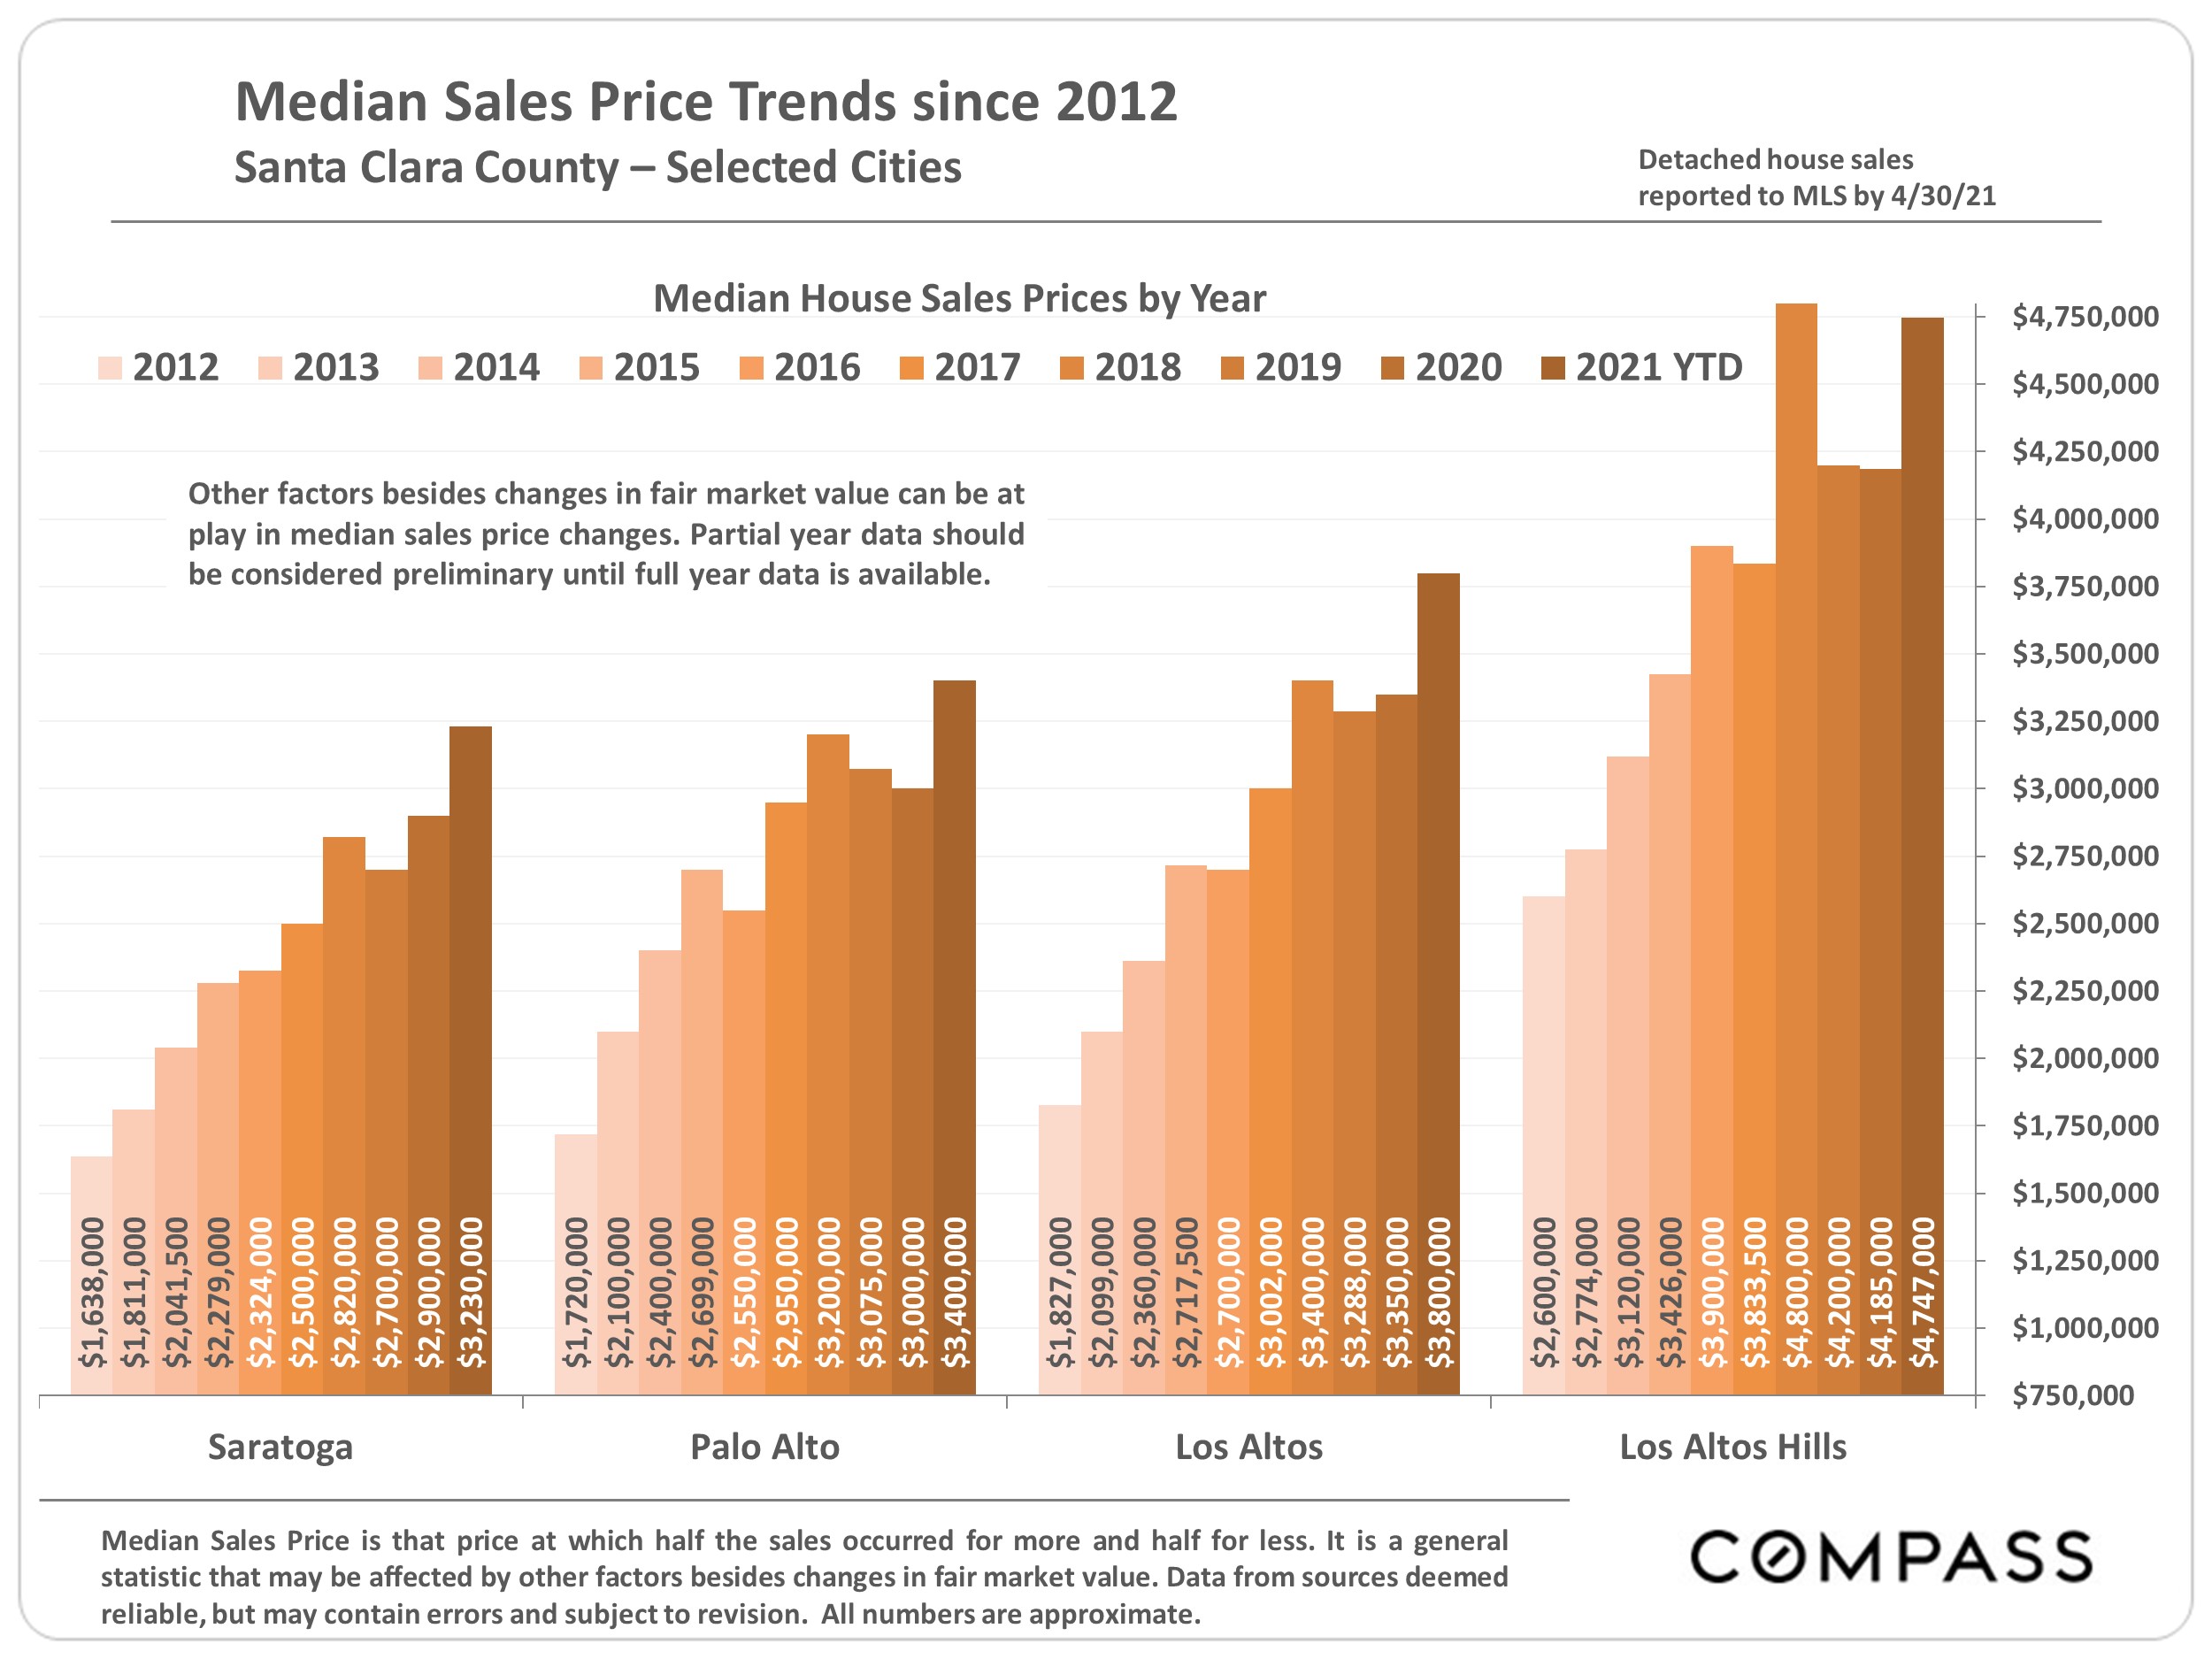
It is impossible to know how median and average value statistics apply to any particular home without a specific comparative market analysis. These analyses were made in good faith with data from sources deemed reliable, but may contain errors and are subject to revision. It is not our intent to convince you of a particular position, but to attempt to provide straightforward data and analysis, so you can make your own informed decisions. Median and average statistics are enormous generalities: There are hundreds of different markets in San Francisco and the Bay Area, each with its own unique dynamics. Median prices and average dollar per square foot values can be and often are affected by other factors besides changes in fair market value. Longer term trends are much more meaningful than short-term.
Compass is a real estate broker licensed by the State of California, DRE 01527235. Equal Housing Opportunity. This report has been prepared solely for information purposes. The information herein is based on or derived from information generally available to the public and/or from sources believed to be reliable. No representation or warranty can be given with respect to the accuracy or completeness of the information. Compass disclaims any and all liability relating to this report, including without limitation any express or implied representations or warranties for statements contained in, and omissions from, the report. Nothing contained herein is intended to be or should be read as any regulatory, legal, tax, accounting or other advice and Compass does not provide such advice. All opinions are subject to change without notice. Compass makes no representation regarding the accuracy of any statements regarding any references to the laws, statutes or regulations of any state are those of the author(s). Past performance is no guarantee of future results.