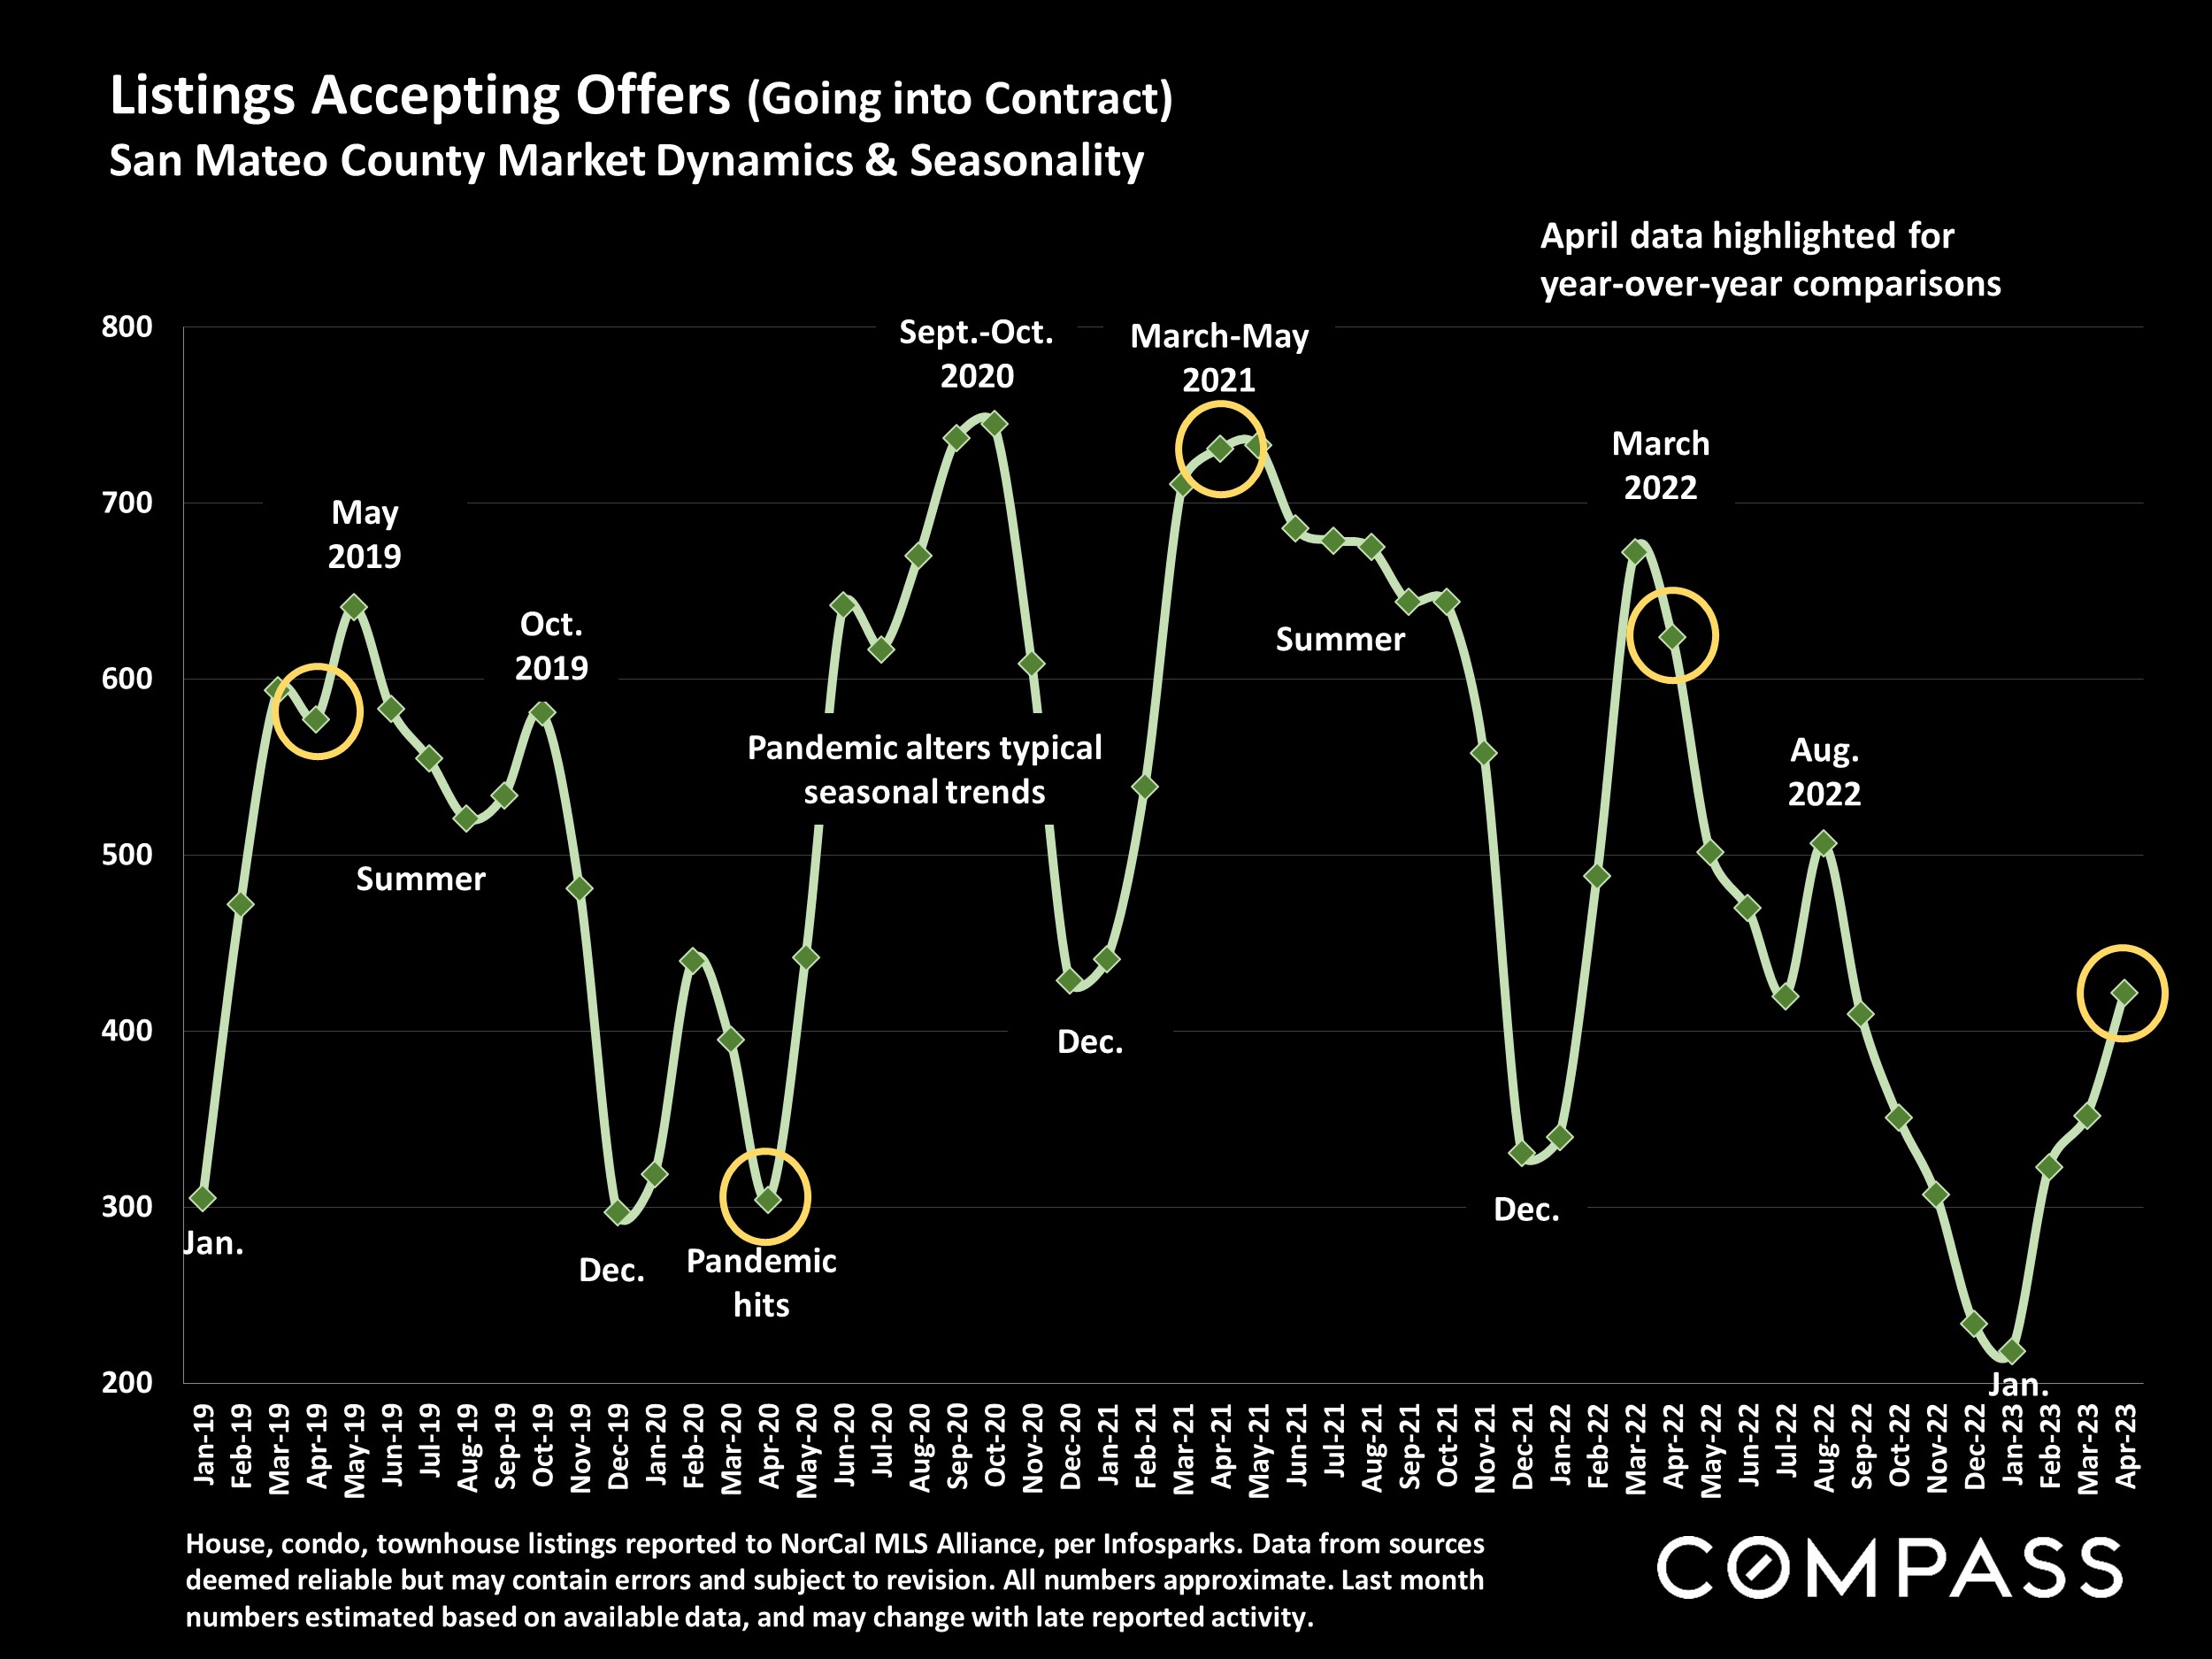
Open house visitor numbers have surged, new listings coming on market have risen, the pipeline of coming listings is filling up faster than last year, and the number of homes going into contract is climbing rapidly as the market wakes up. With dramatic improvements since October in interest rates, stock markets and consumer confidence, both buyers and sellers are re-engaging to a much greater degree, and the velocity of the market is accelerating.
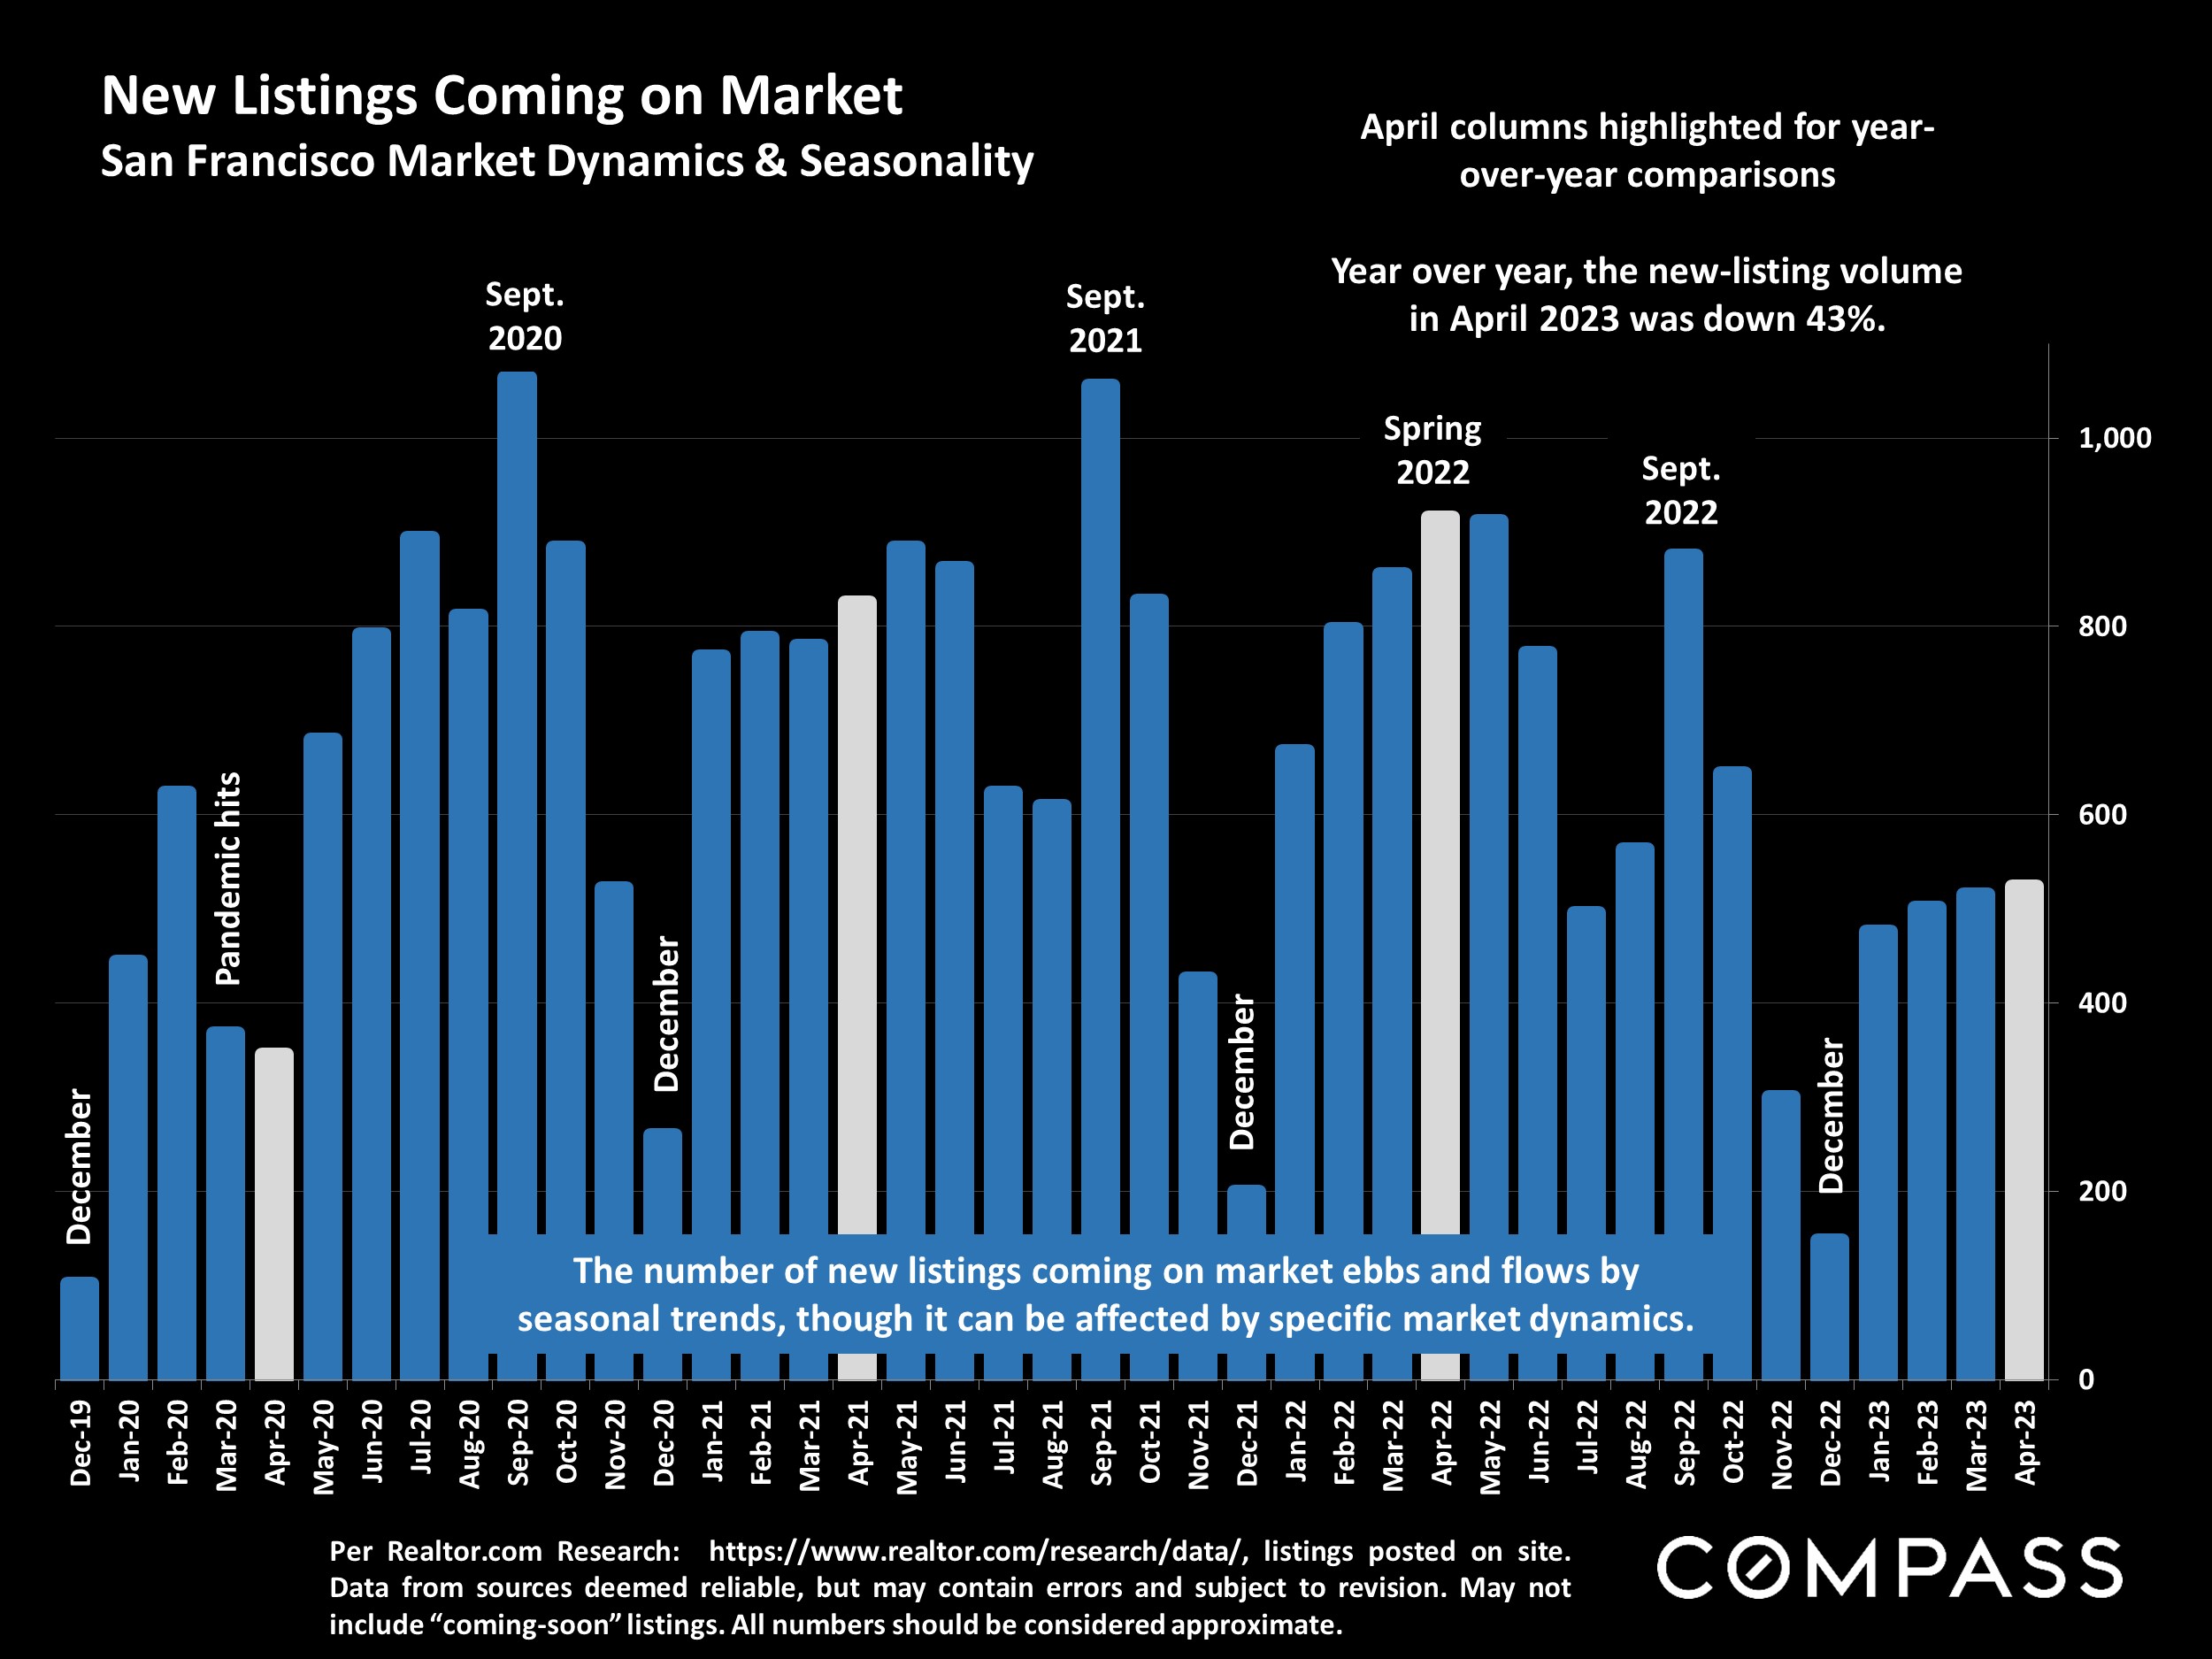
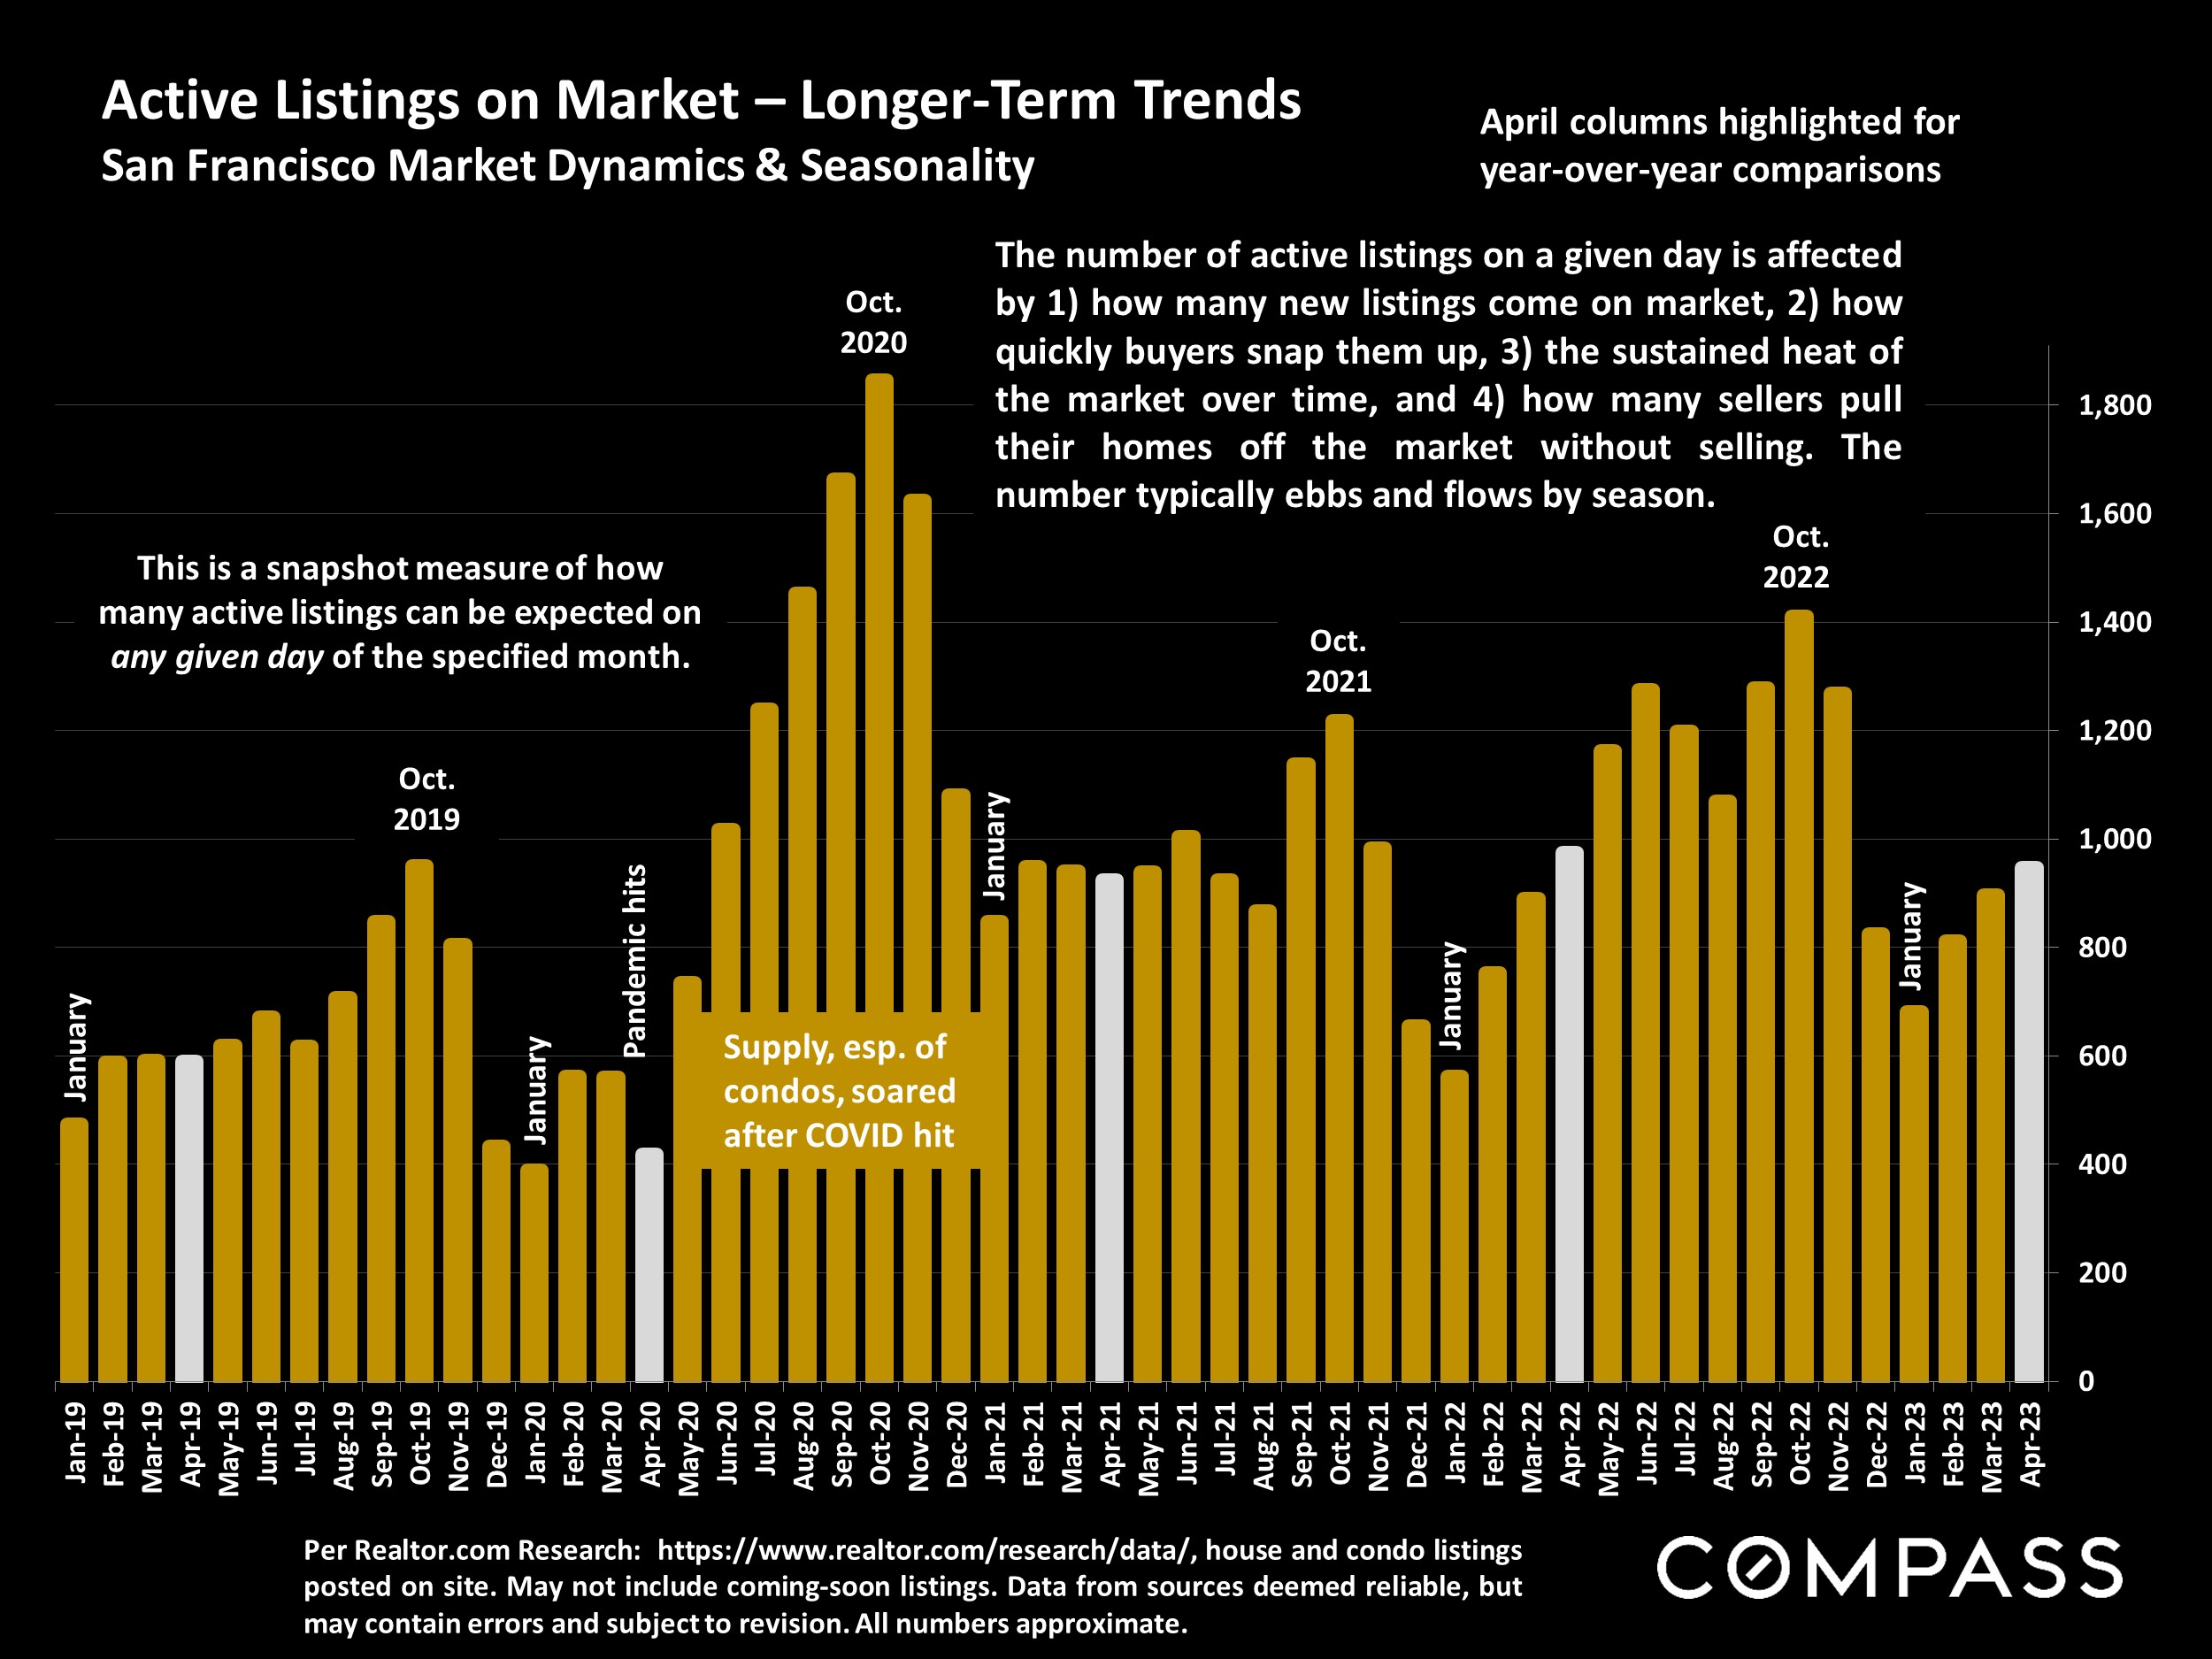
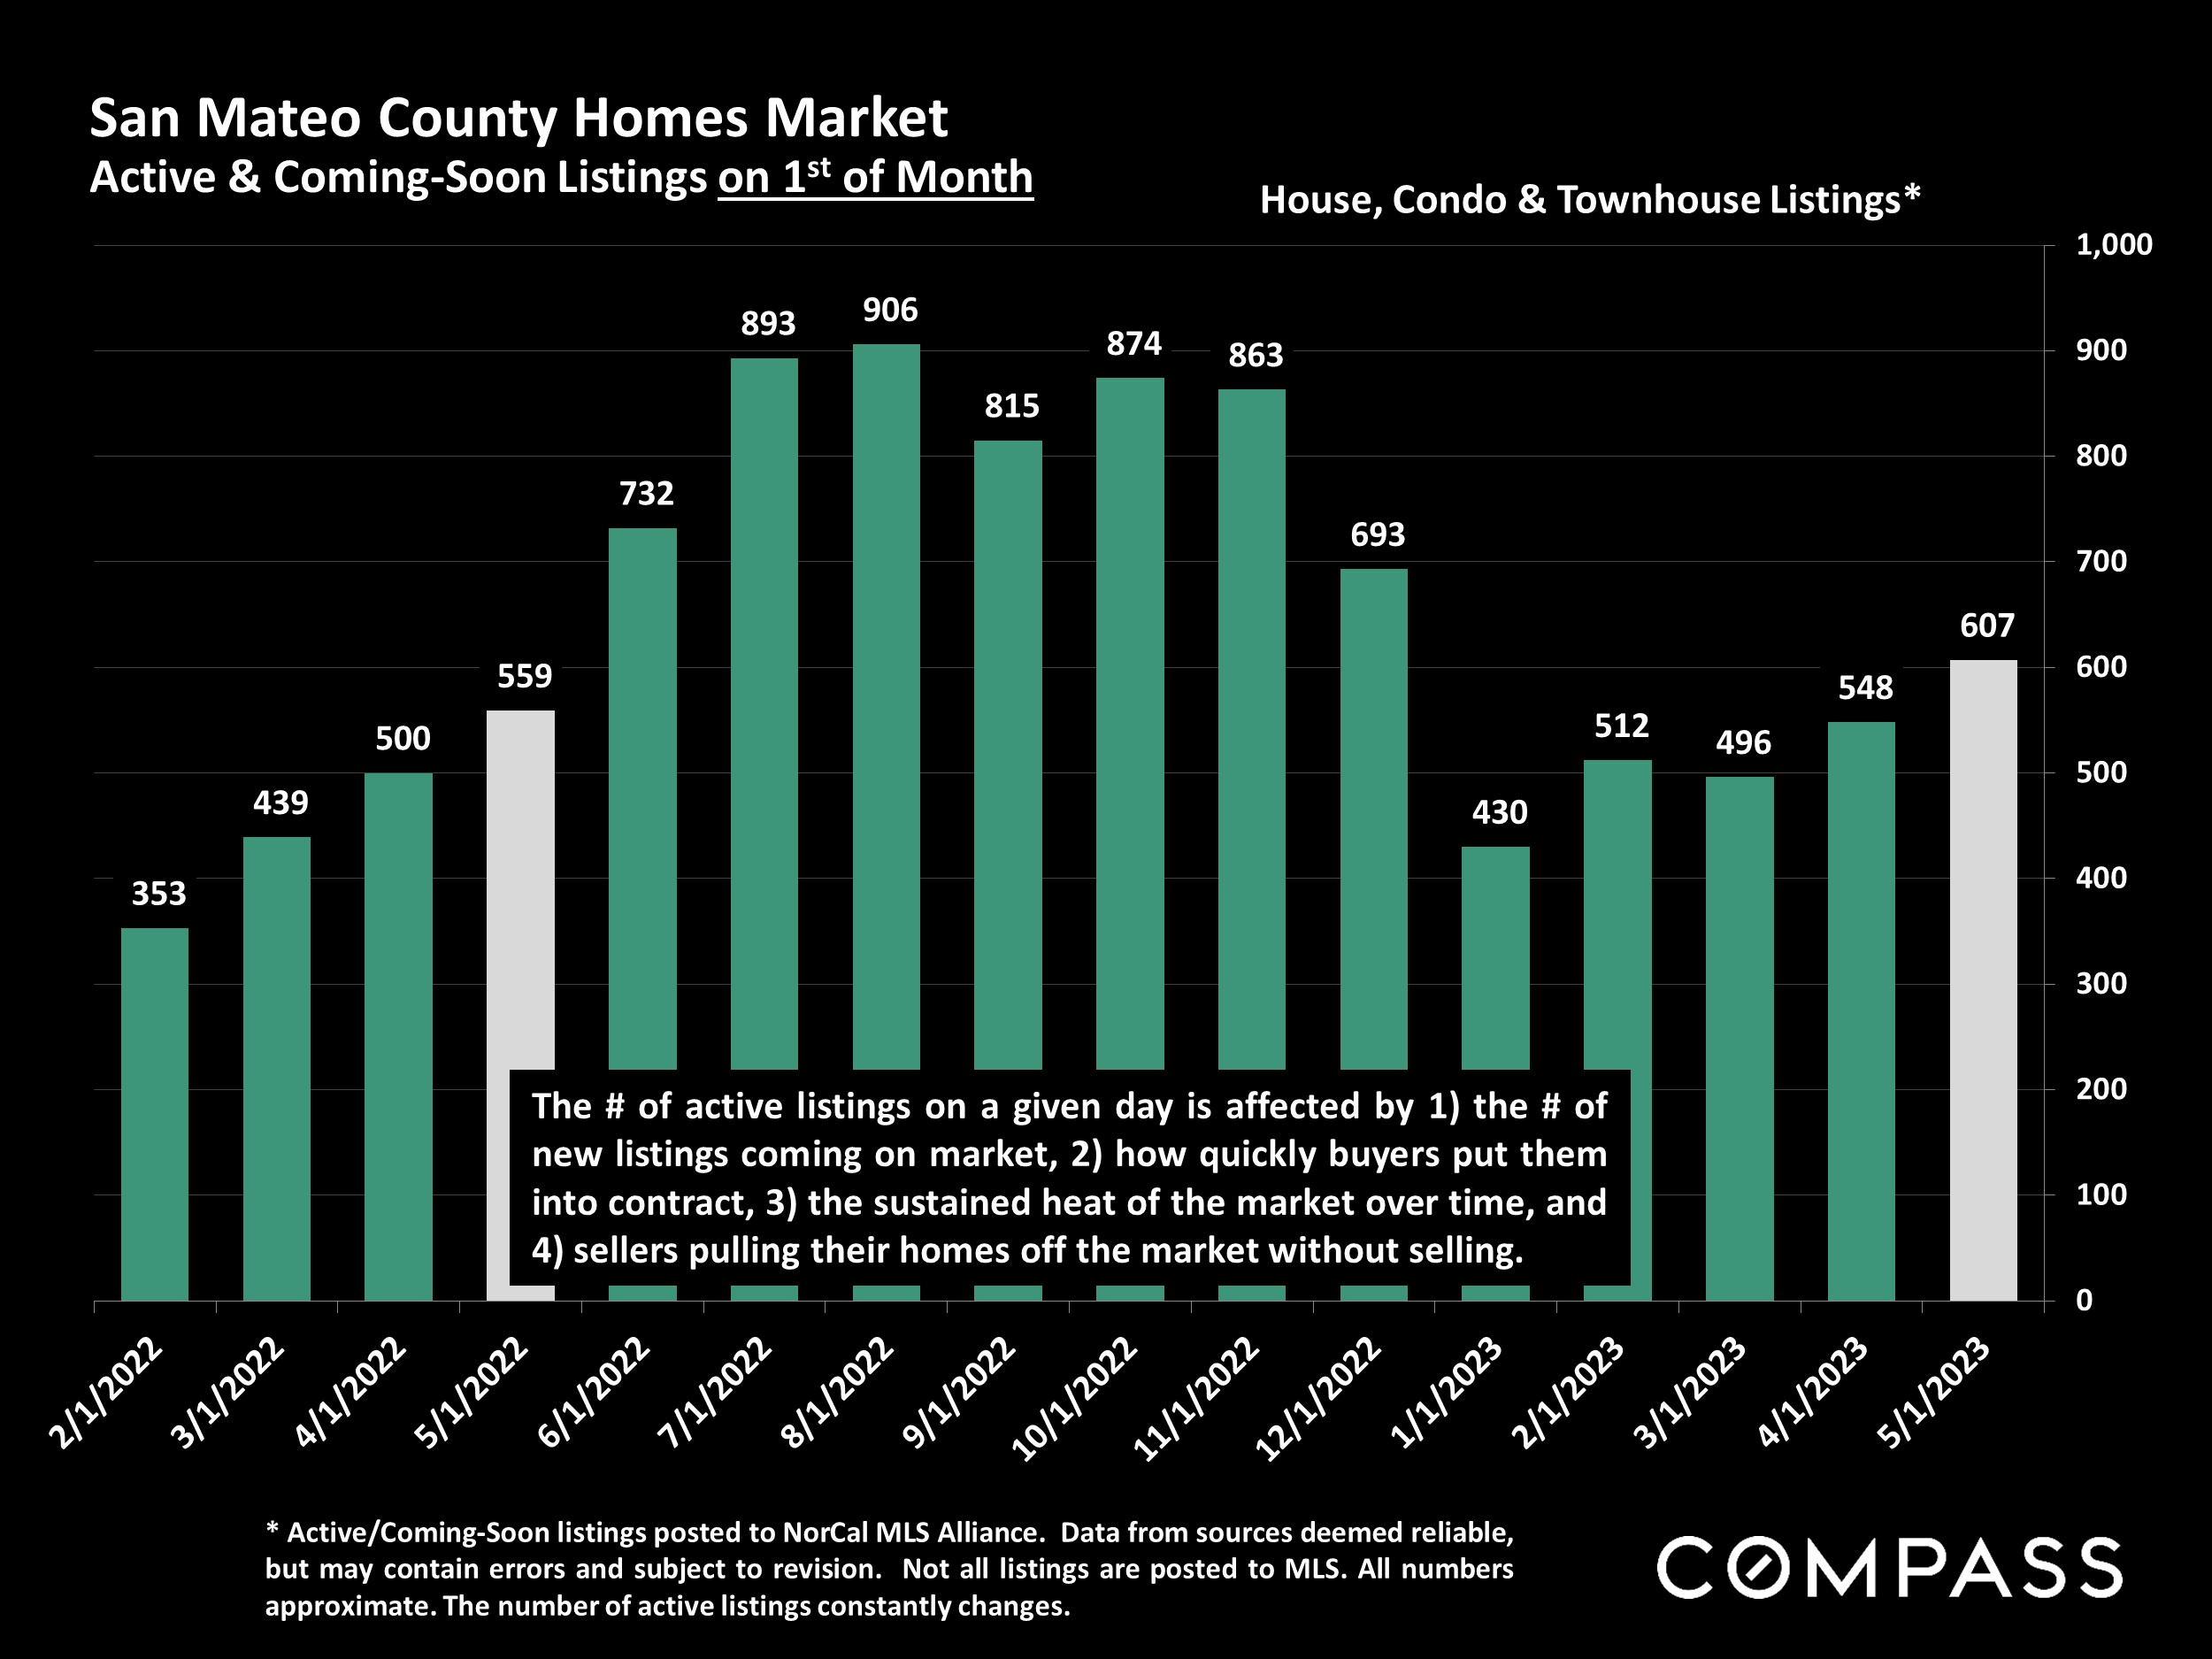
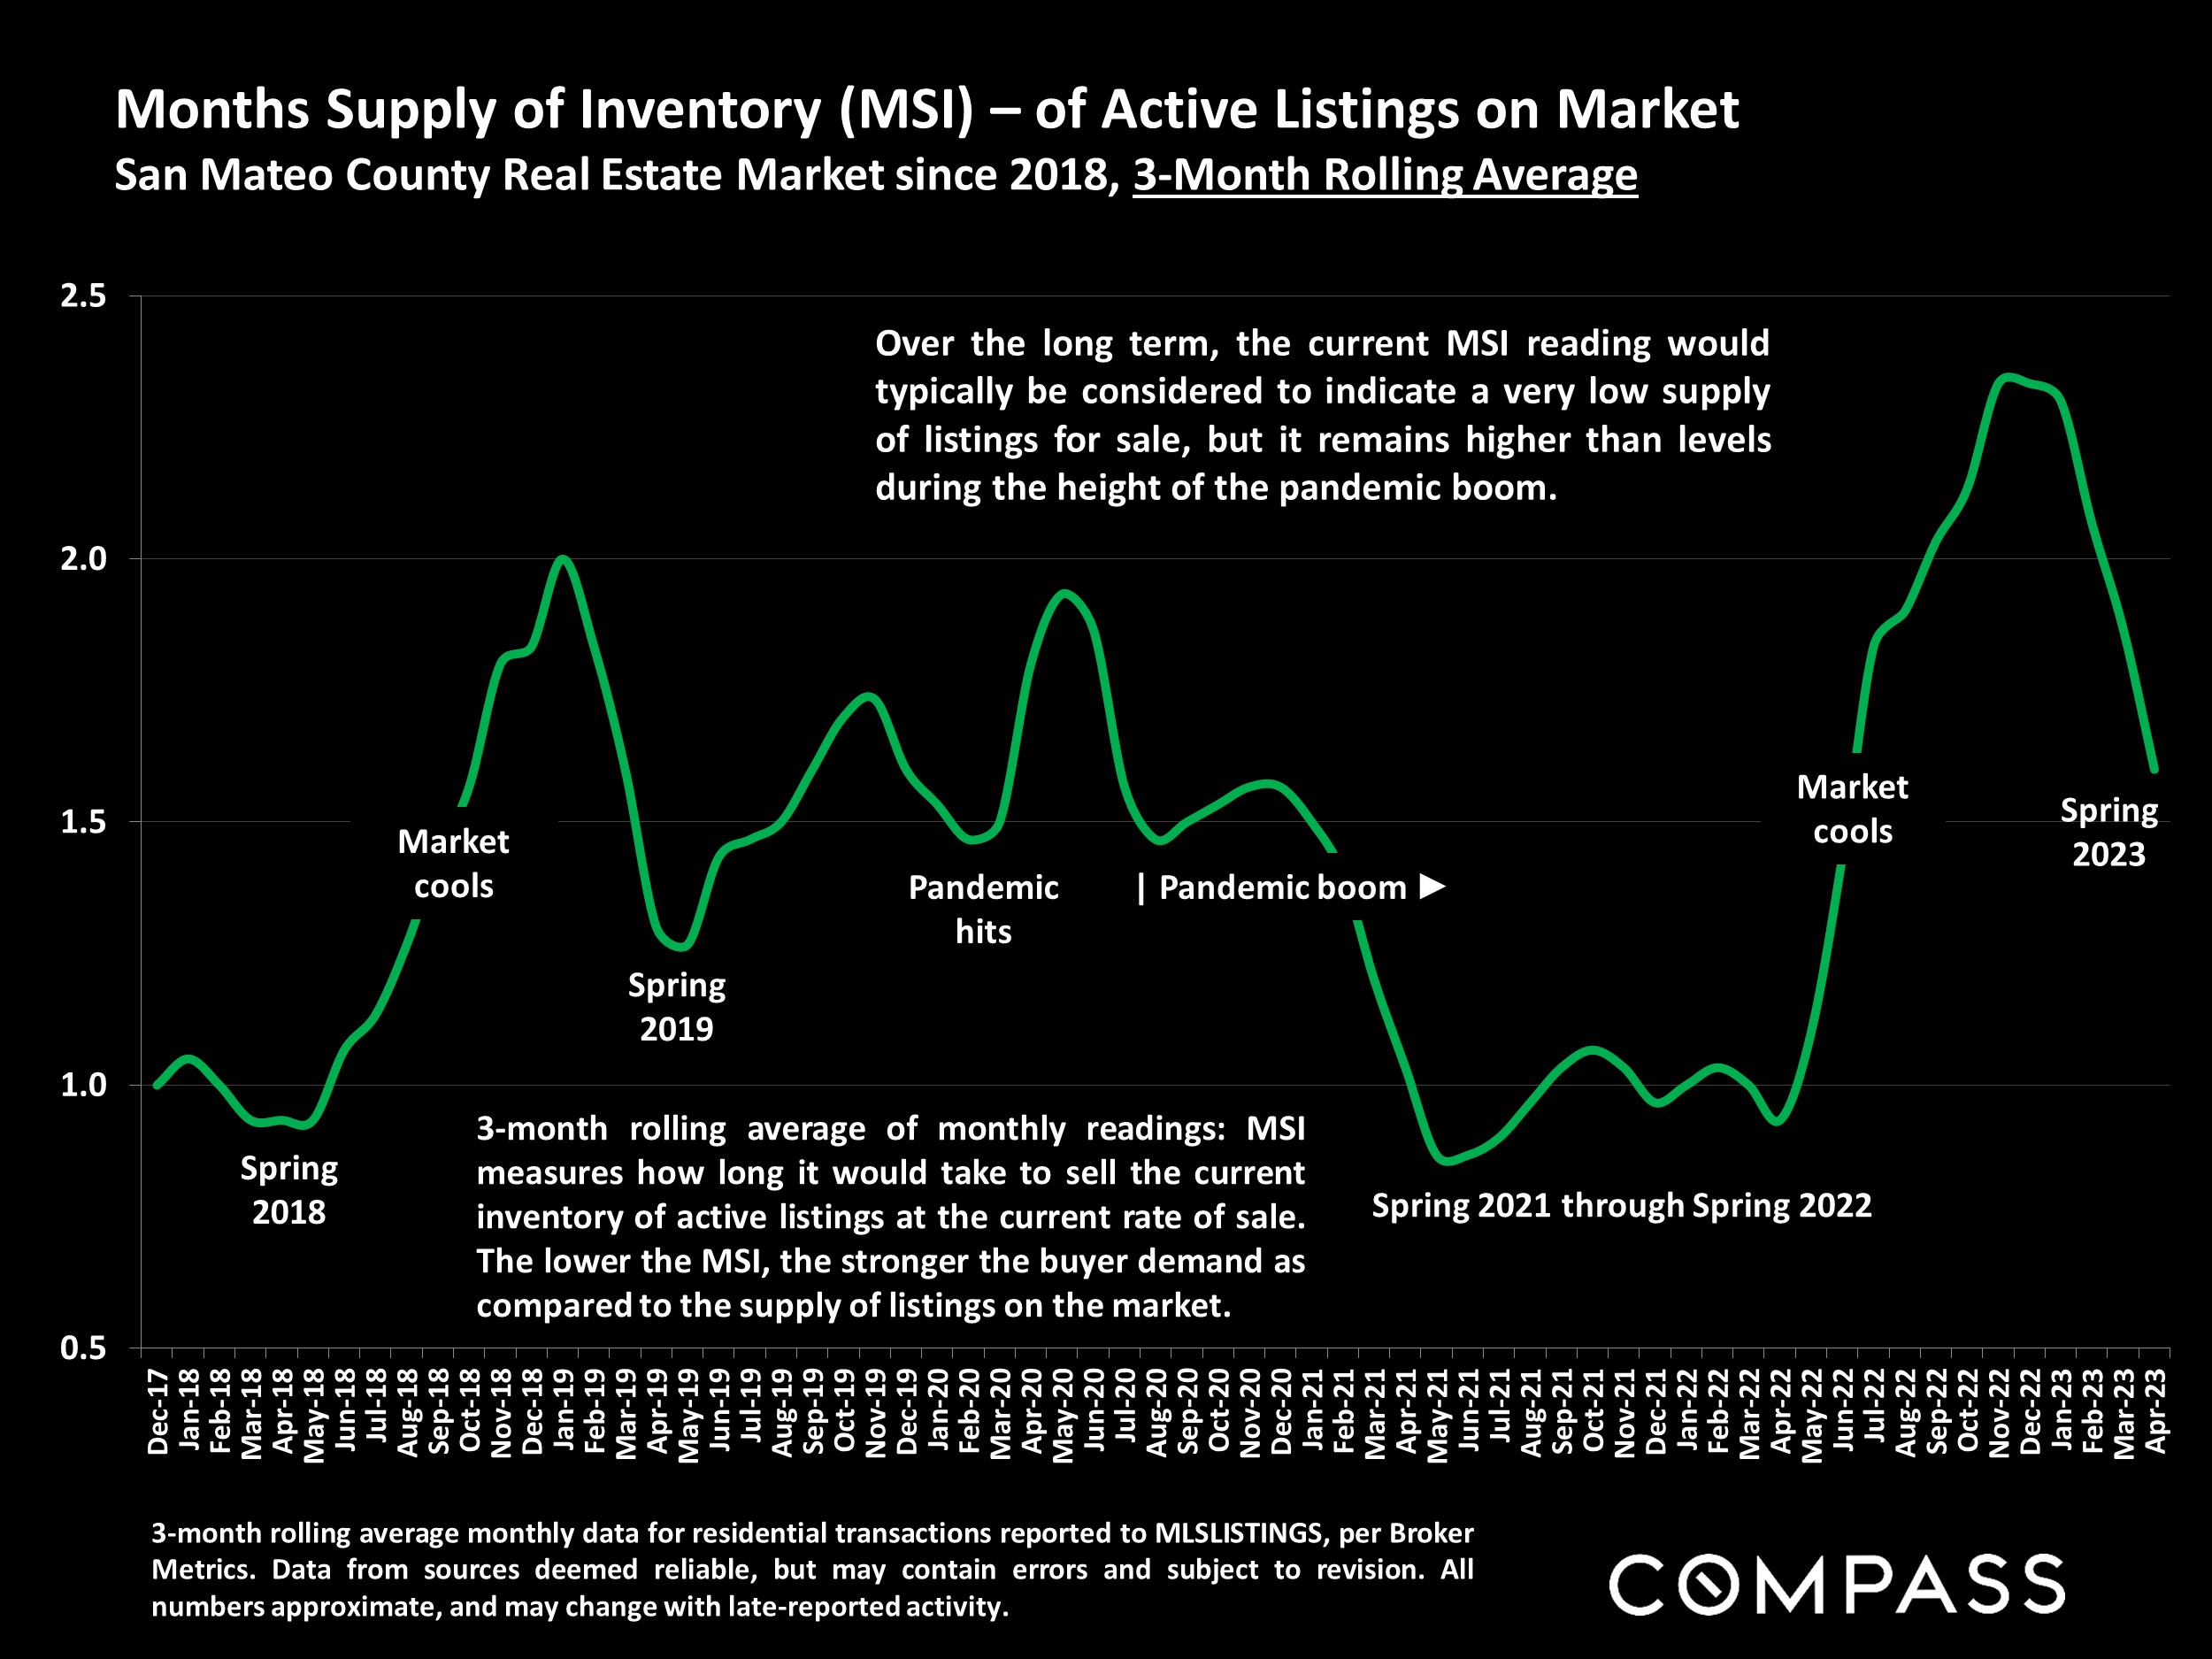
However, even as listing inventory begins to rise, it remains very low compared to pre-pandemic norms, and a common seasonal dynamic early in the new year has been for buyers to jump back in faster and in greater numbers than sellers with new listings – especially if buyer demand was repressed in the previous year and economic conditions have rebounded. A big mismatch between supply and demand right from the start of the year deeply affects market dynamics moving into spring, and perhaps the biggest question in 2024 will be how many sellers, who have held off listing their homes since mid-2022, move forward with life plans.
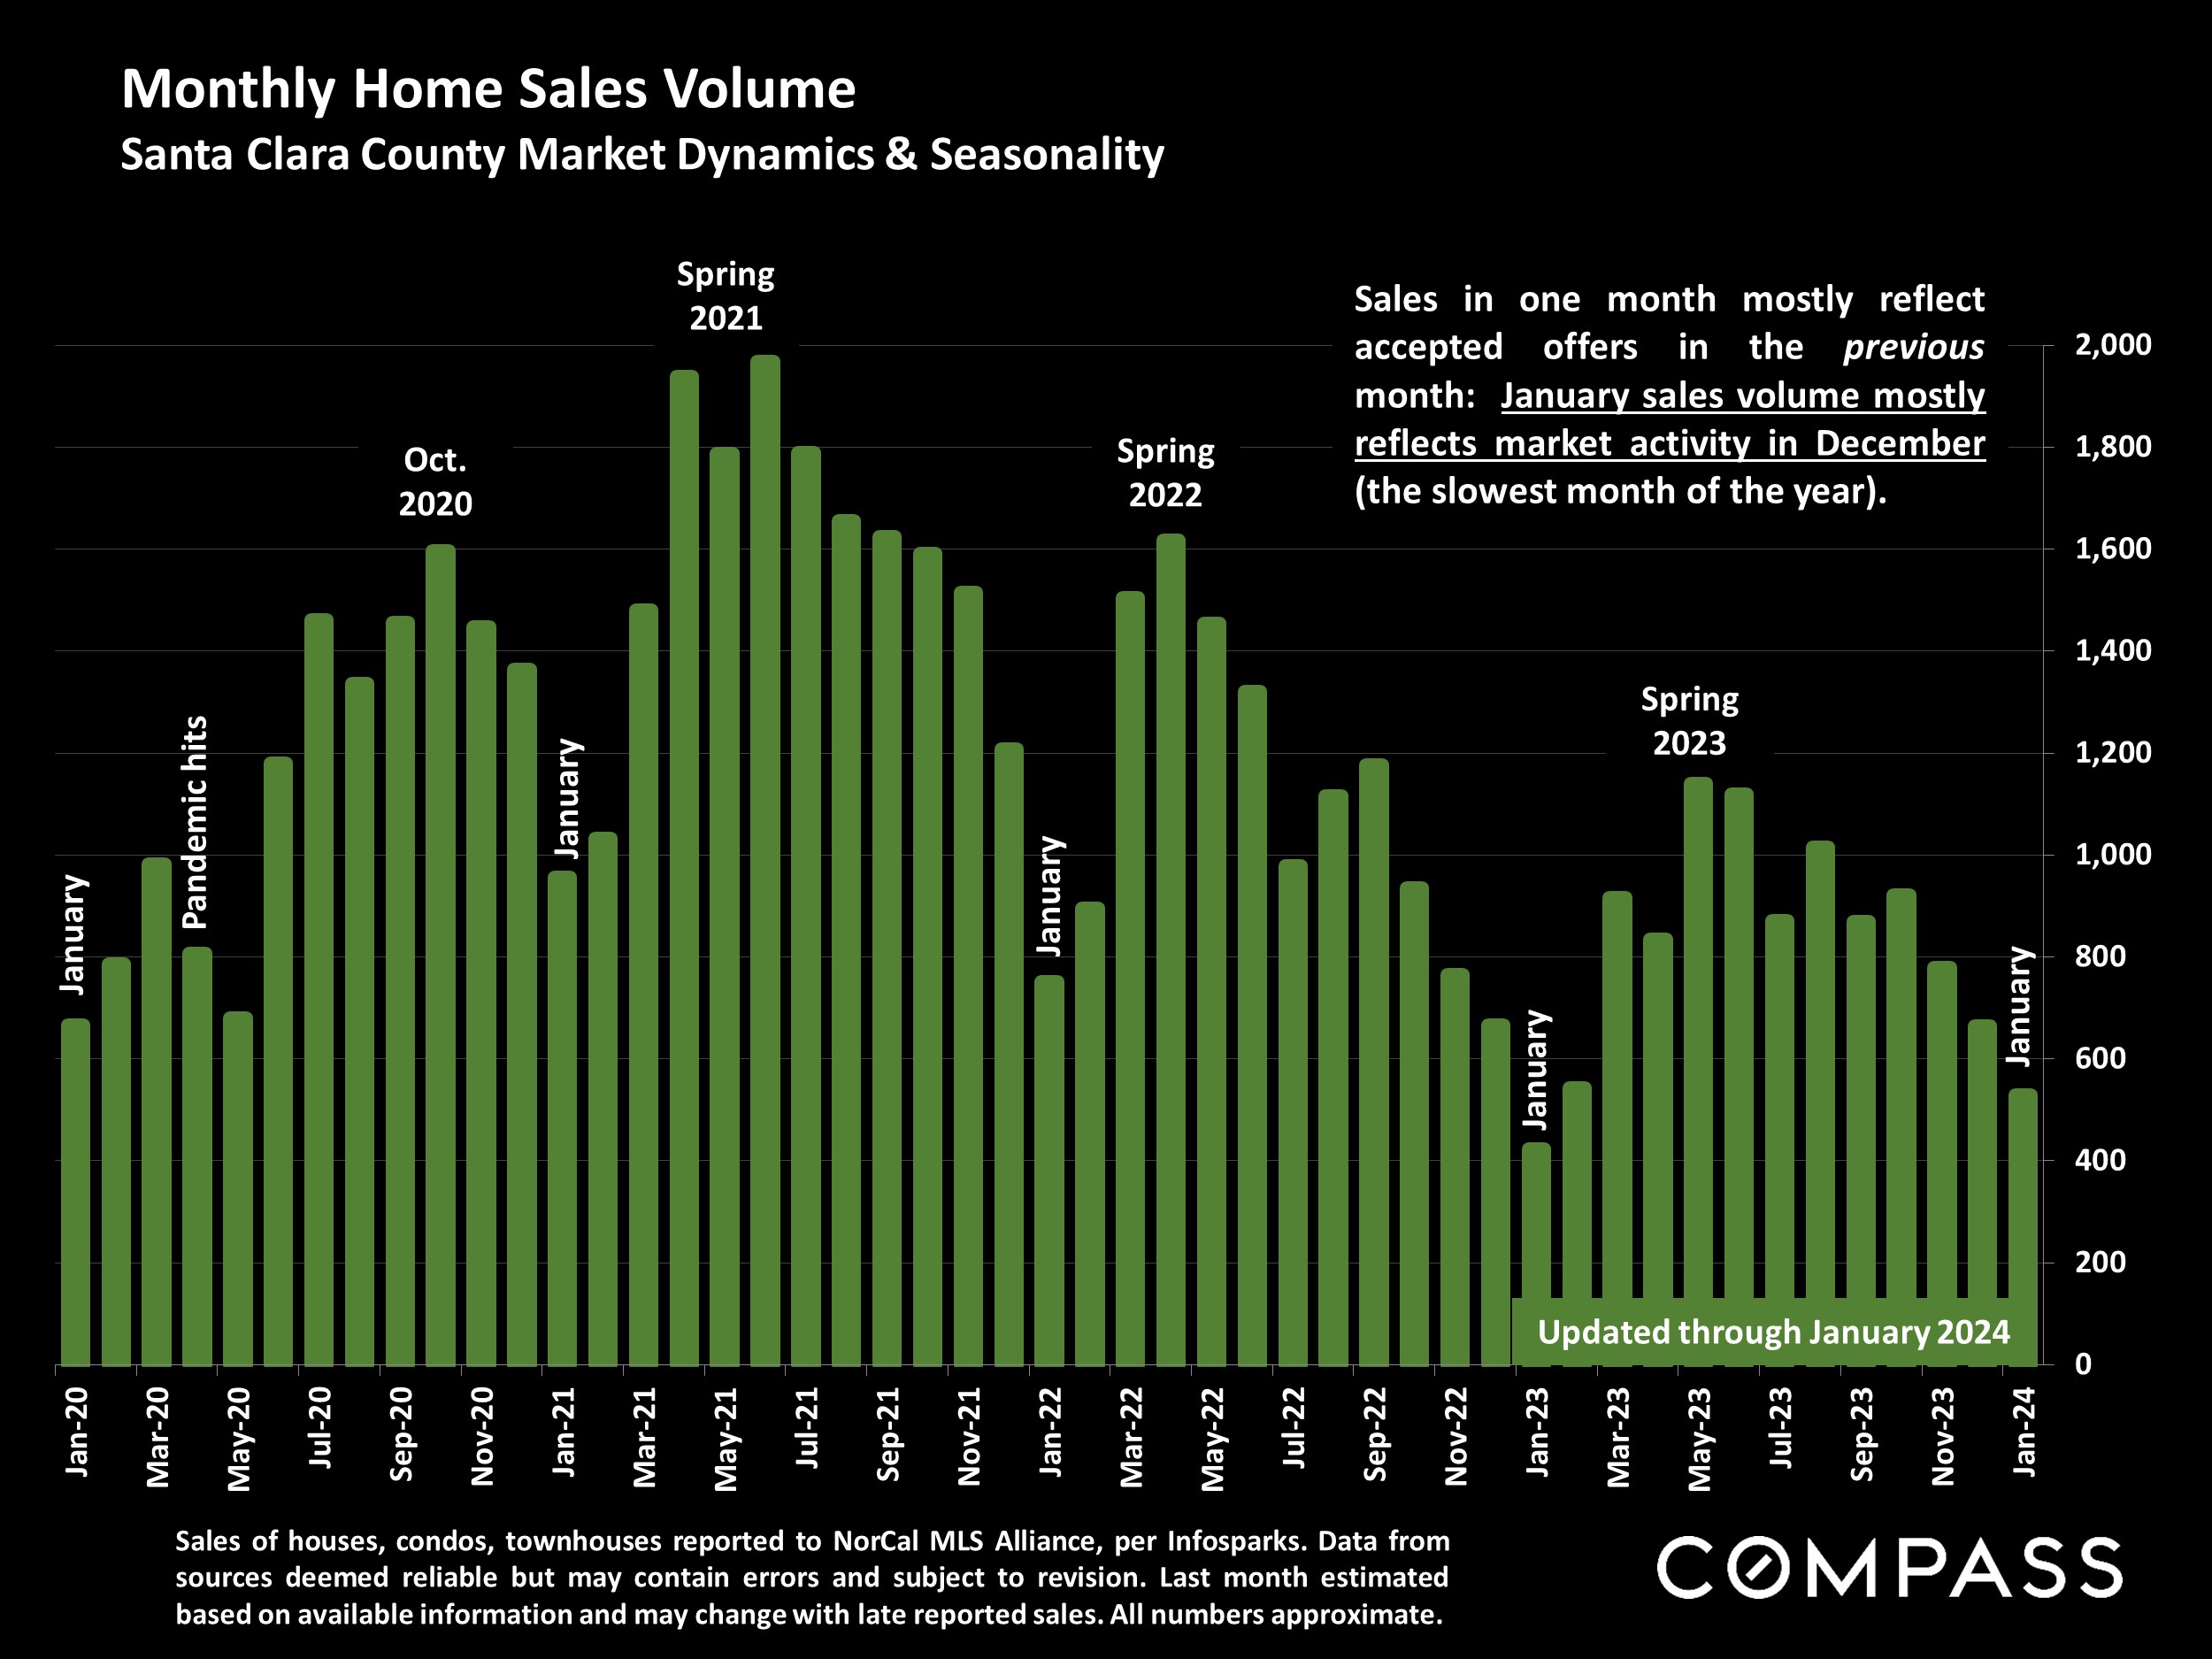
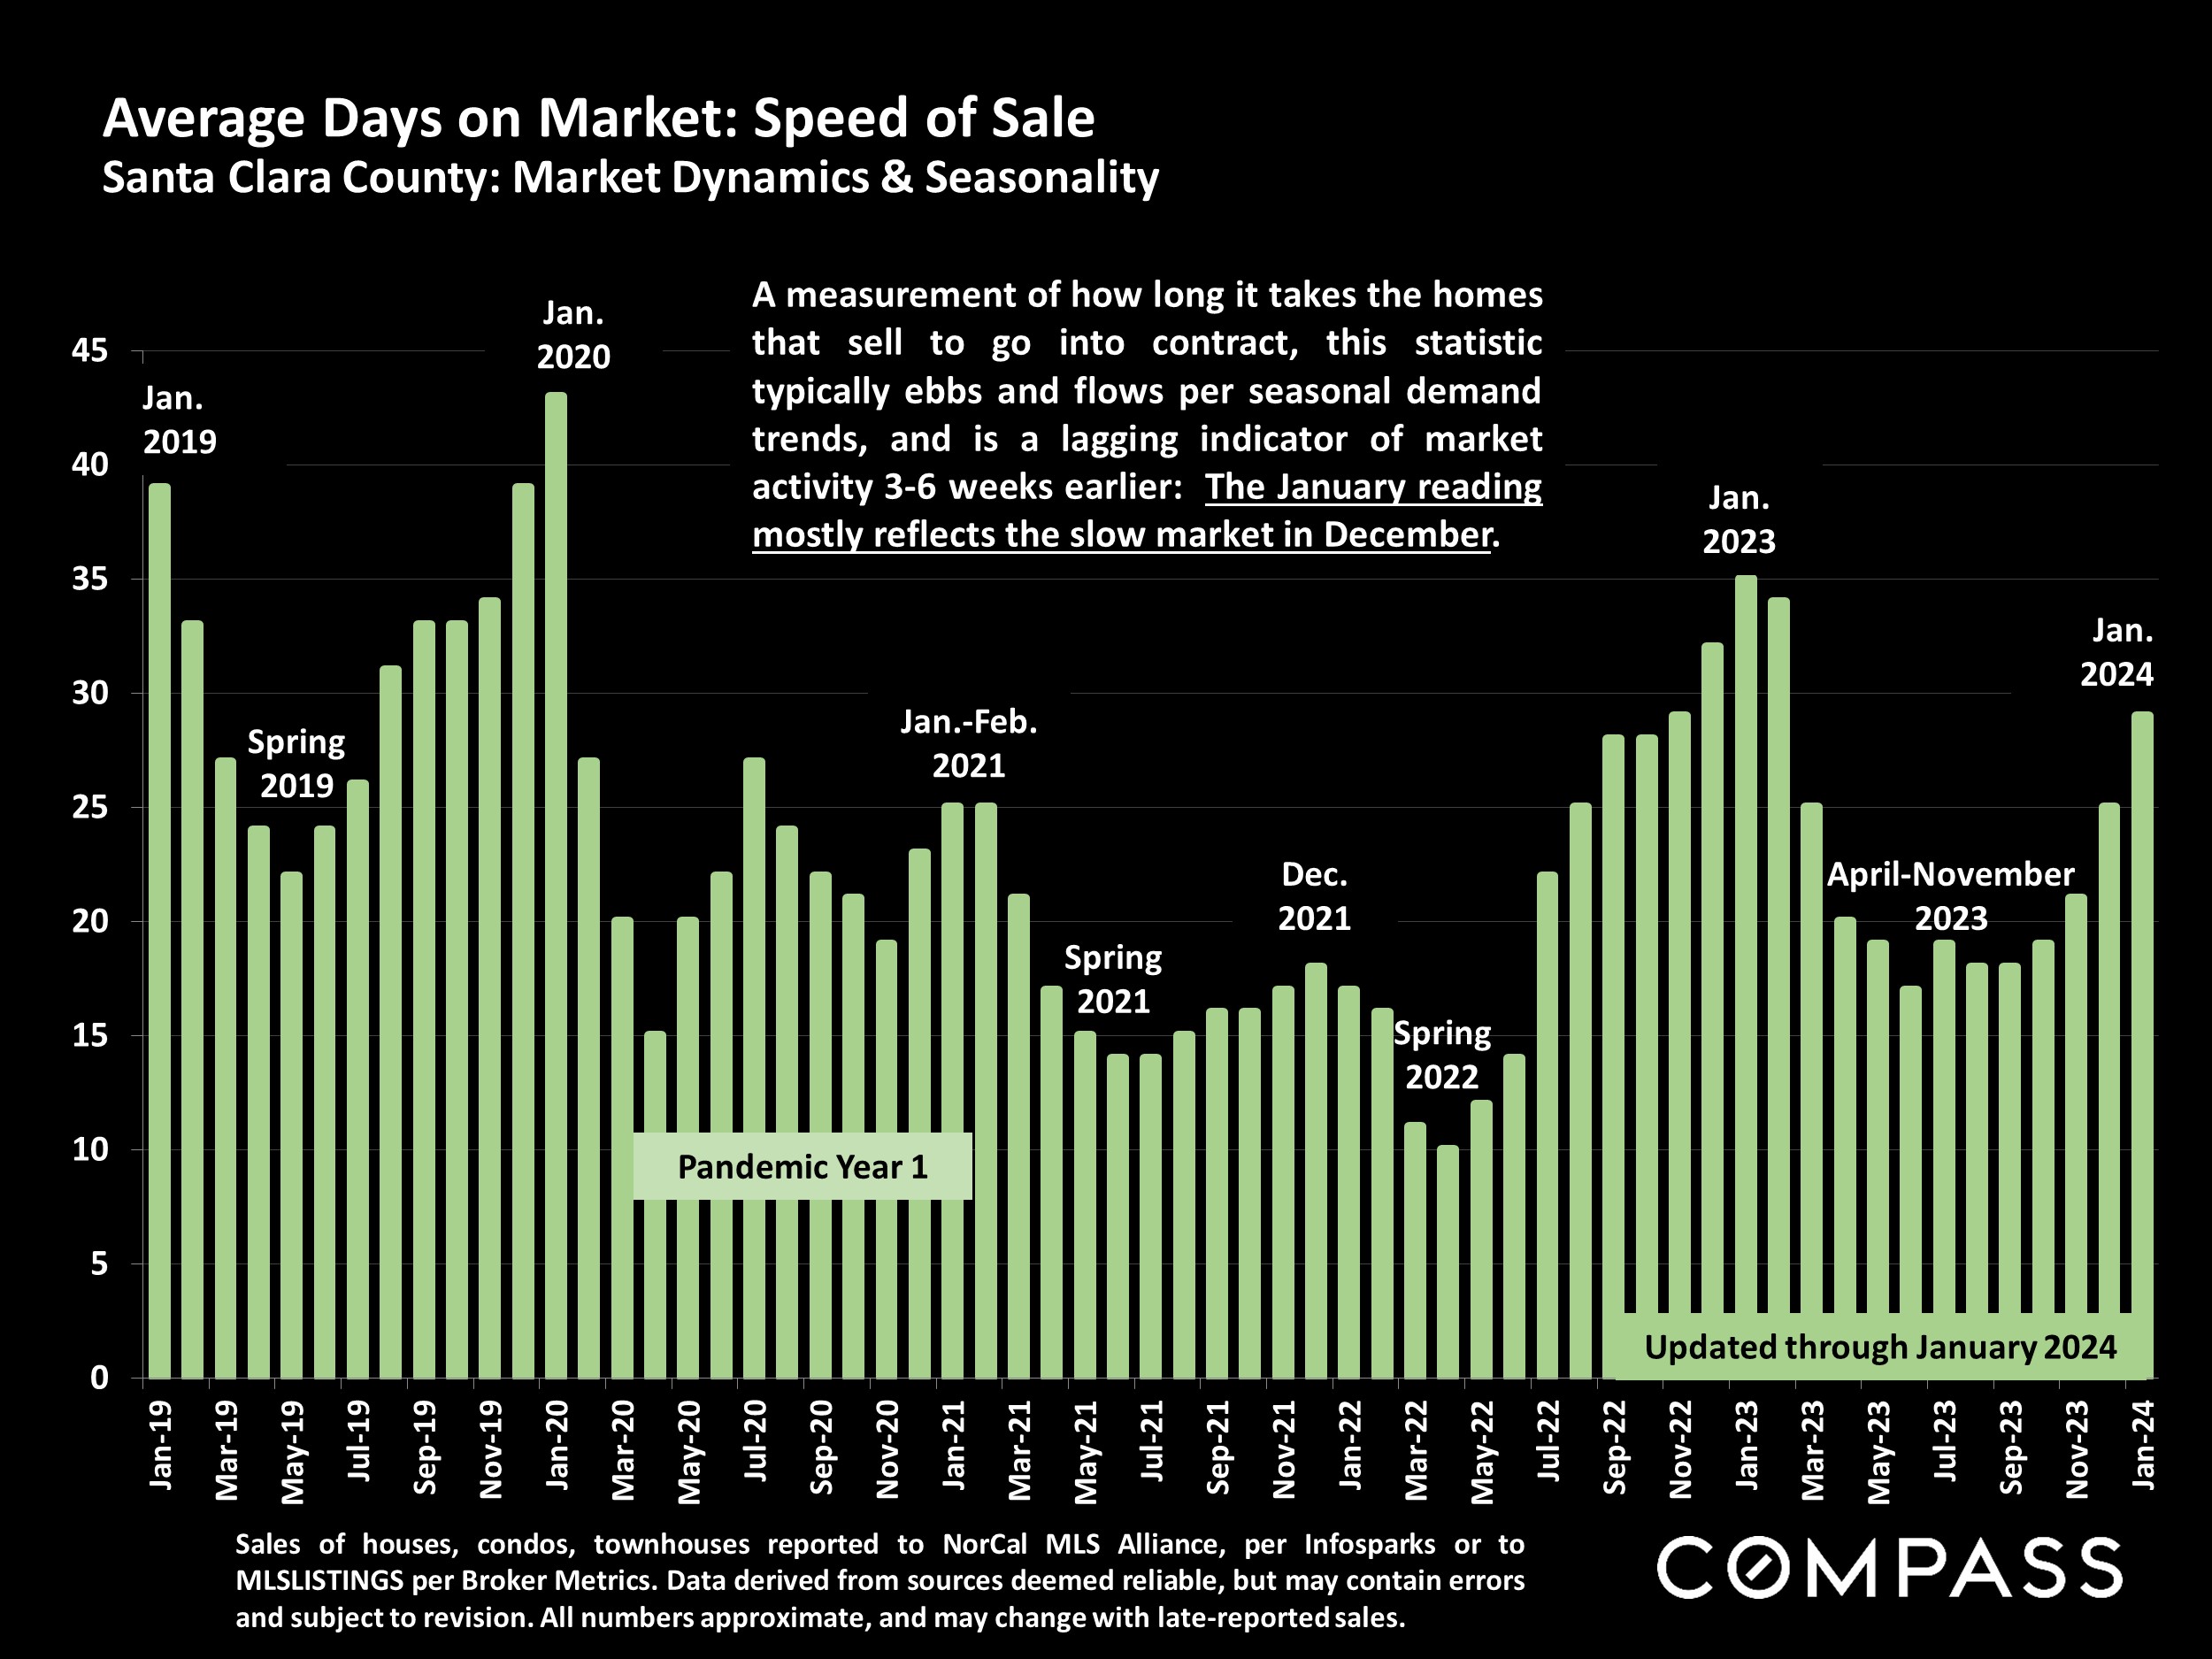
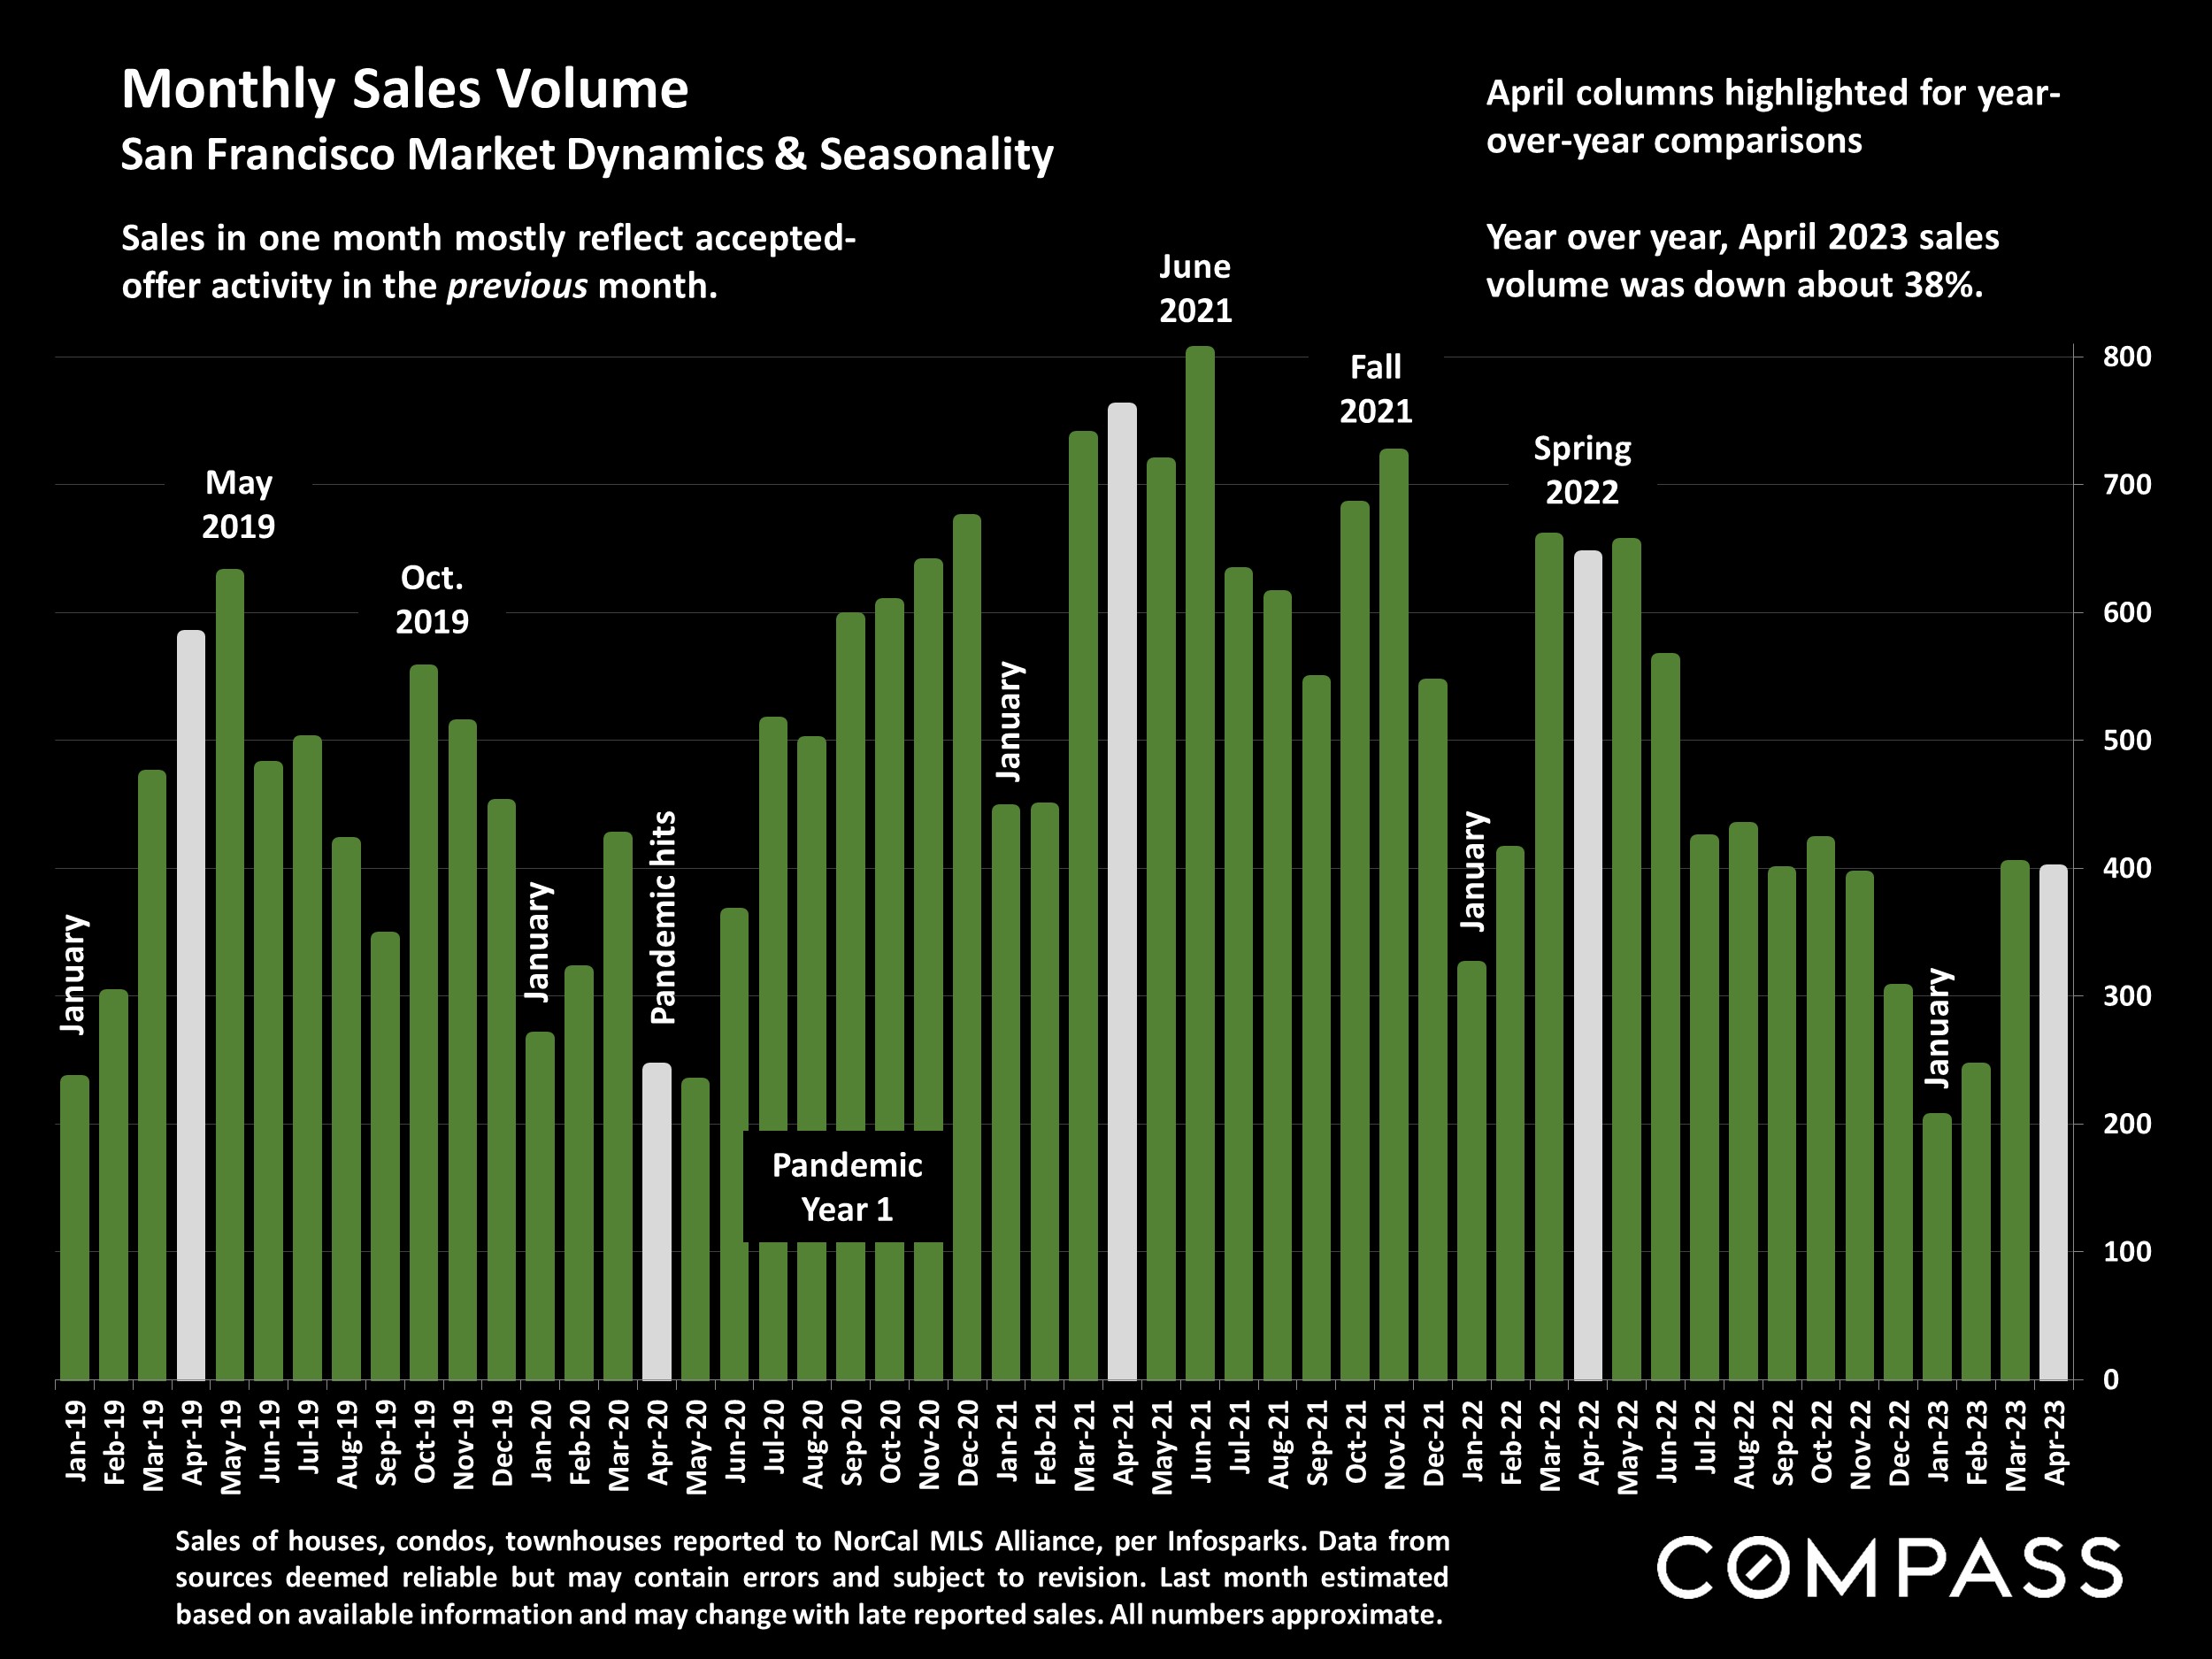
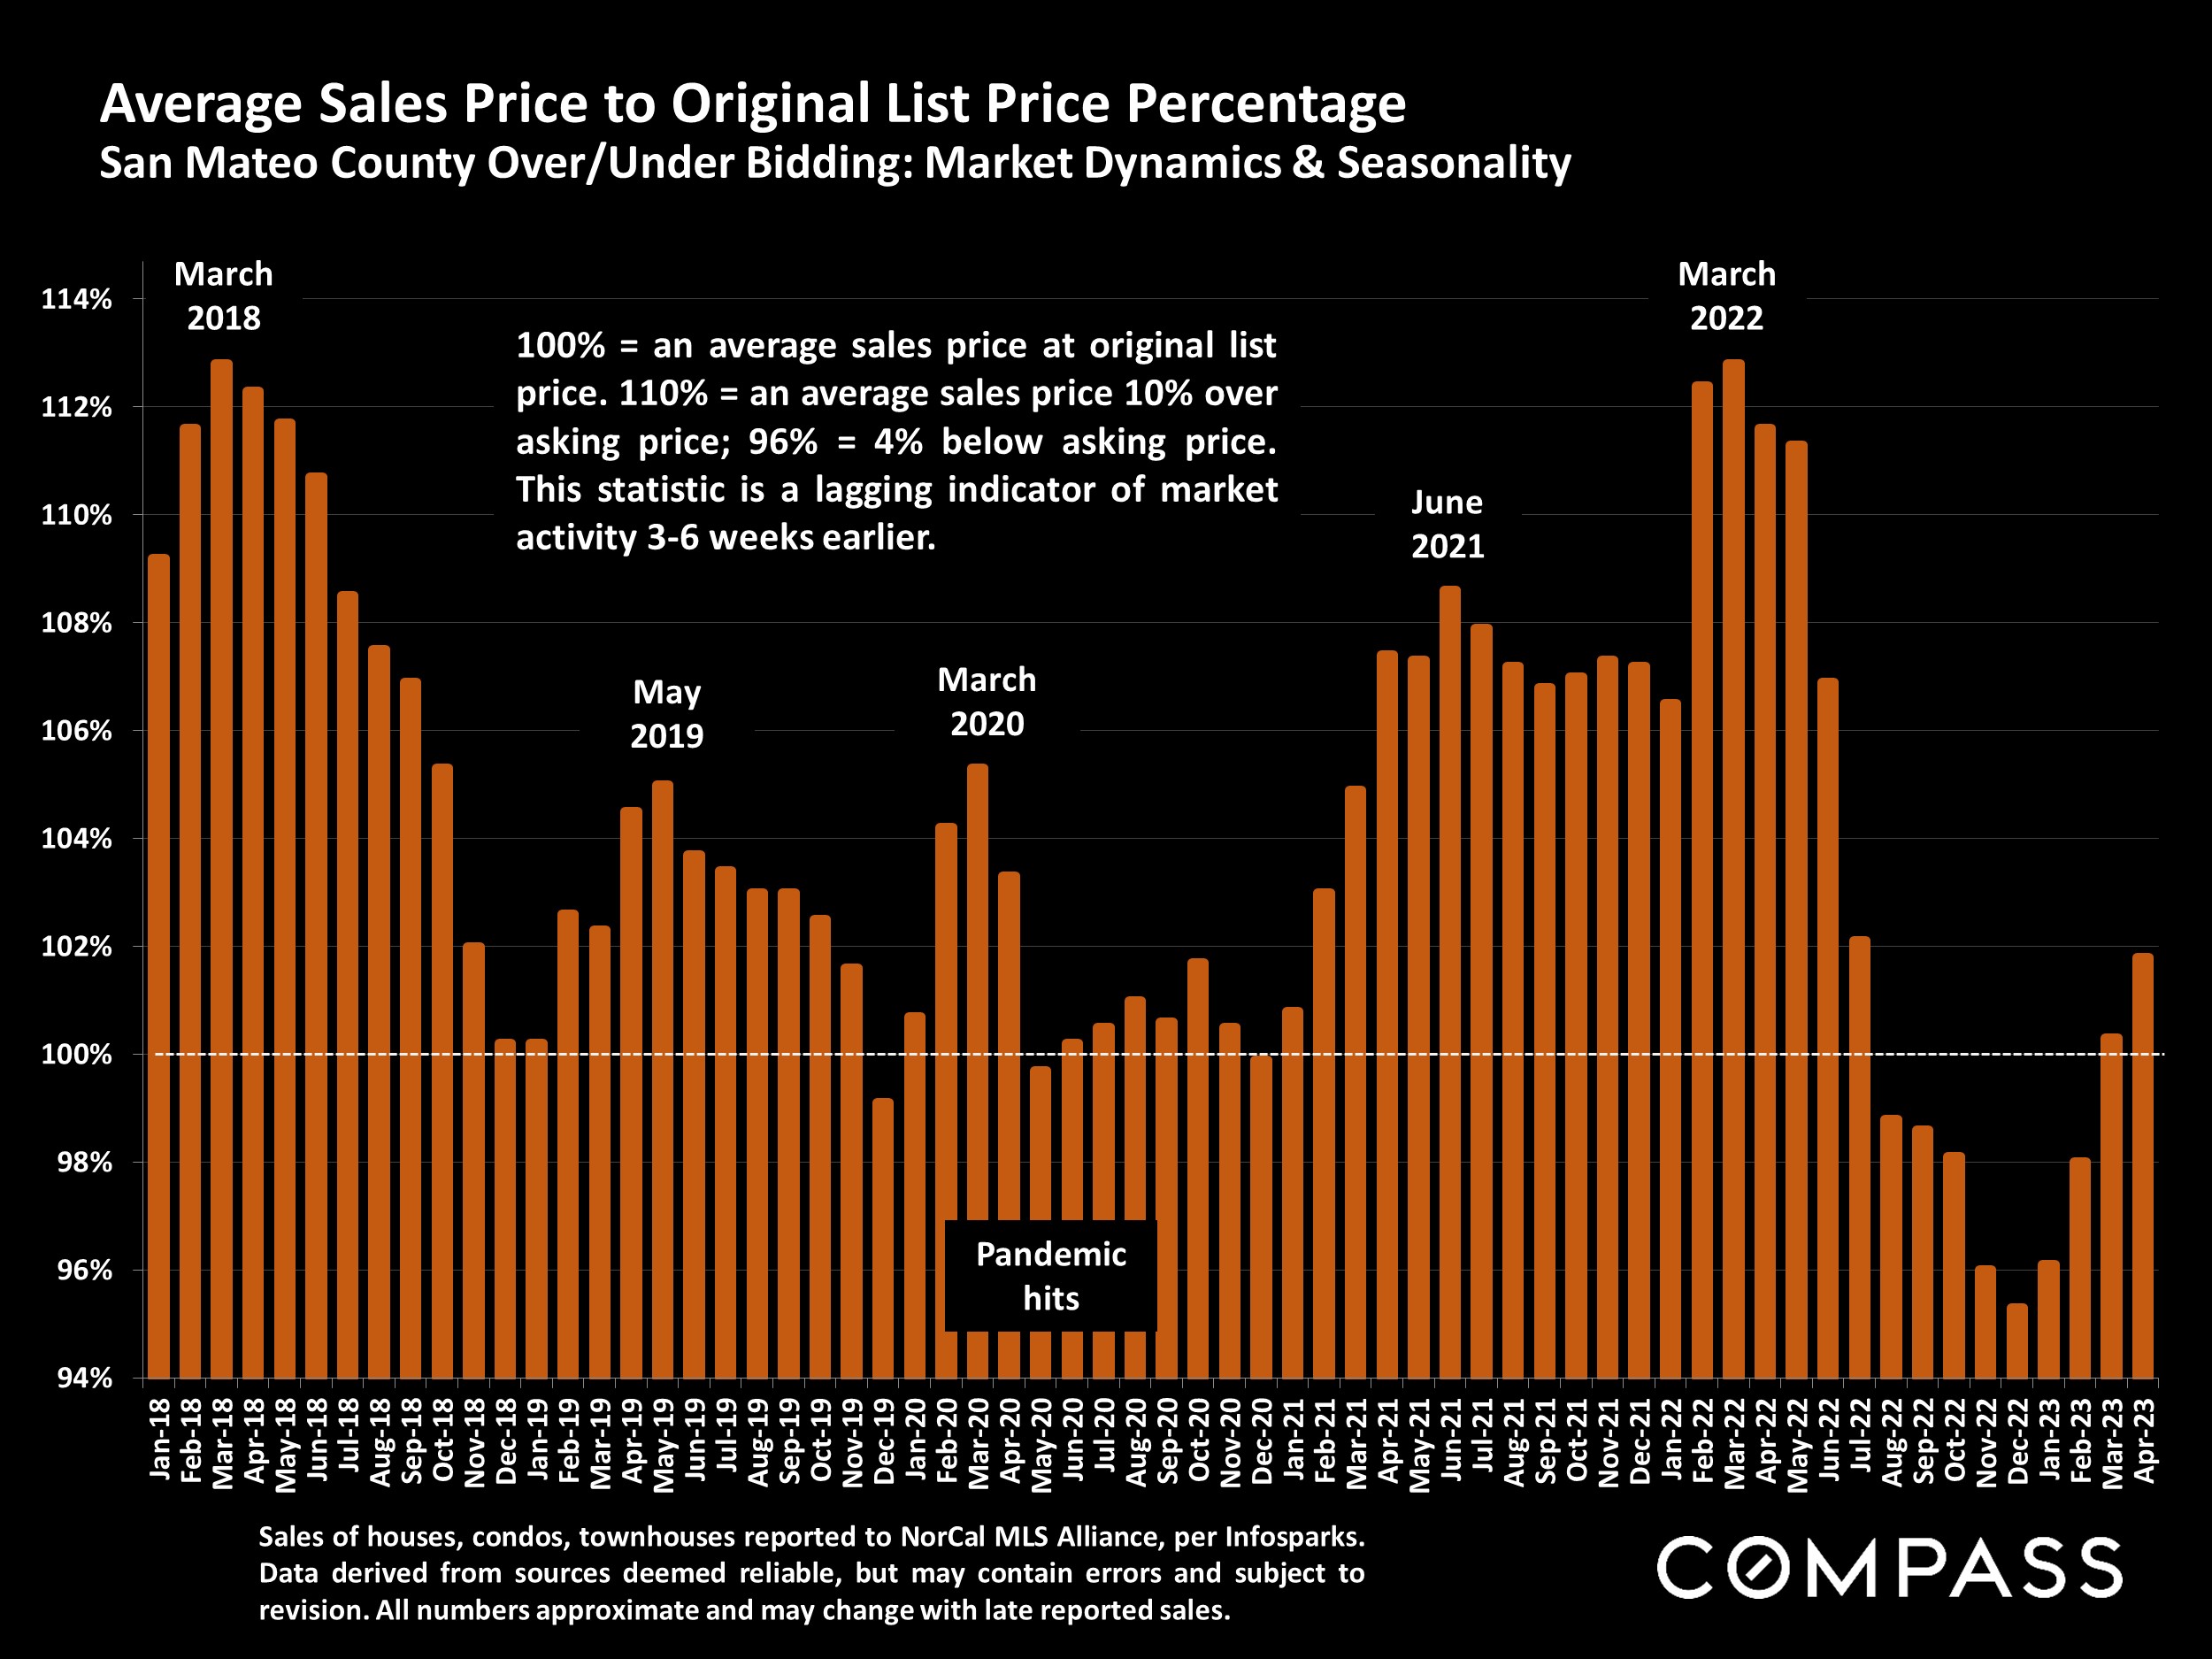
January statistics based on closed sales – sales prices, sales volume, days-on-market, overbidding percentages – will mostly reflect listings that went into contract in late 2023, the slowest market of the year. Spring, typically the most active selling season, should soon result in substantial changes in all these indicators. Depending on the weather, “spring” in the Bay Area can begin as early as February.
Data from sources deemed reliable but may contain errors and subject to revision. Some January numbers are estimates based on data available in early February. Economic conditions can be volatile. All numbers are approximate. Header photo by Deniece Smith, used with permission.
“Although affordability continues to impact homeownership, the combination of a solid economy, strong demographics and lower mortgage rates are setting the stage for a more robust housing market. Mortgage rates have been stable for nearly two months, but with continued deceleration in inflation, rates are expected to decline further. The economy continues to outperform due to solid job and income growth, while household formation is increasing at rates above pre-pandemic levels. These favorable factors should provide strong fundamental support to the market in the months ahead.” FHLMC (Freddie Mac), 2/1/24
“Over the last two months, [consumer] sentiment has climbed a cumulative 29%, the largest two- month increase since 1991…For the second straight month, all five index components rose… there was a broad consensus of improved sentiment across age, income, education, and geography.” University of Michigan, Consumer Sentiment Index, Preliminary January Report, 1/19/24
“The recession America was expecting never showed up…Instead, the economy grew 3.1% last year, up from less than 1% in 2022, and faster than the average for the 5 years leading up to the pandemic. Inflation has retreated substantially [and] unemployment remains at historic lows…” The New York Times, 1/26/24, “Economists Predicted a Recession. So Far They’ve Been Wrong.”
The California Association of Realtors forecasts that compared to 2023, the number of state home sales in 2024 will increase 23%, the CA median house sales price will rise 6.2%, and the average 30- year mortgage interest rate will decline to 6.3%. Jordan Levine, CAR chief economist, 1/18/2024
Statistics are generalities, essentially summaries of widely disparate data generated by dozens, hundreds or thousands of unique, individual sales occurring within different time periods. They are best seen not as precise measurements, but as broad, comparative indicators, with reasonable margins of error. Anomalous fluctuations in statistics are not uncommon, especially in smaller, expensive market segments. Last period data should be considered estimates that may change with late-reported data. Different analytics programs sometimes define statistics – such as “active listings,” “days on market,” and “months supply of inventory” – differently: what is most meaningful are not specific calculations but the trends they illustrate. Most listing and sales data derives from the local or regional multi-listing service (MLS) of the area specified in the analysis, but not all listings or sales are reported to MLS and these won’t be reflected in the data. “Homes” signifies real-property, single-household housing units: houses, condos, co-ops, townhouses, duets and TICs (but not mobile homes), as applicable to each market. City/town names refer specifically to the named cities and towns, unless otherwise delineated. Multi-county metro areas will be specified as such. Data from sources deemed reliable, but may contain errors and subject to revision. All numbers to be considered approximate.
Many aspects of value cannot be adequately reflected in median and average statistics: curb appeal, age, condition, amenities, views, lot size, quality of outdoor space, “bonus” rooms, additional parking, quality of location within the neighborhood, and so on. How any of these statistics apply to any particular home is unknown without a specific comparative market analysis.
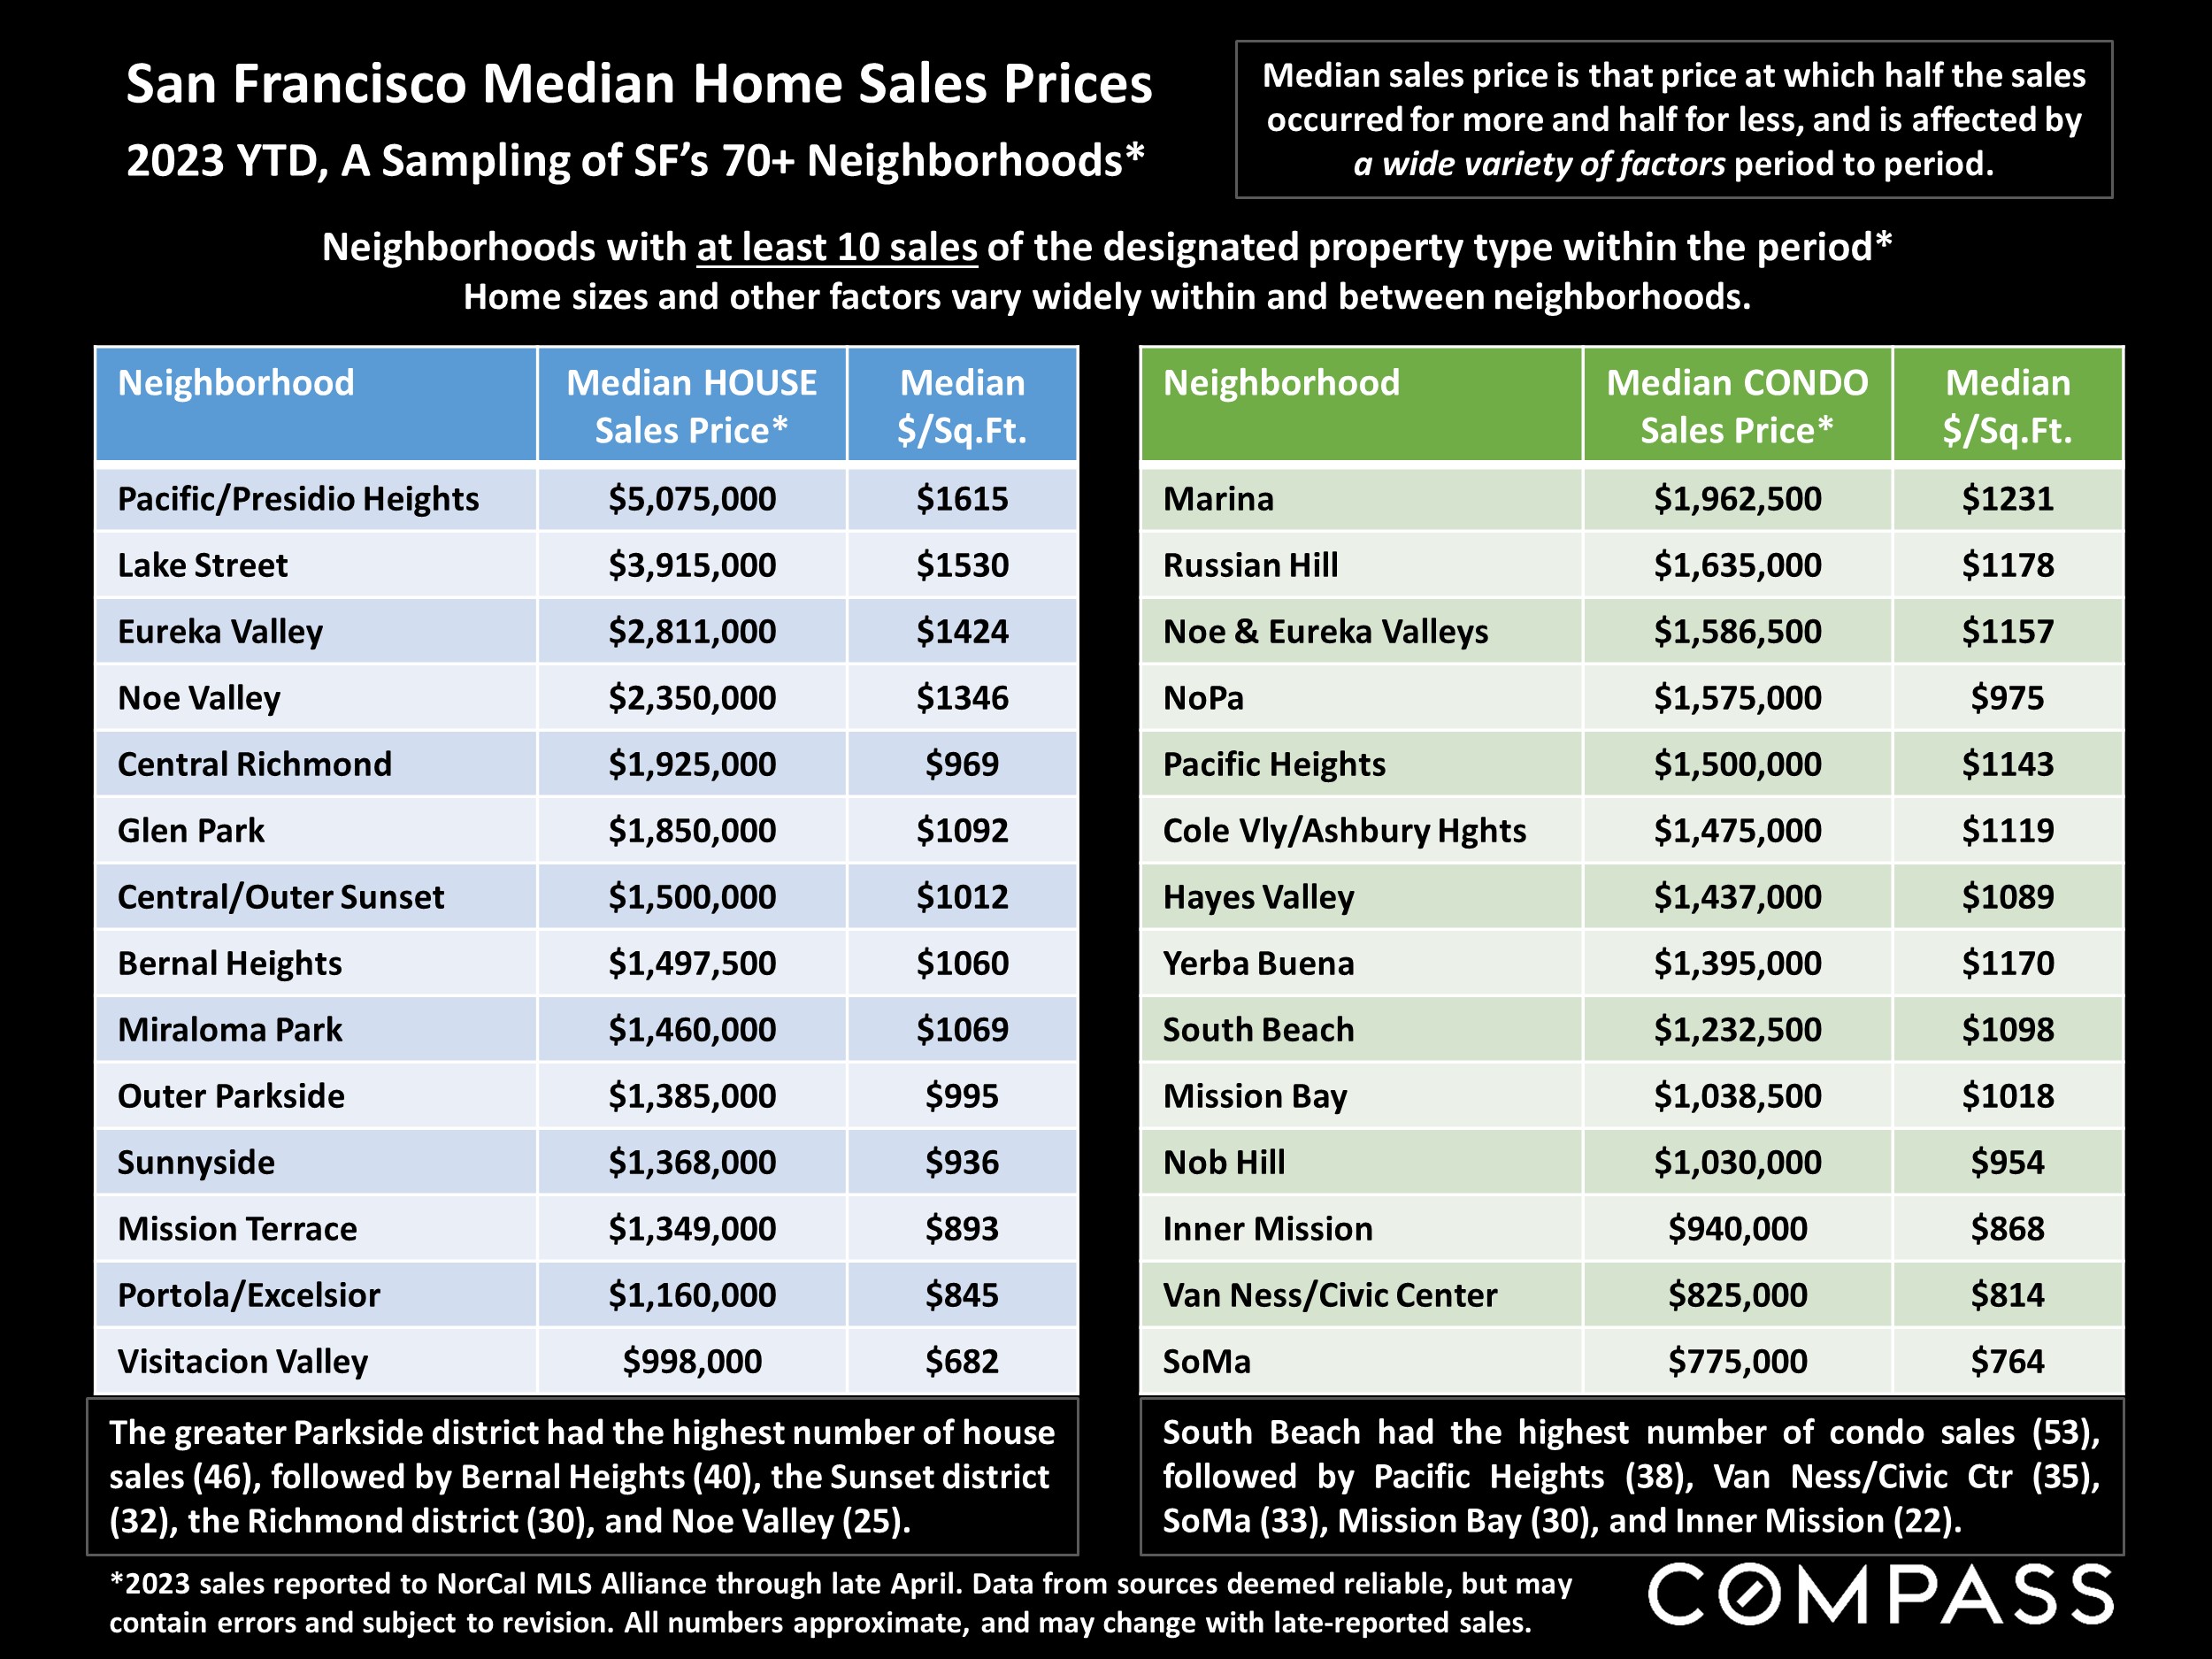
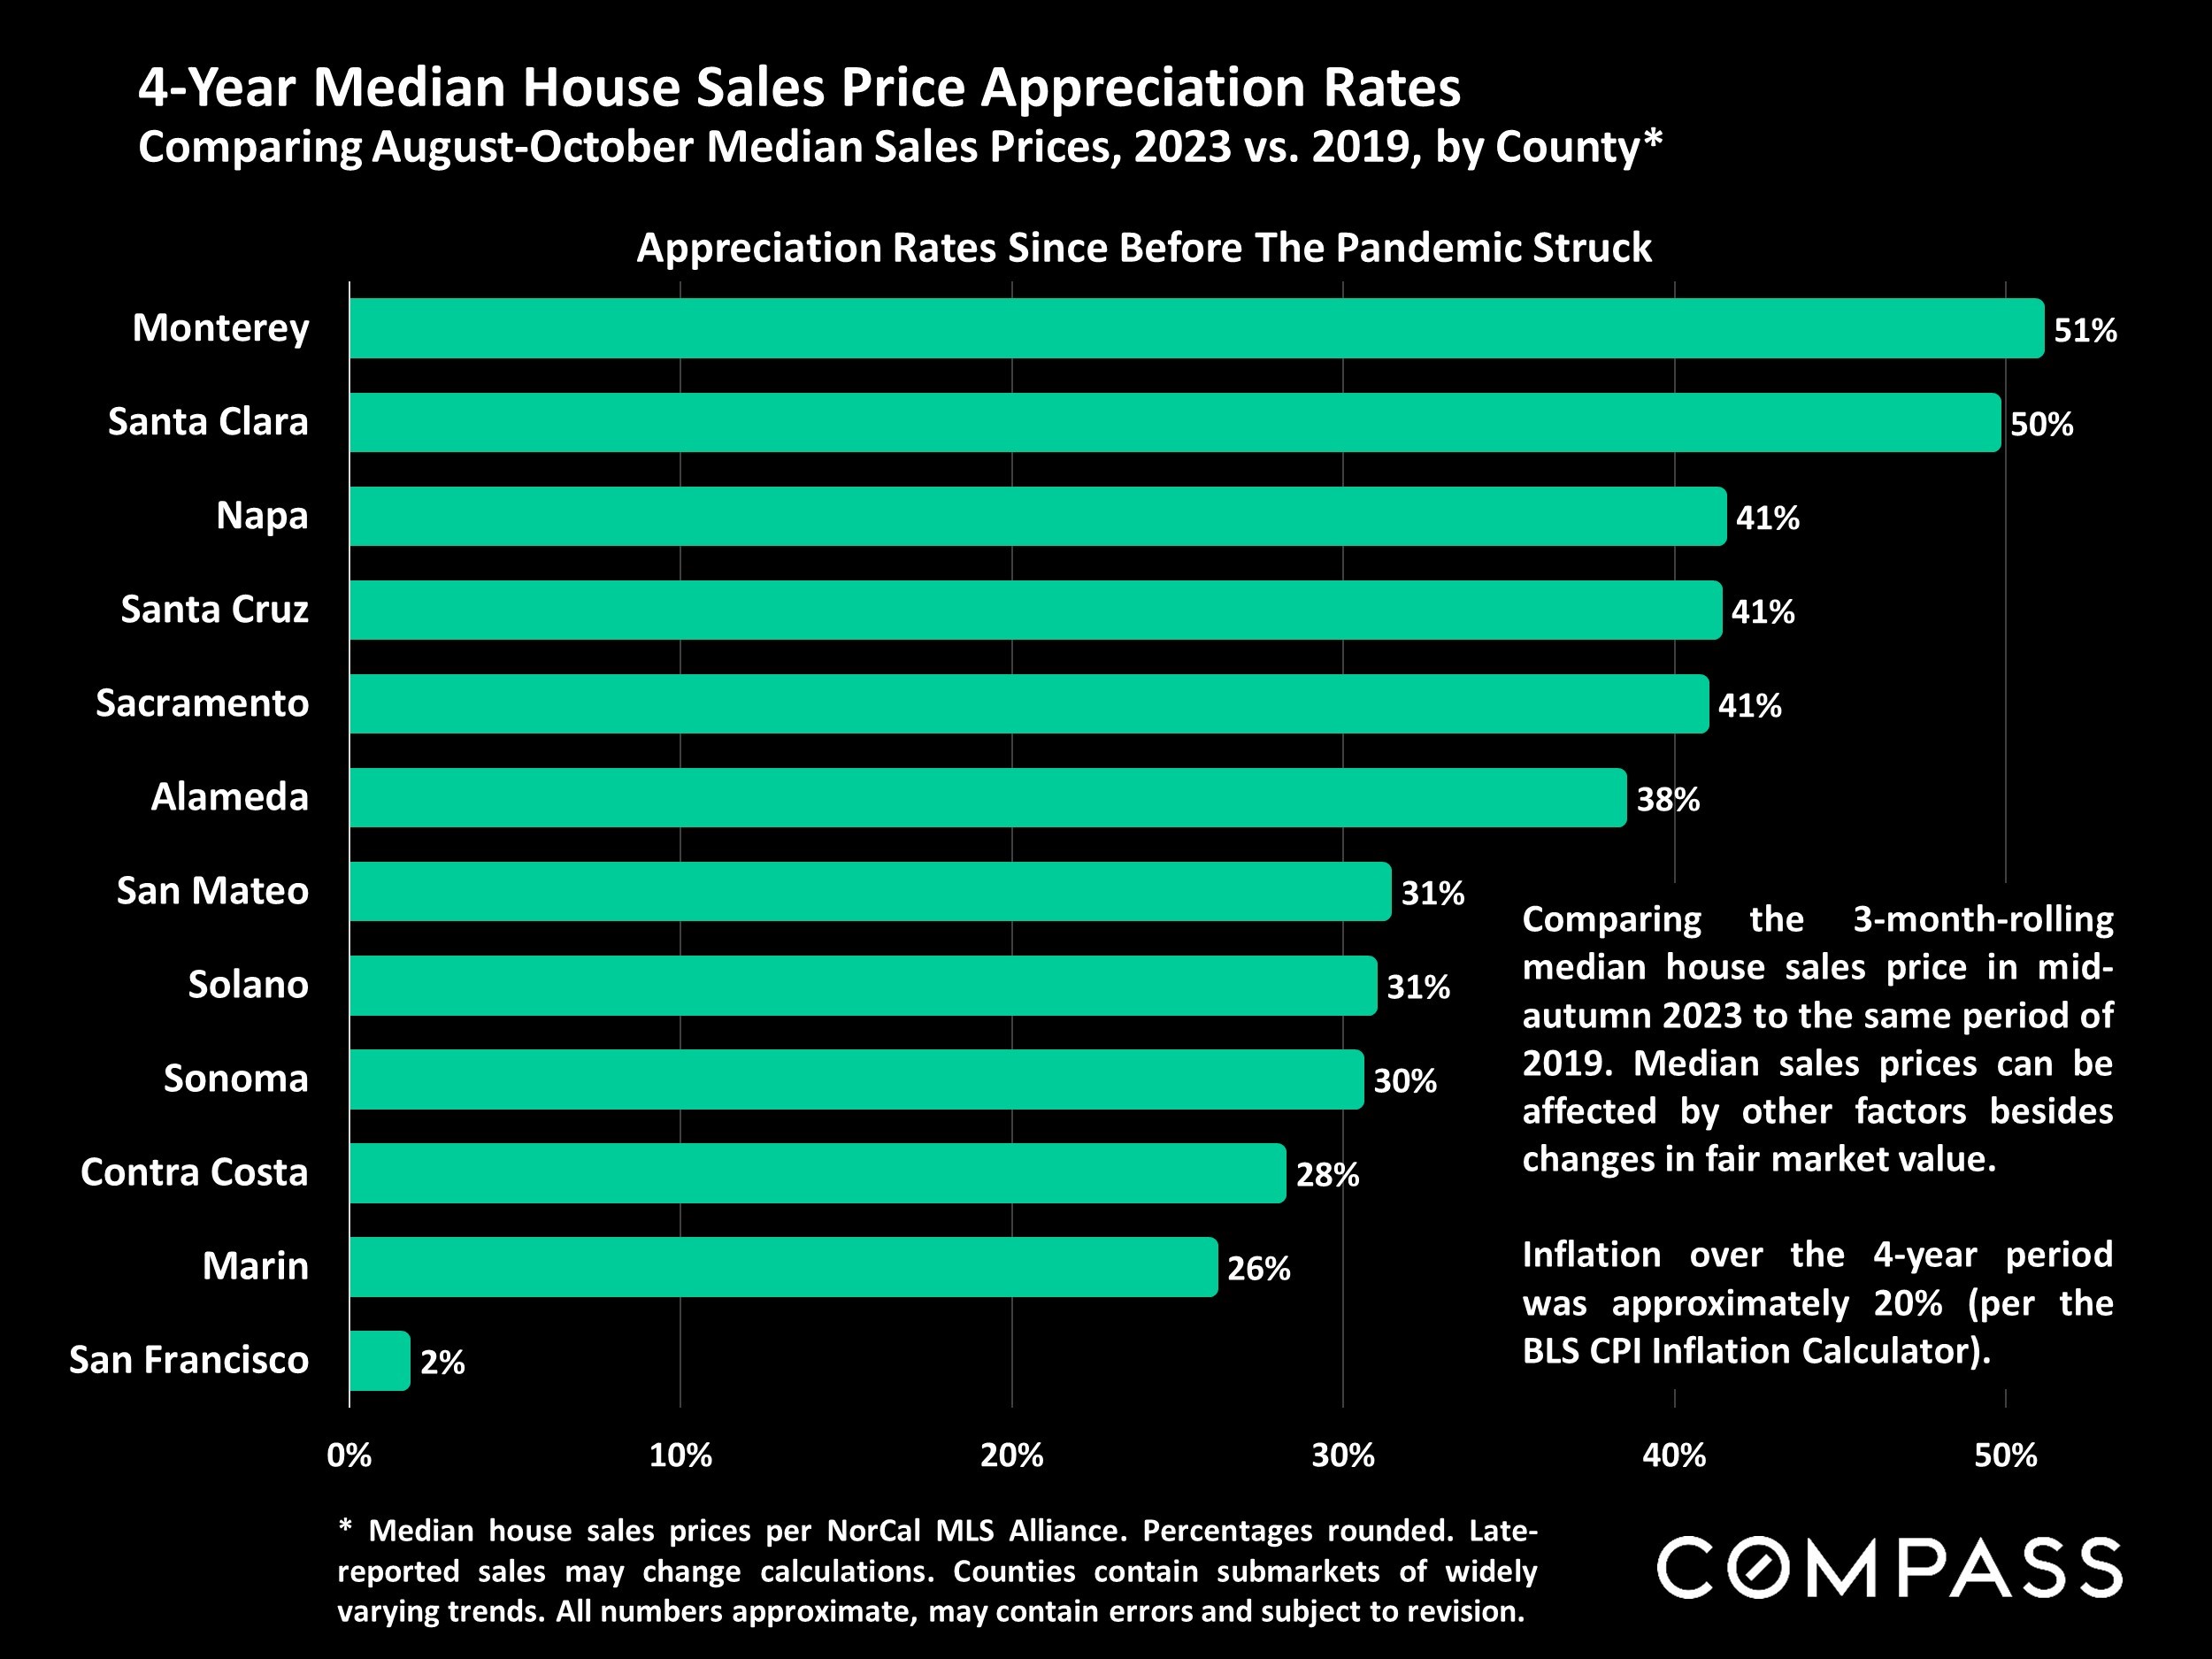
Median Sales Price is that price at which half the properties sold for more and half for less. It may be affected by seasonality, “unusual” events, or changes in inventory and buying trends, as well as by changes in fair market value. The median sales price for an area will often conceal an enormous variety of sales prices in the underlying individual sales.
Dollar per Square Foot is based upon the home’s interior living space and does not include garages, unfinished attics and basements, rooms built without permit, patios, decks or yards (though all those can add value to a home). These figures are usually derived from appraisals or tax records, but are sometimes unreliable (especially for older homes) or unreported altogether. The calculation can only be made on those home sales that reported square footage.