Virtually across the Bay Area, Q3 median sales prices retreated dramatically from their spring peaks. Part of this was due to seasonal trends – median sales prices often peak for the calendar year in Q2, then drop in summer – but part of the decline was clearly due to changing market conditions prompted by shifts in interest rates, inflation, stock markets, and consumer confidence. In this report, home prices will be reviewed from a variety of angles to provide greater context. On the supply and demand side, it appears that after the big drop in demand in early-mid summer, conditions have mostly stabilized: Generally speaking, sales numbers are no longer appreciably dropping, though overbidding statistics continue to decline and days on market to climb.
When looking at recent market changes, it is important to remember how overheated the market was in 2021 and early 2022 – many quarter-to-quarter, and year-over-year comparisons are distorted by the unusual (sometimes frenzied) conditions that prevailed then. It is also wise not to jump to definitive conclusions based upon a single quarter’s data: The economy and real estate market are still in a period of adjustment.
Comparisons with the crash of 2008 continue to be made, but the precipitating factor in the 2008 crash – tens of millions of households talked into home loans they could never afford, forcing a tsunami of frantic sales during the great recession – simply does not apply today. Mortgage payments as a percentage of income, and loan delinquency rates are both close to all-time lows; most homeowners’ mortgages are held at historically low rates. There has been no surge of desperate sellers: New listing numbers are actually down from last year. Stock market declines, though substantial, cannot compare with those seen in 2008-2009, and employment remains very strong. This is not to minimize the correction the market is going through: There are certainly major economic challenges at play right now, but a market correction is not a crash, being more like a slow leak in an over-pressurized tire than a blowout on the highway at high speed.
The relatively short autumn selling season began after Labor Day and runs through mid-November. The midwinter holiday slowdown then runs through mid-January. Though sales continue in every month of the year, listing and sale activity drops dramatically as we near Thanksgiving. Slower markets can offer opportunities to buyers, but the selection of homes for sale usually tumbles.
Our reports are not intended to convince you regarding a course of action or to predict the future, but to provide, to the best of our ability, straightforward information and good-faith analysis to assist you in making your own informed decisions. Statistics should be considered very general indicators, and all numbers should be considered approximate. How they apply to any particular property is unknown without a specific comparative market analysis.
Statistics are generalities, essentially summaries of widely disparate data generated by dozens, hundreds or thousands of unique, individual sales occurring within different time periods. They are best seen not as precise measurements, but as broad, comparative indicators, with reasonable margins of error. Anomalous fluctuations in statistics are not uncommon, especially in smaller, expensive market segments. Last period data should be considered estimates that may change with late-reported data. Different analytics programs sometimes define statistics – such as “active listings,” “days on market,” and “months supply of inventory” – differently: what is most meaningful are not specific calculations but the trends they illustrate. Most listing and sales data derives from the local or regional multi-listing service (MLS) of the area specified in the analysis, but not all listings or sales are reported to MLS and these won’t be reflected in the data. “Homes” signifies real-property, single-household housing units: houses, condos, co-ops, townhouses, duets and TICs (but not mobile homes), as applicable to each market. City/town names refer specifically to the named cities and towns, unless otherwise delineated. Multi-county metro areas will be specified as such. Data from sources deemed reliable, but may contain errors and subject to revision. All numbers to be considered approximate.
Many aspects of value cannot be adequately reflected in median and average statistics: curb appeal, age, condition, amenities, views, lot size, quality of outdoor space, “bonus” rooms, additional parking, quality of location within the neighborhood, and so on. How any of these statistics apply to any particular home is unknown without a specific comparative market analysis.
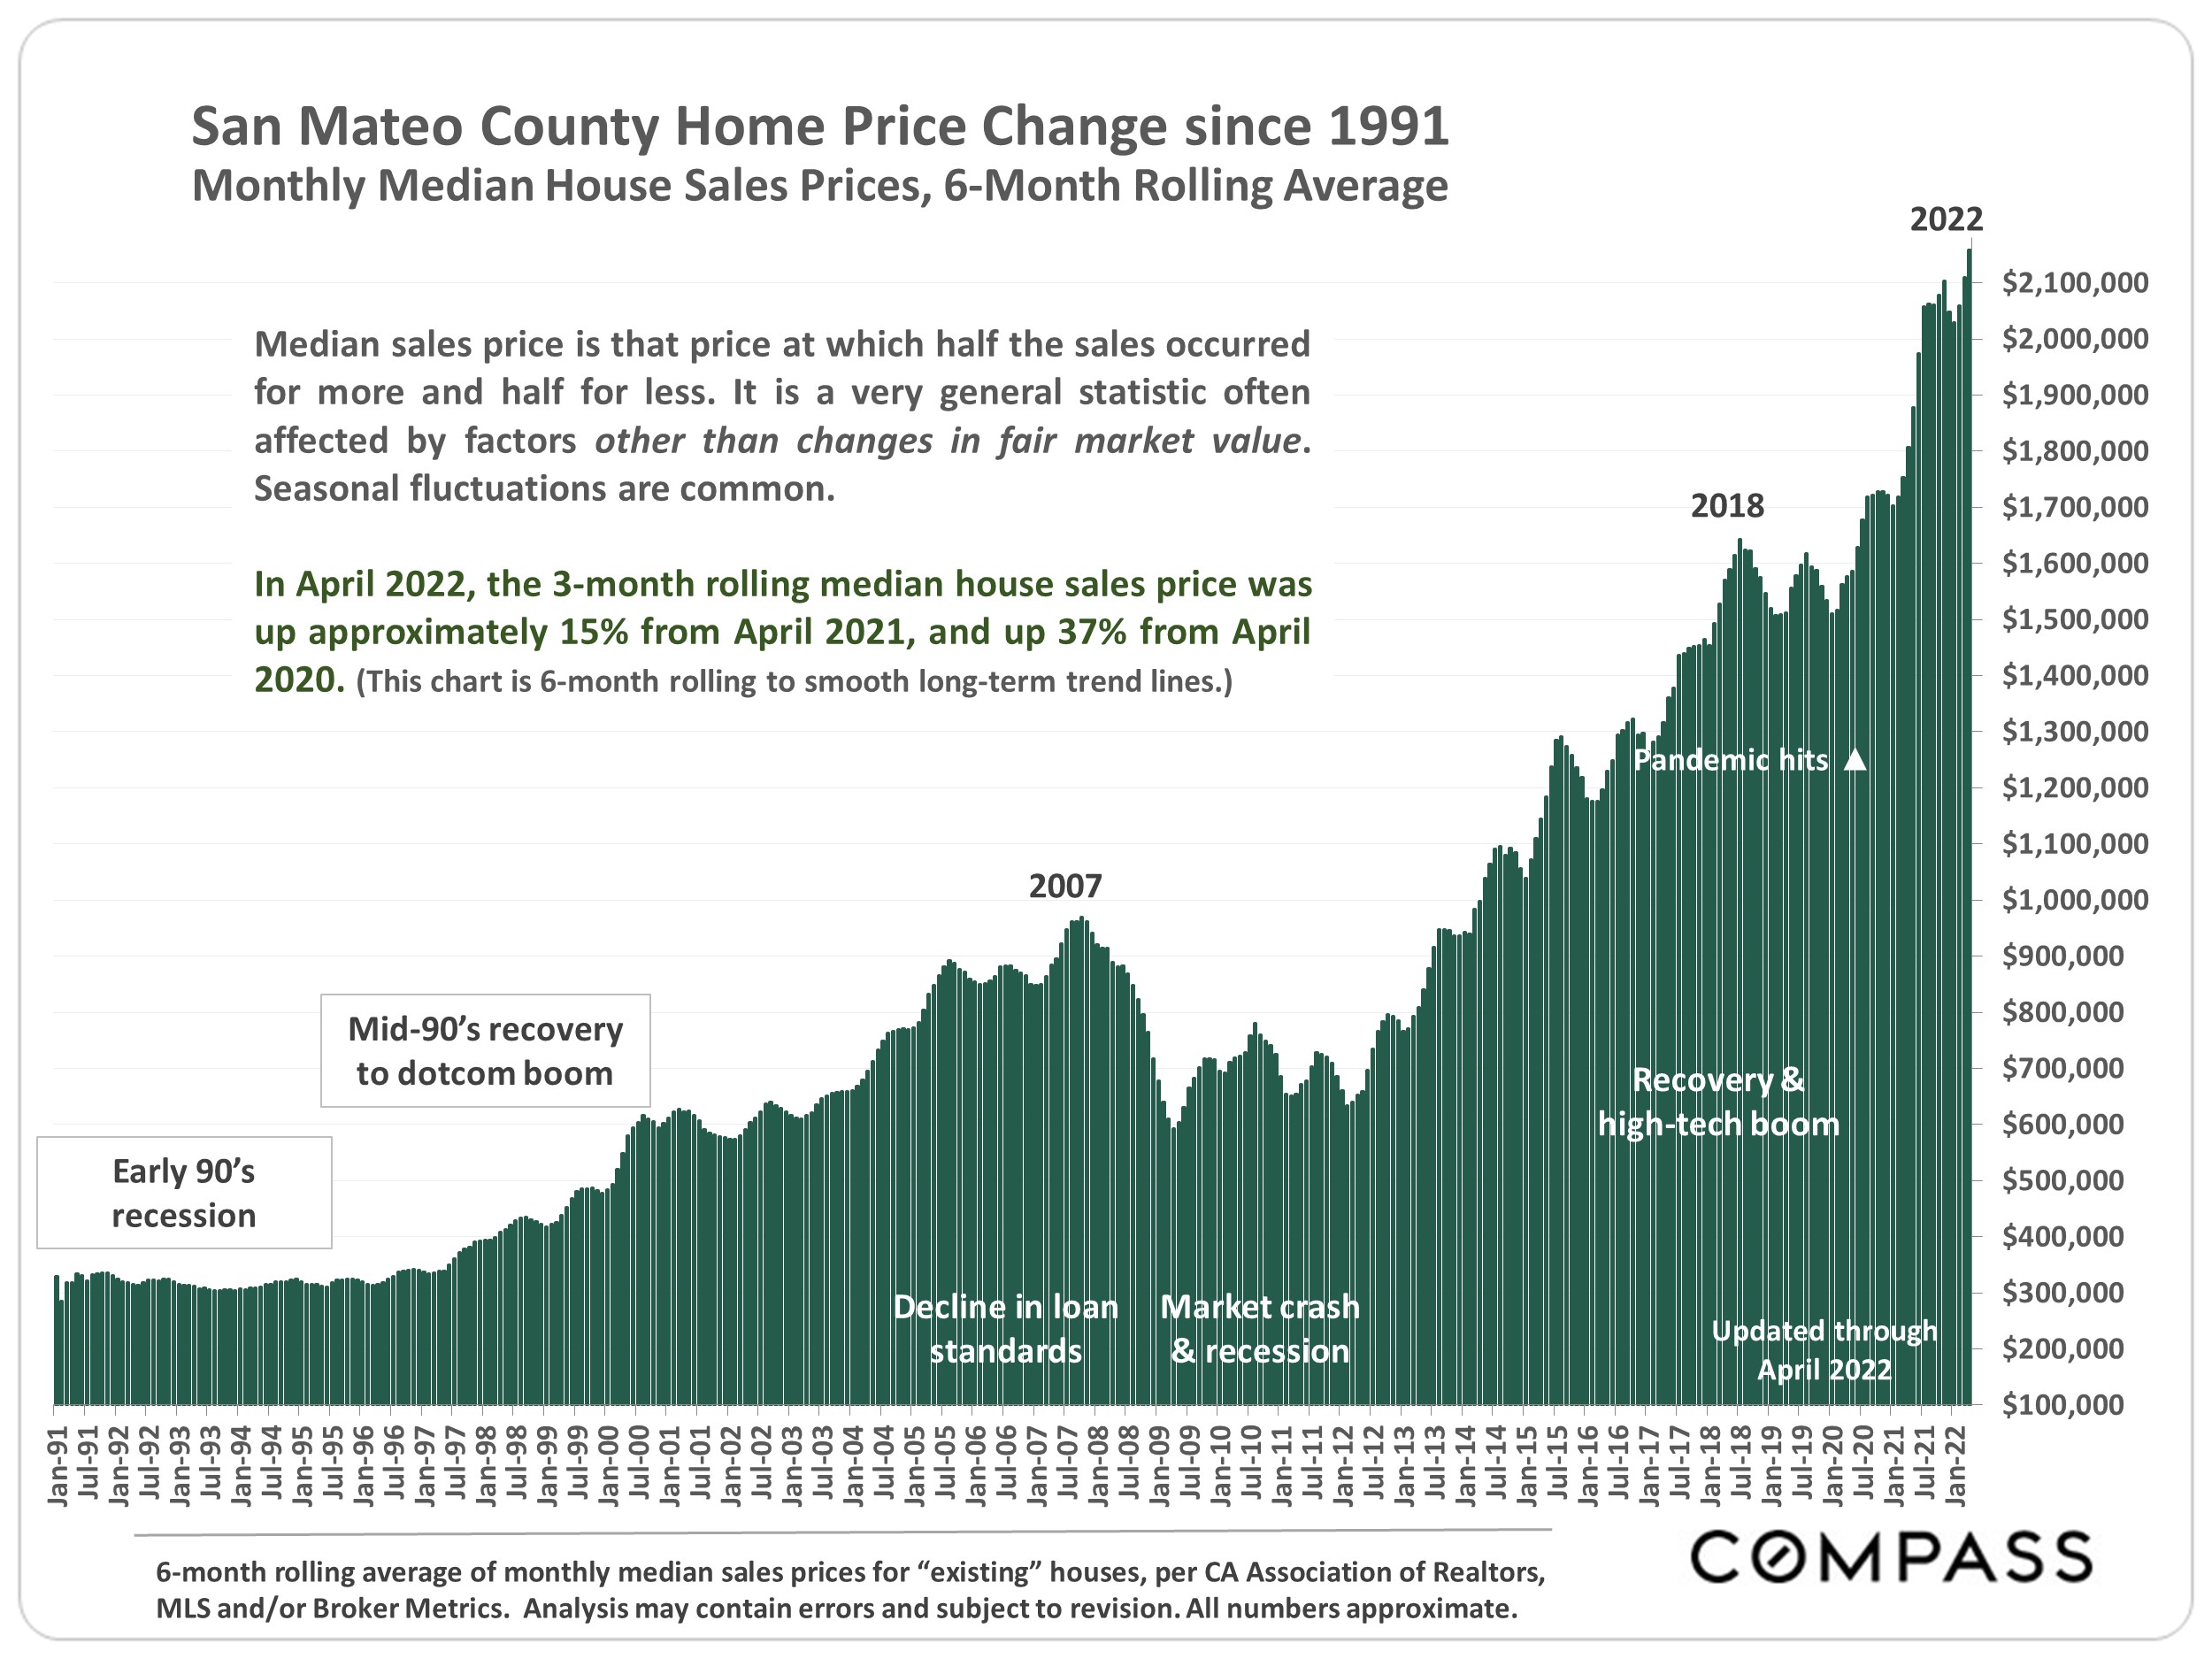
Median Sales Price is that price at which half the properties sold for more and half for less. It may be affected by seasonality, “unusual” events, or changes in inventory and buying trends, as well as by changes in fair market value. The median sales price for an area will often conceal an enormous variety of sales prices in the underlying individual sales.
Dollar per Square Foot is based upon the home’s interior living space and does not include garages, unfinished attics and basements, rooms built without permit, patios, decks or yards (though all those can add value to a home). These figures are usually derived from appraisals or tax records, but are sometimes unreliable (especially for older homes) or unreported altogether. The calculation can only be made on those home sales that reported square footage.
Compass is a real estate broker licensed by the State of California, DRE 01527235. Equal Housing Opportunity. This report has been prepared solely for information purposes. The information herein is based on or derived from information generally available to the public and/or from sources believed to be reliable. No representation or warranty can be given with respect to the accuracy or completeness of the information. Compass disclaims any and all liability relating to this report, including without limitation any express or implied representations or warranties for statements contained in, and omissions from, the report. Nothing contained herein is intended to be or should be read as any regulatory, legal, tax, accounting or other advice and Compass does not provide such advice. All opinions are subject to change without notice. Compass makes no representation regarding the accuracy of any statements regarding any references to the laws, statutes or regulations of any state are those of the author(s). Past performance is no guarantee of future results.