The focus of this survey is on broad, Bay Area market trends. Though submarkets will often diverge to various degrees, general trends in prices, and supply and demand typically move in parallel directions – especially over longer periods of time. Towards the end of the report is a link to a review of selected macroeconomic factors at play in the market.
Some analyses pertain to different selections of counties and different property types, depending on statistic and data source. Statistics are generalities, essentially summaries of data generated by dozens, hundreds or thousands of unique, individual sales. They are best seen not as precise measurements, but as broad, comparative indicators with reasonable margins of error – and how they apply to any particular property is unknown without a specific comparative market analysis. Anomalous fluctuations in statistics are not uncommon, and longer-term trends are typically more meaningful than short-term fluctuations. Data from sources deemed reliable, but may contain errors and subject to revision. All numbers are approximate.
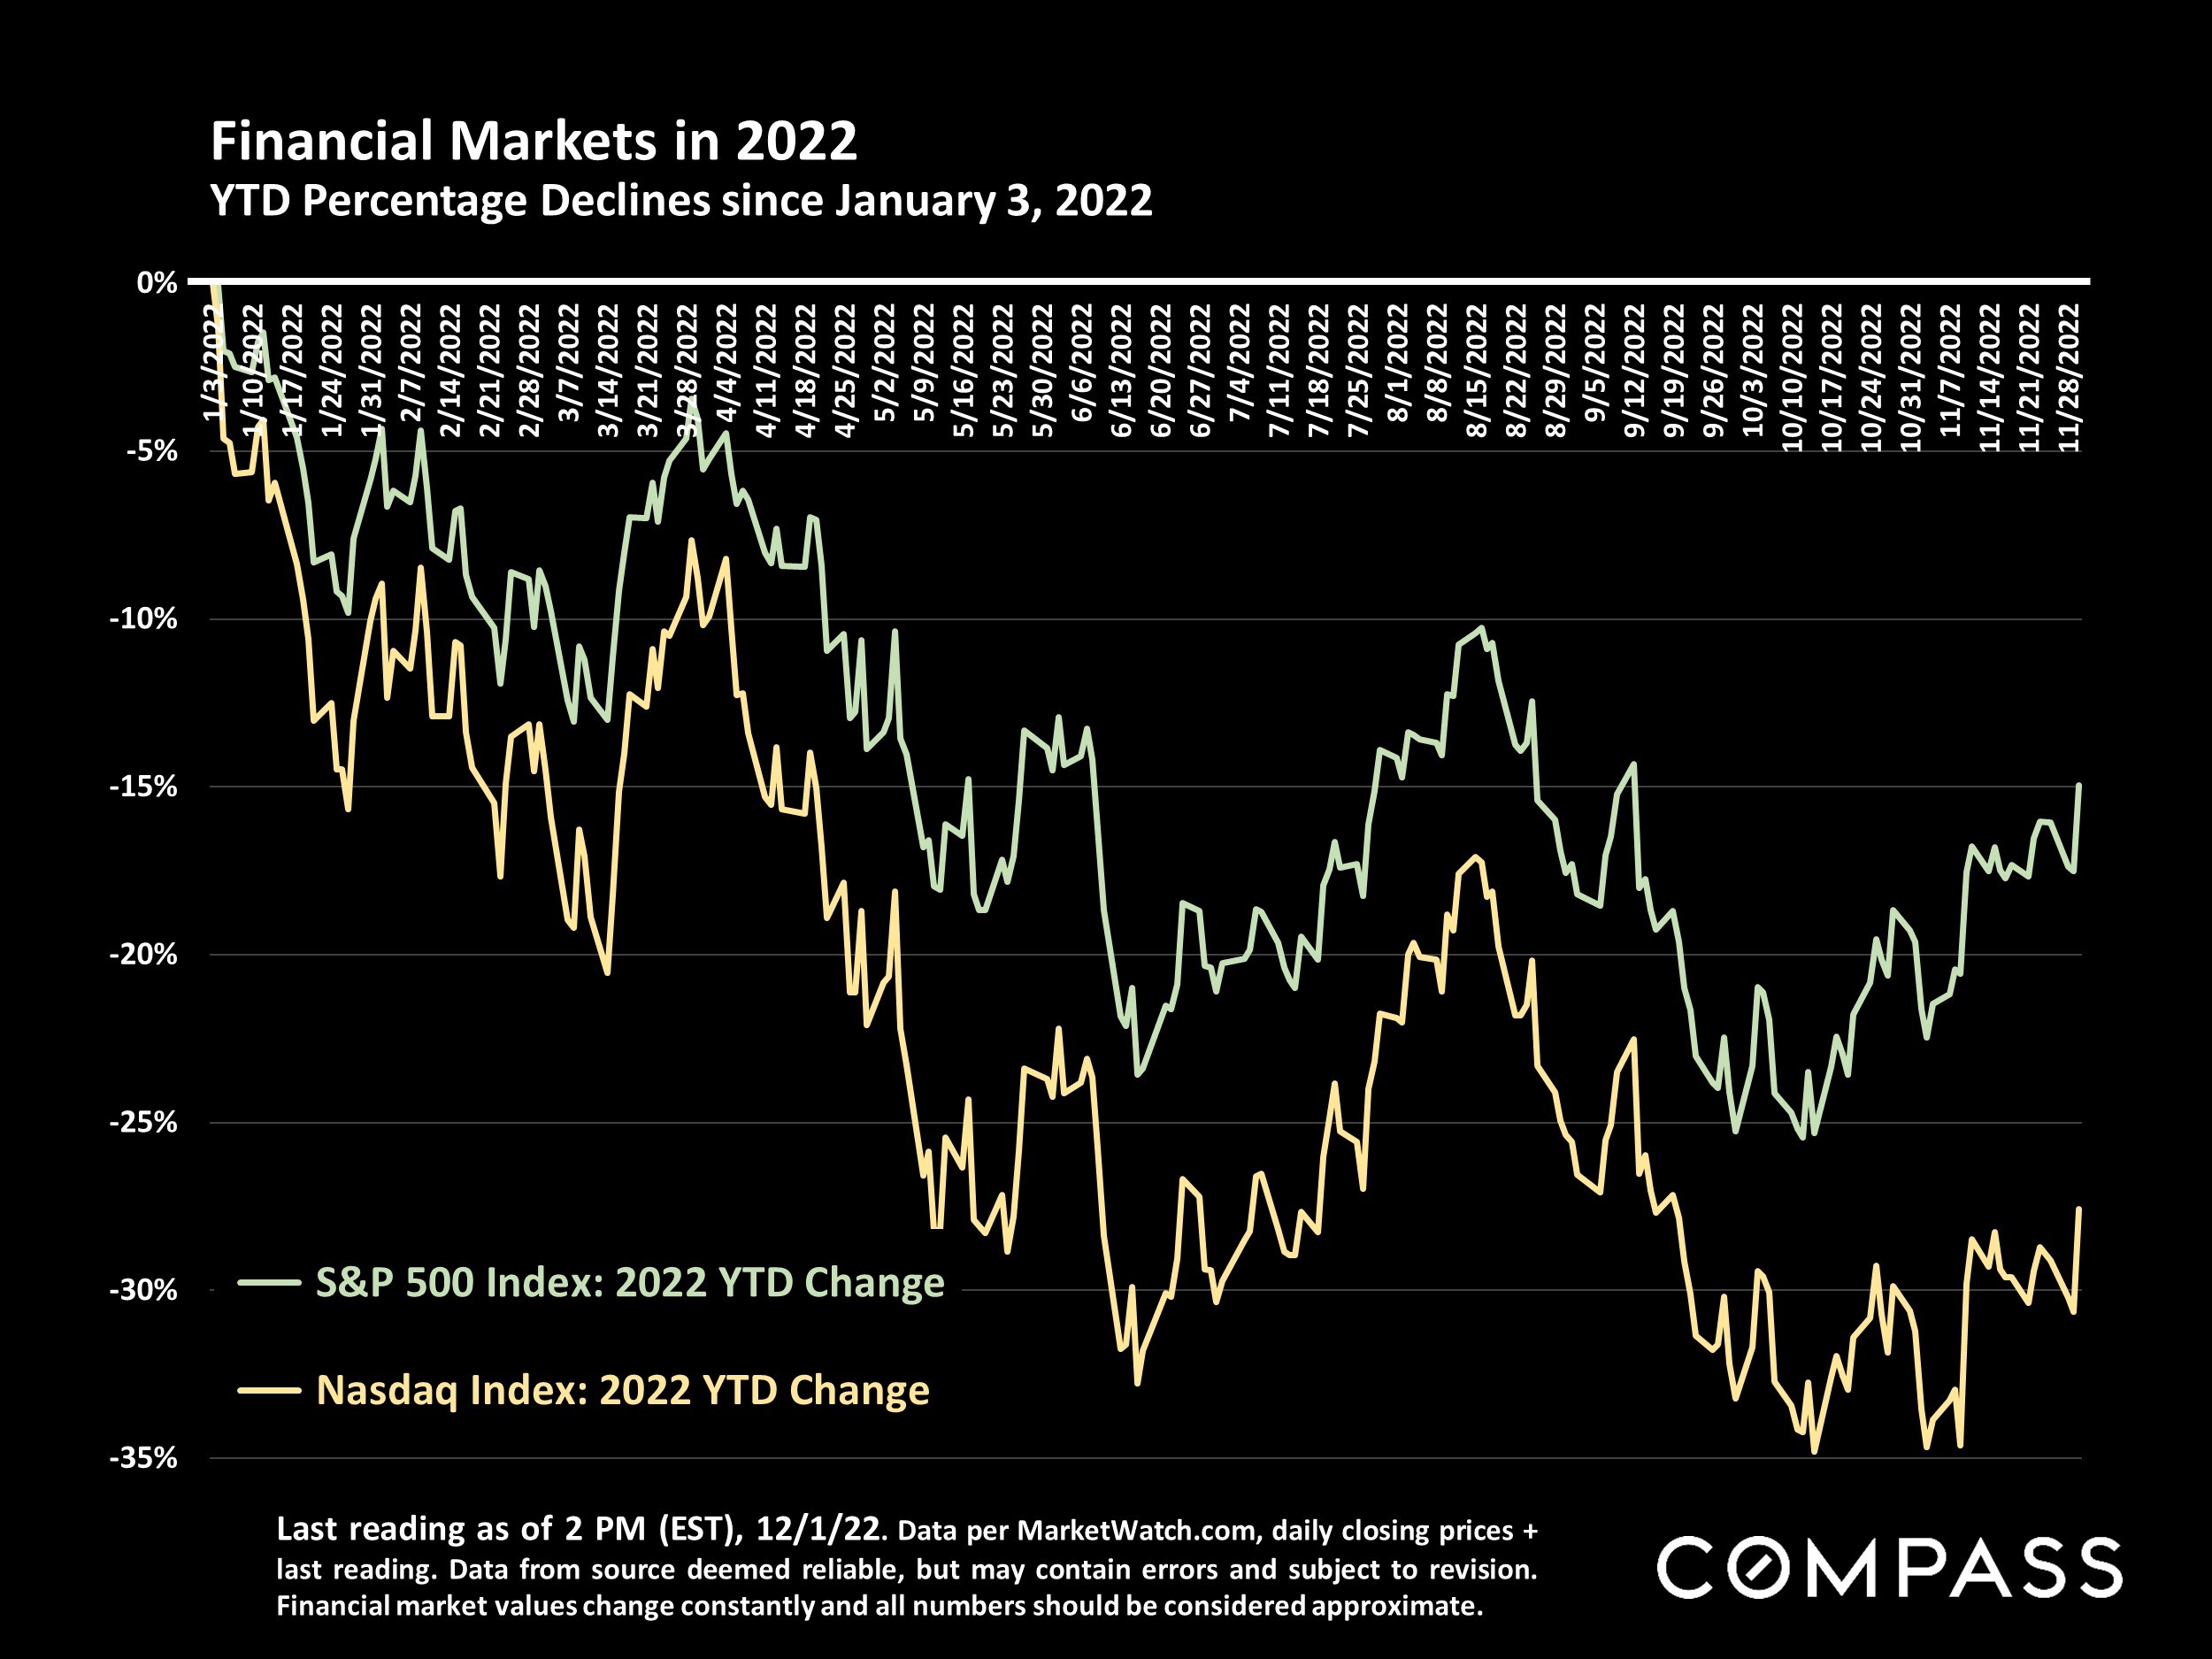
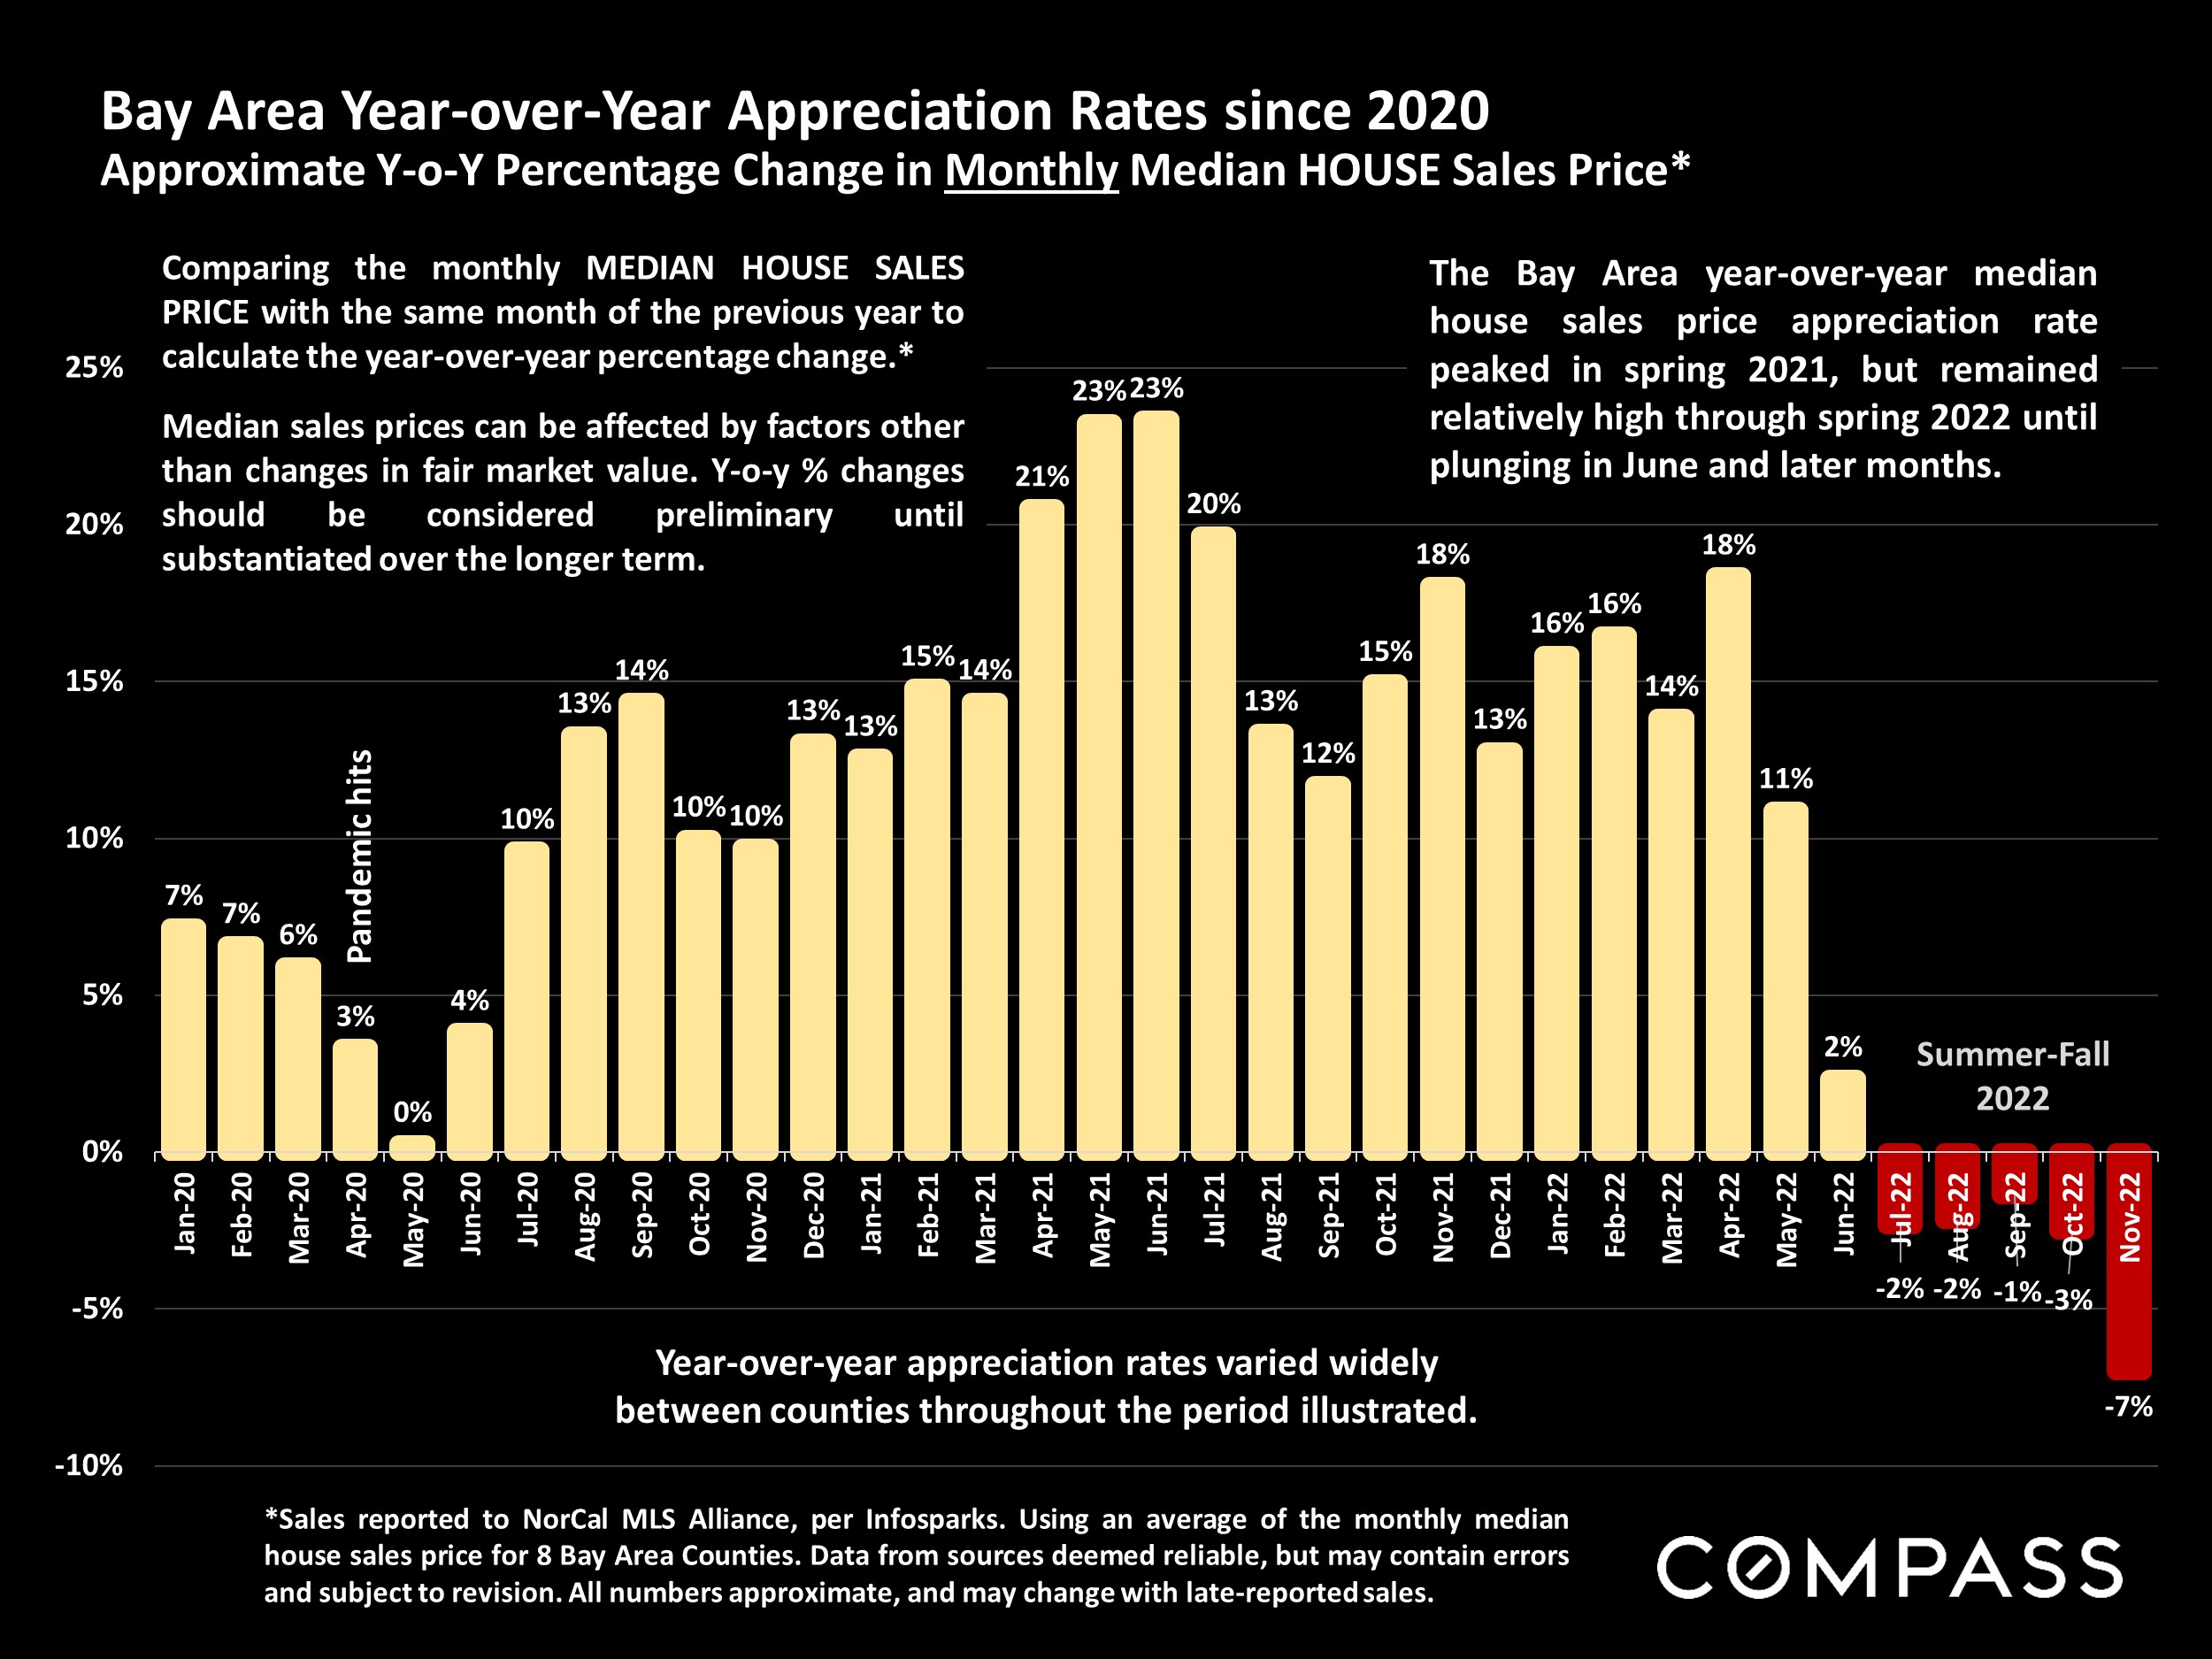
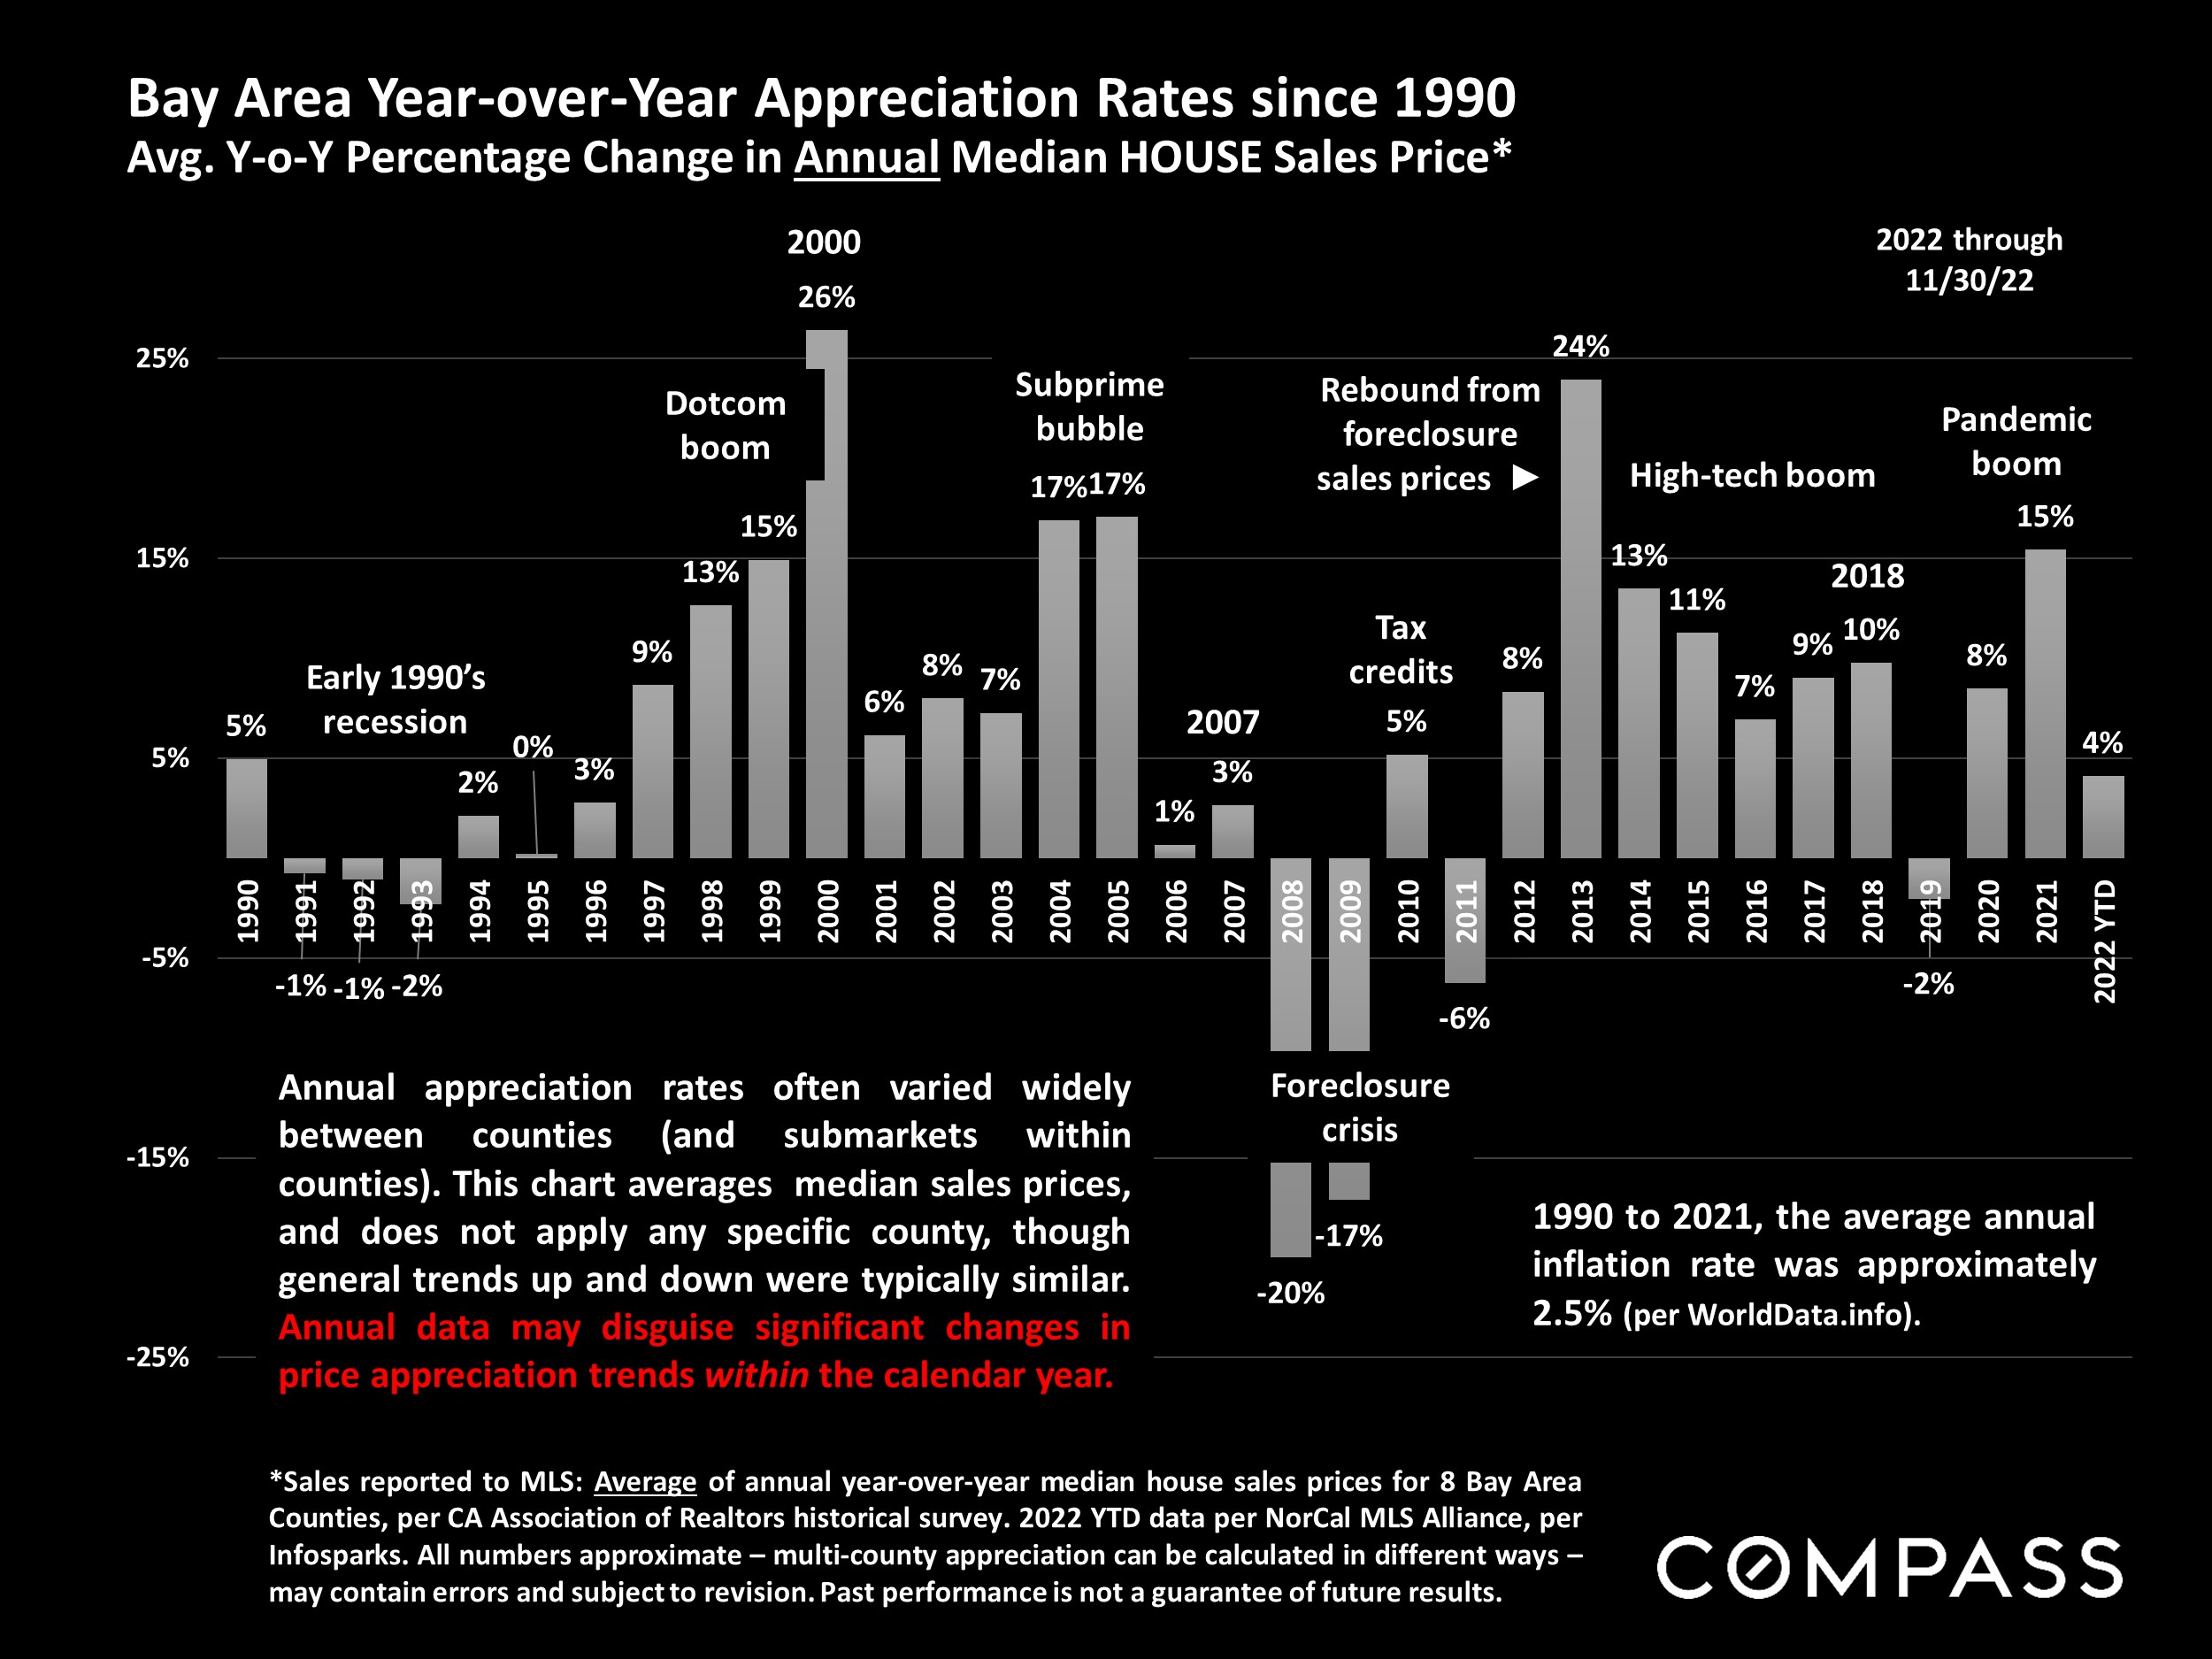
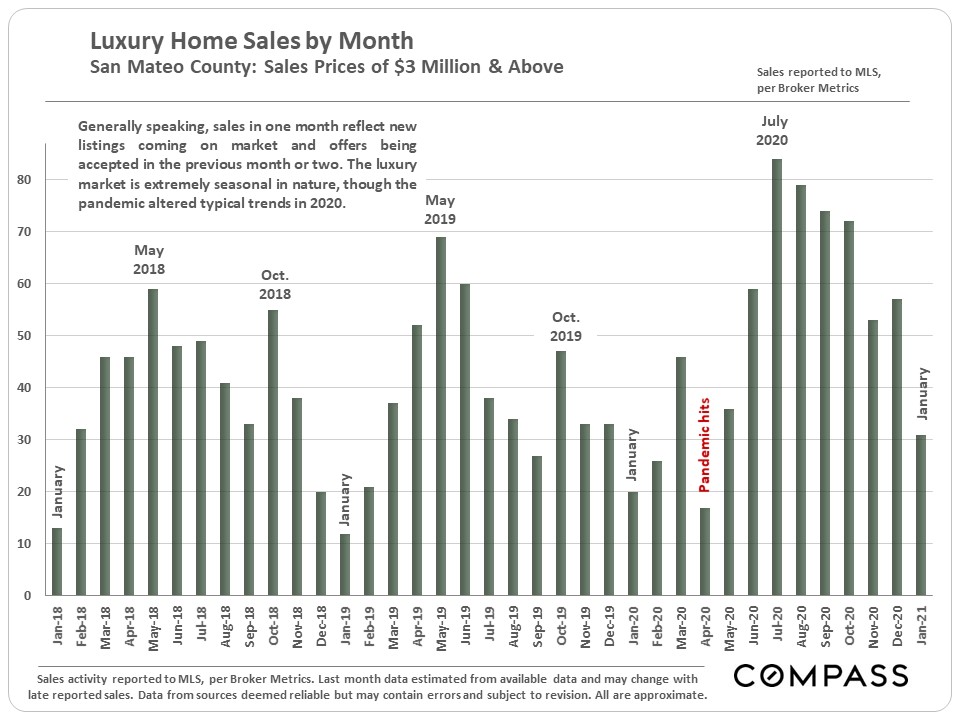
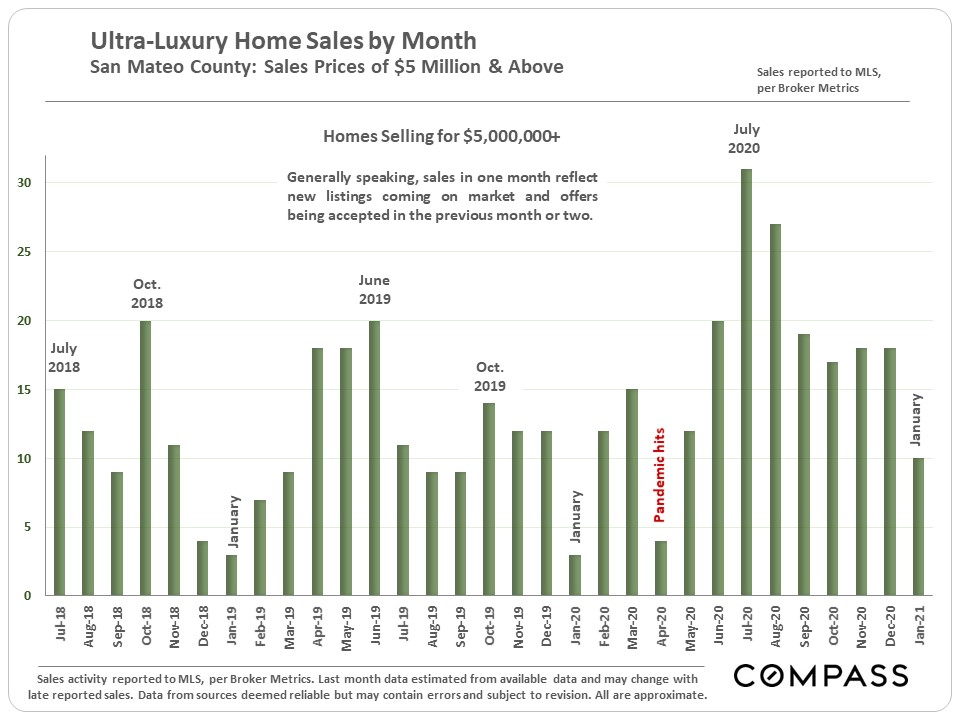
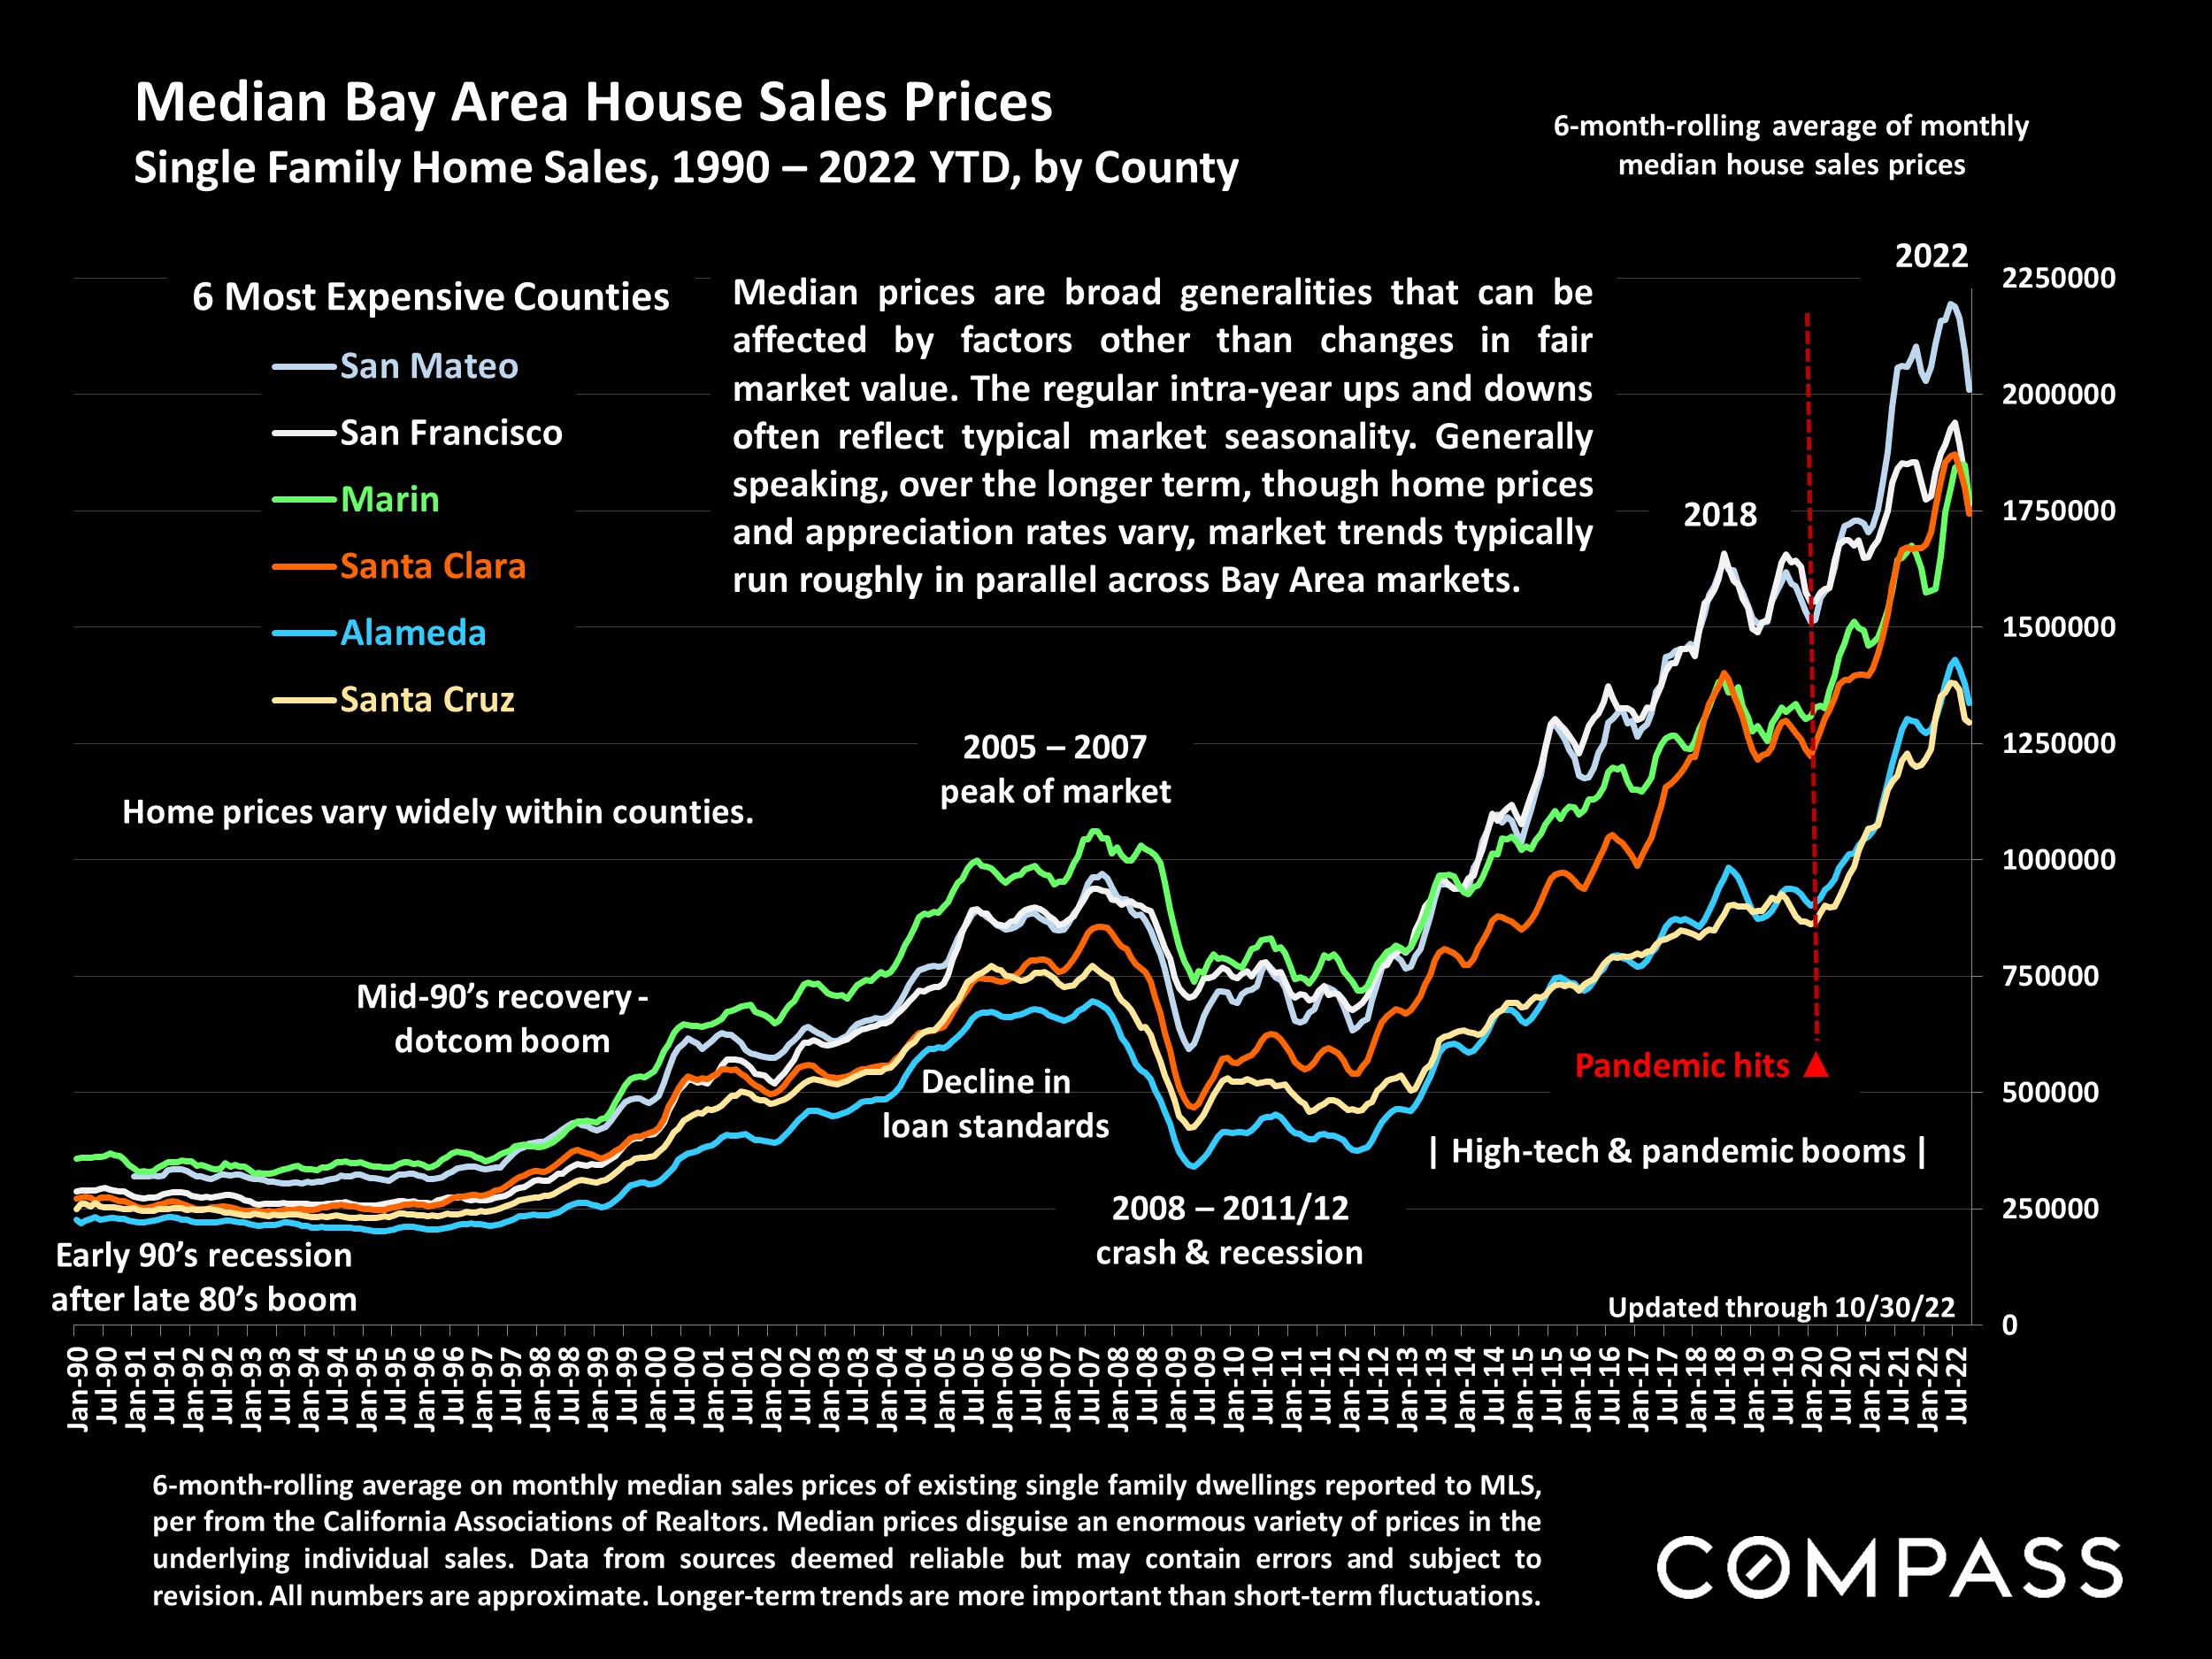
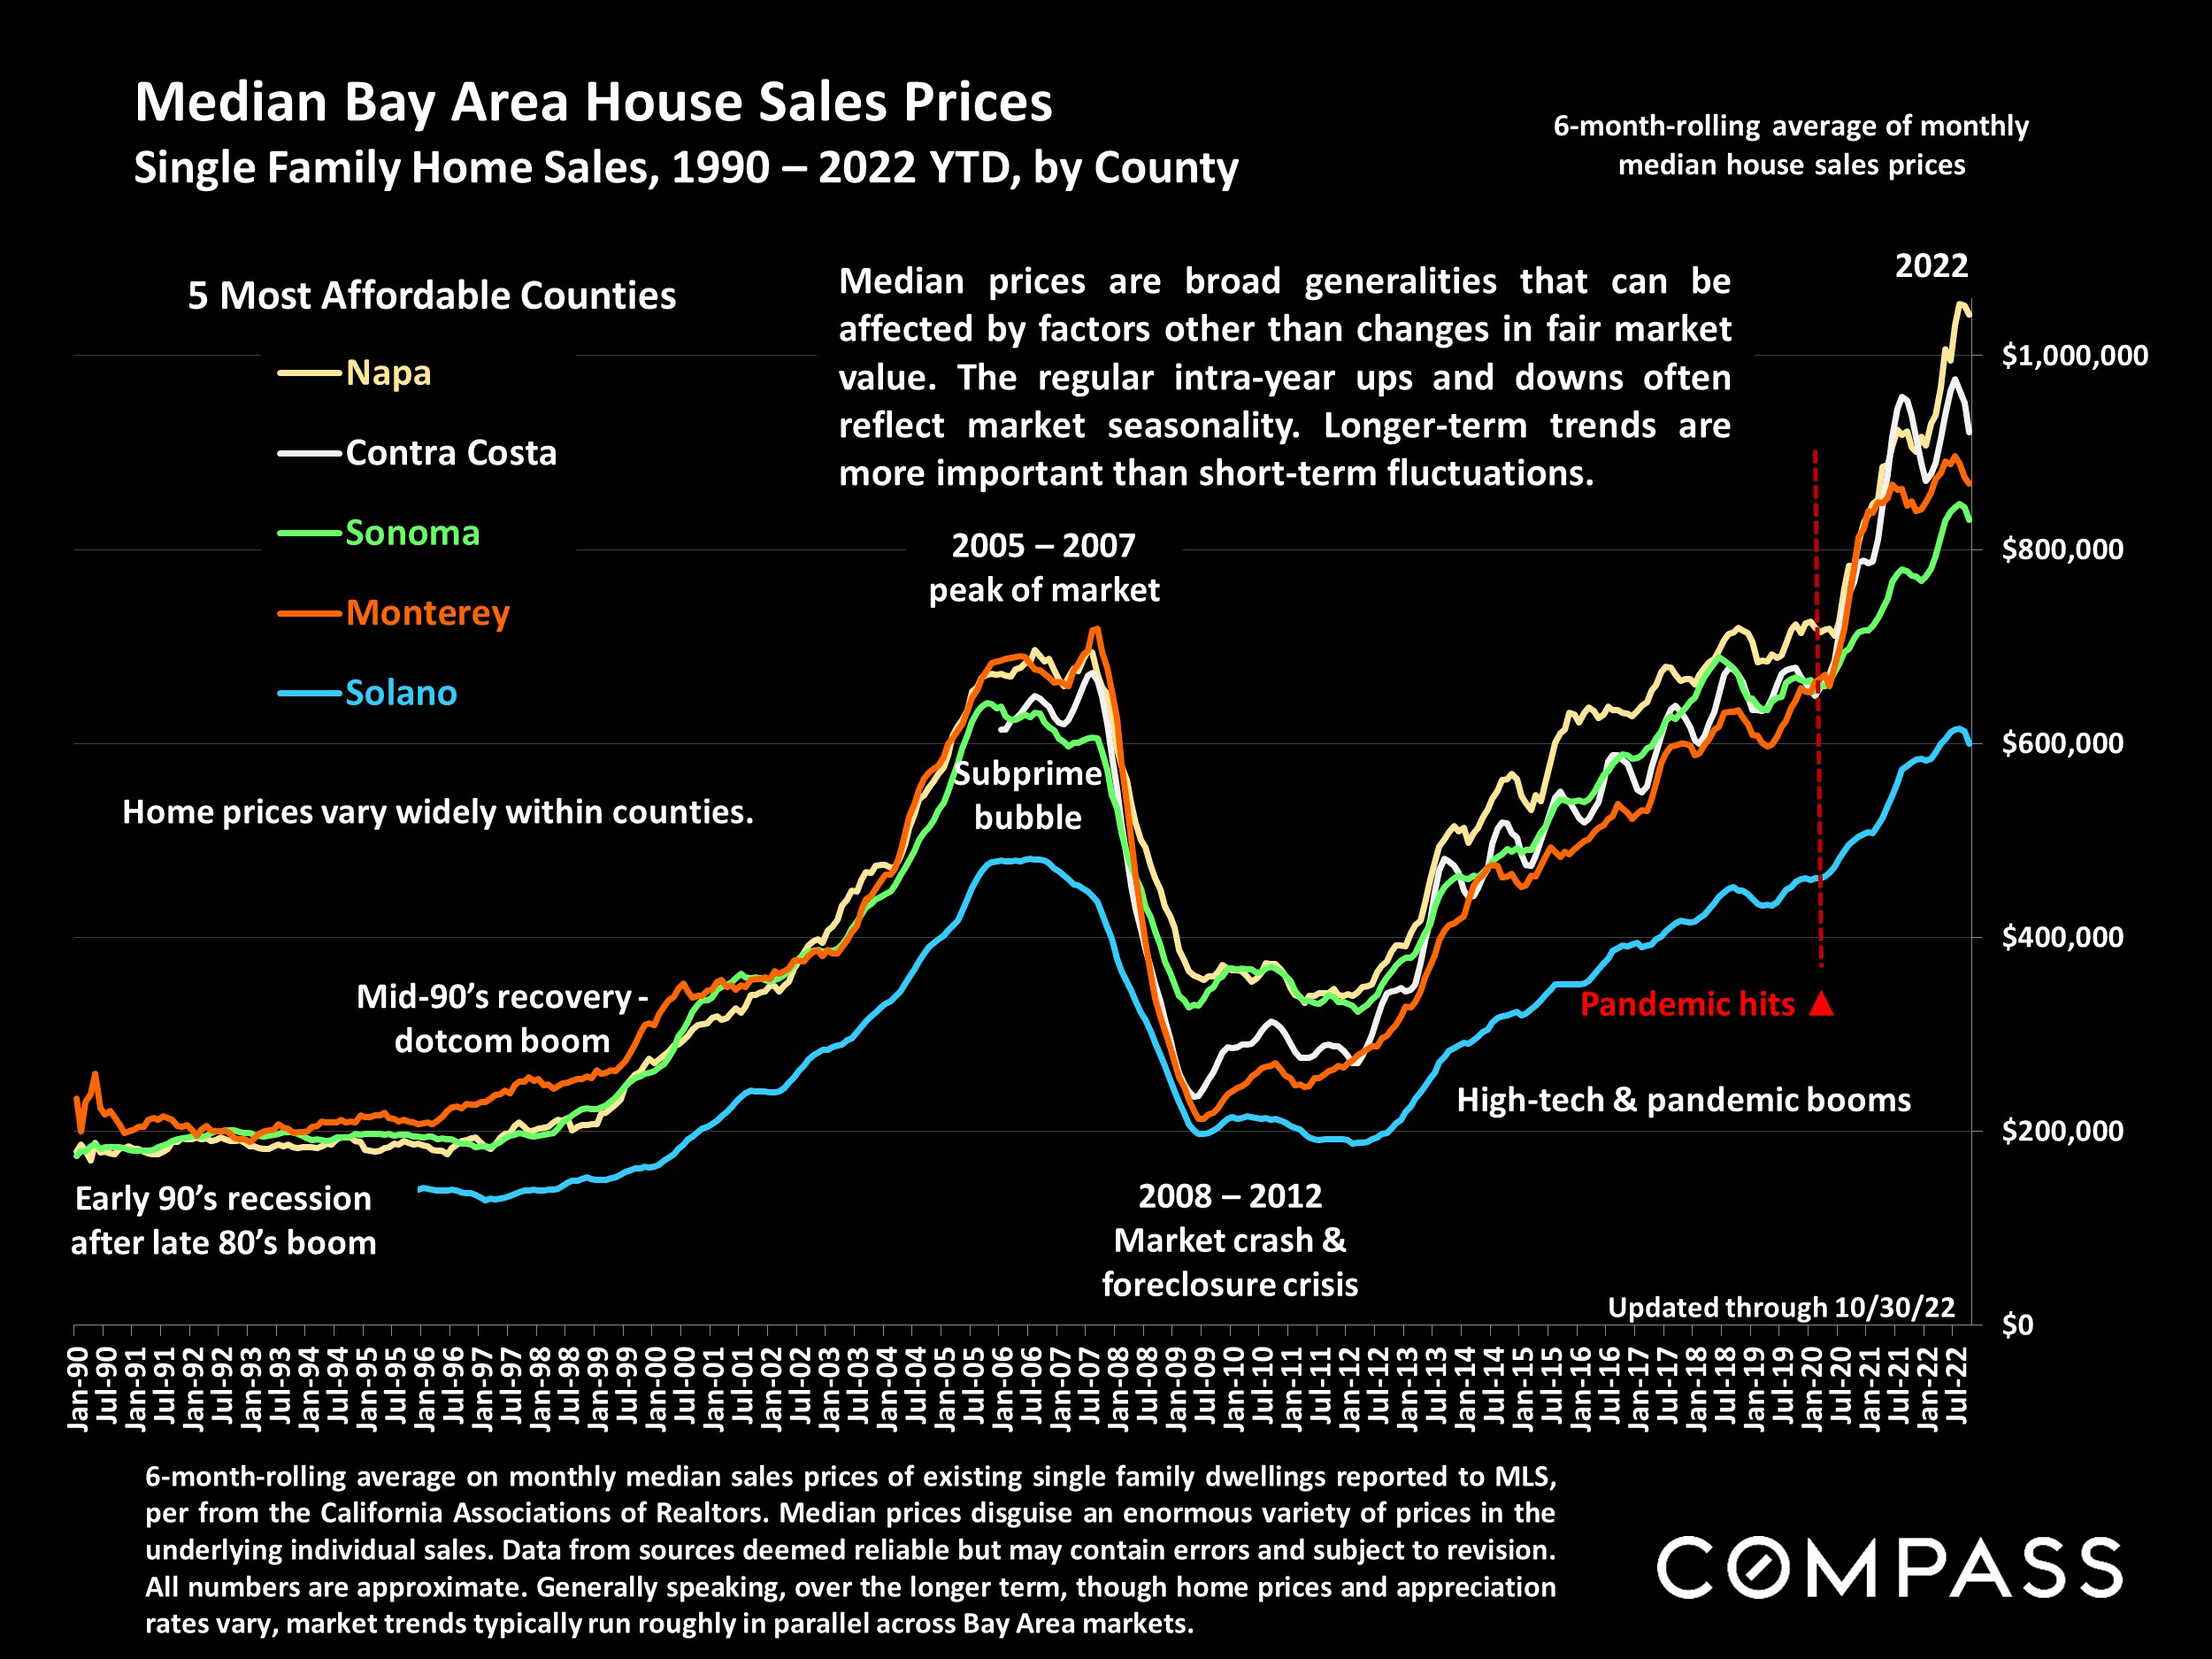
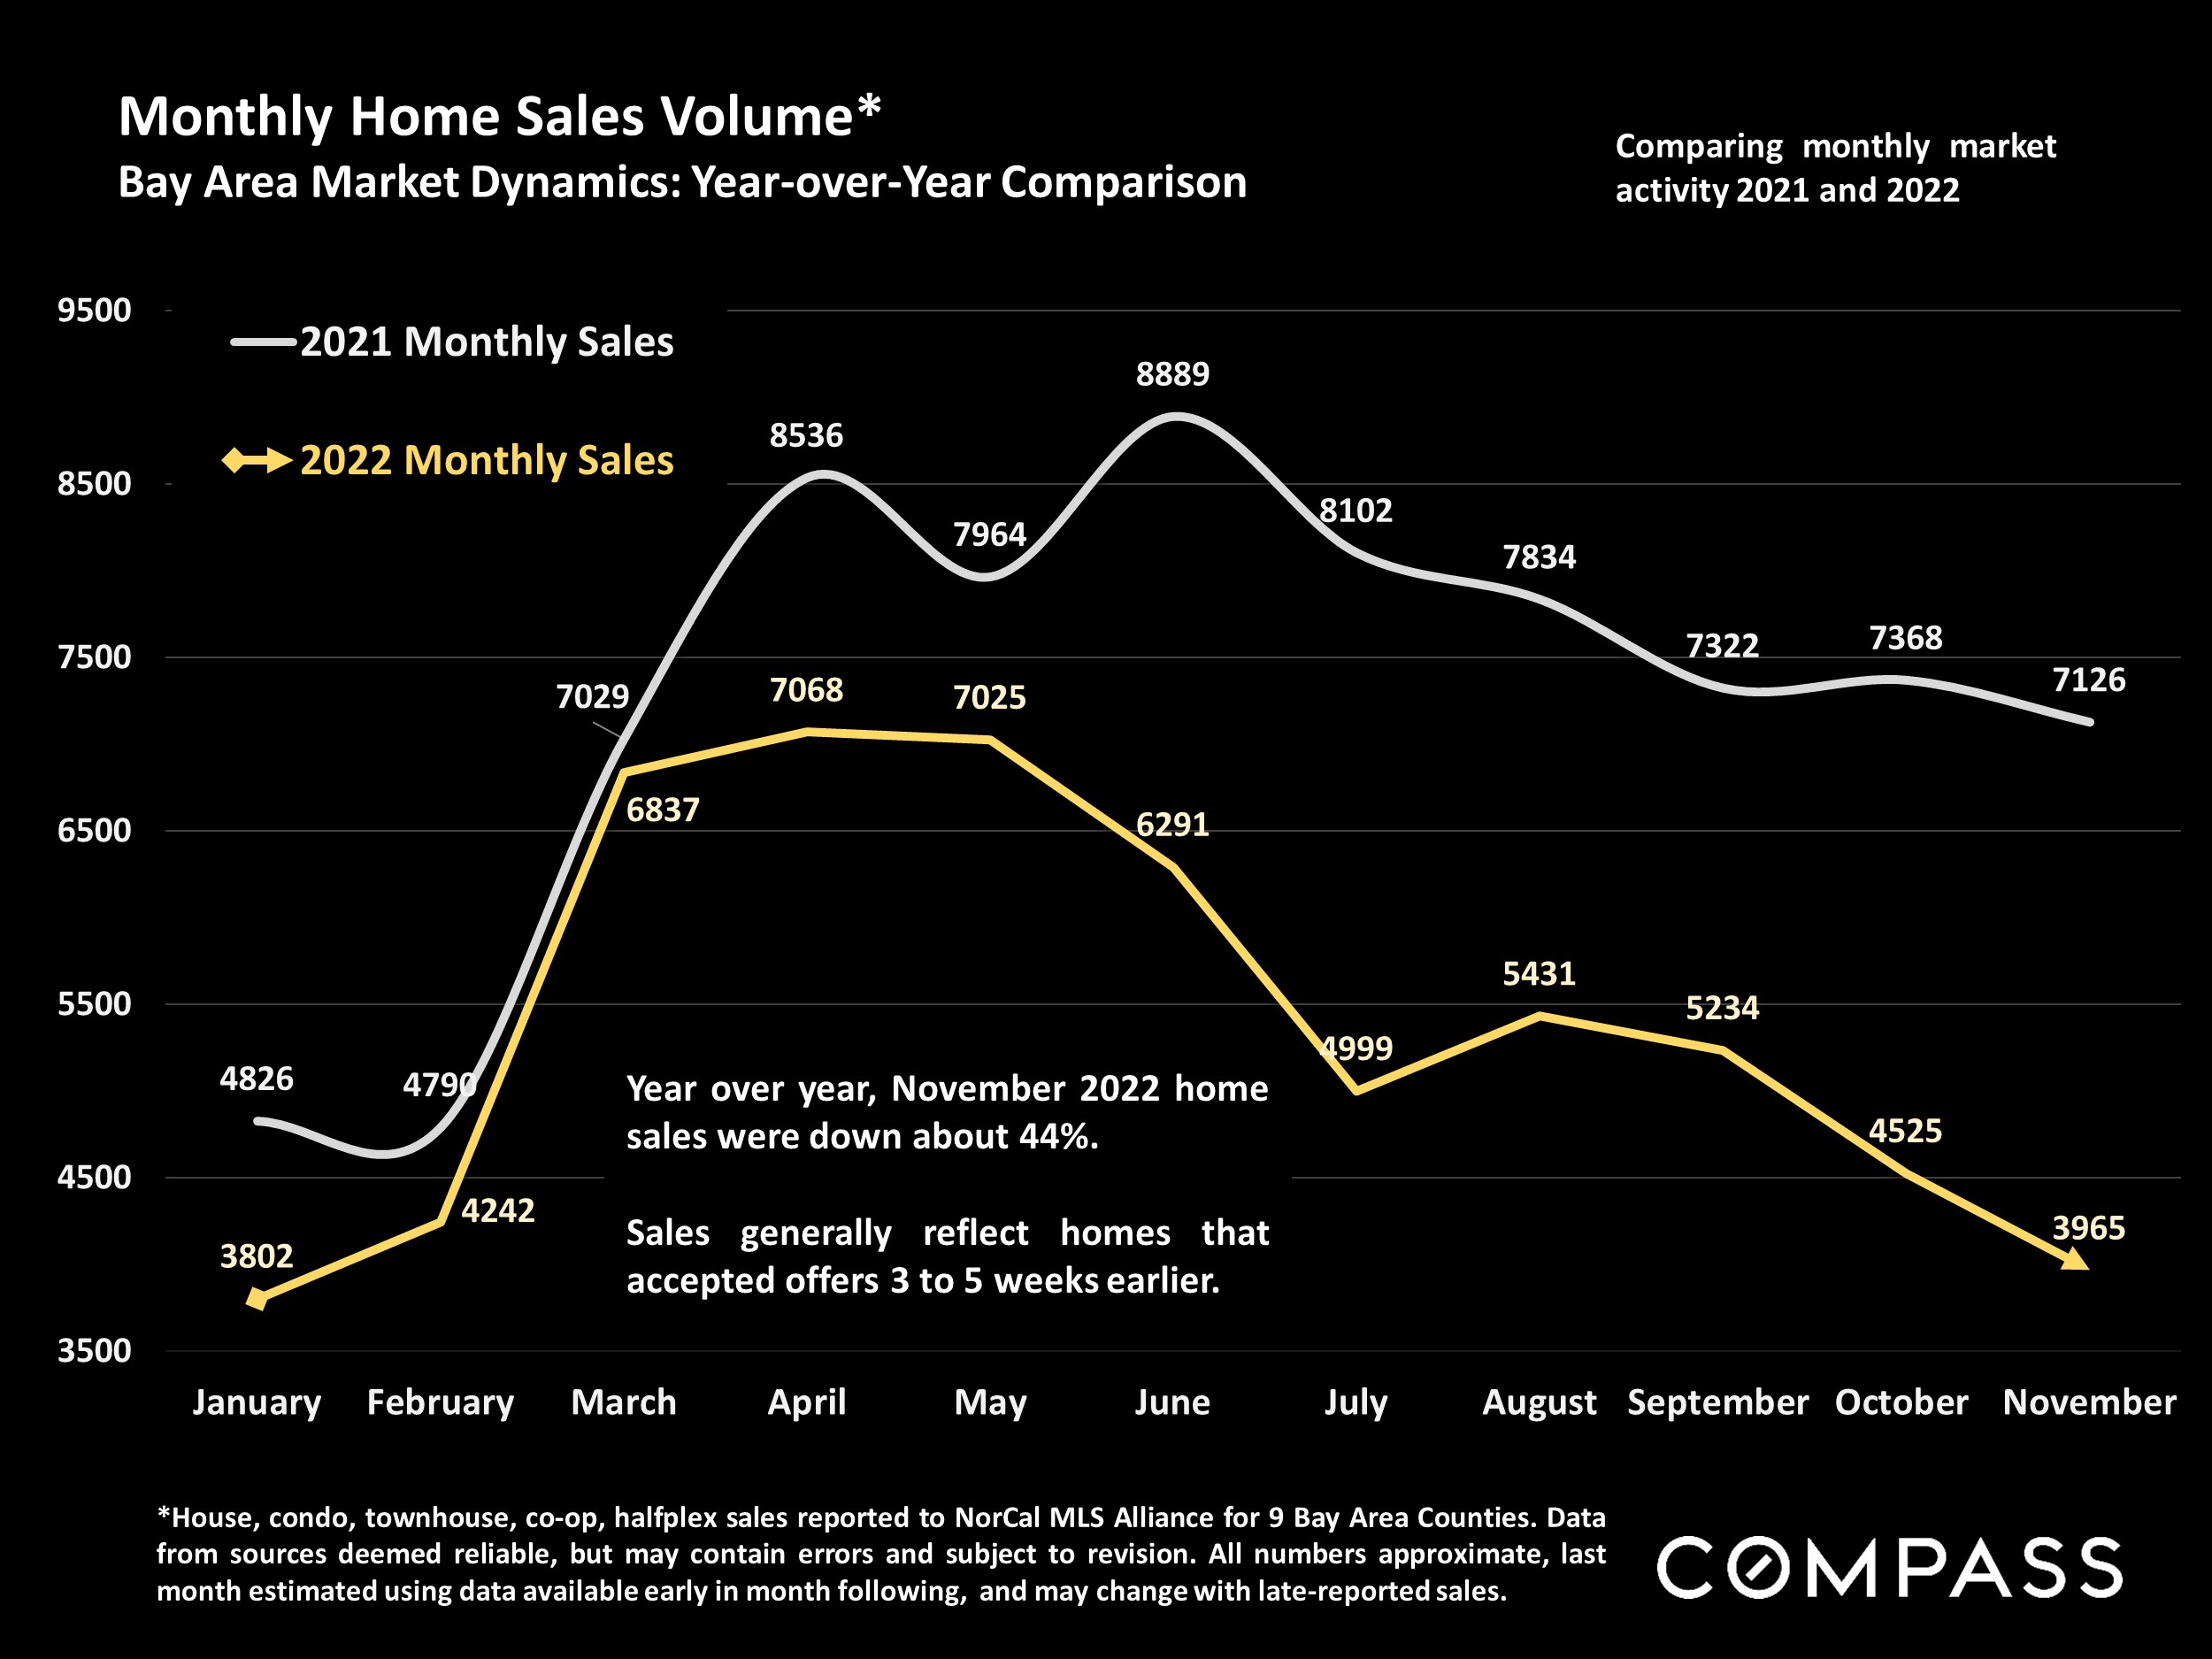
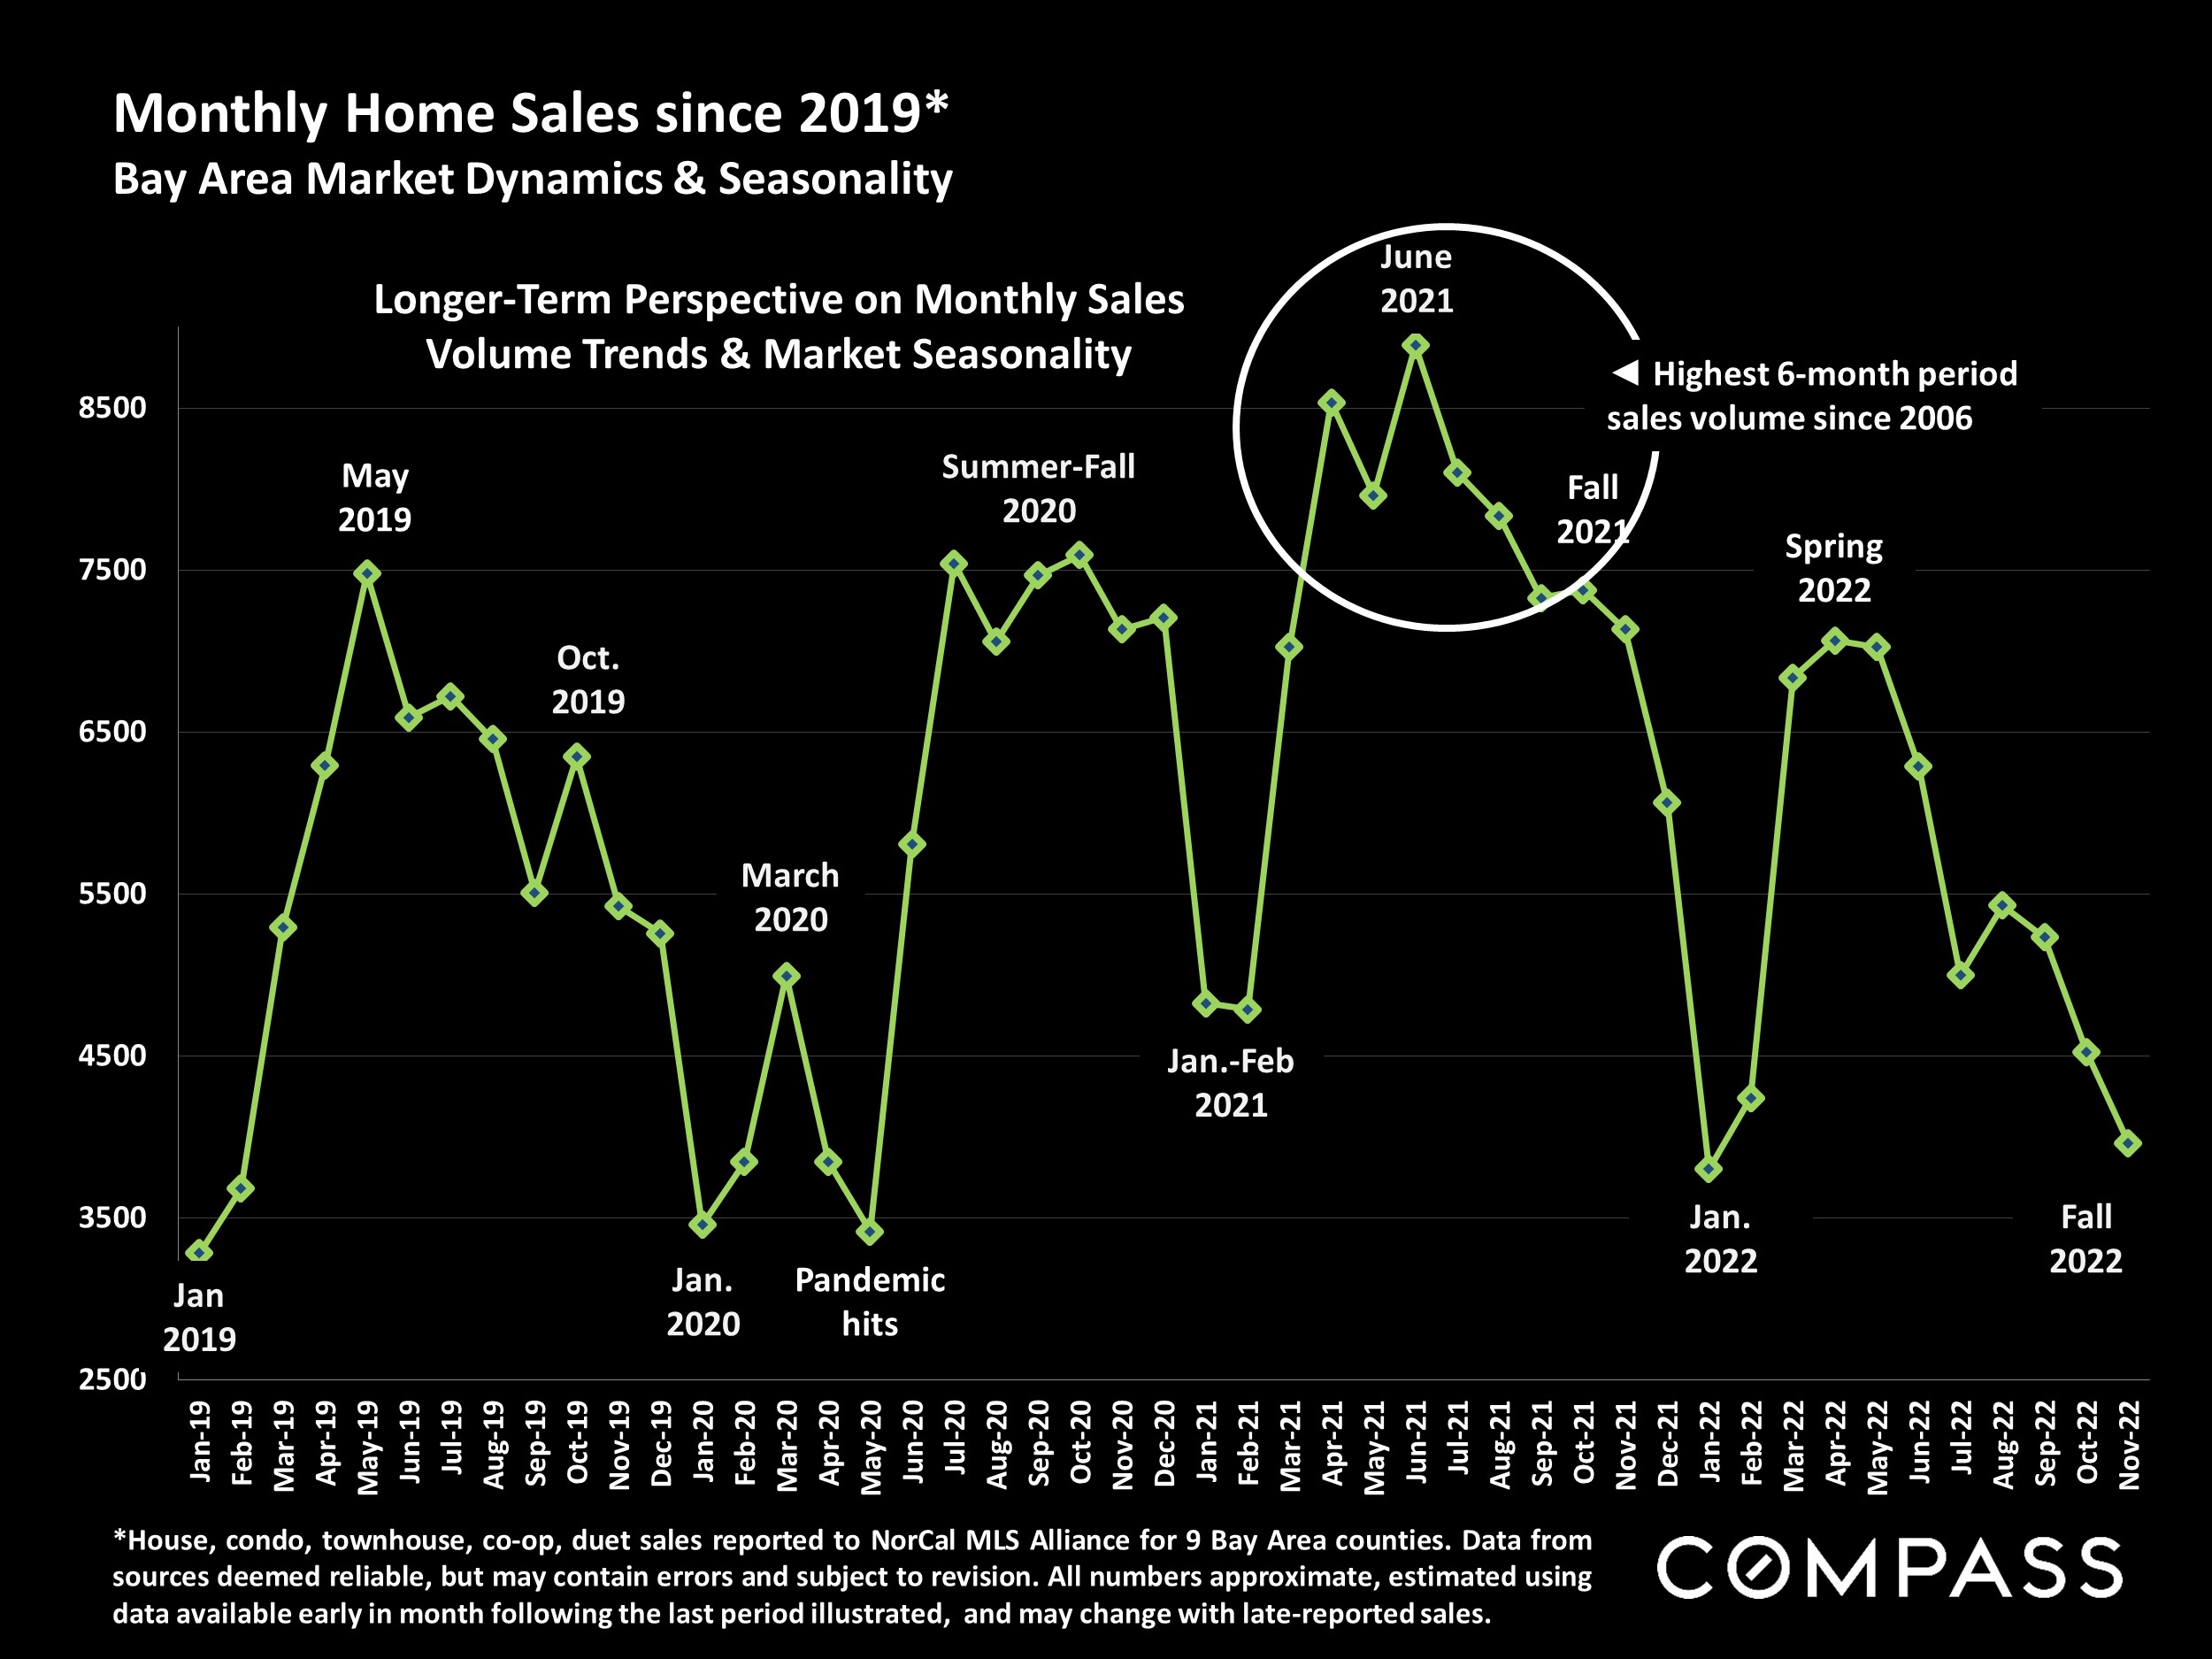
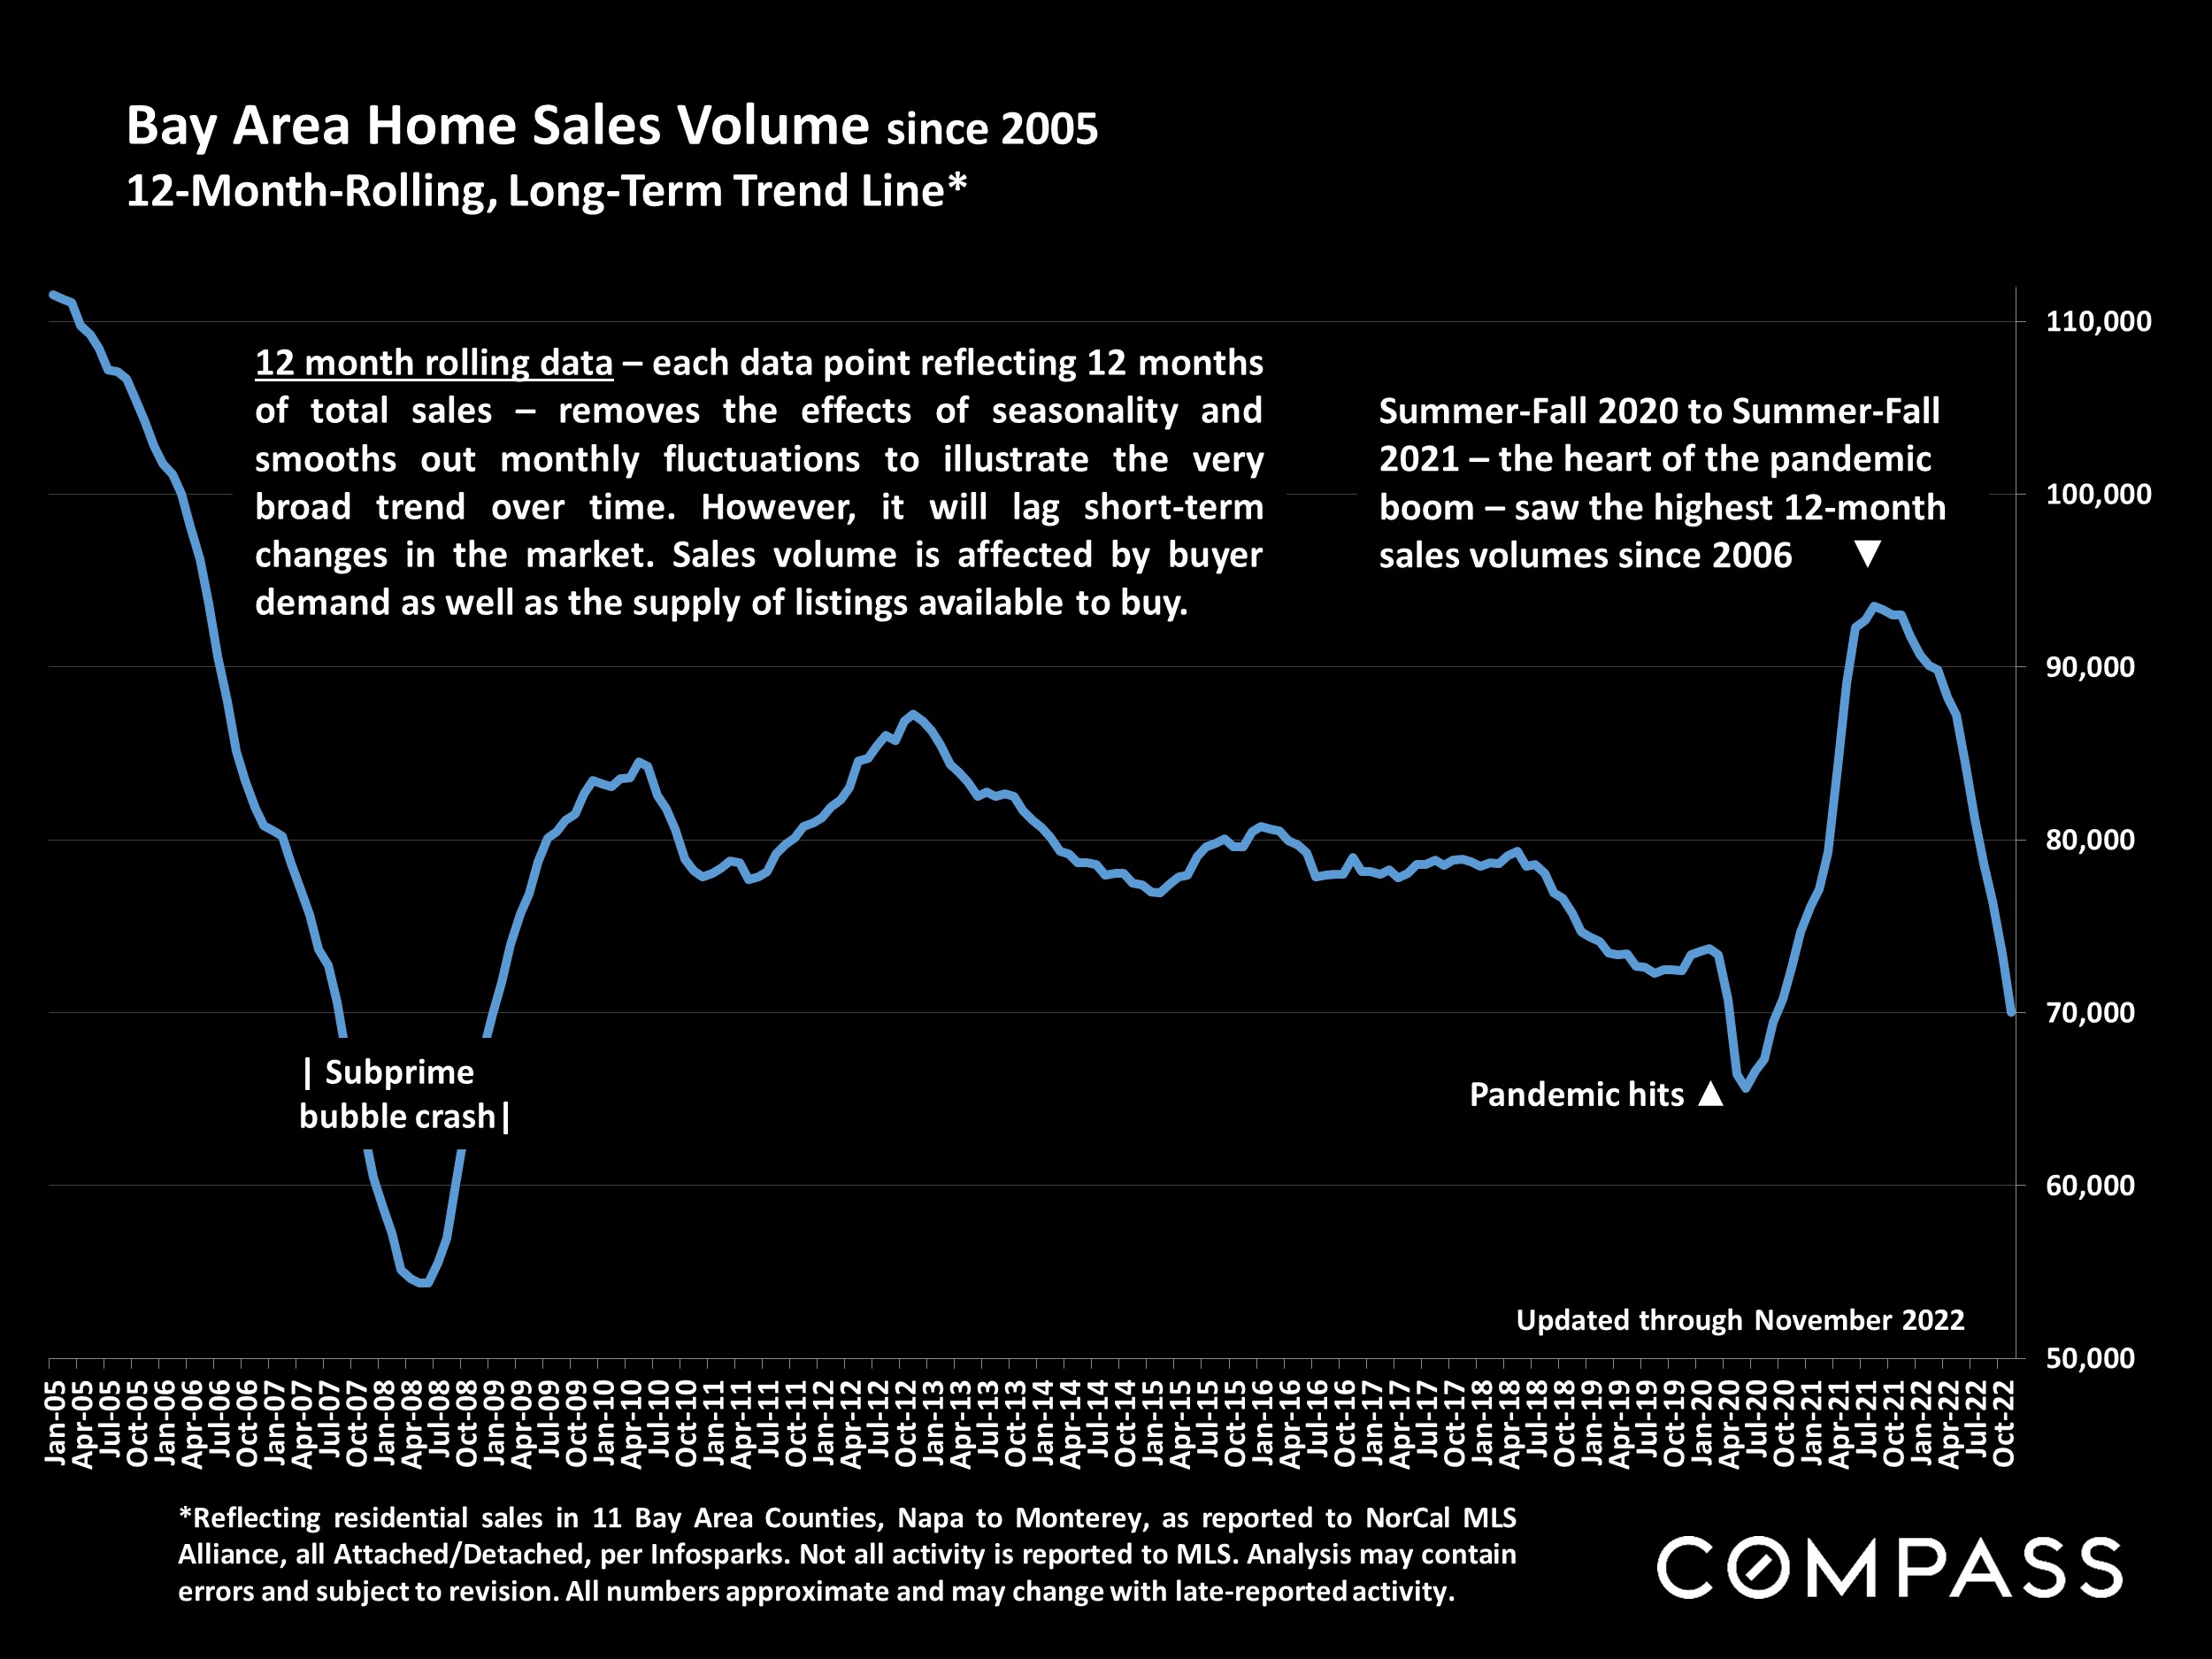
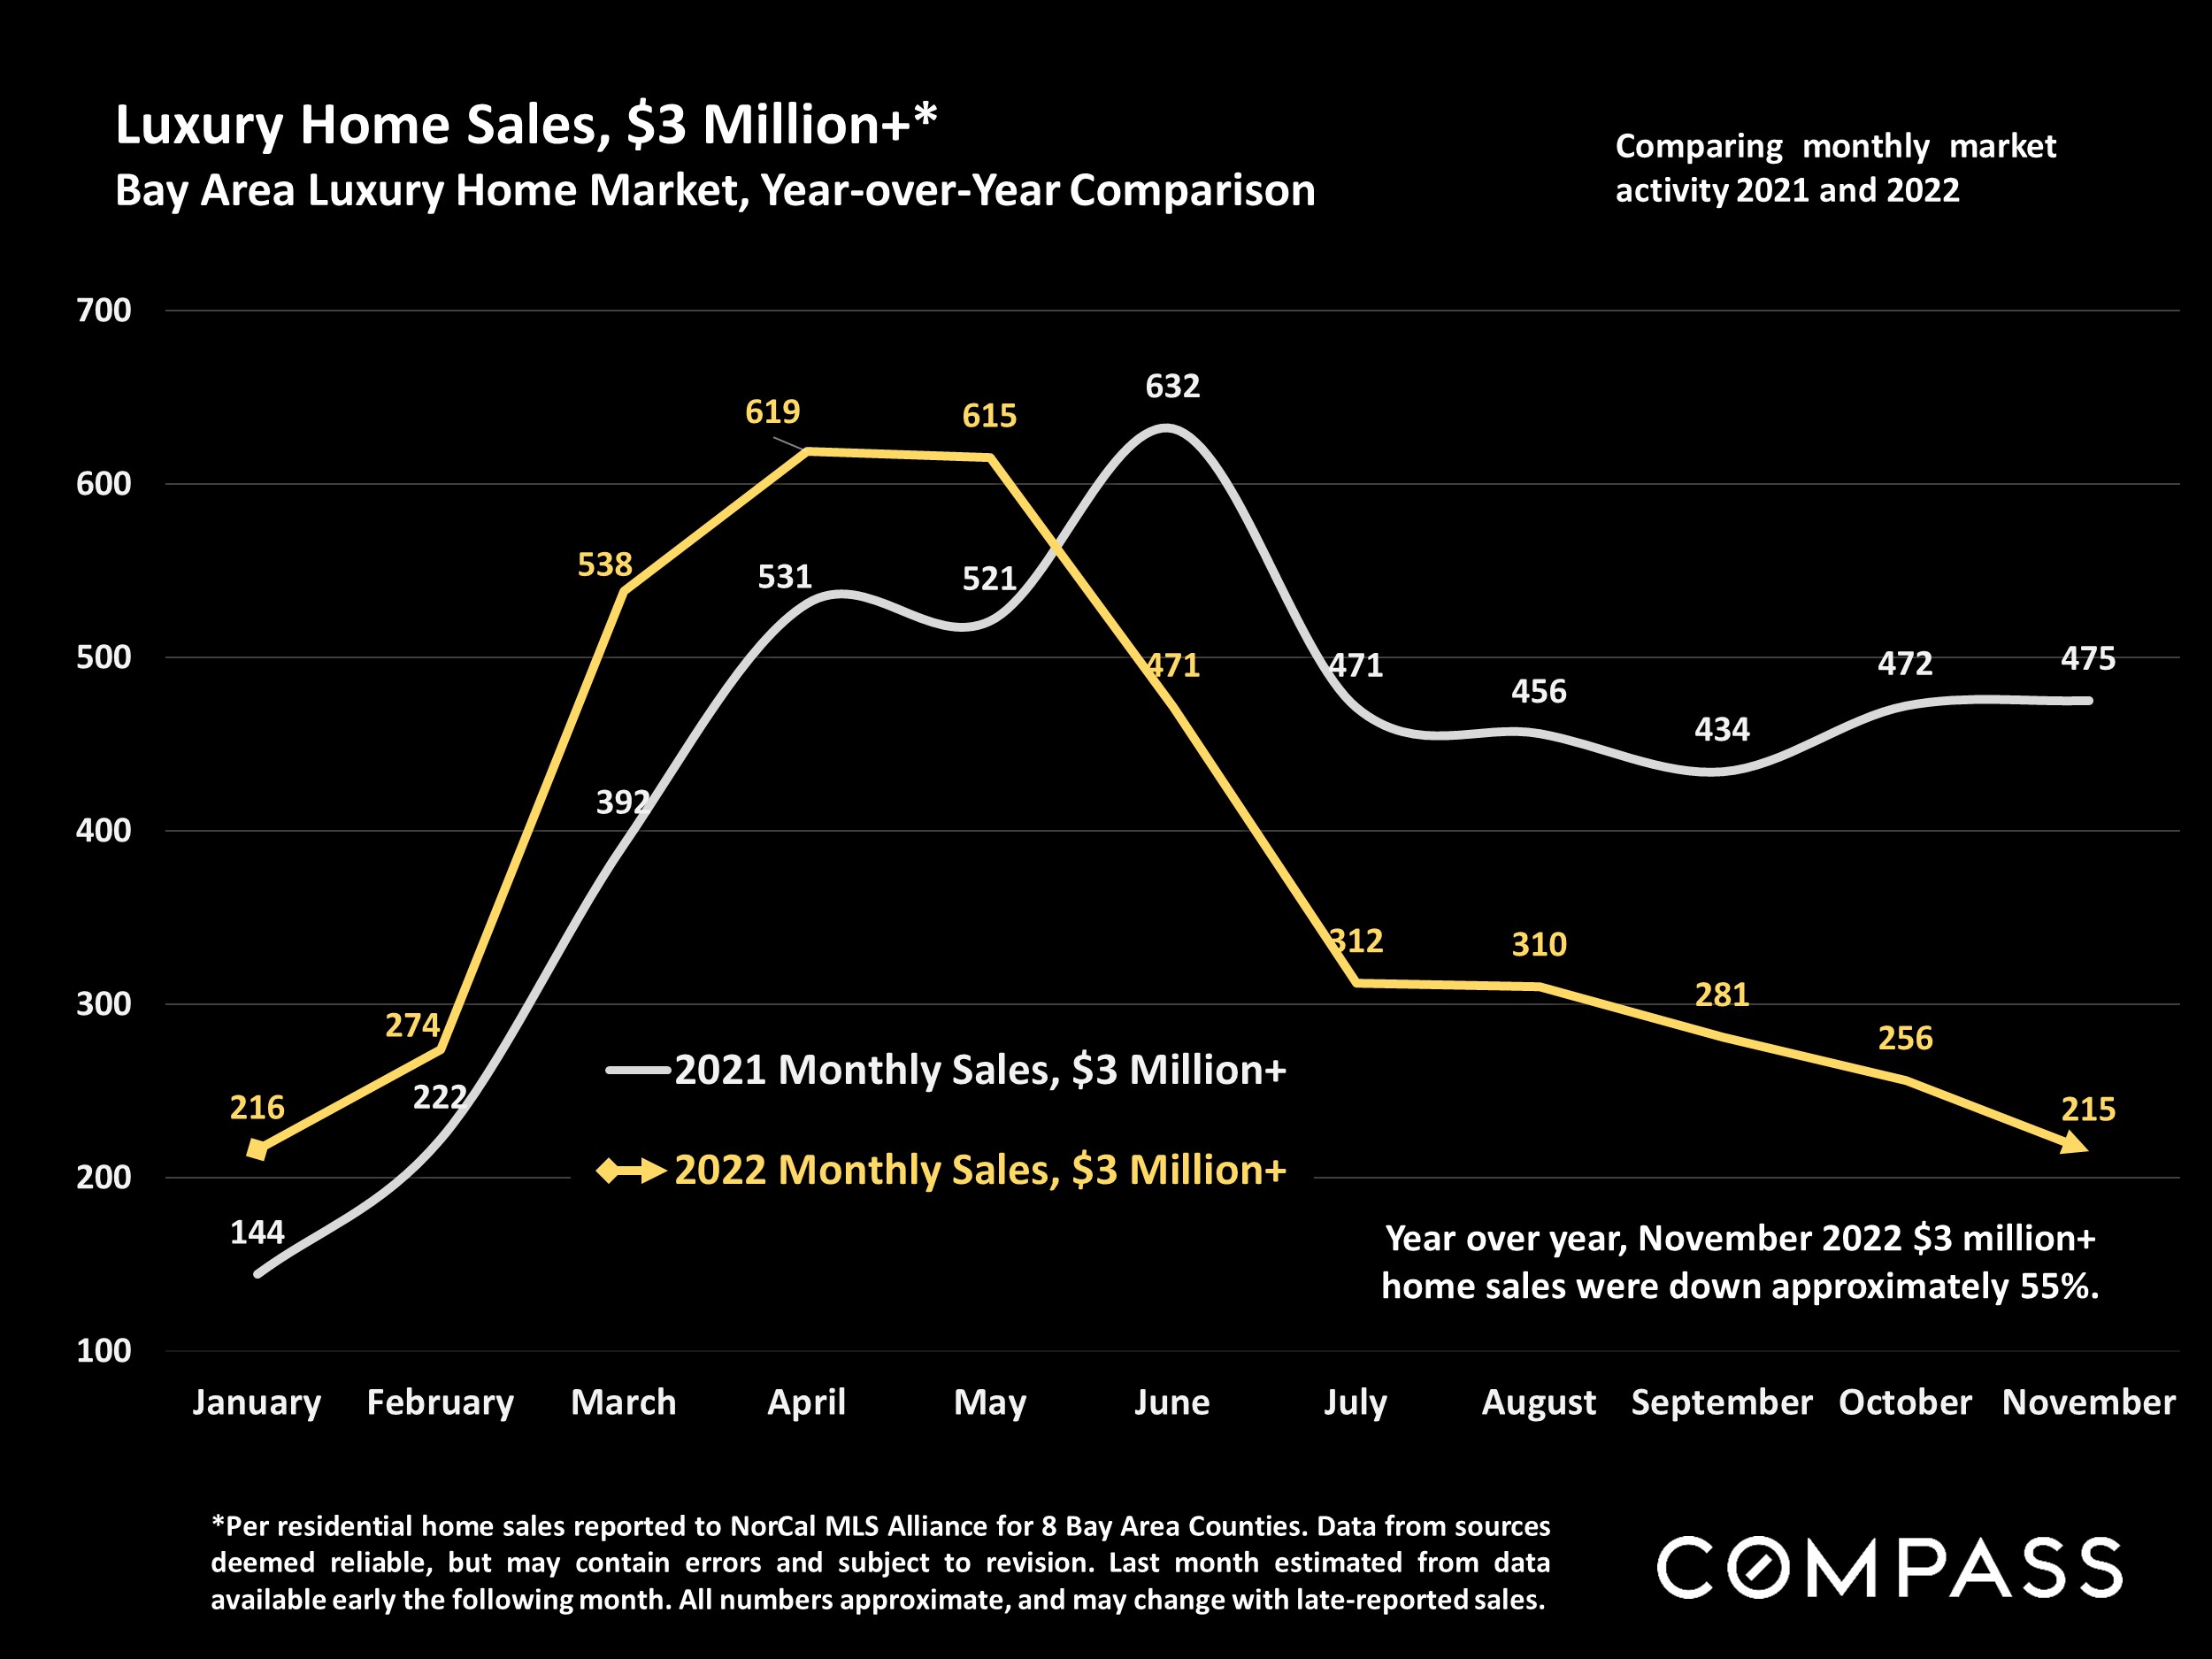
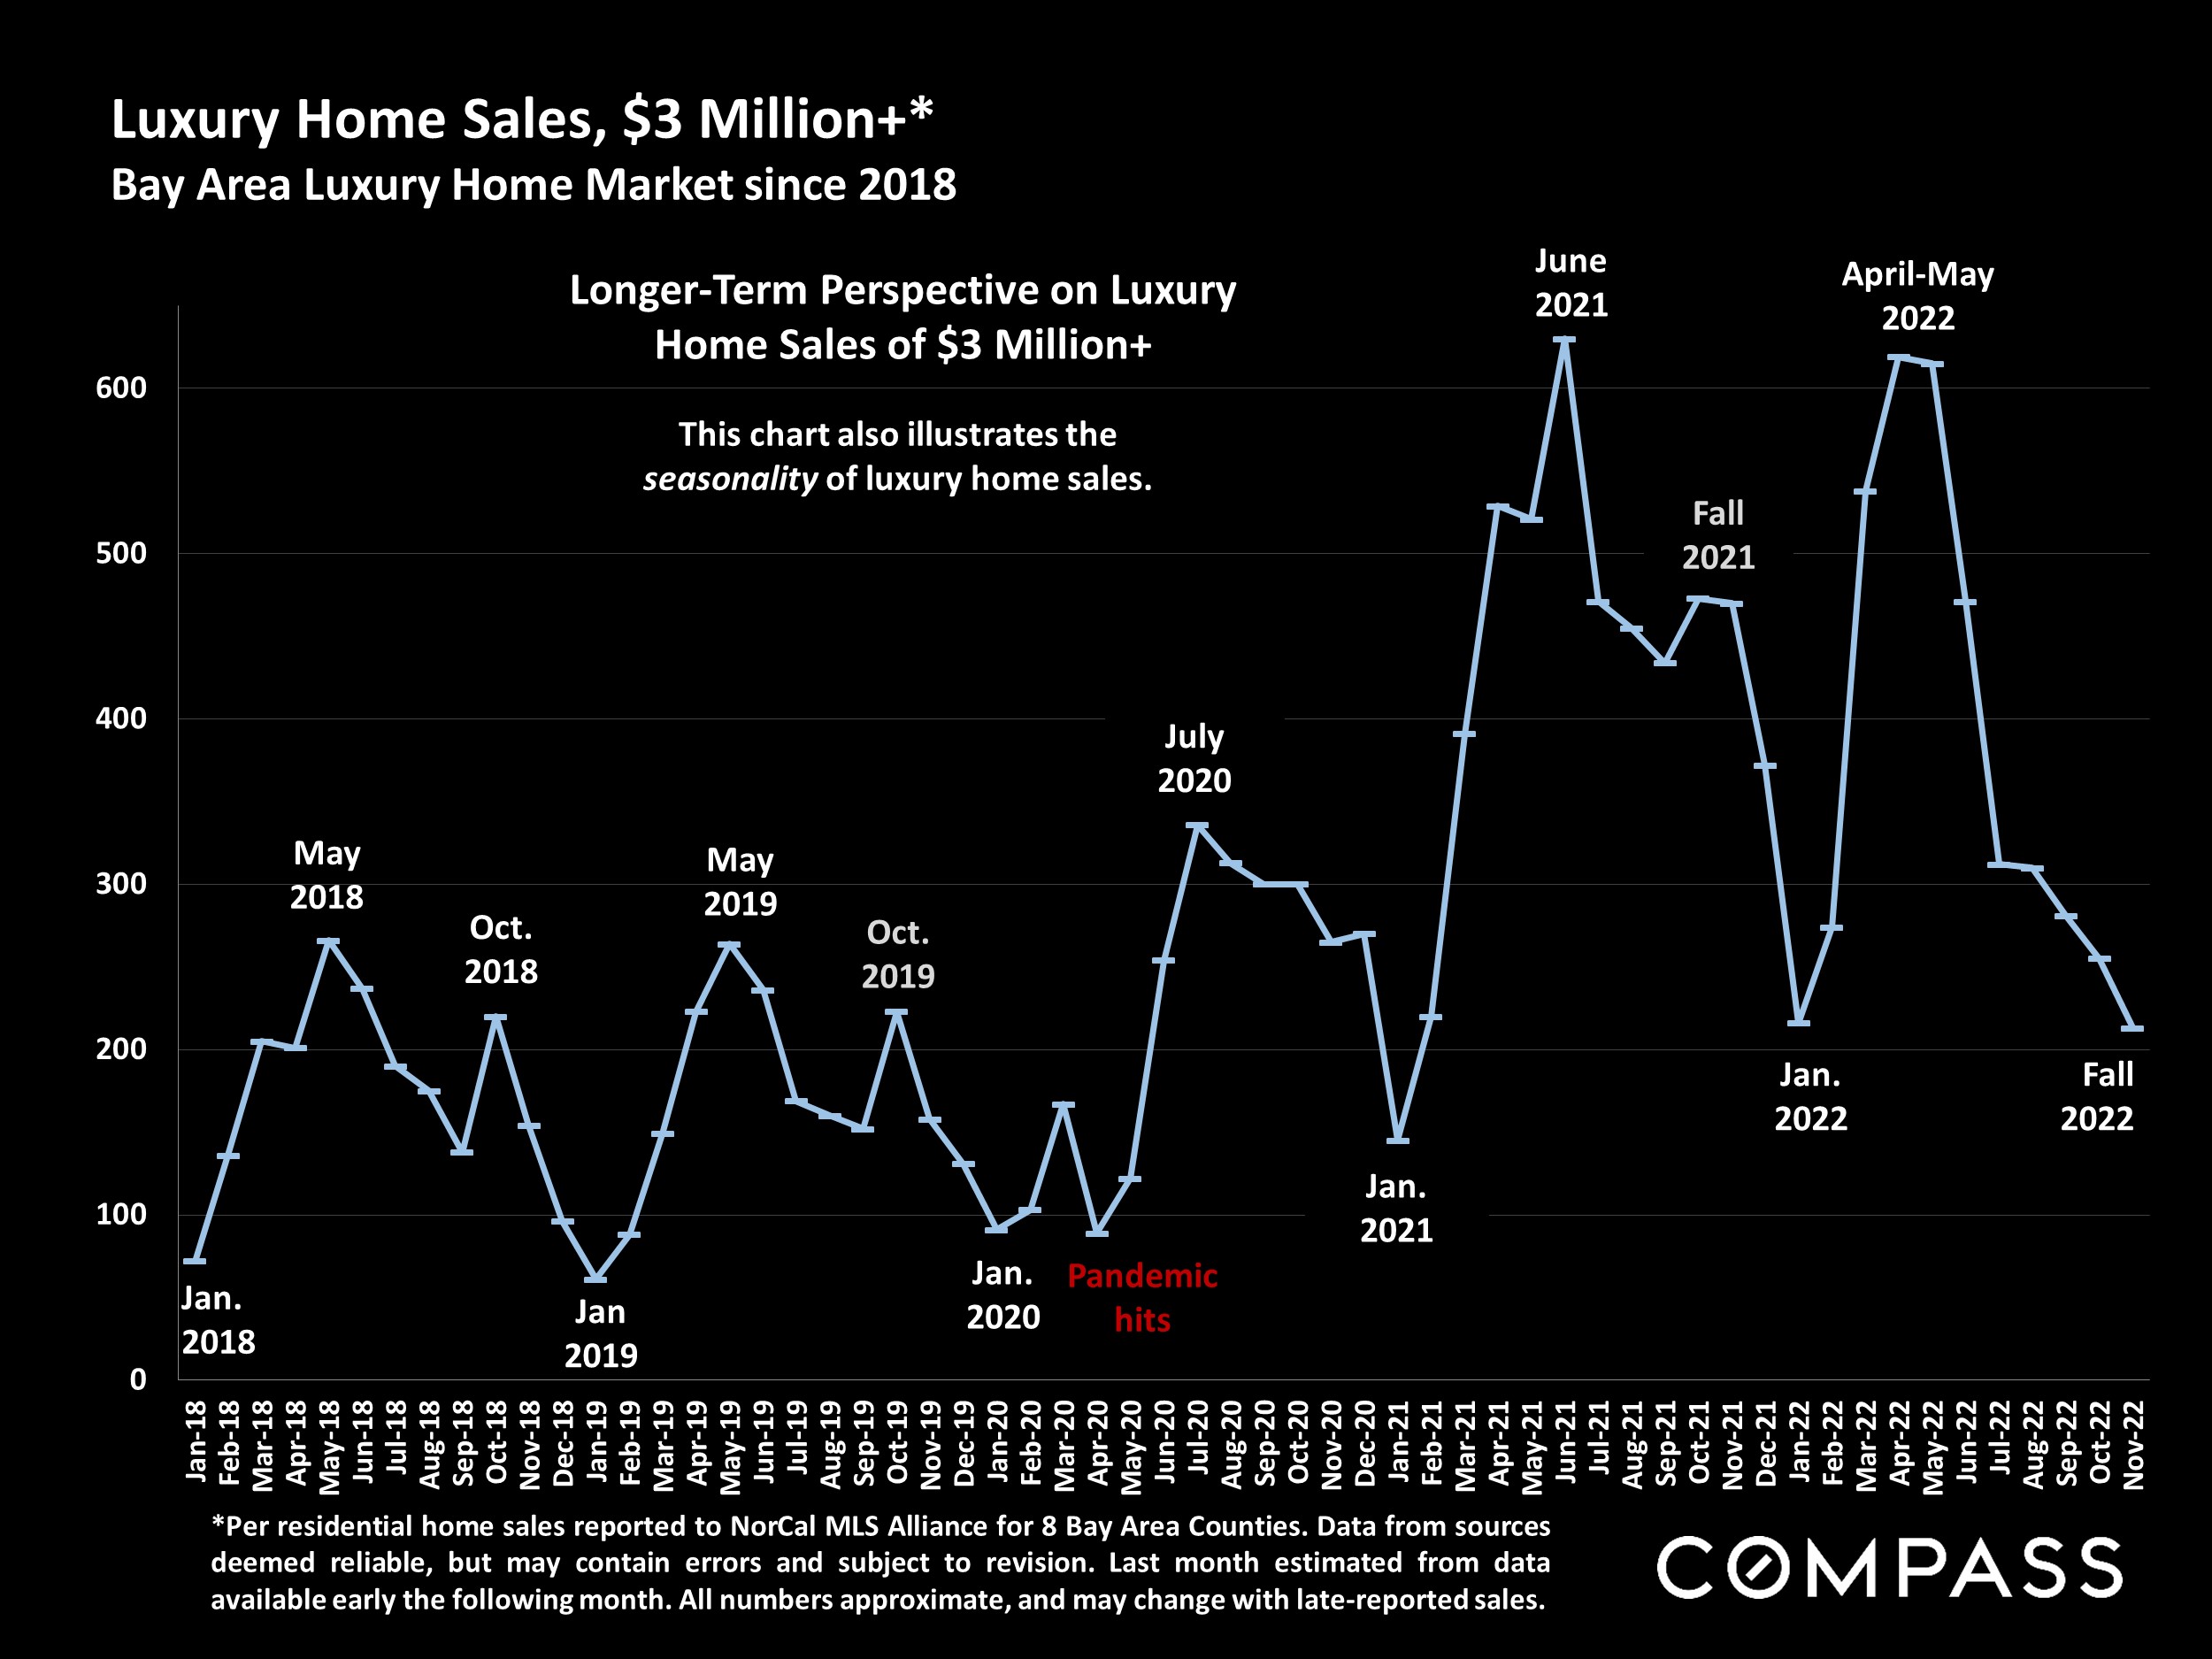
The significant changes in market dynamics that began in late spring/early summer 2022 due to a variety of macroeconomic headwinds – including increasing inflation and interest rates, and declining consumer confidence and stock markets (though all these have fluctuated over the period, and some readings have recently improved) – generally accelerated in autumn 2022. In the greater San Francisco Bay Area region, sales volumes and home-price appreciation rates have continued to decline on a year-over-year basis. The vast majority of statistics clearly illustrate a market that has substantially cooled and “corrected” since spring 2022, when it appears that a long, dramatic, 10-year market upcycle peaked. In recent months, luxury home sales have dropped more on a year-over-year percentage basis than the general residential market.
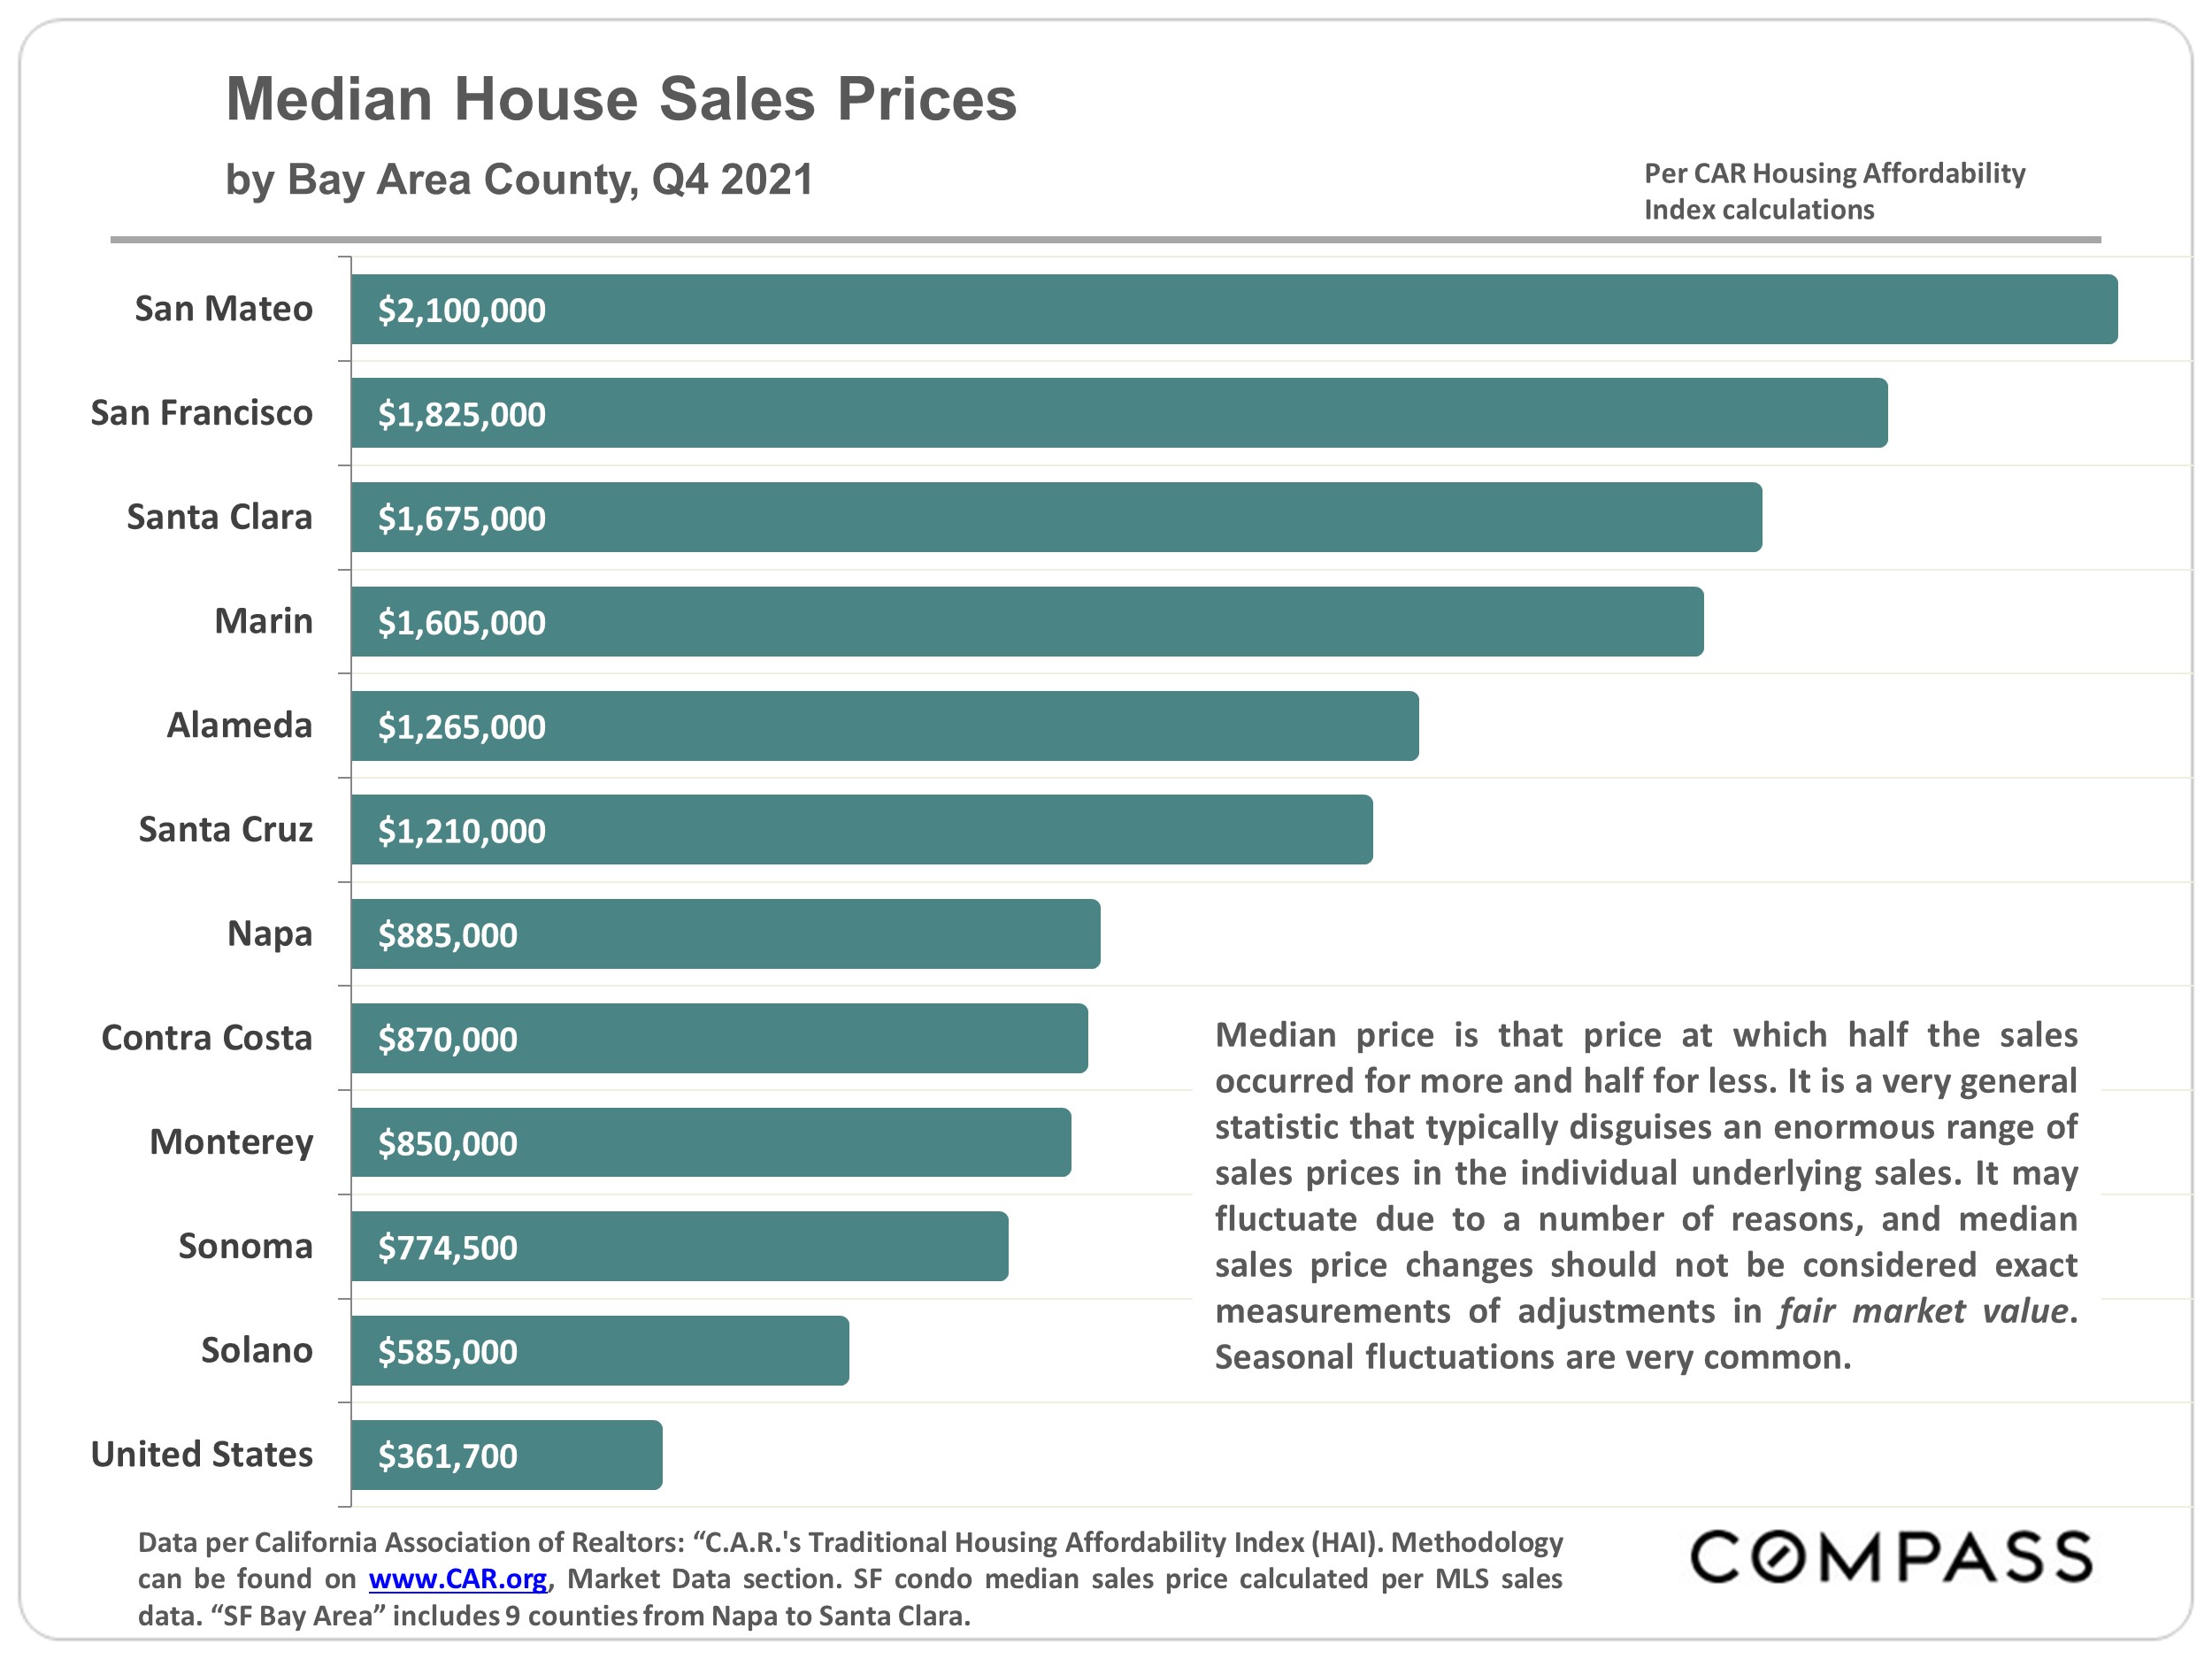
For the overall Bay Area, home prices are now lower year-over-year, though there are significant variations among the individual counties: Median sales prices in the most affordable counties are often still somewhat higher year over year. (Please refer to our individual county reports.)
From a variety of short-term and long-term angles, this report will review data and trends in home prices and appreciation rates, sales volumes in the general and luxury market segments, overbidding and speed of sale, new listing and accepted-offer activity, the inventory of listings for sale, price reductions, all-cash purchases, and other housing metrics.
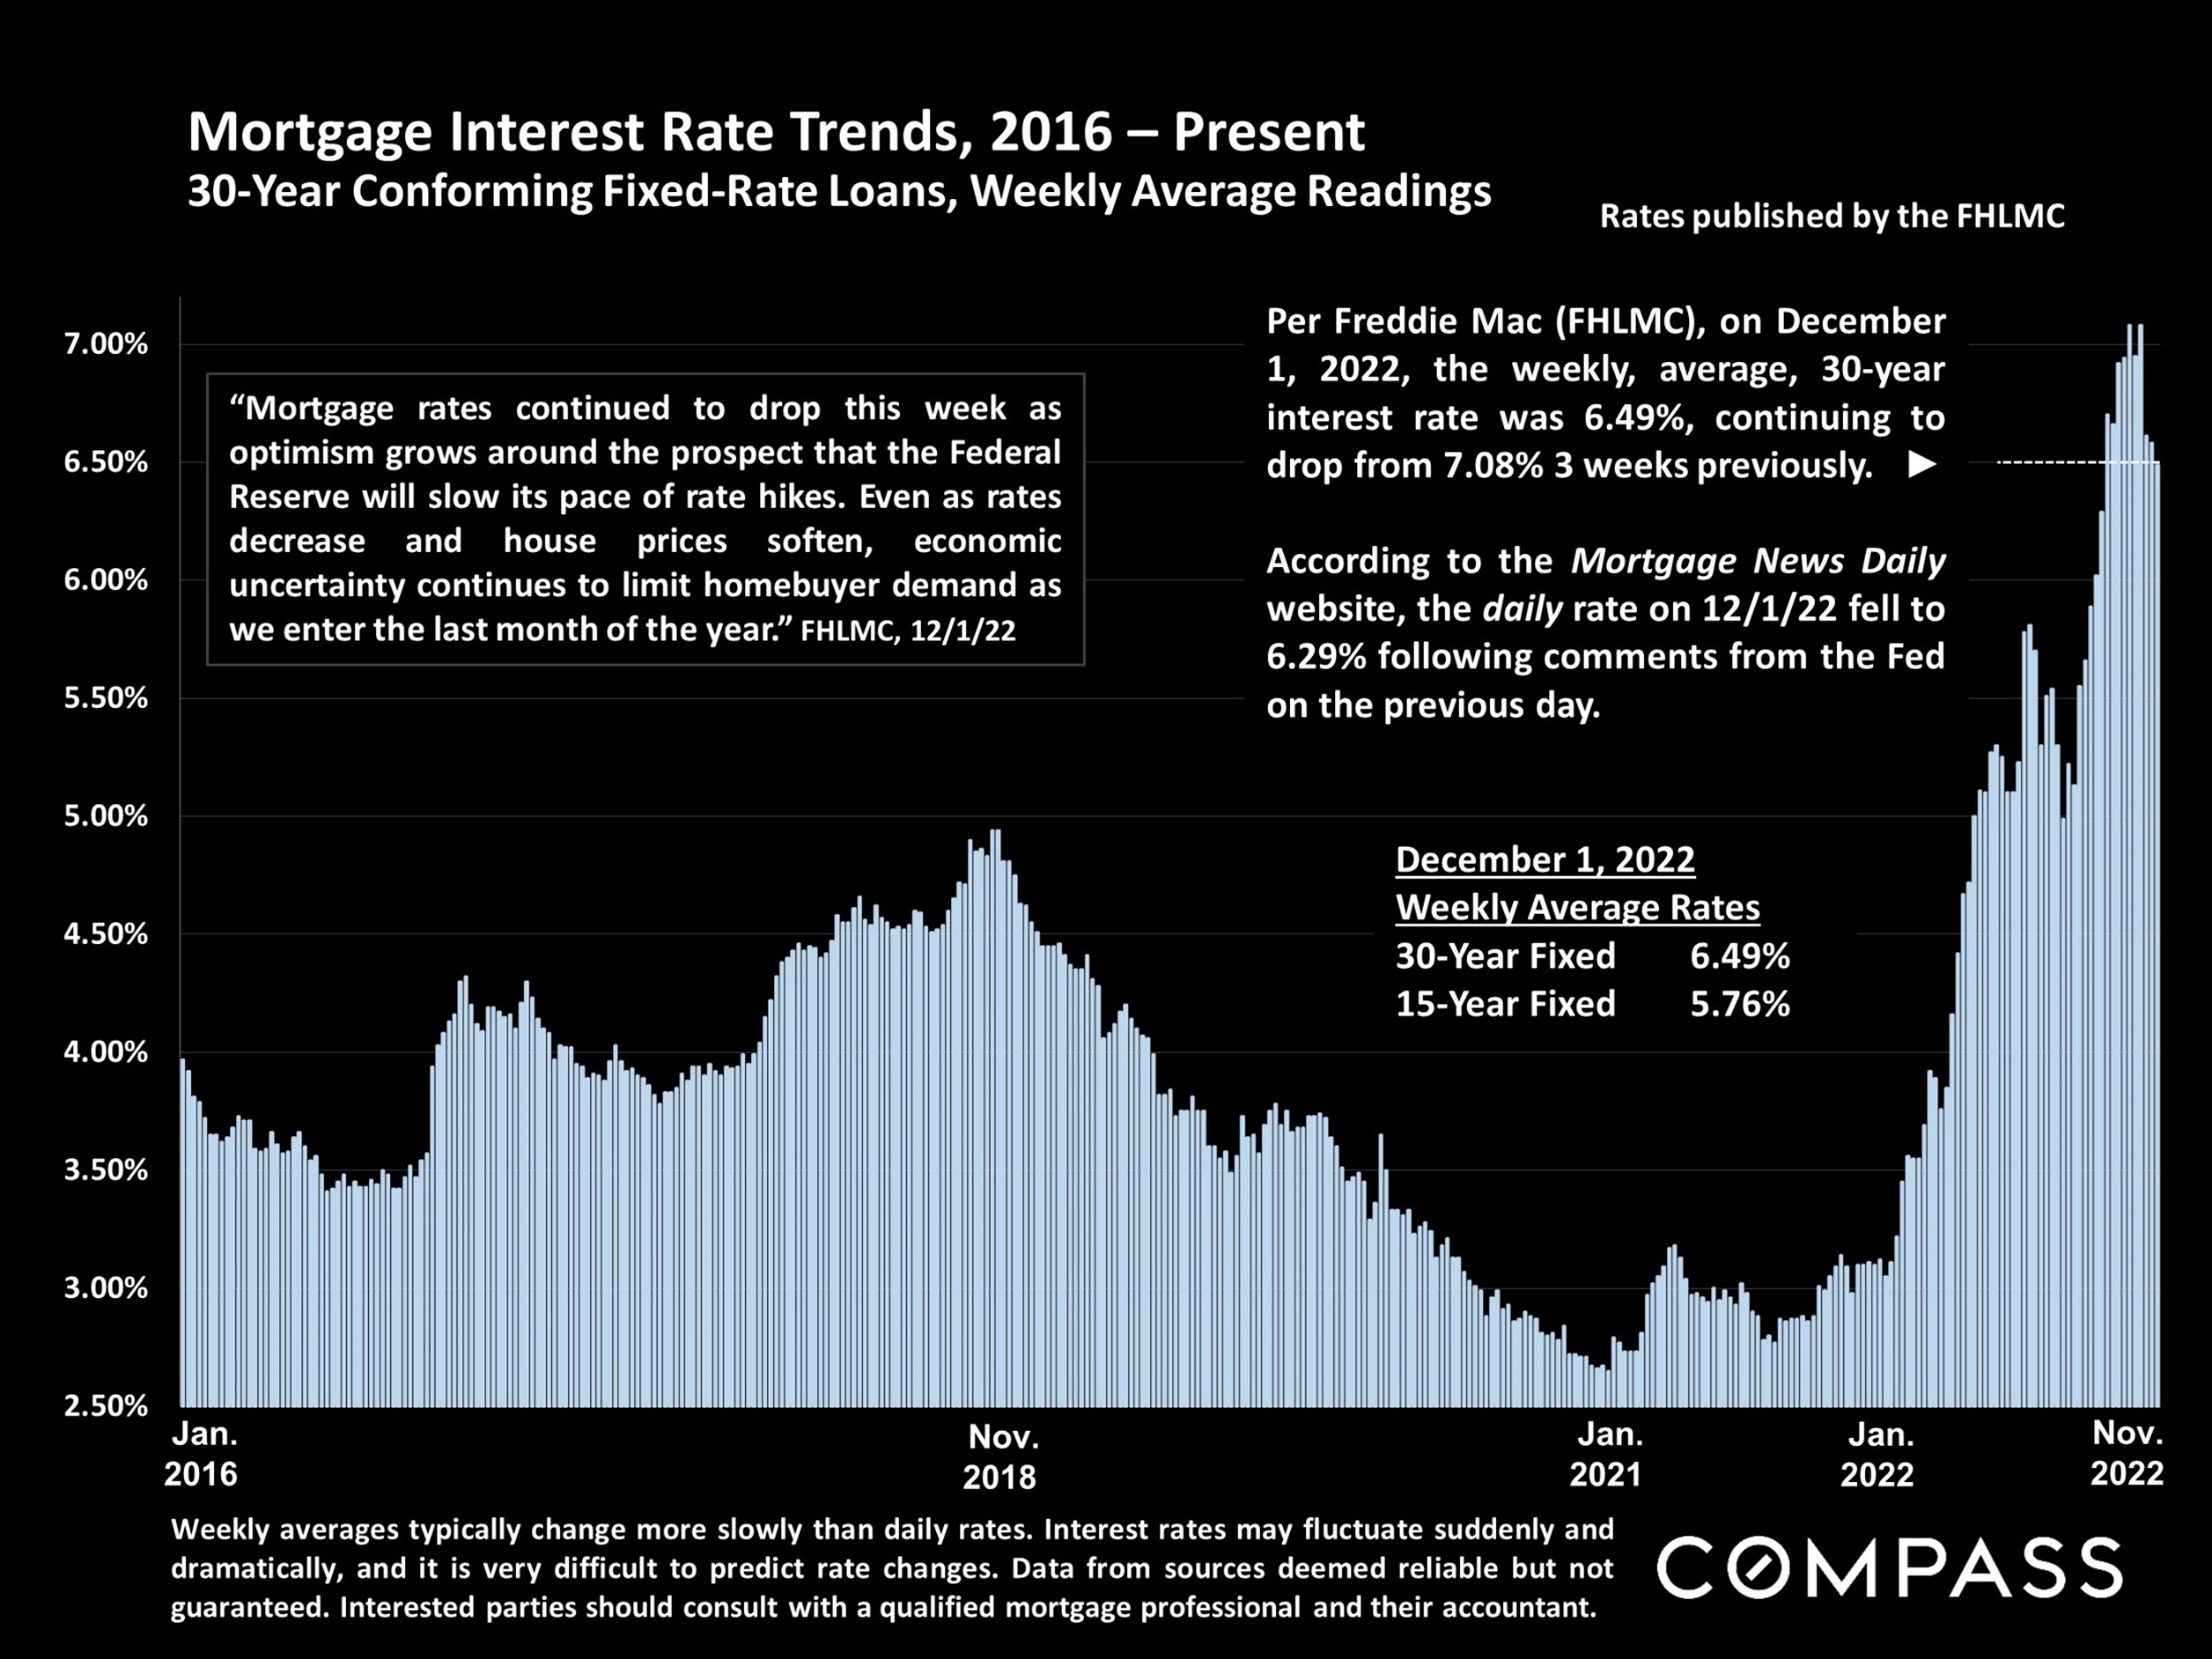
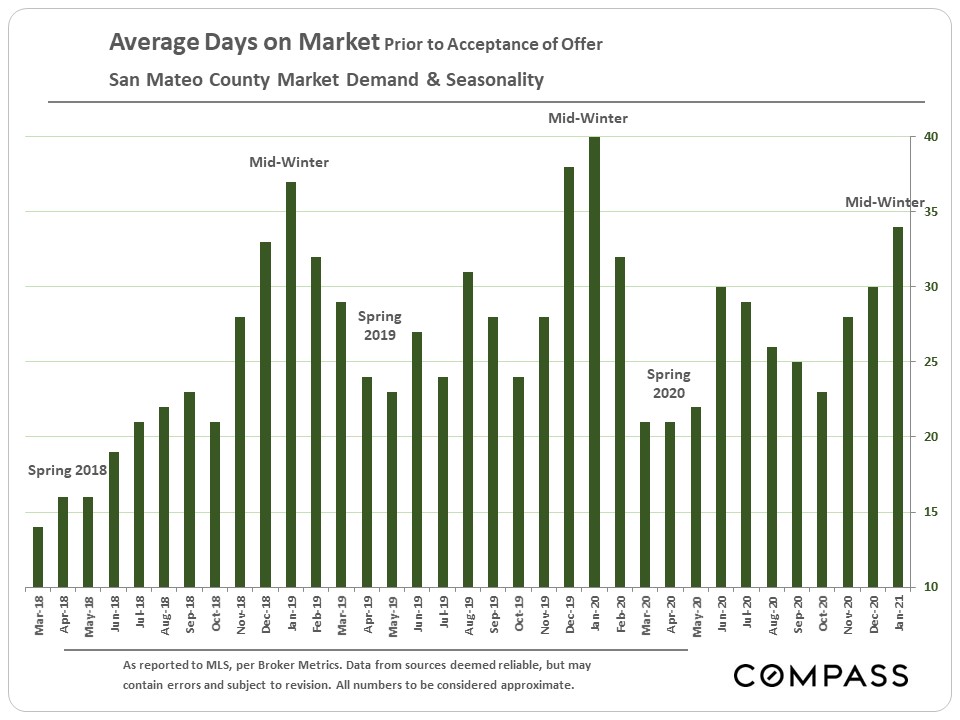
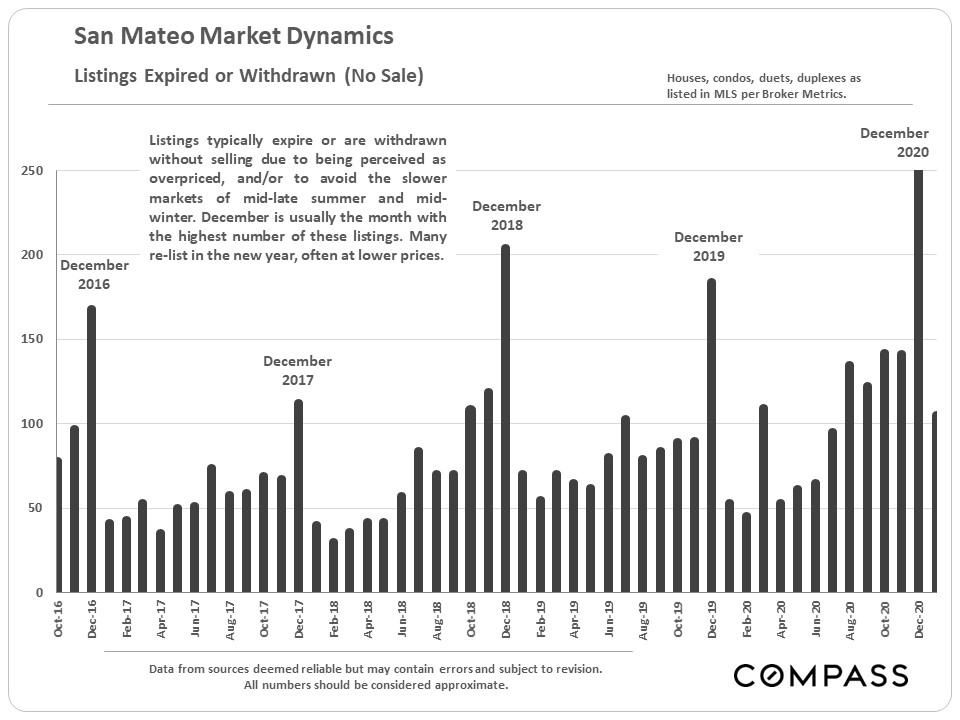
December typically sees the low point of listing and sales activity for the year – and some sellers take their homes off the market until the new year – but thousands of homes will continue to be marketed and sold. This can be an excellent time for buyers to aggressively negotiate prices, though the supply of homes to choose from dwindles. The market usually begins to wake up in mid-January and then quickly accelerates in early spring. In the Bay Area, depending on the weather and economic conditions, the “early spring” market can begin as soon as February. The single, most closely watched factor will be what happens in mortgage interest rates.

Source: Compass
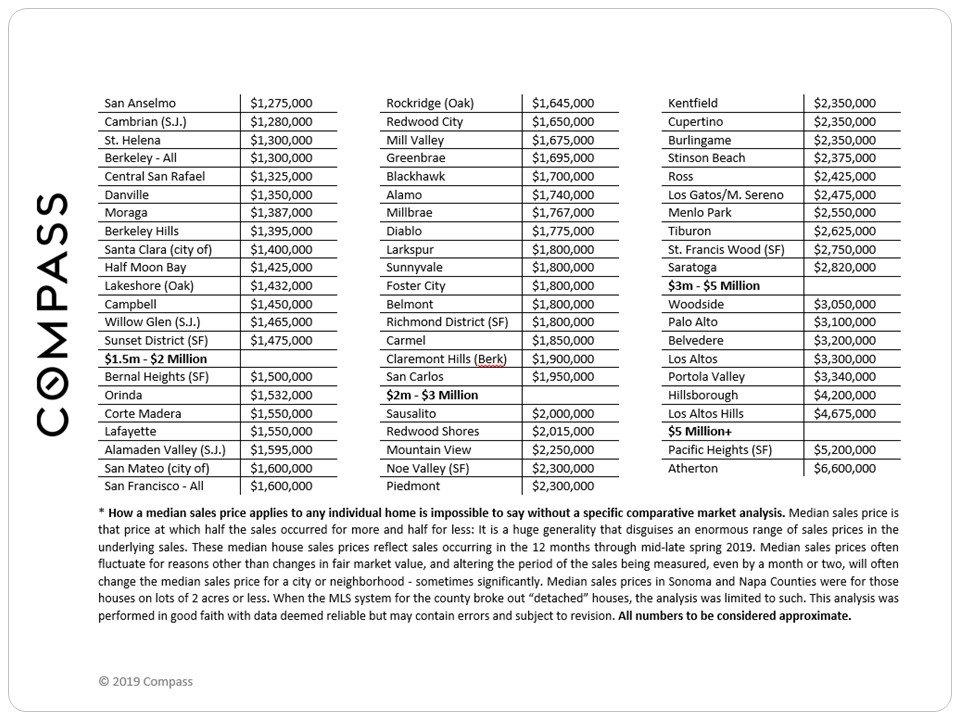
It is impossible to know how median and average value statistics apply to any particular home without a specific comparative market analysis. These analyses were made in good faith with data from sources deemed reliable, but may contain errors and are subject to revision. It is not our intent to convince you of a particular position, but to attempt to provide straightforward data and analysis, so you can make your own informed decisions. Median and average statistics are enormous generalities: There are hundreds of different markets in San Francisco and the Bay Area, each with its own unique dynamics. Median prices and average dollar per square foot values can be and often are affected by other factors besides changes in fair market value. Longer term trends are much more meaningful than short-term.
Compass is a real estate broker licensed by the State of California, DRE 01527235. Equal Housing Opportunity. This report has been prepared solely for information purposes. The information herein is based on or derived from information generally available to the public and/or from sources believed to be reliable. No representation or warranty can be given with respect to the accuracy or completeness of the information. Compass disclaims any and all liability relating to this report, including without limitation any express or implied representations or warranties for statements contained in, and omissions from, the report. Nothing contained herein is intended to be or should be read as any regulatory, legal, tax, accounting or other advice and Compass does not provide such advice. All opinions are subject to change without notice. Compass makes no representation regarding the accuracy of any statements regarding any references to the laws, statutes or regulations of any state are those of the author(s). Past performance is no guarantee of future results.