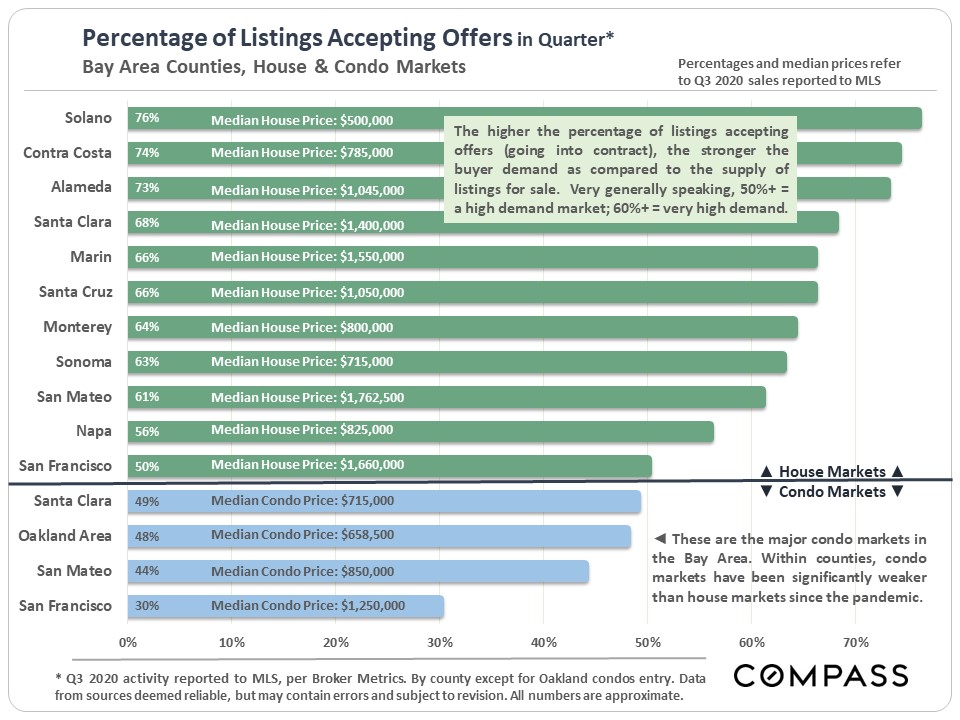
PERCENTAGE OF LISTINGS ACCEPTING OFFERS, BY BAY AREA COUNTY, Q3 2020
This first chart compares the heat of Bay Area County markets as measured by the percentage of active listings which accepted offers (went into contract) within the quarter. It is a good measurement of buyer demand as compared to the supply of listings for sale.
The top section reflects county house markets, while at the bottom, some of the largest Bay Area condo markets are broken out. As can be seen, condo markets are generally weaker than house markets, a situation significantly exacerbated by the pandemic – especially in San Francisco.
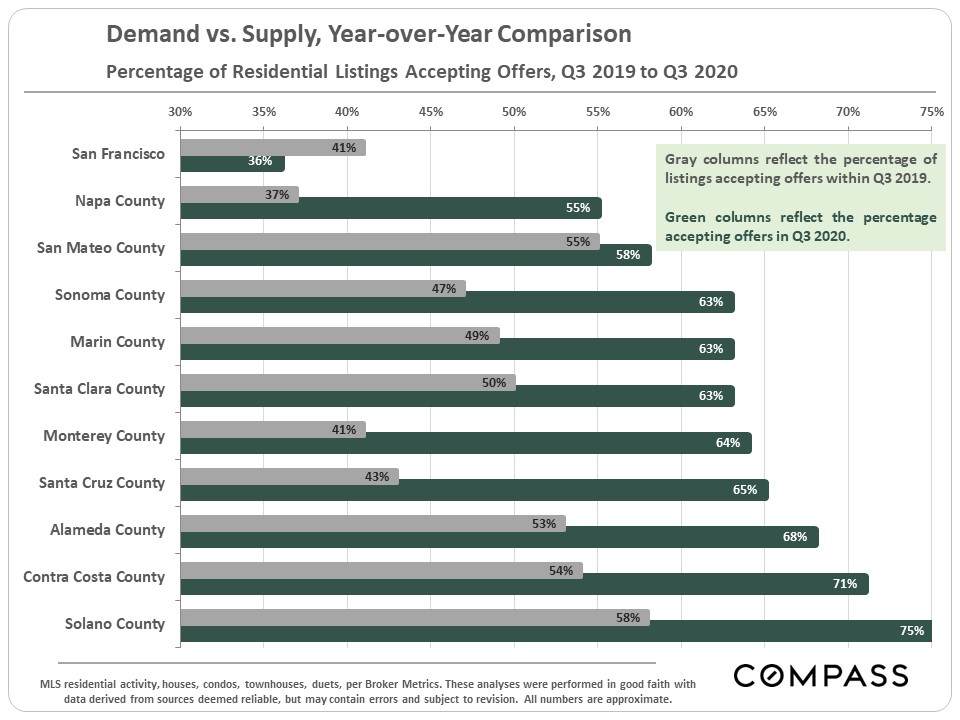
This second chart reflects year over year changes, Q3 2019 to Q3 2020, for the same statistic, but for all residential listings combined. Some counties have seen very dramatic increases in the heat of their markets – especially Monterey, Santa Cruz, Napa and Sonoma Counties. San Francisco was the only county that saw a year over year decline in the percentage of listings accepting offers.