
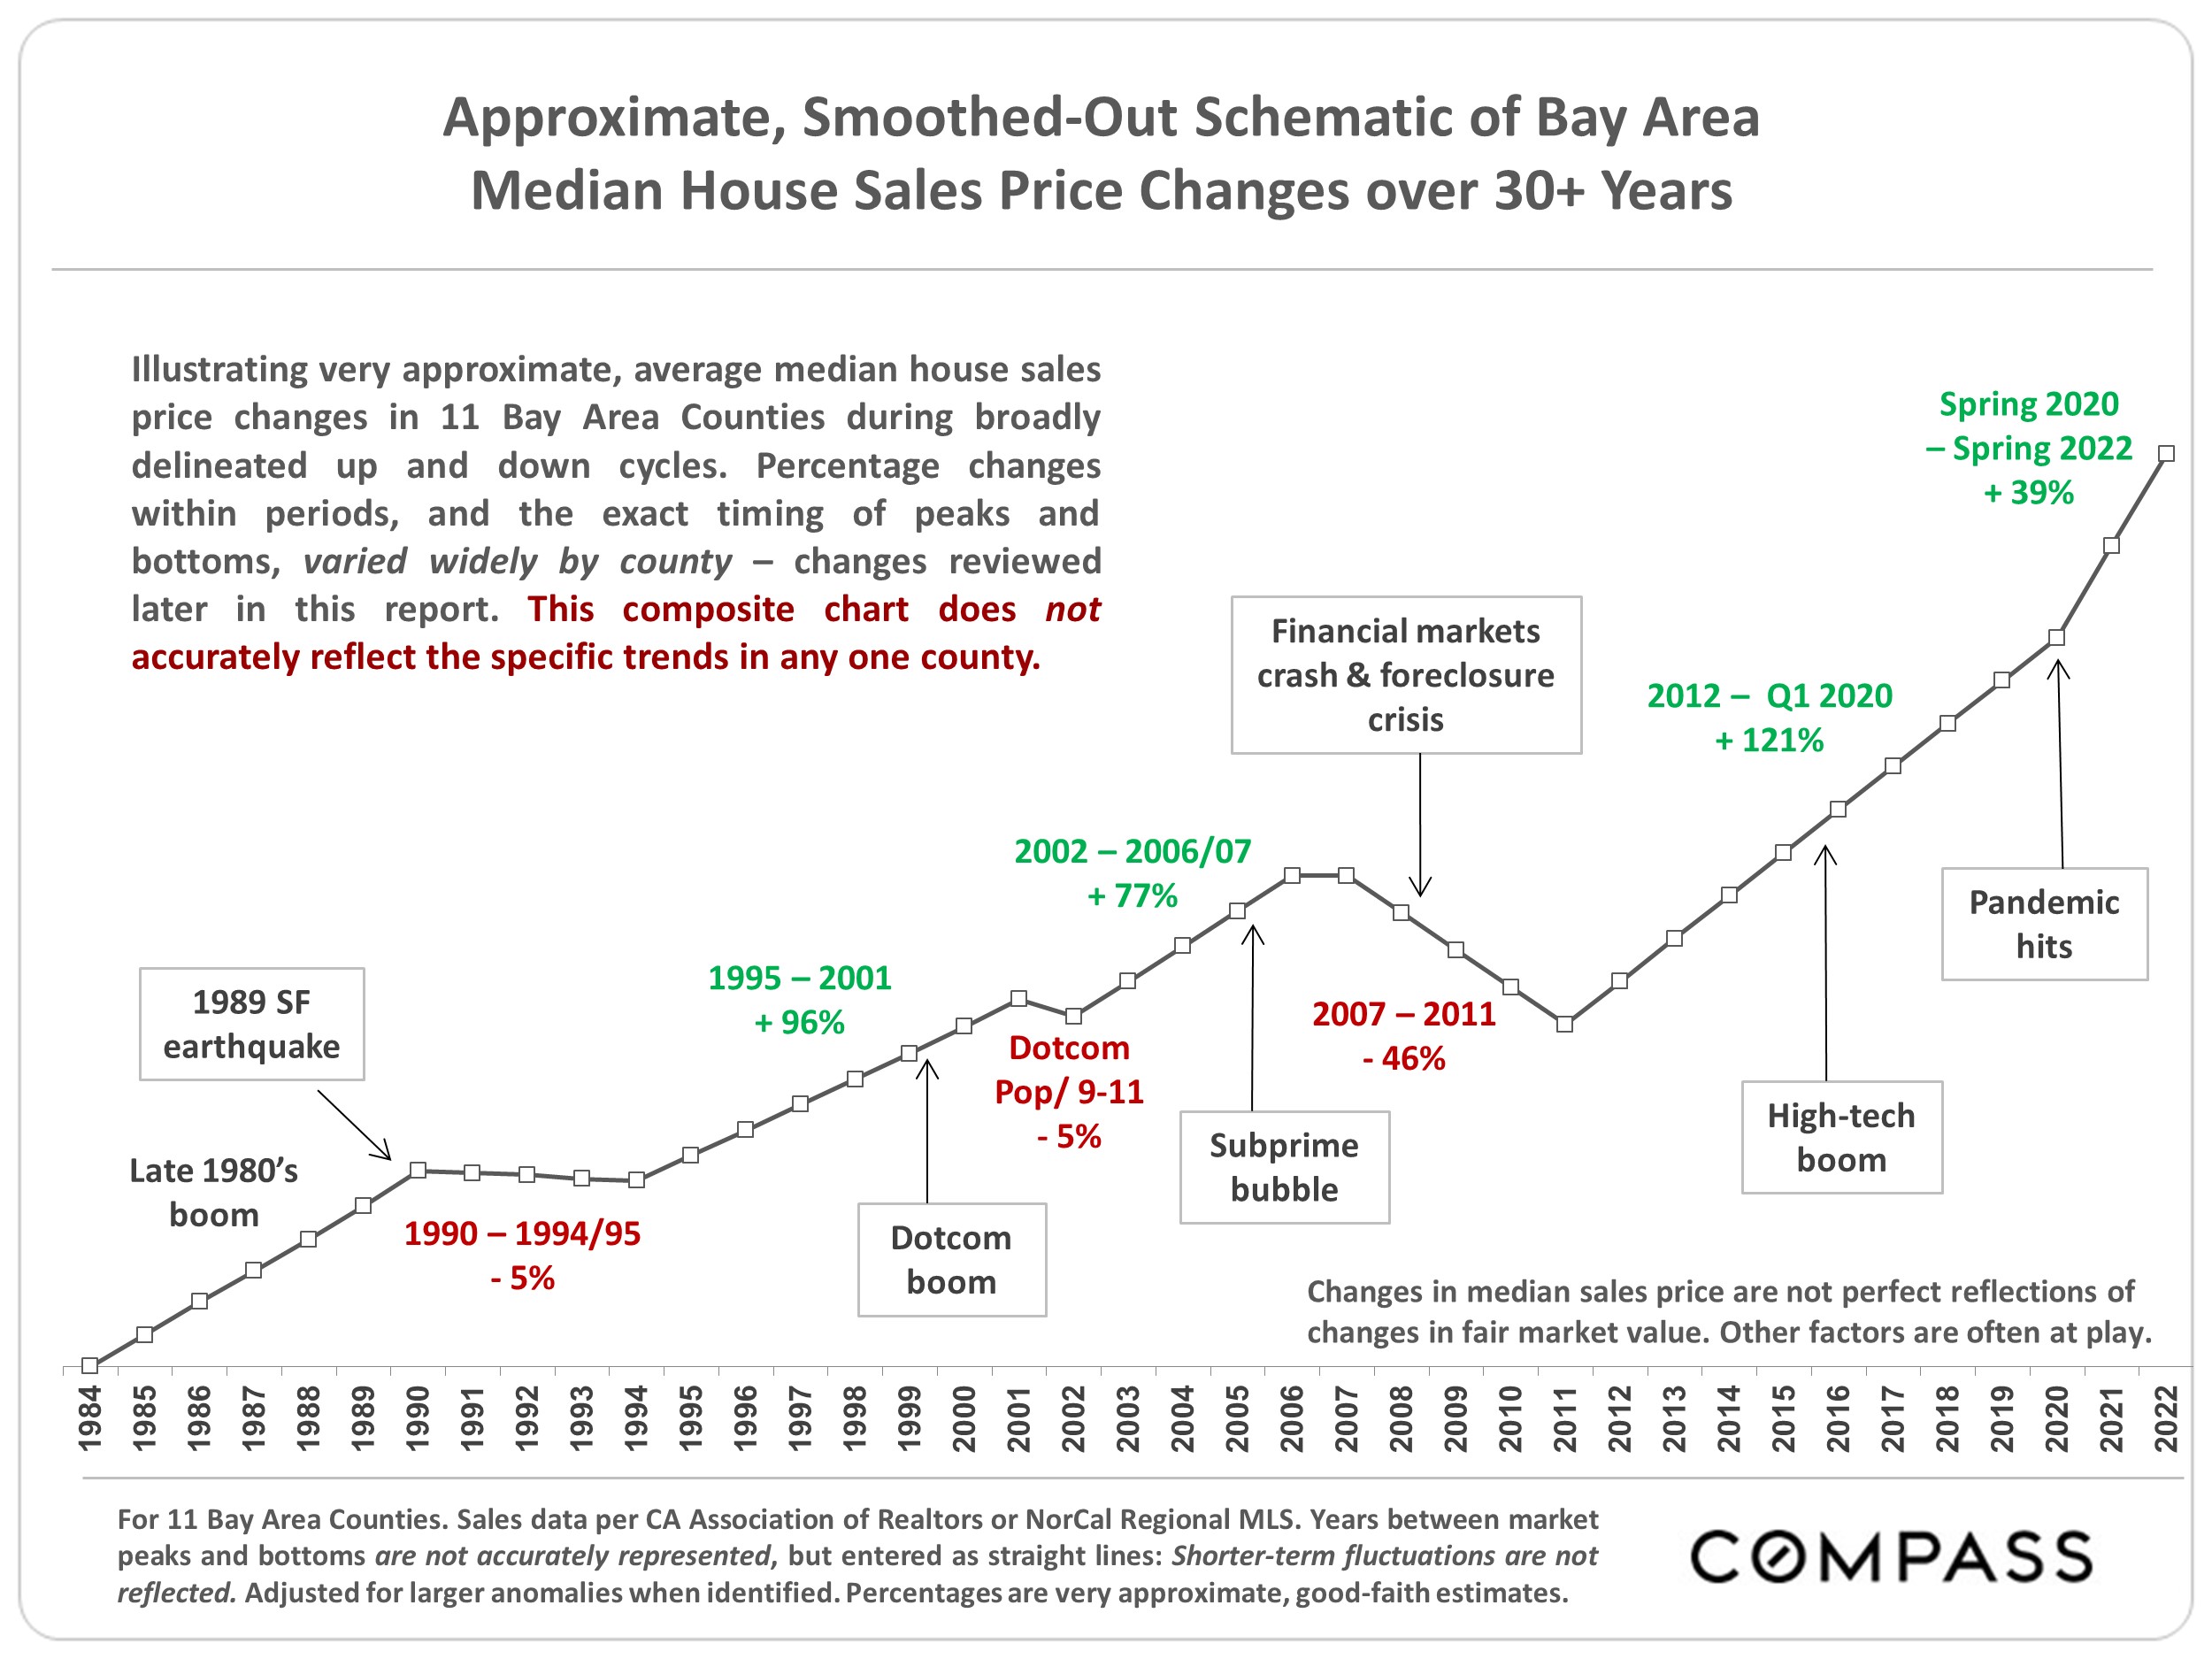
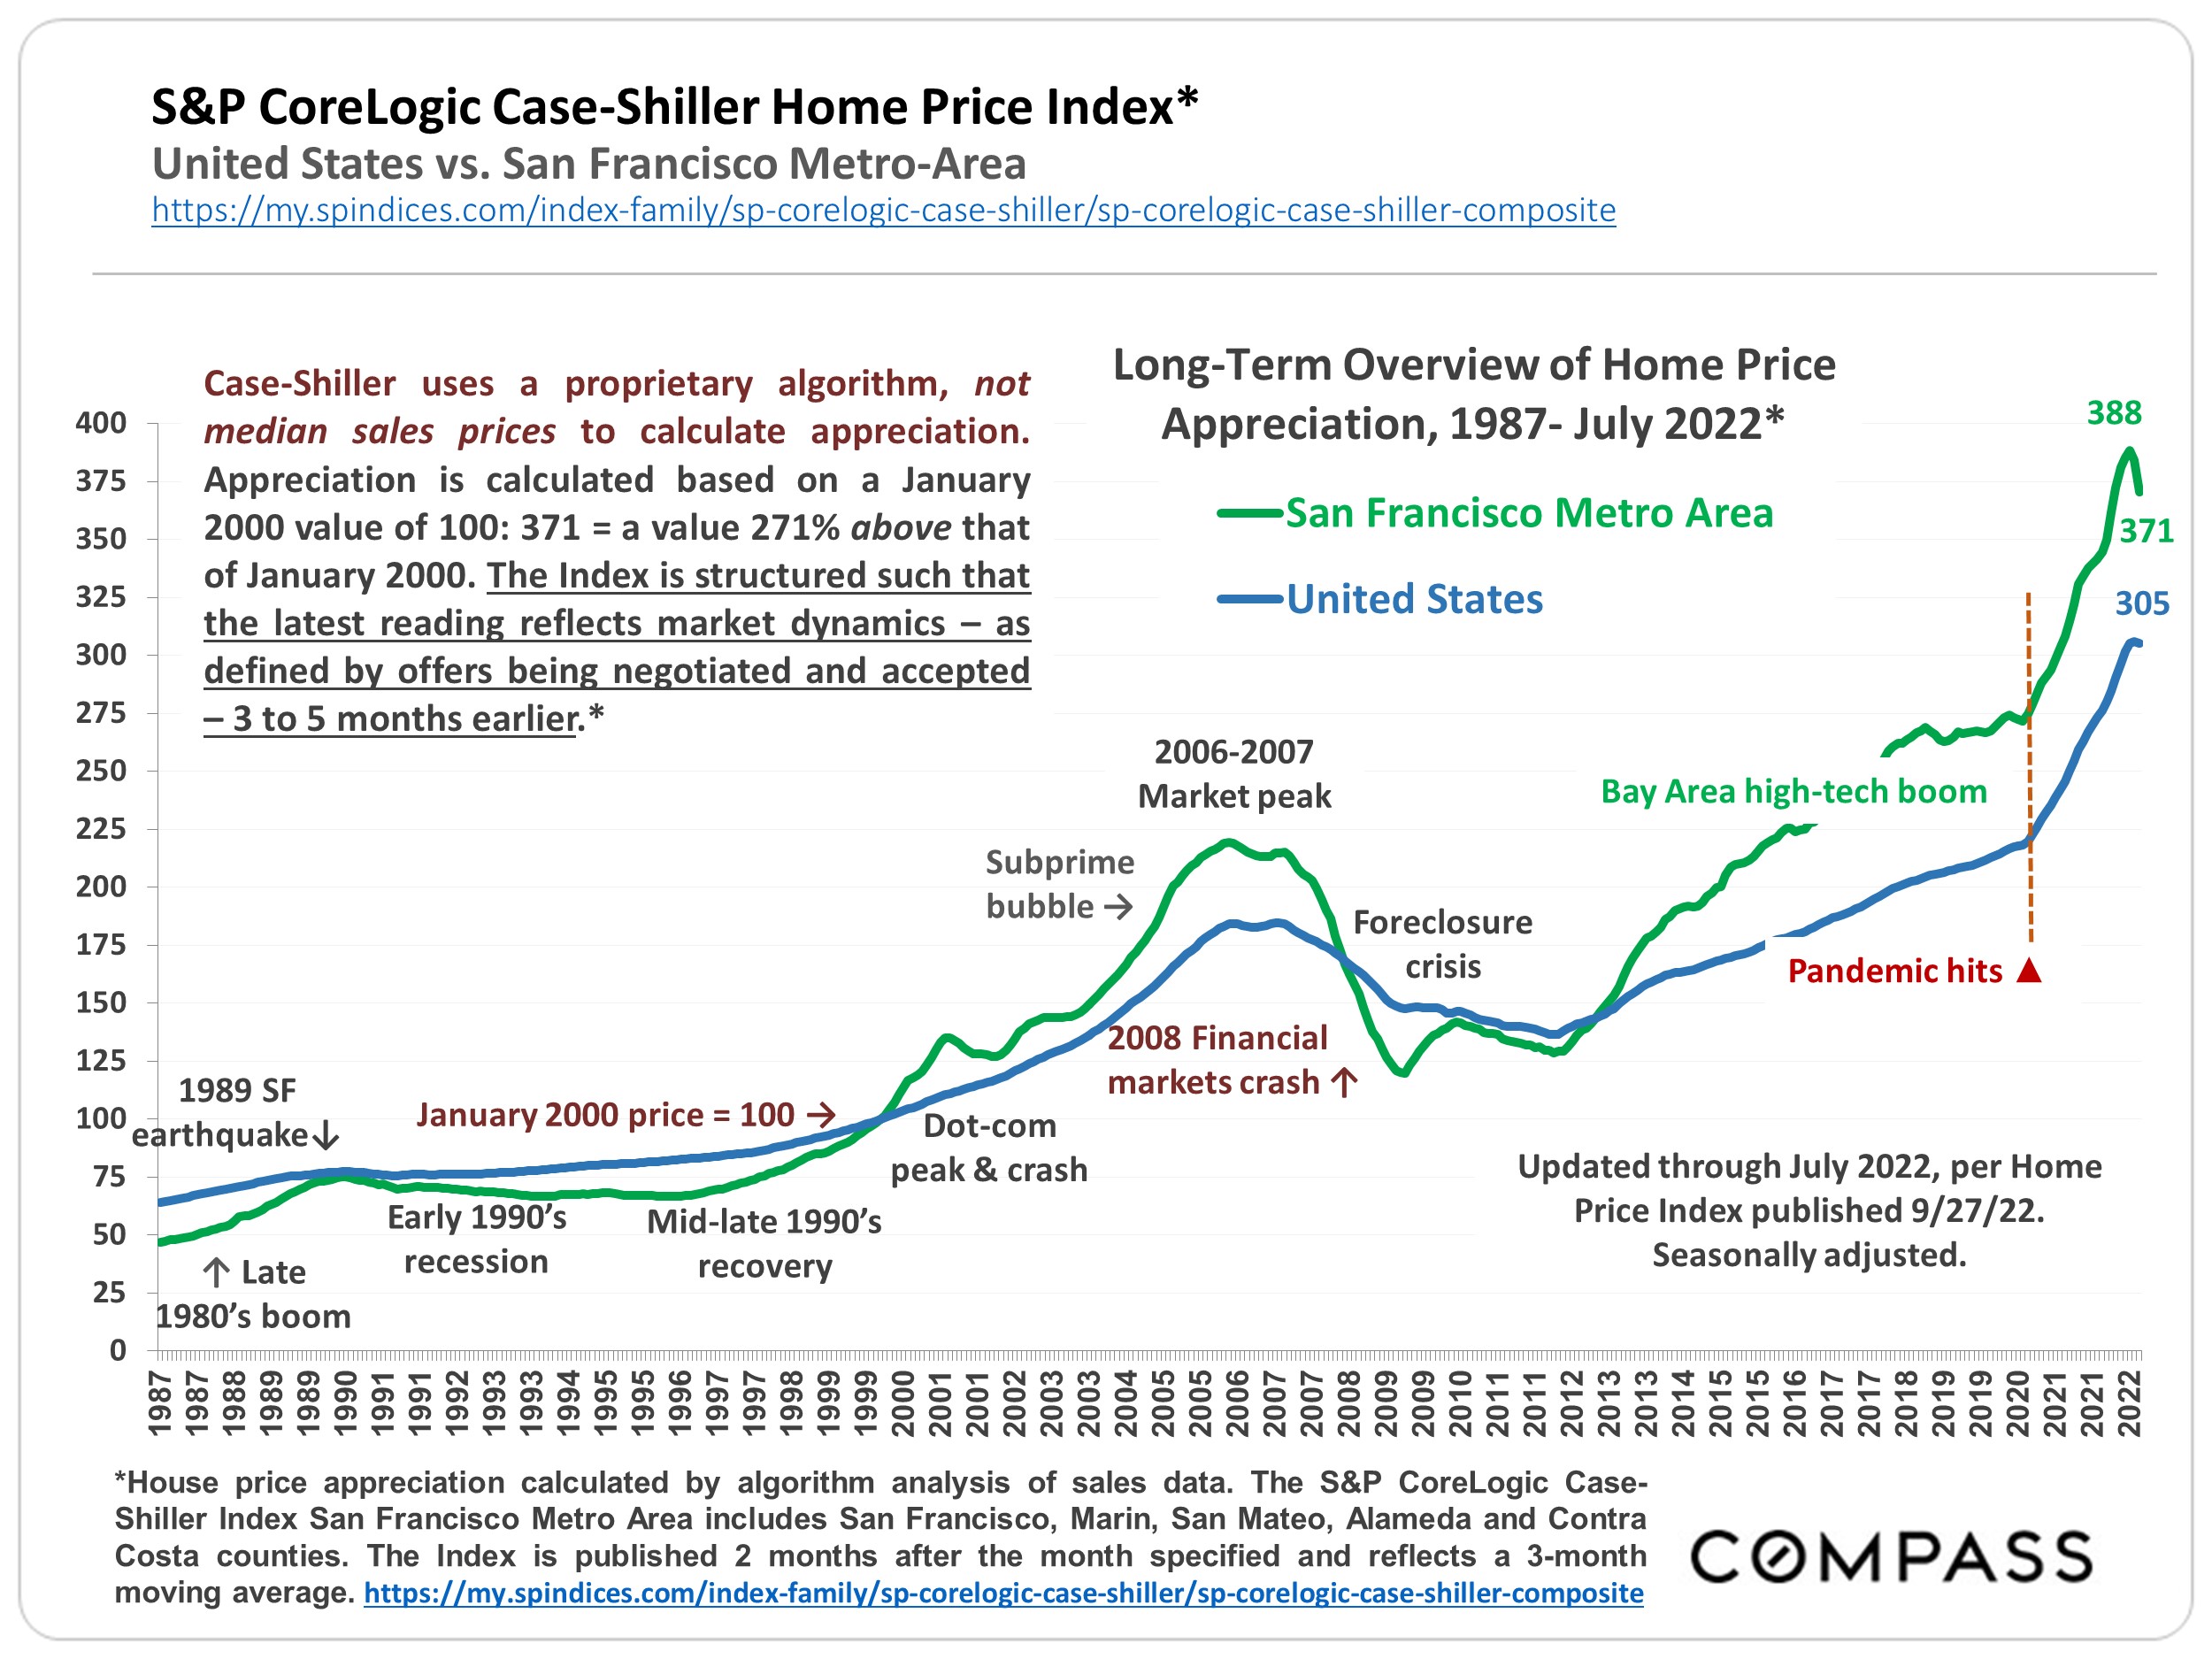
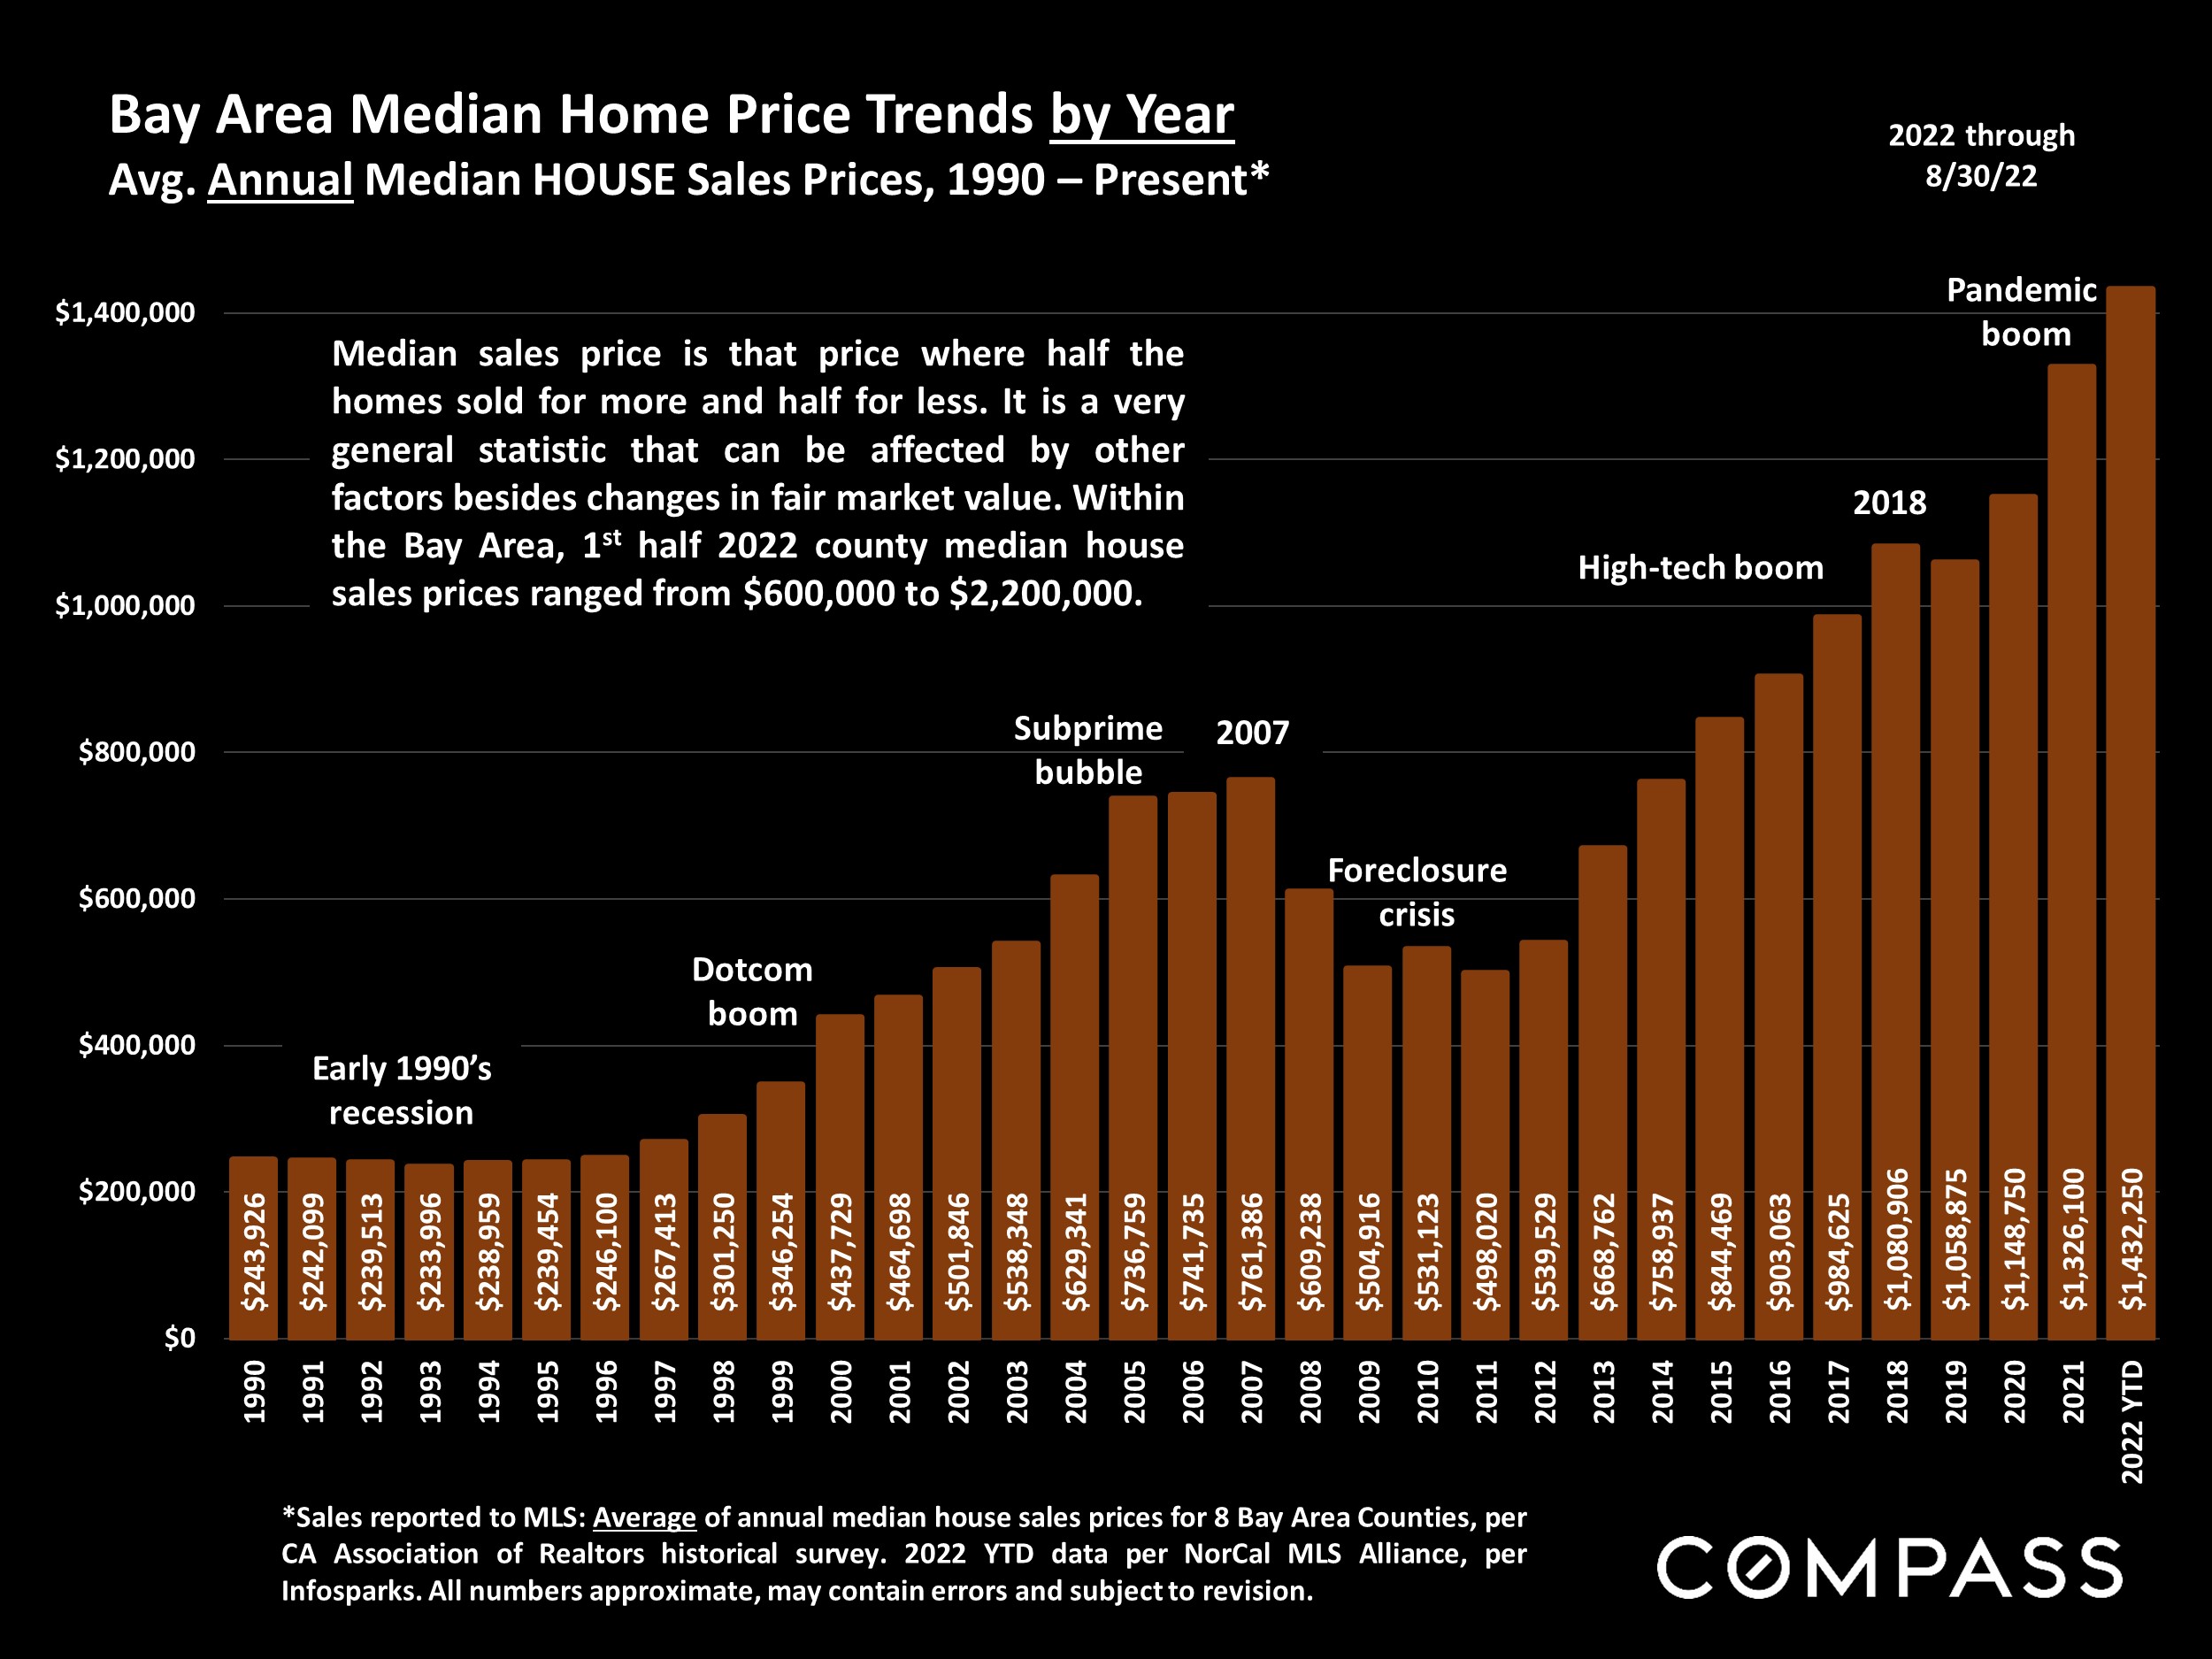
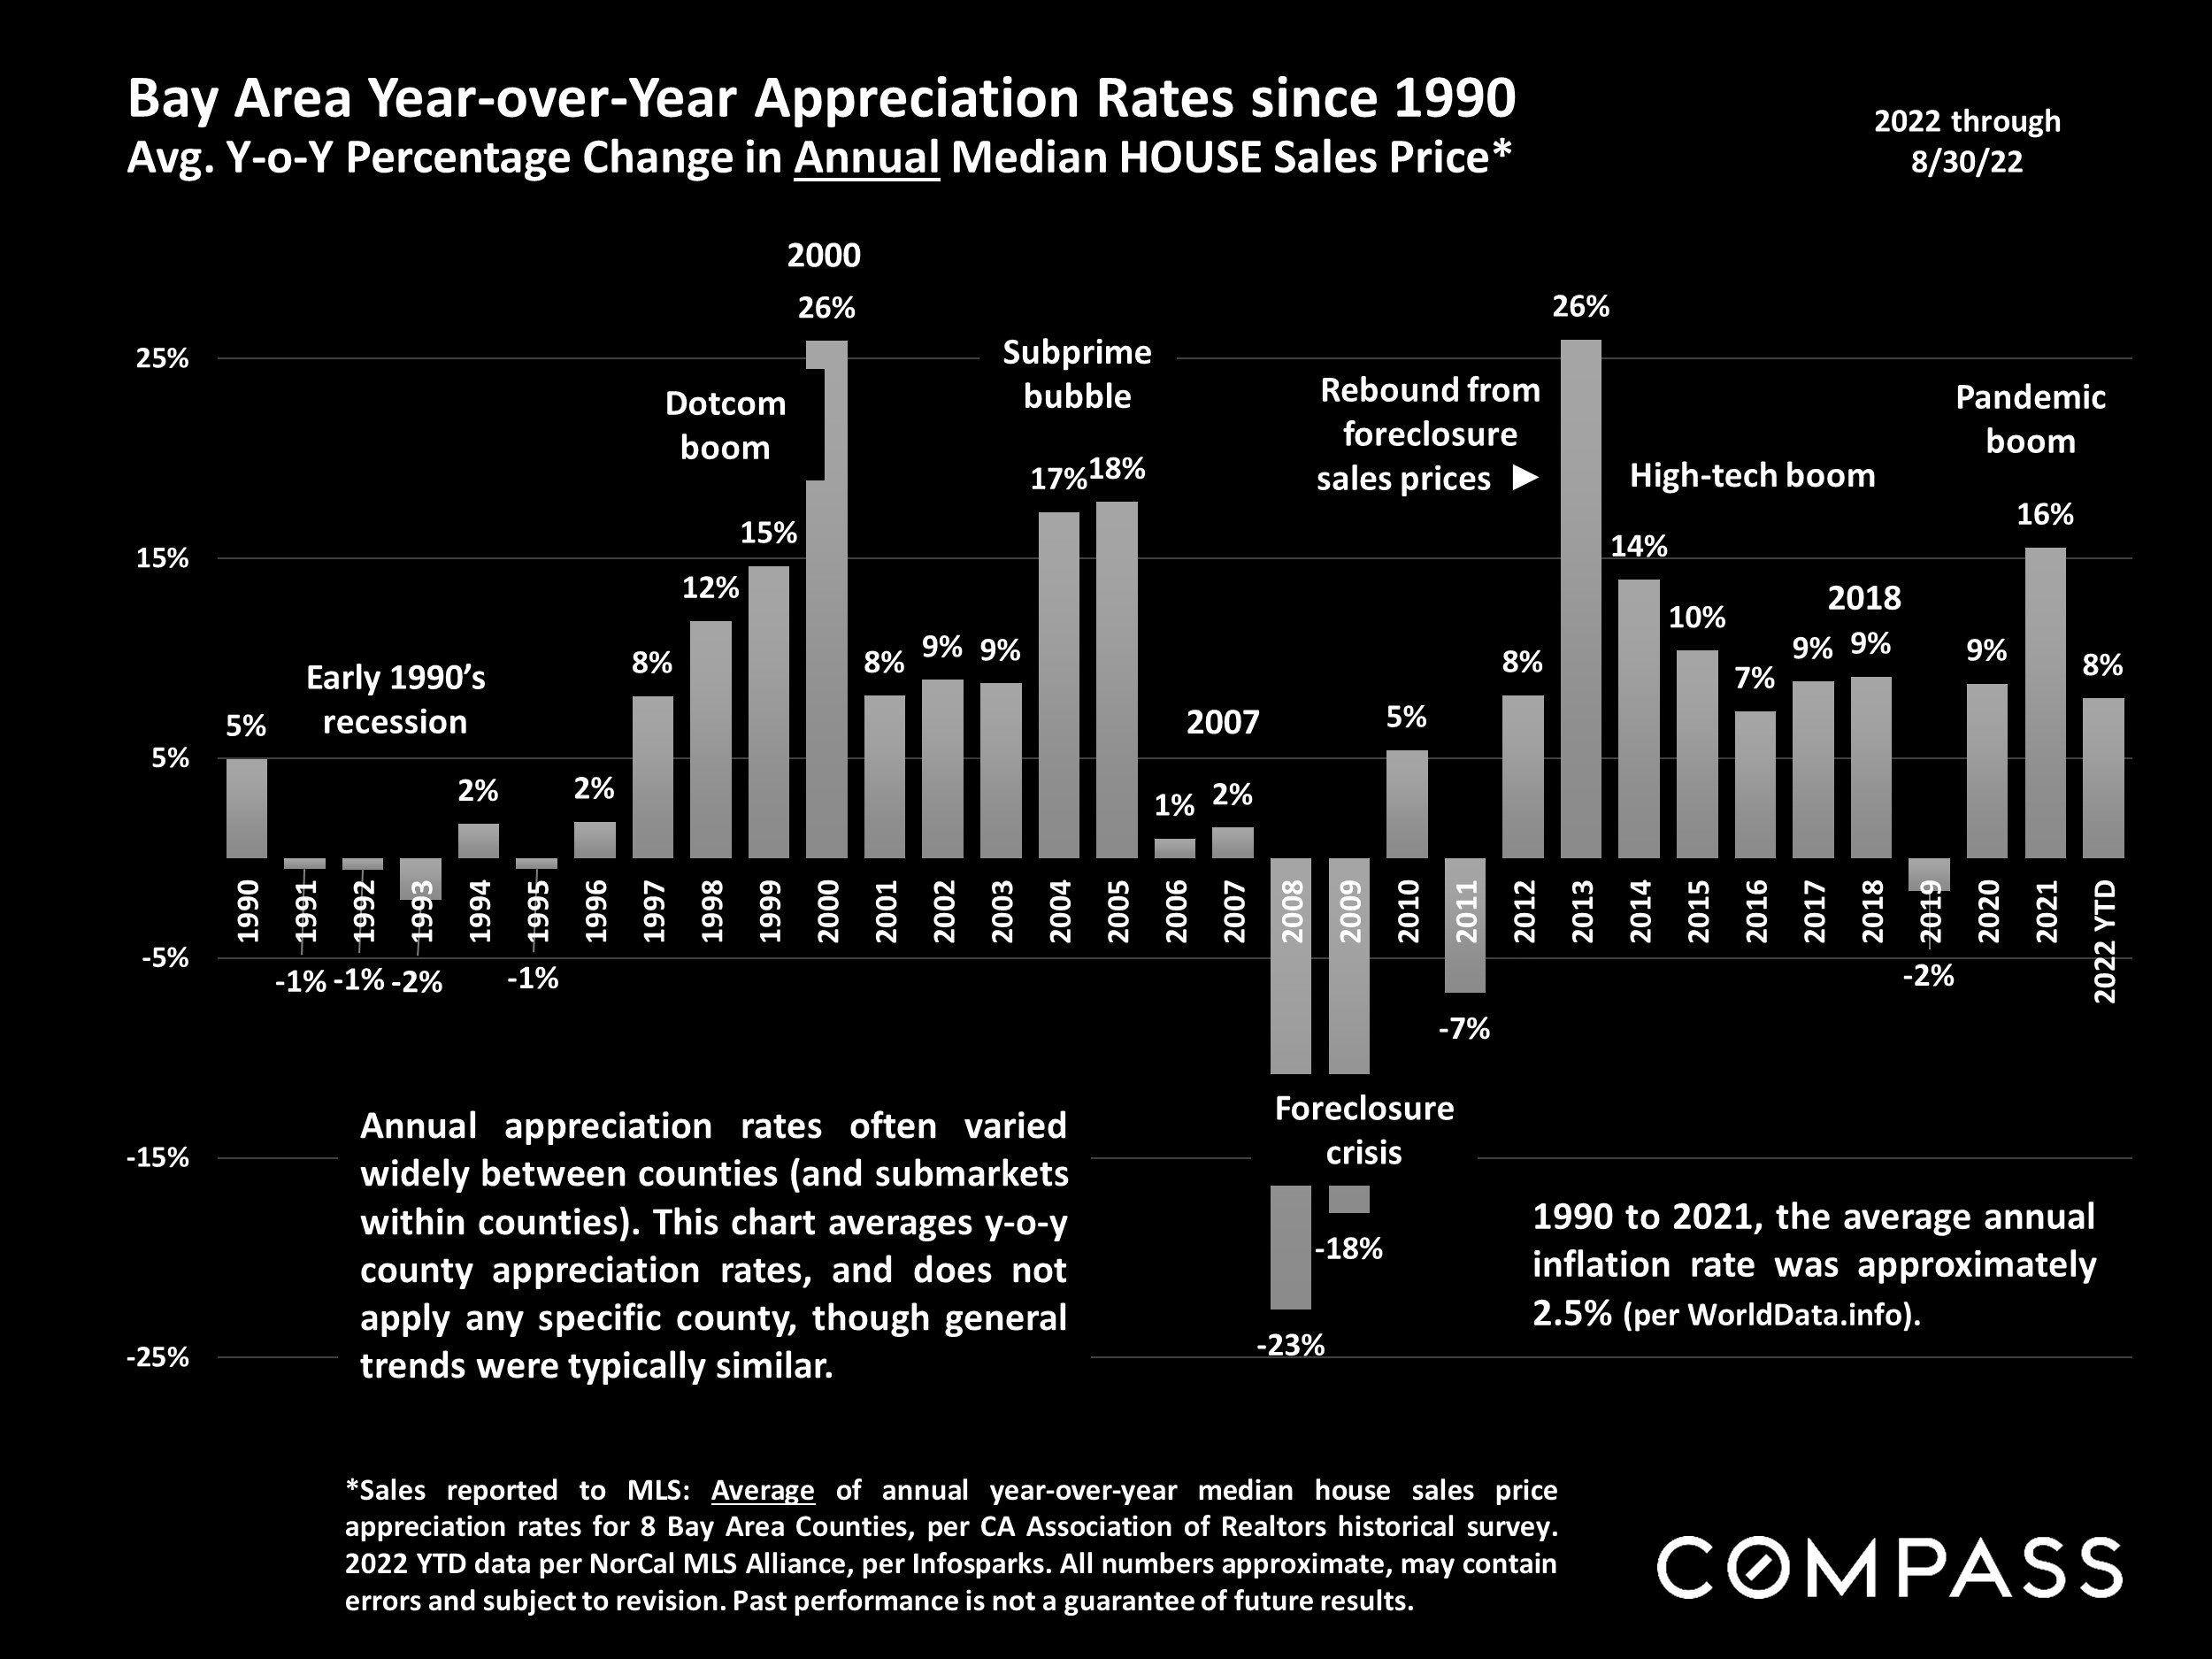
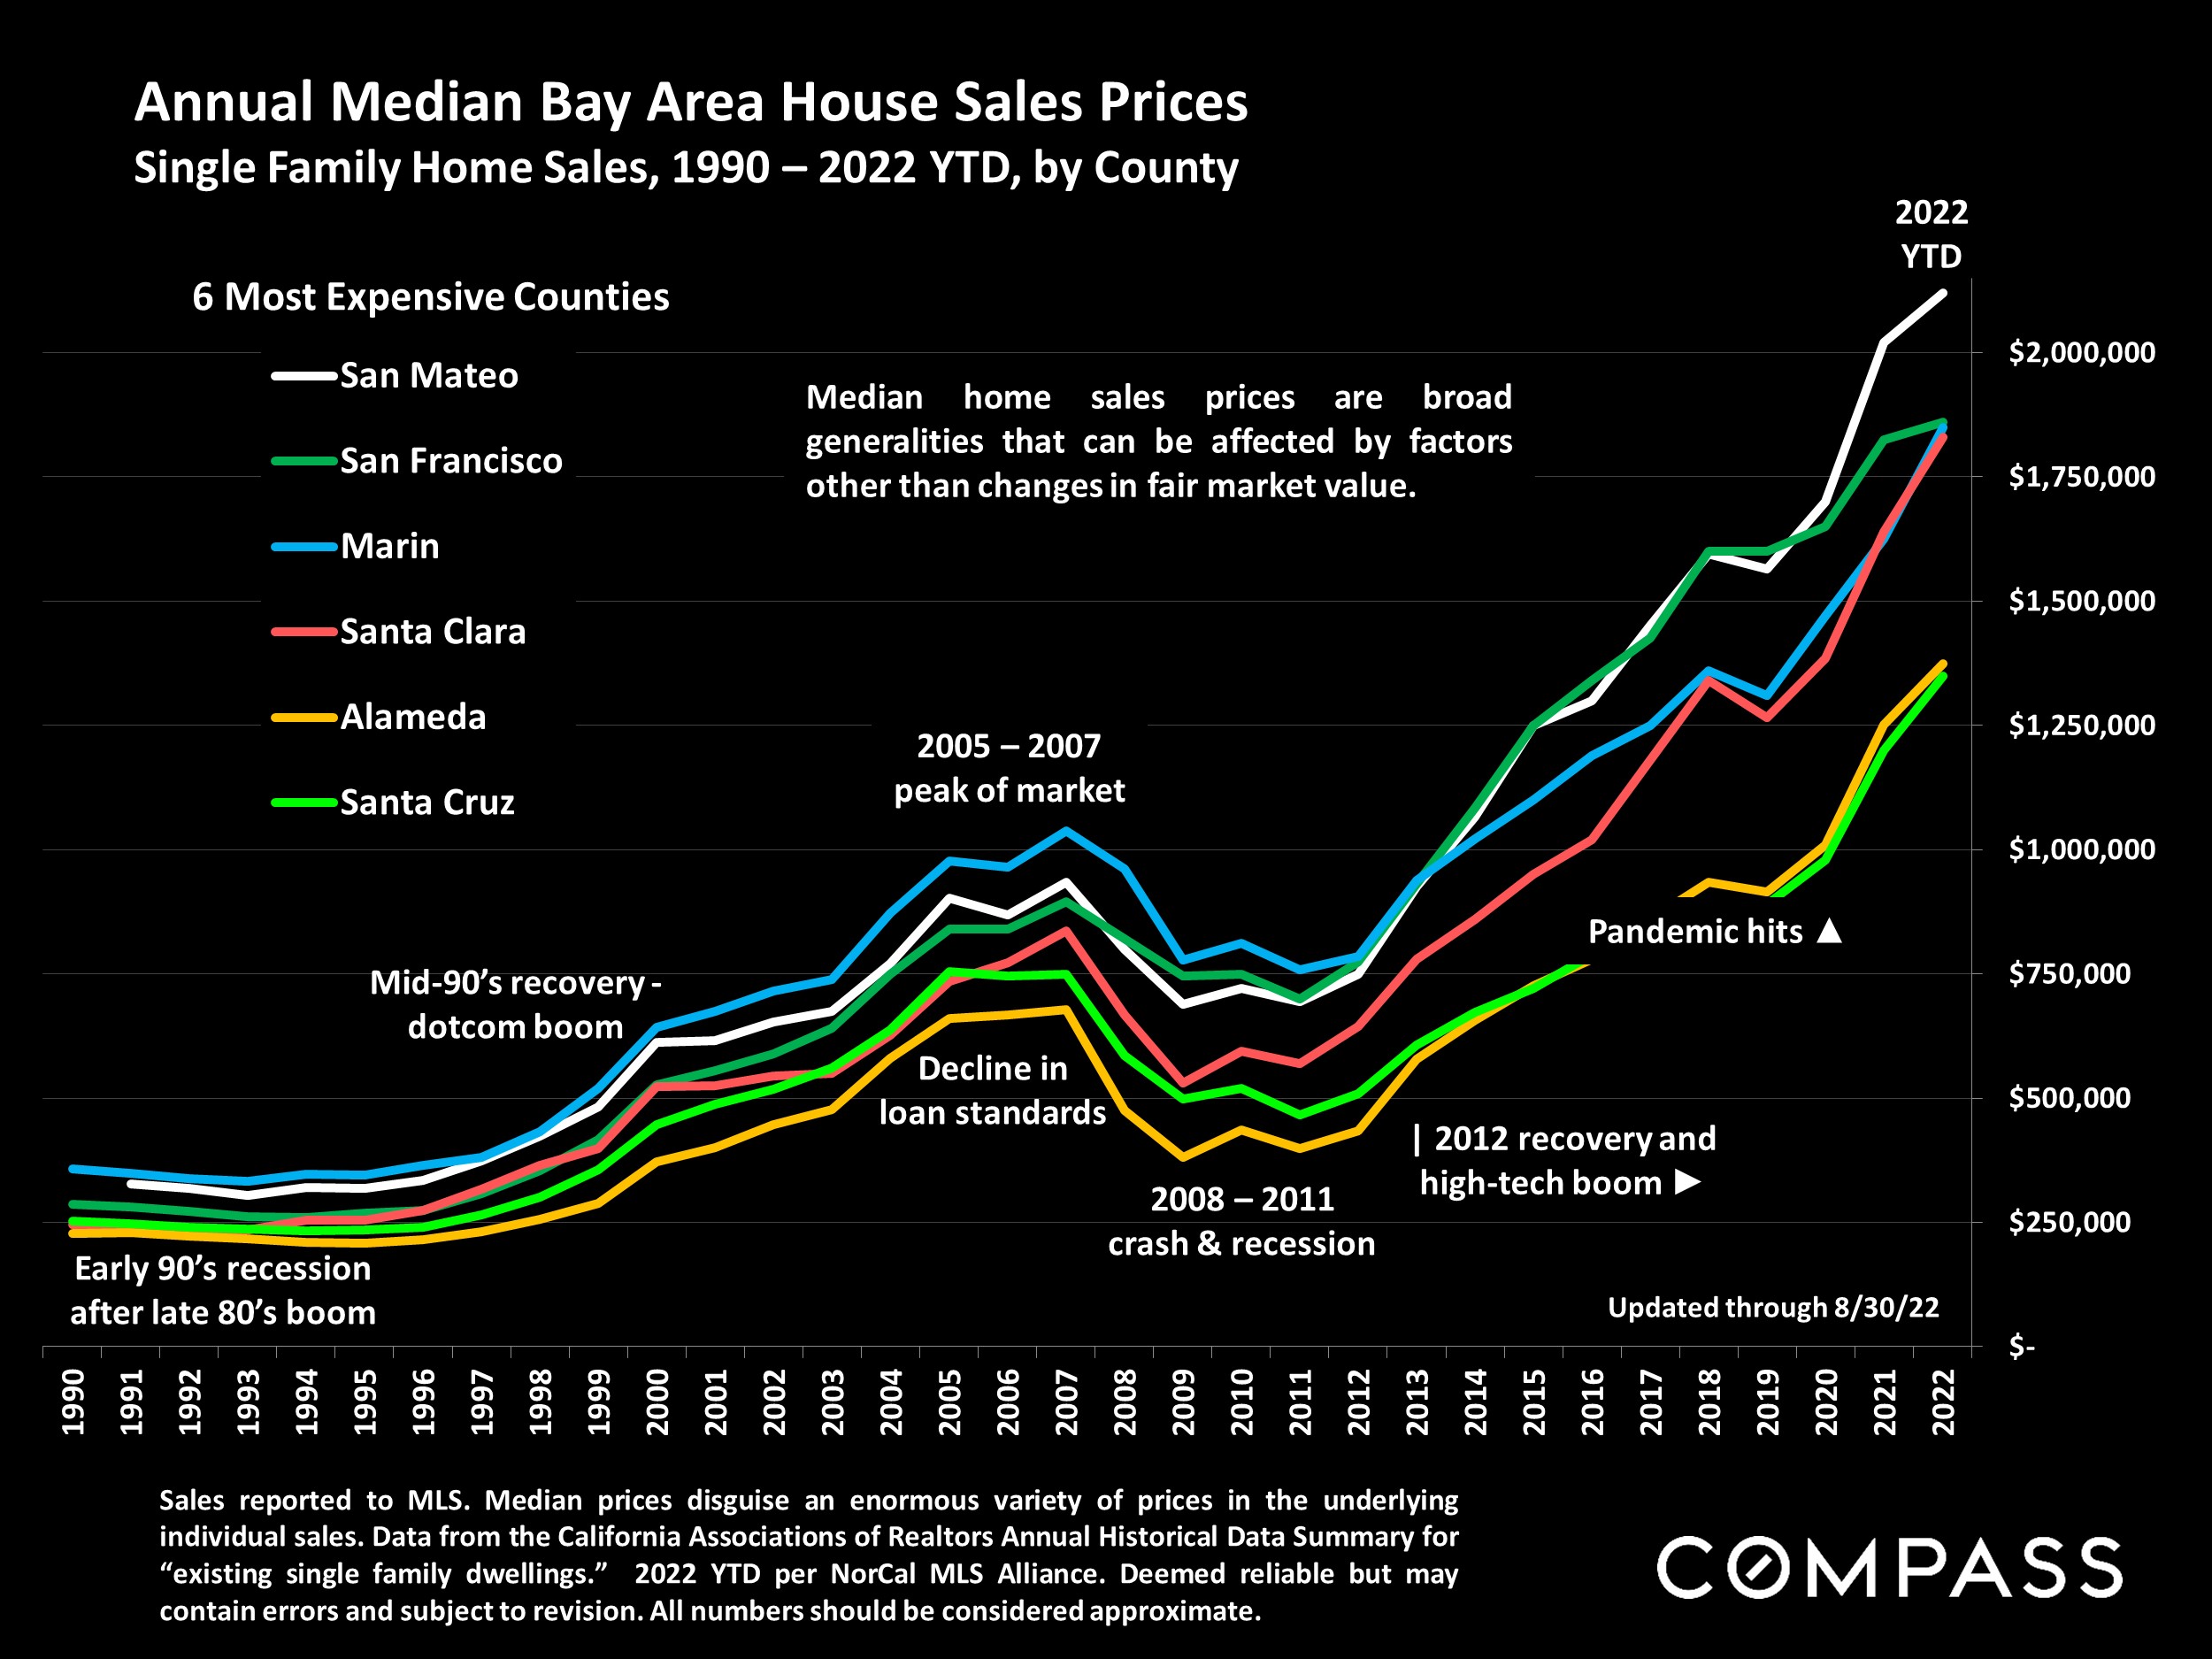
The early 1990’s recession, the dotcom boom, subprime bubble and crash, market recovery, high-tech boom – and pandemic.
Financial and real estate markets have run in cycles for at least hundreds of years. Though varying in their details, causes and effects, there are many similarities in how they play out, providing greater context to how markets work over time.
Many economic, political, demographic and environmental factors play roles in real estate markets, including interest rates, inflation, financial markets, new wealth creation (or destruction), housing affordability, employment, population migration, governmental economic interventions, national and international crises, financial product engineering and manipulation, runaway speculation, regulation and risk management, tax law, debt, natural disasters, and, as we have recently seen, even pandemics.
Human psychology also plays a defining role, with optimism, confidence, and often, ultimately, “irrational exuberance” fueling upcycles. (“The world is different now. The old rules don’t apply, and these boom times can continue indefinitely.”) Conversely, fear, doubt and pessimism play a role in the shift to, and then underpin down-cycles. (“The housing market probably won’t recover in our lifetimes.”) Whatever the phase of the cycle, people tend to believe it will last forever, but, of course, the nature of cycles is to keep turning.
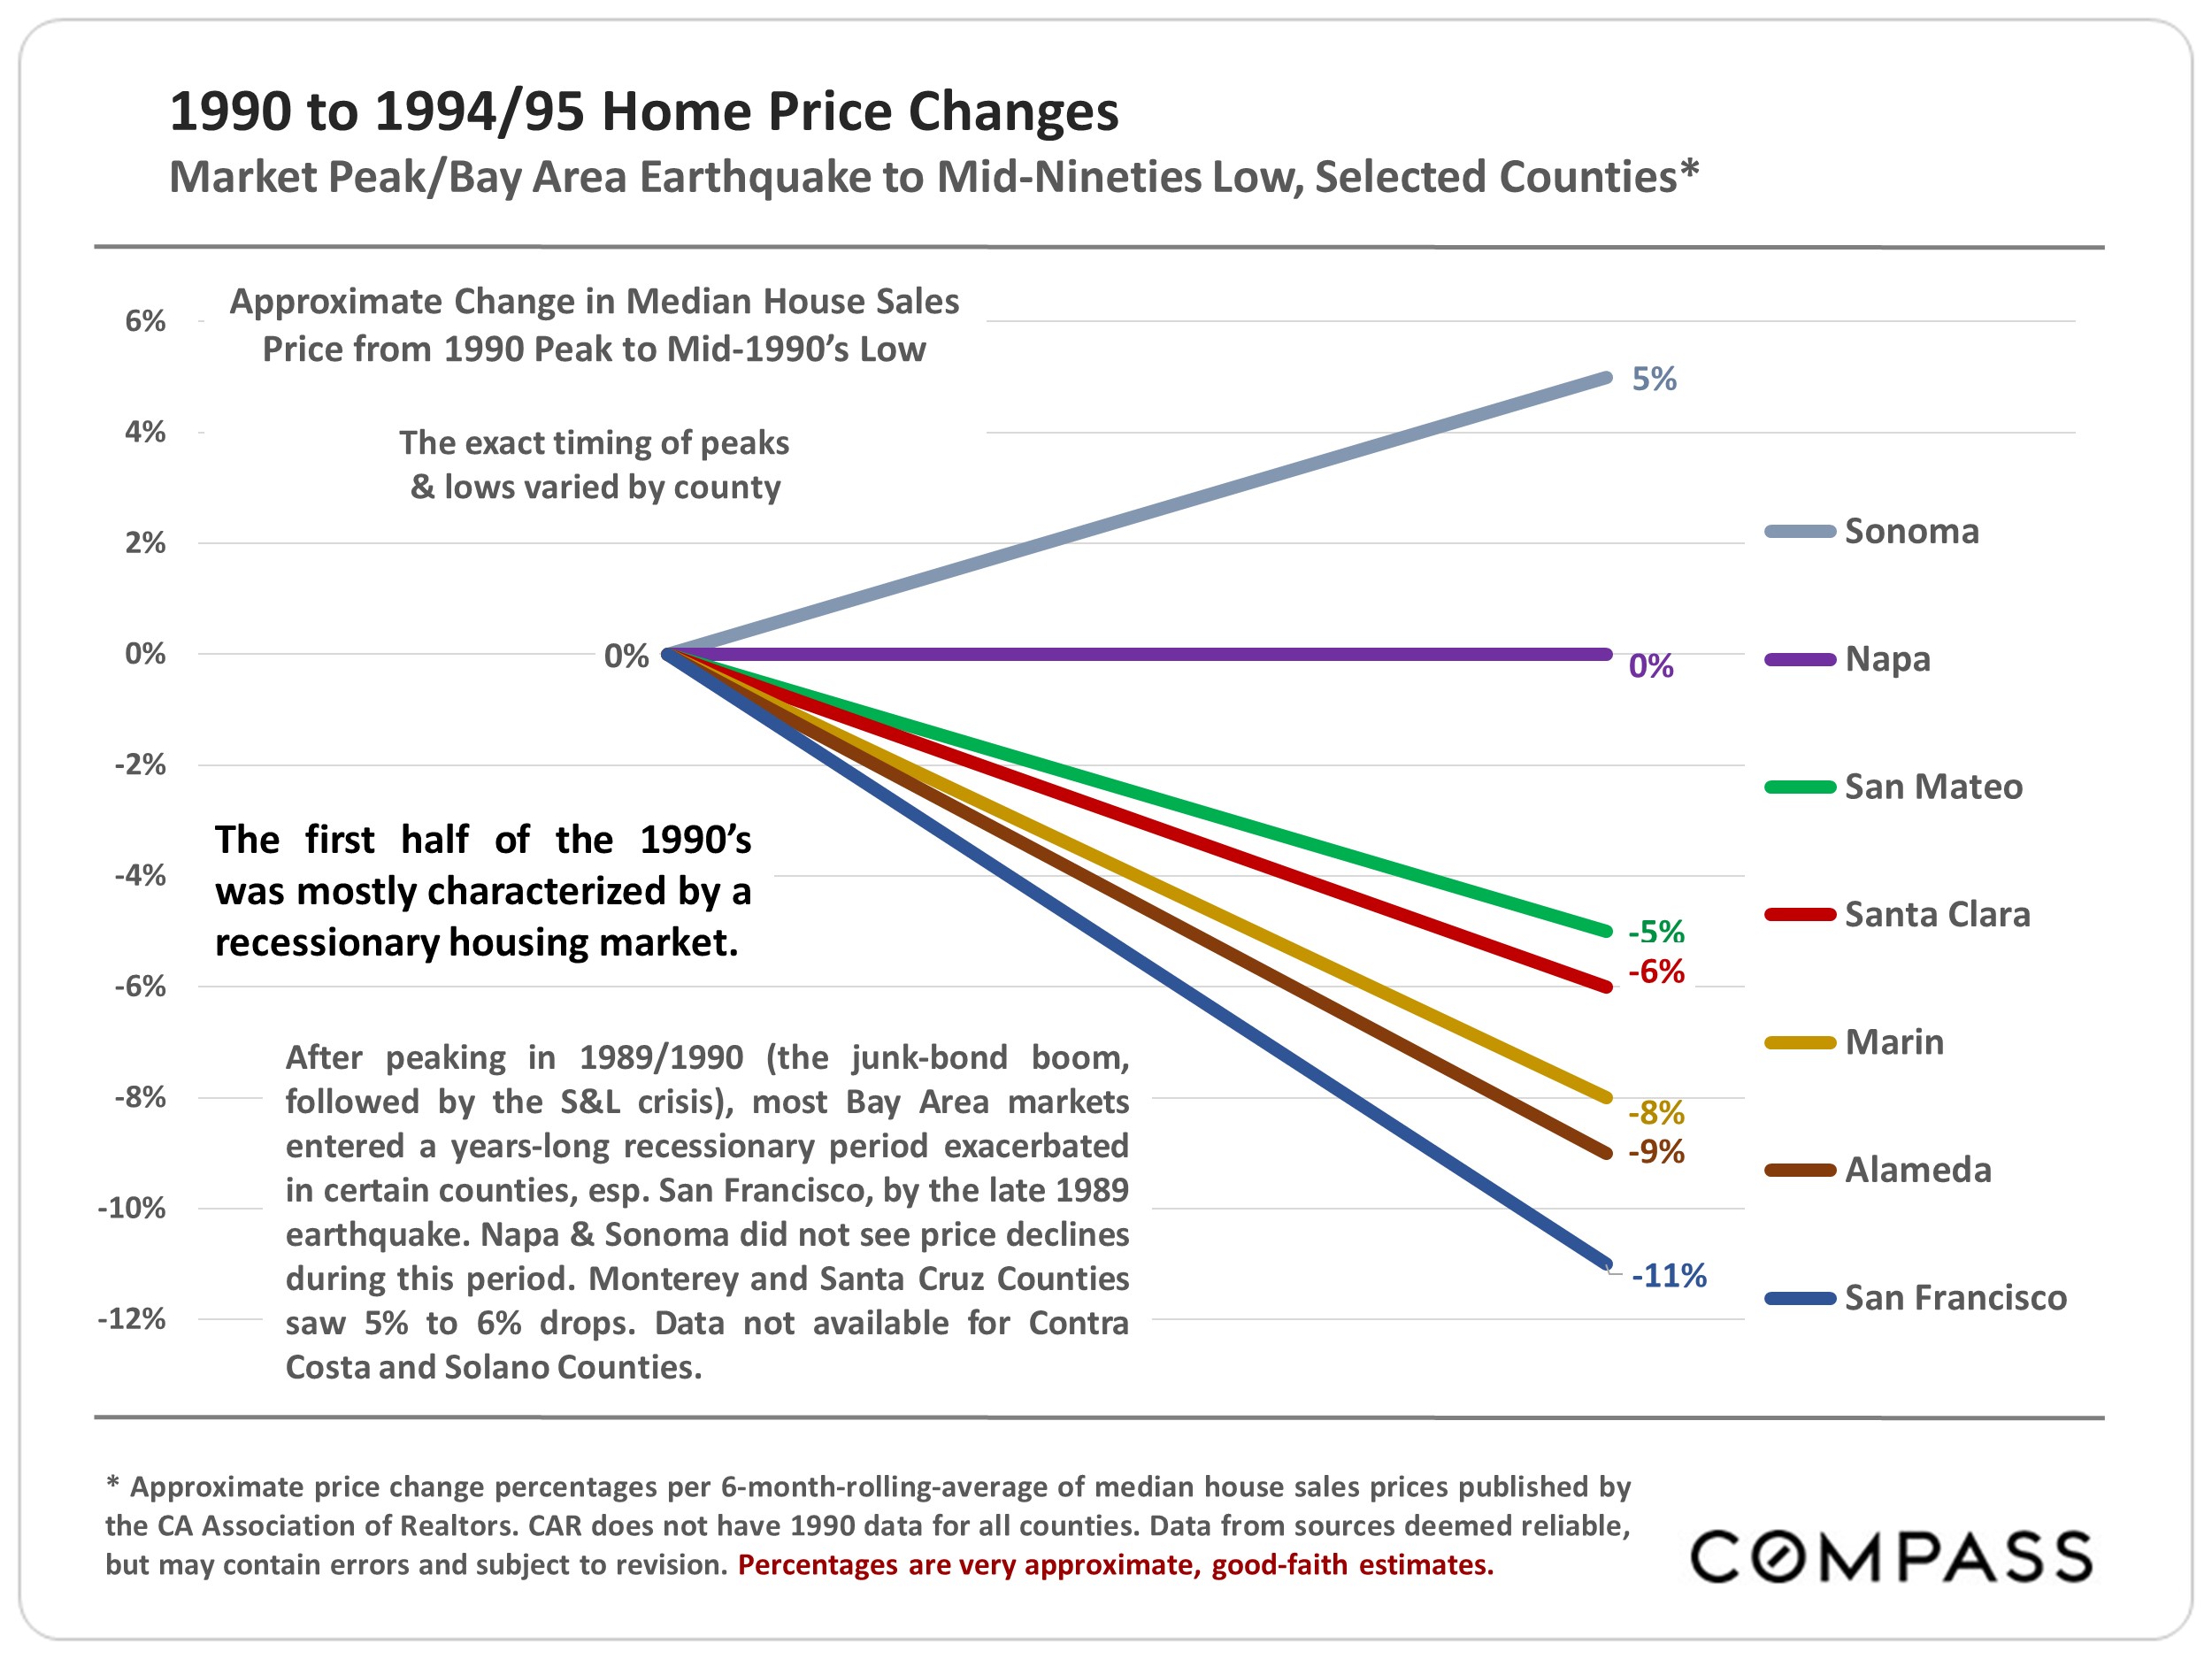
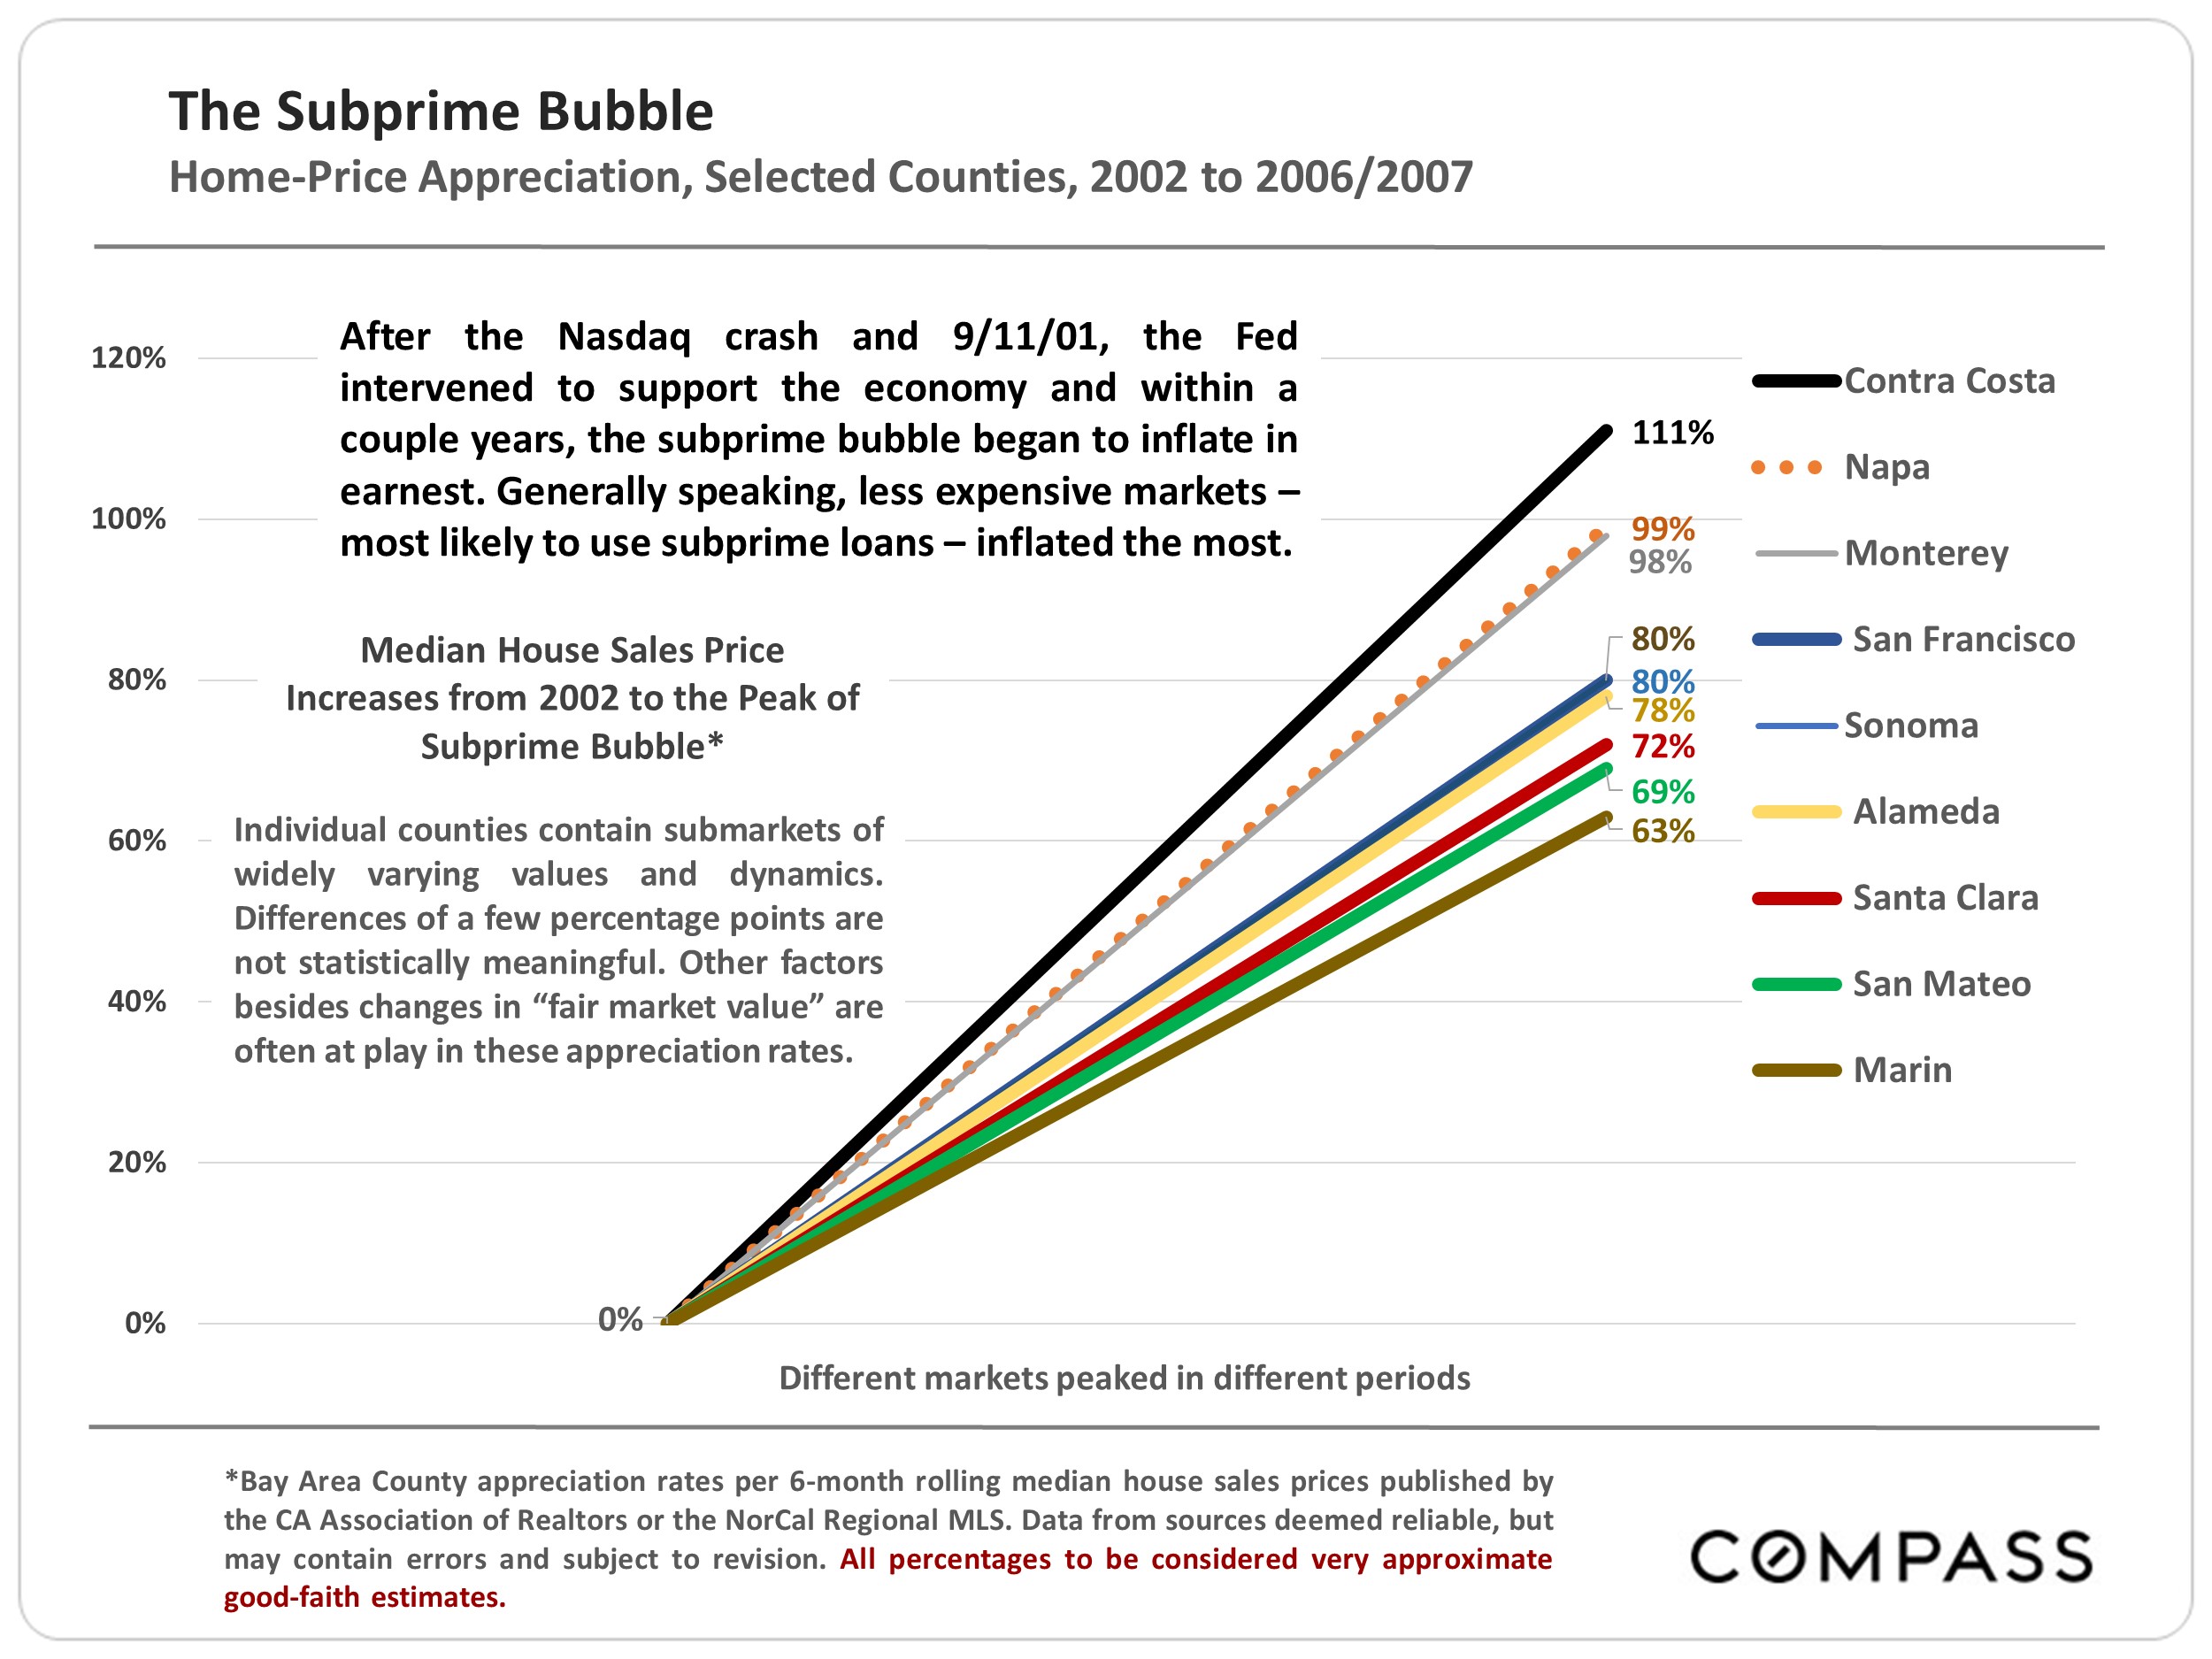
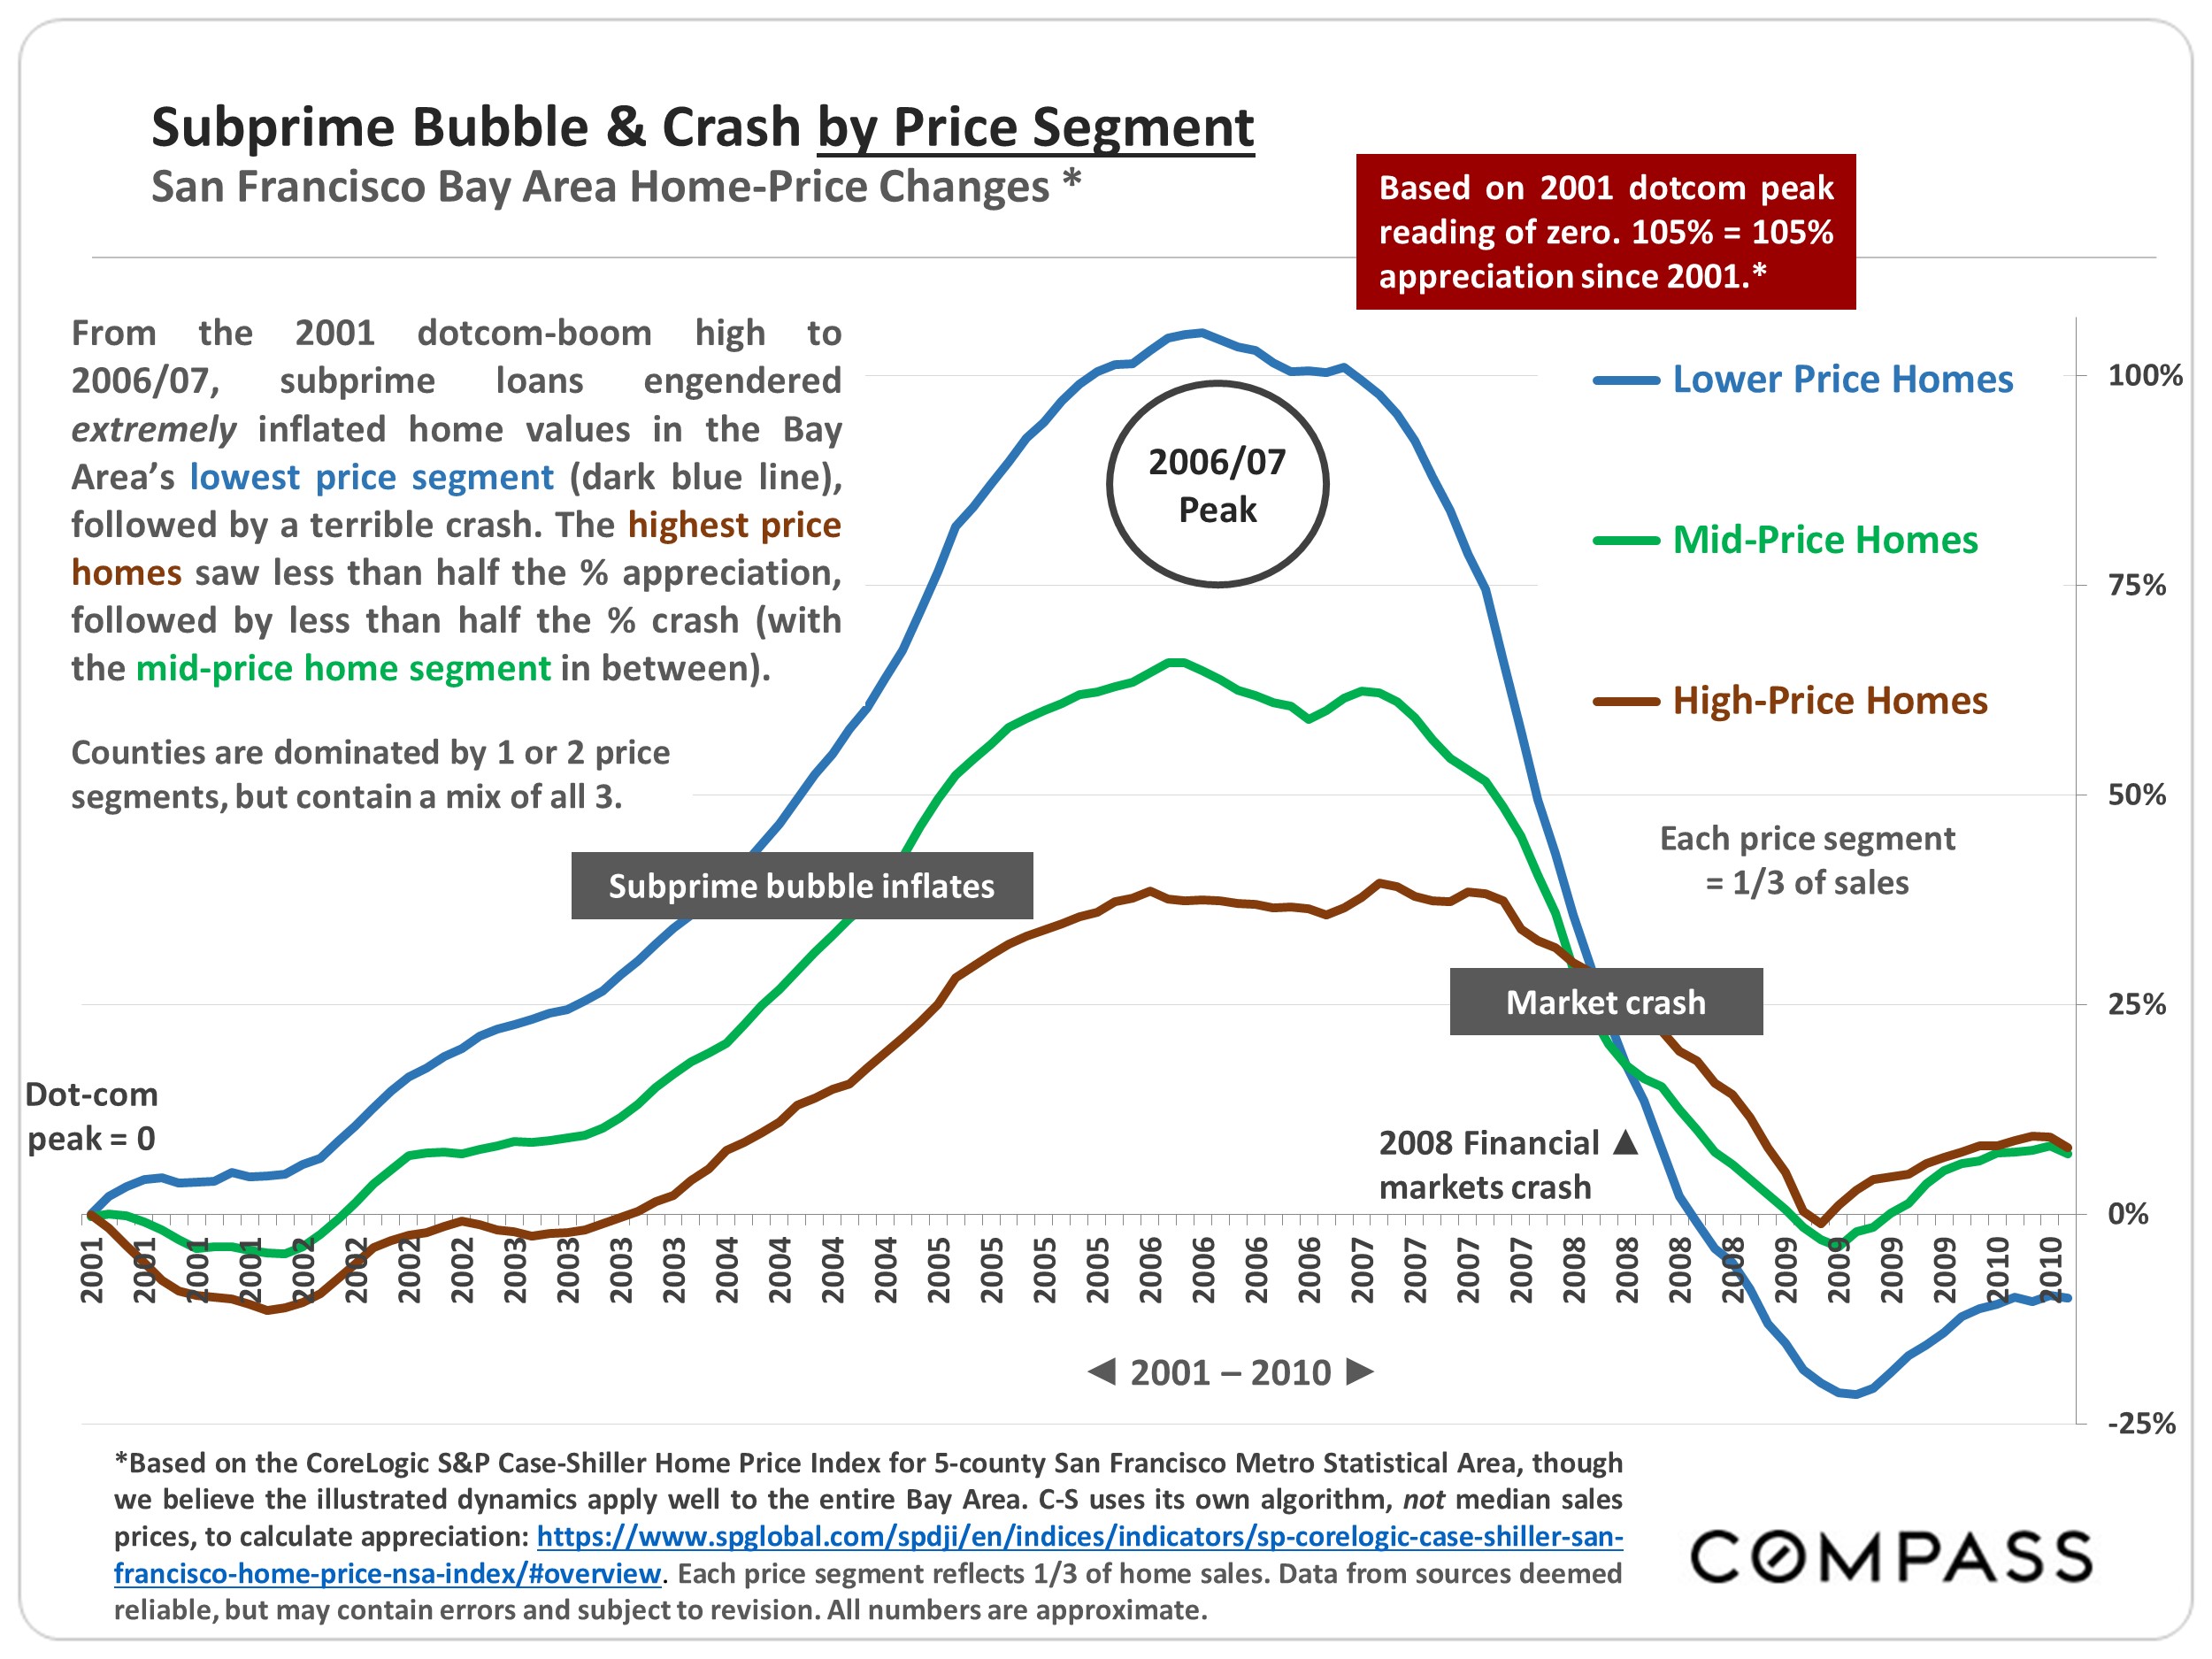
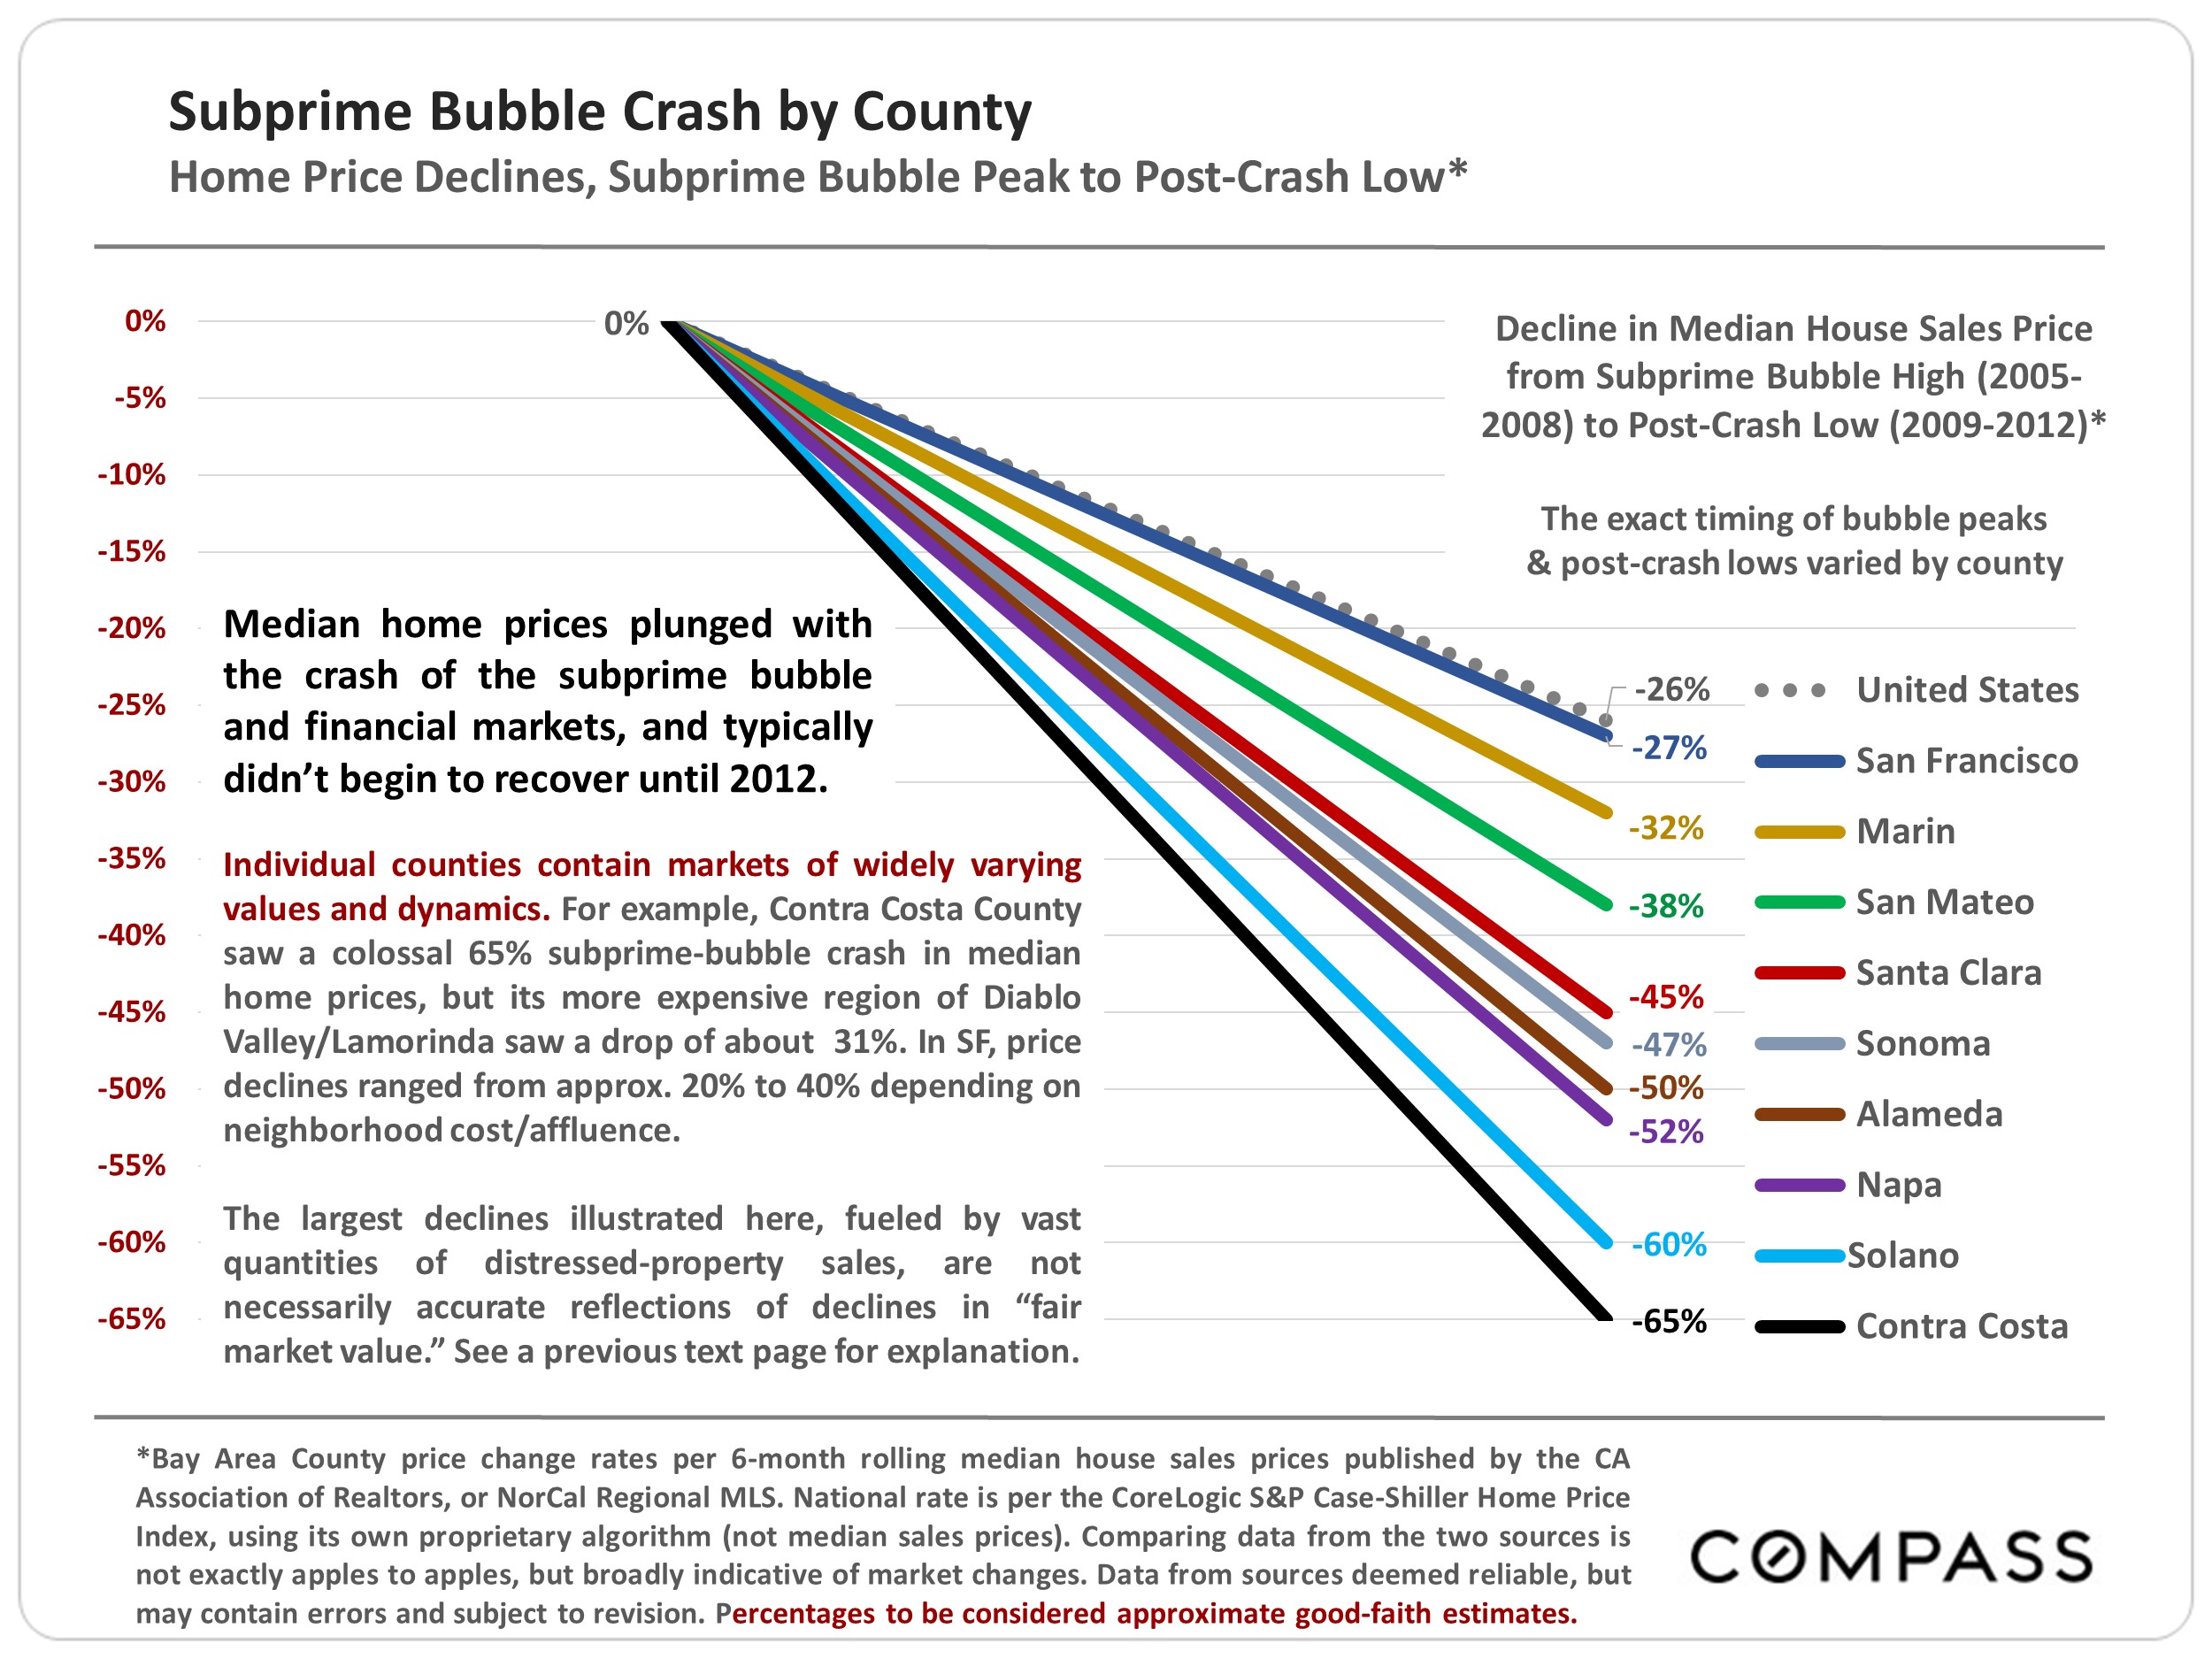
It is extremely difficult to predict when different parts of a cycle will begin or end. Boom times, even periods of “irrational exuberance,” can go on much longer than expected, or get second winds, with huge jumps in values. On the other hand, negative shocks can appear with startling suddenness, often triggered by unexpected events or factors that affect a variety of economic fundamentals, hammer confidence, and cause shifts into slowdowns, “market corrections” or recessions of varying degrees and duration. These negative adjustments can feel like a switch being flipped, the slow deflation of a tire with a small puncture, or traffic going 120 miles per hour suddenly decelerating. Prices can flatten, adjust 5% to 10%, or, as with the subprime bubble, crash. (The subprime bubble and crash was caused by very unusual circumstances, as discussed later in this report.)
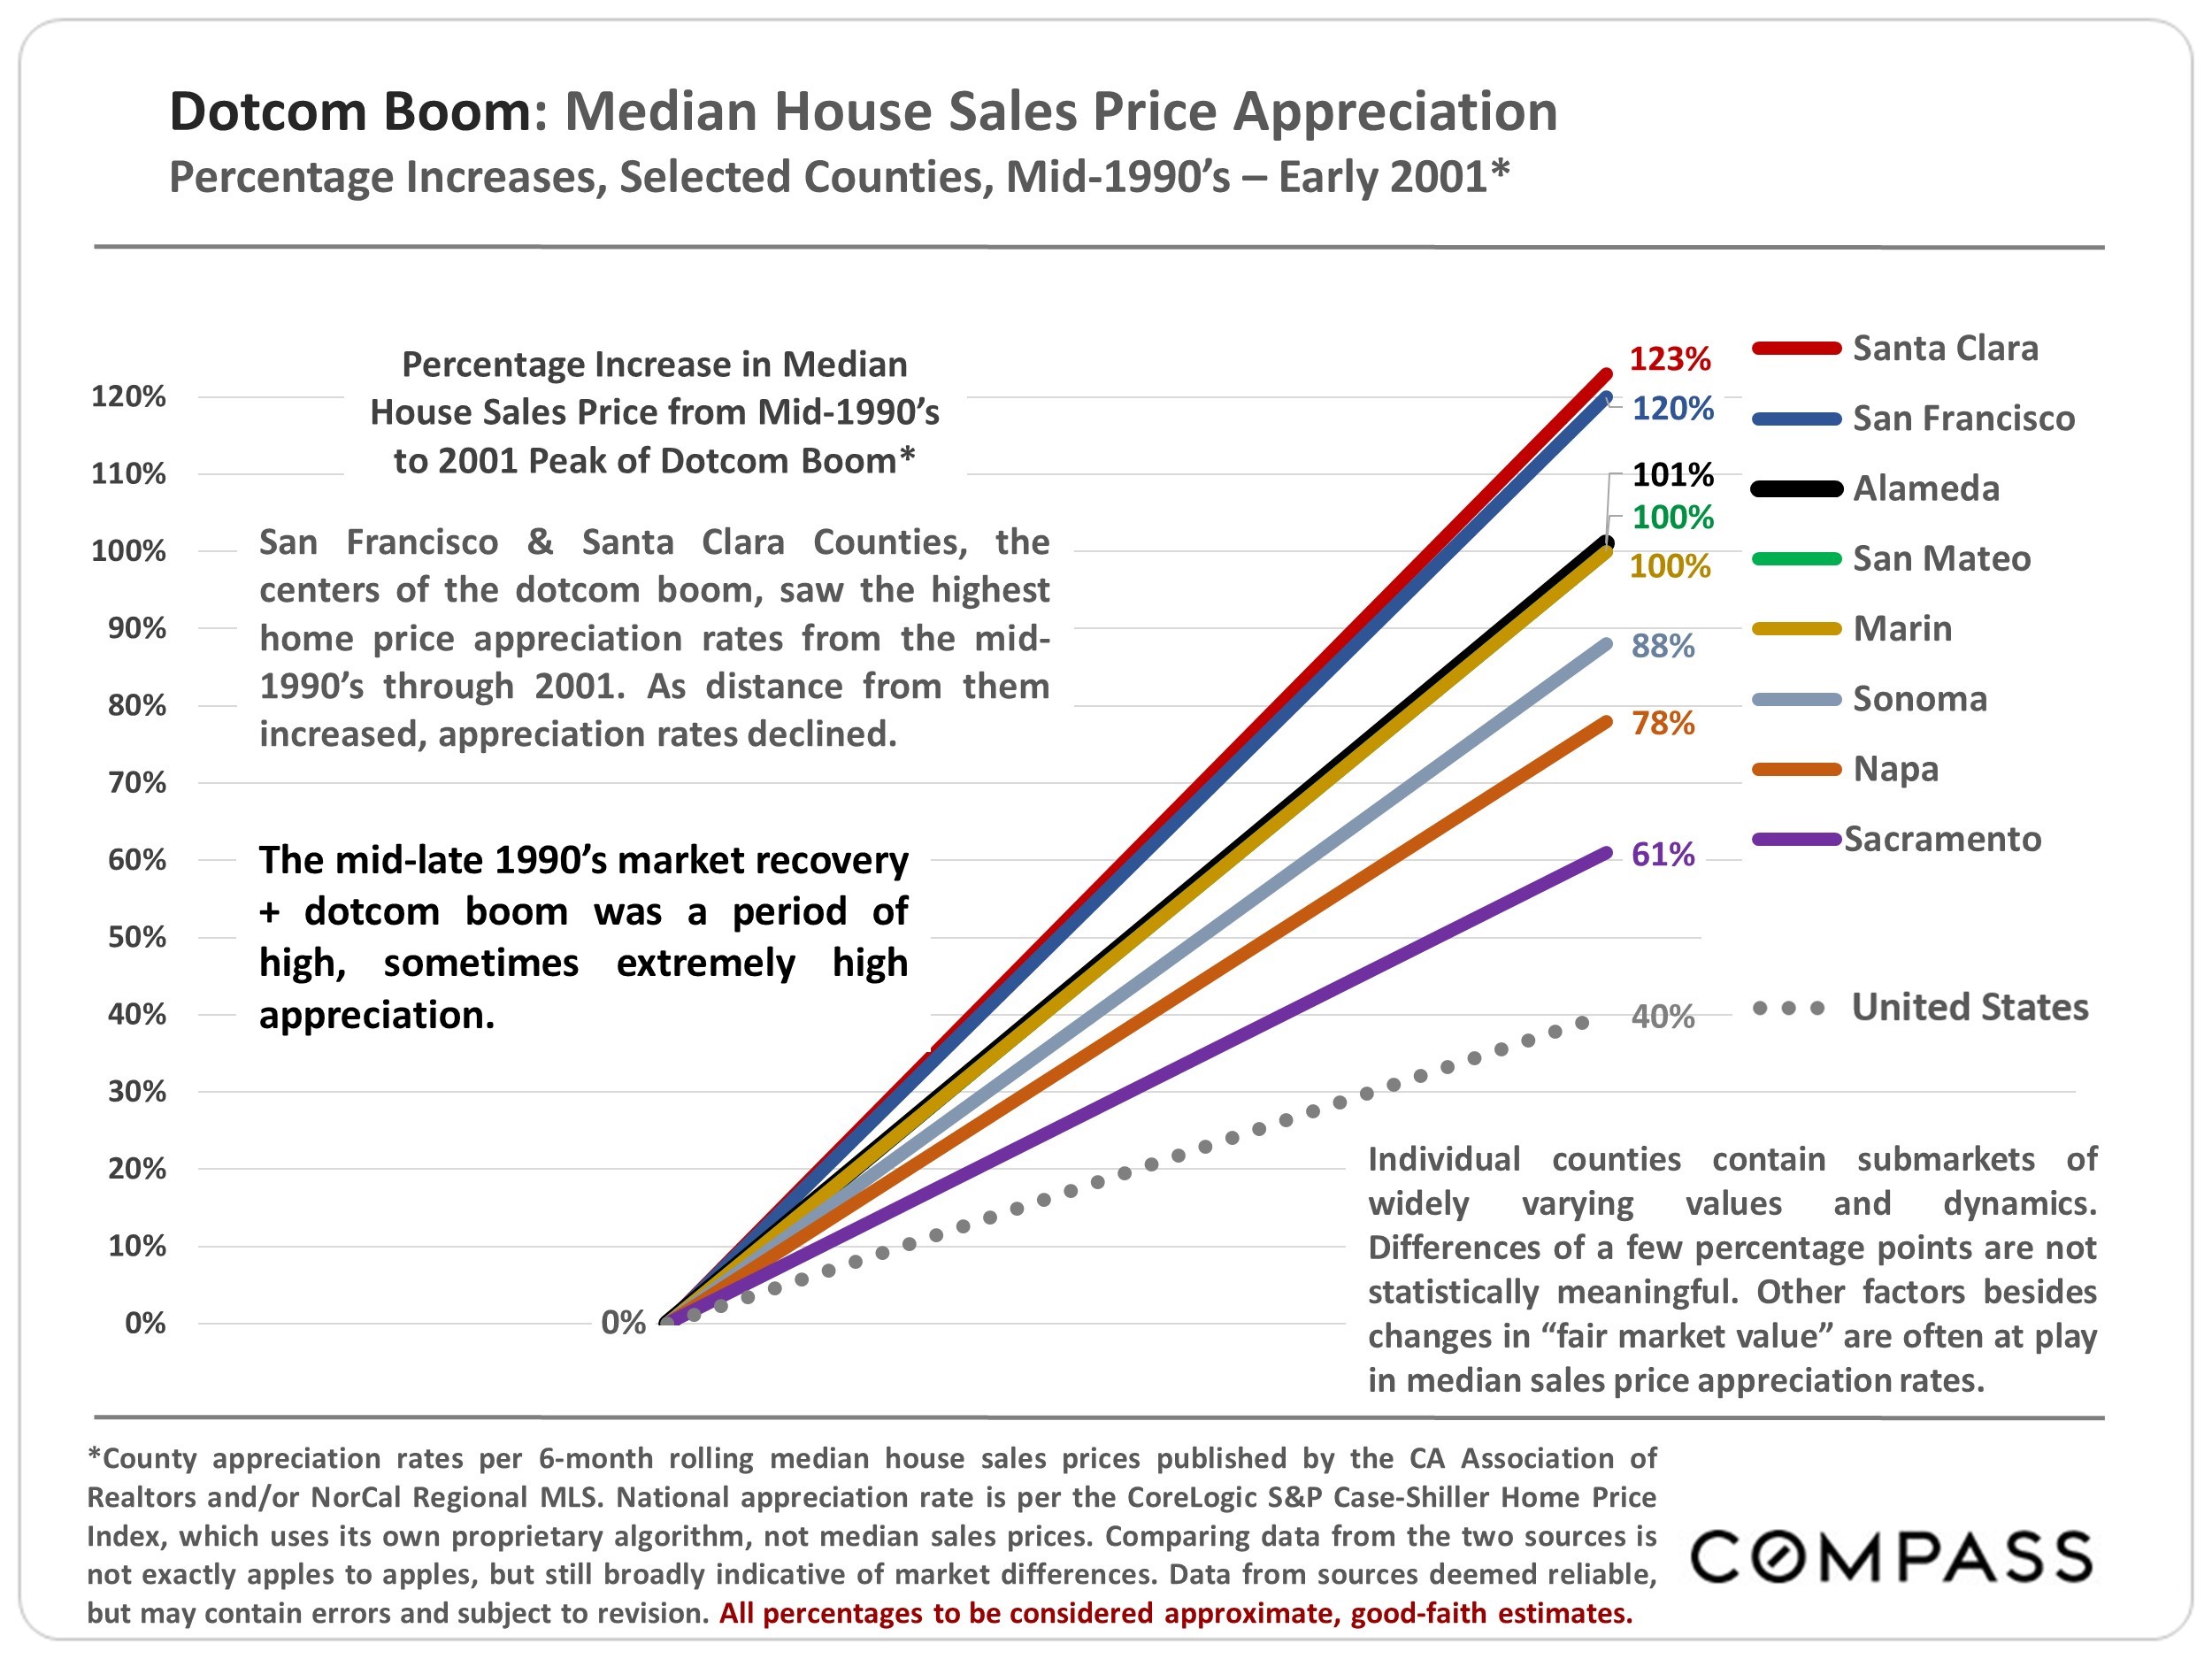
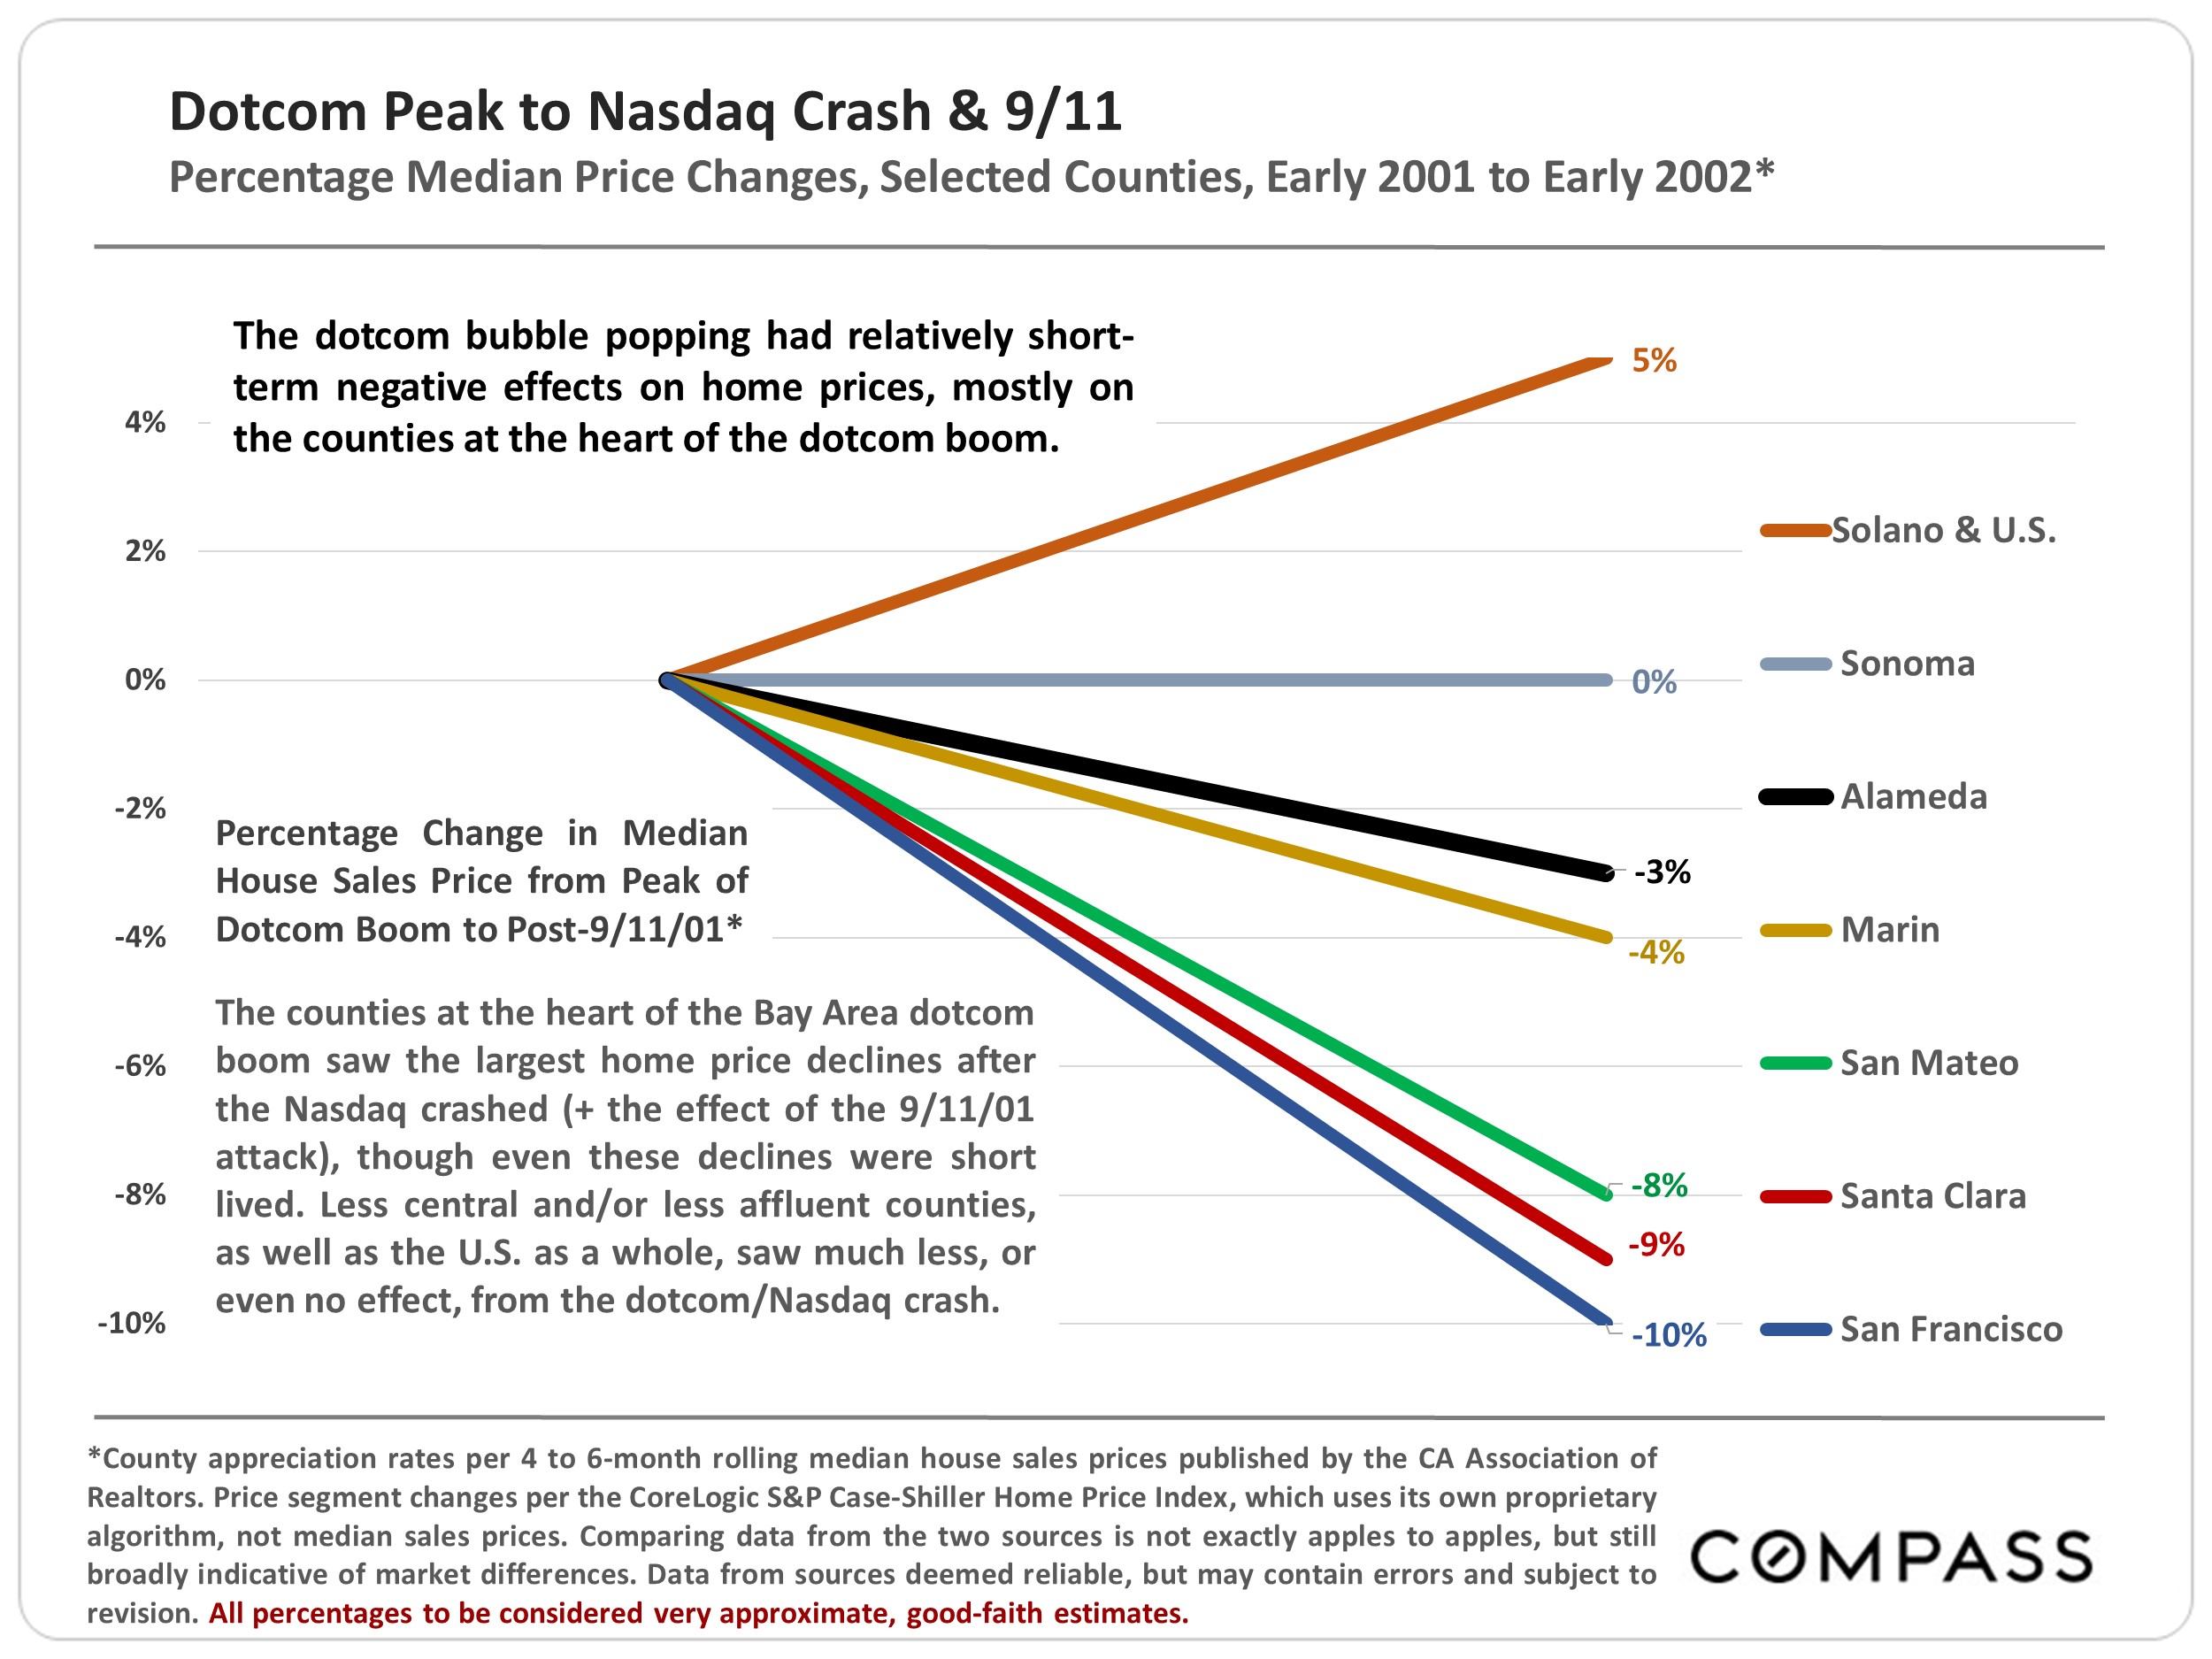
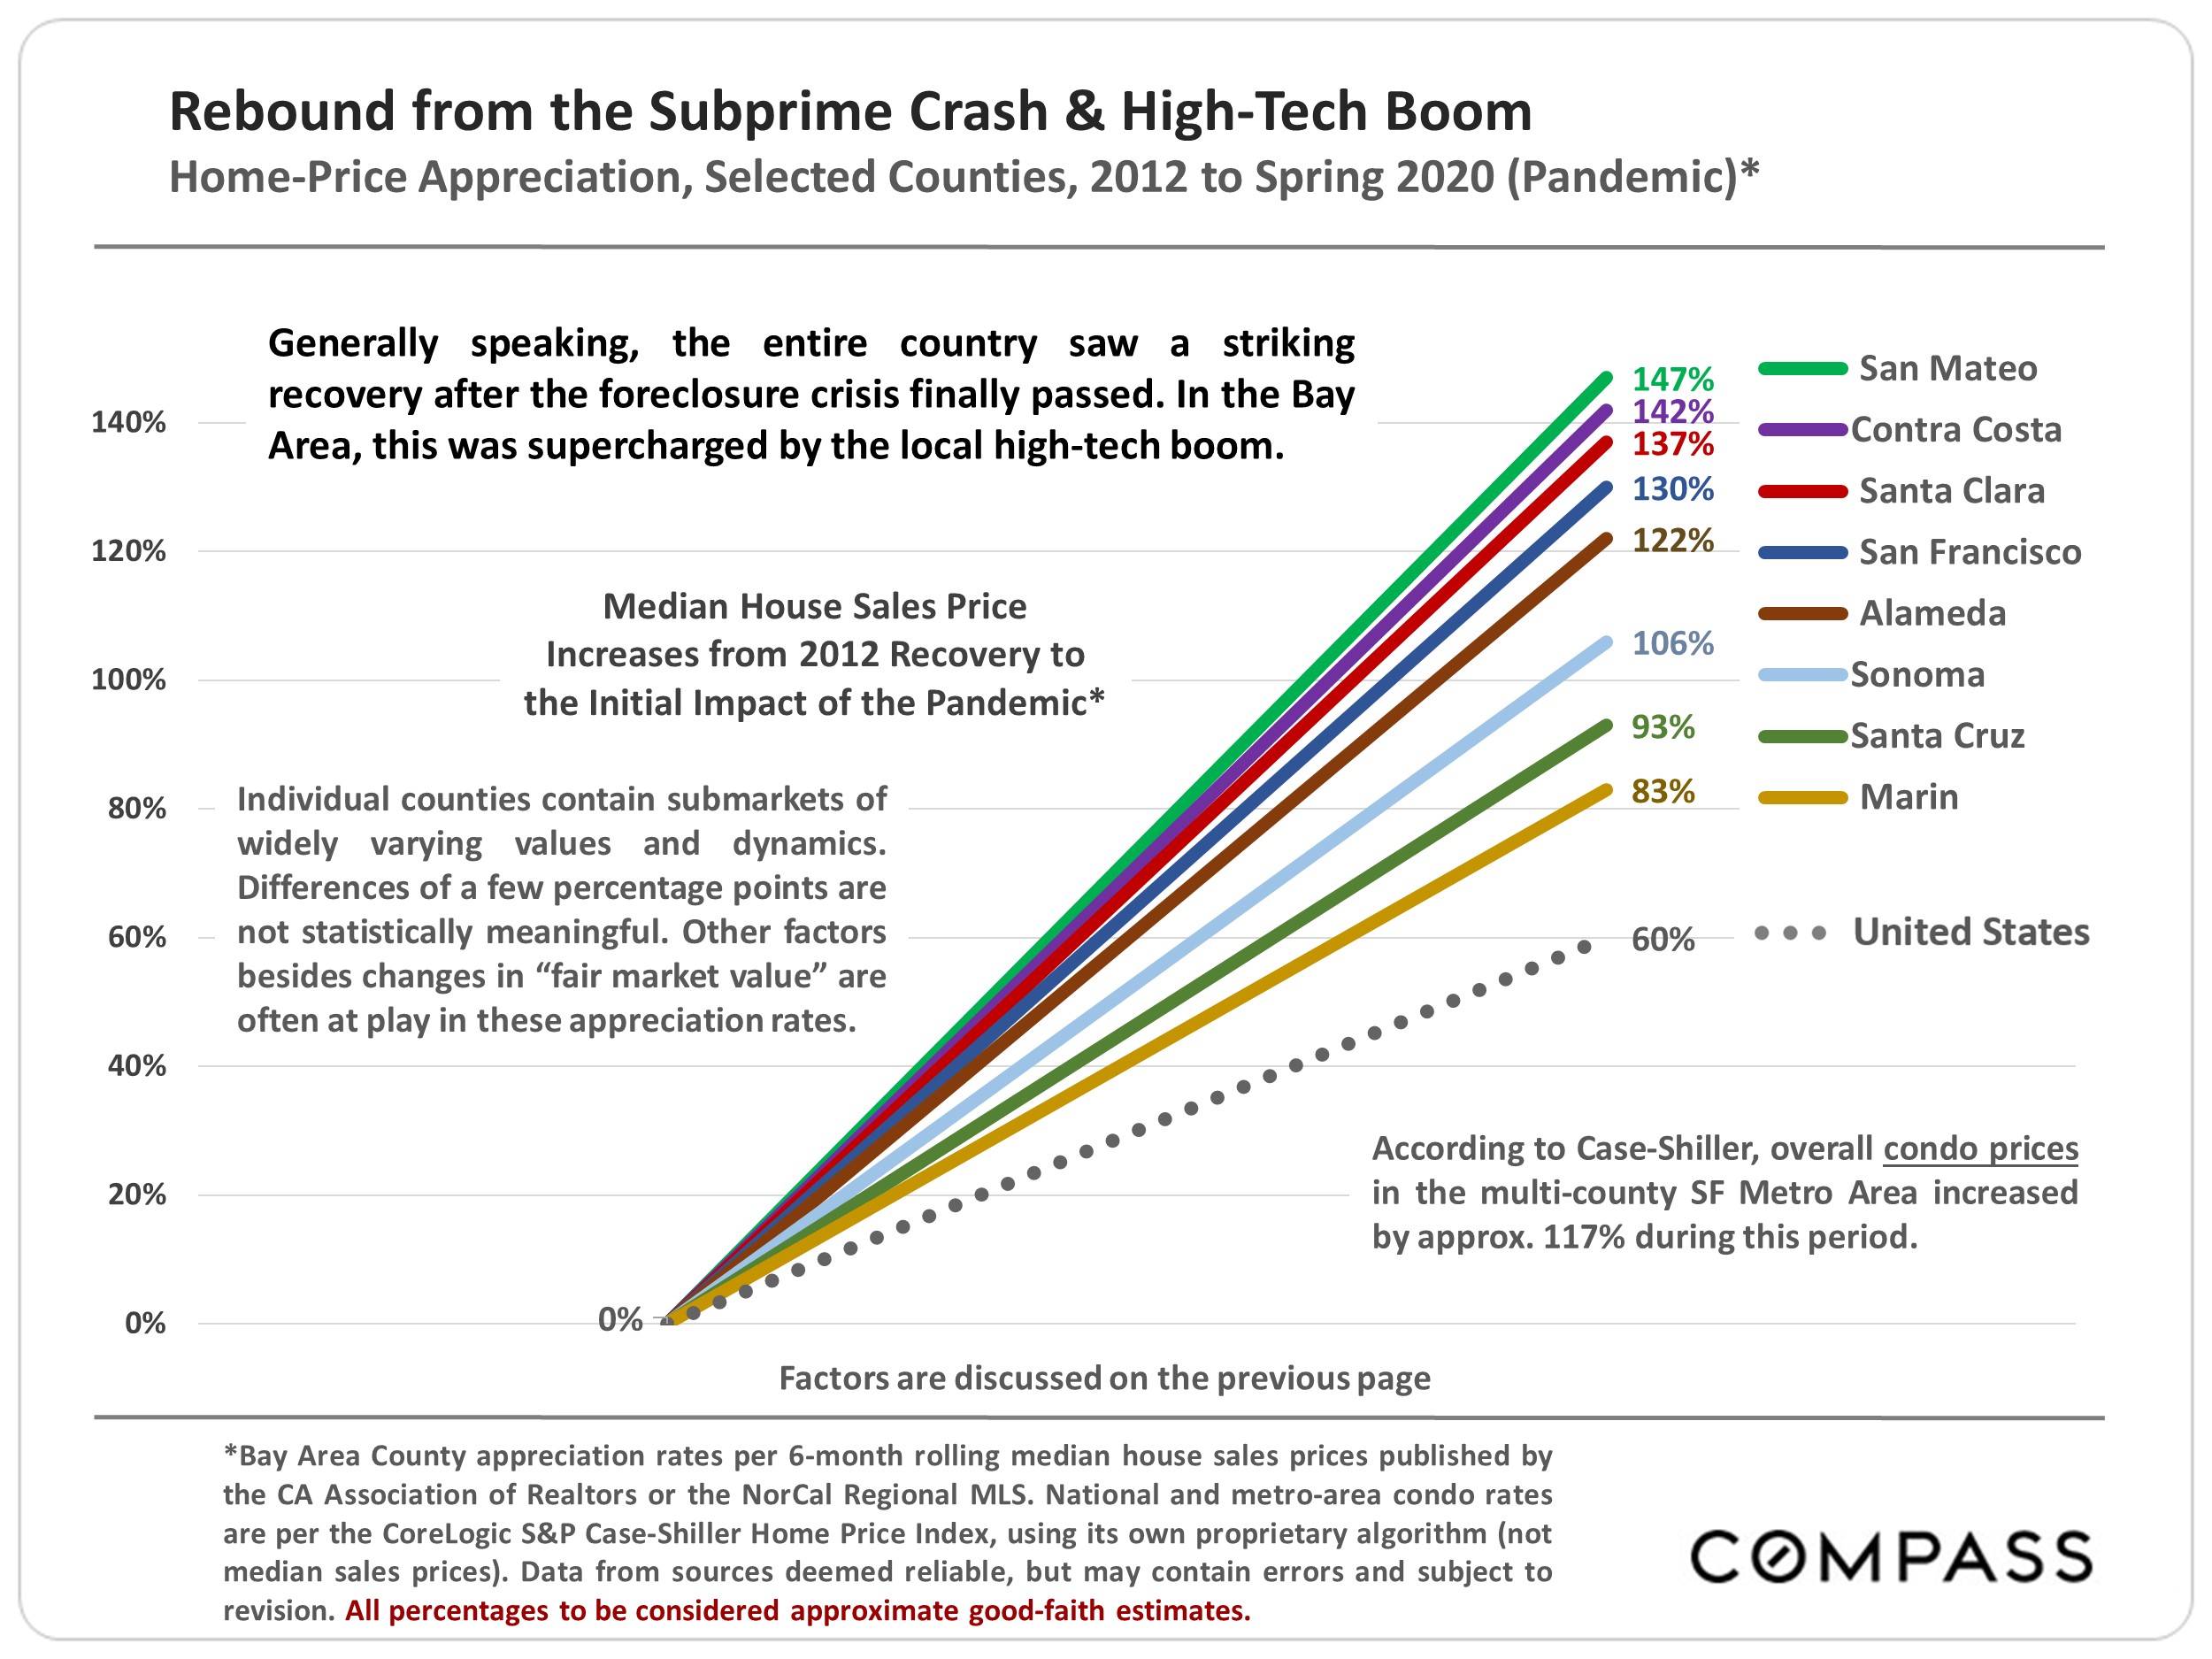
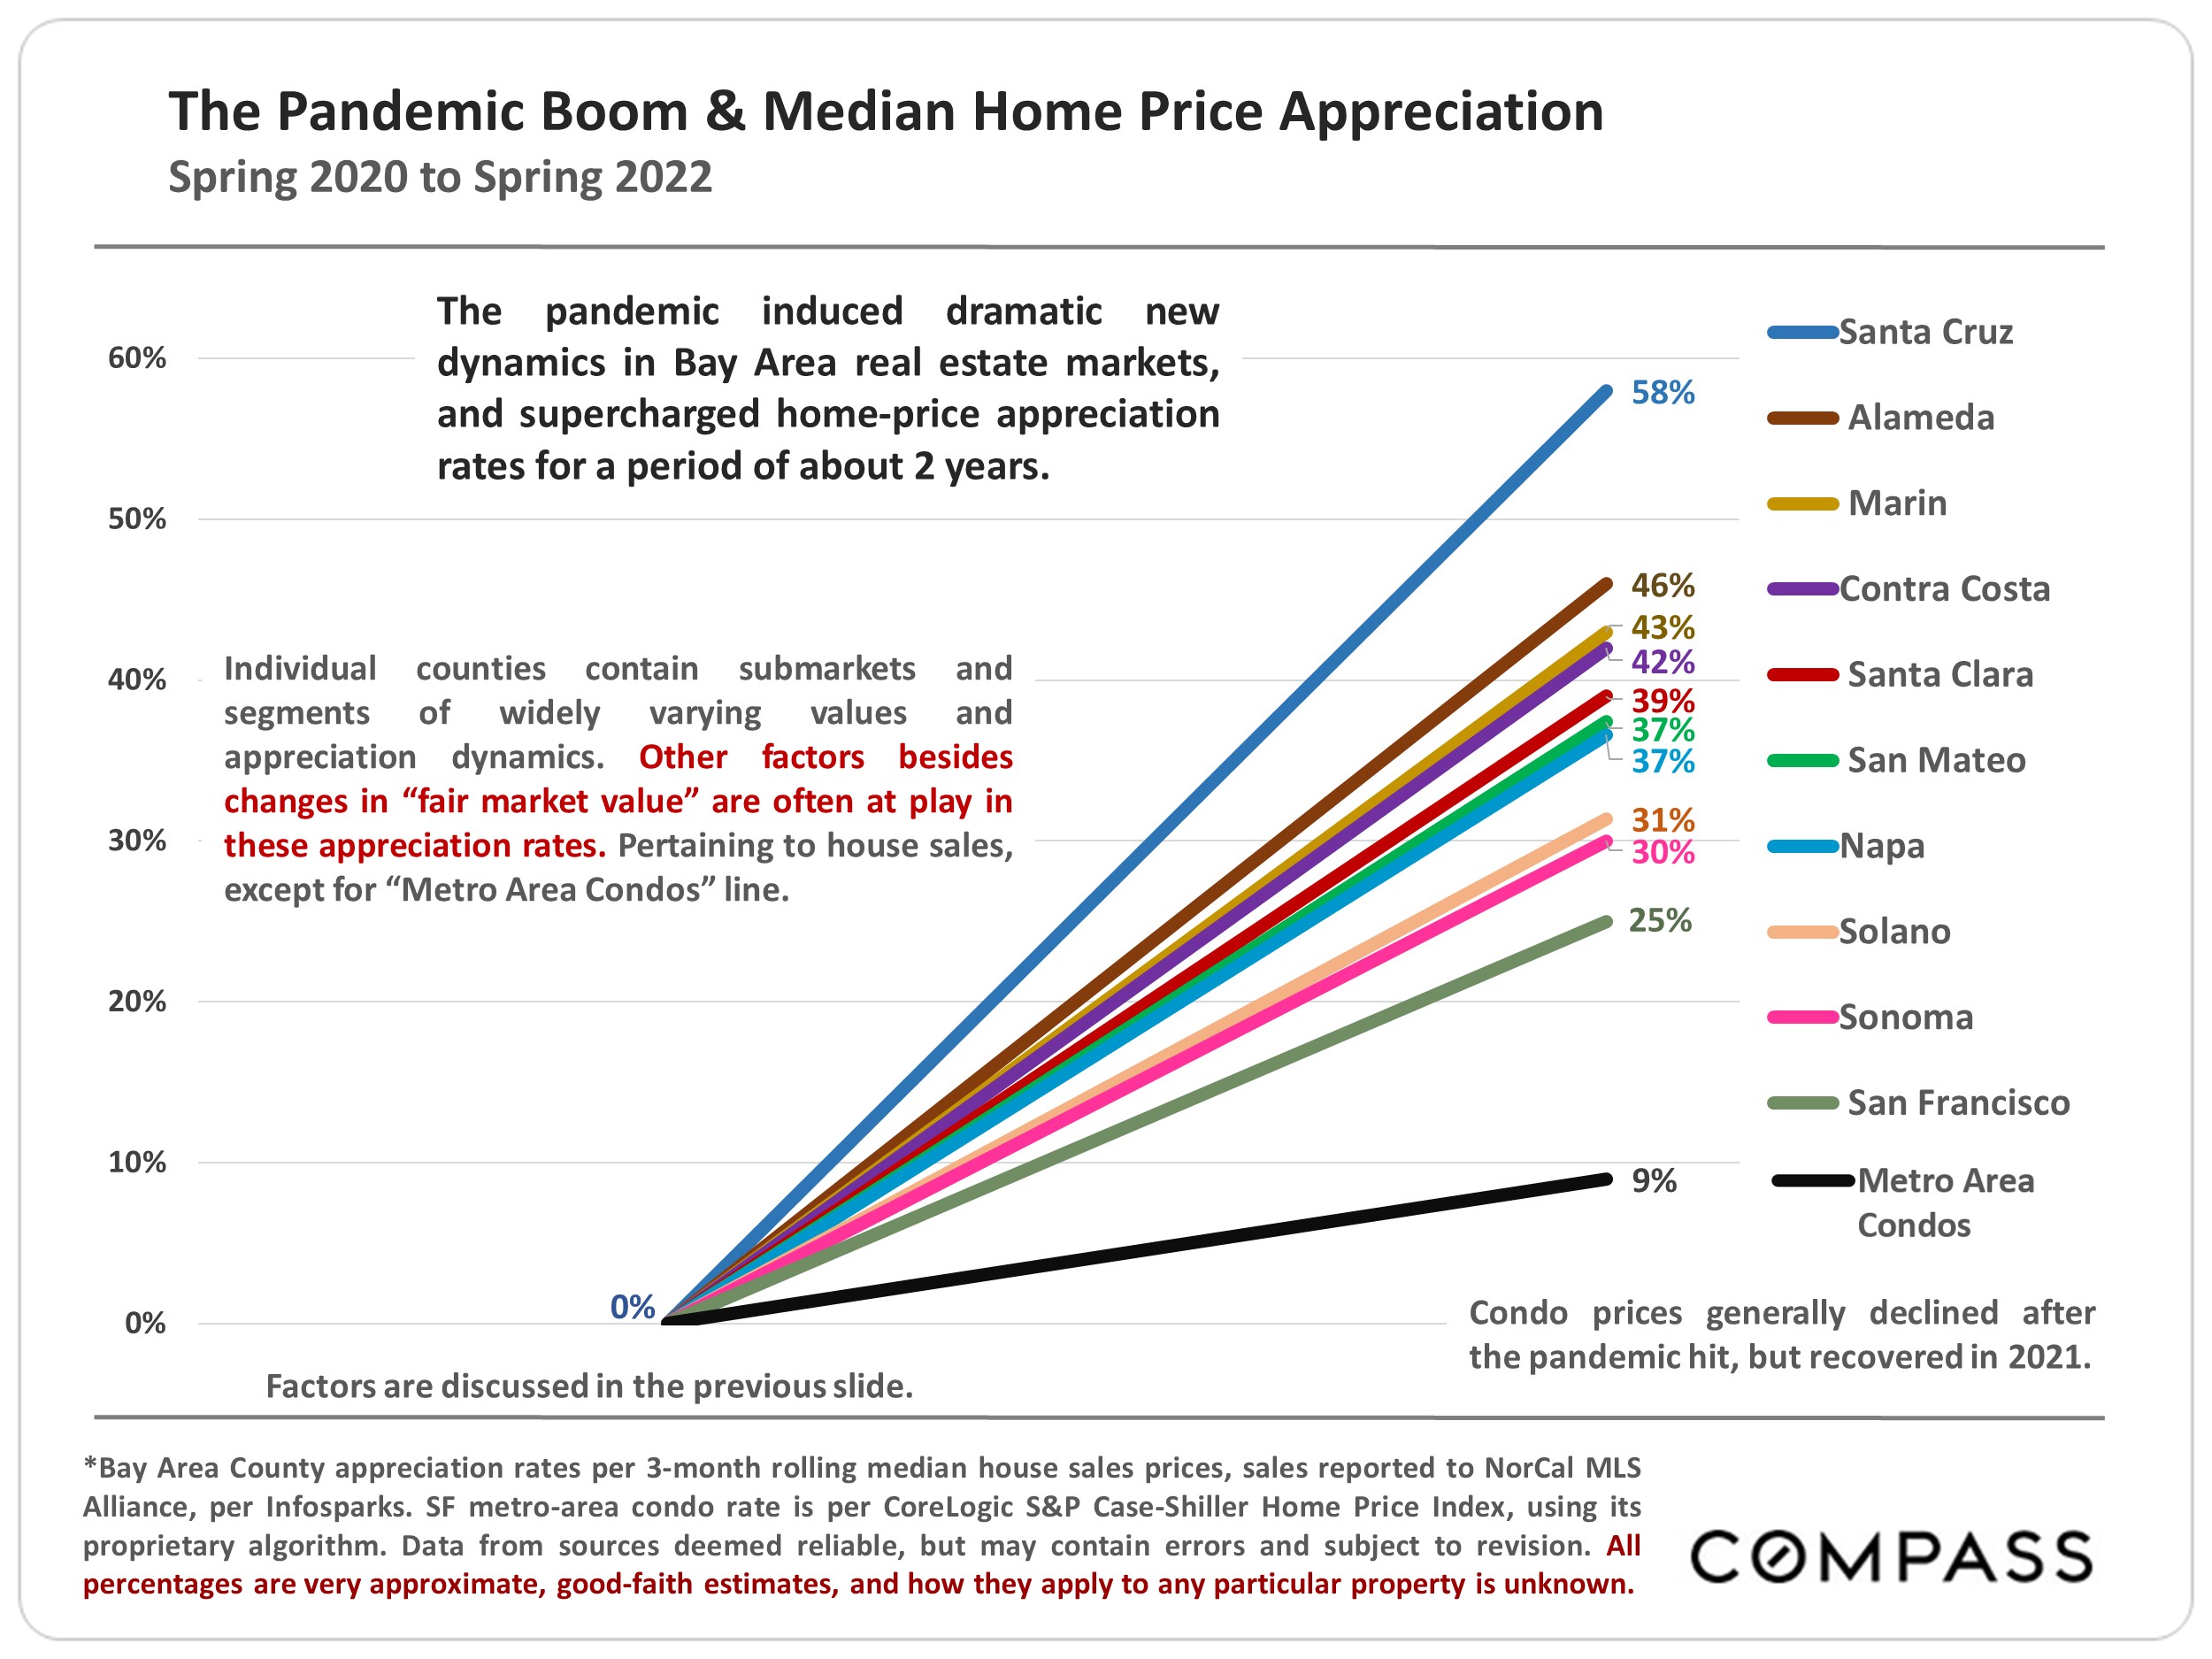
It’s interesting to note that different markets often behaved very differently during the various cycles, depending on the factors at play. As one example, San Francisco’s market was hit hardest after the 1989 earthquake; saw one of the highest appreciation rates during the dotcom boom – and a bigger price drop after it popped; a moderate-sized subprime bubble and crash; very high appreciation after the 2012 recovery and subsequent high-tech boom; but then a relatively low appreciation rate as compared to surrounding counties, after the pandemic hit. In real estate, the devil is always in the details.
Source: Compass
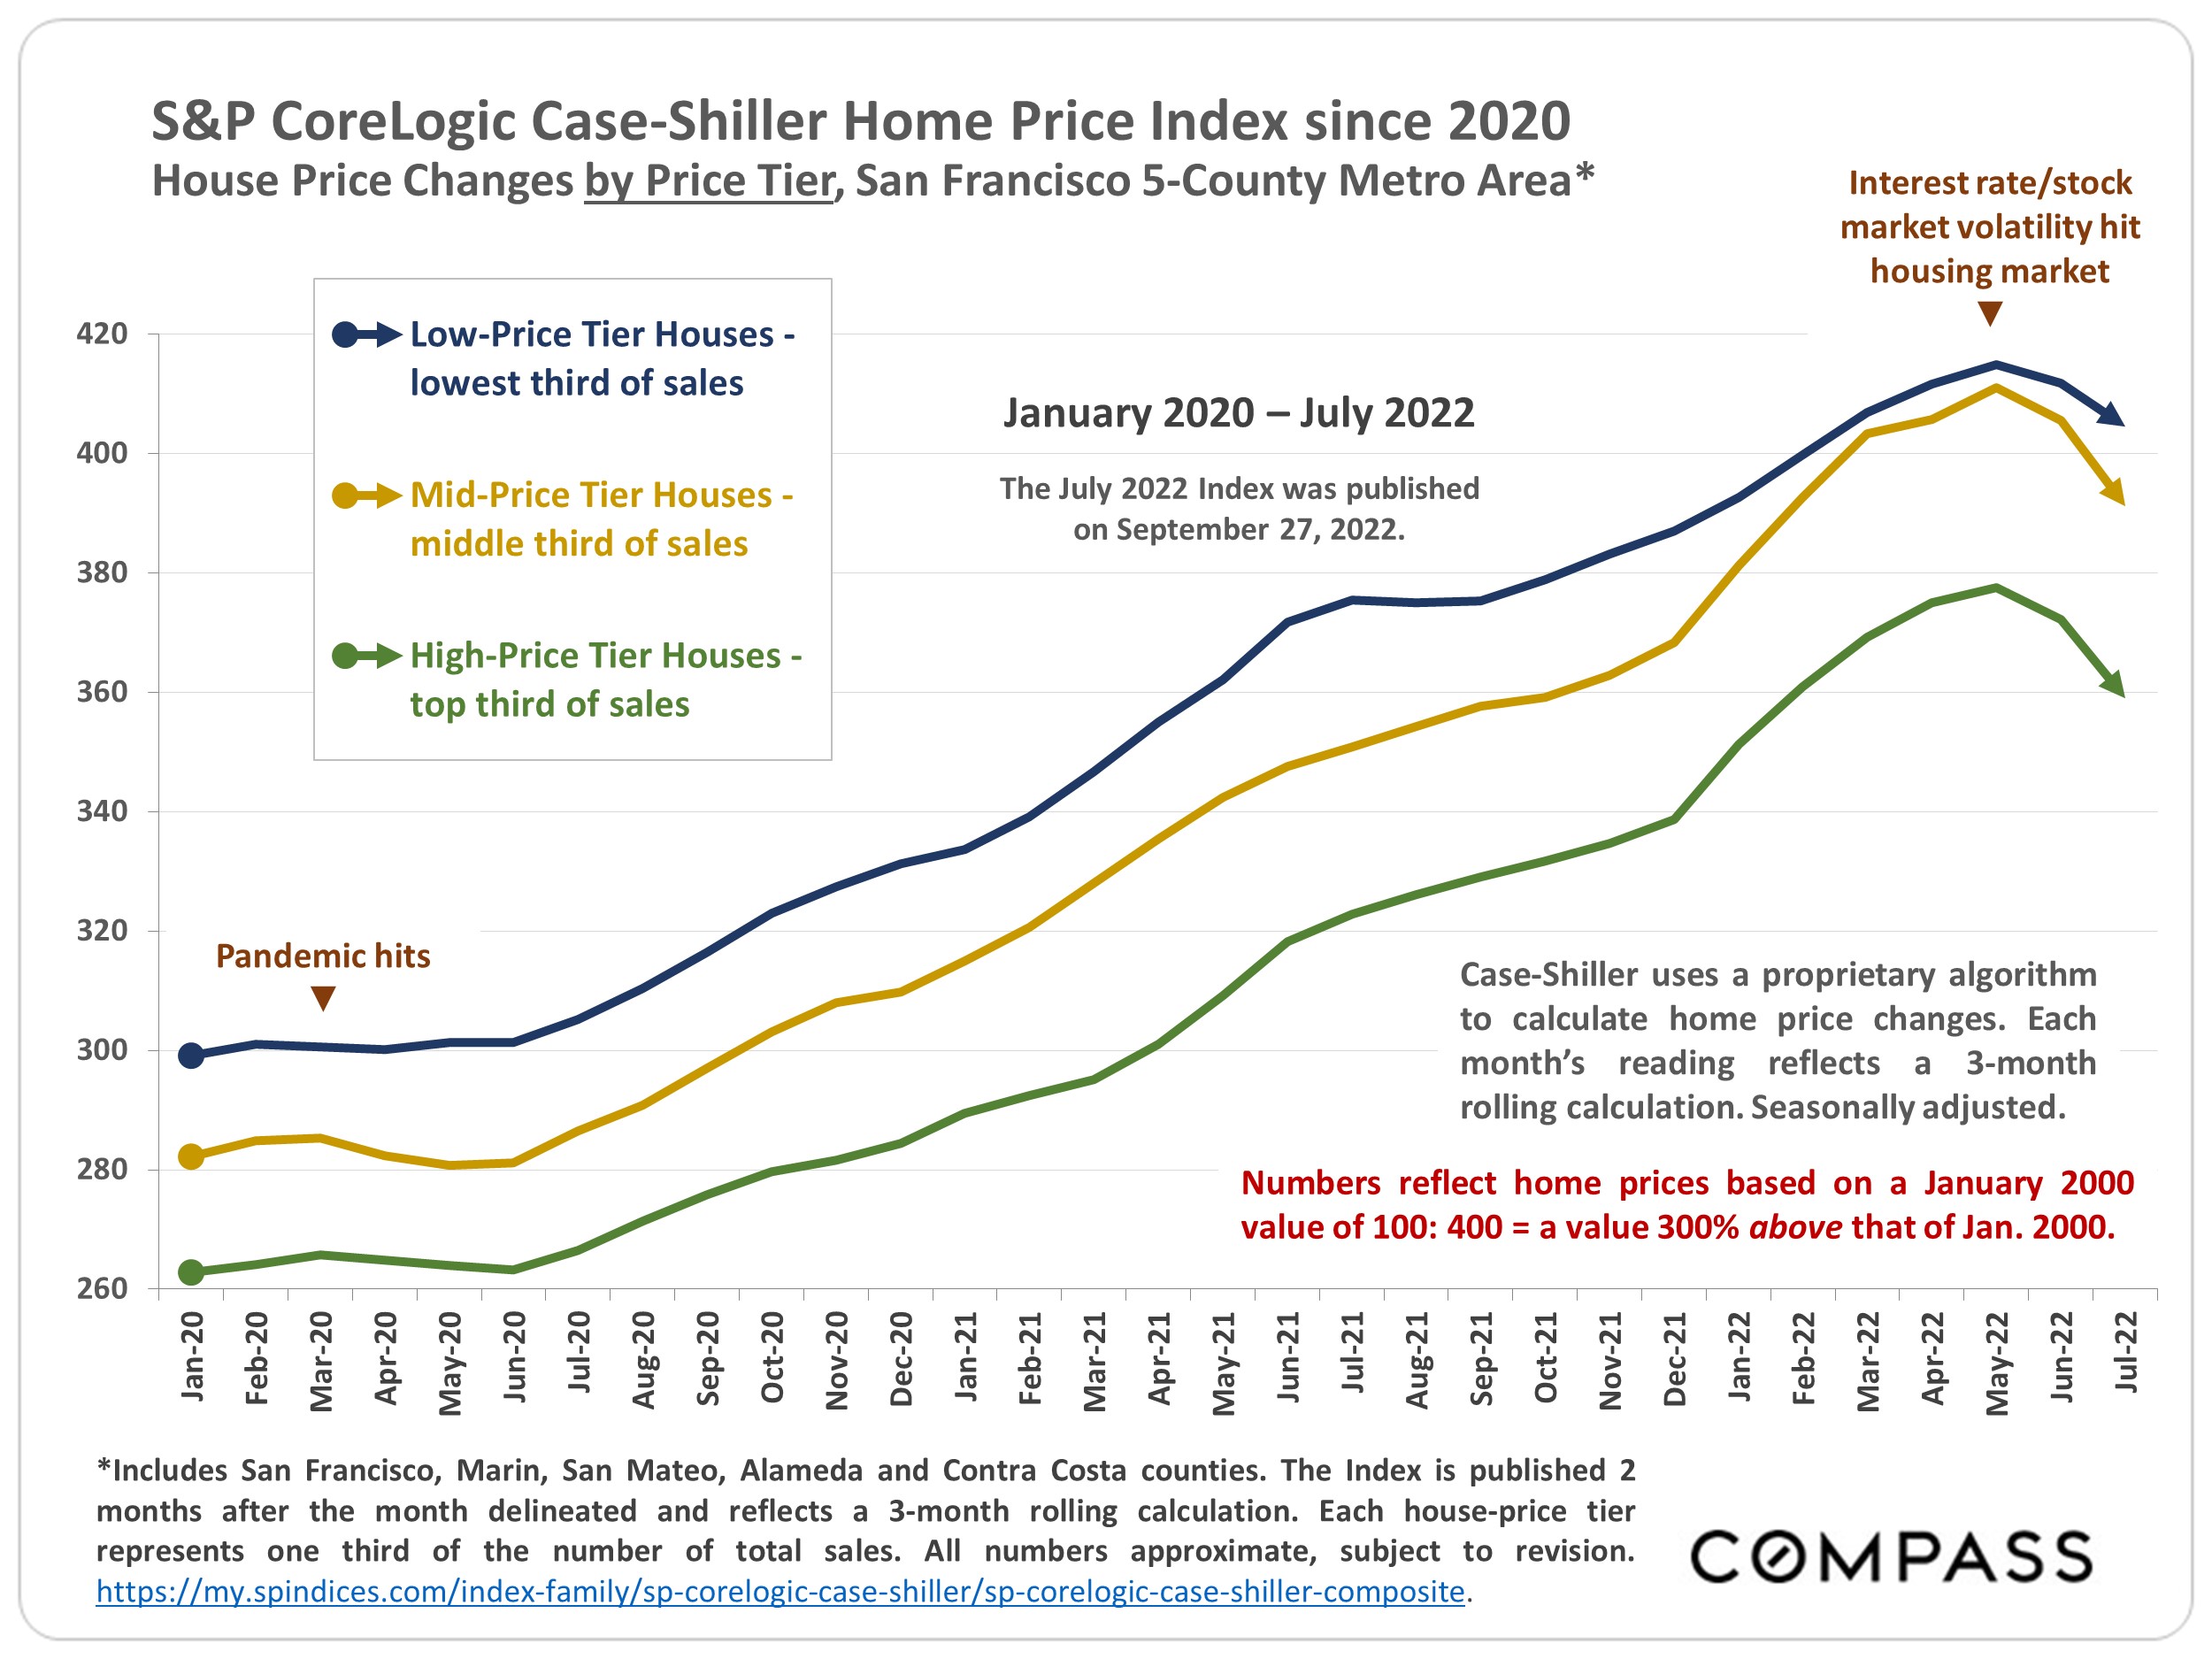
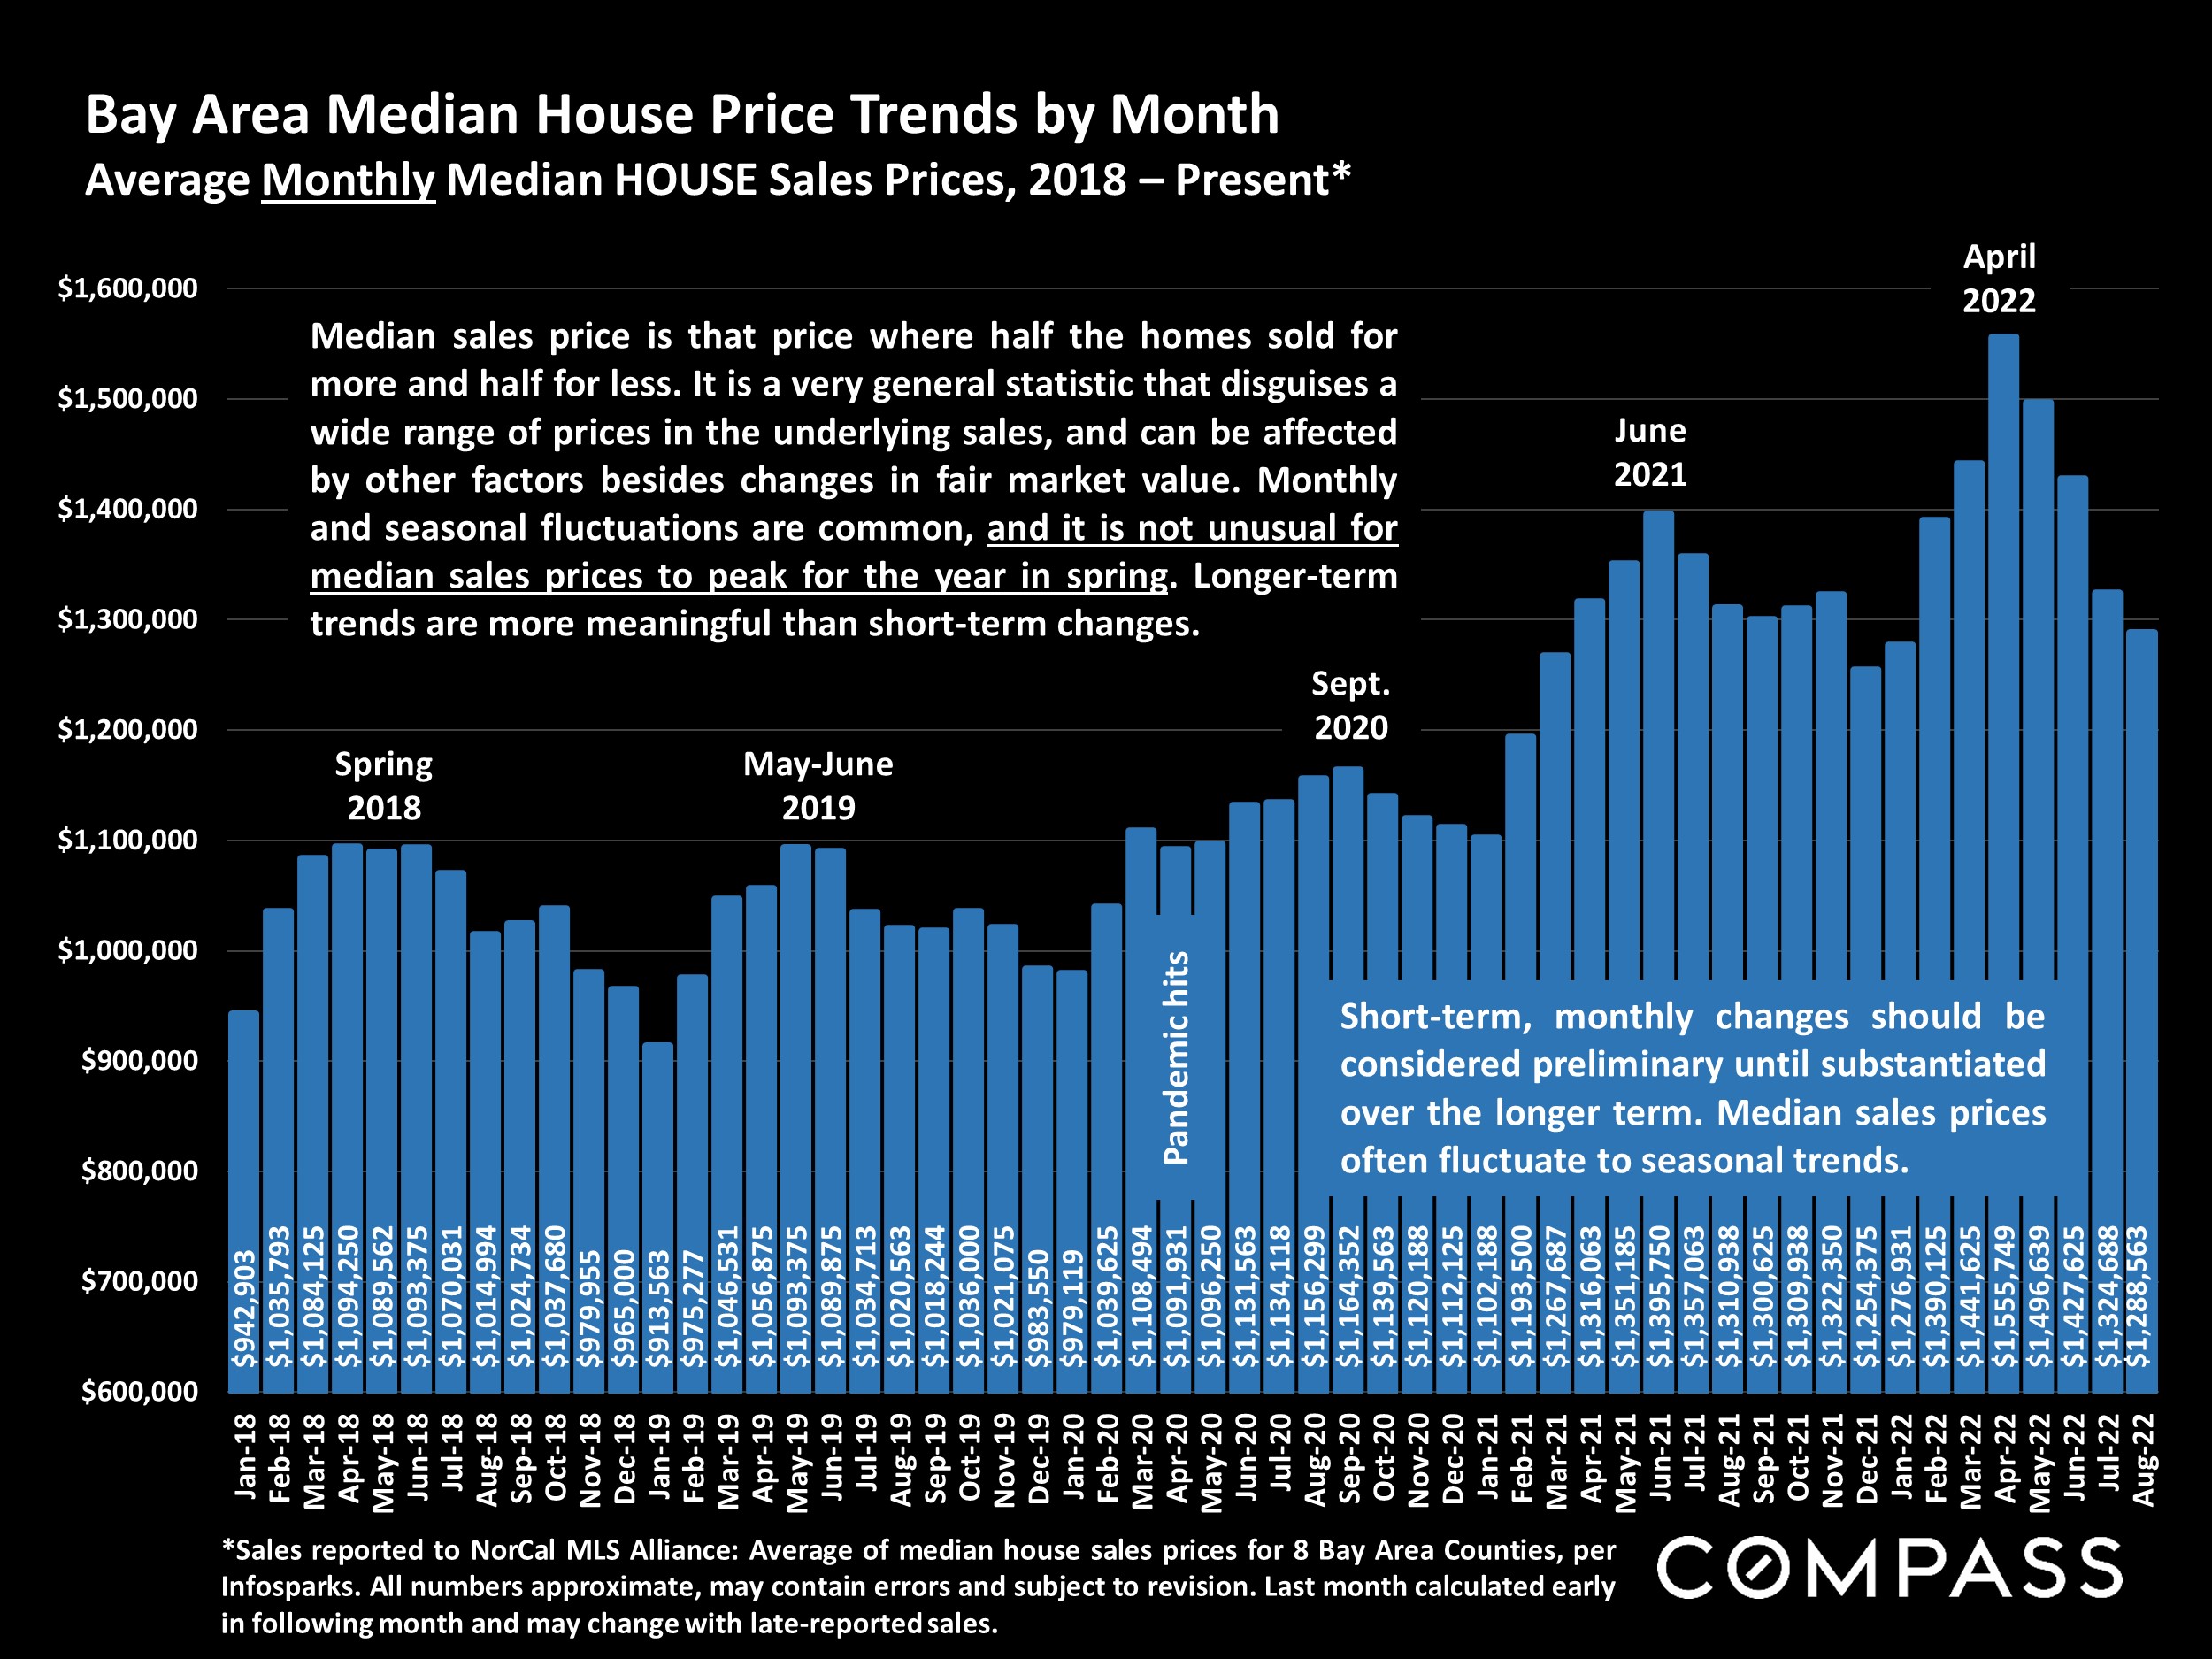
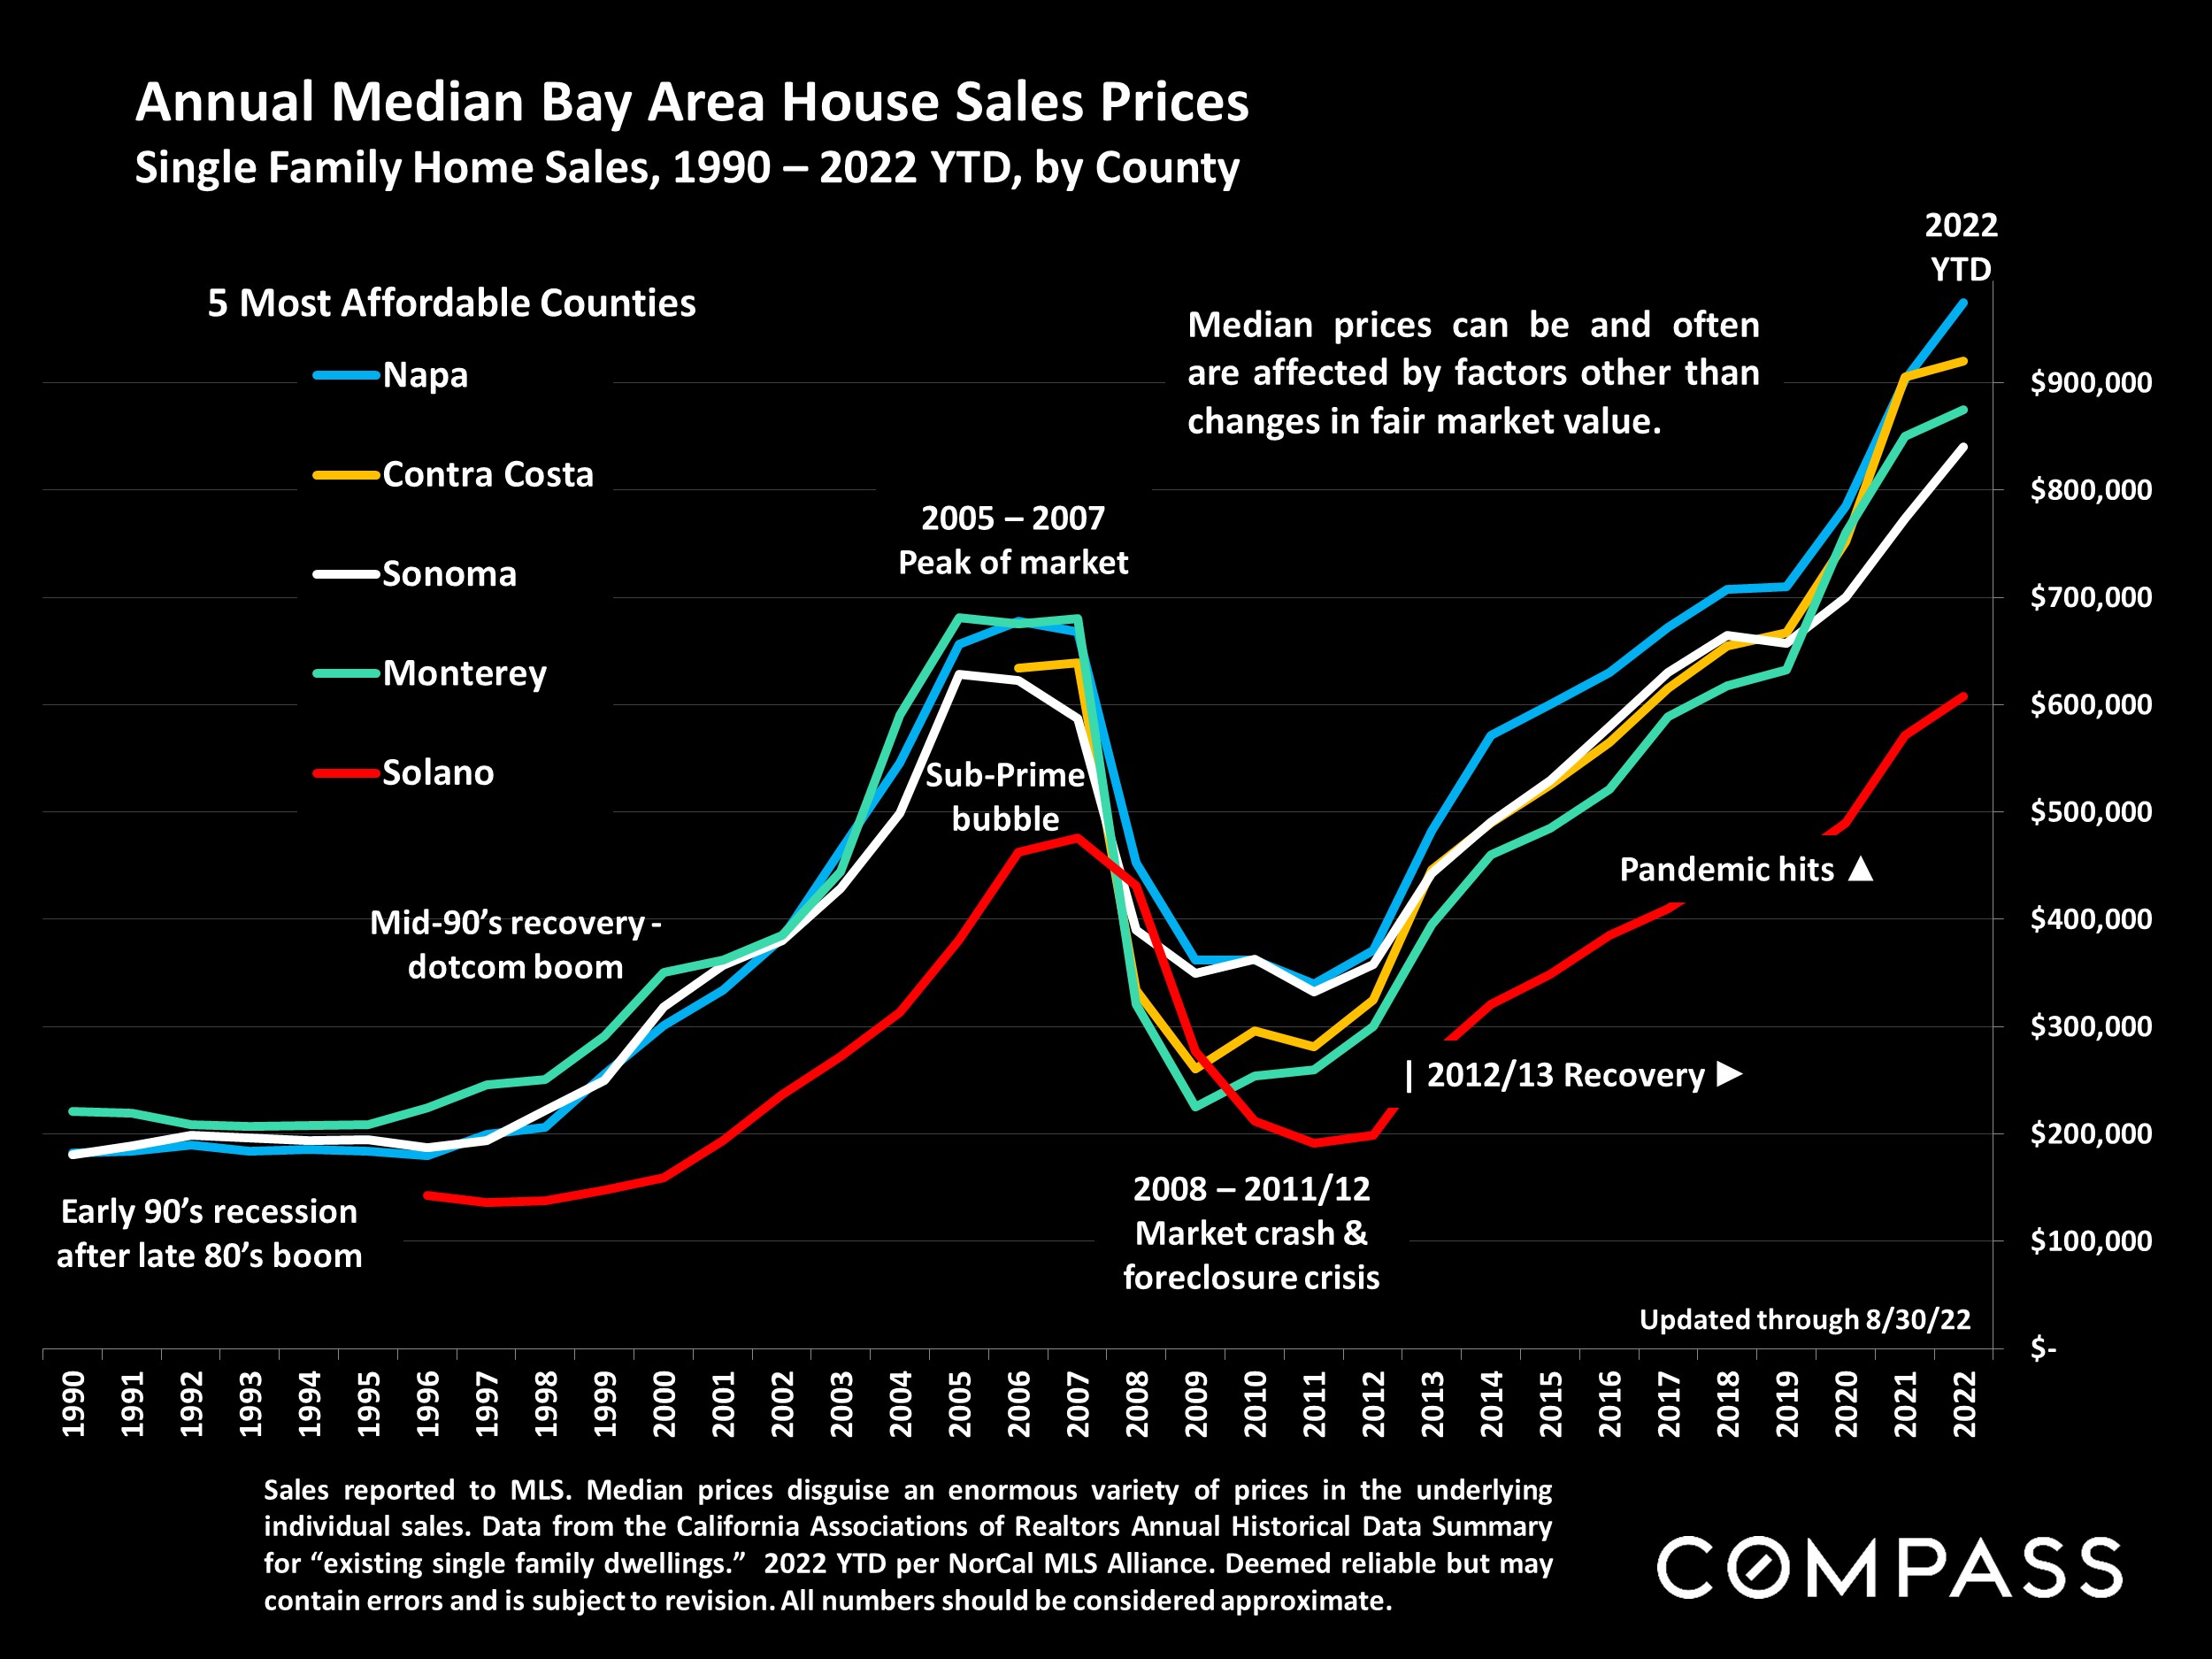
It is impossible to know how median and average value statistics apply to any particular home without a specific comparative market analysis. These analyses were made in good faith with data from sources deemed reliable, but may contain errors and are subject to revision. It is not our intent to convince you of a particular position, but to attempt to provide straightforward data and analysis, so you can make your own informed decisions. Median and average statistics are enormous generalities: There are hundreds of different markets in San Francisco and the Bay Area, each with its own unique dynamics. Median prices and average dollar per square foot values can be and often are affected by other factors besides changes in fair market value. Longer term trends are much more meaningful than short-term.
Compass is a real estate broker licensed by the State of California, DRE 01527235. Equal Housing Opportunity. This report has been prepared solely for information purposes. The information herein is based on or derived from information generally available to the public and/or from sources believed to be reliable. No representation or warranty can be given with respect to the accuracy or completeness of the information. Compass disclaims any and all liability relating to this report, including without limitation any express or implied representations or warranties for statements contained in, and omissions from, the report. Nothing contained herein is intended to be or should be read as any regulatory, legal, tax, accounting or other advice and Compass does not provide such advice. All opinions are subject to change without notice. Compass makes no representation regarding the accuracy of any statements regarding any references to the laws, statutes or regulations of any state are those of the author(s). Past performance is no guarantee of future results.
