
Dramatically Improving Economic Indicators Suggest a Brighter 2024 Housing Market
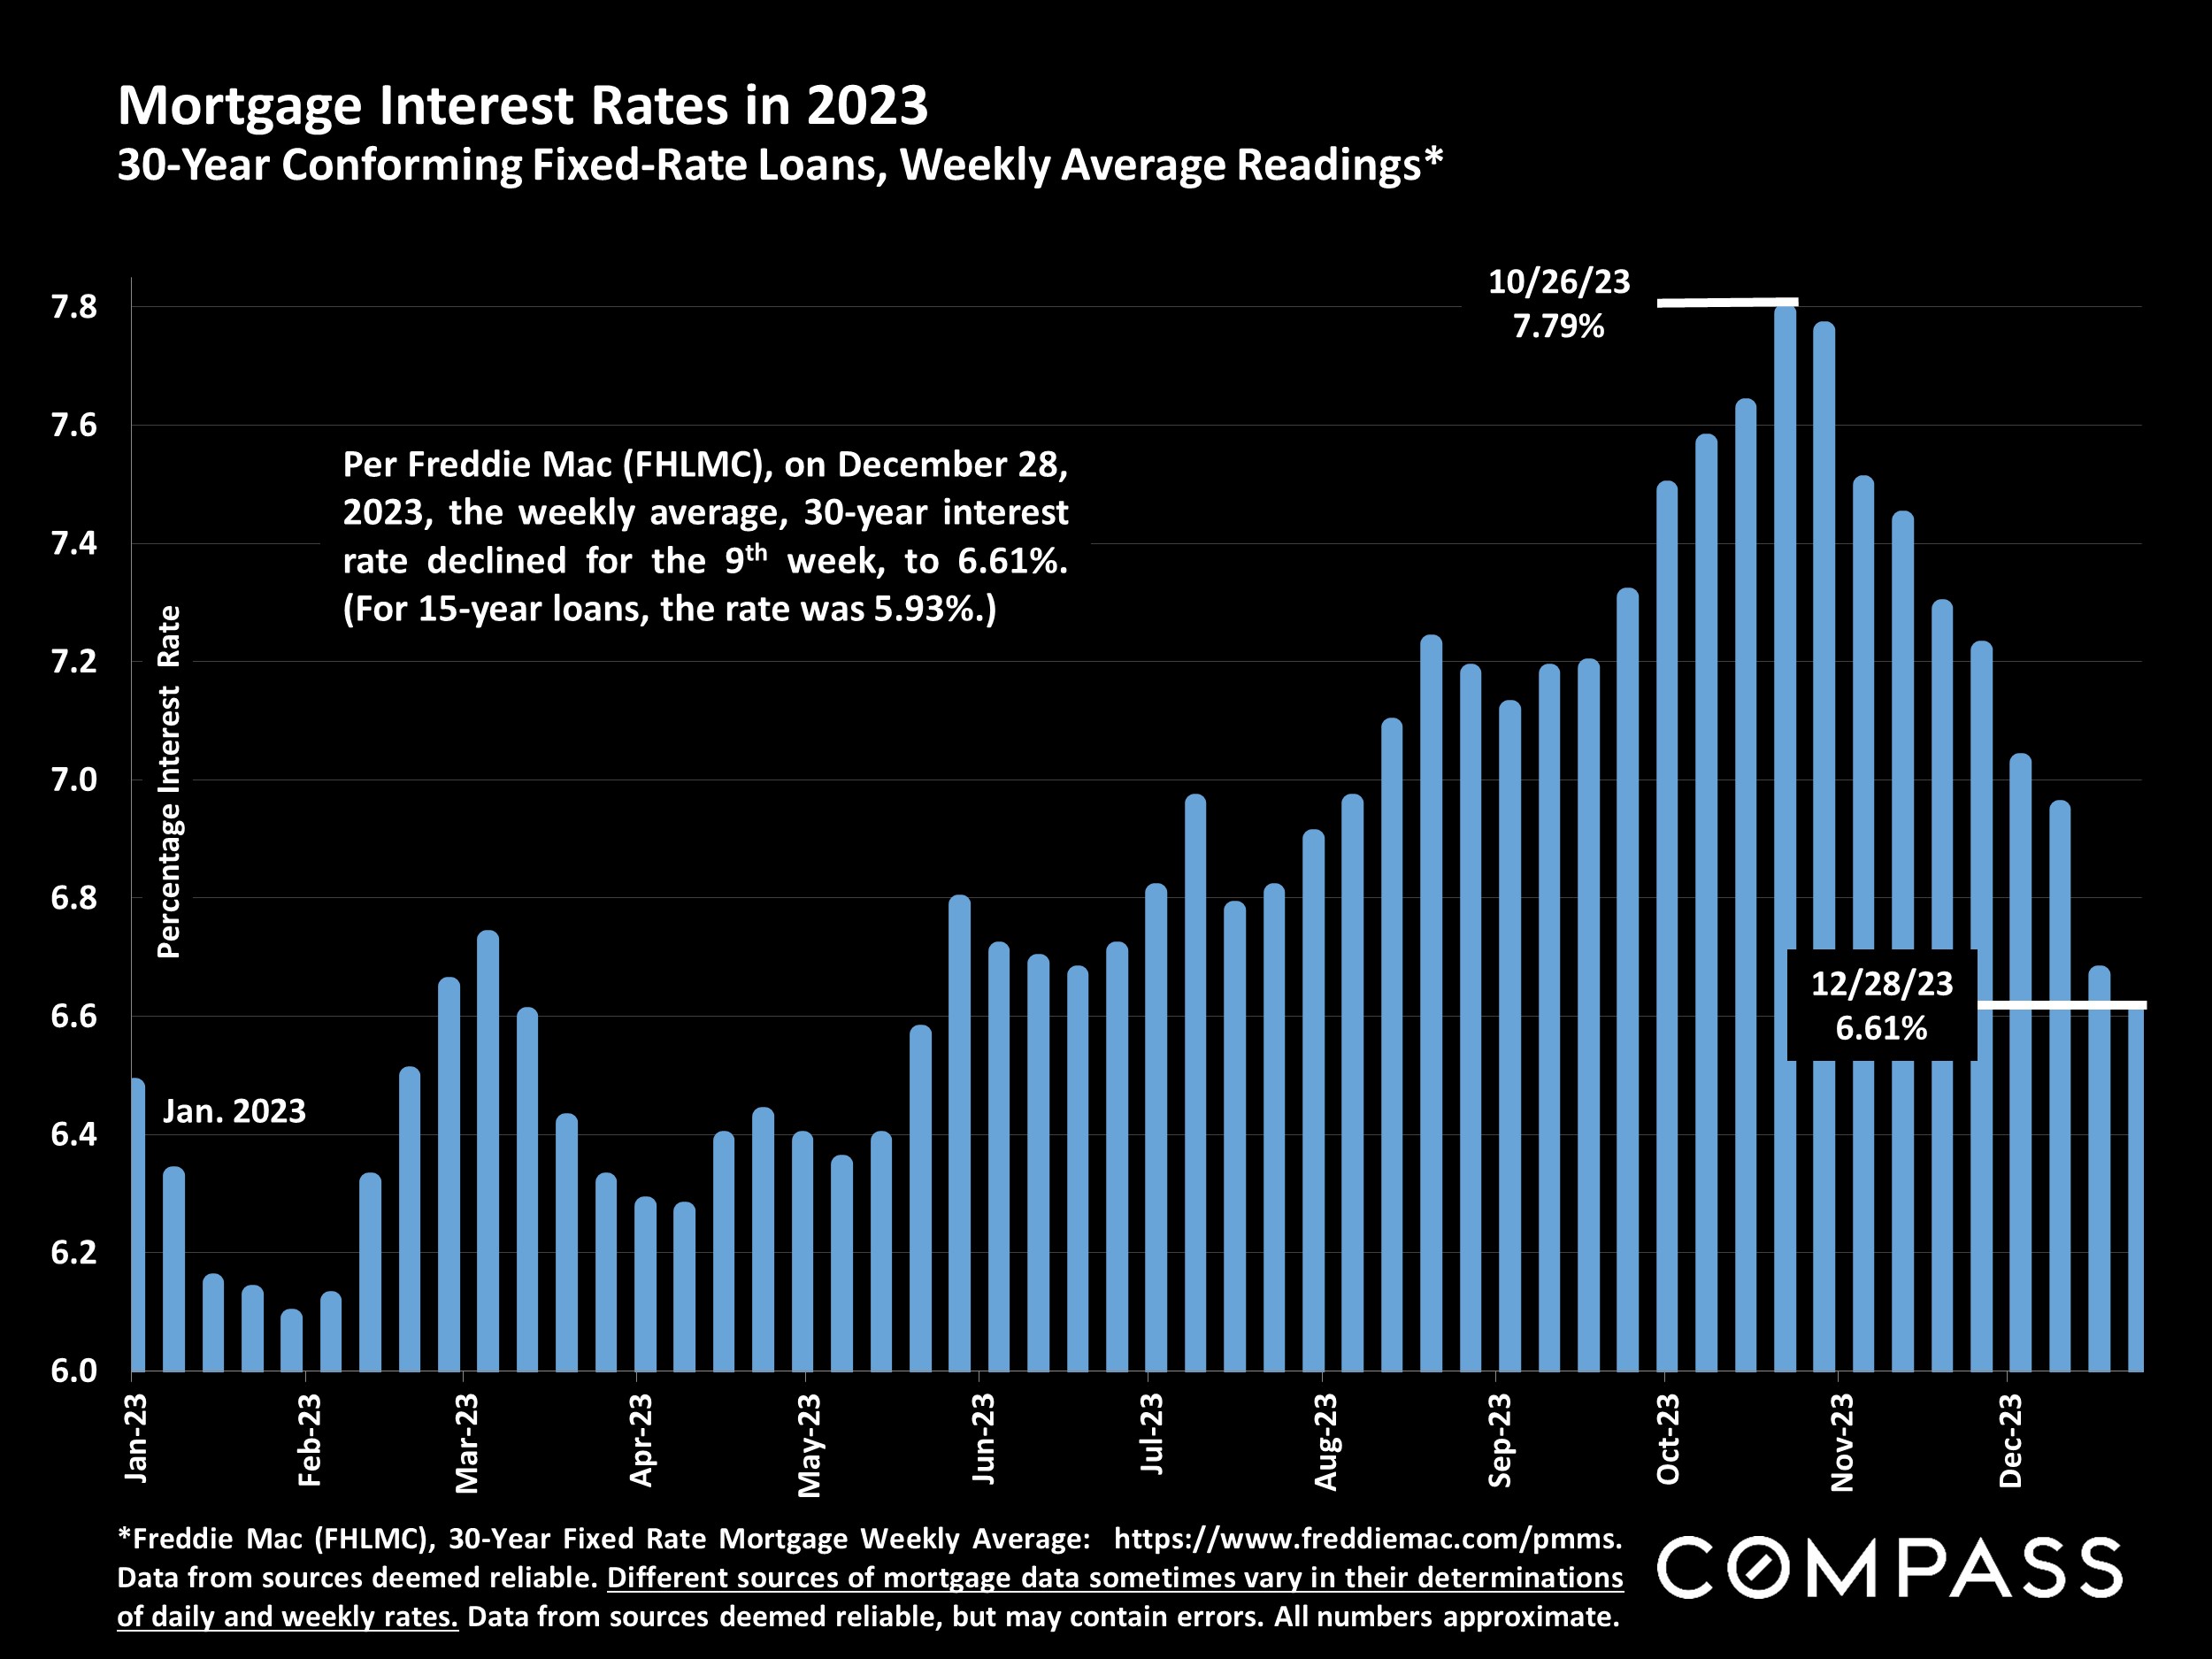
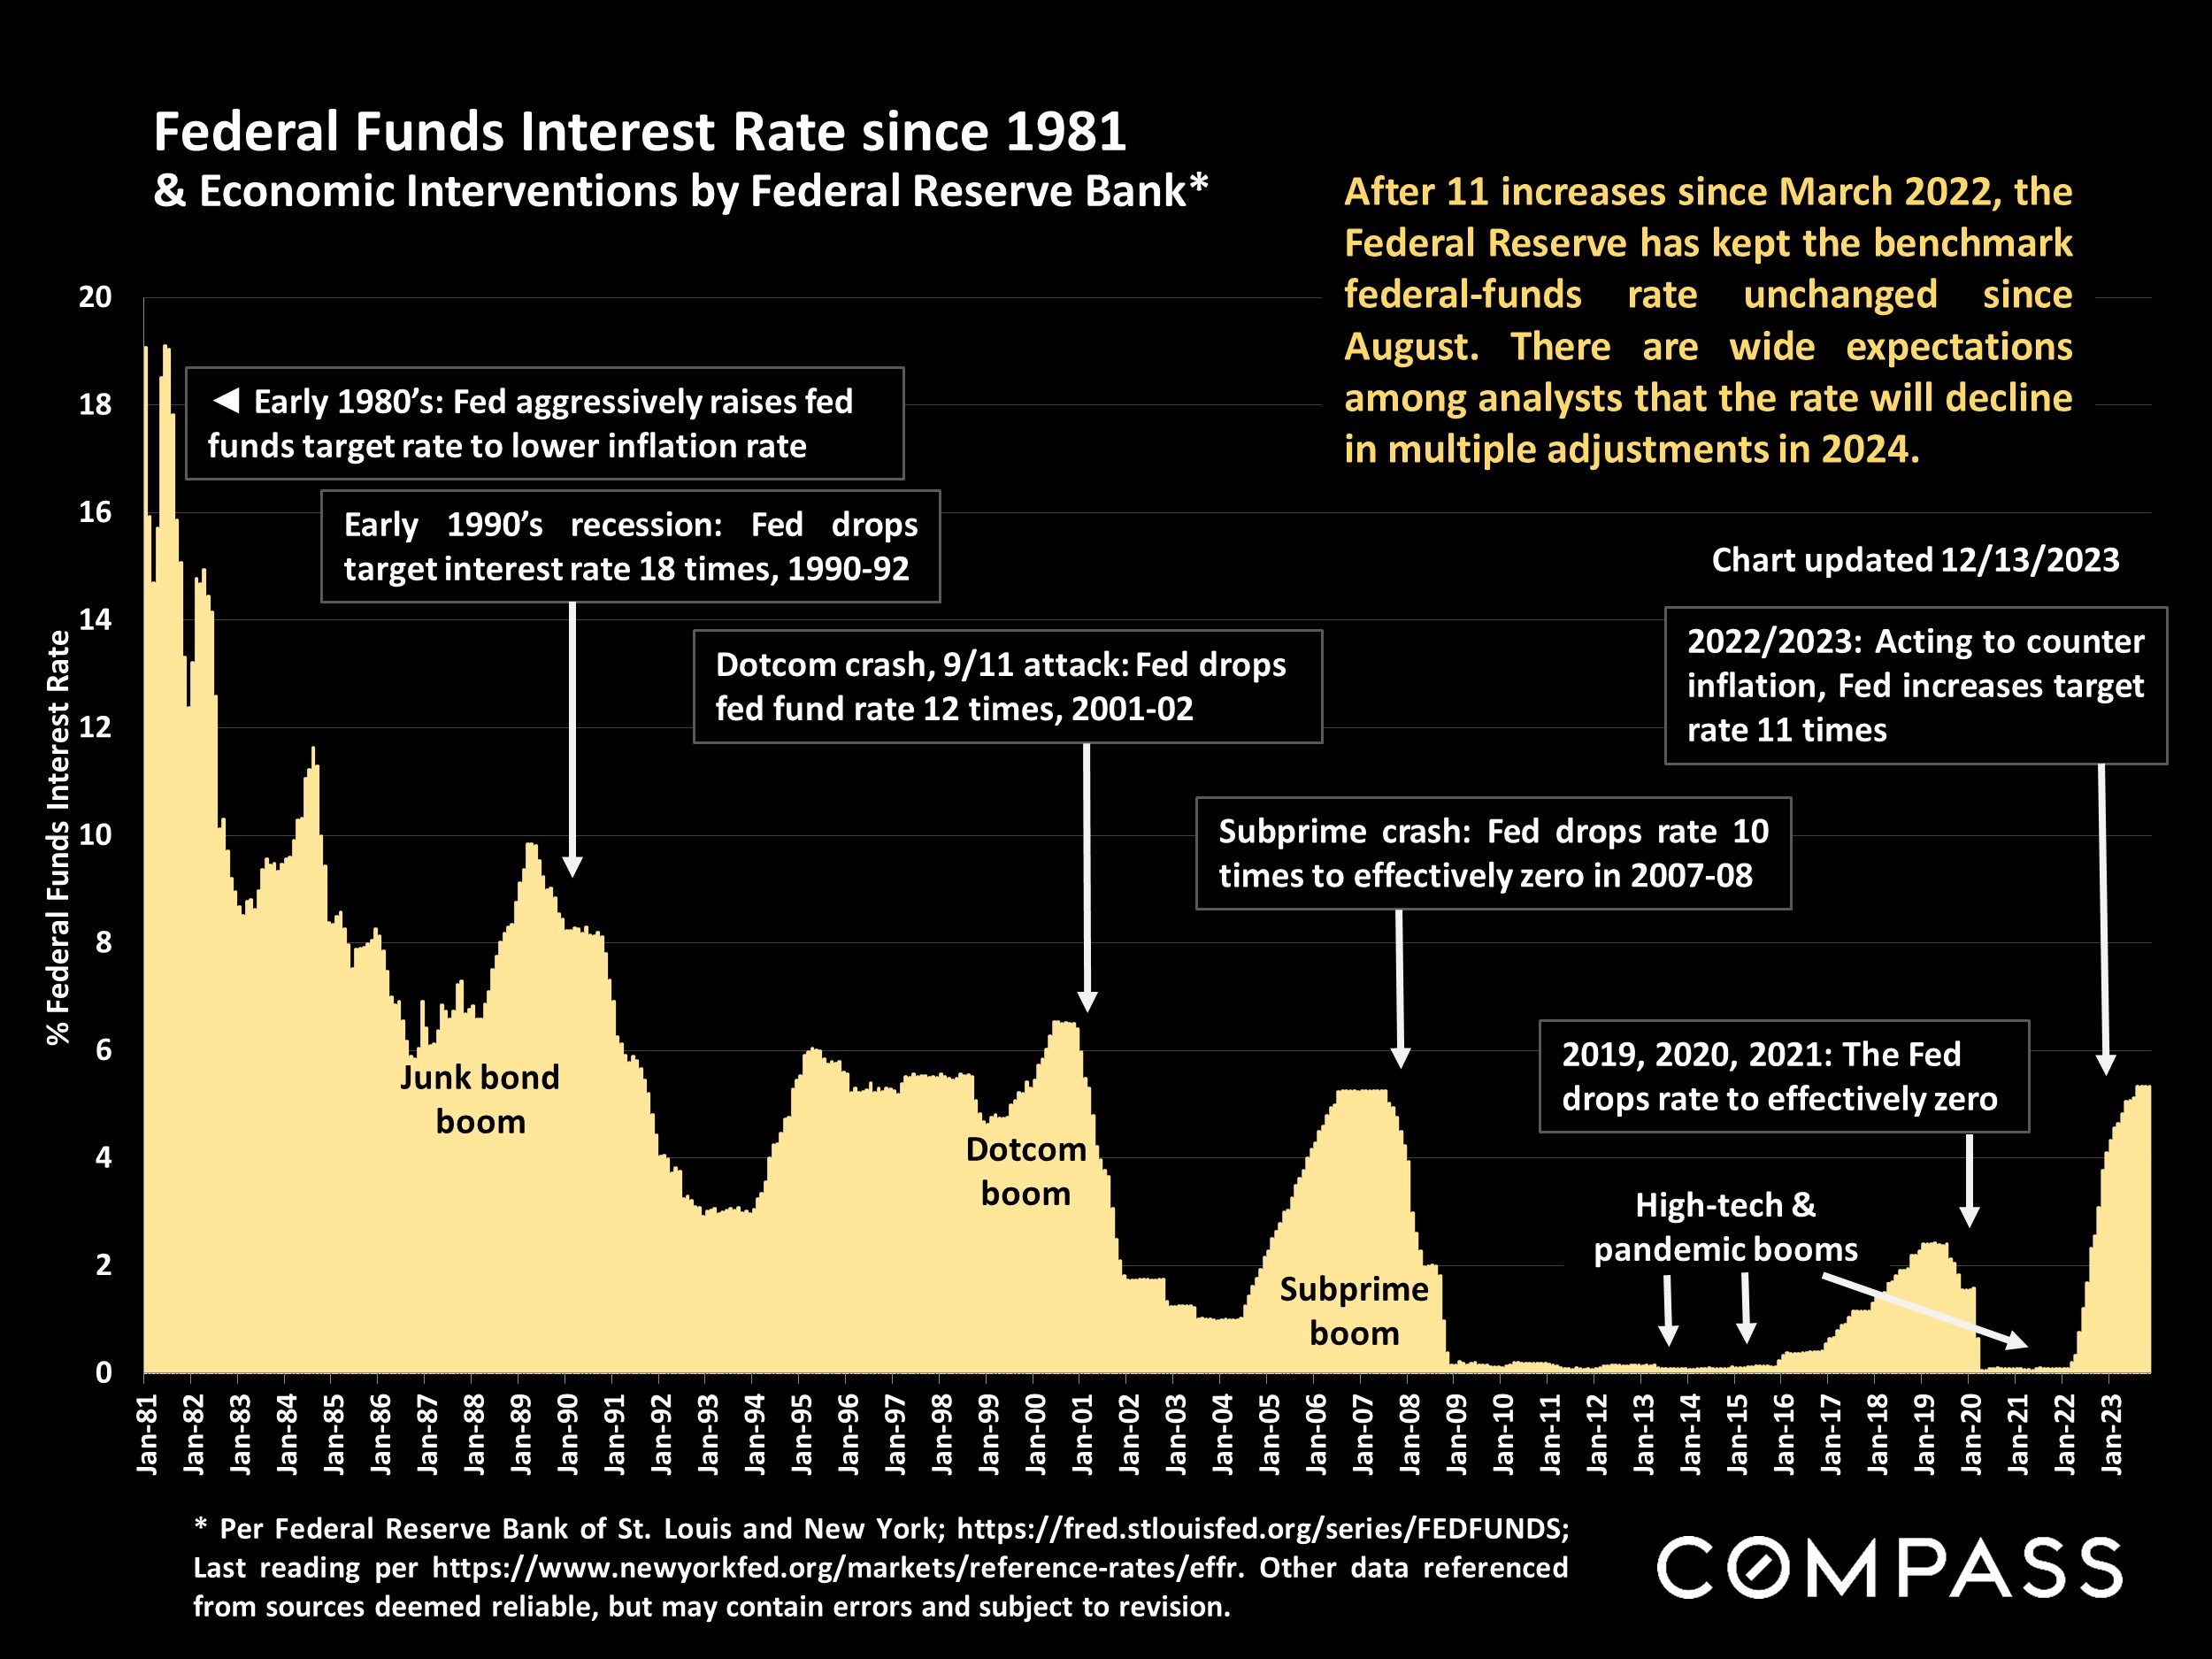
■ In the last 2 months of 2023, the average, weekly, 30-year mortgage interest rate dropped from 7.79% to 6.61%. With the fall in inflation this past year, the Fed is widely expected to begin dropping its benchmark rate, probably in multiple steps, in 2024. The consensus forecast among analysts is for further declines in mortgage interest rates.
■ After its end-of-year rally, the S&P Index was up 25% and the Nasdaq up 45% in 2023 (though it has ticked down in early 2024). This plays a major role in Bay Area household wealth.
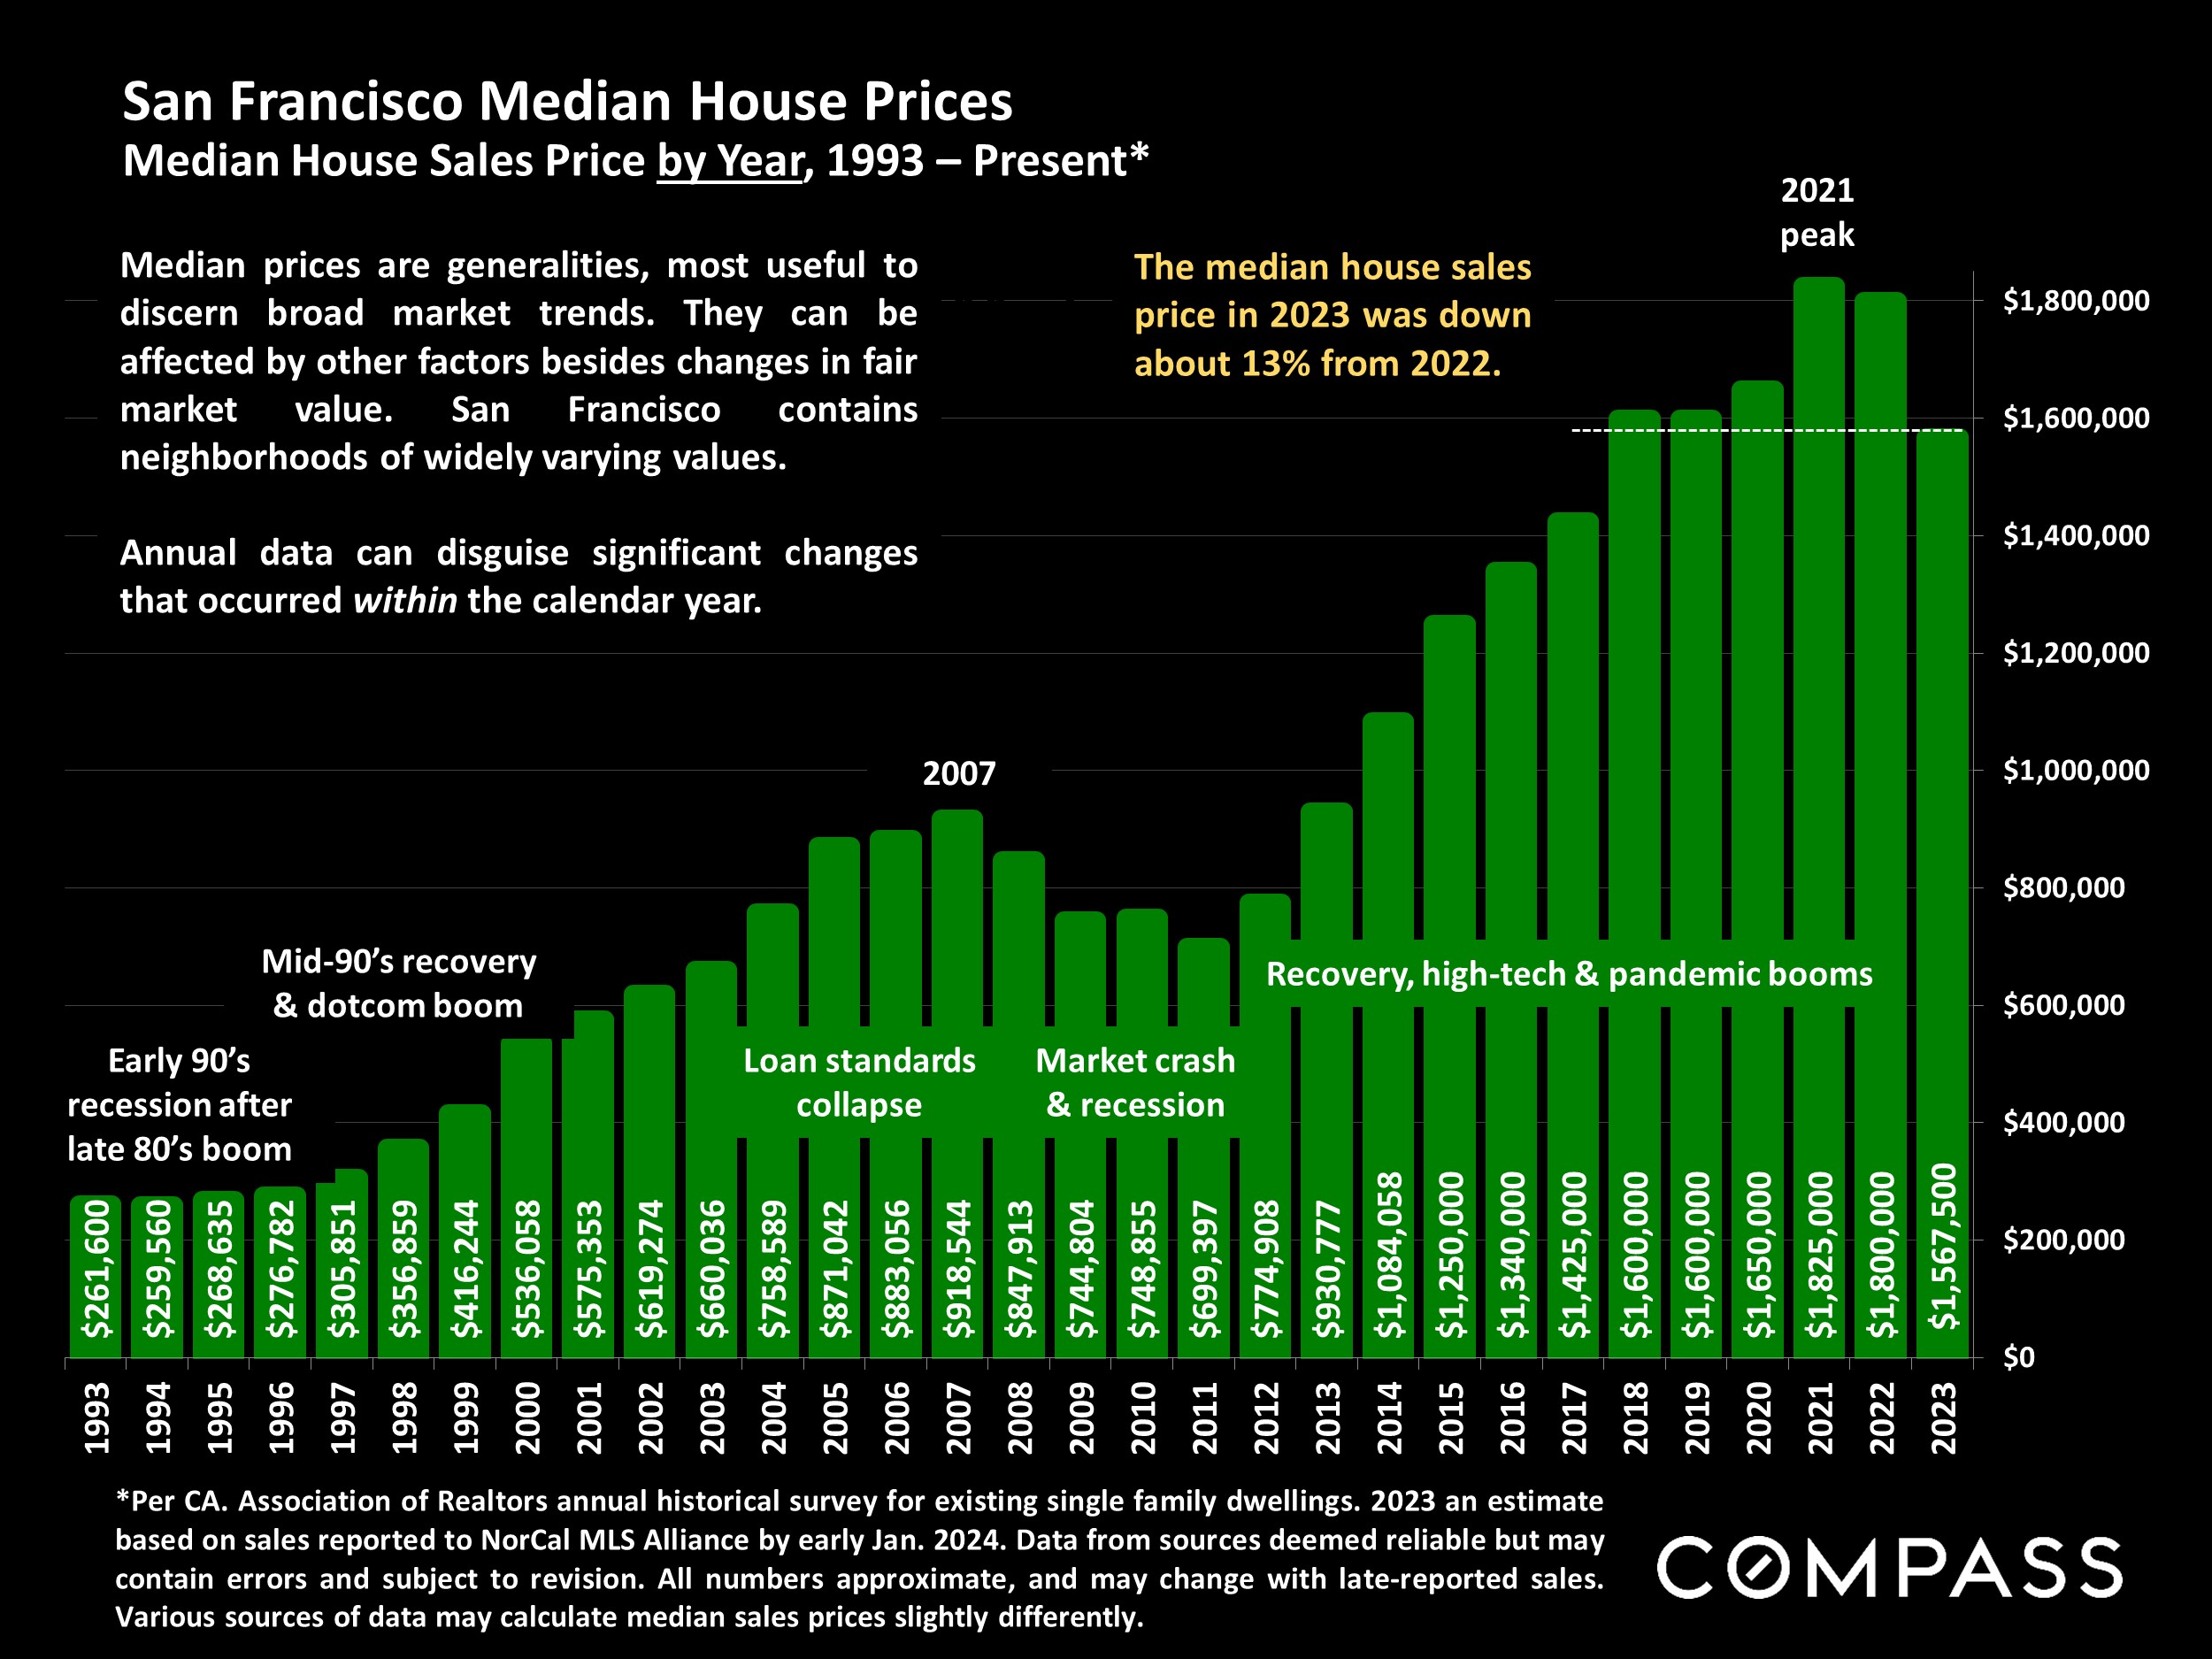
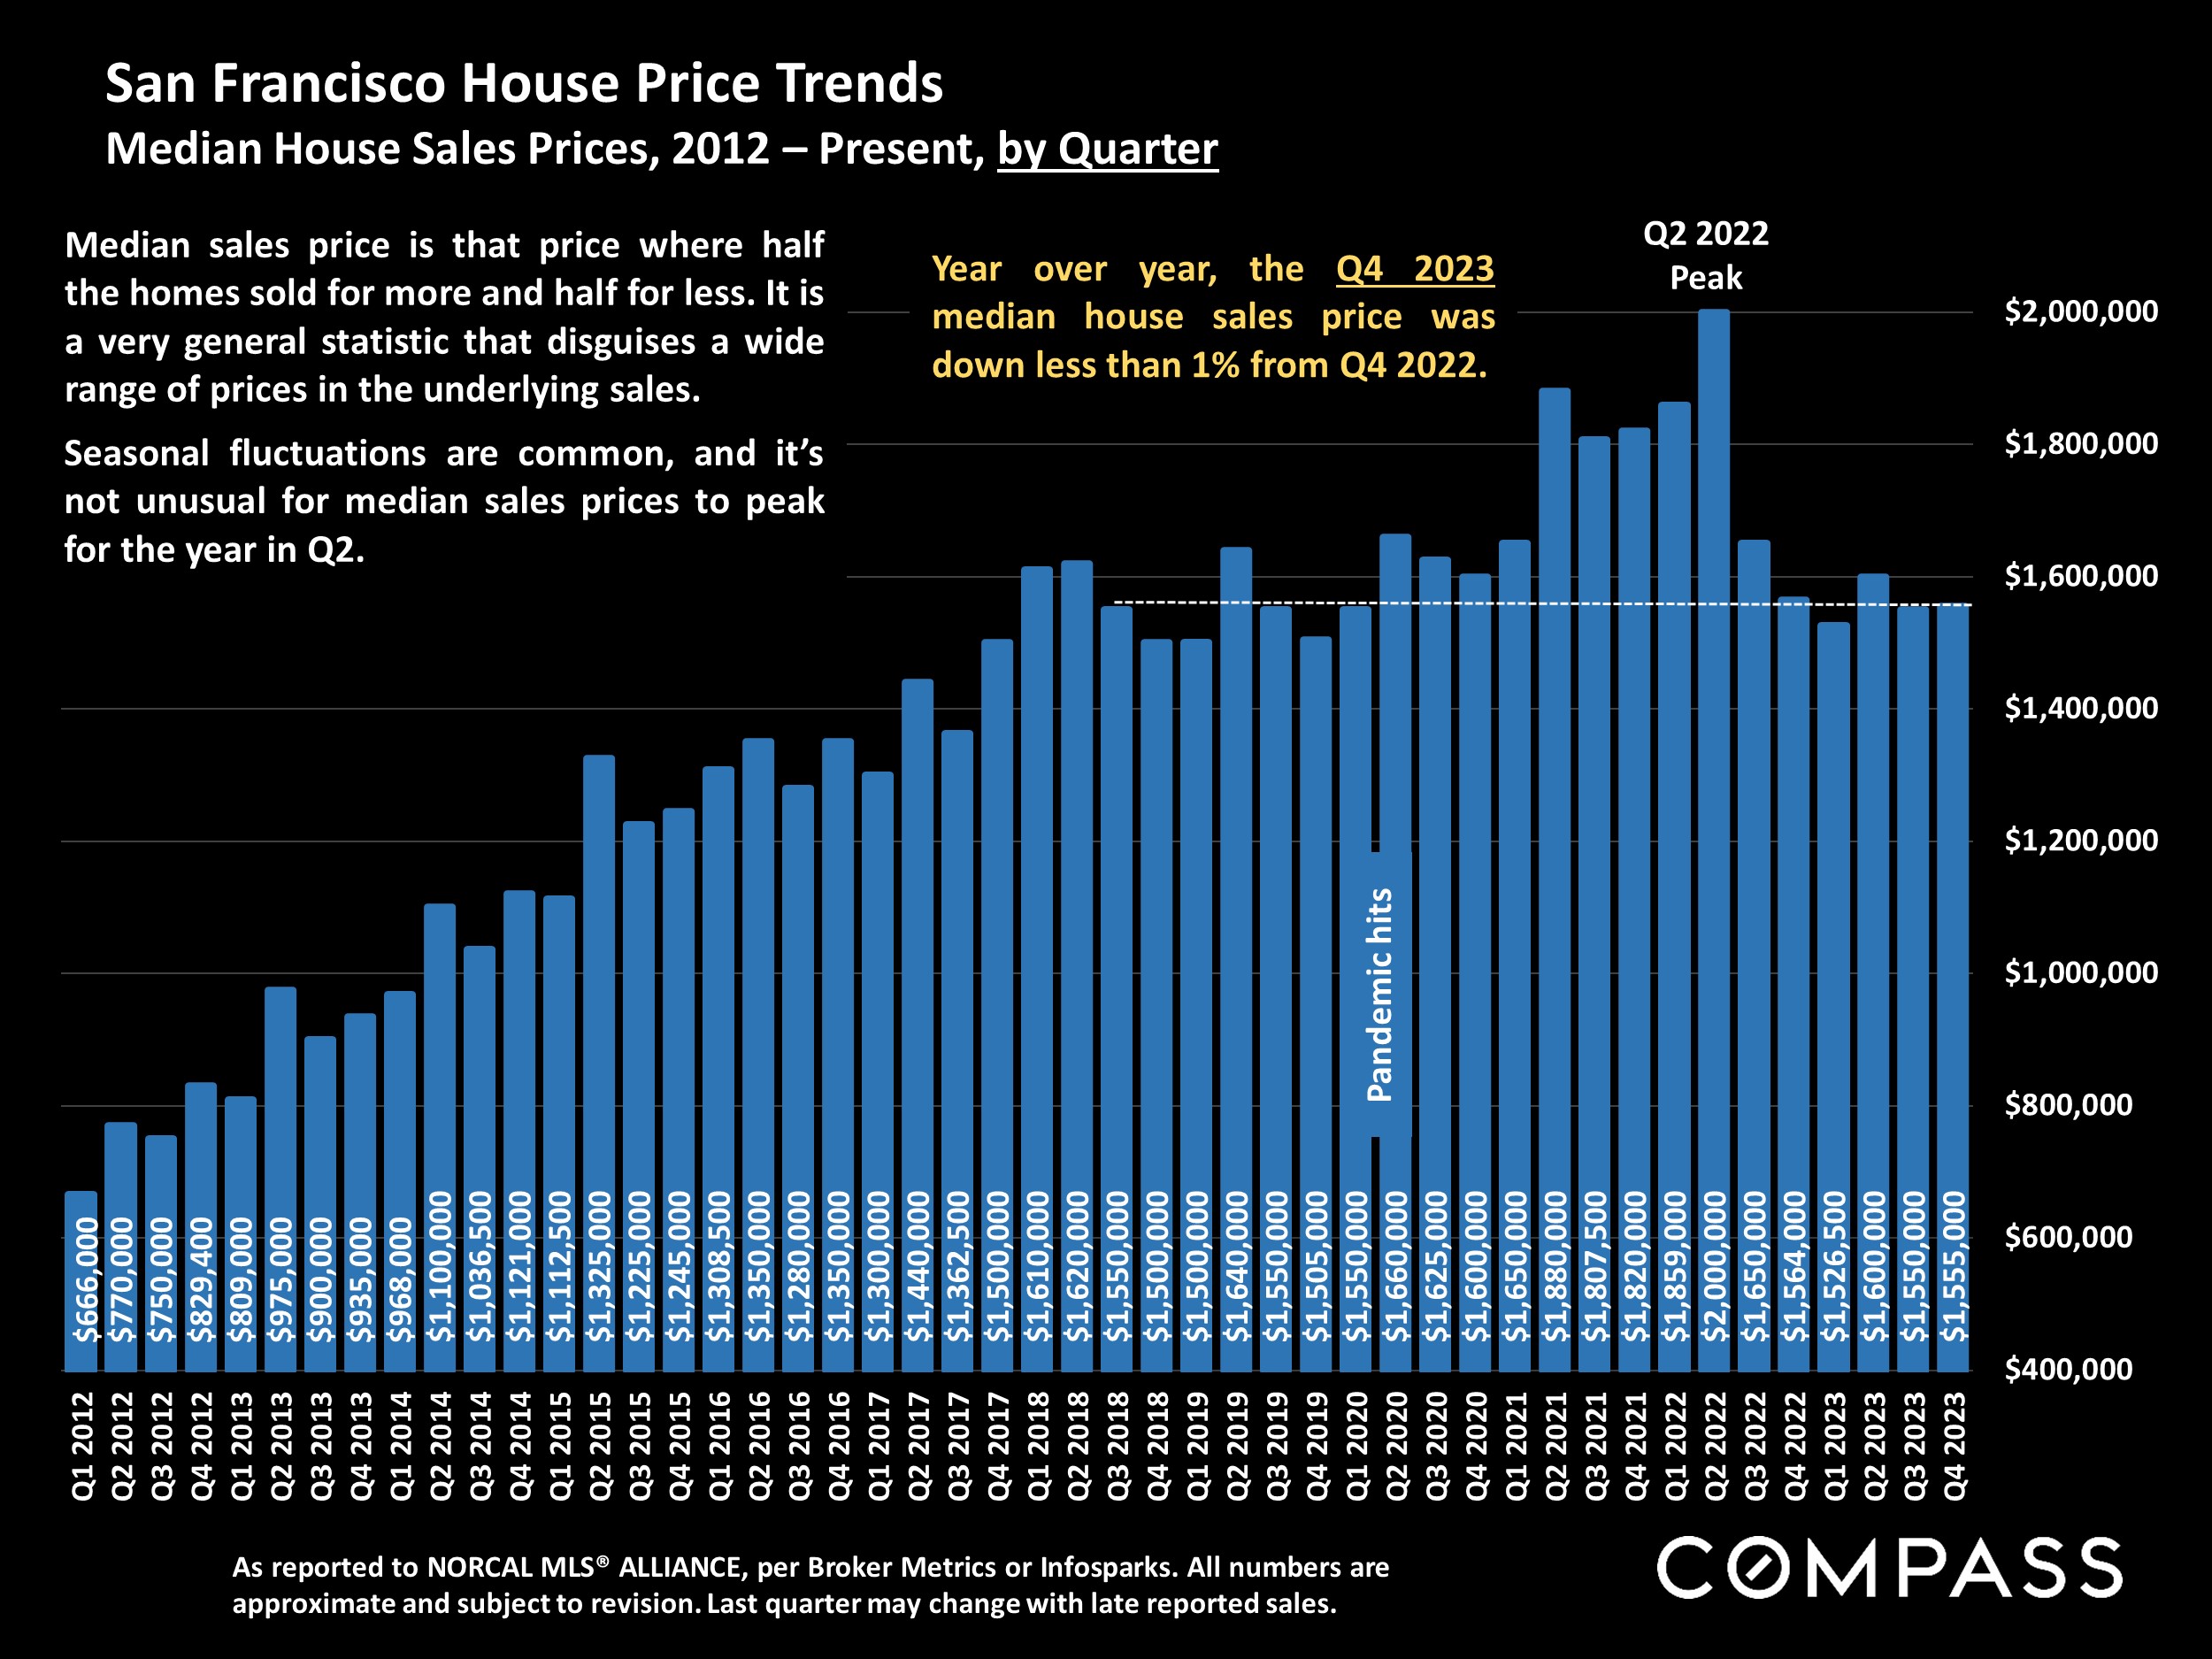
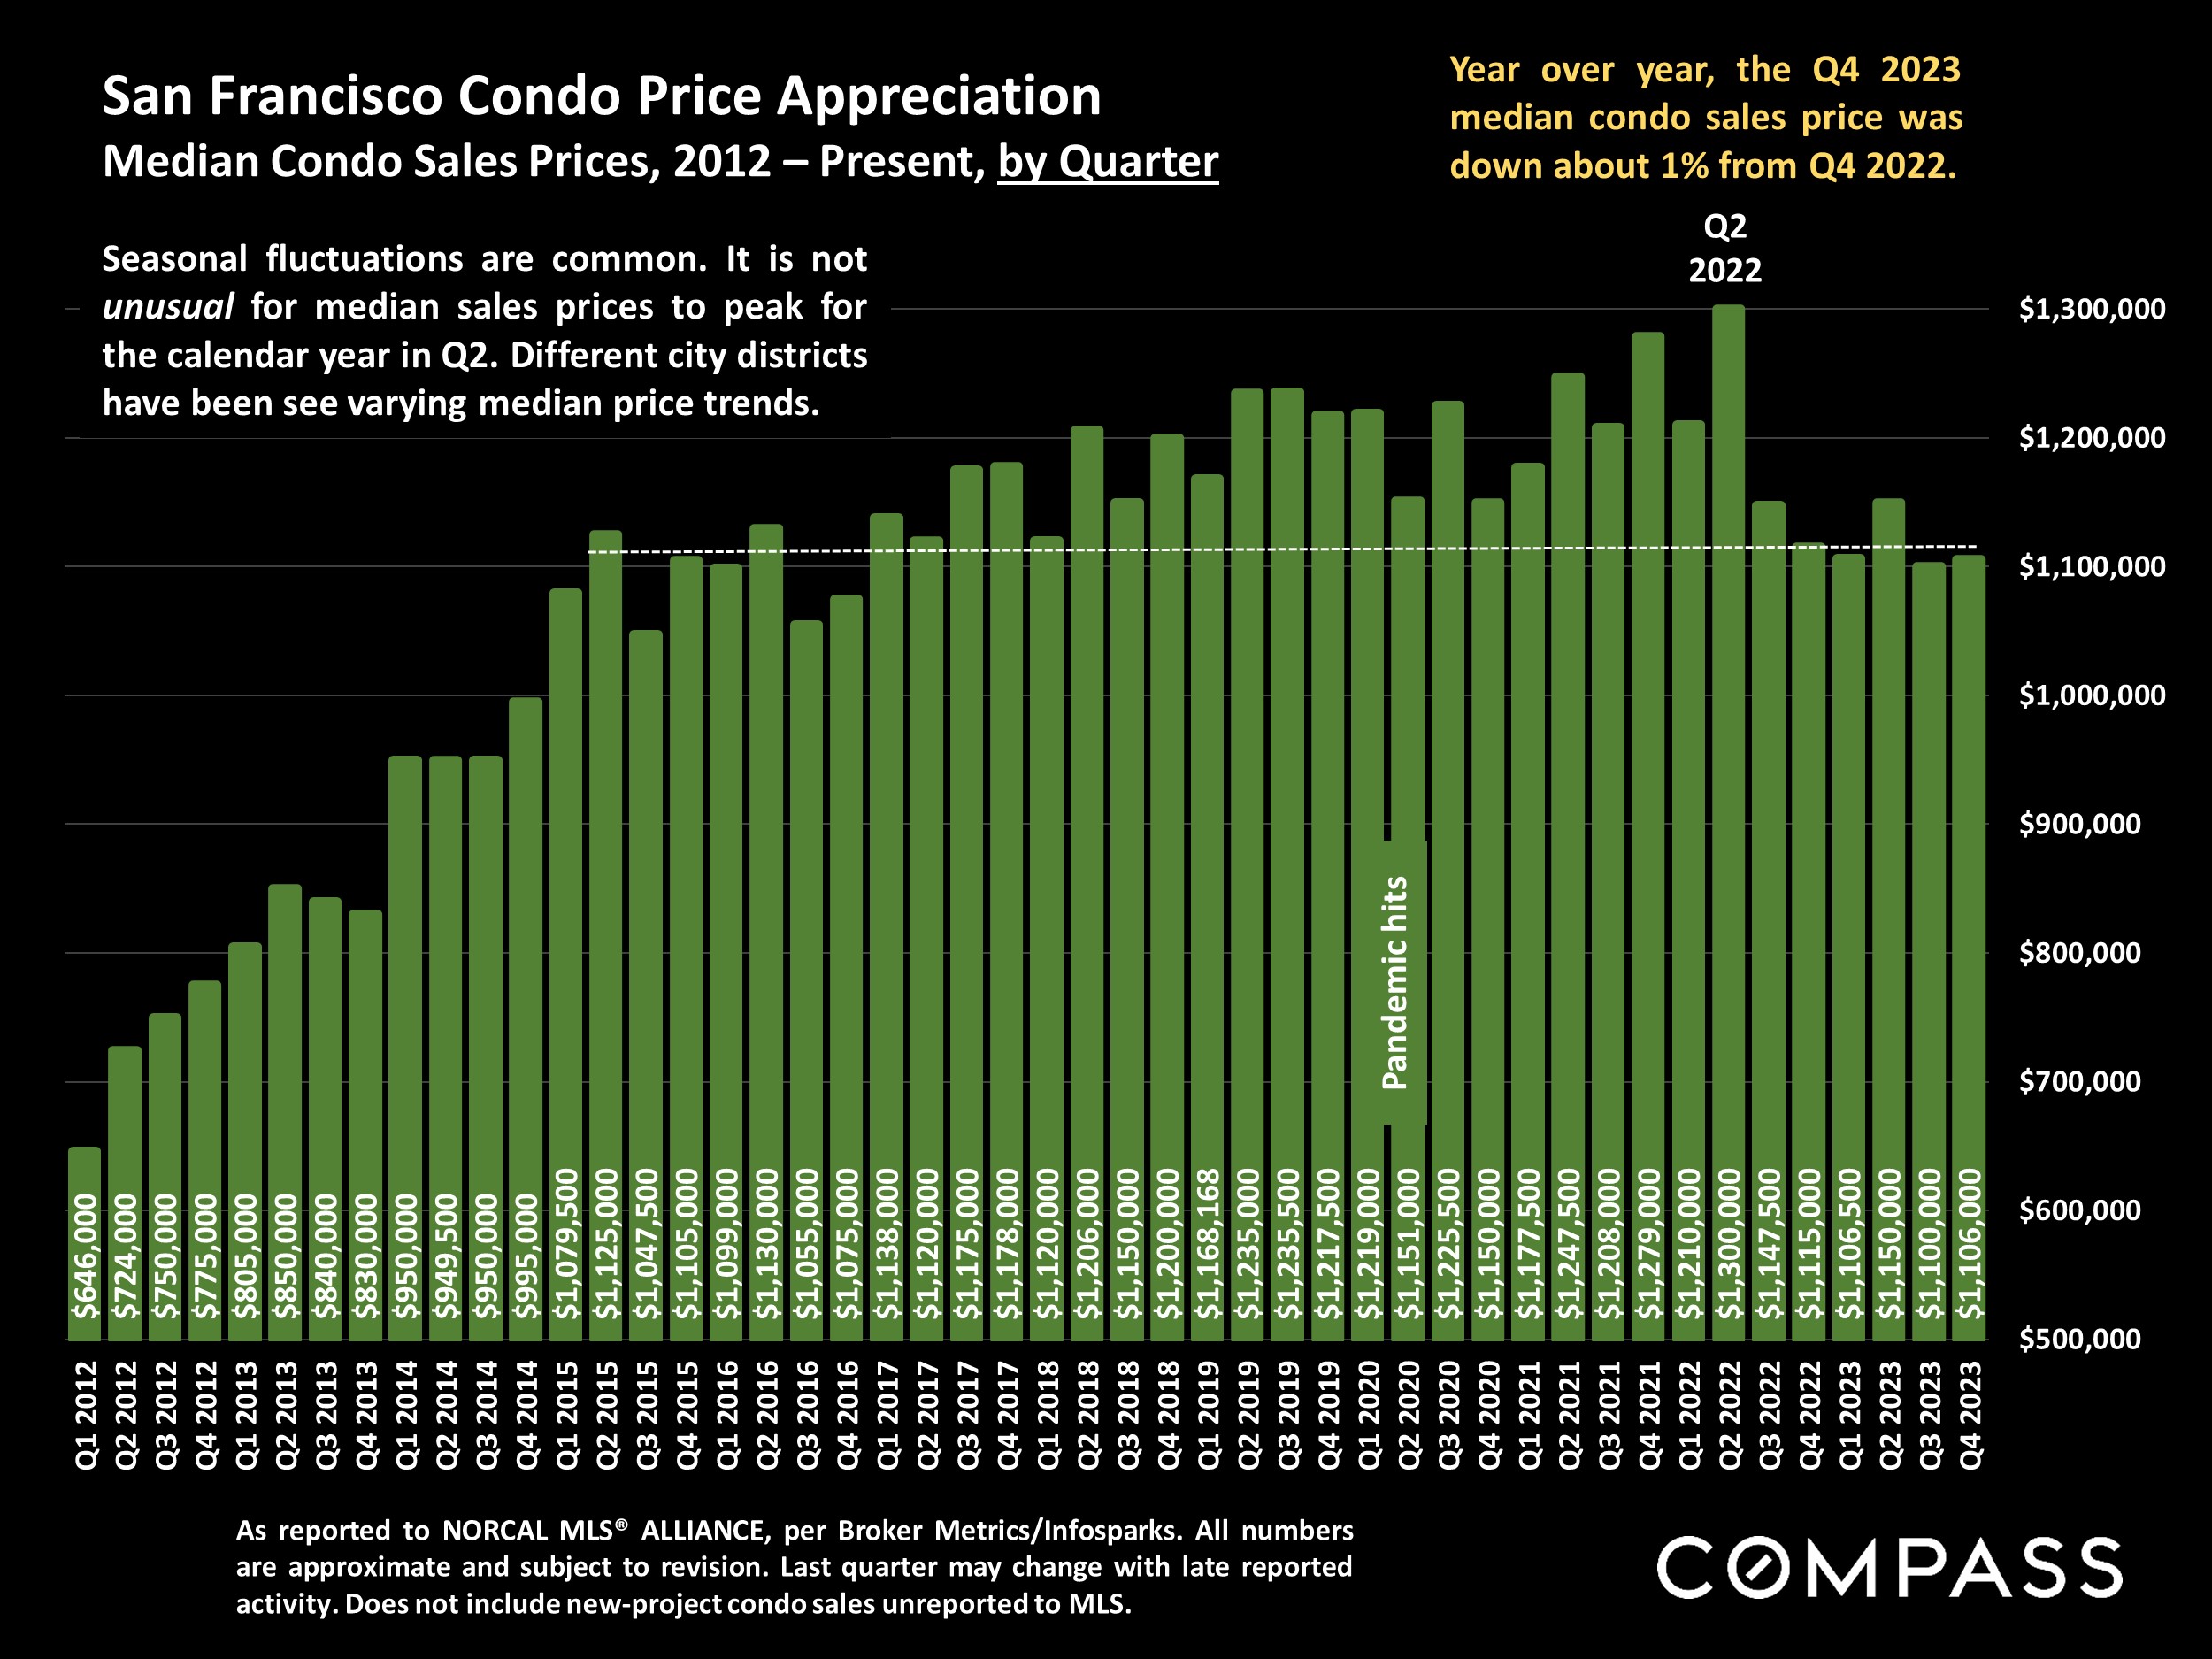
■ On an annual basis, the 2023 median house sales price was down 13% from 2022, while on a quarterly basis, the Q4 price was down less than 1% year-over-year.
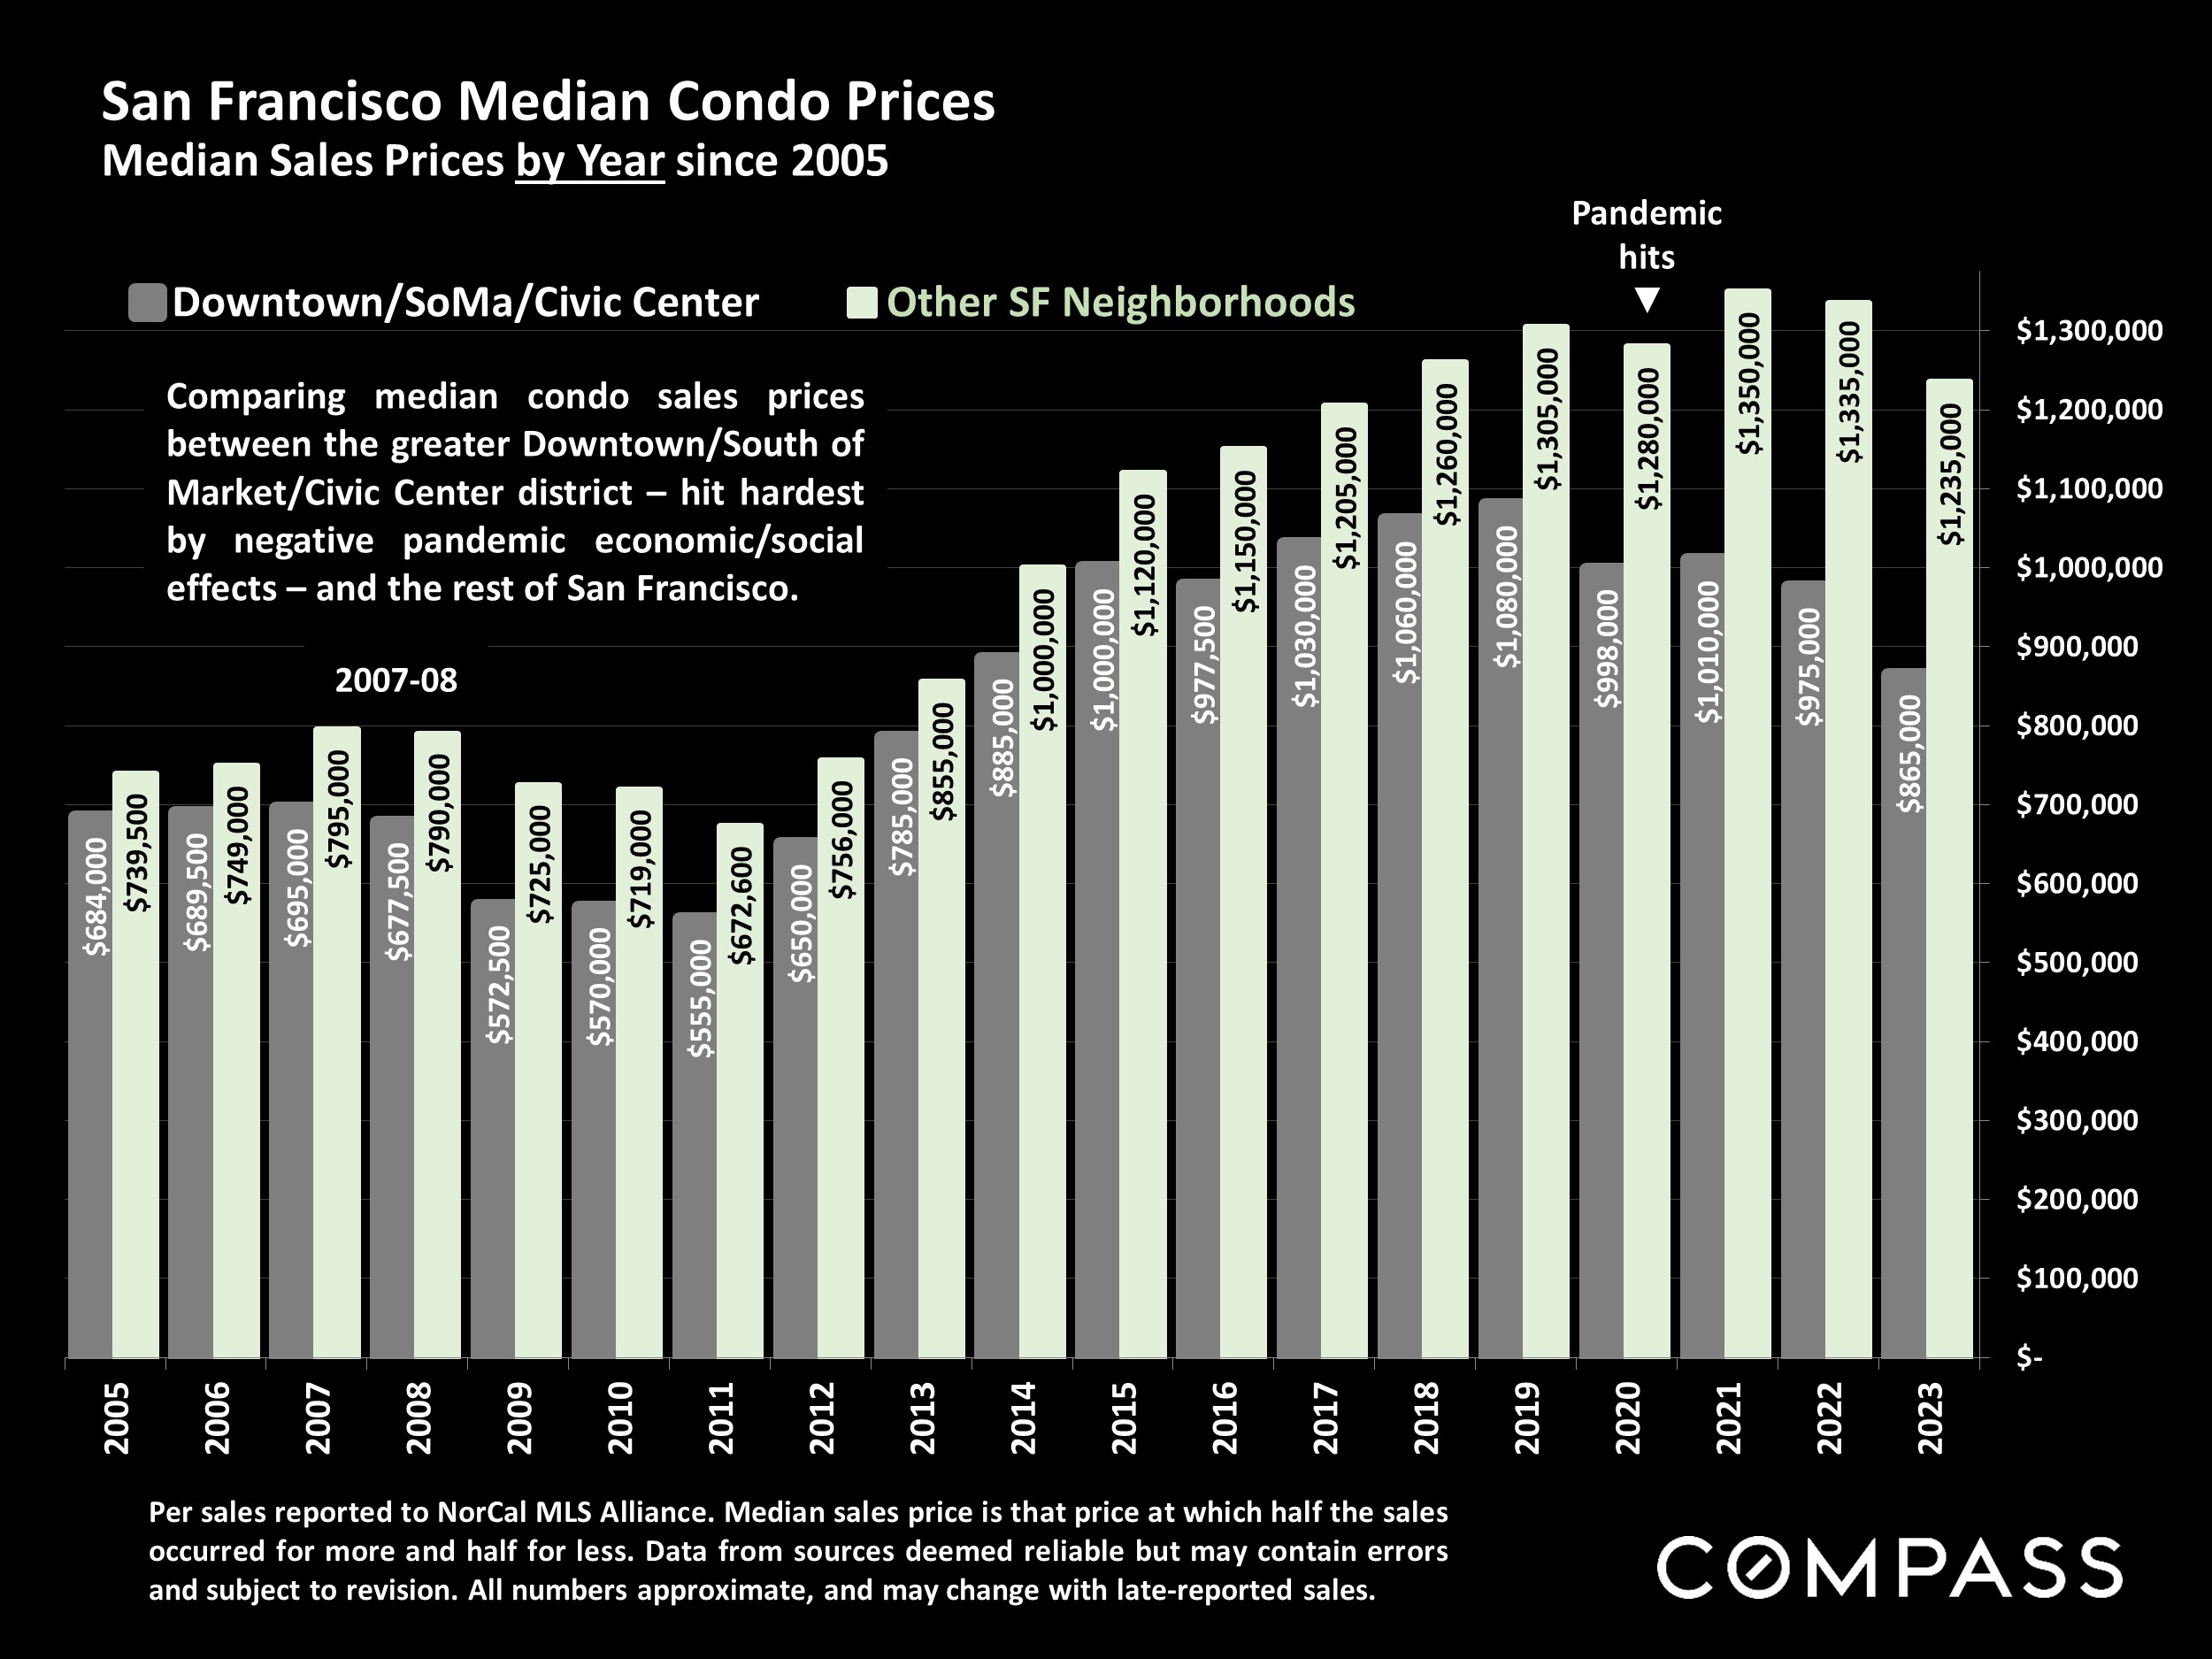
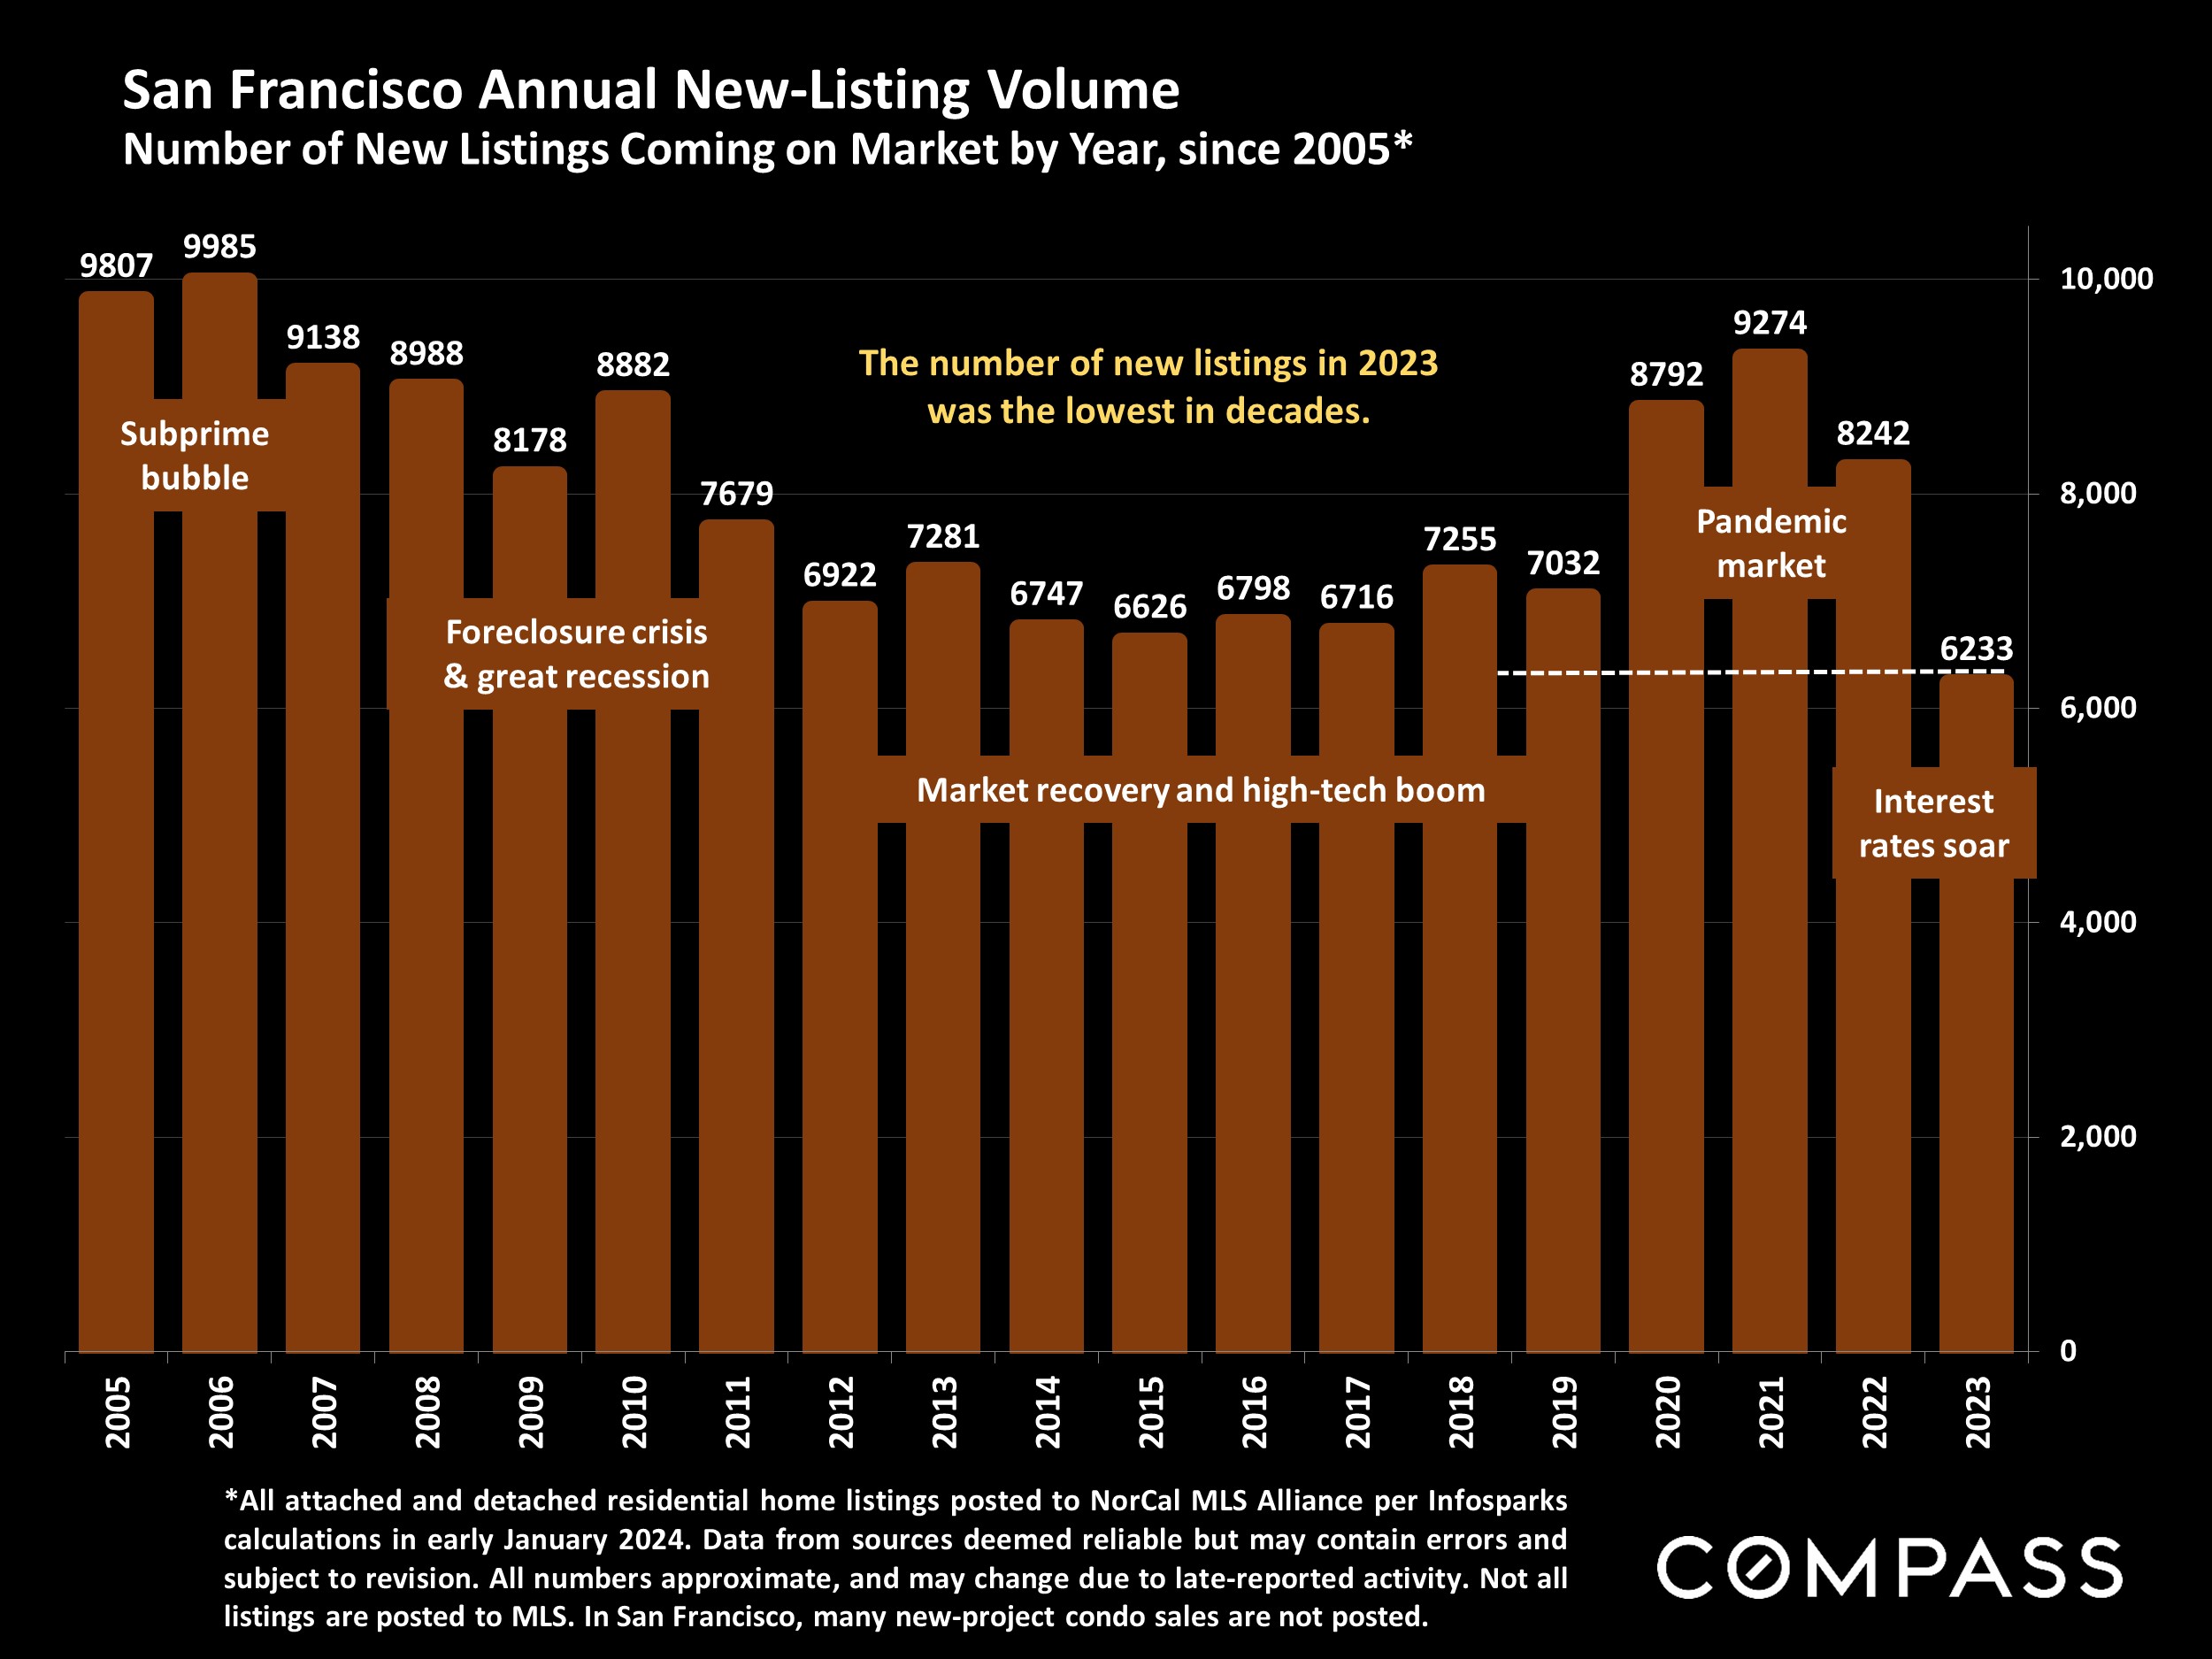
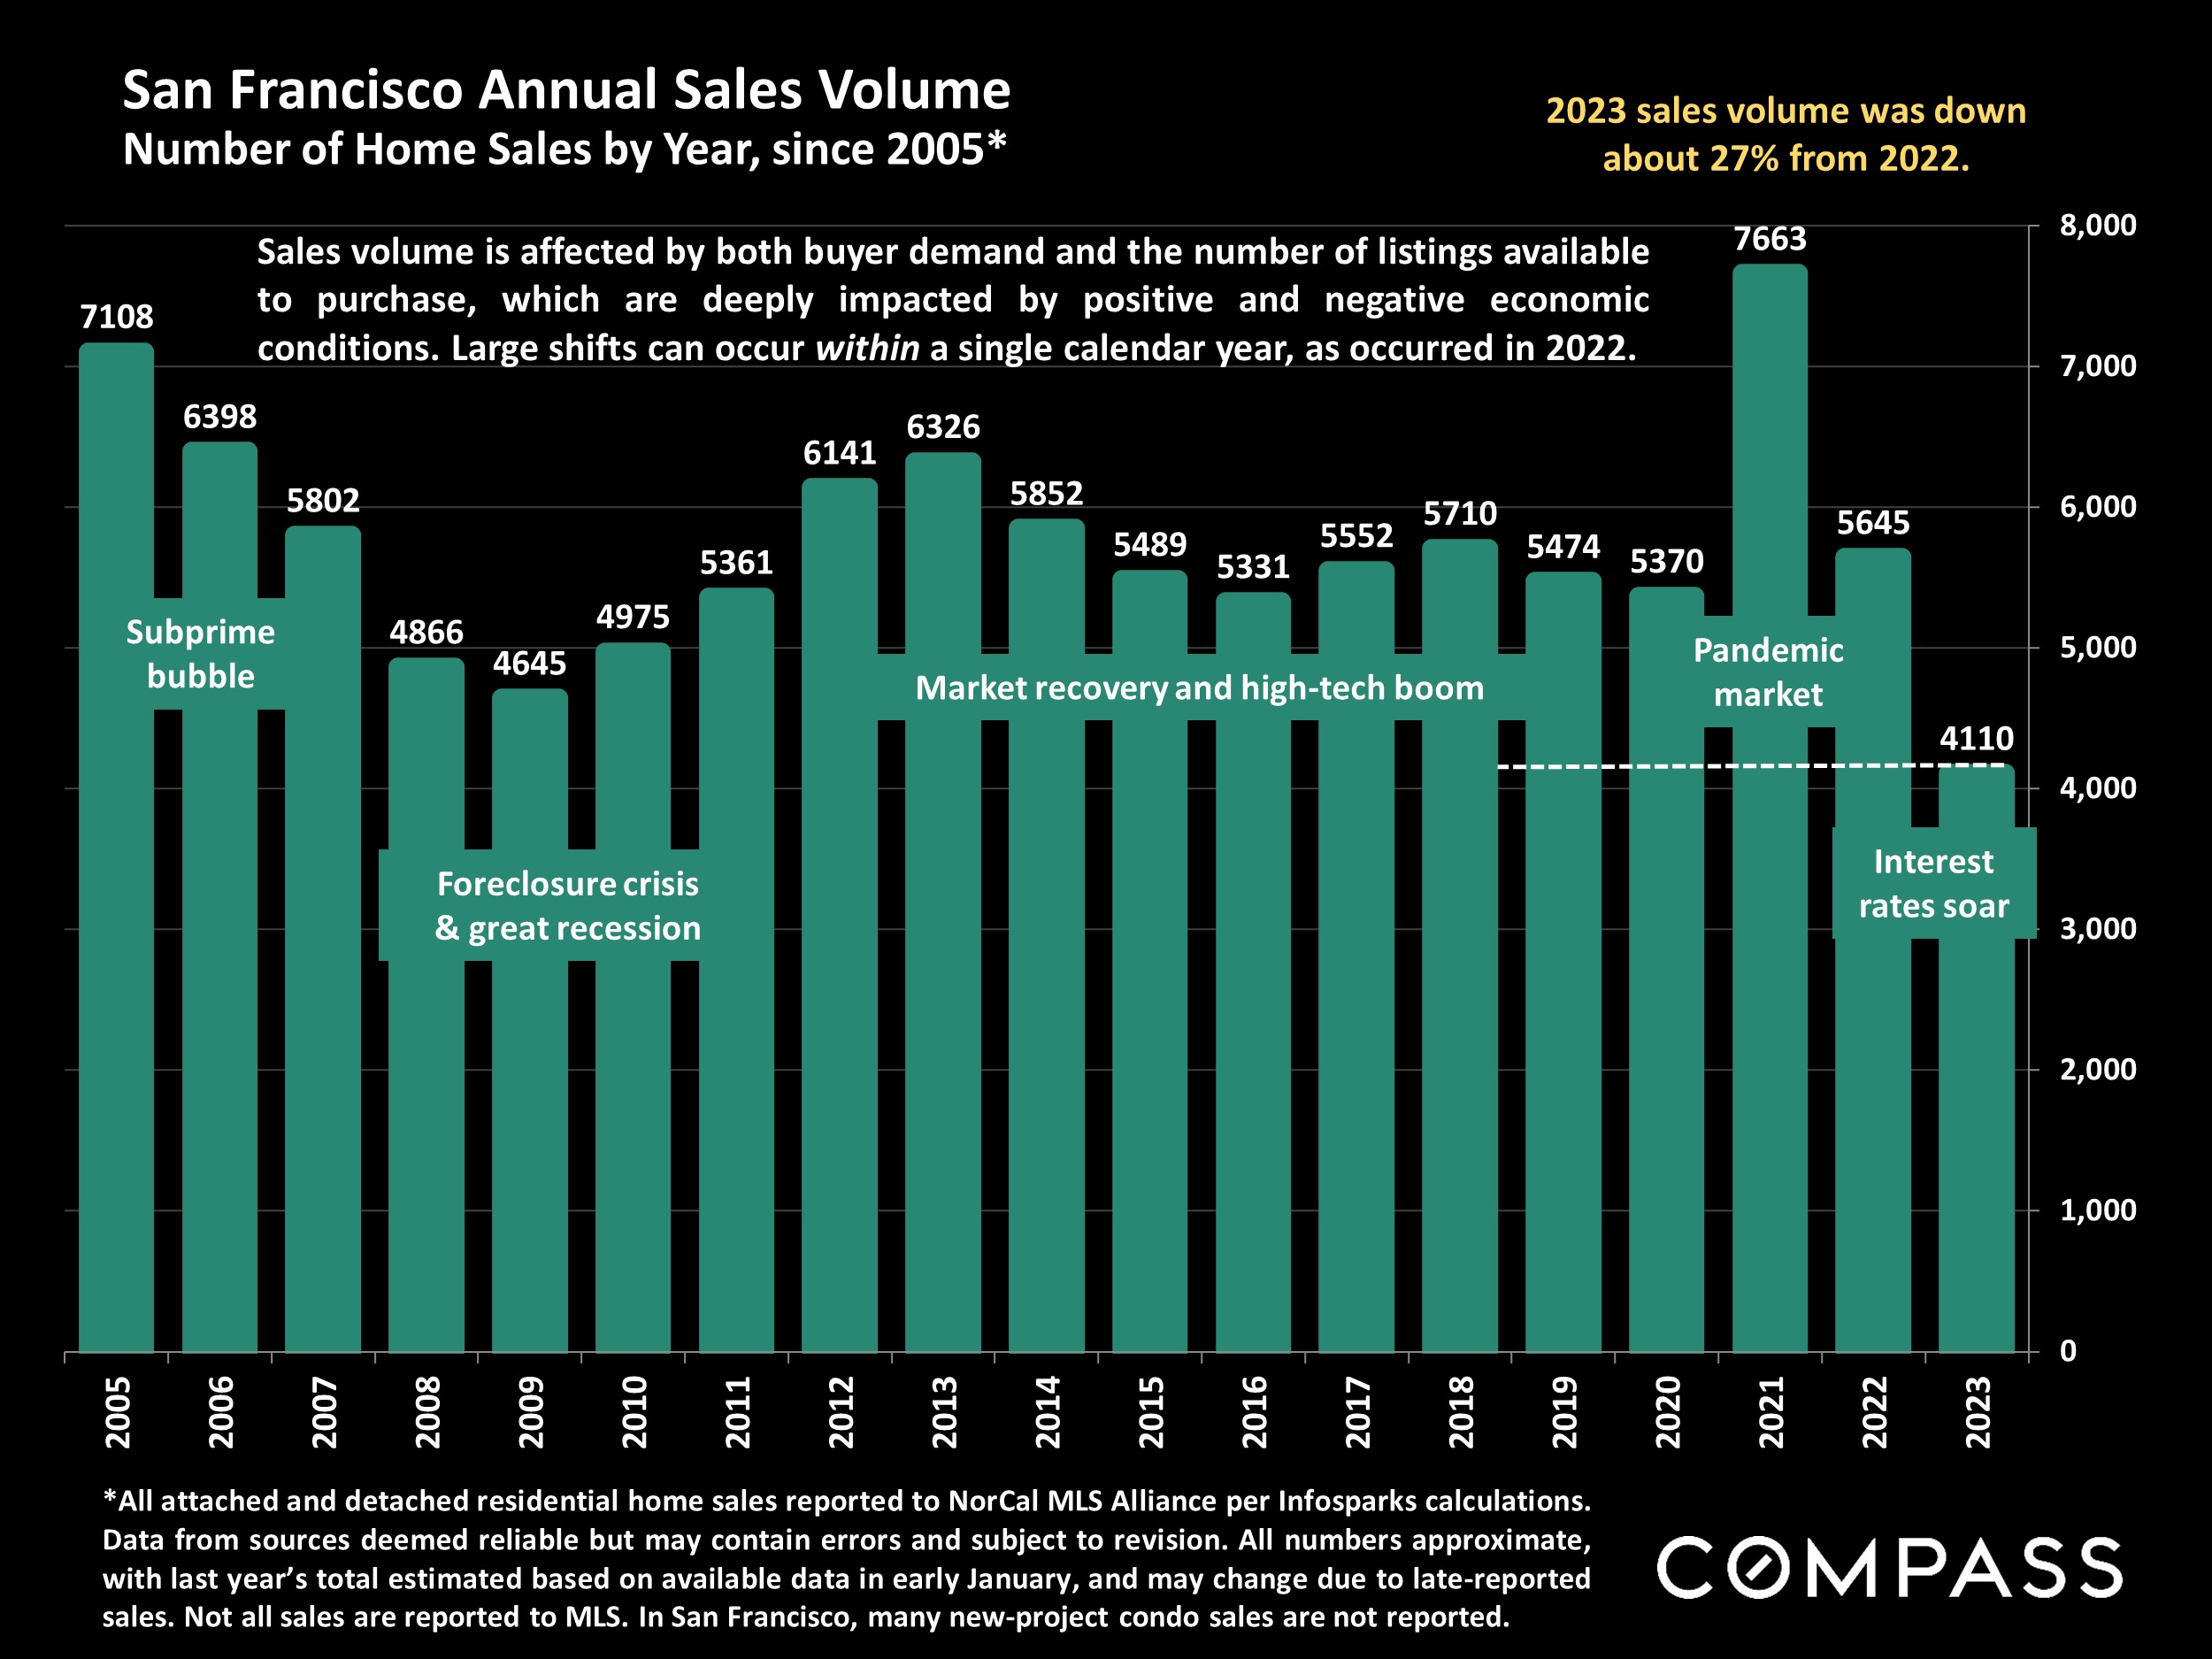
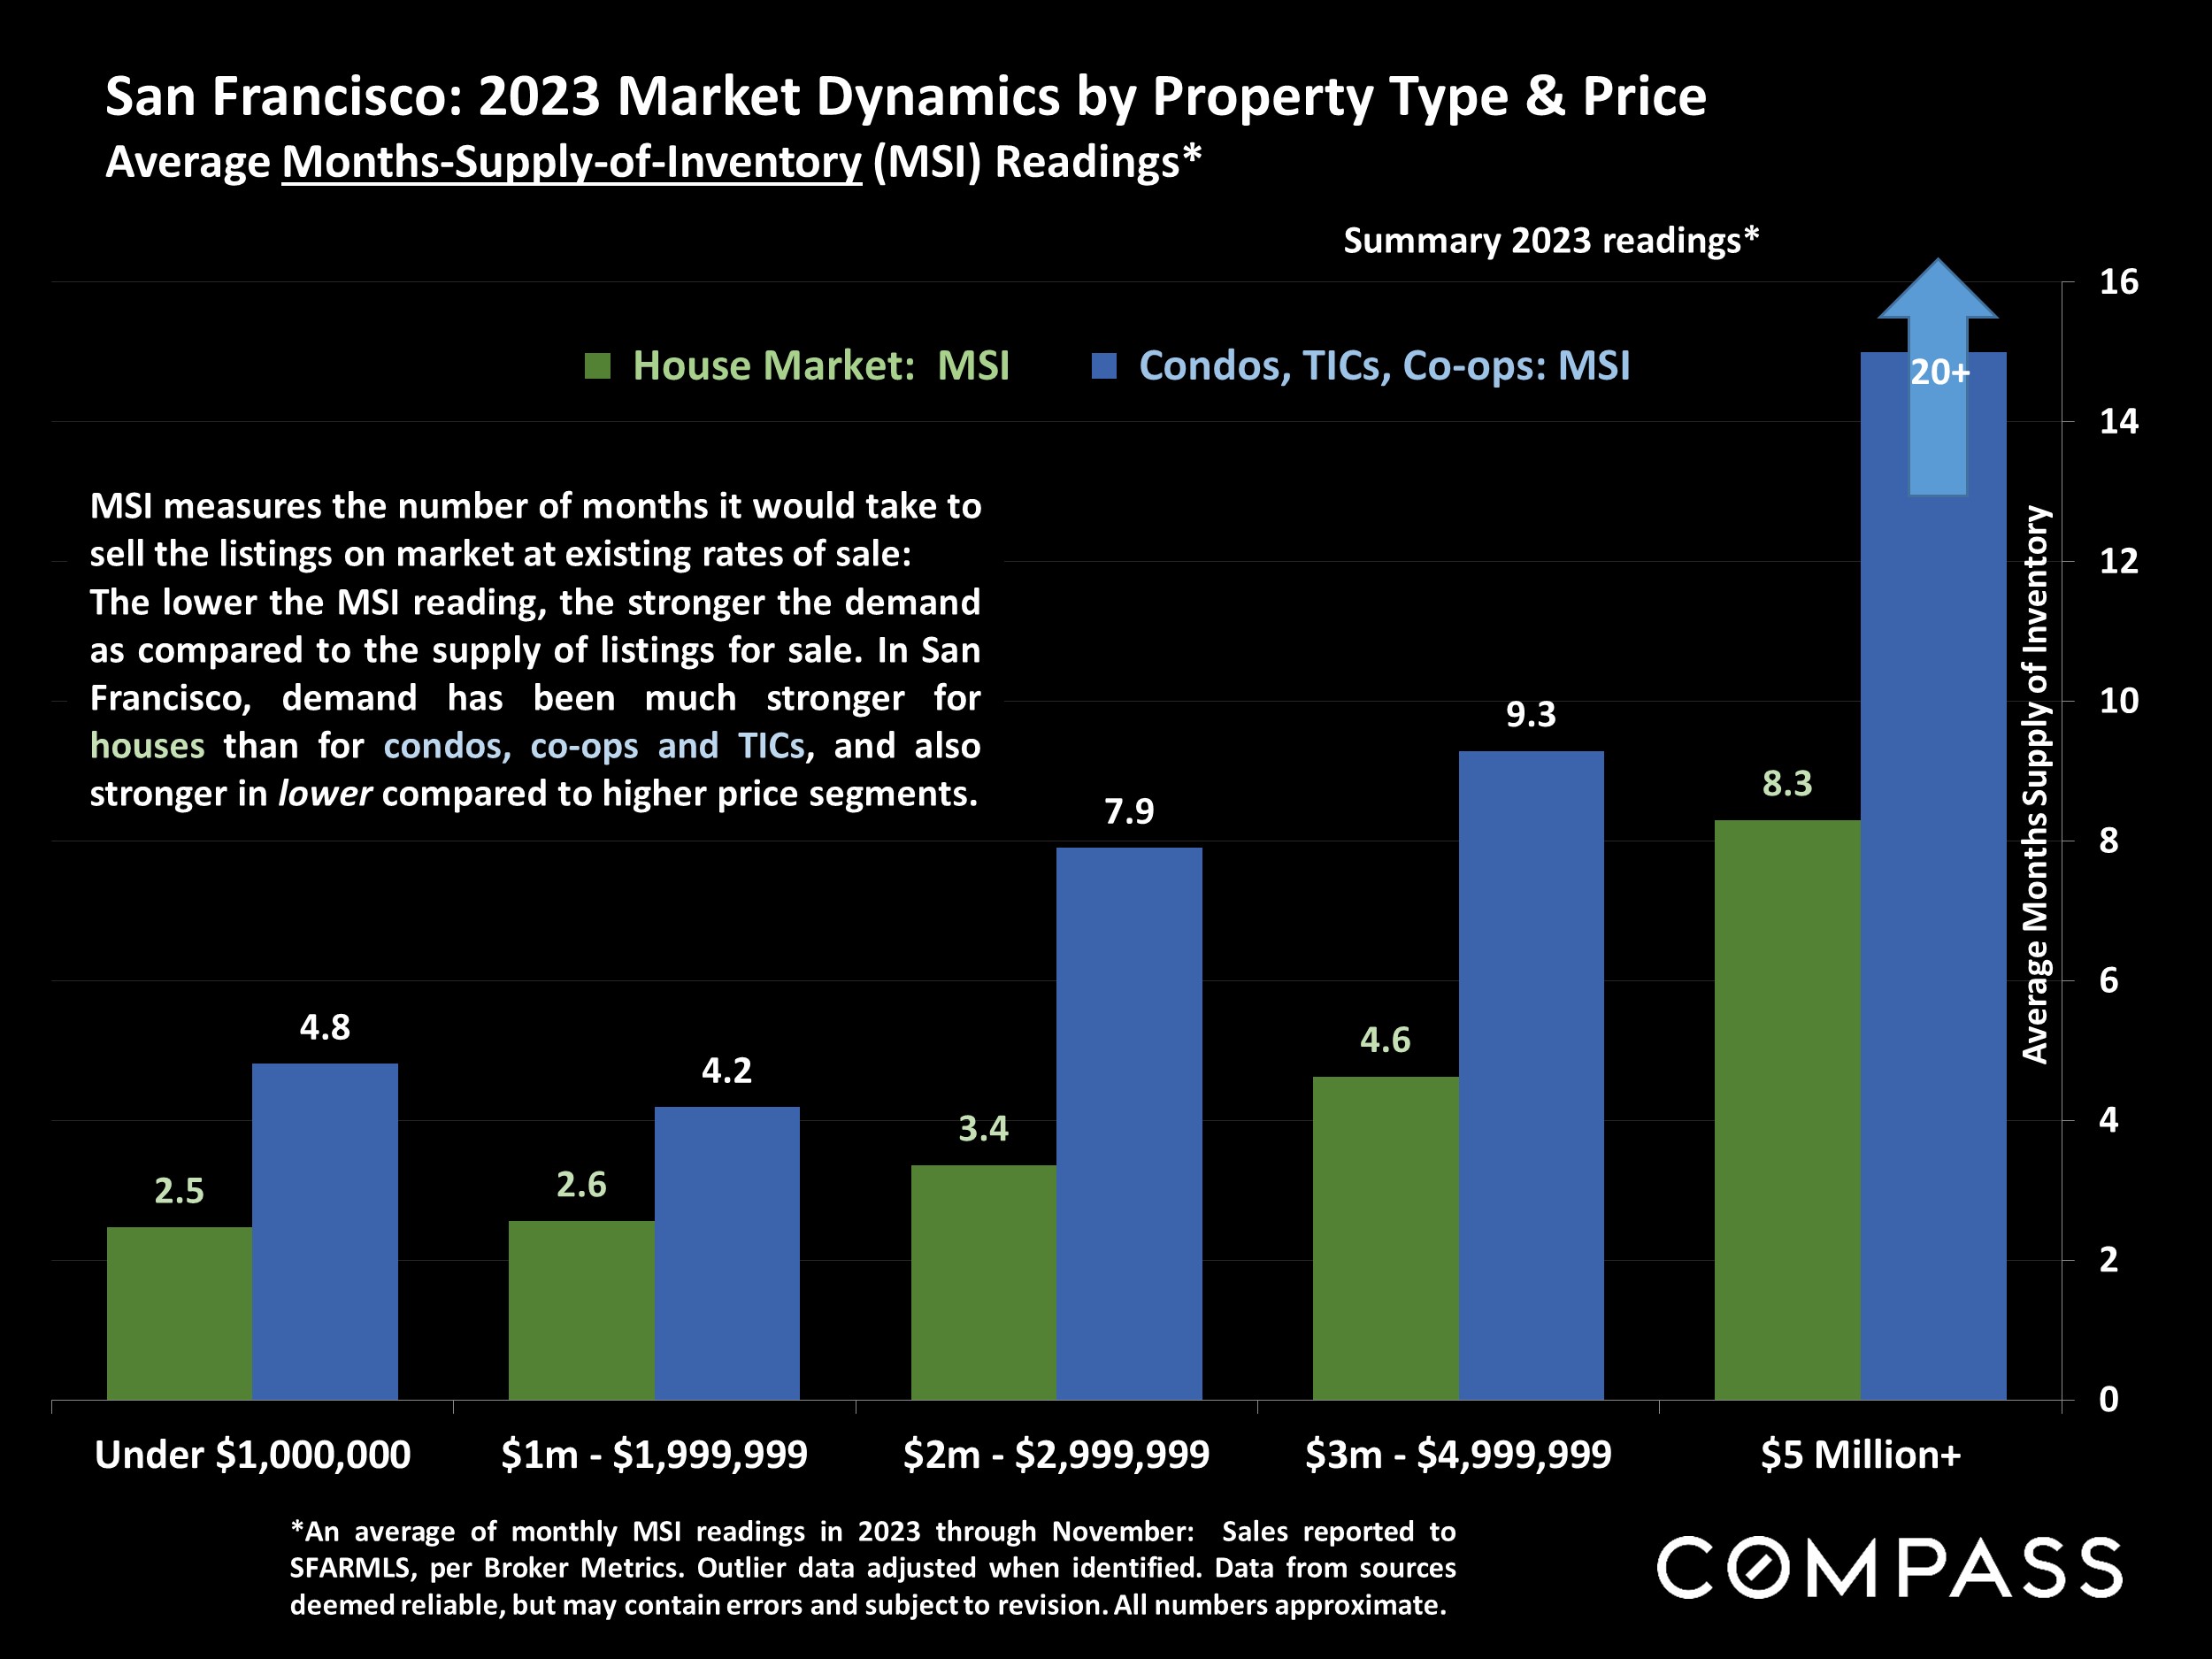
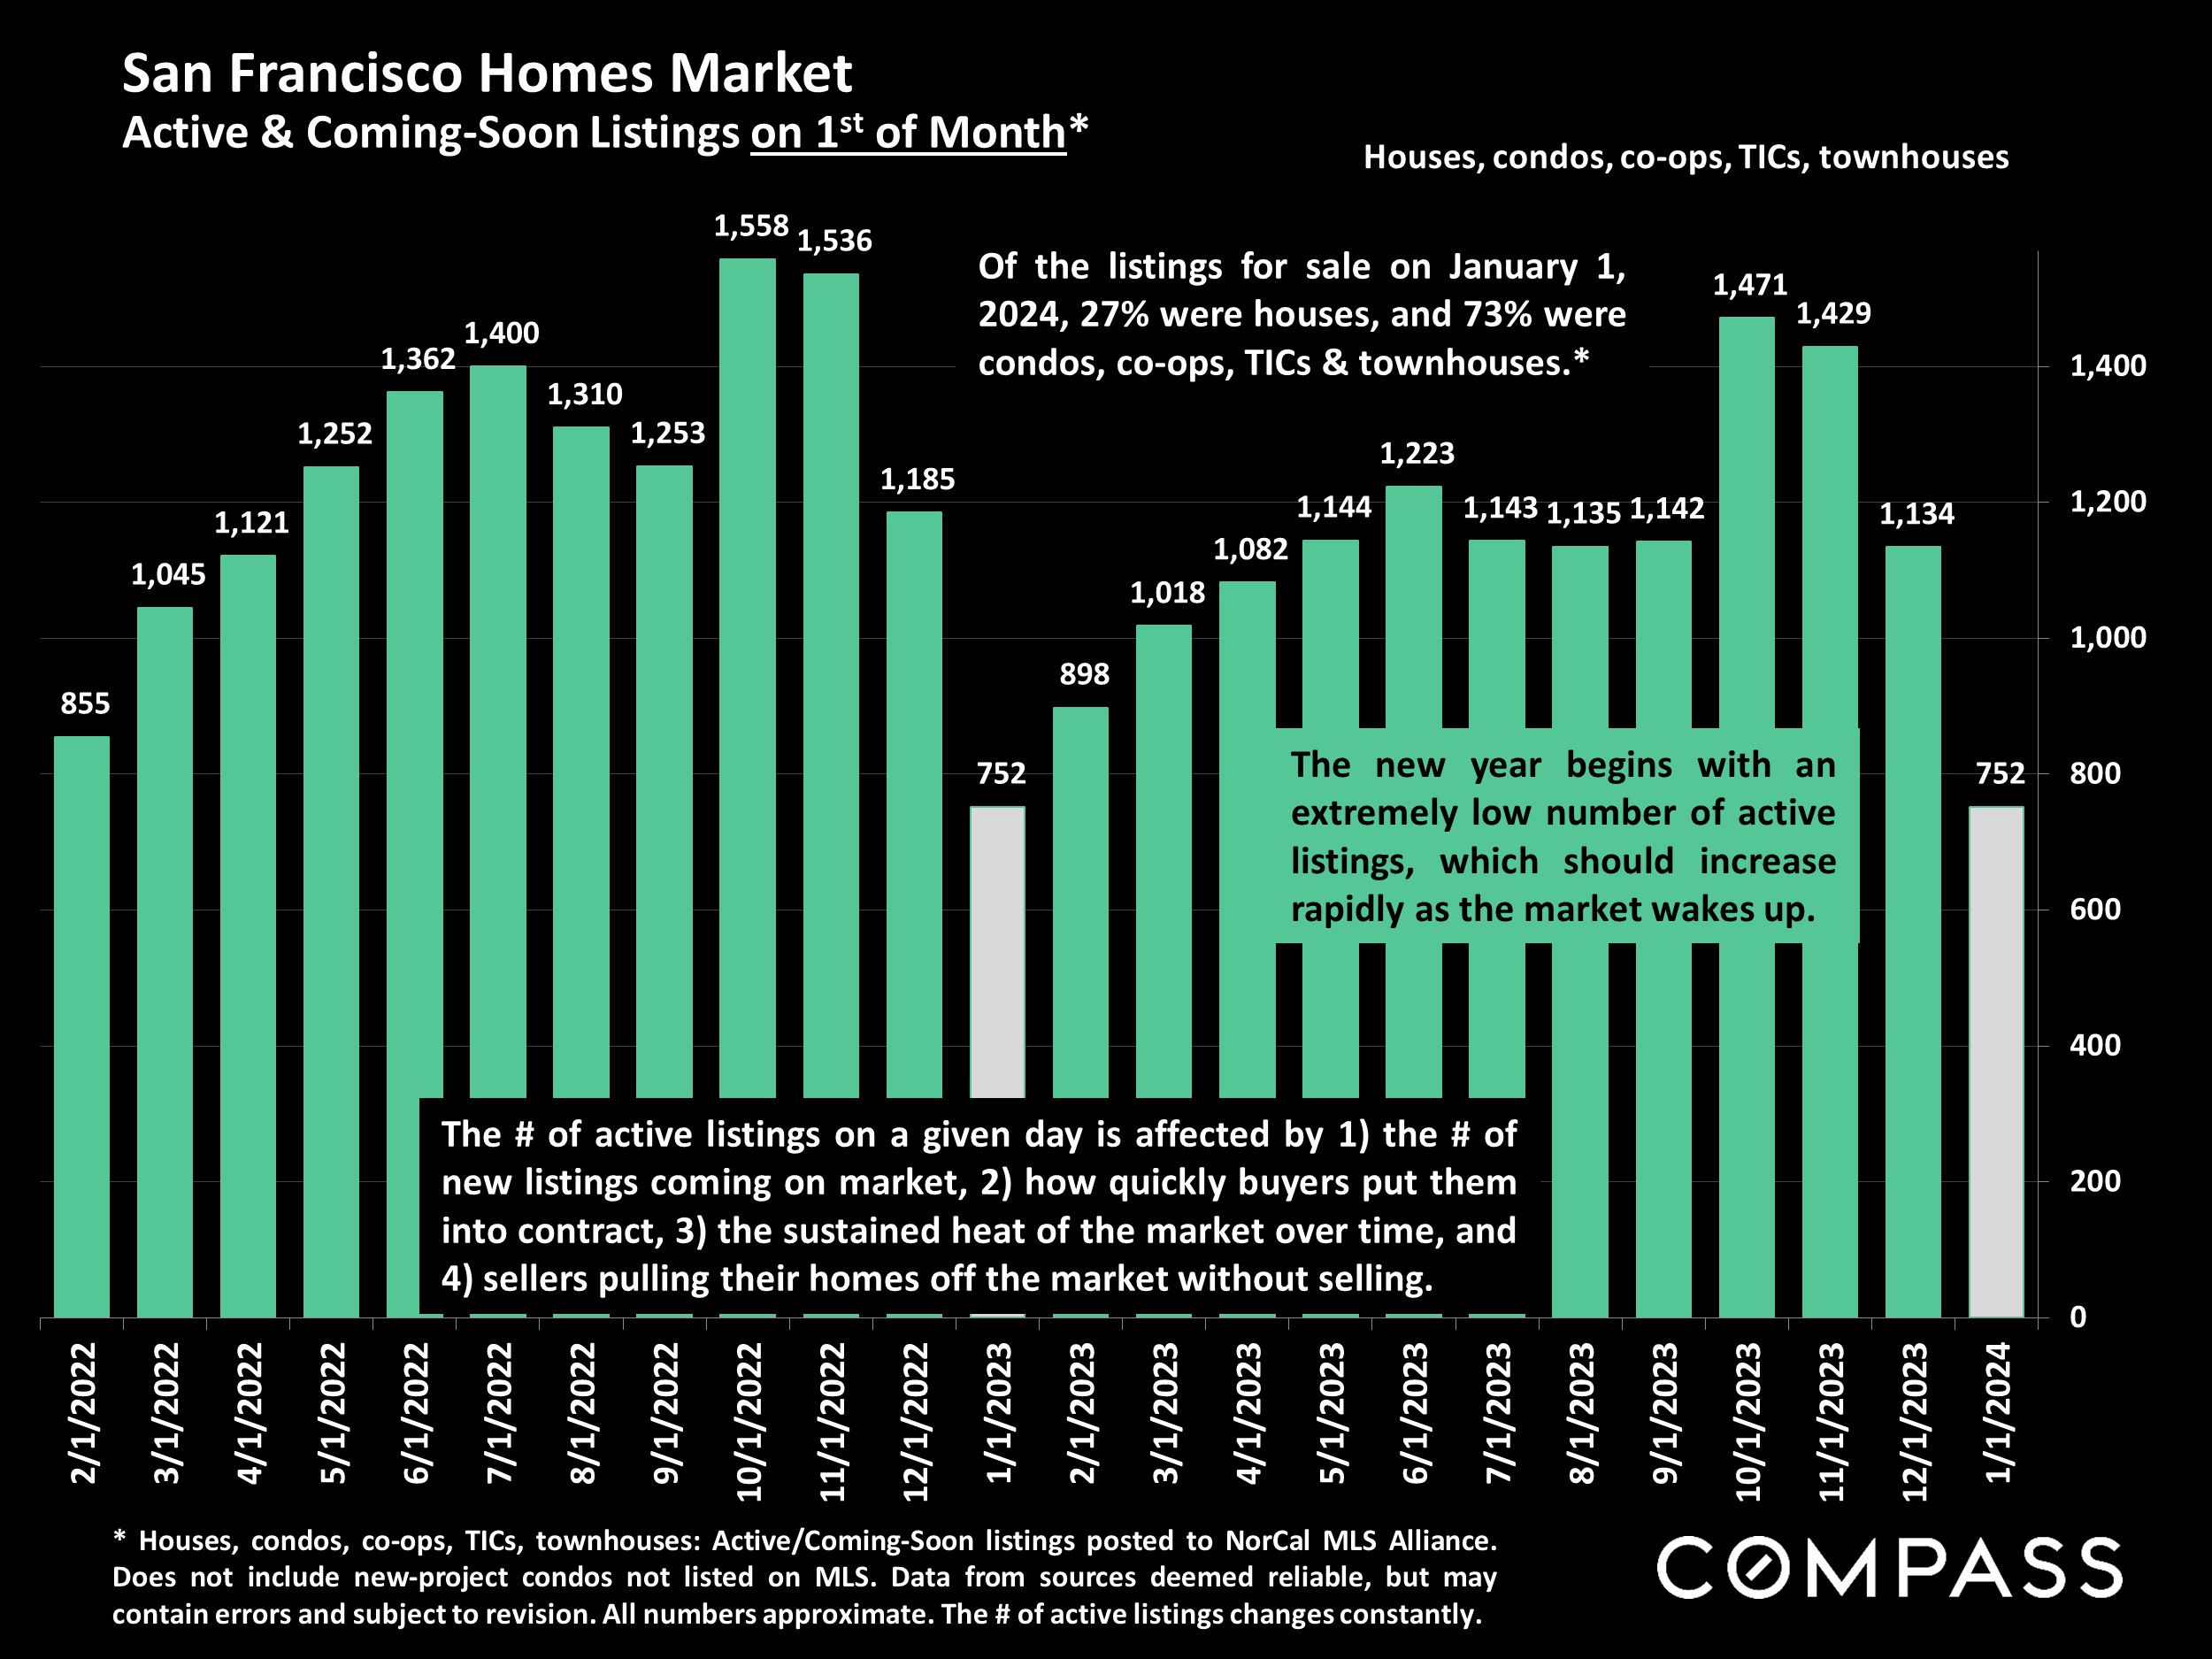
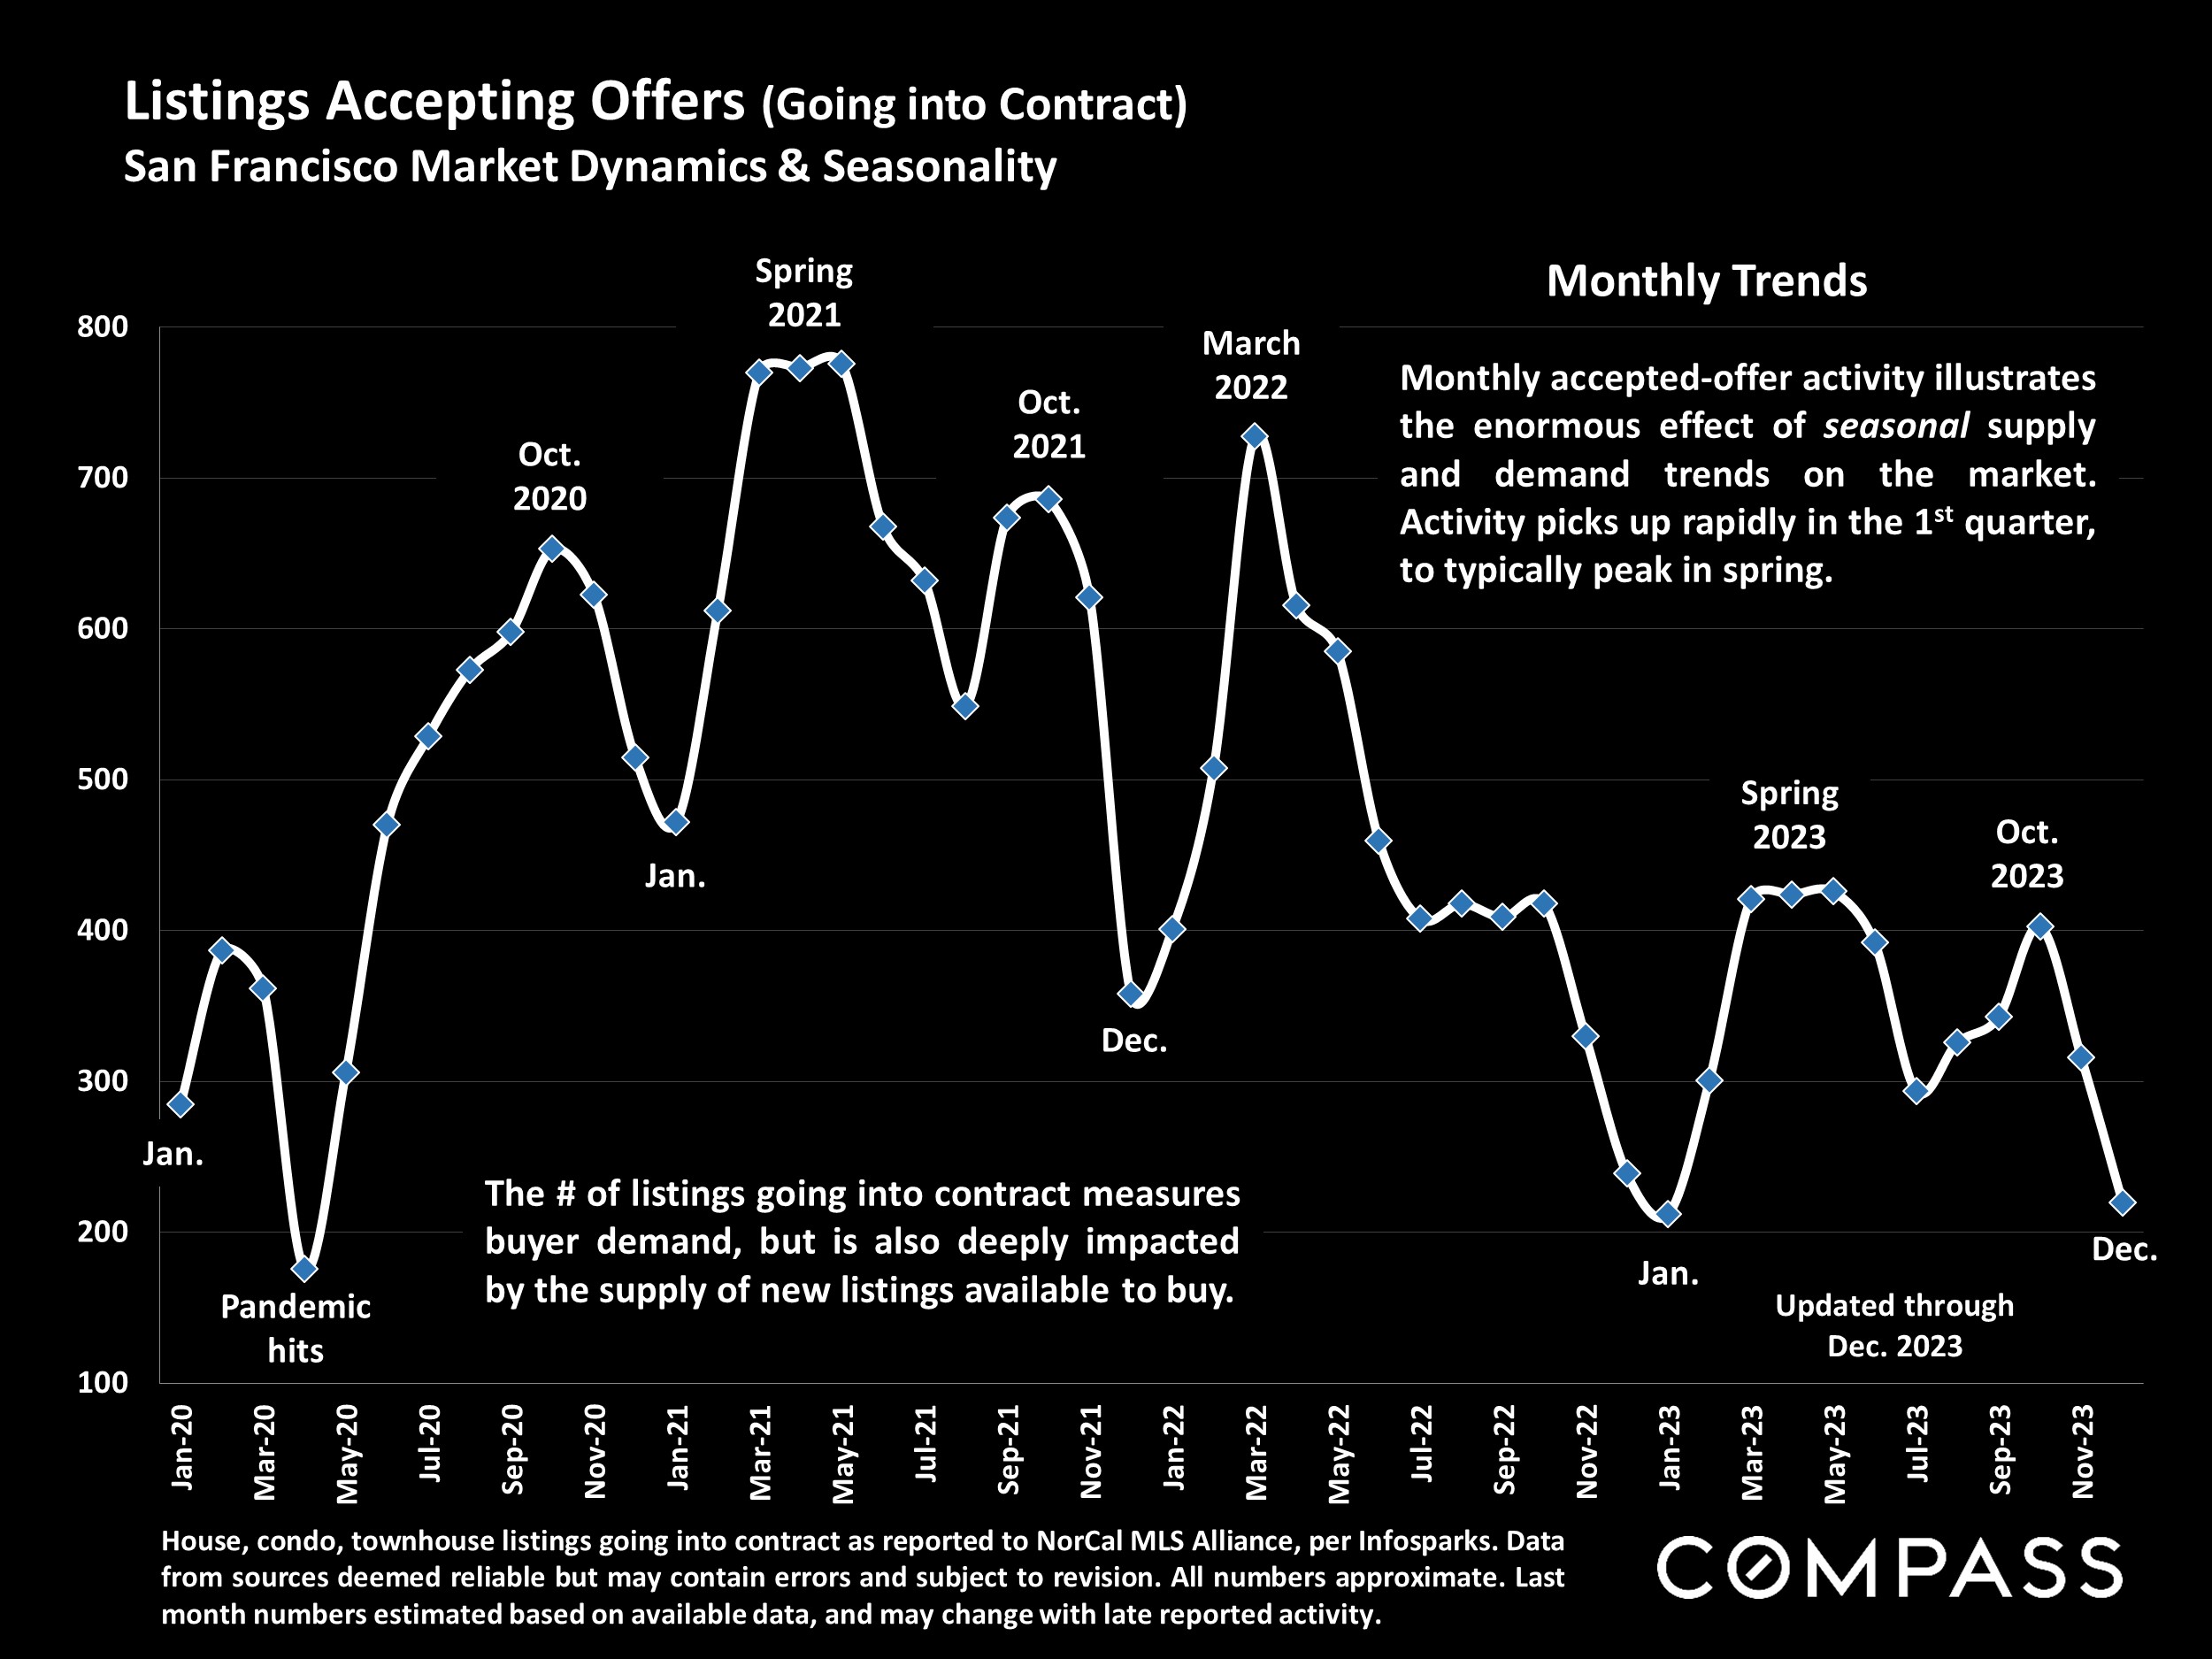
The 2023 market was characterized by high interest rates, financial market uncertainty, negative media “doom-loop” narratives (terribly overdone), social/economic issues pertaining to the downtown district, and a low supply of new listings in most neighborhoods – generally much lower for houses than for condos. Total sales volume plunged, while for many prospective sellers, the motivation to move was reduced by the mortgage lock-in effect. With interest rates falling, media coverage turning more positive, AI companies expanding in downtown, and economic conditions and consumer confidence rebounding, the direction is trending positive for San Francisco real estate.
Note: As often seen in recent years, the complex economic, political and social factors affecting interest rates, inflation, consumer confidence, and housing and financial markets can change quickly in unexpected ways. Forecasts and predictions are best guesses based on the interpretation of recent economic data and trends.
“Inflation around the globe is slowing way faster than expected. If economists are right…next year [will see] inflation back to normal levels for the first time in three years.” Wall Street Journal, 12/24/23, “For Much of the World, Inflation Will Be Normal in 2024 – Finally”
“Consumer sentiment…soared 14% in December [due to] substantial improvements in how consumers view the trajectory of inflation…All age, income, education, geographic, and political identification groups saw gains in sentiment…[2024] inflation expectations plunged from 4.5% last month to 3.1% this month.” University of Michigan, Consumer Sentiment Index, December 2023
“Housing starts surged to a six-month high, sales of previously owned homes picked up from a 13- year low and builder optimism boosted by increased interest from prospective buyers. Meanwhile, Americans’ home-buying plans rose this month by the most in more than a year. The bounce back comes as mortgage rates have declined by…the biggest drop over a comparable period since 2009.” Bloomberg News, 12/20/23
“The 30-year fixed-rate mortgage remained below 7%…after 17 consecutive weeks above. Lower rates are bringing potential homebuyers who were previously waiting on the sidelines back into the market…Heading into the new year, the economy remains on firm ground with solid growth, a tight labor market, decelerating inflation, and a nascent rebound in the housing market.” Freddie Mac, 12/21/23 & 12/28/23
Changes in economic indicators didn’t begin to affect market psychology until early-mid November, right before the big holiday slowdown, and the homebuying process takes 30 to 60 days from loan qualification and offer acceptance to closed sale. Significant effects on sales statistics will not begin to show up until early 2024 data starts to become available.
Statistics are generalities, essentially summaries of widely disparate data generated by dozens, hundreds or thousands of unique, individual sales occurring within different time periods. They are best seen not as precise measurements, but as broad, comparative indicators, with reasonable margins of error. Anomalous fluctuations in statistics are not uncommon, especially in smaller, expensive market segments. Last period data should be considered estimates that may change with late-reported data. Different analytics programs sometimes define statistics – such as “active listings,” “days on market,” and “months supply of inventory” – differently: what is most meaningful are not specific calculations but the trends they illustrate. Most listing and sales data derives from the local or regional multi-listing service (MLS) of the area specified in the analysis, but not all listings or sales are reported to MLS and these won’t be reflected in the data. “Homes” signifies real-property, single-household housing units: houses, condos, co-ops, townhouses, duets and TICs (but not mobile homes), as applicable to each market. City/town names refer specifically to the named cities and towns, unless otherwise delineated. Multi-county metro areas will be specified as such. Data from sources deemed reliable, but may contain errors and subject to revision. All numbers to be considered approximate.
Many aspects of value cannot be adequately reflected in median and average statistics: curb appeal, age, condition, amenities, views, lot size, quality of outdoor space, “bonus” rooms, additional parking, quality of location within the neighborhood, and so on. How any of these statistics apply to any particular home is unknown without a specific comparative market analysis.
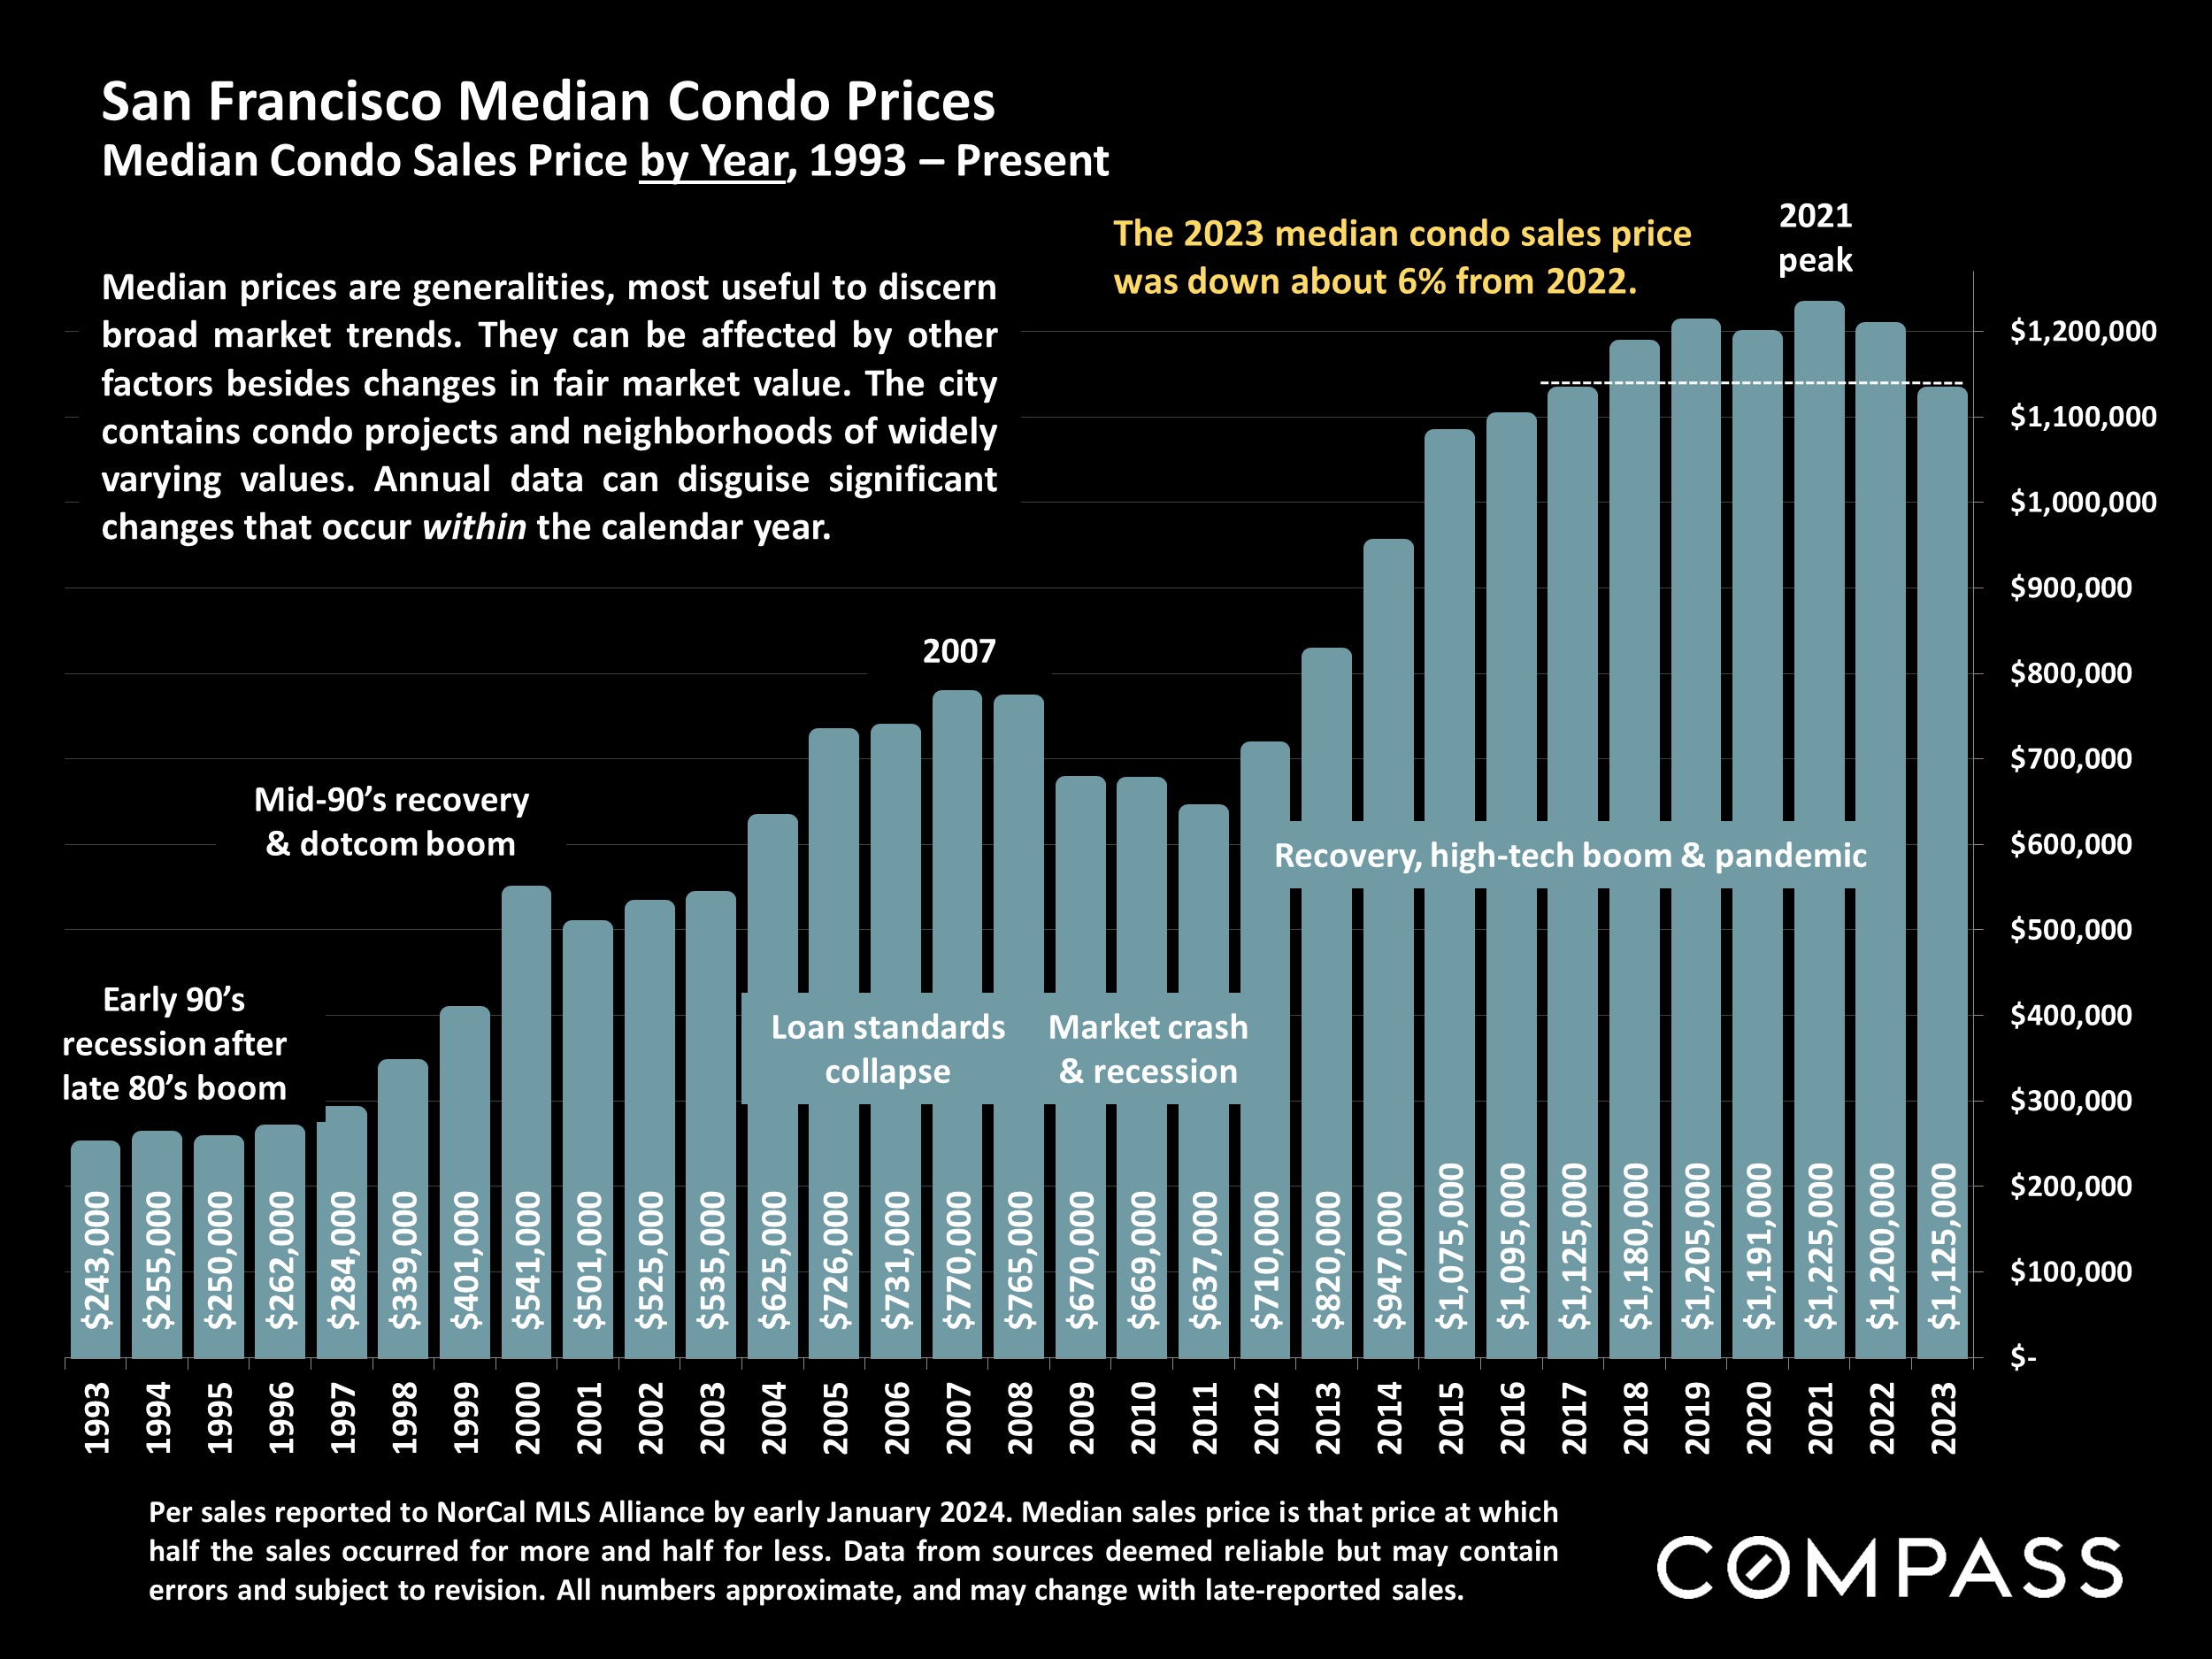
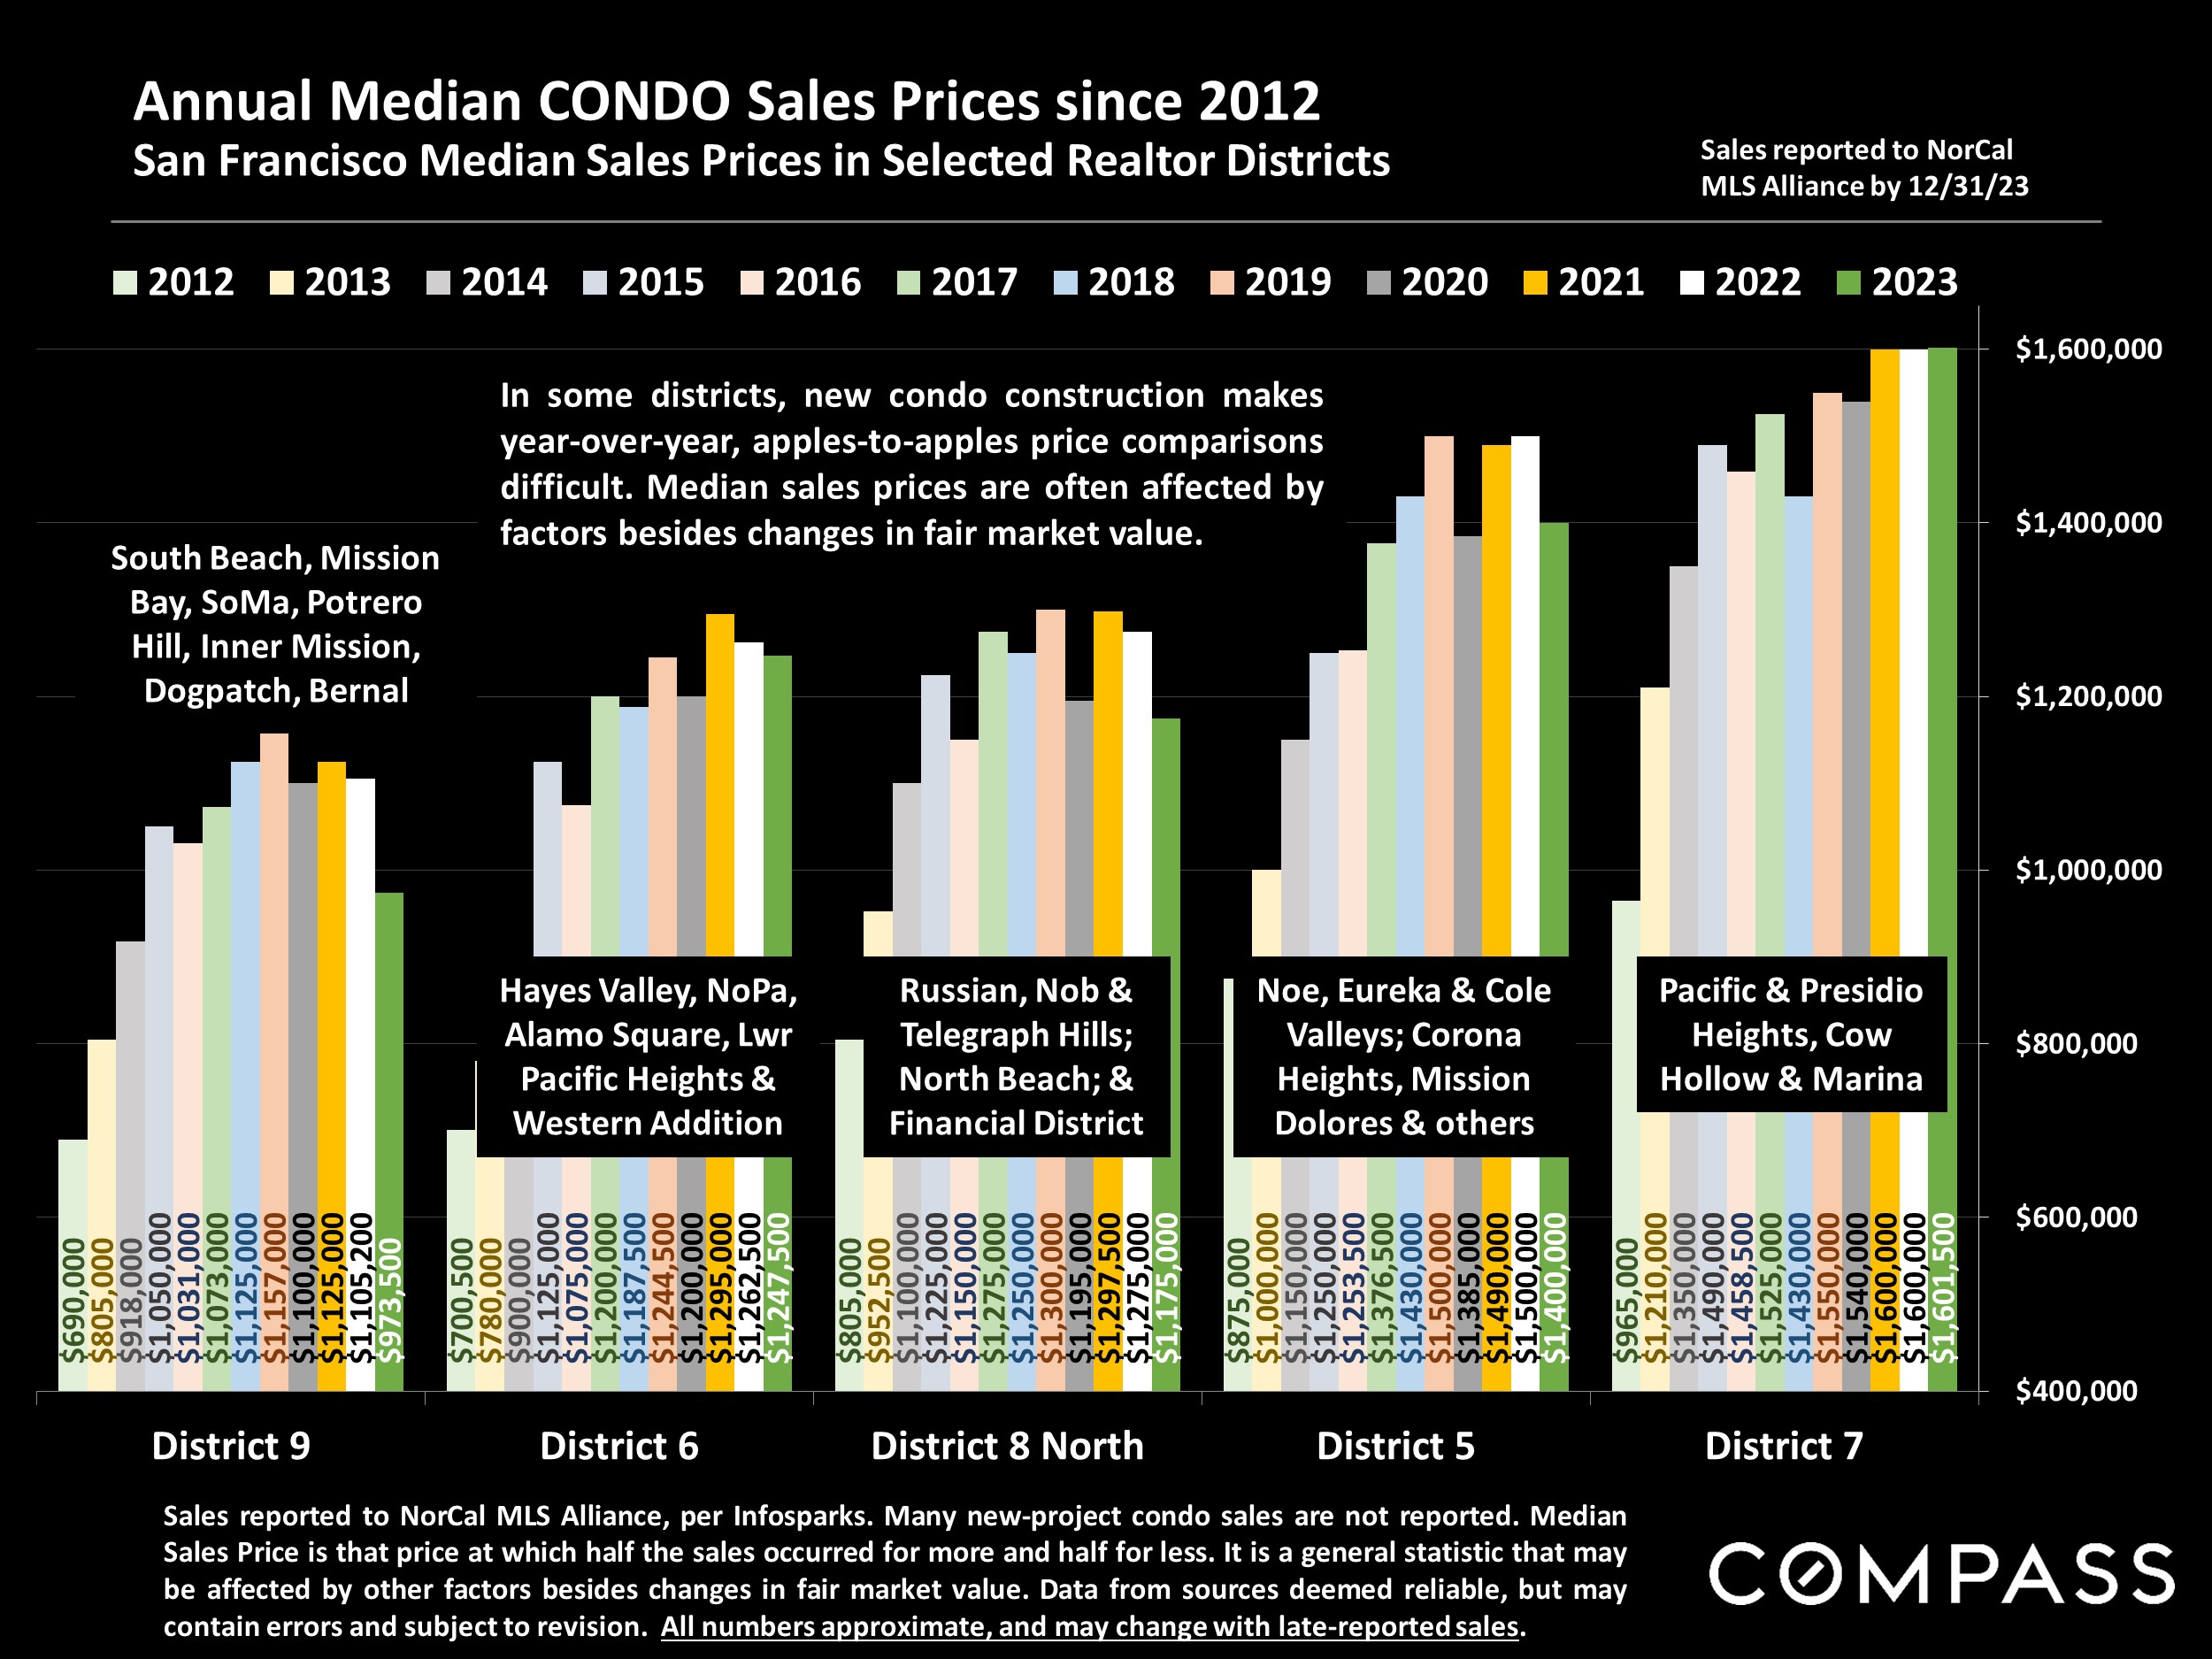
Median Sales Price is that price at which half the properties sold for more and half for less. It may be affected by seasonality, “unusual” events, or changes in inventory and buying trends, as well as by changes in fair market value. The median sales price for an area will often conceal an enormous variety of sales prices in the underlying individual sales.
Dollar per Square Foot is based upon the home’s interior living space and does not include garages, unfinished attics and basements, rooms built without permit, patios, decks or yards (though all those can add value to a home). These figures are usually derived from appraisals or tax records, but are sometimes unreliable (especially for older homes) or unreported altogether. The calculation can only be made on those home sales that reported square footage.
