
A Strange Year Begins Winding Down
|
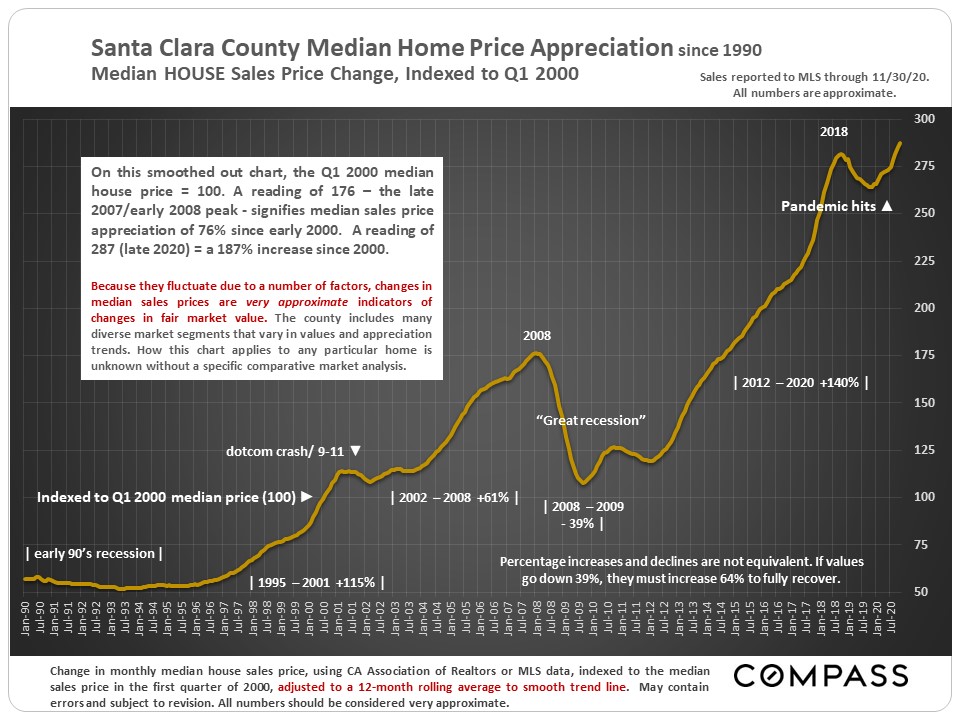
Though Covid-19 upended many normal seasonal trends this year, the market did begin its typical “holiday season” slowdown in November – however activity remained well above levels of last year. It is unknown how the latest pandemic circumstances may affect the market in December, which is usually by far the slowest month of the year. More importantly, we hope you and your loved ones stay safe and well during this challenging holiday season. ———————————– This first chart tracks percentage changes in median house sales price since 1990. It is based upon the Q1 2000 price being indexed to 100: A reading of 50 signifies a median price half that in Q1 2000; 200 means the price has doubled since then. In early 1990, the Santa Clara County median house price was about $270,000; it is currently running about $1,400,000.
|
 |
 |
 |
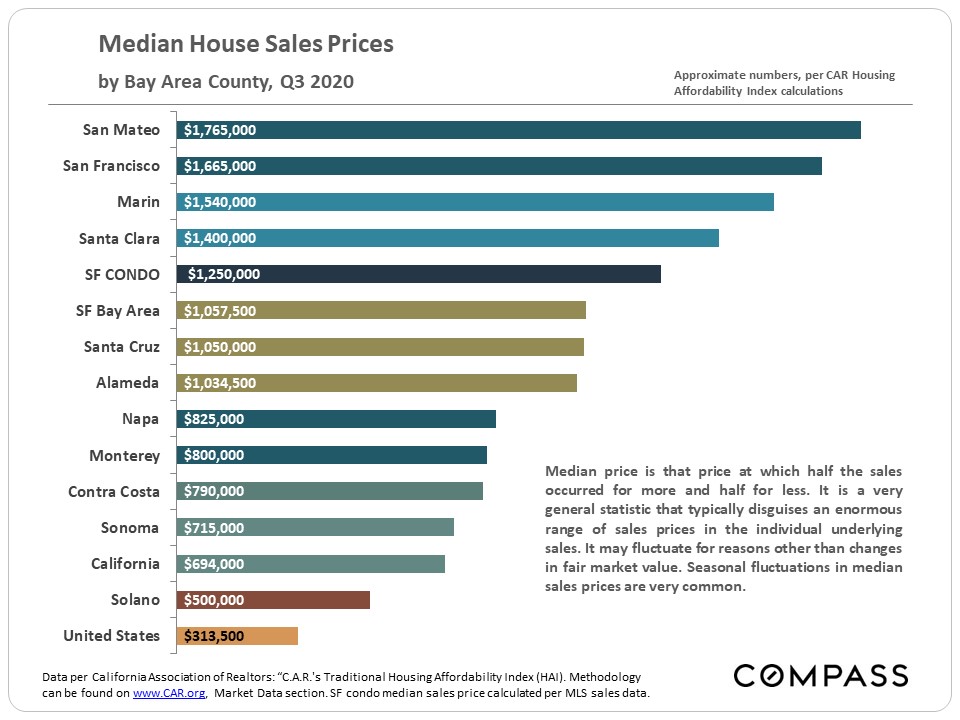
Q3 2020 median home prices around the Bay Area.
|
 |
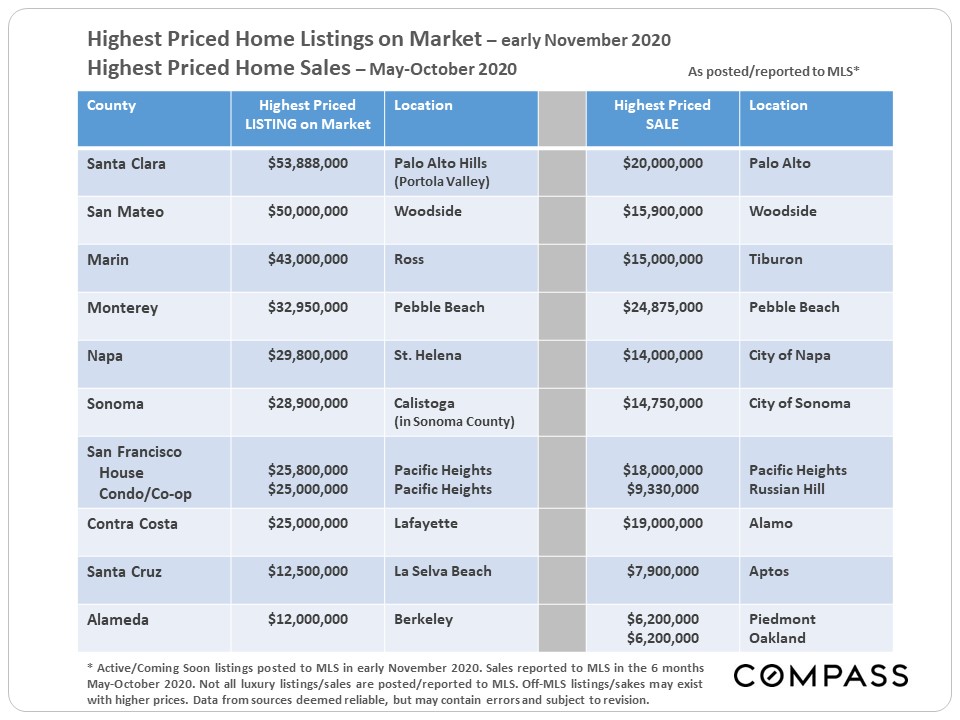
Highest priced listings on the market in early November, and the highest priced sales May through October 2020, by Bay Area County.
|
 |
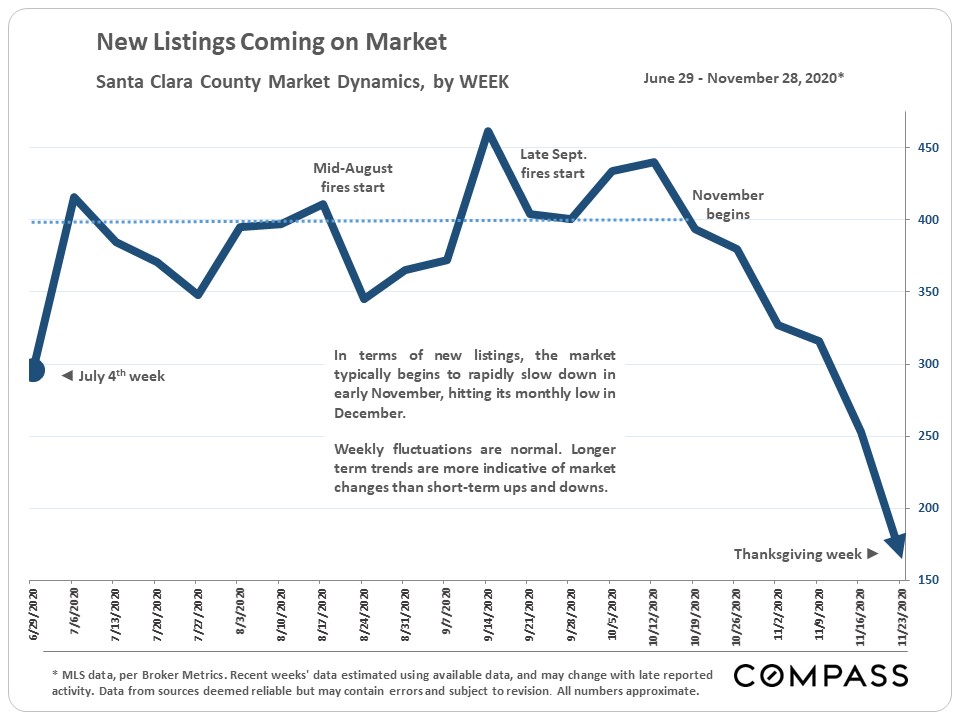
As is typical, the number of new listings plunged in November. In the first week of December – not illustrated on this chart – new listing activity ticked back up from the short Thanksgiving week, but remained well below pre-November numbers. December is usually the month with the lowest number of new listings coming on market.
|
 |
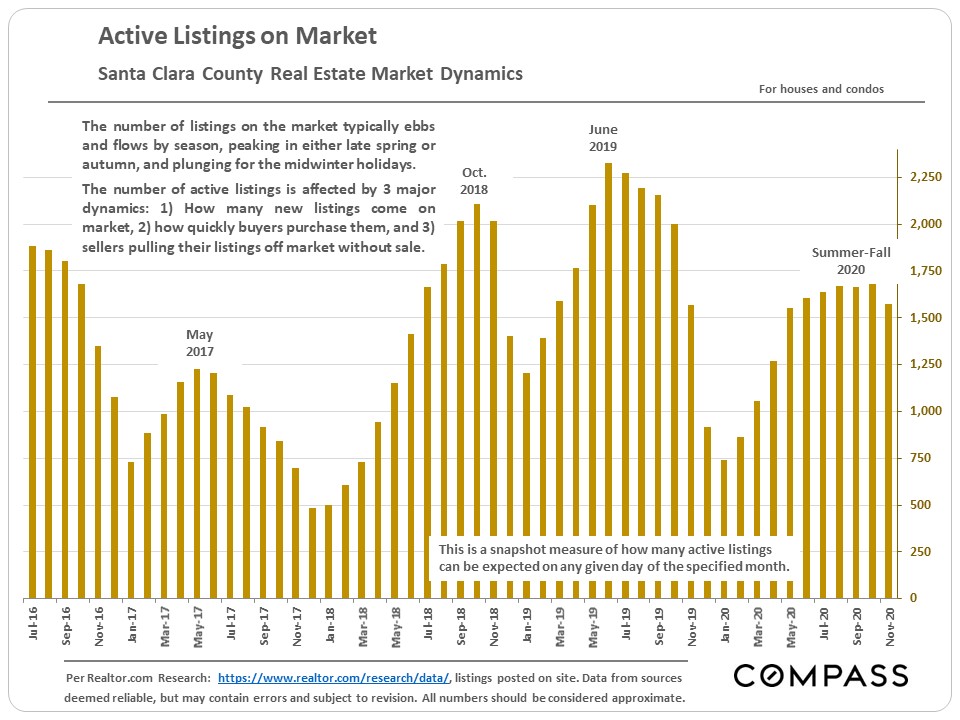
Low inventory of listings on the market has been a major factor in the county market this year.
|
 |
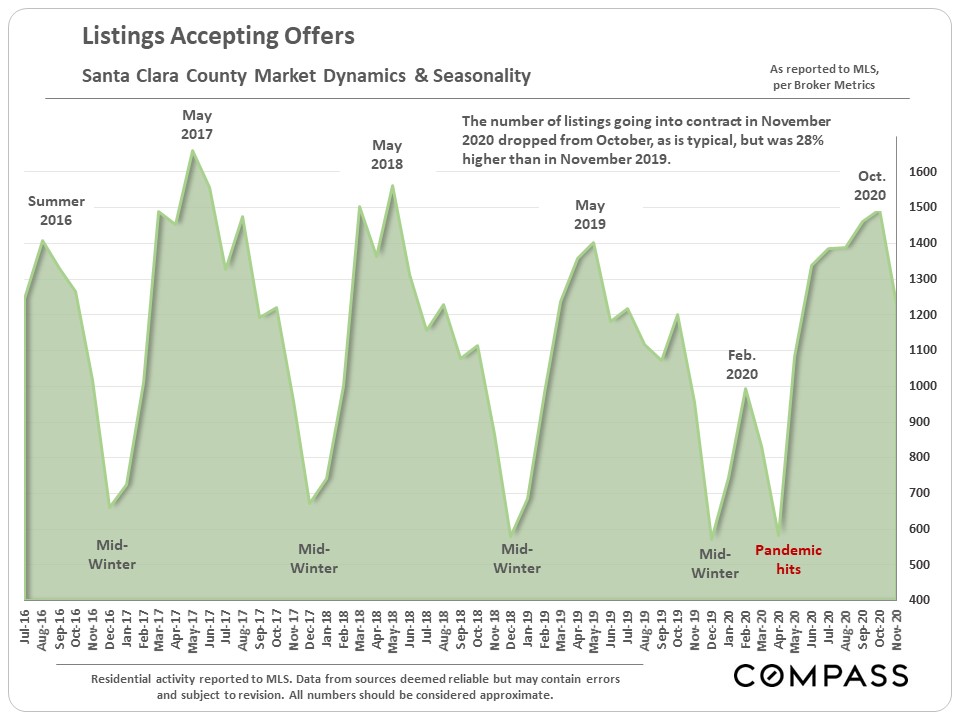
Market activity as measured by the number of listings going into contract, though dropping in November, was significantly higher on a year-over-year basis: 28% higher than in November 2019.
|
 |
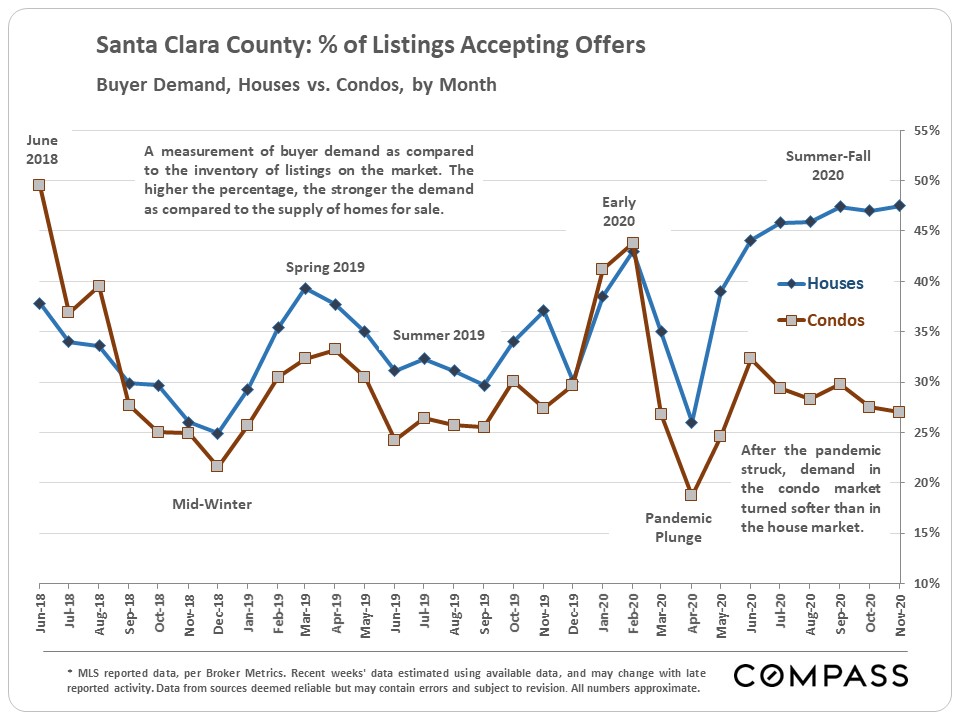
This statistic measures demand as compared to the supply of listings available to buy. Since the pandemic began, the condo market has been significantly weaker than the house market as measured by this metric.
|
 |
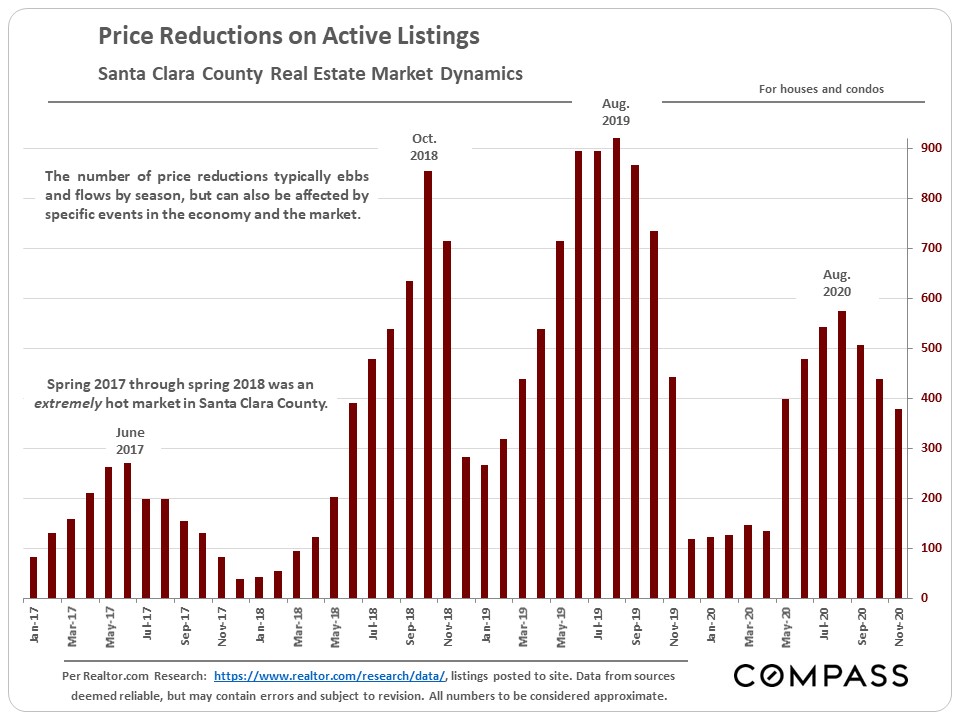
Hotter market = fewer price reductions.
|
 |
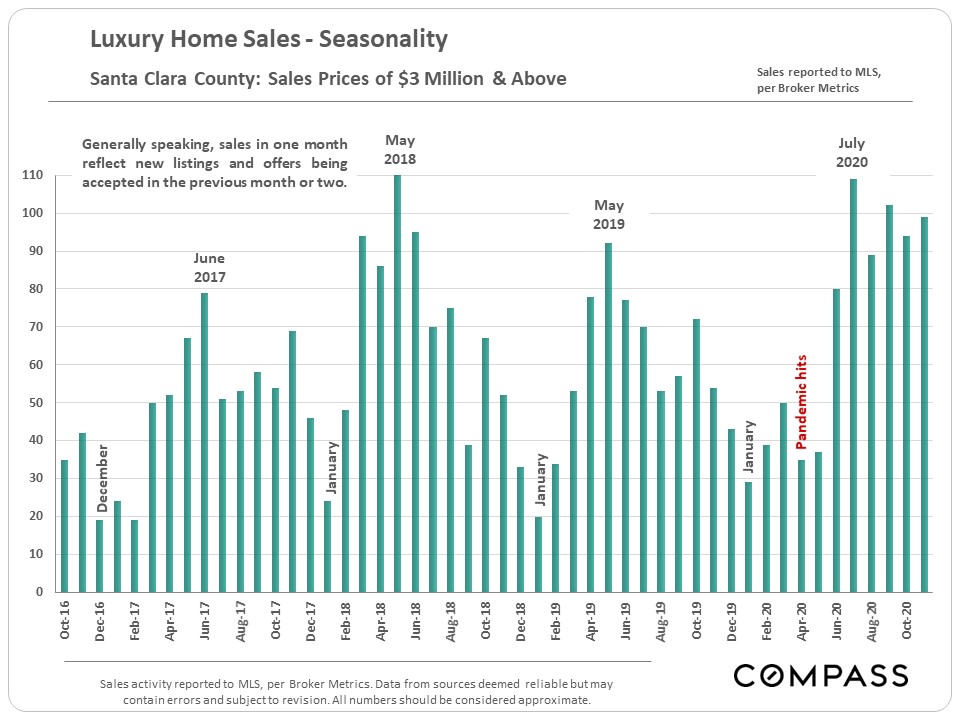
Luxury home sales by month. The number of luxury home listings accepting offers began to drop in November (not illustrated on this chart), as is normal, and should show up in a reduced number of closed sales in December. Sales usually bottom out in January.
|
 |
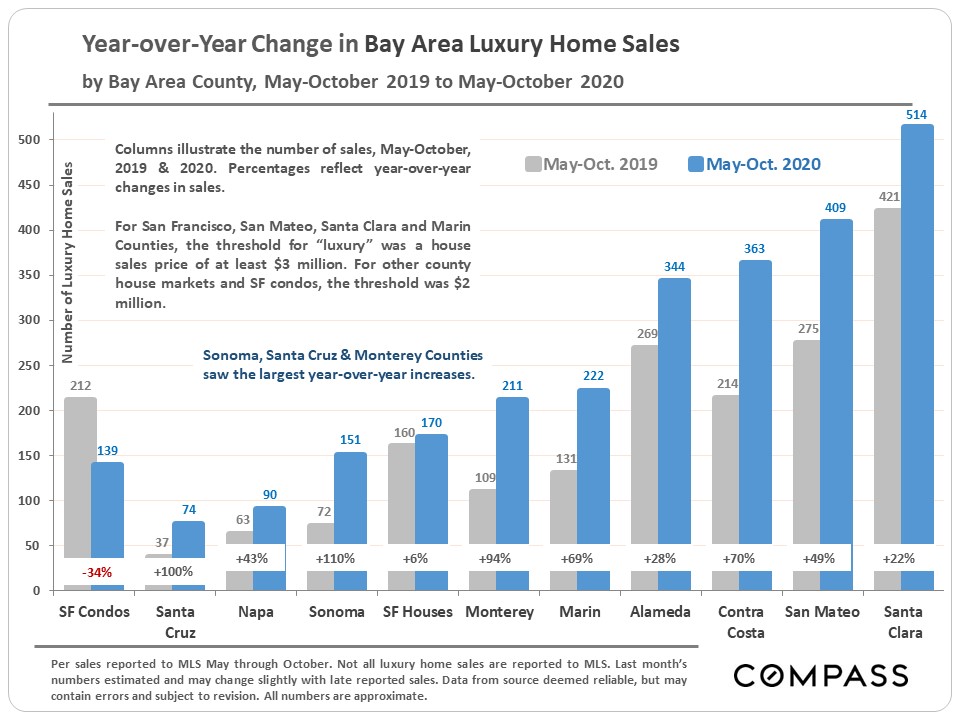
Santa Clara County is the largest luxury home market in the Bay Area, but since the pandemic, other counties have seen higher percentage rates in the year-over-year increase in sales – especially Sonoma and Santa Cruz (despite the fires), and Monterey.
|
 |
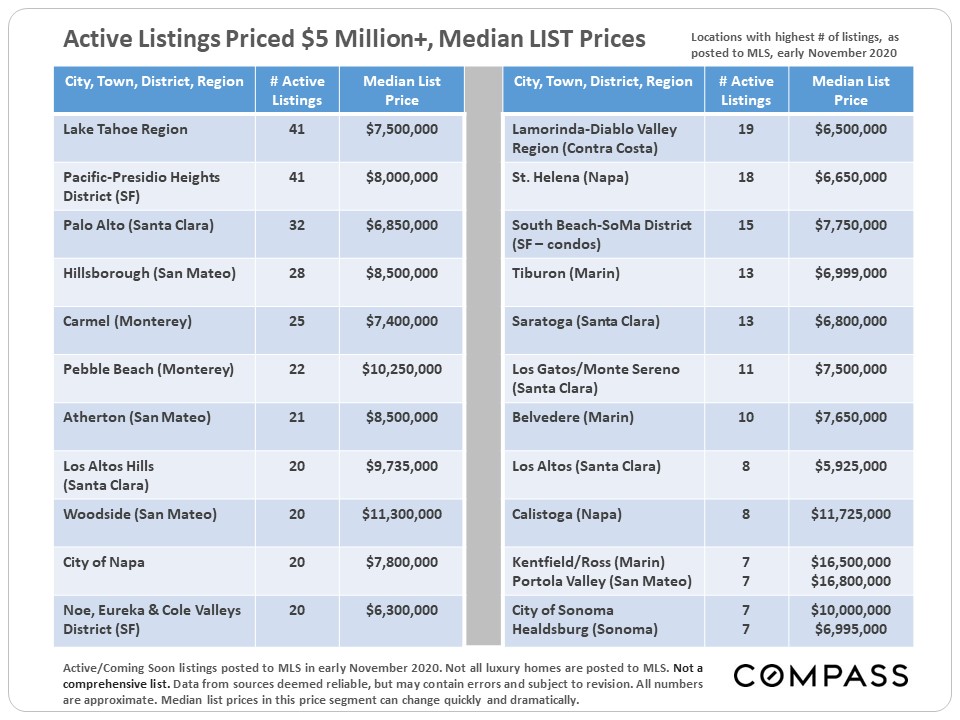
If you’re looking for a home priced $5 million and above, these are the places where you will have the greatest choice of listings. You have a high number of options within the county itself.
|
 |
Source: Compass
It is impossible to know how median and average value statistics apply to any particular home without a specific comparative market analysis. These analyses were made in good faith with data from sources deemed reliable, but may contain errors and are subject to revision. It is not our intent to convince you of a particular position, but to attempt to provide straightforward data and analysis, so you can make your own informed decisions. Median and average statistics are enormous generalities: There are hundreds of different markets in San Francisco and the Bay Area, each with its own unique dynamics. Median prices and average dollar per square foot values can be and often are affected by other factors besides changes in fair market value. Longer term trends are much more meaningful than short-term.
Compass is a real estate broker licensed by the State of California, DRE 01527235. Equal Housing Opportunity. This report has been prepared solely for information purposes. The information herein is based on or derived from information generally available to the public and/or from sources believed to be reliable. No representation or warranty can be given with respect to the accuracy or completeness of the information. Compass disclaims any and all liability relating to this report, including without limitation any express or implied representations or warranties for statements contained in, and omissions from, the report. Nothing contained herein is intended to be or should be read as any regulatory, legal, tax, accounting or other advice and Compass does not provide such advice. All opinions are subject to change without notice. Compass makes no representation regarding the accuracy of any statements regarding any references to the laws, statutes or regulations of any state are those of the author(s). Past performance is no guarantee of future results.
