San Mateo County Quarterly Statistics, July 2020

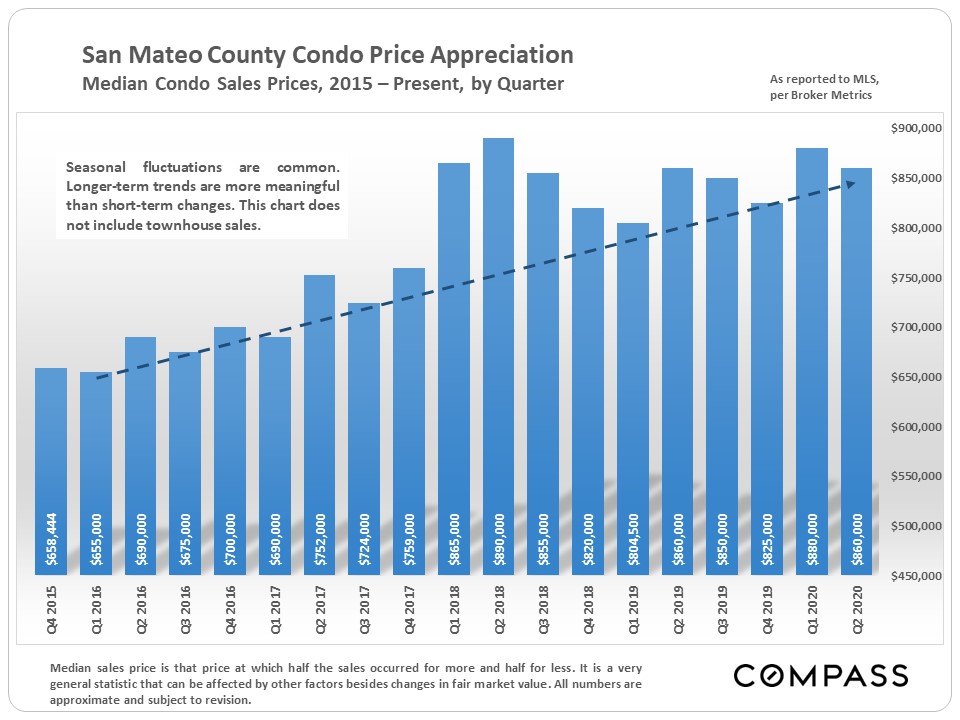
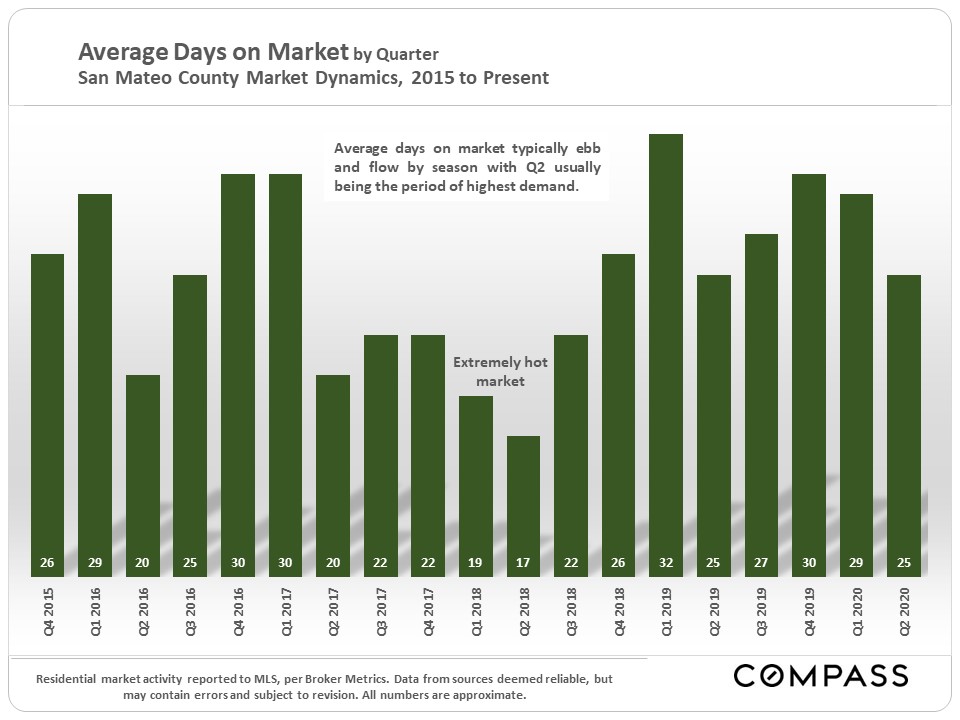
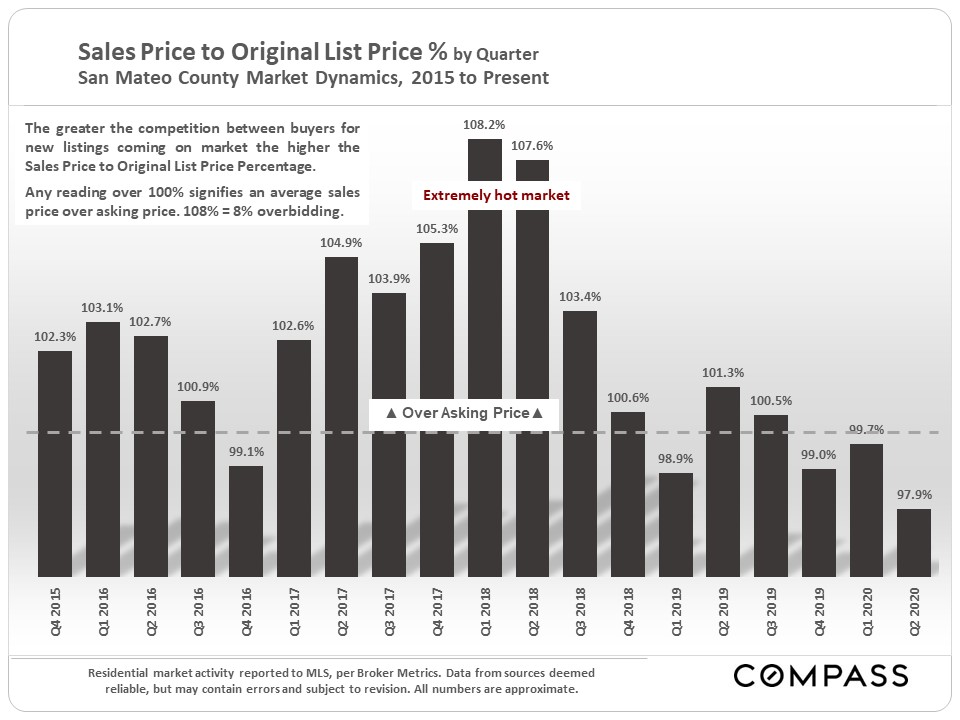
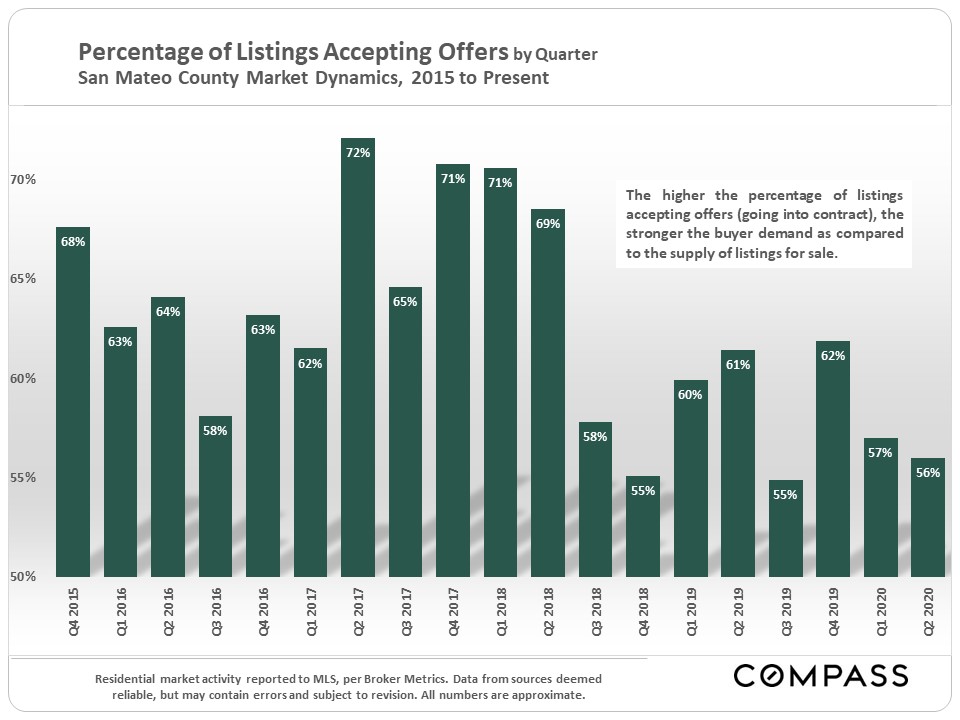
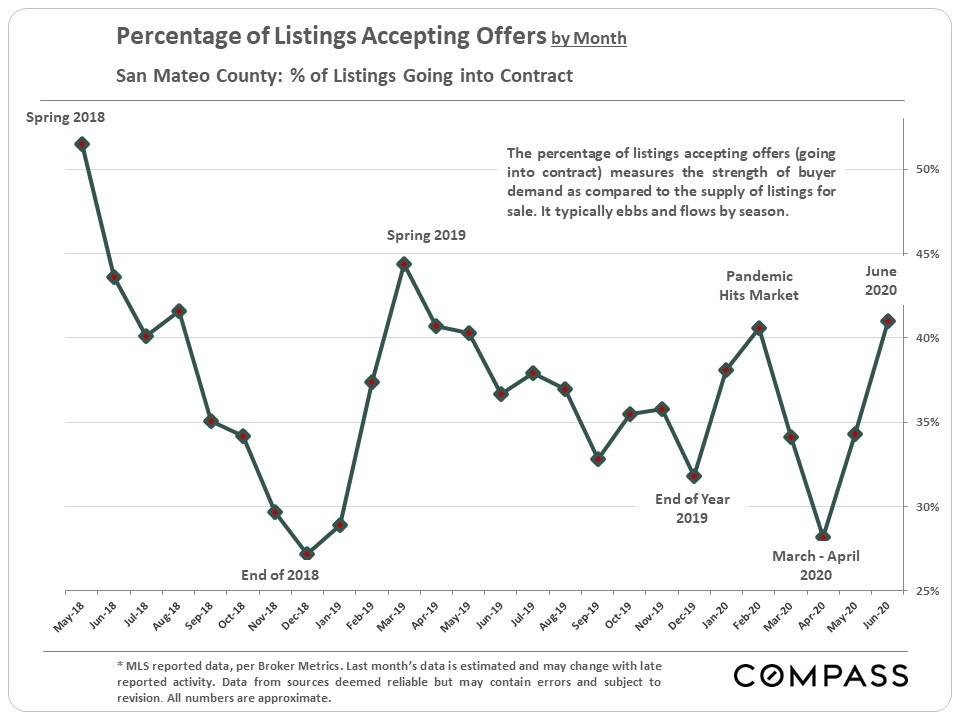
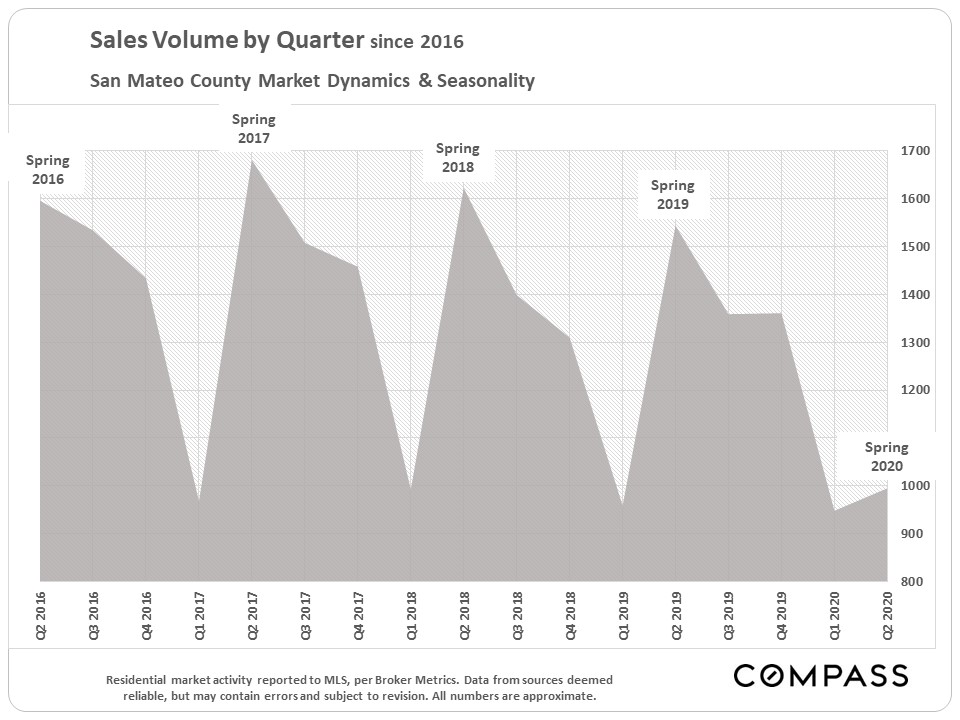
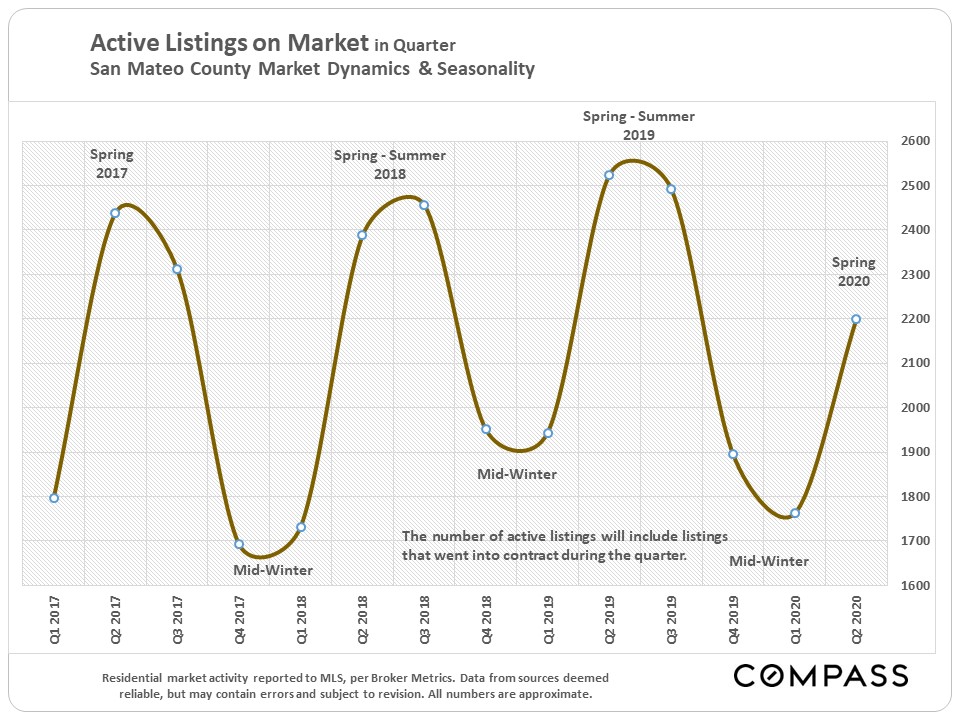
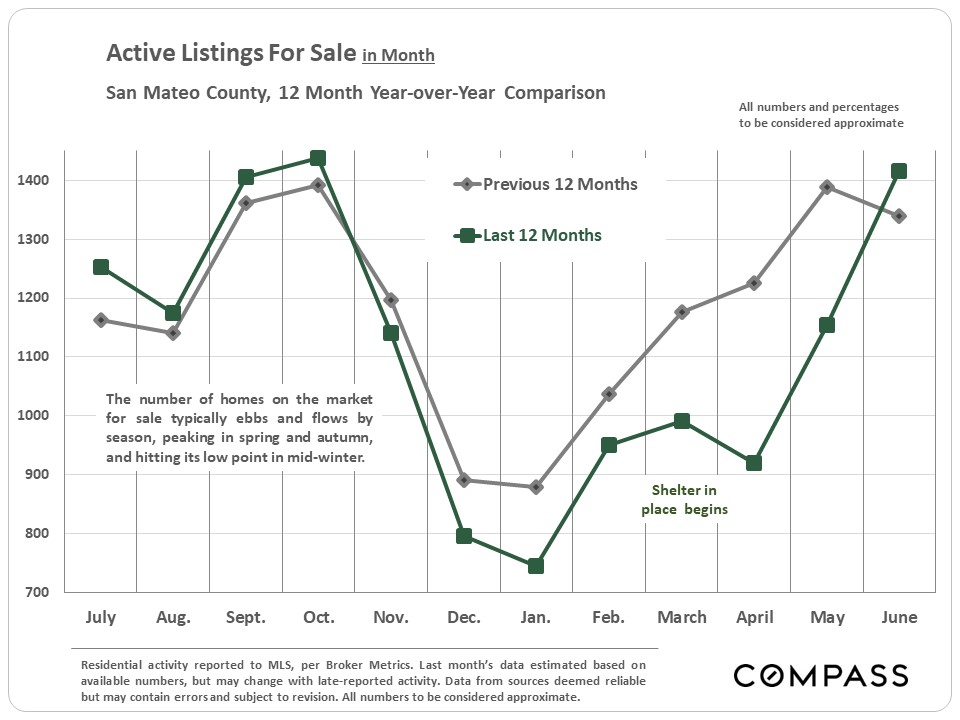
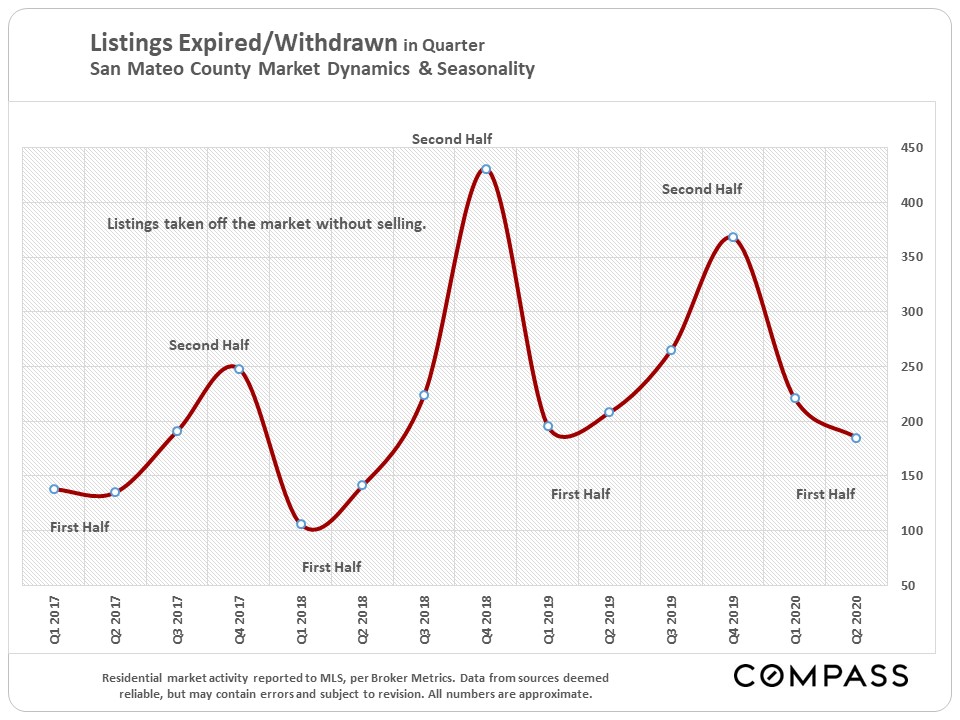
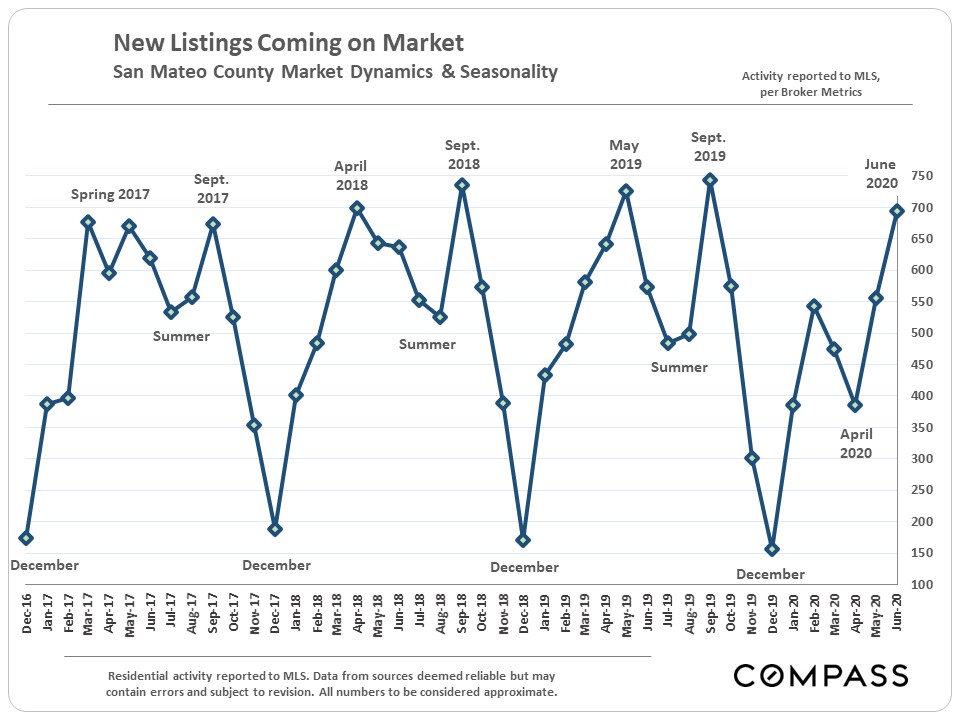
Market indicators are often seasonal in nature, with Q2 typically being the period of highest demand, and the mid-winter holiday period being the period of lowest activity. The pandemic gravely affected Q2 2020 market activity, but the quarterly statistics disguise the steep decline followed by the dramatic rebound that occurred over the course of the 3 months. A few monthly charts have been added to illustrate this dynamic.

**Data from sources deemed reliable, but may contain errors and subject to revision. All numbers to be considered approximate.
Source: Compass

It is impossible to know how median and average value statistics apply to any particular home without a specific comparative market analysis. These analyses were made in good faith with data from sources deemed reliable, but may contain errors and are subject to revision. It is not our intent to convince you of a particular position, but to attempt to provide straightforward data and analysis, so you can make your own informed decisions. Median and average statistics are enormous generalities: There are hundreds of different markets in San Francisco and the Bay Area, each with its own unique dynamics. Median prices and average dollar per square foot values can be and often are affected by other factors besides changes in fair market value. Longer term trends are much more meaningful than short-term.

Compass is a real estate broker licensed by the State of California, DRE 01527235. Equal Housing Opportunity. This report has been prepared solely for information purposes. The information herein is based on or derived from information generally available to the public and/or from sources believed to be reliable. No representation or warranty can be given with respect to the accuracy or completeness of the information. Compass disclaims any and all liability relating to this report, including without limitation any express or implied representations or warranties for statements contained in, and omissions from, the report. Nothing contained herein is intended to be or should be read as any regulatory, legal, tax, accounting or other advice and Compass does not provide such advice. All opinions are subject to change without notice. Compass makes no representation regarding the accuracy of any statements regarding any references to the laws, statutes or regulations of any state are those of the author(s). Past performance is no guarantee of future results.

Santa Clara County Quarterly Statistics, July 2020

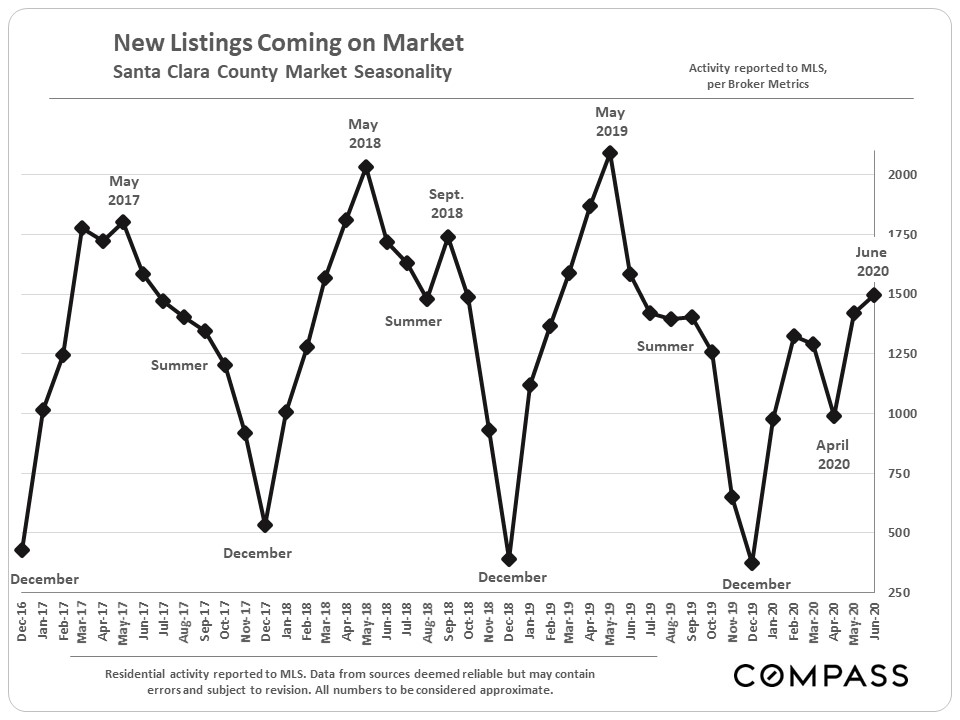
Market indicators are often seasonal in nature, with Q2 typically being the period of highest demand, and the mid-winter holid ay period being the period of lowest activity.

The pandemic and shelter-in-place deeply affected the overall Q2 2020 market, though quarterly statistics disguise the combination of steep decline in market activity followed by the large rebound that occurred over the course of April, May and June. A few monthly charts have been added to illustrate this dynamic.

*Data from sources deemed reliable, but may contain errors and subject to revision.All numbers to be considered approximate.
“Stanford Circle” July 2020

The most expensive regional real estate market in the Bay Area


Analyses of the communities of Palo Alto, Los Altos, Los Altos Hills, Atherton, Menlo Park, Woodside & Portola Valley

Source: Compass

It is impossible to know how median and average value statistics apply to any particular home without a specific comparative market analysis. These analyses were made in good faith with data from sources deemed reliable, but may contain errors and are subject to revision. It is not our intent to convince you of a particular position, but to attempt to provide straightforward data and analysis, so you can make your own informed decisions. Median and average statistics are enormous generalities: There are hundreds of different markets in San Francisco and the Bay Area, each with its own unique dynamics. Median prices and average dollar per square foot values can be and often are affected by other factors besides changes in fair market value. Longer term trends are much more meaningful than short-term.

Compass is a real estate broker licensed by the State of California, DRE 01527235. Equal Housing Opportunity. This report has been prepared solely for information purposes. The information herein is based on or derived from information generally available to the public and/or from sources believed to be reliable. No representation or warranty can be given with respect to the accuracy or completeness of the information. Compass disclaims any and all liability relating to this report, including without limitation any express or implied representations or warranties for statements contained in, and omissions from, the report. Nothing contained herein is intended to be or should be read as any regulatory, legal, tax, accounting or other advice and Compass does not provide such advice. All opinions are subject to change without notice. Compass makes no representation regarding the accuracy of any statements regarding any references to the laws, statutes or regulations of any state are those of the author(s). Past performance is no guarantee of future results.
San Francisco 2-4 Units July 2020

It had already been a challenging couple of years for San Francisco landlords, with political developments regarding sales, evictions and rent control coming into effect, seemingly one after another – but COVID-19 is a health and economic crisis of another magnitude. Mass unemployment hits the city’s rental market extremely hard: Tenants paying the highest rents in the country often move quickly if their jobs are lost. The crisis has left many existing tenants unable to pay their rent, and new rules have severely limited landlords’ legal options, though some of those are now being challenged in court. Market rent rates have been dropping and vacancy rates increasing, in a manner reminiscent of the period after the dotcom collapse, another time of sudden, high unemployment.

With all this occurring, it is not surprising that sales activity for multi-family income properties has plunged in the last quarter, and to a large degree, we have little choice but to wait for the situation to settle and clarify. Shelter in place rules make it virtually impossible to show occupied units. With reduced sales volume, it becomes more difficult to reliably assess market values, but so far, there has been no precipitous drop. Even with rent declines, occupied apartments generate high income streams, and interest rates have hit all-time lows. And, of course, vacant units in smaller buildings often appeal to owner-occupier buyers. Though COVID-19 has temporarily affected many of the things that residents love so much about the city, San Francisco remains a financial, technology and cultural capital.

Long-term investors who have avoided over-leveraging their properties have ridden out several economic crises over the last 30 years and will do so again. There will almost certainly be opportunities for savvy buyers.


Supply & Demand Indicators
by Month or Quarter

Sales Breakdowns – 12 Months of Sales

2-Unit Building Values

(Not enough 3-4 unit building sales in

Q2 for reliable analysis)

Market Rate Rent Trends

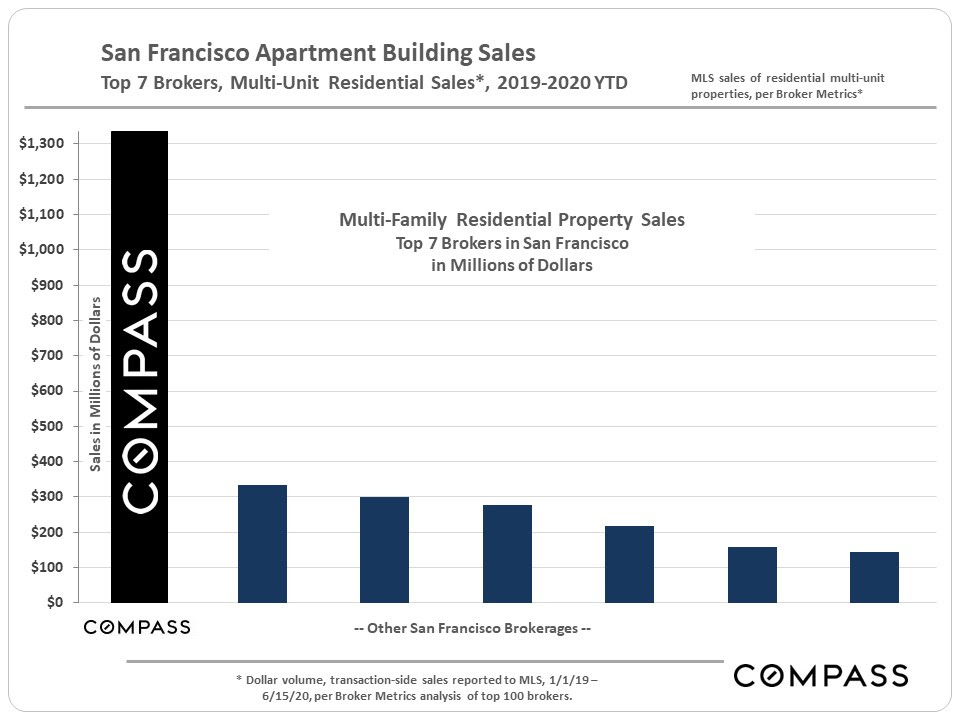
Market Share by Broker

Sales Breakdowns – 12 Months of Sales

2-Unit Building Values

(Not enough 3-4 unit building sales in

Q2 for reliable analysis)

Market Rate Rent Trends

Market Share by Broker

Source: Compass

It is impossible to know how median and average value statistics apply to any particular home without a specific comparative market analysis. These analyses were made in good faith with data from sources deemed reliable, but may contain errors and are subject to revision. It is not our intent to convince you of a particular position, but to attempt to provide straightforward data and analysis, so you can make your own informed decisions. Median and average statistics are enormous generalities: There are hundreds of different markets in San Francisco and the Bay Area, each with its own unique dynamics. Median prices and average dollar per square foot values can be and often are affected by other factors besides changes in fair market value. Longer term trends are much more meaningful than short-term.

Compass is a real estate broker licensed by the State of California, DRE 01527235. Equal Housing Opportunity. This report has been prepared solely for information purposes. The information herein is based on or derived from information generally available to the public and/or from sources believed to be reliable. No representation or warranty can be given with respect to the accuracy or completeness of the information. Compass disclaims any and all liability relating to this report, including without limitation any express or implied representations or warranties for statements contained in, and omissions from, the report. Nothing contained herein is intended to be or should be read as any regulatory, legal, tax, accounting or other advice and Compass does not provide such advice. All opinions are subject to change without notice. Compass makes no representation regarding the accuracy of any statements regarding any references to the laws, statutes or regulations of any state are those of the author(s). Past performance is no guarantee of future results.

San Francisco Residential July 2020

San Francisco Real Estate Market  Rebounds Dramatically

Median house sales price hits new monthly high

July 2020 report

Despite the ongoing health and economic crisis precipitated by COVID-19, the SF real estate market made a large recovery from the steep declines in March and April. The SF median house price hit a new monthly high in June ($1,800,000), and high-end houses, in particular, have seen very strong demand – this applies to virtually every market in the Bay Area. More affluent buyers – the demographic least affected by COVID-19, unemployment, and also having the greatest financial resources – have been jumping back into the market to a greater degree than other segments.

The condo market has been weaker than the house market, as measured by both supply and demand metrics and median sales price. It may be that prospective condo buyers – often younger and less affluent than house owners – have been more affected by the huge jump in unemployment.

The first chart below illustrates the big rebound in buyer demand, as the number of listings accepting offers in June 2020 rose slightly higher on a year-over-year basis. Of course, closed-sales volume – a lagging indicator – was hammered in Q2 by shelter in place.

High-end sales staged a particularly strong recovery,  reaching a new high as a percentage of total sales. This is one of the factors behind the median house sales price hitting a new peak in June.

As illustrated below, the house market (blue line) has performed much better than the condo market (purple line).

Three angles on median home sales price movements – annual, monthly and quarterly. While the median house price has hit a new peak, the median condo price has declined from its 2019 high.

Average days on market remained relatively low in Q2, though higher than Q2 in 2018 and 2019.

The average overbidding percentage declined to zero in Q2 as showing procedures and the offer-making process have been severely affected by shelter in place.

The Bay Area markets with the largest year-over-year increases in the number of listings accepting offers in June 2020 were the 4 outer Bay Area counties of Monterey (up 61%), Santa Cruz (58%), Sonoma (47%) and Napa (37%). They also have among the lowest population densities in the Bay Area. The more urban counties saw more modest y-o-y increases: San Francisco (6%) and Alameda (7%). Other factors may play a role in this: length/strictness of shelter-in-place rules, home price differences, second-home buying patterns, and so on.


A review of annual and 2020 YTD median home sales prices in some of the largest districts in San Francisco. Changes in median sales price are not perfect indicators of changes in fair market value, as it can be affected by a number of other factors.

Source: Compass

It is impossible to know how median and average value statistics apply to any particular home without a specific comparative market analysis. These analyses were made in good faith with data from sources deemed reliable, but may contain errors and are subject to revision. It is not our intent to convince you of a particular position, but to attempt to provide straightforward data and analysis, so you can make your own informed decisions. Median and average statistics are enormous generalities: There are hundreds of different markets in San Francisco and the Bay Area, each with its own unique dynamics. Median prices and average dollar per square foot values can be and often are affected by other factors besides changes in fair market value. Longer term trends are much more meaningful than short-term.

Compass is a real estate broker licensed by the State of California, DRE 01527235. Equal Housing Opportunity. This report has been prepared solely for information purposes. The information herein is based on or derived from information generally available to the public and/or from sources believed to be reliable. No representation or warranty can be given with respect to the accuracy or completeness of the information. Compass disclaims any and all liability relating to this report, including without limitation any express or implied representations or warranties for statements contained in, and omissions from, the report. Nothing contained herein is intended to be or should be read as any regulatory, legal, tax, accounting or other advice and Compass does not provide such advice. All opinions are subject to change without notice. Compass makes no representation regarding the accuracy of any statements regarding any references to the laws, statutes or regulations of any state are those of the author(s). Past performance is no guarantee of future results.

San Mateo County Real Estate, July 2020

Dramatic Rebound for San Mateo County Real Estate Market
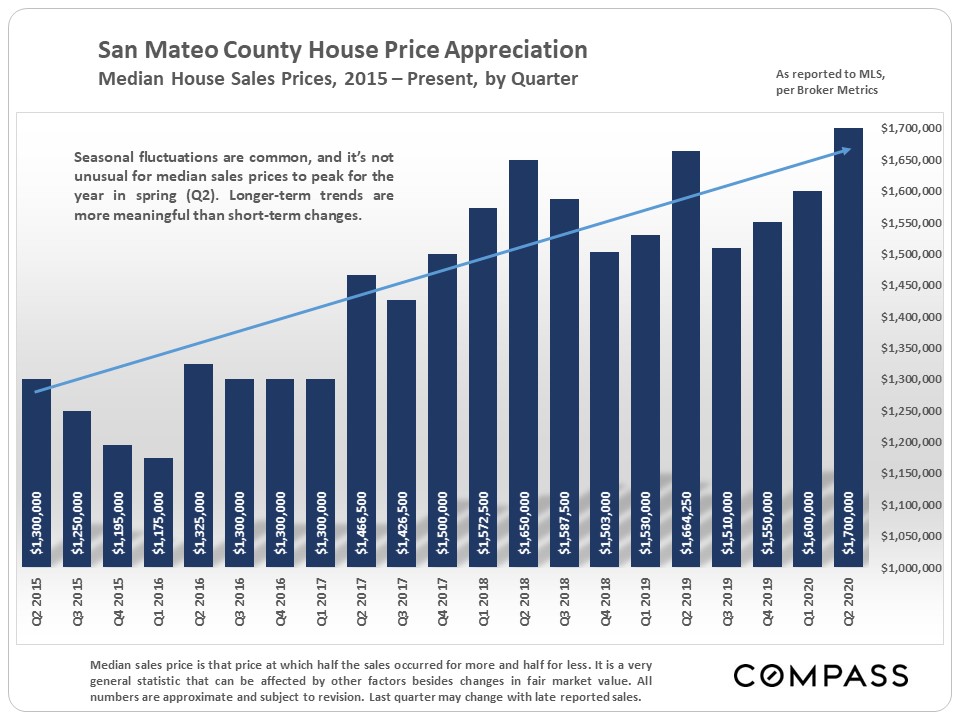
Median house price hits new quarterly high. 
July 2020 Report 
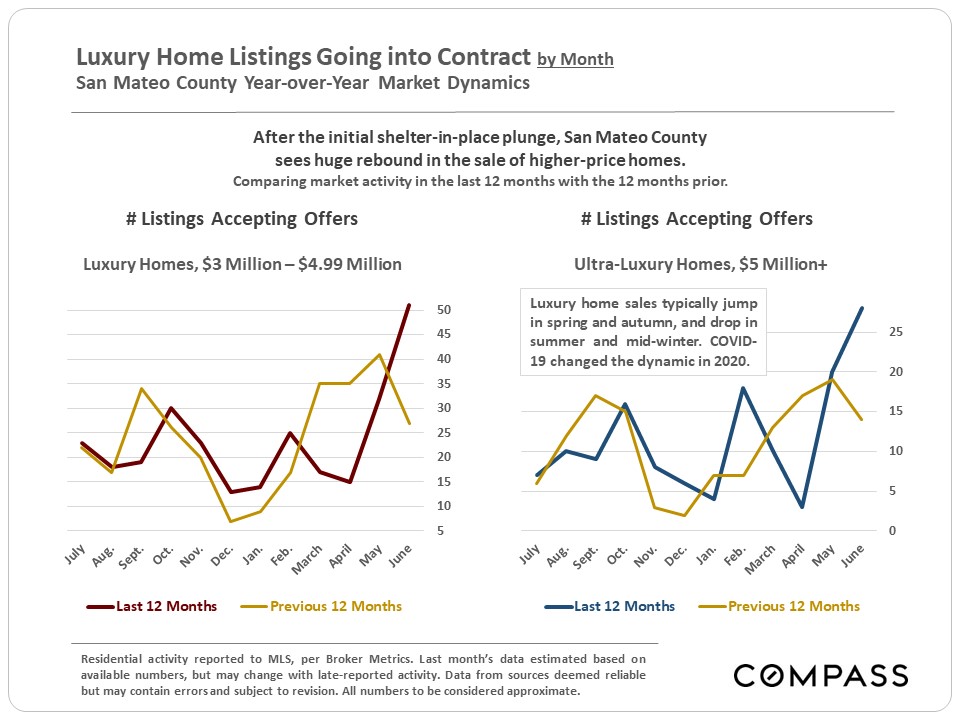
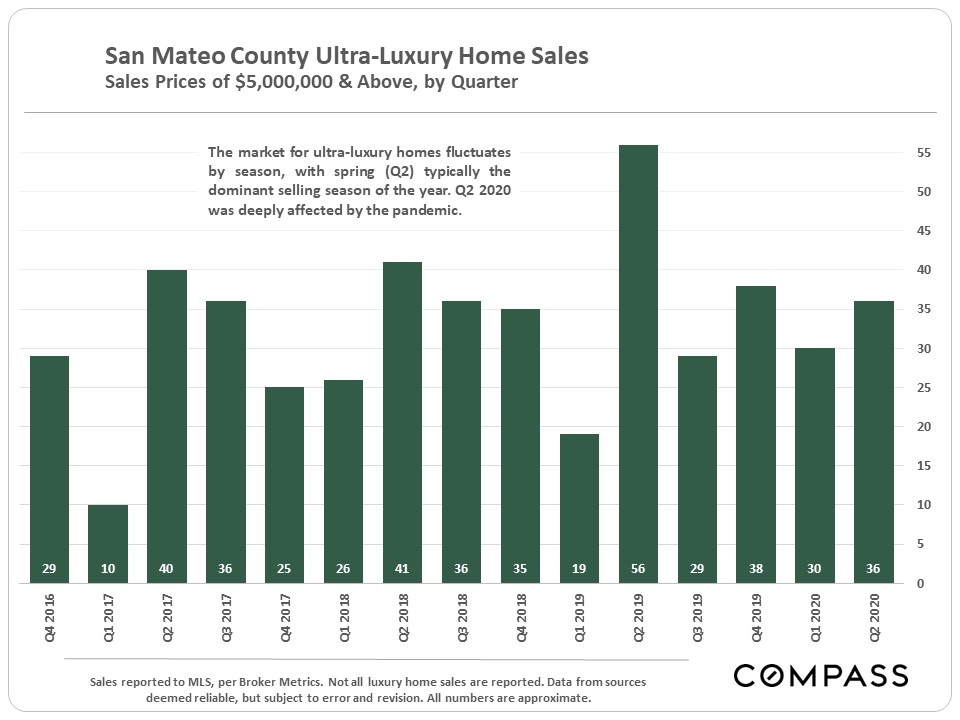
Despite the ongoing health and economic crisis precipitated by COVID-19, the real estate market made a dramatic recovery from the steep declines in March and April. The median house sales price hit a new high in Q2, and high-end homes, in particular, have seen extremely strong demand – in fact, this applies to virtually every market in the Bay Area. More affluent buyers – the demographic least affected by COVID-19, unemployment, and also having the greatest financial resources – have been jumping back into the market to a greater degree than other segments. 
The first chart below illustrates the big rebound in buyer demand, as the number of listings accepting offers in June 2020 rose higher on a year-over-year basis. Of course, closed-sales volume – a lagging indicator – was hammered in Q2 by shelter in place. 
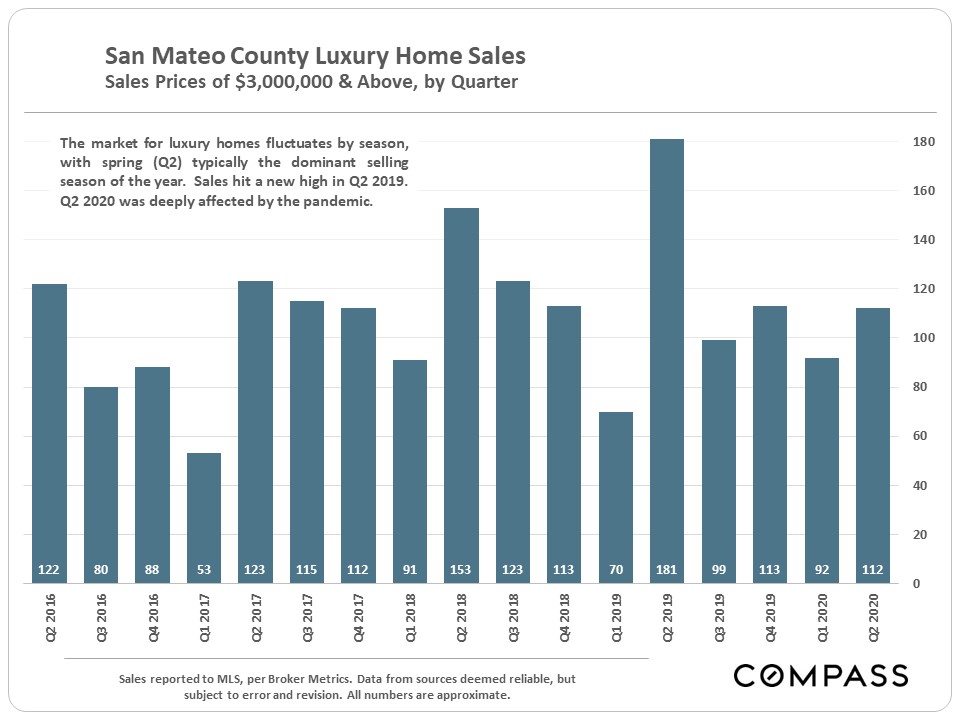
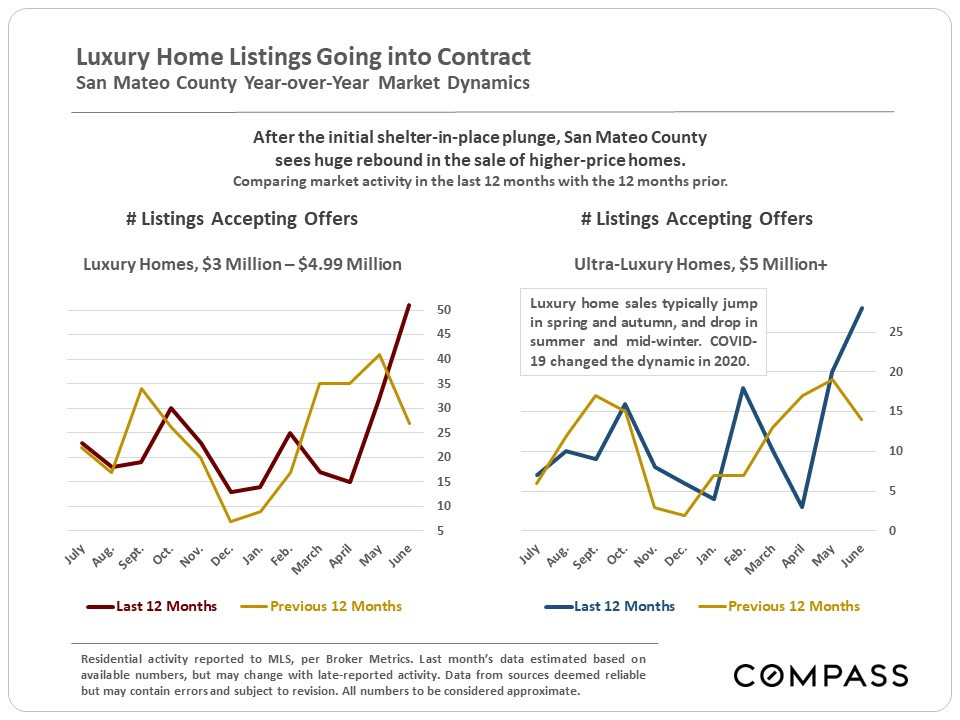
Demand for luxury homes has been very high, as reflected in the next 2 charts.
This has certainly been one factor in the rise in the median house sales price in Q2. 
The number of active listings on the market has also bounced back,
and is now slightly above the level seen last year. 
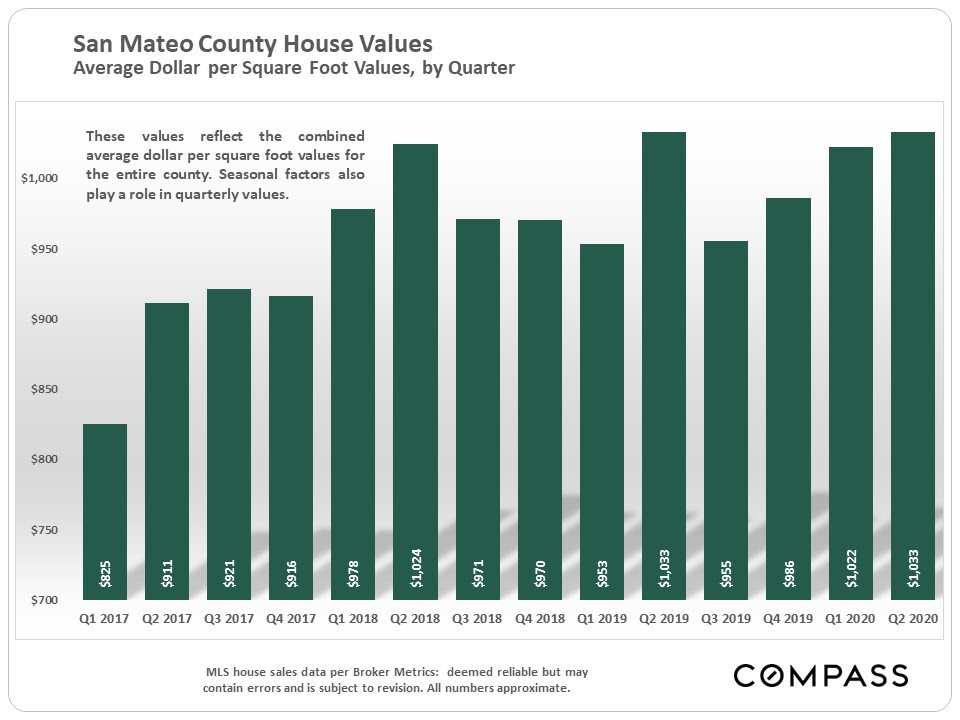
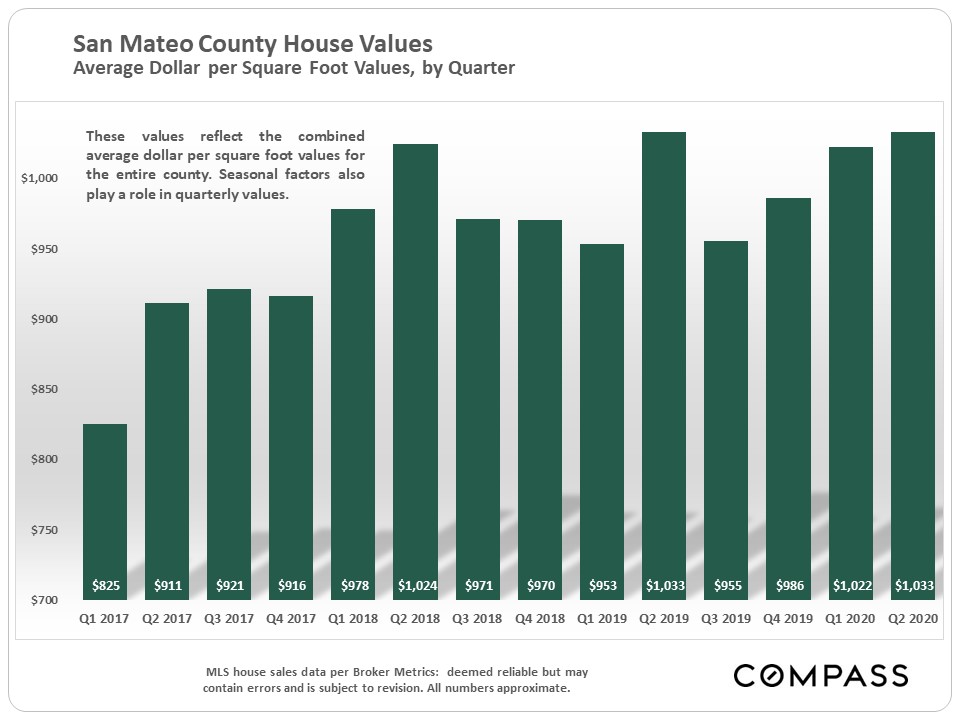
Three angles on San Mateo County house values: quarterly median sales price and average dollar per square foot values,
and a longer-term perspective. 
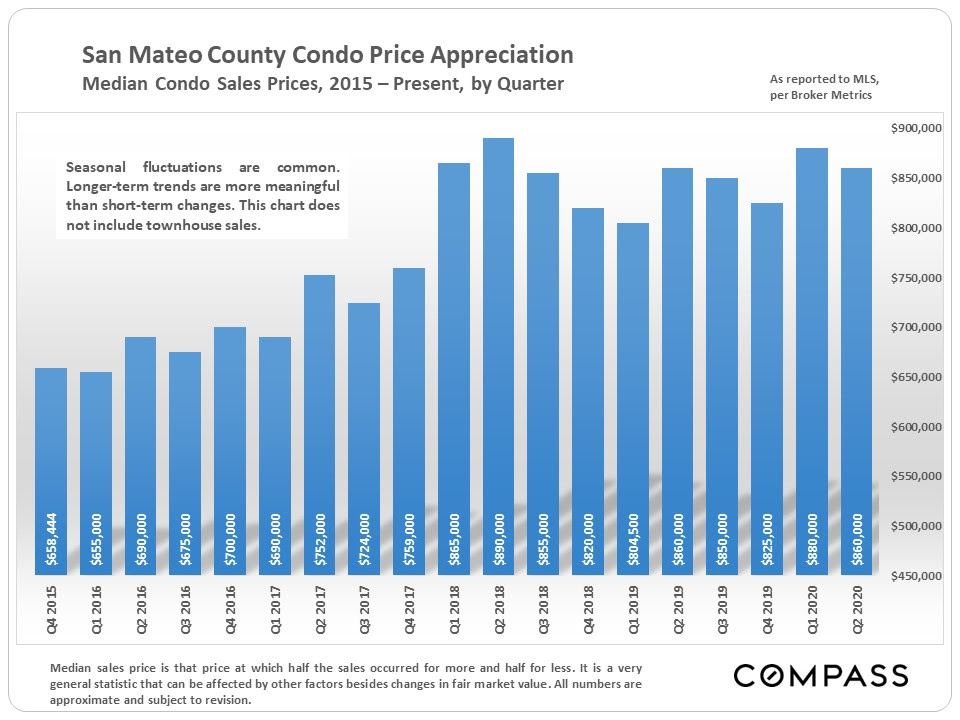
Around the Bay Area, condo markets have not performed quite as well as house markets,
in either market demand or median sales price trends.
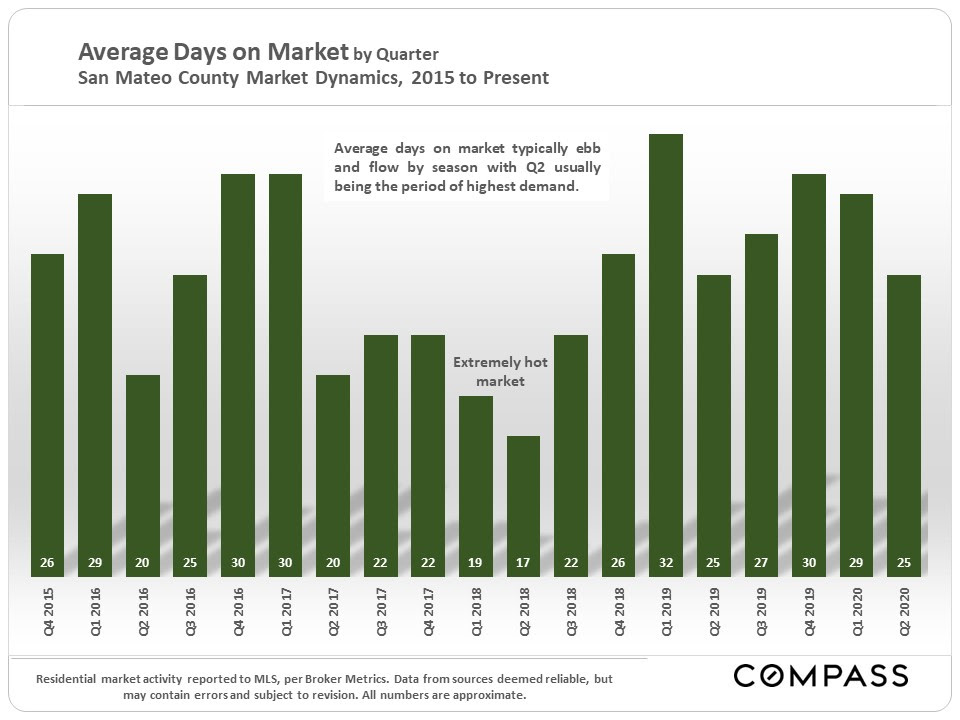
Average days on market were the same on a year-over-year basis (and relatively low).
Overbidding asking price has become less common. Part of this is due to changes in home showing rules,
which make multiple offers less likely. 
Below is a breakdown of home sales by city and bedroom count.  
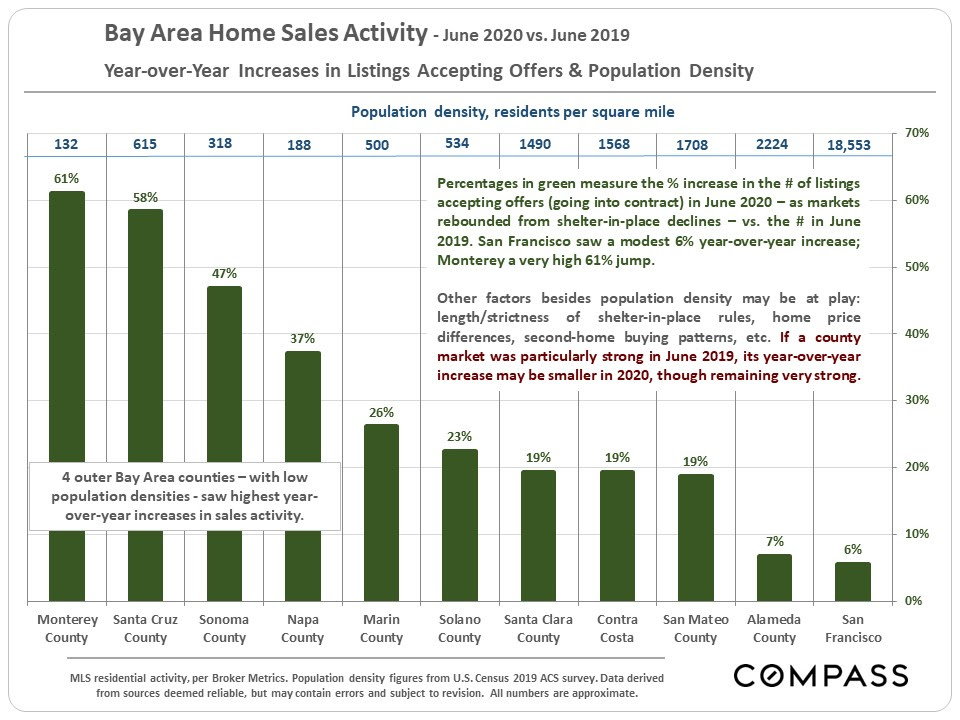
The Bay Area markets with the largest year-over-year increases in the number of listings accepting offers in June 2020 were the 4 outer Bay Area counties of Monterey (up 61%), Santa Cruz (58%), Sonoma (47%) and Napa (37%). They also have among the lowest population densities in the Bay Area. The more urban counties saw more modest y-o-y increases: San Francisco (6%) and Alameda (7%). San Mateo County was between those 2 poles. 

Source: Compass

It is impossible to know how median and average value statistics apply to any particular home without a specific comparative market analysis. These analyses were made in good faith with data from sources deemed reliable, but may contain errors and are subject to revision. It is not our intent to convince you of a particular position, but to attempt to provide straightforward data and analysis, so you can make your own informed decisions. Median and average statistics are enormous generalities: There are hundreds of different markets in San Francisco and the Bay Area, each with its own unique dynamics. Median prices and average dollar per square foot values can be and often are affected by other factors besides changes in fair market value. Longer term trends are much more meaningful than short-term.

Compass is a real estate broker licensed by the State of California, DRE 01527235. Equal Housing Opportunity. This report has been prepared solely for information purposes. The information herein is based on or derived from information generally available to the public and/or from sources believed to be reliable. No representation or warranty can be given with respect to the accuracy or completeness of the information. Compass disclaims any and all liability relating to this report, including without limitation any express or implied representations or warranties for statements contained in, and omissions from, the report. Nothing contained herein is intended to be or should be read as any regulatory, legal, tax, accounting or other advice and Compass does not provide such advice. All opinions are subject to change without notice. Compass makes no representation regarding the accuracy of any statements regarding any references to the laws, statutes or regulations of any state are those of the author(s). Past performance is no guarantee of future results.

Santa Clara County Real Estate, July 2020

Santa Clara County Real Estate Market Rebounds from COVID-19 Plunge
 
July 2020 Report
Despite the ongoing health and economic crisis precipitated by COVID-19, the real estate market made a dramatic recovery from the steep declines in March and April. The median house sales price in Q2 was only a tad below its 2018 peak, and high-end homes, in particular, have seen extremely strong demand – this applies to virtually every market in the Bay Area. More affluent buyers – the demographic least affected by COVID-19, unemployment, and also having the greatest financial resources – have been jumping back into the market to a greater degree than other segments. 
 
The first chart below illustrates the big rebound in buyer demand, as the number of listings accepting offers in June 2020 rose higher on a year-over-year basis. 
Demand for luxury homes has soared in the last 2 months. 
Inventory started out low in the beginning of 2020,
and remains well below the levels of last year. 
Three angles on house value trends: median sales price and average dollar per square foot by quarter, and then a longer-term perspective. 
The condo market has been softer than the house market, as measured by both sales activity and median sales price. This is a common dynamic around the Bay Area. 
Average days on market were quite low in Q2. 
The overbidding of asking prices has declined very dramatically from 2018, when Santa Clara County was probably the hottest market in the country. 
Median home prices by city or San Jose neighborhood, by bedroom count. 
The Bay Area markets with the largest year-over-year increases in the number of listings accepting offers in June 2020 were the 4 outer Bay Area counties of Monterey (up 61%), Santa Cruz (58%), Sonoma (47%) and Napa (37%). They also have among the lowest population densities in the Bay Area. The most urban counties saw modest y-o-y increases: San Francisco (6%) and Alameda (7%). Santa Clara County at 19% was between the two poles. 
Interest rates, once again, hit a new historic low. 

Source: Compass

It is impossible to know how median and average value statistics apply to any particular home without a specific comparative market analysis. These analyses were made in good faith with data from sources deemed reliable, but may contain errors and are subject to revision. It is not our intent to convince you of a particular position, but to attempt to provide straightforward data and analysis, so you can make your own informed decisions. Median and average statistics are enormous generalities: There are hundreds of different markets in San Francisco and the Bay Area, each with its own unique dynamics. Median prices and average dollar per square foot values can be and often are affected by other factors besides changes in fair market value. Longer term trends are much more meaningful than short-term.

Compass is a real estate broker licensed by the State of California, DRE 01527235. Equal Housing Opportunity. This report has been prepared solely for information purposes. The information herein is based on or derived from information generally available to the public and/or from sources believed to be reliable. No representation or warranty can be given with respect to the accuracy or completeness of the information. Compass disclaims any and all liability relating to this report, including without limitation any express or implied representations or warranties for statements contained in, and omissions from, the report. Nothing contained herein is intended to be or should be read as any regulatory, legal, tax, accounting or other advice and Compass does not provide such advice. All opinions are subject to change without notice. Compass makes no representation regarding the accuracy of any statements regarding any references to the laws, statutes or regulations of any state are those of the author(s). Past performance is no guarantee of future results.

Skip to content