
Statistics and the Definition of Buyers’ & Sellers’ Markets
So-called “buyers’ markets” and “sellers’ markets” have typically been defined by certain statistical thresholds: Depending on readings for months-supply-of-inventory, absorption rate, days-on-market or other metrics, the market is pronounced to be relatively “balanced” between buyers and sellers, or to favor one party or the other, typically in terms of negotiating power and home-price appreciation.
But it is actually buyer and seller psychology that determines the balance between the parties, and the perception of what constitutes a heated (sellers’) or weak (buyers’) market can change considerably depending on what people get used to. If it becomes the norm that listings sell within 1-7 days, with wild overbidding by a surplus of buyers, then getting 1 offer at or below list price, or no offers, after 15-20 days seems like a huge shift – causing anxiety on the selling side, and concern on the buying side (why hasn’t this home sold yet?) – even if, historically speaking, 15-20 days is a relatively short time on market. If it becomes typical that buyers’ choice of listings is rarely more than 1 or 2 homes, usually snapped up before day’s end, it’s an almost shocking change to see 4 or 5 active listings, most still available a week later, even if that would have been considered normal or low inventory a few years earlier.
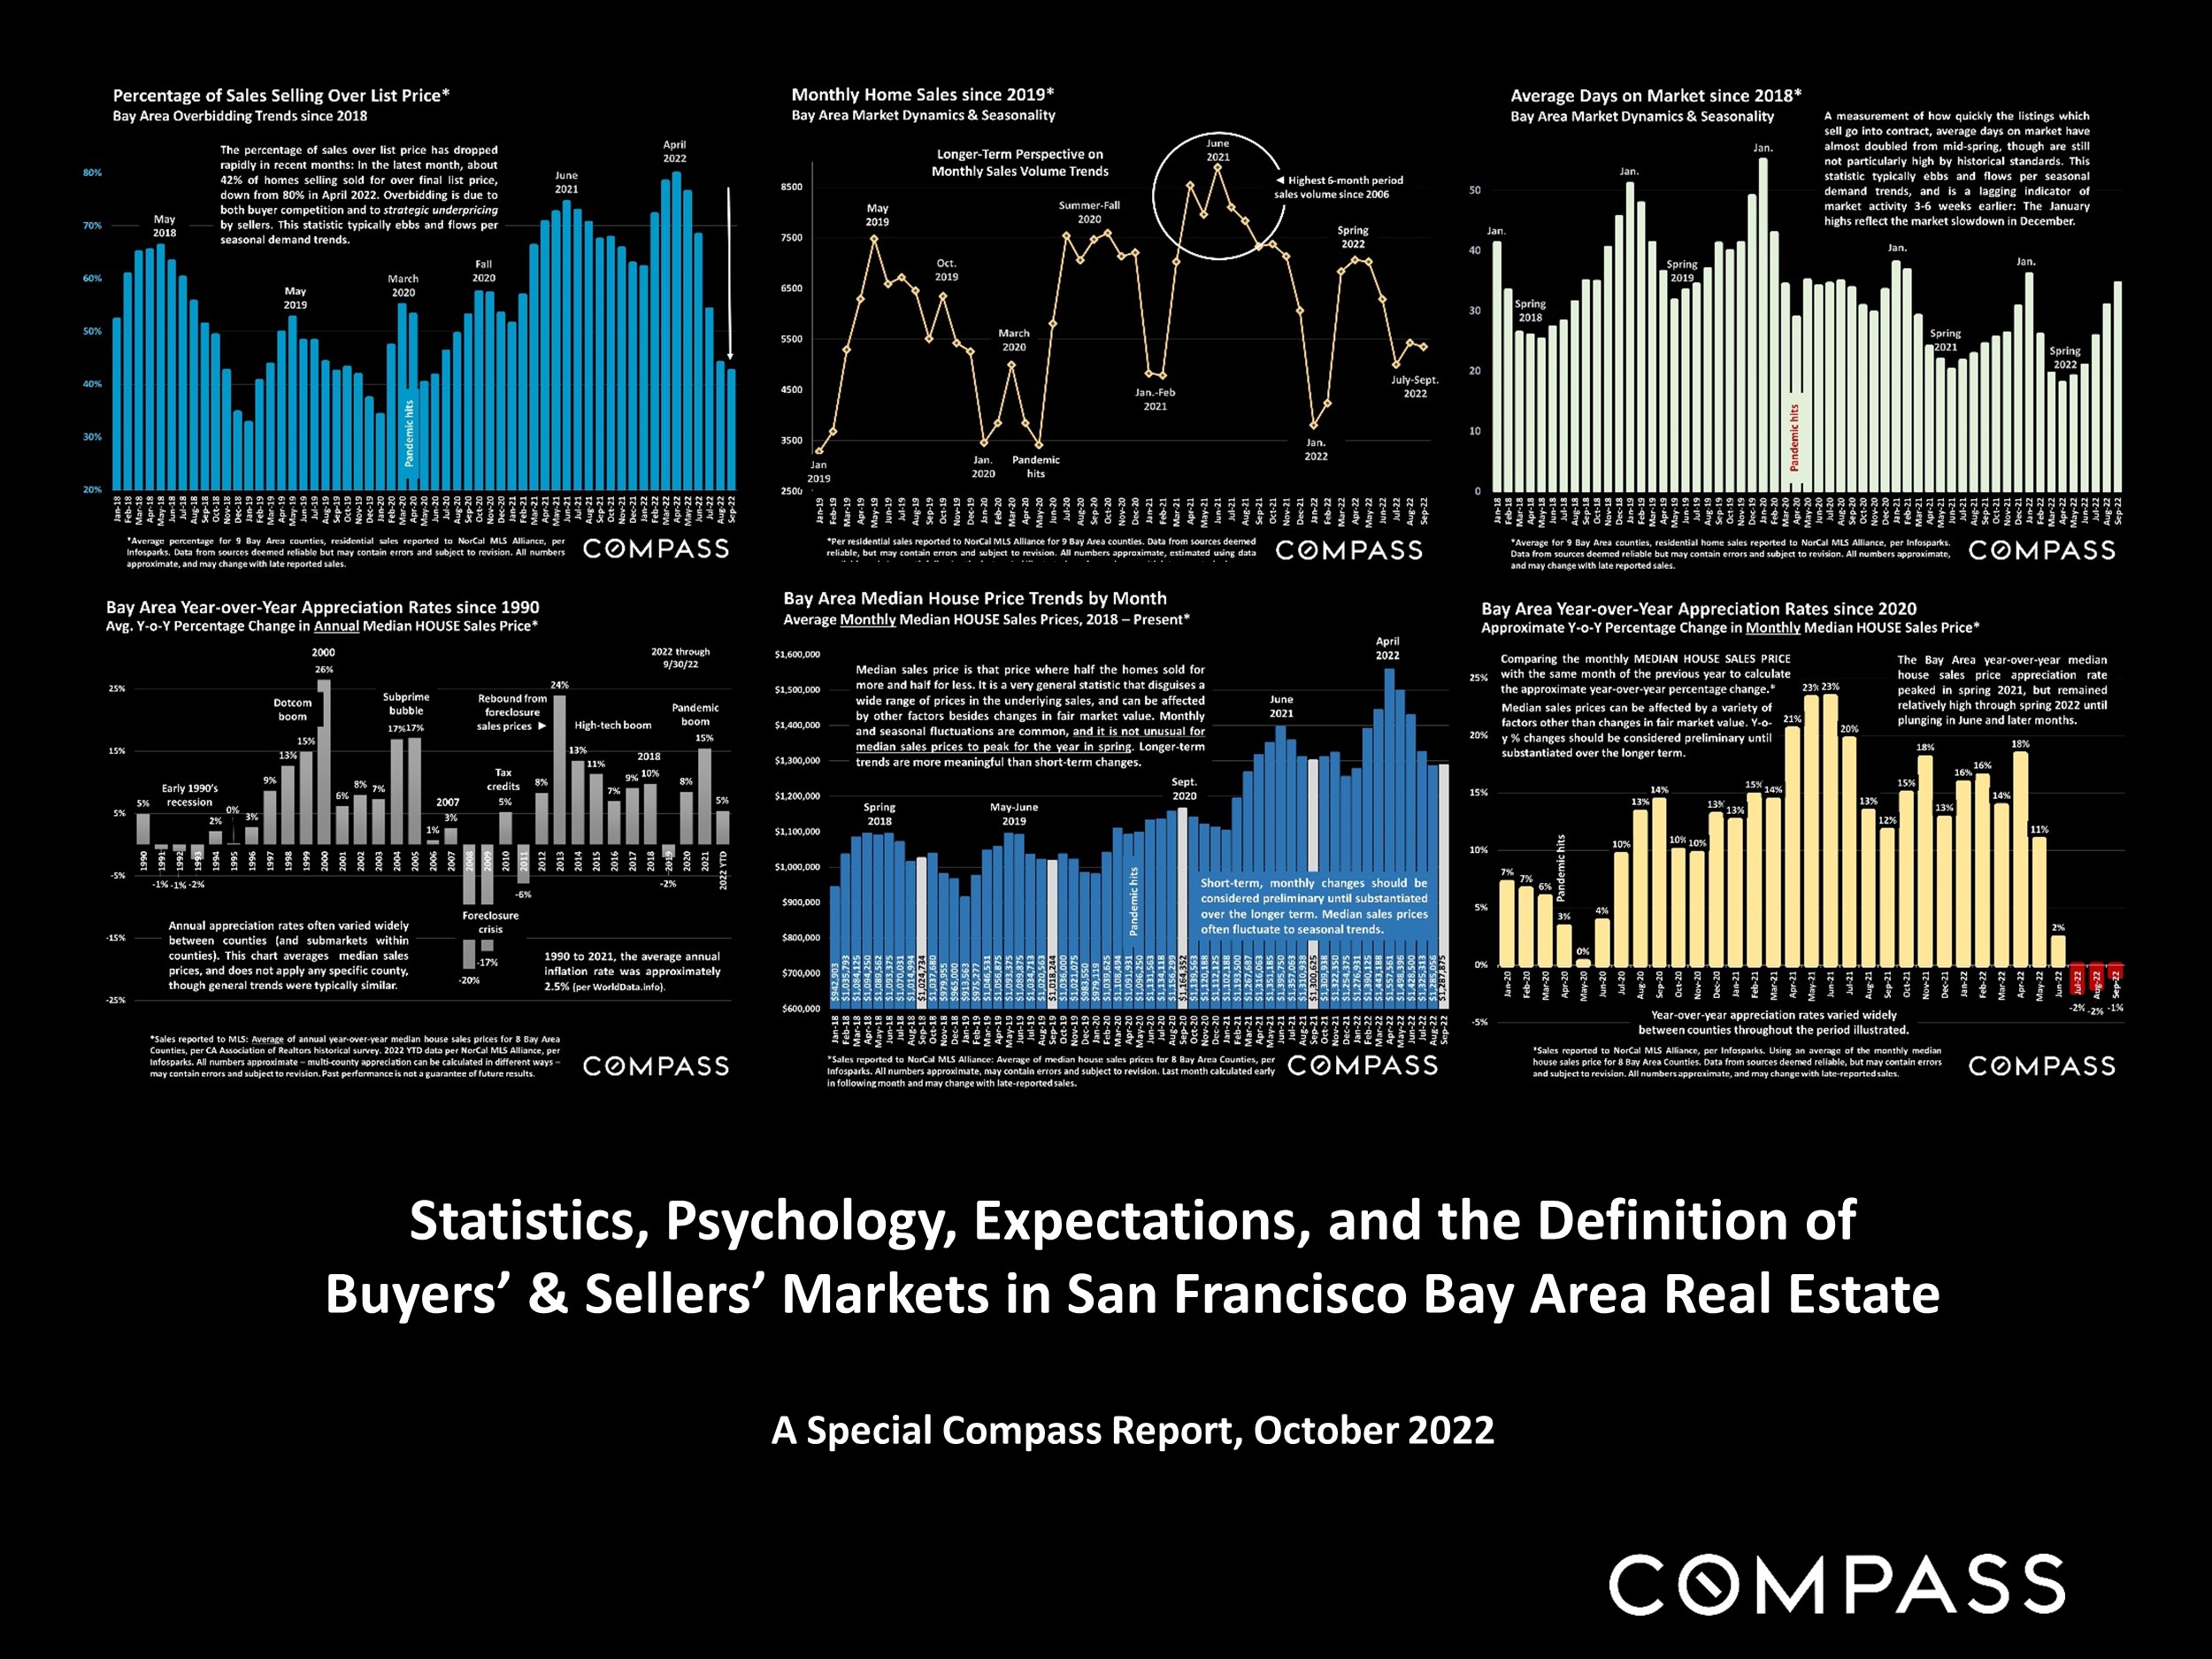
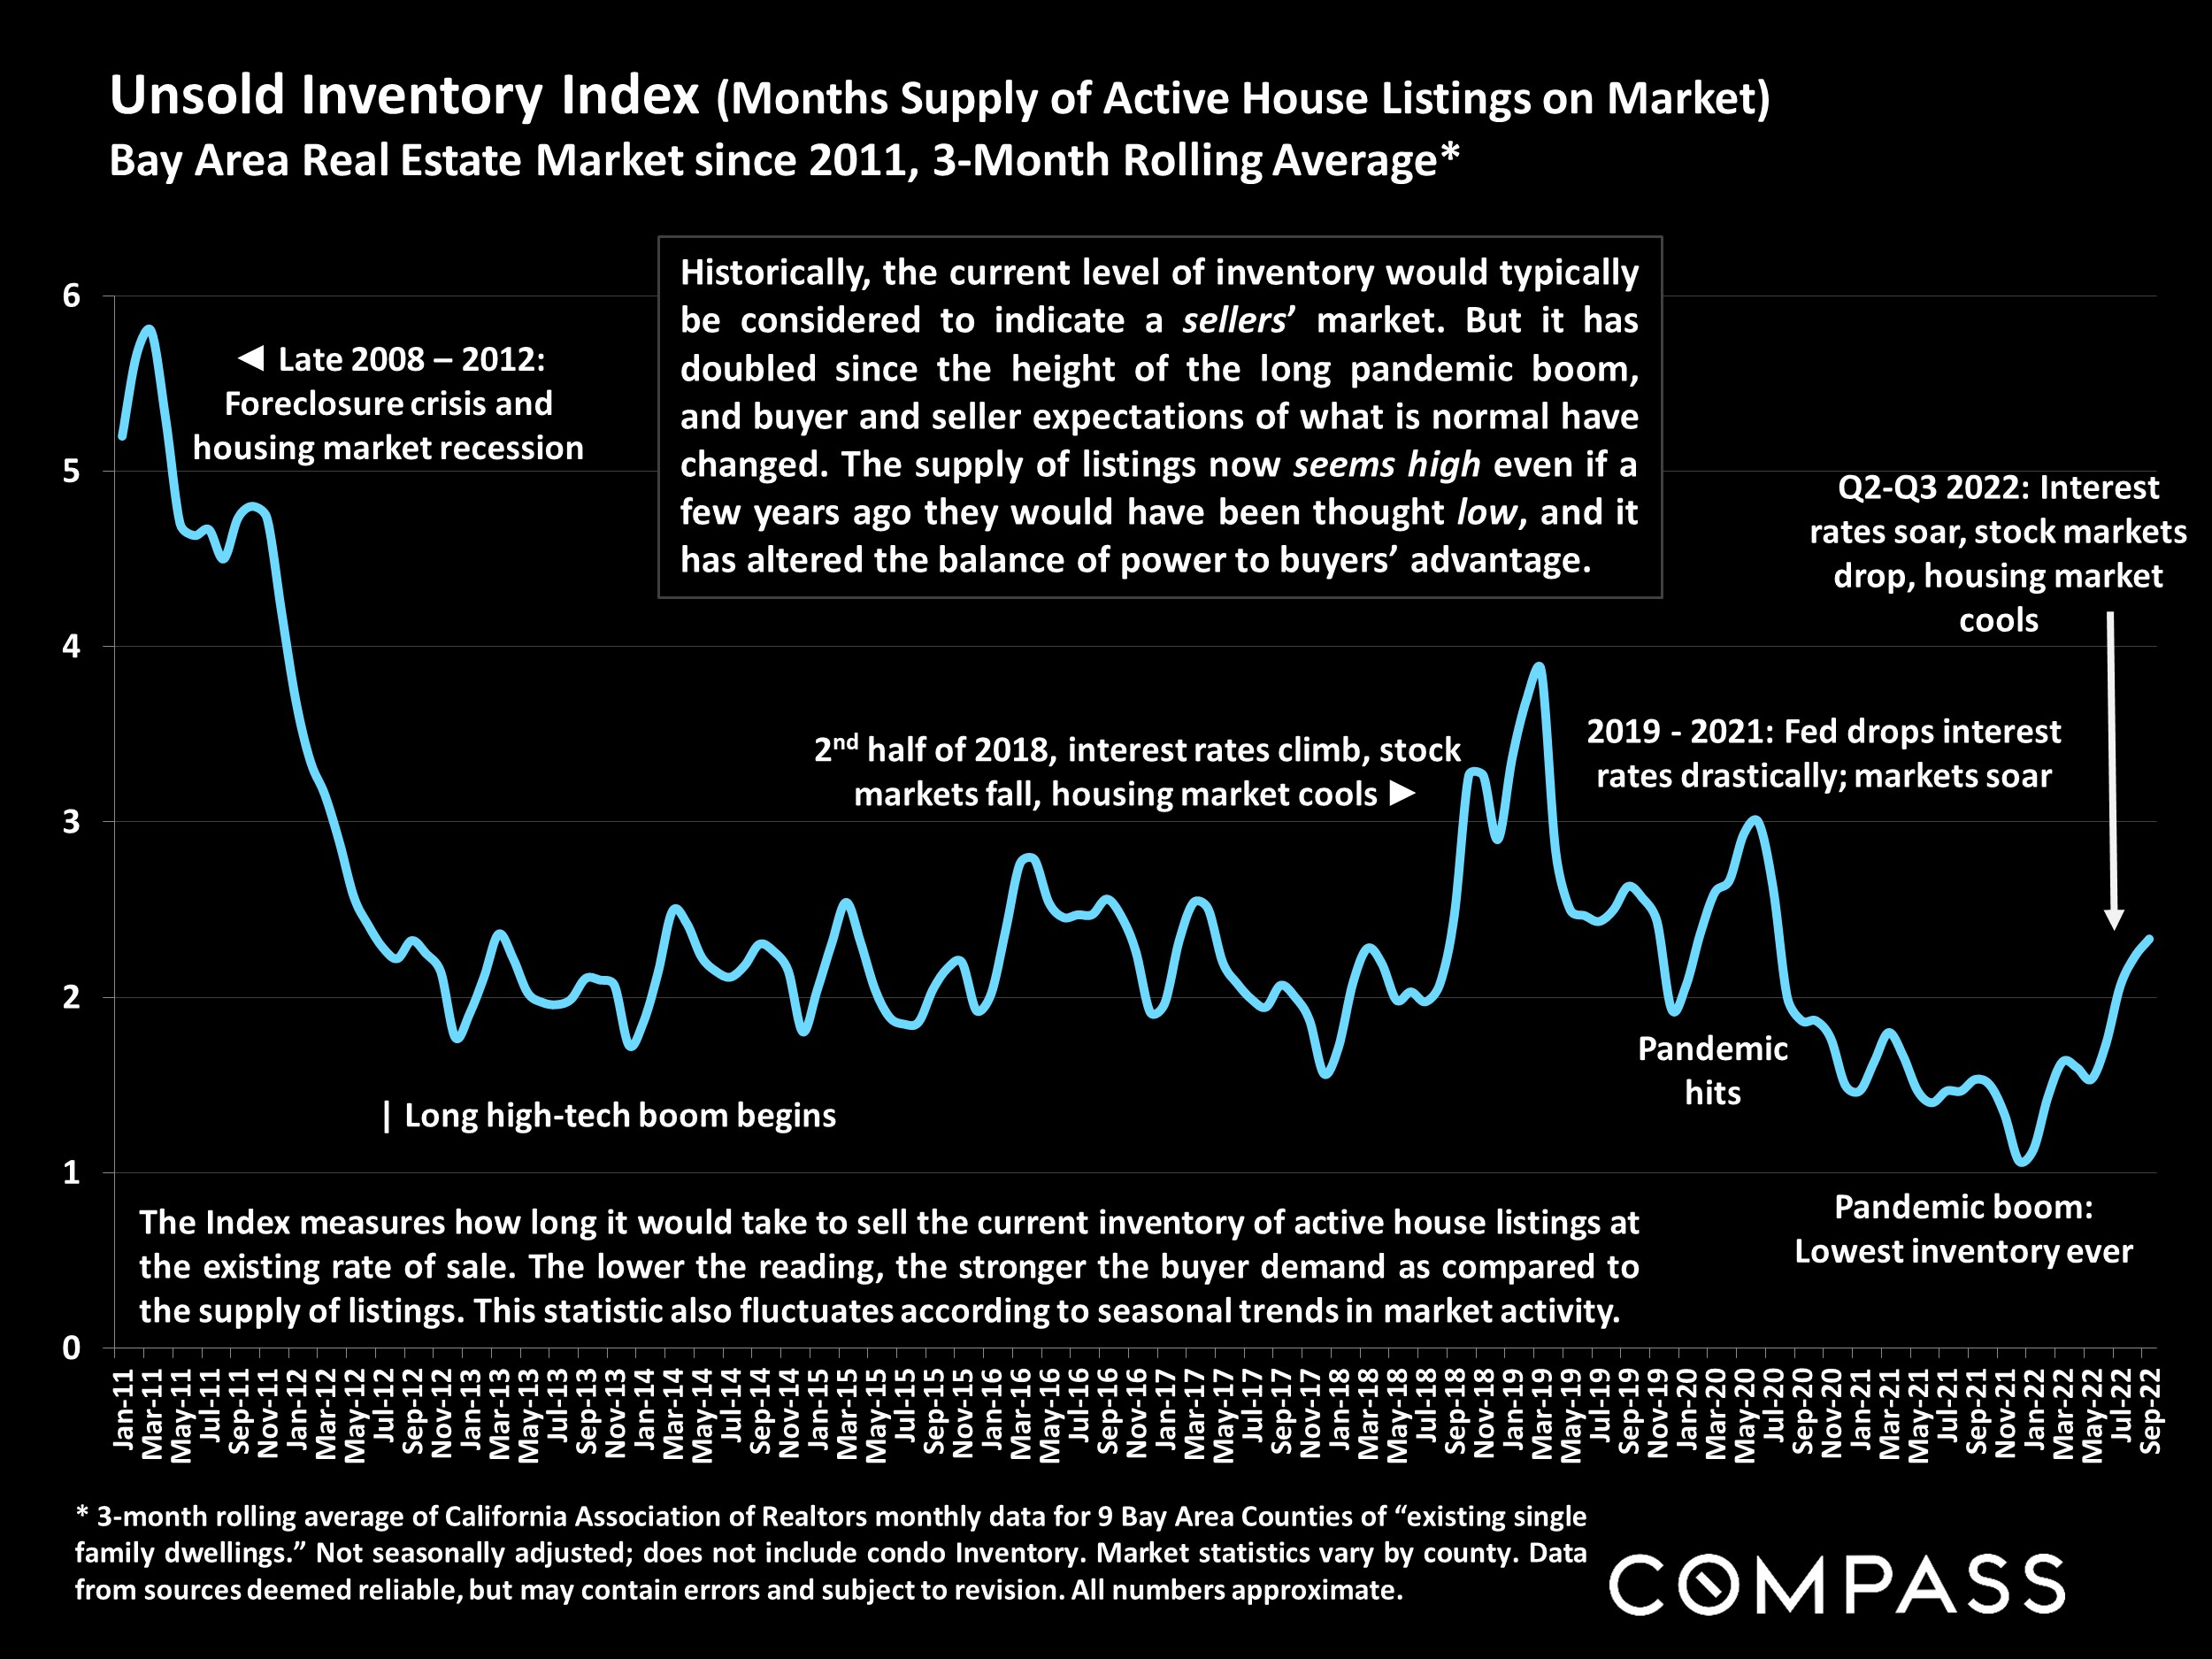
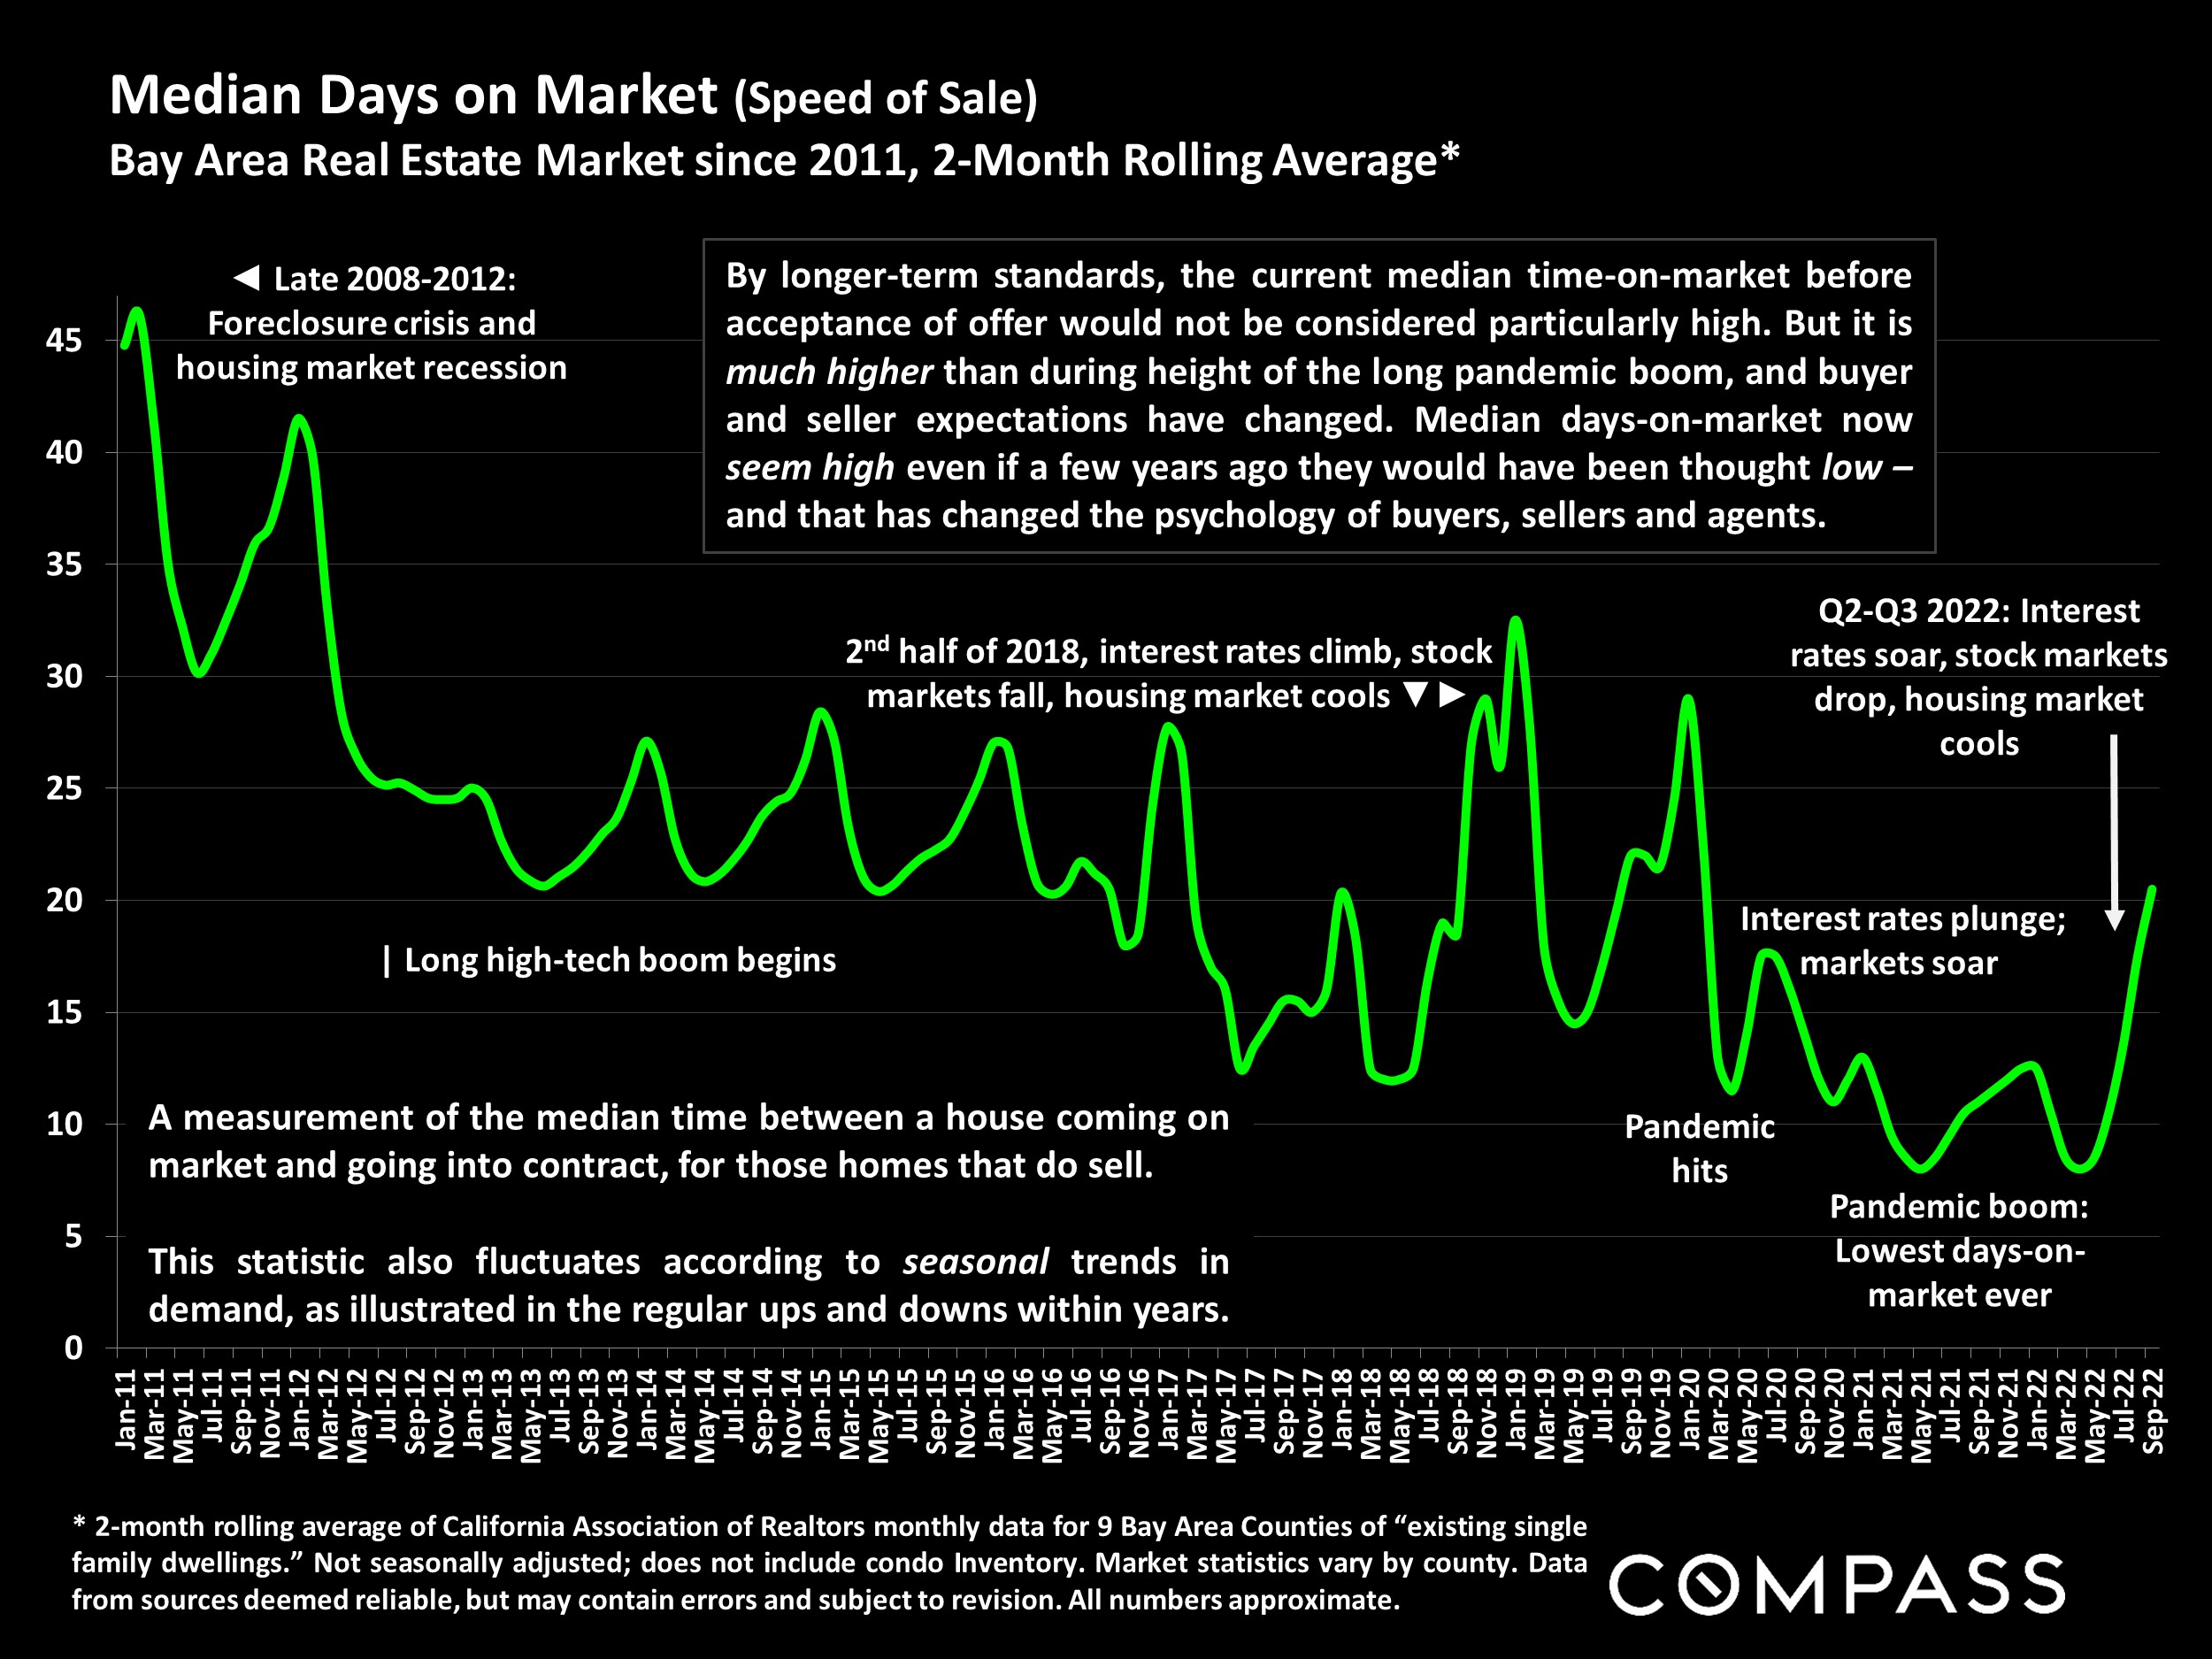
This is what has occurred since the end of the, often wildly overheated, pandemic boom. Abnormal market conditions – by far the lowest interest rates, months-supply-of-inventory and days-on-market; by far the highest stock values, absorption and overbidding rates, in history – became the norm for almost 2 years. When those indicators cooled in the Bay Area in Q2-Q3 2022, very significantly on a percentage basis – 1⁄2 to 1 month of inventory jumping to (a still historically low) 2 to 2.5 months; a median of 6-8 days-on-market climbing to (a still relatively low) 18 to 24 days – the speed and scale of change altered the balance of power to buyers’ advantage. Appreciation and overbidding rates have generally plunged, and price reductions soared, though many homes still sell quickly if priced correctly.
Older interpretations of statistical thresholds for defining buyers’ and sellers’ markets – often found online or in the media – are based on market-activity norms that no longer apply.
Demand has clearly weakened significantly due to the economic headwinds of 2022-inflation, interest rates, financial market volatility – but buyer, seller and agent expectations have also been somewhat twisted out of whack, fundamentally changing how we psychologically perceive and react to existing market realities. What might have been considered relatively healthy market dynamics are now seen as distinctly anemic in comparison to the pandemic boom. With the current market correction in progress, what will ultimately be considered heated, balanced or weak remains in flux while the market adjusts to the economic and demographic changes still in process.
The two charts which follow, illustrating Bay Area changes in inventory and time-on-market since 2011, speak to the shifting norms of supply and demand over the past 12 years.
Note: Market conditions, as measured by standard industry statistics, differ between regional markets and between price segments. The dynamics of distinct markets varied during the high-tech and pandemic booms: In each period, depending on a number of factors, some regions or segments experienced more dramatic changes in demand. However, generally speaking (and there are exceptions), Bay Area markets have seen similar trends, heating or cooling roughly in parallel during recent market eras – whether subprime boom, foreclosure crisis, high-tech or pandemic boom, or now during the current market adjustment.
Our reports are not intended to convince you regarding a course of action or to predict the future, but to provide, to the best of our ability, straightforward information and good-faith analysis to assist you in making your own informed decisions. Statistics should be considered very general indicators, and all numbers should be considered approximate. How they apply to any particular property is unknown without a specific comparative market analysis.
Statistics are generalities, essentially summaries of widely disparate data generated by dozens or hundreds of unique, individual sales occurring within different time periods. They are best seen not as precise measurements, but as broad, comparative indicators, with reasonable margins of error. Anomalous fluctuations in statistics are not uncommon, especially in smaller, expensive market segments. Last period data should be considered estimates that may change with late-reported data. Different analytics programs sometimes define statistics – such as “active listings,” “days on market,” and “months supply of inventory” – differently: what is most meaningful are not specific calculations but the trends they illustrate. Most listing and sales data derives from the local or regional multi-listing service (MLS) of the area specified in the analysis, but not all listings or sales are reported to MLS and these won’t be reflected in the data. “Homes” signifies real-property, single-household housing units: houses, condos, co-ops, townhouses, duets and TICs (but not mobile homes), as applicable to each market. City/town names refer specifically to the named cities and towns, unless otherwise delineated. Multi-county metro areas will be specified as such. Data from sources deemed reliable, but may contain errors and subject to revision. All numbers to be considered approximate.
Many aspects of value cannot be adequately reflected in median and average statistics: curb appeal, age, condition, amenities, views, lot size, quality of outdoor space, “bonus” rooms, additional parking, quality of location within the neighborhood, and so on. How any of these statistics apply to any particular home is unknown without a specific comparative market analysis.
Median Sales Price is that price at which half the properties sold for more and half for less. It may be affected by seasonality, “unusual” events, or changes in inventory and buying trends, as well as by changes in fair market value. The median sales price for an area will often conceal an enormous variety of sales prices in the underlying individual sales.
Dollar per Square Foot is based upon the home’s interior living space and does not include garages, unfinished attics and basements, rooms built without permit, patios, decks or yards (though all those can add value to a home). These figures are usually derived from appraisals or tax records, but are sometimes unreliable (especially for older homes) or unreported altogether. The calculation can only be made on those home sales that reported square footage.
Compass is a real estate broker licensed by the State of California, DRE 01527235. Equal Housing Opportunity. This report has been prepared solely for information purposes. The information herein is based on or derived from information generally available to the public and/or from sources believed to be reliable. No representation or warranty can be given with respect to the accuracy or completeness of the information. Compass disclaims any and all liability relating to this report, including without limitation any express or implied representations or warranties for statements contained in, and omissions from, the report. Nothing contained herein is intended to be or should be read as any regulatory, legal, tax, accounting or other advice and Compass does not provide such advice. All opinions are subject to change without notice. Compass makes no representation regarding the accuracy of any statements regarding any references to the laws, statutes or regulations of any state are those of the author(s). Past performance is no guarantee of future results.
Source: Compass
It is impossible to know how median and average value statistics apply to any particular home without a specific comparative market analysis. These analyses were made in good faith with data from sources deemed reliable, but may contain errors and are subject to revision. It is not our intent to convince you of a particular position, but to attempt to provide straightforward data and analysis, so you can make your own informed decisions. Median and average statistics are enormous generalities: There are hundreds of different markets in San Francisco and the Bay Area, each with its own unique dynamics. Median prices and average dollar per square foot values can be and often are affected by other factors besides changes in fair market value. Longer term trends are much more meaningful than short-term.
Compass is a real estate broker licensed by the State of California, DRE 01527235. Equal Housing Opportunity. This report has been prepared solely for information purposes. The information herein is based on or derived from information generally available to the public and/or from sources believed to be reliable. No representation or warranty can be given with respect to the accuracy or completeness of the information. Compass disclaims any and all liability relating to this report, including without limitation any express or implied representations or warranties for statements contained in, and omissions from, the report. Nothing contained herein is intended to be or should be read as any regulatory, legal, tax, accounting or other advice and Compass does not provide such advice. All opinions are subject to change without notice. Compass makes no representation regarding the accuracy of any statements regarding any references to the laws, statutes or regulations of any state are those of the author(s). Past performance is no guarantee of future results.
