
11 counties, Napa to Monterey – Spring 2021
Statistics are generalities, essentially summaries of data generated by dozens, hundreds or thousands of unique, individual sales. They are best seen not as precise measurements, but as broad, comparative indicators with reasonable margins of error – and how they apply to any particular property is unknown without a specific comparative market analysis. Anomalous fluctuations in statistics are not uncommon, especially in smaller markets with fewer sales and wide ranges in sales prices. Longer-term trends are typically more meaningful than short-term changes. Data from sources deemed reliable, but may contain errors and subject to revision. Some analyses pertain to different selections of counties, depending on data source. All numbers are approximate.
Selected Highlights:
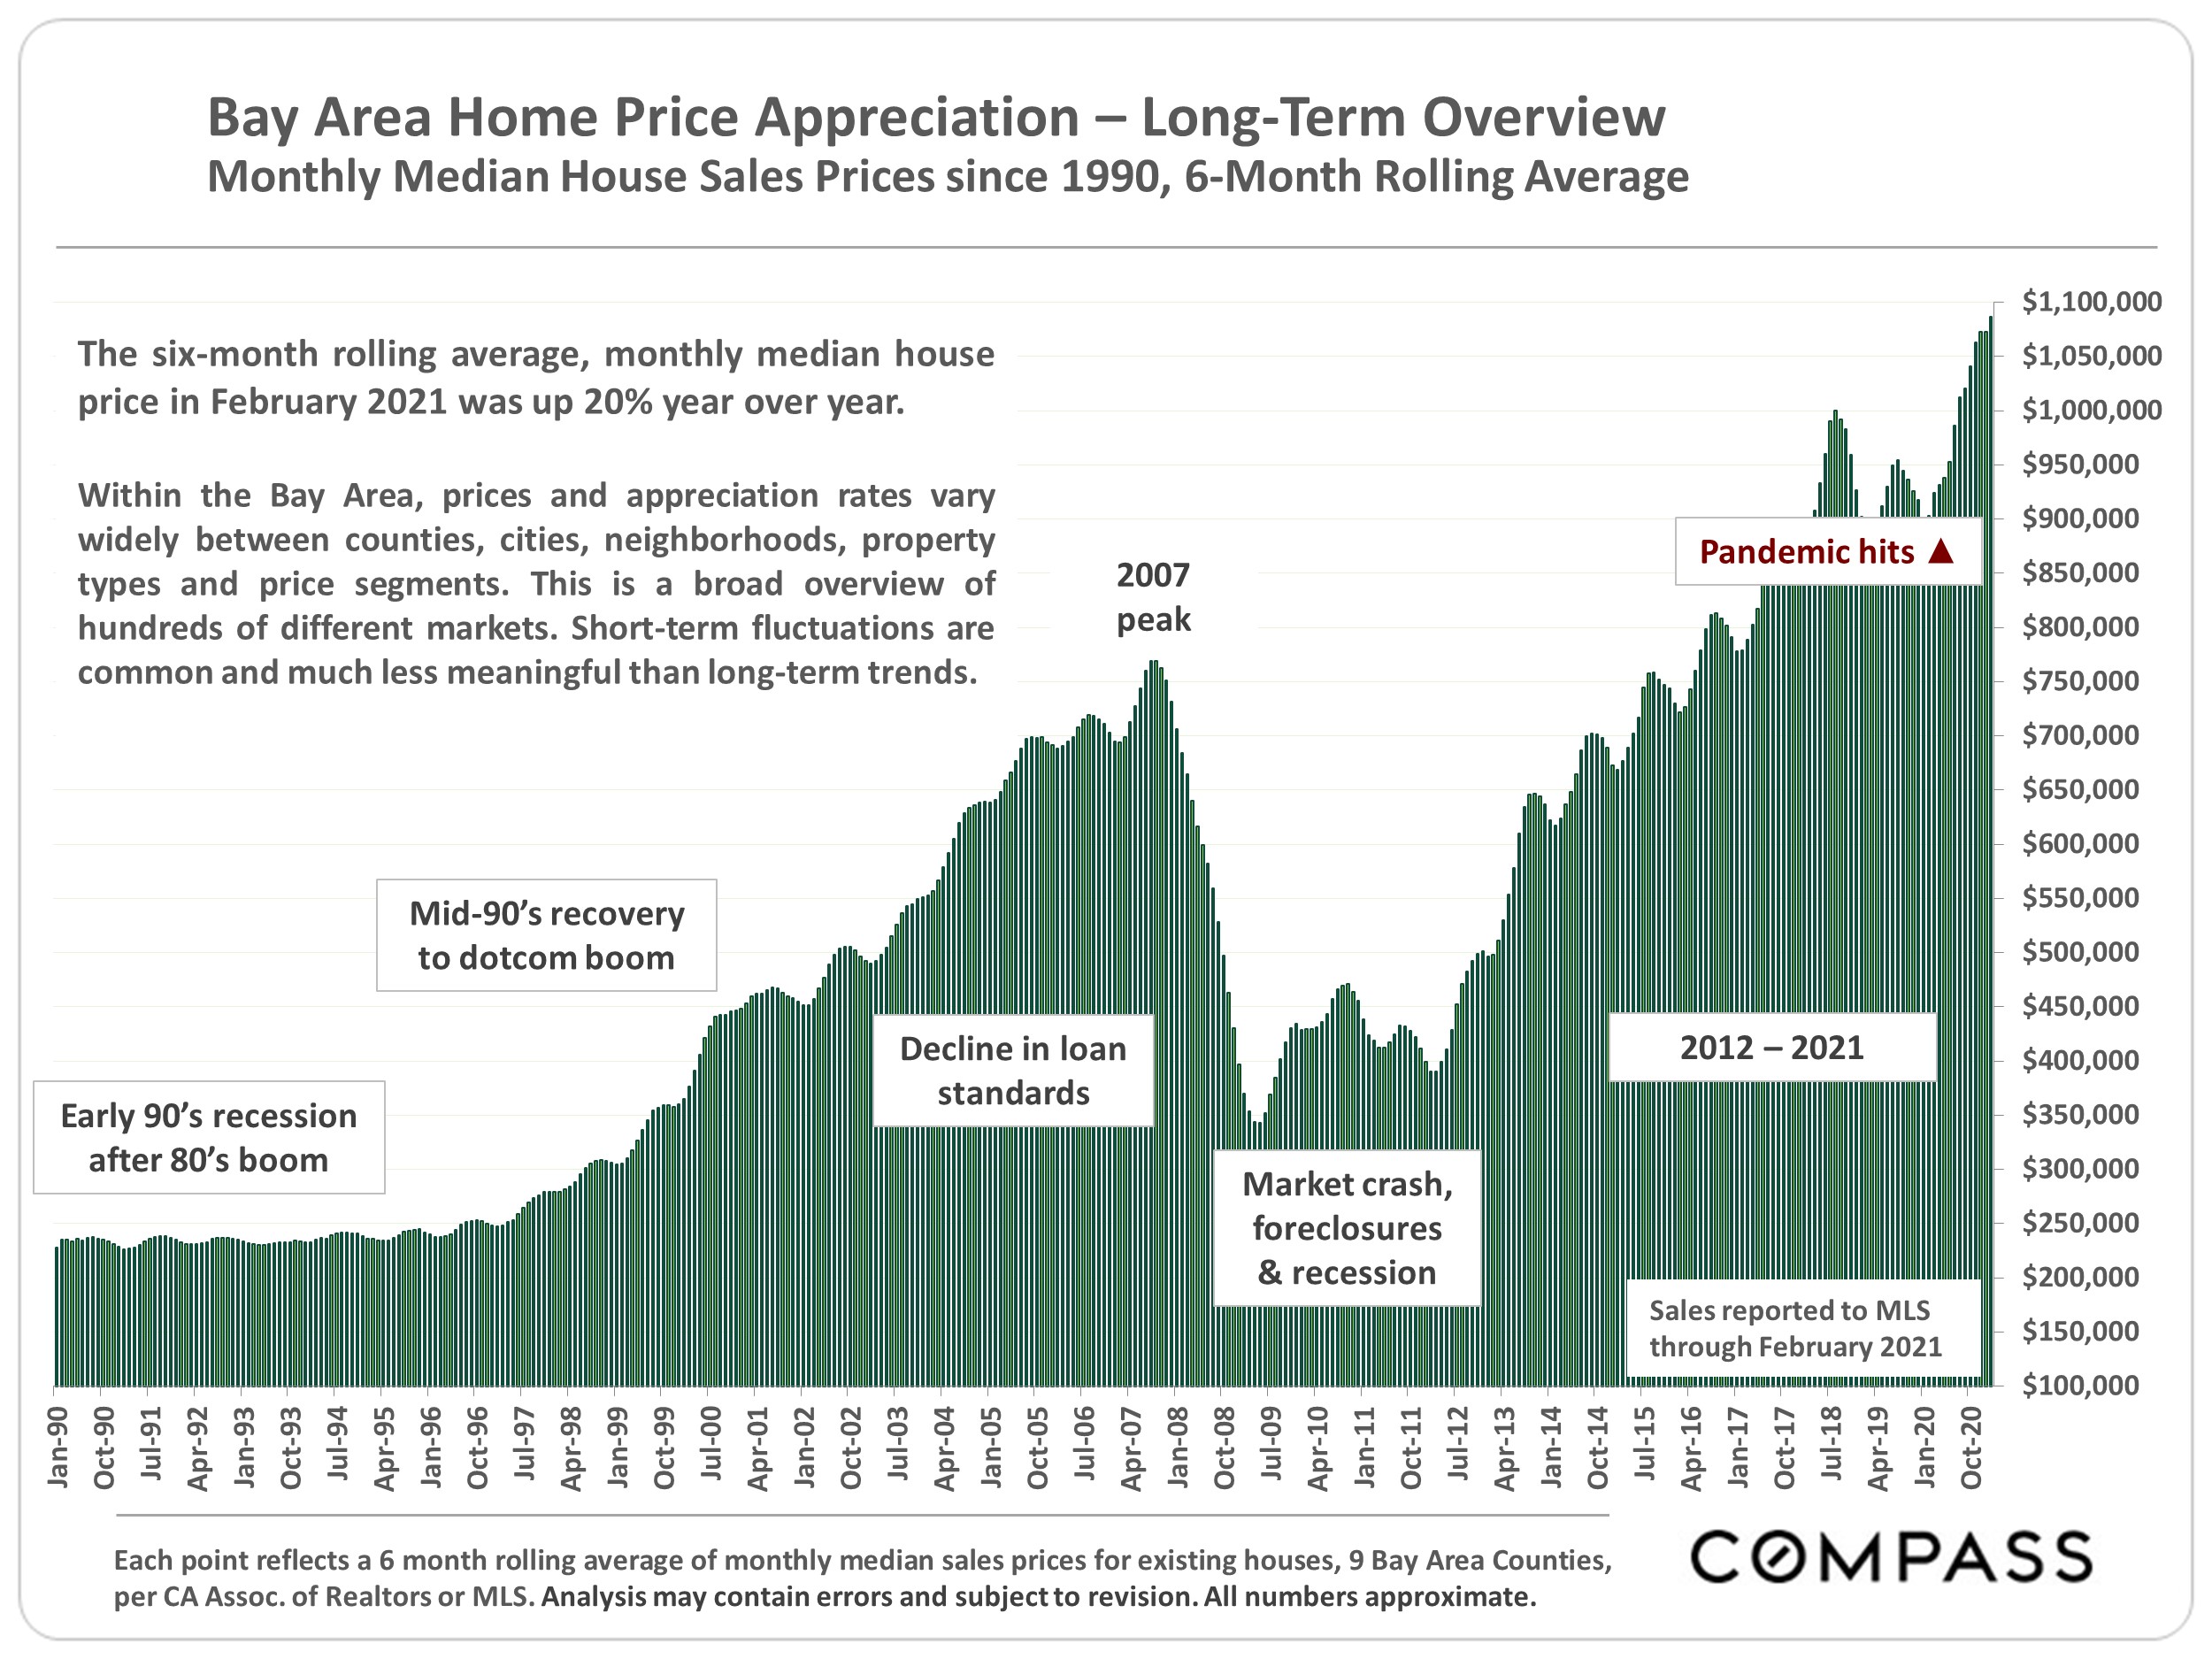
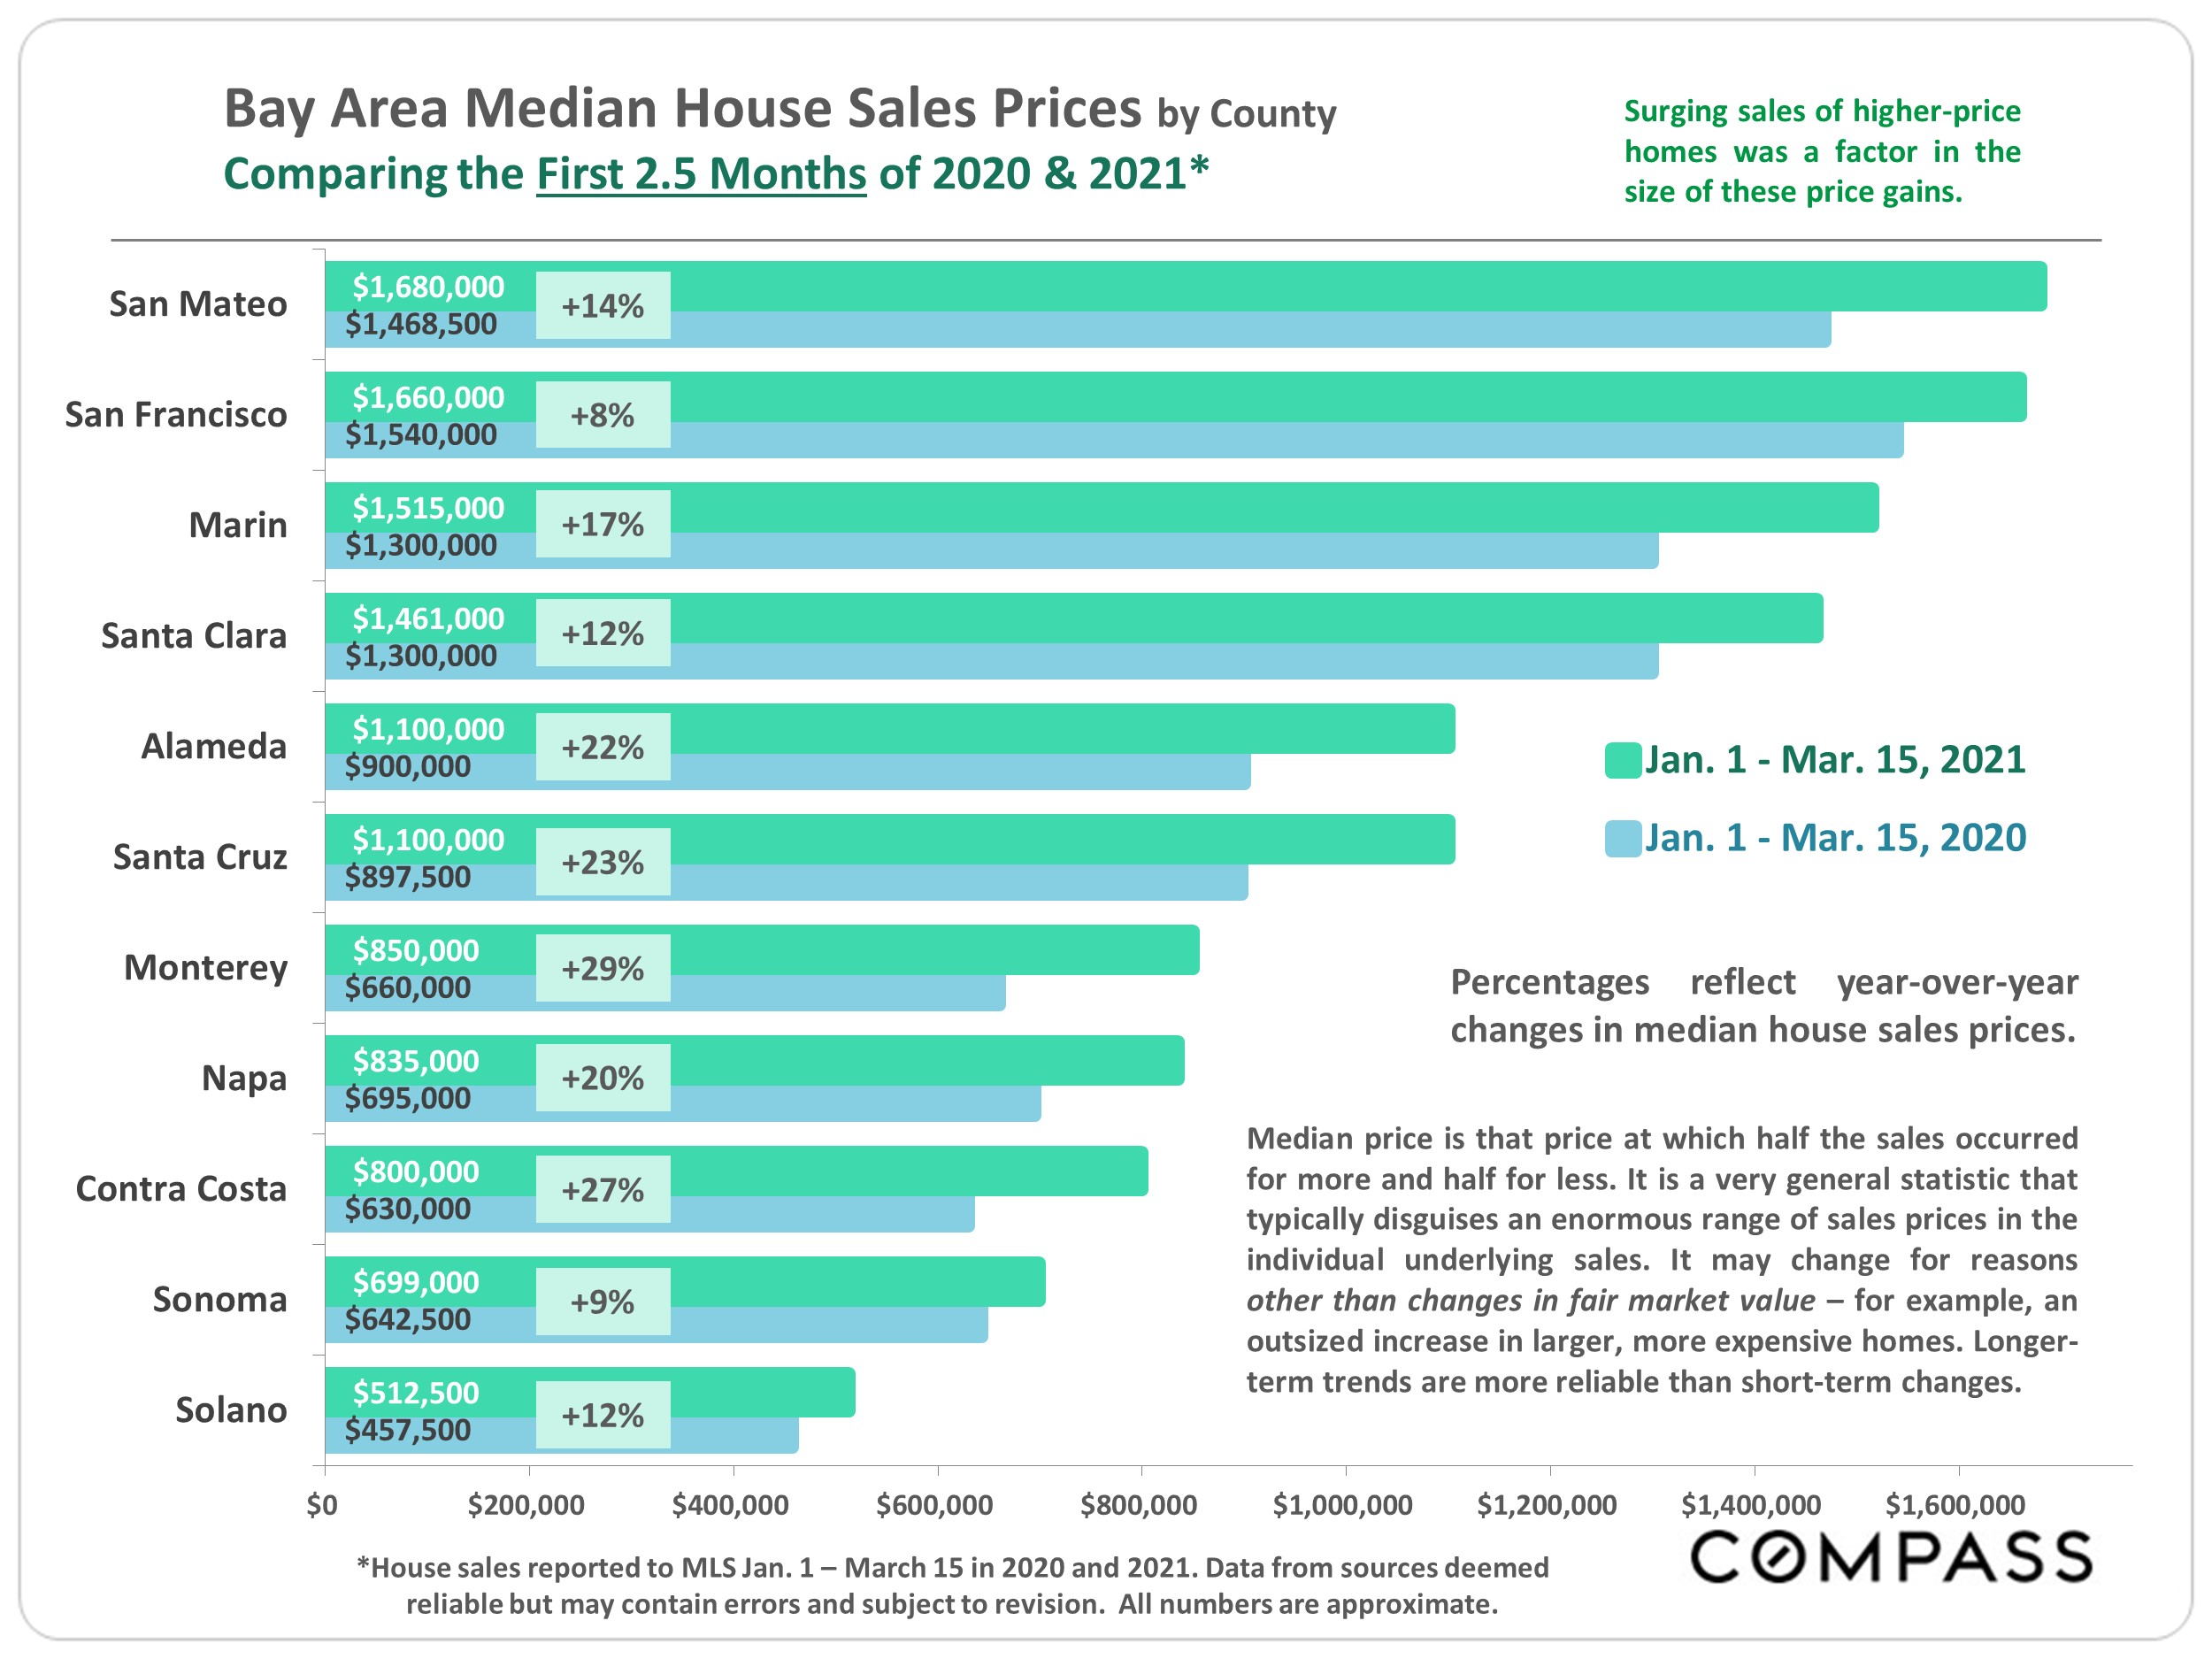
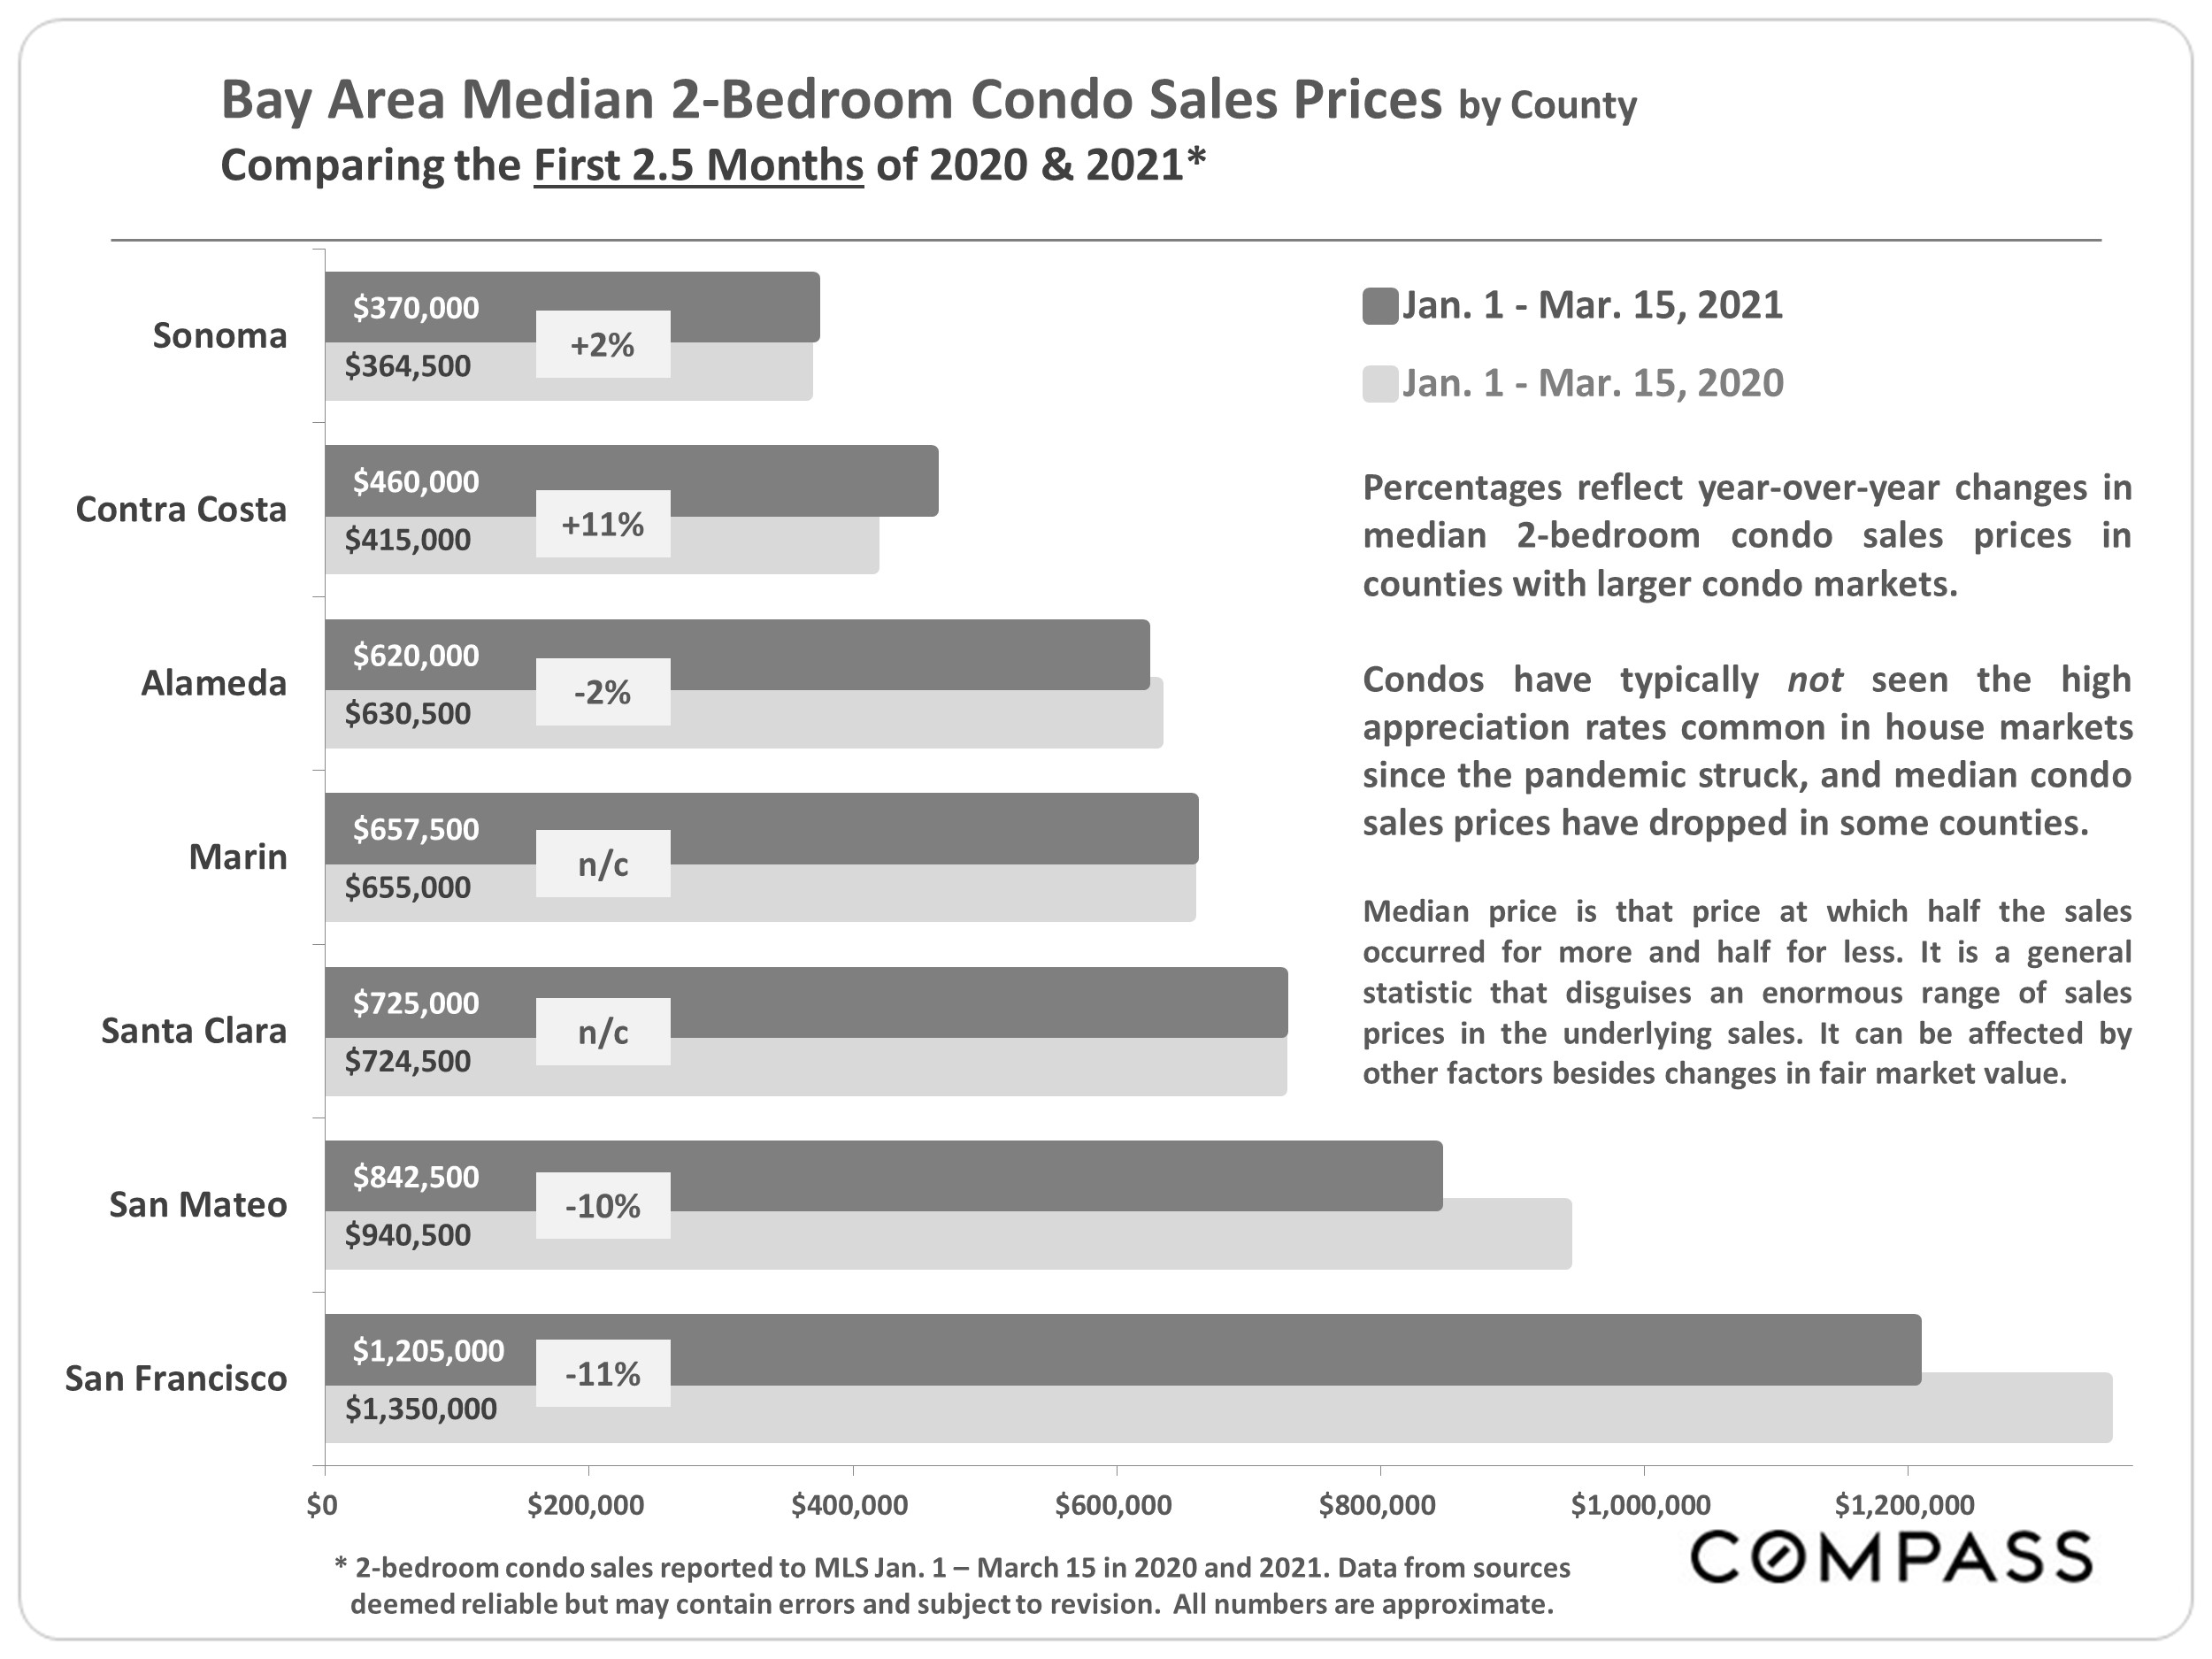
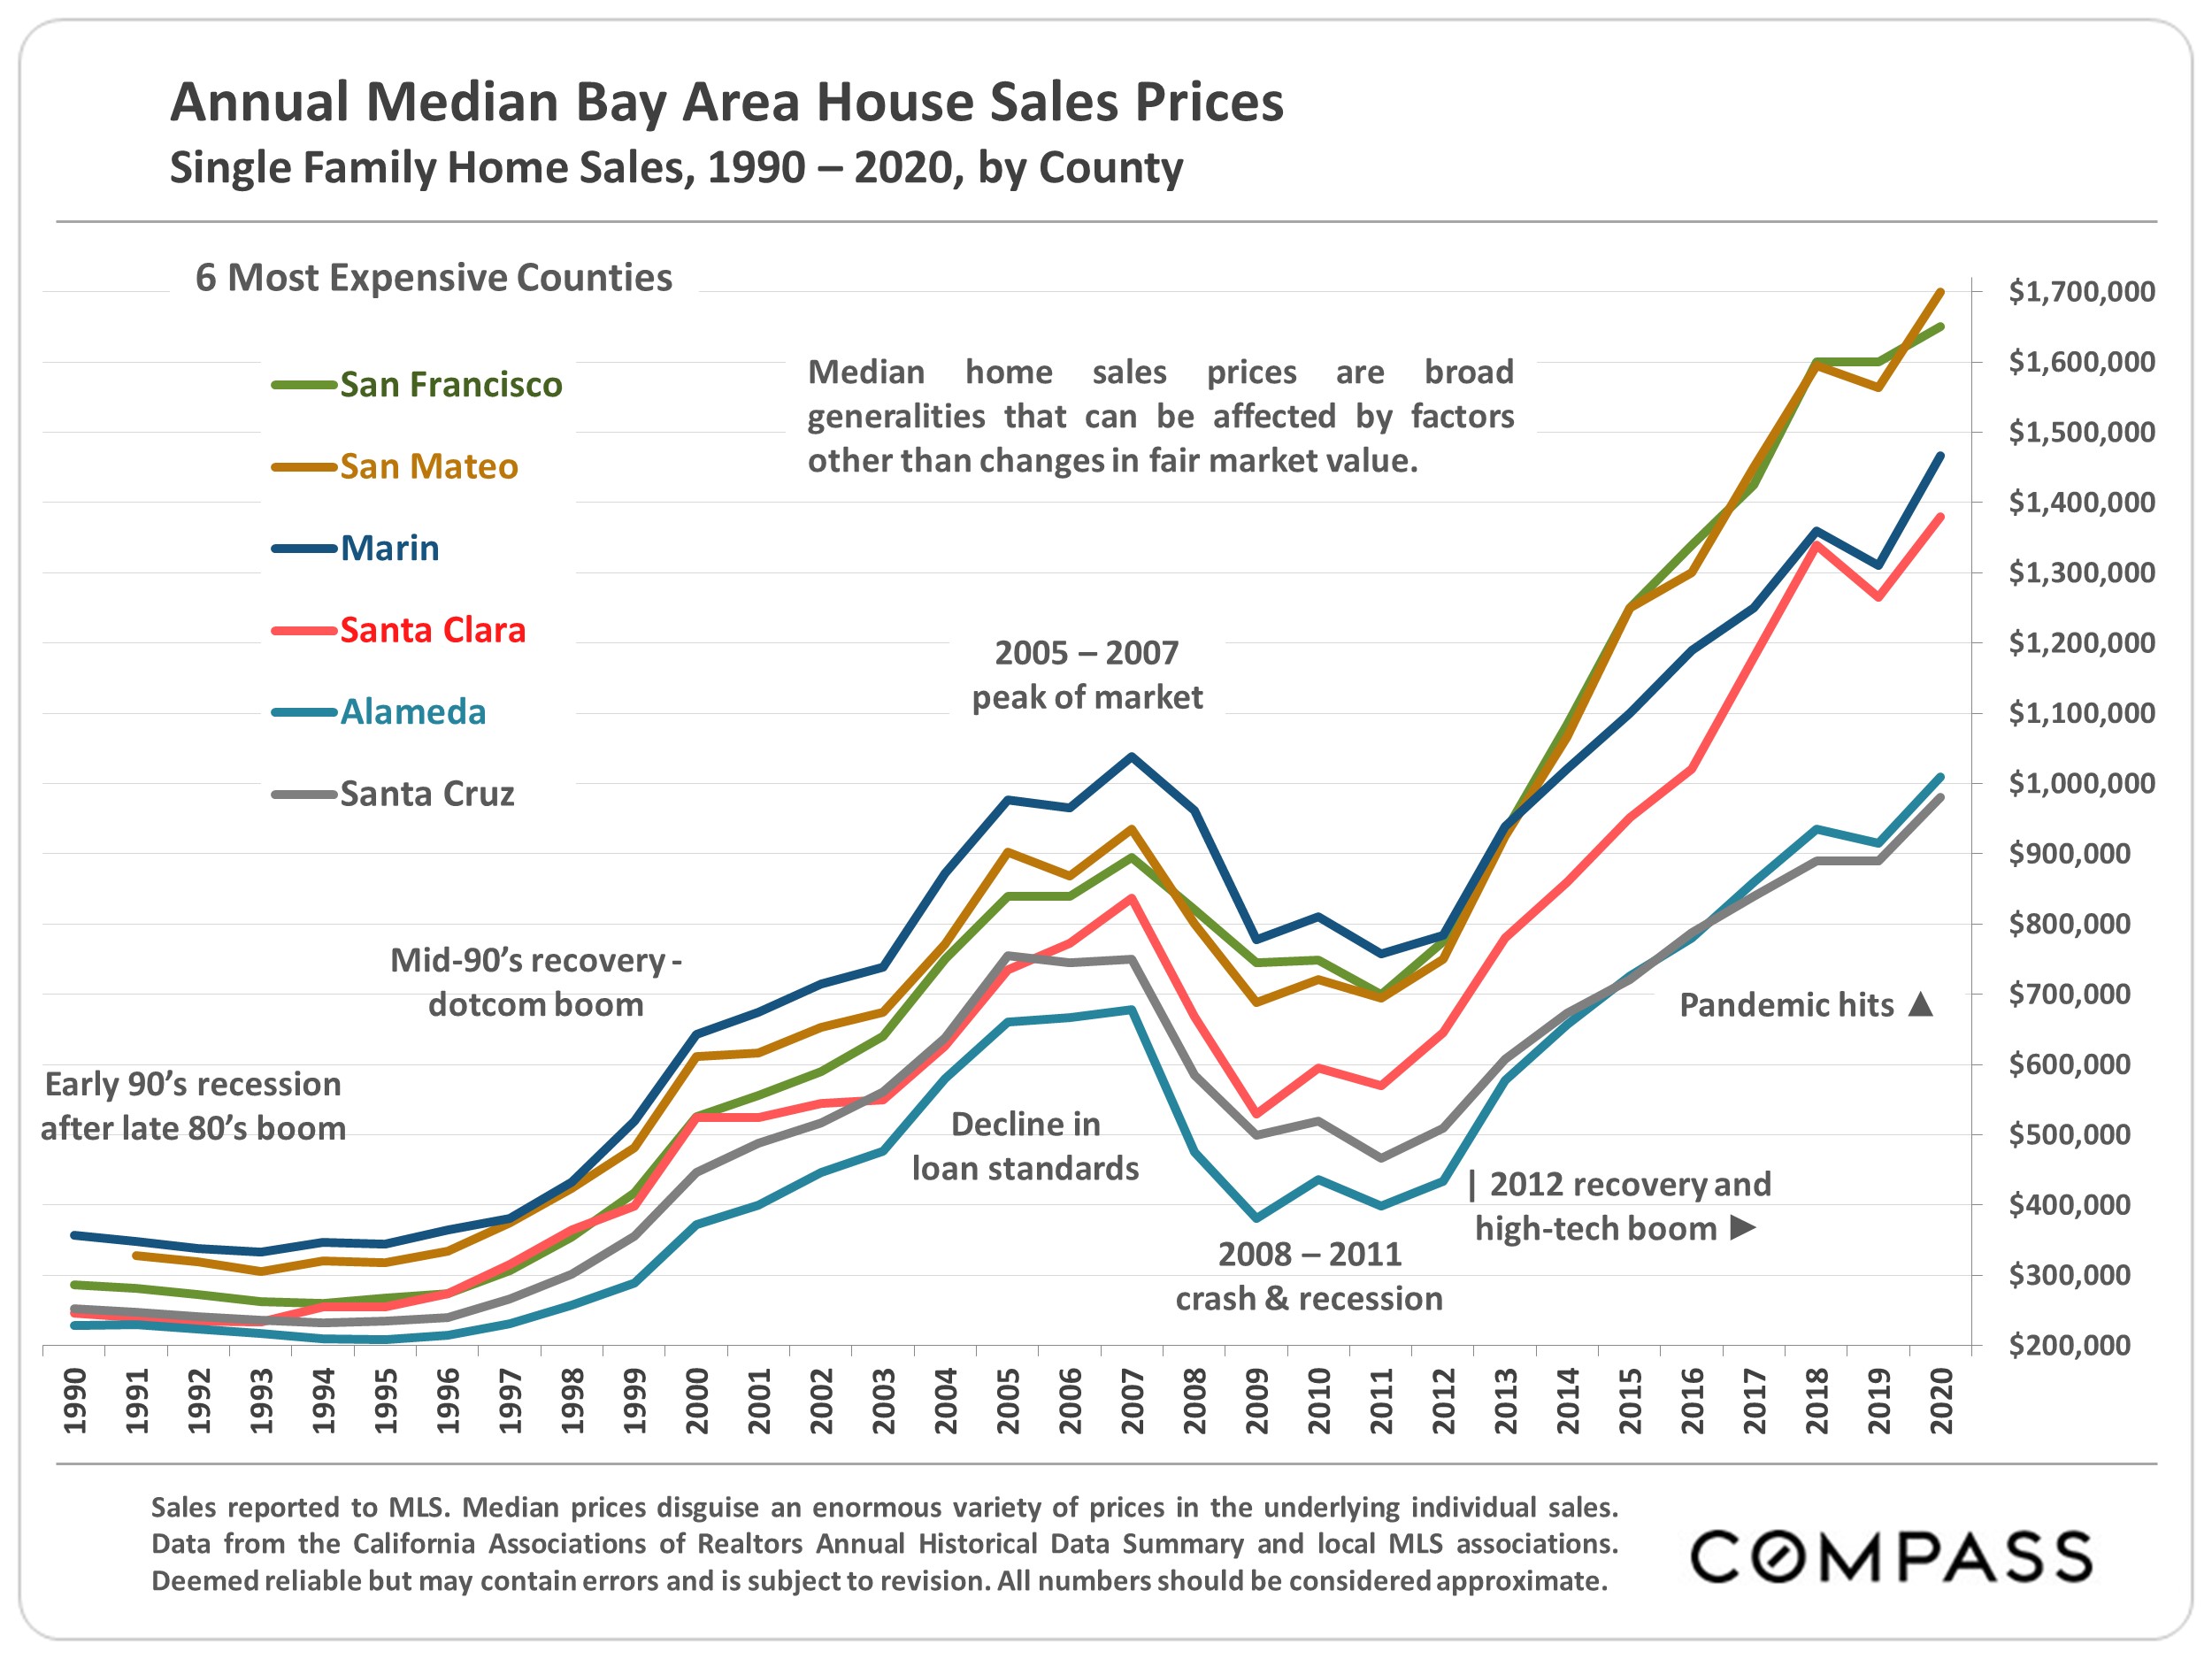
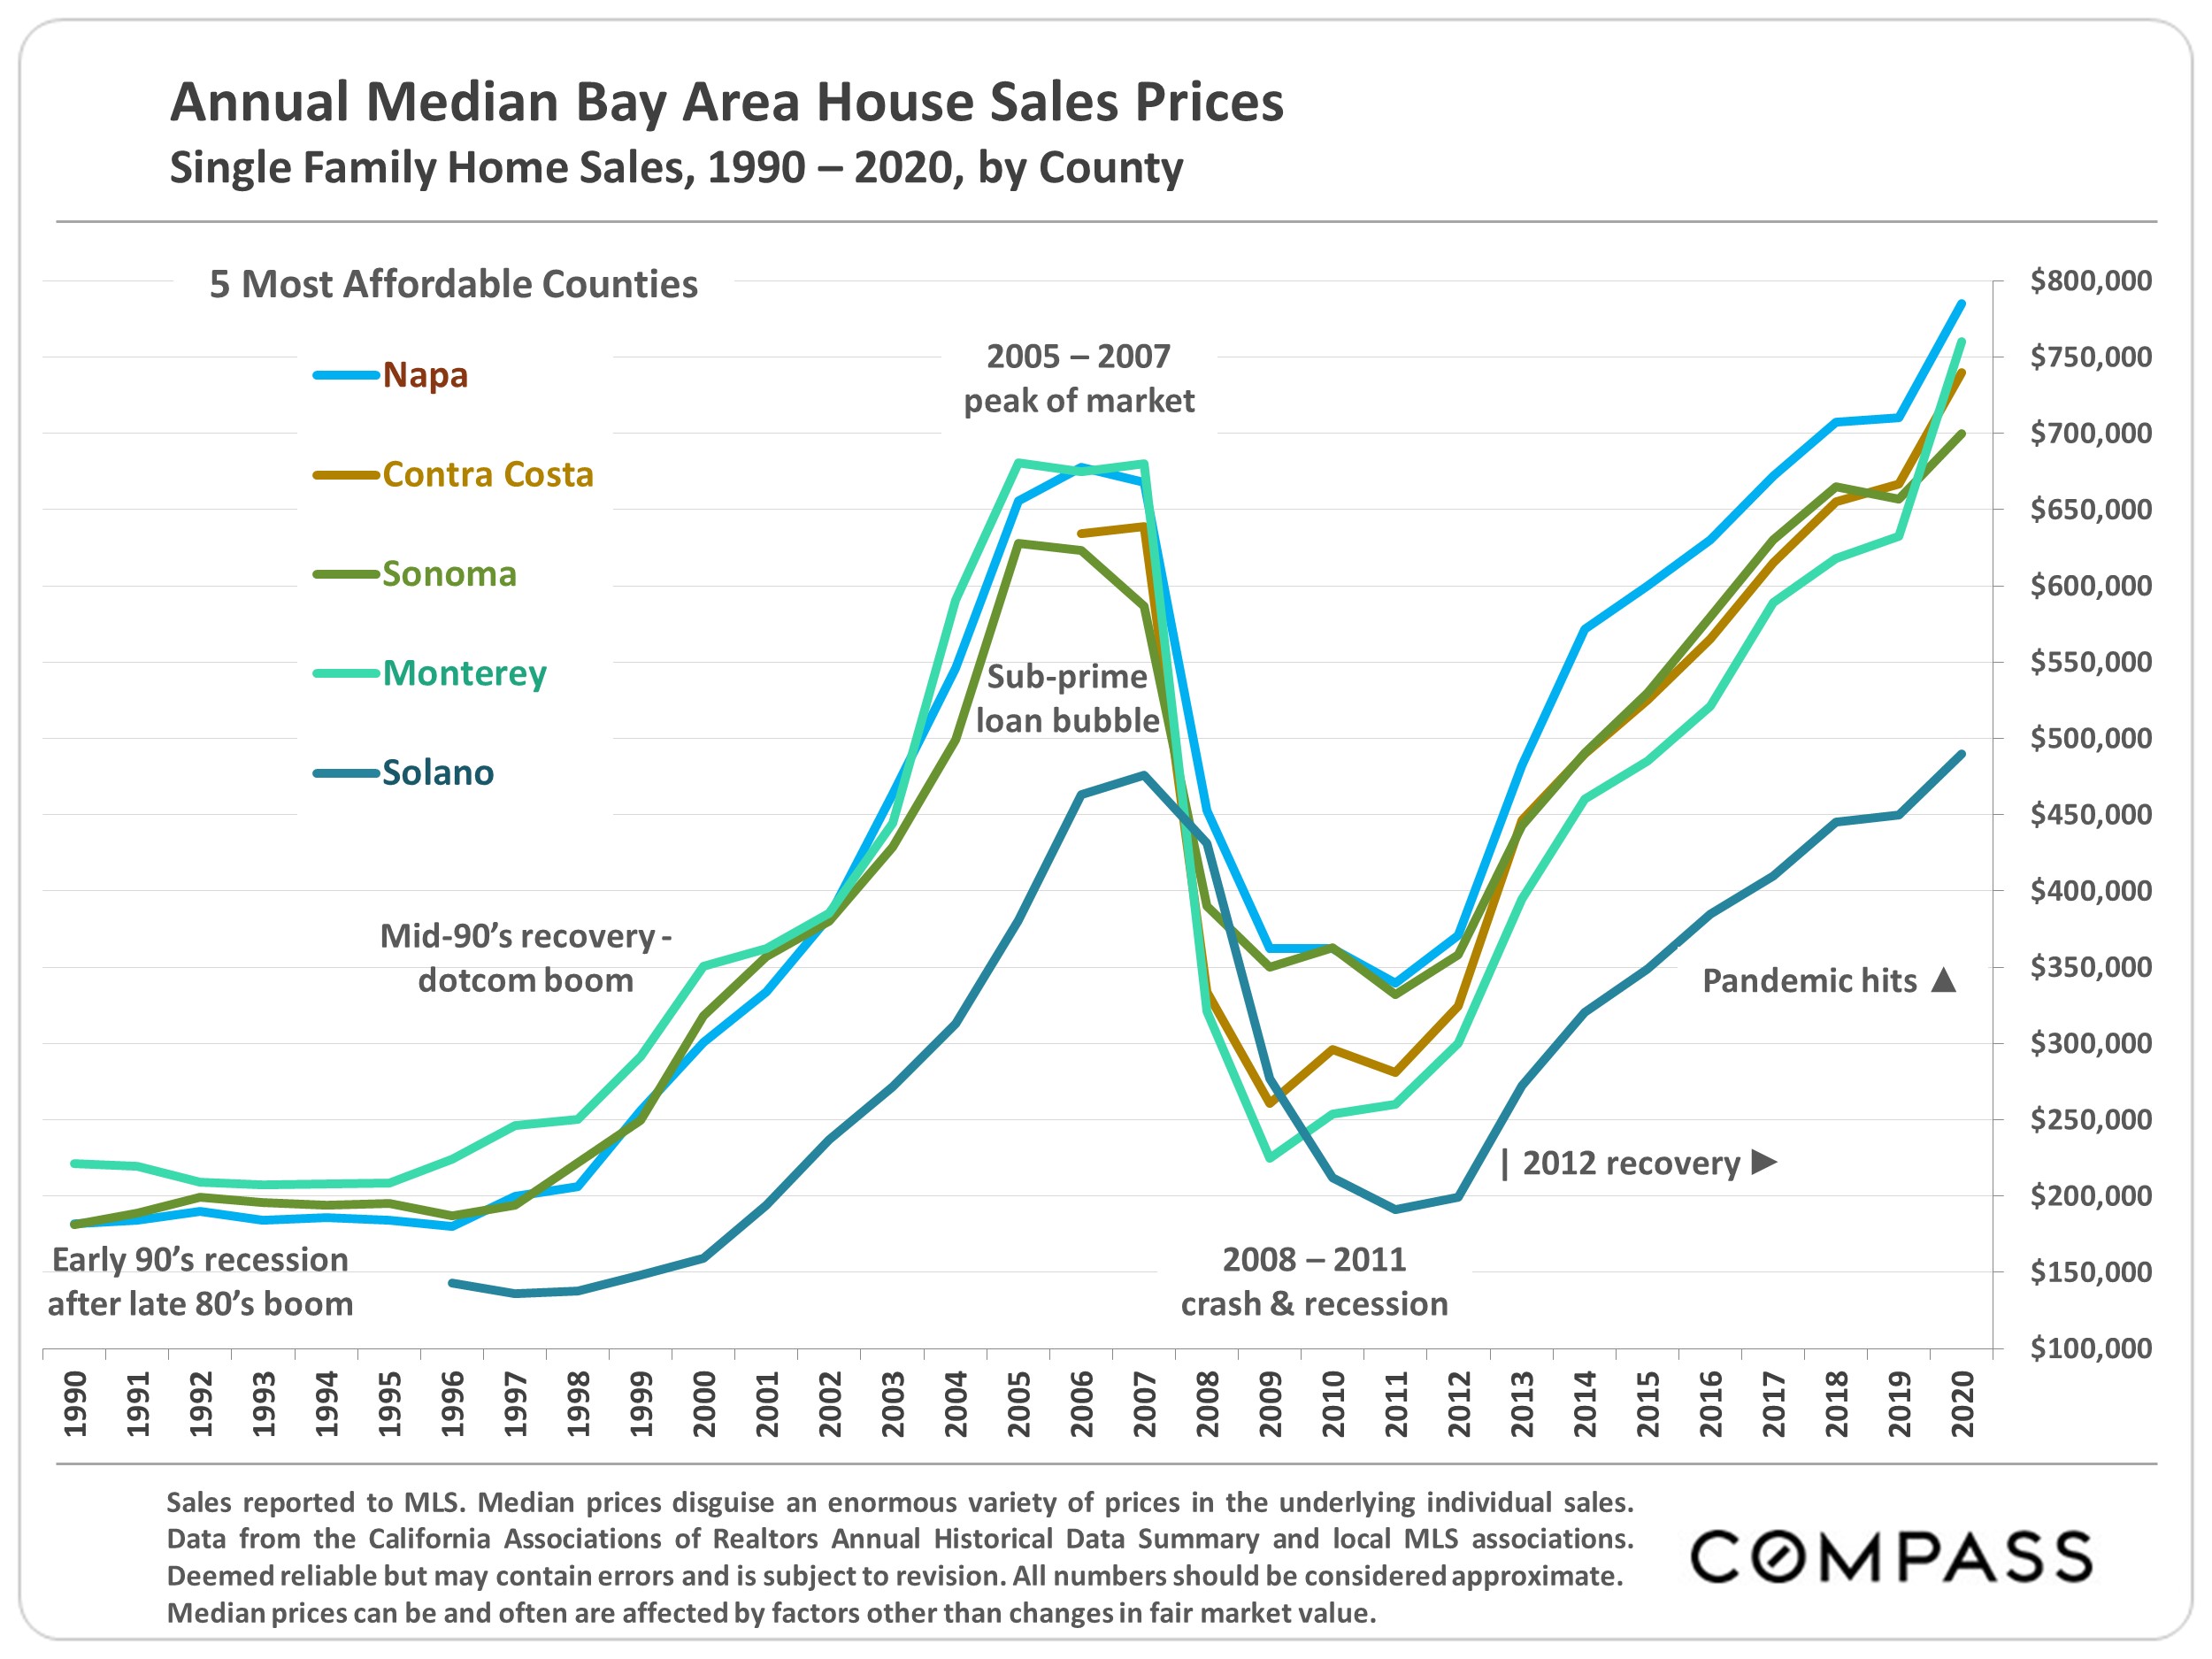
The first 21⁄2 months of 2021 saw year-over-year, median house sales price increases of 8% to 29% depending on county. (The picture for median condo prices was different.)
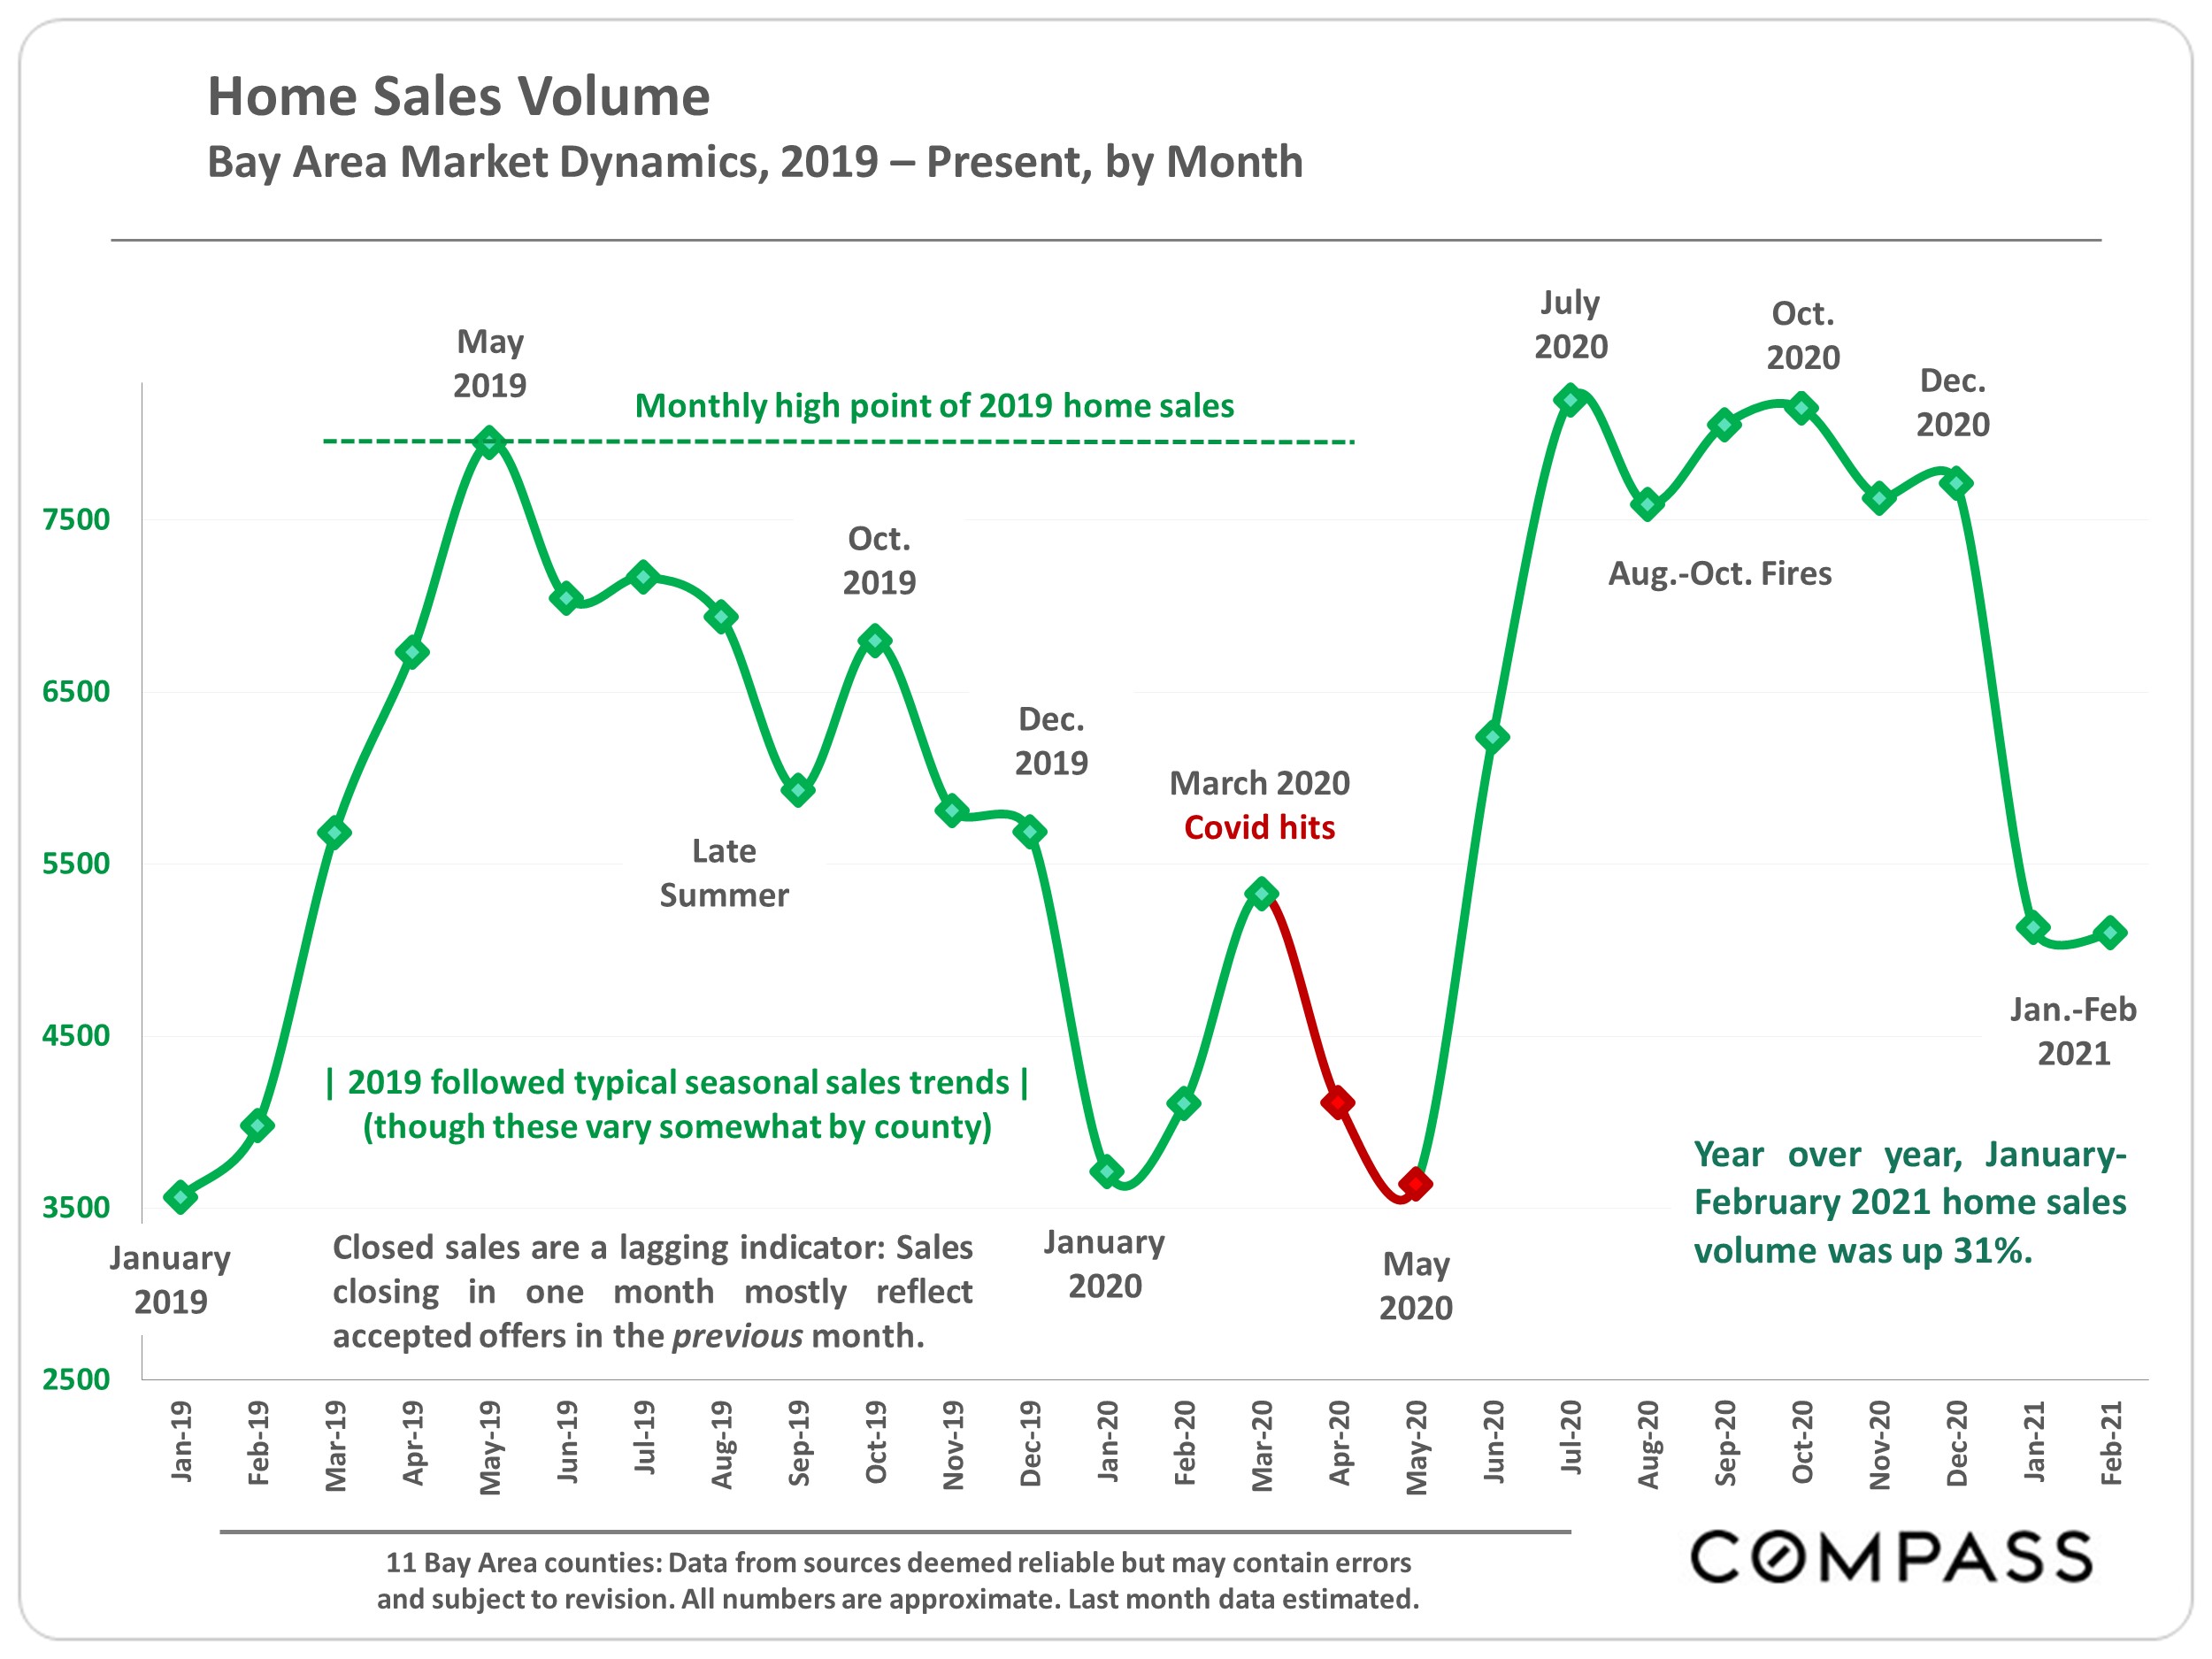
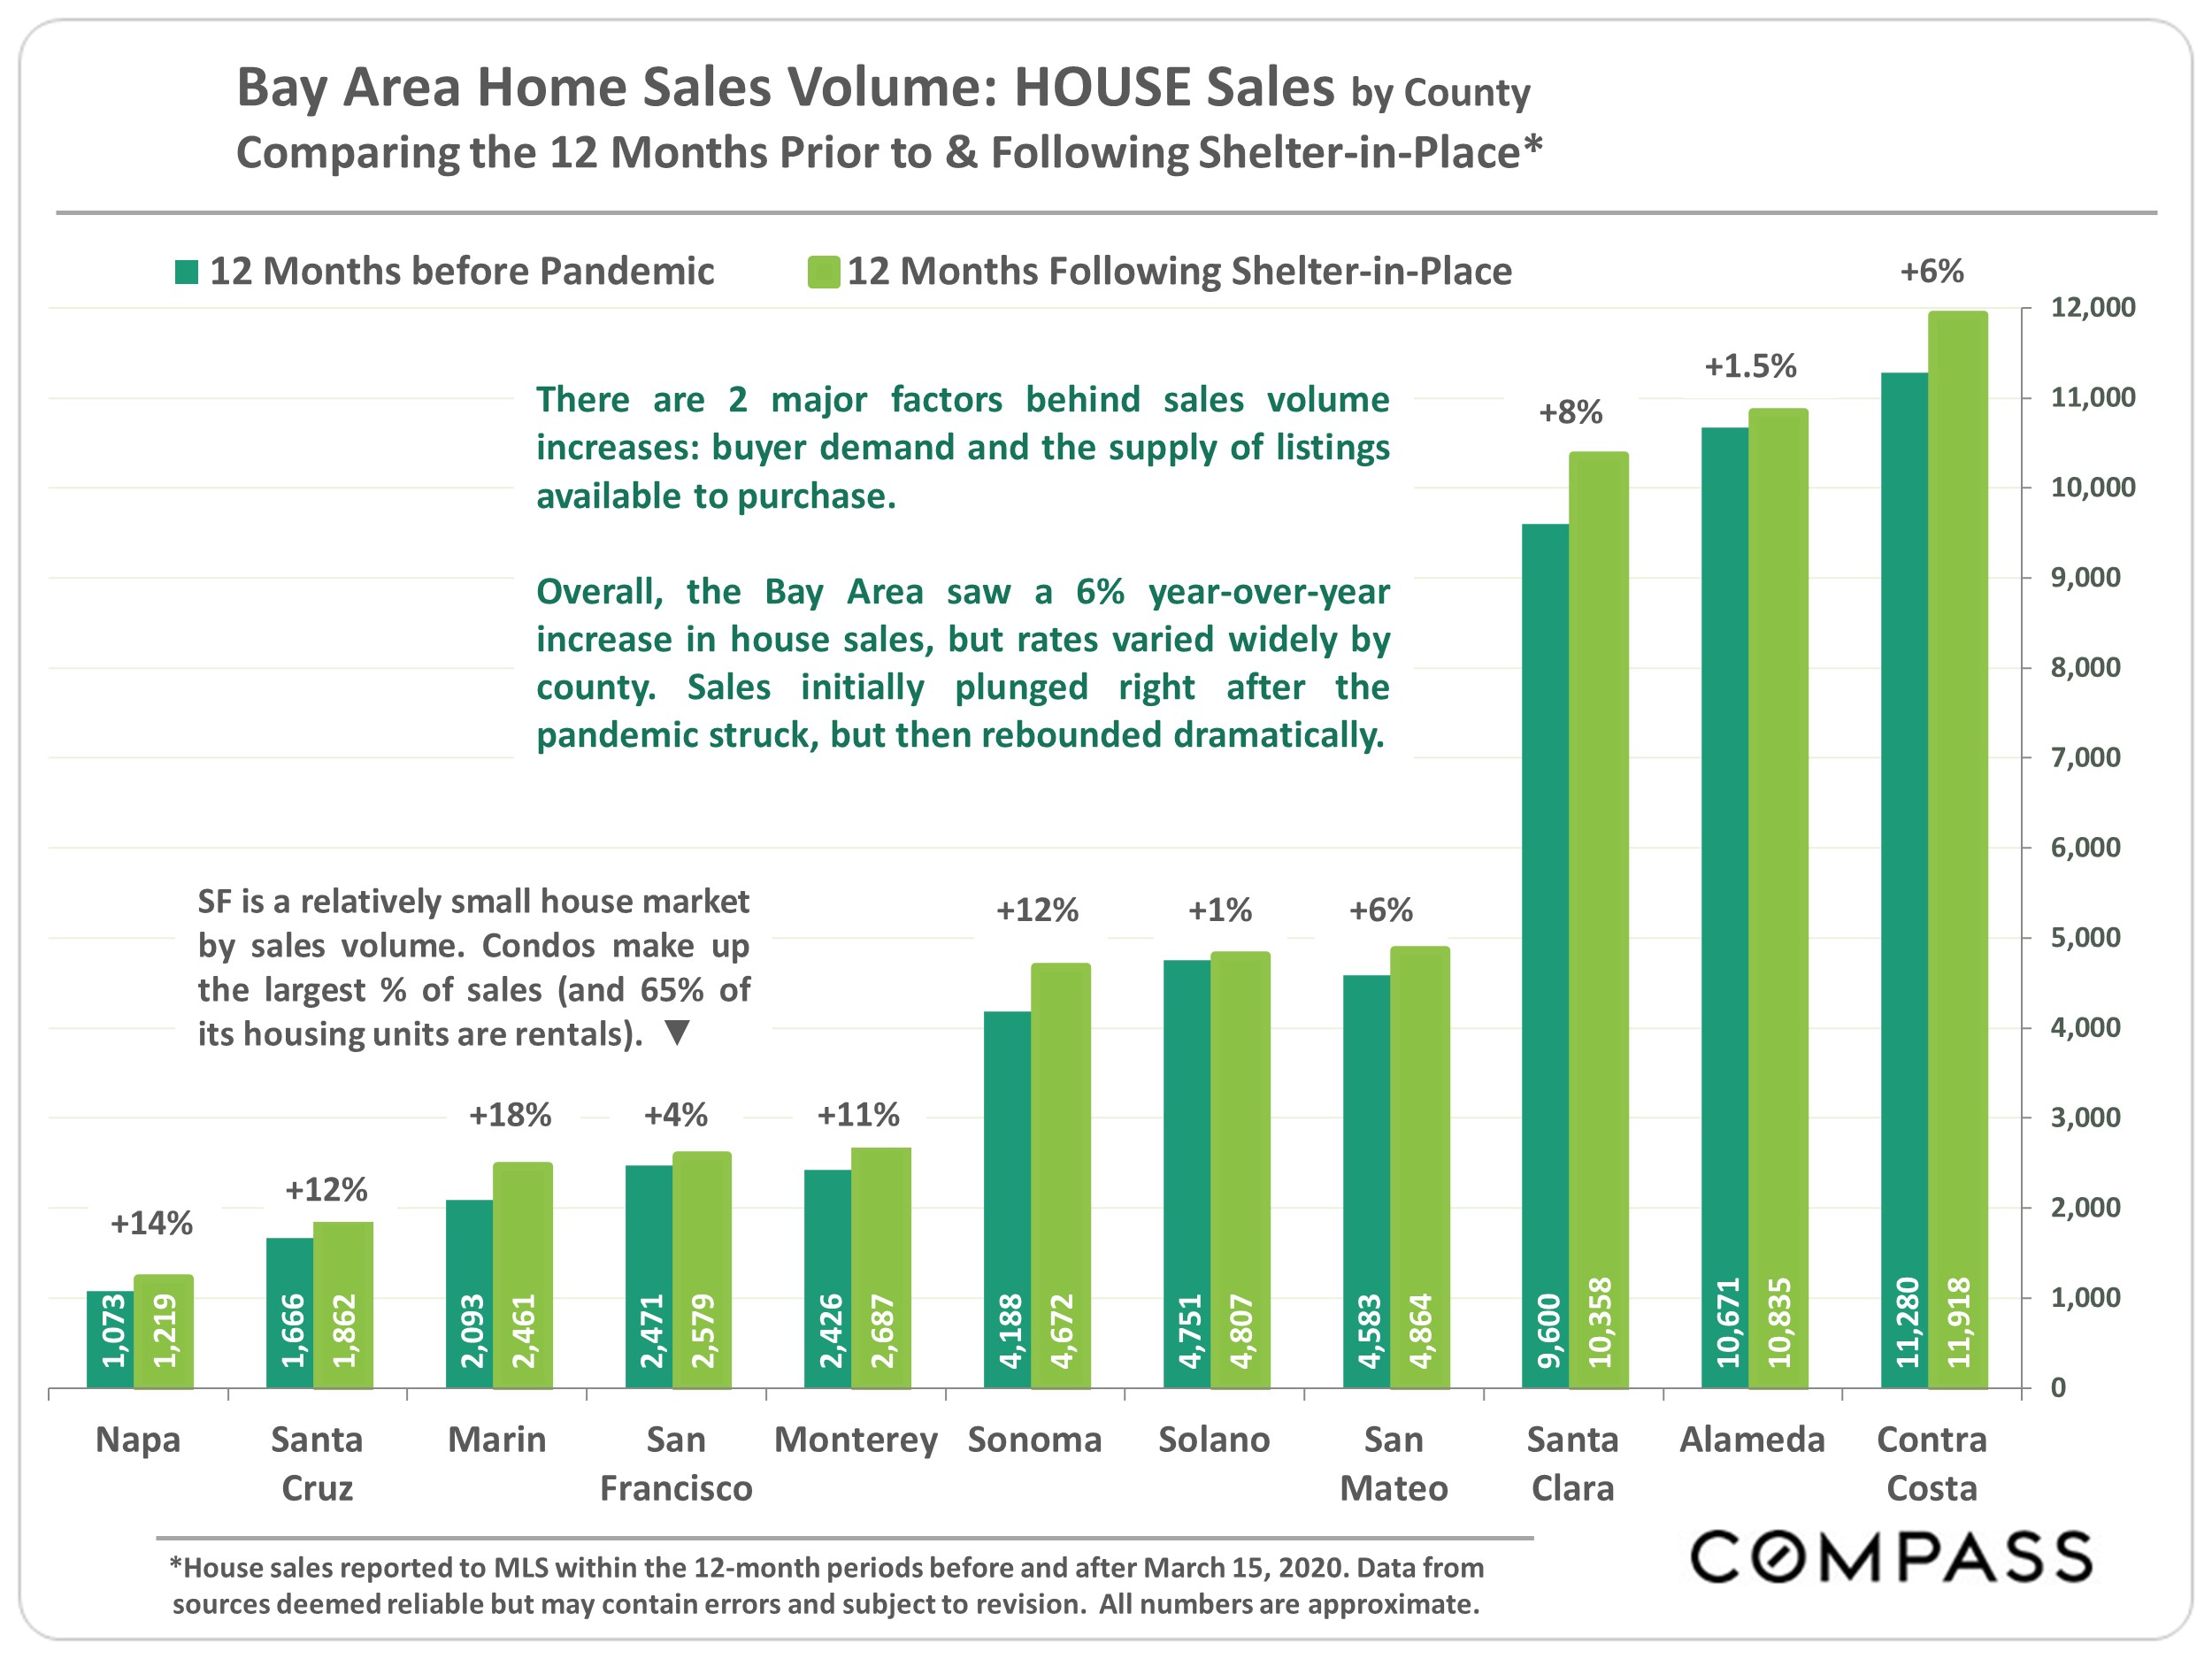
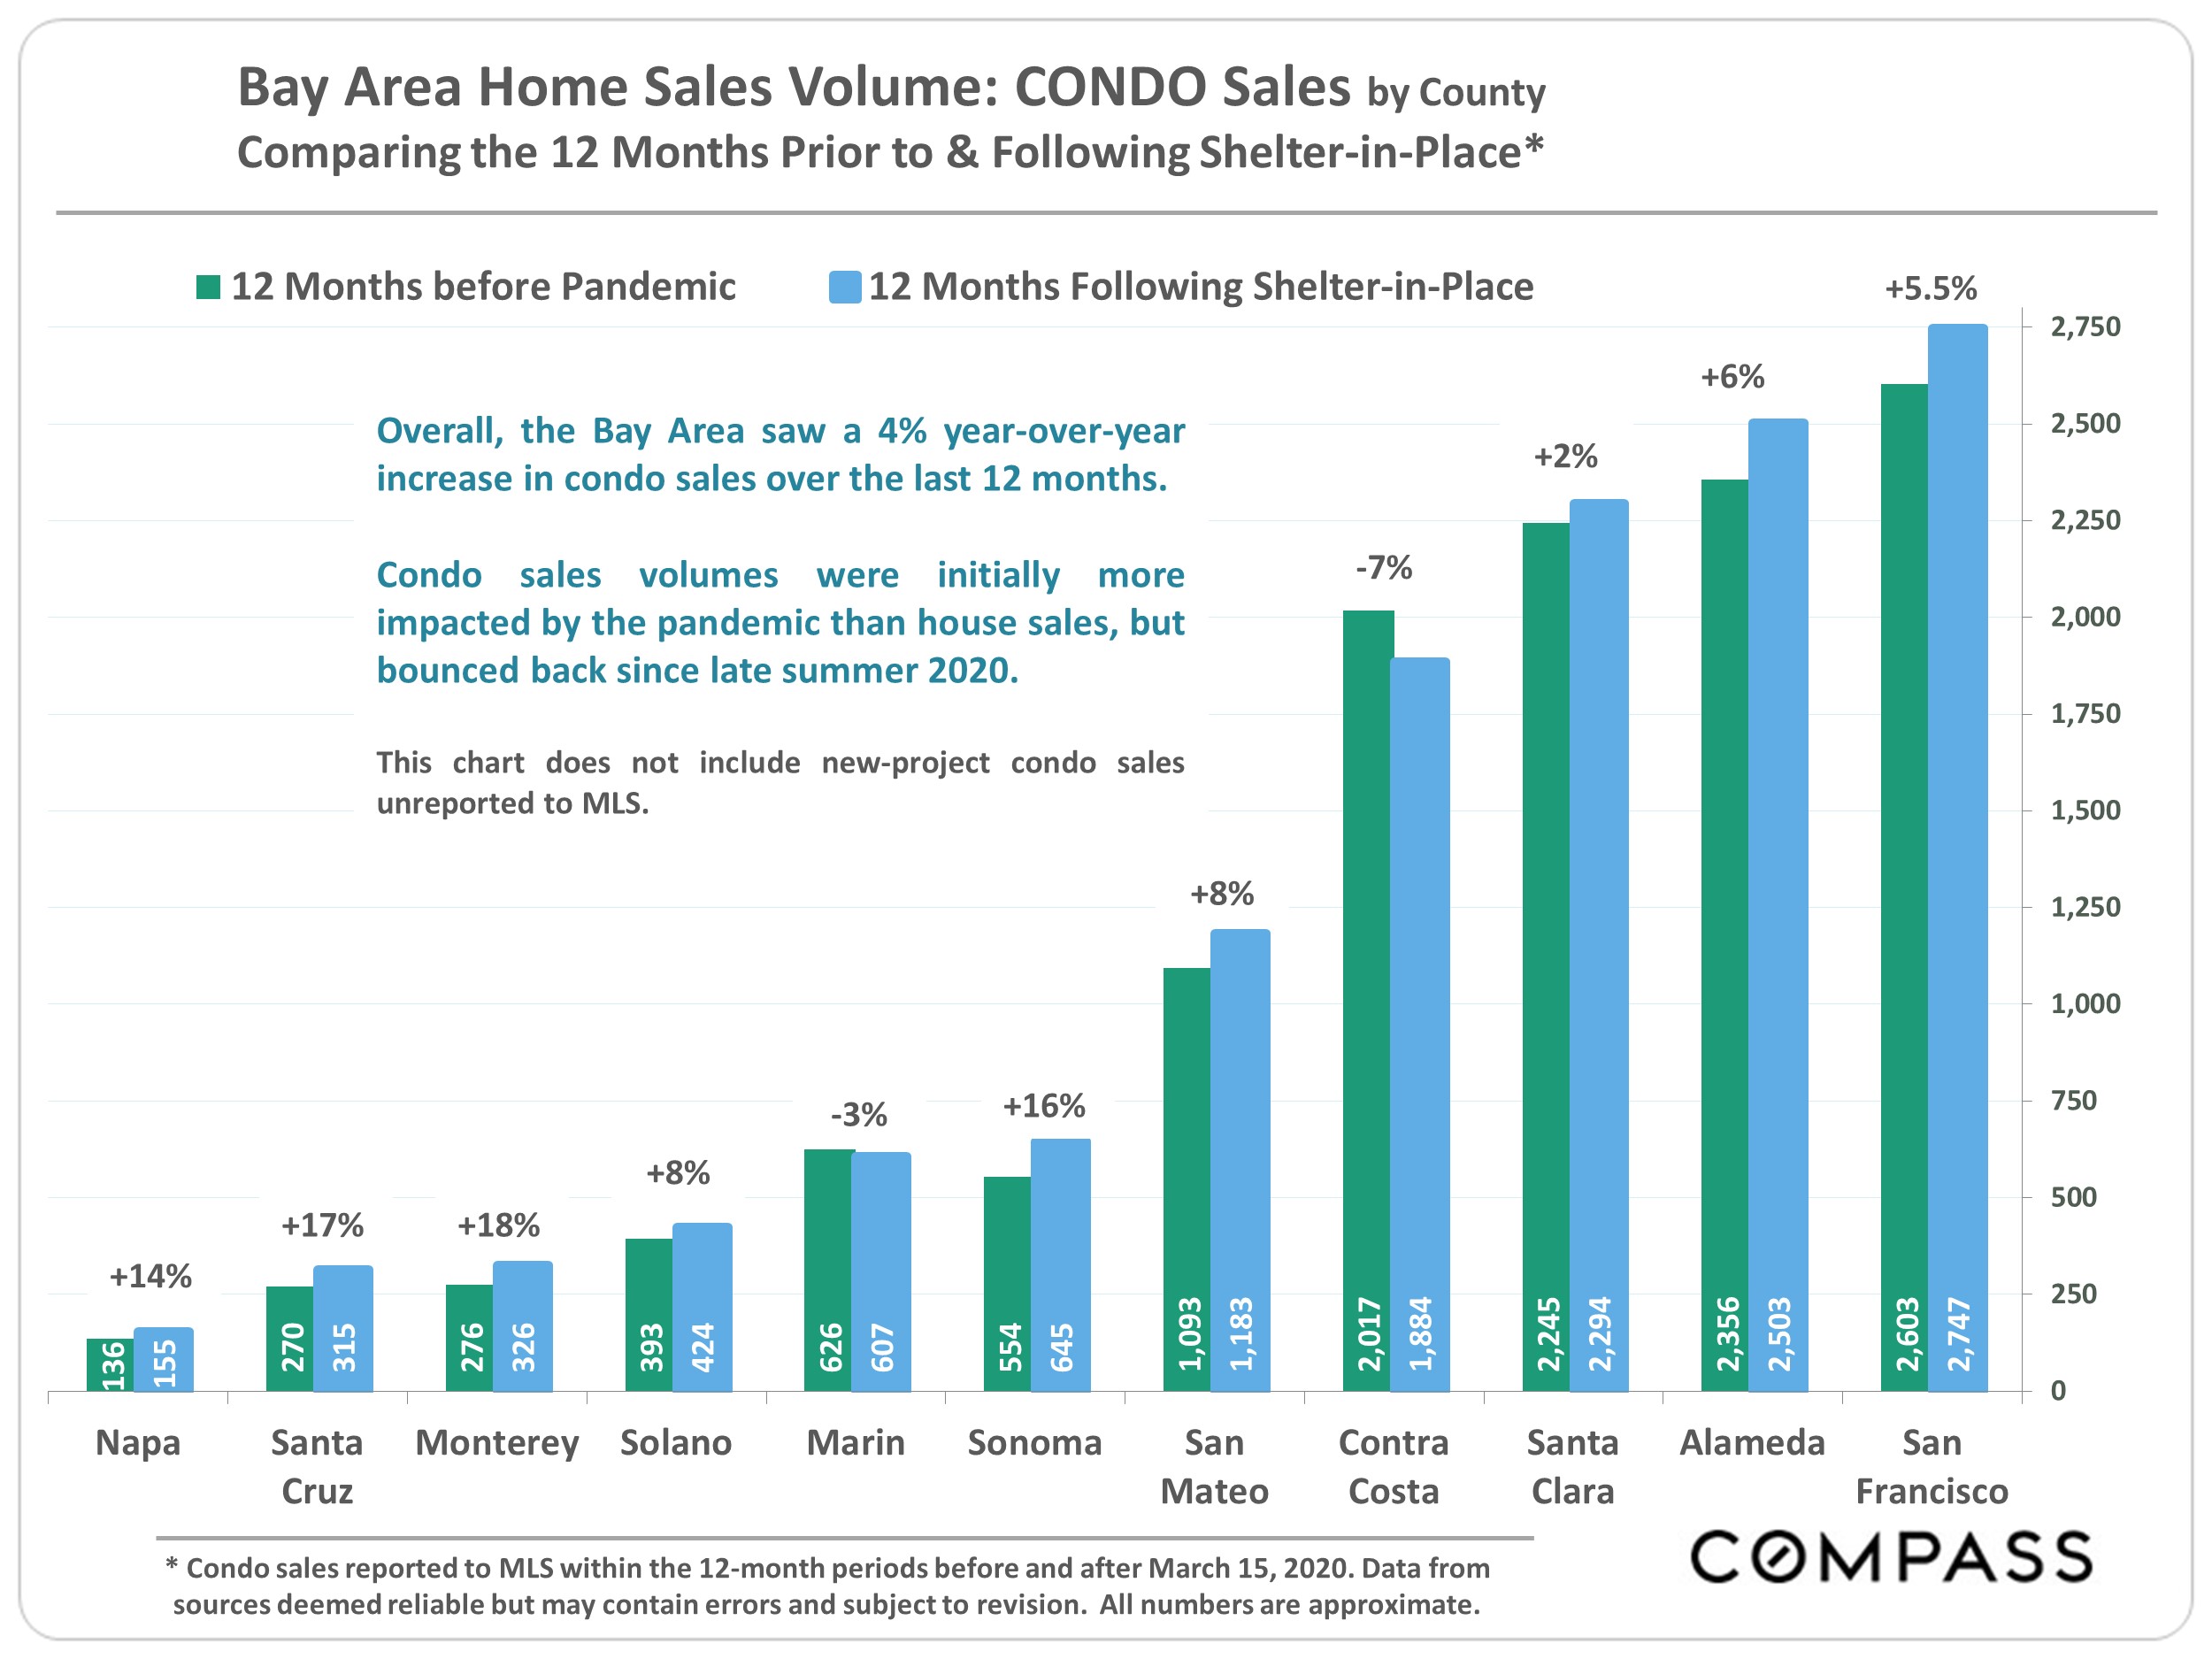
With the recovery from the initial April-May 2020 crash in activity, home sales of all prices and property types increased 6% in the 12 months since March 15, 2020.
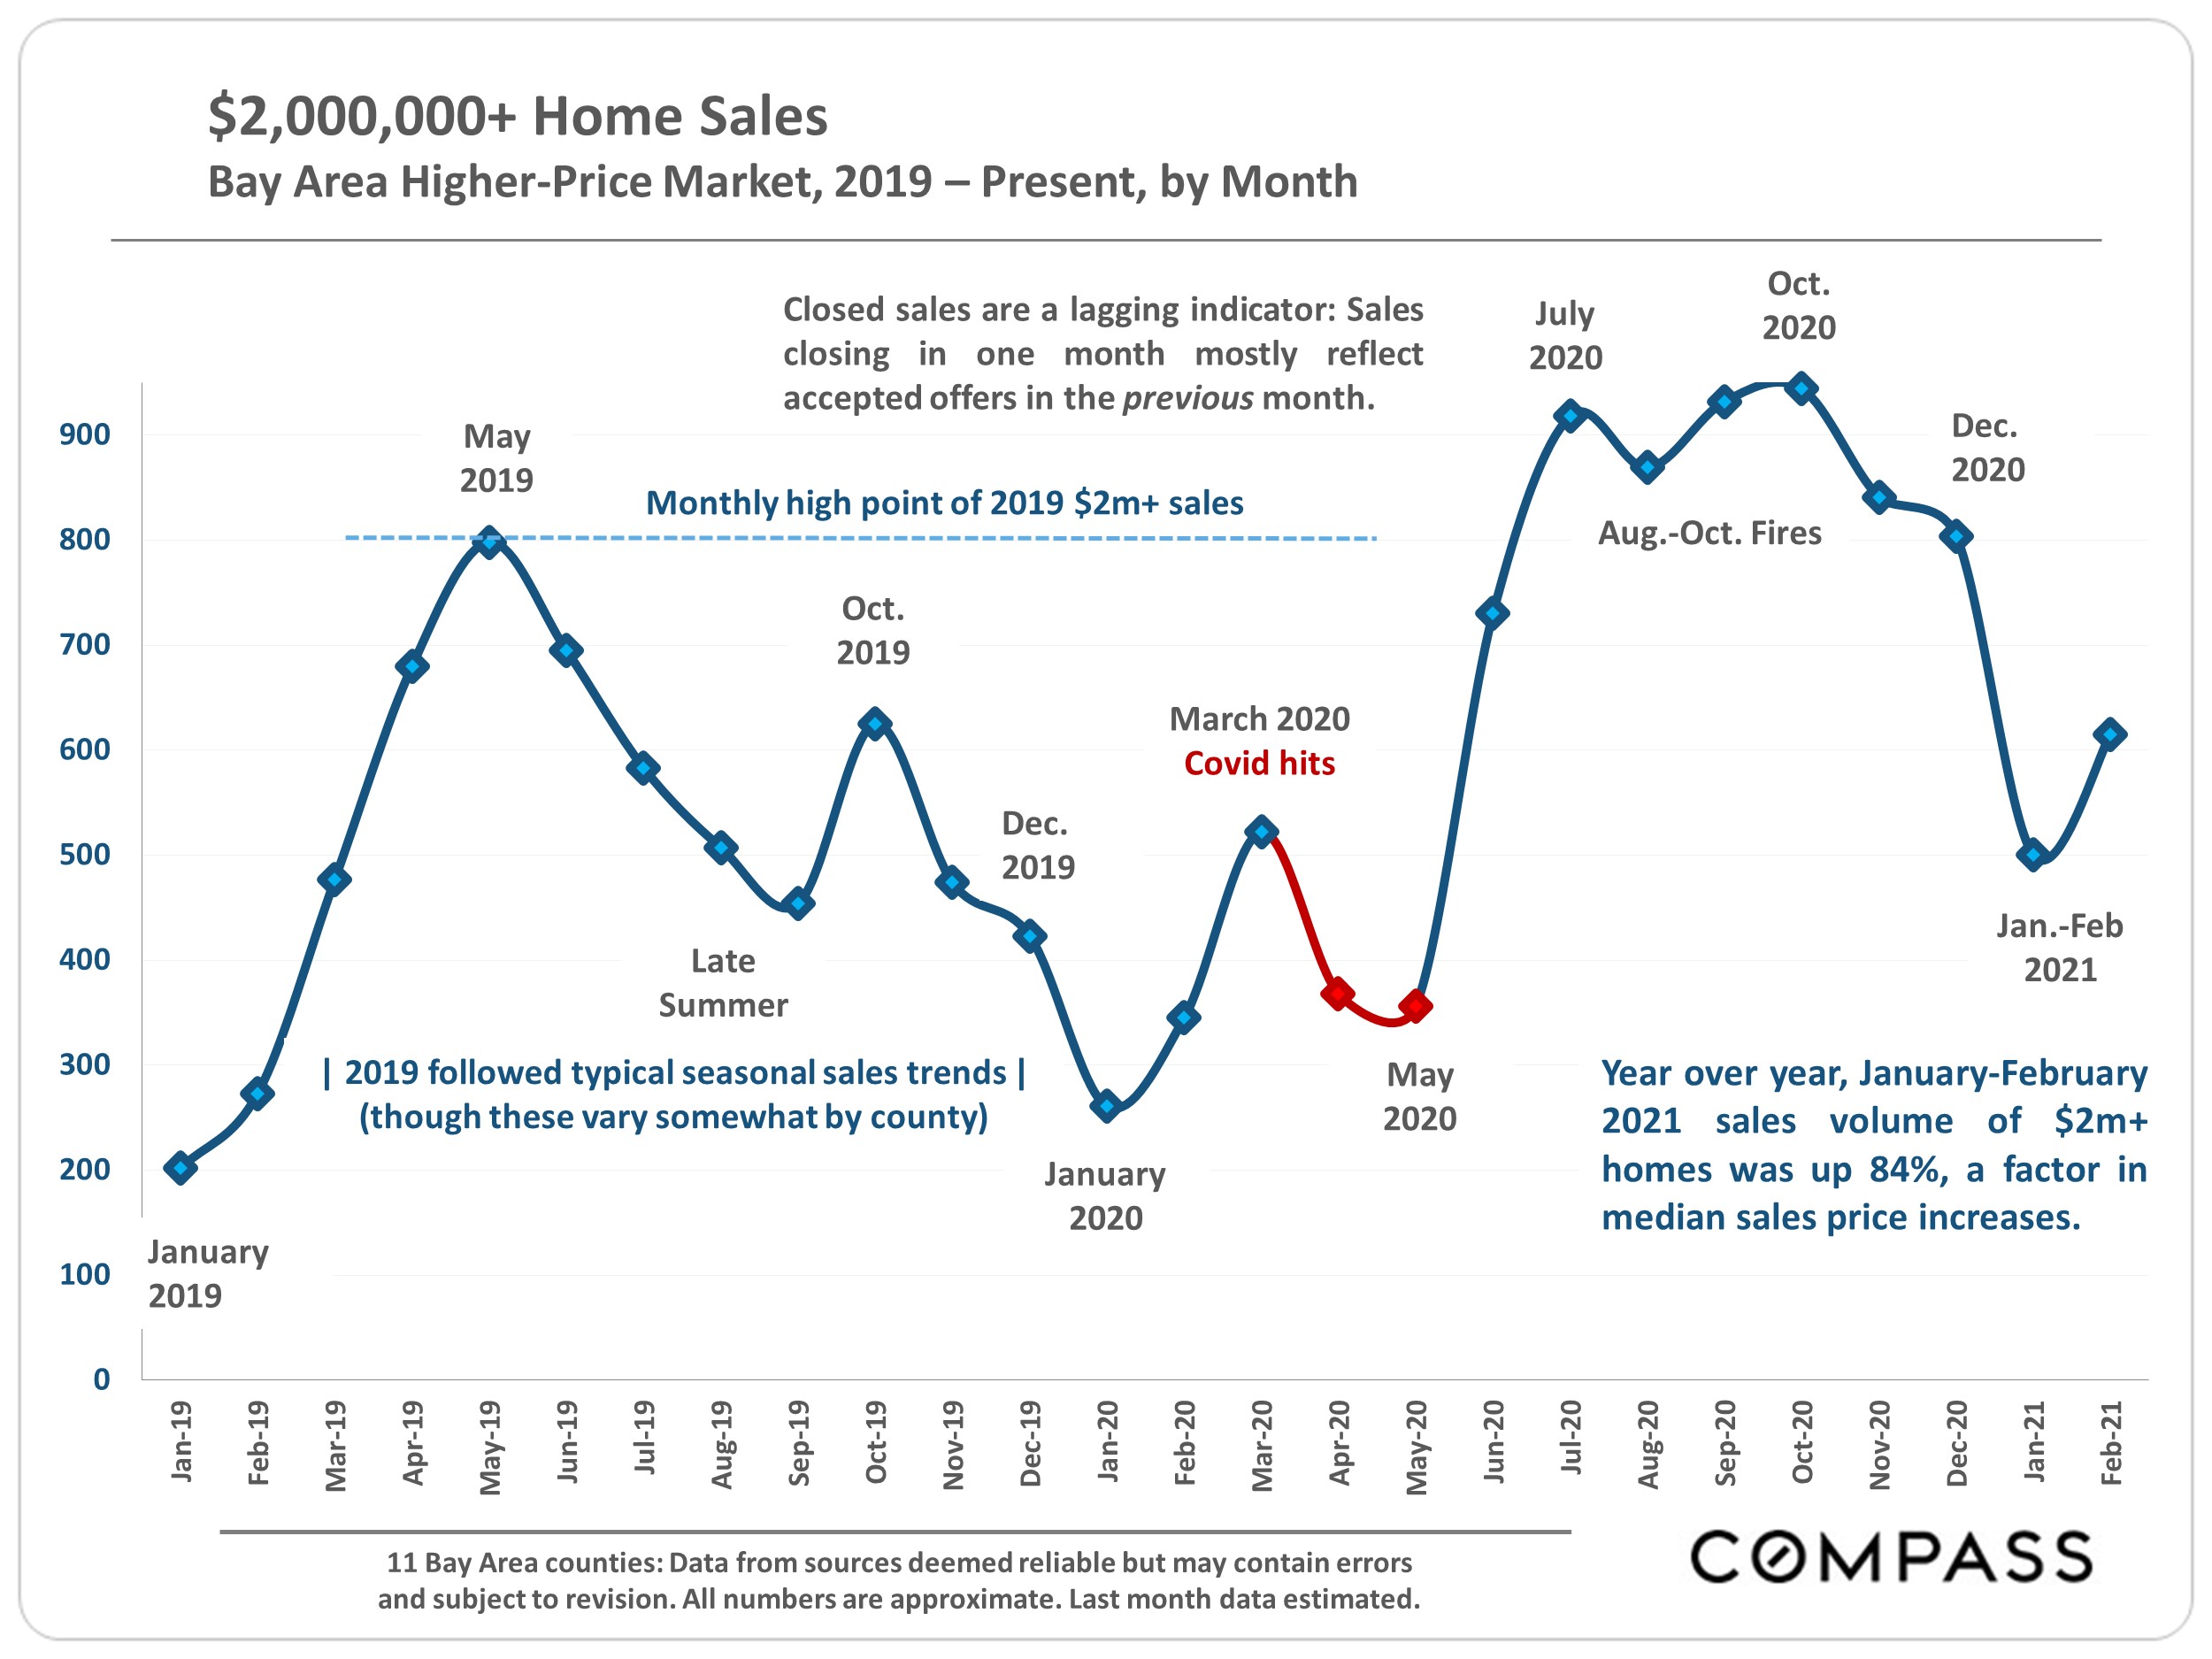
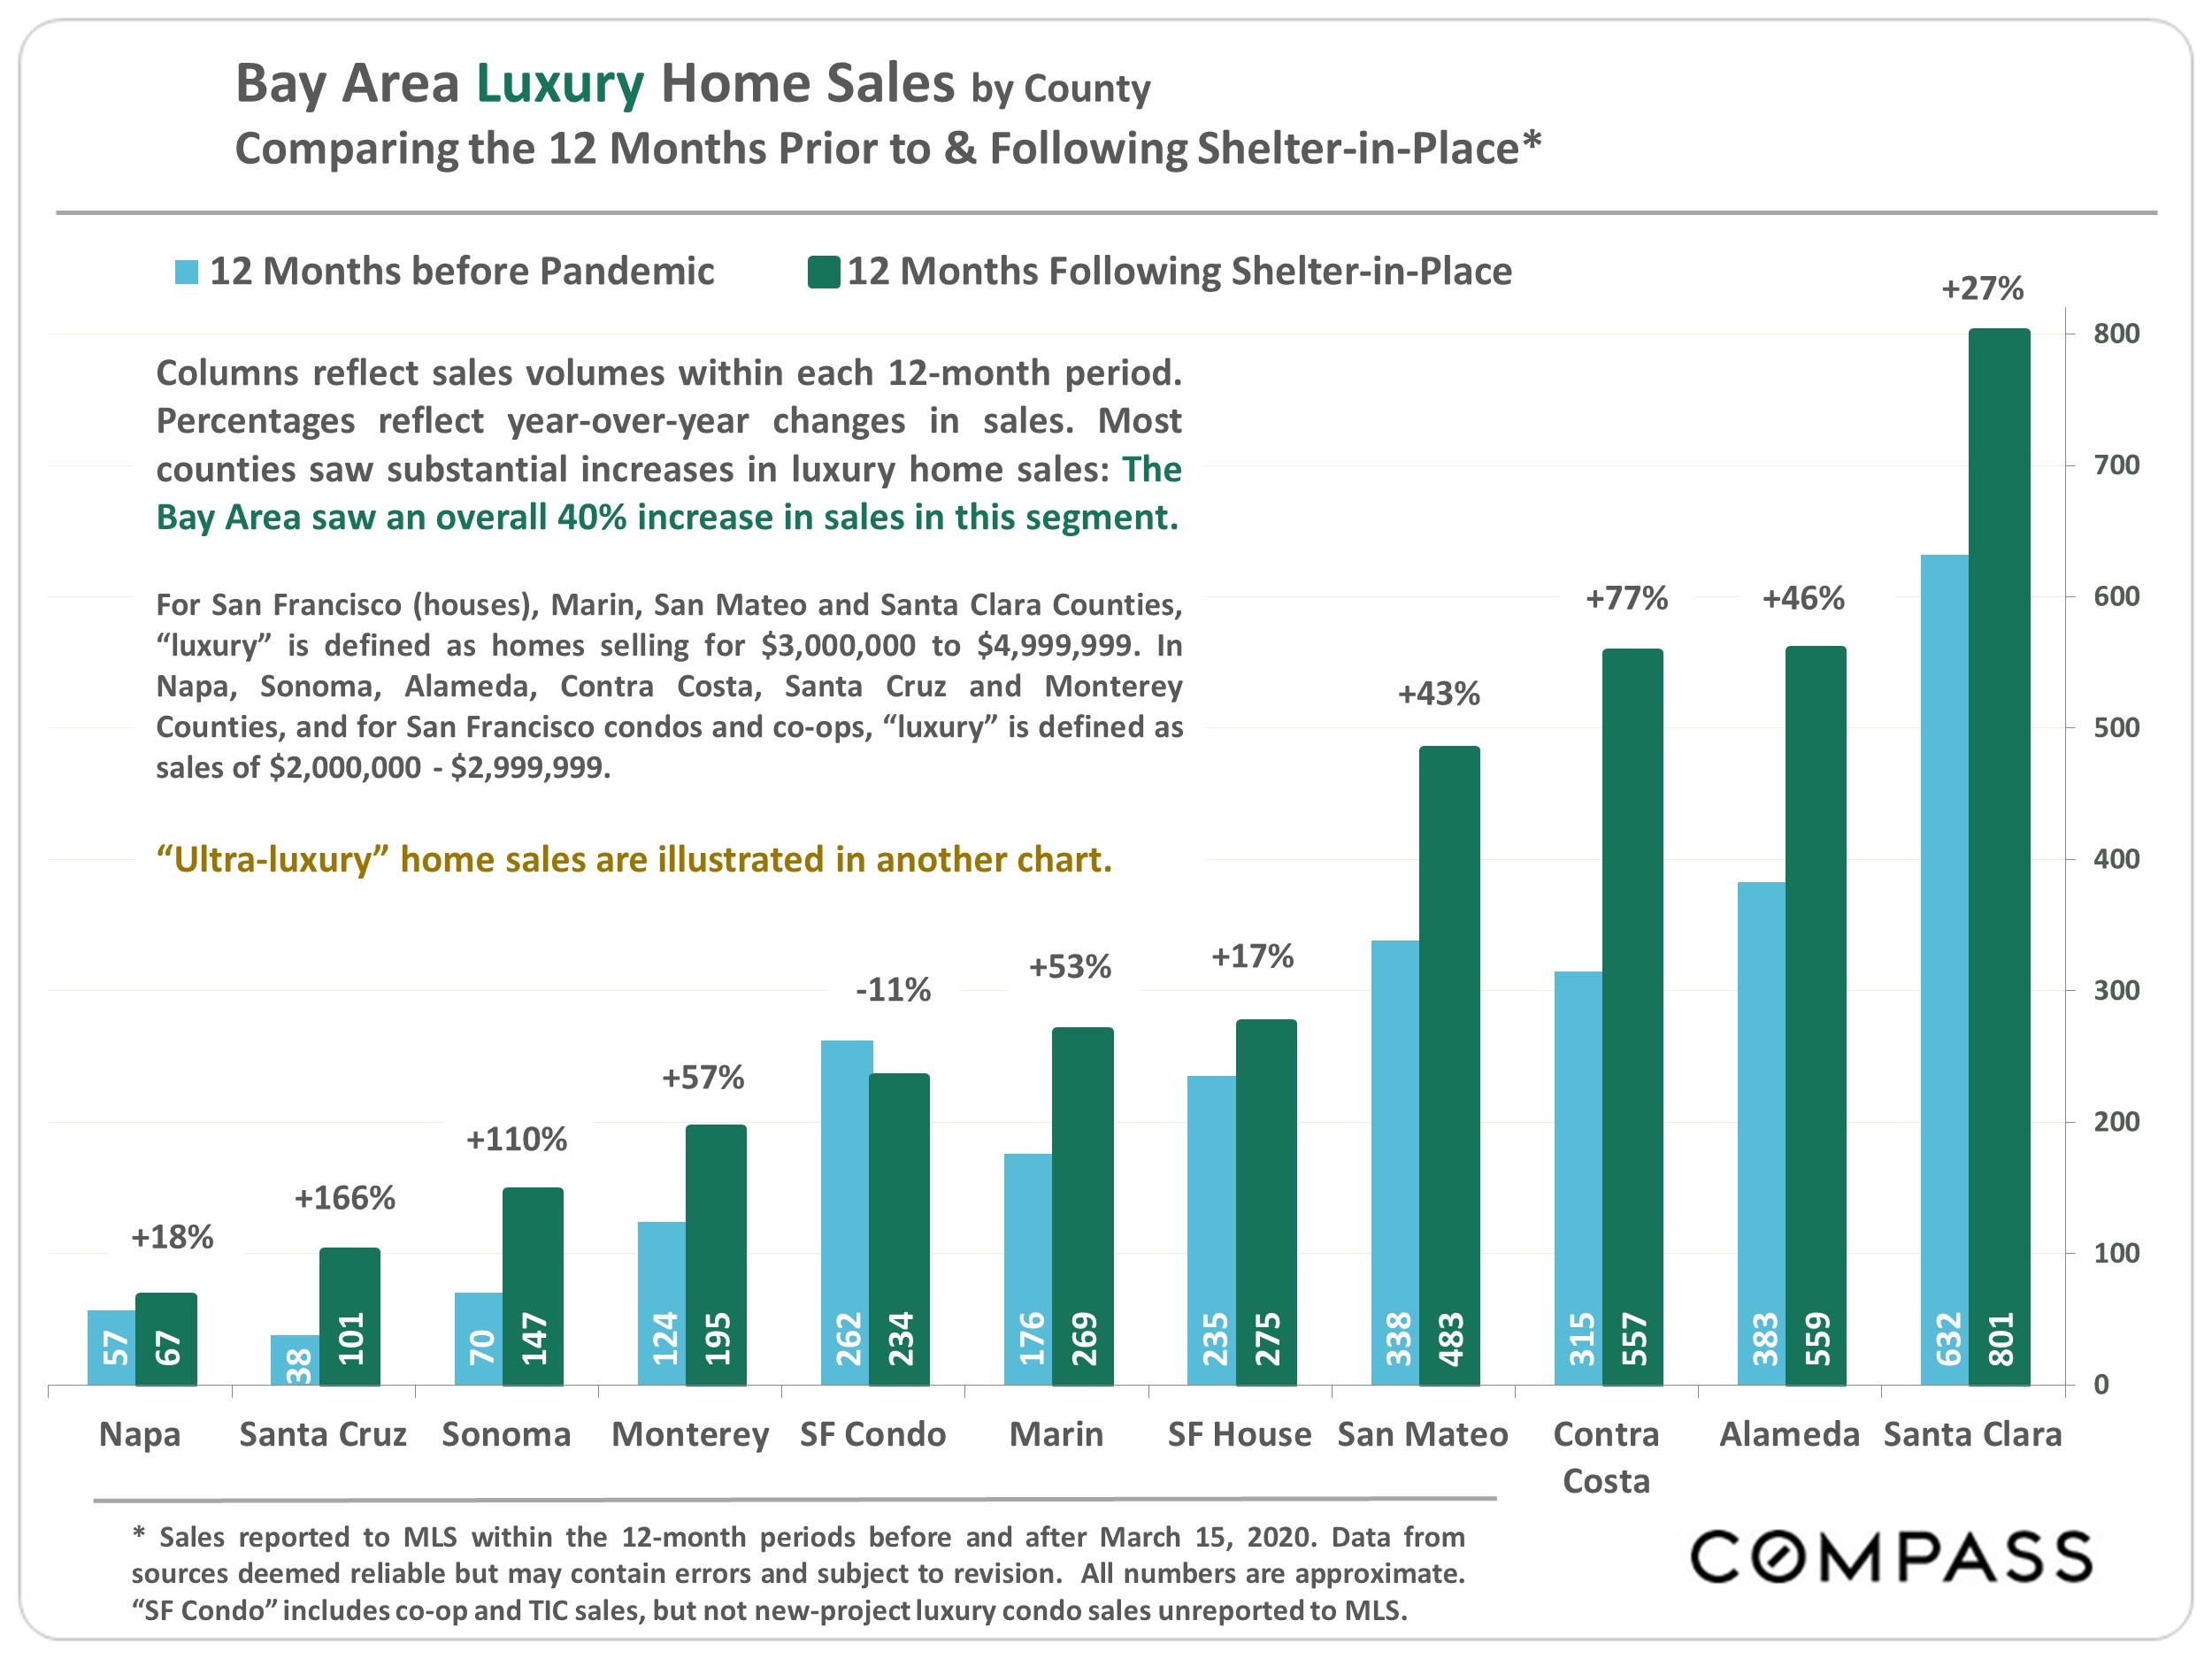
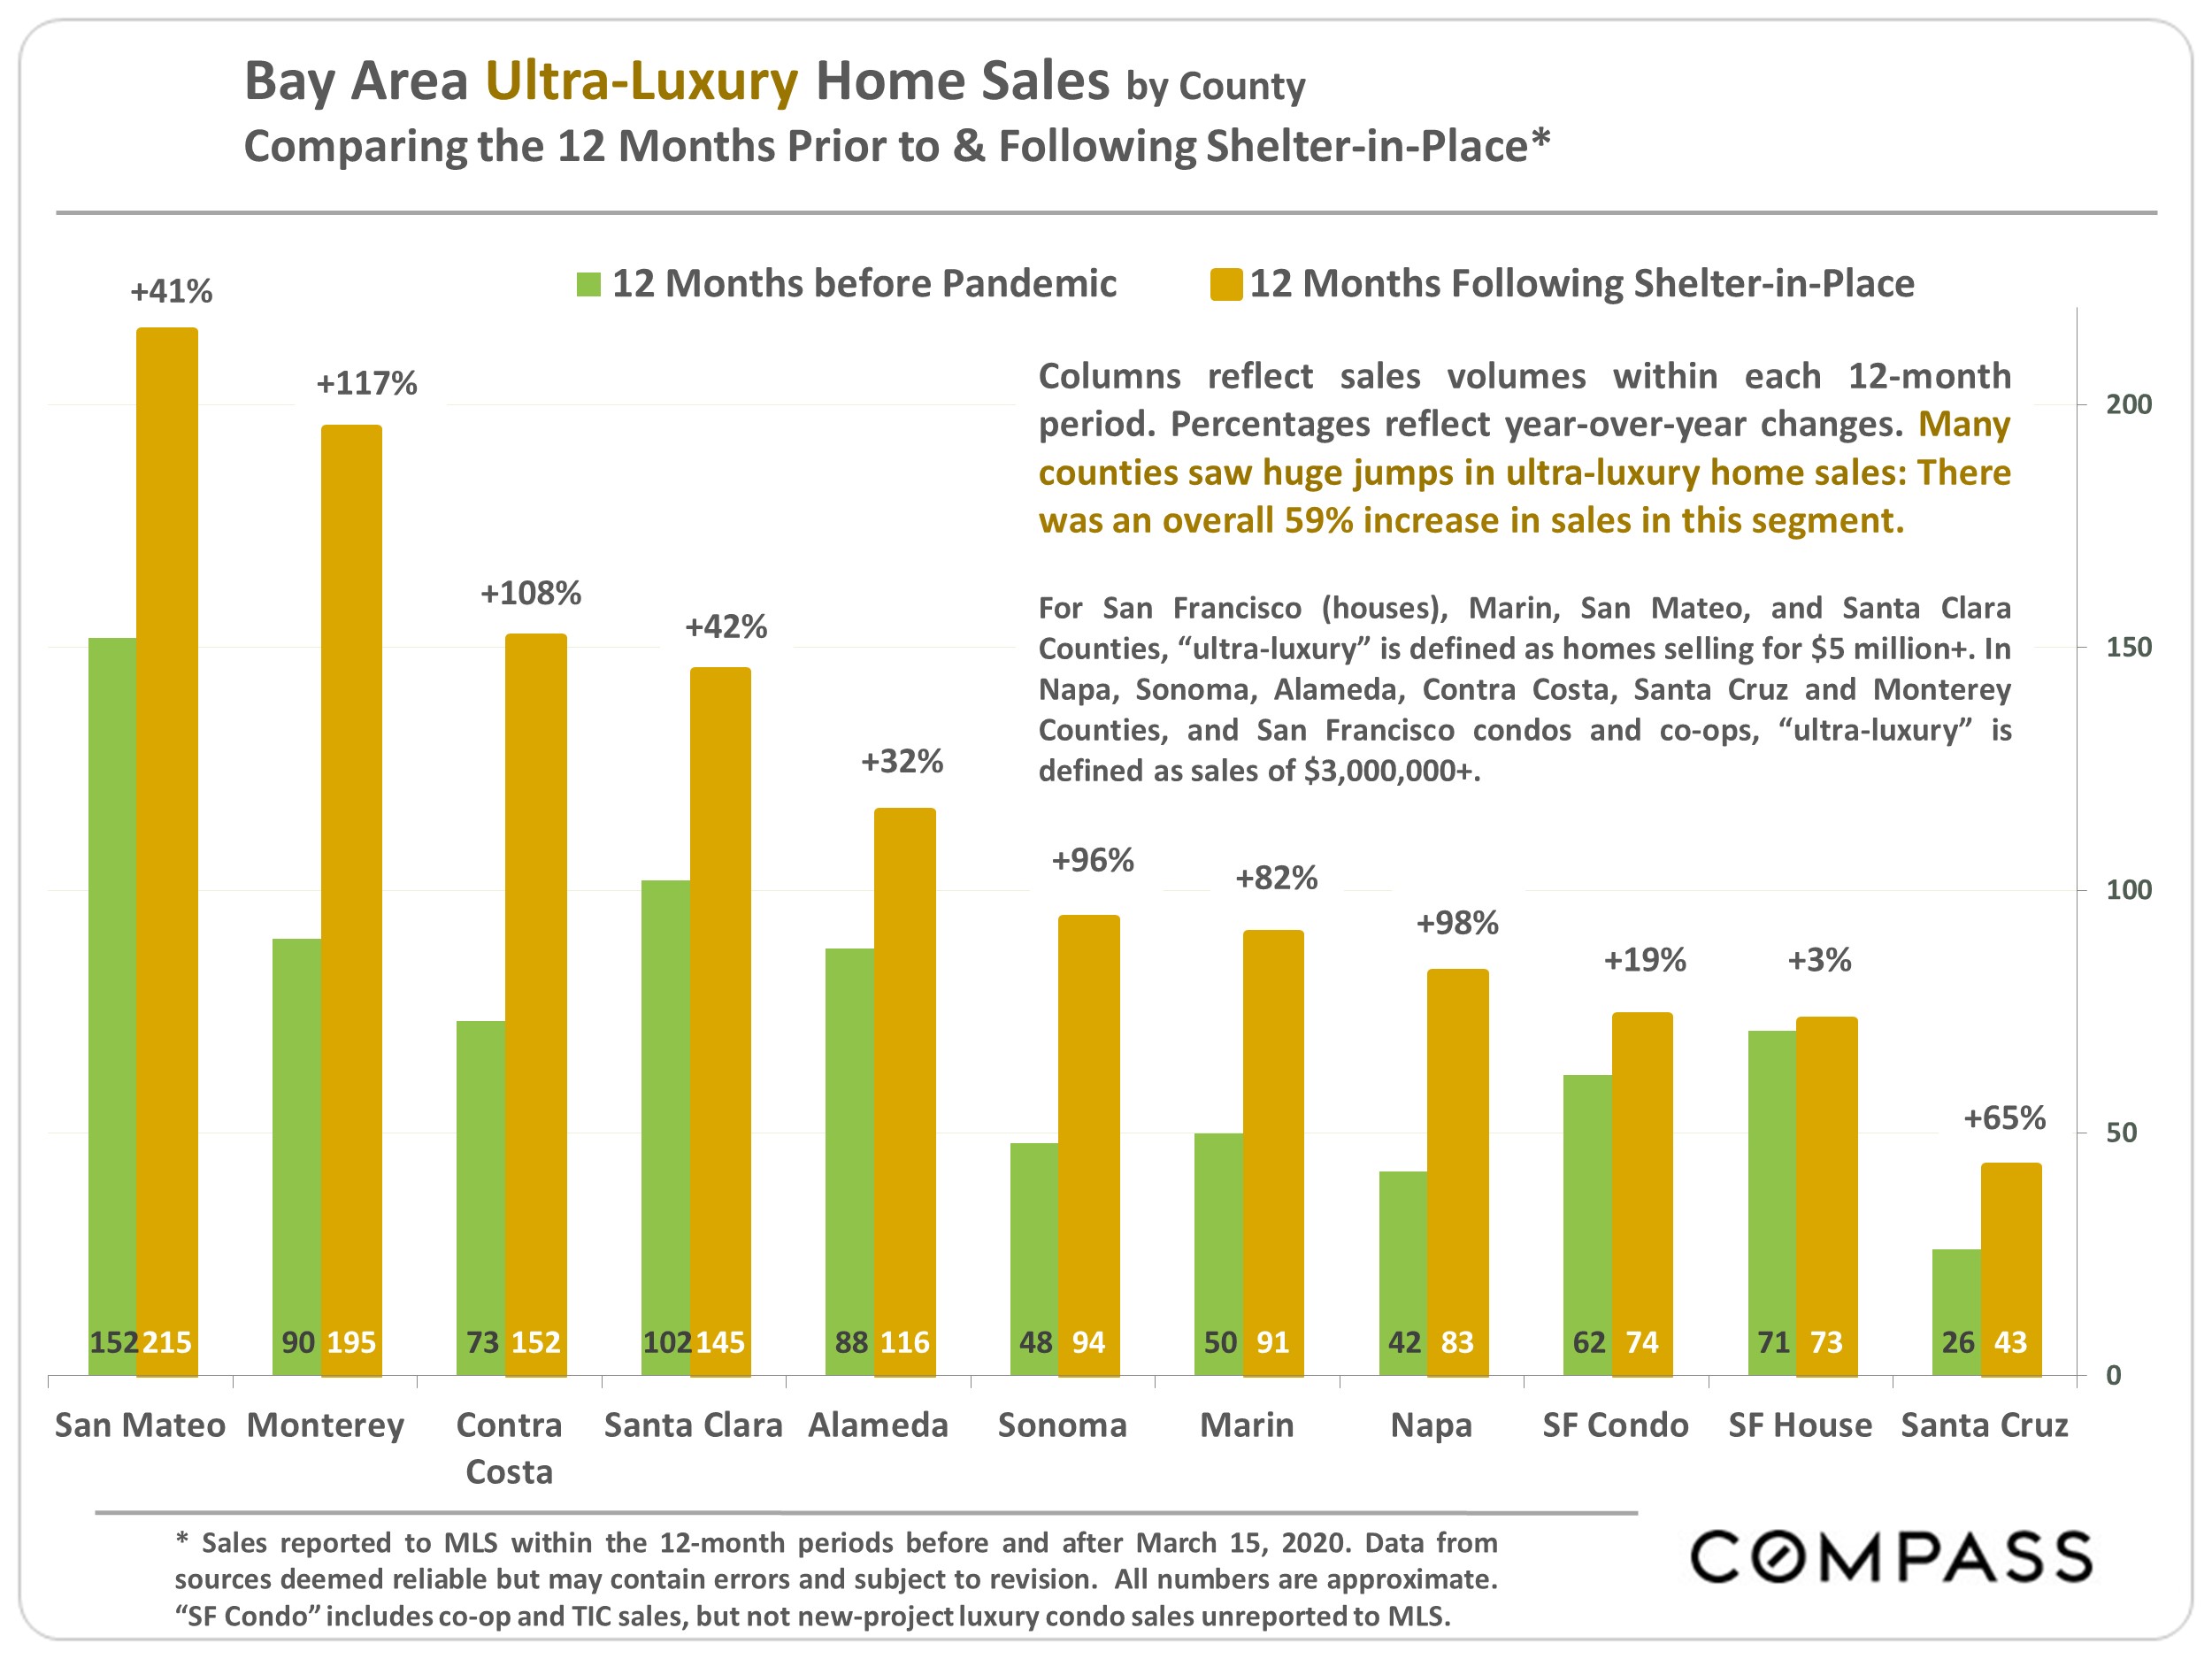
Since shelter-in-place was first introduced, luxury home sales were up 40% year-over-year and ultra-luxury home sales were up 59%. (Price thresholds for these categories are explained within the report.)
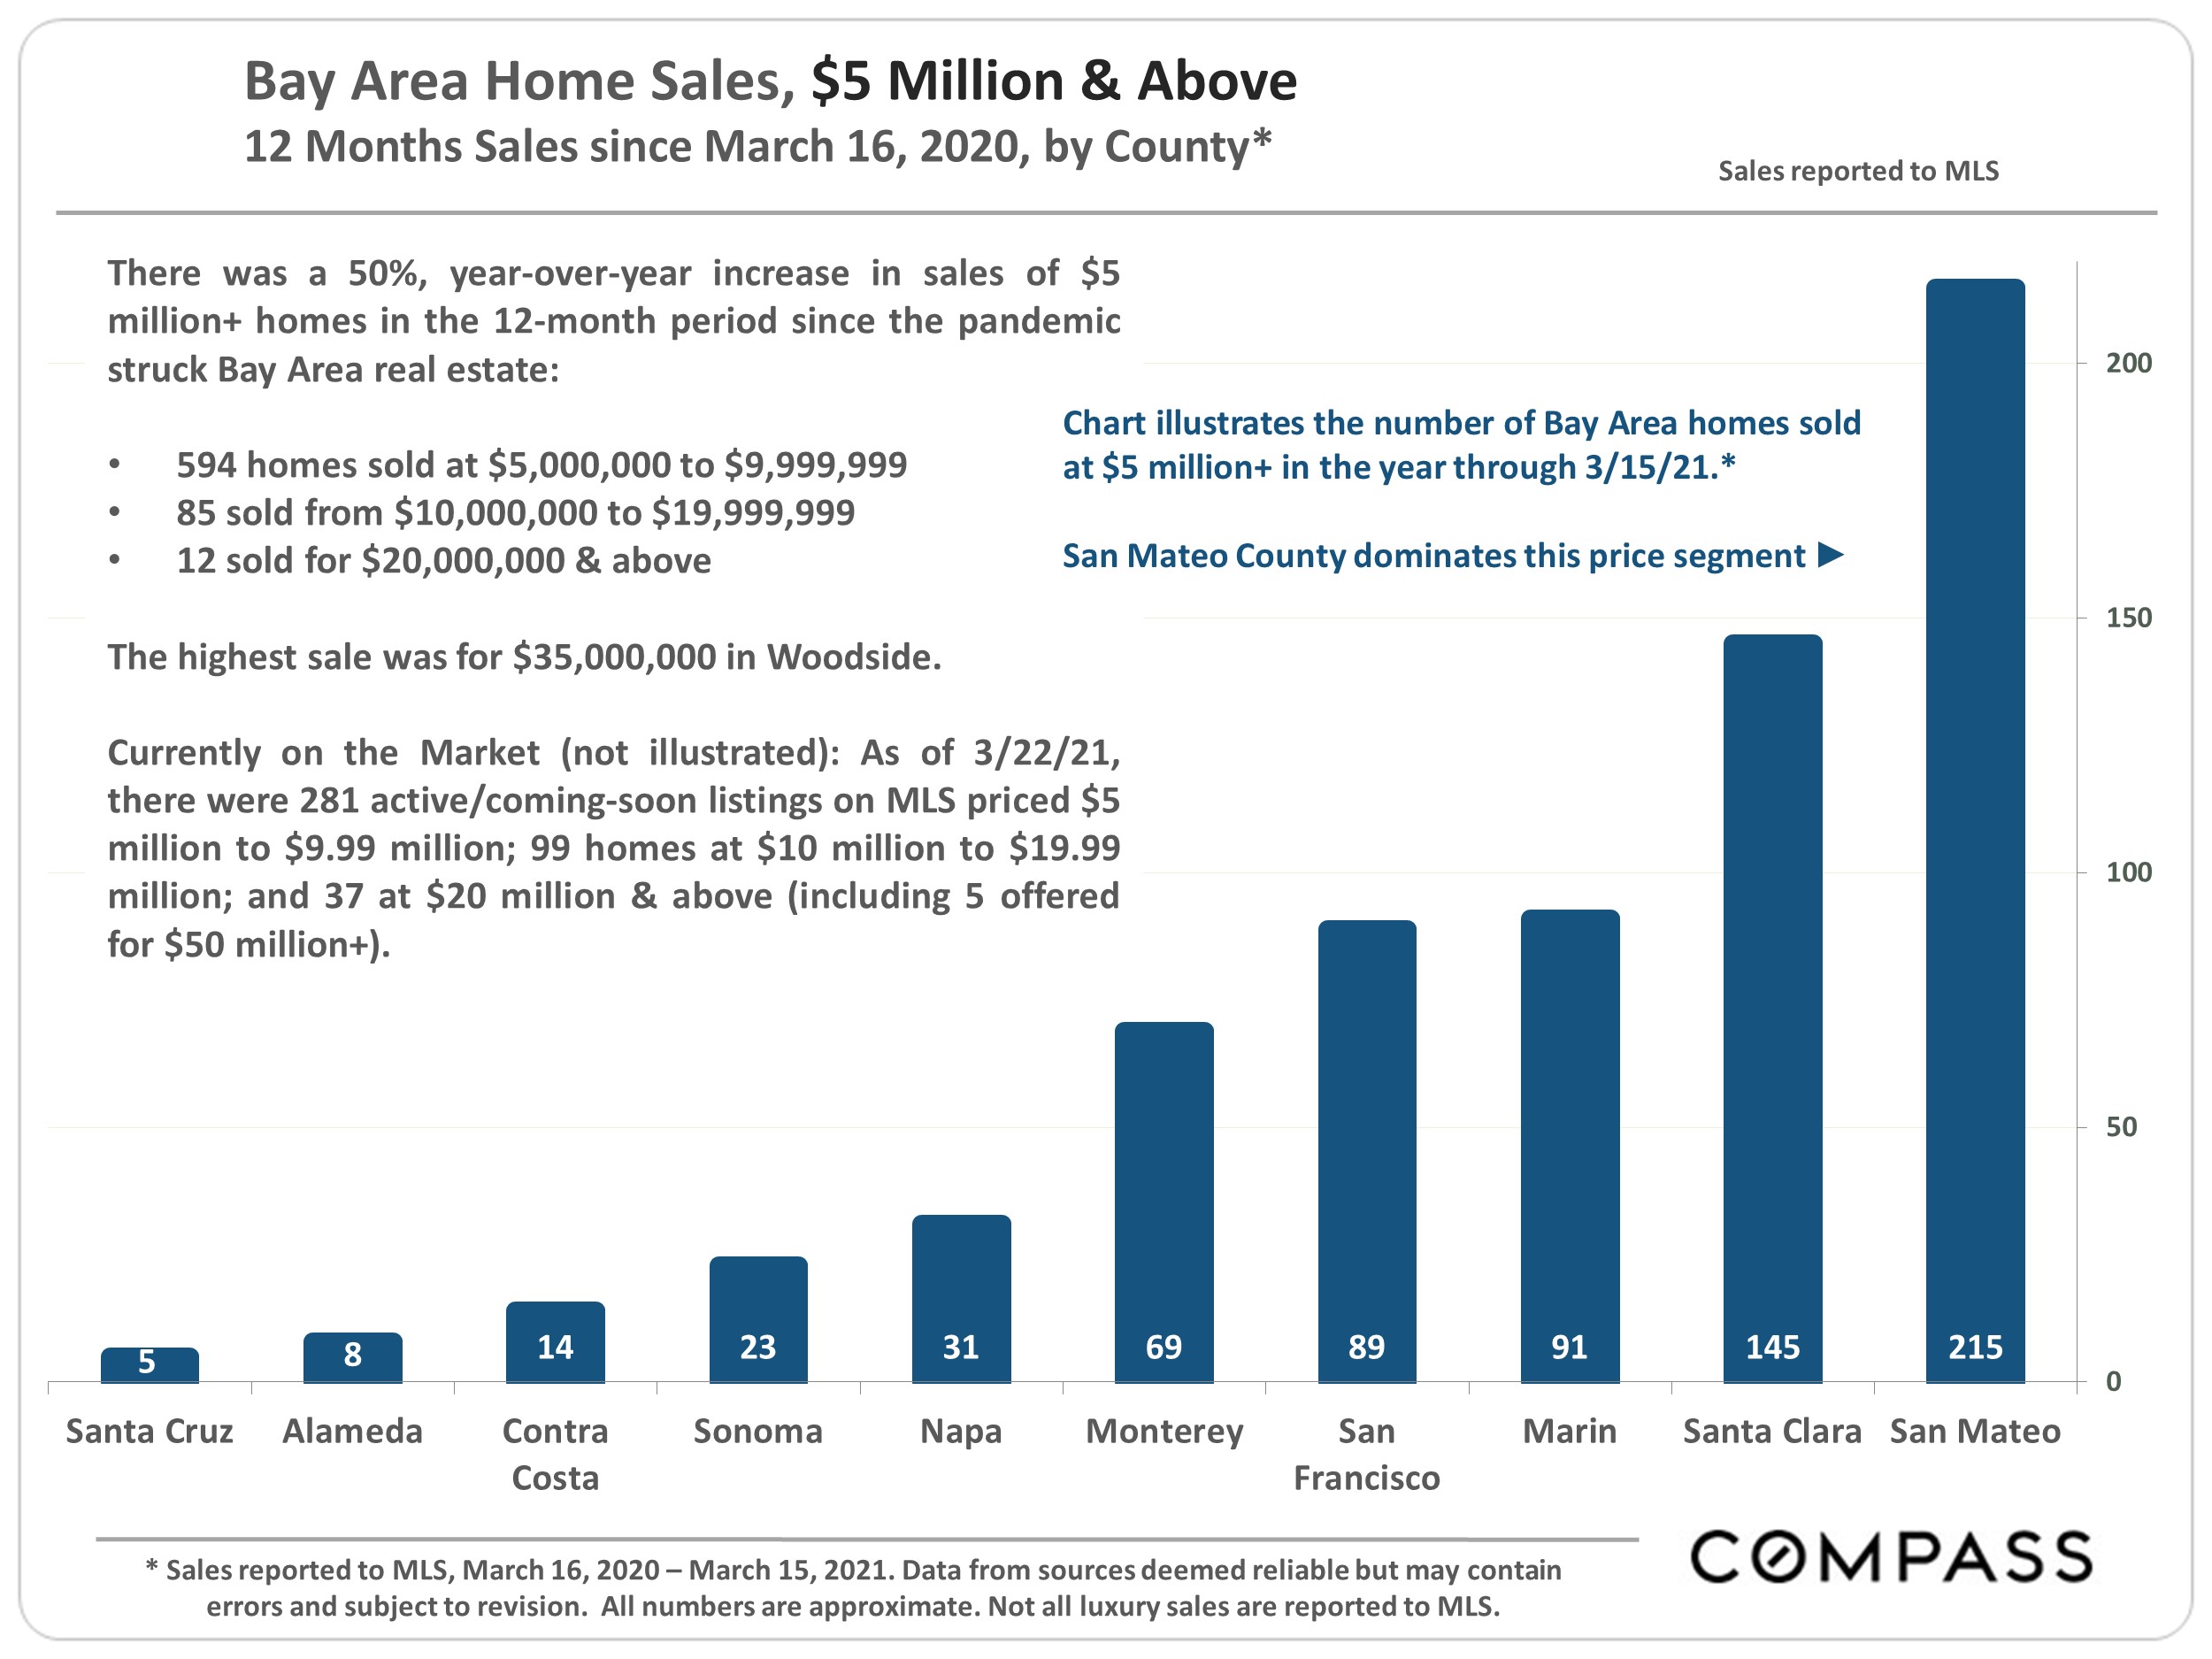
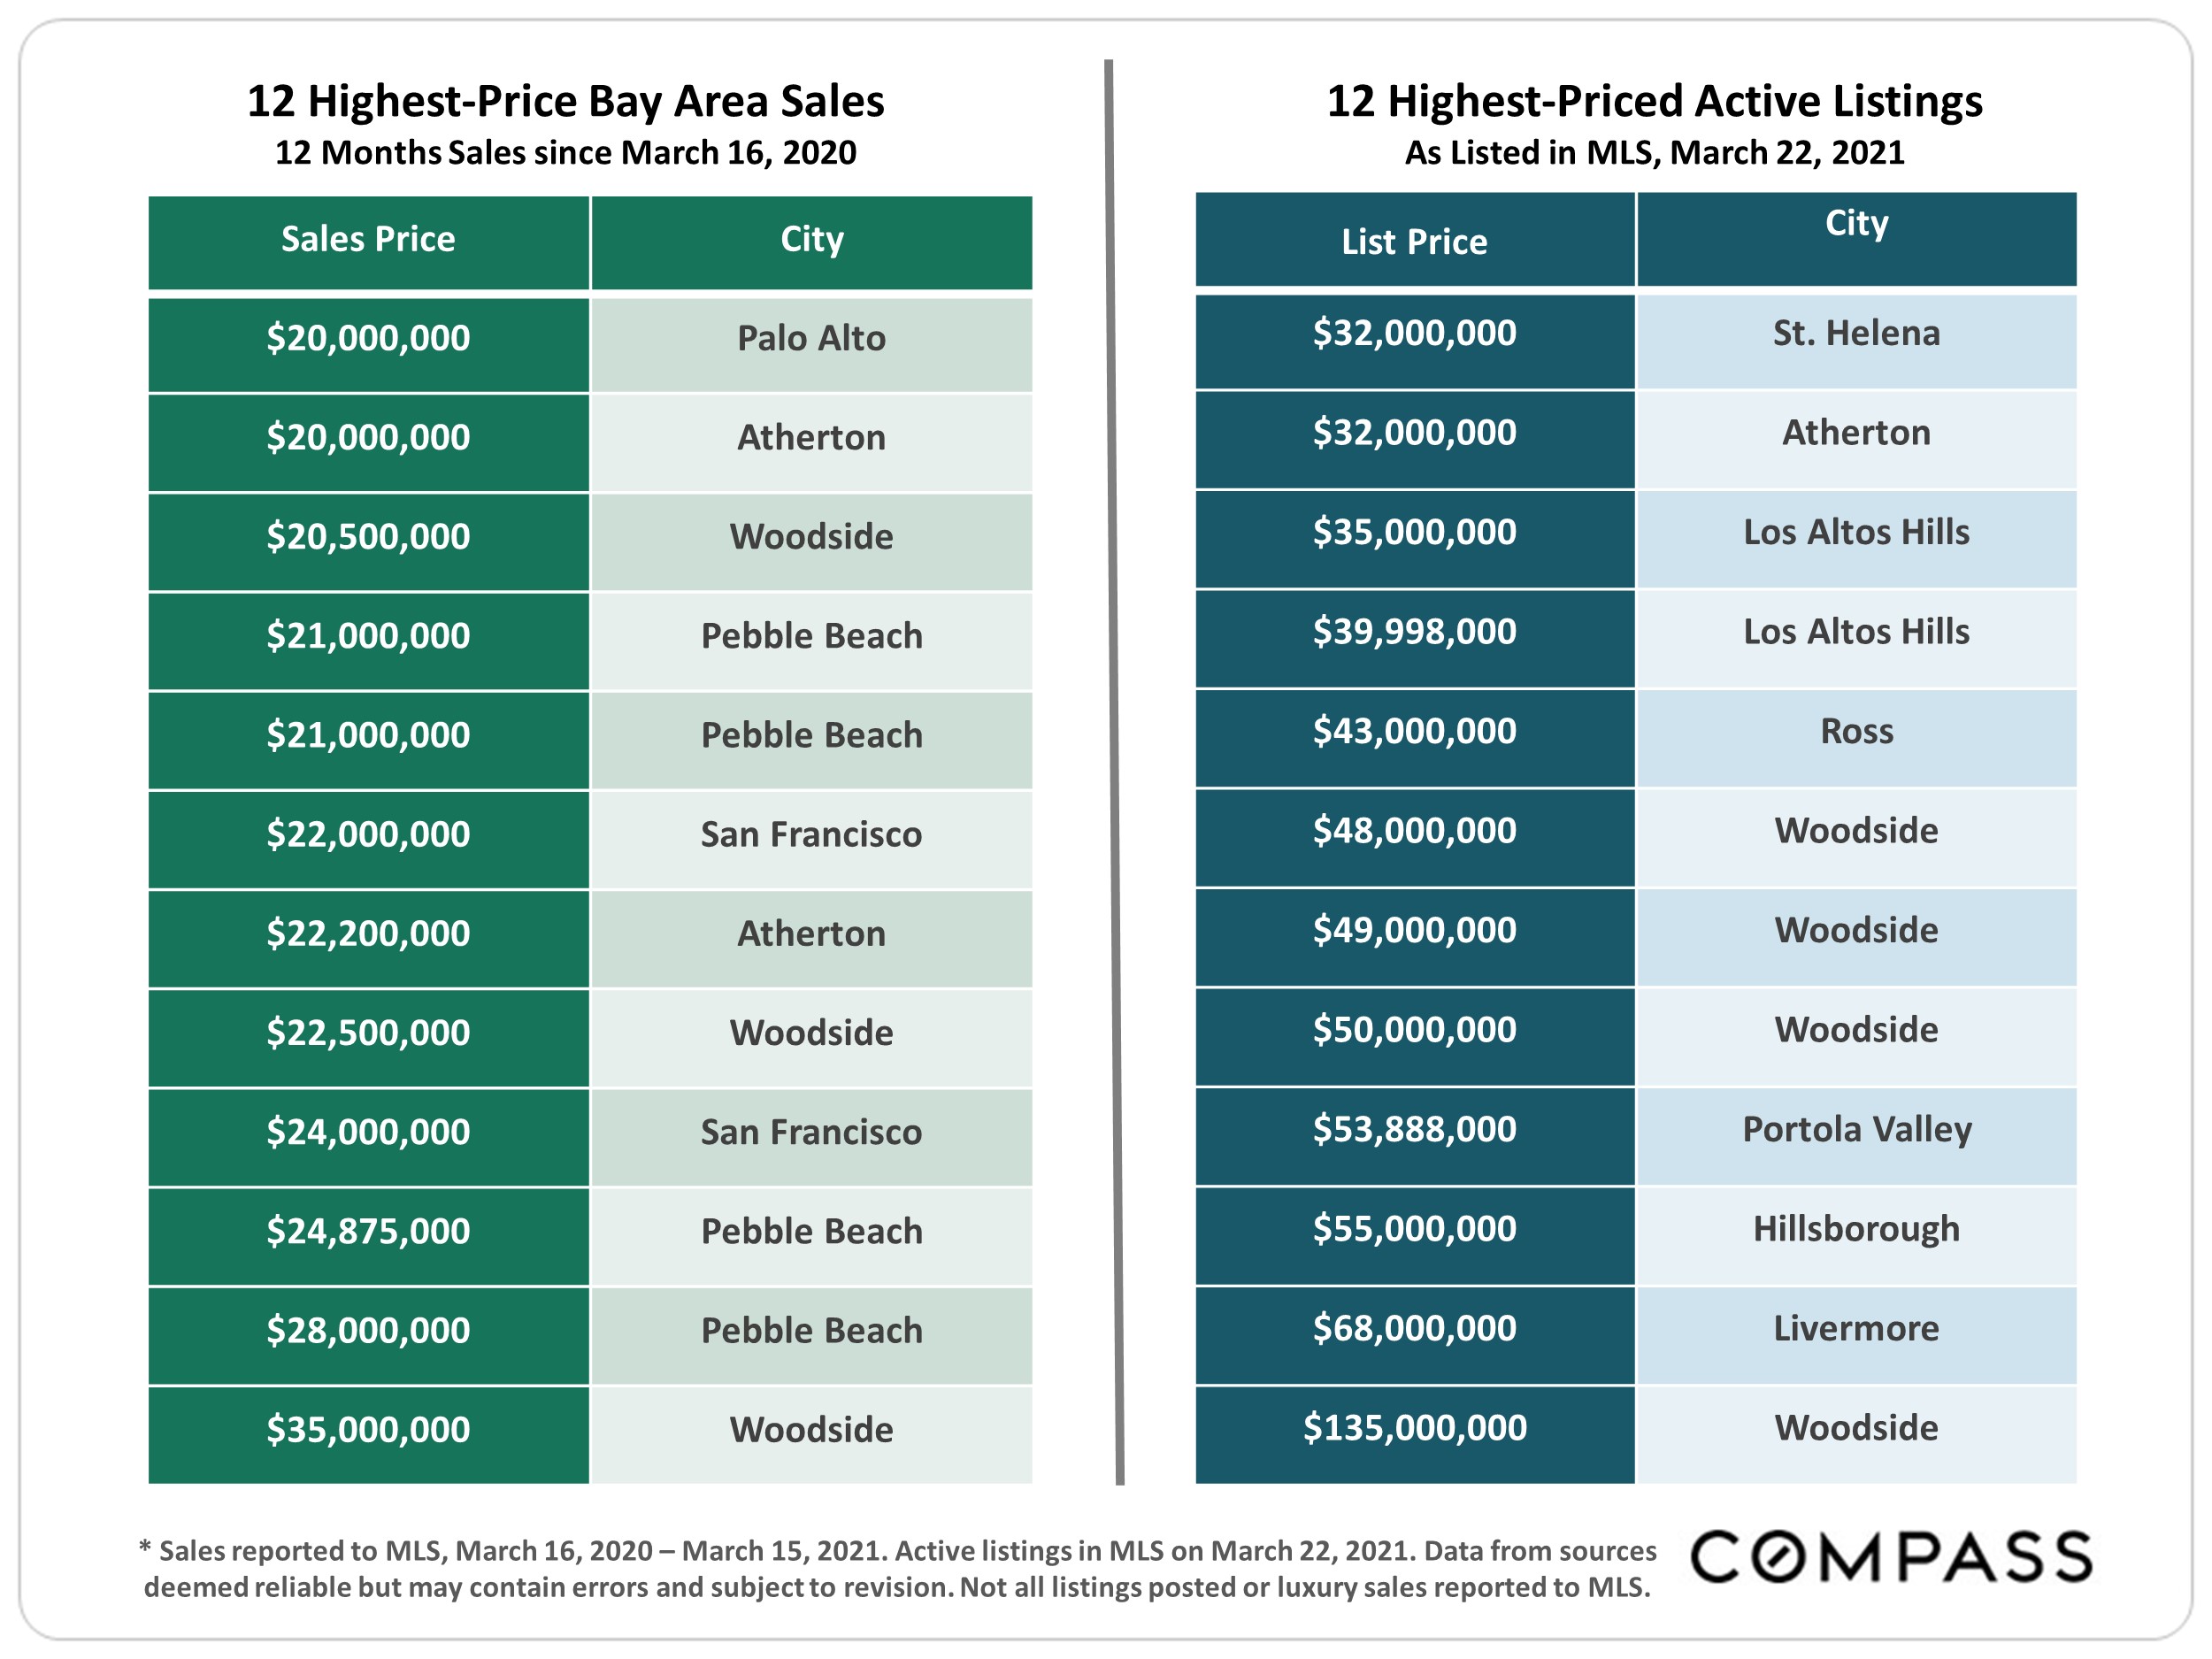
The 12 biggest sales in the greater Bay Area over the past year ranged from $20 million to $35 million. Pebble Beach in Monterey County, with 4 sales, had the highest number of these.
The 12 highest priced listings currently on the market range in asking price from $32 million to $135 million. Eight are located in the circle of very expensive communities surrounding Stanford
University.
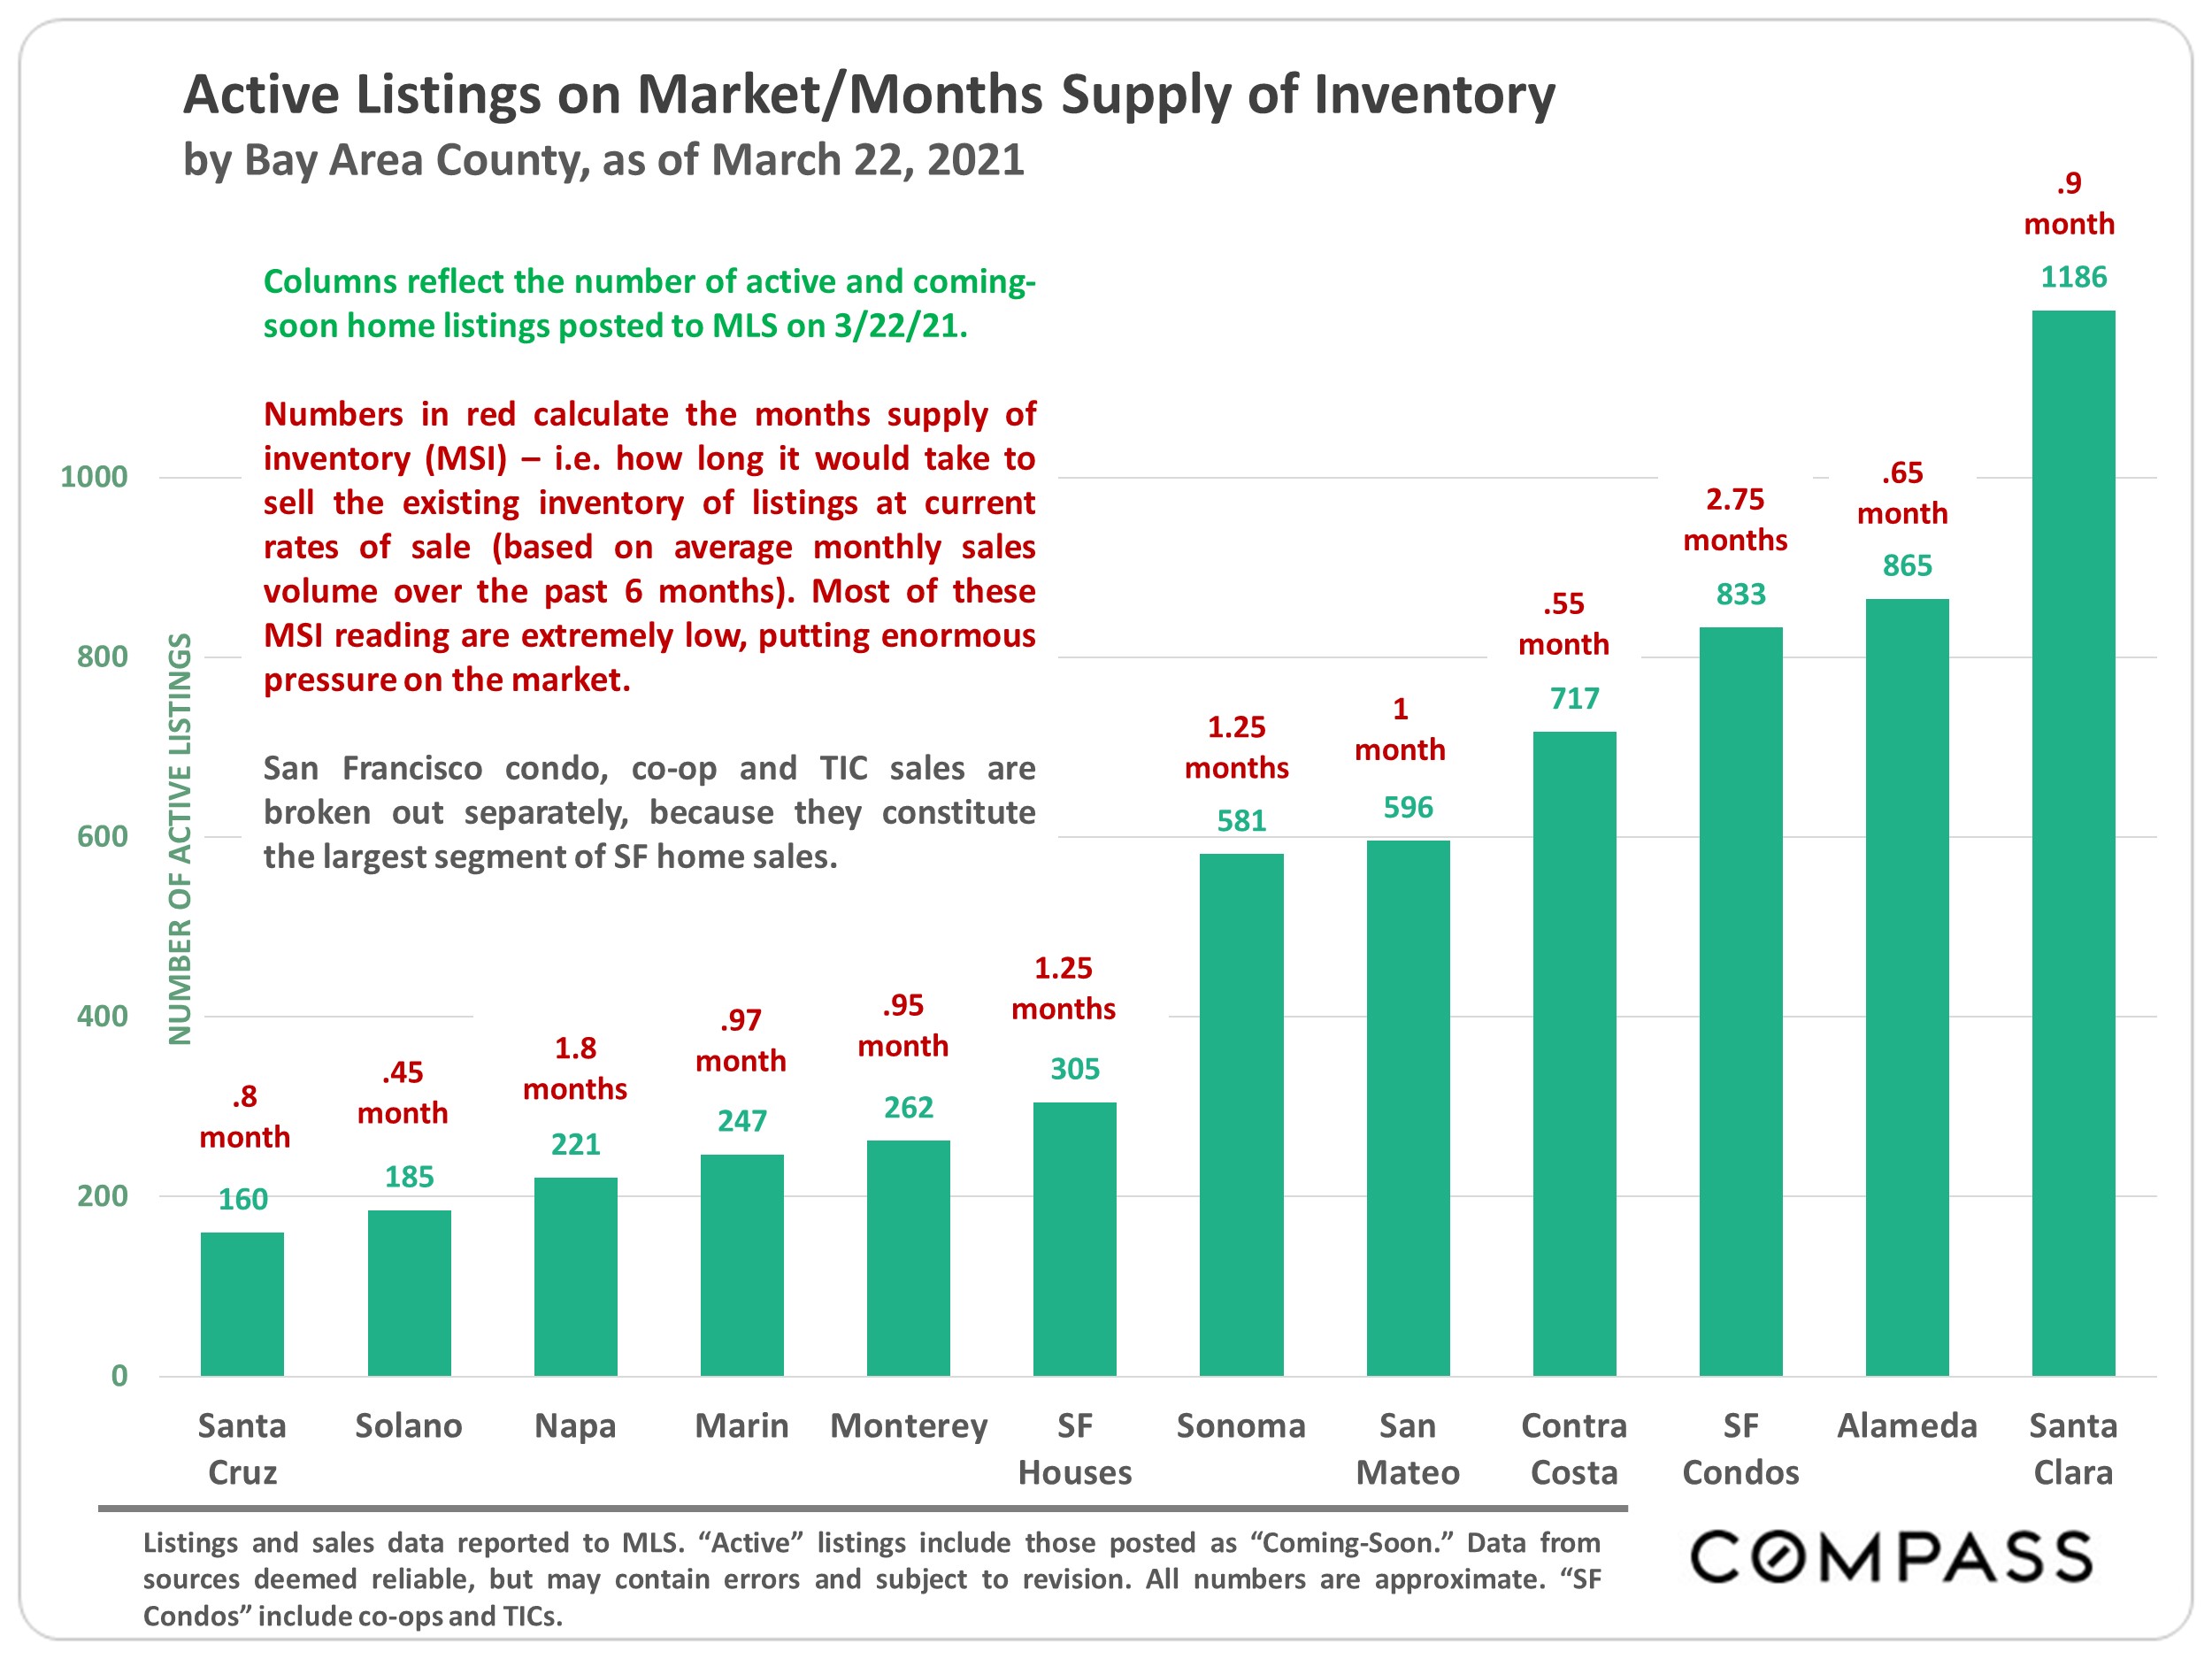
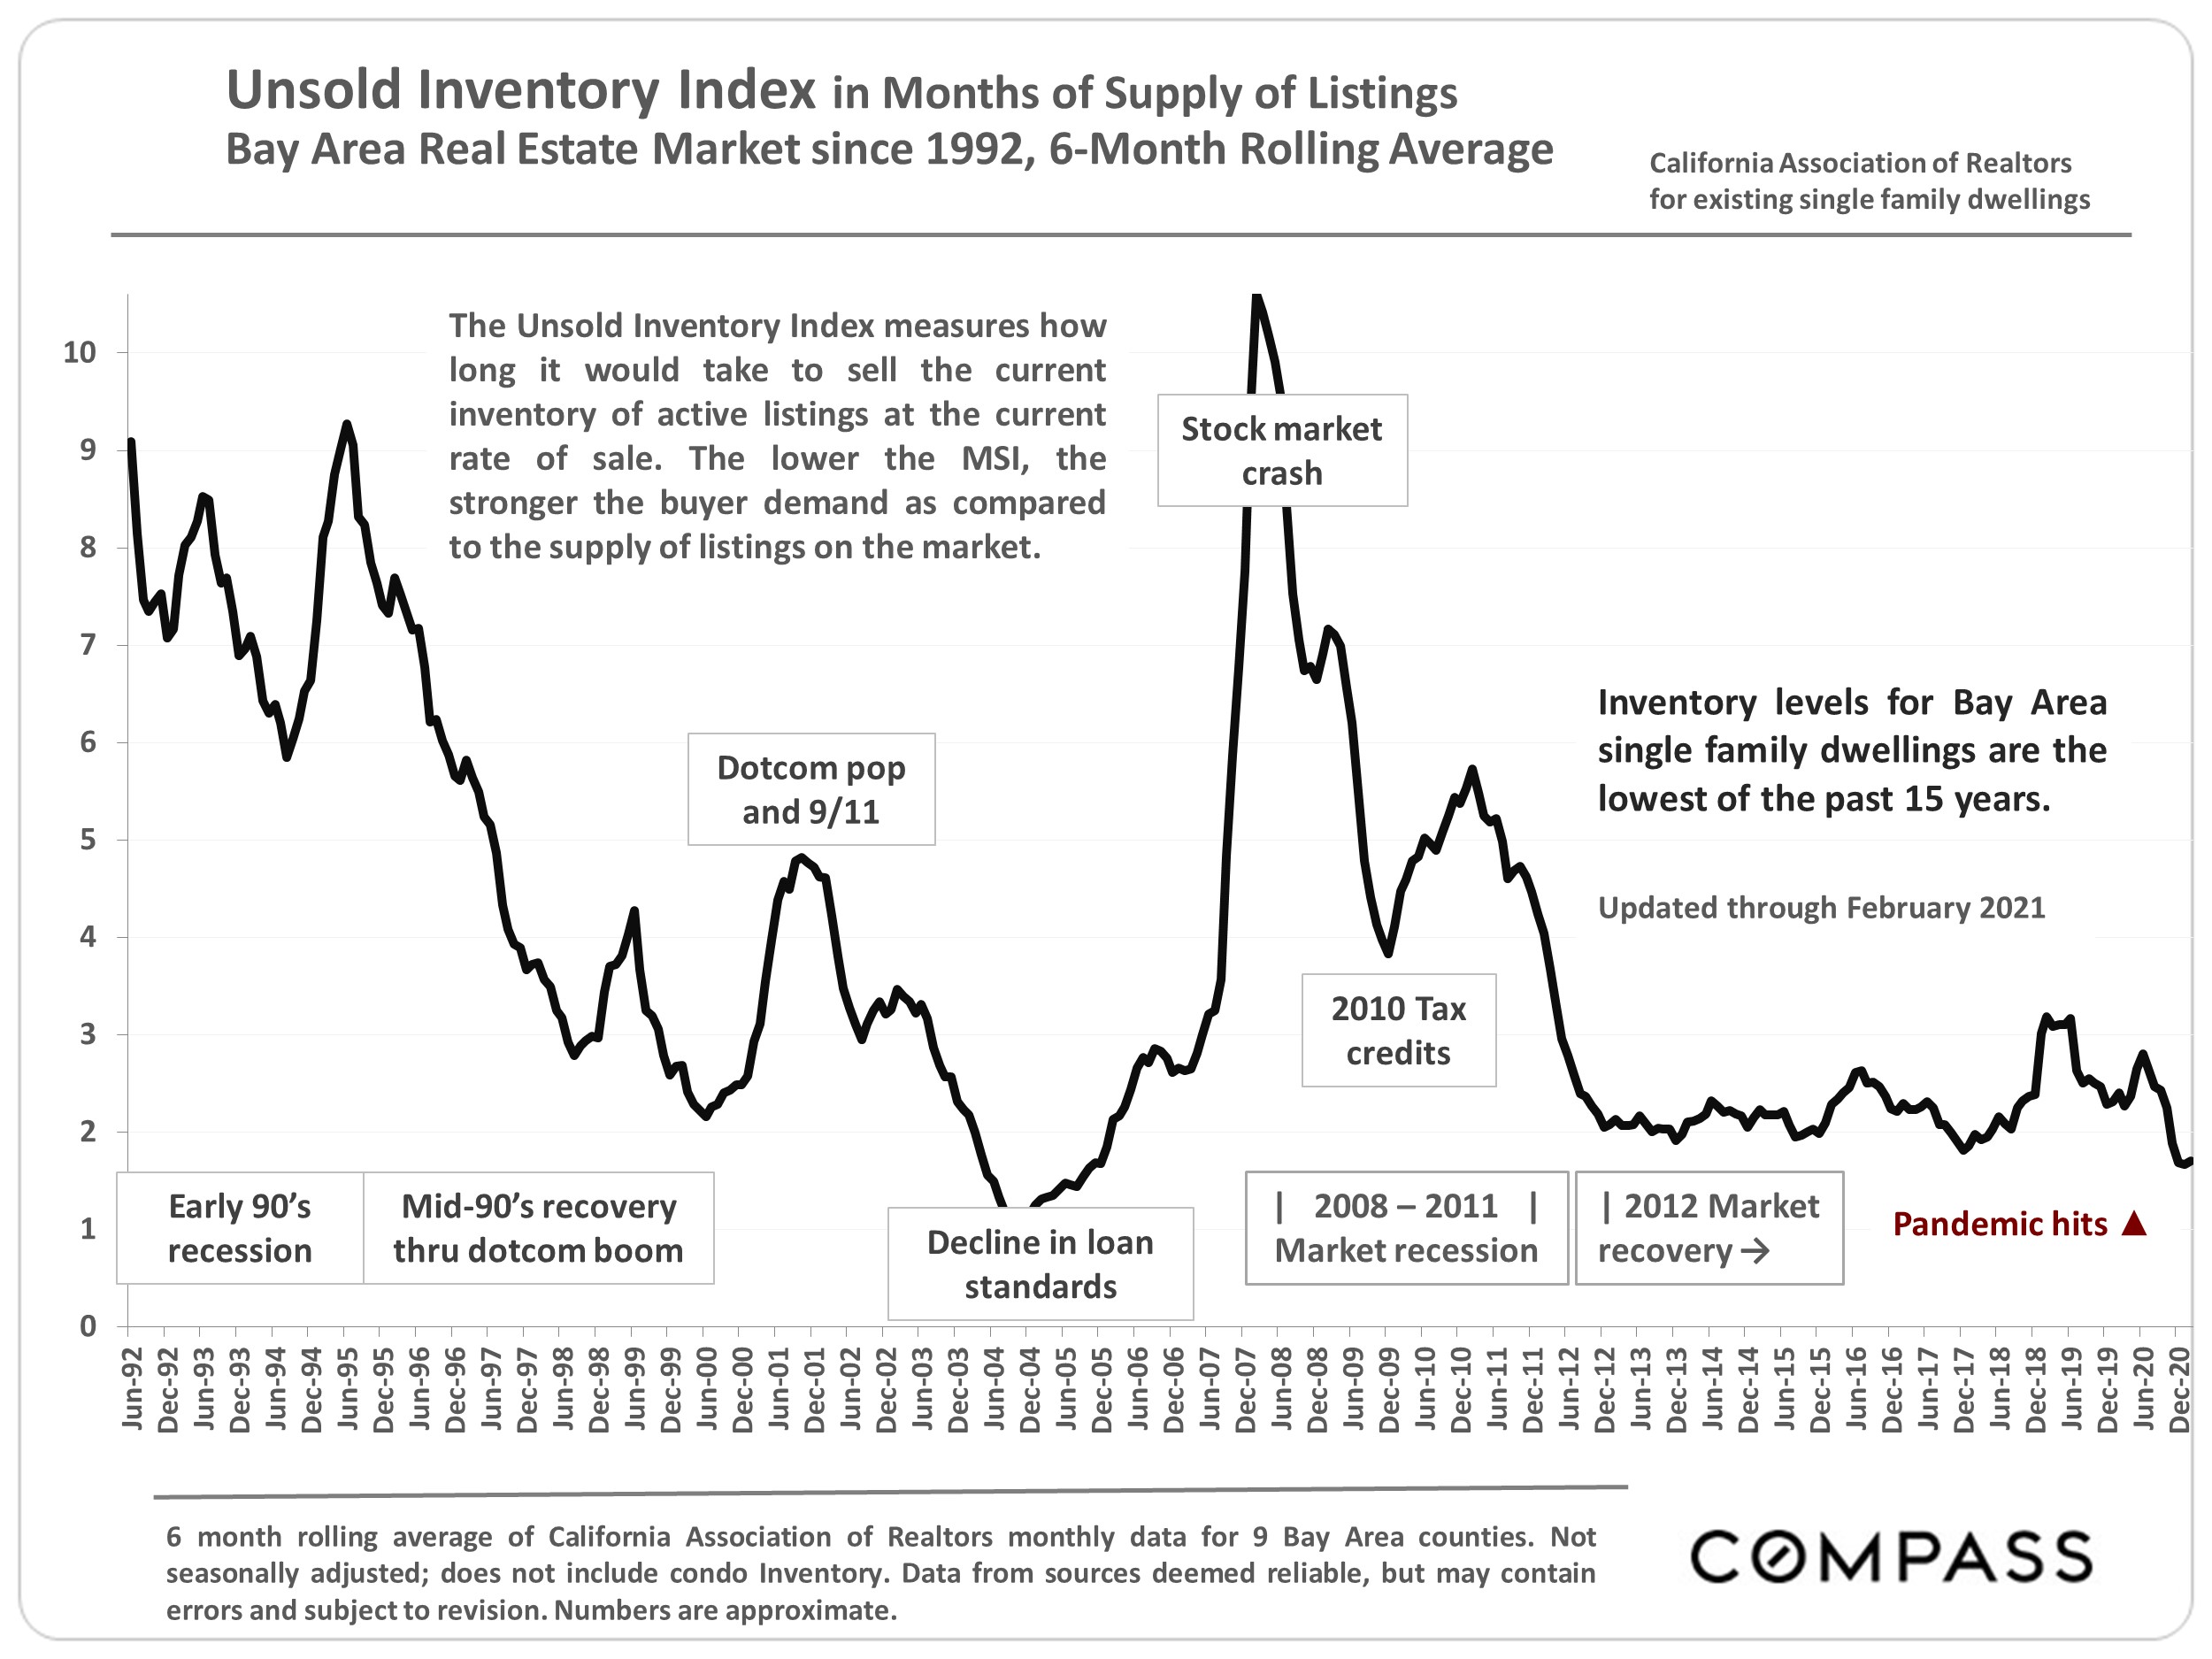
The months-supply-of-inventory level for Bay Area single family dwellings is at its lowest point in at least 15 years.
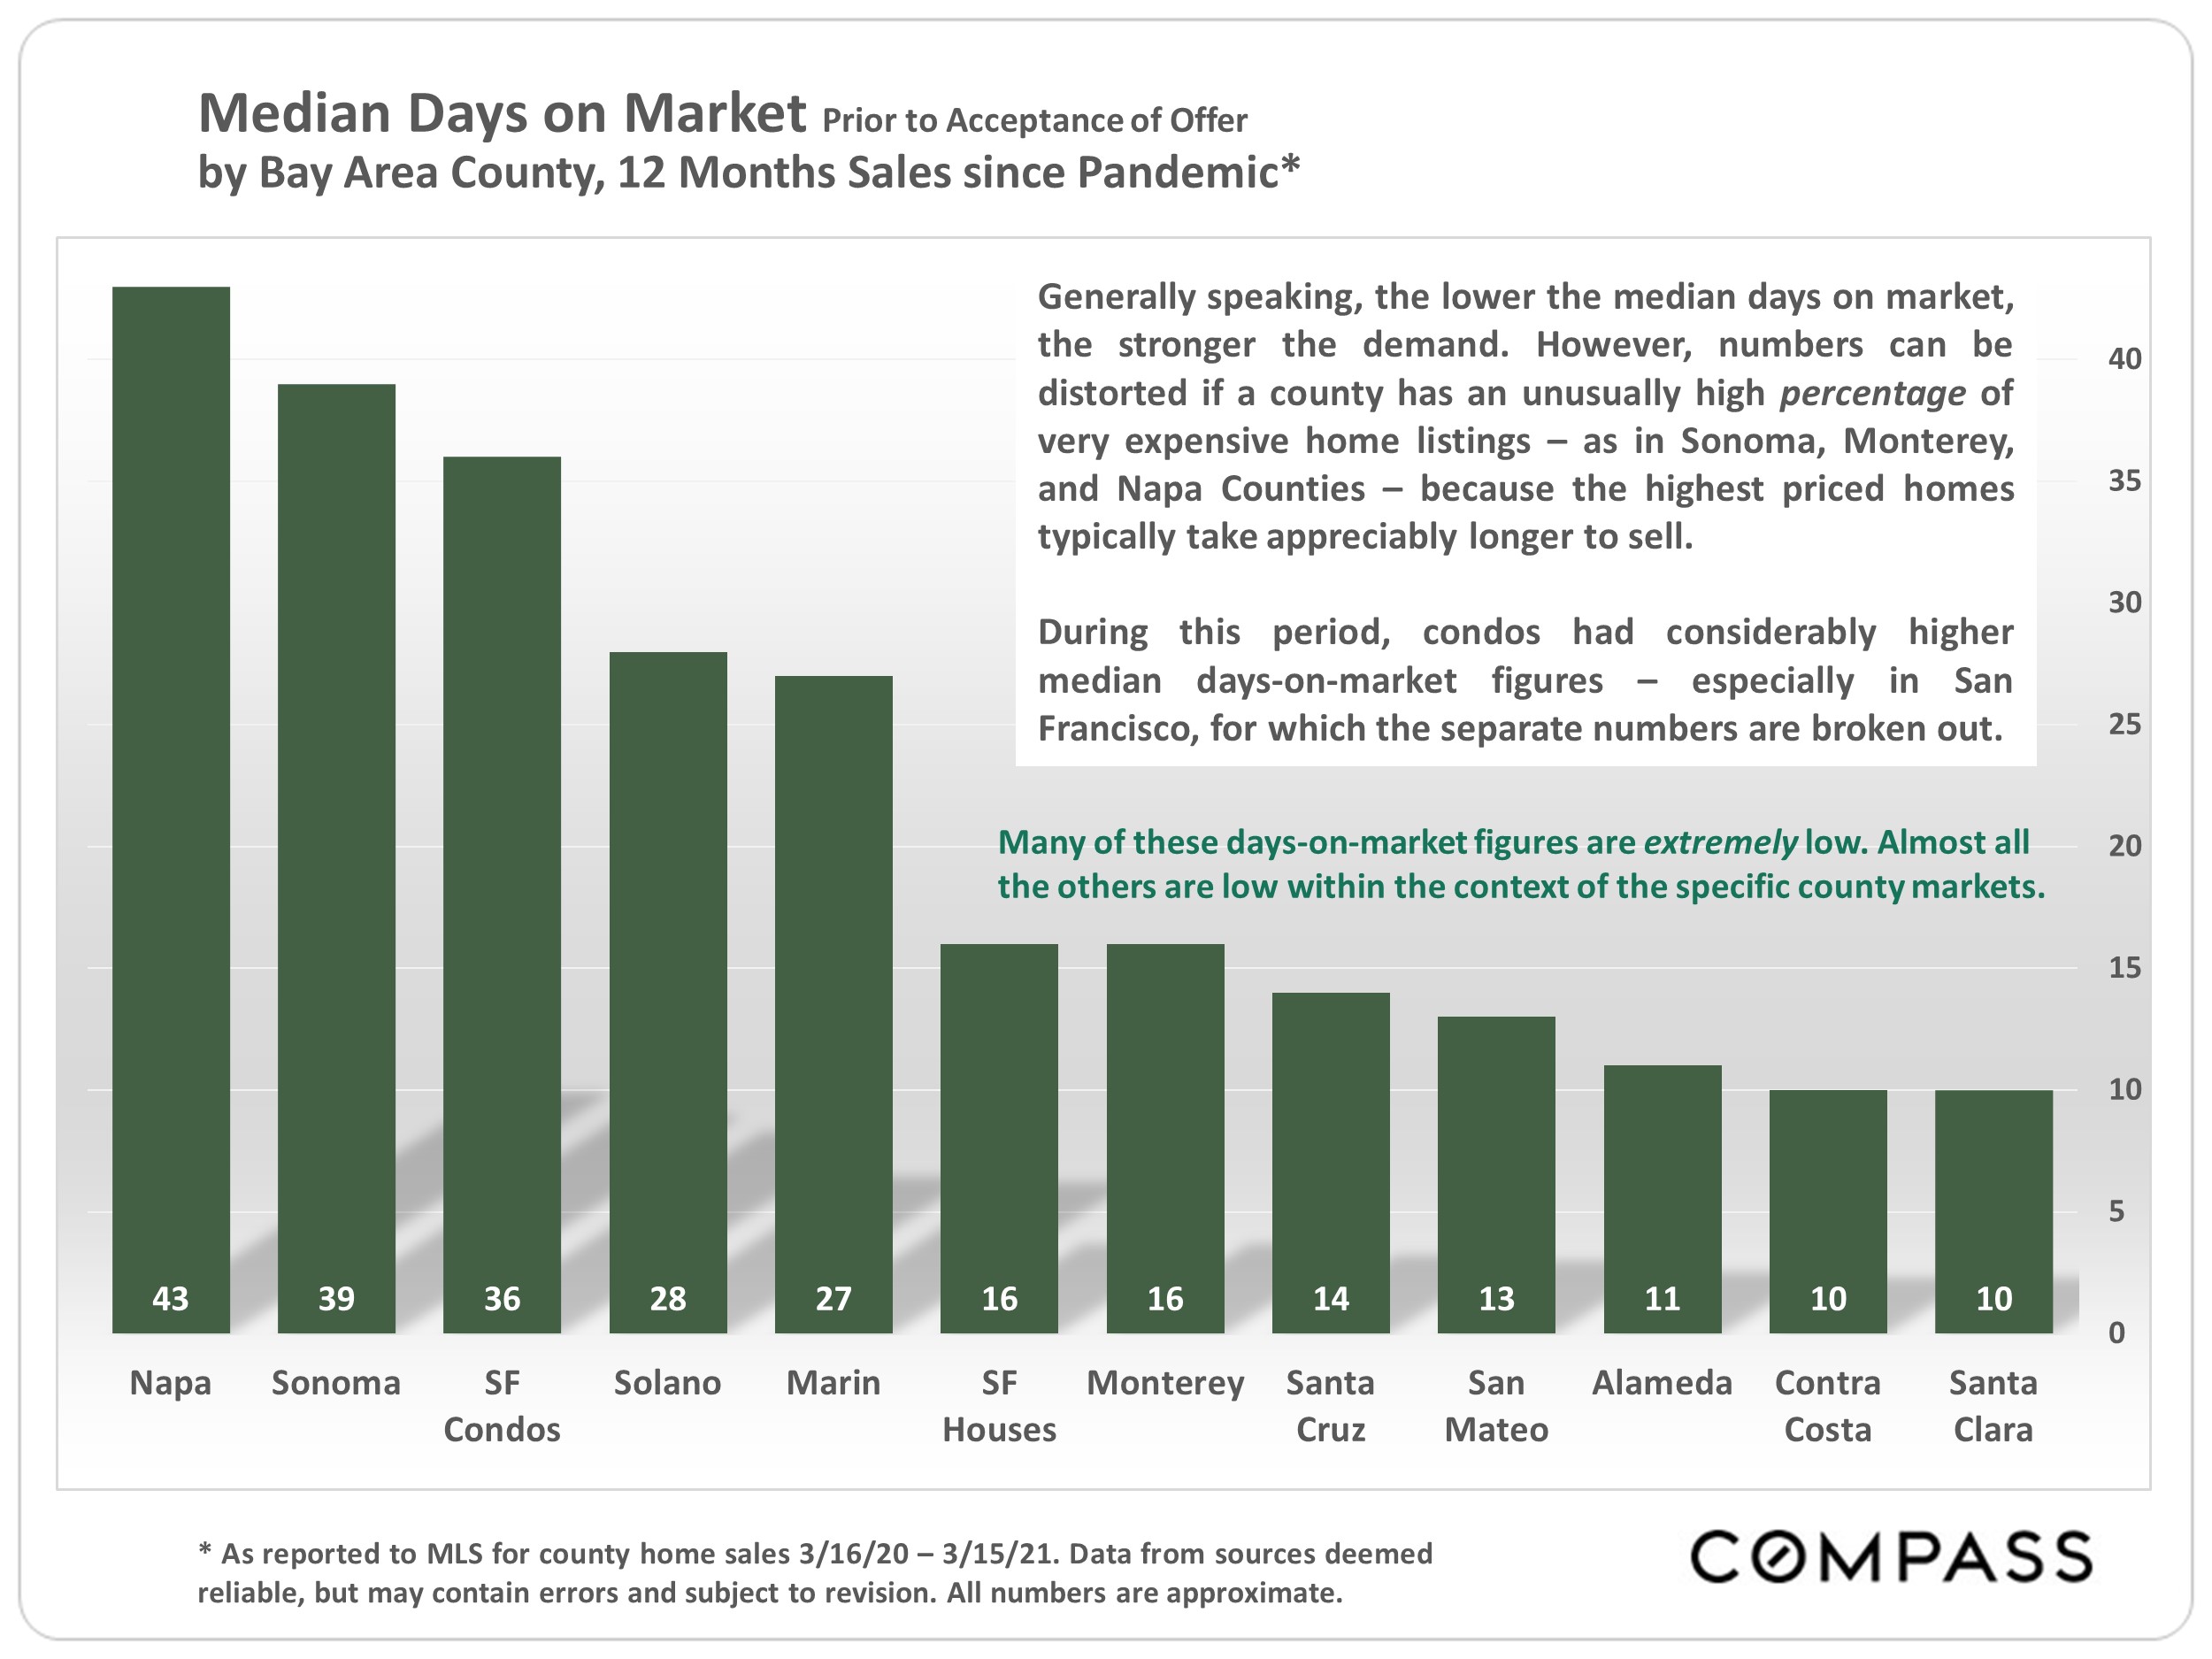
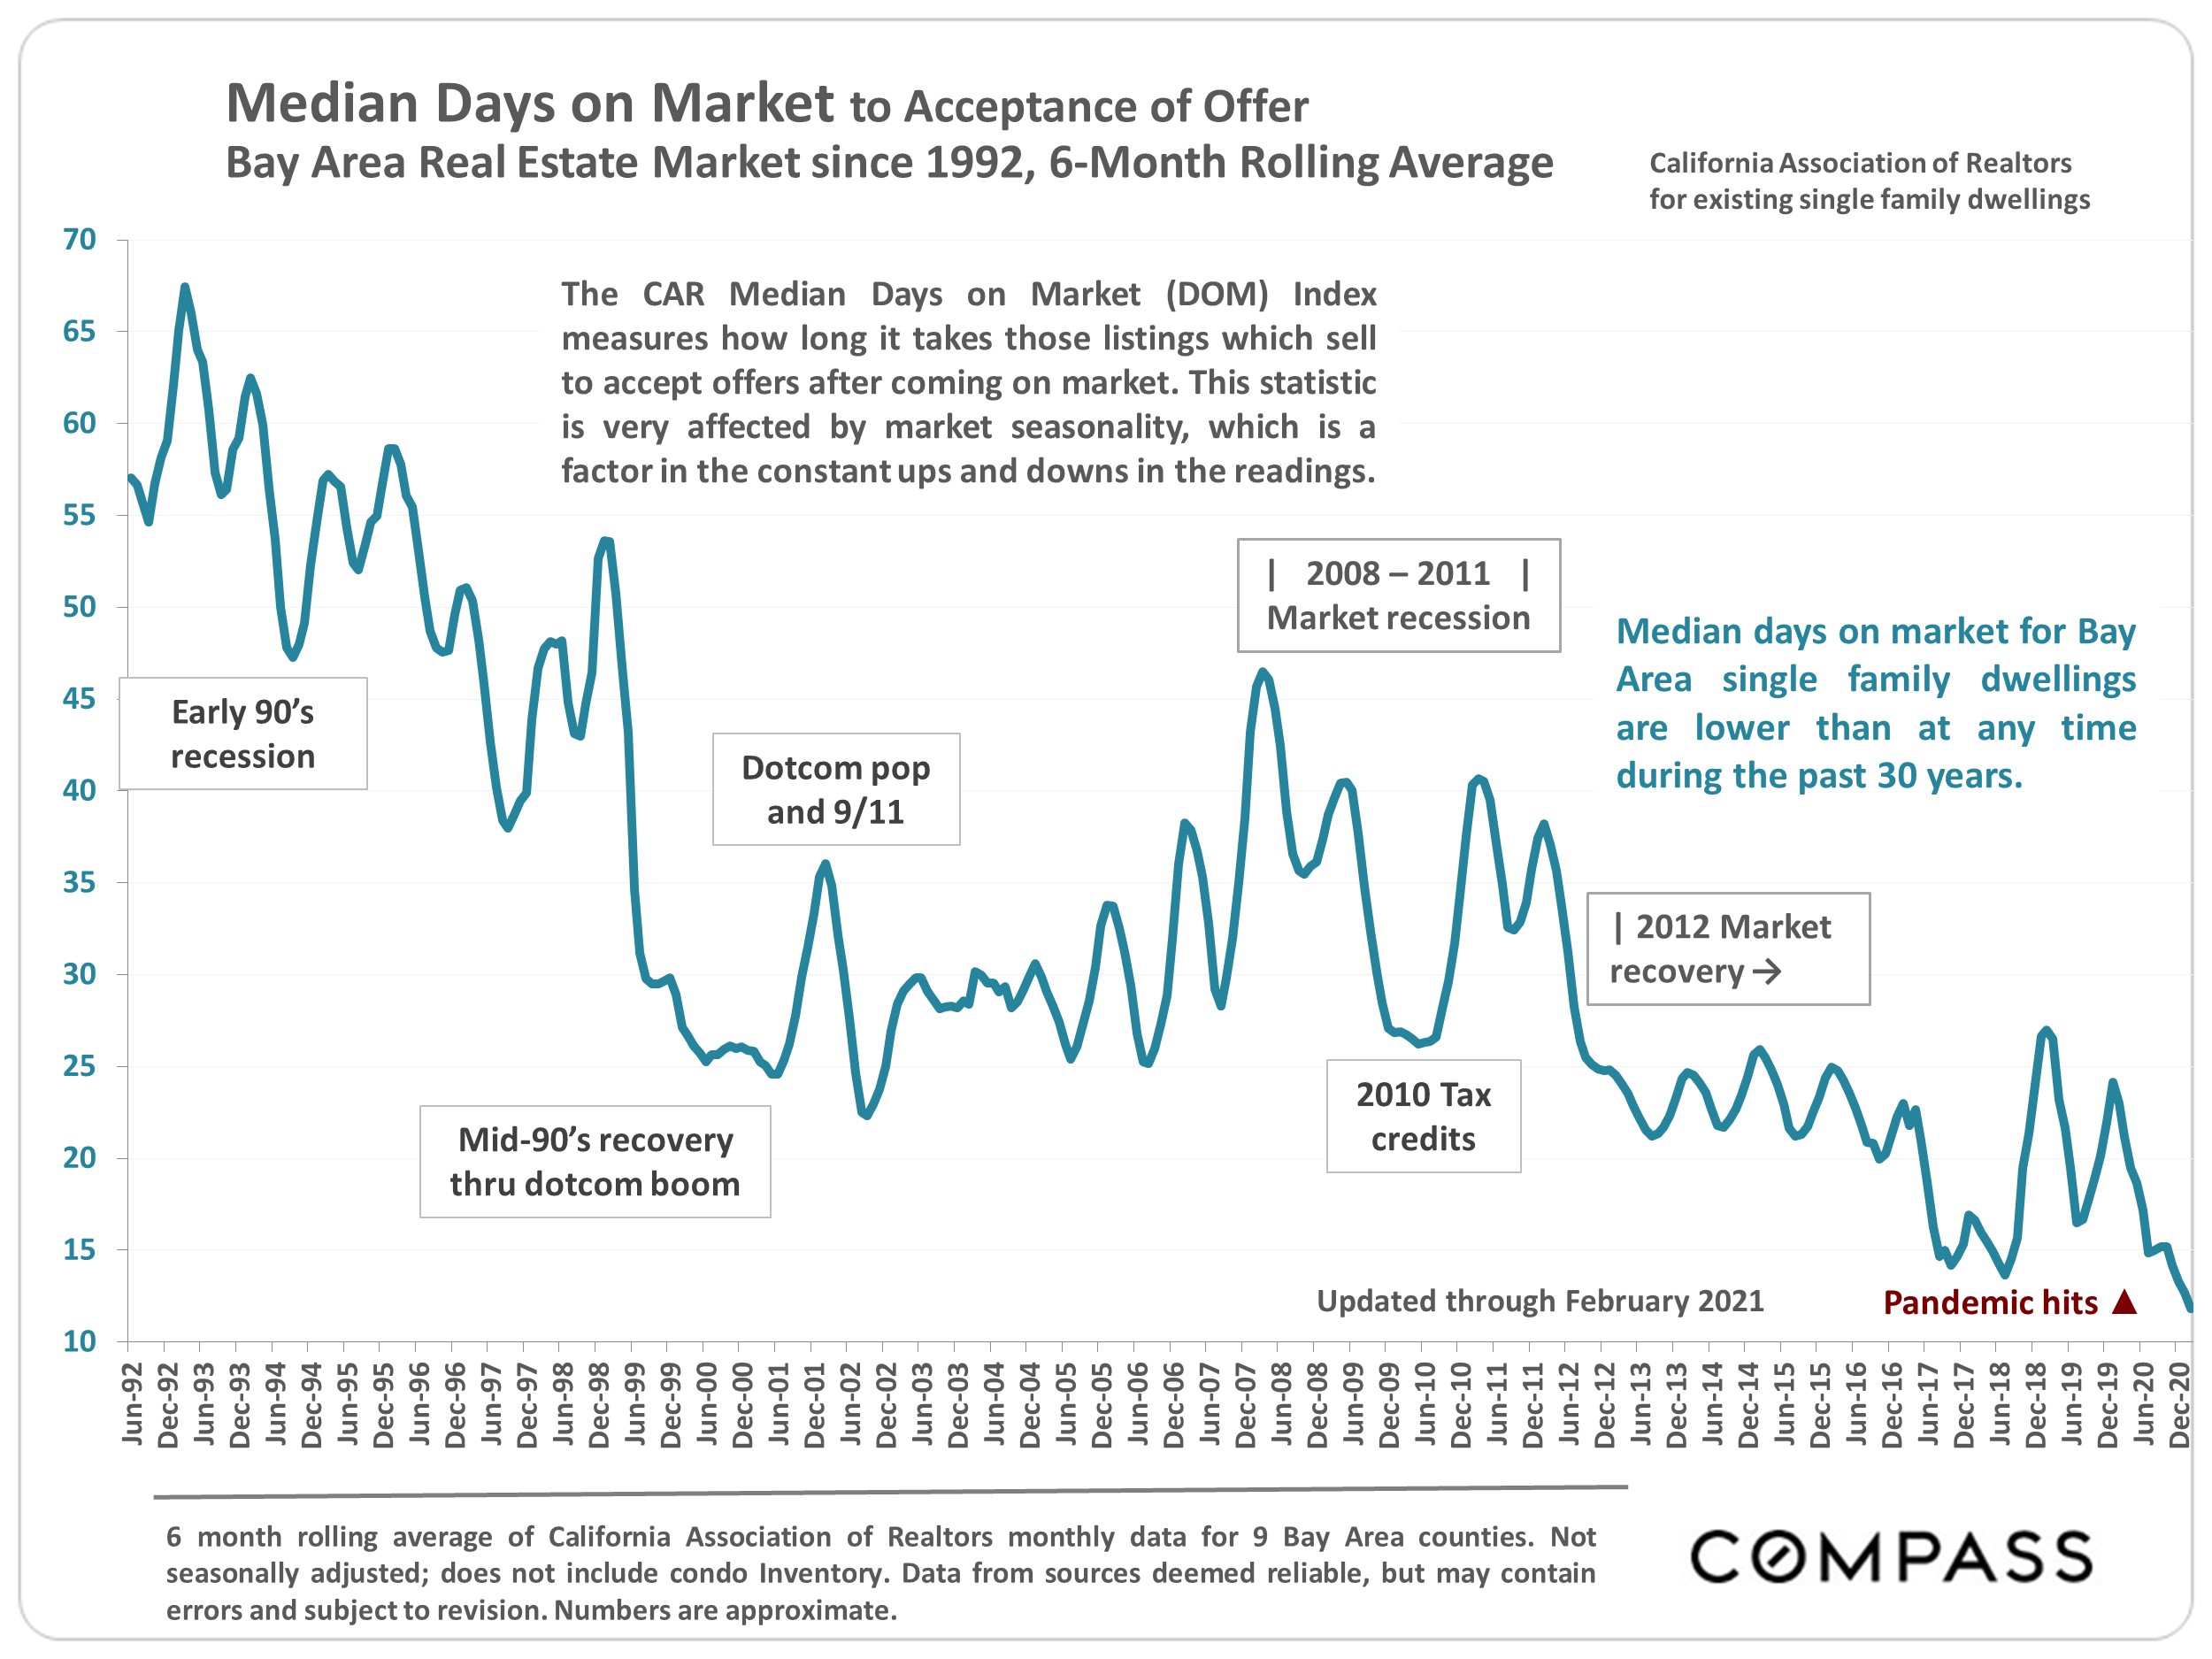
Median days-on-market for Bay Area single family dwellings are at their lowest in at least 30 years.
 |
 |
 |
 |
 |
 |
 |
 |
 |
 |
 |
 |
 |
 |
 |
 |
 |
 |
 |
 |
 |
 |
 |
 |
 |
Source: CompassIt is impossible to know how median and average value statistics apply to any particular home without a specific comparative market analysis. These analyses were made in good faith with data from sources deemed reliable, but may contain errors and are subject to revision. It is not our intent to convince you of a particular position, but to attempt to provide straightforward data and analysis, so you can make your own informed decisions. Median and average statistics are enormous generalities: There are hundreds of different markets in San Francisco and the Bay Area, each with its own unique dynamics. Median prices and average dollar per square foot values can be and often are affected by other factors besides changes in fair market value. Longer term trends are much more meaningful than short-term. Compass is a real estate broker licensed by the State of California, DRE 01527235. Equal Housing Opportunity. This report has been prepared solely for information purposes. The information herein is based on or derived from information generally available to the public and/or from sources believed to be reliable. No representation or warranty can be given with respect to the accuracy or completeness of the information. Compass disclaims any and all liability relating to this report, including without limitation any express or implied representations or warranties for statements contained in, and omissions from, the report. Nothing contained herein is intended to be or should be read as any regulatory, legal, tax, accounting or other advice and Compass does not provide such advice. All opinions are subject to change without notice. Compass makes no representation regarding the accuracy of any statements regarding any references to the laws, statutes or regulations of any state are those of the author(s). Past performance is no guarantee of future results. |
