San Francisco Bay Area Real Estate Market Cycles since 1990, July 2022

The early 1990’s recession, the dotcom boom, subprime bubble and crash, market recovery, high-tech boom – and pandemic.

Important notes and caveats regarding the context and methodology of this report are detailed on the last page. All calculations to be considered very approximate, good-faith estimates. How this report applies to any particular home is unknown without a specific comparative market analysis.

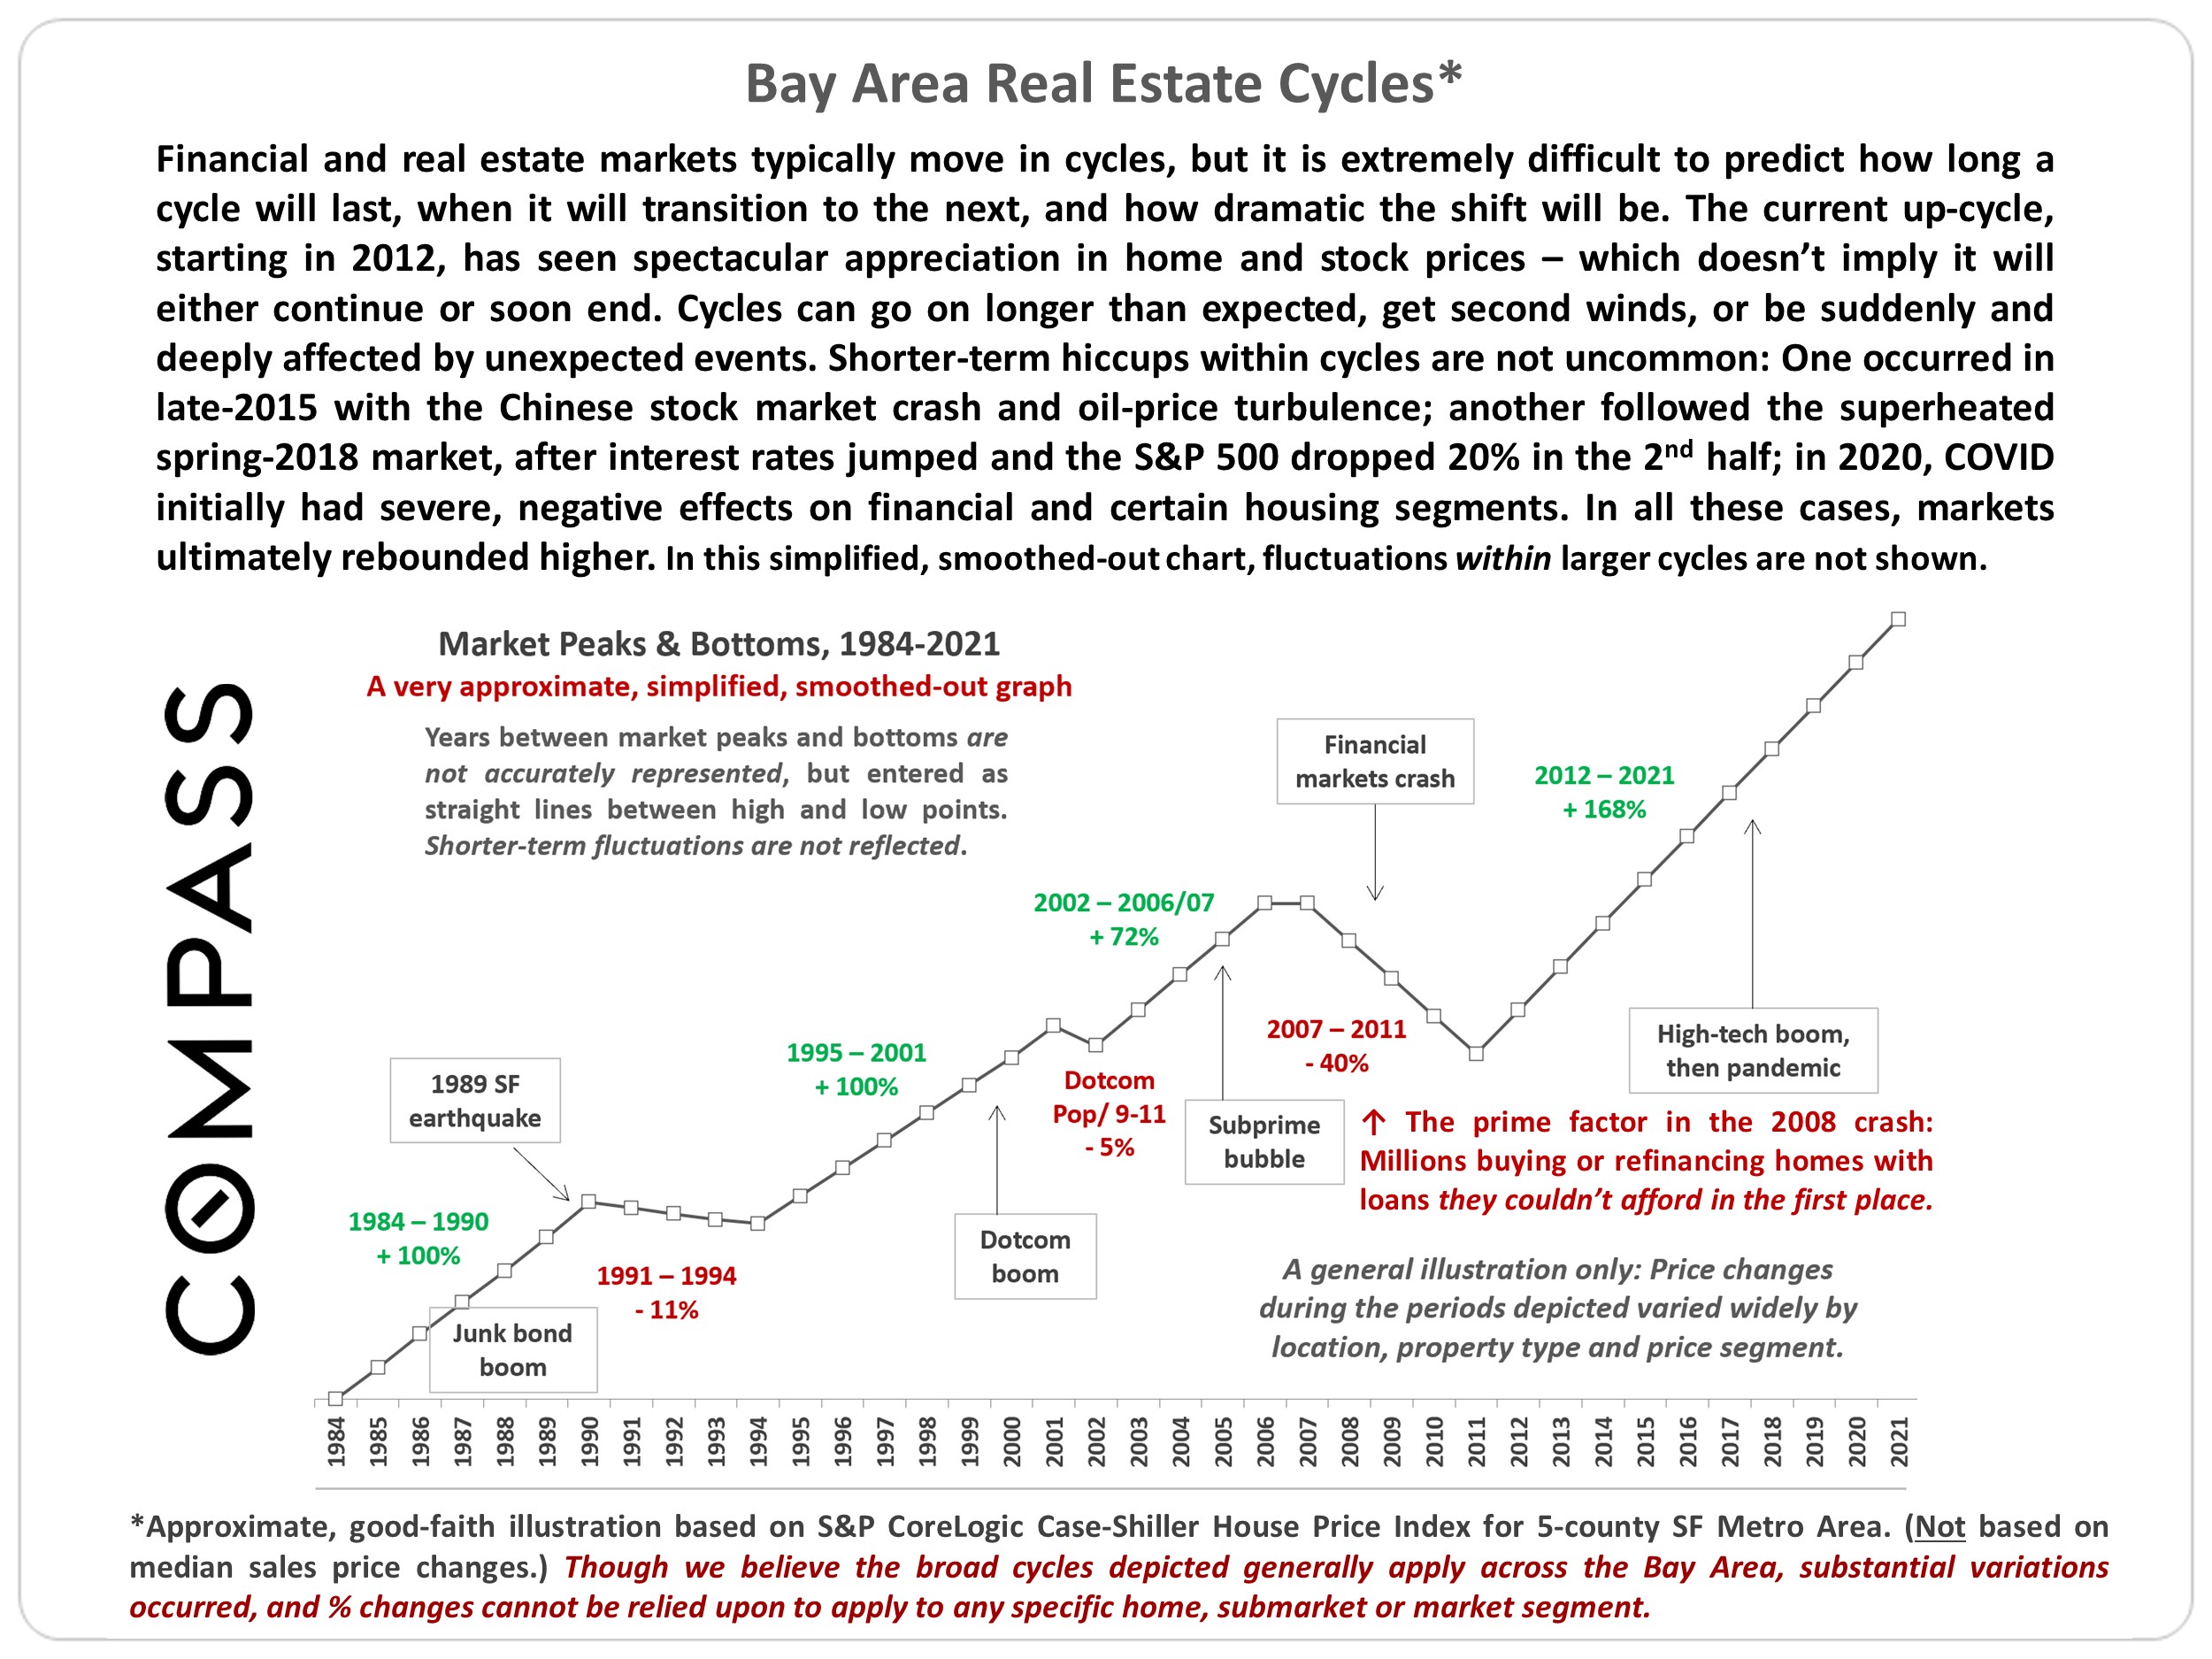
Financial and real estate markets have run in cycles for at least hundreds of years. Though varying in their details, causes and effects, there are many similarities in how they play out, providing greater context to how markets work over time.

Many economic, political, demographic and environmental factors play roles in real estate markets, including interest rates, inflation, financial markets, new wealth creation (or destruction), housing affordability, employment, demographic shifts, governmental economic interventions, national and international crises, financial product engineering and manipulation, runaway speculation, regulation and risk management, tax law, debt, natural disasters, and, as we have recently seen, even pandemics.

Human psychology also plays a defining role, with optimism, confidence, and often, ultimately, “irrational exuberance” fueling upcycles. (“The world is different now. The old rules don’t apply, and these boom times can continue indefinitely.”) Conversely, fear, doubt and pessimism play a role in the shift to, and then underpin down-cycles. (“The housing market probably won’t recover in our lifetimes.”) Whatever the phase of the cycle, people tend to believe it will last forever, but, of course, the nature of cycles is to keep turning.

It is extremely difficult to predict when different parts of a cycle will begin or end. Boom times, even periods of “irrational exuberance,” can go on much longer than expected, or get second winds, with huge jumps in values. On the other hand, negative shocks can appear with startling suddenness, often triggered by unexpected events or factors that affect a variety of economic fundamentals, hammer confidence, and cause shifts into slowdowns, “market corrections” or recessions of varying degrees and duration. These negative adjustments can feel like a switch being flipped, the slow deflation of a tire with a small puncture, or traffic going 120 miles per hour suddenly decelerating. Prices can flatten, adjust 5% to 10%, or, as with the subprime bubble, crash. (The subprime bubble and crash was caused by very unusual circumstances, as discussed later in this report.)

It’s interesting to note that different markets often behaved very differently during the various cycles, depending on the factors at play. As one example, San Francisco’s market was hit hardest after the 1989 earthquake; saw one of the highest appreciation rates during the dotcom boom – and a bigger price drop after it popped; a moderate-sized subprime bubble and crash; very high appreciation after the 2012 recovery and subsequent high-tech boom; but then a relatively low appreciation rate, as compared to surrounding counties, after the pandemic hit. In real estate, the devil is always in the details.
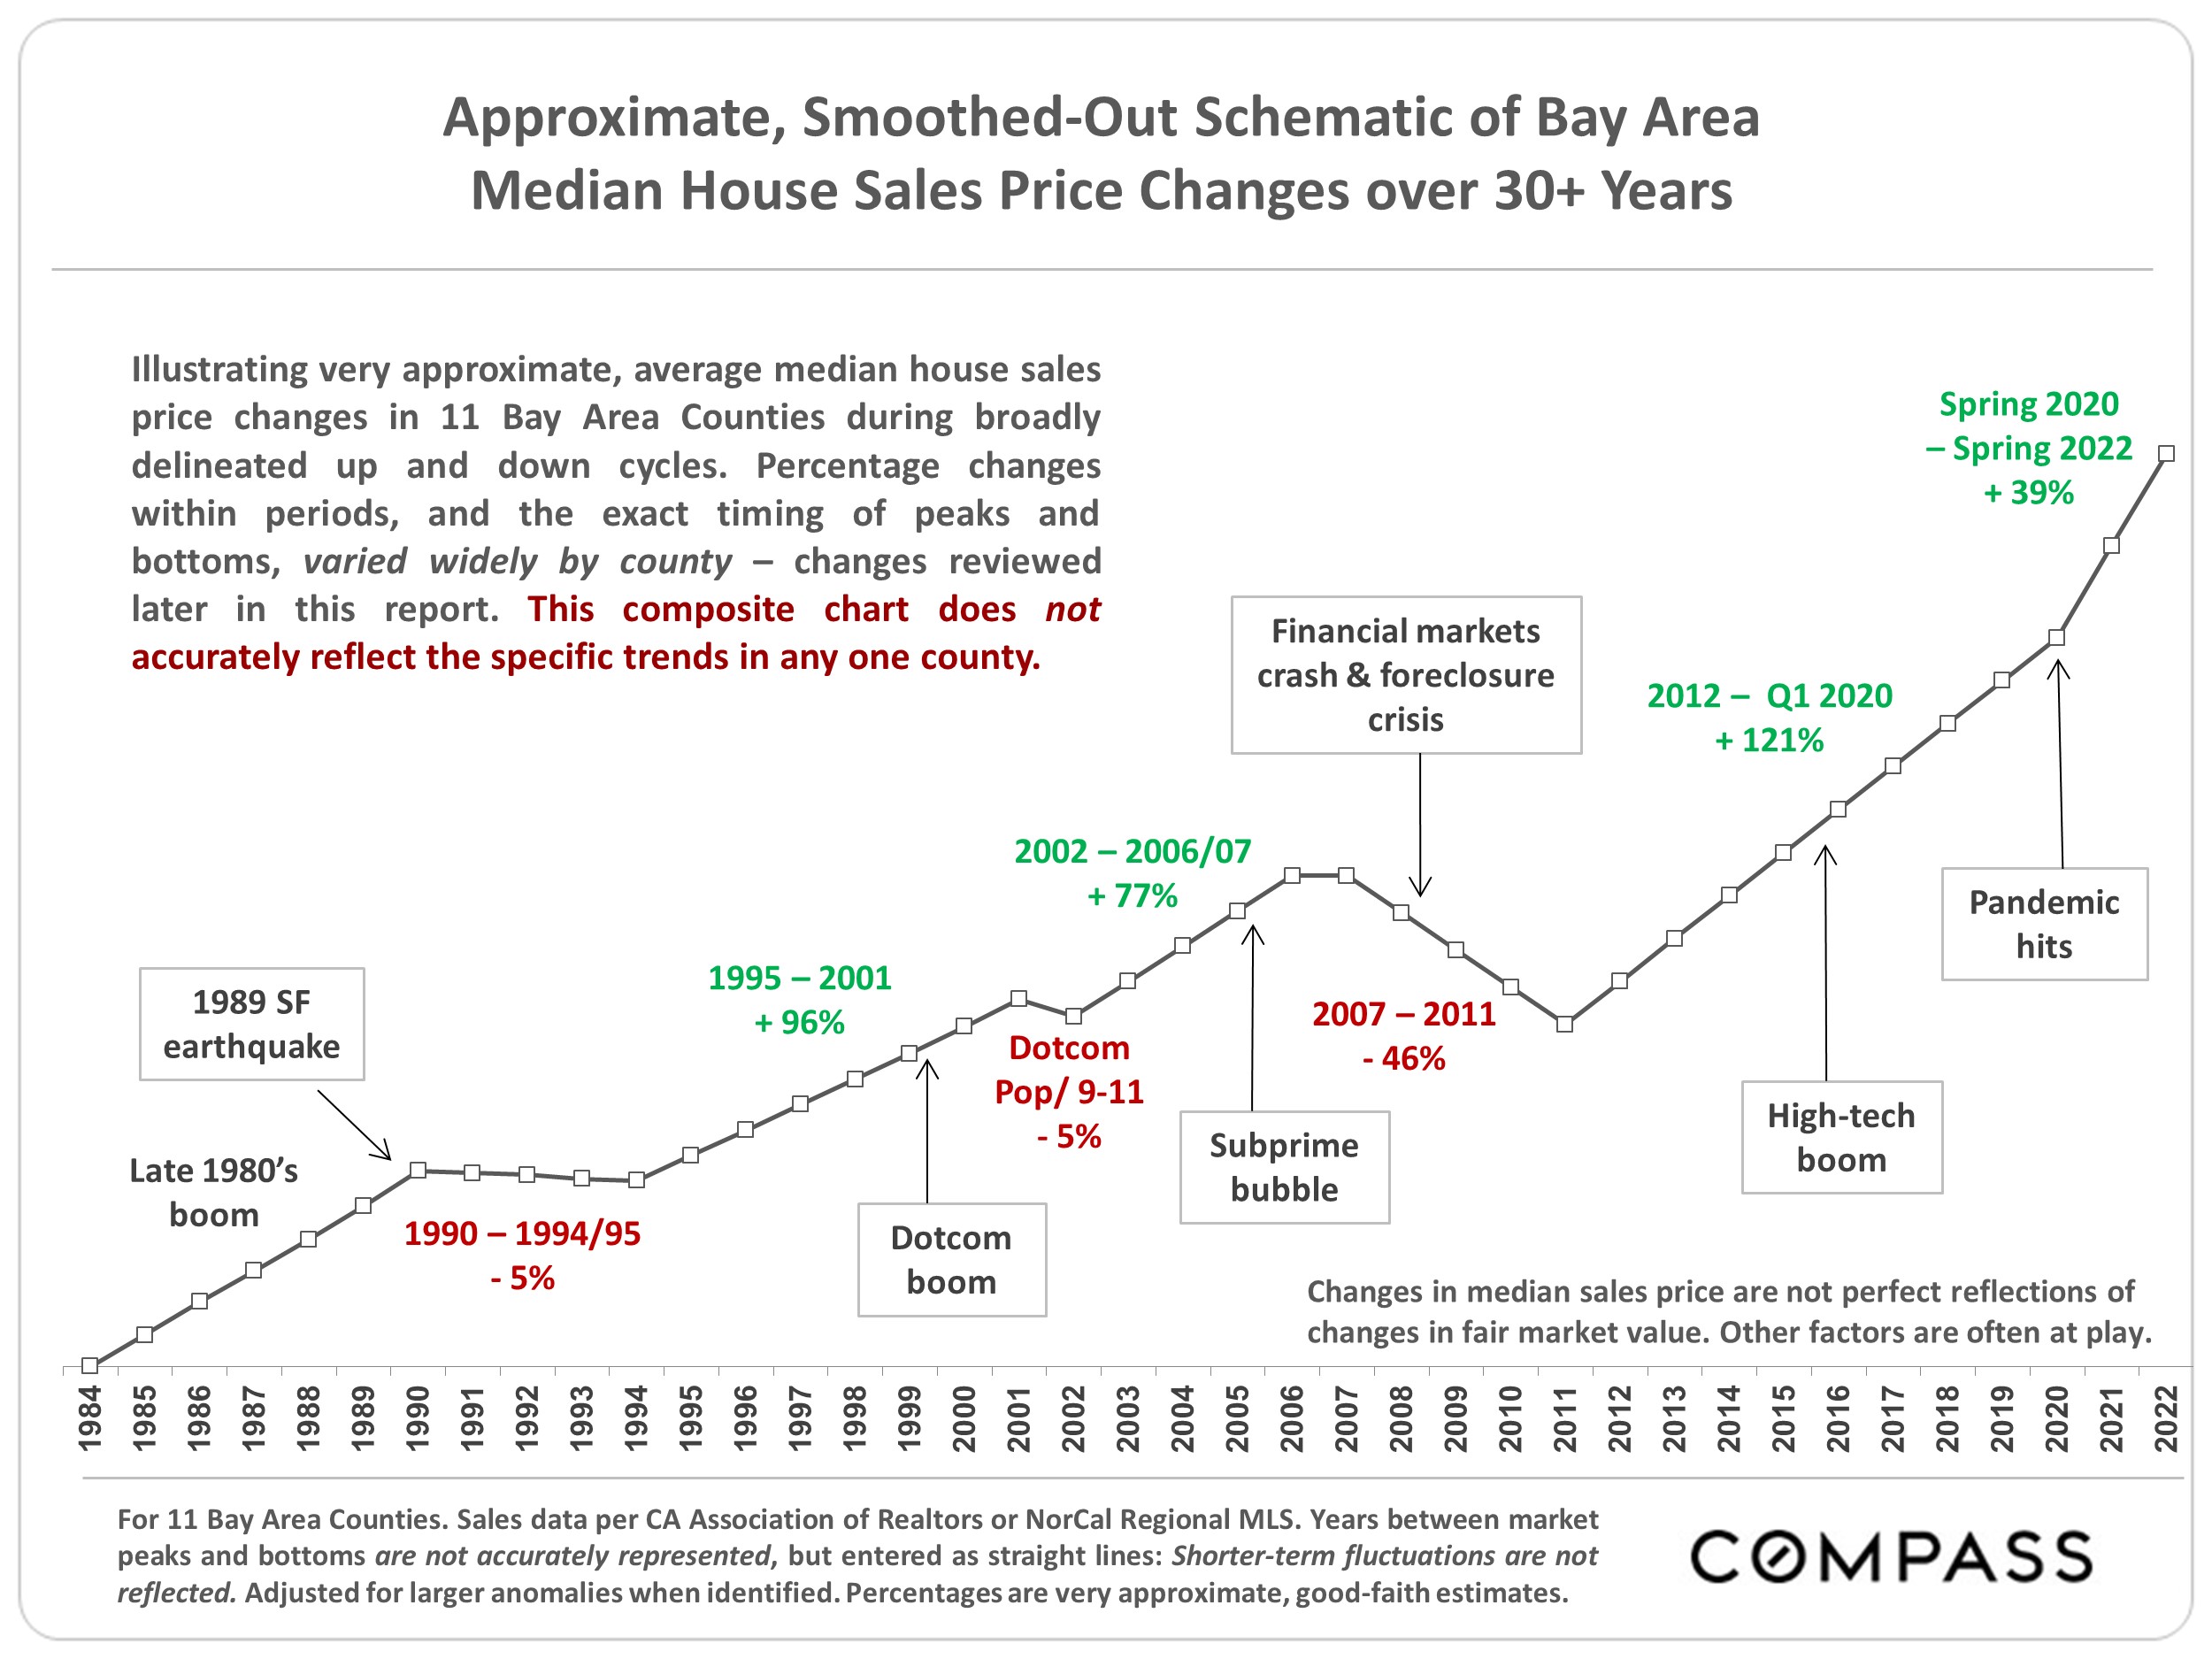
After the Early 1990’s Recession: Recovery & Dotcom Boom

1st chart following: From 1990 – following the late 1980’s stock market peak, the S&L/junk bond crisis, and 1989 earthquake – through the recession to the mid-1990’s, Bay Area real estate markets generally remained weak, with prices typically declining 5% to 11% within the period.

2nd chart: In the middle of the decade, markets began to recover, with home prices subsequently accelerating rapidly during the dotcom boom. Once the dotcom boom got going, San Francisco and Santa Clara Counties, the centers of the phenomenon, saw the highest appreciation rates. Adjacent counties saw lower, though still substantial increases, with rates in the next circle of counties stepping down further. The Bay Area generally saw appreciation percentages peak dramatically in year 2000, the height of the dotcom bubble. National home-price appreciation during this period was considerably lower than in the Bay Area.

3rd chart: When dotcom hysteria collapsed and the Nasdaq crashed, only the inner Bay Area Counties – SF, San Mateo and Santa Clara, and those adjacent to them – saw significant (though relatively short lived) median price declines, while outer counties were generally unaffected. According to the CaseShiller Home Price Index for the multi-county San Francisco Metro Area, the dotcom collapse affected high-price home markets the most (-11%), low-priced homes not at all (+5%), and the mid-price segment somewhere in between (-5%). More affluent homeowners – also tending to be concentrated in inner Bay Area Counties – were most affected: Higher-price home markets are typically much more sensitive to negative changes or uncertainty in financial markets. After 9/11, the Fed intervened to lower interest rates and support the economy, and the downturn passed, gradually transitioning into the subprime bubble.

The Subprime Bubble

The subprime bubble and crash was an anomalous situation caused by loose monetary policy, predatory lending practices, the abandonment of underwriting standards, dishonest financial engineering on Wall Street, bond-rating fraud, and irrational exuberance in financial markets. This led tens of millions of borrowers to take on purchase and refinance loans unaffordable from the moment deceptive “teaser rates” expired. (We believe giving vast numbers of loans to unqualified borrowers, then using these junk loans to create the “A” rated securities which almost caused a worldwide great depression to be anomalous. Perhaps we’re being naive.) When the music stopped, a crash in financial markets, and a tsunami of foreclosure and short sales created a fast, deep spiral of home-price declines.

The crisis resulted in large numbers of homes being sold for well below fair market value, which distorts the meaningfulness of median sales price changes during this period. Enormous median price declines occurred, sometimes exceeding 45% (see following charts). “Distressed” homes sold during the great recession at unnaturally depressed prices: These transactions typically entailed sellers, often banks, desperate to sell, and often entailed more hassle, time, uncertainty and risk for buyers. And the homes were often in significantly poorer condition than the norm.
Part of the definition for “fair market value” is that the seller is not in a situation of being forced to sell quickly. Sellers of foreclosures & short sales – whether homeowners or banks – were usually in urgent distress: This undermined fair market value and provided excellent deals for buyers and hedge funds.

Less expensive, less affluent, less financially sophisticated markets were hammered worst by predatory lending and subprime loans, seeing huge bubbles and crashes. The most expensive/affluent markets saw much smaller bubbles, and smaller, but still significant price declines, probably caused more by the financial markets crash than by a relatively low number of distressed-home sales. Effects varied greatly by community within counties, generally correlating to cost/affluence: Prices in less expensive markets often dropped twice as much as in more affluent communities within the same county.

The next 2 charts look at this period first by price segment, then at the size of subprime-bubble price declines by county.

Recovery from the Subprime/Financial Markets Crash

Generally speaking, Bay Area real estate markets began their sustained recovery from the effects of the subprime-loan bubble/financial market crash/distressed-property crisis in 2012. An unusual mix of factors subsequently came into play behind the highest rates of appreciation:

1) Whether the county was one of the three at the very heart of the high-tech, venture capital/start-up and IPO booms: San Francisco, San Mateo & Santa Clara

2) Whether the county was adjacent to (or across a bridge from) the 3 central counties, but offered significantly more affordable home prices: Alameda was the prime example

3) Whether the county was rebounding from a distinctly outsized crash following the subprime bubble, when their overall markets were utterly dominated by foreclosure & short sales: For example, Contra Costa (especially north county markets); Napa; Alameda (especially Oakland); Solano; Sonoma

Post 2012, the Bay Area became the center of another huge boom in high-tech, with a historic increase in new businesses, start-ups, venture capital and jobs (approximately 700,000) – many of them very well paid. An enormous increase in affluence occurred, and the population soared without a corresponding increase in new home construction, which put tremendous upward pressure on home prices.

The next chart illustrates approximate home-price appreciation rates from 2012 to Spring 2020, when the pandemic struck – which unexpectedly supercharged the upcycle for another 2 years.

Note that broader upcycles often include market fluctuations and shorter-term slowdowns – not illustrated in this report – before the market recovers and moves forward again. This occurred in midlate 2015 (Chinese stock market crash, oil price crash, U.S. stock market volatility), and mid-late 2018 (rising interest rates, declining stock markets). The Fed intervened in 2019, and then again massively in 2020/2021 to reduce interest rates and fuel the economy – adding perhaps too much fuel for too long.

Important notes and caveats regarding the context and methodology of this report are detailed on the last page.


The Pandemic Market

Since the pandemic struck in Spring 2020, Bay Area real estate markets have been affected by many diverse and shifting factors, some of them unique to the period. These include population-density and contagion issues; shelter-in-place and its varying effects on urban, suburban and rural environments; work-from-home upending the relationship between home location and workplace; trillions of dollars of free money issuing from state and federal governments; the Fed interventions causing the historic plunge in interest rates (through 2021); a renewed, pandemic boom in high-tech; an astounding surge in stock markets and household wealth (through 2021); the rollout of vaccines; infection rate surges; as well as other ecological, political, economic and social factors (fires, taxes, unemployment, family care, etc.).

These factors, as they applied in their various combinations to millions of households, prompted big changes in county-to-county migration; the comparative appeal of urban, suburban and rural locations; the desirability of different property types (houses, condos, apartments) and amenities (pools; yards, gardens and decks; home and lot size); a heightened attention to housing affordability between regions (now that many could work from anywhere); and surging luxury home and second-home sales. Waterfront homes, in particular, became highly sought after. Some changes have ebbed and flowed over the period.

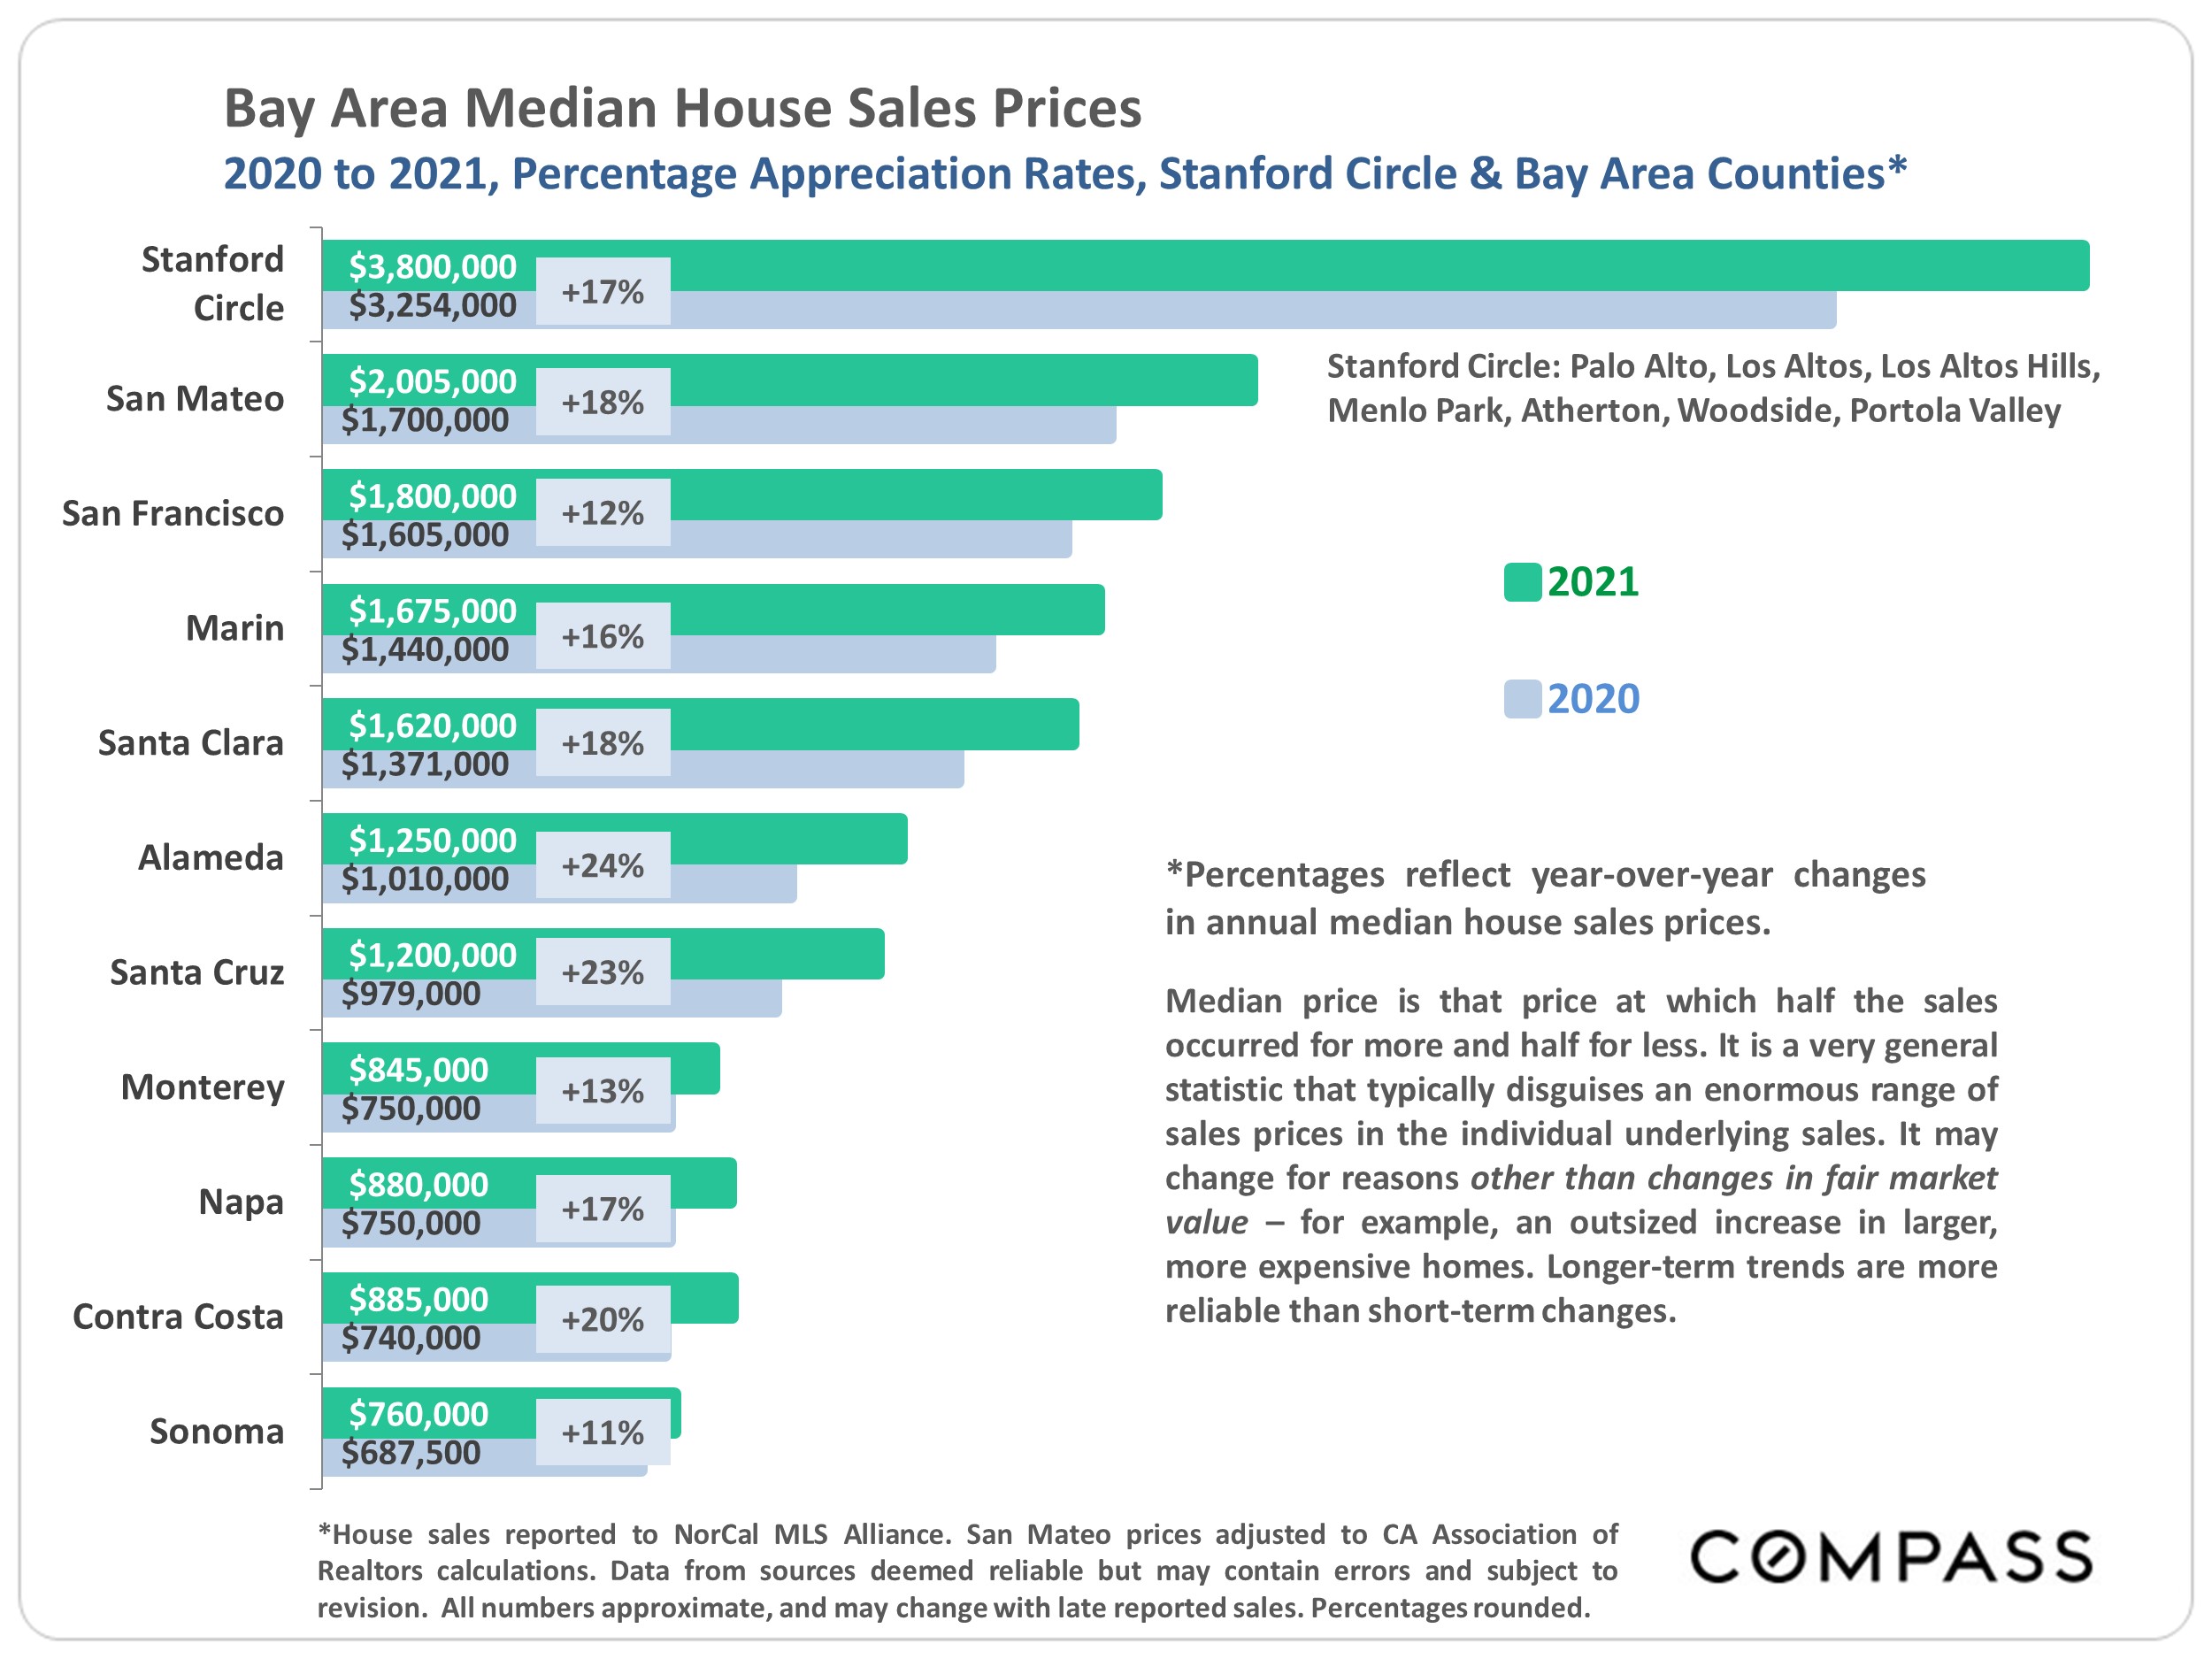
All this brought about striking changes in market dynamics and appreciation rates. Some of the larger trends were significant population movements from expensive, urban markets to suburban and rural areas. In the immediate aftermath of the pandemic, this migration precipitated a distinct weakening of rental and condo markets (which subsequently saw recoveries in 2021/2022). Some counties saw disproportionate increases in sales of larger, more expensive homes, a big factor in boosting median sales prices: This affects apples-to-apples comparisons of appreciation rates between counties.

The following chart illustrates approximate home-price appreciation rates from Spring 2020 to Spring 2022, i.e. during the first 2 years of the pandemic. Note: In early 2022, major macroeconomic changes – soaring inflation and interest rates and volatile stock markets – hit the economy, but through May 2022, median home prices continued to increase. As of June, there are strong indicators of a shift to a slower, cooler market, but it is too soon to make predictions.

Median Home Prices Hit New Highs in Spring 2022, But Effects of Major Macroeconomic Changes Pending

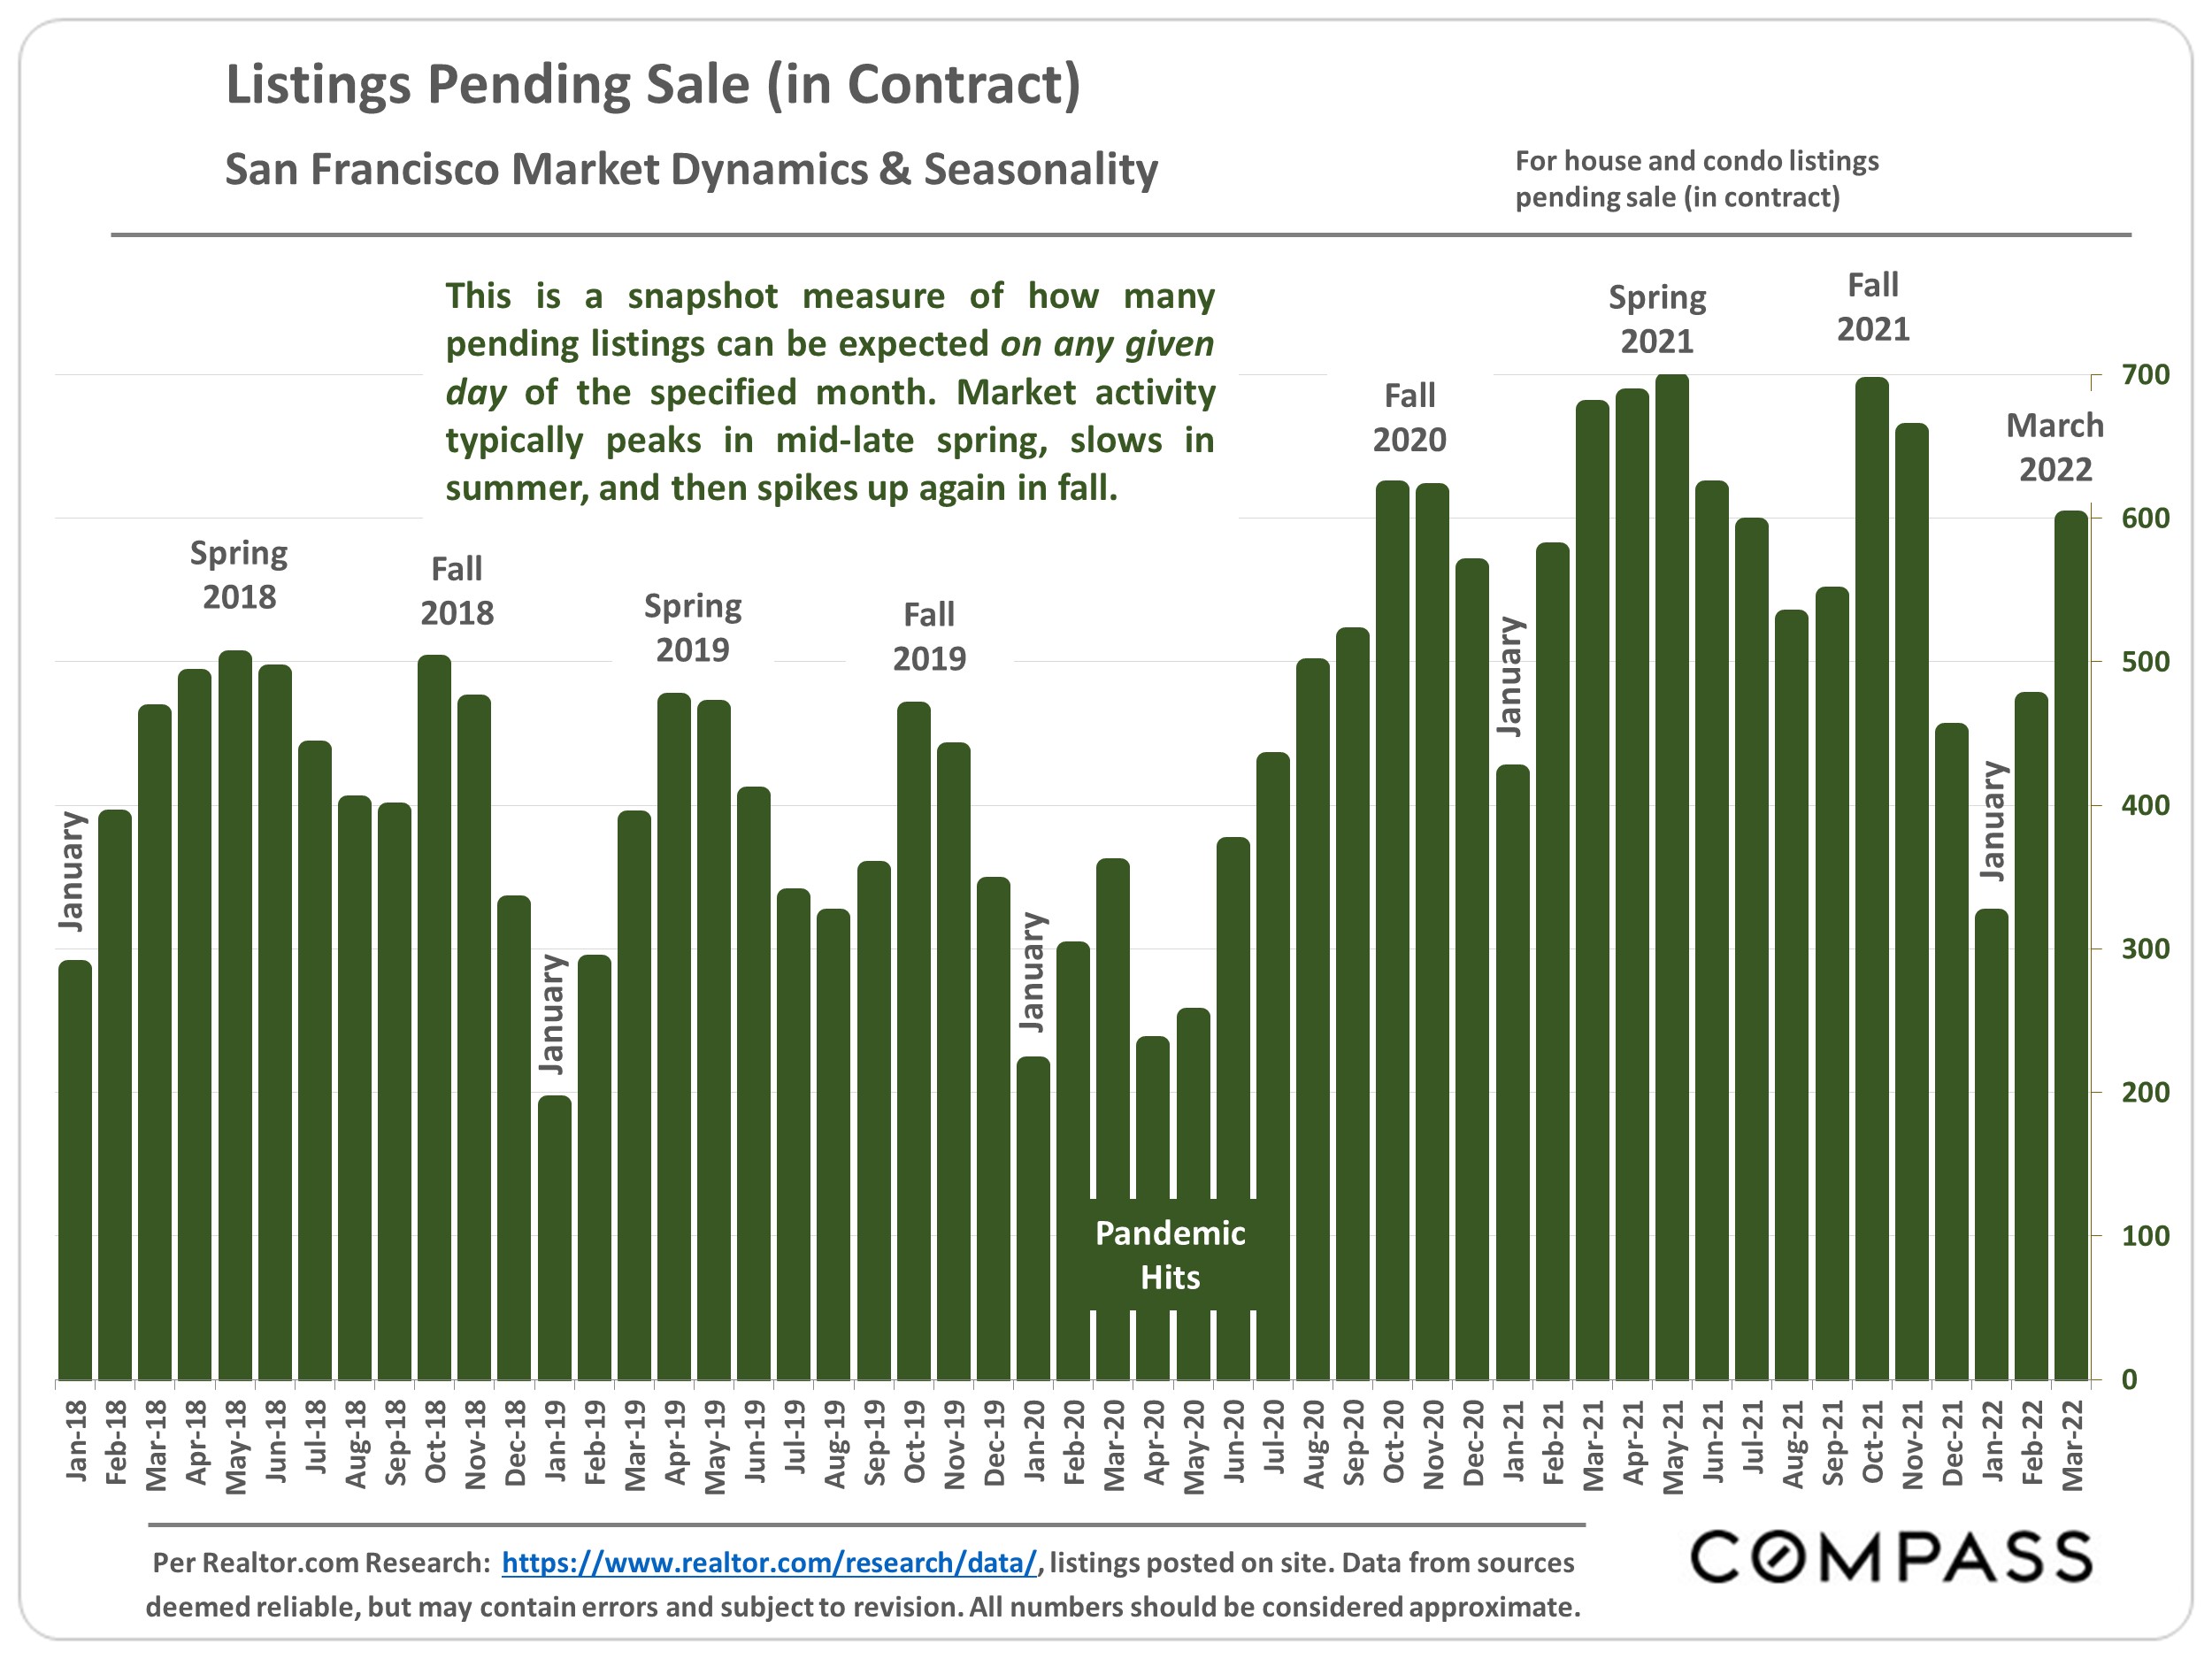
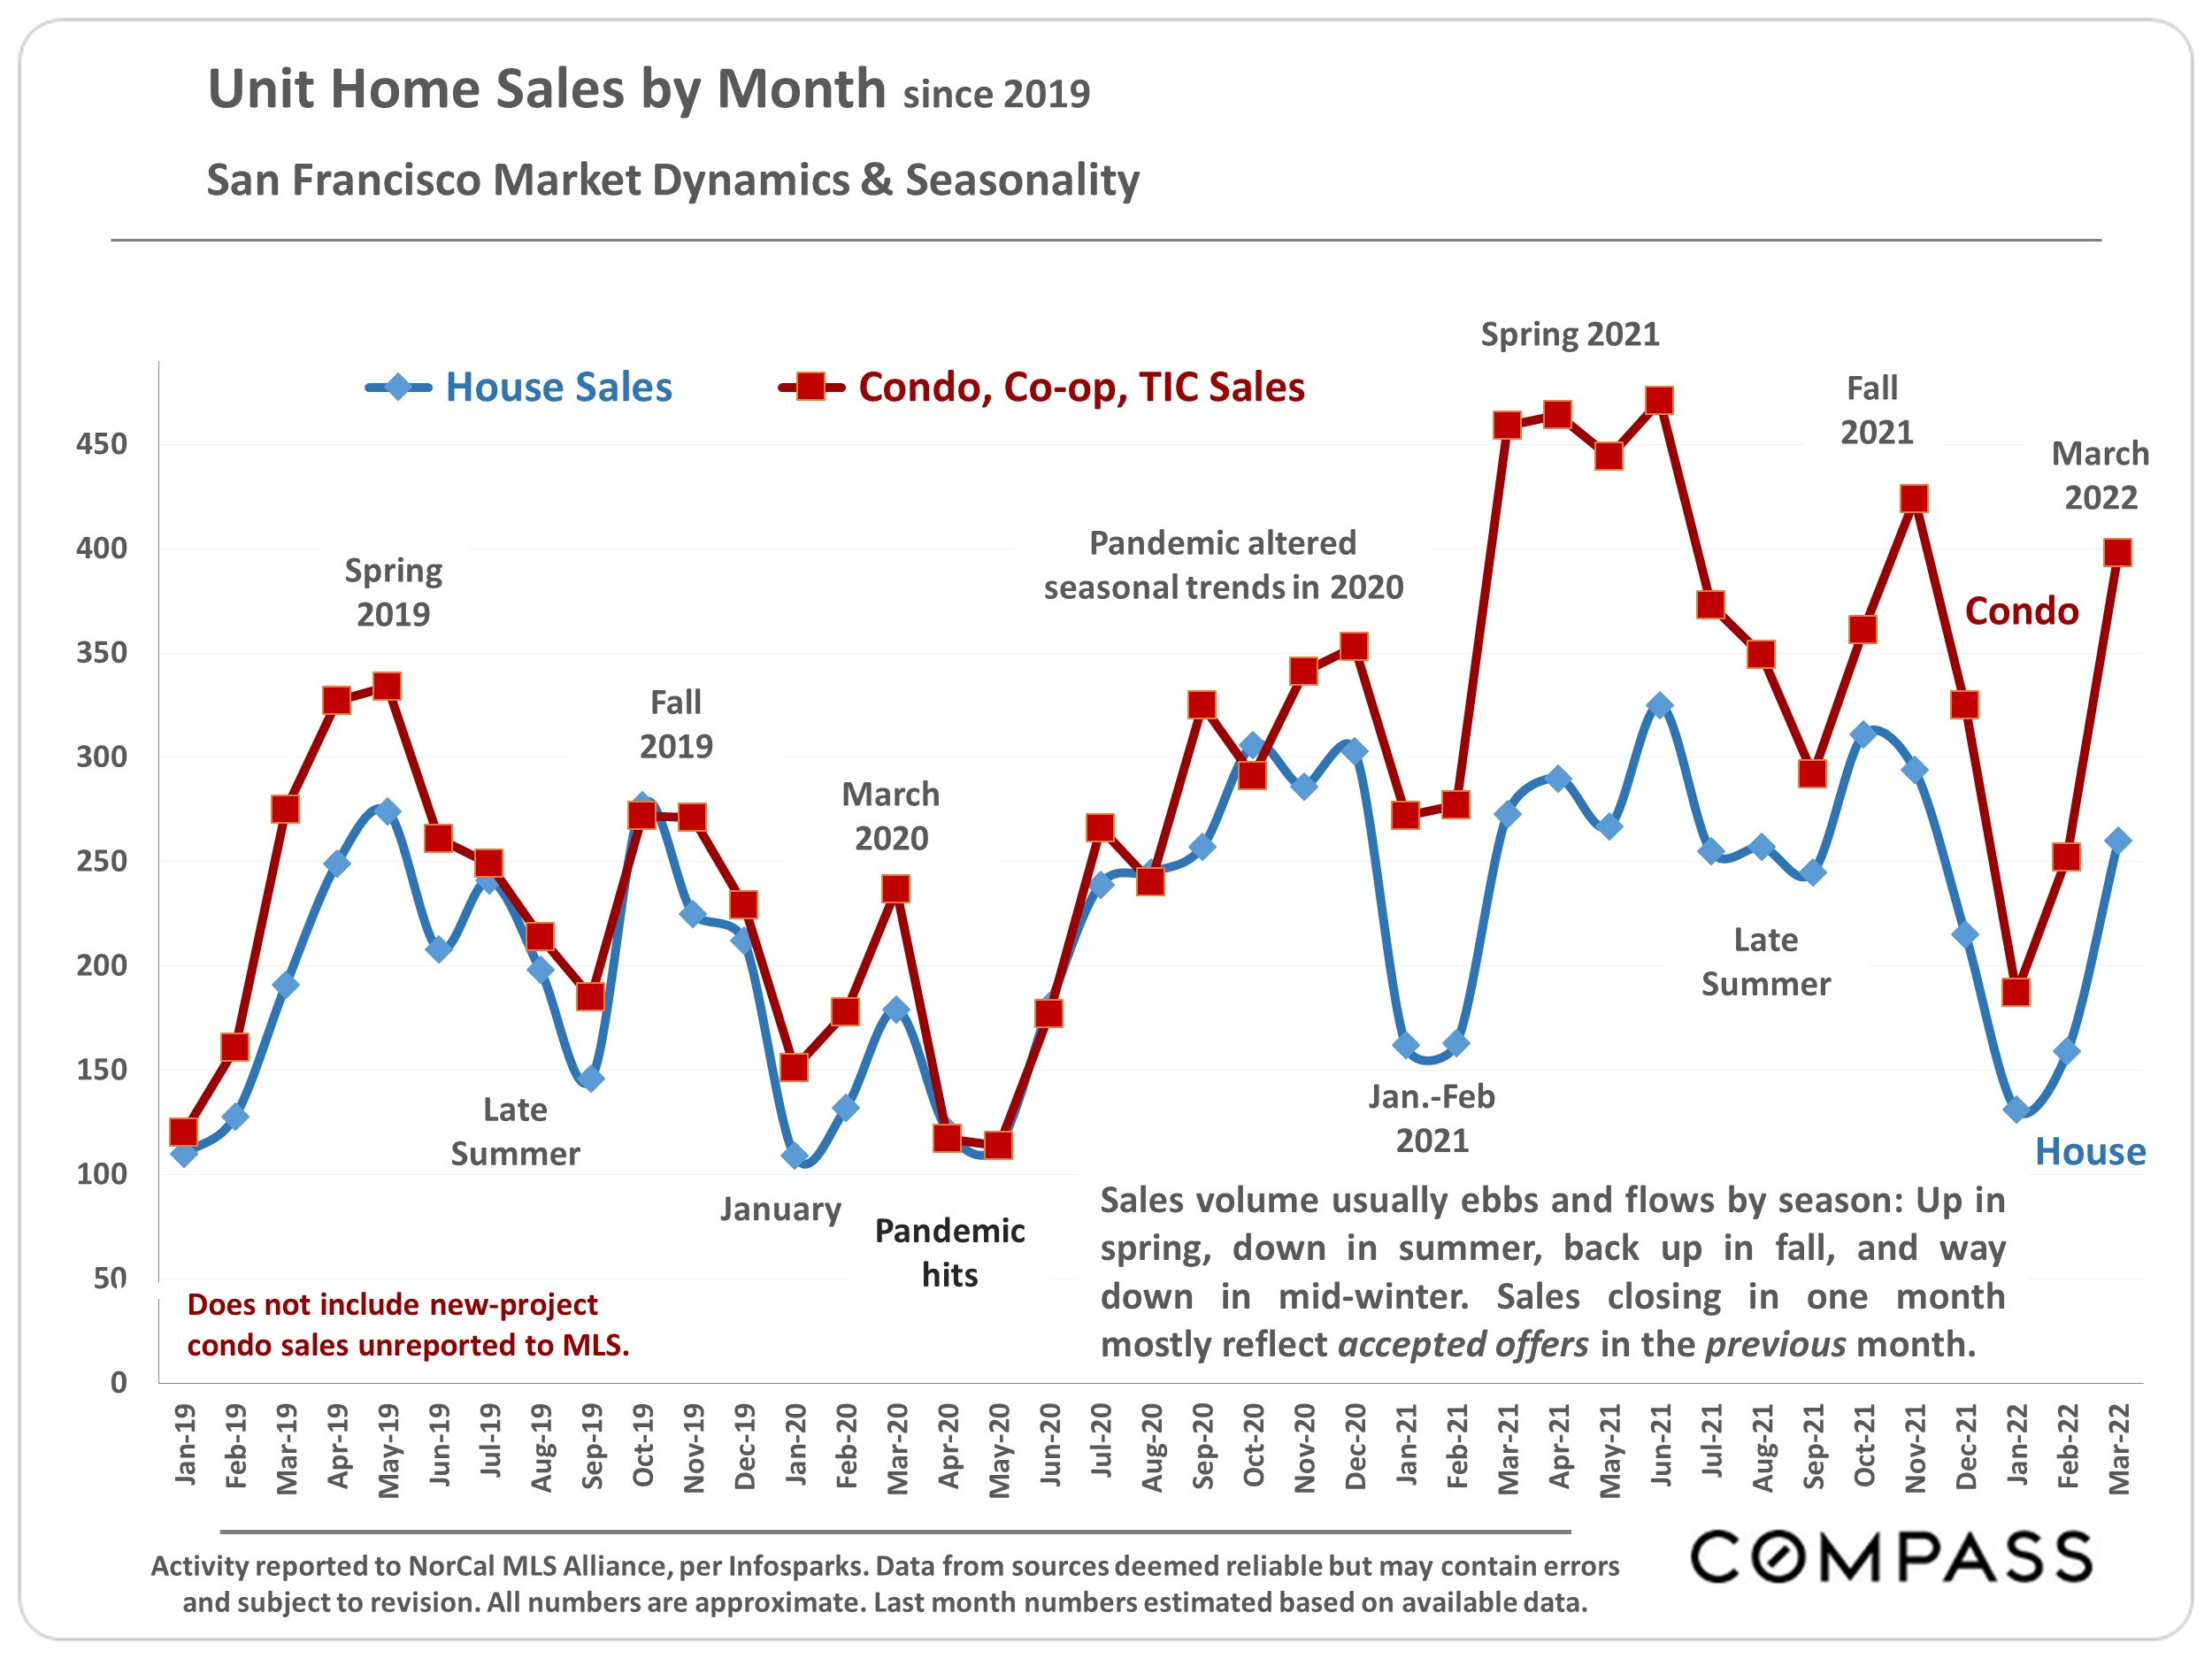
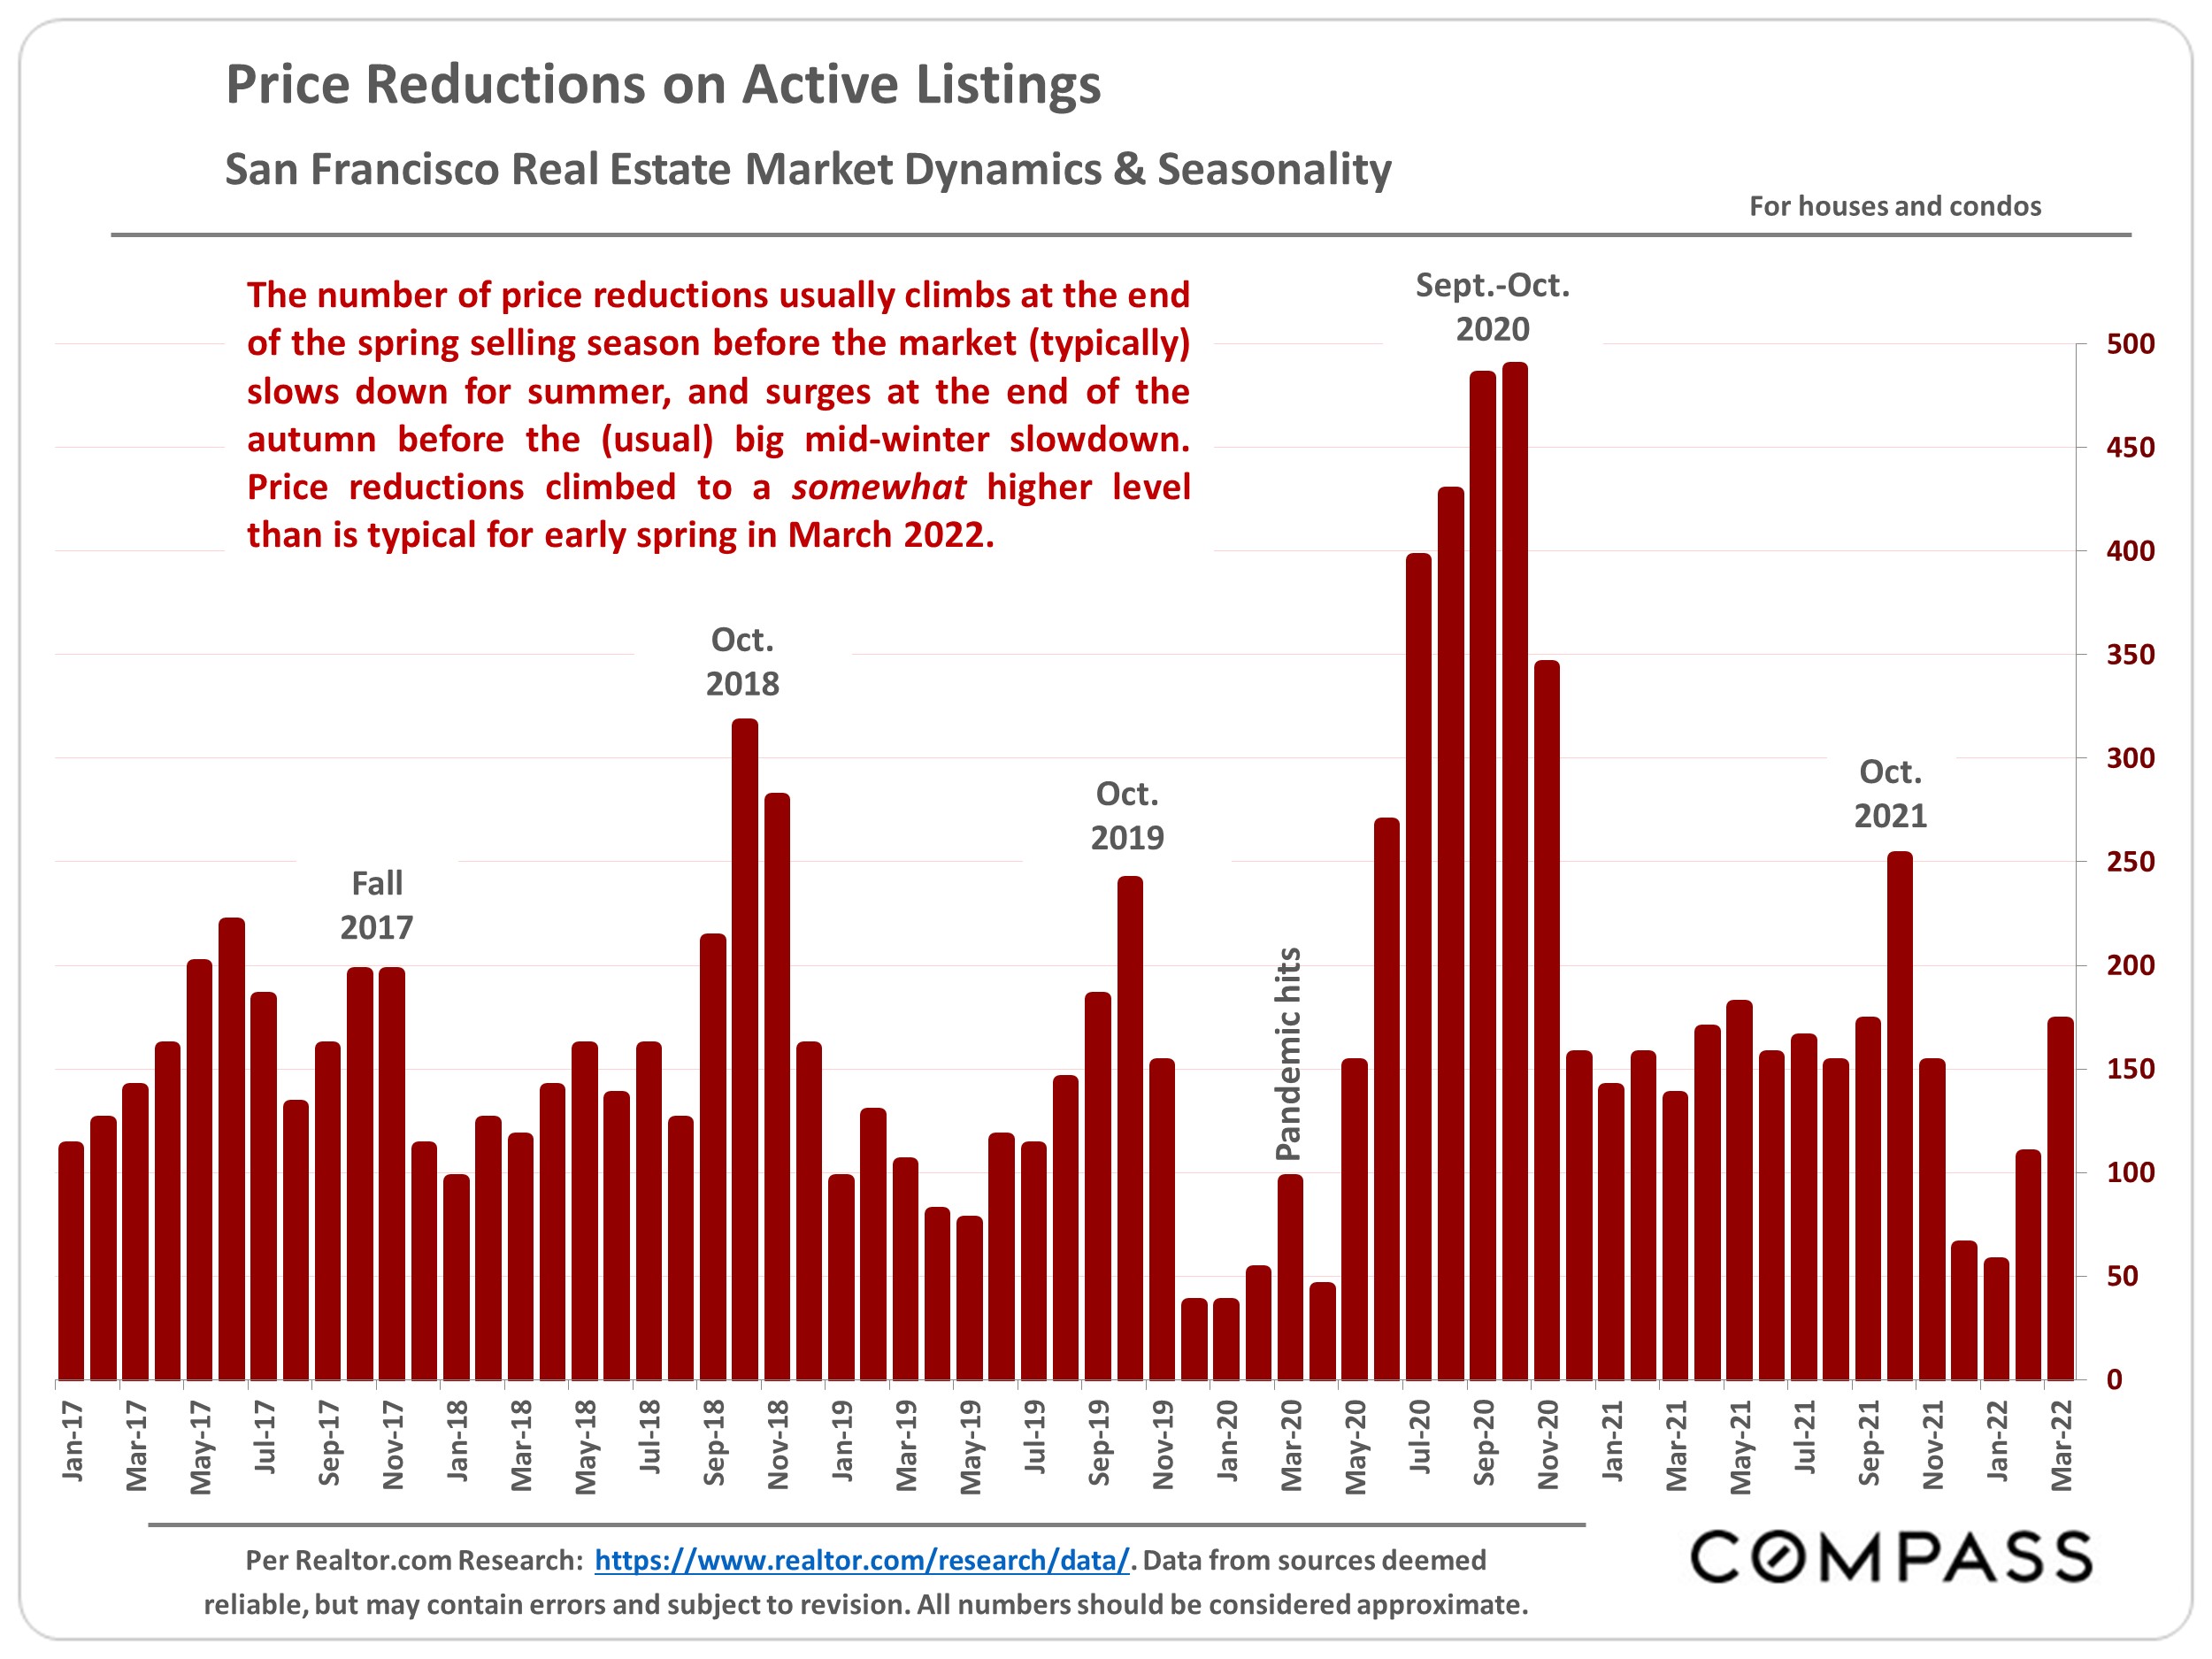
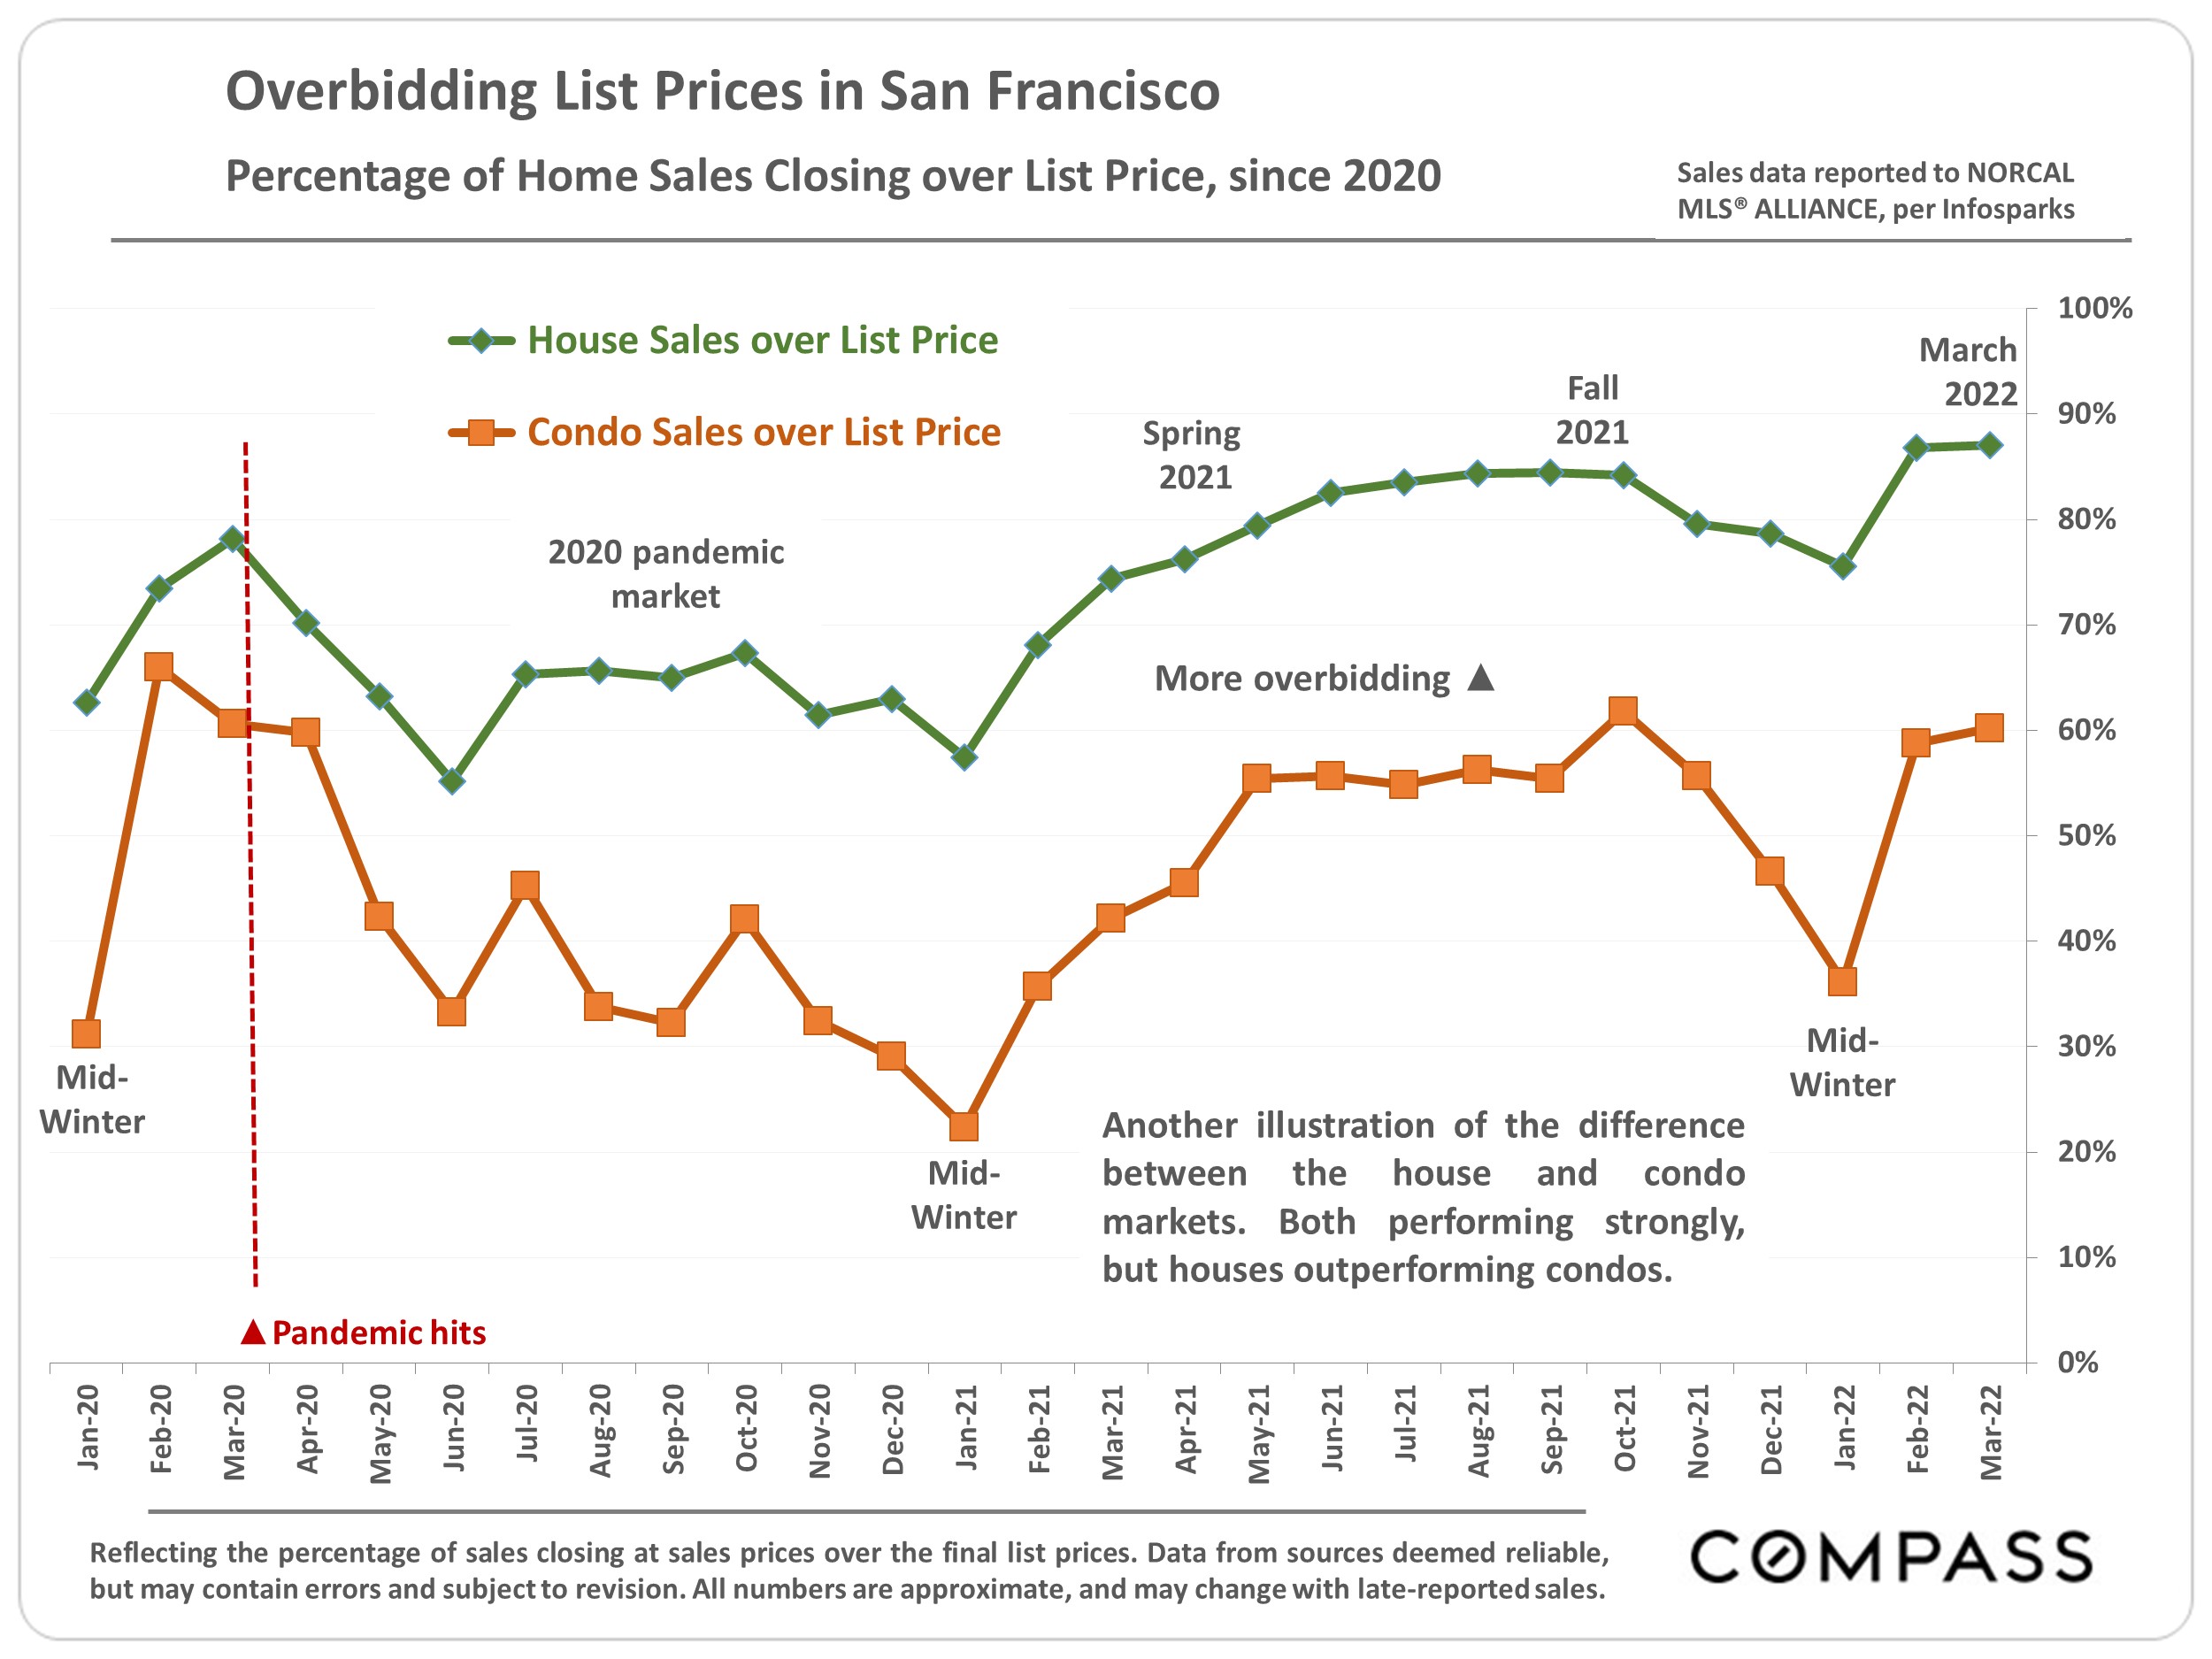
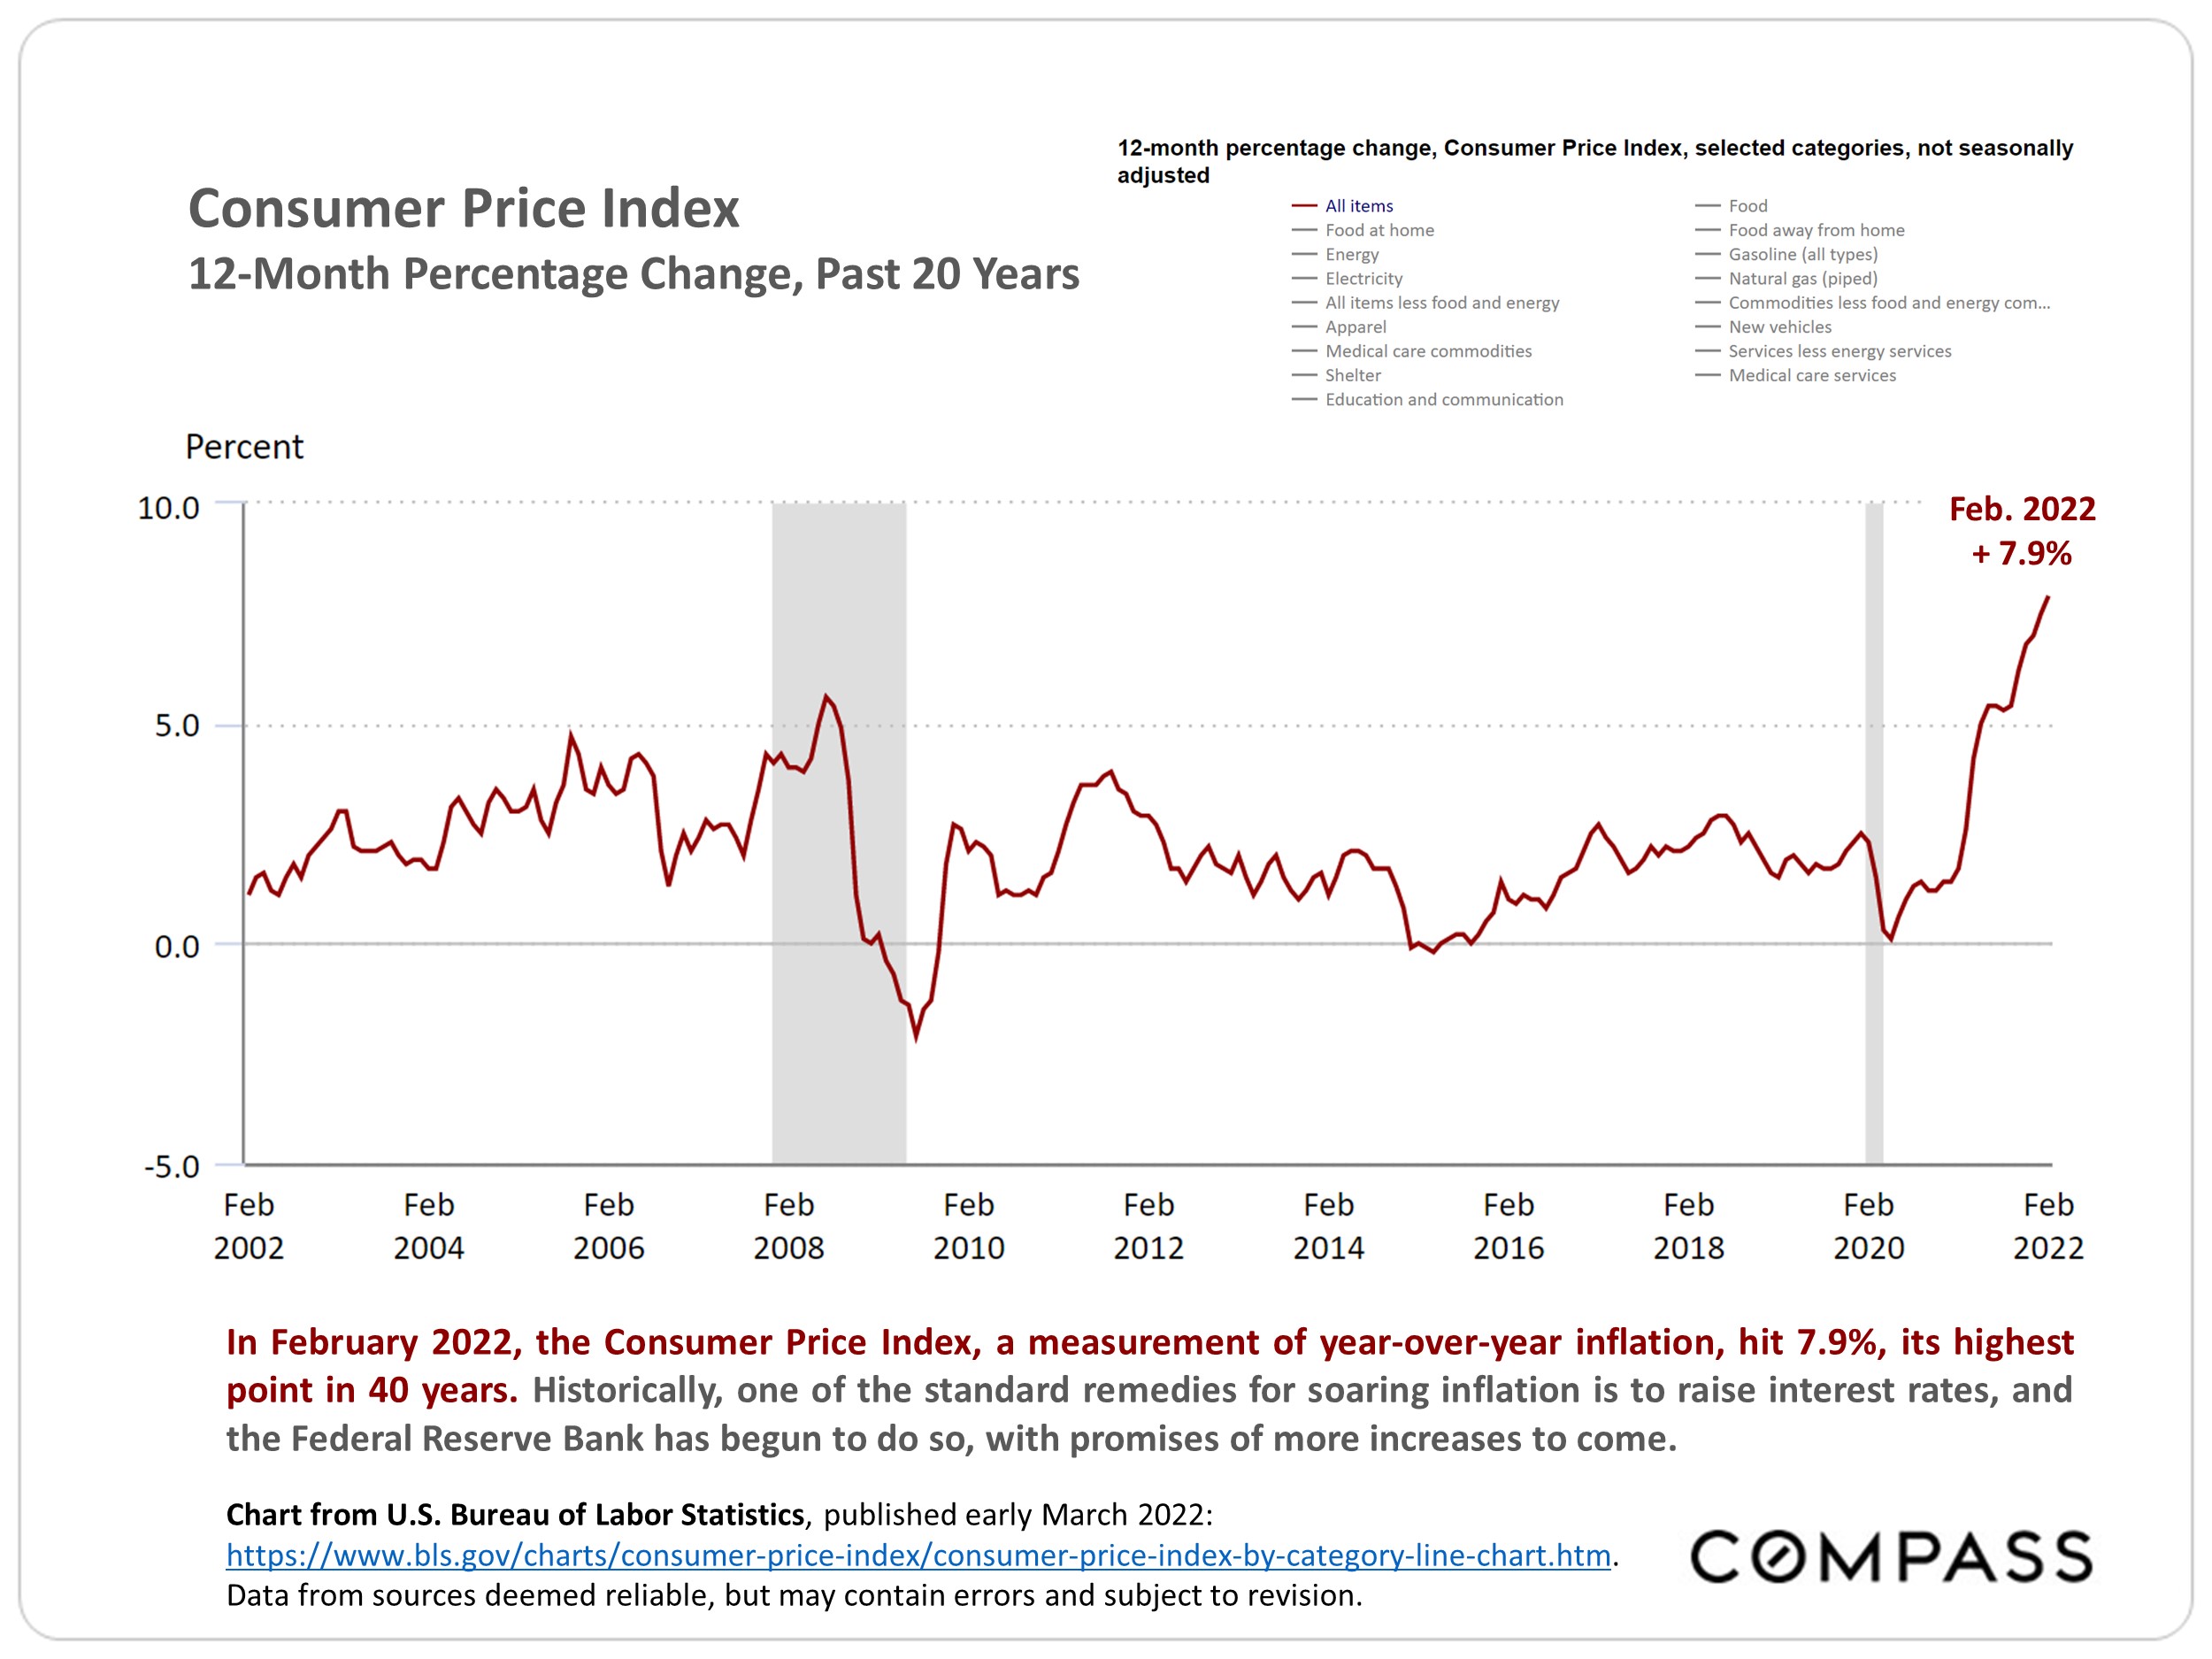
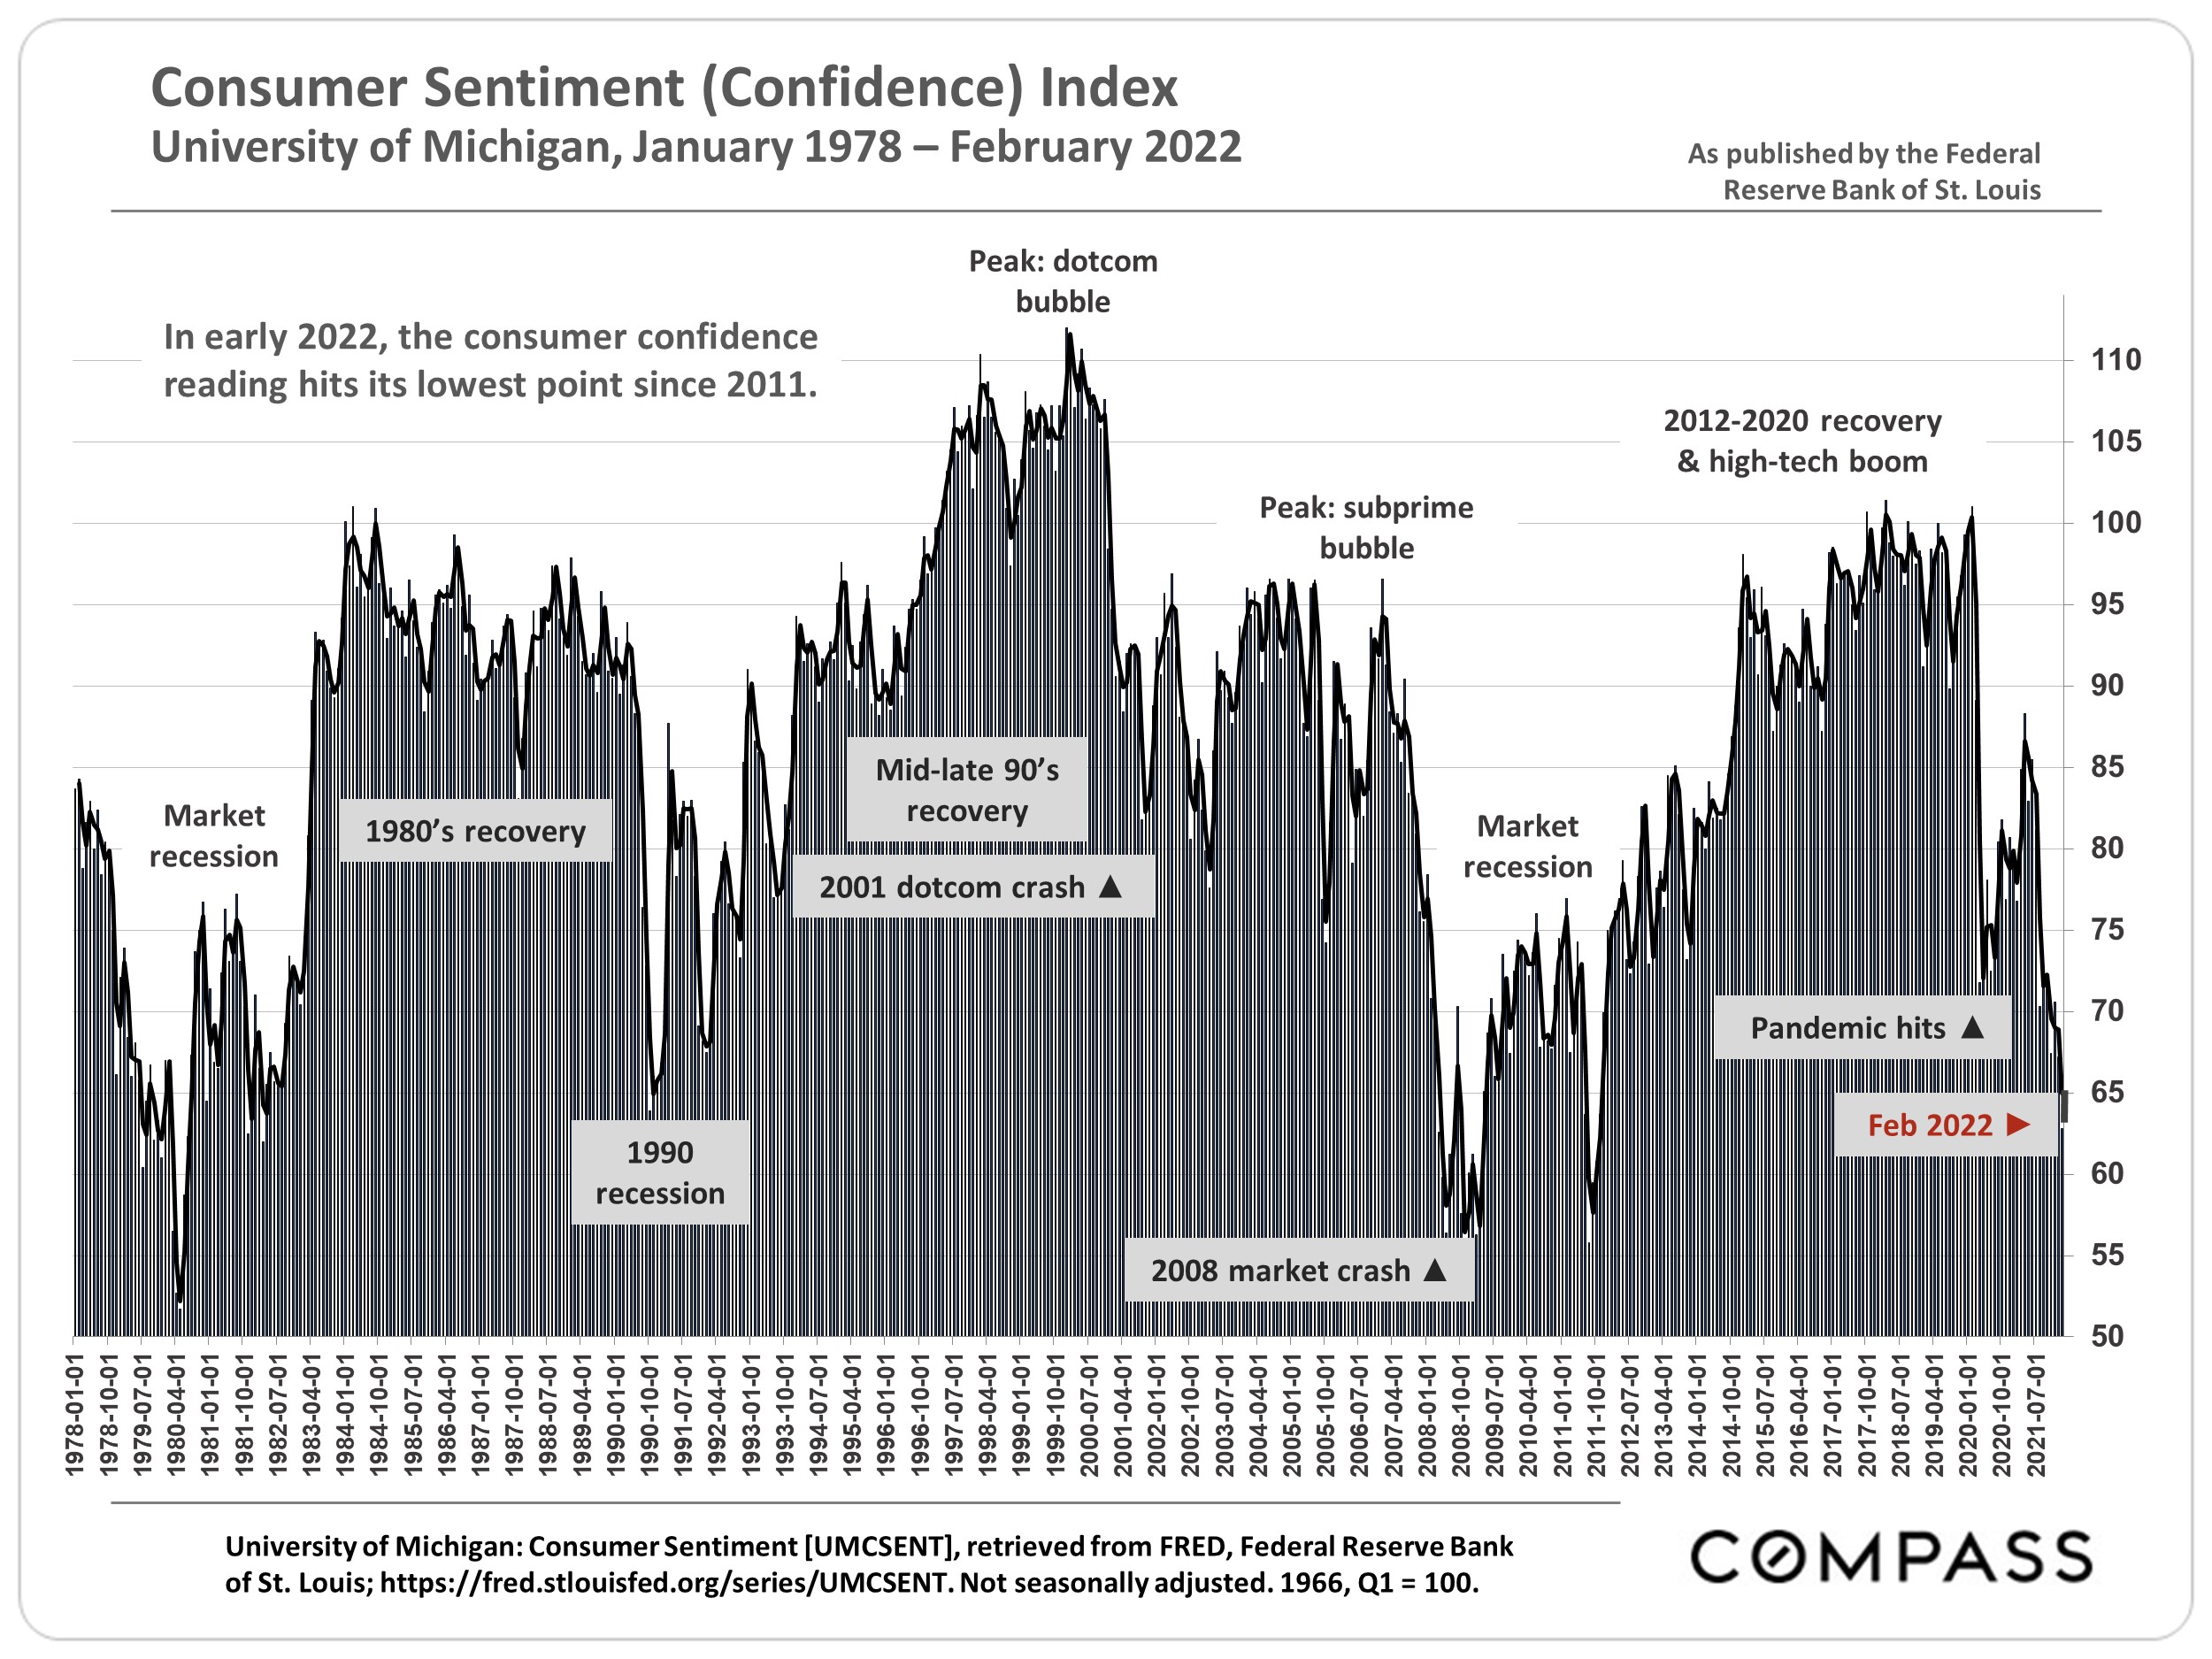
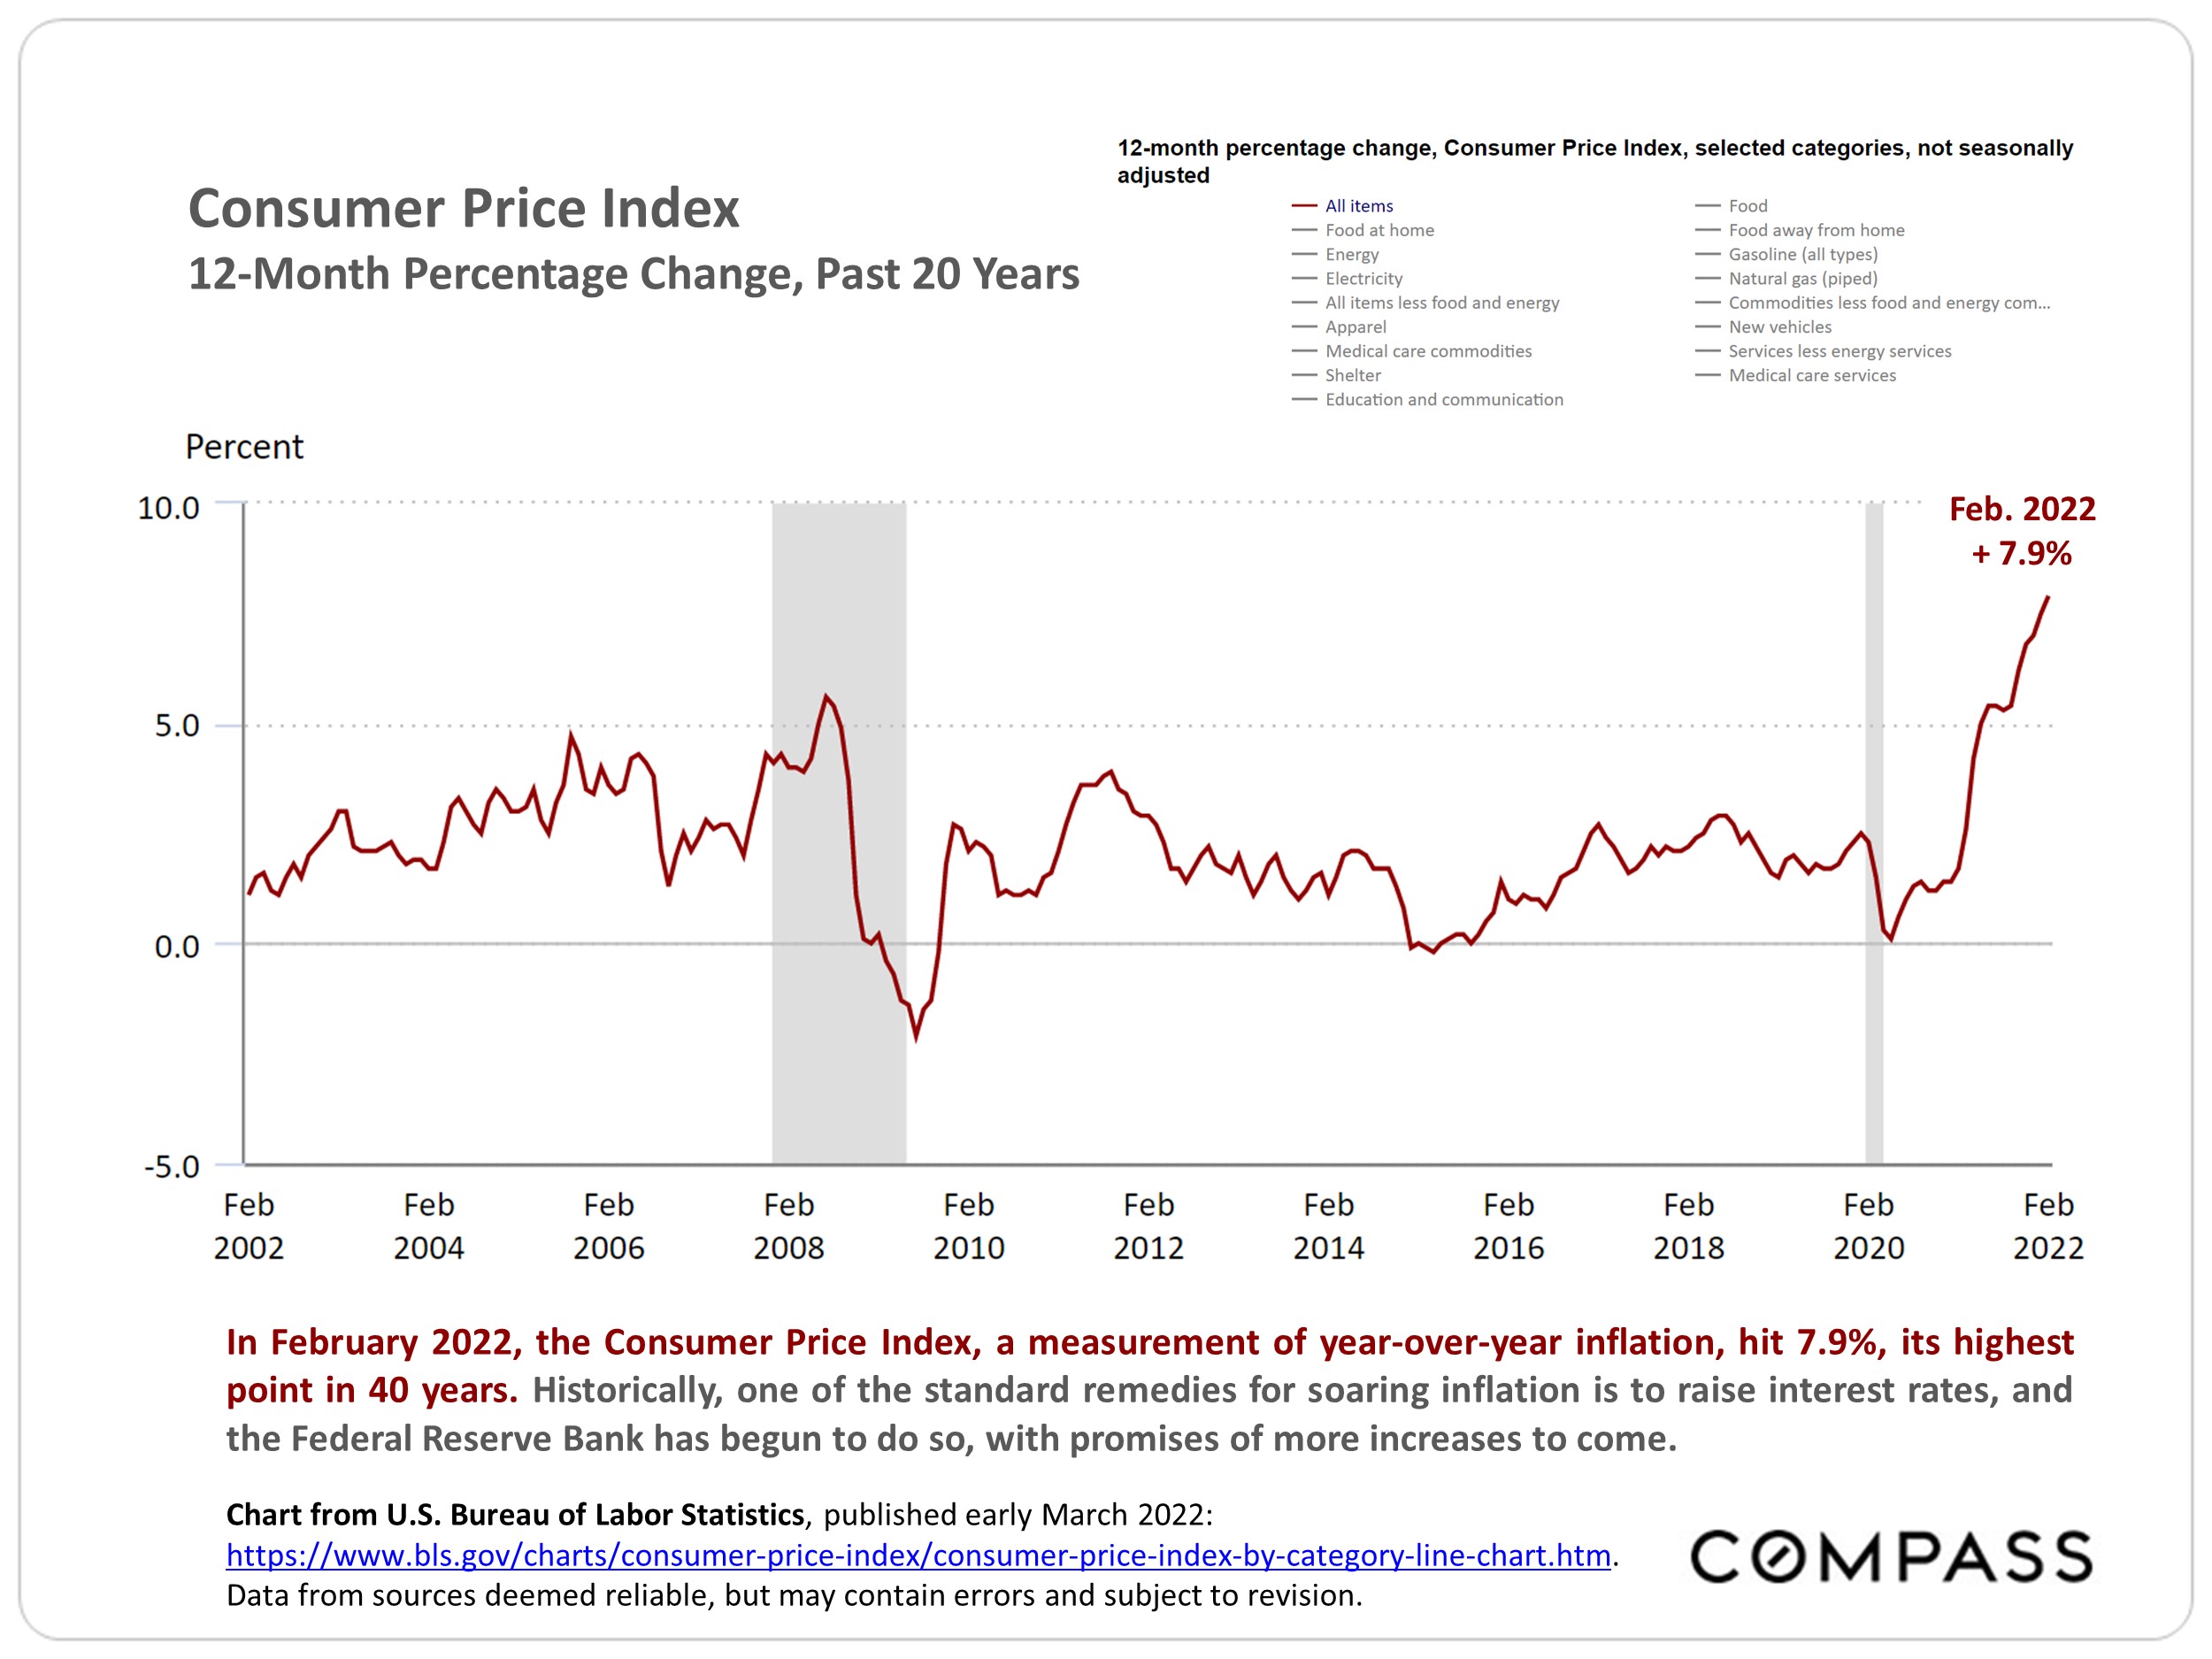
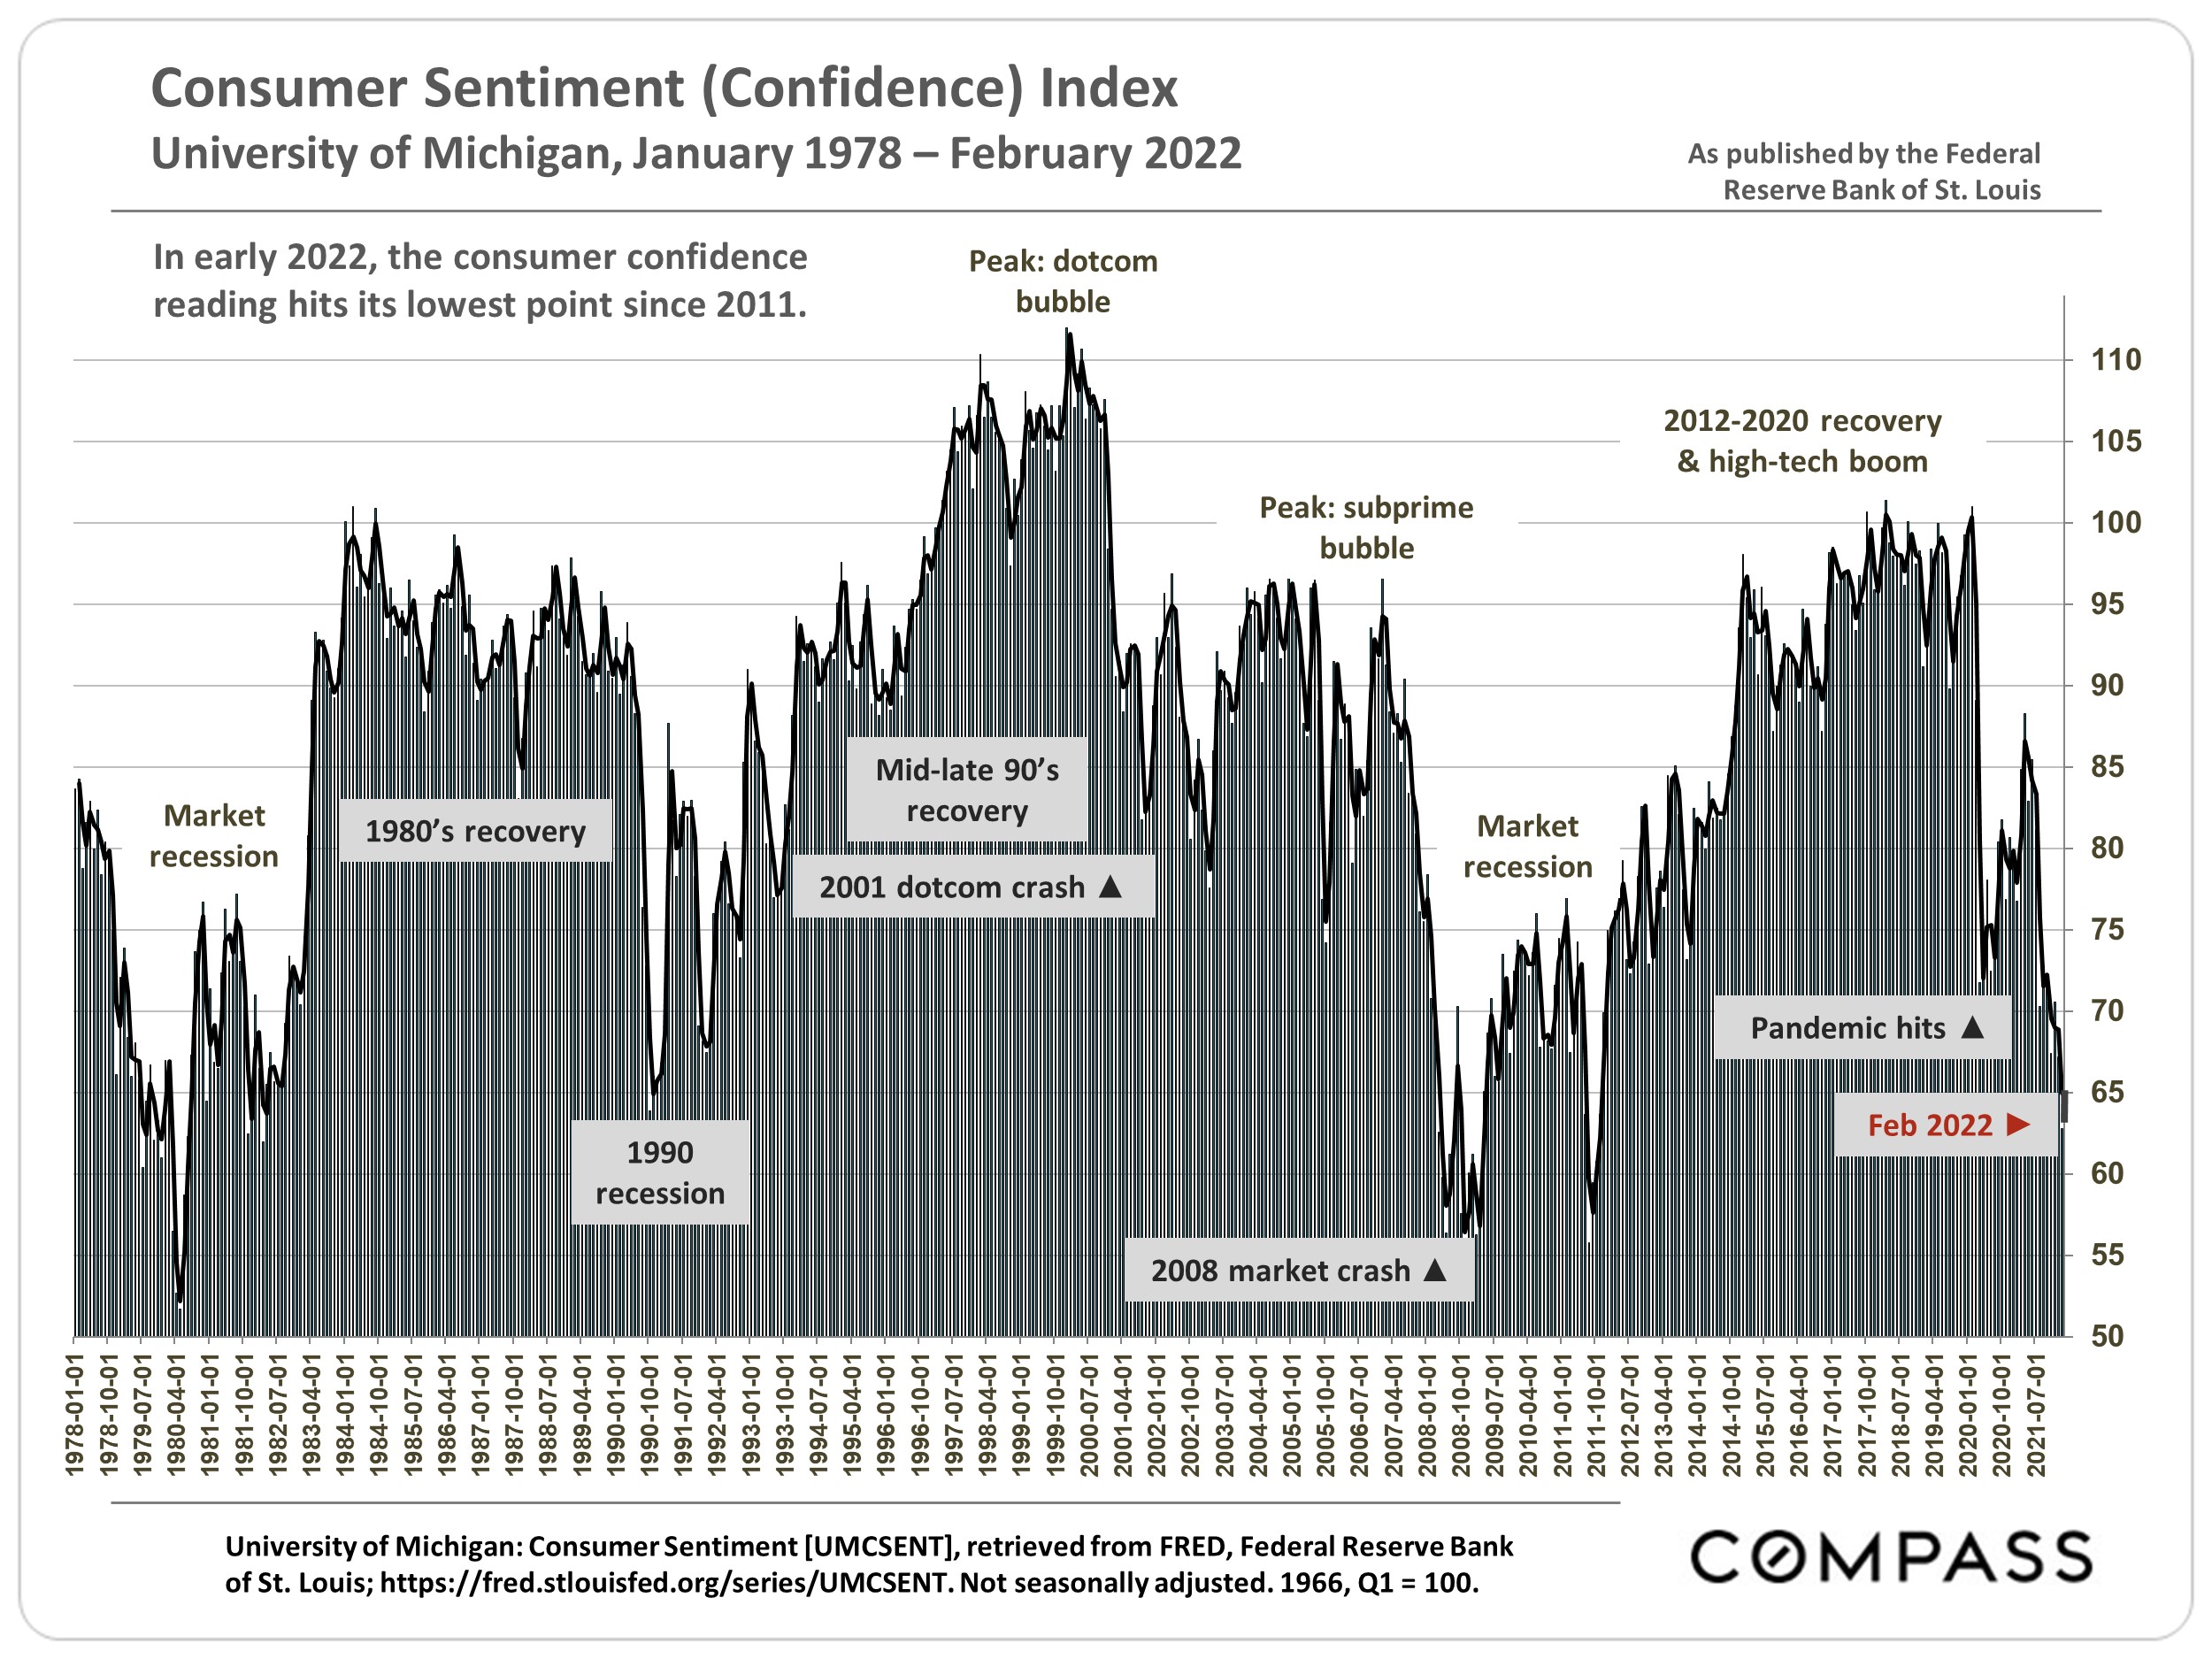
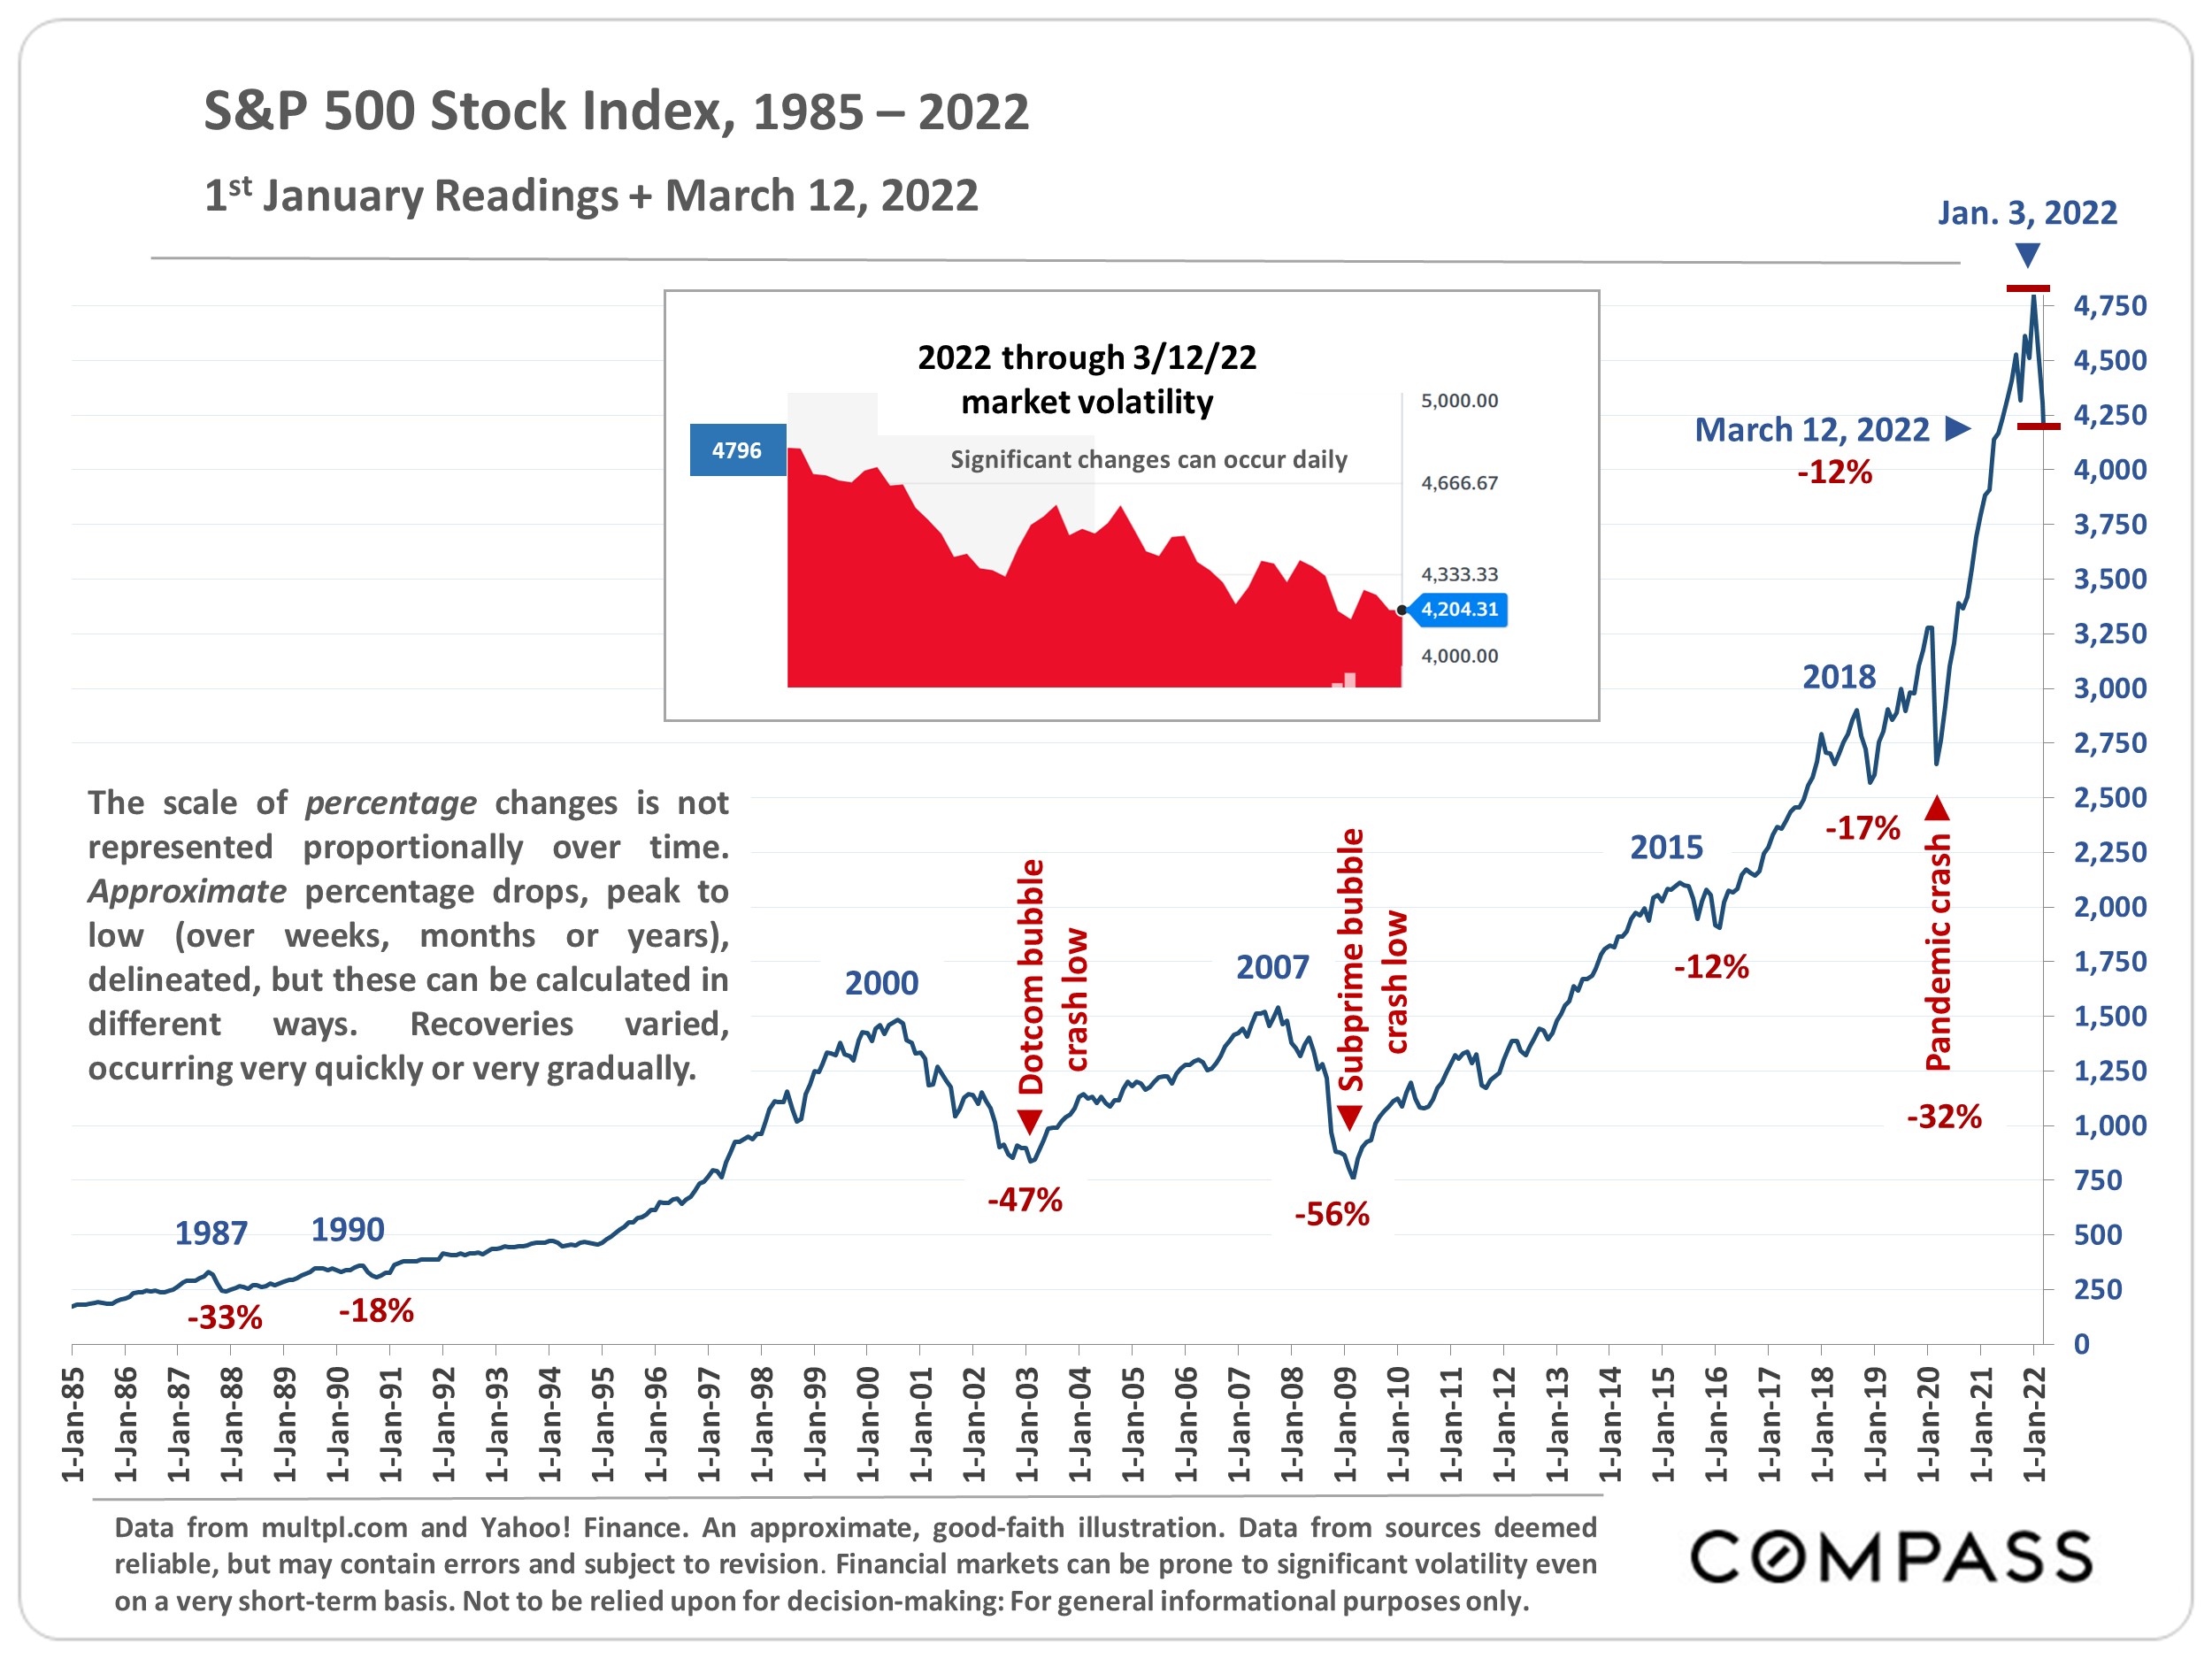
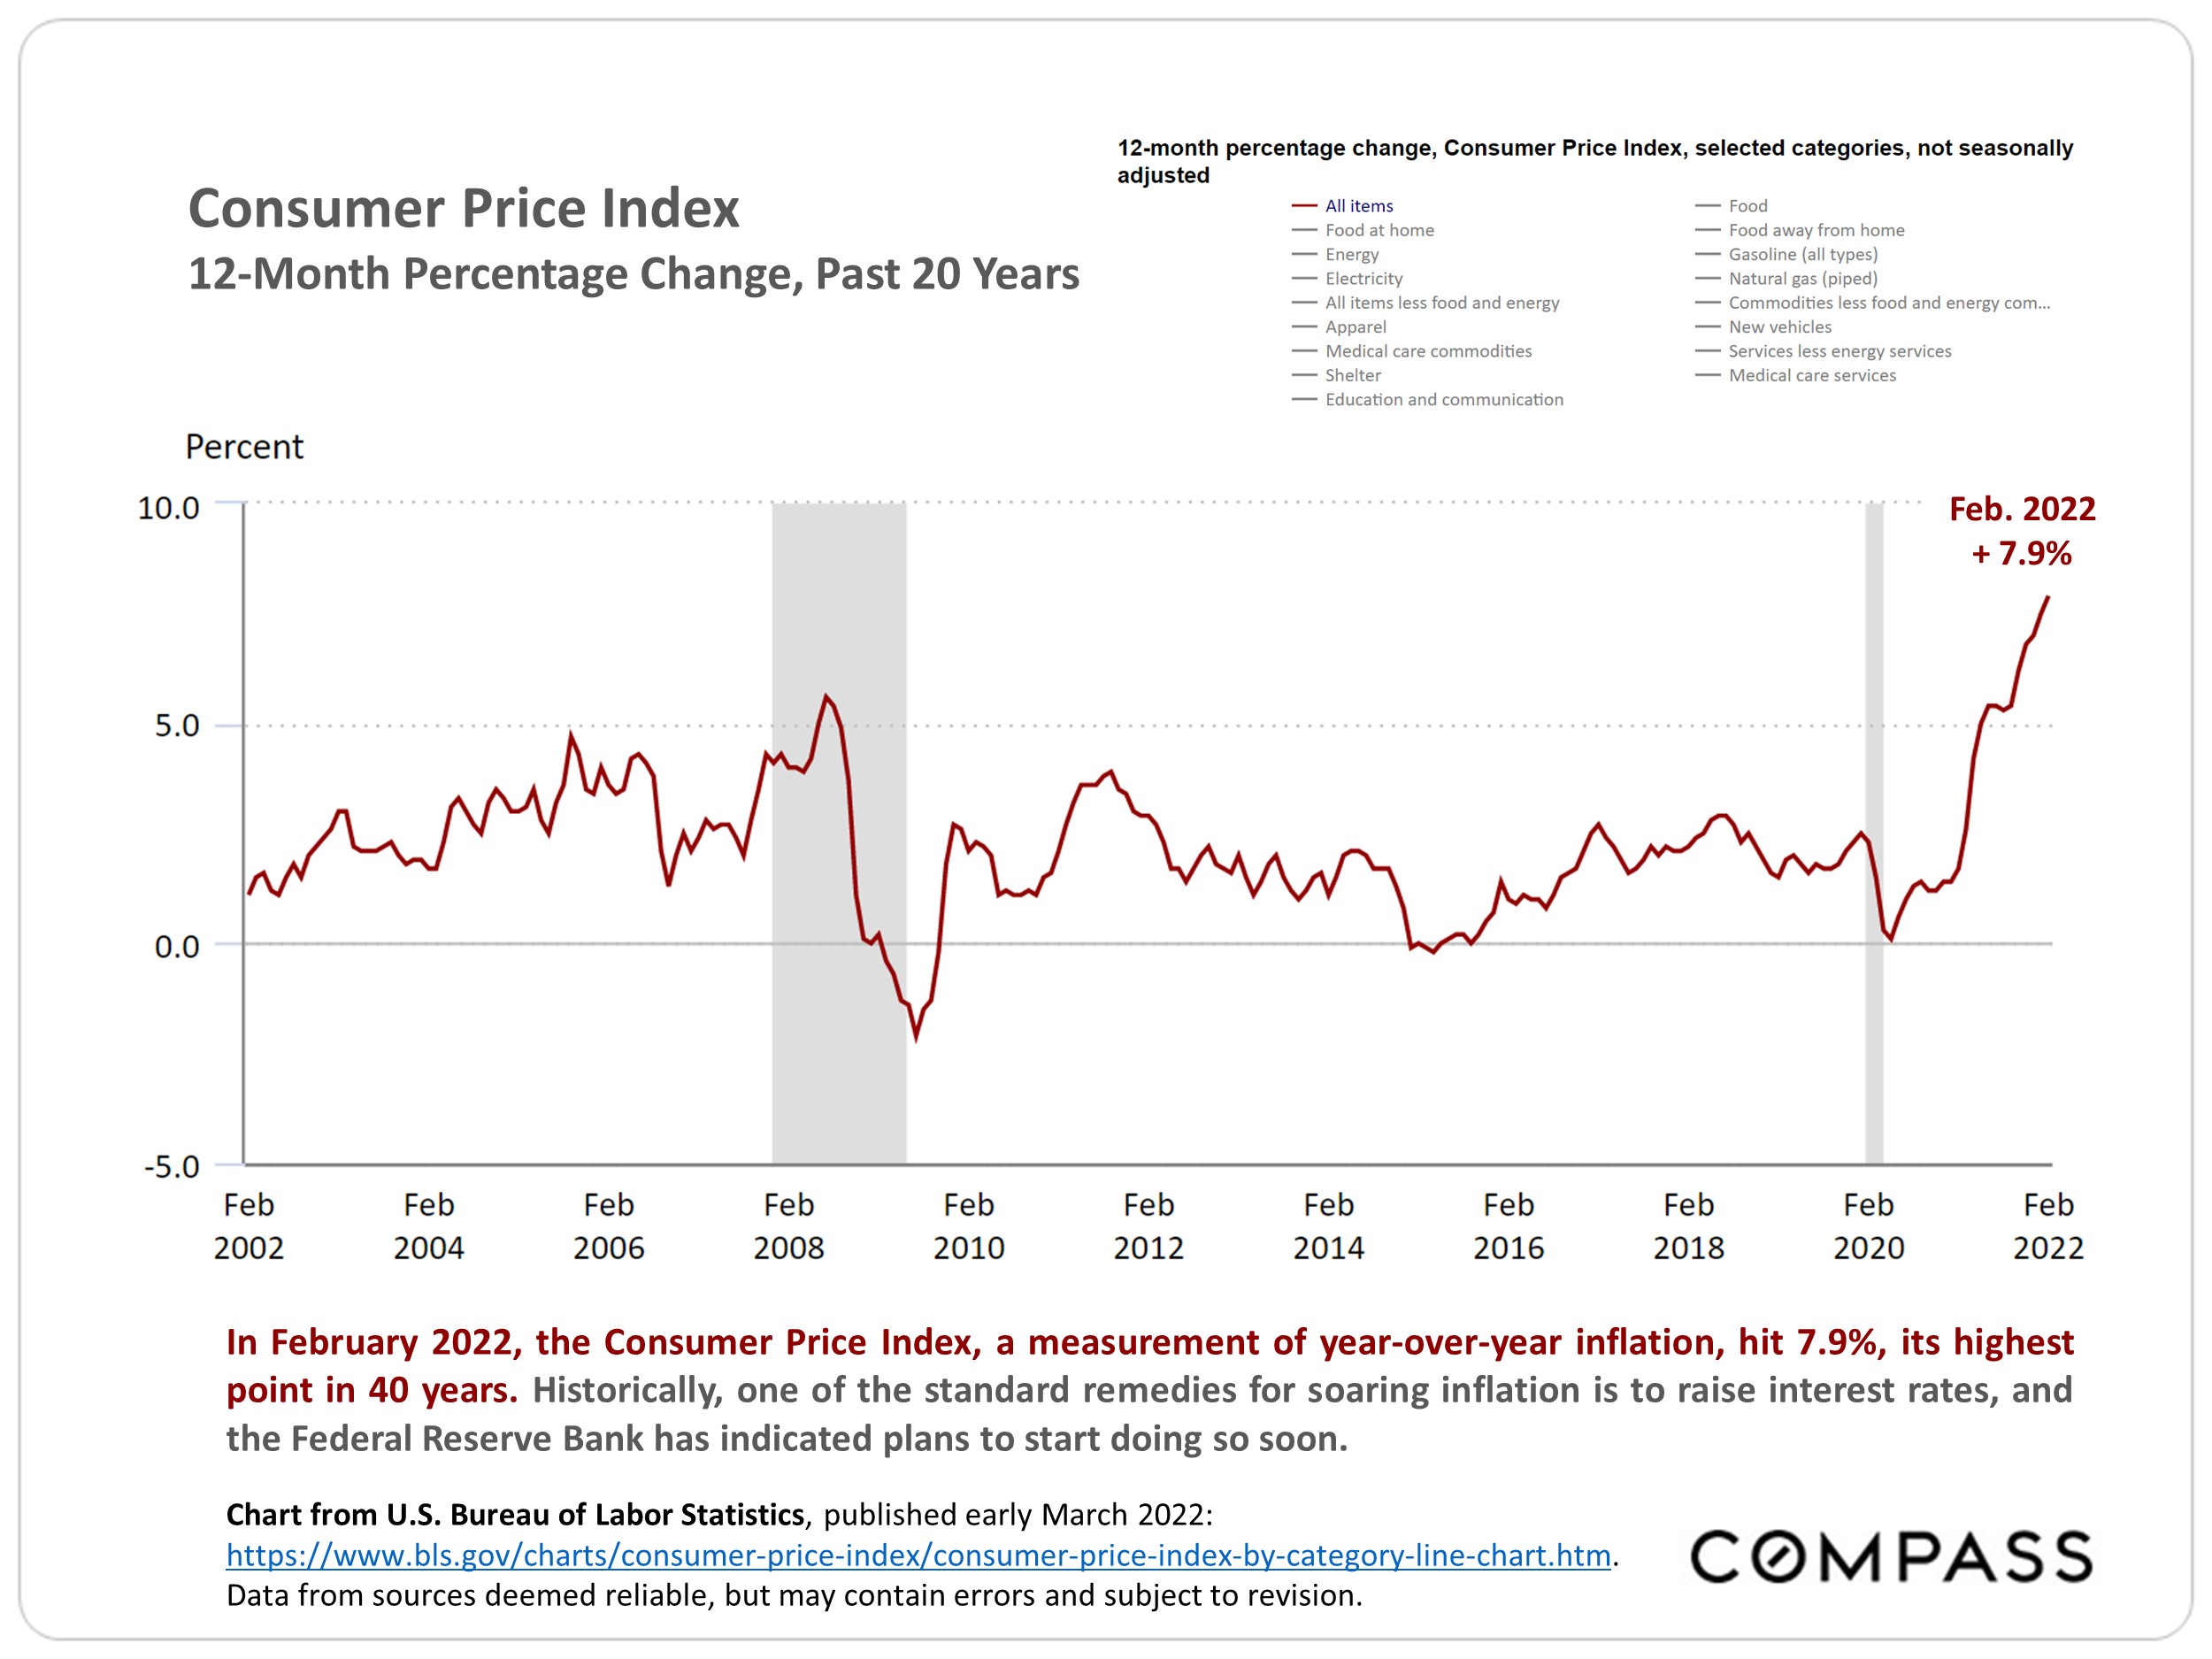
Bay Area home markets through Spring 2022 generally continued to see home-price gains to new peaks. However, interest rates soared over 80% in the first 6 months of the year, and stock markets have experienced high volatility with significant declines. Inflation is at a 40-year high and consumer confidence is at an all-time low (going back to 1957). The effects of these changes have begun filtering through to the market – as seen in declines in demand and the number of offers received on new listings and overbidding, increases in the supply of active listings for sale and price reductions, and drops in sales volumes and, especially, the number of listings going into contract. Closed sales are lagging market indicators, reflecting new listings coming on market, interest rates, and offers being accepted 4 to 8+ weeks earlier.

What exact effects these recent economic changes may have on home prices are yet unknown. The very high year-over-year appreciation rates have begun to decline. Excepting the extremely abnormal circumstances of the 2008 crash (when tens of millions of households had to sell or lost their homes to foreclosure), other “corrections” over the past 30 years have more typically seen median sales prices flattening or declines of 5% to 10%, but whether that will occur now remains to be seen.

It is extremely difficult, if not impossible, to predict the effects of the almost infinite variety of economic, political, demographic and environmental factors – arising, changing and interacting locally, nationally and internationally – that can impact financial and real estate markets. At the end of this report is a link to a review of various macroeconomic factors.

A more detailed explanation of context, methodology and caveats can be found at the end of this report.

Source: Compass

It is impossible to know how median and average value statistics apply to any particular home without a specific comparative market analysis. These analyses were made in good faith with data from sources deemed reliable, but may contain errors and are subject to revision. It is not our intent to convince you of a particular position, but to attempt to provide straightforward data and analysis, so you can make your own informed decisions. Median and average statistics are enormous generalities: There are hundreds of different markets in San Francisco and the Bay Area, each with its own unique dynamics. Median prices and average dollar per square foot values can be and often are affected by other factors besides changes in fair market value. Longer term trends are much more meaningful than short-term.

Compass is a real estate broker licensed by the State of California, DRE 01527235. Equal Housing Opportunity. This report has been prepared solely for information purposes. The information herein is based on or derived from information generally available to the public and/or from sources believed to be reliable. No representation or warranty can be given with respect to the accuracy or completeness of the information. Compass disclaims any and all liability relating to this report, including without limitation any express or implied representations or warranties for statements contained in, and omissions from, the report. Nothing contained herein is intended to be or should be read as any regulatory, legal, tax, accounting or other advice and Compass does not provide such advice. All opinions are subject to change without notice. Compass makes no representation regarding the accuracy of any statements regarding any references to the laws, statutes or regulations of any state are those of the author(s). Past performance is no guarantee of future results.


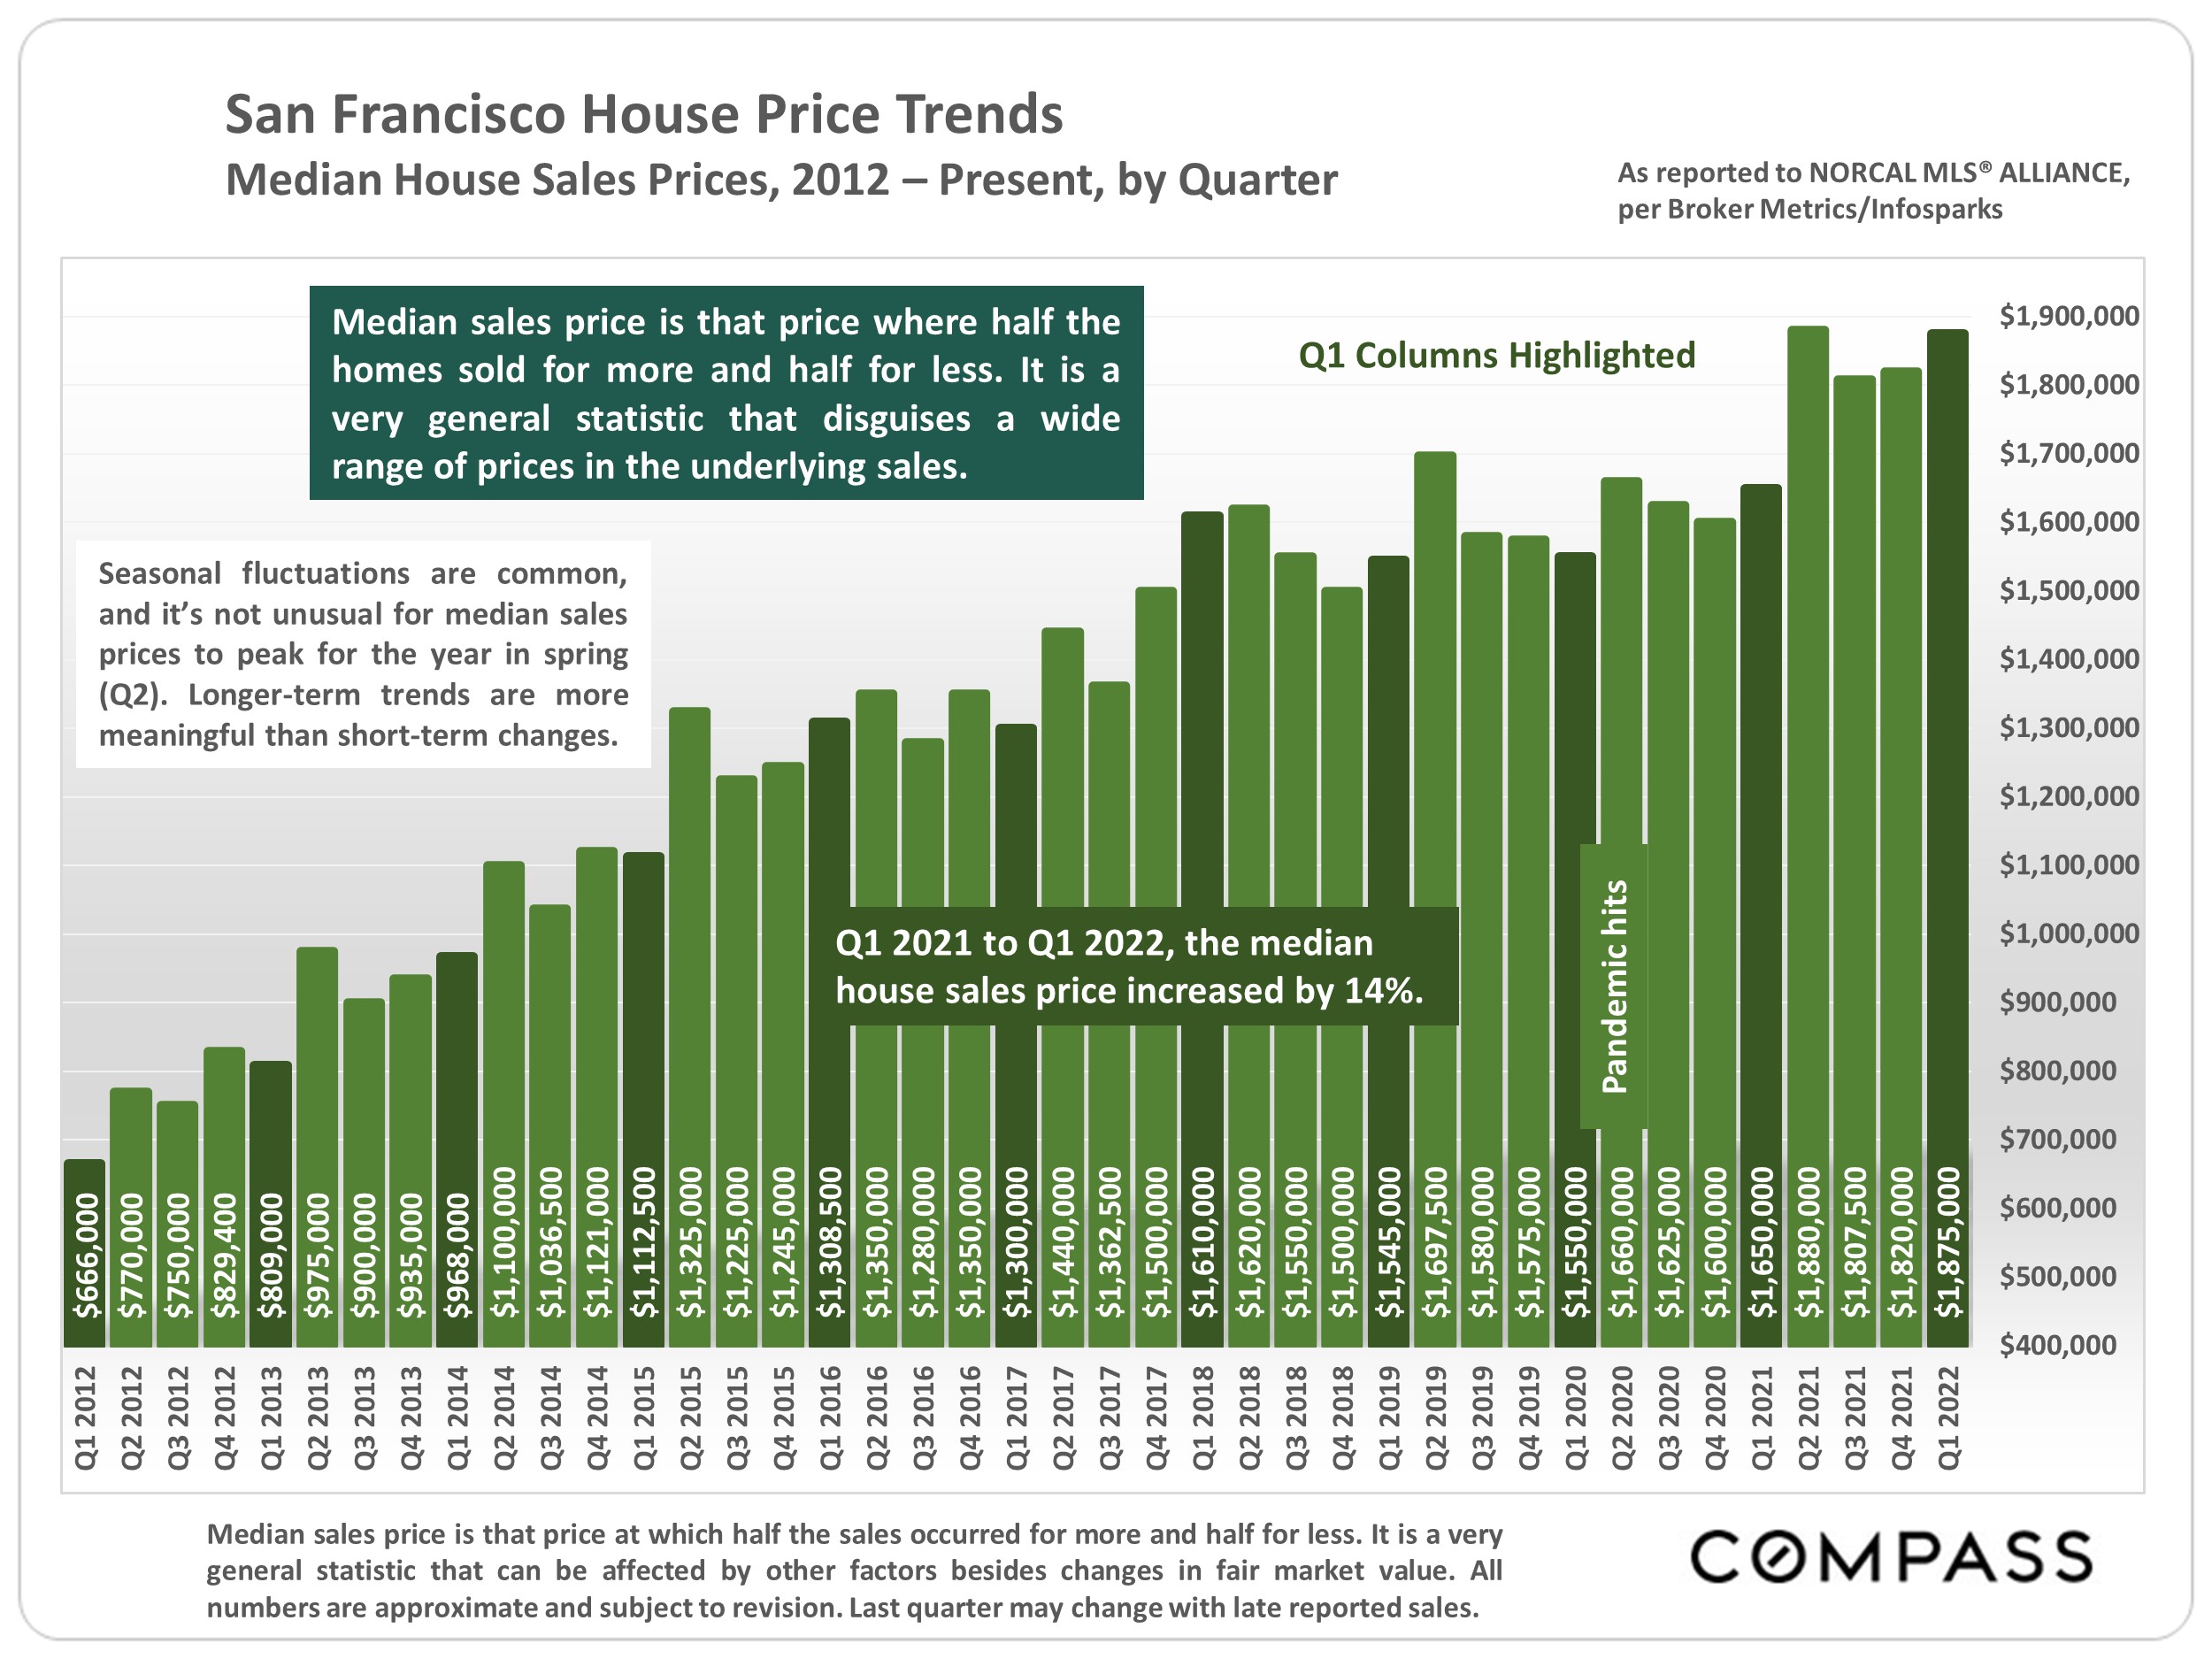
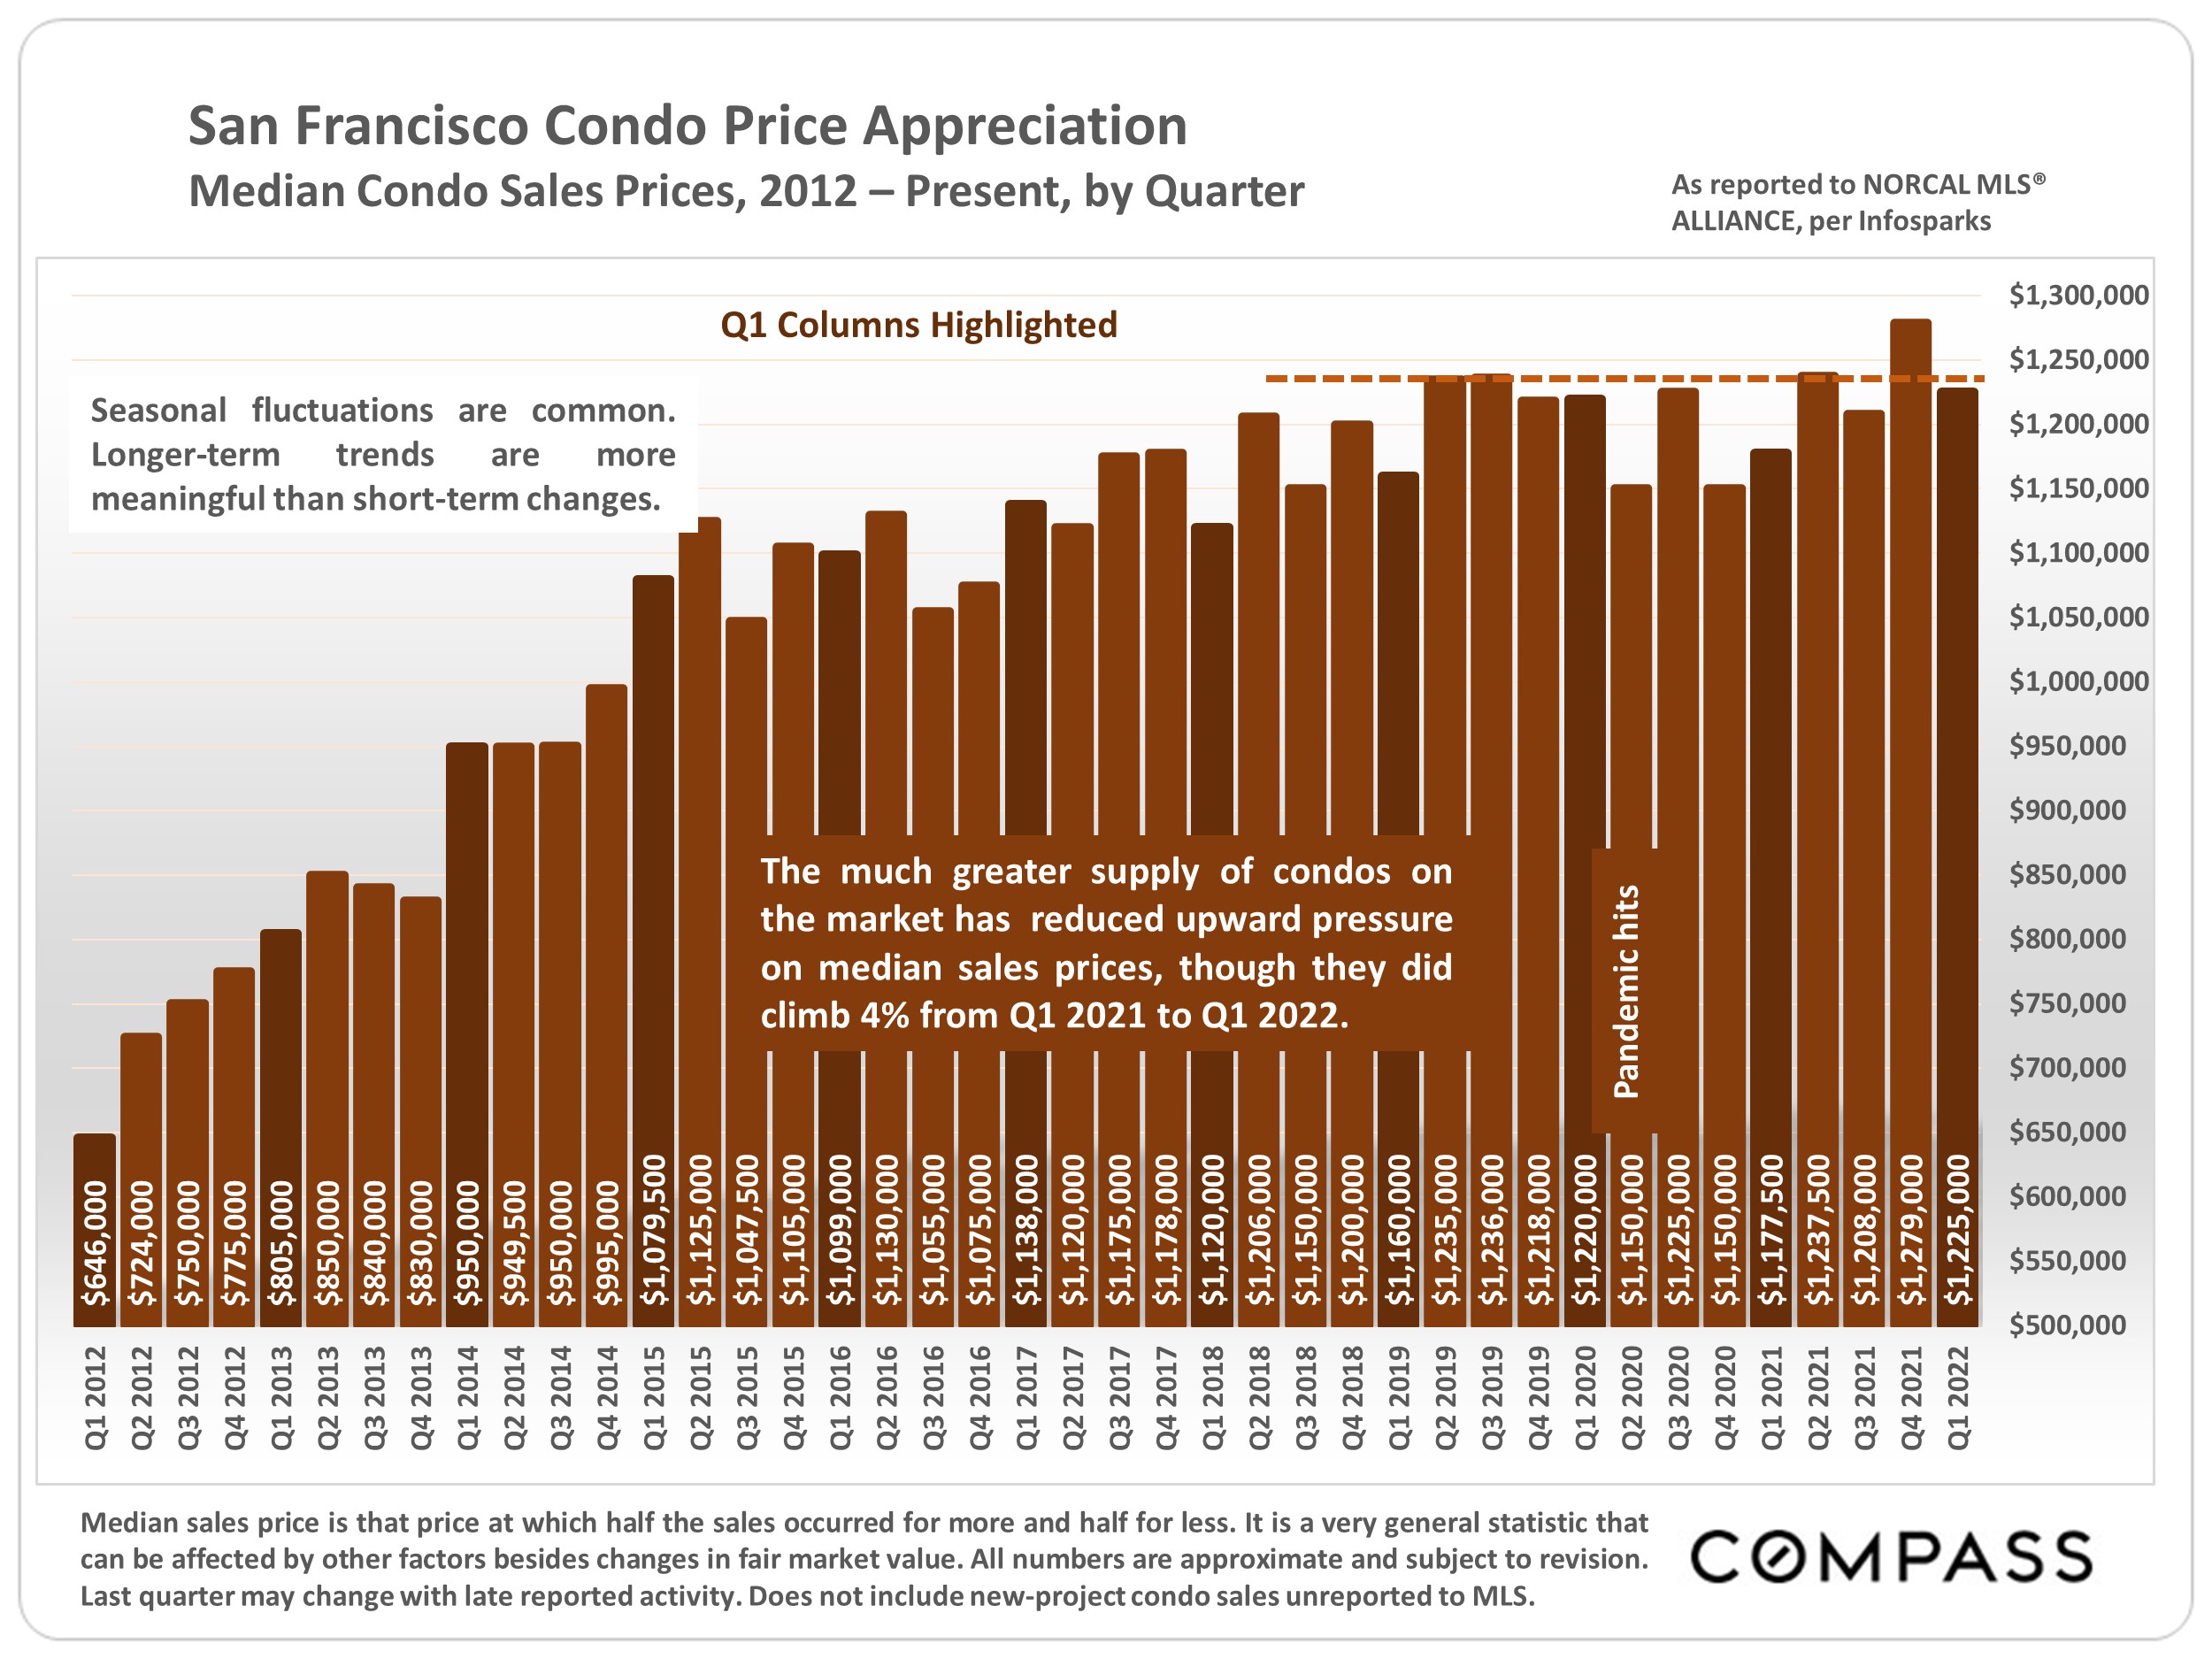
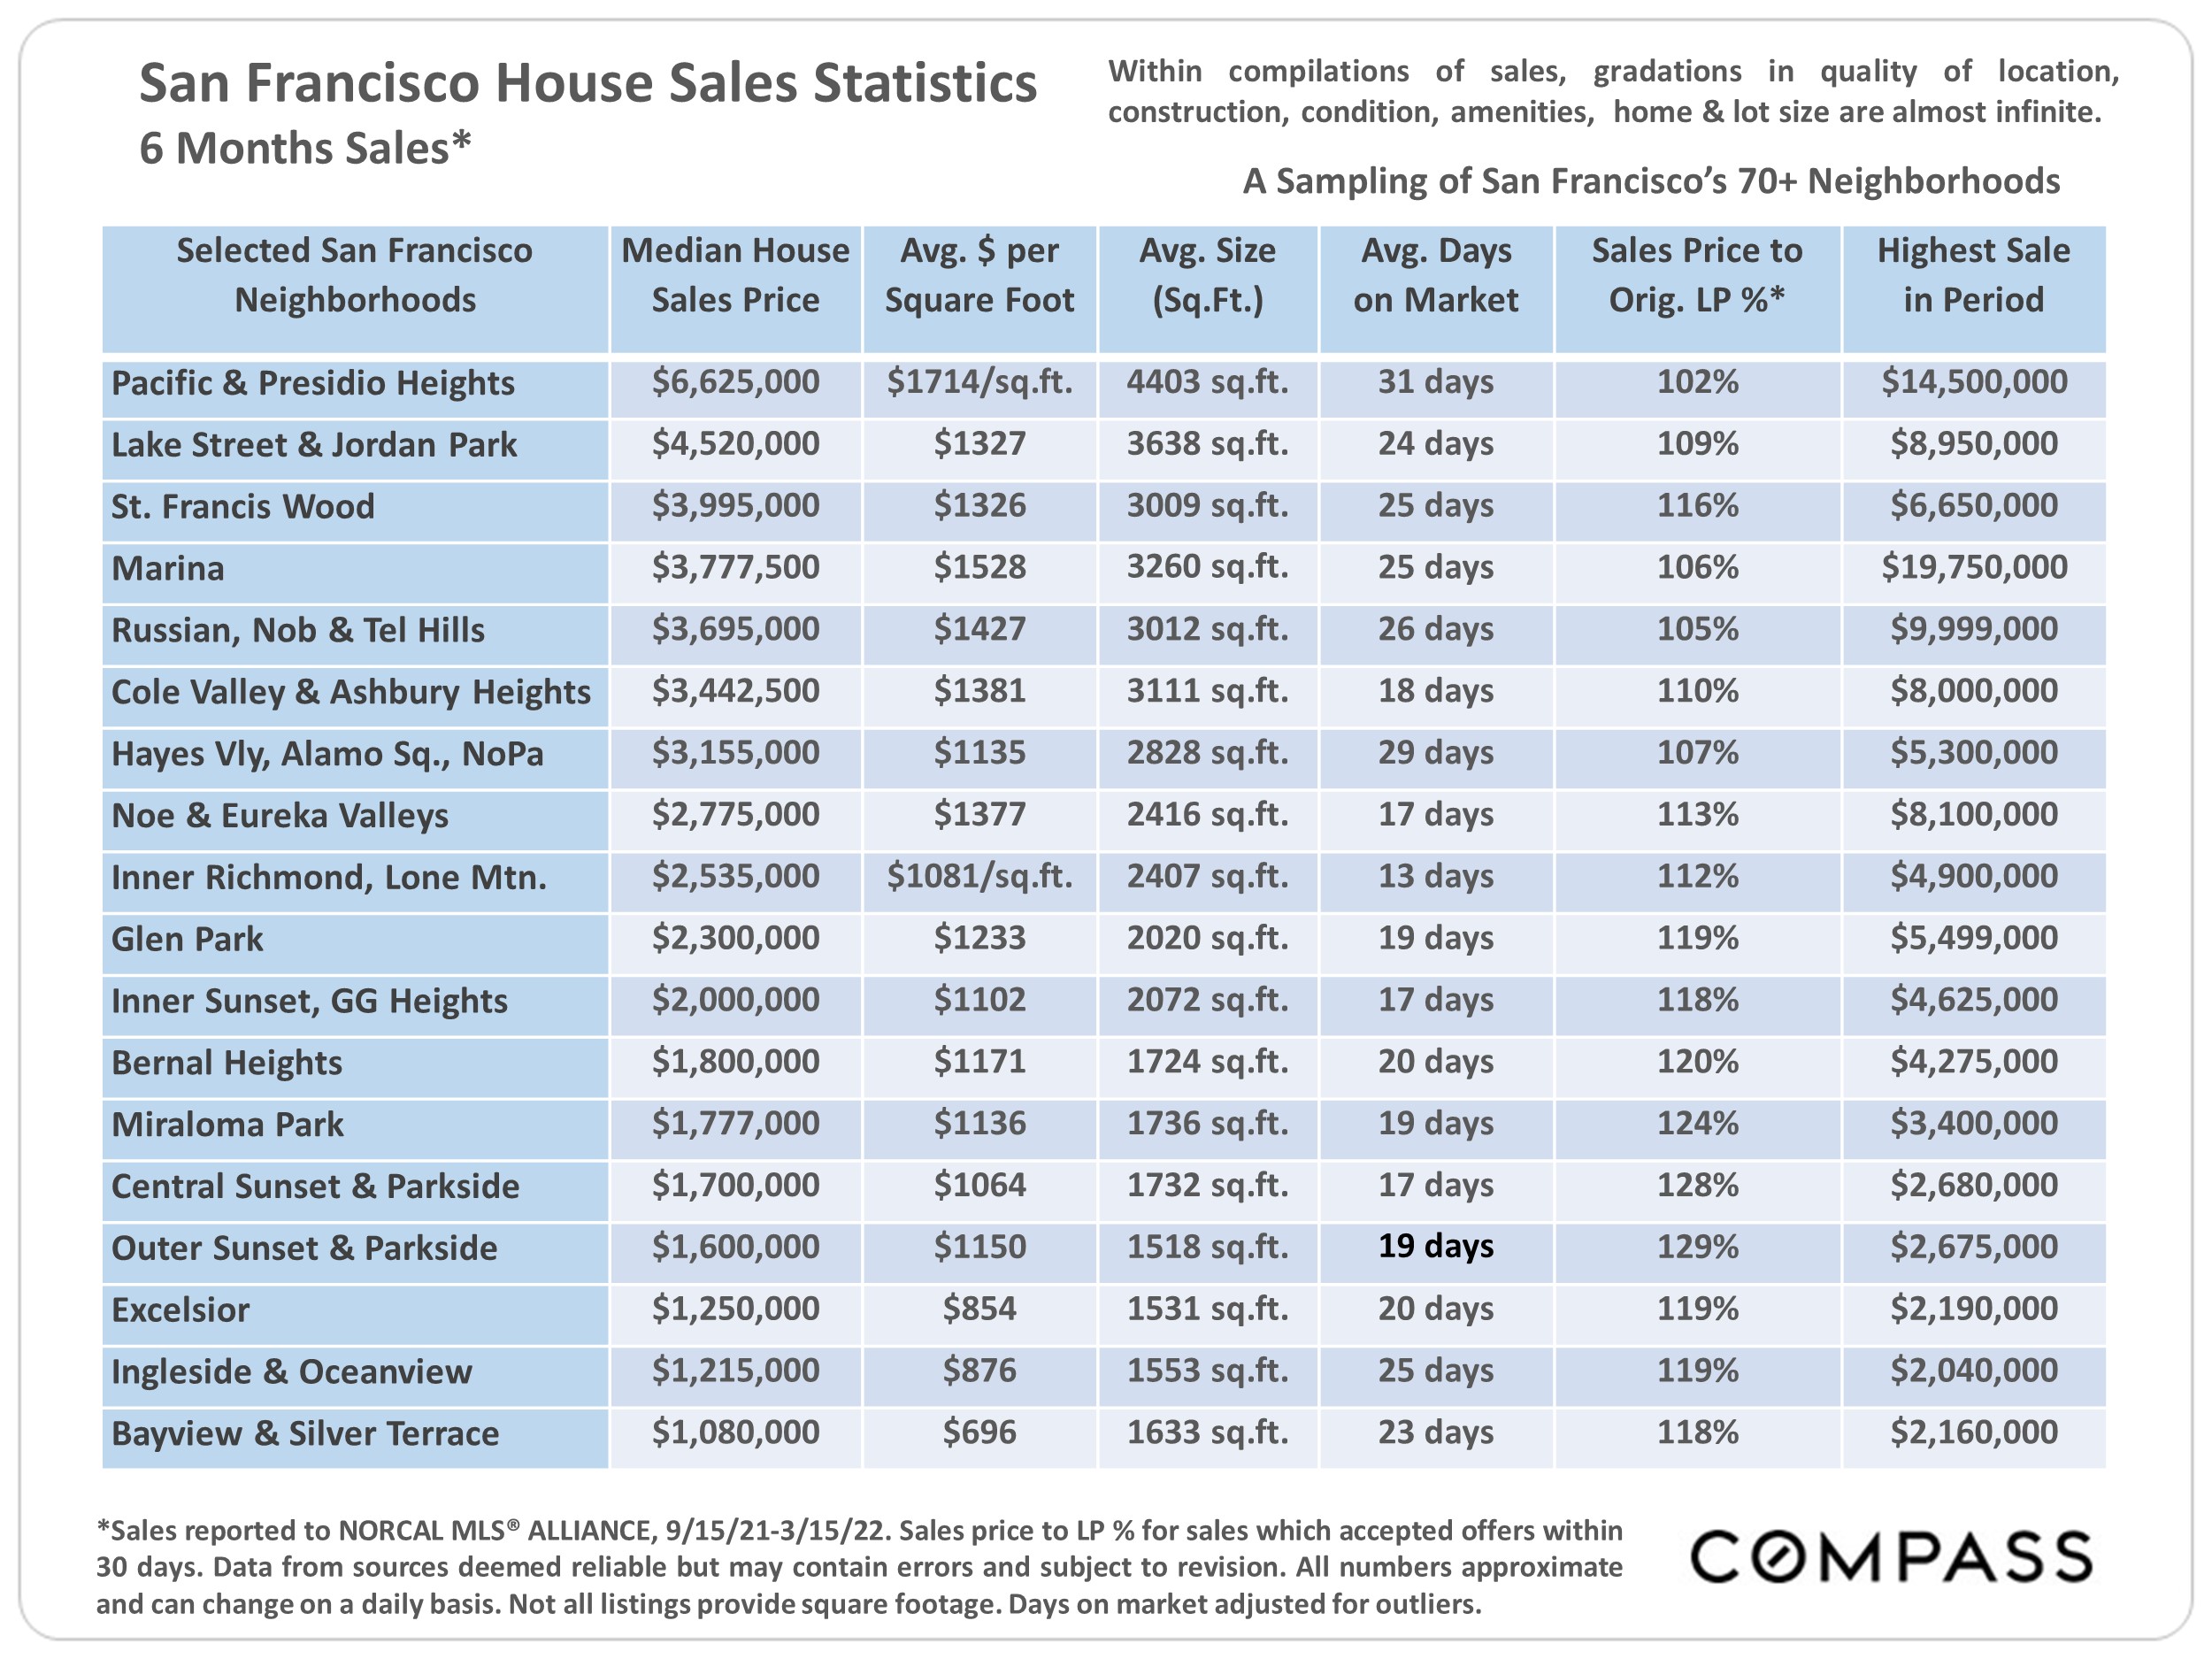
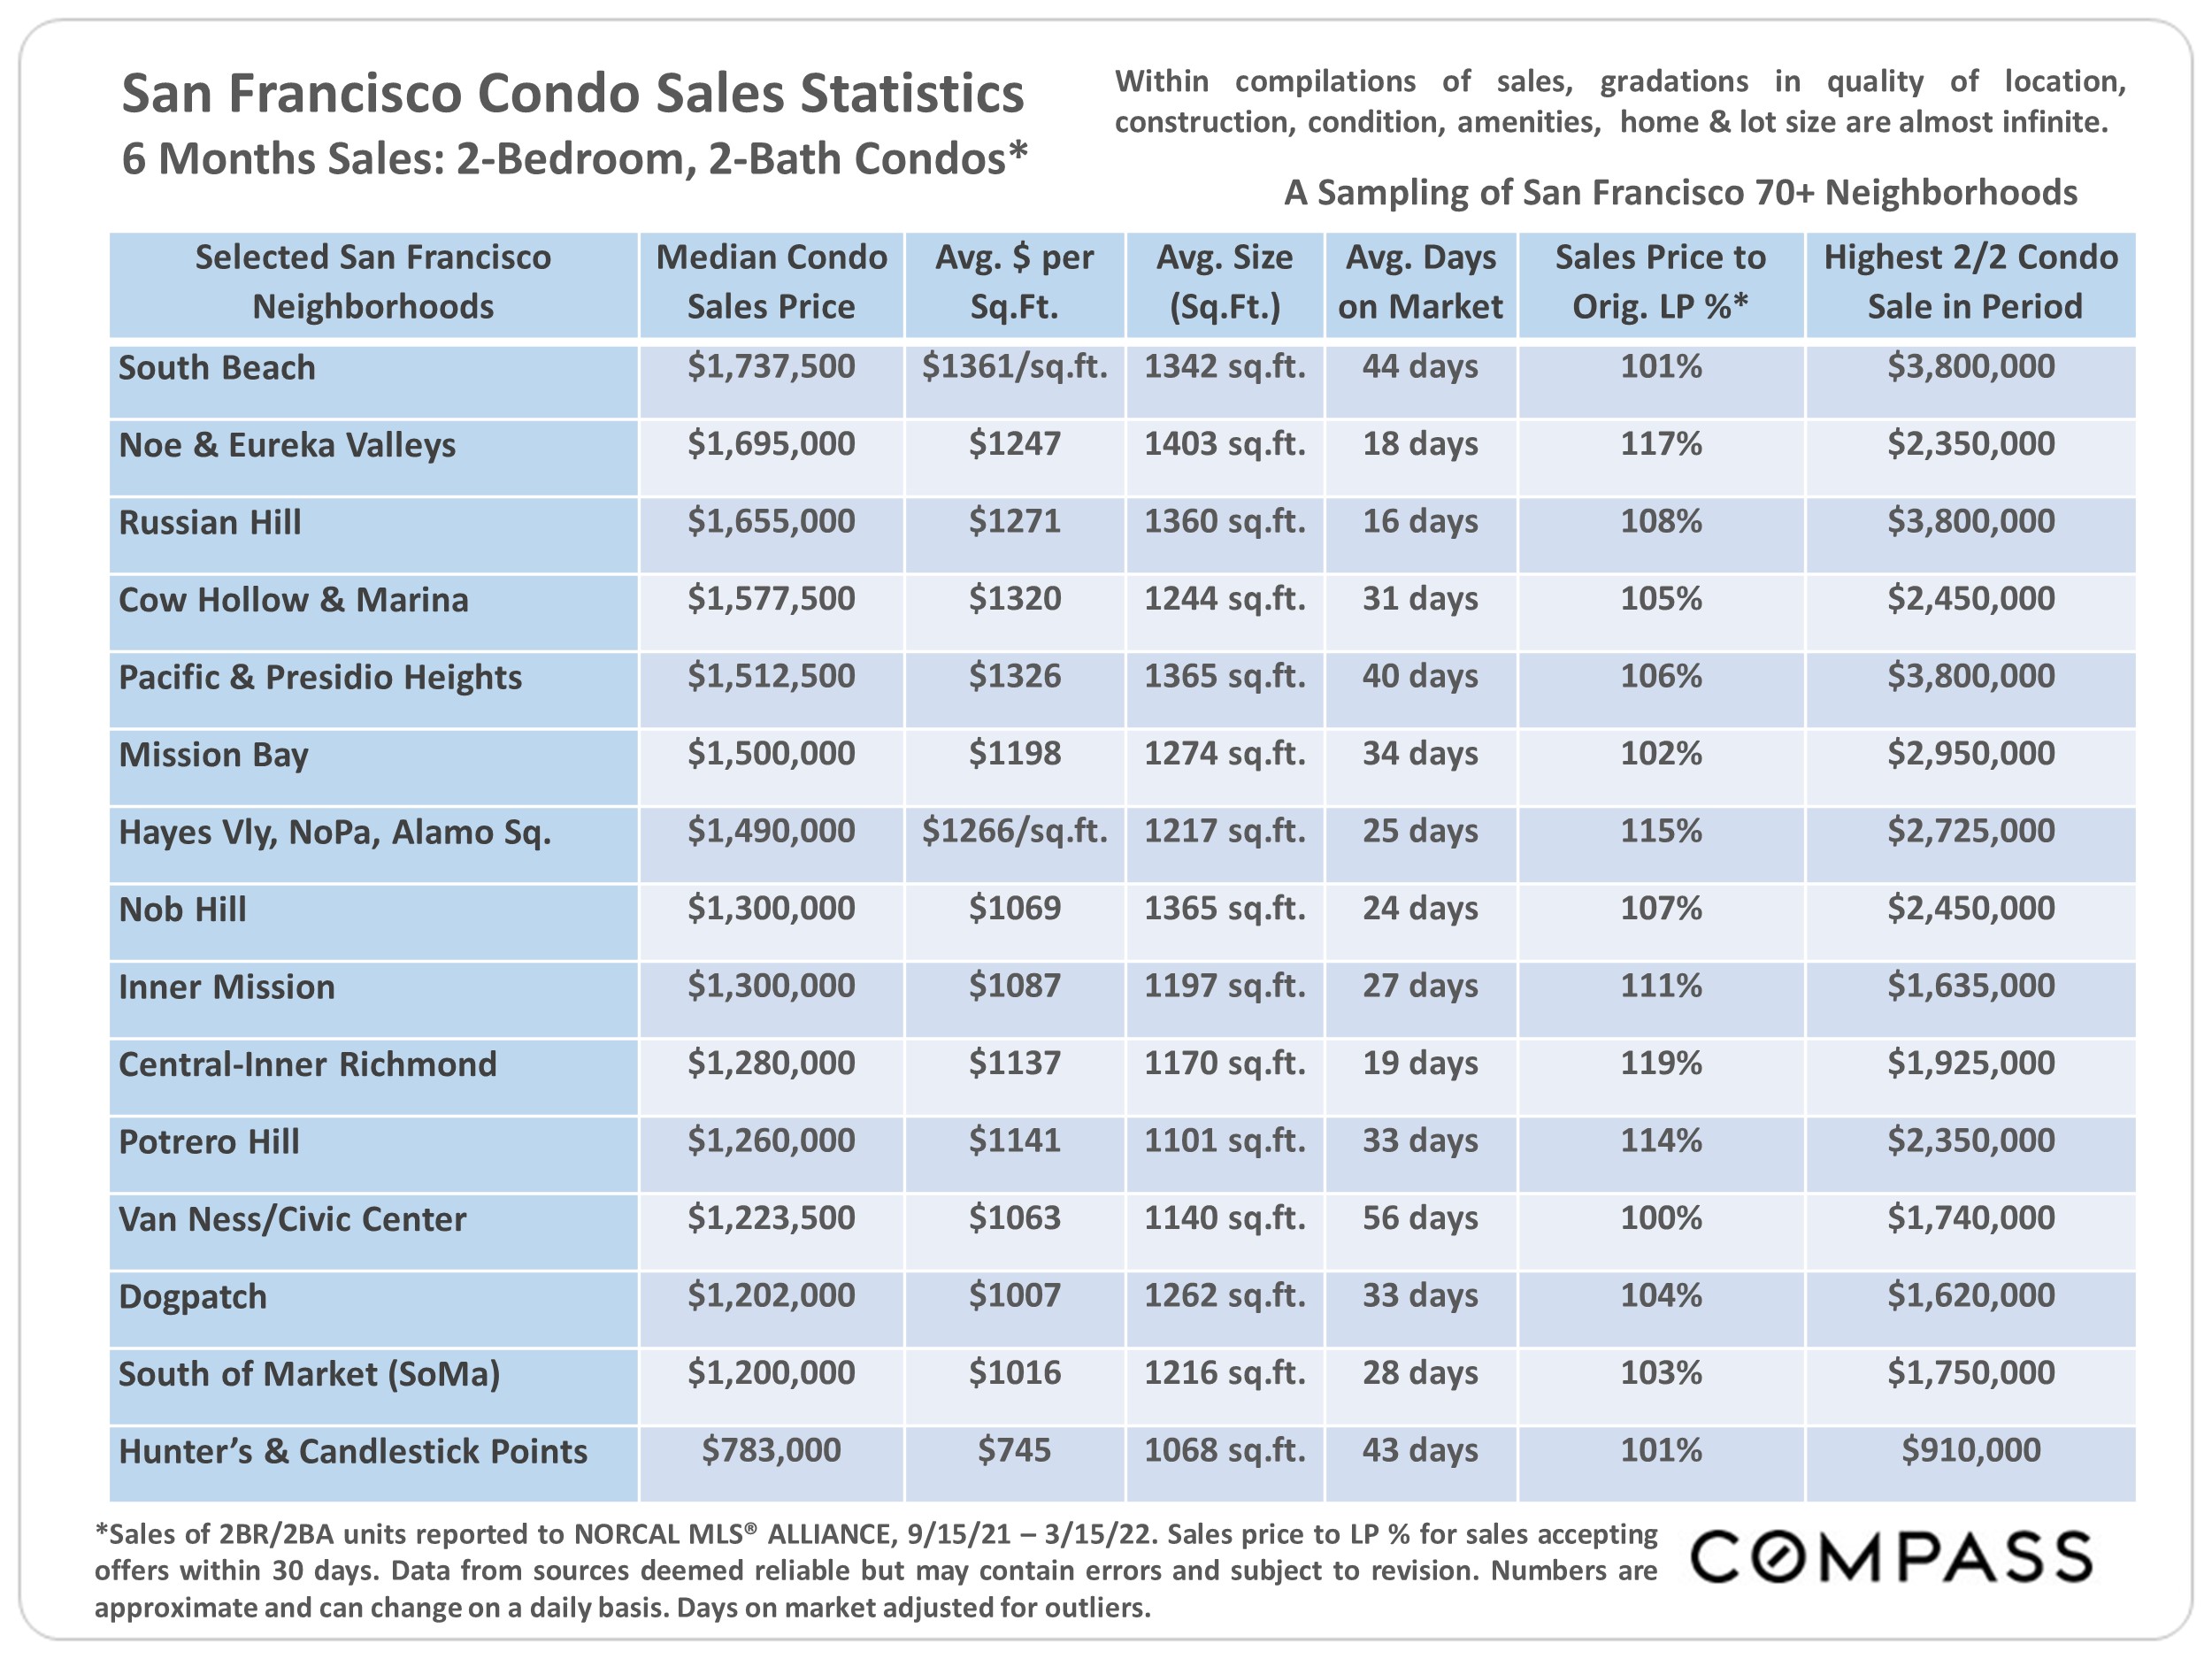
San Francisco County Real Estate, July 2022

Leaning into Market Headwinds, Appreciation Rate Drops

The impacts of this year’s severe economic headwinds – soaring inflation and interest rates, stock market declines, fears of recession – on Bay Area real estate markets are accelerating. The first effect was on buyer demand (fewer buyers, offers and listings into contract), leading to changes in supply (more homes for sale, more price reductions), which began to alter buyer and seller psychology and the balance of power between them. Especially after one of the longest, most dramatic upcycles in history, the psychology, circumstances and plans of individual buyers and sellers shift unevenly in the early months of a transition as they try to make sense of changing market realities. Eventually statistics based on closed sales – prices, appreciation rates, overbidding, days on market – slowly start to adjust. Generally speaking, closed sales are lagging indicators of what occurred in the economy and market weeks and months earlier.

If stock market prices are like a jet skier on a triple-espresso, home prices are like a giant cargo ship, which decelerates and turns slowly. It took a few months from when the big economic changes began, but the high year-over-year appreciation rates of recent years are now dropping fast in Bay Area markets, though the degree of any actual, longer-term “correction” to prices, if it occurs, remains to be seen.

A correction is not a crash. The precipitating factor in the 2008 crash – tens of millions of households talked into home loans they couldn’t afford, forcing frantic sales during a recession – does not apply today. Indeed, mortgage payments as a percentage of income are close to all-time lows (and most homeowners’ mortgages are also at historically low rates). Outside the 2008 crash, market corrections over the last 4 decades typically ran from a simple flattening in appreciation, to price adjustments of 5% to 10% (relatively small compared to the appreciation rates which preceded them). It is far too early, with far too many factors at play, to make predictions.

An overheated market cooling or normalizing, slowing from an unsustainable rate of acceleration, does not necessarily imply a weak market by historical standards, even if the speed and scale of the change is startling. This report will review year-over-year changes in supply and demand, reflecting the significant adjustments occurring, but also longer-term trends to provide greater context to these recent changes.

Monthly data can be volatile, fluctuating according to a number of factors, including market seasonality. For example, in most Bay Area markets, it is not unusual for median sales prices to peak for the year in spring or early summer. It is best not to jump to definitive conclusions based on a few months of data: Longer-term data is more meaningful than short-term fluctuations.

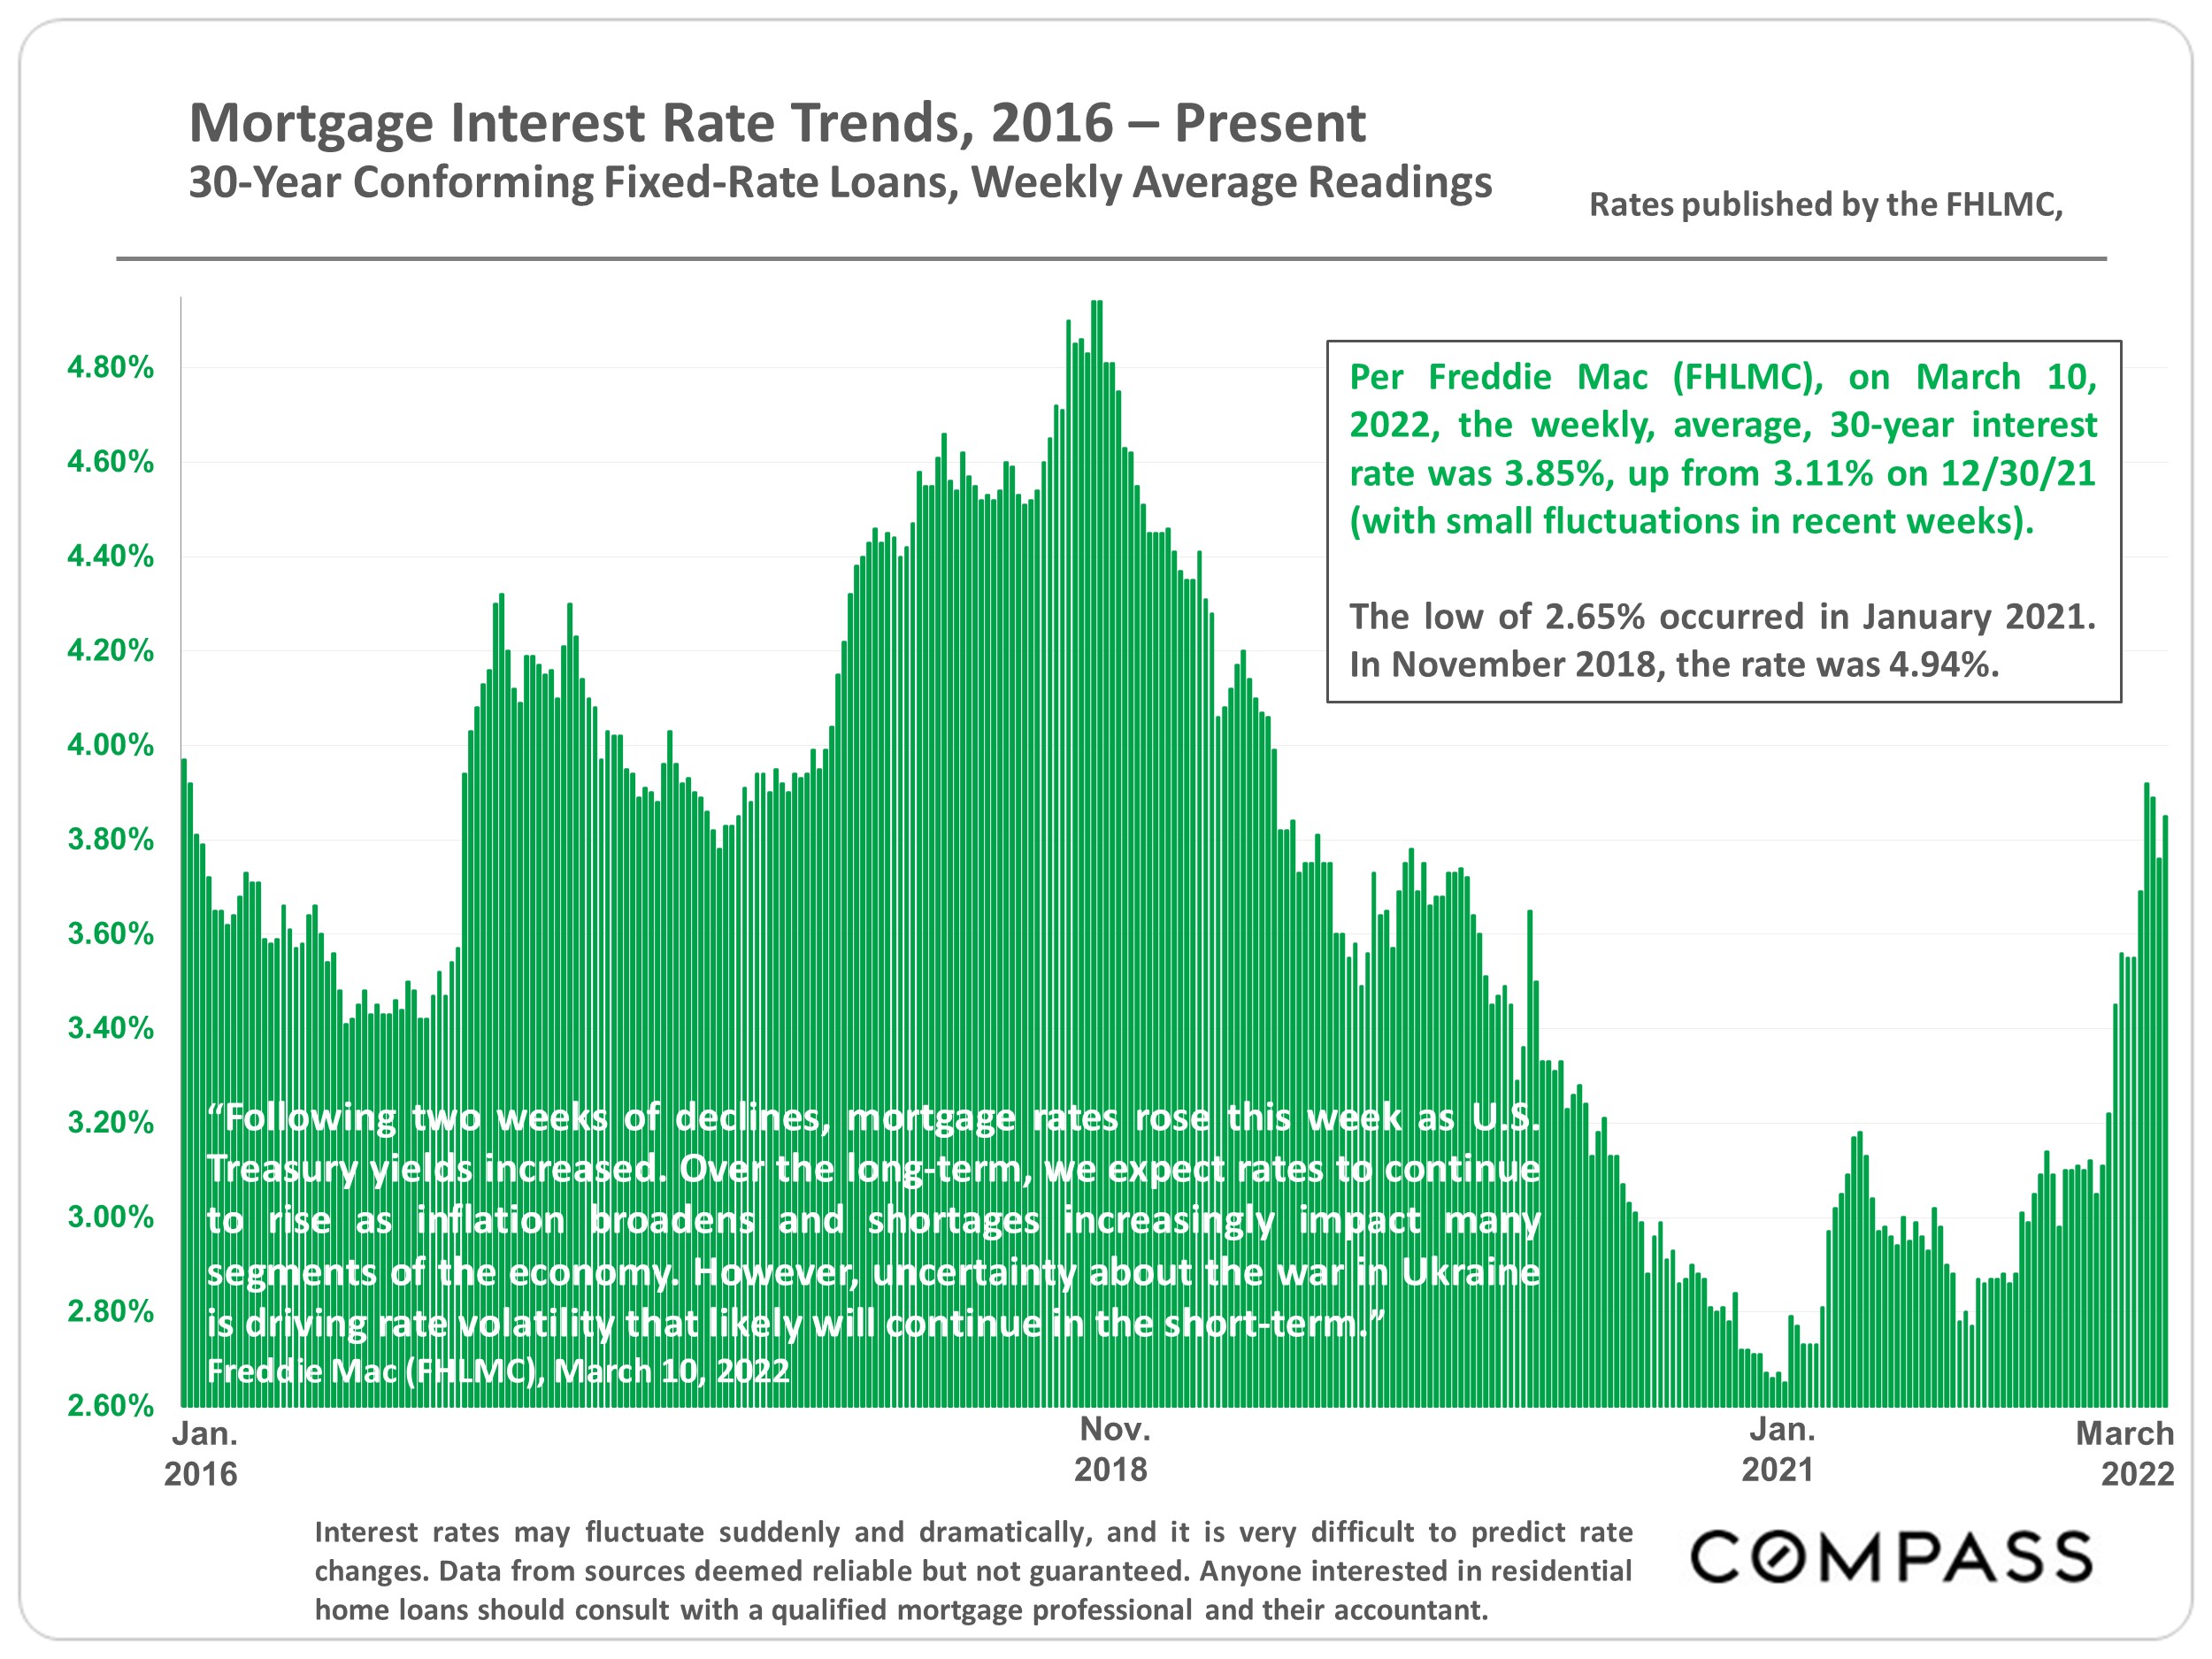
Different regions and market segments are cooling at differing speeds and each region has unique conditions – and in the Bay Area, each home is relatively unique as well. But barring very special circumstances, markets across the Bay Area (and the country) can be expected to eventually move in roughly parallel directions because of the broad macroeconomic factors at play. Within this report is a link to a review of many of these factors. As of July 7, 2022, according to FHLMC, the average weekly mortgage rate for a 30-year fixed rate loan fell to 5.3% from 5.81% two weeks earlier.

Our reports are not intended to convince you regarding a course of action or to predict the future, but to provide, to the best of our ability, straightforward information and good-faith analysis to assist you in making your own informed decisions. Statistics should be considered very general indicators, and all numbers should be considered approximate. How they apply to any particular property is unknown without a specific comparative market analysis.

Source: Compass

It is impossible to know how median and average value statistics apply to any particular home without a specific comparative market analysis. These analyses were made in good faith with data from sources deemed reliable, but may contain errors and are subject to revision. It is not our intent to convince you of a particular position, but to attempt to provide straightforward data and analysis, so you can make your own informed decisions. Median and average statistics are enormous generalities: There are hundreds of different markets in San Francisco and the Bay Area, each with its own unique dynamics. Median prices and average dollar per square foot values can be and often are affected by other factors besides changes in fair market value. Longer term trends are much more meaningful than short-term.

Compass is a real estate broker licensed by the State of California, DRE 01527235. Equal Housing Opportunity. This report has been prepared solely for information purposes. The information herein is based on or derived from information generally available to the public and/or from sources believed to be reliable. No representation or warranty can be given with respect to the accuracy or completeness of the information. Compass disclaims any and all liability relating to this report, including without limitation any express or implied representations or warranties for statements contained in, and omissions from, the report. Nothing contained herein is intended to be or should be read as any regulatory, legal, tax, accounting or other advice and Compass does not provide such advice. All opinions are subject to change without notice. Compass makes no representation regarding the accuracy of any statements regarding any references to the laws, statutes or regulations of any state are those of the author(s). Past performance is no guarantee of future results.

“Stanford Circle Cities” Home Prices, Luxury Home Sales, June 2022

Indications of Changing Market Dynamics

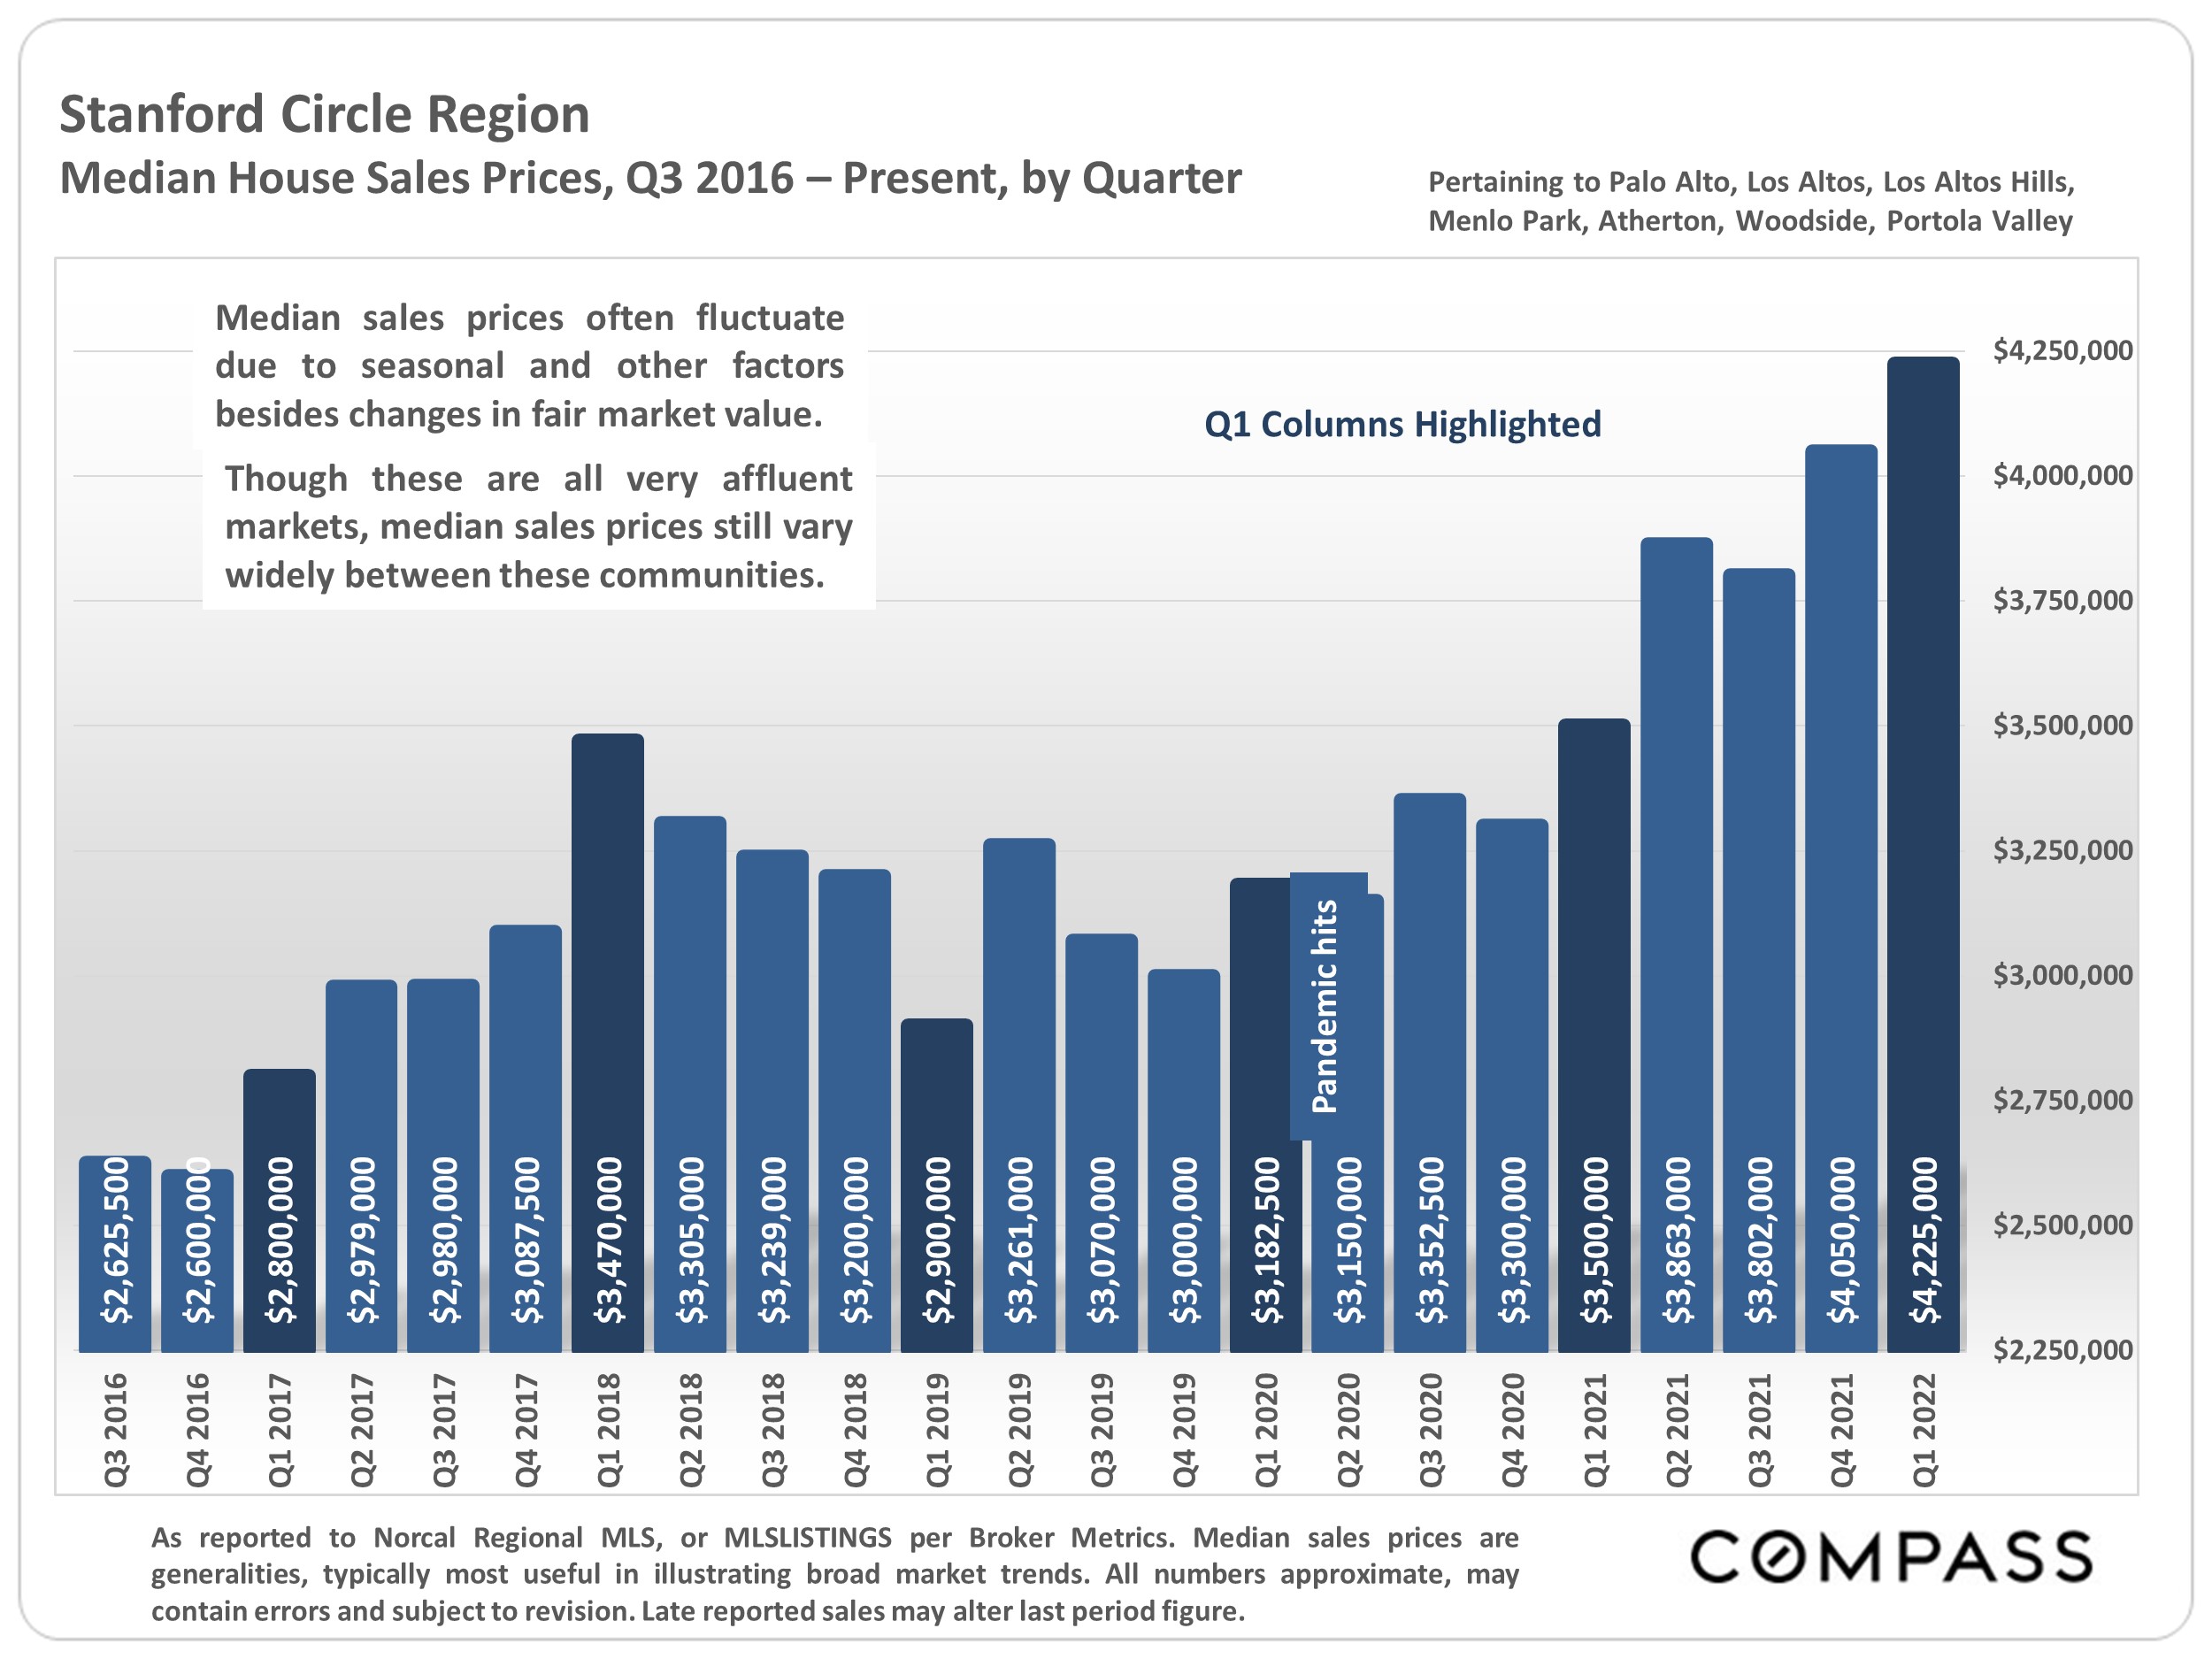
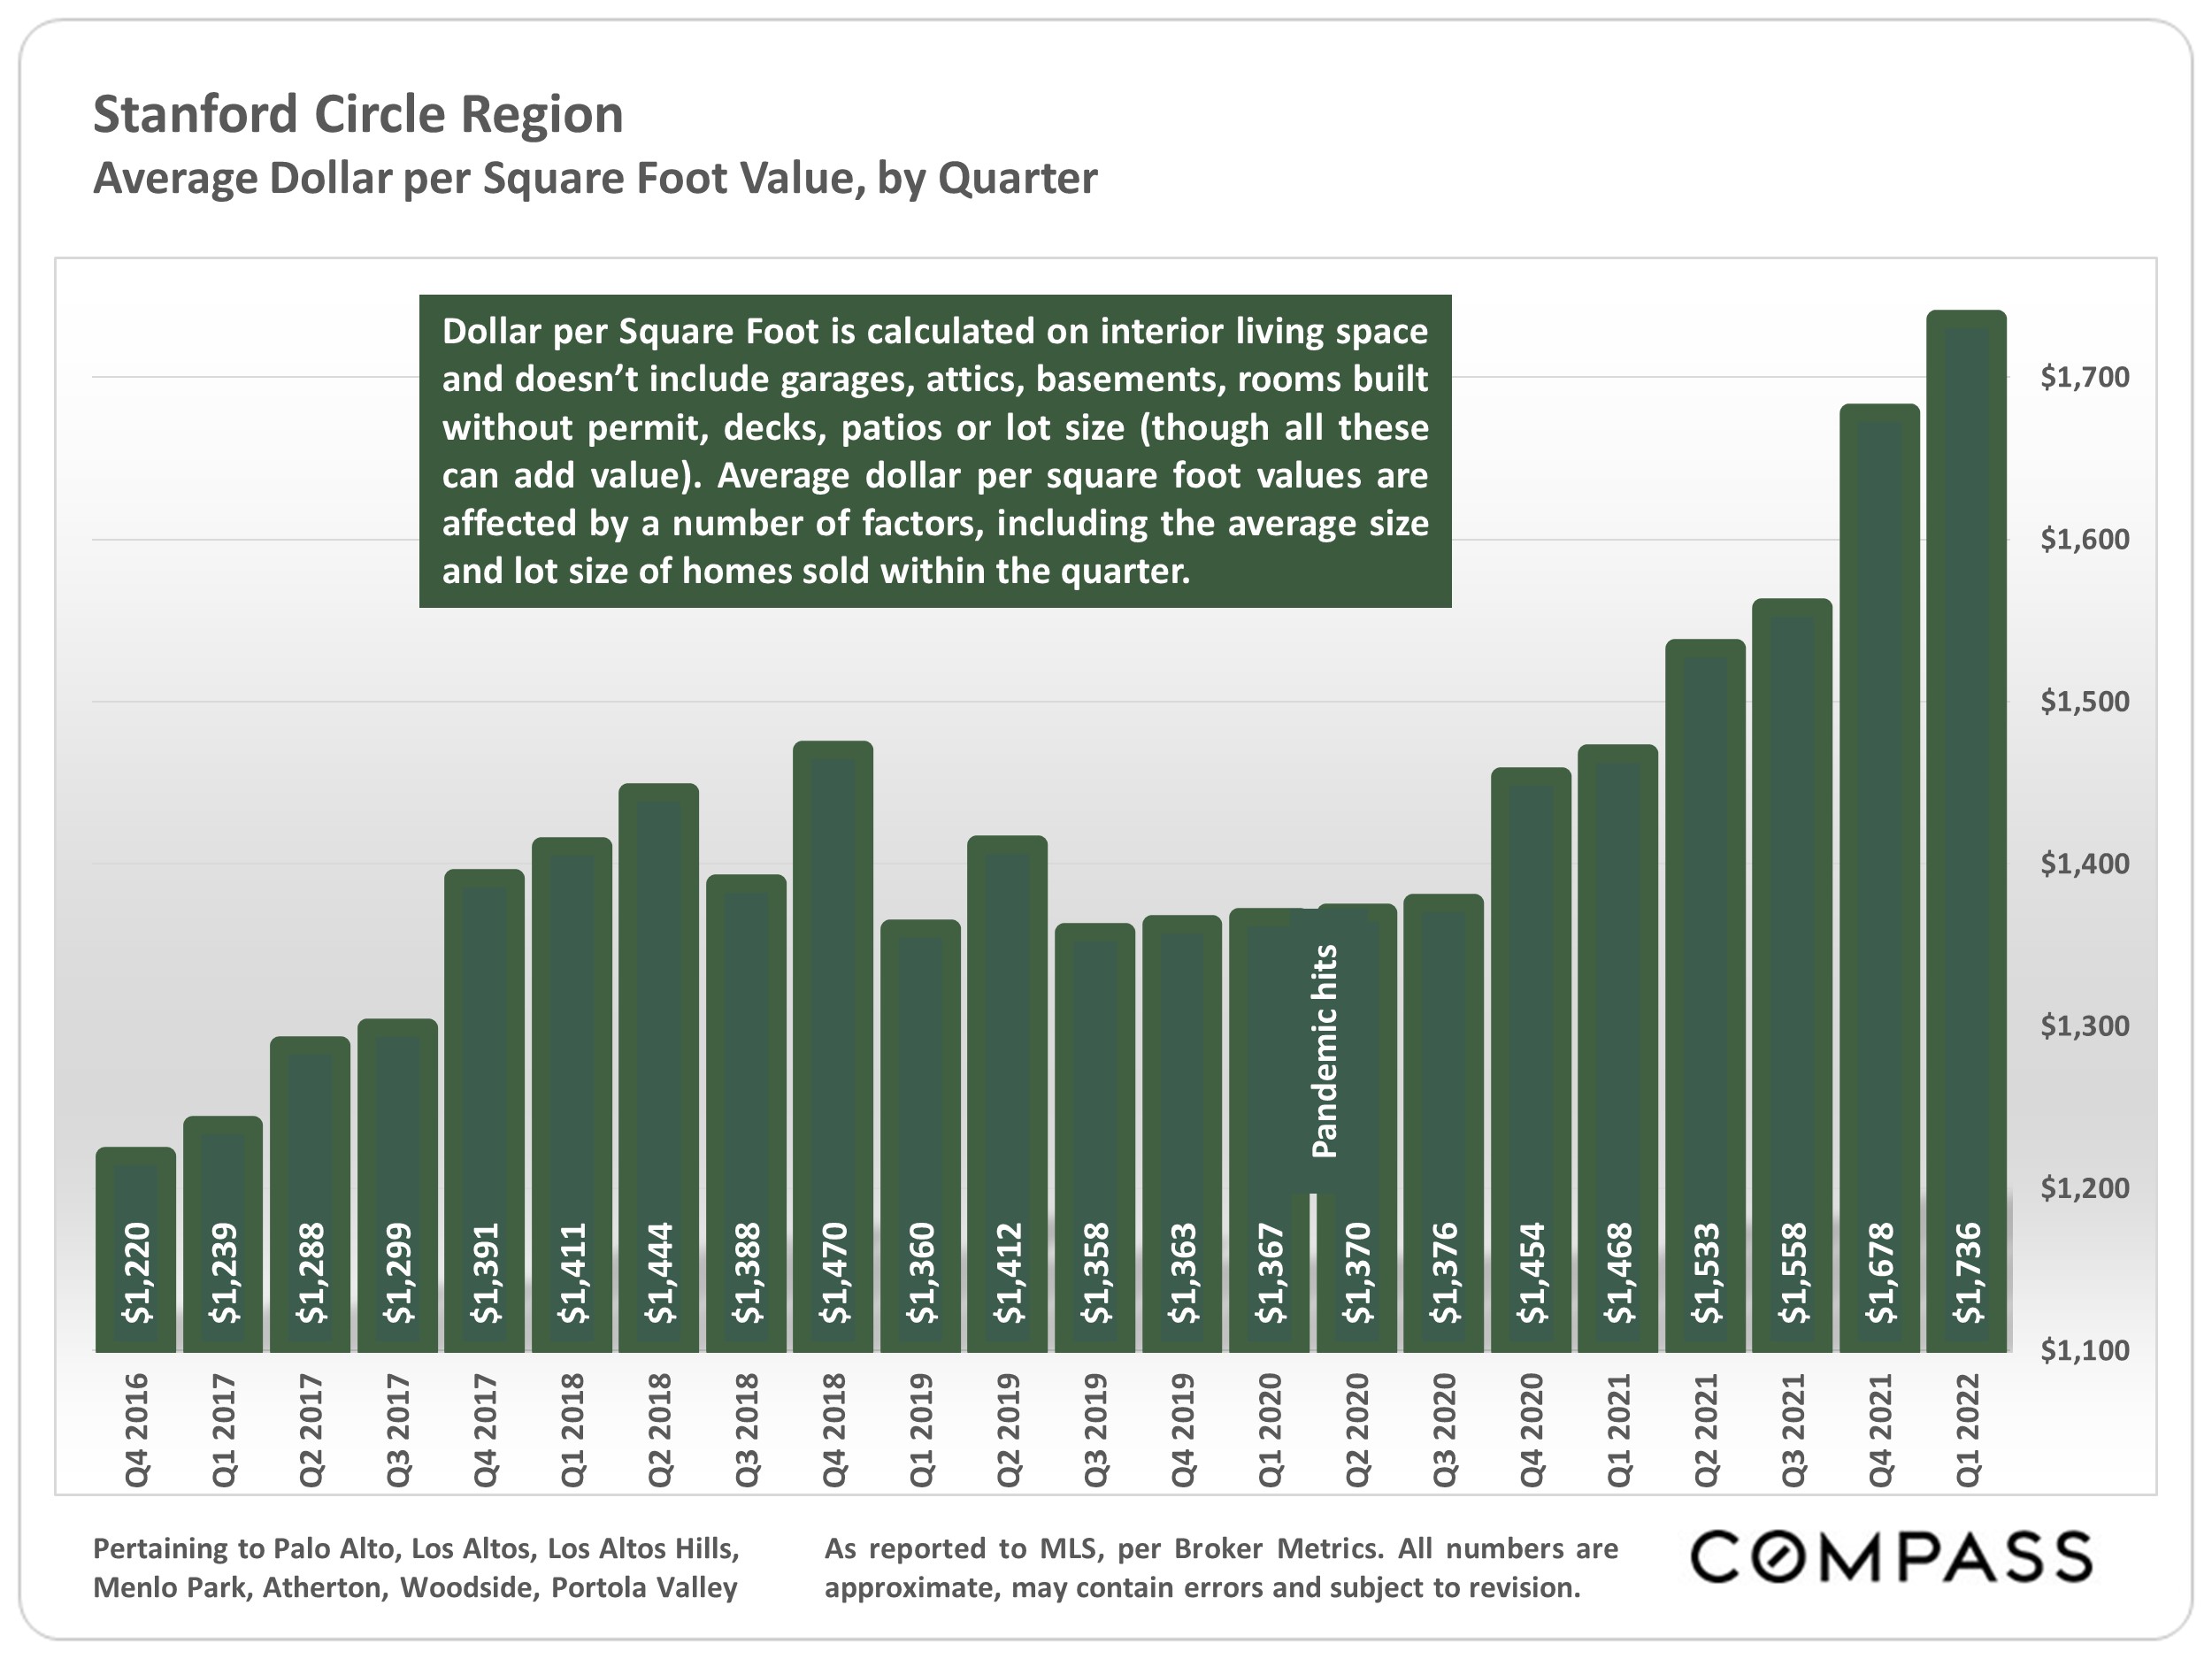
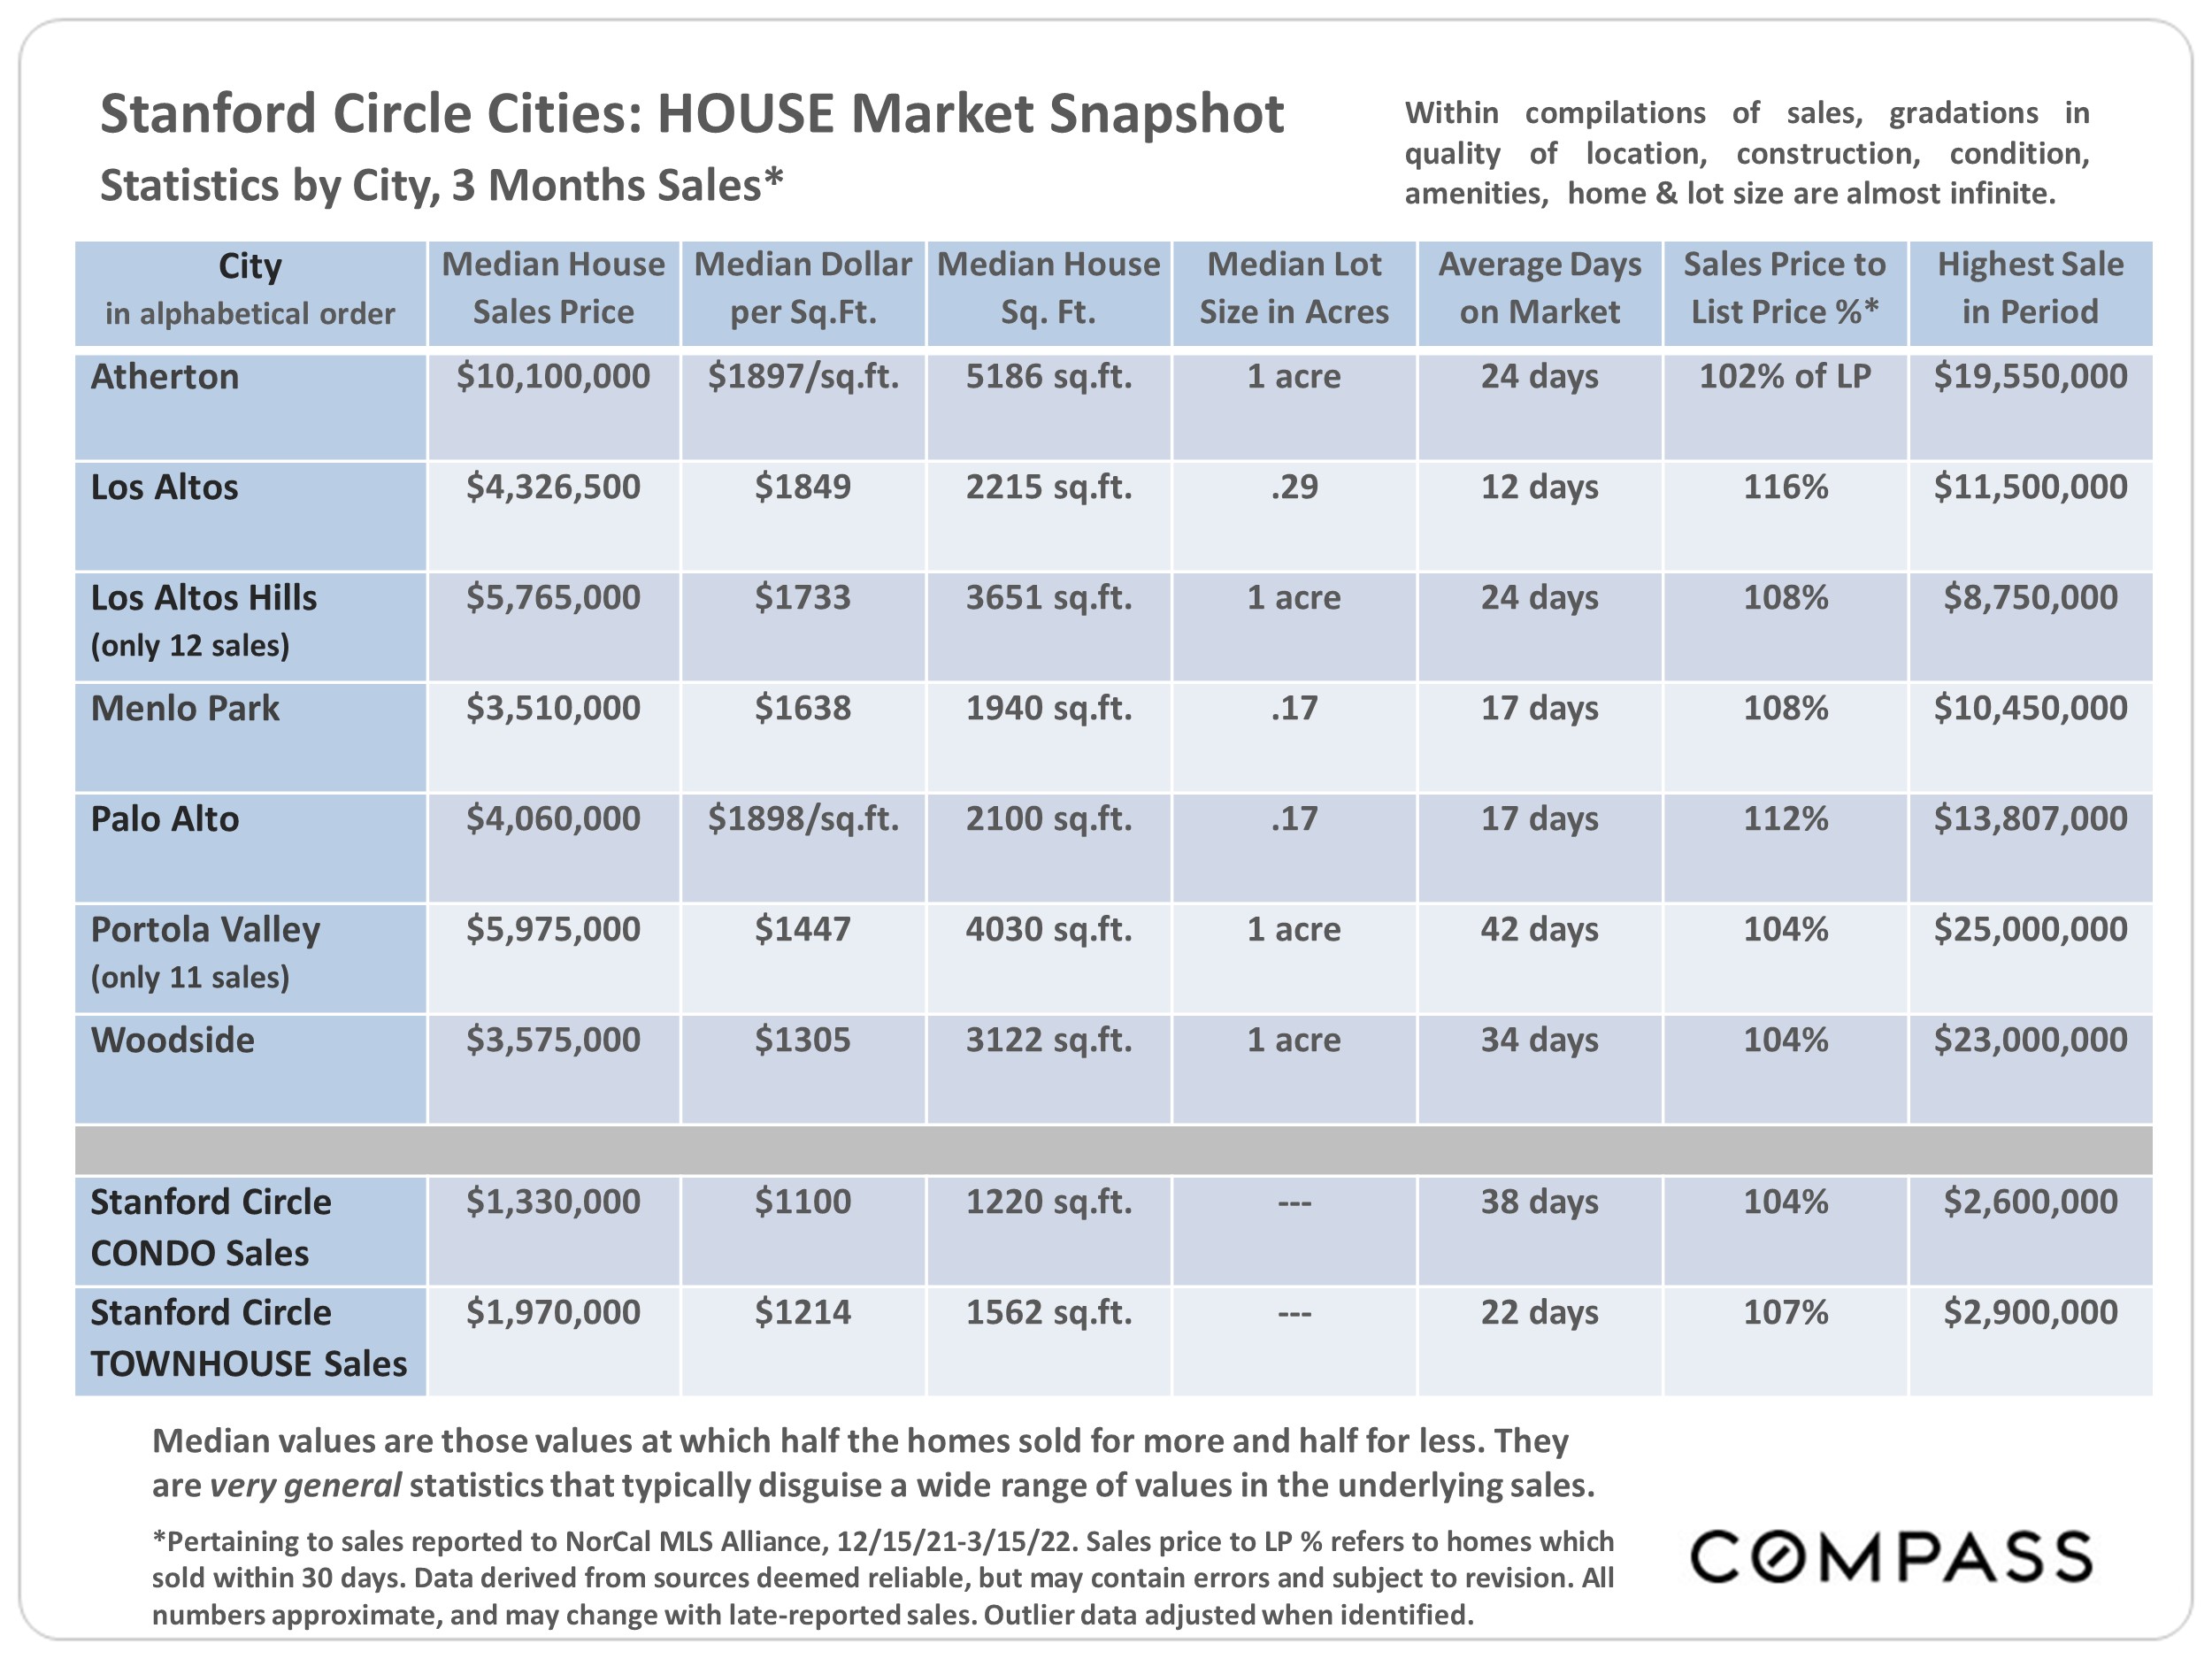
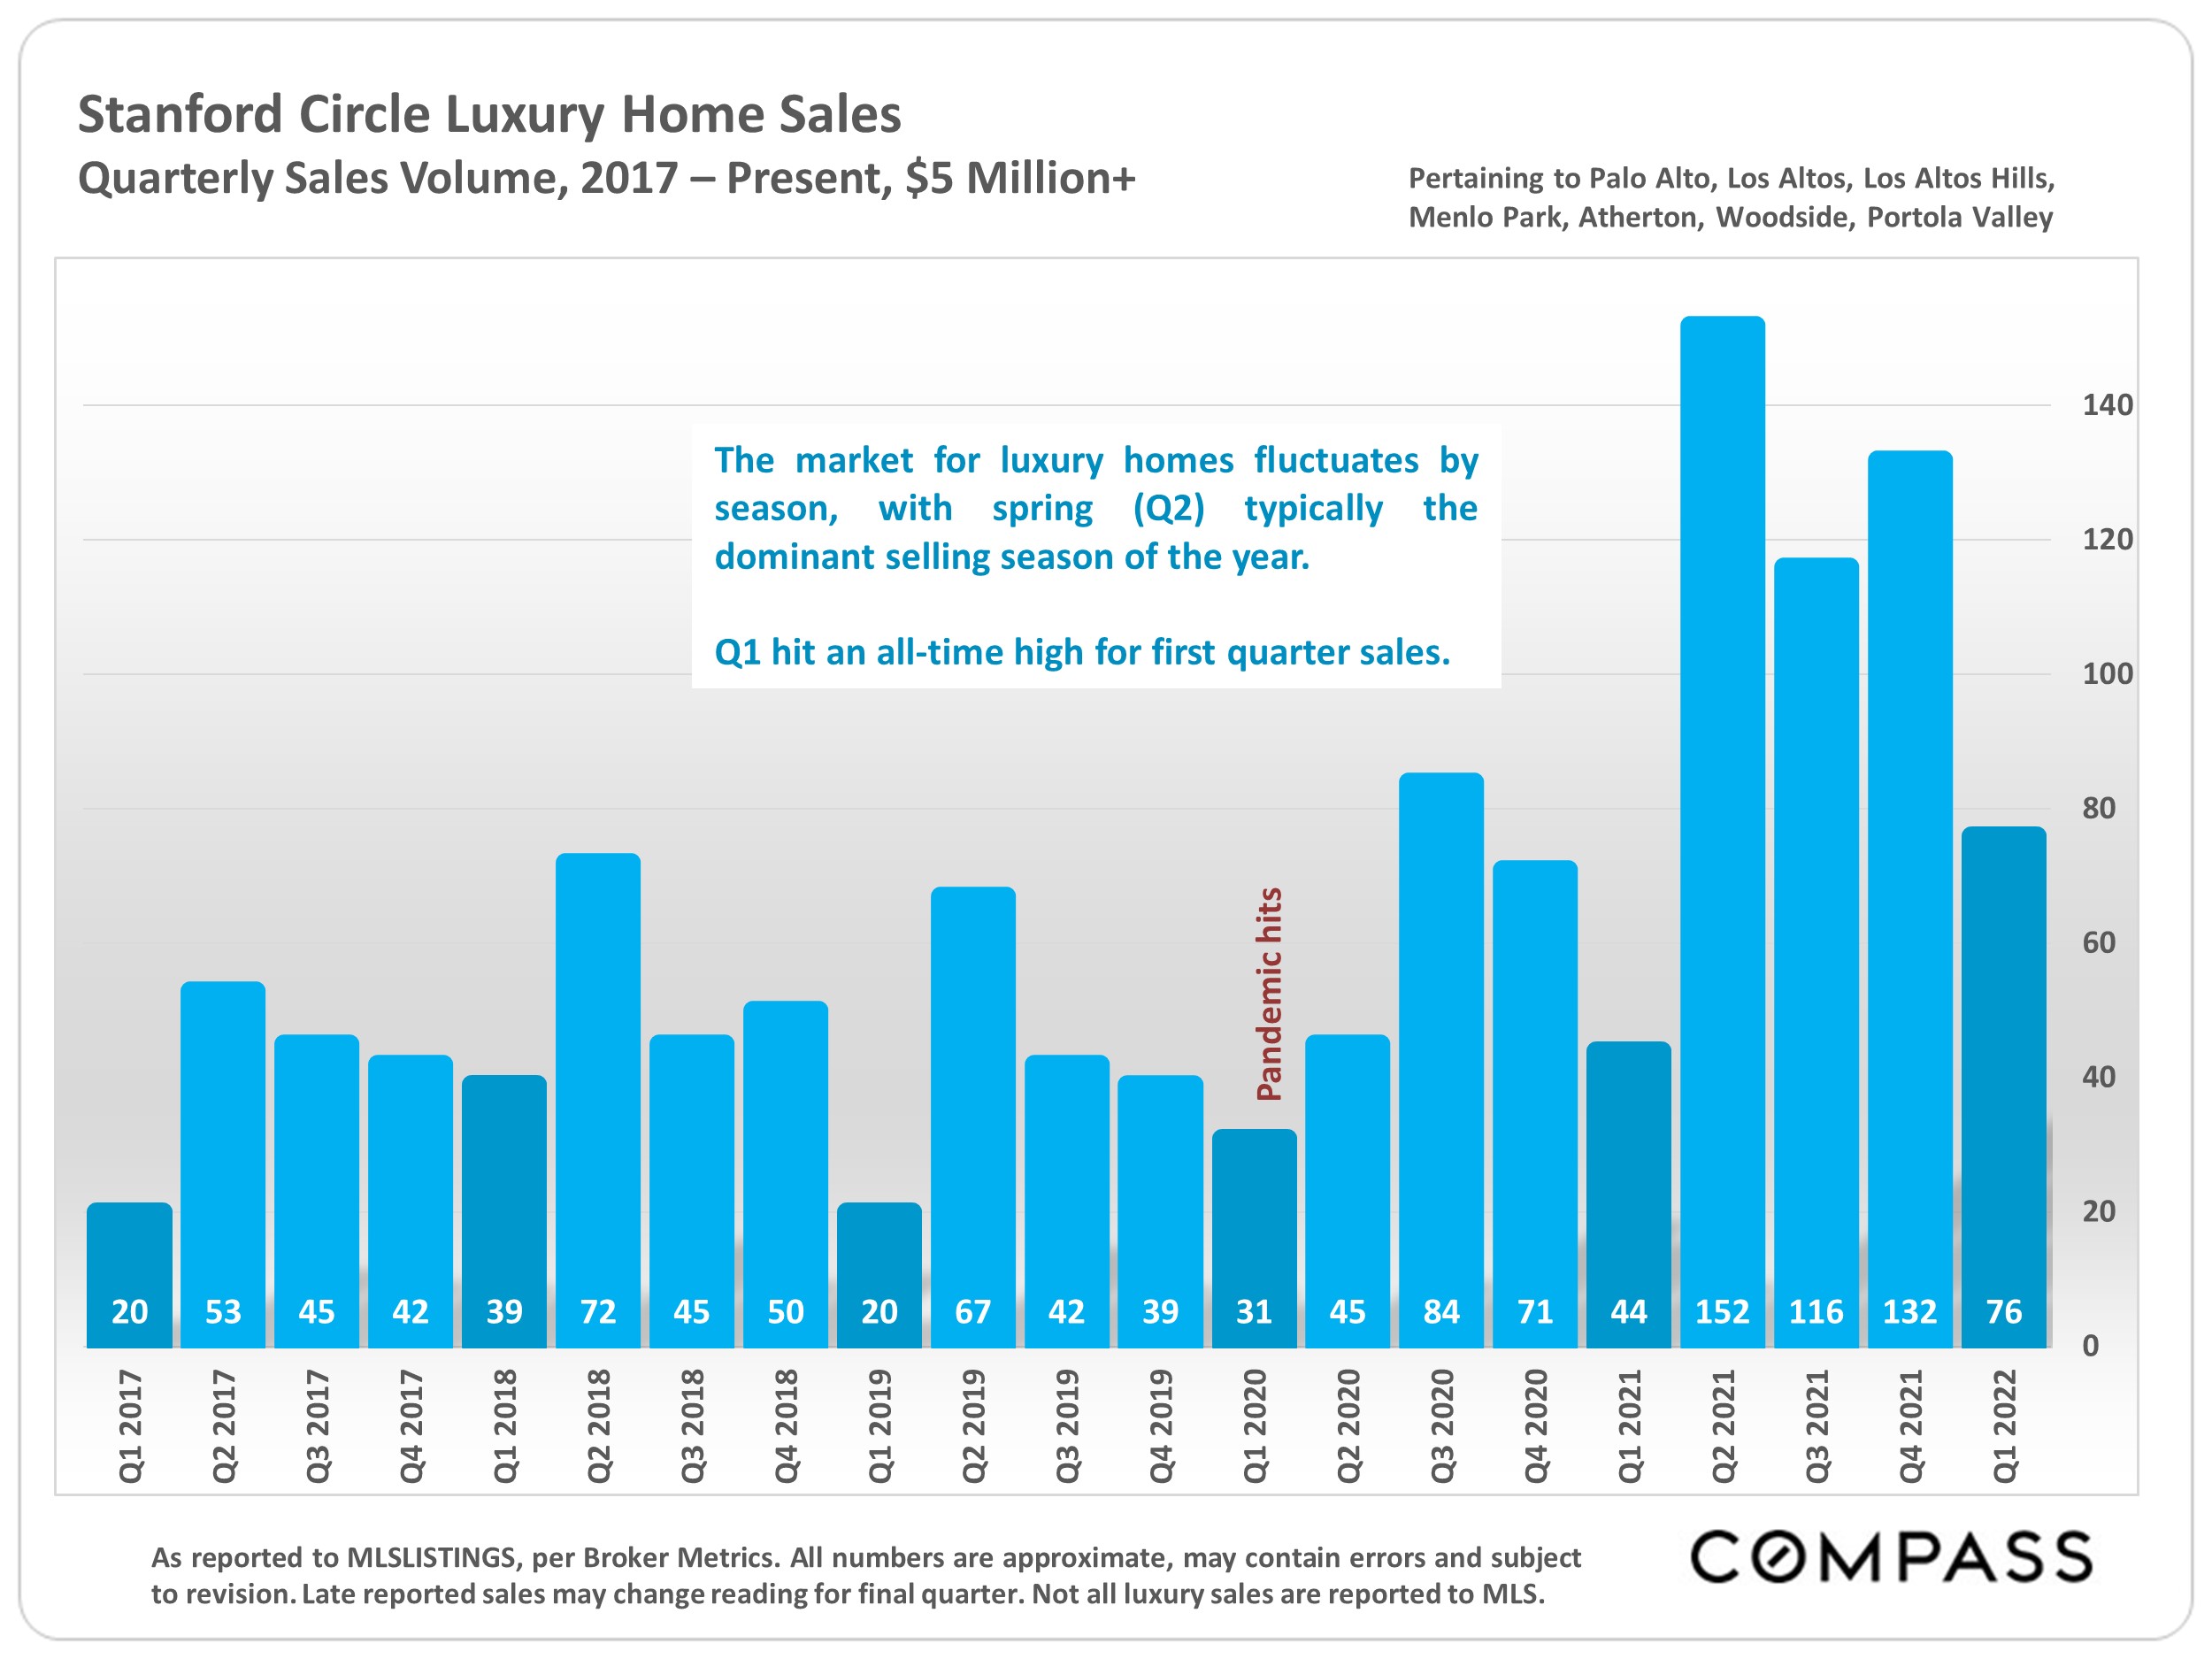
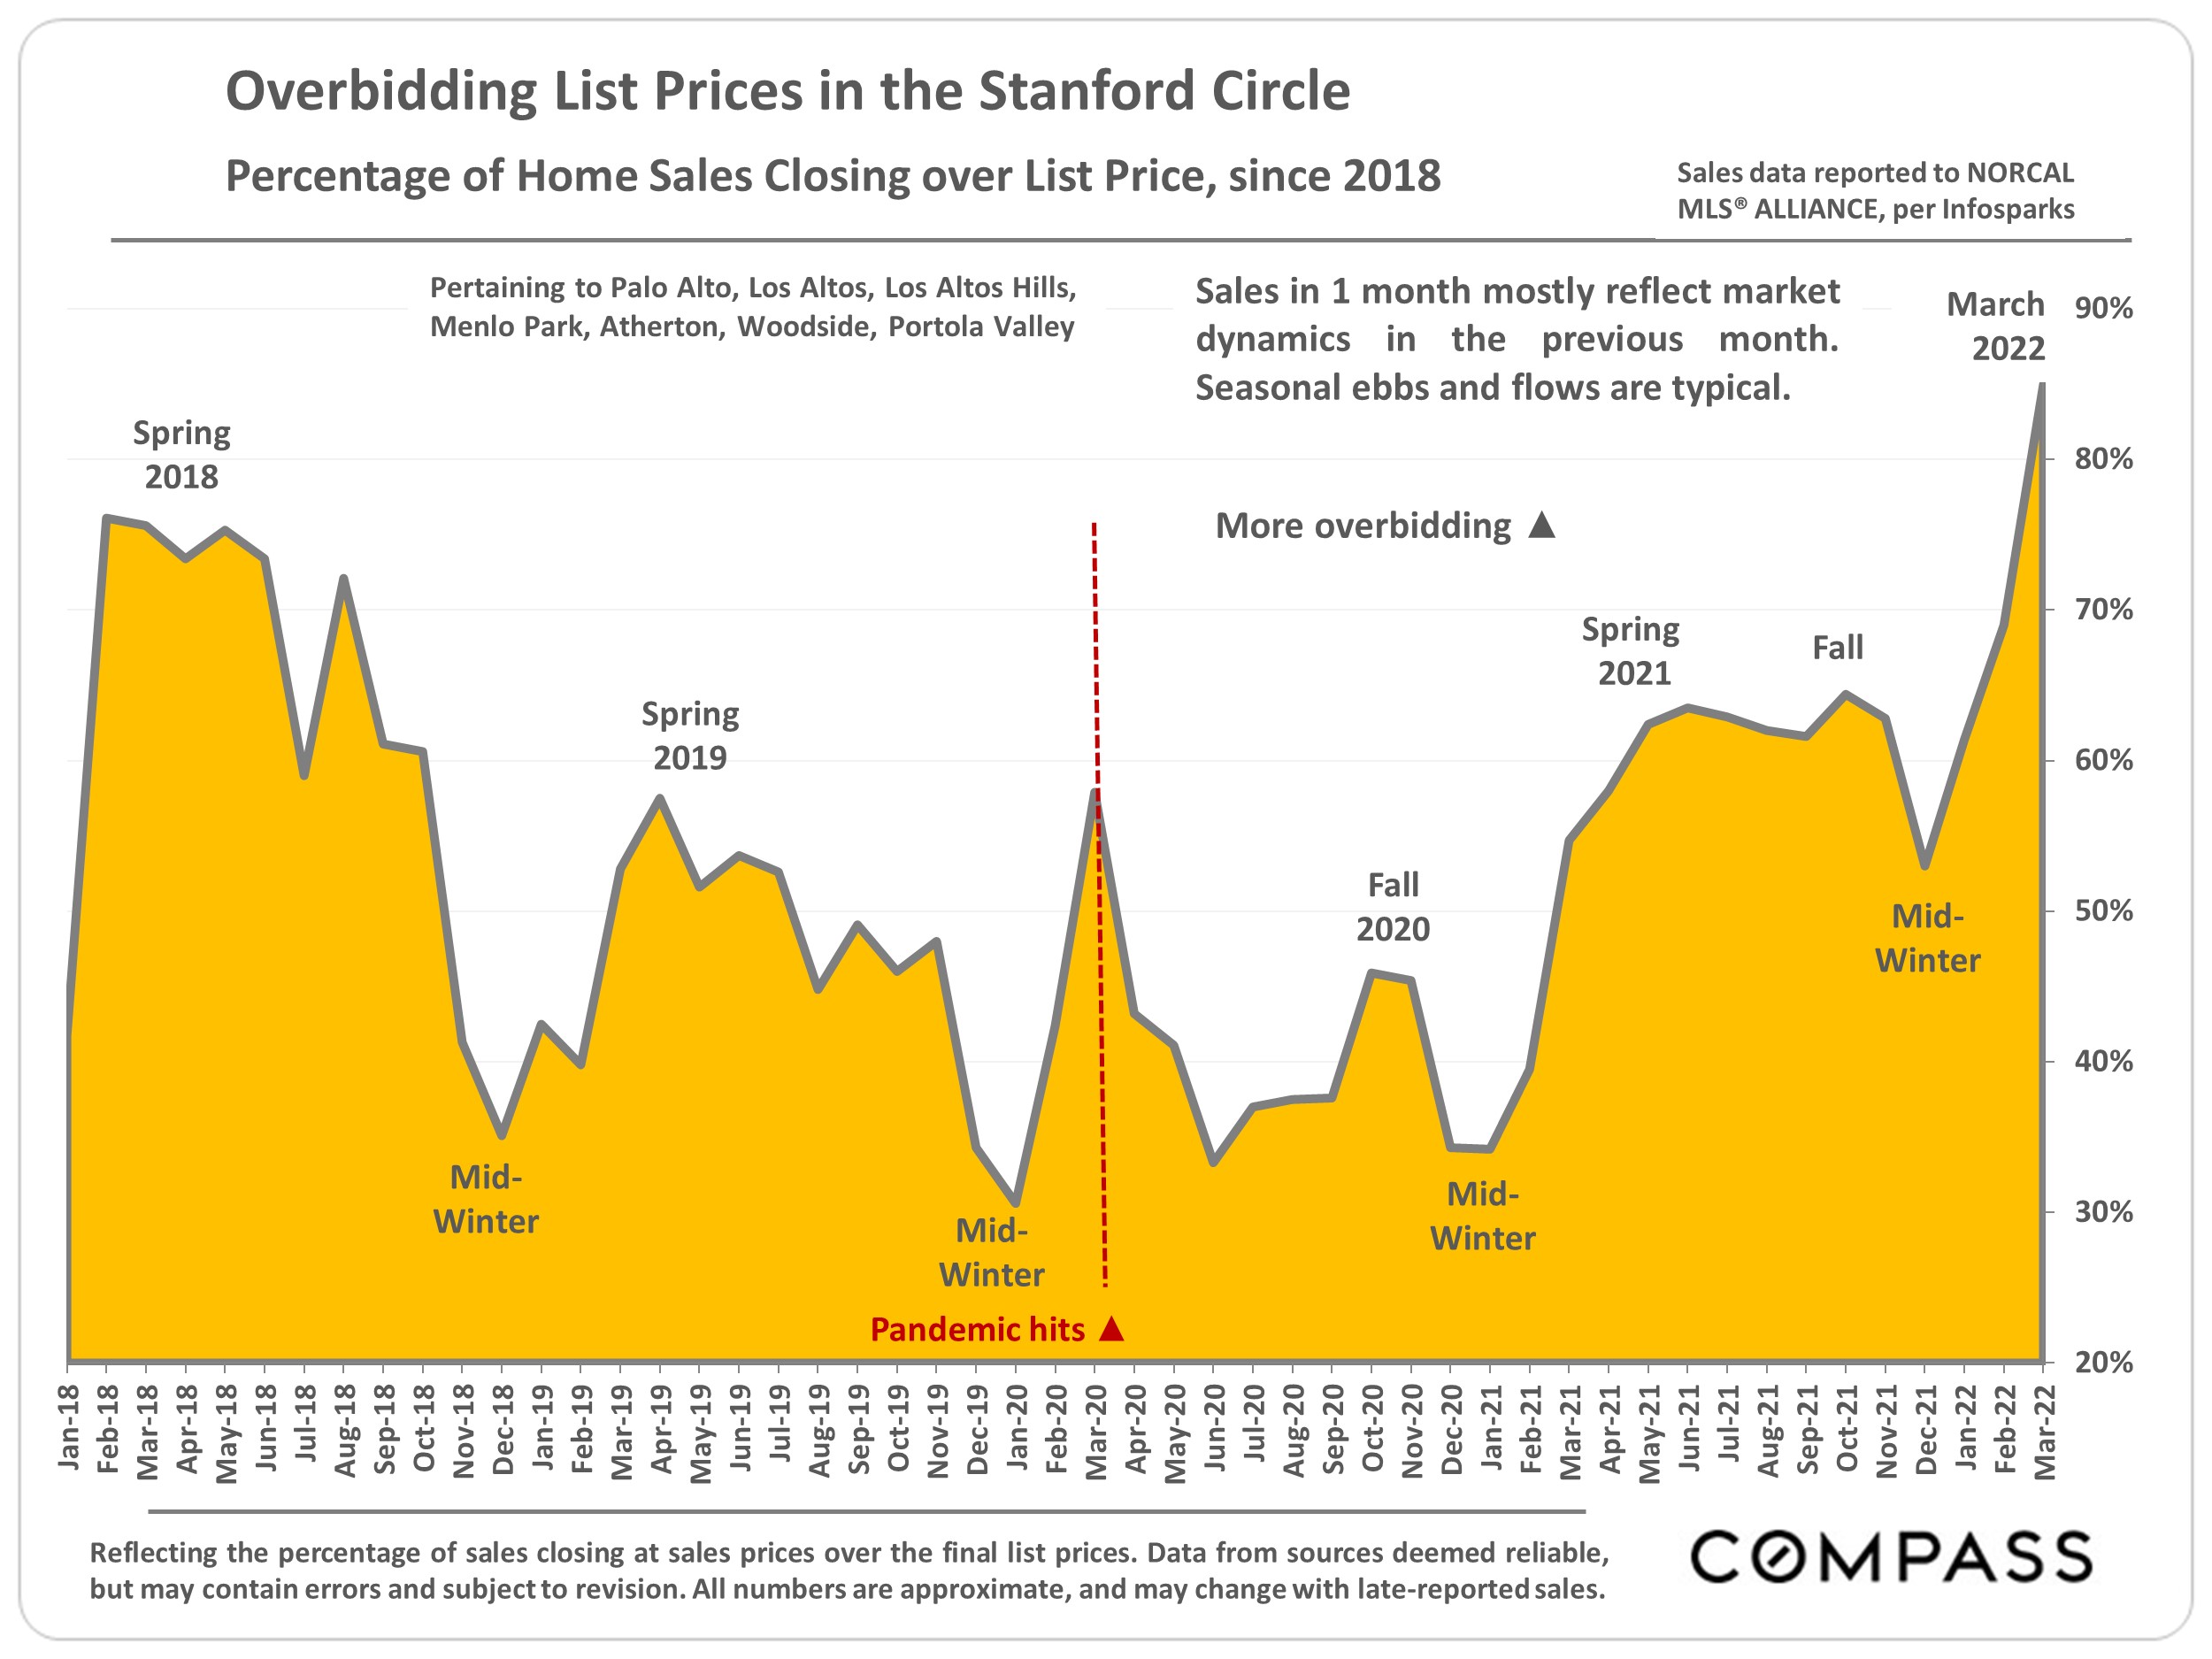
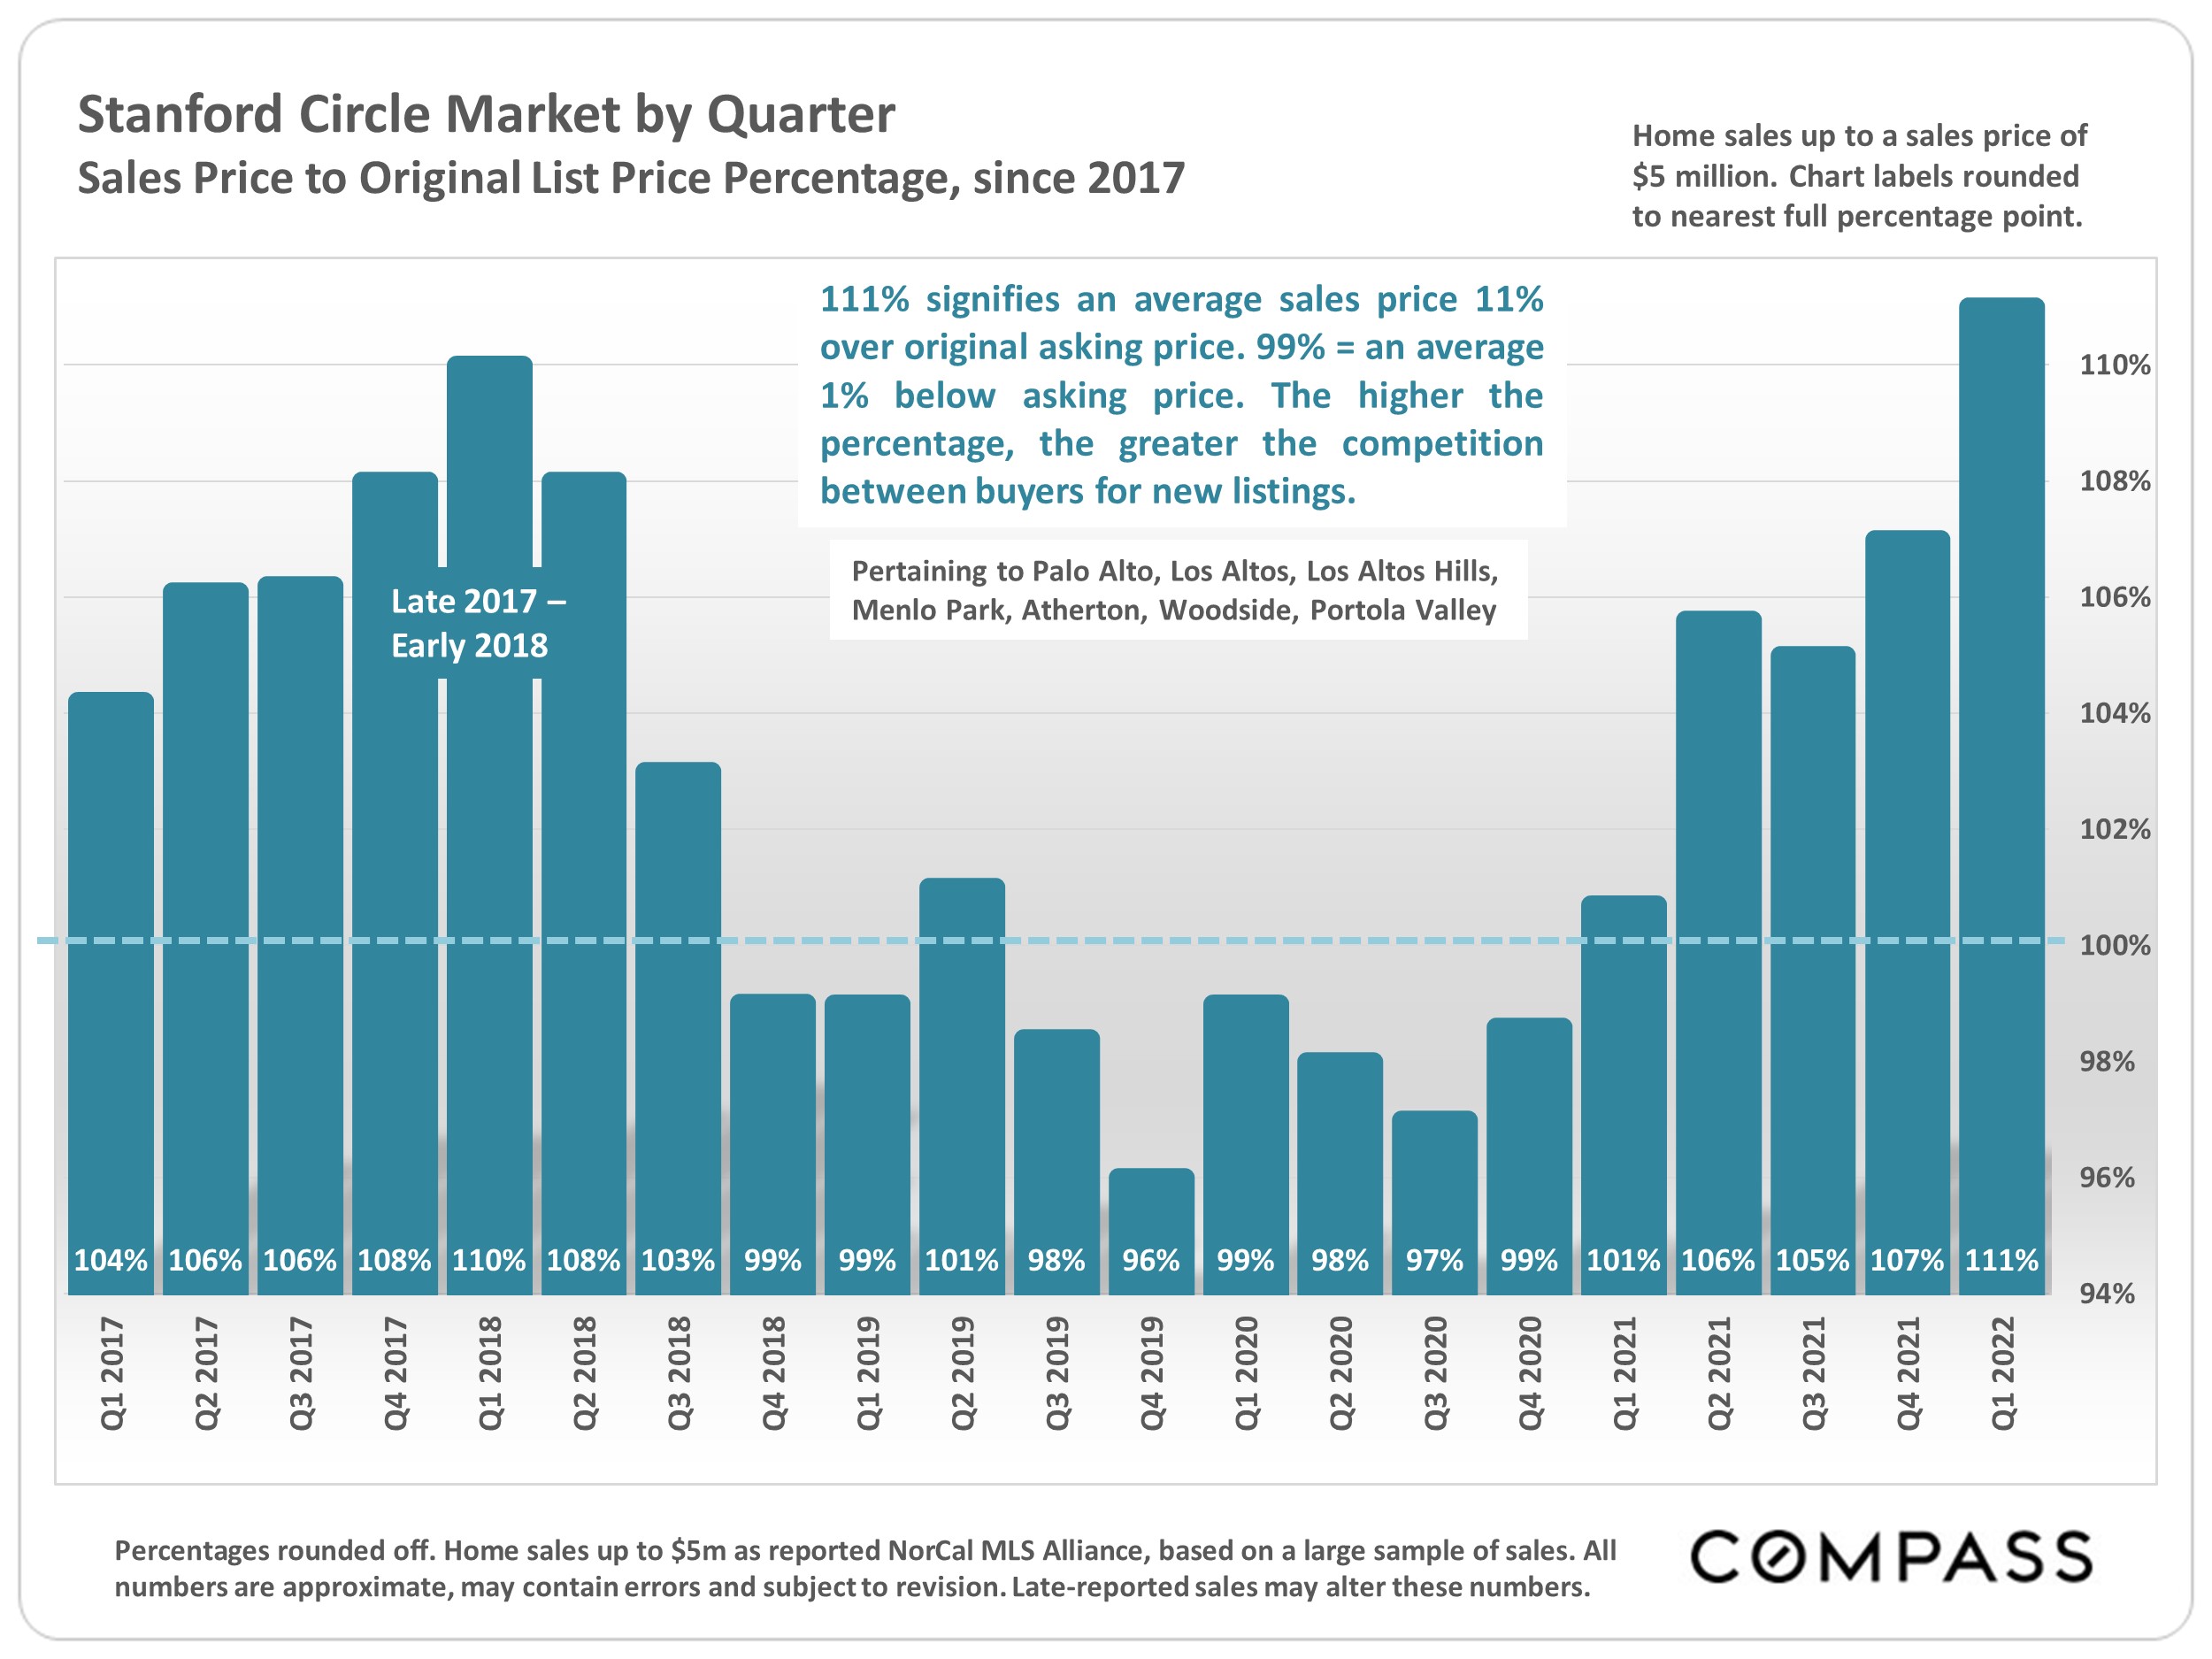
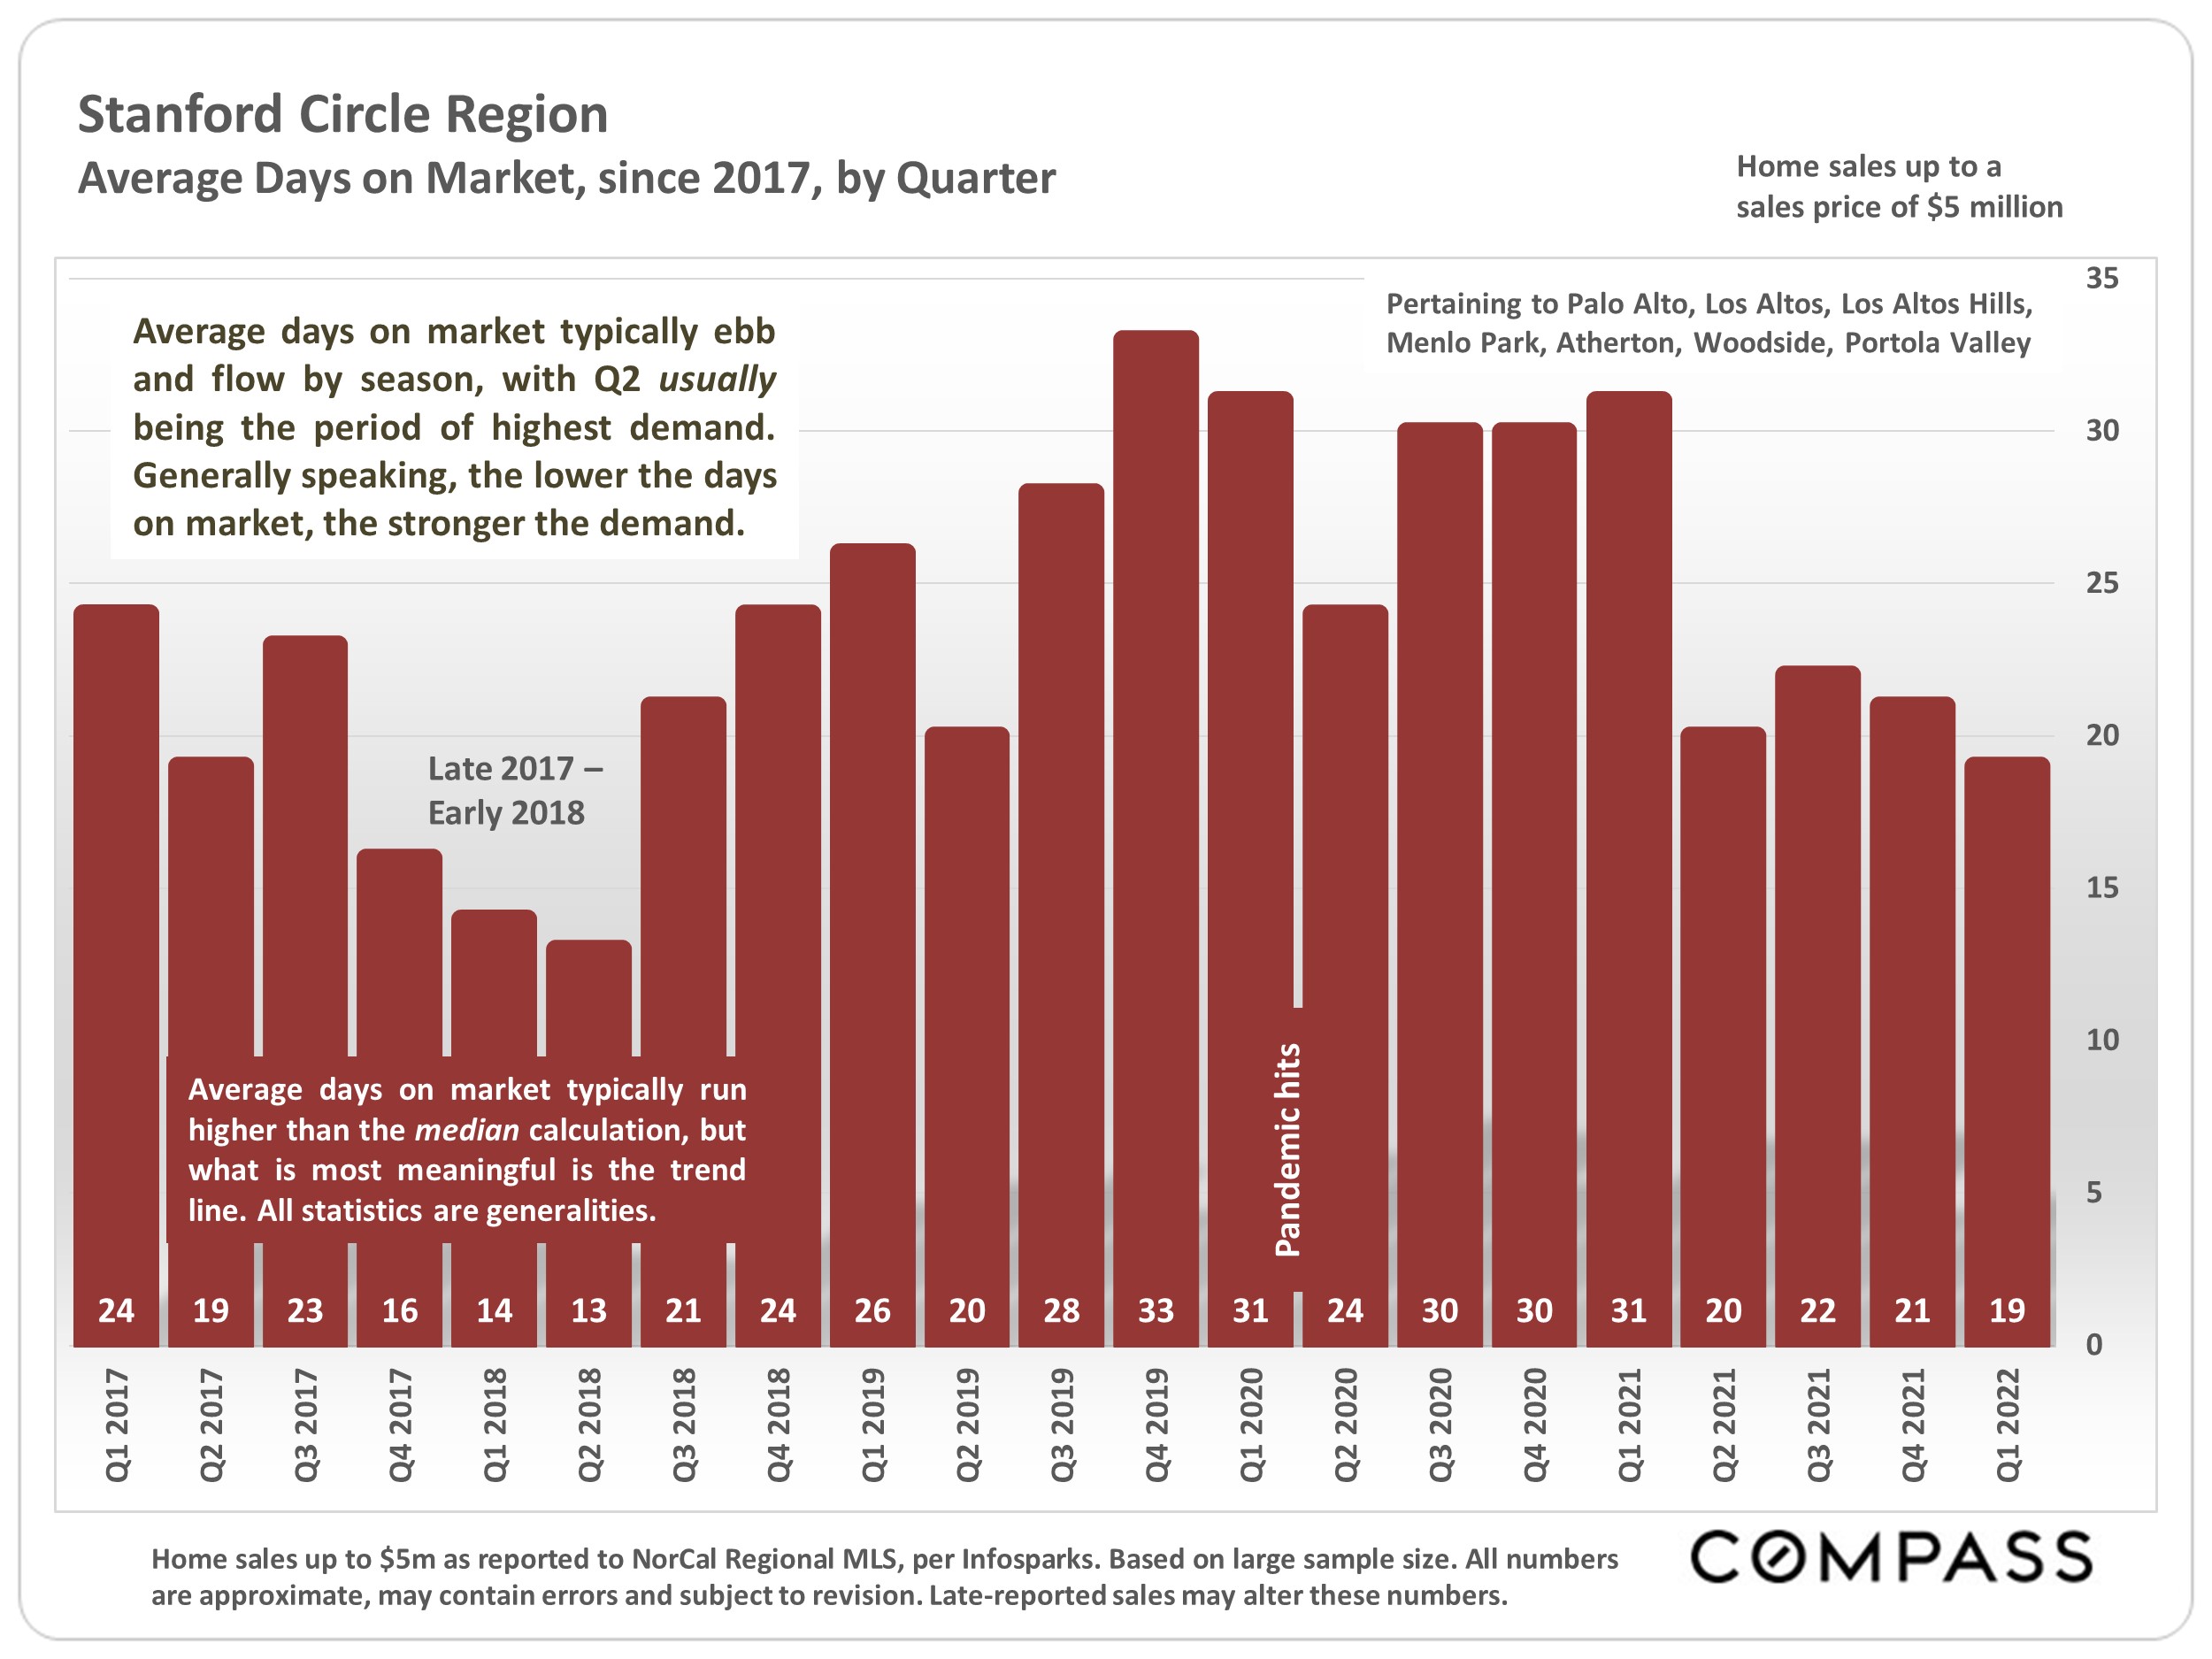
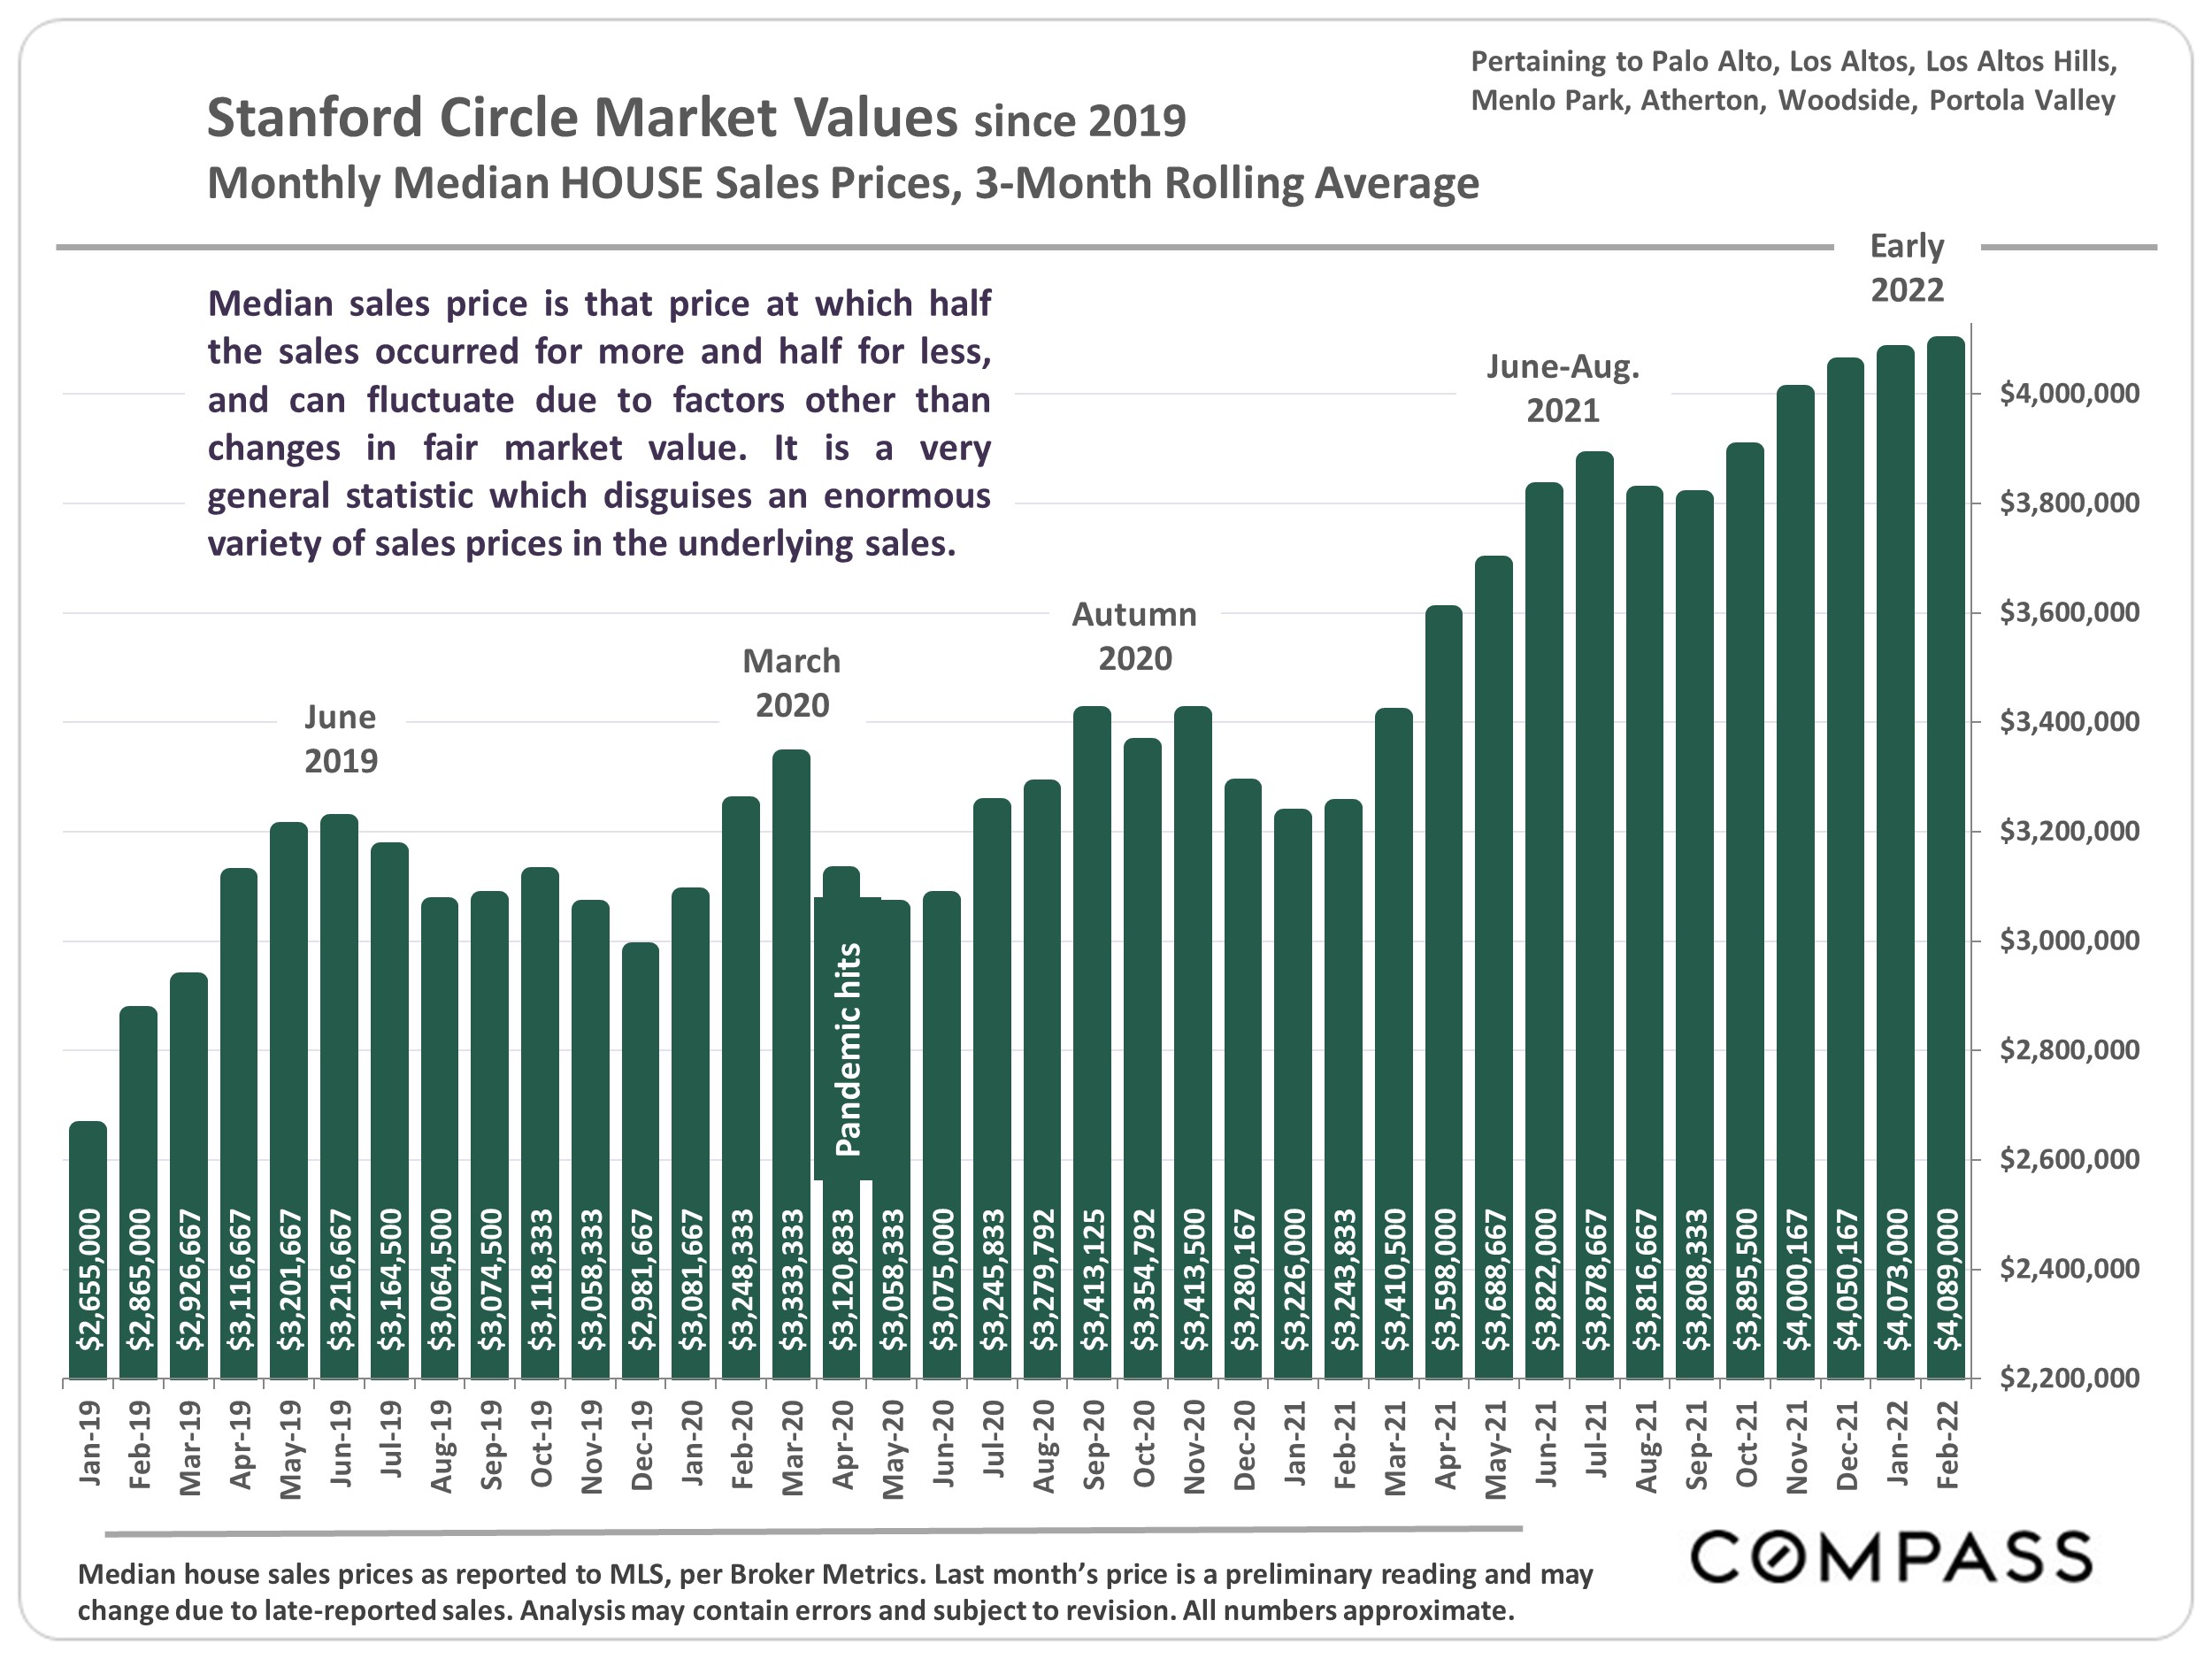
Year-over-year, the number of sales and listings going into contract have significantly dropped, but the homes that are selling are still, on average, selling very quickly for well over asking. Median sales prices and yearover-year appreciation rates remain high. When an overheated market cools, the change is typically gradual (absent a disaster event), and does not mean the market is weak by any normal standard. As an analogy, if traffic is going 120 miles per hour and drops to 75, it feels a lot slower, but cannot reasonably be described as slow. After 2 years of scorching demand, it may be difficult to remember what a more normal market feels like, but people will continue to buy and sell homes in the elite neighborhoods of the Stanford Circle cities.

As of late spring, less expensive home sales (by very elevated, Stanford Circle standards) have generally seen considerable declines. For the time being, sales of luxury homes ($5 million+) have held up, but in most of the Bay Area, cooling demand is showing up clearly in pending-sale data for luxury homes – though not yet here. Affluent buyers tend to be more affected by financial markets, which became very volatile in May. Market changes are often uneven in the early months of a transition, with one home selling in days at 25% over list price, while next door, the seller has to reduce their price to get an offer. As markets cool – and markets are cooling across the country – buyers become more discriminating. Negative conditions previously ignored are noticed; more negotiation occurs; multiple offers and overbidding decline. Listings that are well prepared, show well, and priced right will have an increasing advantage.

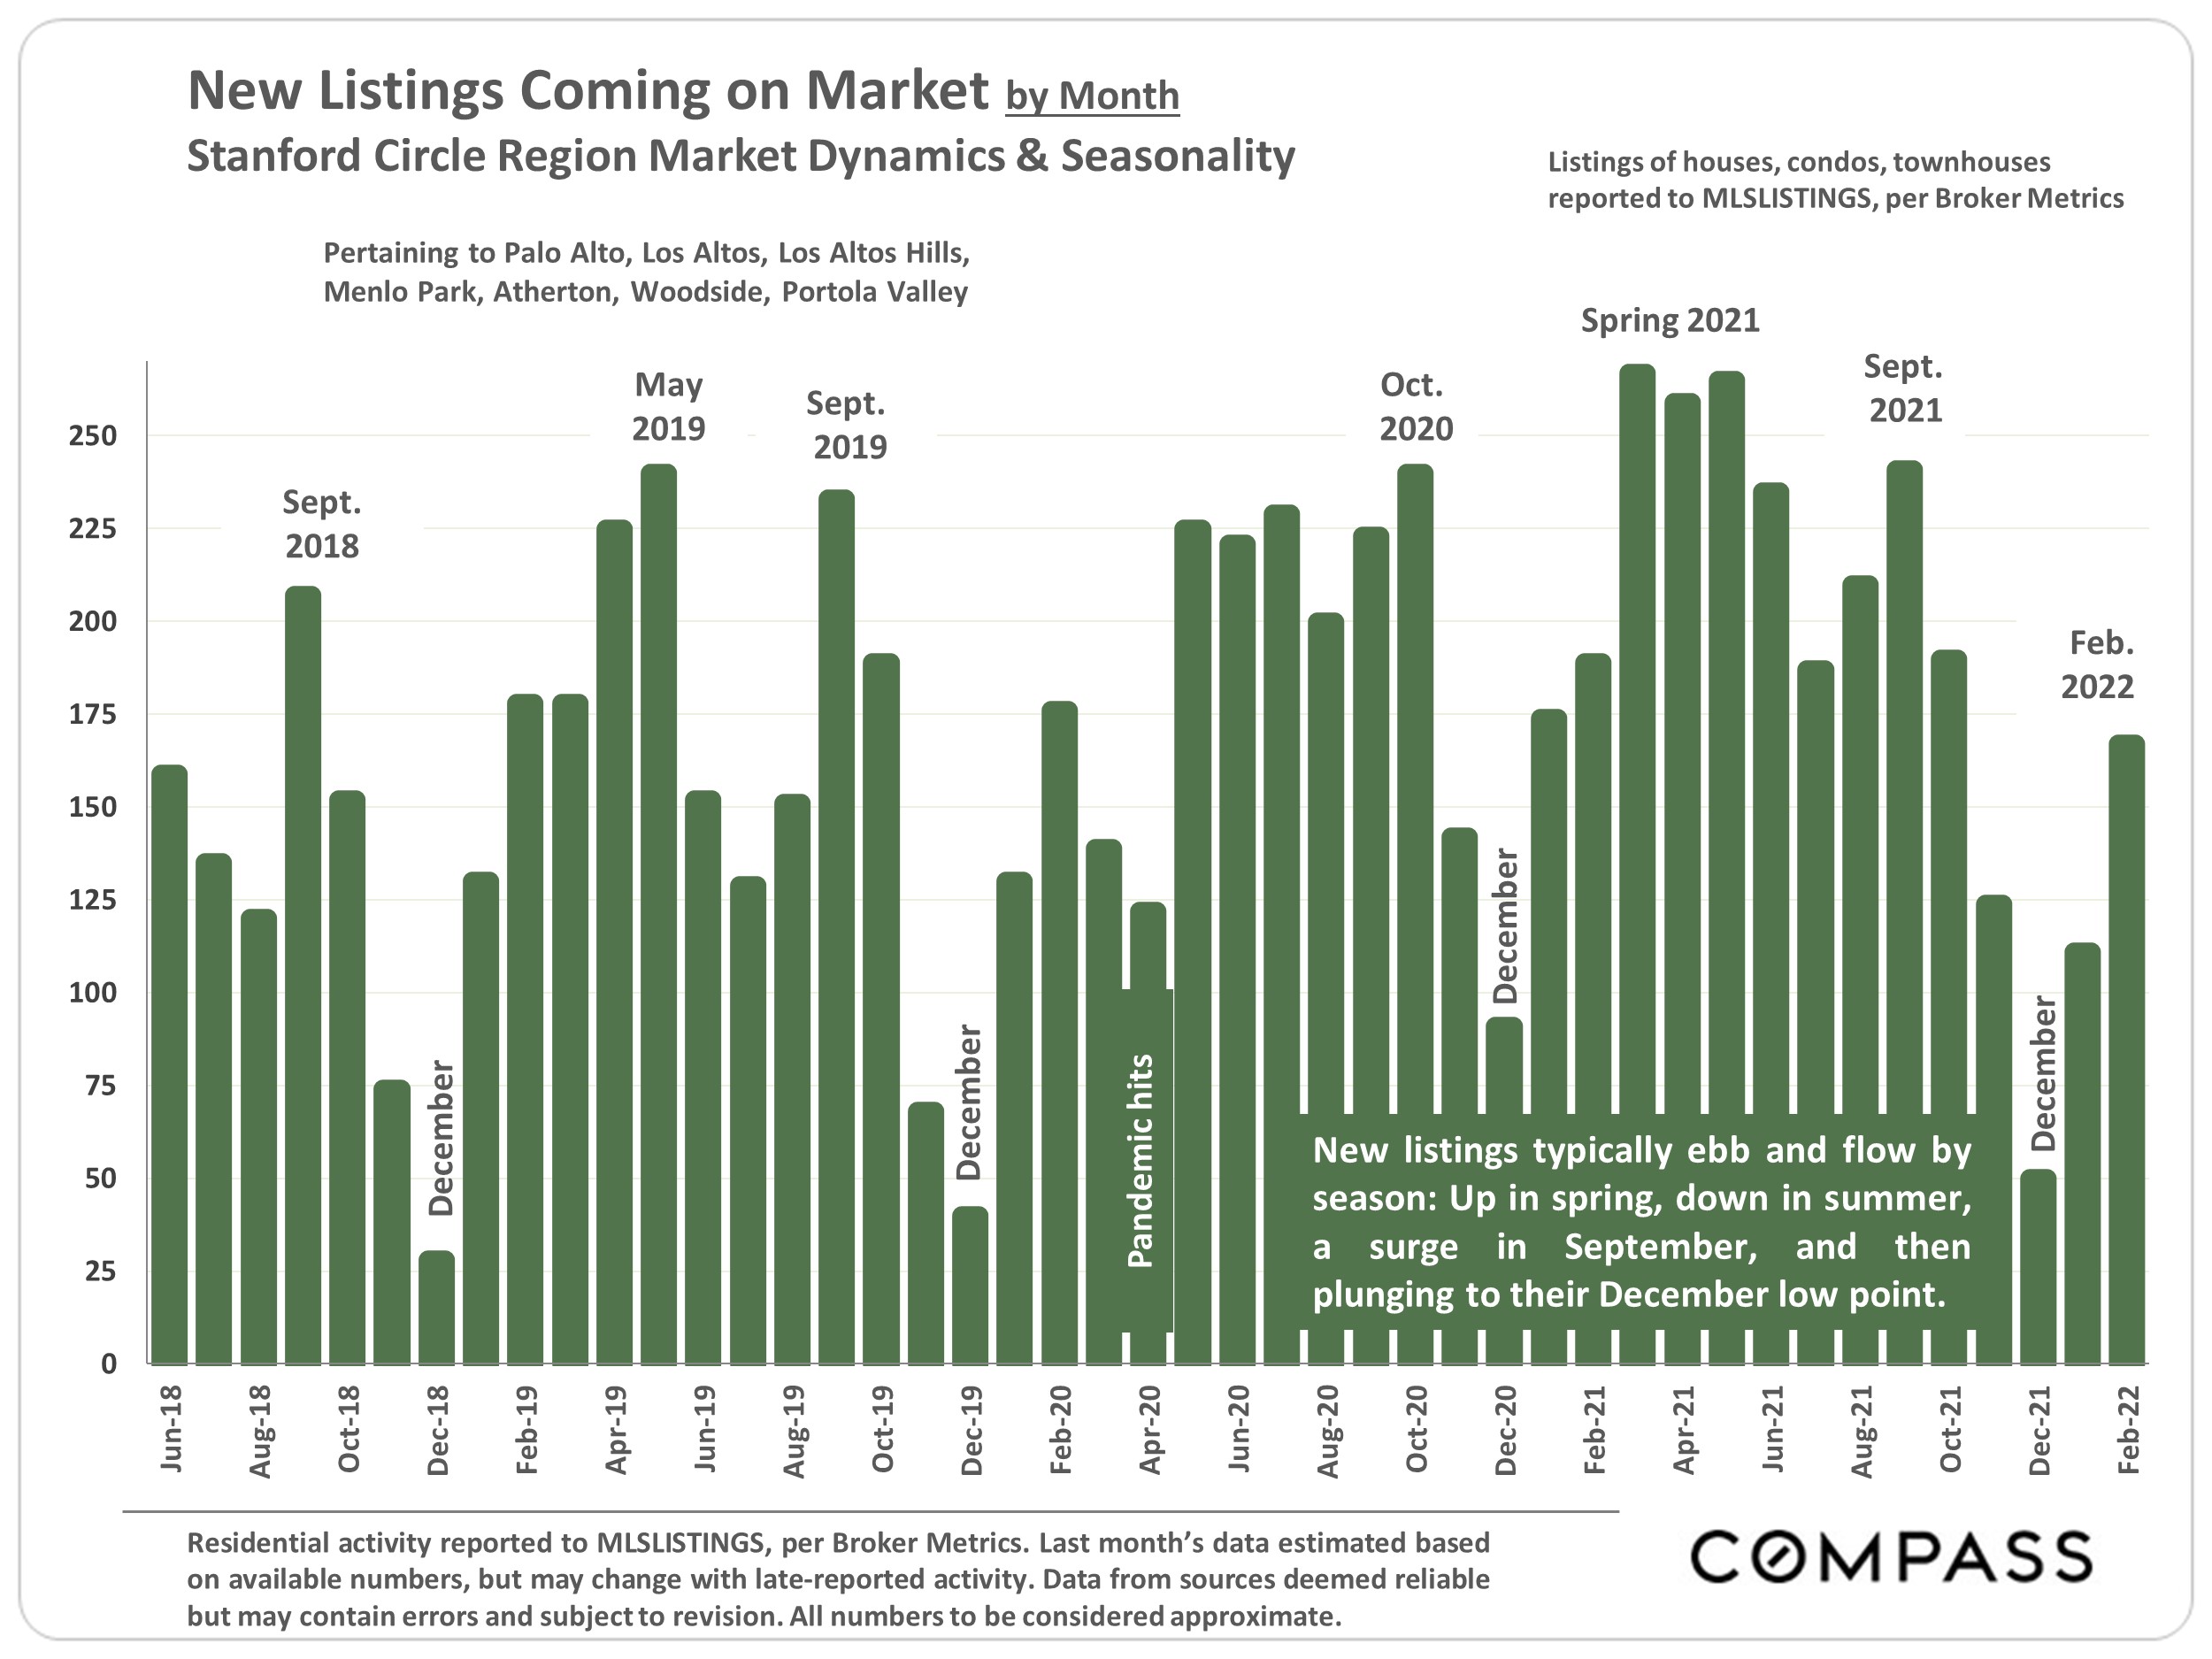
After peaking in spring, market activity typically slows through summer. Autumn usually sees another, shorter spike in activity prior to the big mid-winter slowdown. These are common seasonal dynamics, though other factors can come into play. We will have to wait and see what occurs in the economy in coming months.

This report will look at recent, year-over-year changes in inventory and demand, while also reviewing longer term trends for more context. Included is a link to a report reviewing city/town submarkets.


Source: Compass

It is impossible to know how median and average value statistics apply to any particular home without a specific comparative market analysis. These analyses were made in good faith with data from sources deemed reliable, but may contain errors and are subject to revision. It is not our intent to convince you of a particular position, but to attempt to provide straightforward data and analysis, so you can make your own informed decisions. Median and average statistics are enormous generalities: There are hundreds of different markets in San Francisco and the Bay Area, each with its own unique dynamics. Median prices and average dollar per square foot values can be and often are affected by other factors besides changes in fair market value. Longer term trends are much more meaningful than short-term.

Compass is a real estate broker licensed by the State of California, DRE 01527235. Equal Housing Opportunity. This report has been prepared solely for information purposes. The information herein is based on or derived from information generally available to the public and/or from sources believed to be reliable. No representation or warranty can be given with respect to the accuracy or completeness of the information. Compass disclaims any and all liability relating to this report, including without limitation any express or implied representations or warranties for statements contained in, and omissions from, the report. Nothing contained herein is intended to be or should be read as any regulatory, legal, tax, accounting or other advice and Compass does not provide such advice. All opinions are subject to change without notice. Compass makes no representation regarding the accuracy of any statements regarding any references to the laws, statutes or regulations of any state are those of the author(s). Past performance is no guarantee of future results.

San Francisco County Real Estate, June 2022

Source: Compass

It is impossible to know how median and average value statistics apply to any particular home without a specific comparative market analysis. These analyses were made in good faith with data from sources deemed reliable, but may contain errors and are subject to revision. It is not our intent to convince you of a particular position, but to attempt to provide straightforward data and analysis, so you can make your own informed decisions. Median and average statistics are enormous generalities: There are hundreds of different markets in San Francisco and the Bay Area, each with its own unique dynamics. Median prices and average dollar per square foot values can be and often are affected by other factors besides changes in fair market value. Longer term trends are much more meaningful than short-term.

Compass is a real estate broker licensed by the State of California, DRE 01527235. Equal Housing Opportunity. This report has been prepared solely for information purposes. The information herein is based on or derived from information generally available to the public and/or from sources believed to be reliable. No representation or warranty can be given with respect to the accuracy or completeness of the information. Compass disclaims any and all liability relating to this report, including without limitation any express or implied representations or warranties for statements contained in, and omissions from, the report. Nothing contained herein is intended to be or should be read as any regulatory, legal, tax, accounting or other advice and Compass does not provide such advice. All opinions are subject to change without notice. Compass makes no representation regarding the accuracy of any statements regarding any references to the laws, statutes or regulations of any state are those of the author(s). Past performance is no guarantee of future results.

San Francisco County Real Estate, May 2022

Amid Dramatic Home-Price Gains to New Peaks,
Preliminary Signs of Markets Shifting Cooler

In April 2022, the Bay Area continued to see appreciation, overbidding and days-on-market reflecting extremely intense demand. But sales are a lagging indicator reflecting offers accepted 3-6 weeks earlier. April sales mostly reflect buyers who locked in mortgage rates before the big late-March/April jumps, buyers highly motivated to buy before their interest rate locks expired, adding short-term pressure to demand.

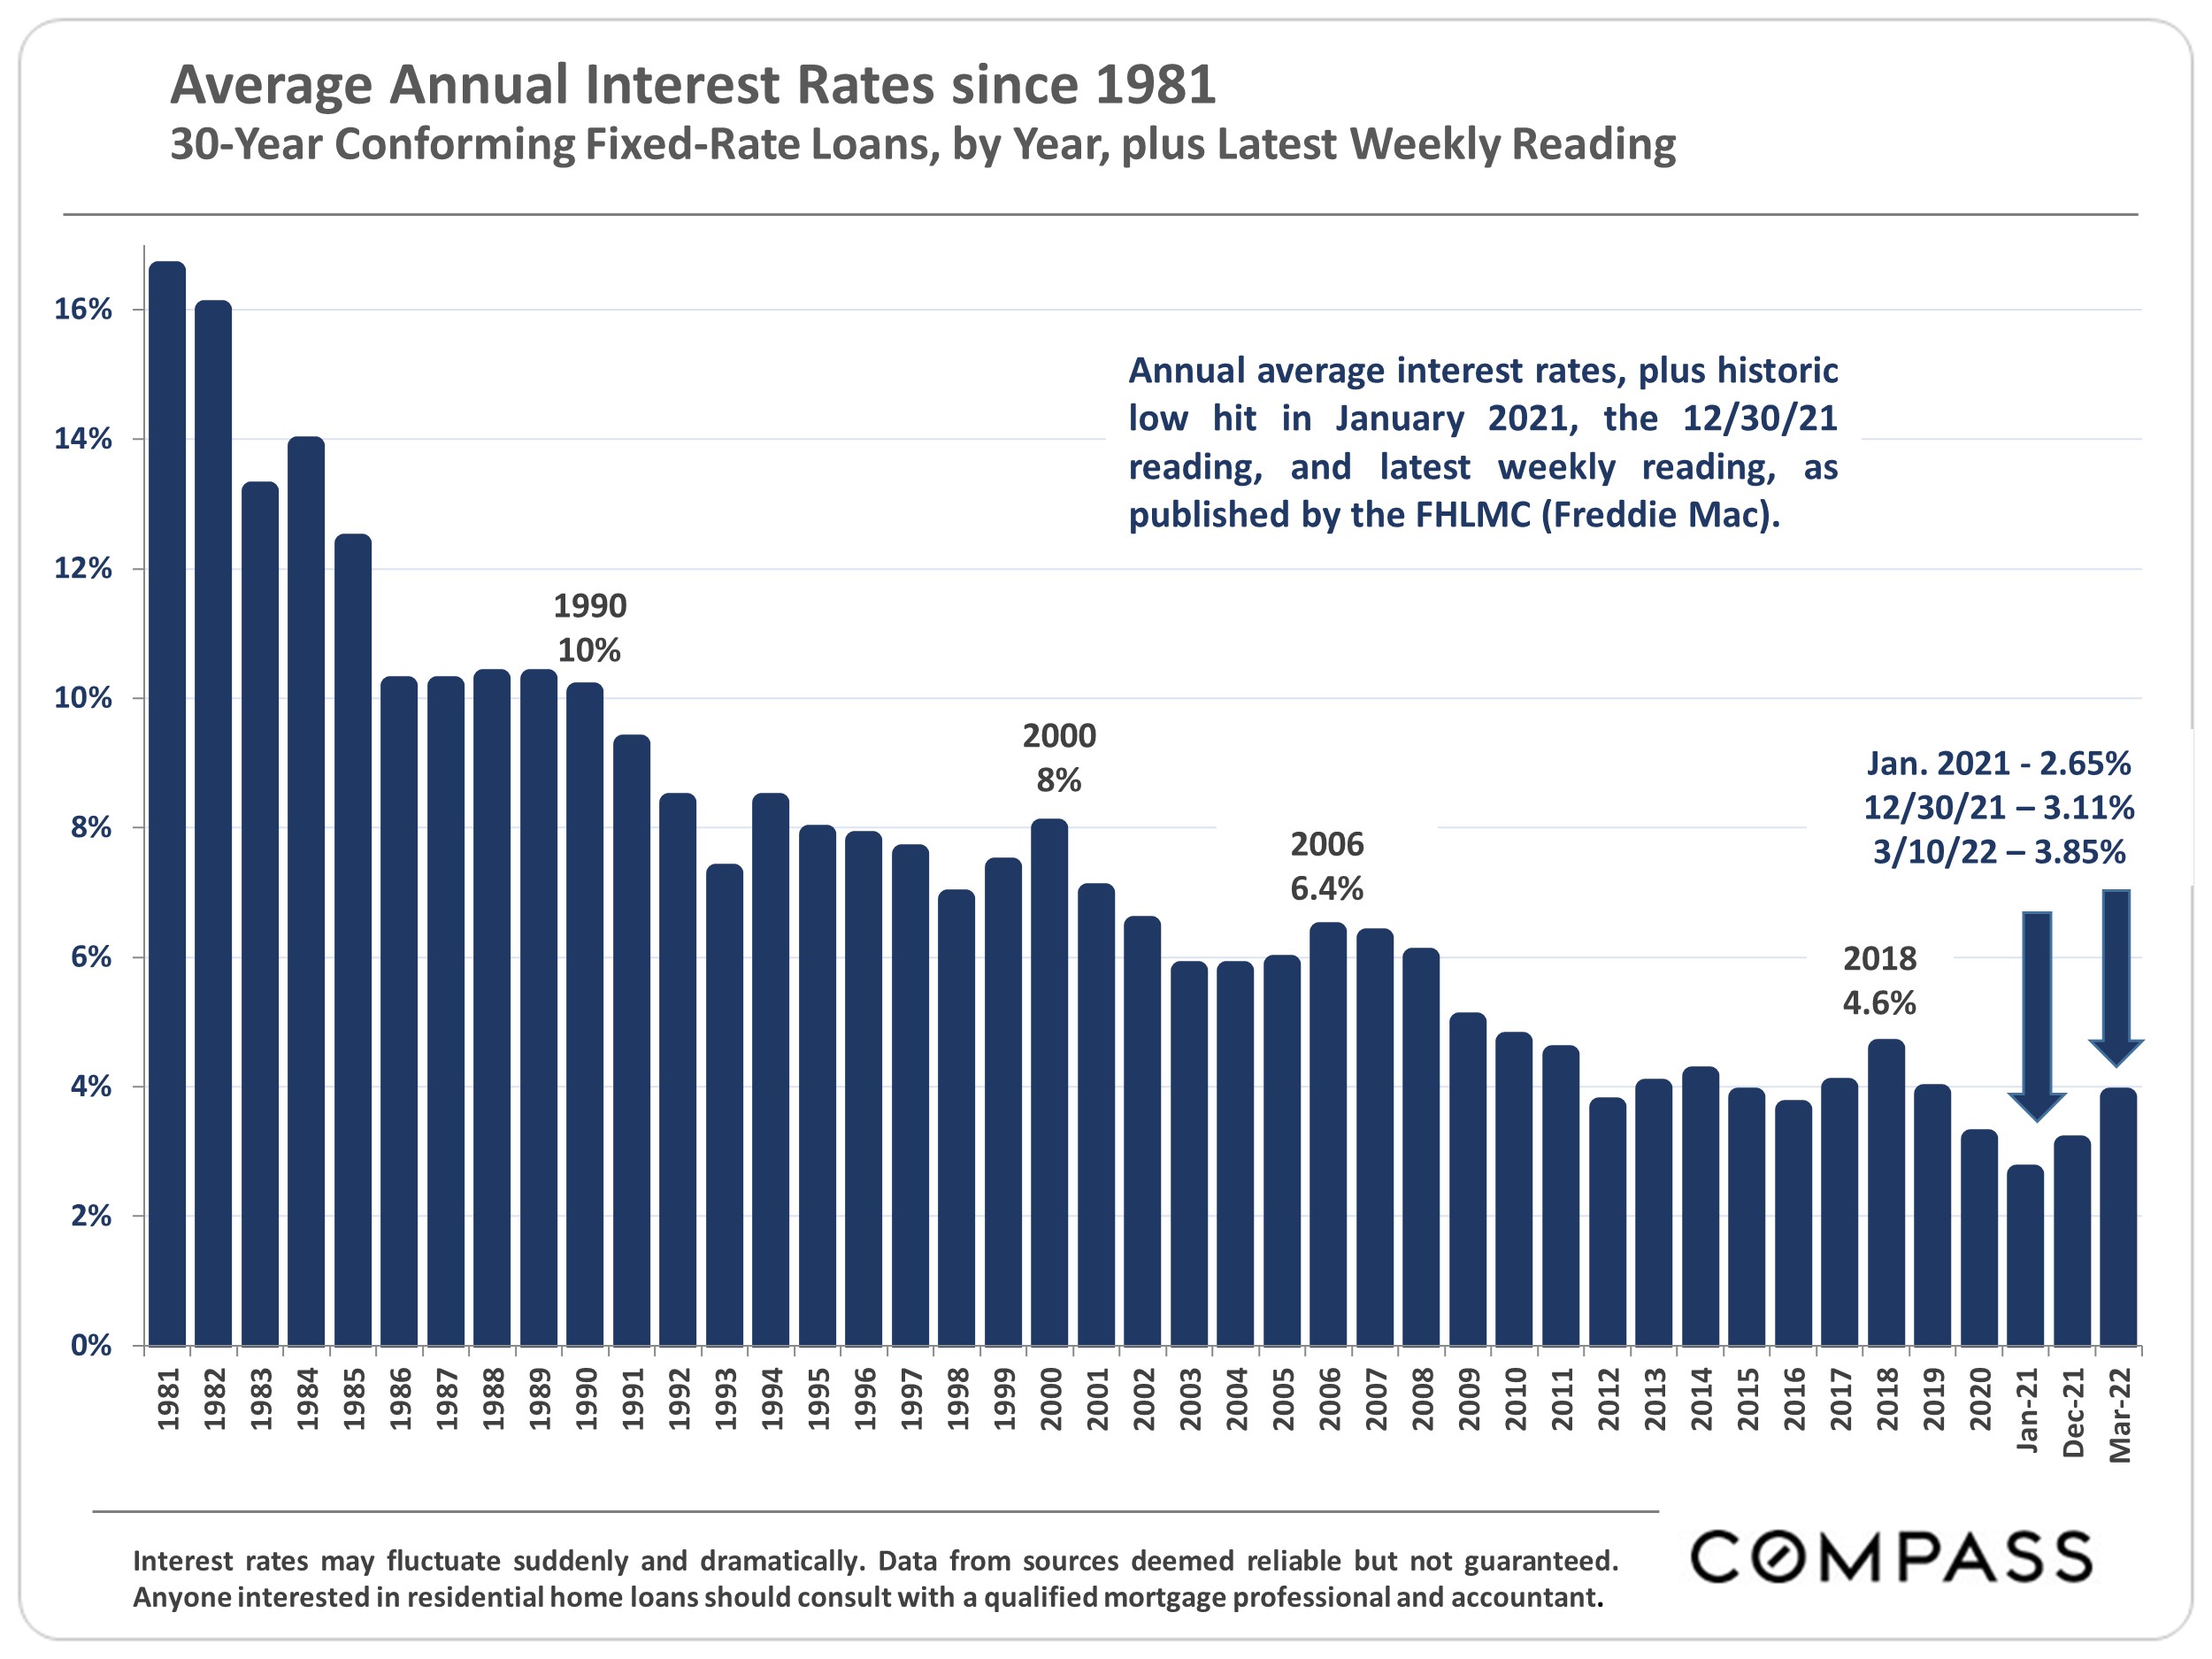
Declining interest rates stimulate demand: In recent years, large rate declines subsidized much of the surge in home prices. Escalating interest rates initially fueled demand in early 2022 as buyers rushed to avoid further rises, but at a certain point, big increases, especially if coupled with peak prices, batter affordability. And all buyers – even all-cash buyers – can be affected financially and psychologically by stock market declines and economic uncertainty. If continuing, these factors can be expected to dampen purchase activity.

As of May 5, mortgage rates were up 69% in 2022, and the scale and speed of the increase make it difficult to predict precise effects; inflation is at a 40-year high; the S&P 500 is down 14% and the Nasdaq, 22%. *The housing market is beginning to show preliminary, but not universal reactions. Accounts of less crowded open houses and fewer offers on new listings are becoming more common. Some buyers are dropping out or becoming more selective; some sellers are moving listing dates forward. In many markets, declines in listings going into contract occurred in April. But some agents report no change, so far, in client plans or motivation. Due to the time involved in the home search/closing process, and the extremely heated conditions of early 2022, substantial changes in closed-sales statistics, if coming, won’t appear until later in Q2 or Q3.

Even the hottest markets eventually cool. This does not necessarily imply a large “bubble and crash” (terms much overused). Over the past 4 decades, a cooling shift has typically meant a gradual decline in sales activity, then either a leveling off in appreciation or price declines of 5% to 10%: More like a slow leak in an over-pressurized tire than a blowout at high speed. The 2008 subprime crisis – a true bubble & crash – was an extreme event brought about by a massive failure of ethics, underwriting standards and risk management in the loan, banking, investment and ratings industries.

*Markets have been volatile: Interest rates and stock markets are subject to sudden, dramatic changes.

When hot markets shift cooler, effects are typically first reflected in reductions in multiple offers, overbidding and the number of homes going into contract; gradual increases in active listings and time-on-market; and gradual declines in year-over-year appreciation rates. Historically, after a down cycle runs its course, the market moves into the next upcycle and home prices climb (often relatively quickly) above previous peaks. Over the longer term, past appreciation trends – magnified by tax breaks & financing options – have typically made Bay Area real estate an excellent, and often spectacular investment.

Looking back to spring 2018, 6 years into the market recovery from the foreclosure crisis, after an enormous boom in high-tech hiring, immigration and wealth, and dramatic home-price appreciation, Bay Area markets (and especially Santa Clara County) generally hit an intense peak in demand. In the second half of 2018, interest rates climbed 31% over the 2017 low, the S&P 500 dropped almost 20%, and supply and demand indicators swiftly cooled. By spring 2019, county median house sales prices were down about 7%: Not a huge drop, but after the high appreciation rates of previous years, a distinct shift in the psychology of the market. In Q3 2019, the Fed began lowering interest rates again. Then the pandemic struck in spring 2020, with profound social/economic effects, interest rates plunged, stock markets soared, and house prices rapidly climbed far above 2018 peaks. (Condo markets saw somewhat different pandemic-era dynamics.)

Many economic, political and demographic factors affect housing markets. What occurs with inflation, interest rates and stock markets will certainly be important. How the media covers the market will influence buyer and seller psychology. And major events often arise from off the radar (e.g. the pandemic, the war in Ukraine). The speed and scale of market changes often vary by region, price segment and property type. Less expensive homes may be more affected initially by rising interest rates, while affluent markets tend to be more influenced by sustained changes in financial markets. But over time, broad market trends tend to end up running roughly parallel across the Bay Area.

As always, analysts, economists and industry commentators are making diverging forecasts. Sales data in coming months should soon provide more concrete indications of market direction.

Not intended to convince anyone to take a specific course of action, or to predict the future, but only to provide, to the best of our ability, a straightforward analysis of market conditions and trends.

San Francisco Bay Area Real Estate Markets & Cycles since 1990 – Updated Through April 2022

San Francisco County Real Estate, April 2022

Soaring Interest Rates & Housing Costs; Continuing Strong Demand, Low Inventory of Listings & High Market Velocity

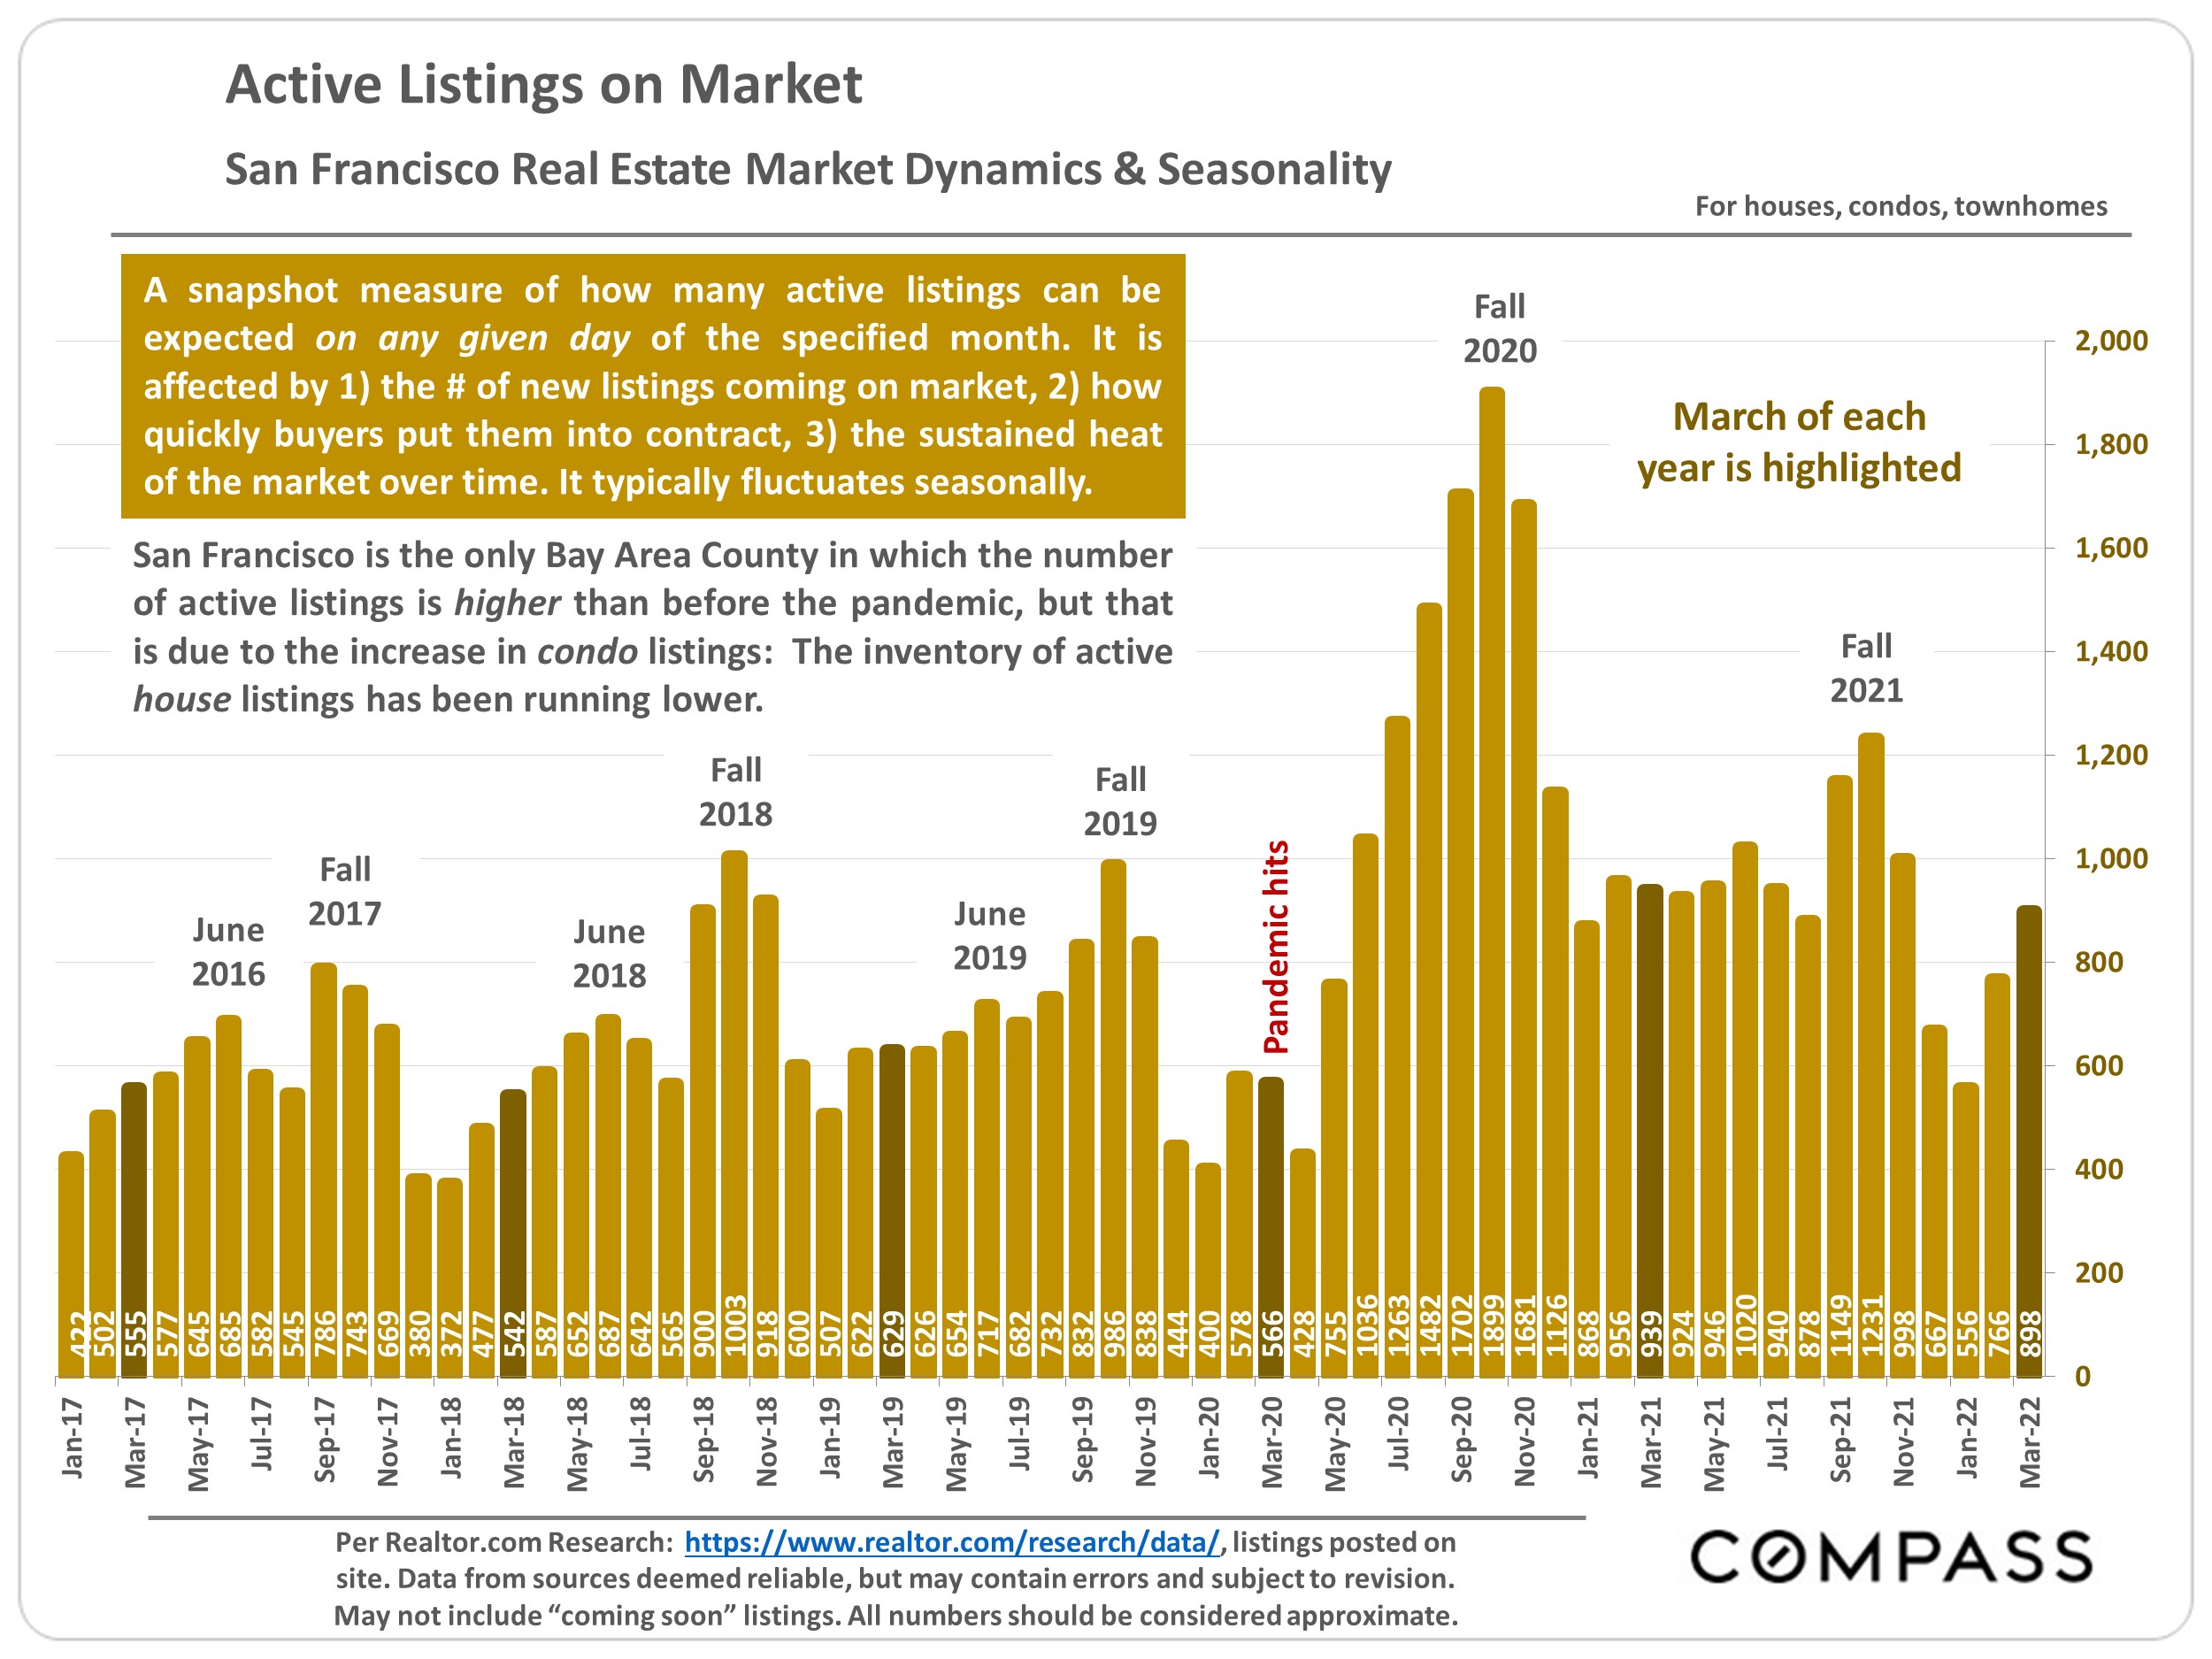
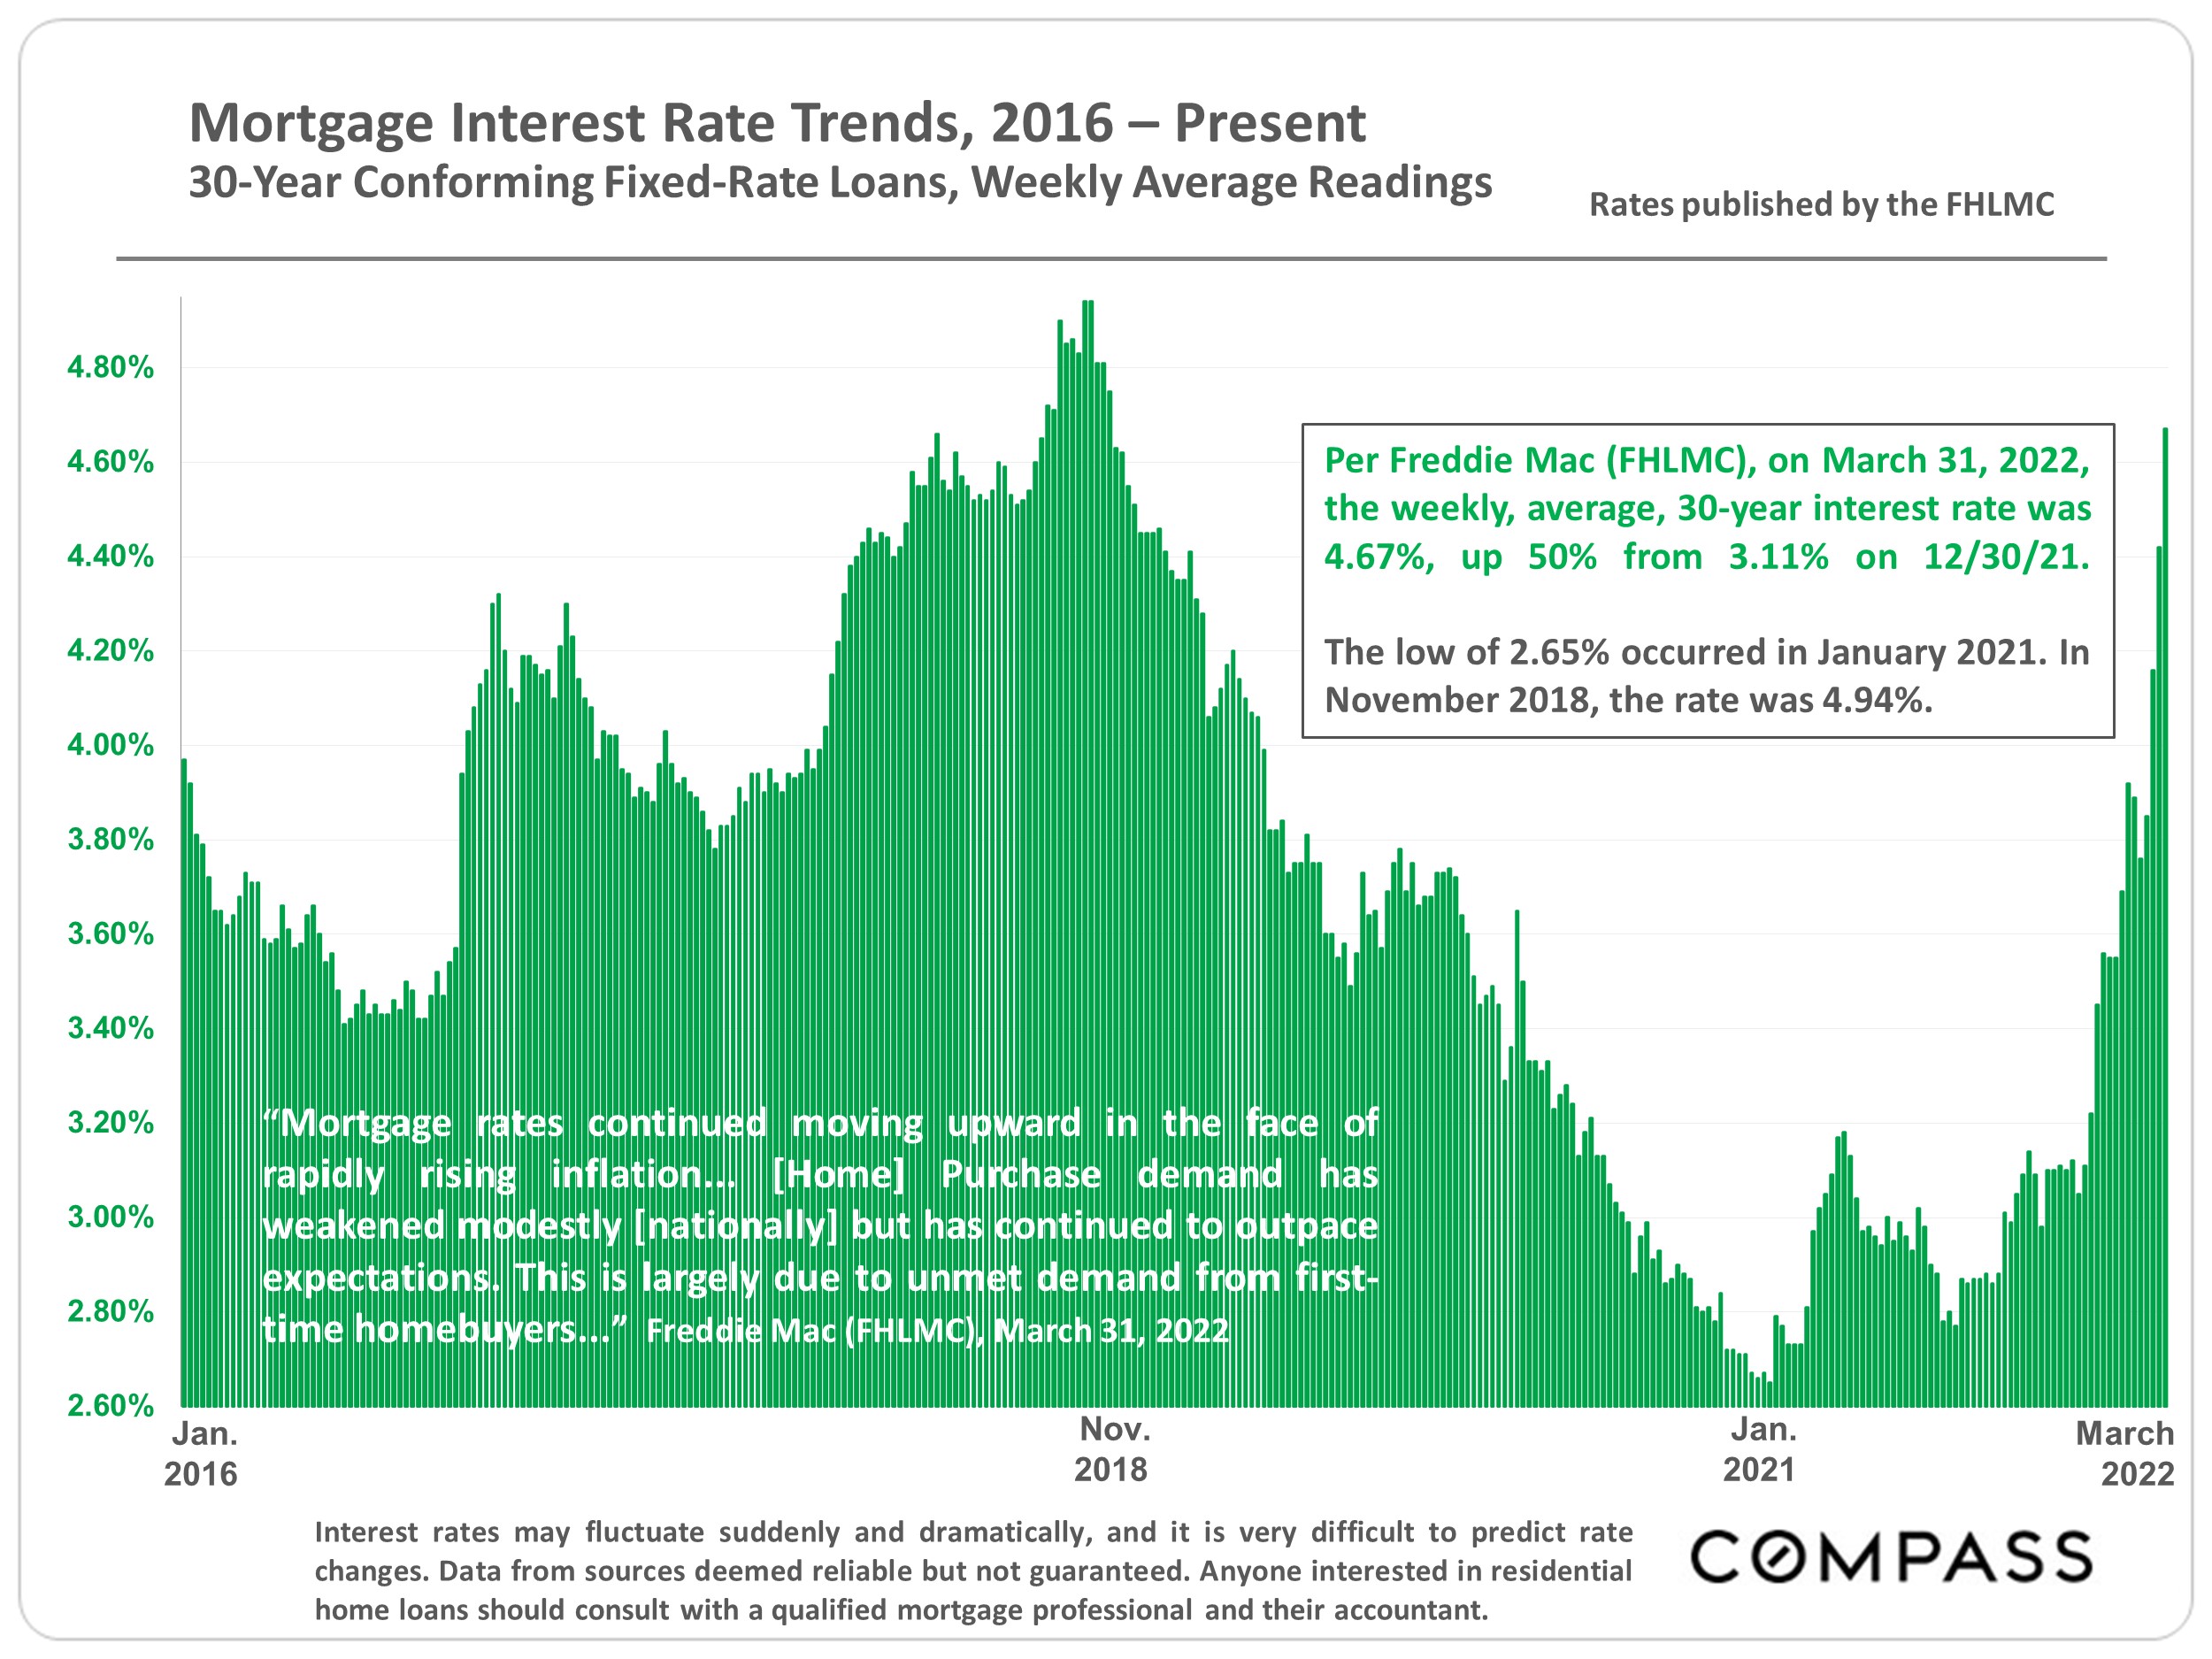
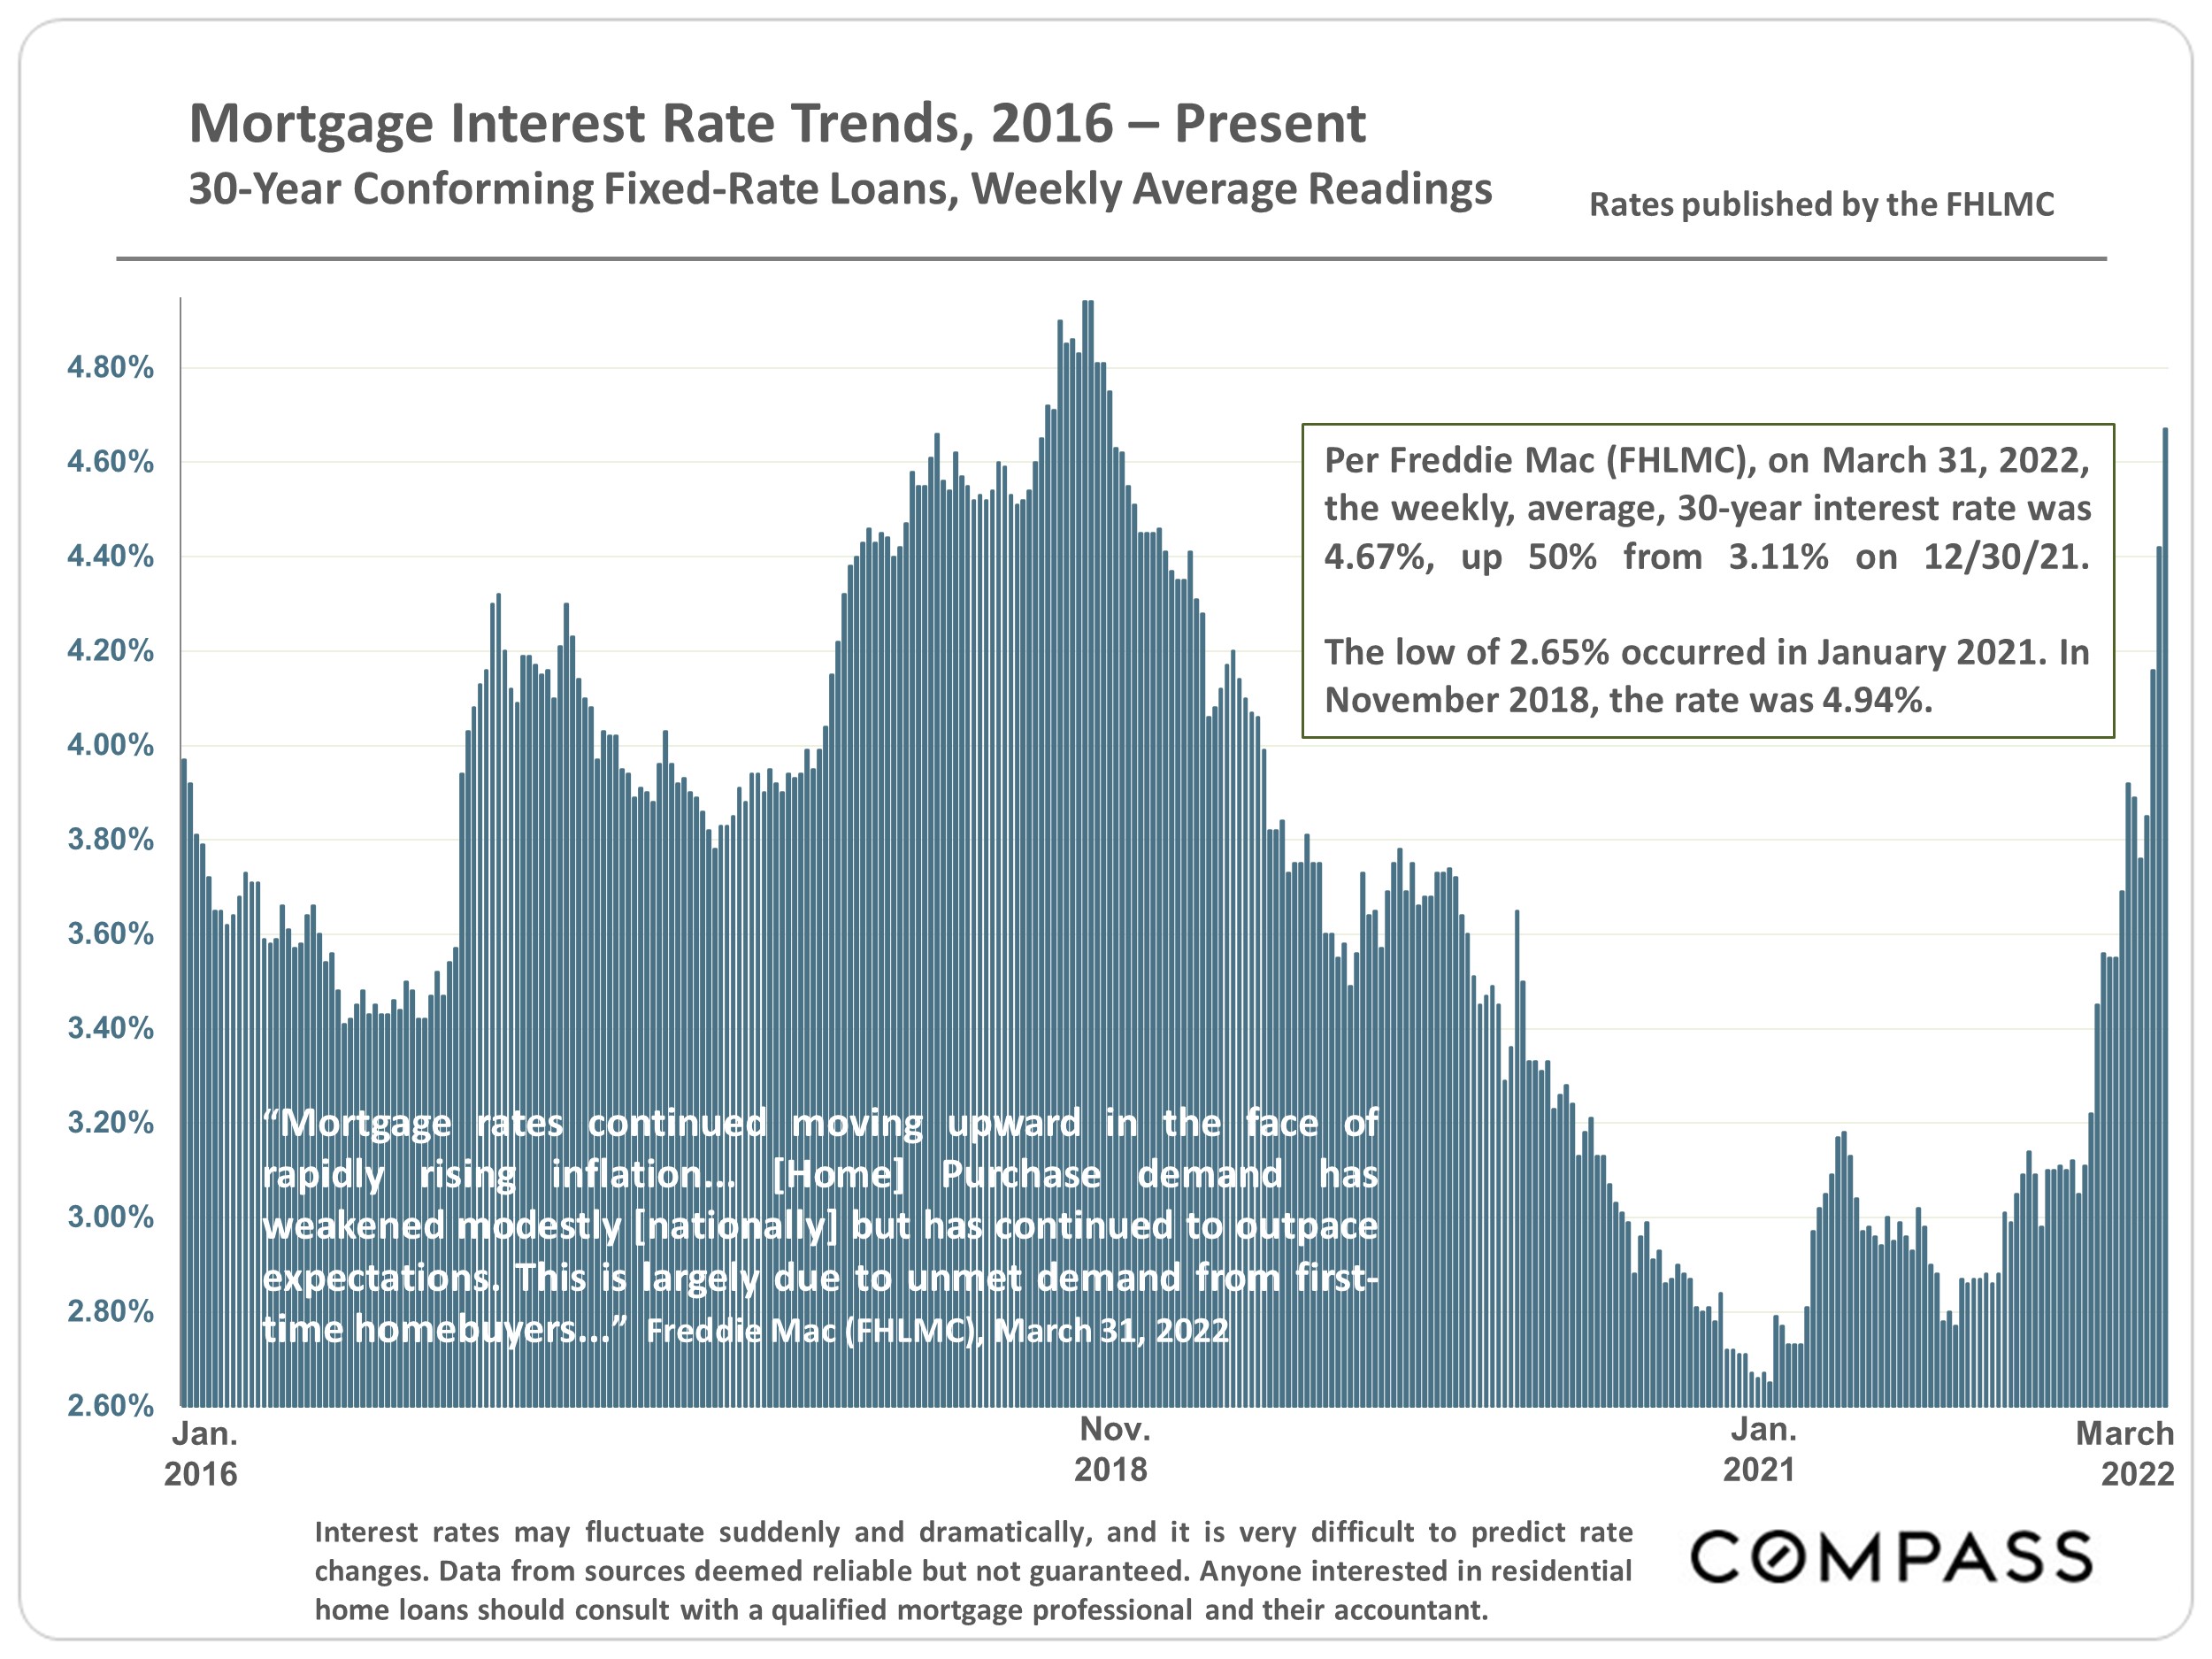
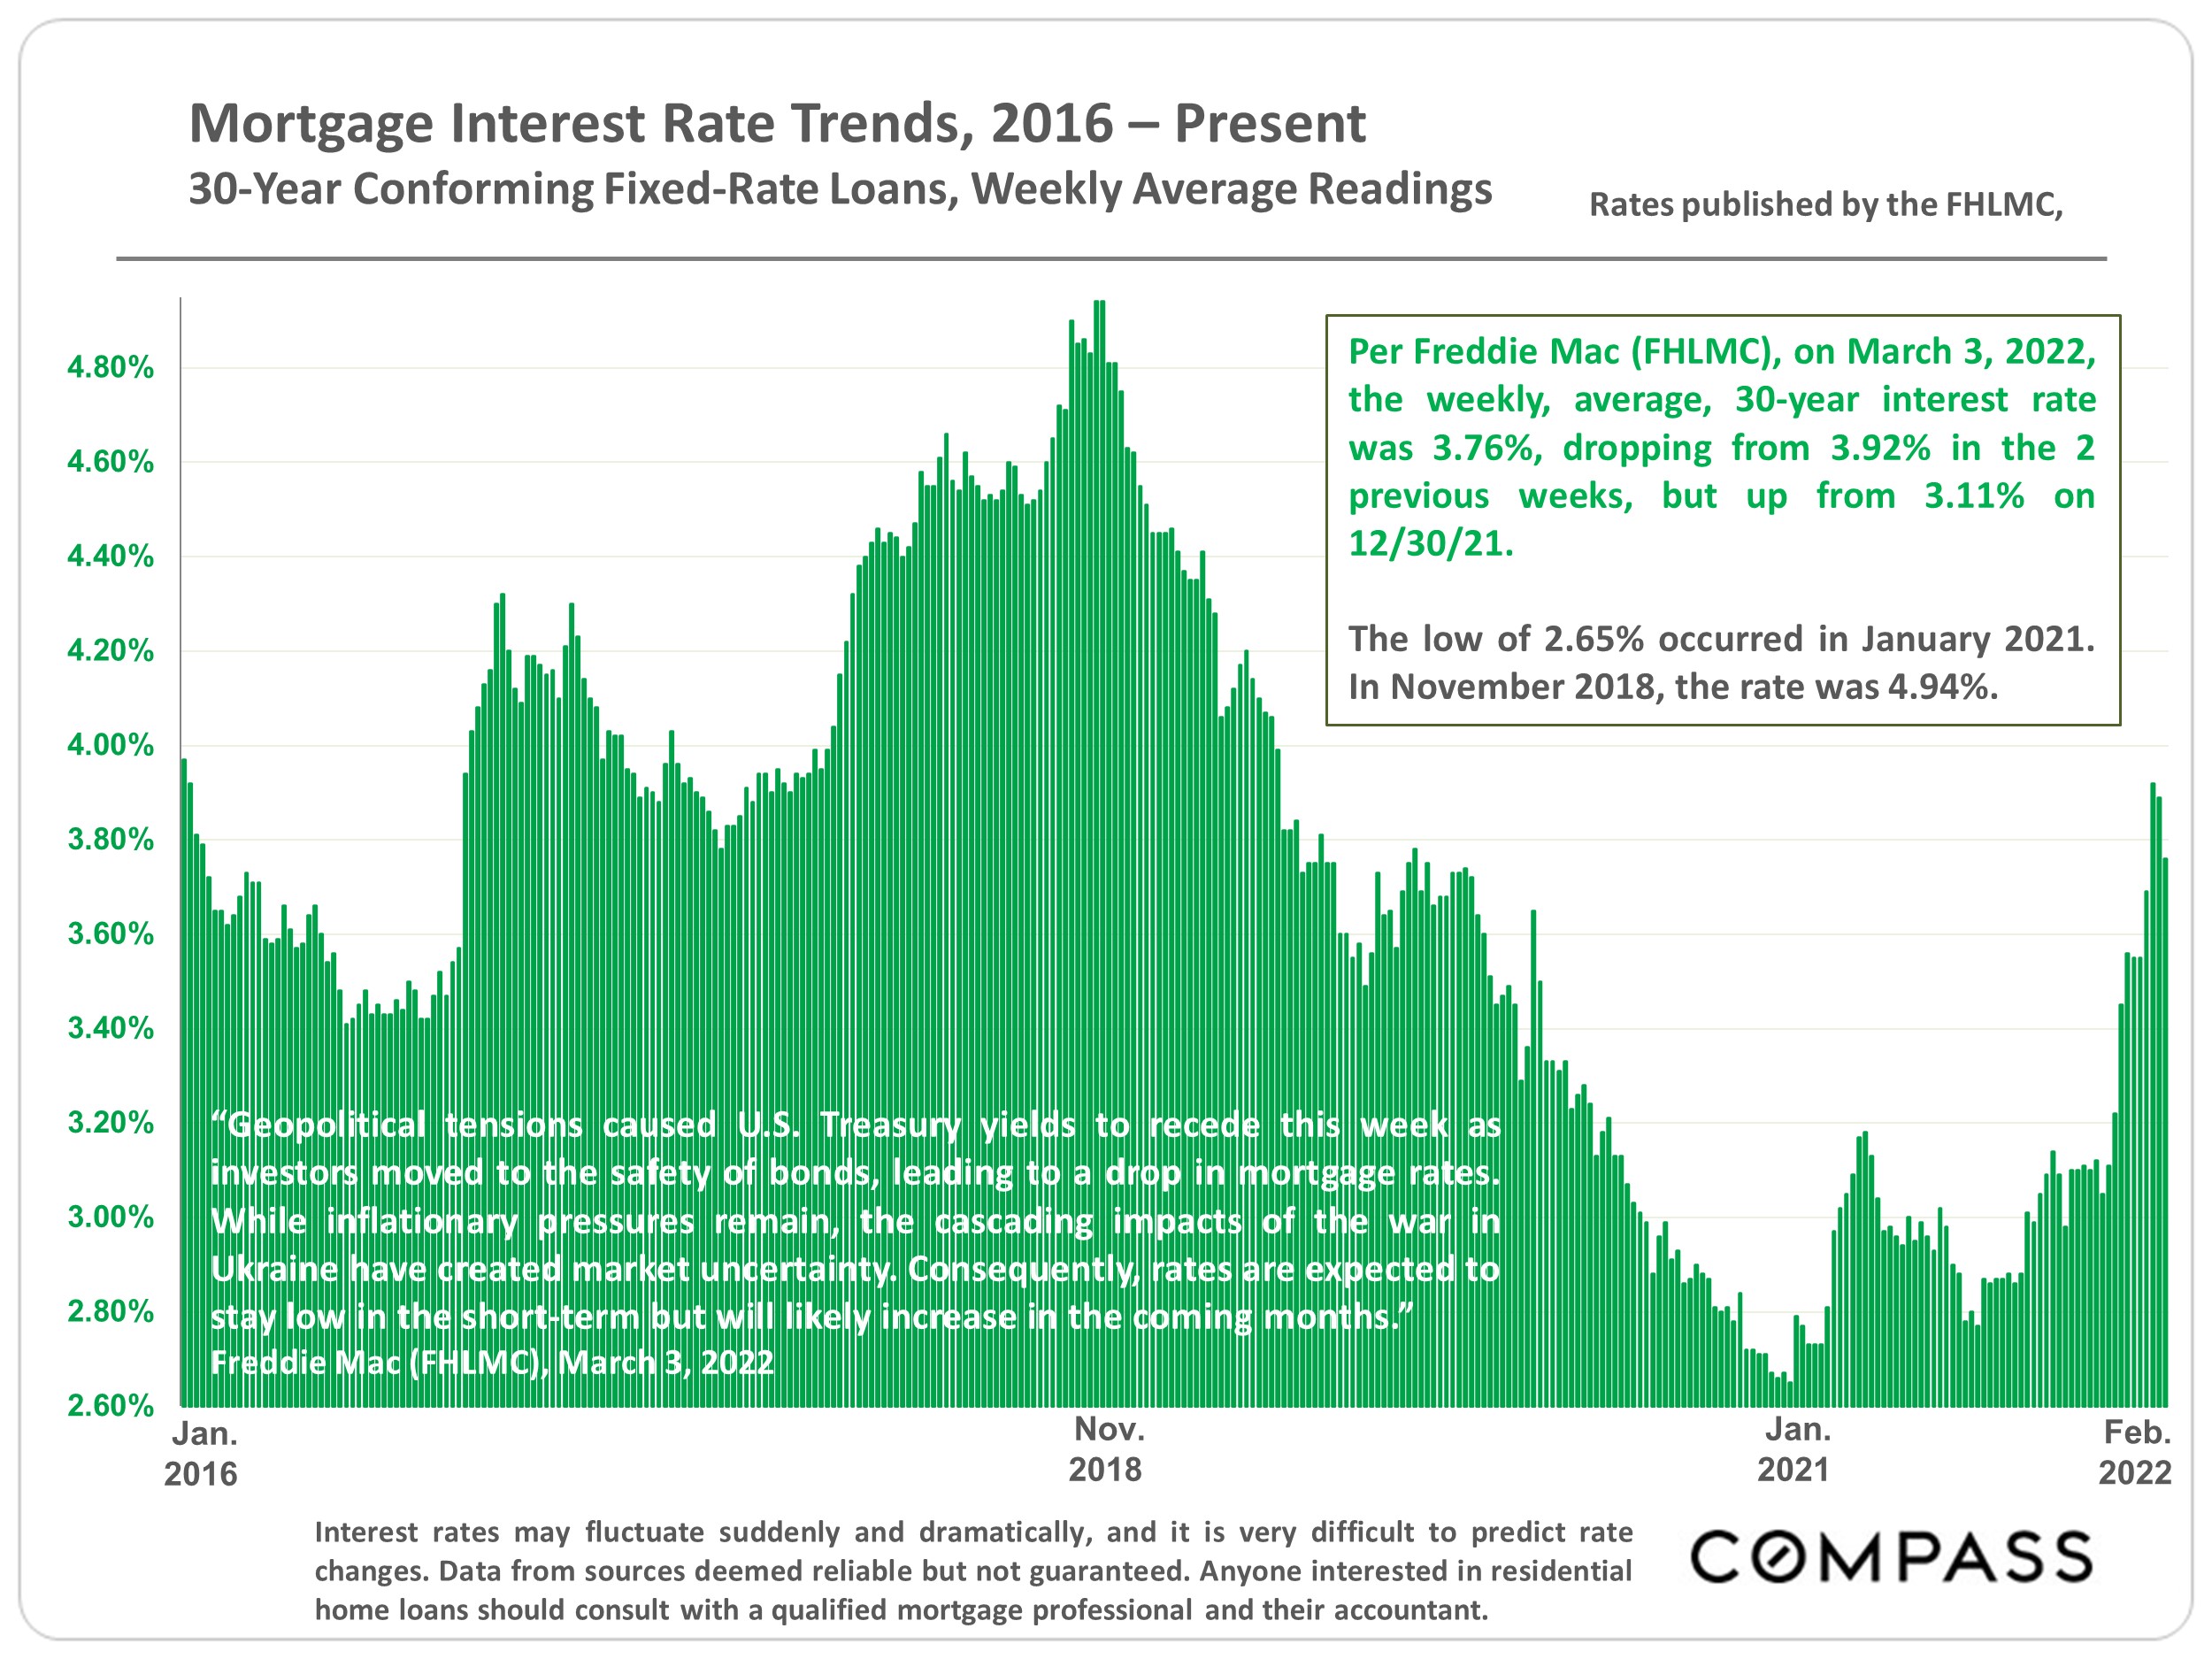
The market remained overheated in Q1, as our review of home-price appreciation, and supply and demand indicators will illustrate. However, as of March 31st, mortgage interest rates have skyrocketed 50% in 2022, with a particularly large jump in March. Because of the time involved in the homebuying process – the search, loan qualification, going into contract, escrow, closing sale – any significant effects of the recent spike won’t show up until Q2. Rates may stabilize, rise further, or drop back down – they can change very quickly – and the exact, follow-on effects are unknown. Interest rates are only 1 factor: Local economic conditions, financial markets, wealth creation, housing affordability, consumer confidence, inflation, migration, the pandemic, war, debt and government policies can all have big market impacts, and they are flashing both positive and negative signals.

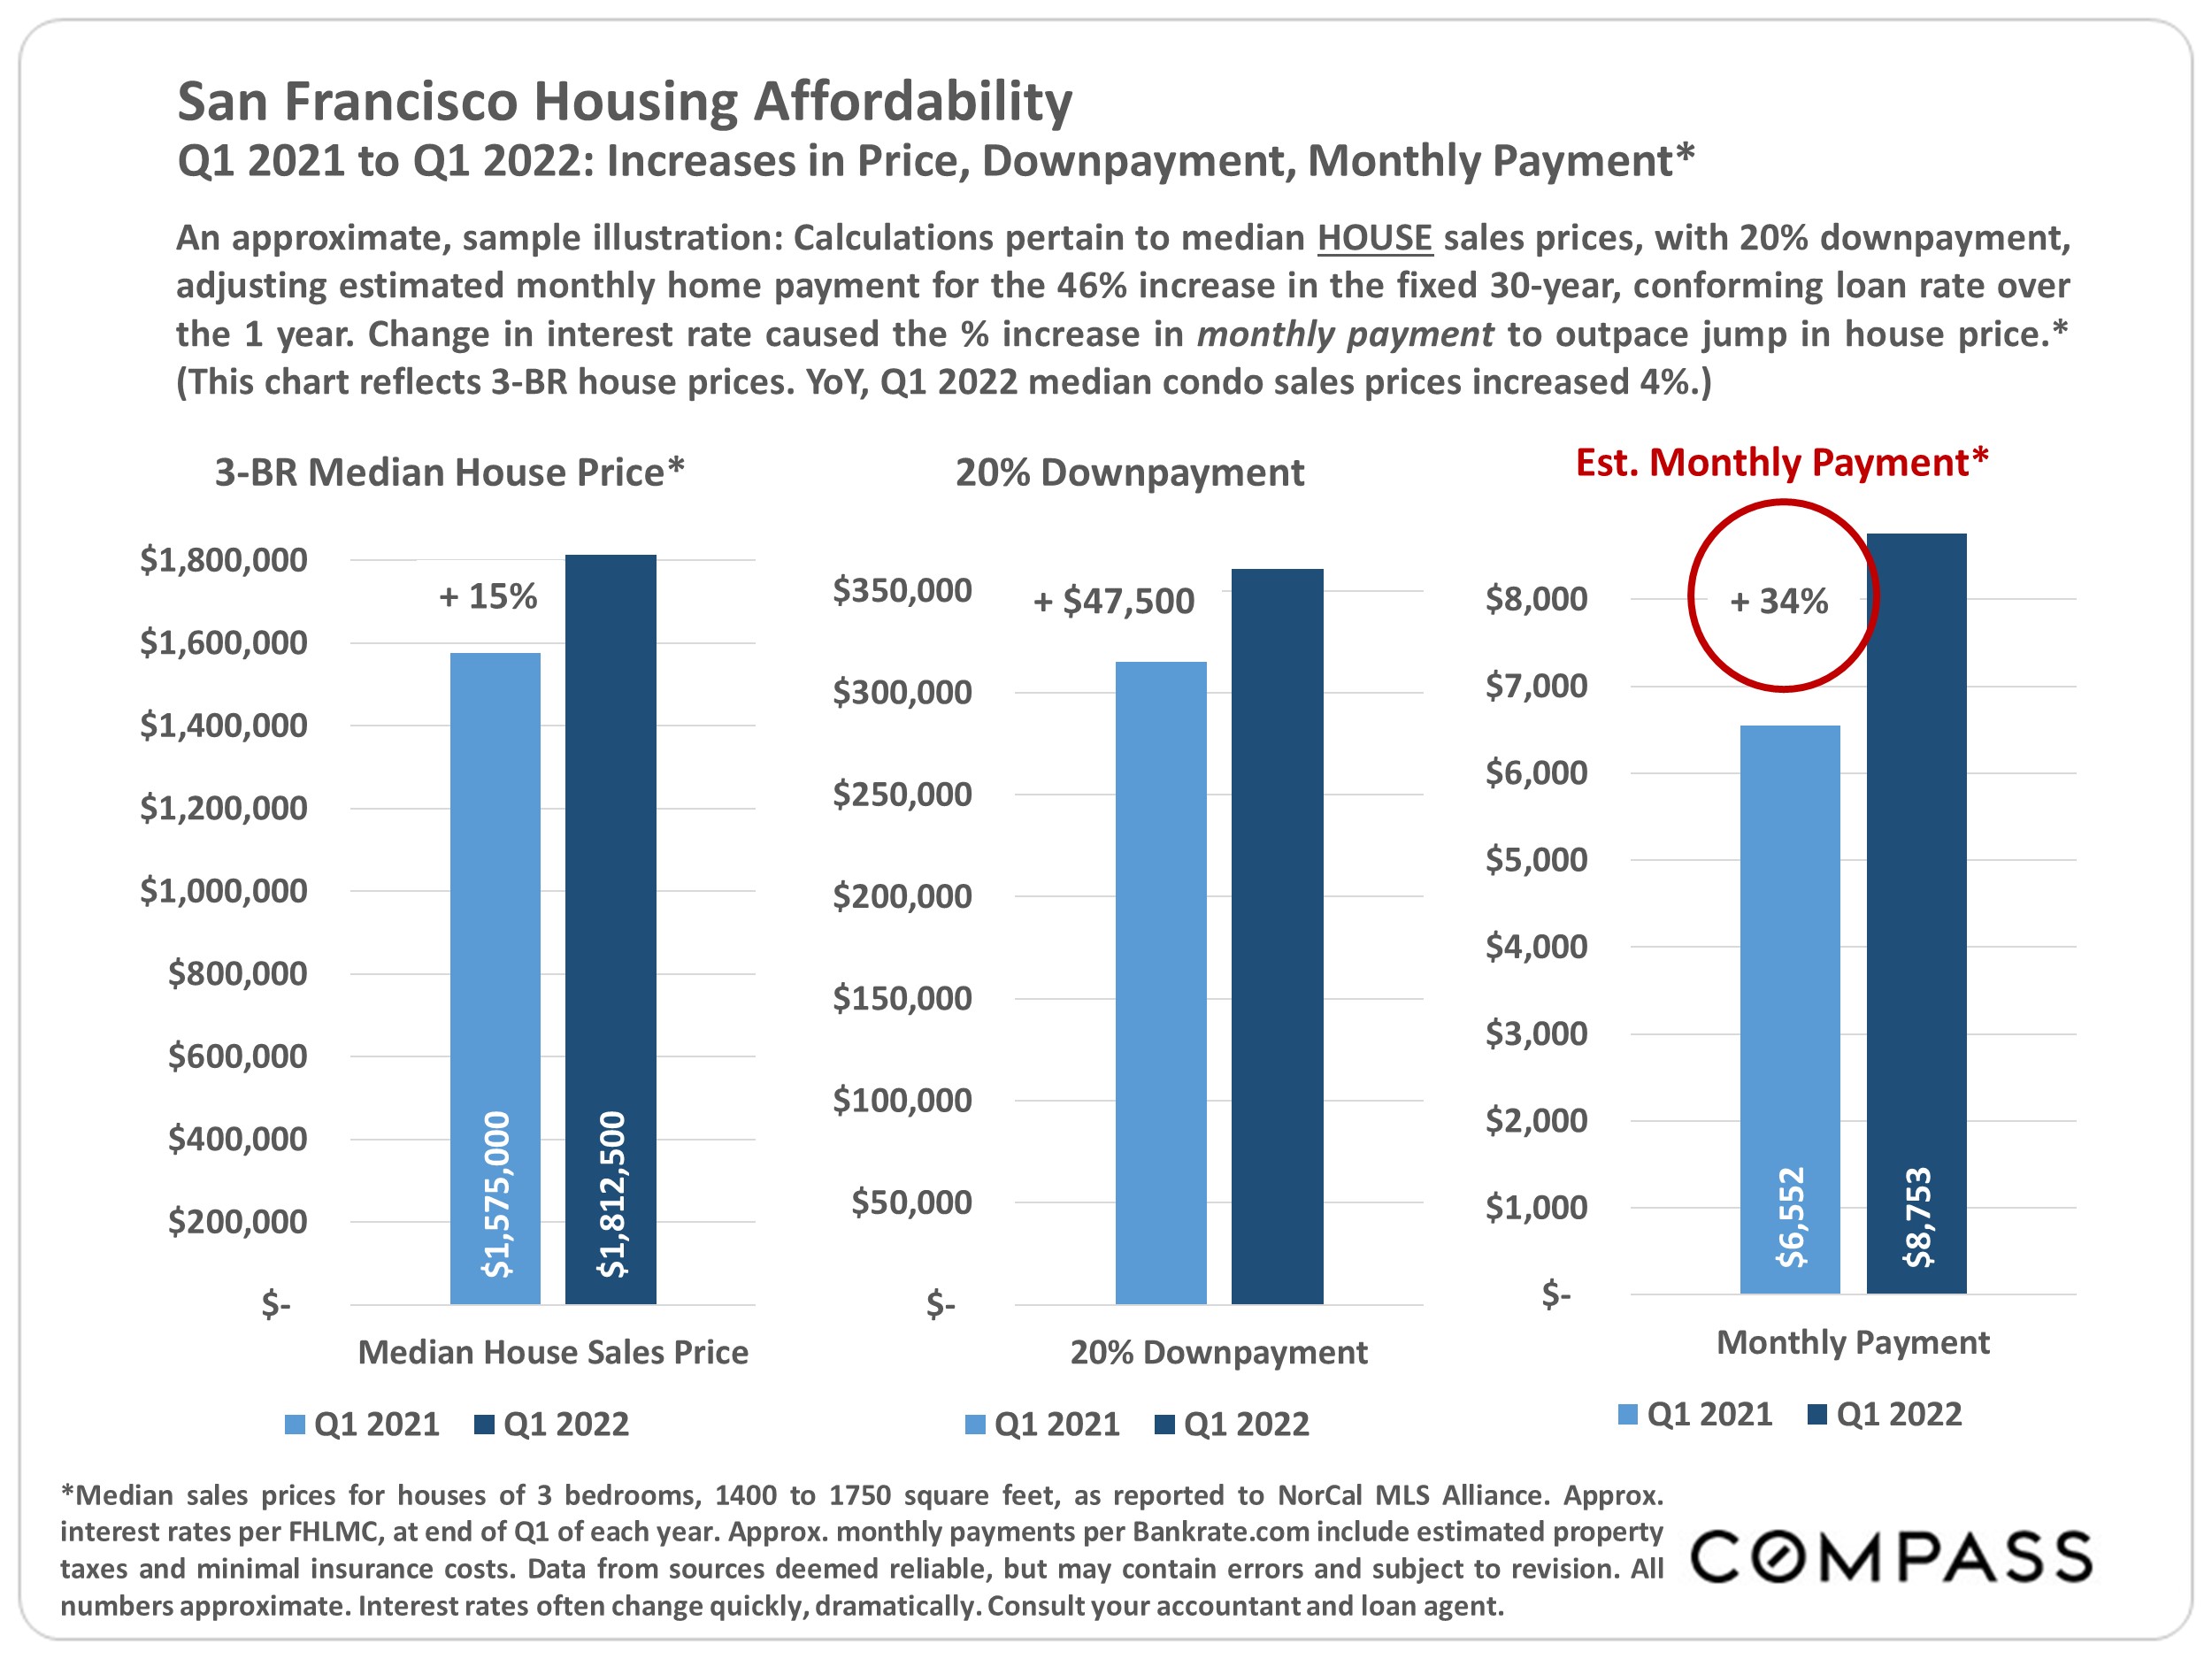
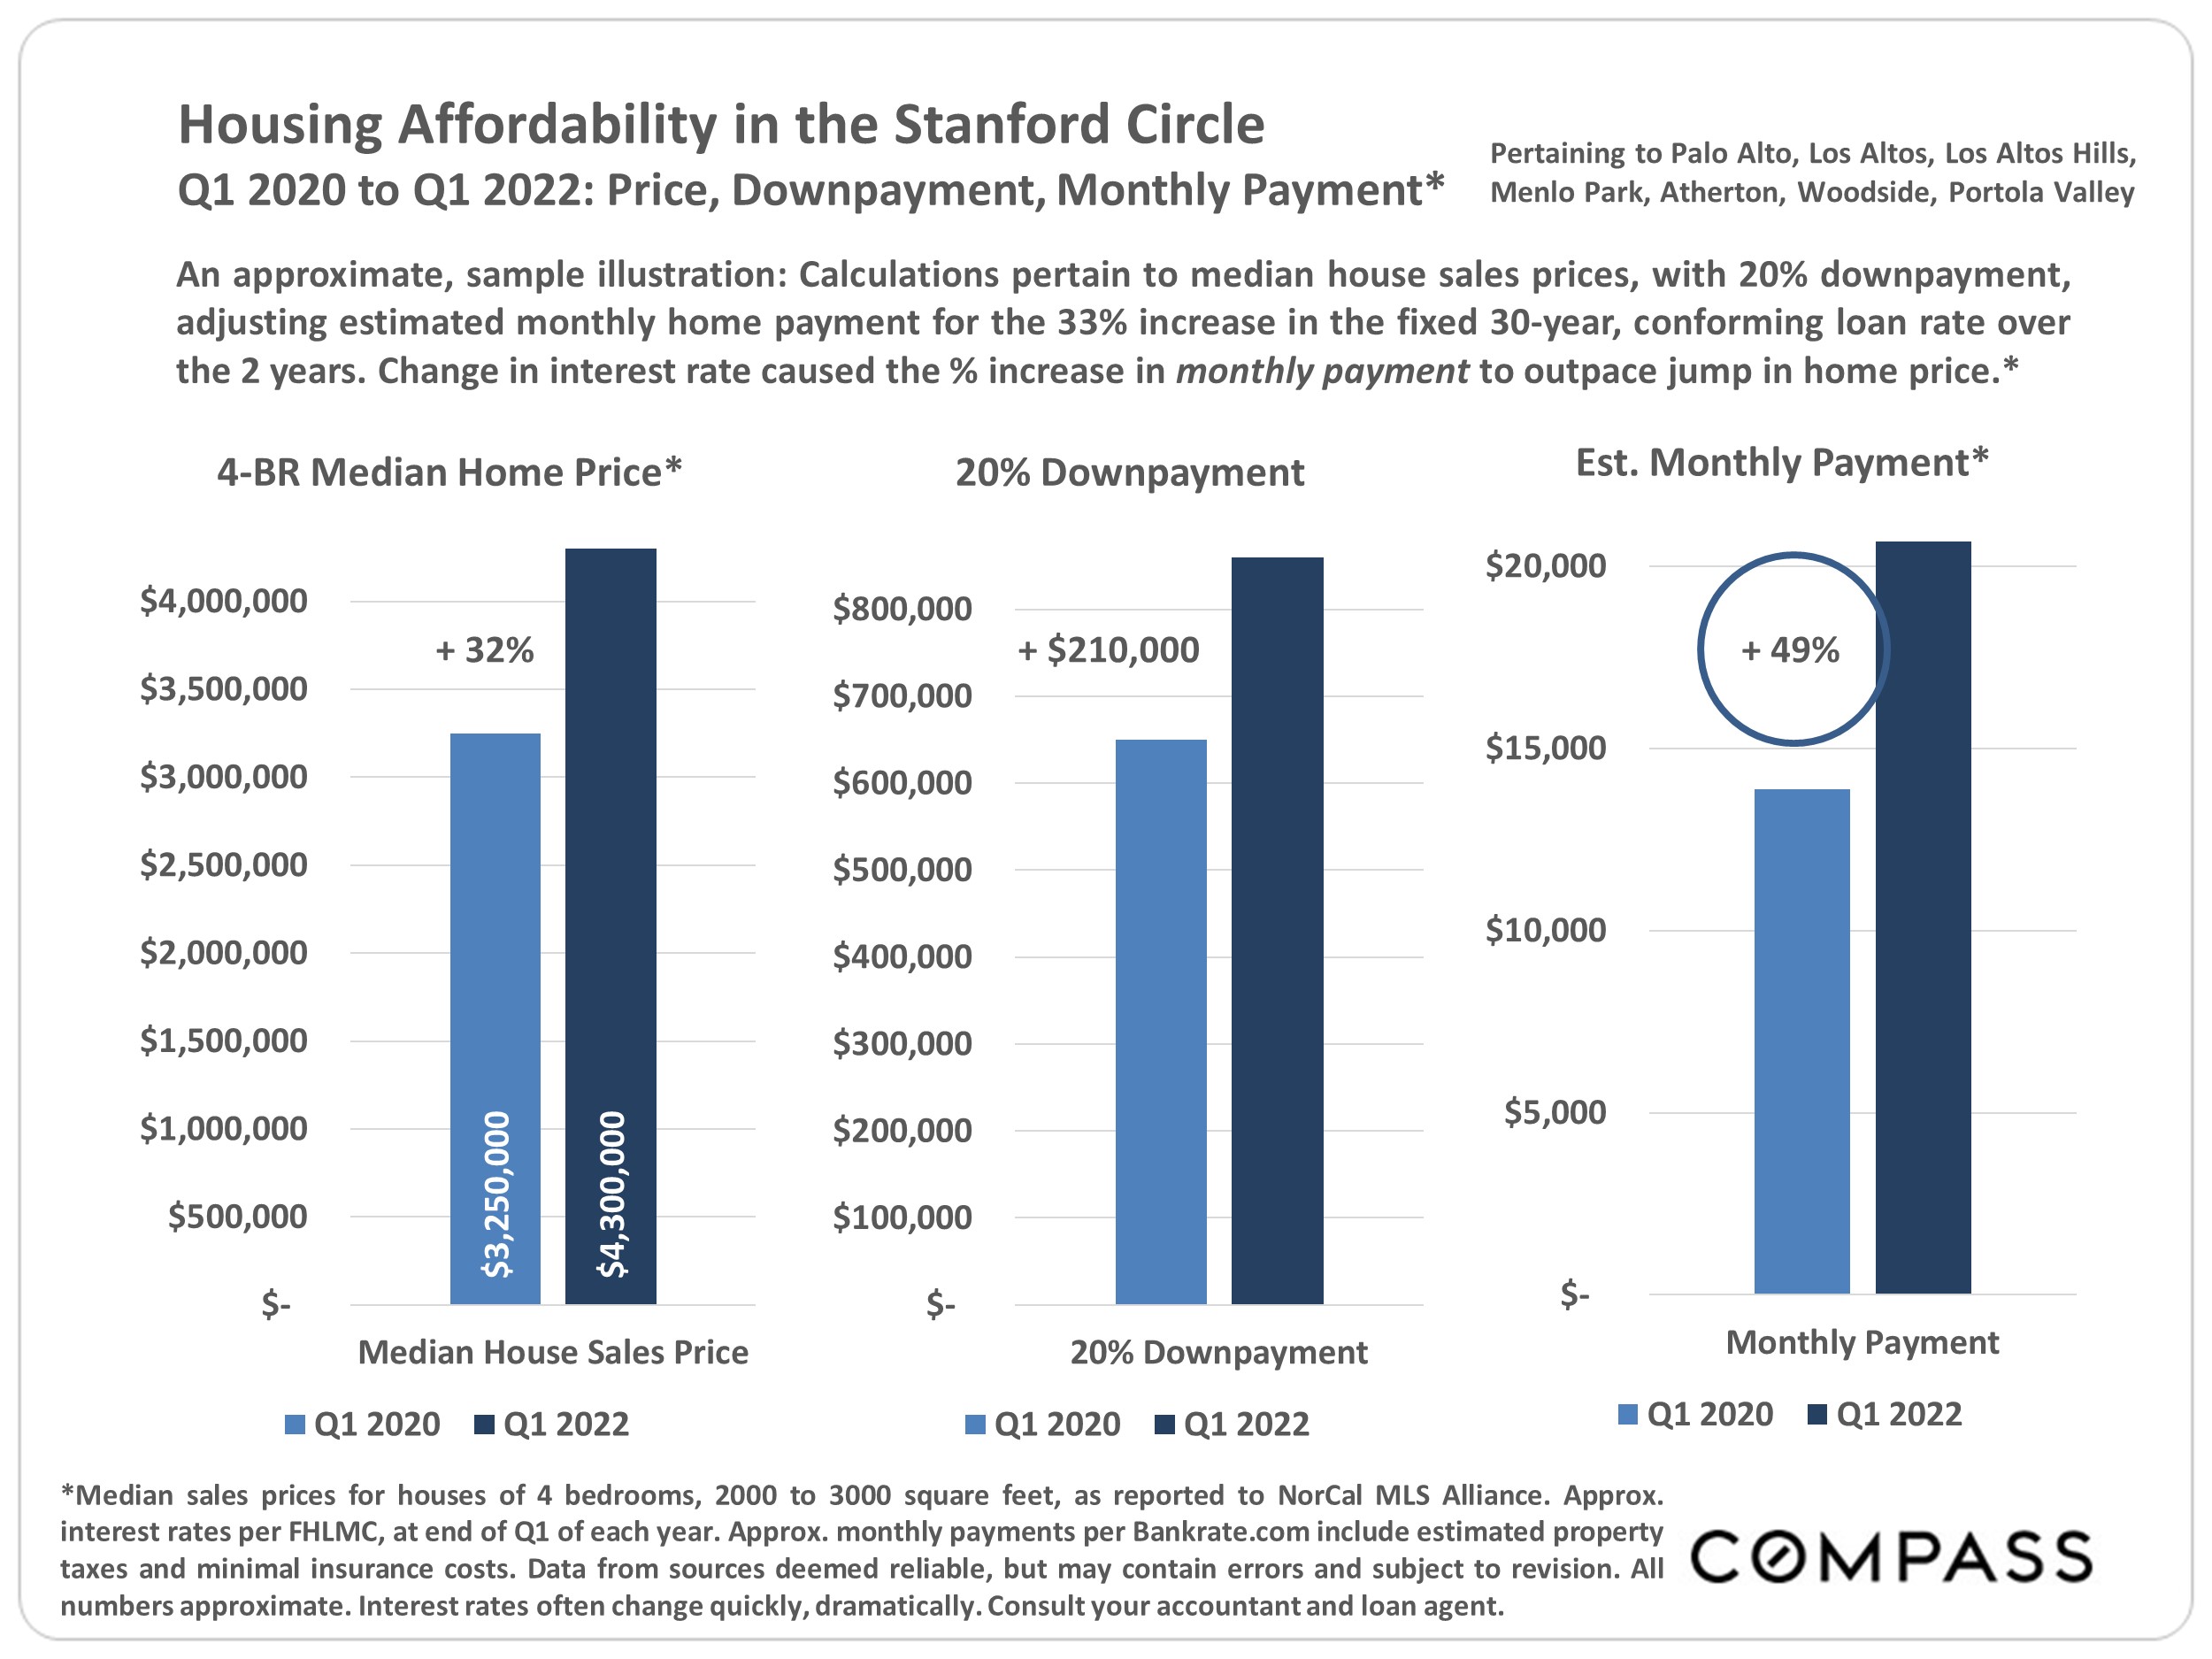
For buyers financing their purchase, interest rates play an enormous role in monthly housing costs. Depending on the speed and scale of changes, declining interest rates can help supercharge demand, as they did in 2021, while rapidly increasing rates typically cool the market, as occurred in the 2nd half of 2018. If both interest rates and home prices soar, there is a double whammy on housing affordability. It is very difficult to accurately predict interest rate changes: 3 months ago, Freddie Mac predicted an average, 30-year, fixed rate of 3.6% for 2022; at the end of March, it hit 4.67%.

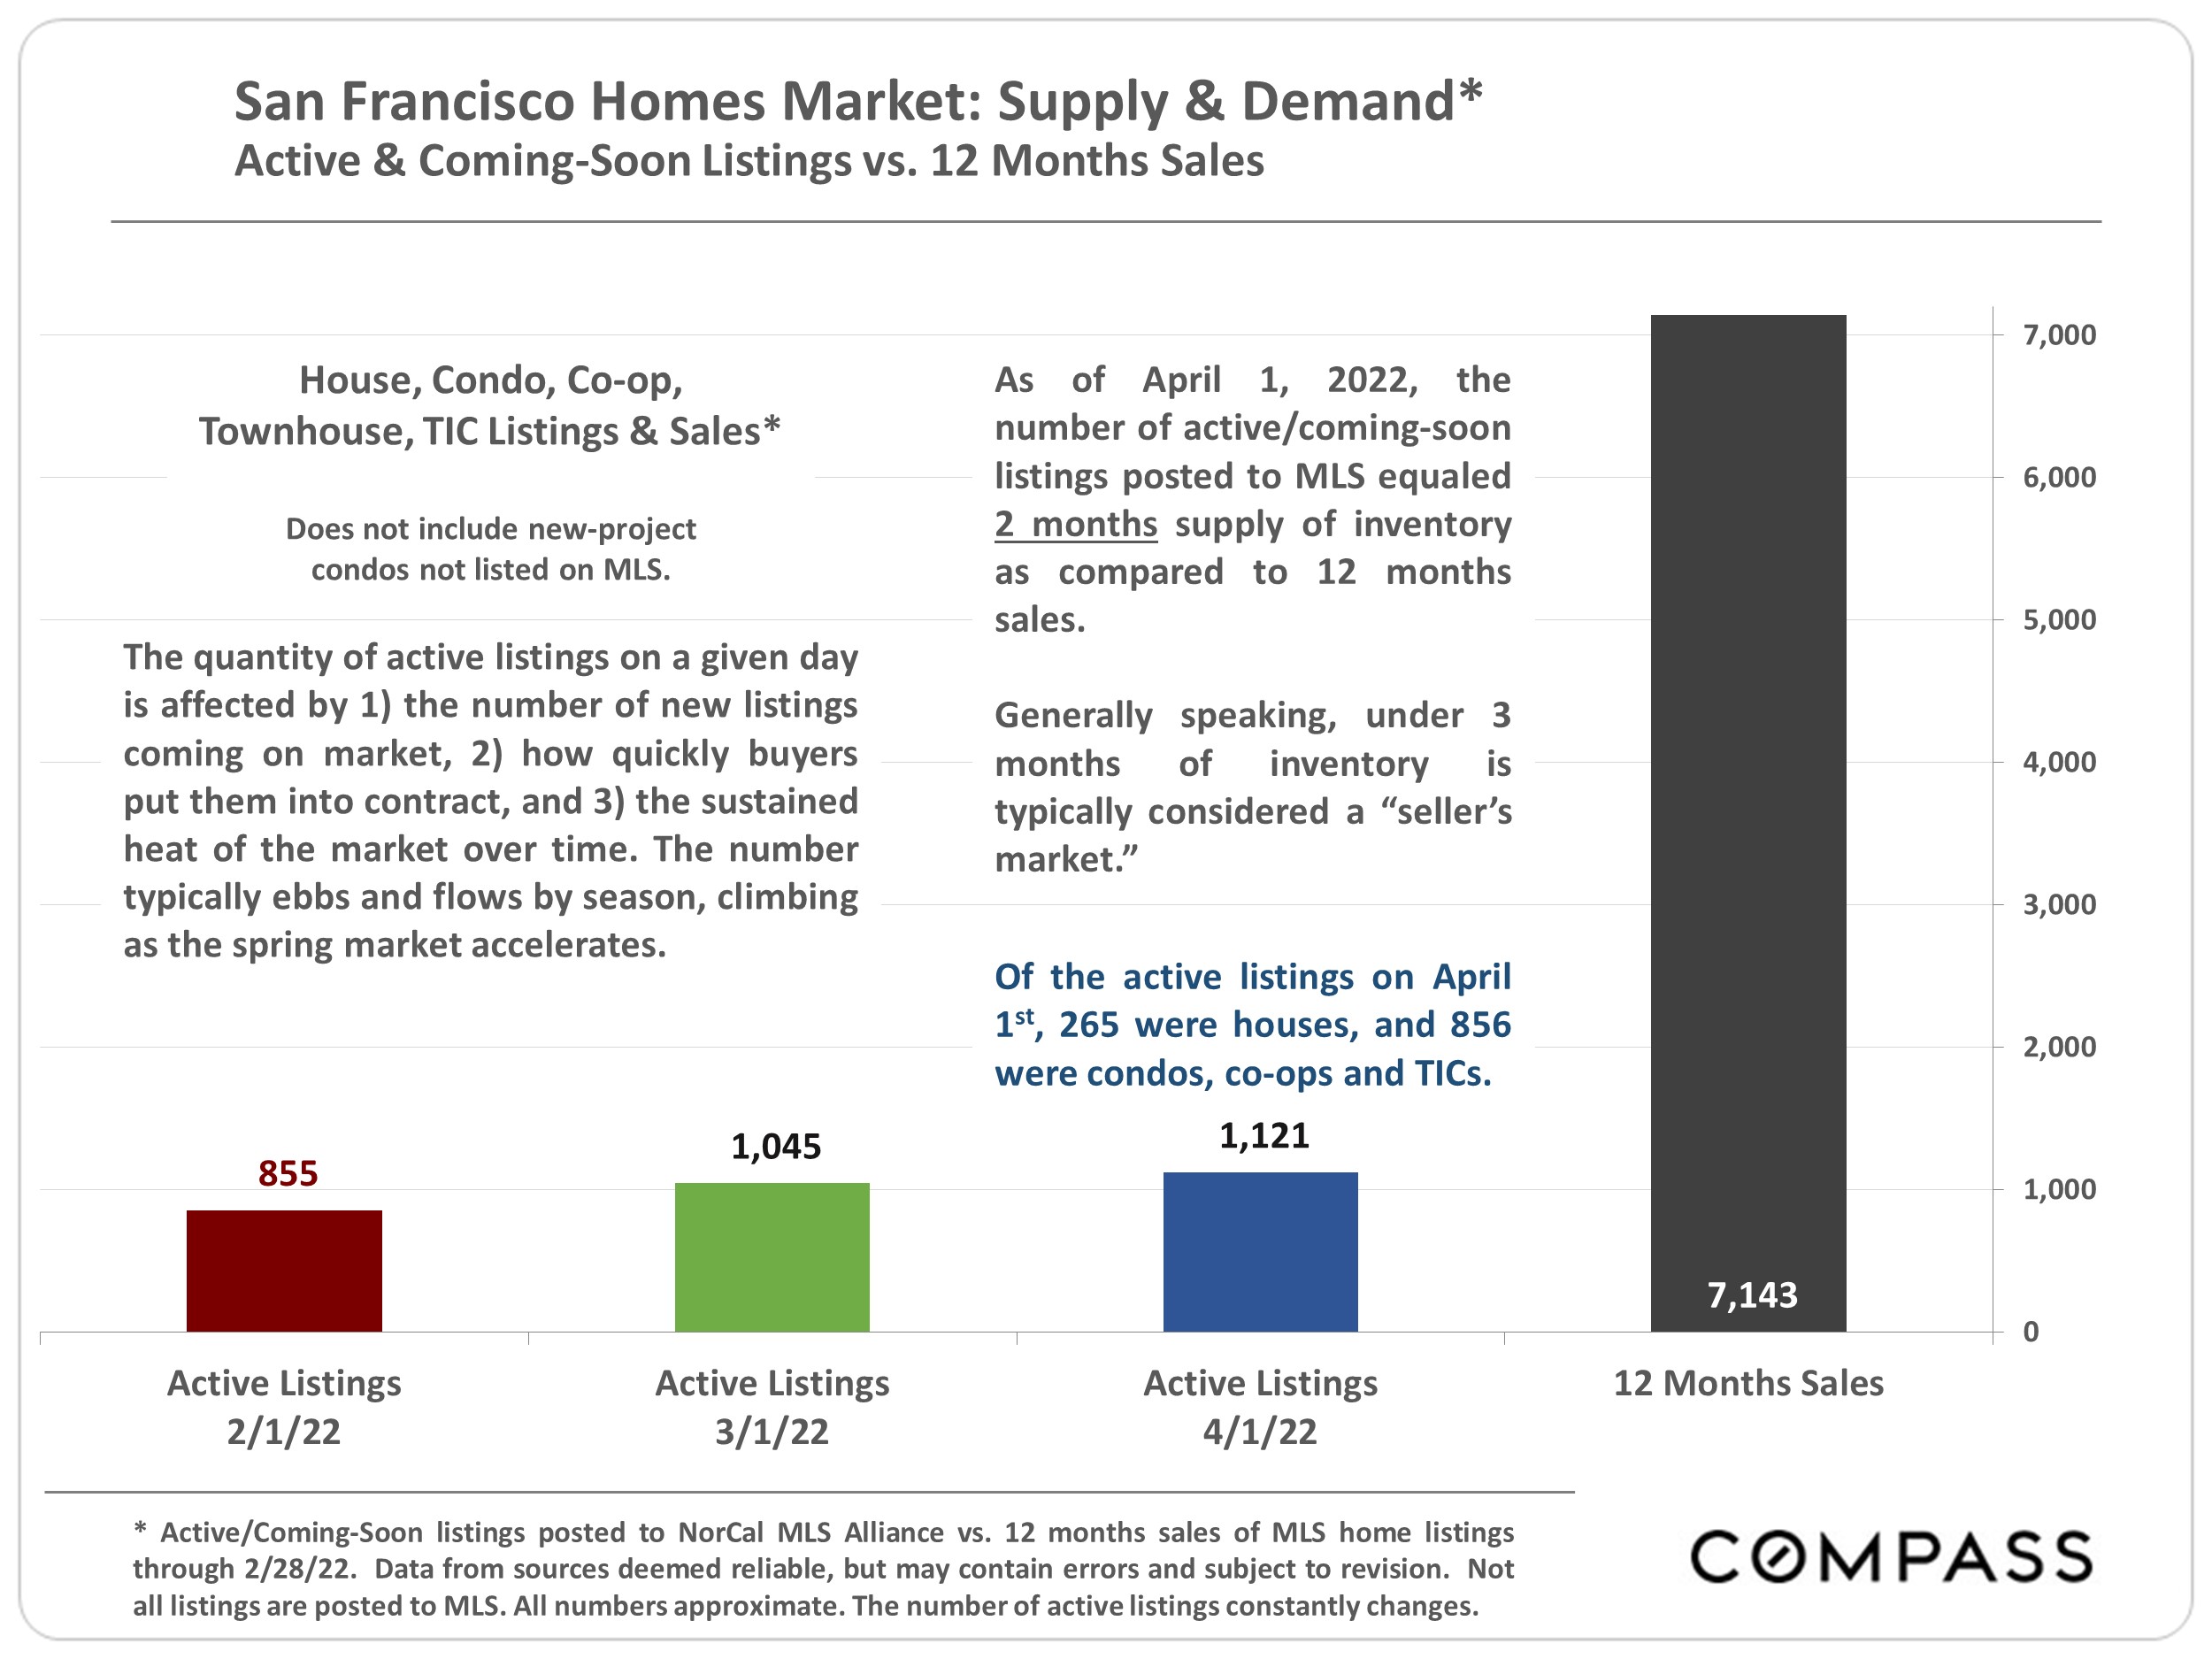
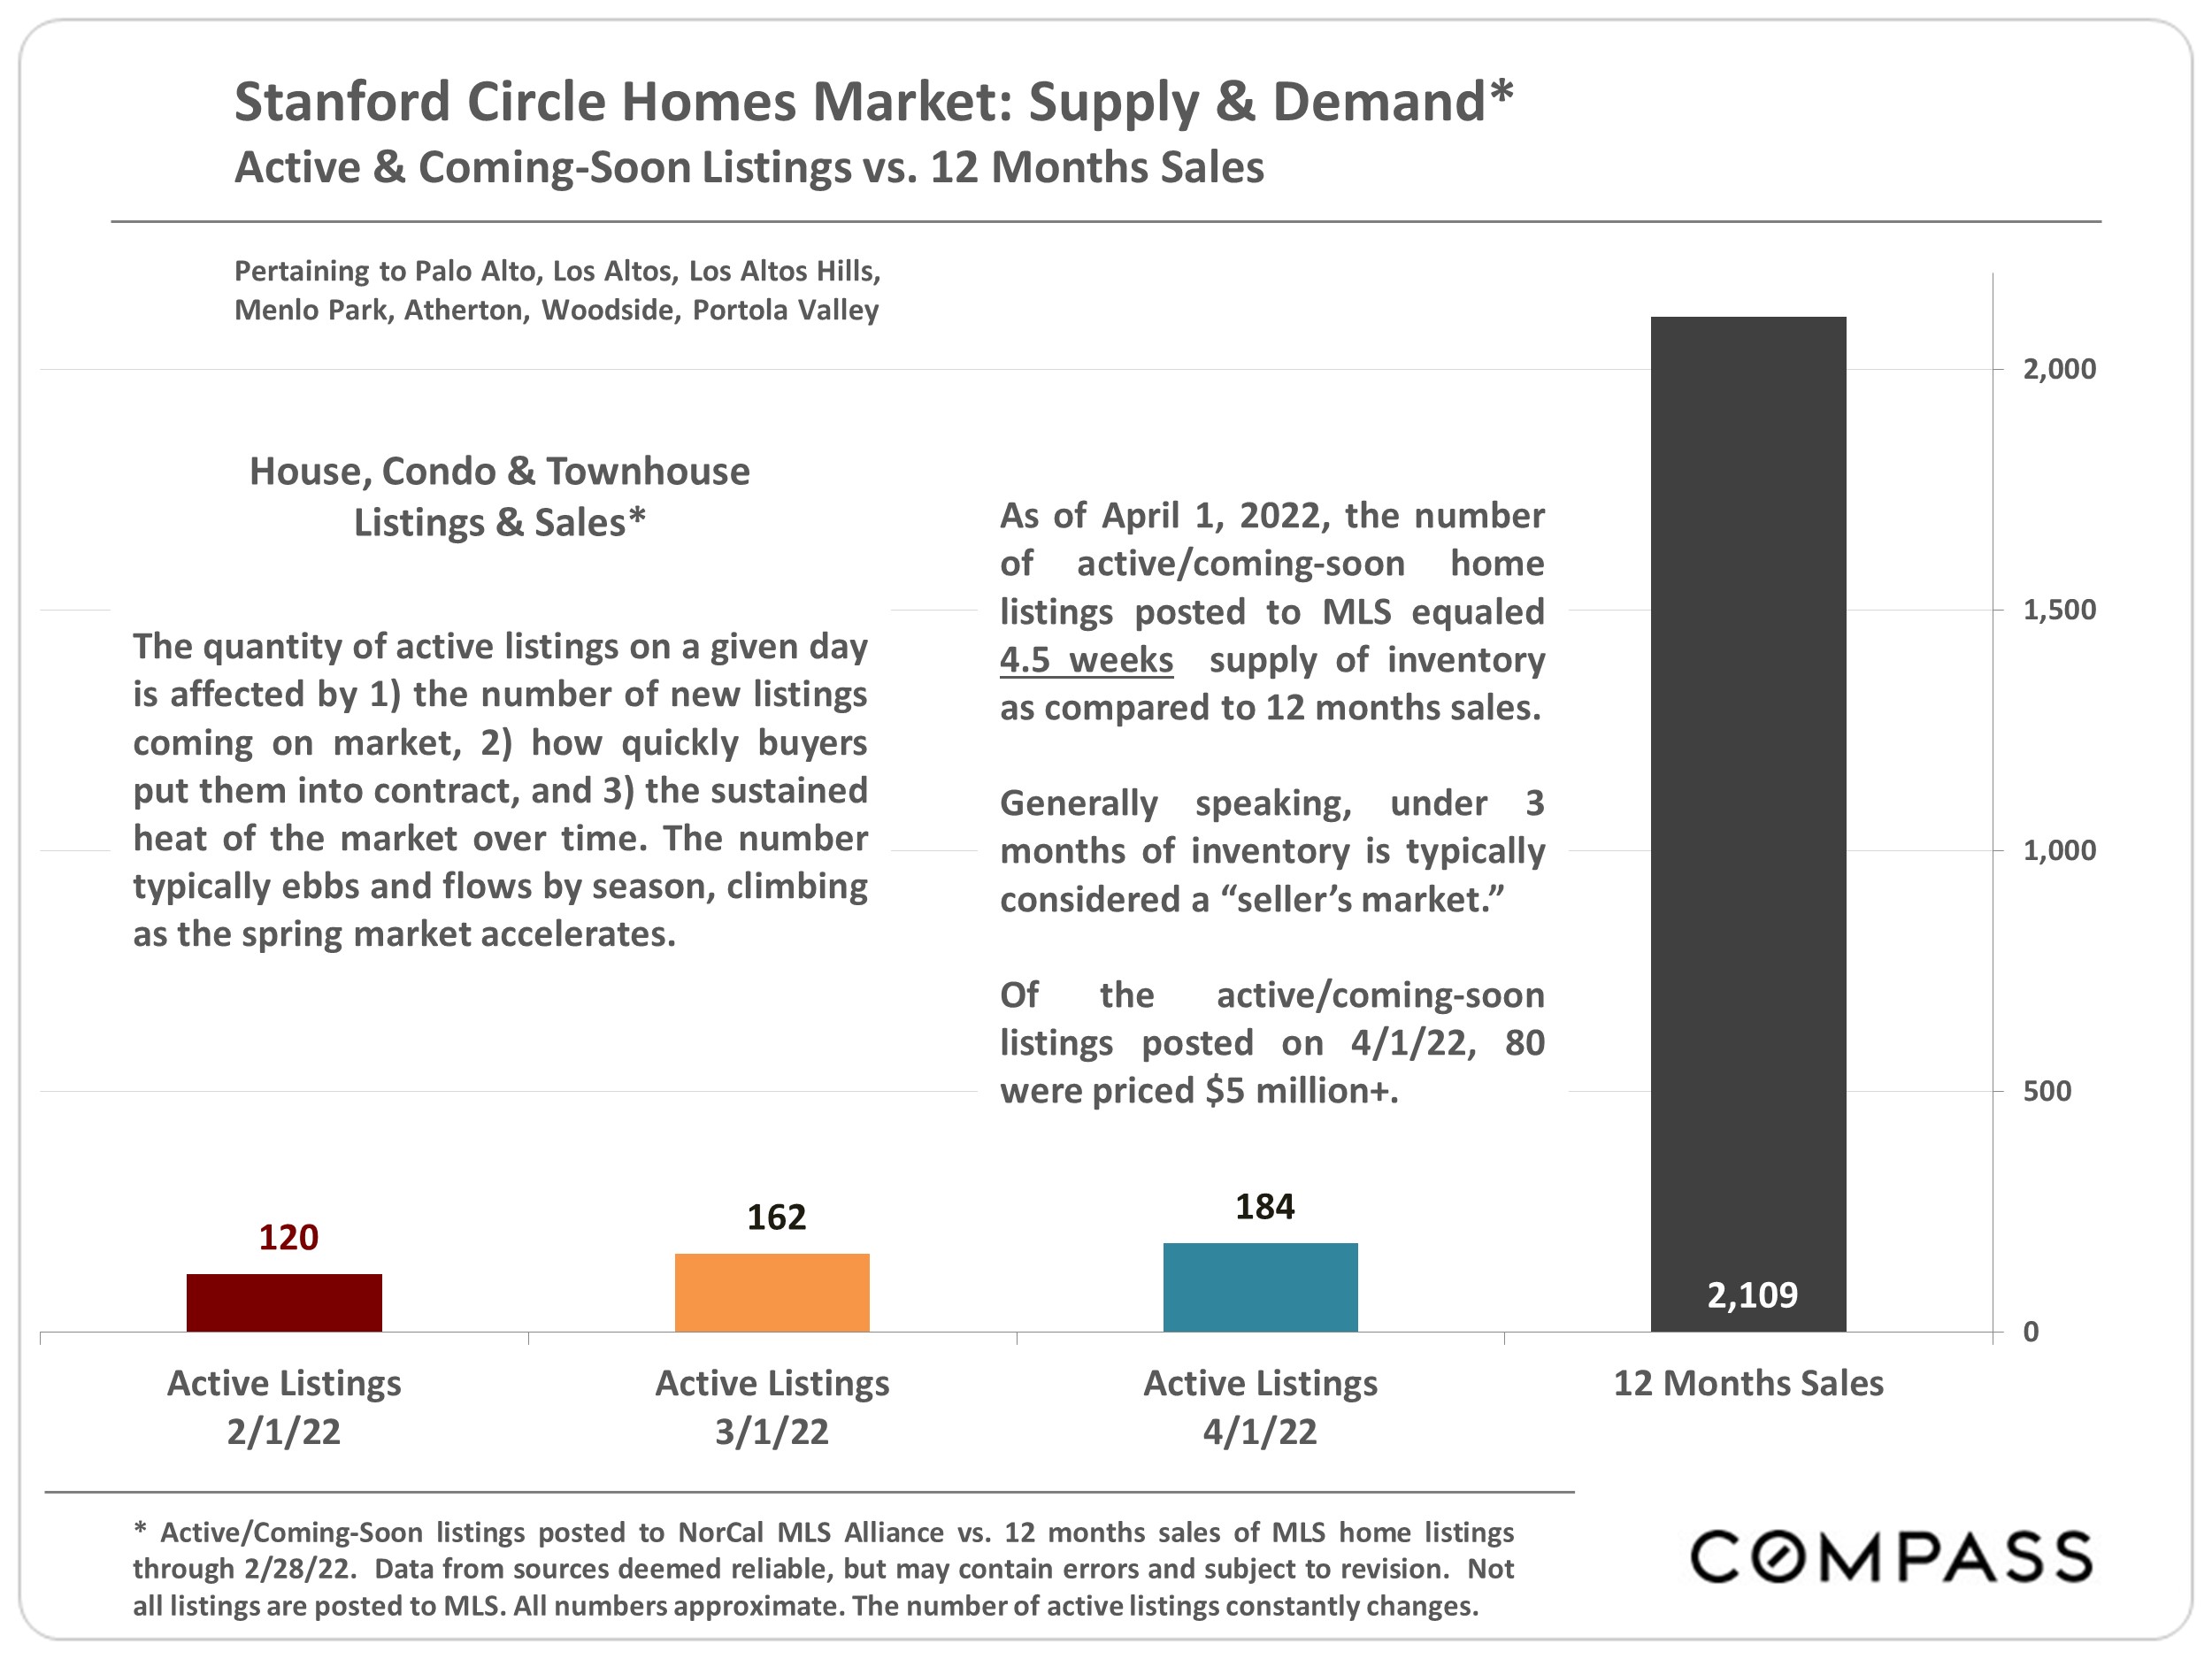
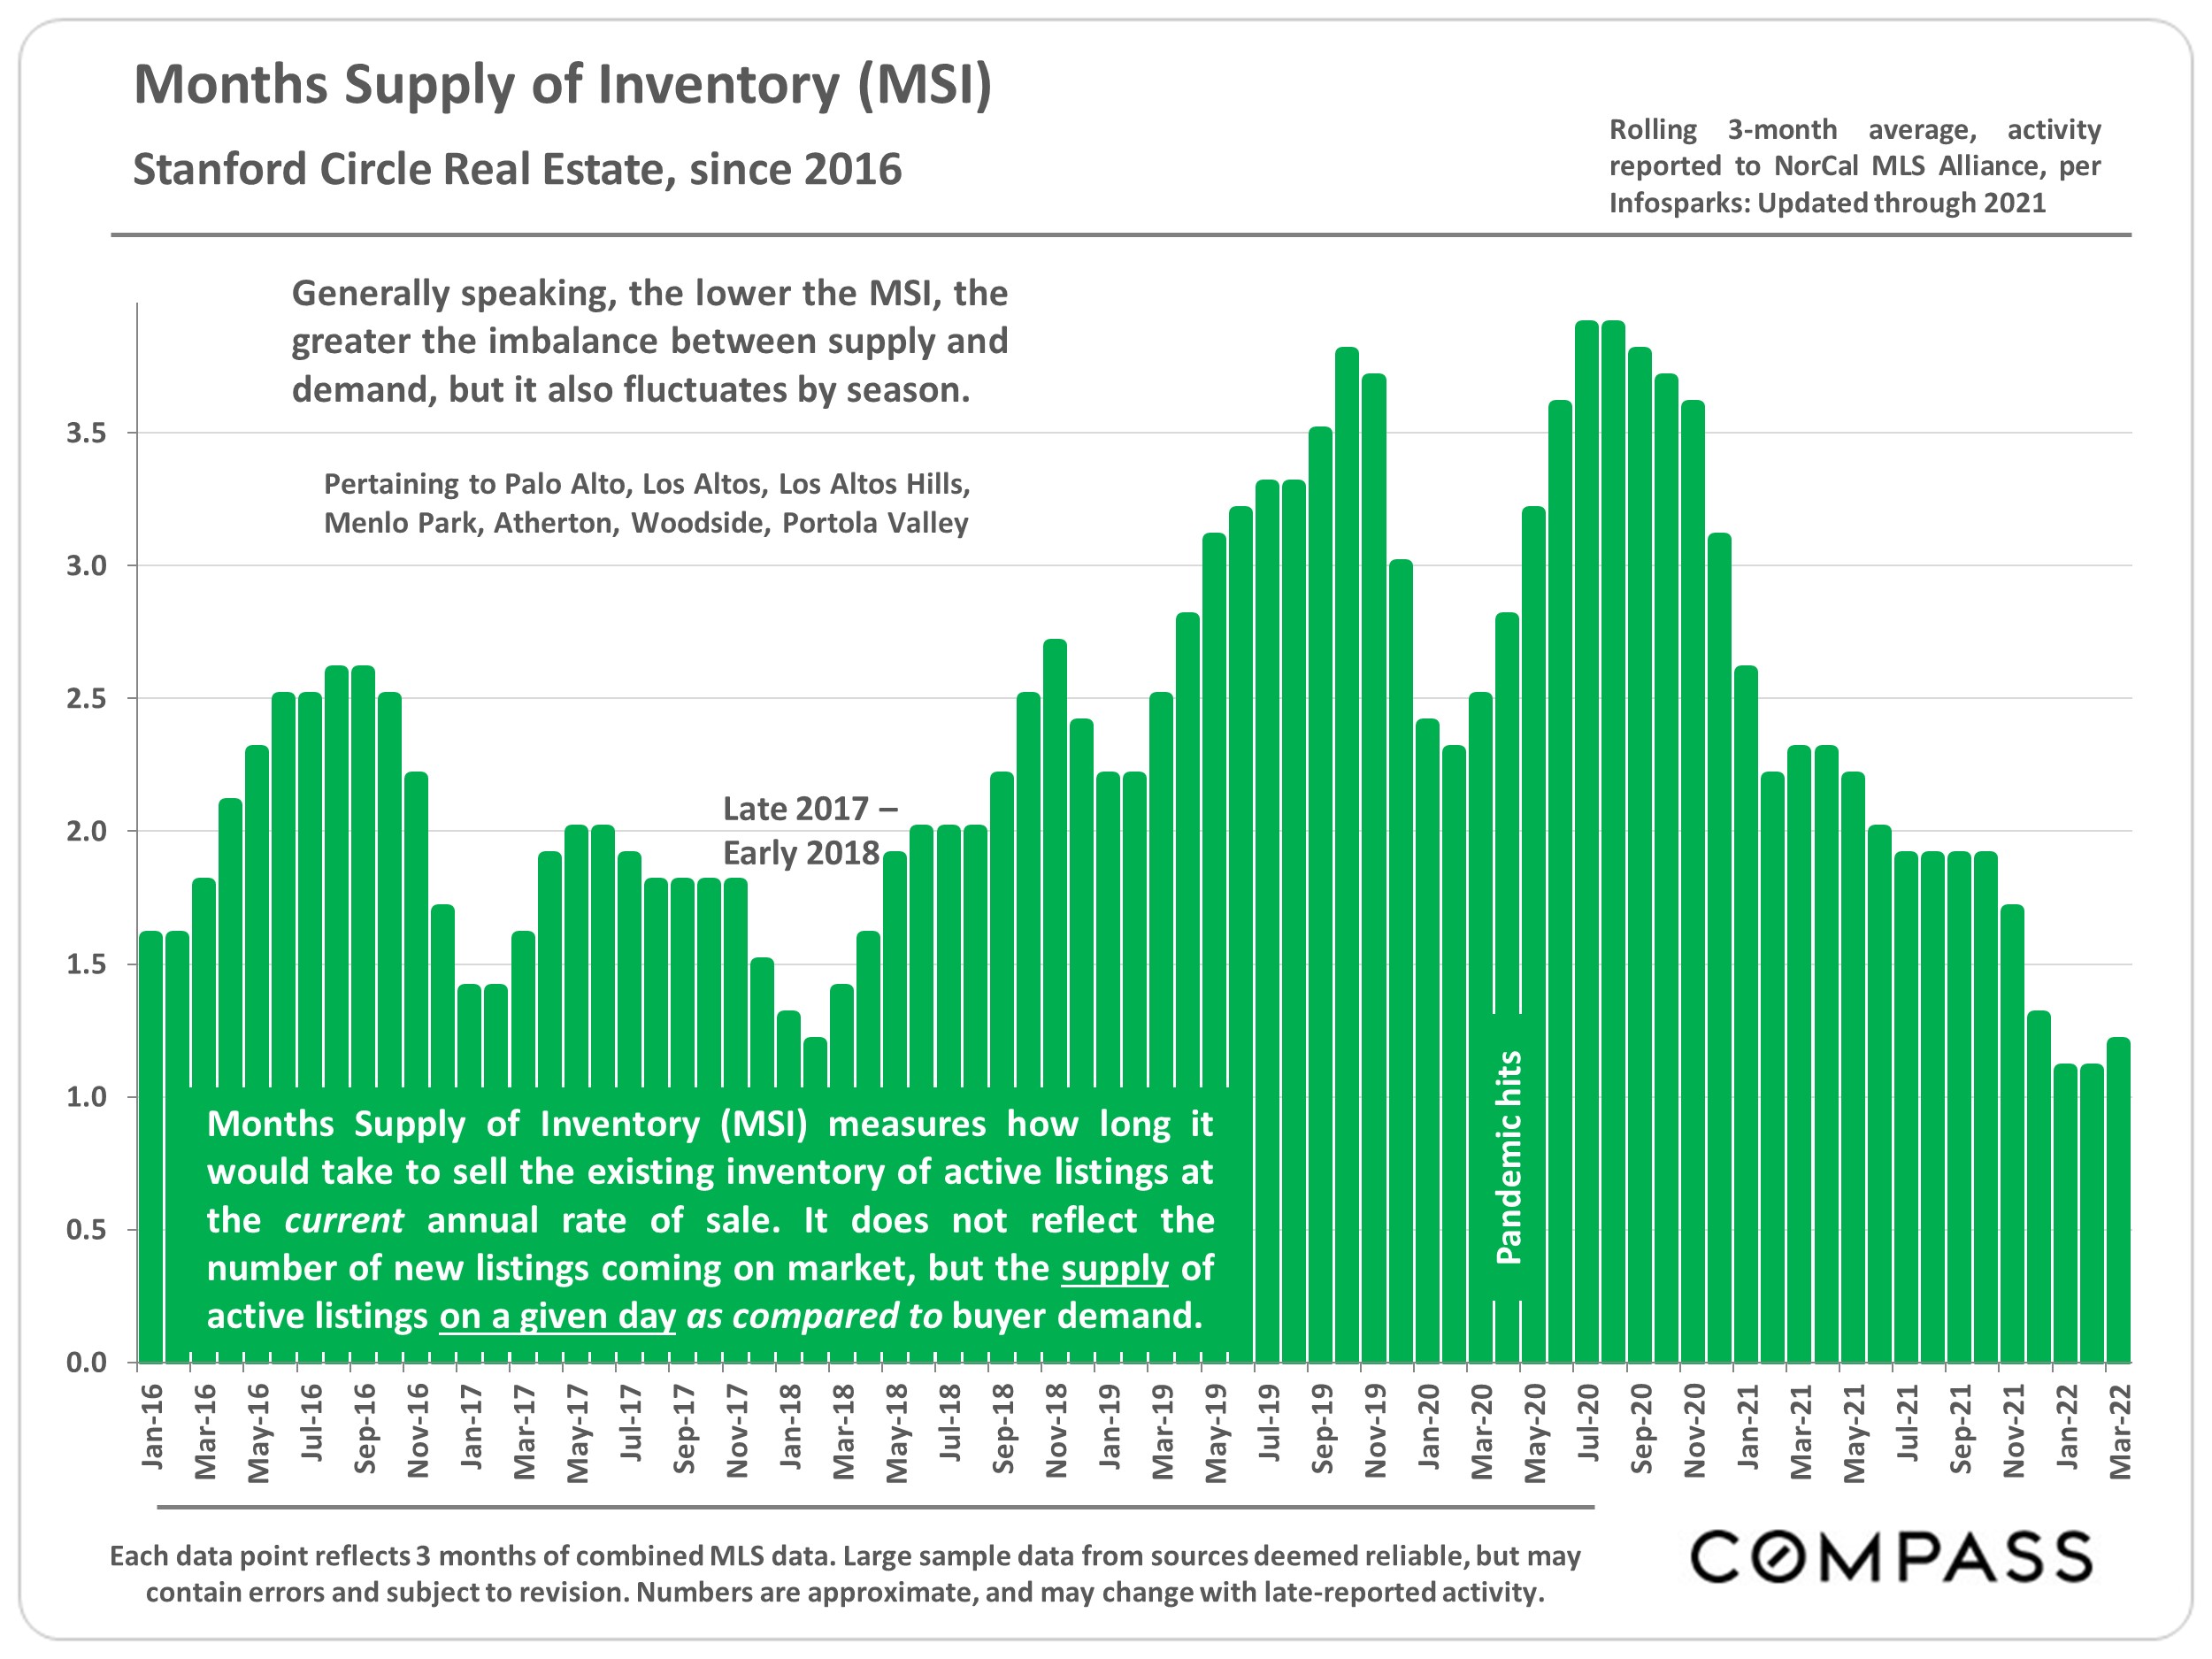
“Low inventory” does not necessarily mean fewer homes are being put up for sale. Indeed, sales volumes hit multi-year highs in 2021, fed by an increase in new listings. But “inventory” is measured by what is for sale on a given day, and even if the quantity of new listings is steady or climbing, the number of active listings can drop if they are selling more quickly. Historically high market velocity has been pushing the supply of active listings (on any given day) down to historic lows.

This report contains analyses reviewing many of these issues through Q1 2022. Q2 is typically the highest-demand, most active selling season of the year.

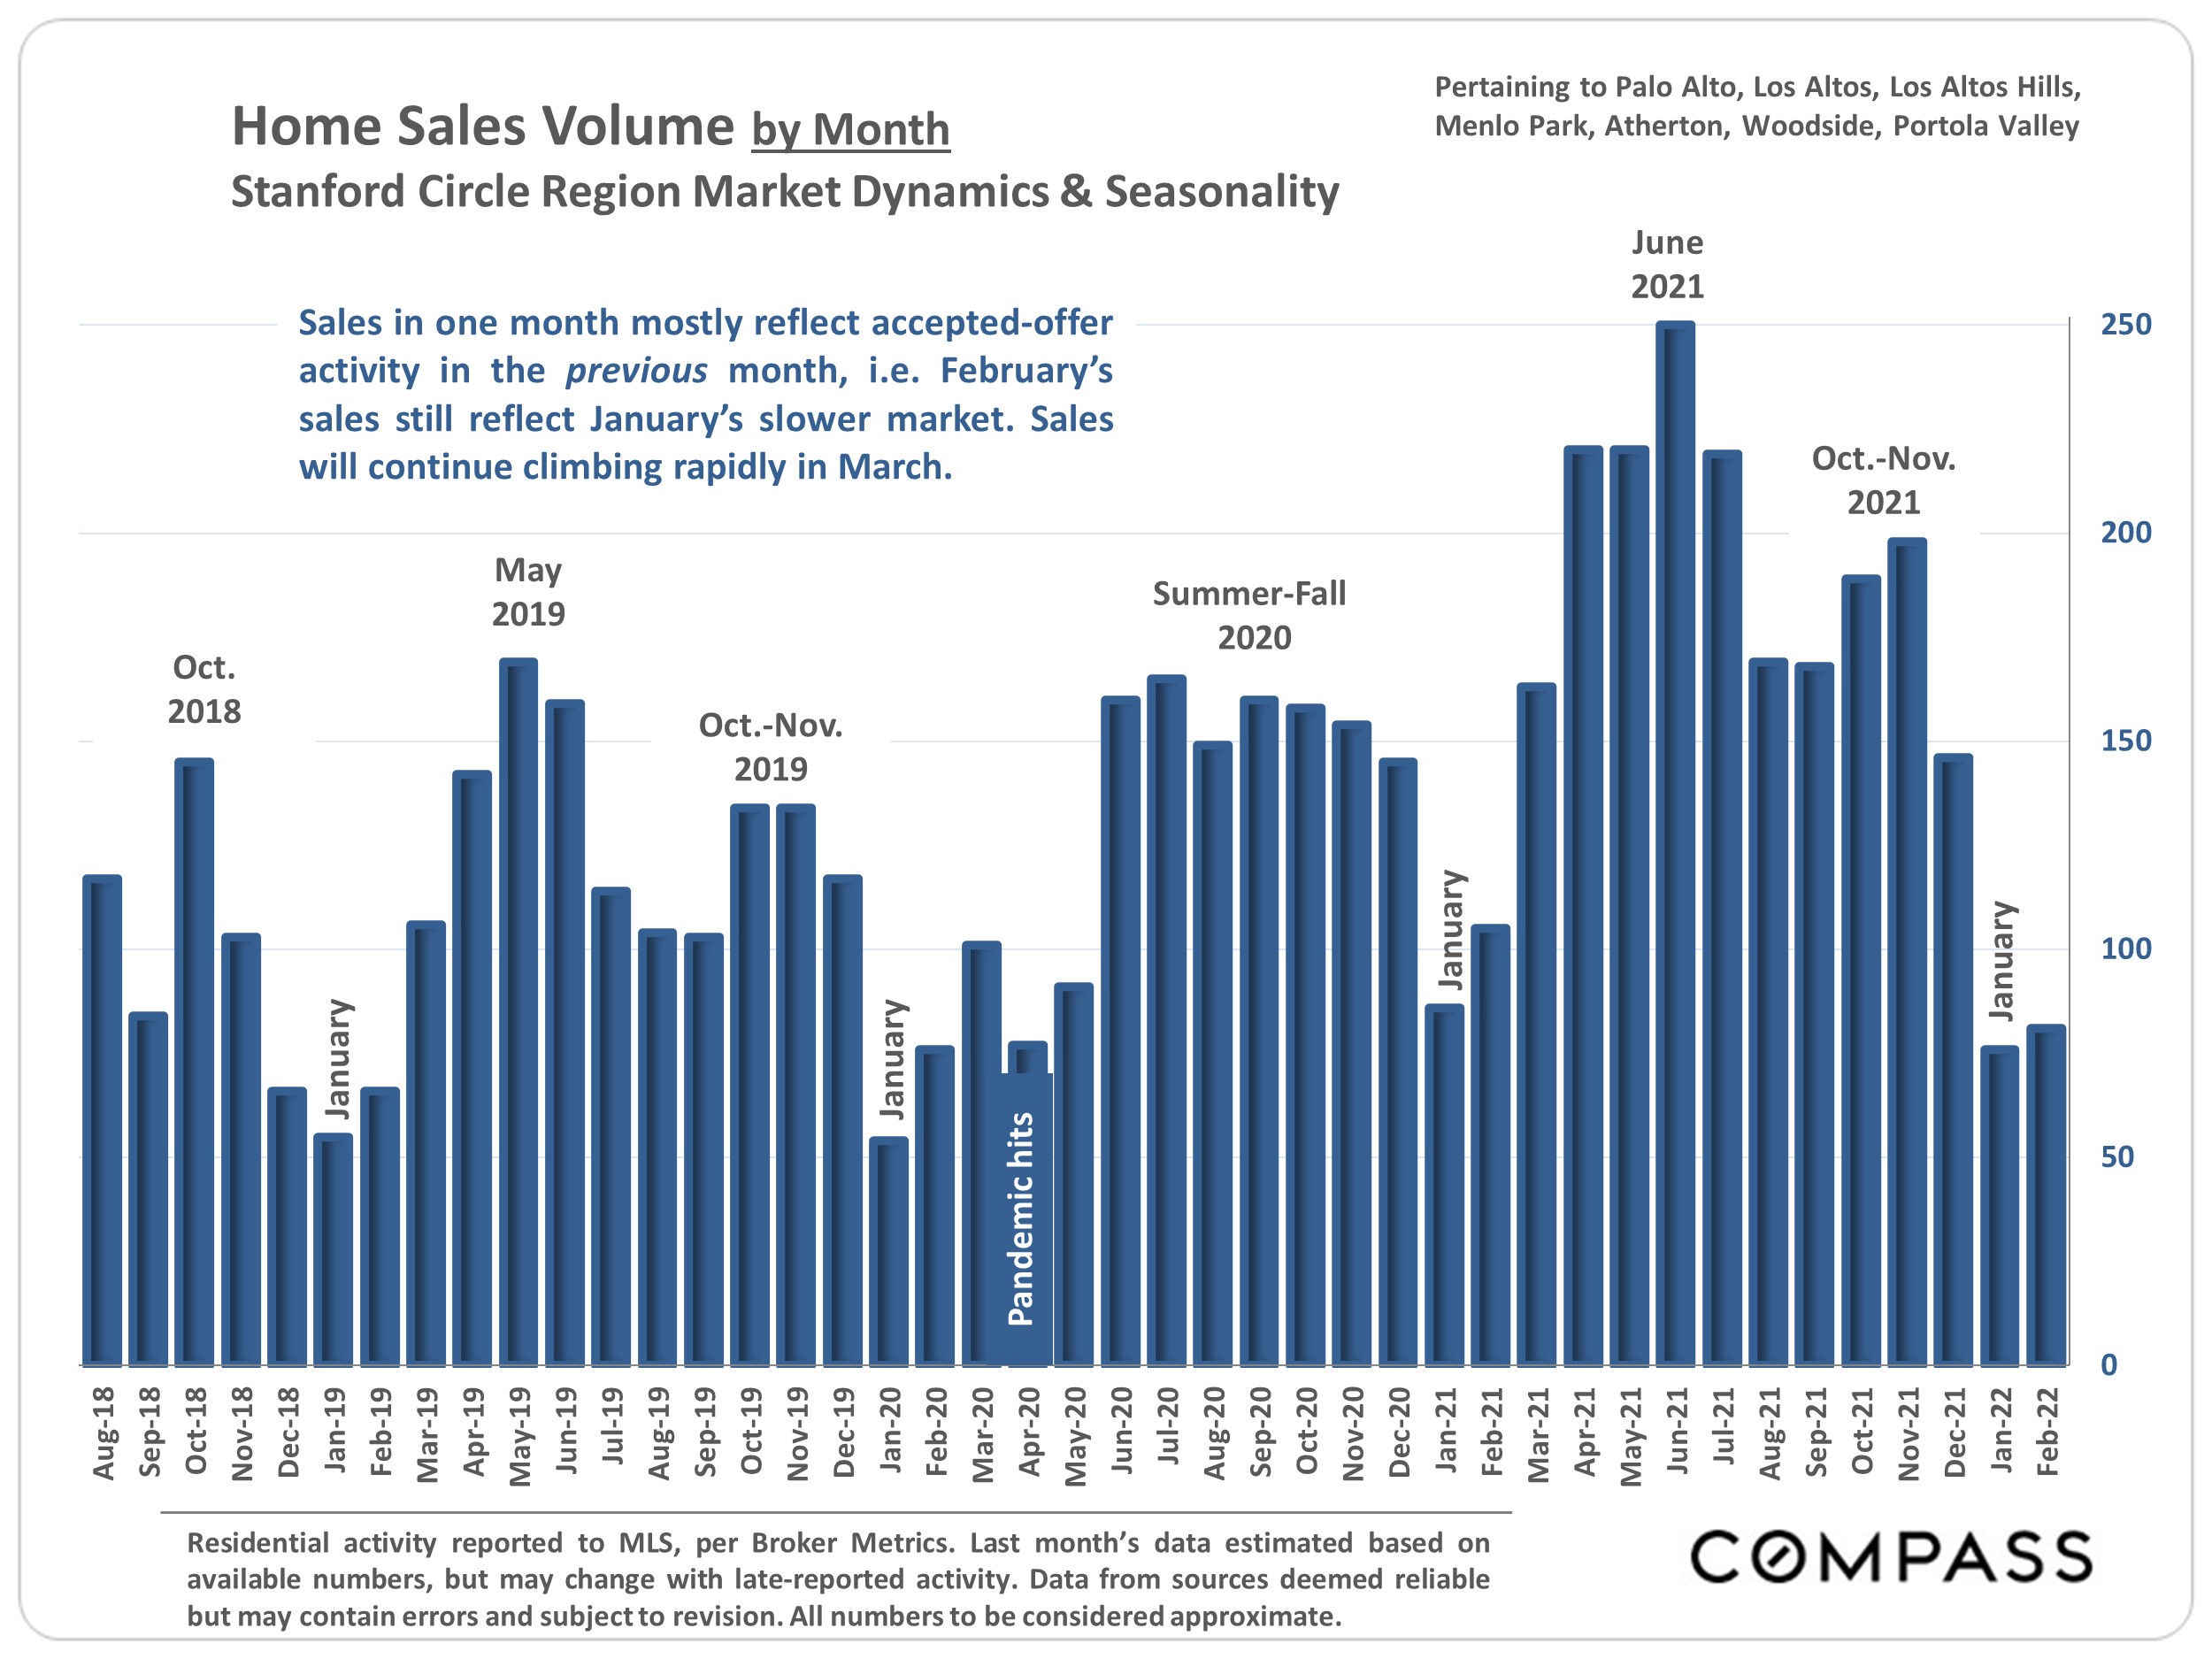
Sales in one month mostly reflect market dynamics in the previous month, and activity typically ebbs and flows by season. Data from sources deemed reliable, but may contain errors and subject to revision. All numbers approximate, and may change with late-reported activity.

Source: Compass

It is impossible to know how median and average value statistics apply to any particular home without a specific comparative market analysis. These analyses were made in good faith with data from sources deemed reliable, but may contain errors and are subject to revision. It is not our intent to convince you of a particular position, but to attempt to provide straightforward data and analysis, so you can make your own informed decisions. Median and average statistics are enormous generalities: There are hundreds of different markets in San Francisco and the Bay Area, each with its own unique dynamics. Median prices and average dollar per square foot values can be and often are affected by other factors besides changes in fair market value. Longer term trends are much more meaningful than short-term.

Compass is a real estate broker licensed by the State of California, DRE 01527235. Equal Housing Opportunity. This report has been prepared solely for information purposes. The information herein is based on or derived from information generally available to the public and/or from sources believed to be reliable. No representation or warranty can be given with respect to the accuracy or completeness of the information. Compass disclaims any and all liability relating to this report, including without limitation any express or implied representations or warranties for statements contained in, and omissions from, the report. Nothing contained herein is intended to be or should be read as any regulatory, legal, tax, accounting or other advice and Compass does not provide such advice. All opinions are subject to change without notice. Compass makes no representation regarding the accuracy of any statements regarding any references to the laws, statutes or regulations of any state are those of the author(s). Past performance is no guarantee of future results.

“Stanford Circle Cities” Real Estate Trends, April 2022

Source: Compass

It is impossible to know how median and average value statistics apply to any particular home without a specific comparative market analysis. These analyses were made in good faith with data from sources deemed reliable, but may contain errors and are subject to revision. It is not our intent to convince you of a particular position, but to attempt to provide straightforward data and analysis, so you can make your own informed decisions. Median and average statistics are enormous generalities: There are hundreds of different markets in San Francisco and the Bay Area, each with its own unique dynamics. Median prices and average dollar per square foot values can be and often are affected by other factors besides changes in fair market value. Longer term trends are much more meaningful than short-term.

Compass is a real estate broker licensed by the State of California, DRE 01527235. Equal Housing Opportunity. This report has been prepared solely for information purposes. The information herein is based on or derived from information generally available to the public and/or from sources believed to be reliable. No representation or warranty can be given with respect to the accuracy or completeness of the information. Compass disclaims any and all liability relating to this report, including without limitation any express or implied representations or warranties for statements contained in, and omissions from, the report. Nothing contained herein is intended to be or should be read as any regulatory, legal, tax, accounting or other advice and Compass does not provide such advice. All opinions are subject to change without notice. Compass makes no representation regarding the accuracy of any statements regarding any references to the laws, statutes or regulations of any state are those of the author(s). Past performance is no guarantee of future results.

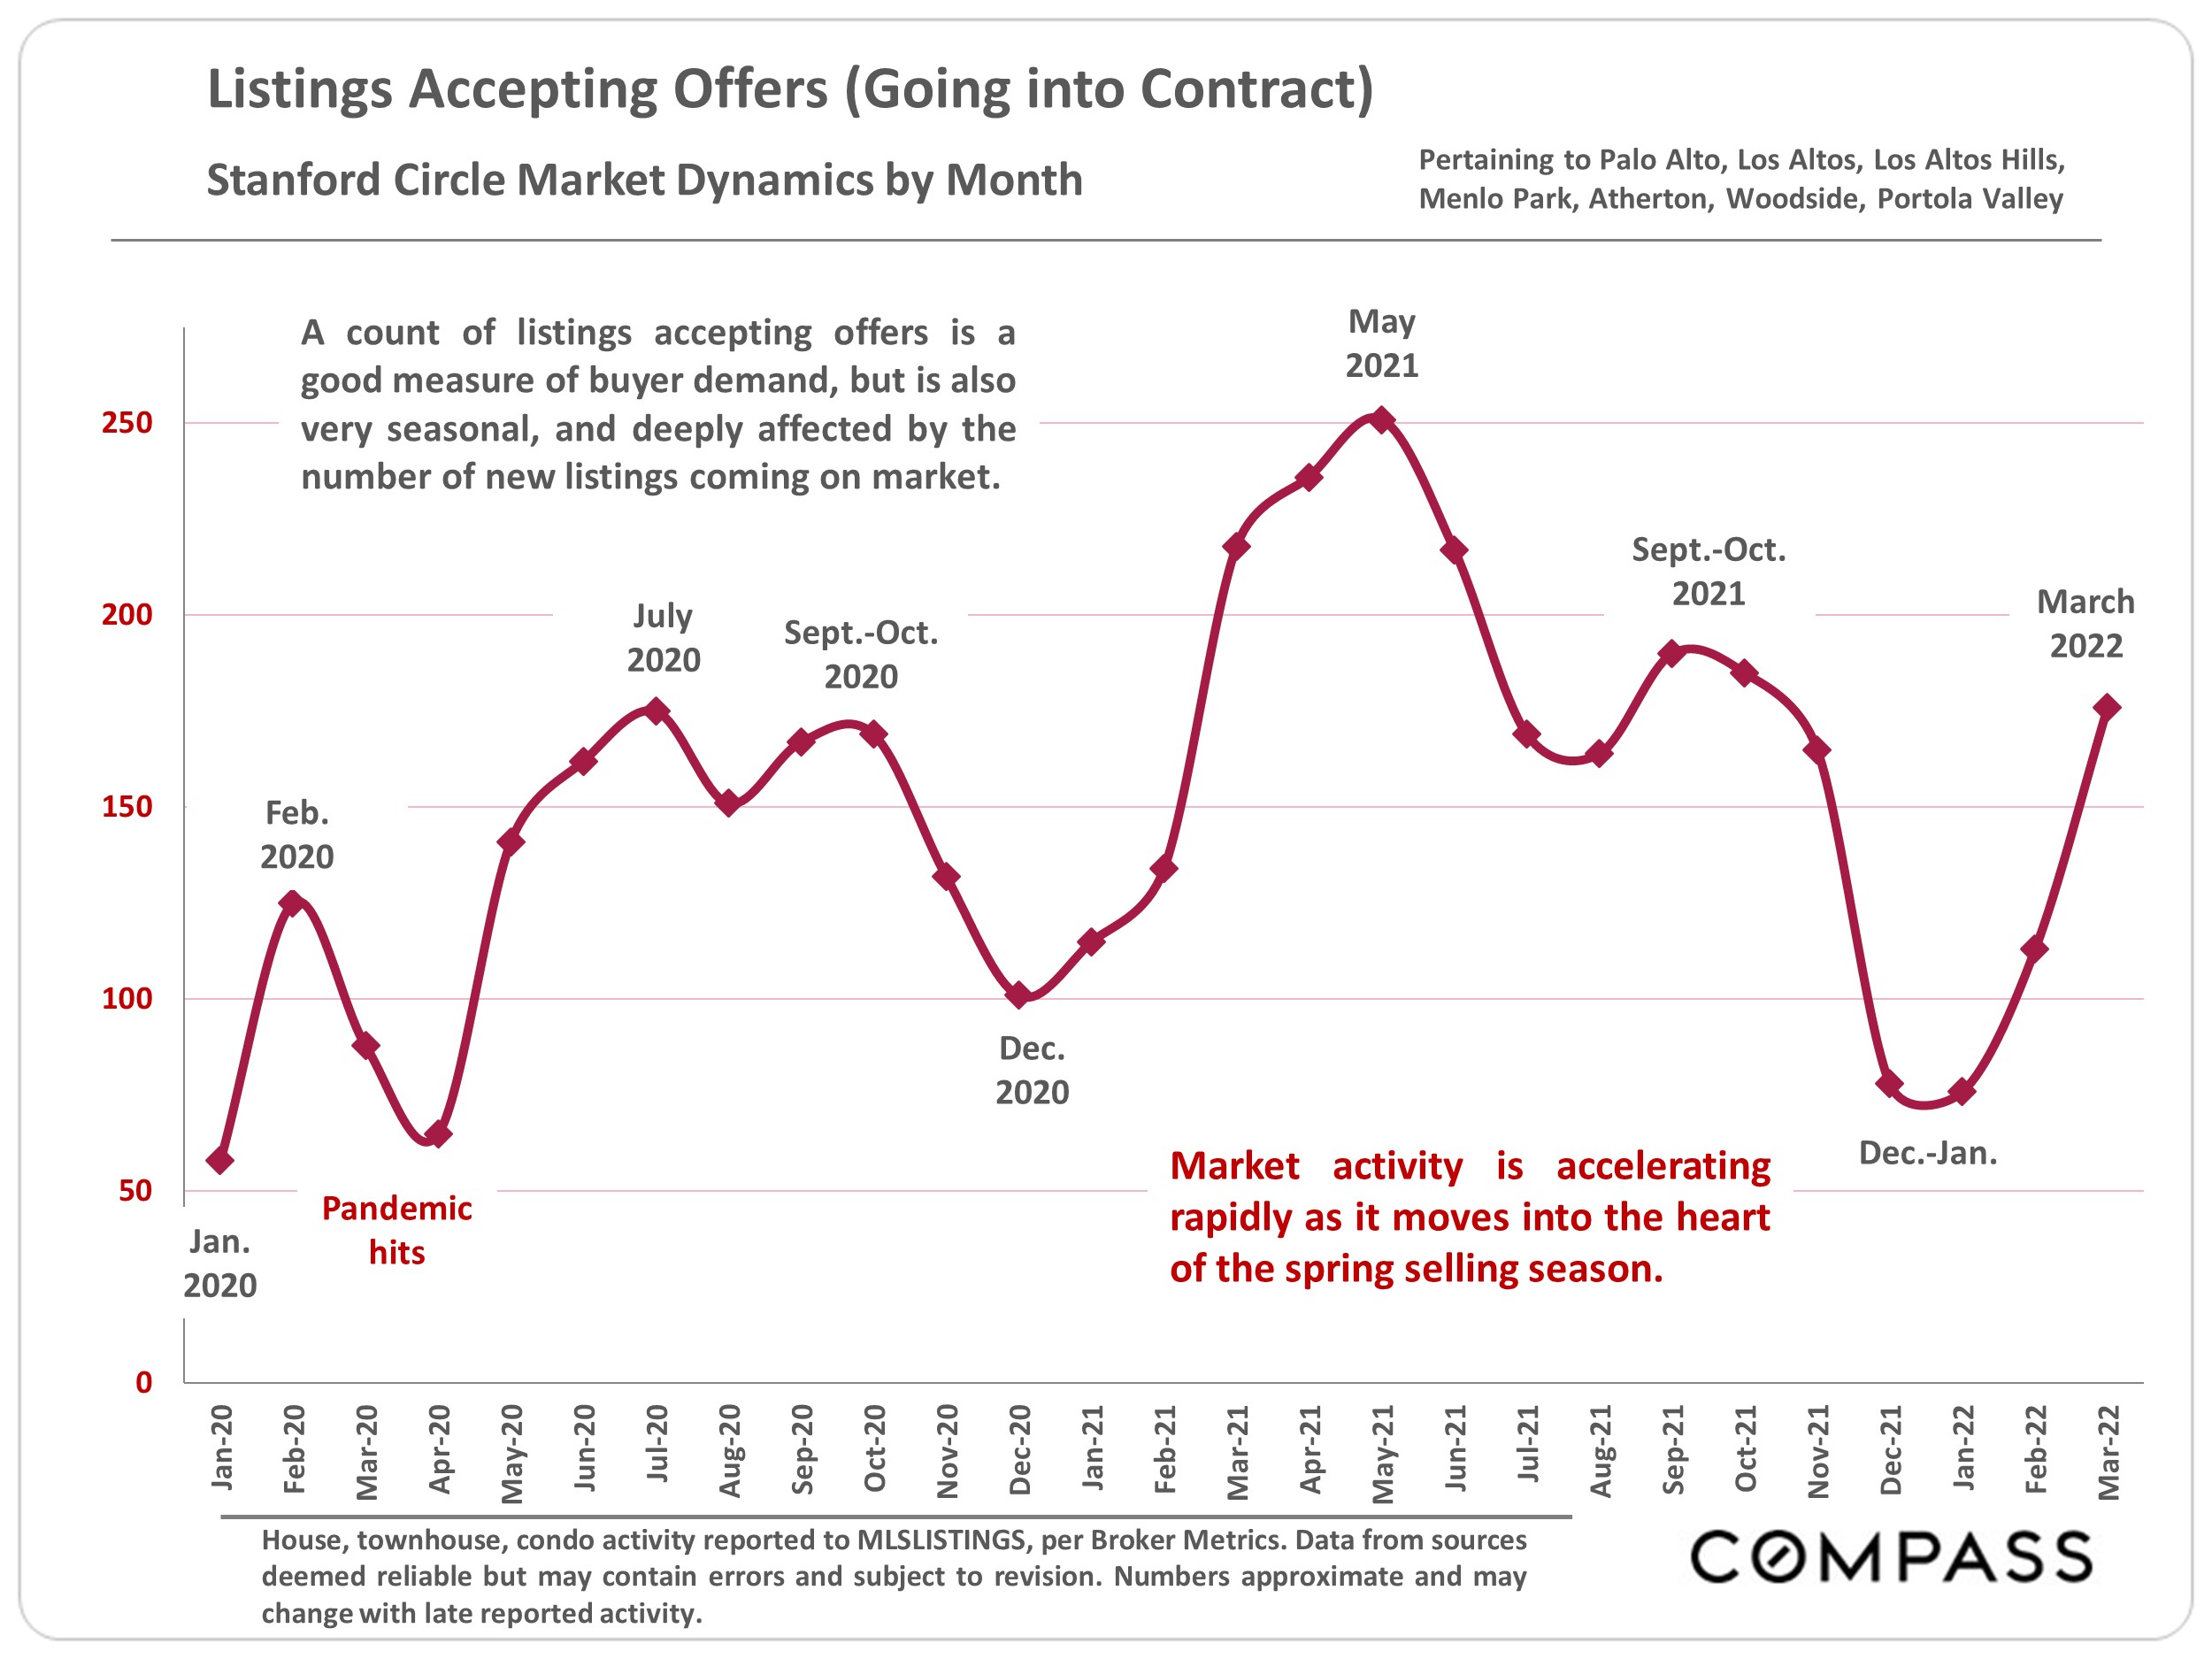
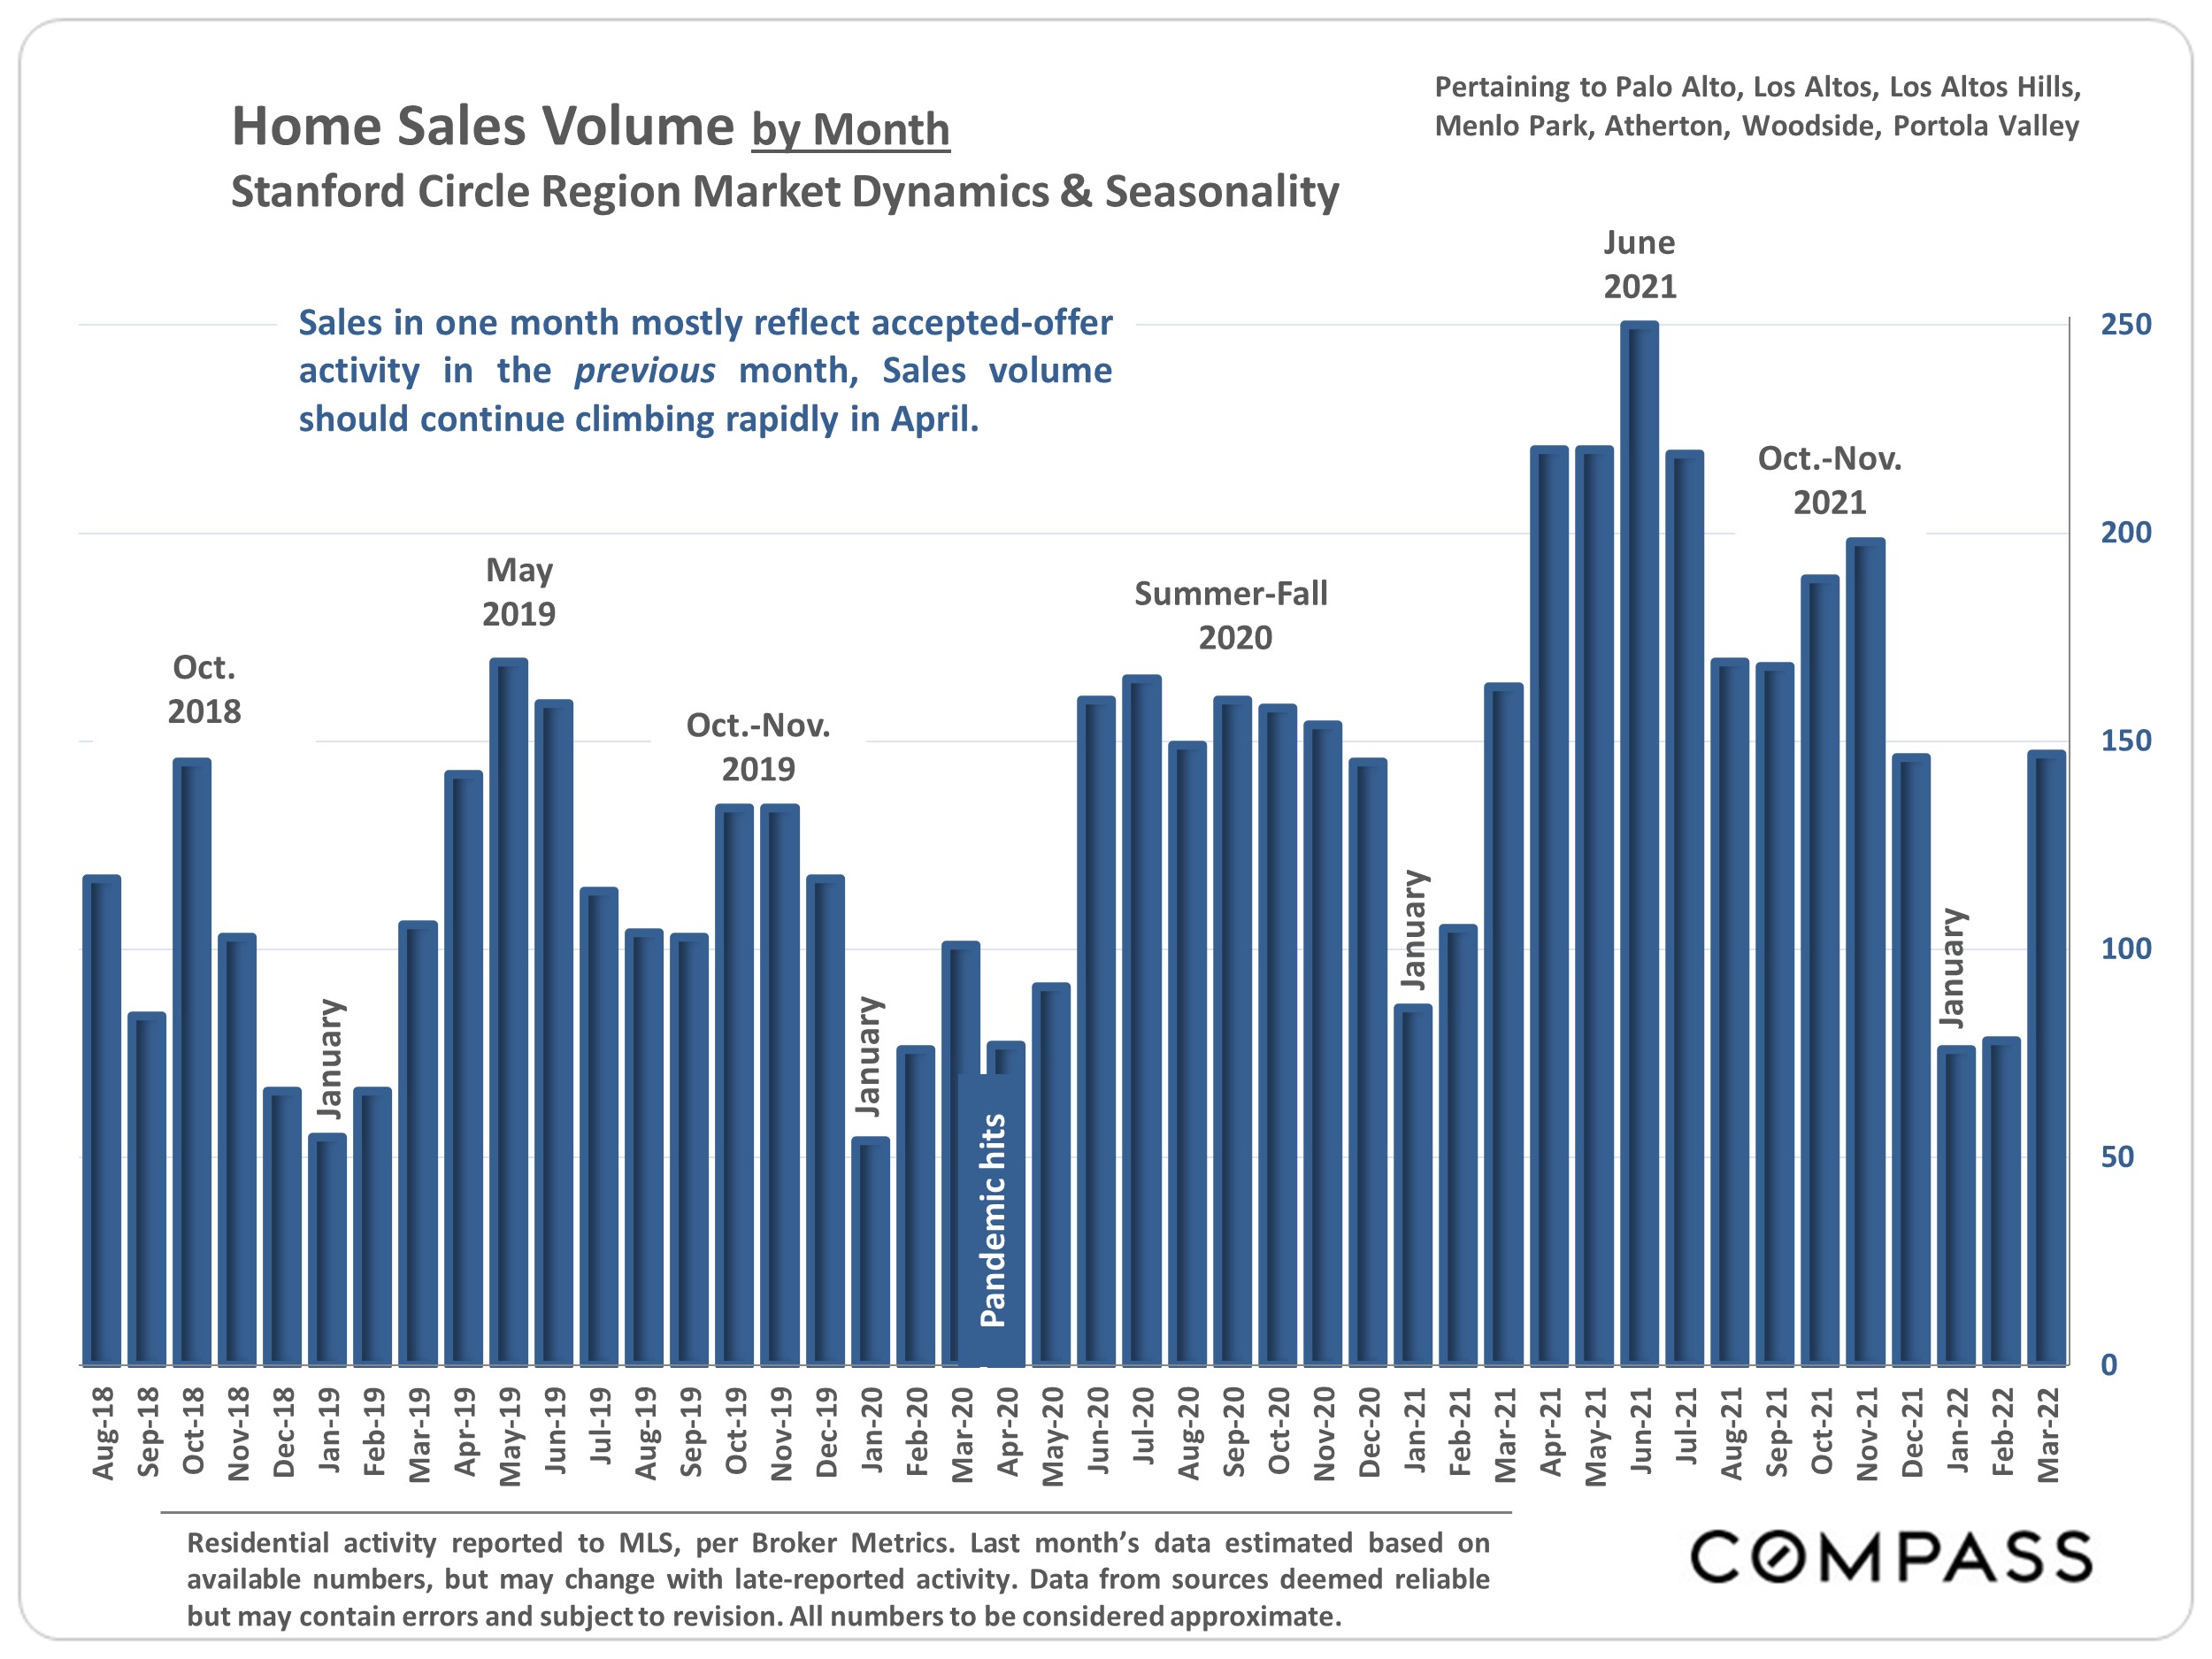
“Stanford Circle Cities” Real Estate Trends, March 2022

Moving into Spring, Markets Remain Very Heated

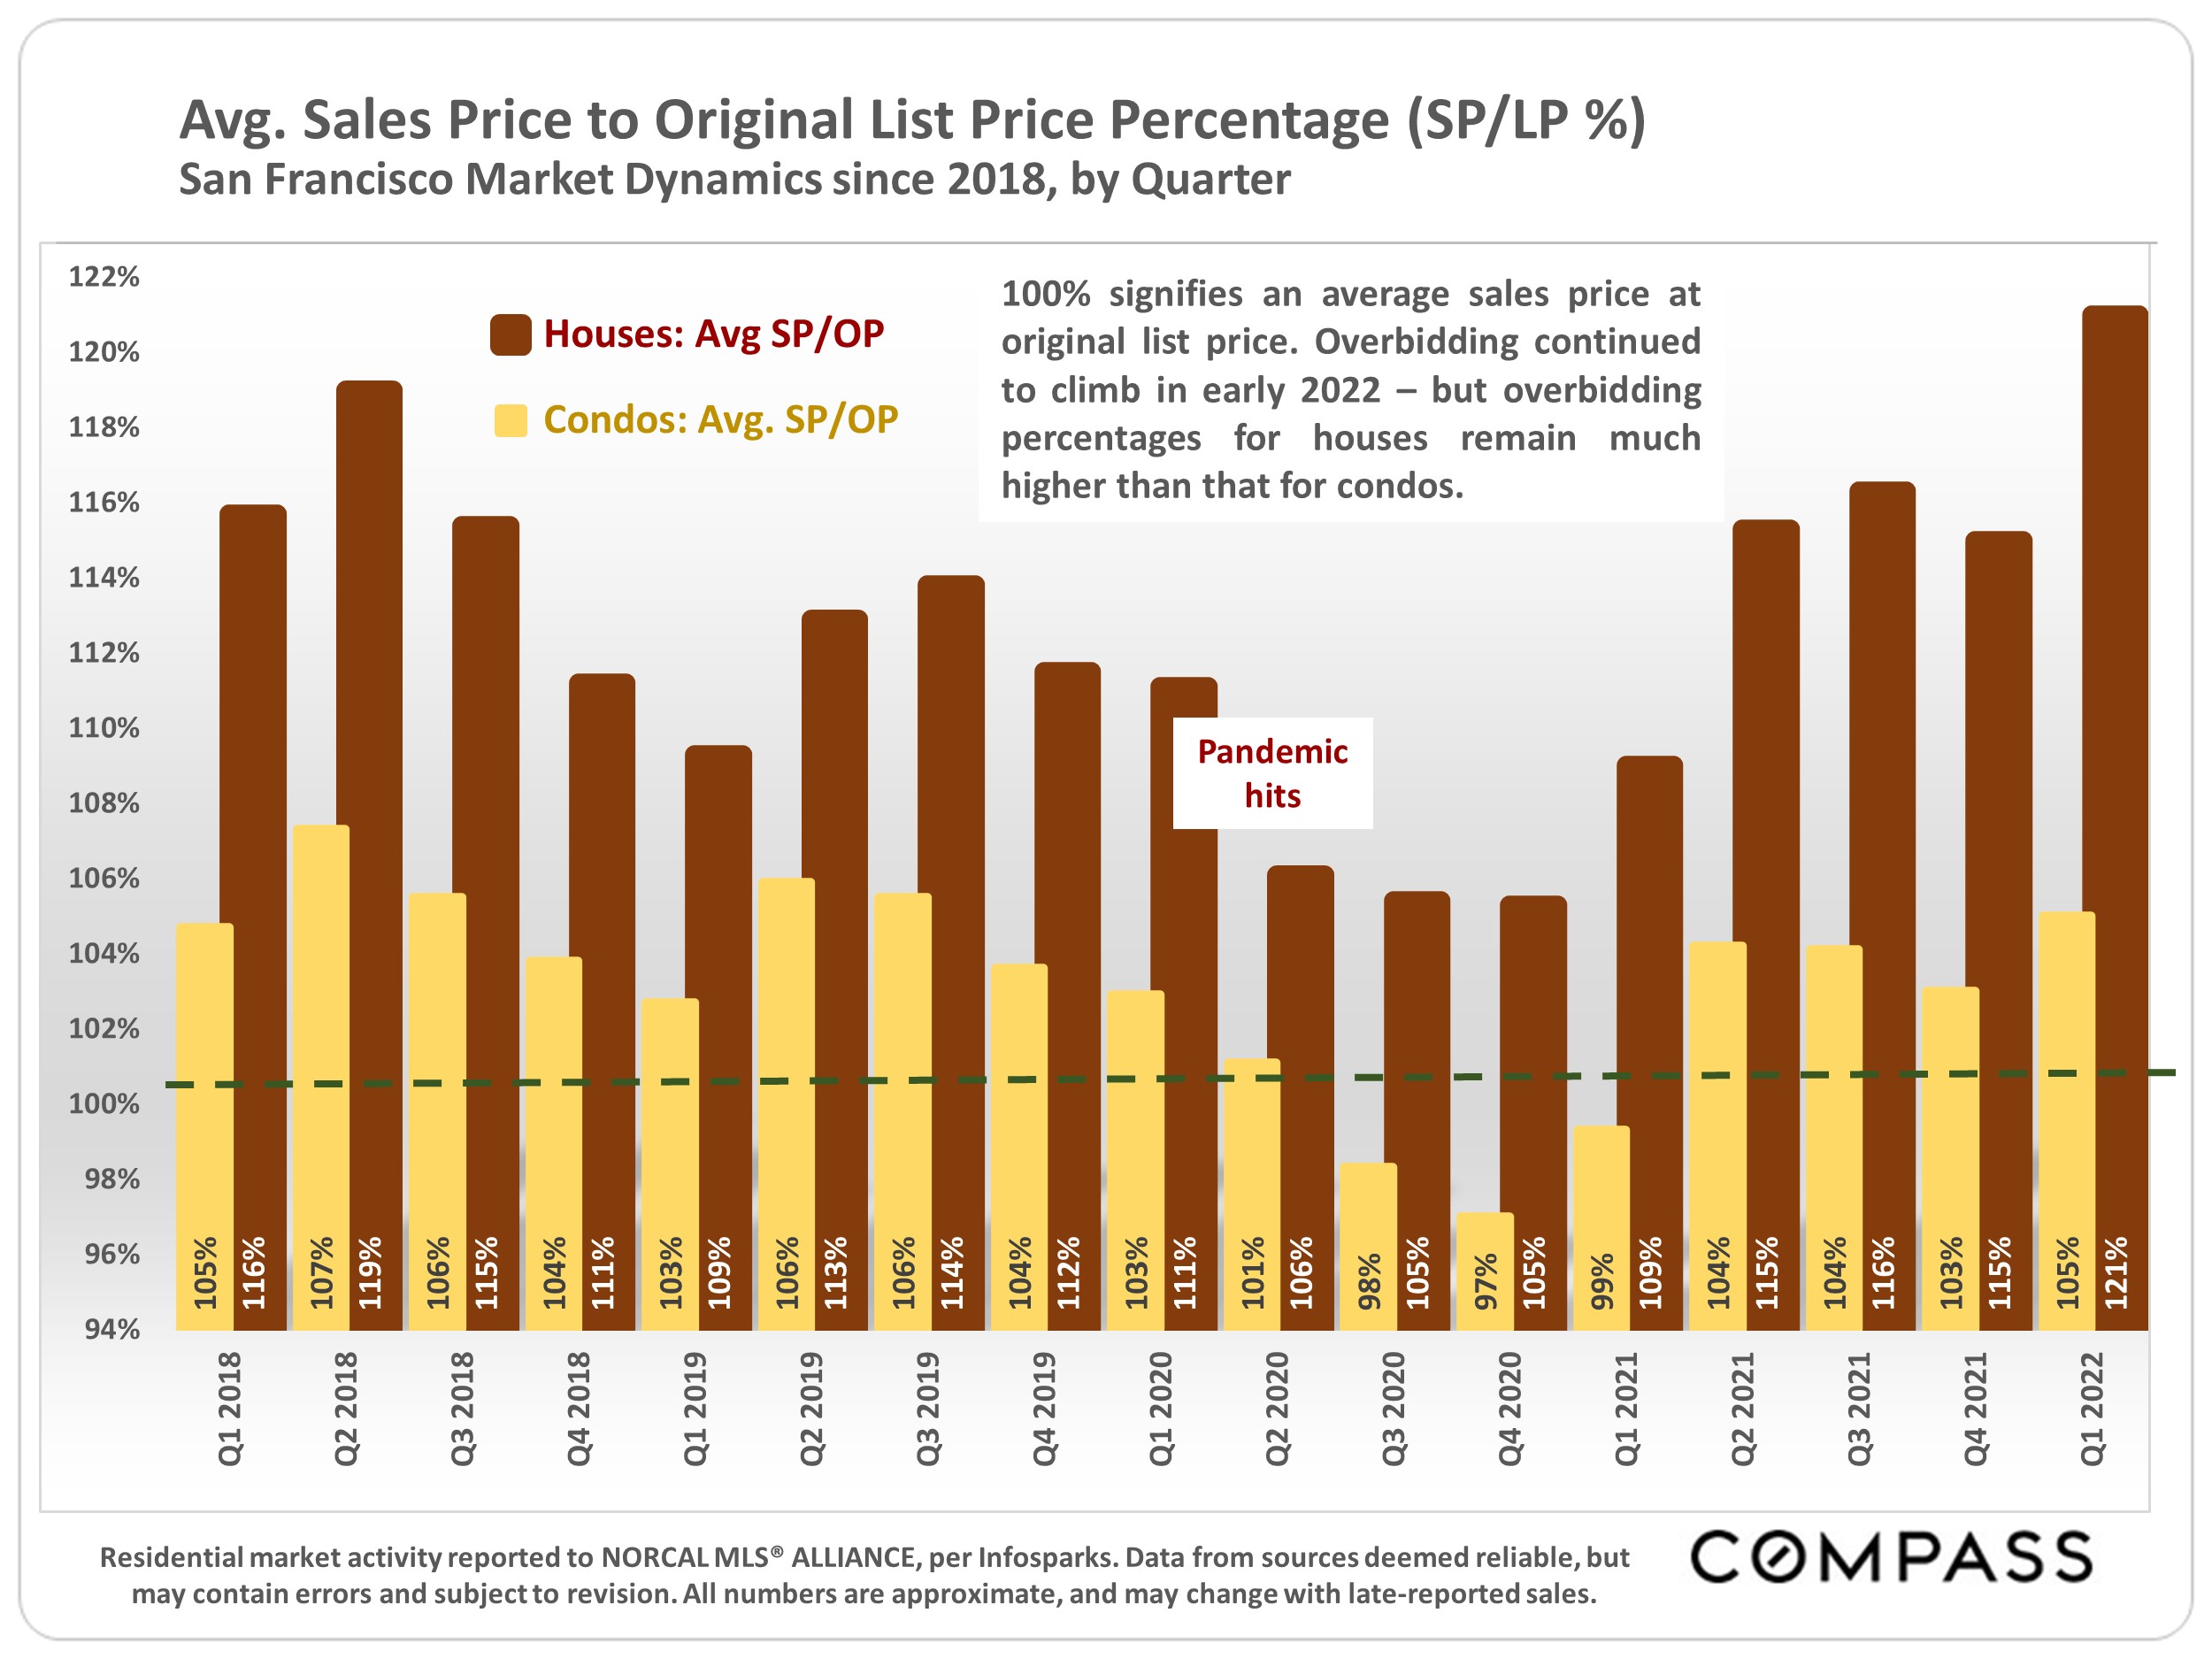
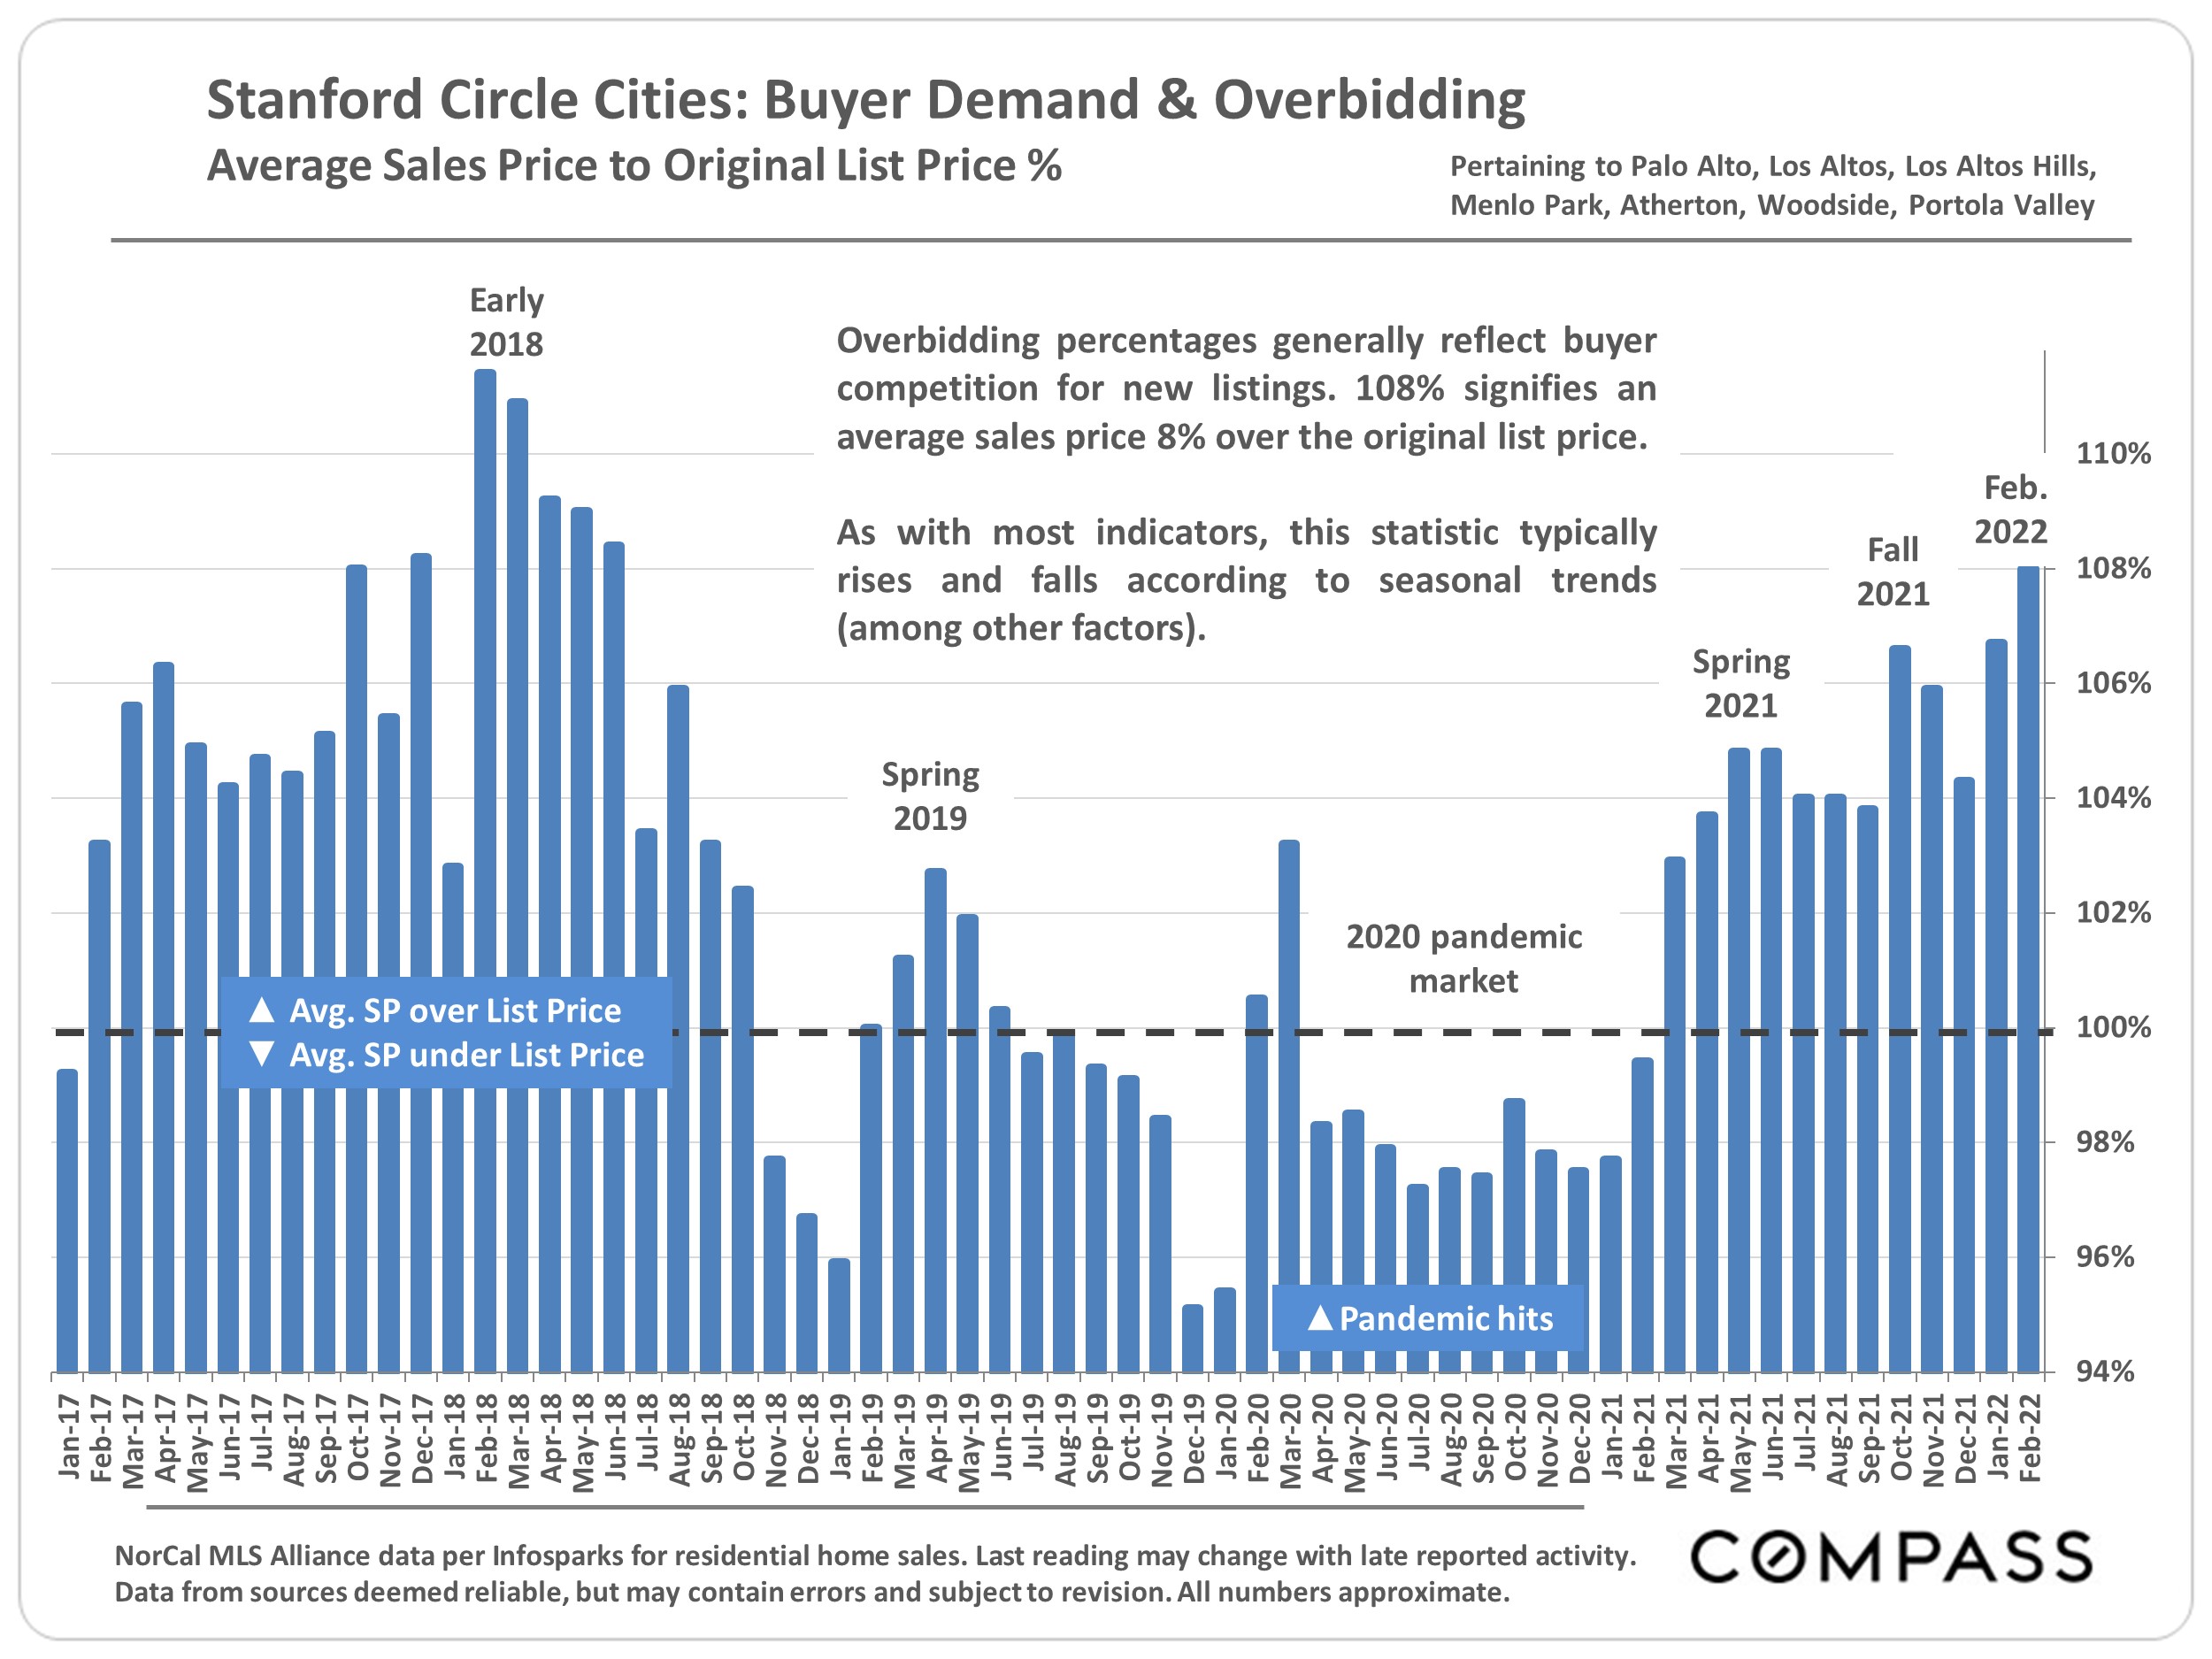
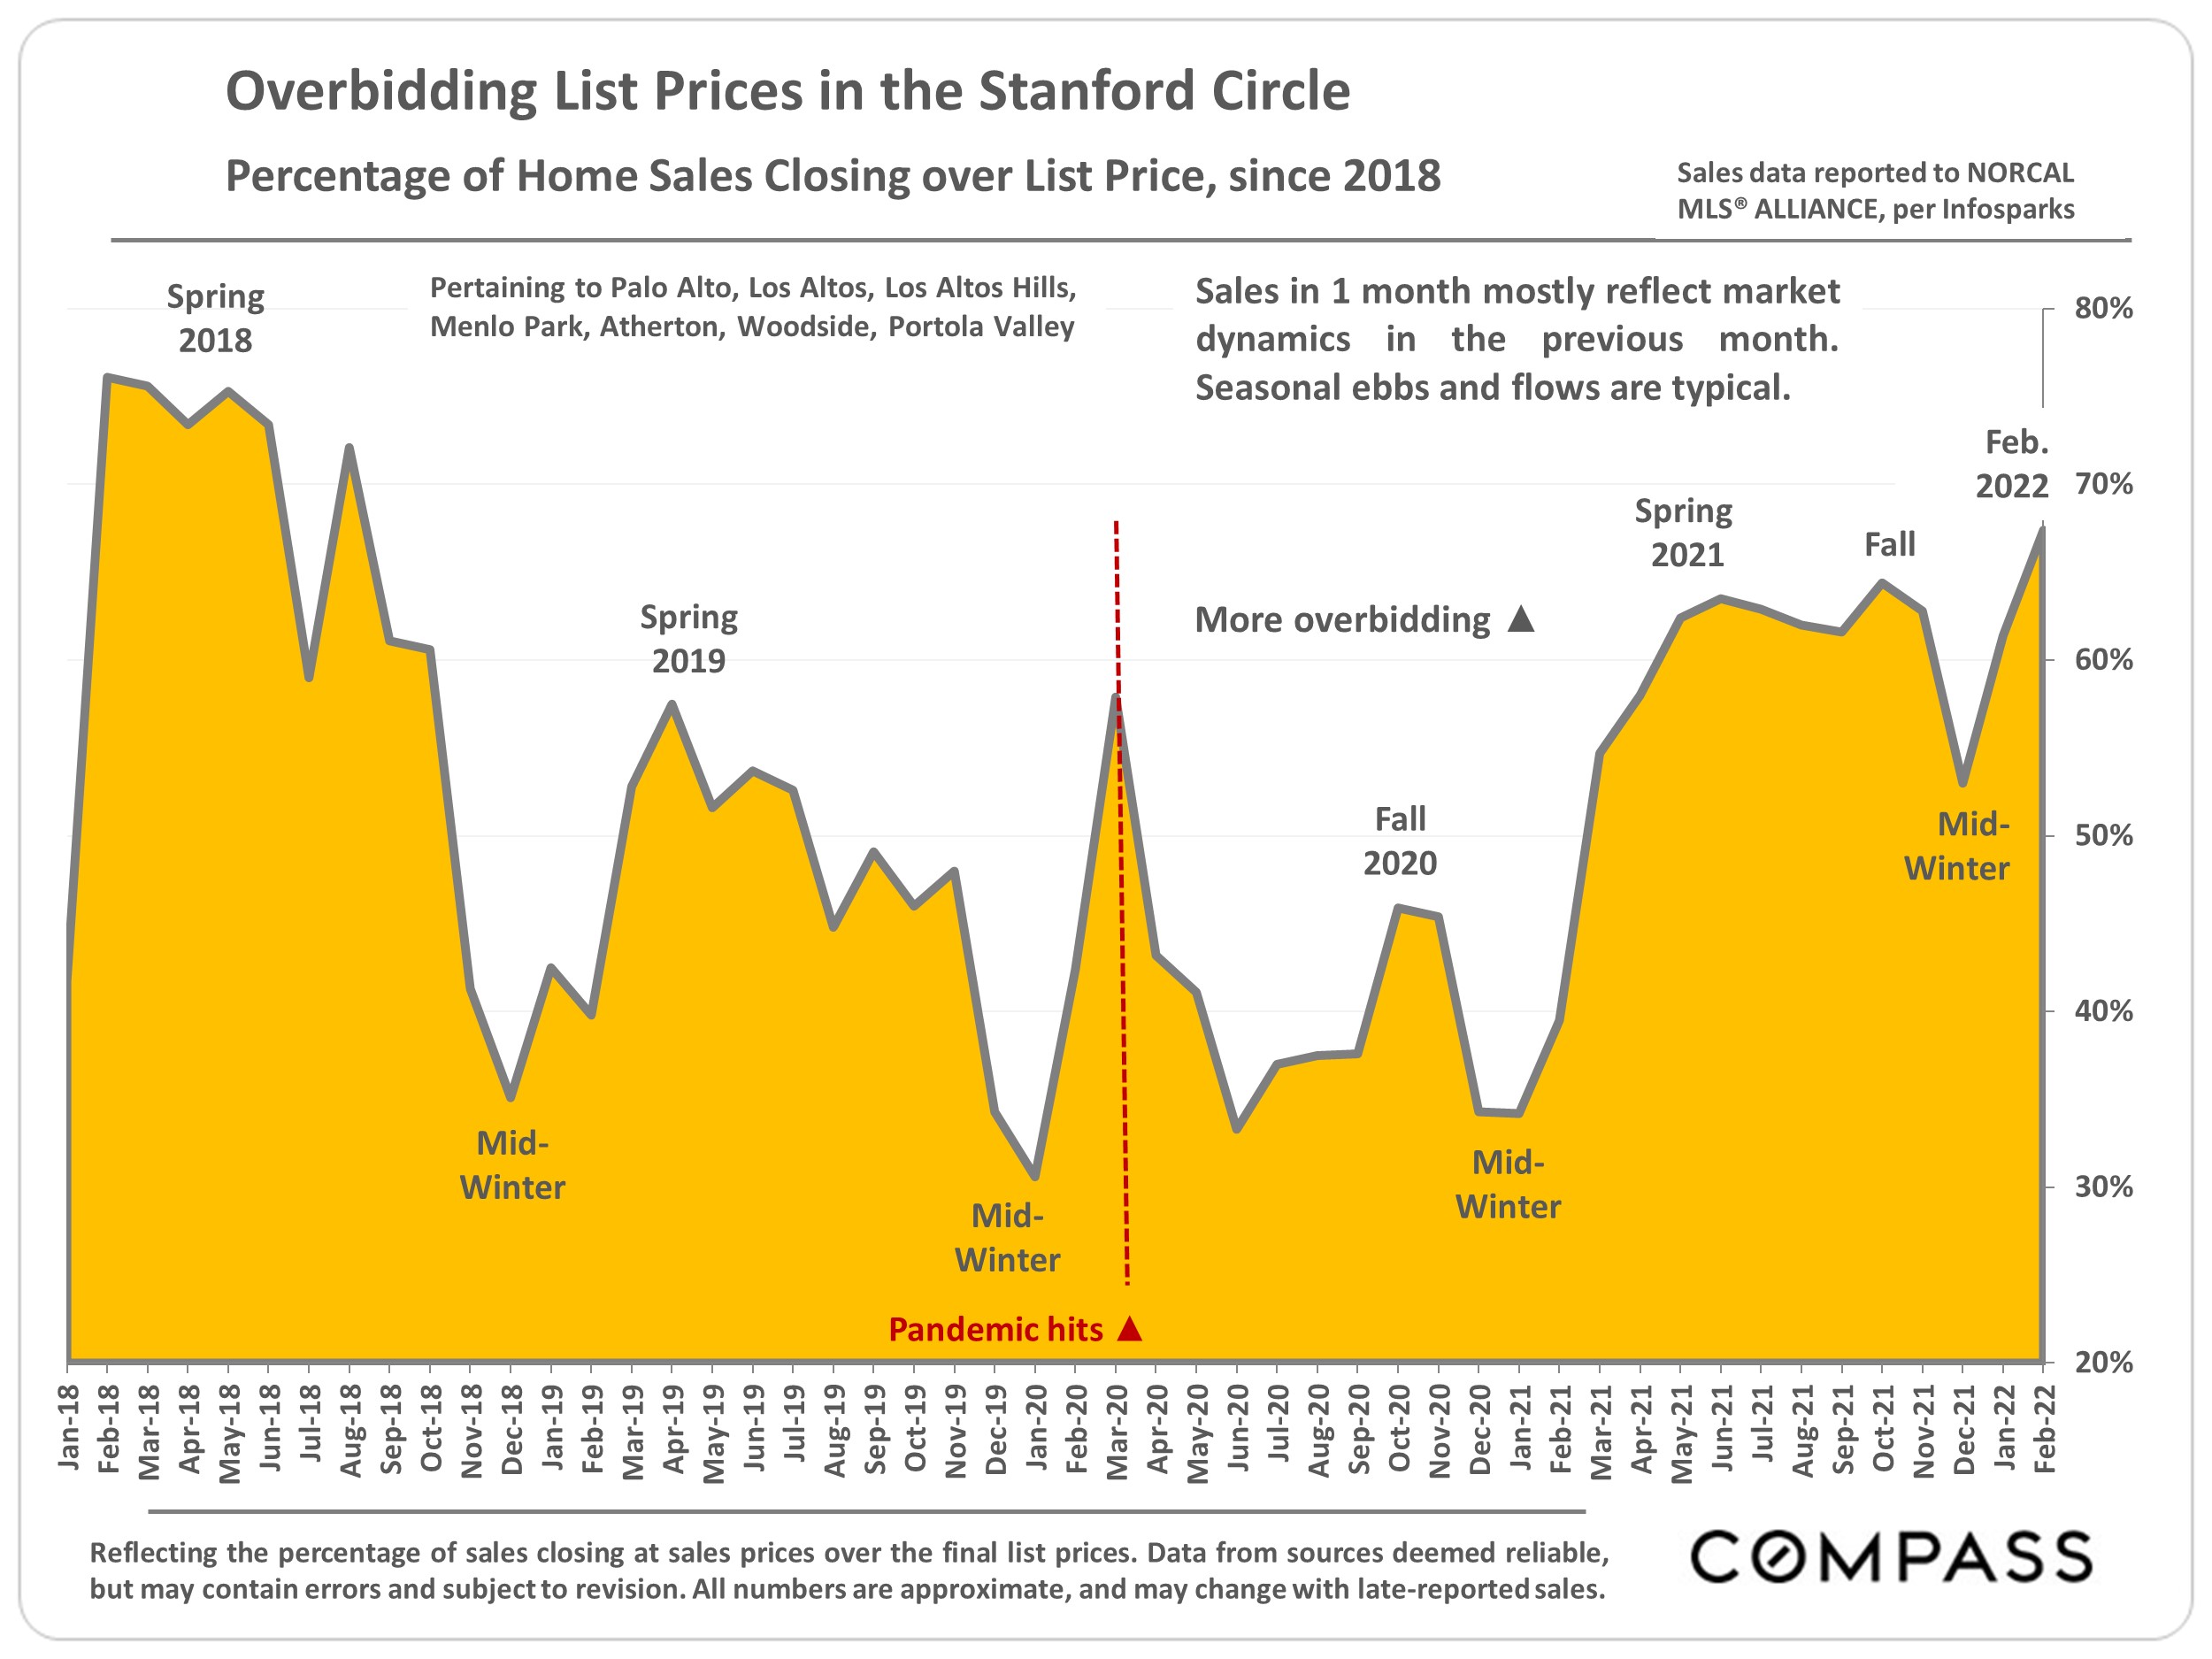
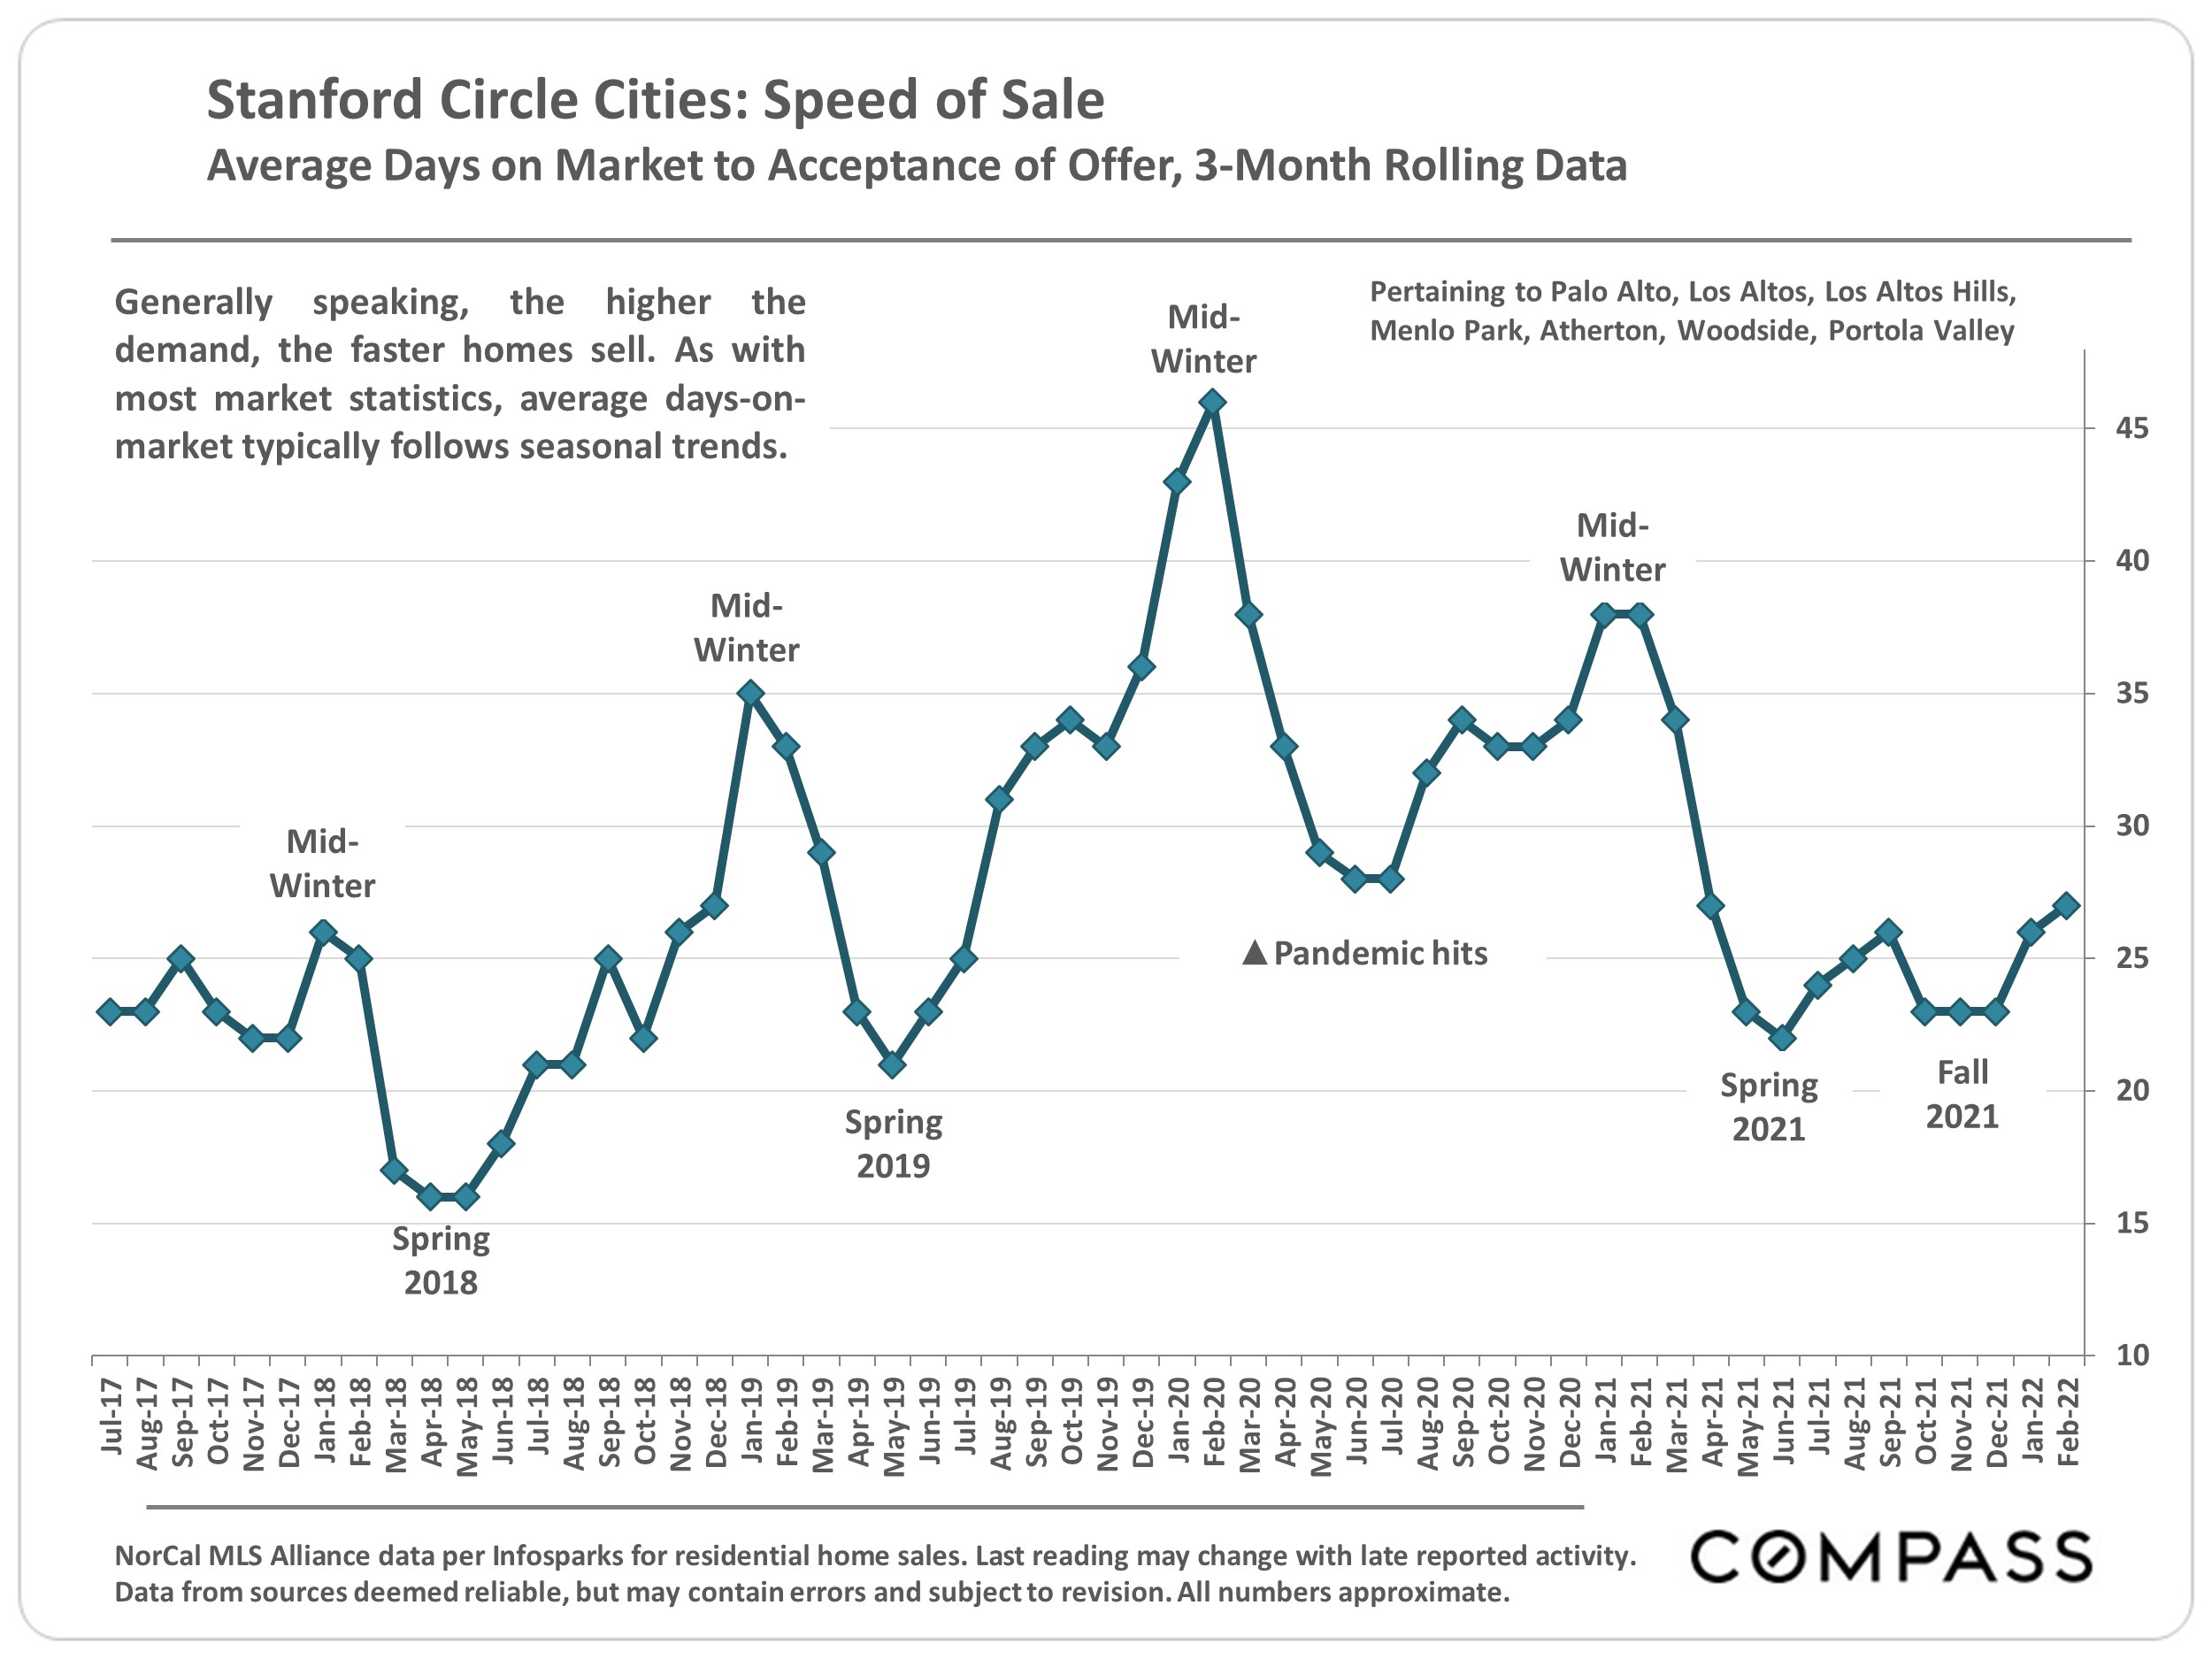
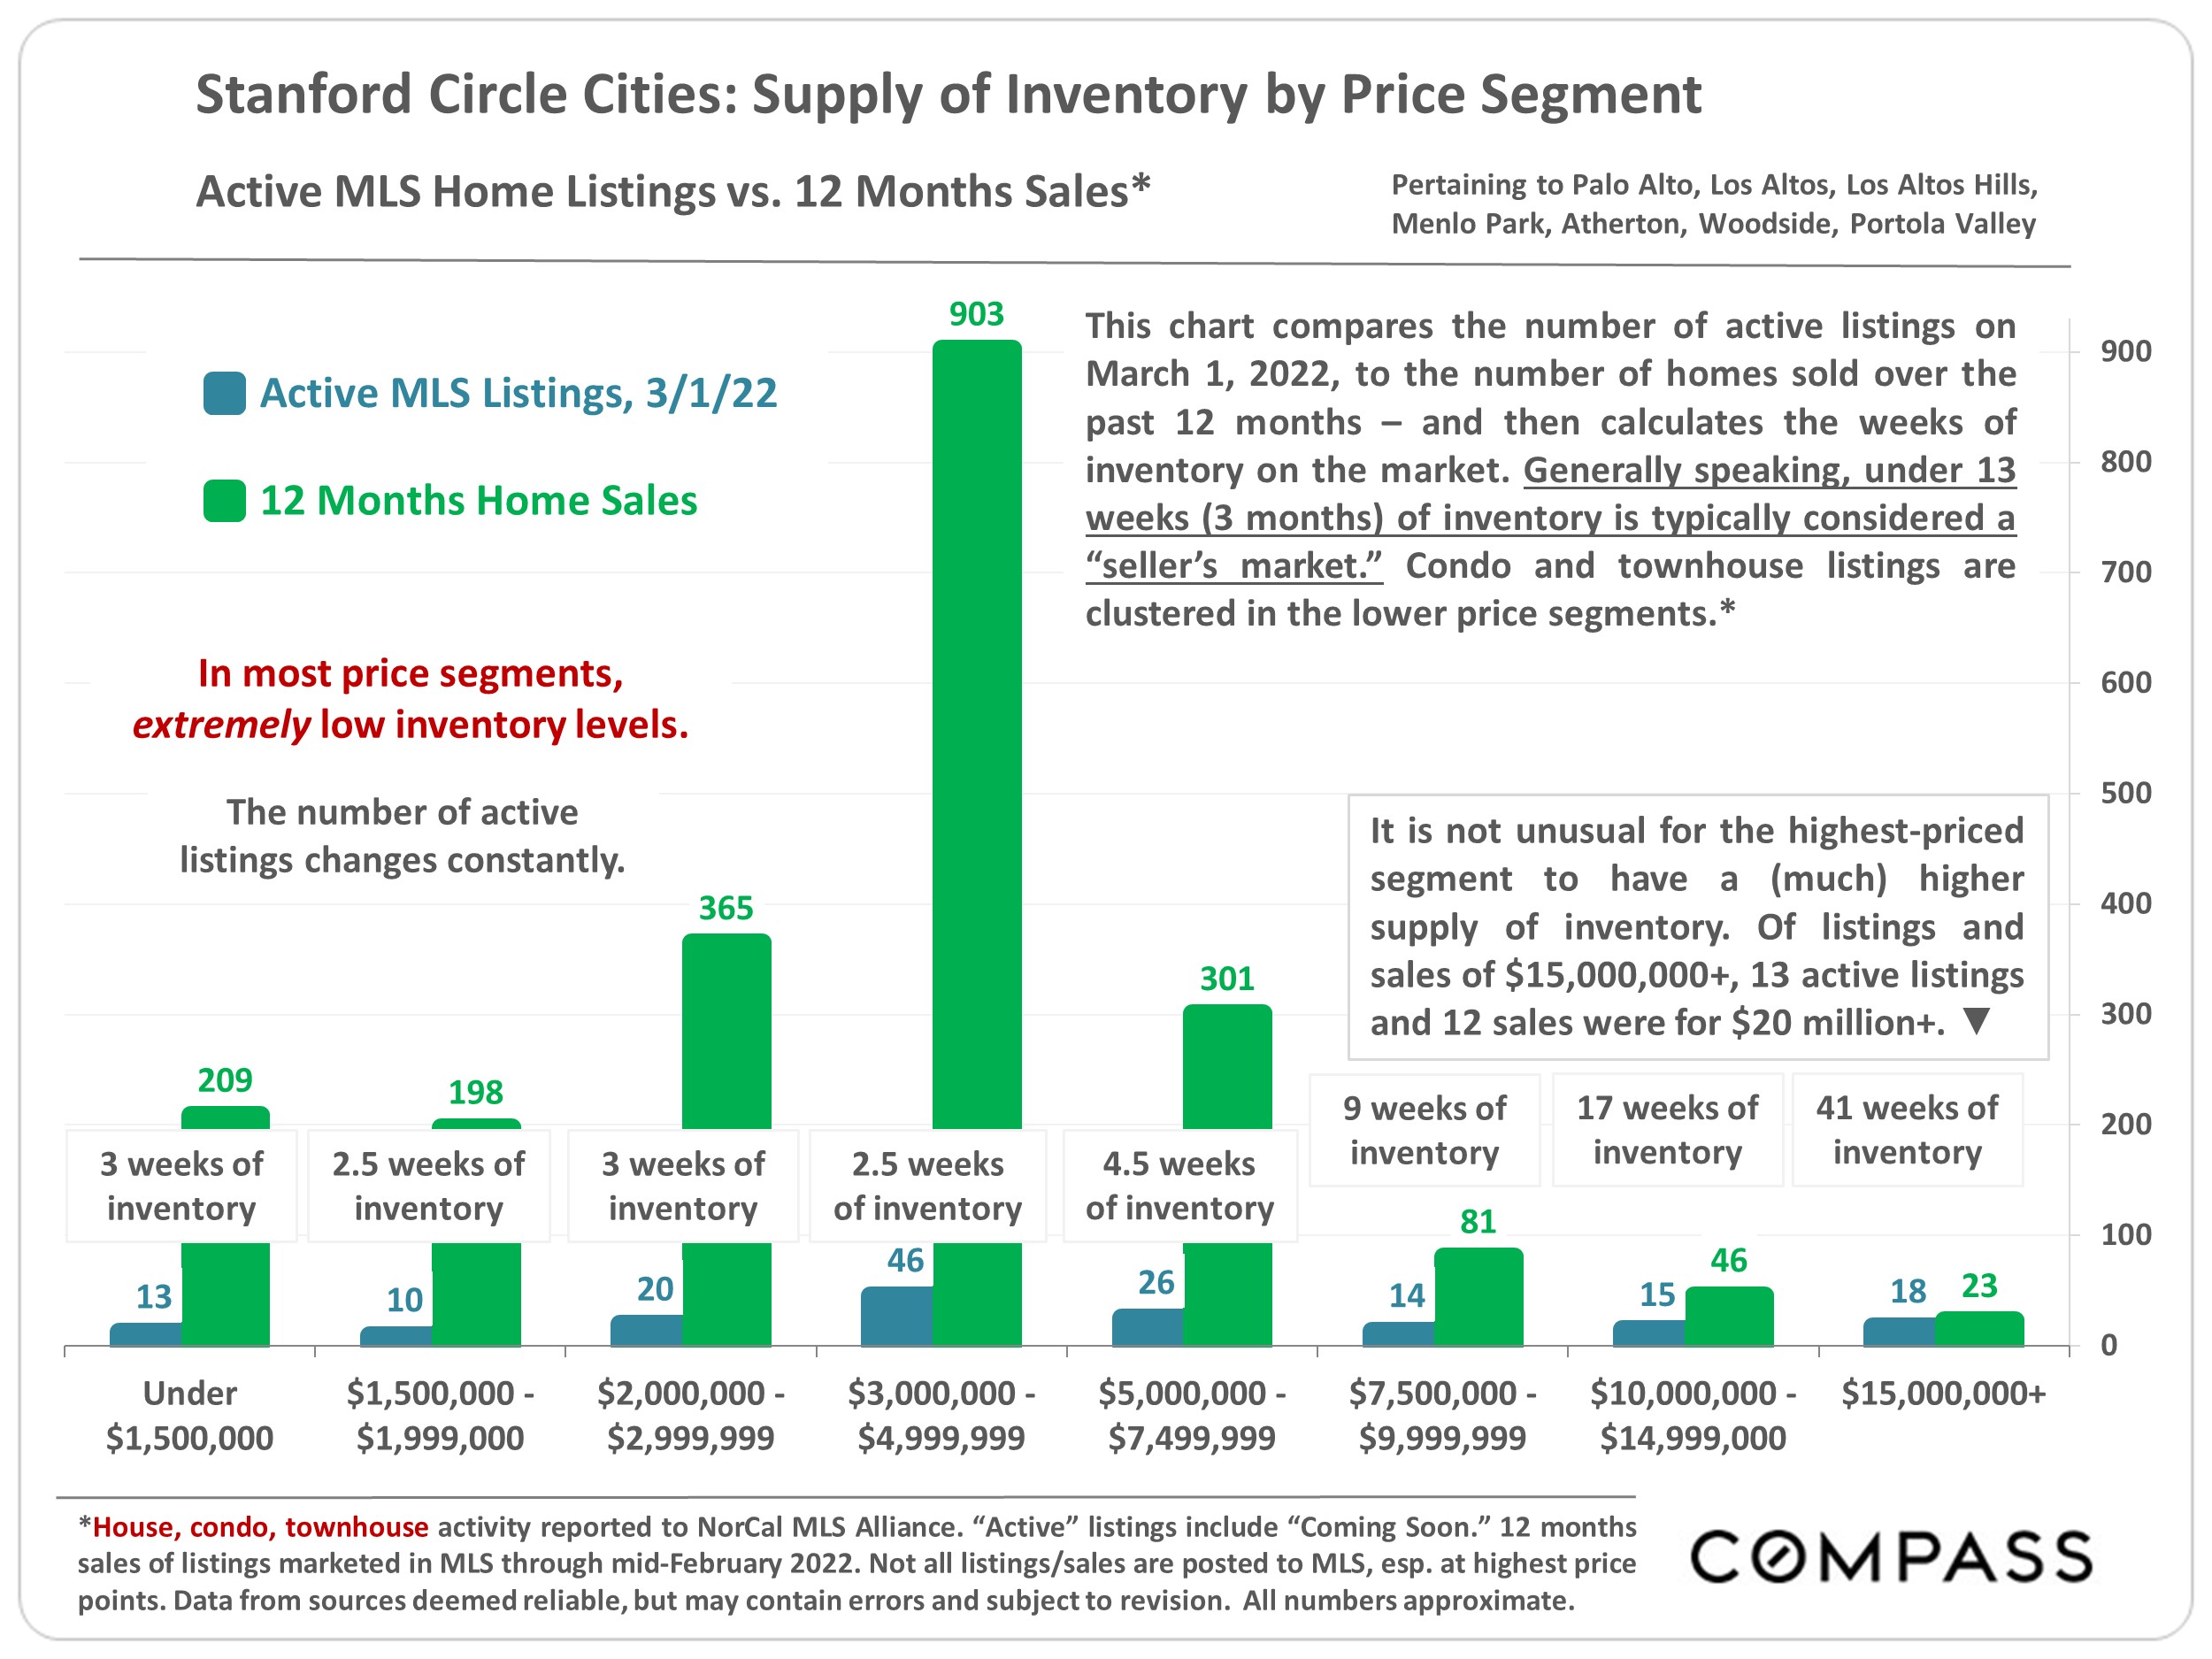
So far in 2022, Bay Area real estate markets appear largely unfazed by higher interest rates, volatility in financial markets, and troubling international events. The prevailing dynamic remains one of strong buyer demand competing for an inadequate inventory of listings for sale: Crowded open houses, multiple offers, fierce overbidding, fast sales, and rising prices remain the norm. That is not to say there haven’t been buyers negatively impacted by higher loan rates and/or recent declines in stock portfolios; and some buyers and sellers have become more hesitant or paused their plans, awaiting more clarity amid recent developments. But not enough to move the needle on the fundamentally very-high-demand/very-low-­supply conditions which dominated 2021.

As typical at the start of the year, the number of new listings coming on market and the number of listings going into contract continue to rise. These normally climb rapidly through spring, characteristically the biggest selling season of the year.

This report will review a number of standard indicators, as well as home values, interest rates, factors that can affect real estate markets, and how market cycles have broadly played out over the last 4 decades. March and April data will soon provide further indications of the market’s direction in 2022.

Sales in one month mostly reflect market dynamics in the previous month, and activity typically ebbs and flows by season. Data from sources deemed reliable, but may contain errors and subject to revision. All numbers approximate, and may change with late-reported activity.

Source: Compass

It is impossible to know how median and average value statistics apply to any particular home without a specific comparative market analysis. These analyses were made in good faith with data from sources deemed reliable, but may contain errors and are subject to revision. It is not our intent to convince you of a particular position, but to attempt to provide straightforward data and analysis, so you can make your own informed decisions. Median and average statistics are enormous generalities: There are hundreds of different markets in San Francisco and the Bay Area, each with its own unique dynamics. Median prices and average dollar per square foot values can be and often are affected by other factors besides changes in fair market value. Longer term trends are much more meaningful than short-term.

Compass is a real estate broker licensed by the State of California, DRE 01527235. Equal Housing Opportunity. This report has been prepared solely for information purposes. The information herein is based on or derived from information generally available to the public and/or from sources believed to be reliable. No representation or warranty can be given with respect to the accuracy or completeness of the information. Compass disclaims any and all liability relating to this report, including without limitation any express or implied representations or warranties for statements contained in, and omissions from, the report. Nothing contained herein is intended to be or should be read as any regulatory, legal, tax, accounting or other advice and Compass does not provide such advice. All opinions are subject to change without notice. Compass makes no representation regarding the accuracy of any statements regarding any references to the laws, statutes or regulations of any state are those of the author(s). Past performance is no guarantee of future results.

Bay Area Luxury Market Report, March 22, 2022

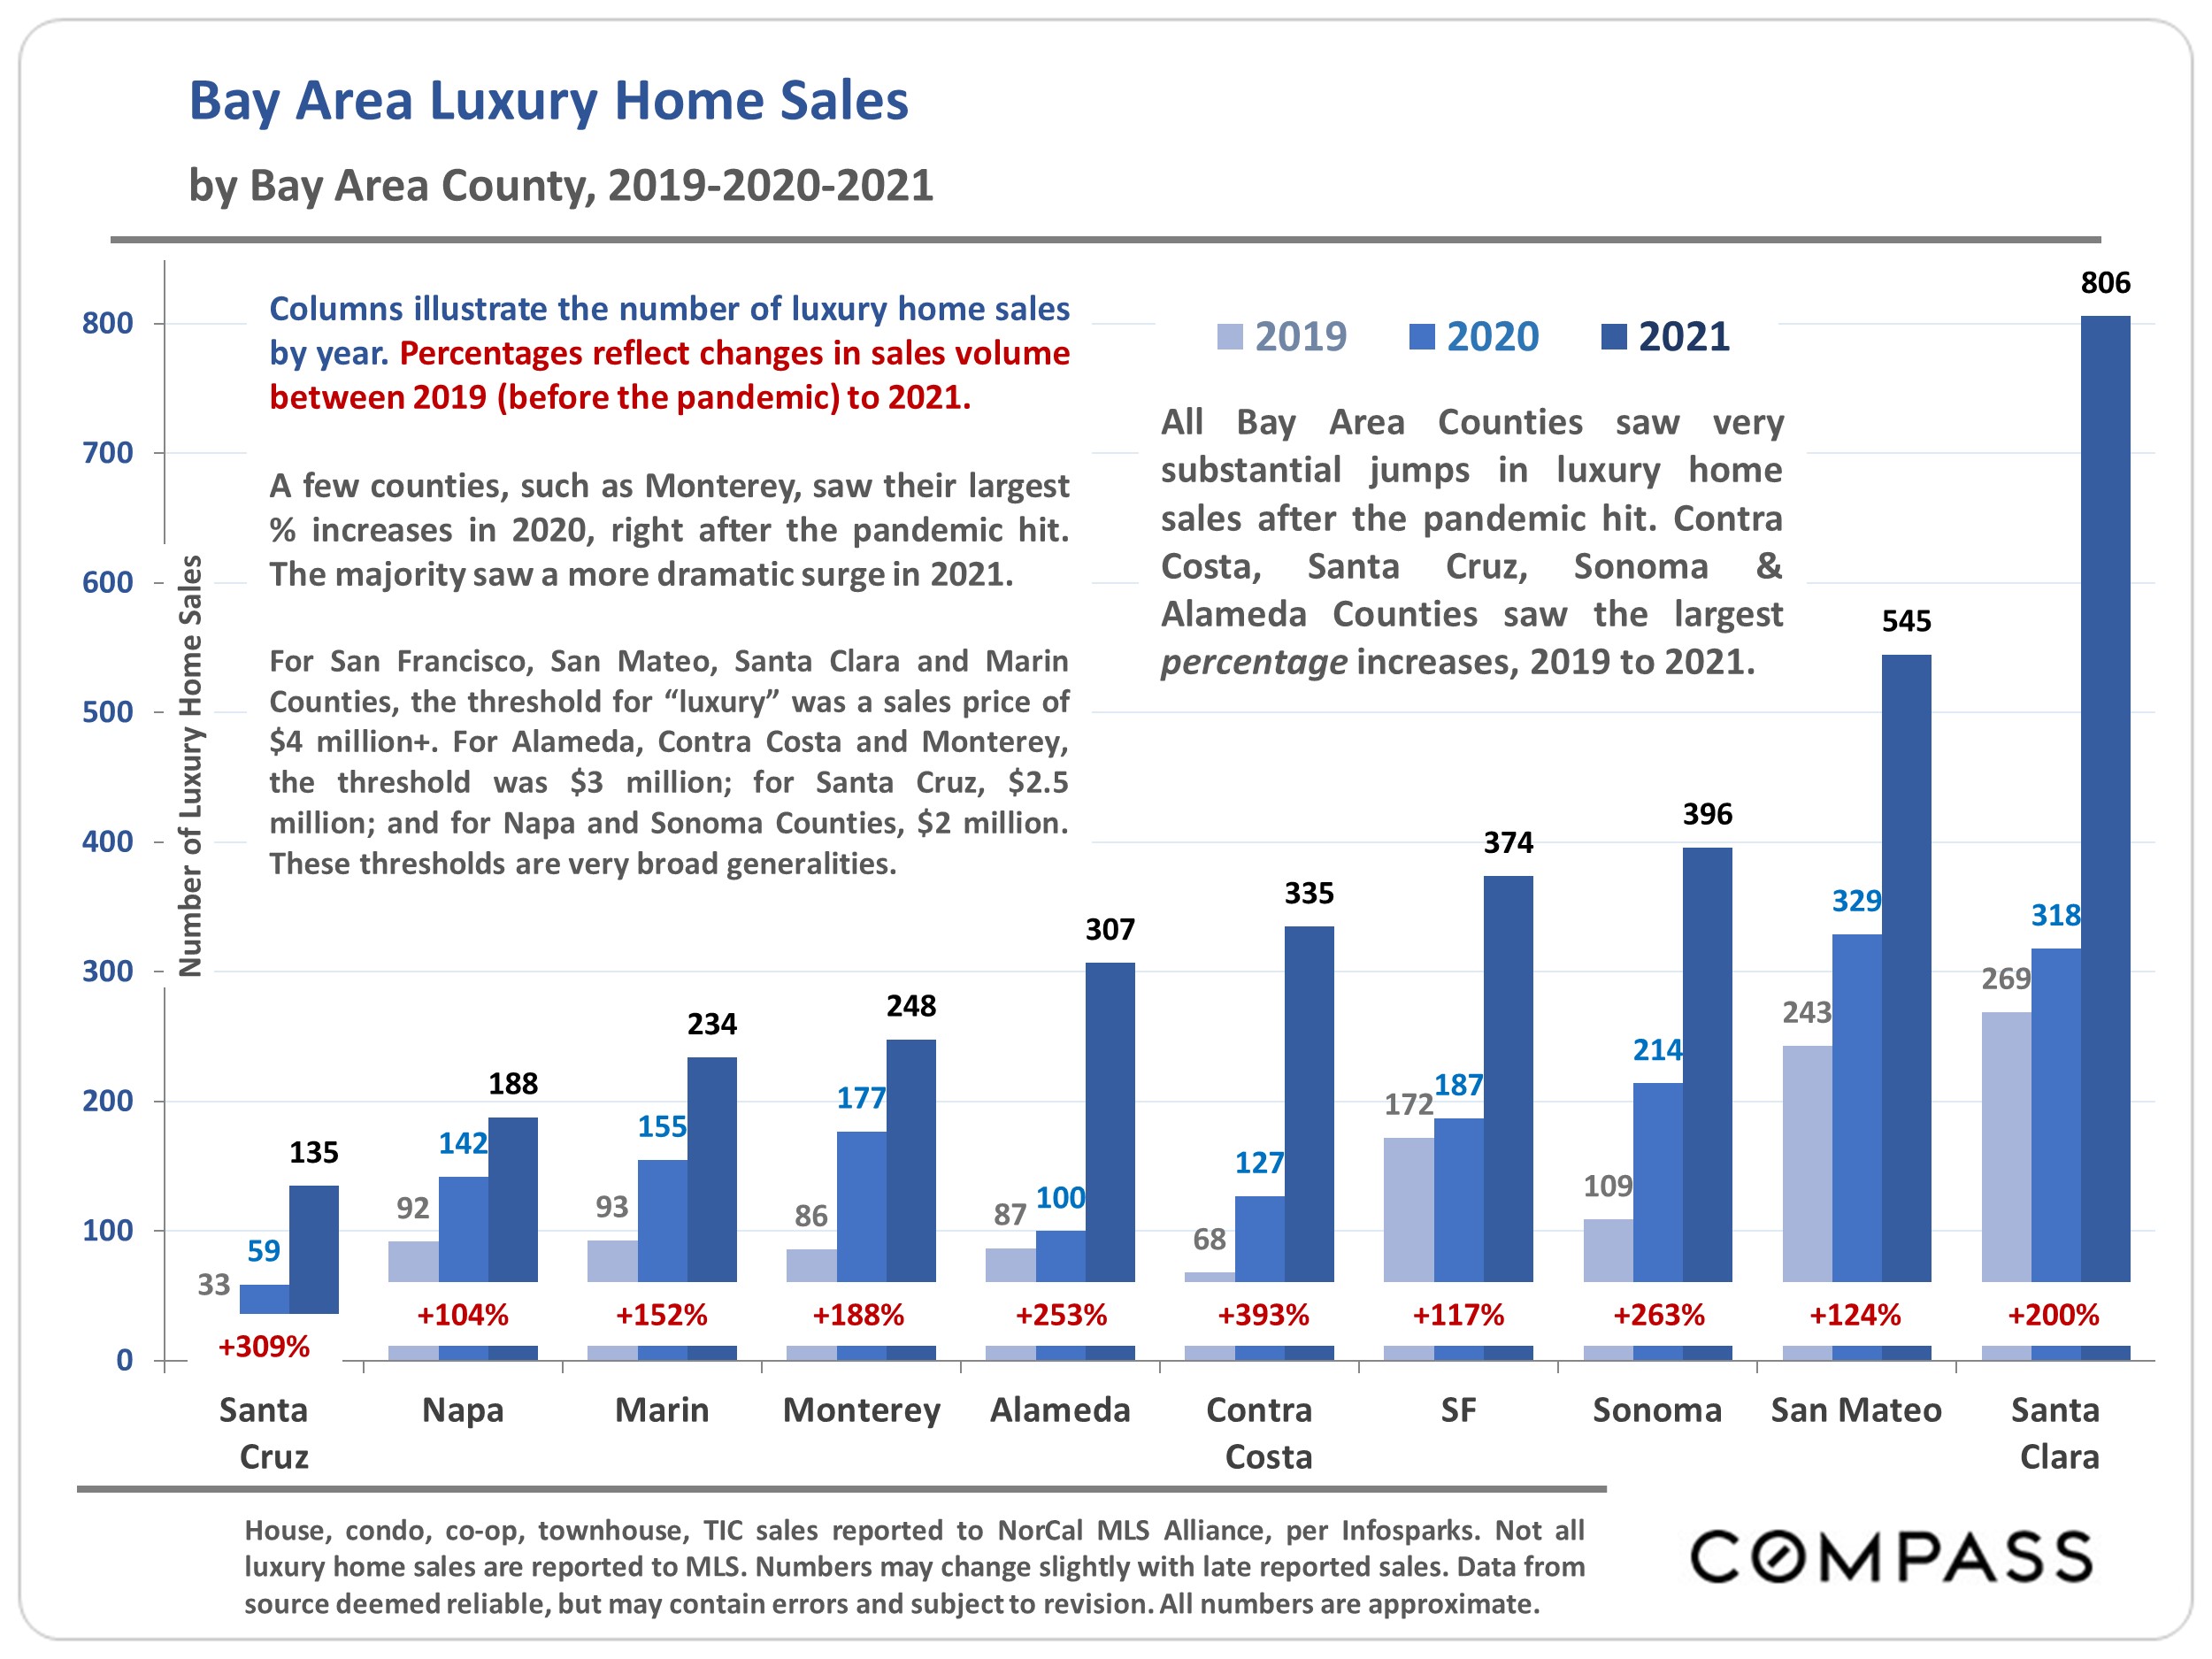
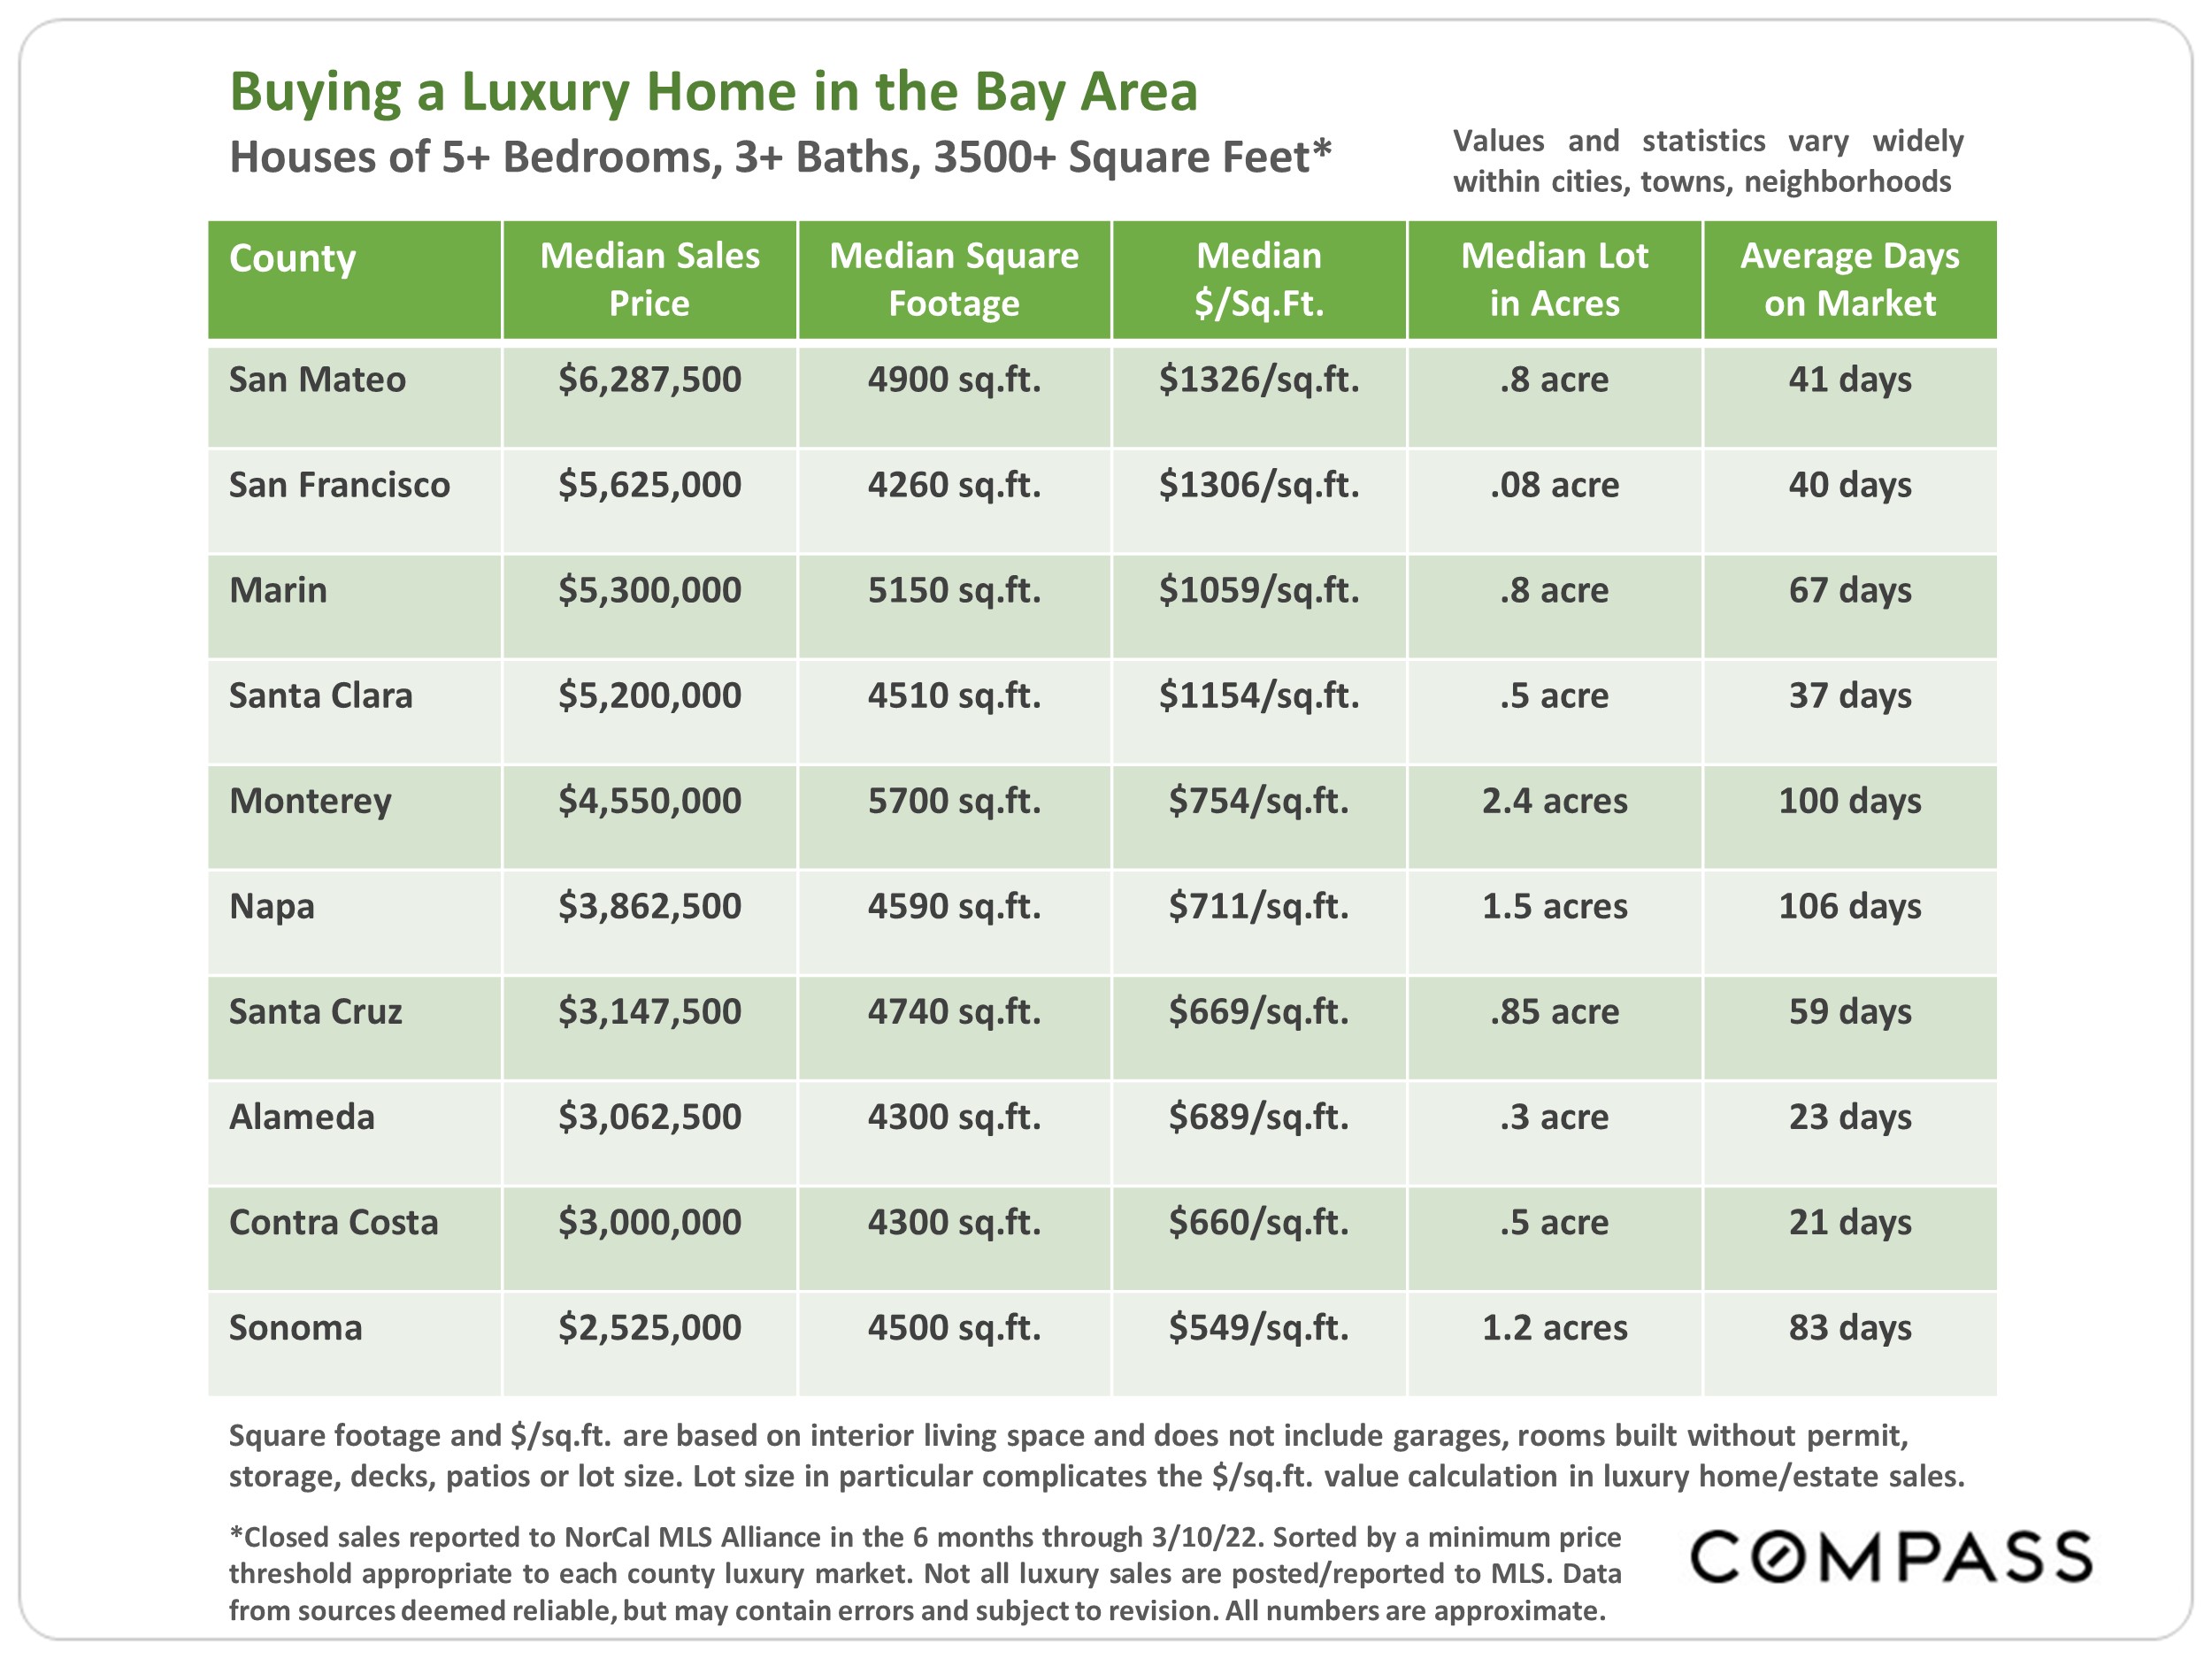
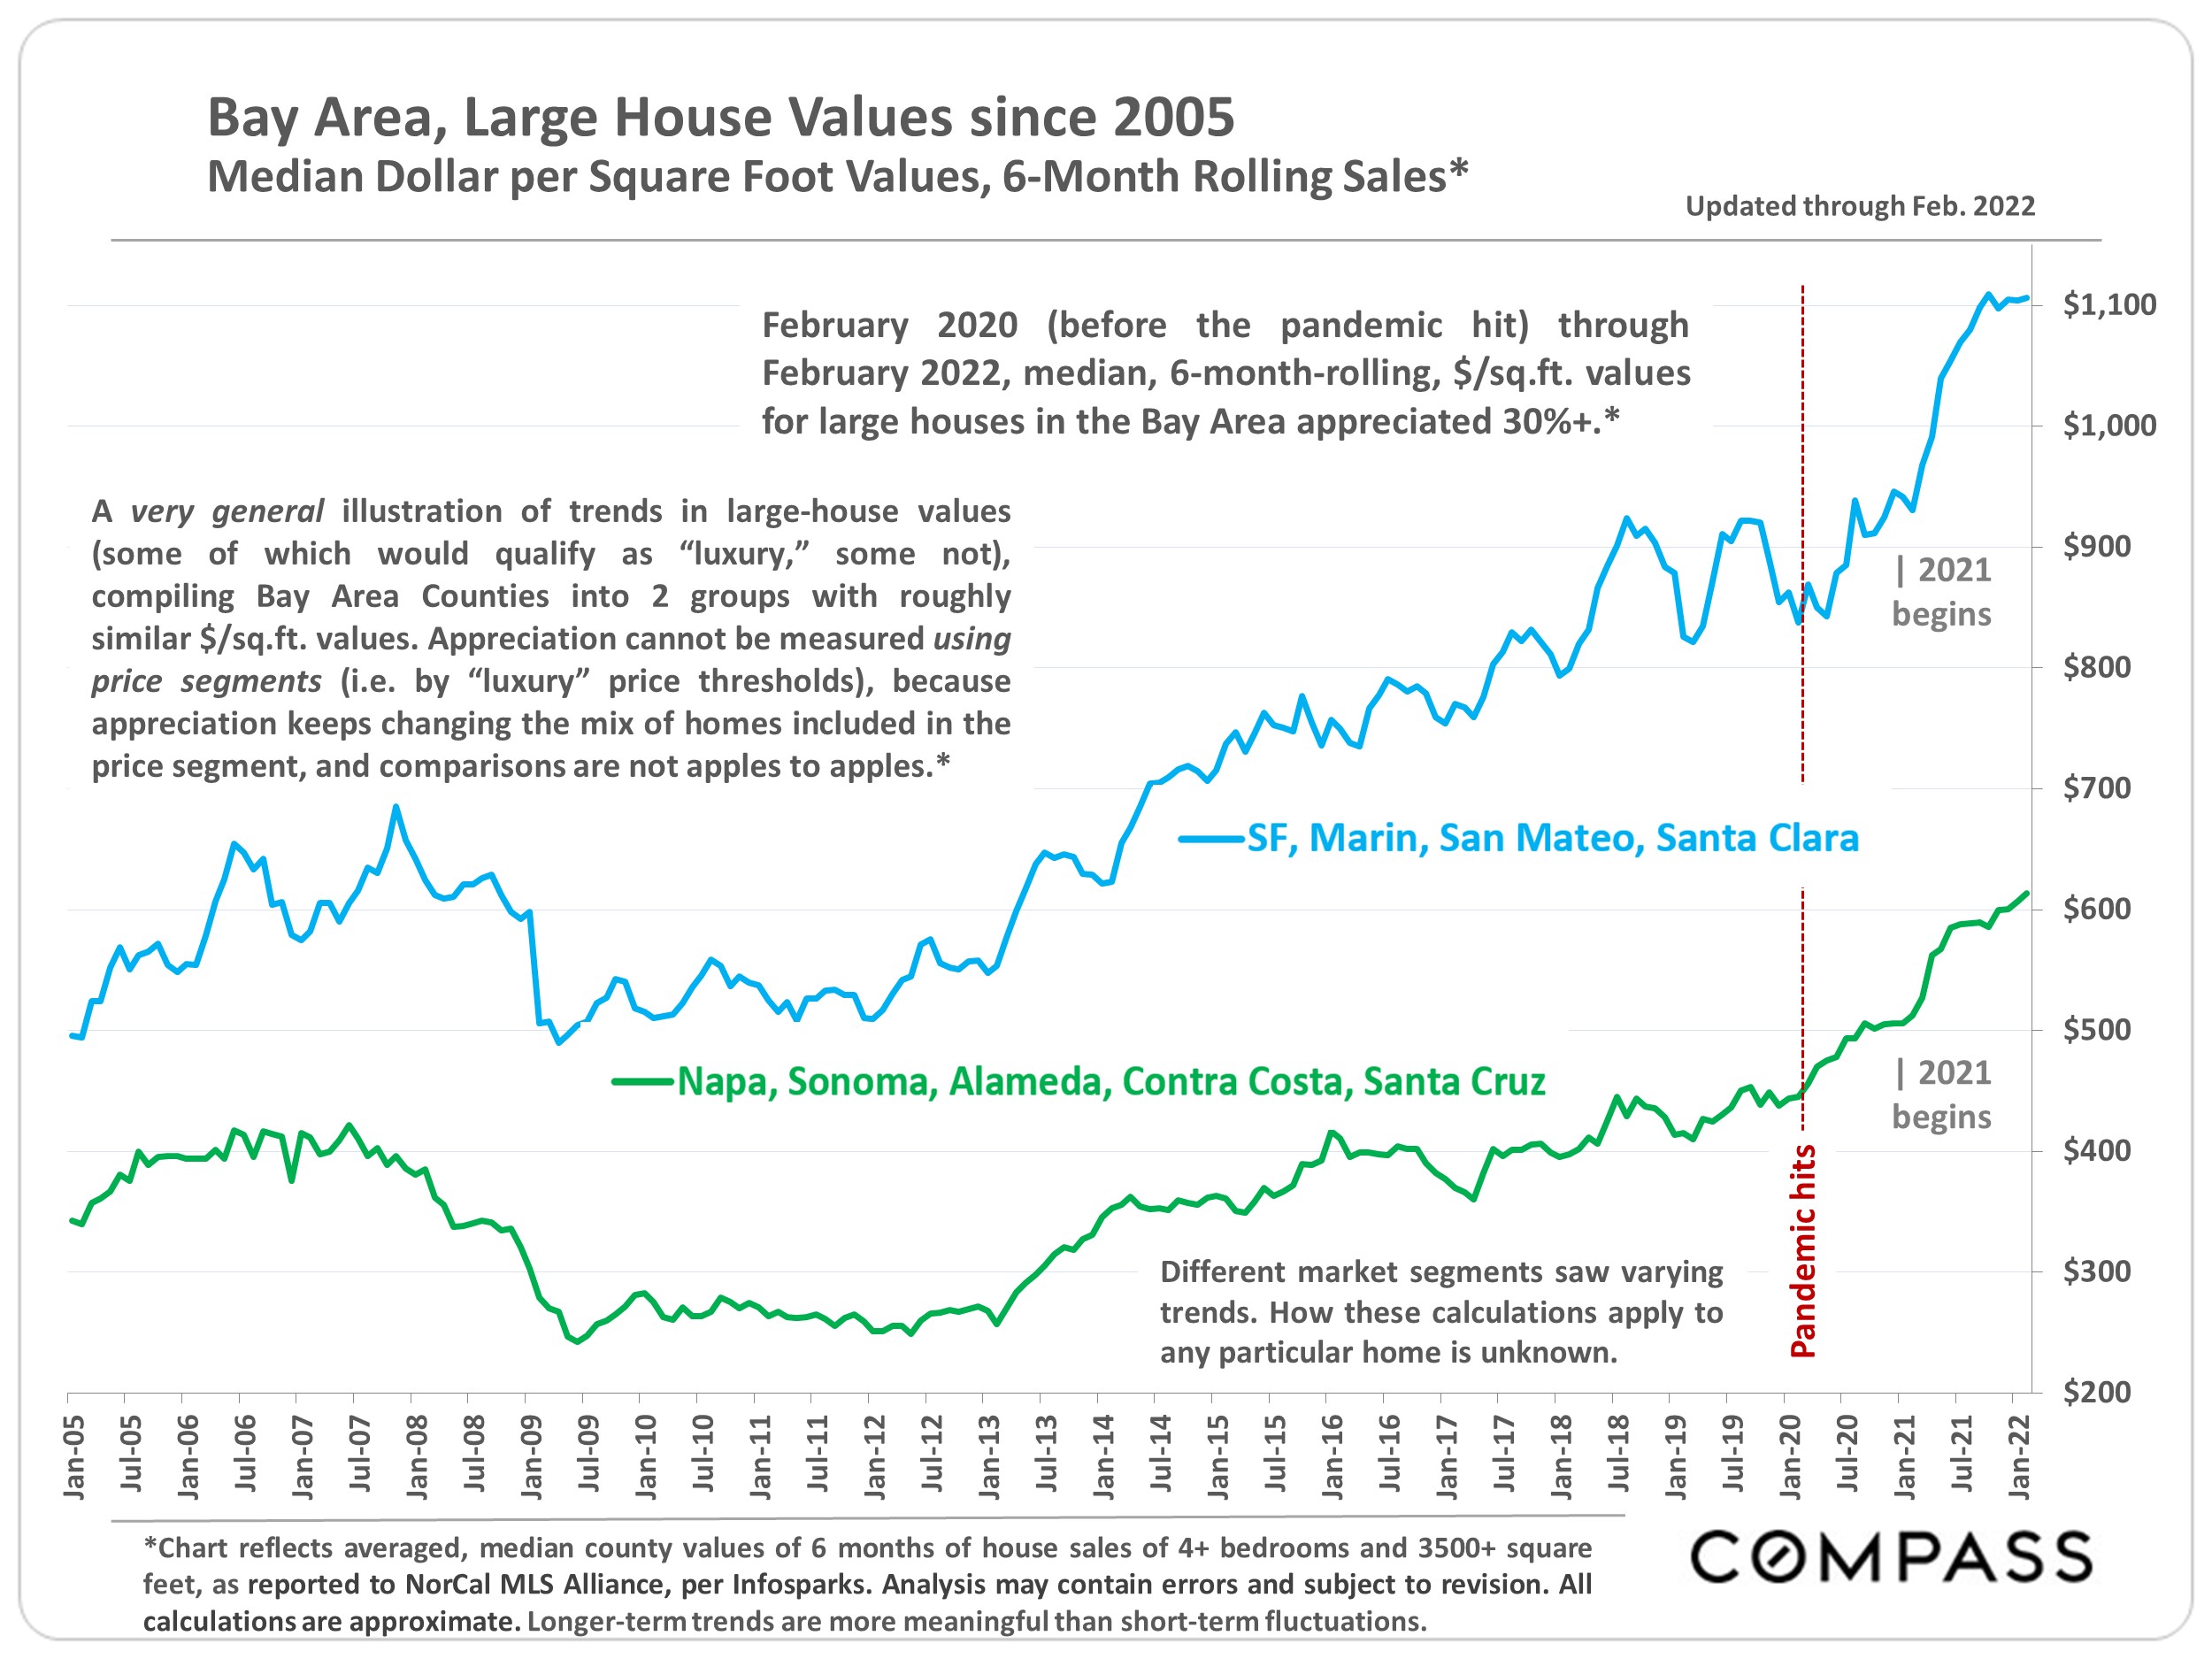
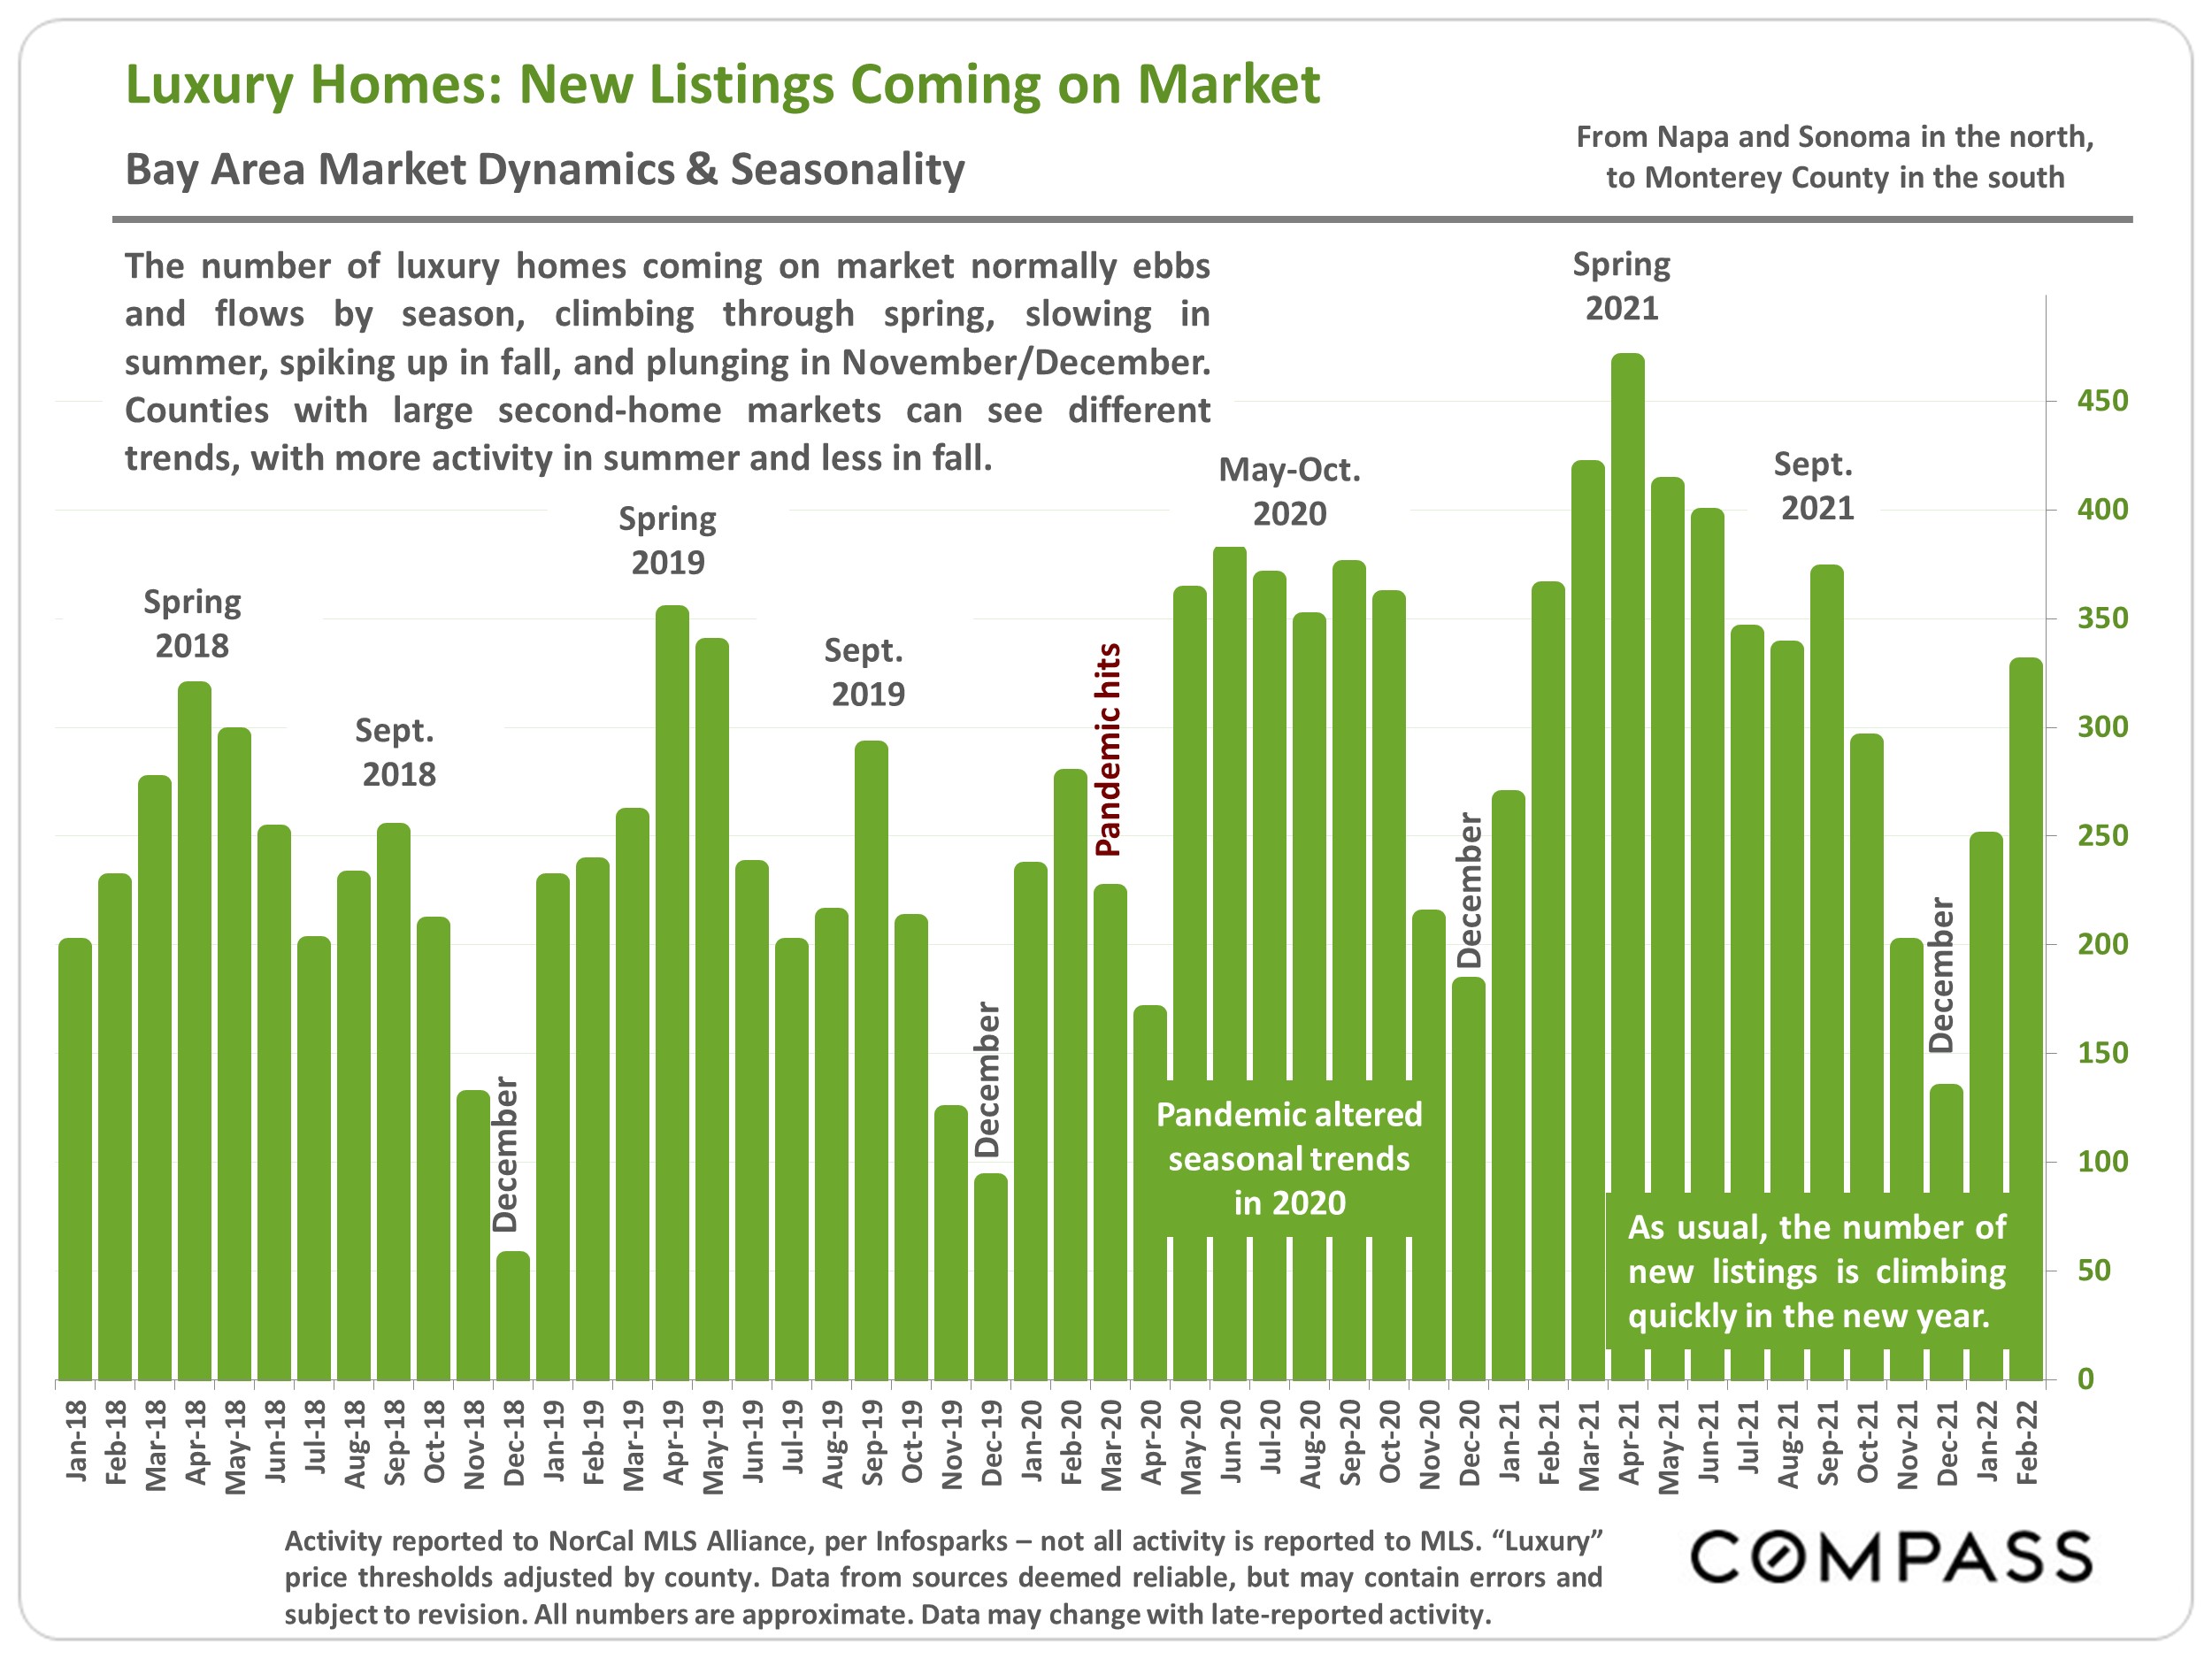
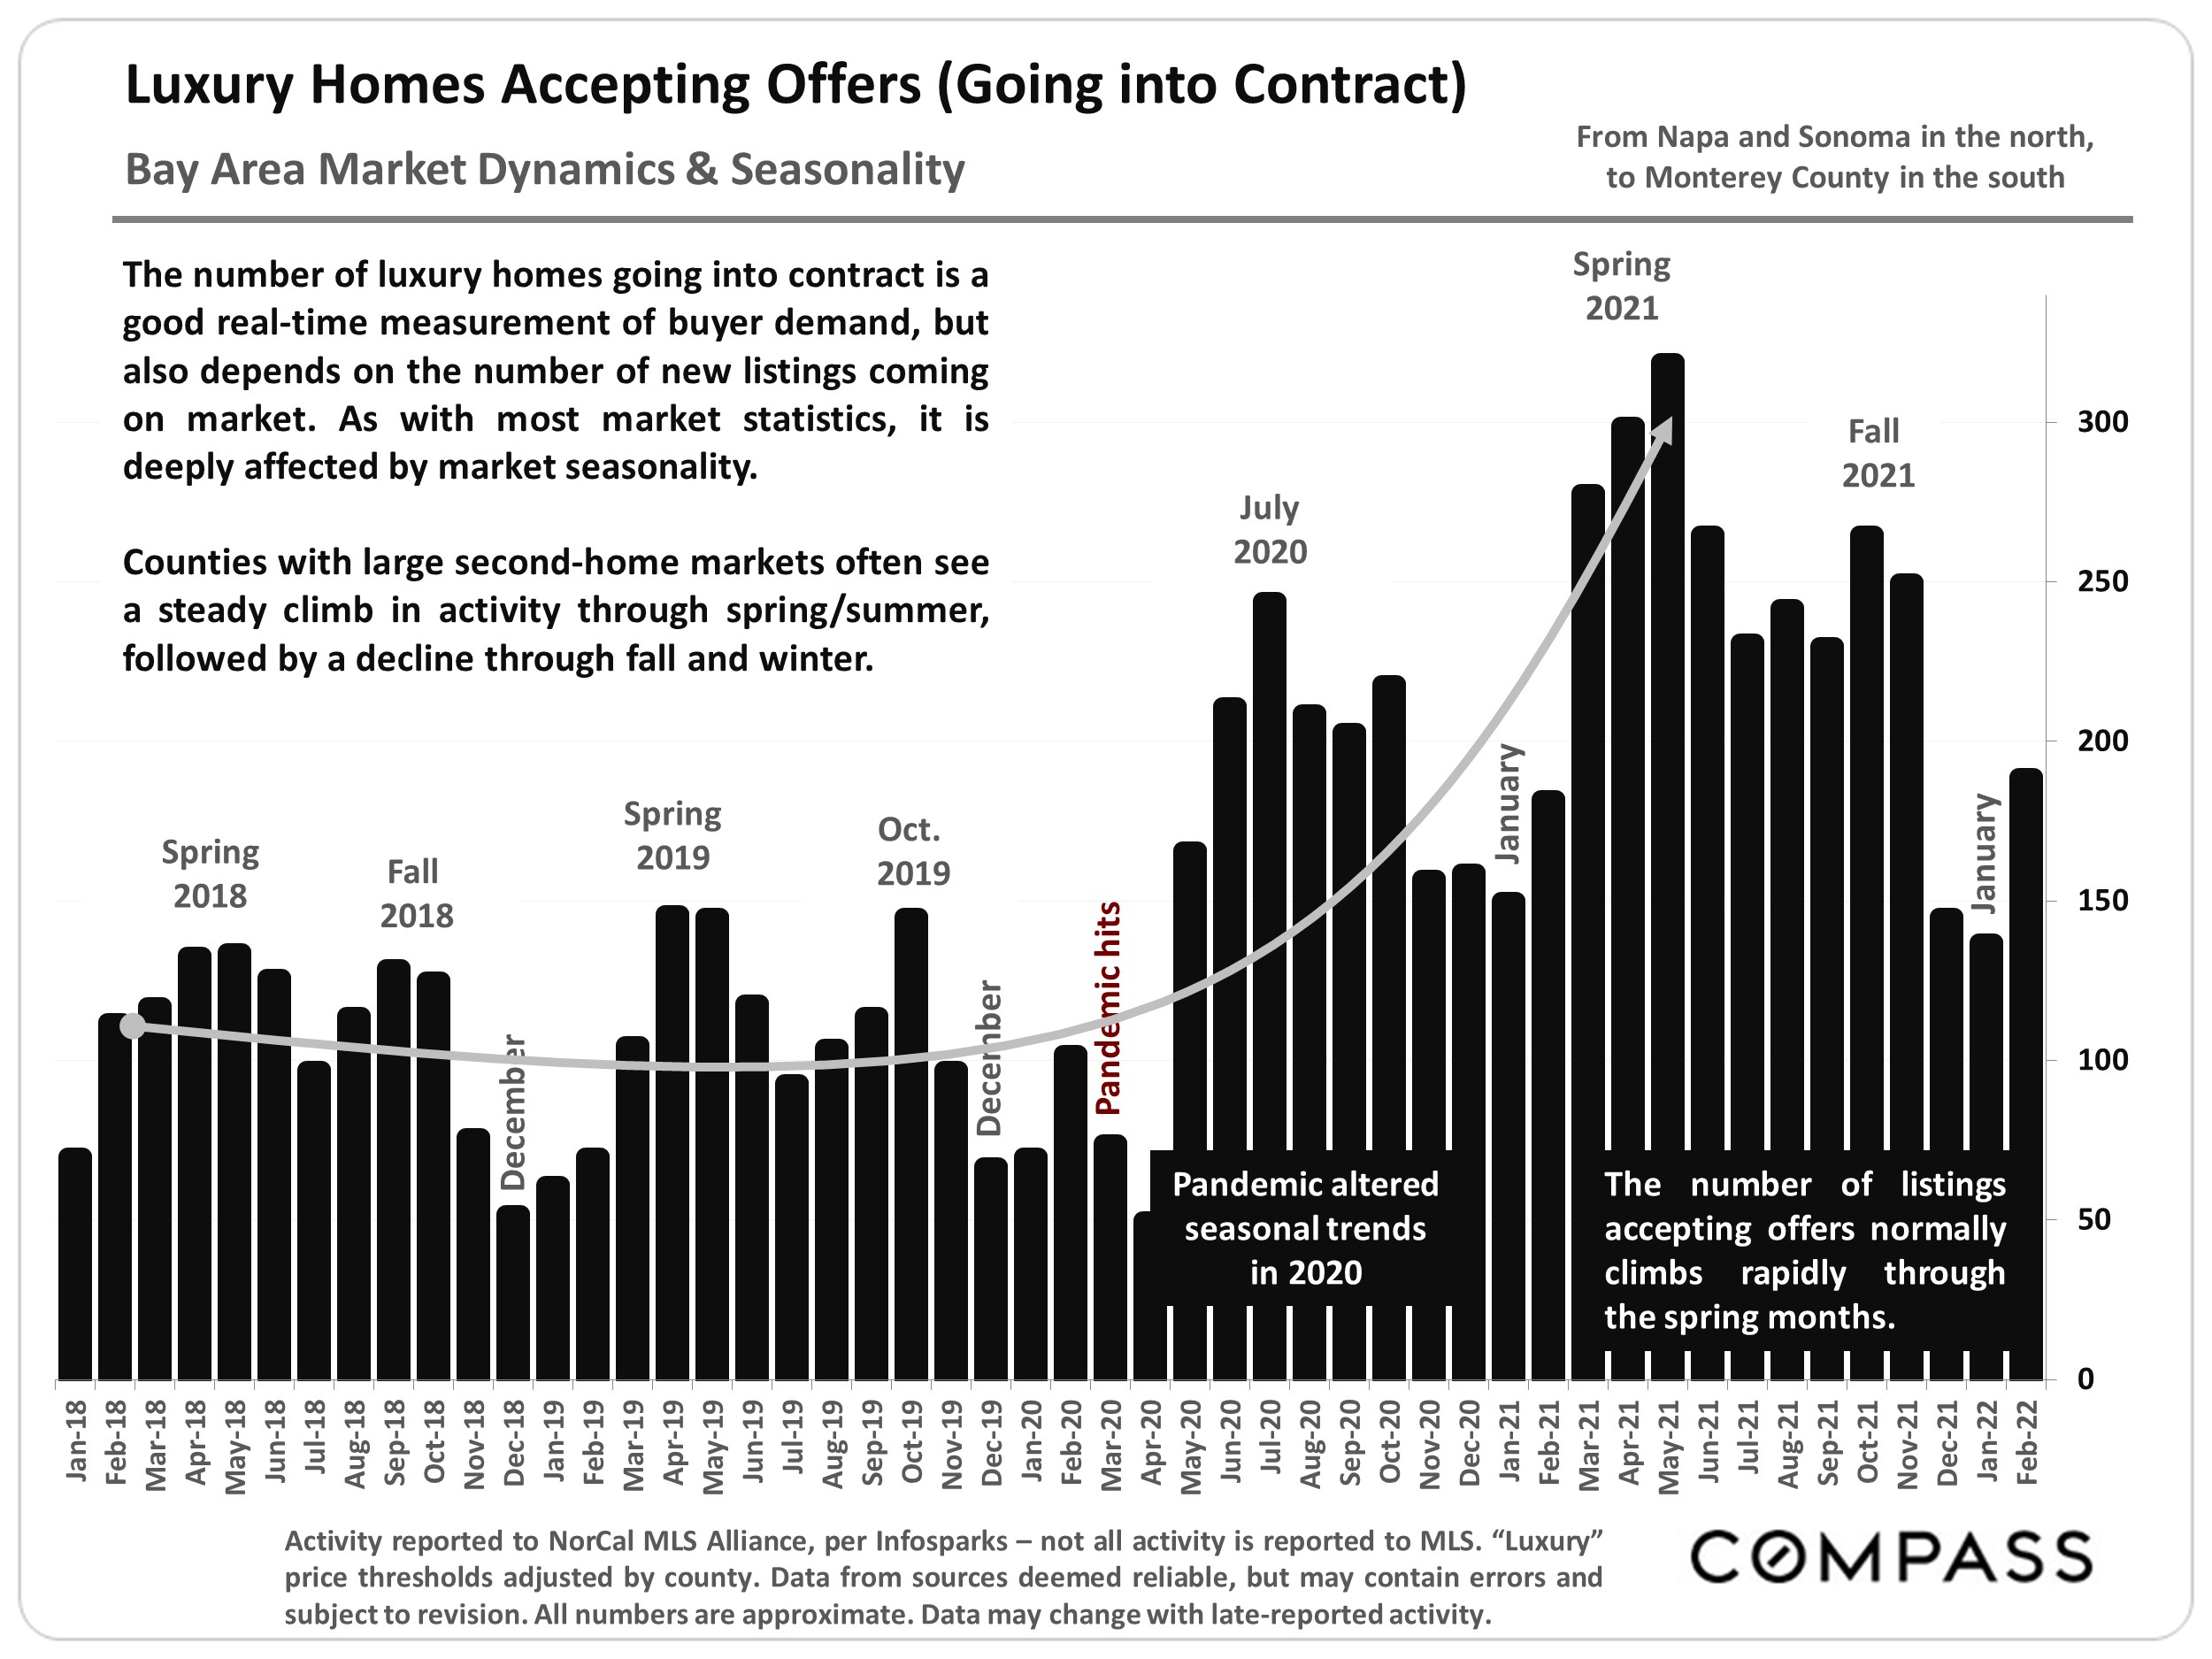
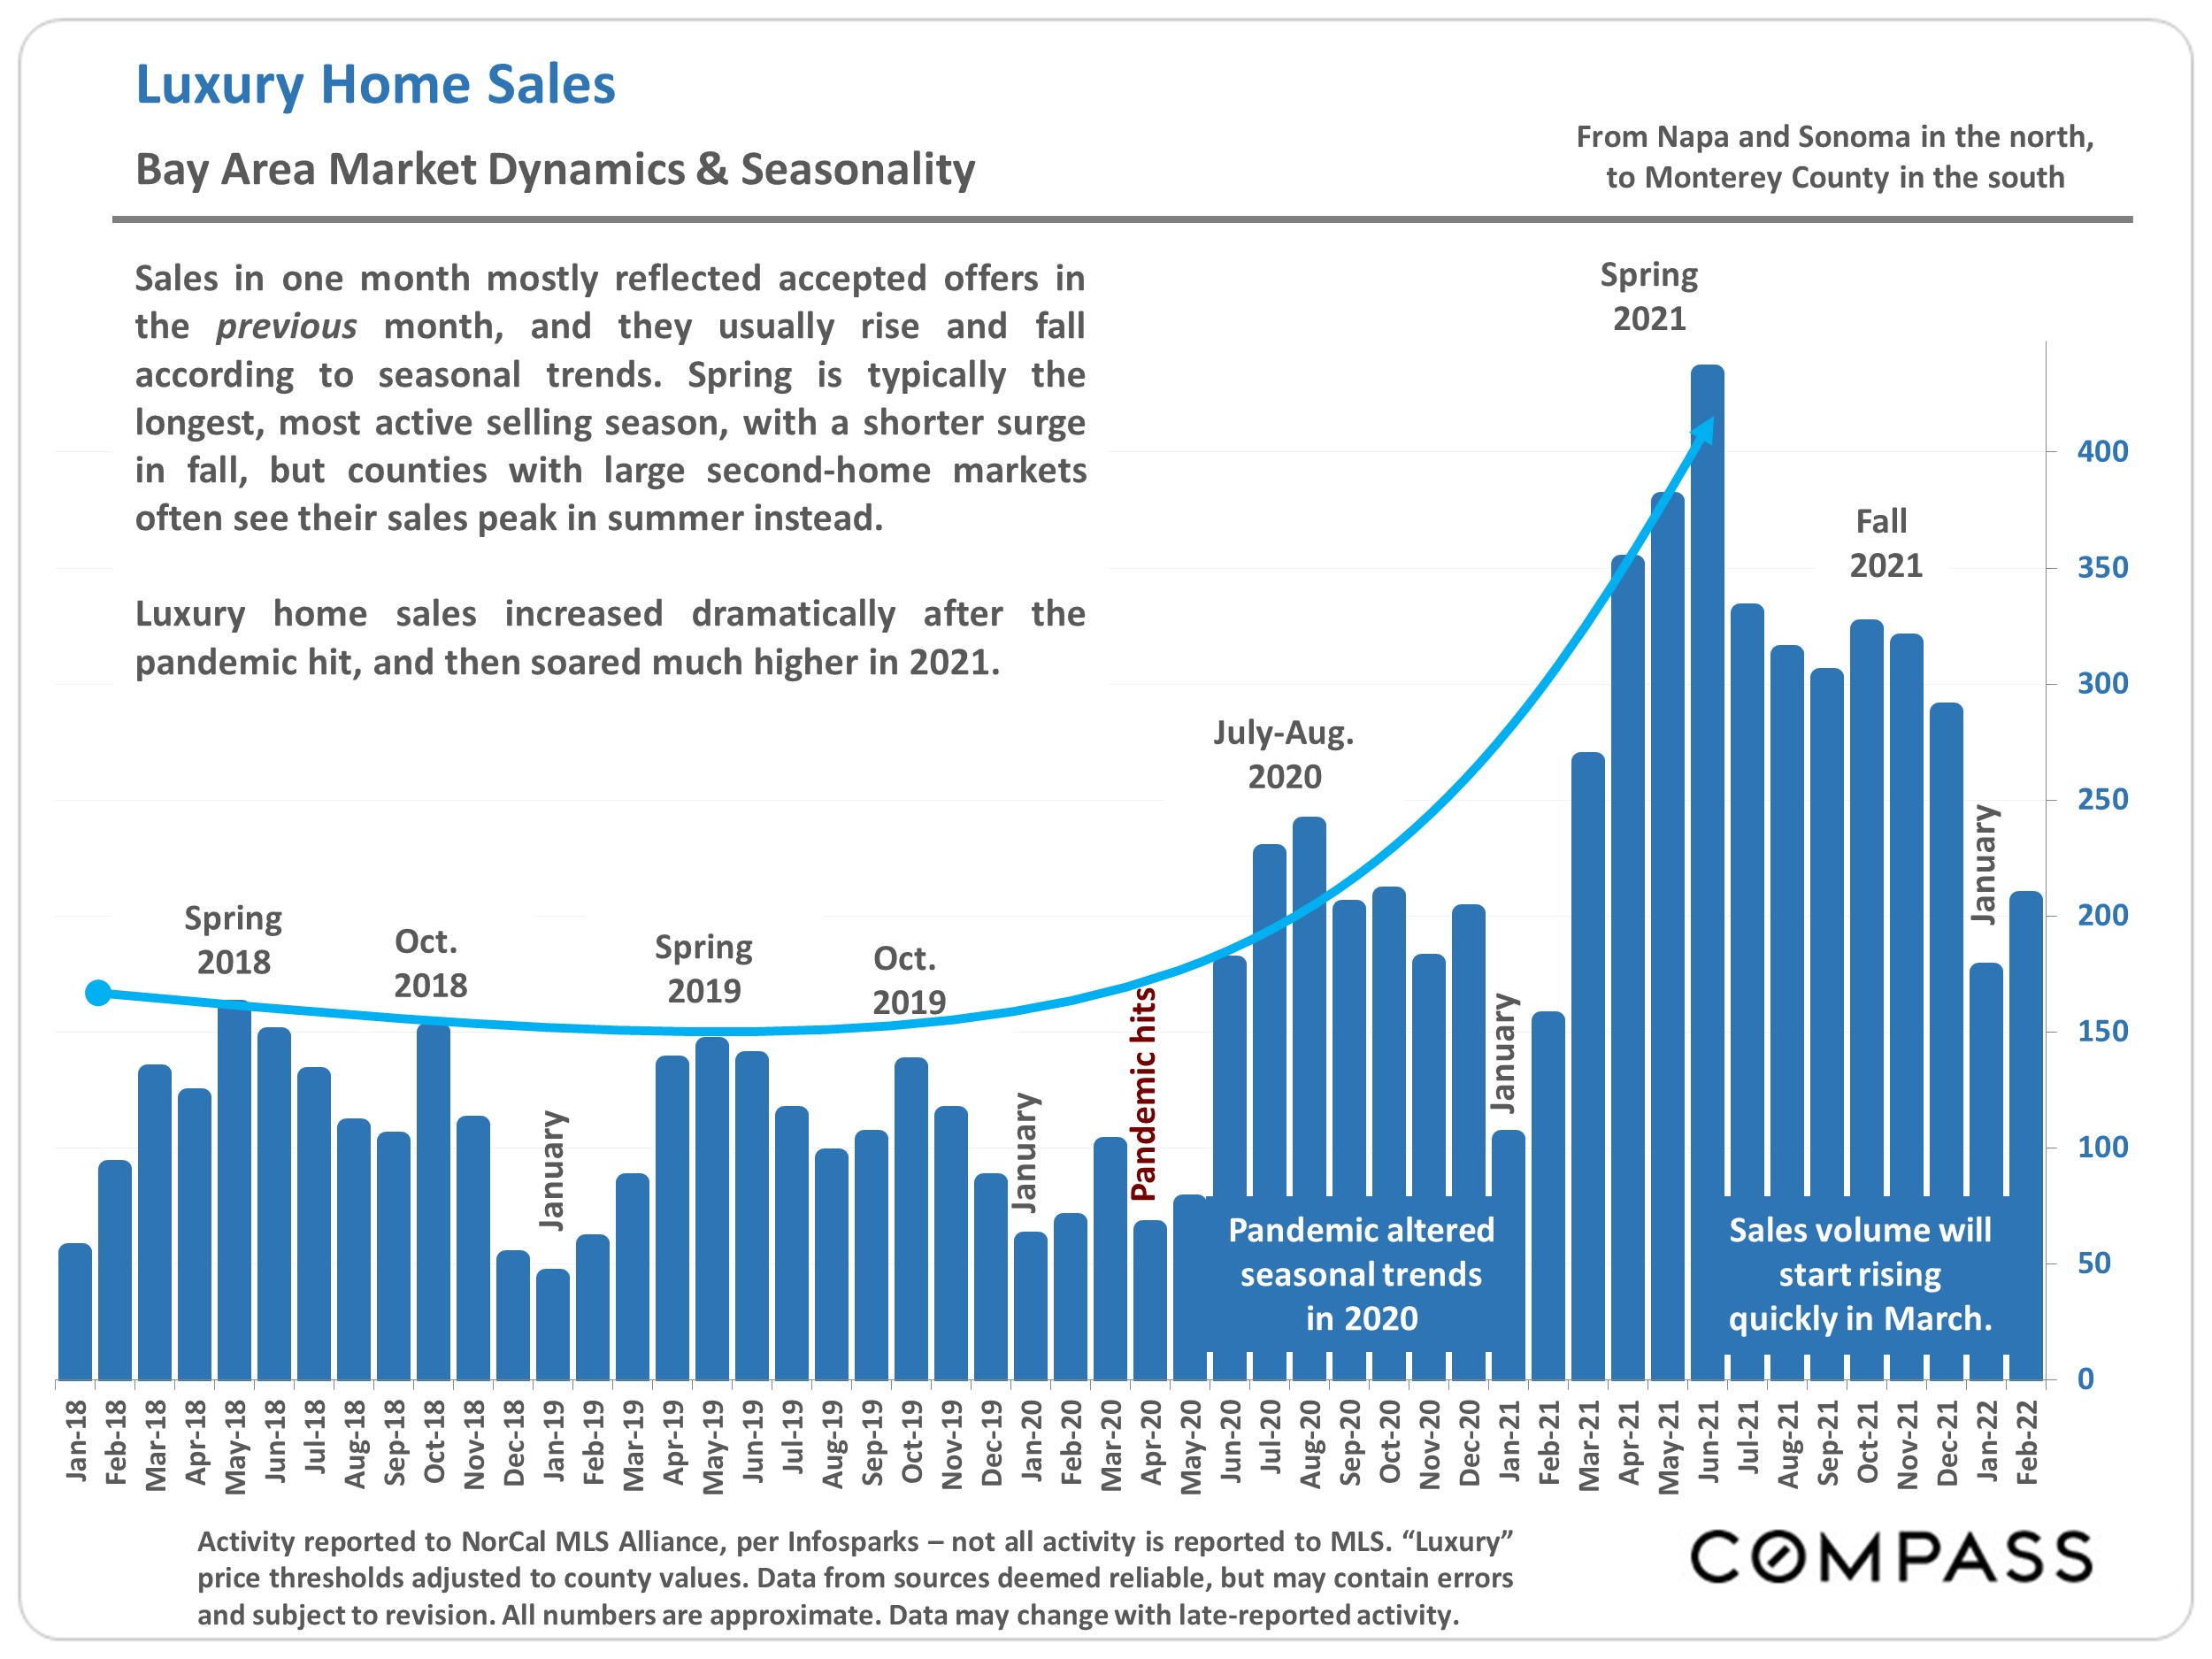
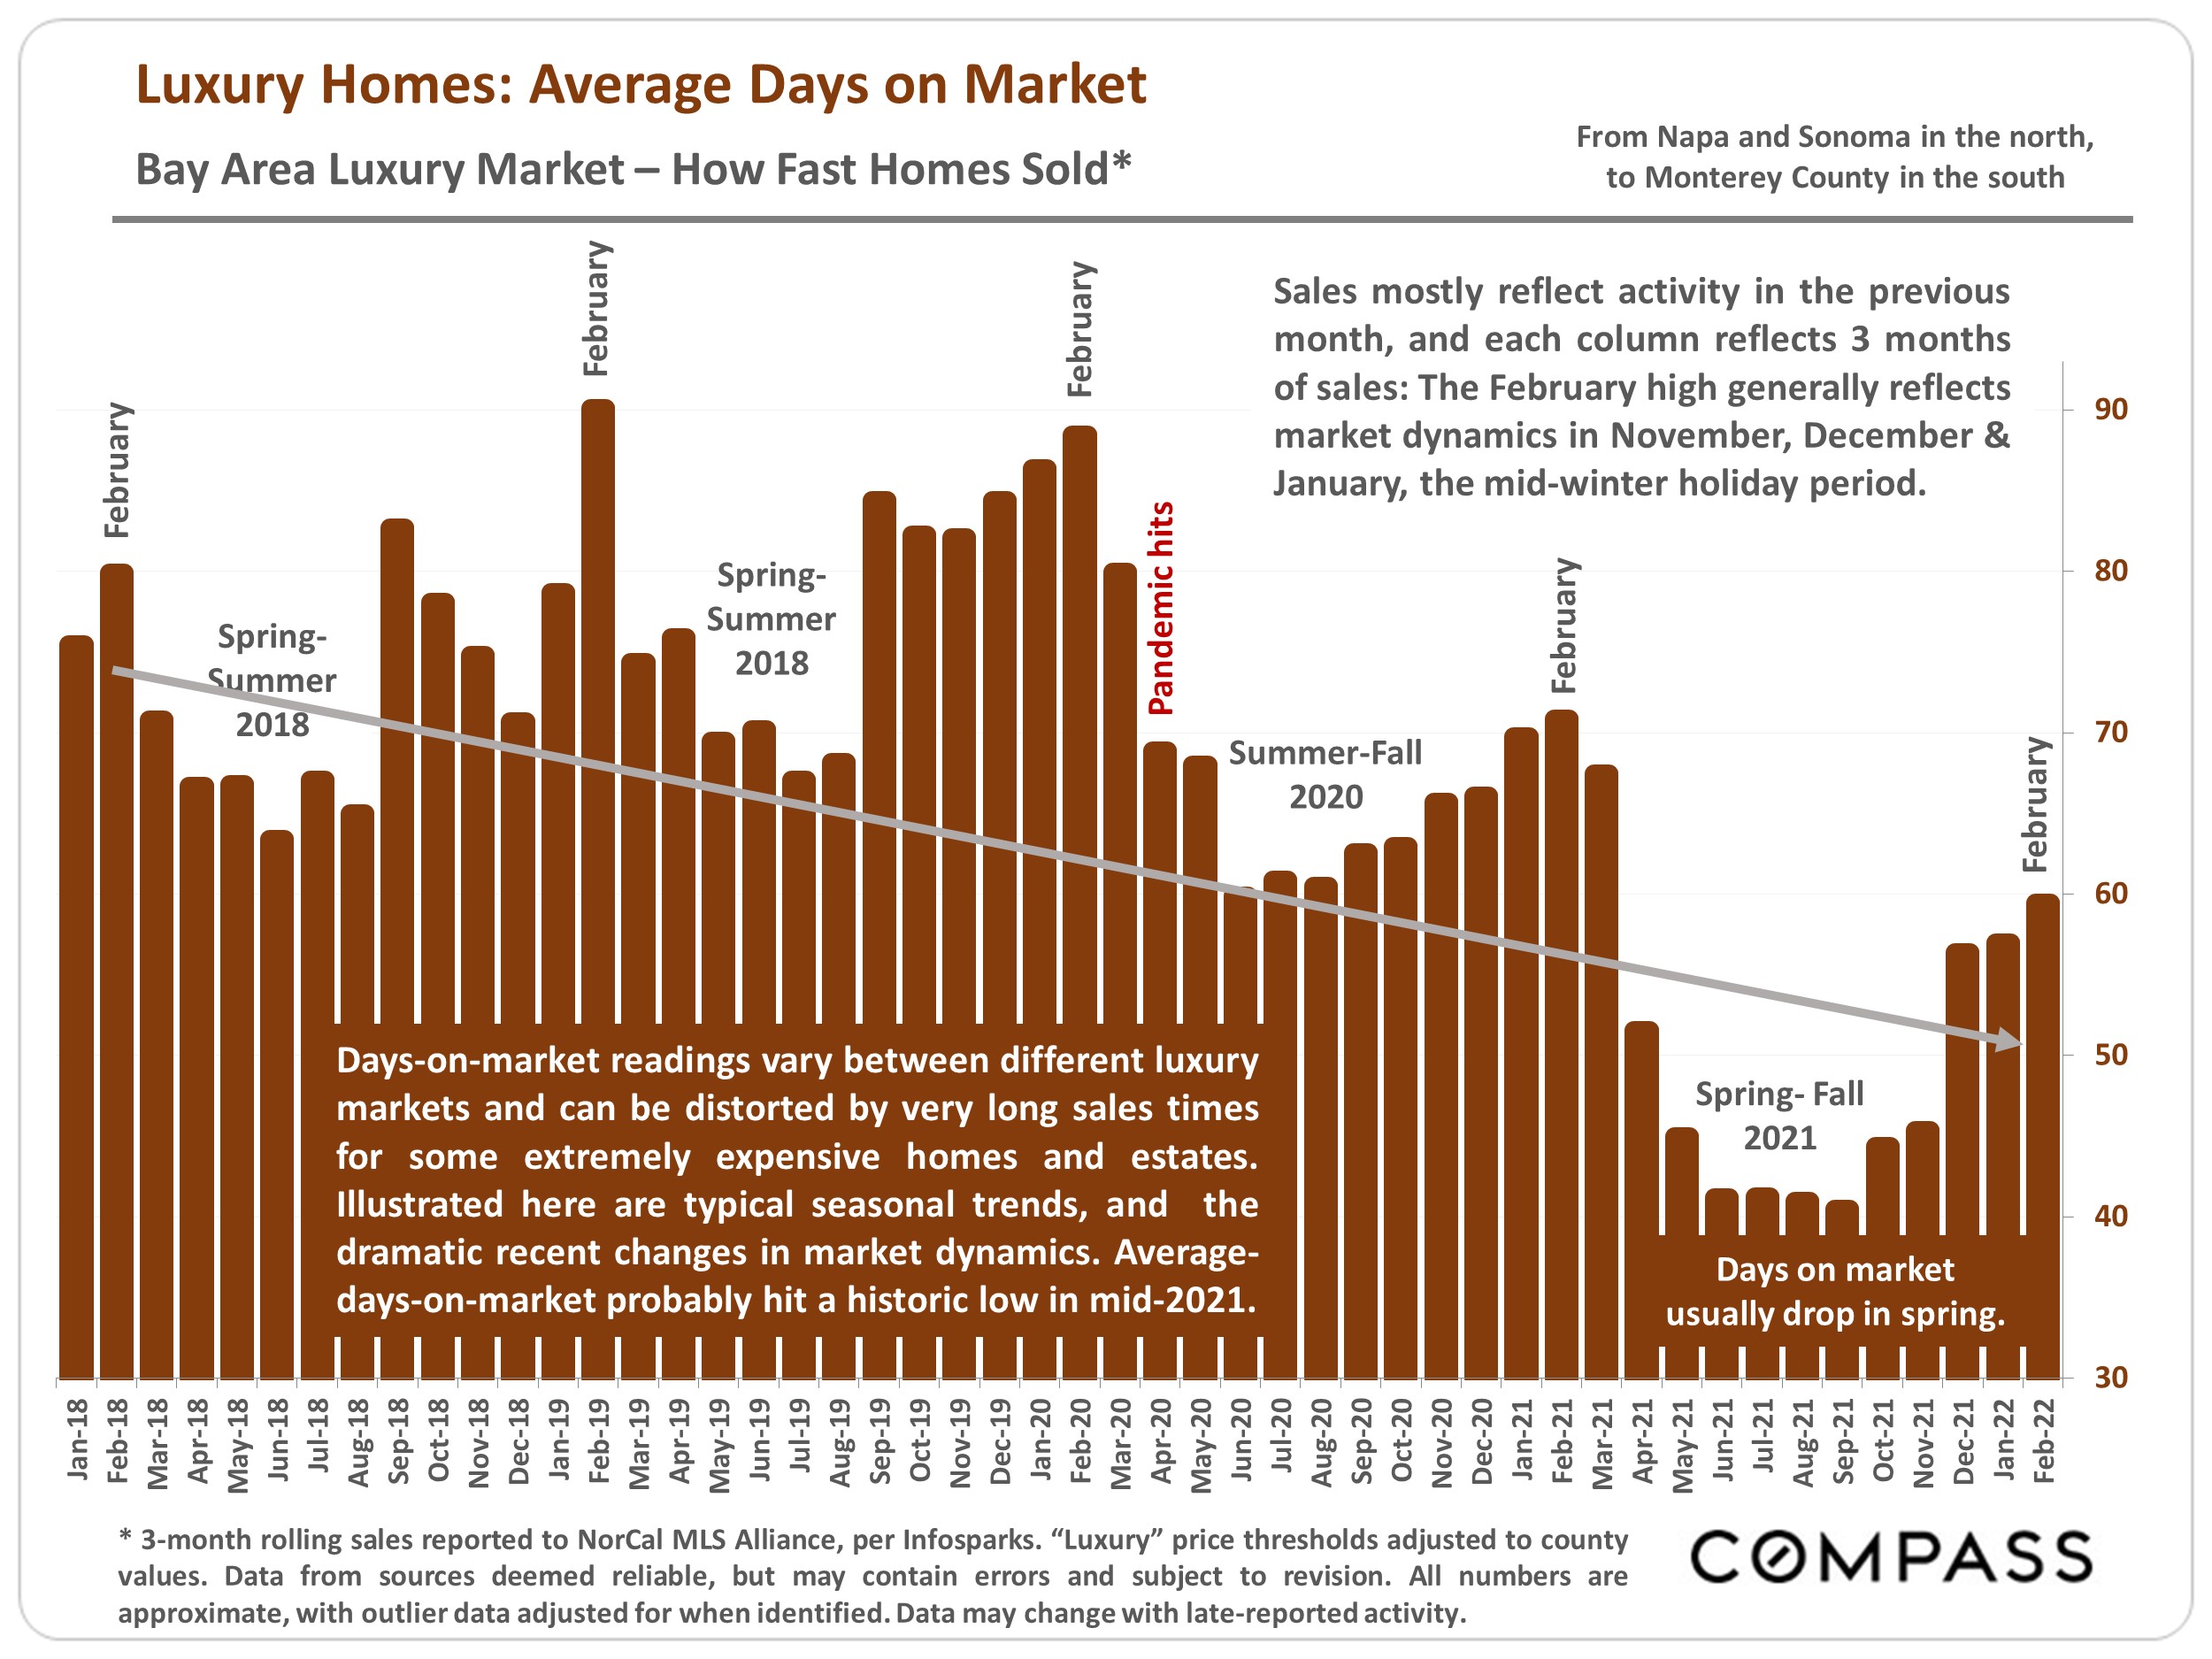
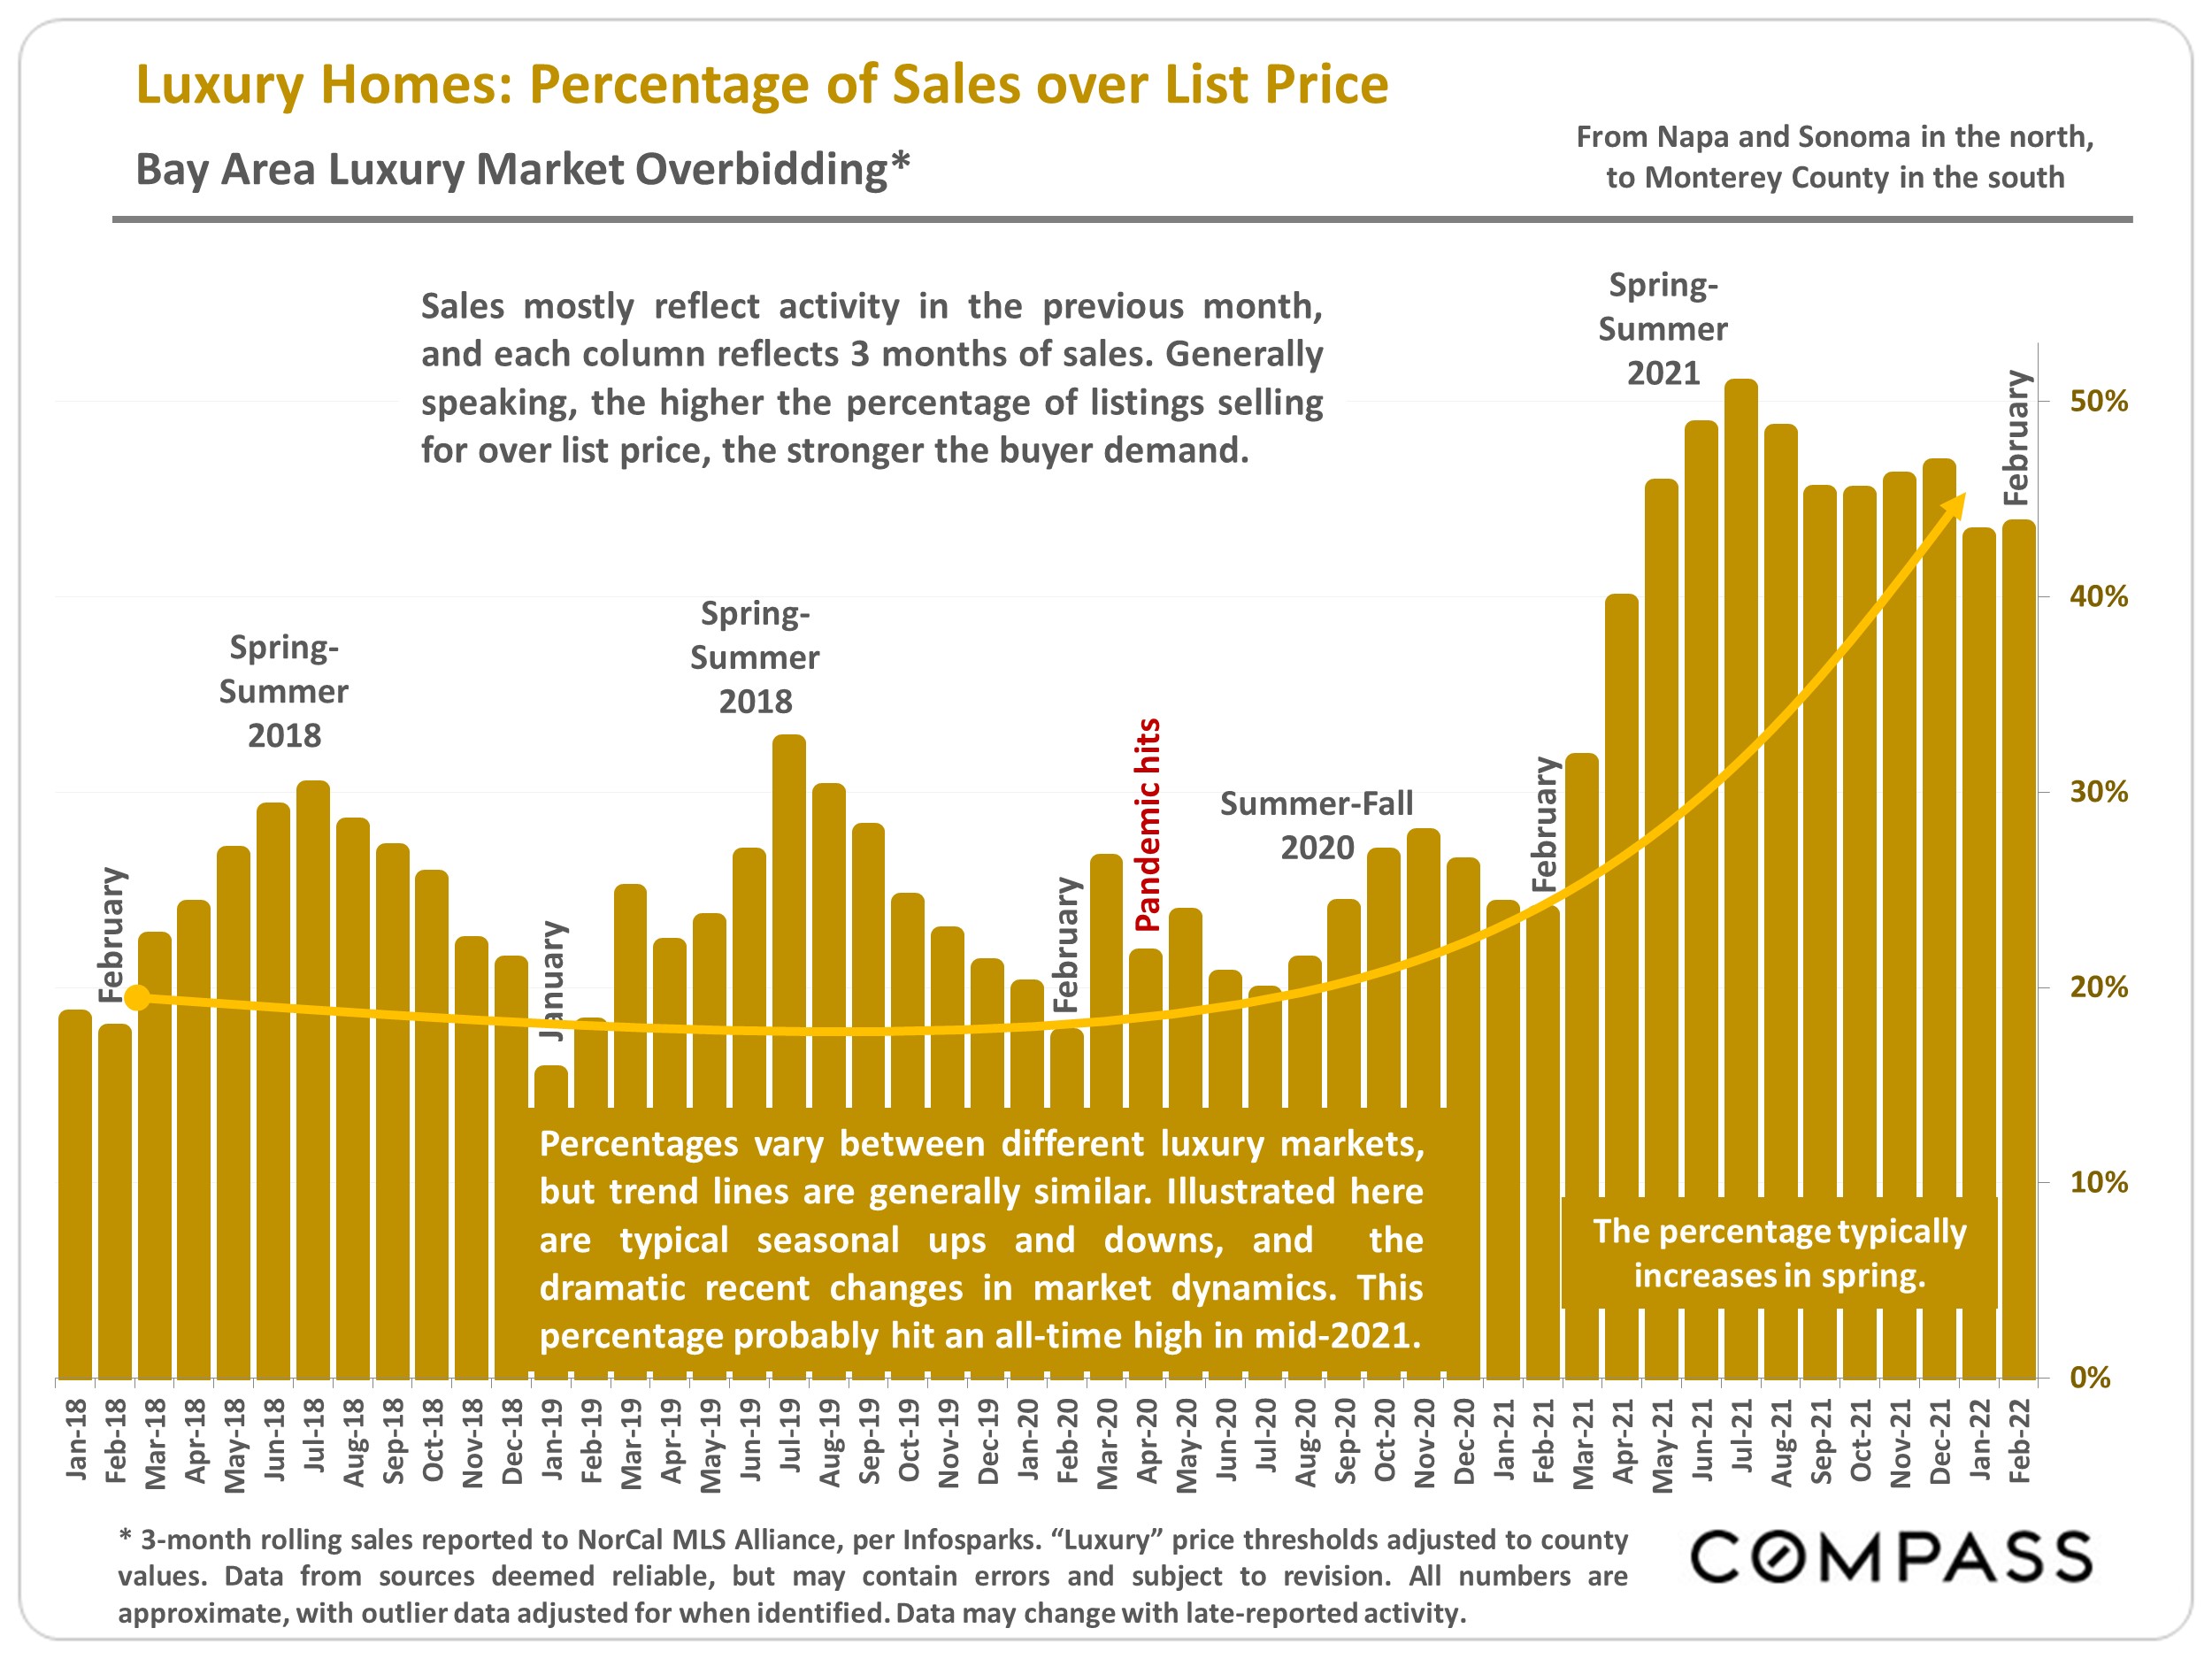
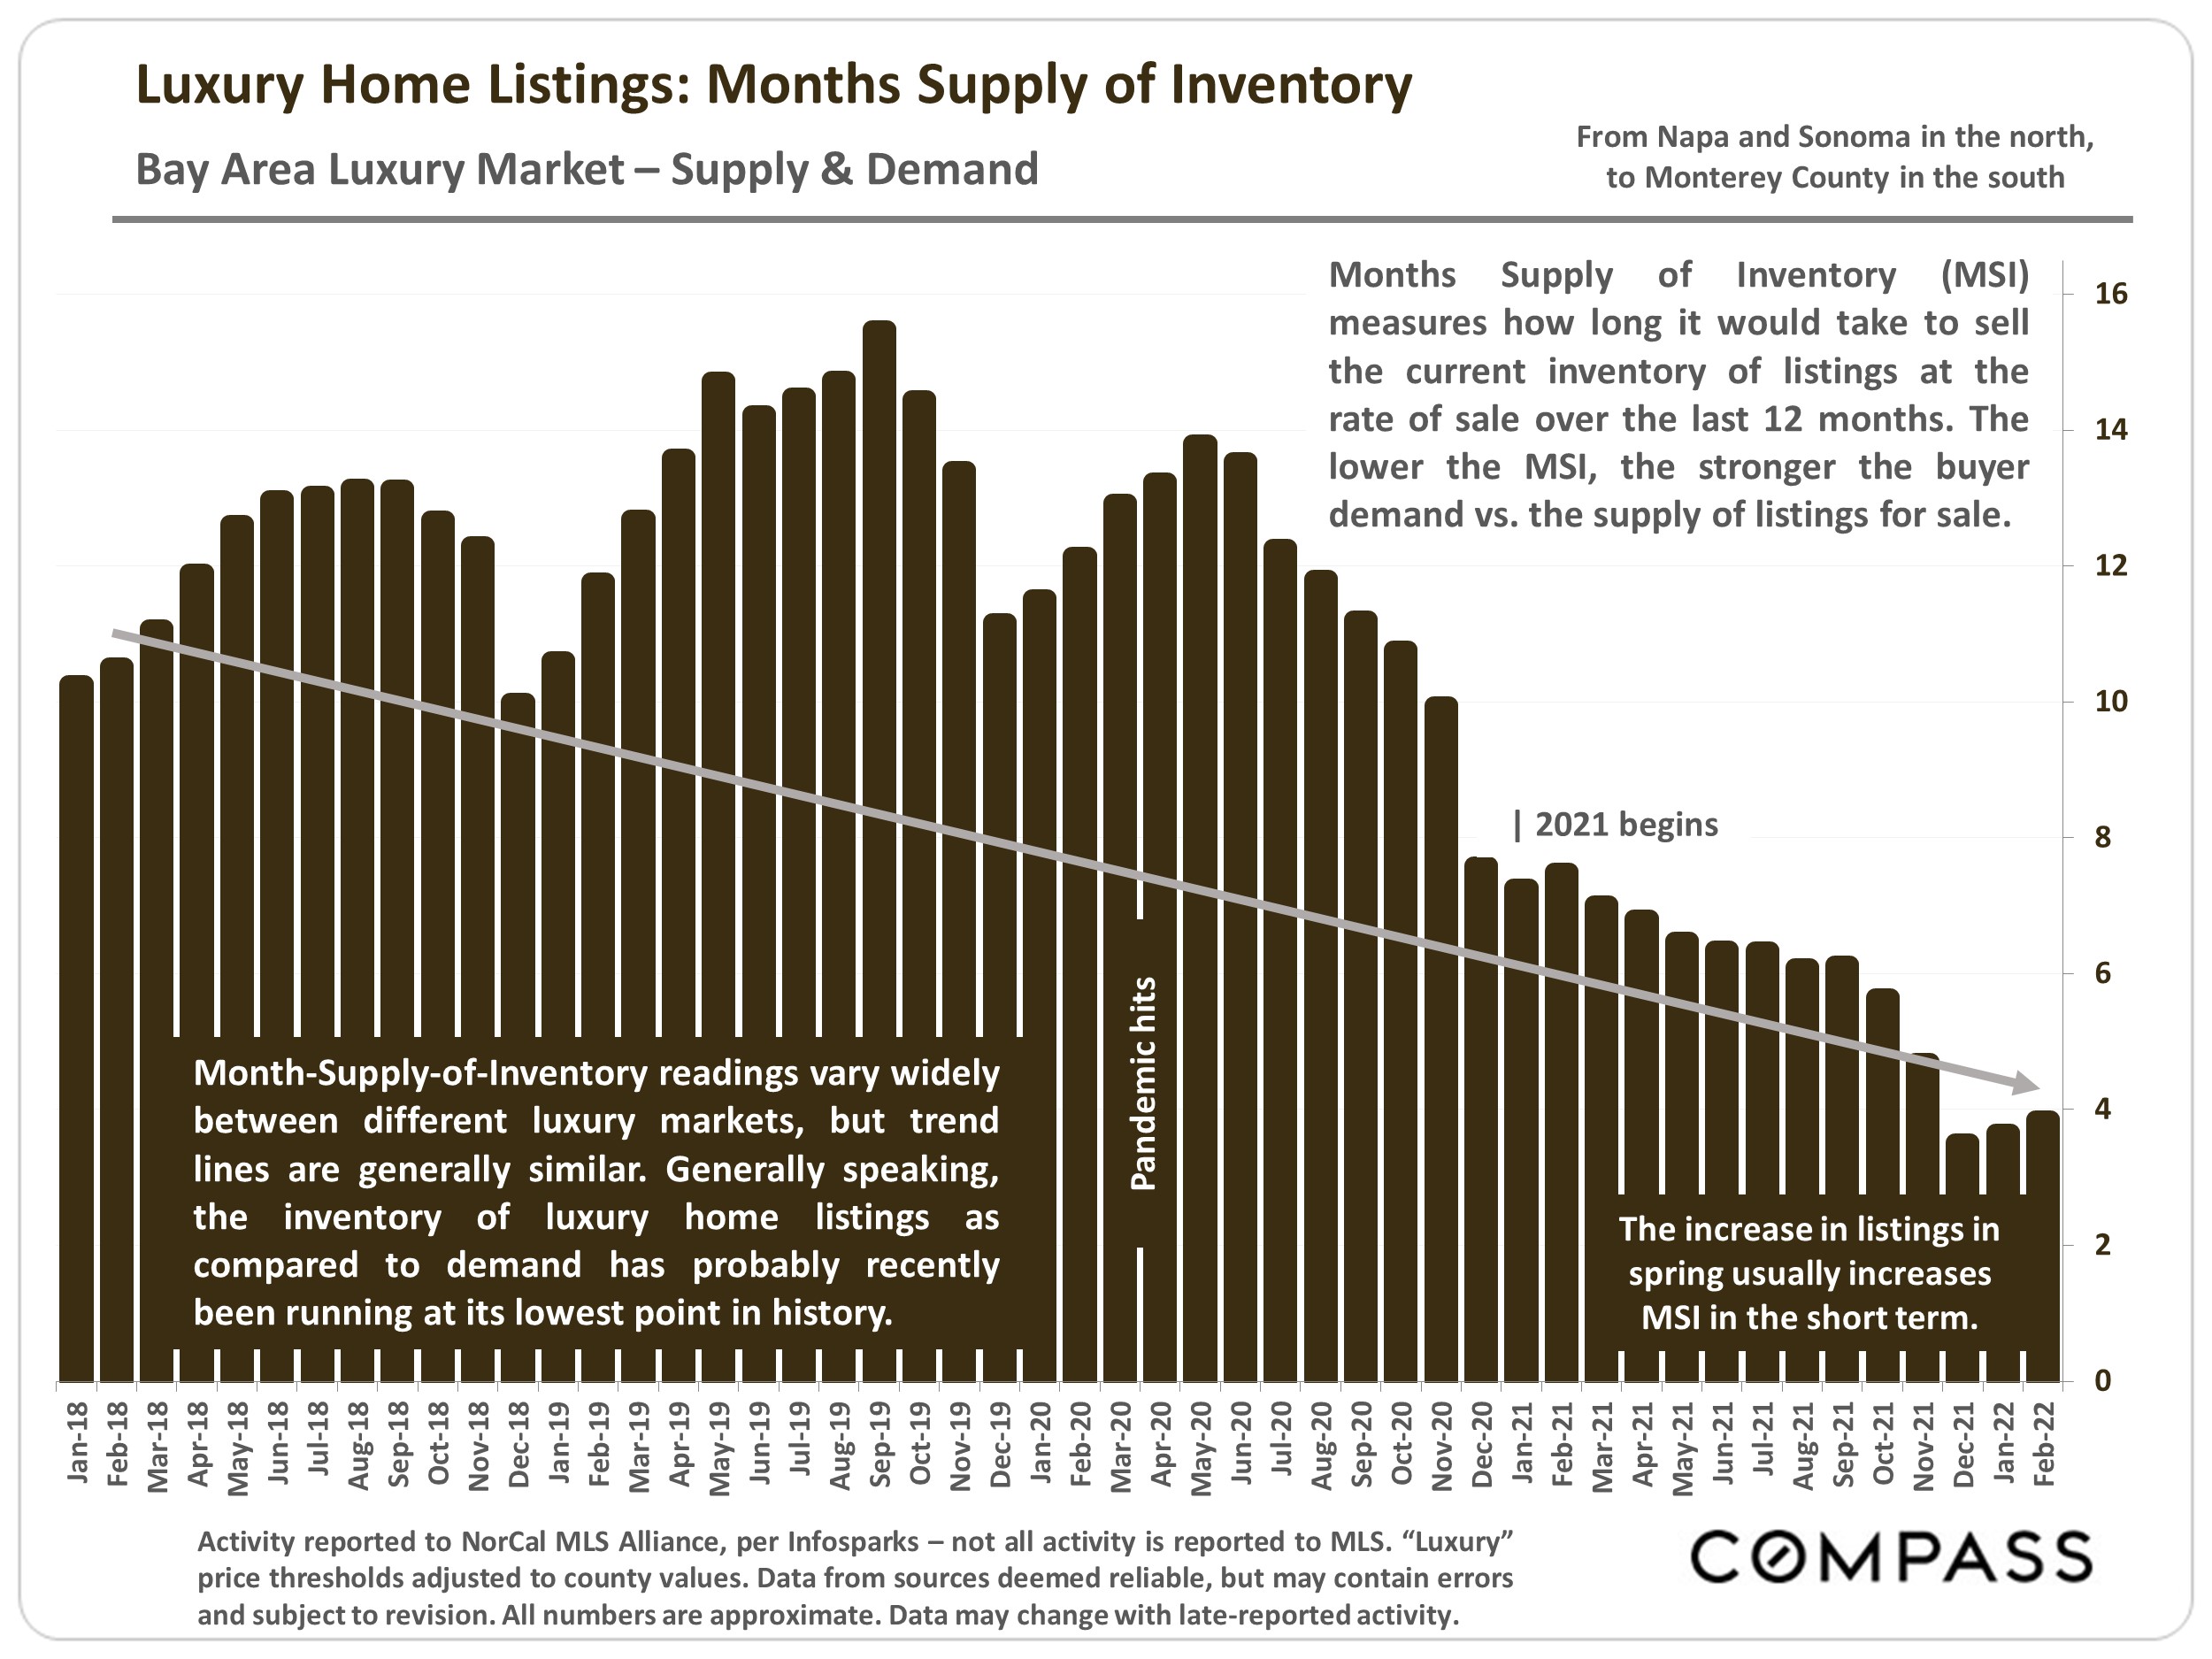
Driven by both pandemic-related issues, and surging household wealth among the affluent, Bay Area luxury home sales rose dramatically in the second half of 2020, and then skyrocketed in 2021. This report focuses on sales and values by county, broad Bay Area trends in supply and demand, the effects of seasonality on activity, and a few macroeconomic snapshots. Spring is typically the biggest selling season — or spring/summer in counties with large second-home markets (Napa, Sonoma, Monterey, Santa Cruz). Currently, the usual, early-spring acceleration is well under way in new listings coming on market and the number of homes going into contract.

So far, the luxury market appears largely unfazed by the economic and political volatility that has characterized the beginning of 2022. Though some buyers and sellers have paused their plans, awaiting more clarity in recent developments, the prevailing dynamic remains one of high demand and historically low supply — which doesn’t mean that every home, no matter the price, sells quickly. (The luxury market, characterized by stunning homes and spectacular estates, is often more susceptible to overpricing than less expensive segments.) As a general rule, affluent buyers are less concerned with interest rate changes and more sensitive to financial markets, though the 2 are often interrelated. Spring sales data will soon provide more substantial indications of market direction.


In this report, considering differences in county values, the luxury segment is defined as including homes of $4 million+ in San Francisco, Marin, San Mateo & Santa Clara Counties; $3 million+ in Alameda, Contra Costa & Monterey; $2.5 million+ in Santa Cruz; and $2 million+ in Napa & Sonoma Counties. These price thresholds are very broad generalities, and what one gets for however many millions of dollars in any specific city, town or neighborhood varies enormously: In home and lot size (or acreage/vineyards); architecture and condition; home technology; views; privacy; decks, pools, tennis courts and landscaping; wine cellars, media rooms, security and 3+ car garages; access to open space, beaches, golf courses, good schools and shopping; and many other circumstances and amenities. In real estate, and especially the luxury home market, the devil is always in the details.


Per listings and sales posted to NorCal MLS Alliance — not all listings/sales are posted. Report was created in good faith using data from sources deemed reliable, but may contain errors and subject to revision. Statistics are generalities and all numbers are approximate. Data may change due to late-reported sales.

Source: Compass

It is impossible to know how median and average value statistics apply to any particular home without a specific comparative market analysis. These analyses were made in good faith with data from sources deemed reliable, but may contain errors and are subject to revision. It is not our intent to convince you of a particular position, but to attempt to provide straightforward data and analysis, so you can make your own informed decisions. Median and average statistics are enormous generalities: There are hundreds of different markets in San Francisco and the Bay Area, each with its own unique dynamics. Median prices and average dollar per square foot values can be and often are affected by other factors besides changes in fair market value. Longer term trends are much more meaningful than short-term.

Compass is a real estate broker licensed by the State of California, DRE 01527235. Equal Housing Opportunity. This report has been prepared solely for information purposes. The information herein is based on or derived from information generally available to the public and/or from sources believed to be reliable. No representation or warranty can be given with respect to the accuracy or completeness of the information. Compass disclaims any and all liability relating to this report, including without limitation any express or implied representations or warranties for statements contained in, and omissions from, the report. Nothing contained herein is intended to be or should be read as any regulatory, legal, tax, accounting or other advice and Compass does not provide such advice. All opinions are subject to change without notice. Compass makes no representation regarding the accuracy of any statements regarding any references to the laws, statutes or regulations of any state are those of the author(s). Past performance is no guarantee of future results.

Skip to content