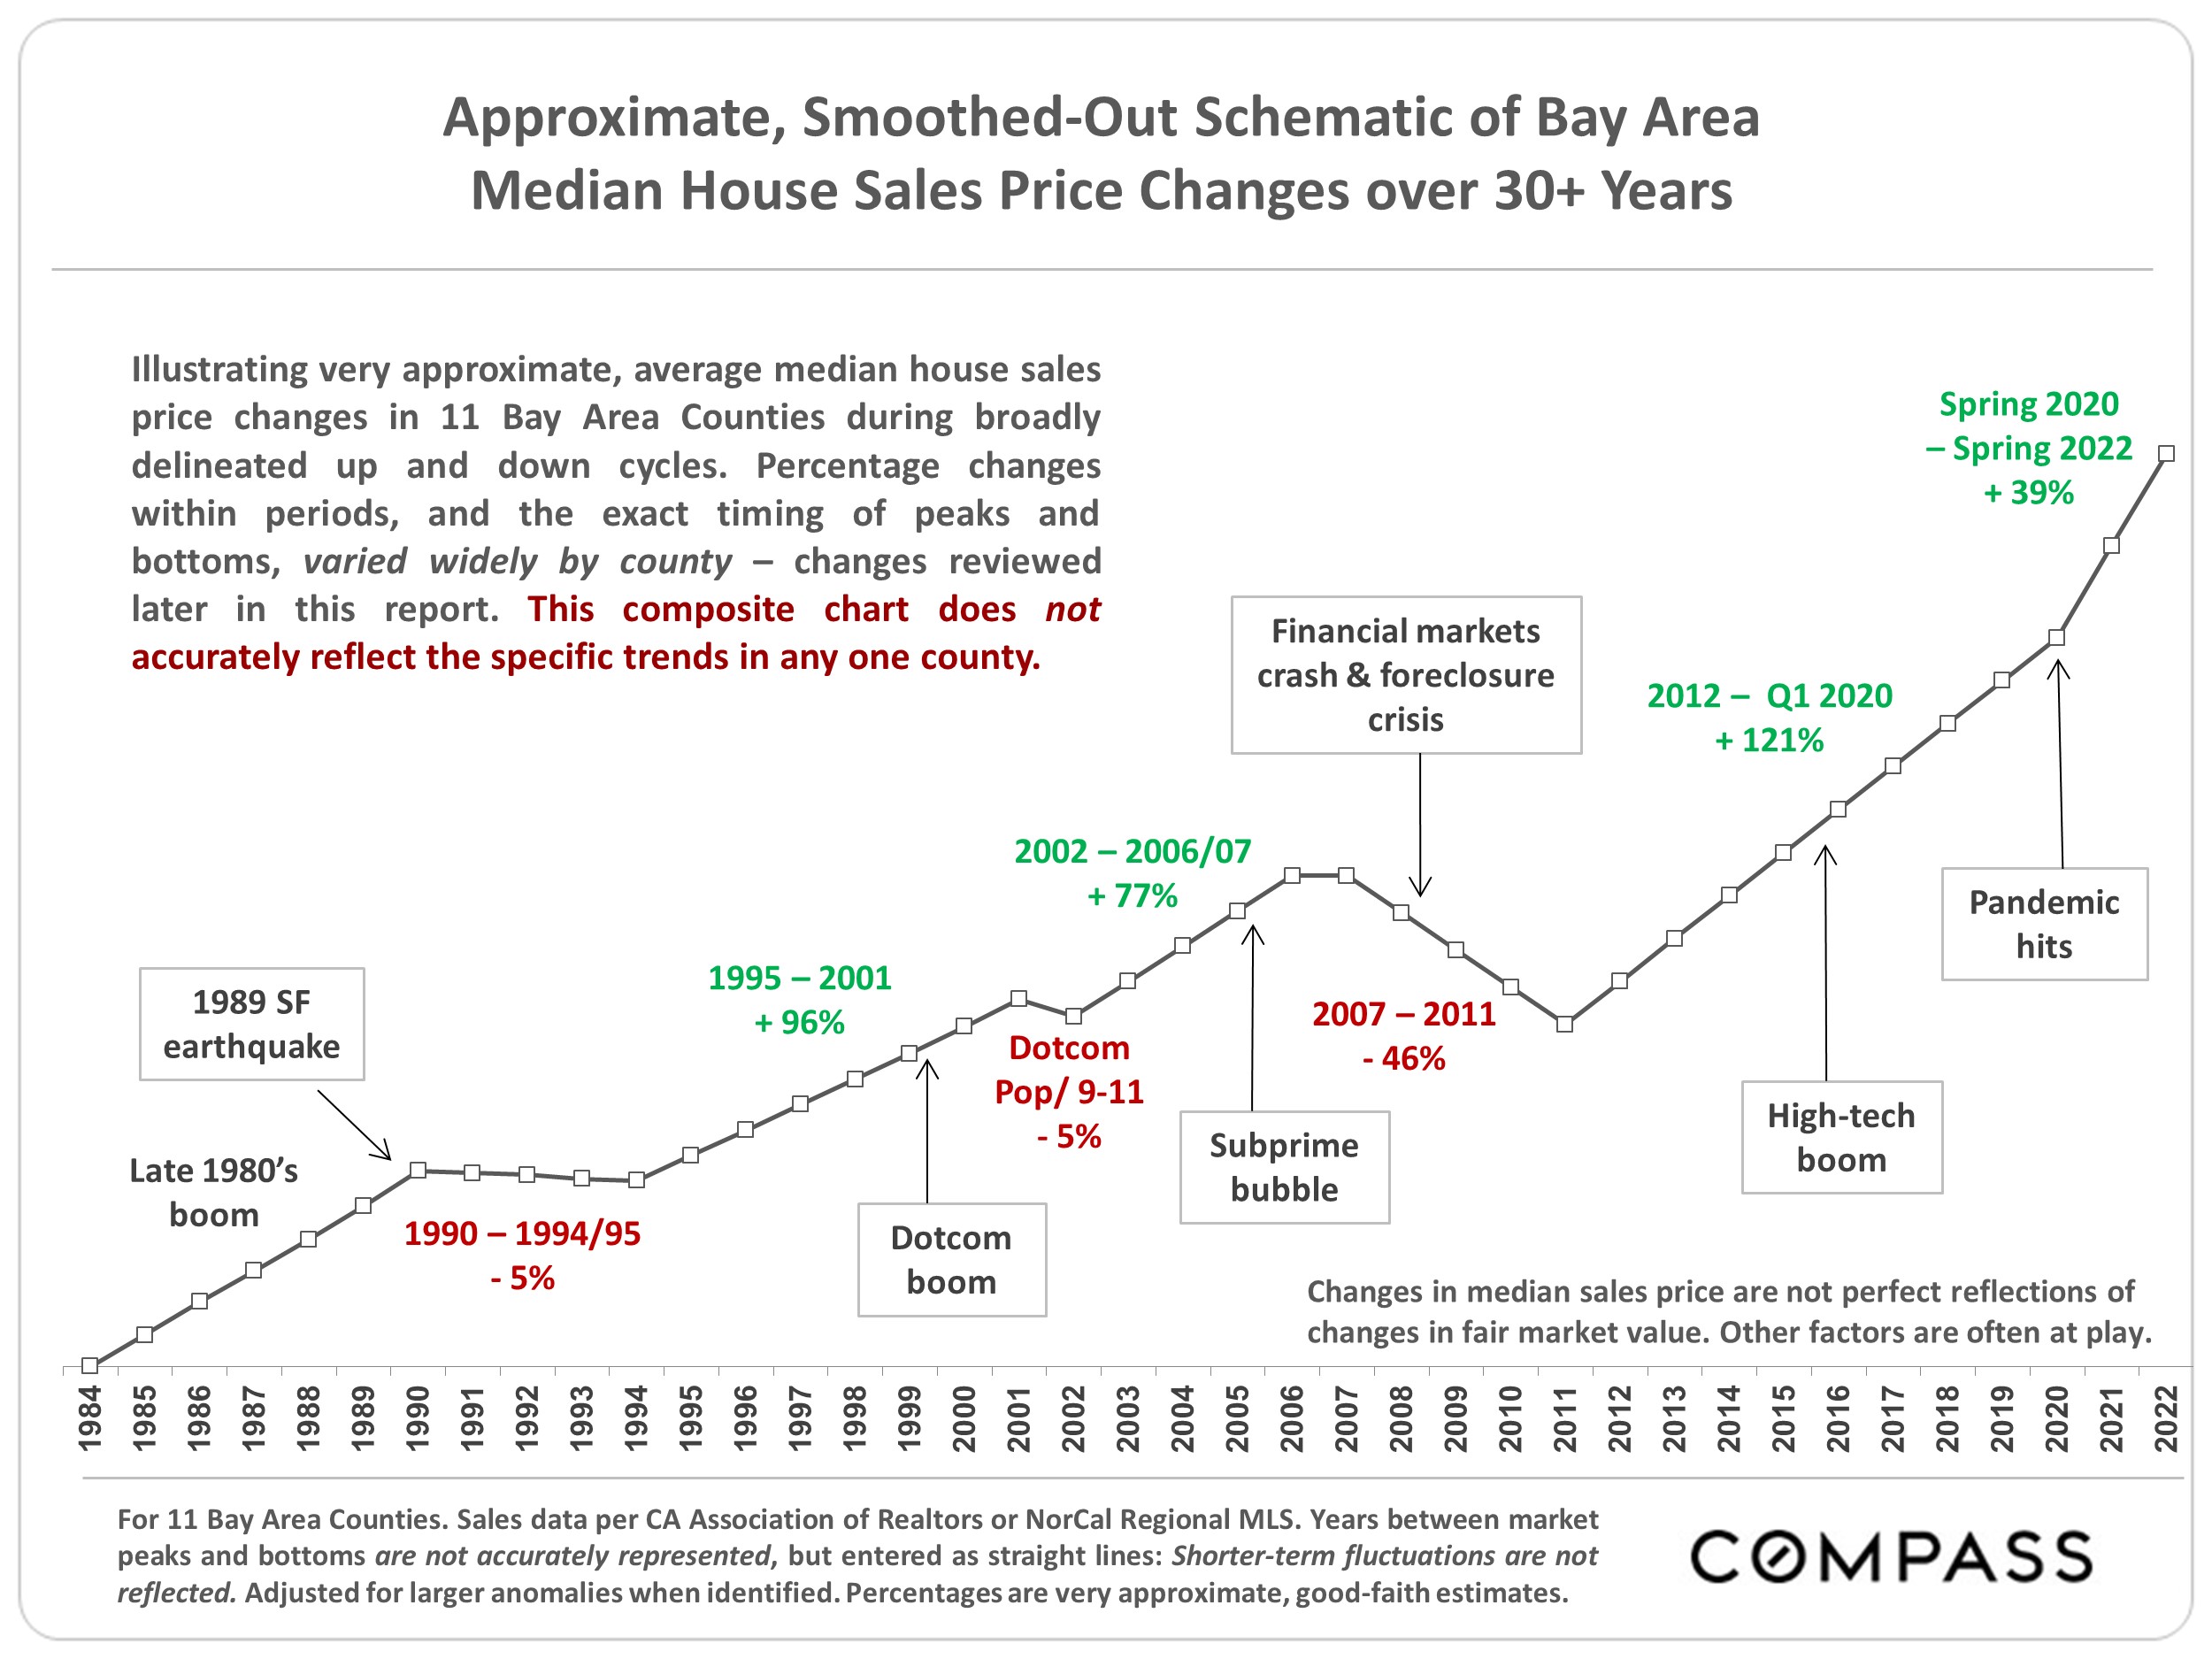
Financial and real estate markets have run in cycles for at least hundreds of years. Though varying in their details, causes and effects, there are many similarities in how they play out, providing greater context to how markets work over time.
Many economic, political, demographic and environmental factors play roles in real estate markets, including interest rates, inflation, financial markets, new wealth creation (or destruction), housing affordability, employment, demographic shifts, governmental economic interventions, national and international crises, financial product engineering and manipulation, runaway speculation, regulation and risk management, tax law, debt, natural disasters, and, as we have recently seen, even pandemics.
Human psychology also plays a defining role, with optimism, confidence, and often, ultimately, “irrational exuberance” fueling upcycles. (“The world is different now. The old rules don’t apply, and these boom times can continue indefinitely.”) Conversely, fear, doubt and pessimism play a role in the shift to, and then underpin down-cycles. (“The housing market probably won’t recover in our lifetimes.”) Whatever the phase of the cycle, people tend to believe it will last forever, but, of course, the nature of cycles is to keep turning.
It is extremely difficult to predict when different parts of a cycle will begin or end. Boom times, even periods of “irrational exuberance,” can go on much longer than expected, or get second winds, with huge jumps in values. On the other hand, negative shocks can appear with startling suddenness, often triggered by unexpected events or factors that affect a variety of economic fundamentals, hammer confidence, and cause shifts into slowdowns, “market corrections” or recessions of varying degrees and duration. These negative adjustments can feel like a switch being flipped, the slow deflation of a tire with a small puncture, or traffic going 120 miles per hour suddenly decelerating. Prices can flatten, adjust 5% to 10%, or, as with the subprime bubble, crash. (The subprime bubble and crash was caused by very unusual circumstances, as discussed later in this report.)
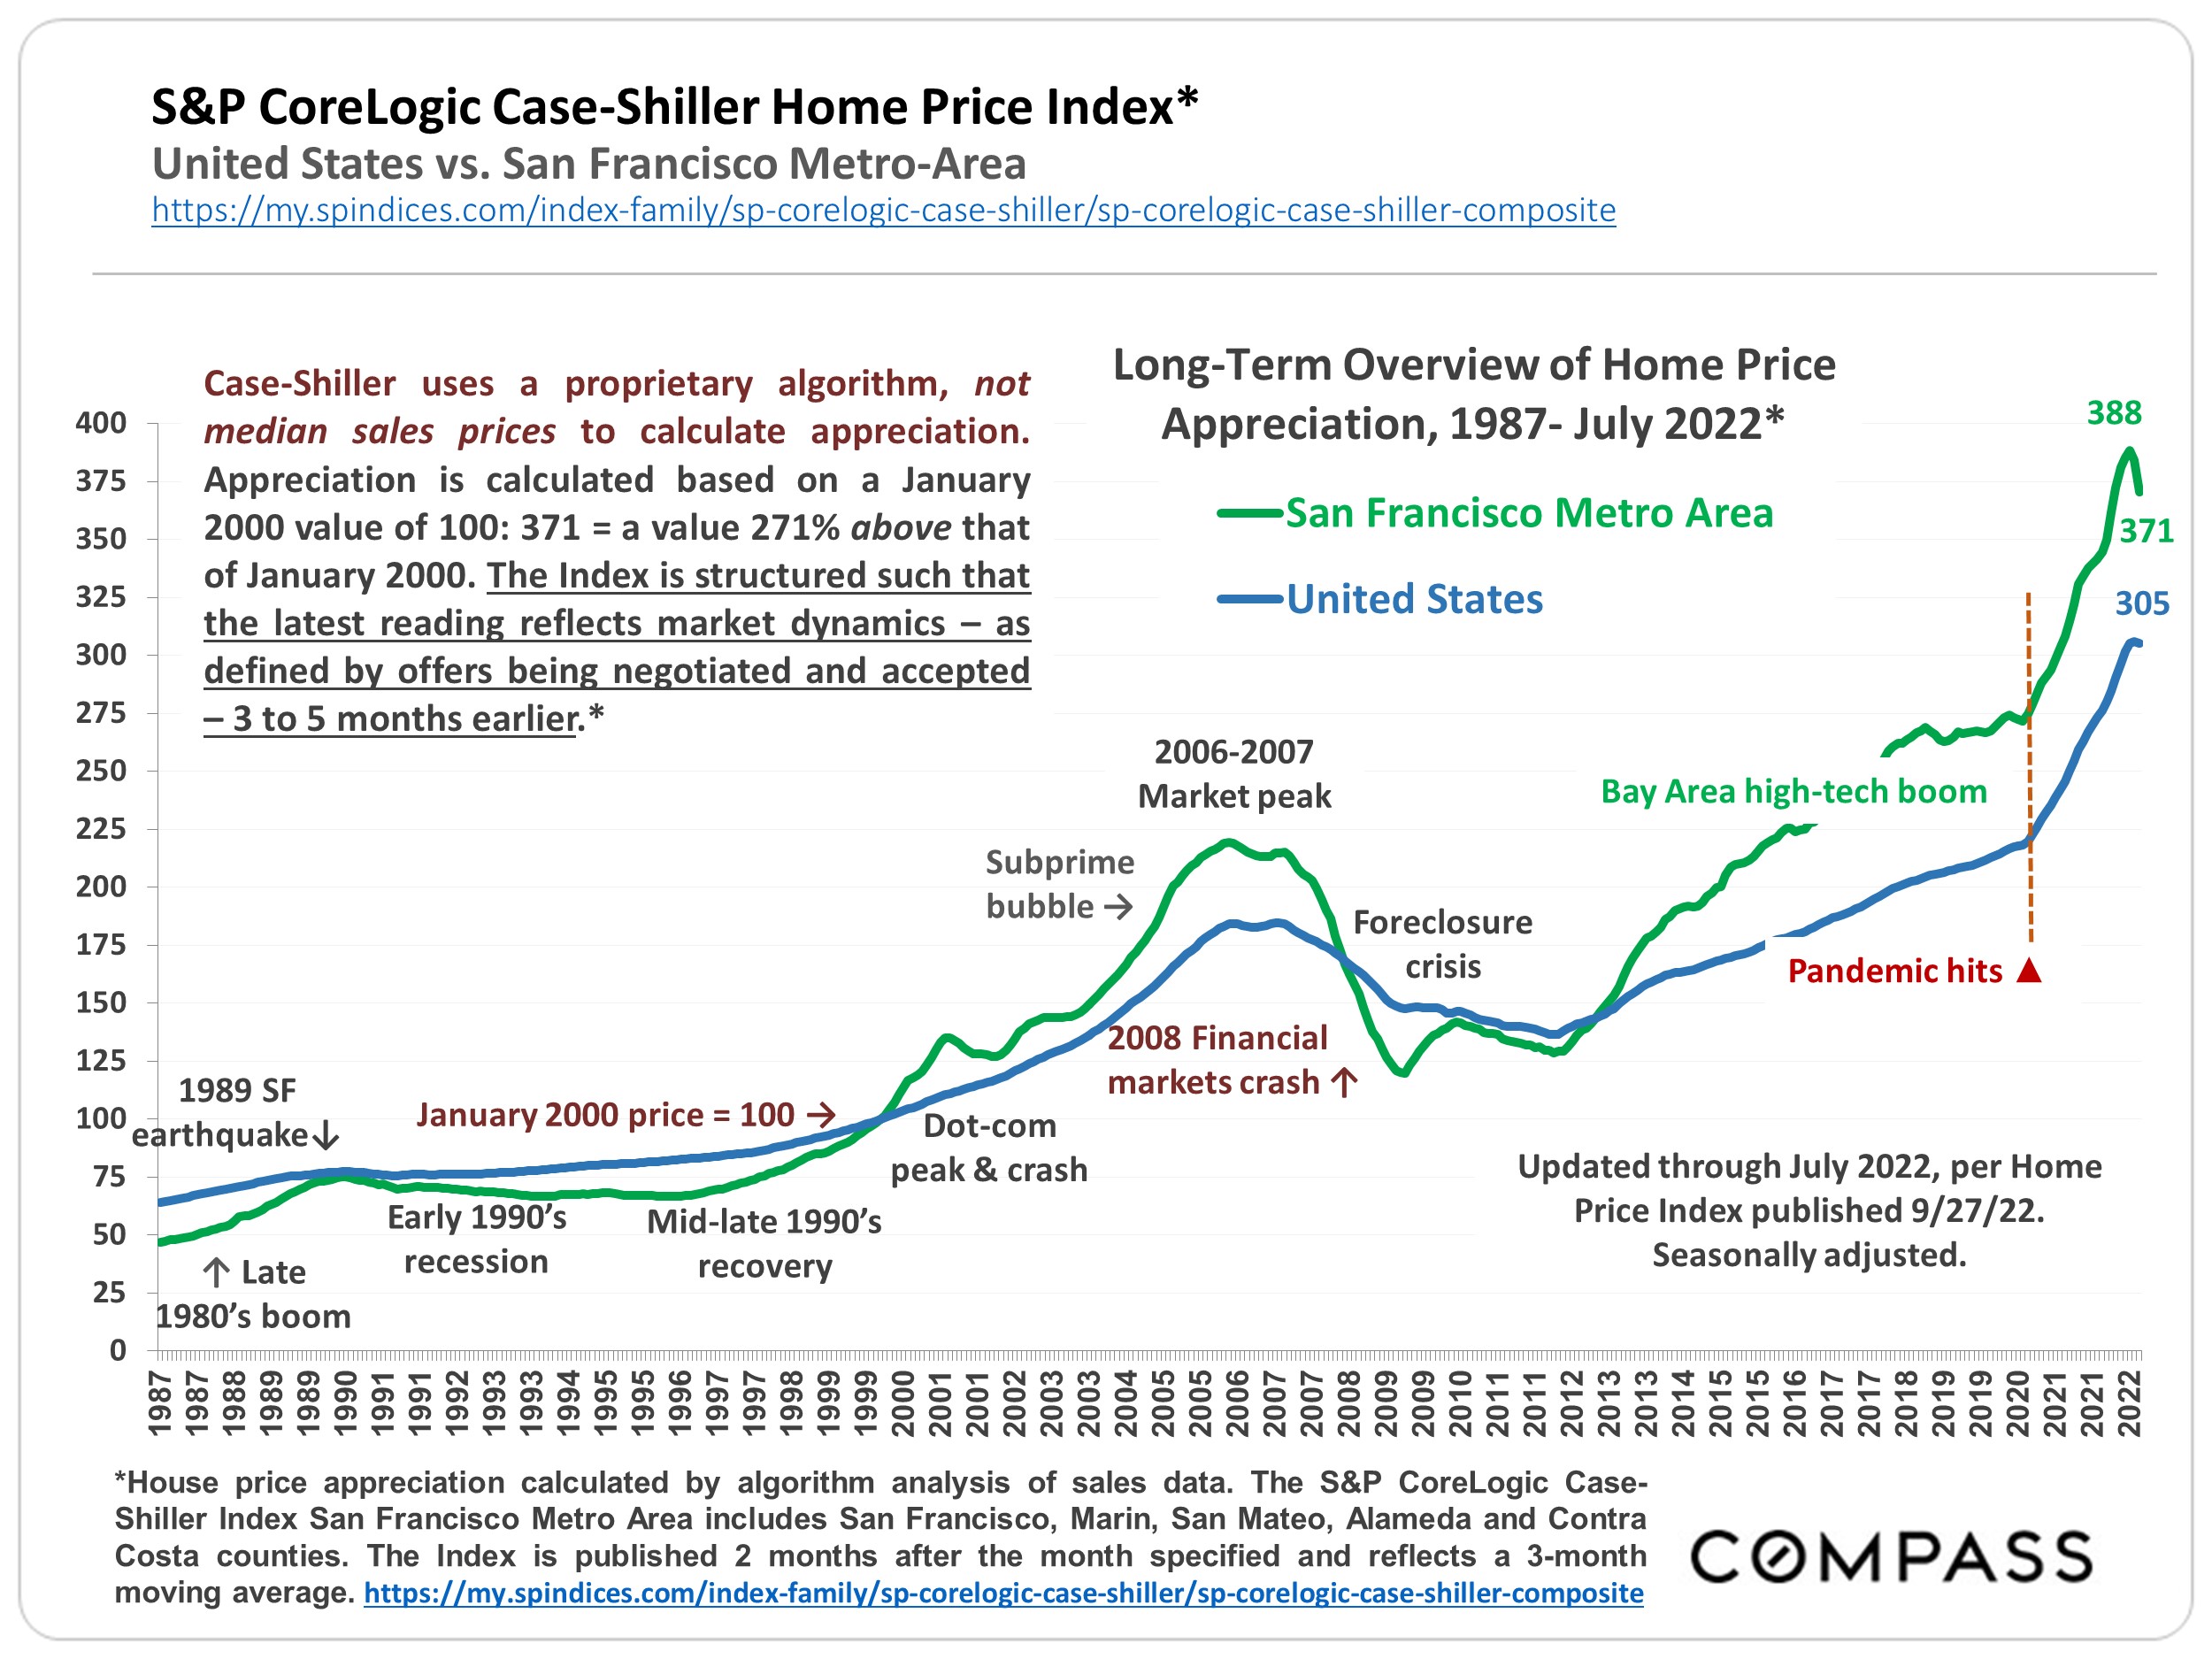
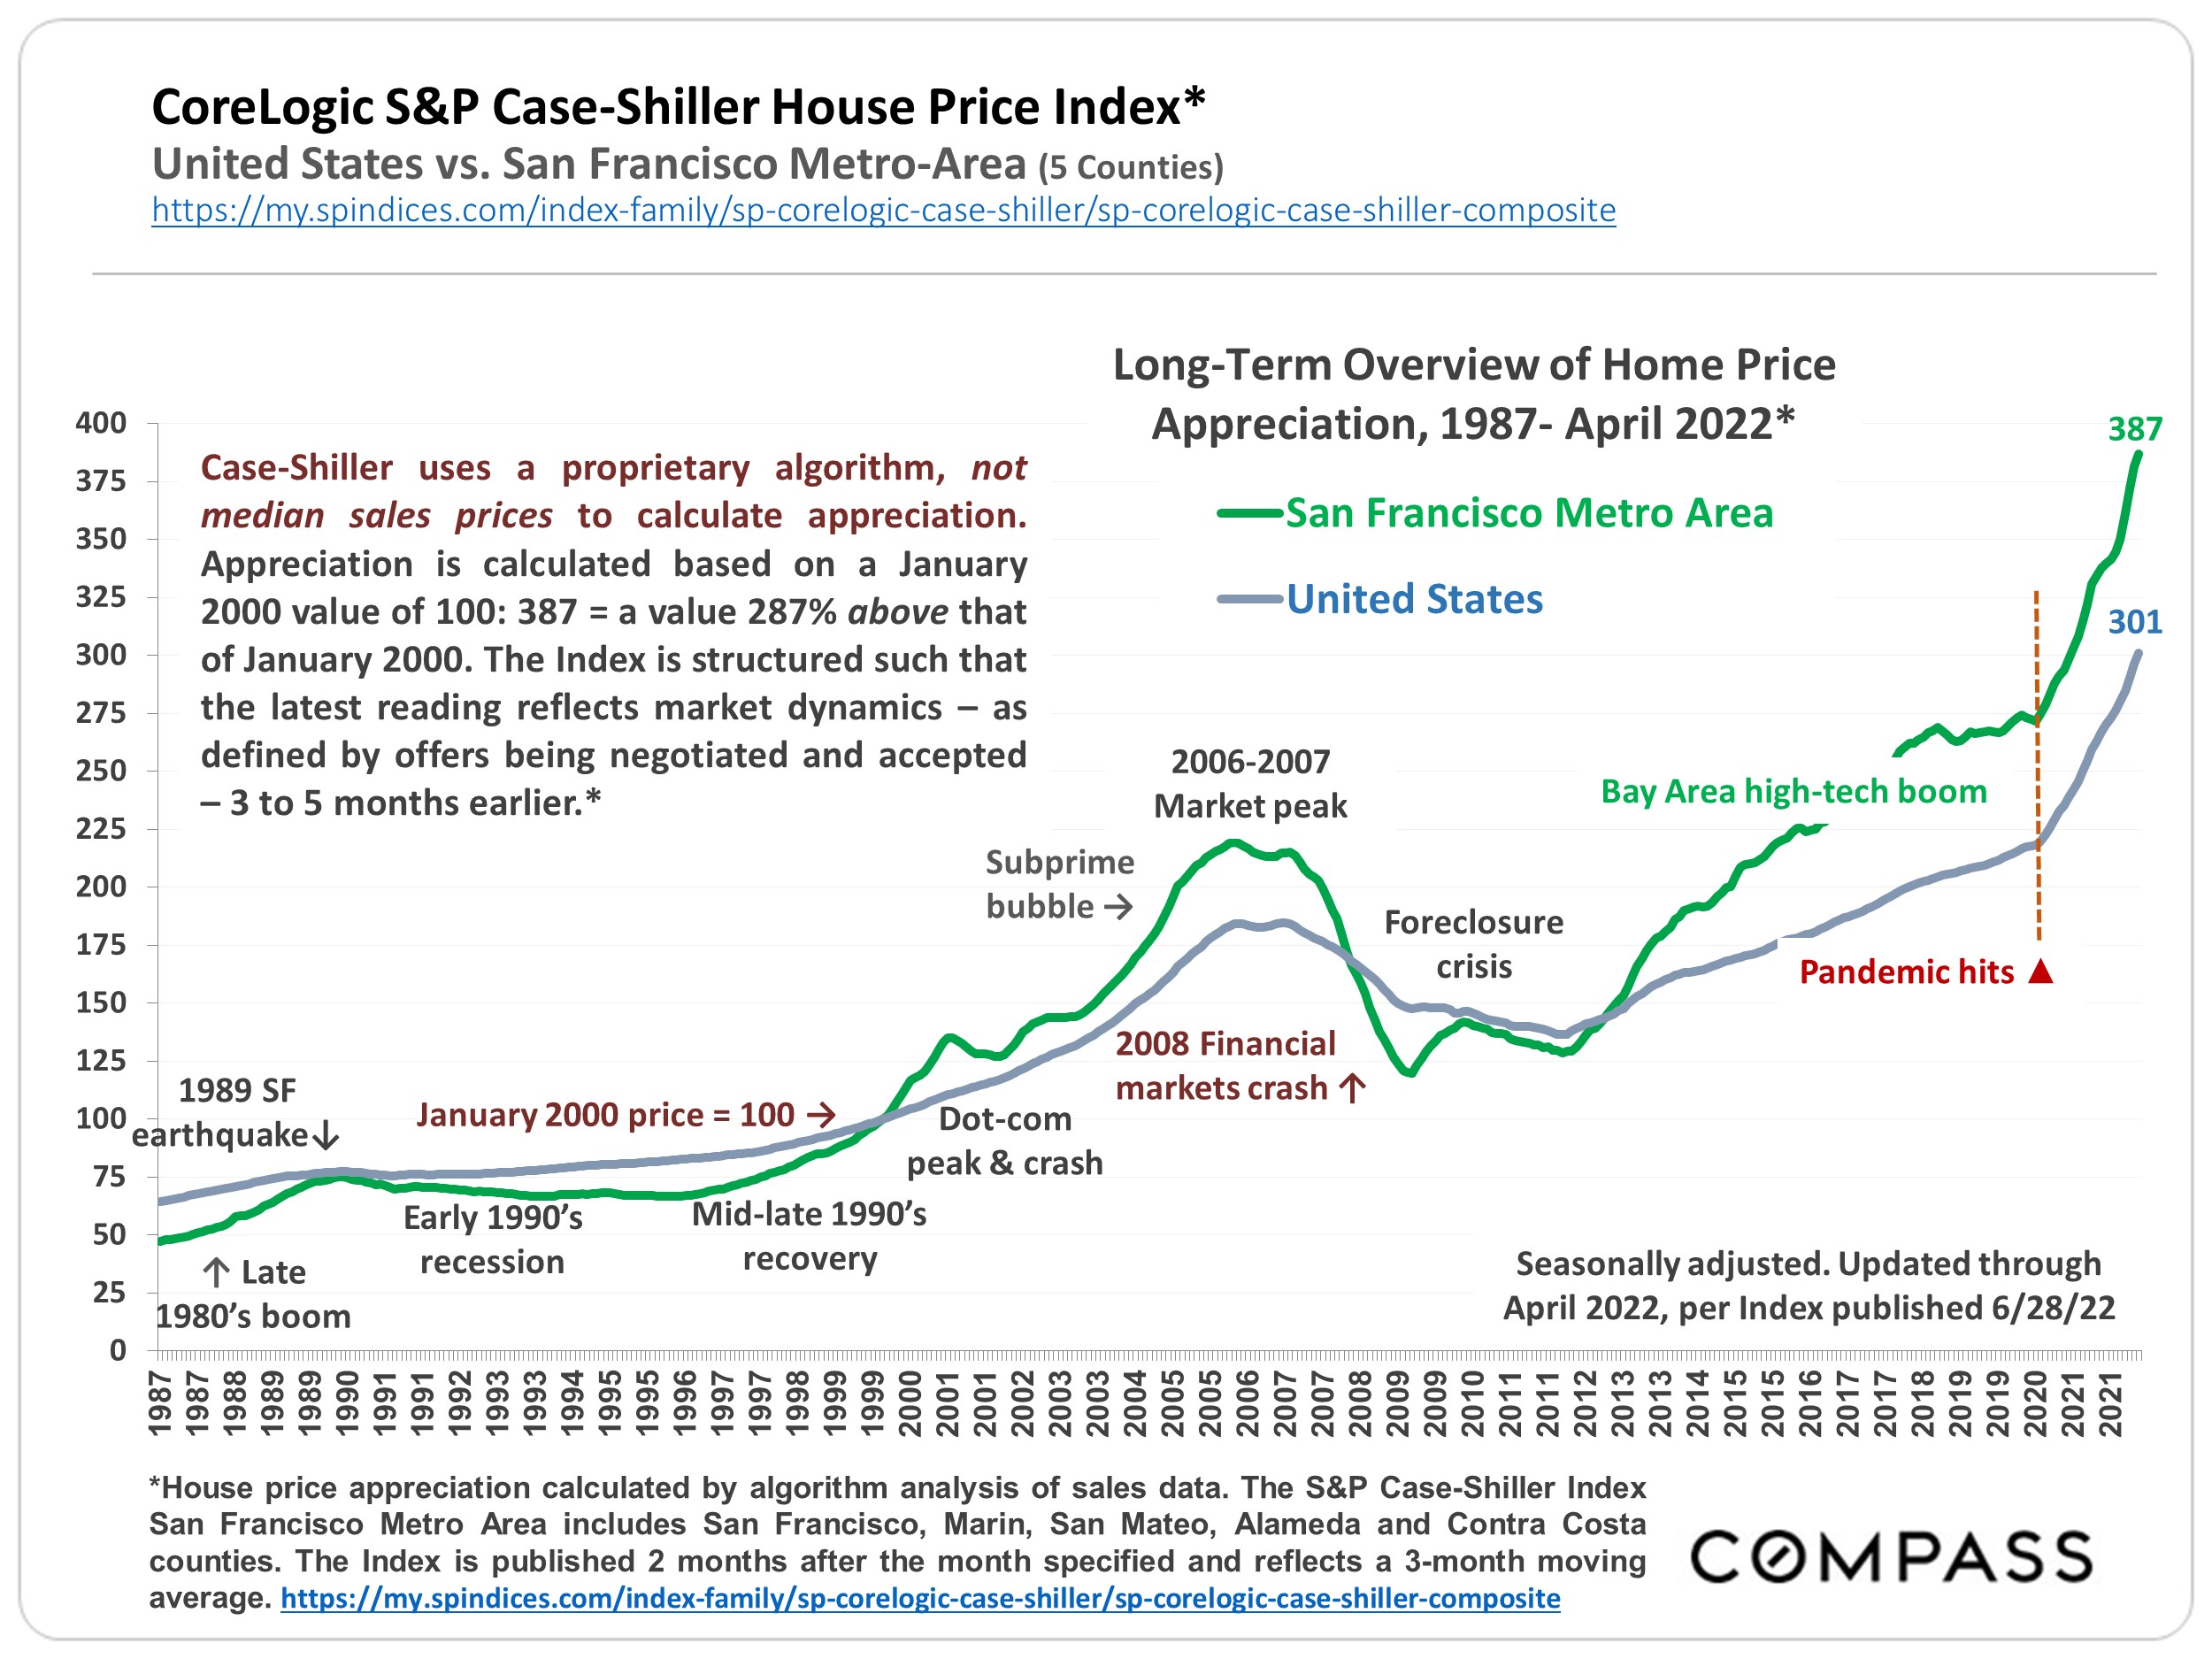
It’s interesting to note that different markets often behaved very differently during the various cycles, depending on the factors at play. As one example, San Francisco’s market was hit hardest after the 1989 earthquake; saw one of the highest appreciation rates during the dotcom boom – and a bigger price drop after it popped; a moderate-sized subprime bubble and crash; very high appreciation after the 2012 recovery and subsequent high-tech boom; but then a relatively low appreciation rate, as compared to surrounding counties, after the pandemic hit. In real estate, the devil is always in the details.
After the Early 1990’s Recession: Recovery & Dotcom Boom
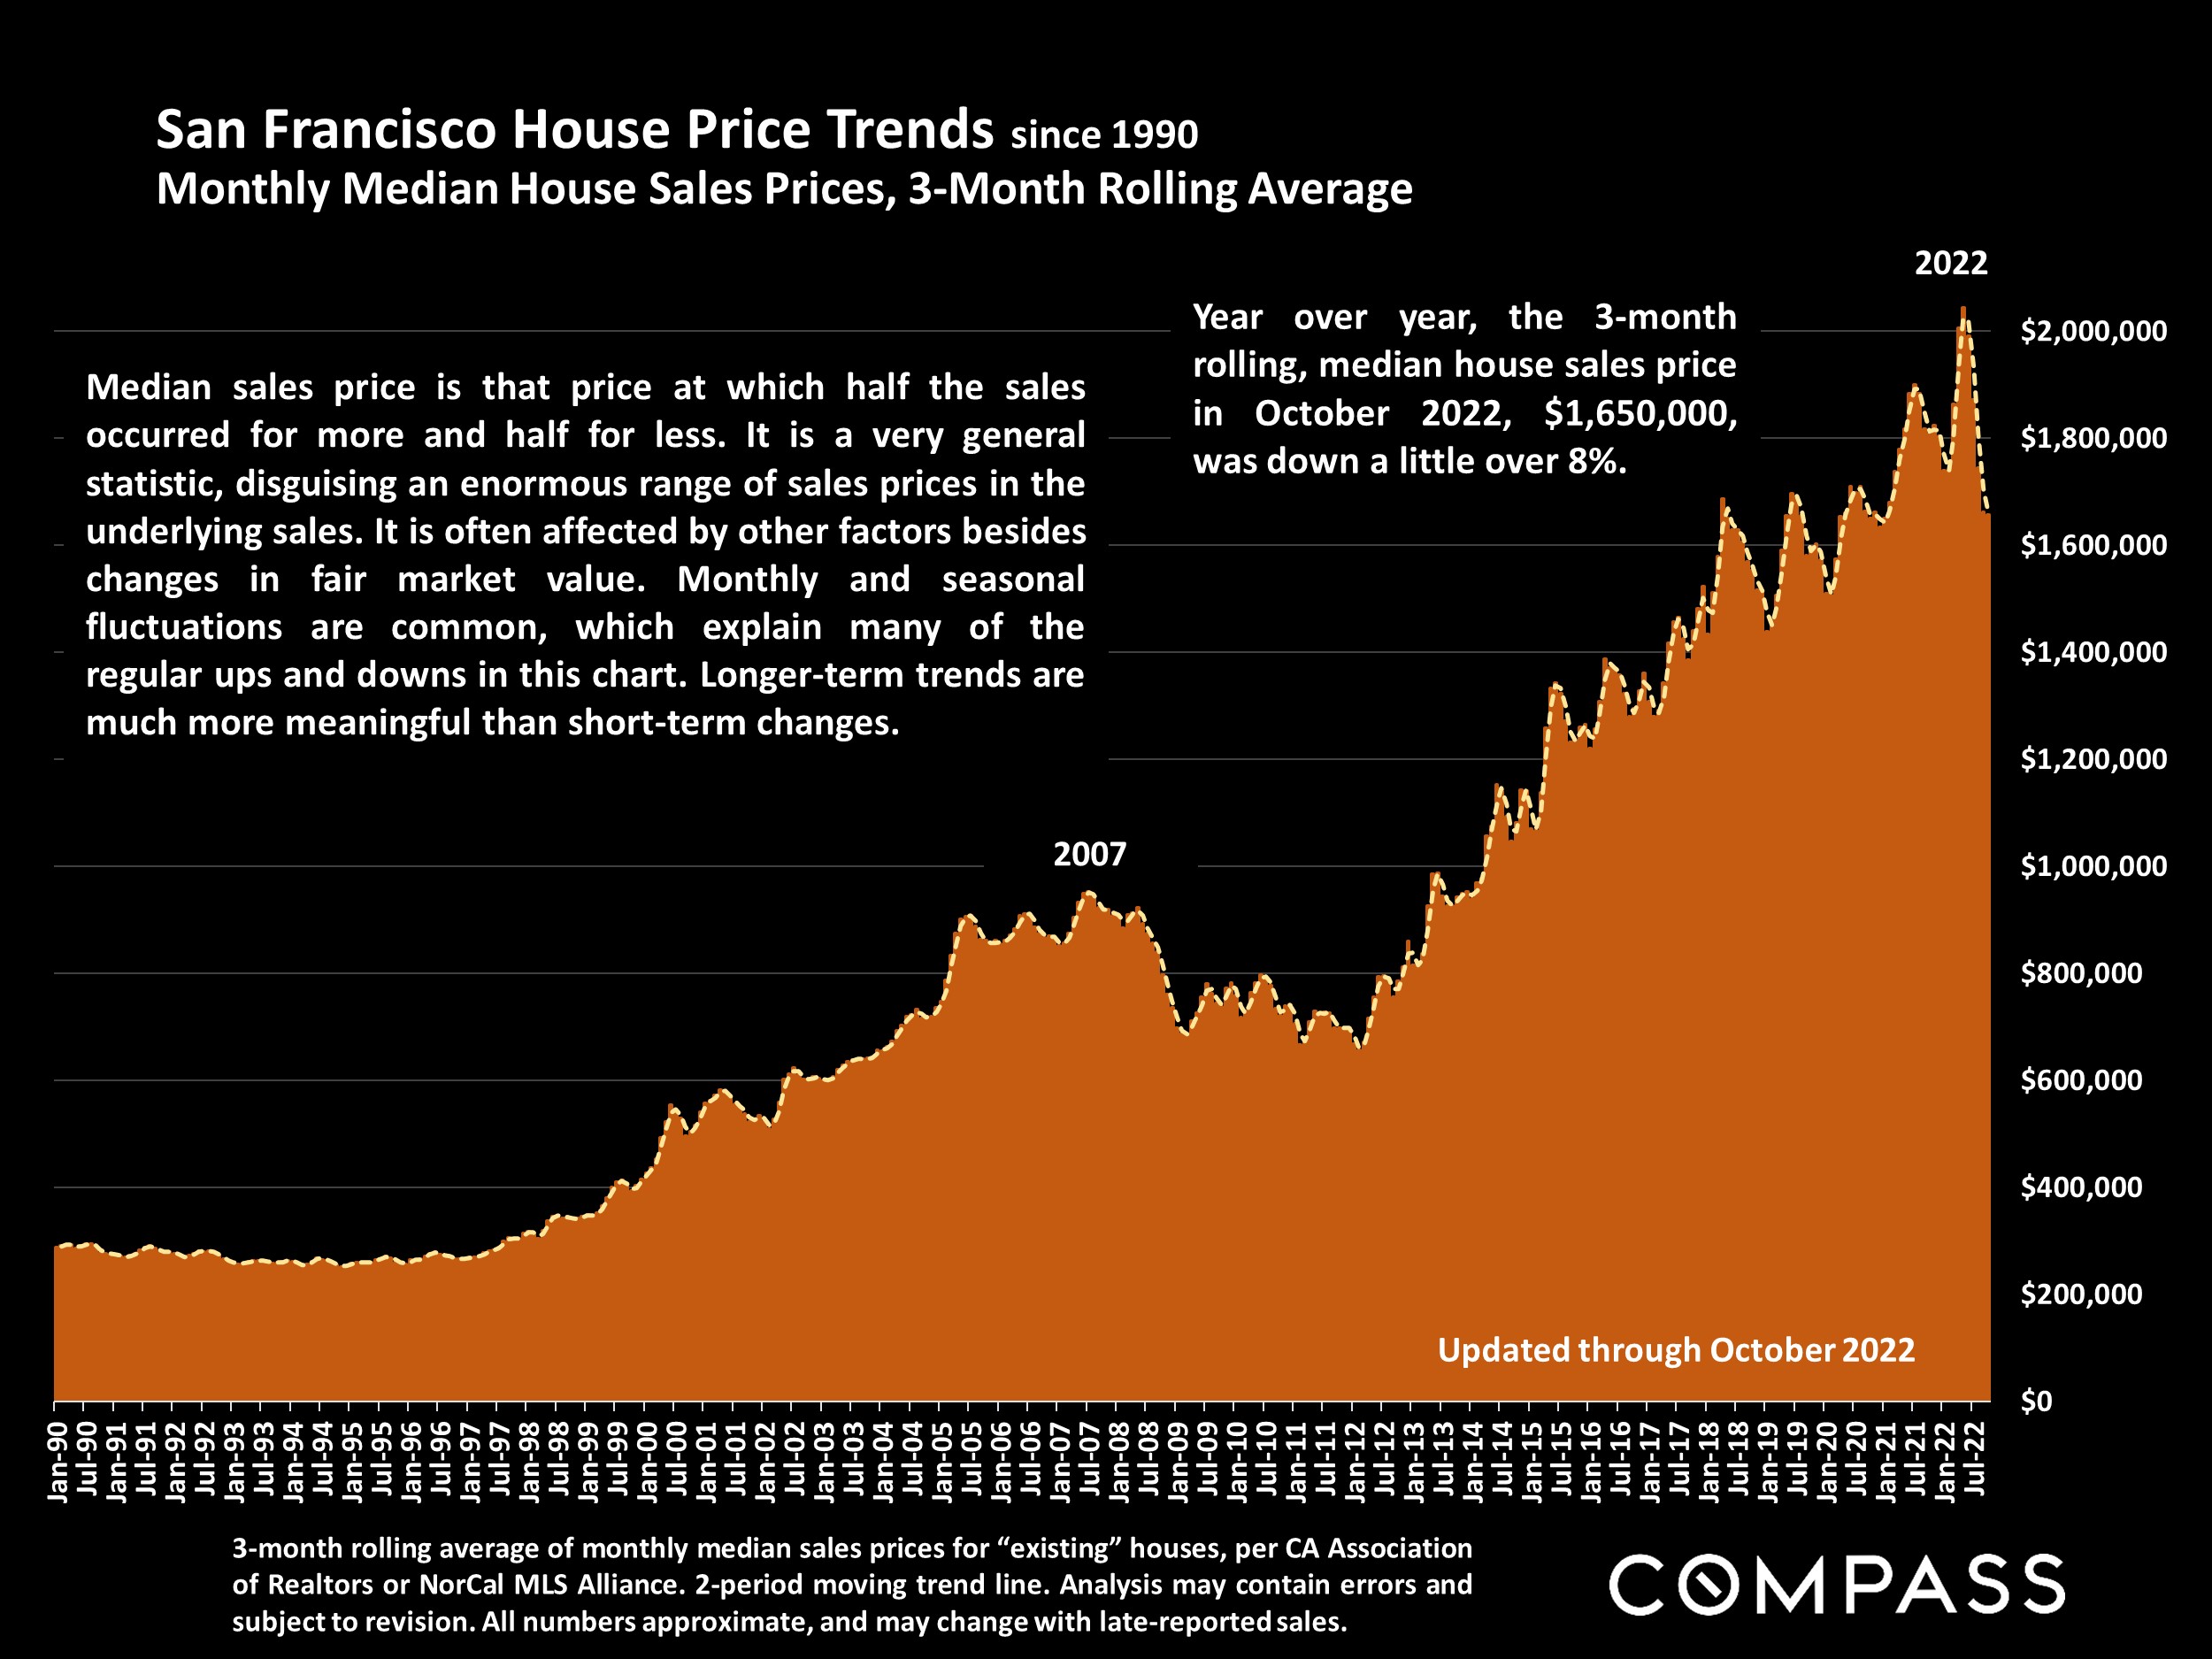
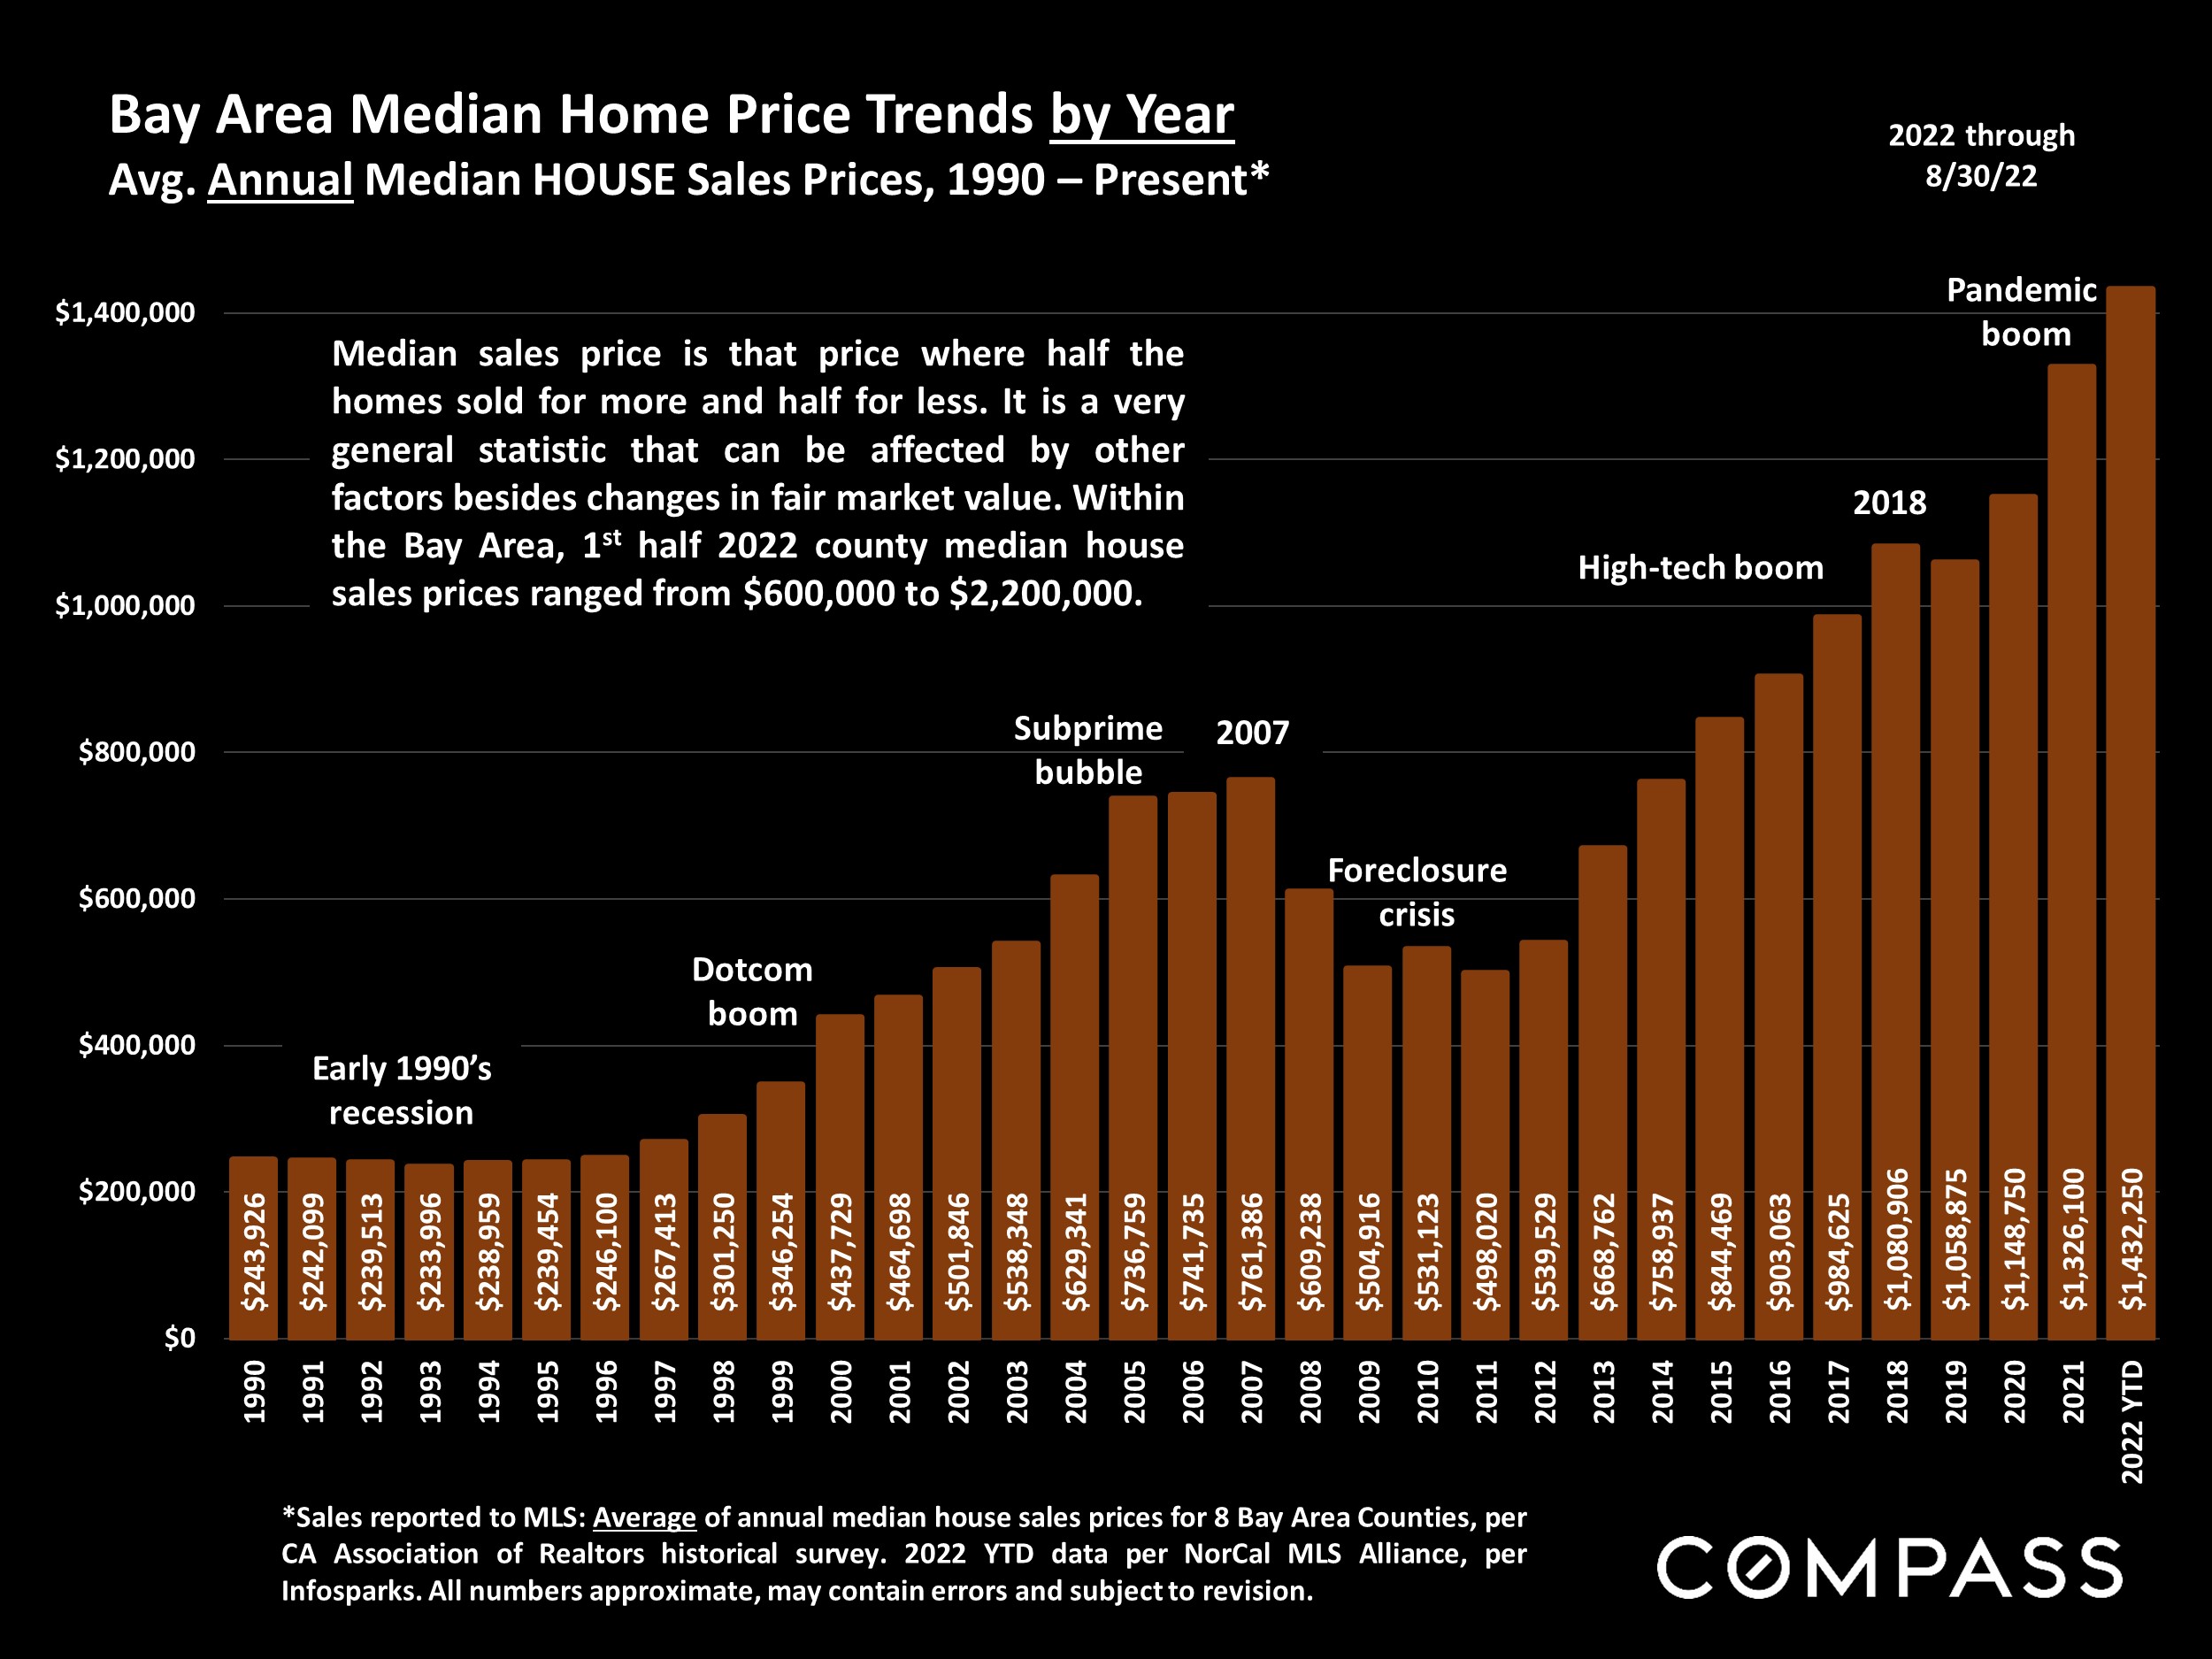
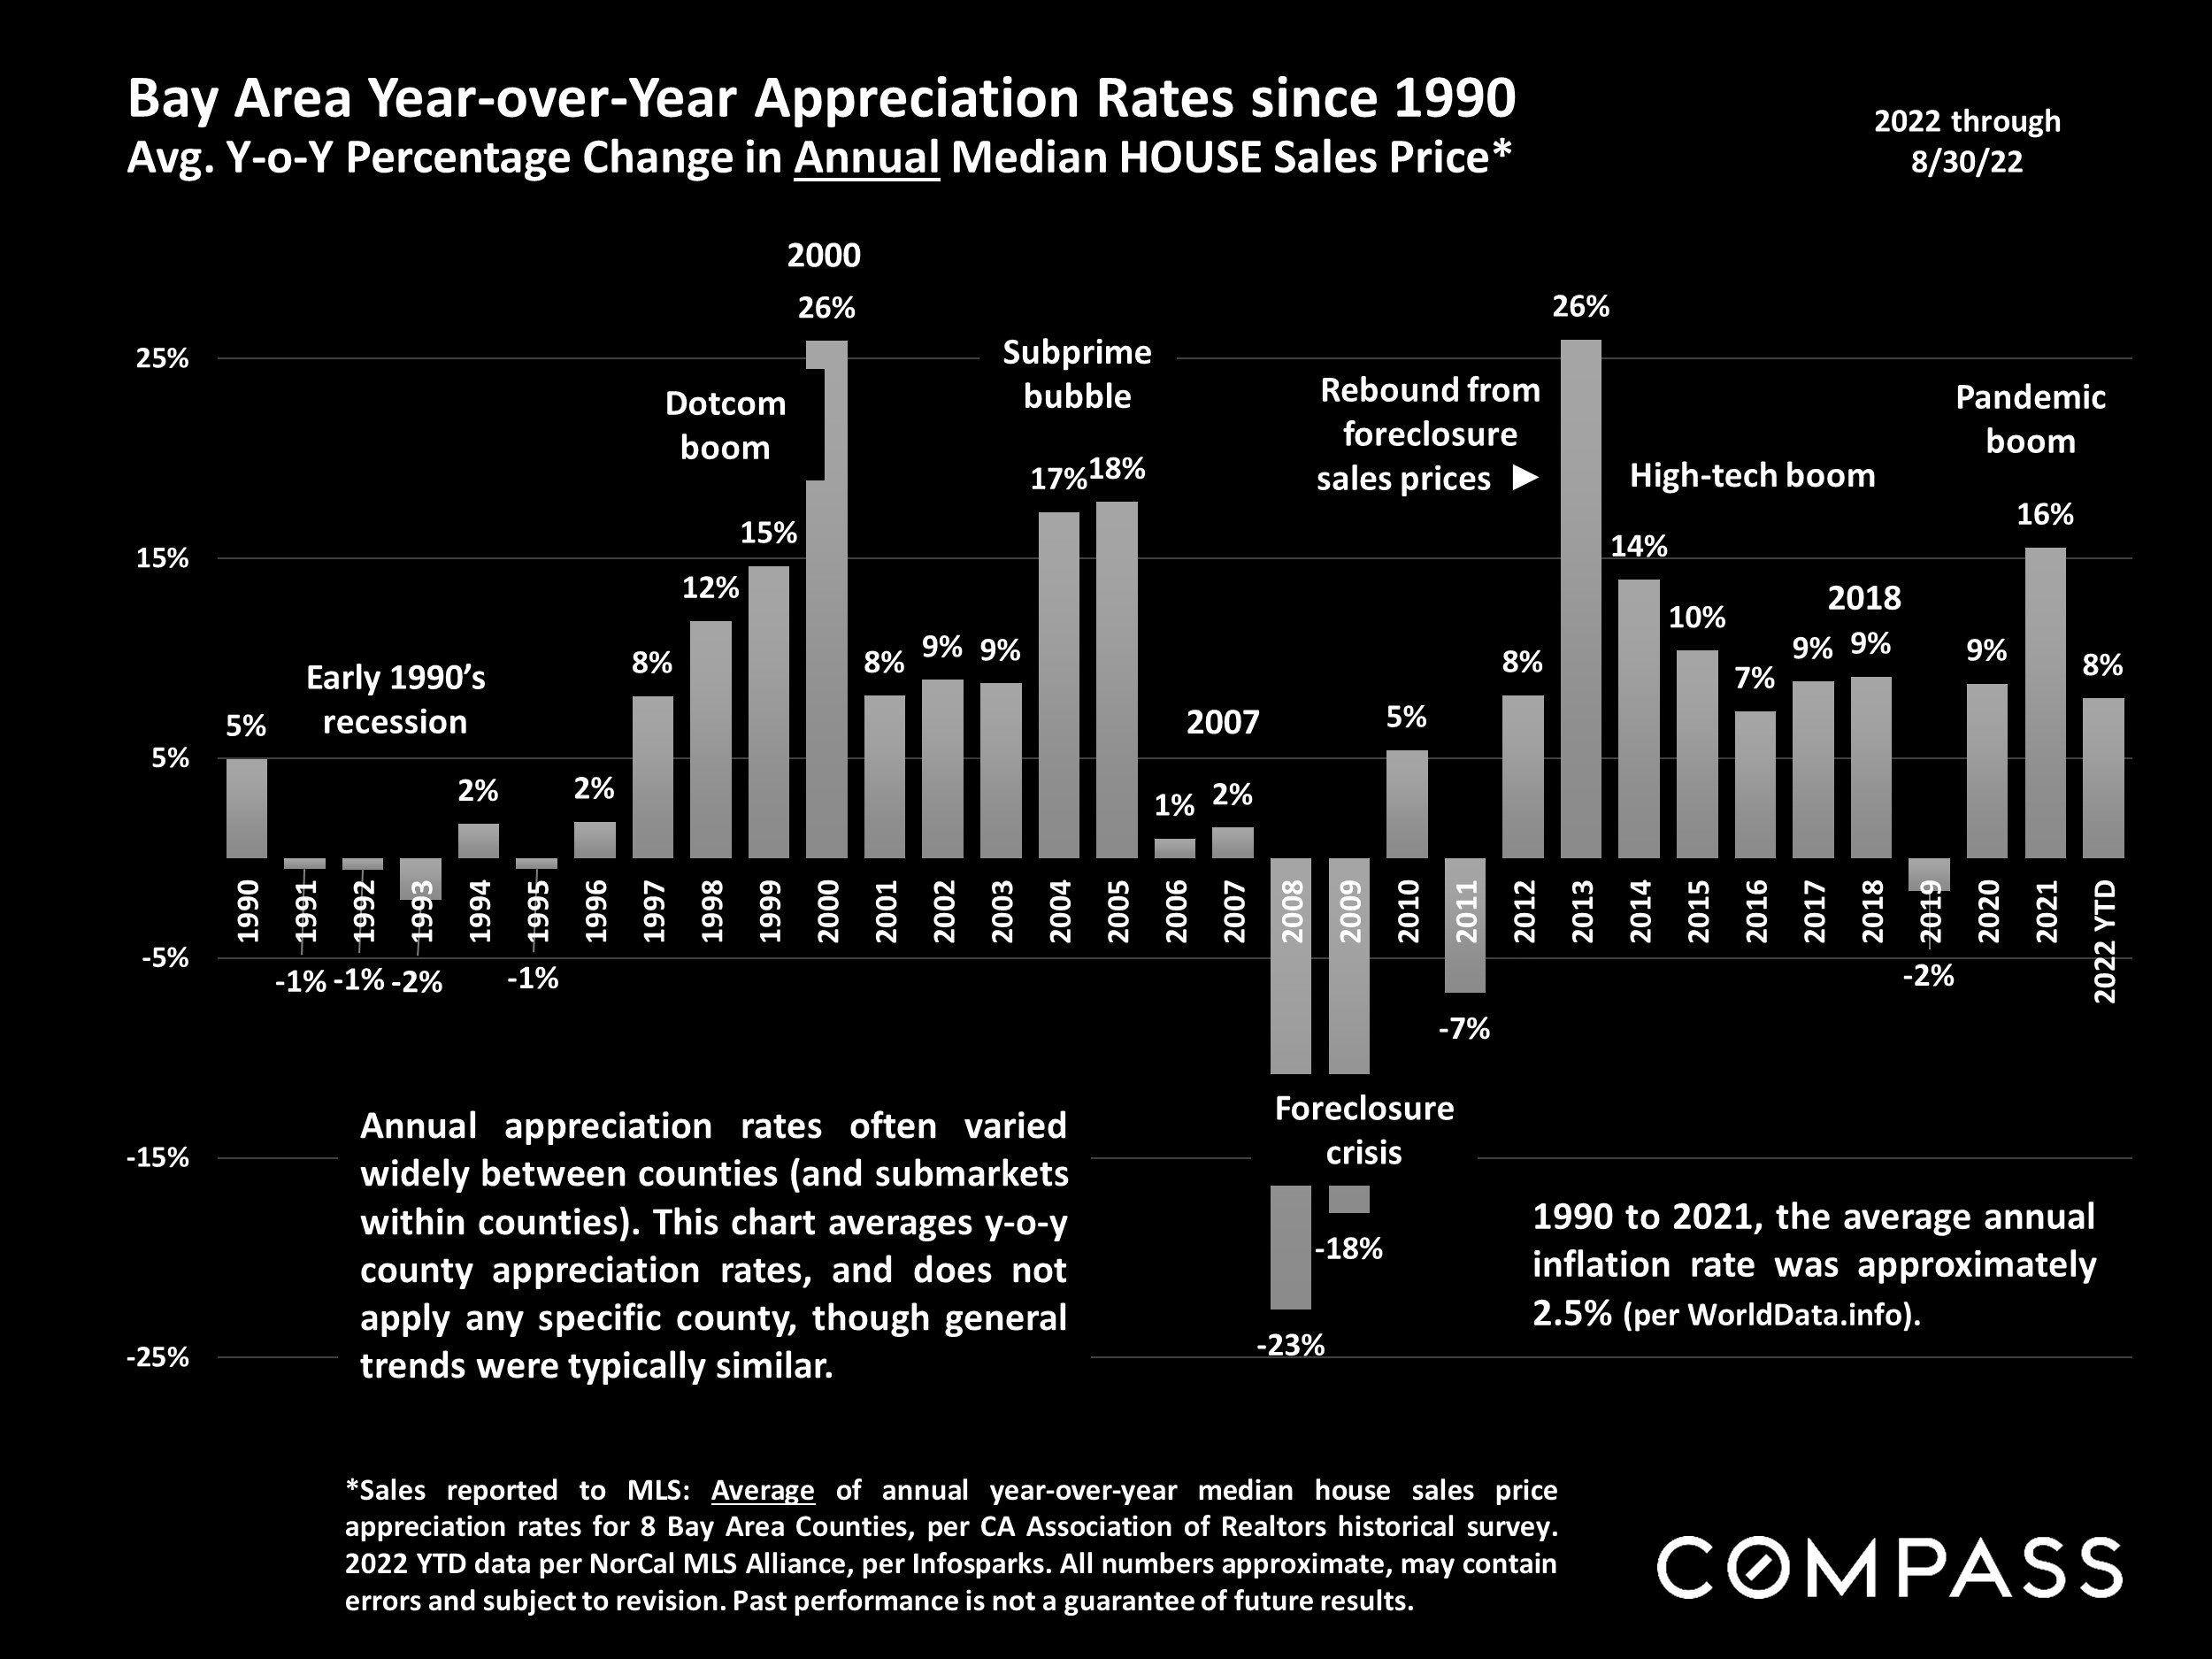
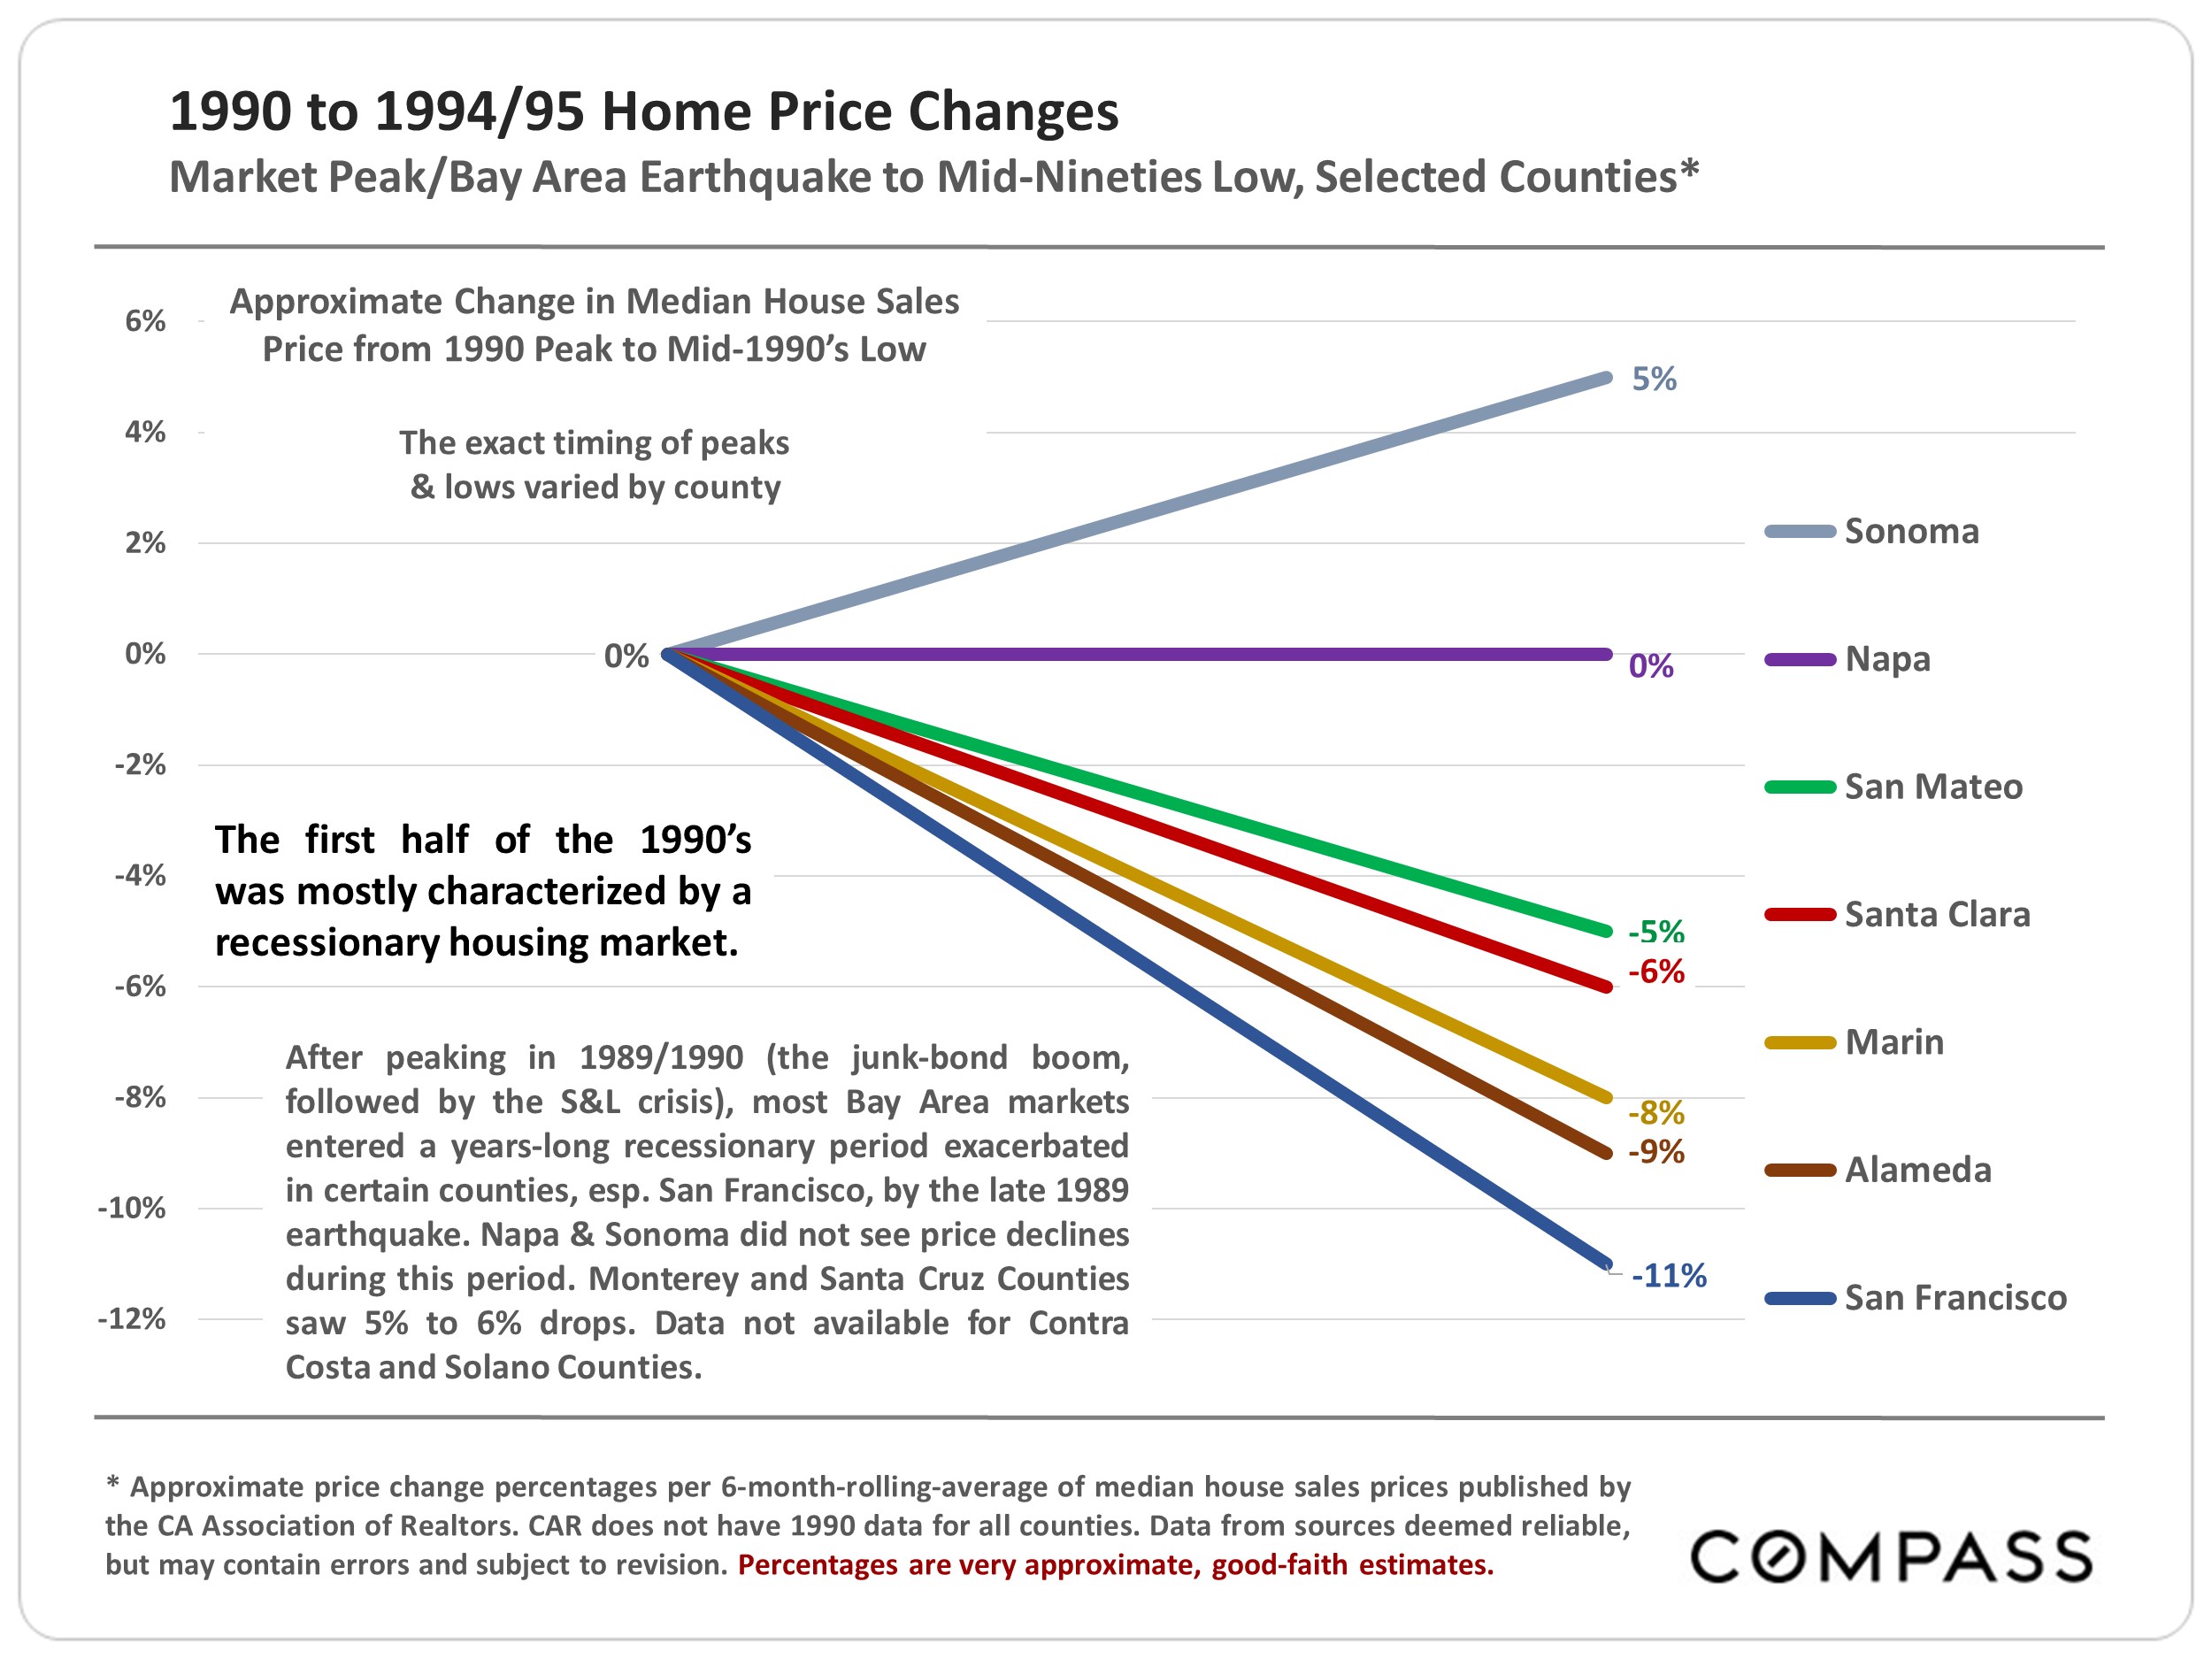
1st chart following: From 1990 – following the late 1980’s stock market peak, the S&L/junk bond crisis, and 1989 earthquake – through the recession to the mid-1990’s, Bay Area real estate markets generally remained weak, with prices typically declining 5% to 11% within the period.
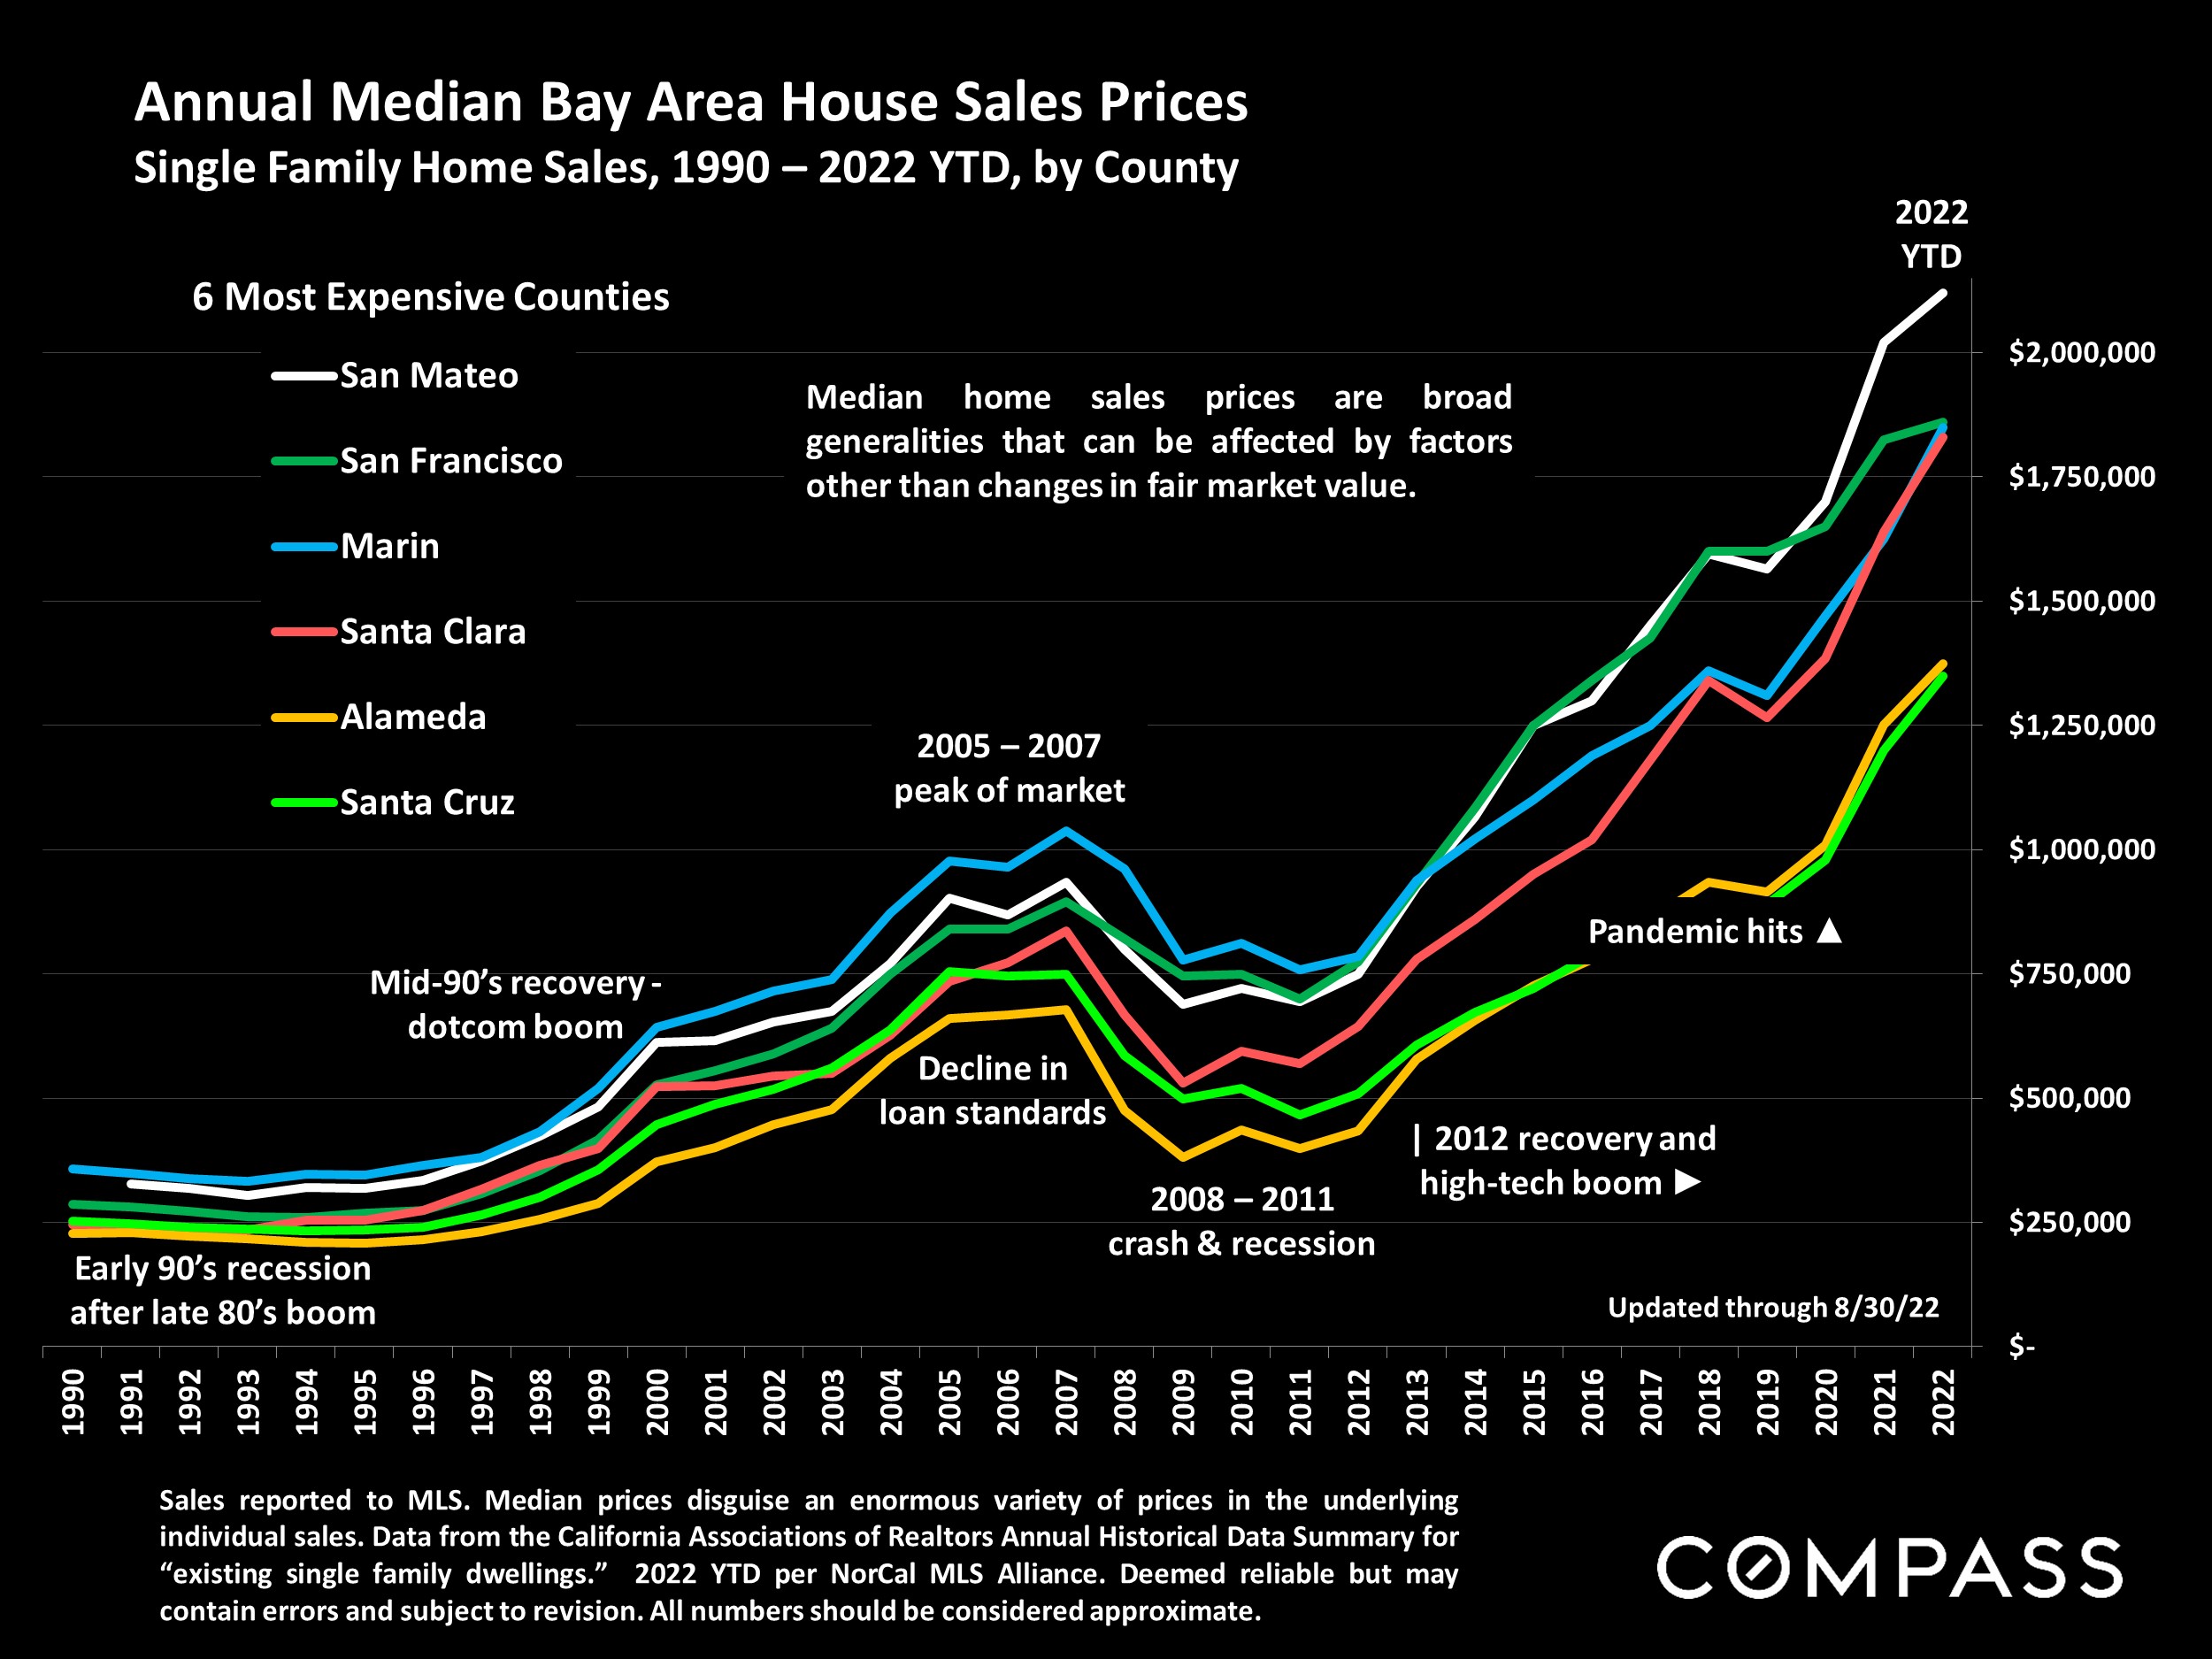
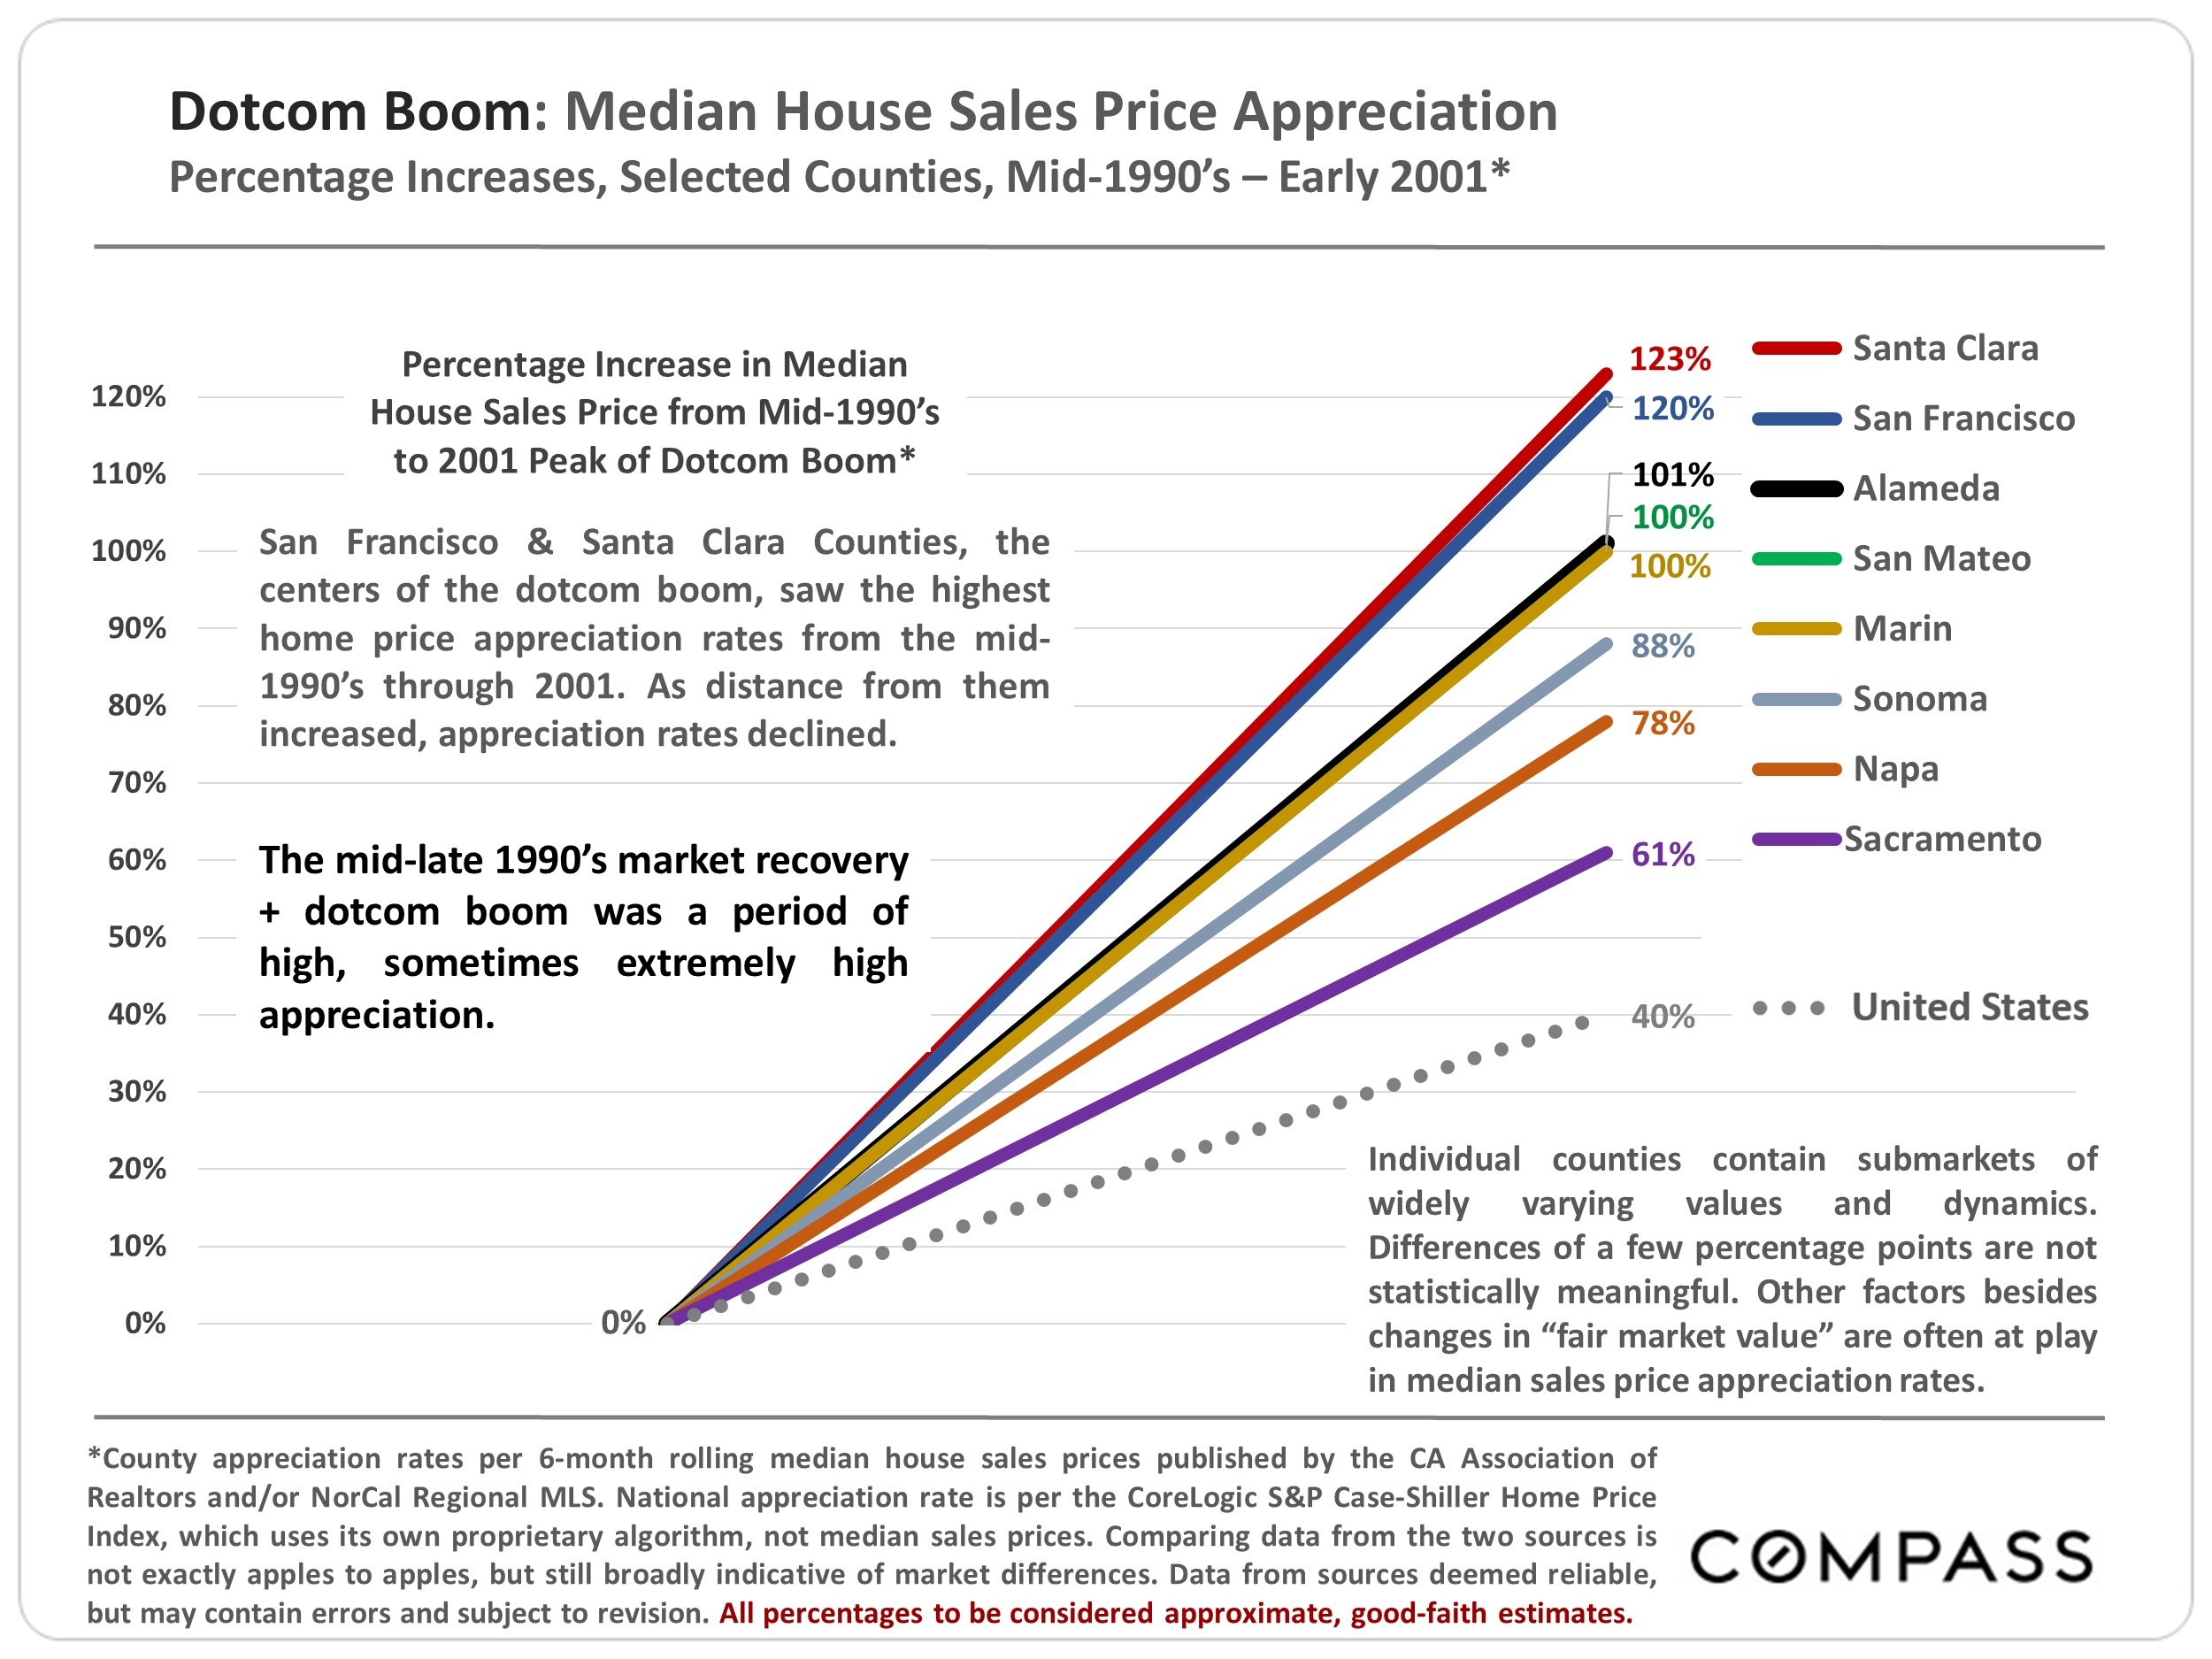
2nd chart: In the middle of the decade, markets began to recover, with home prices subsequently accelerating rapidly during the dotcom boom. Once the dotcom boom got going, San Francisco and Santa Clara Counties, the centers of the phenomenon, saw the highest appreciation rates. Adjacent counties saw lower, though still substantial increases, with rates in the next circle of counties stepping down further. The Bay Area generally saw appreciation percentages peak dramatically in year 2000, the height of the dotcom bubble. National home-price appreciation during this period was considerably lower than in the Bay Area.
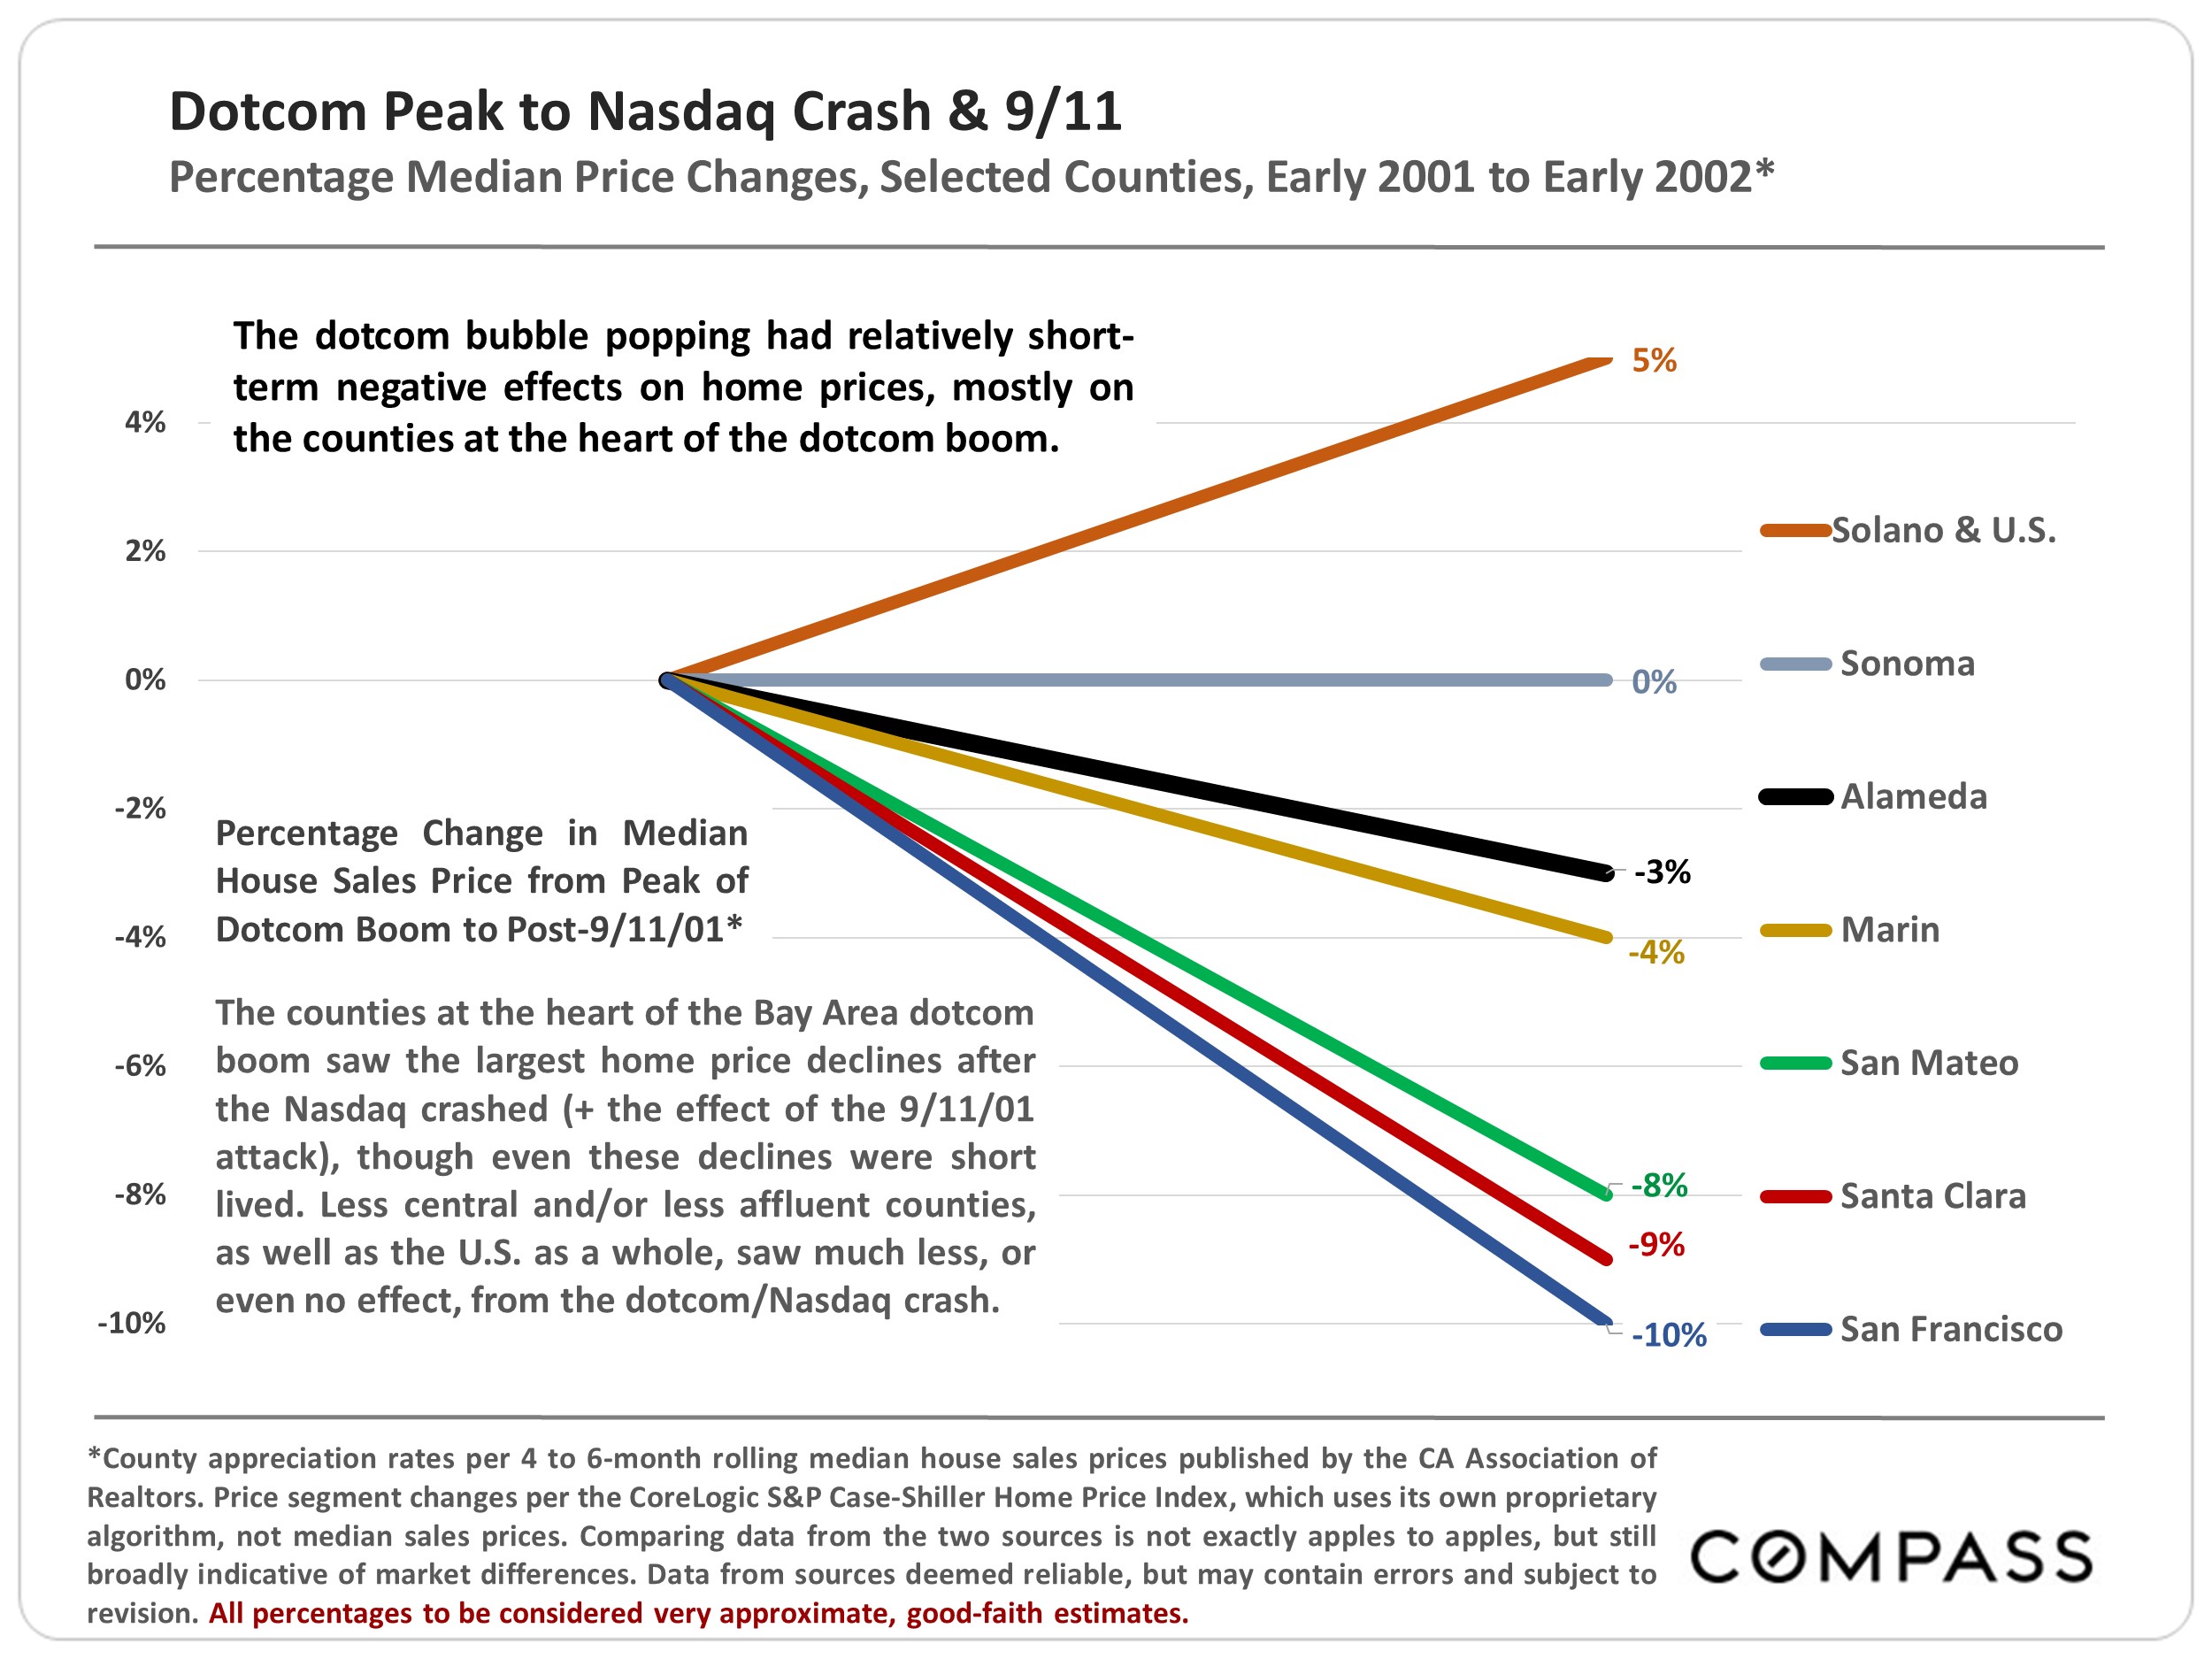
3rd chart: When dotcom hysteria collapsed and the Nasdaq crashed, only the inner Bay Area Counties – SF, San Mateo and Santa Clara, and those adjacent to them – saw significant (though relatively short lived) median price declines, while outer counties were generally unaffected. According to the CaseShiller Home Price Index for the multi-county San Francisco Metro Area, the dotcom collapse affected high-price home markets the most (-11%), low-priced homes not at all (+5%), and the mid-price segment somewhere in between (-5%). More affluent homeowners – also tending to be concentrated in inner Bay Area Counties – were most affected: Higher-price home markets are typically much more sensitive to negative changes or uncertainty in financial markets. After 9/11, the Fed intervened to lower interest rates and support the economy, and the downturn passed, gradually transitioning into the subprime bubble.
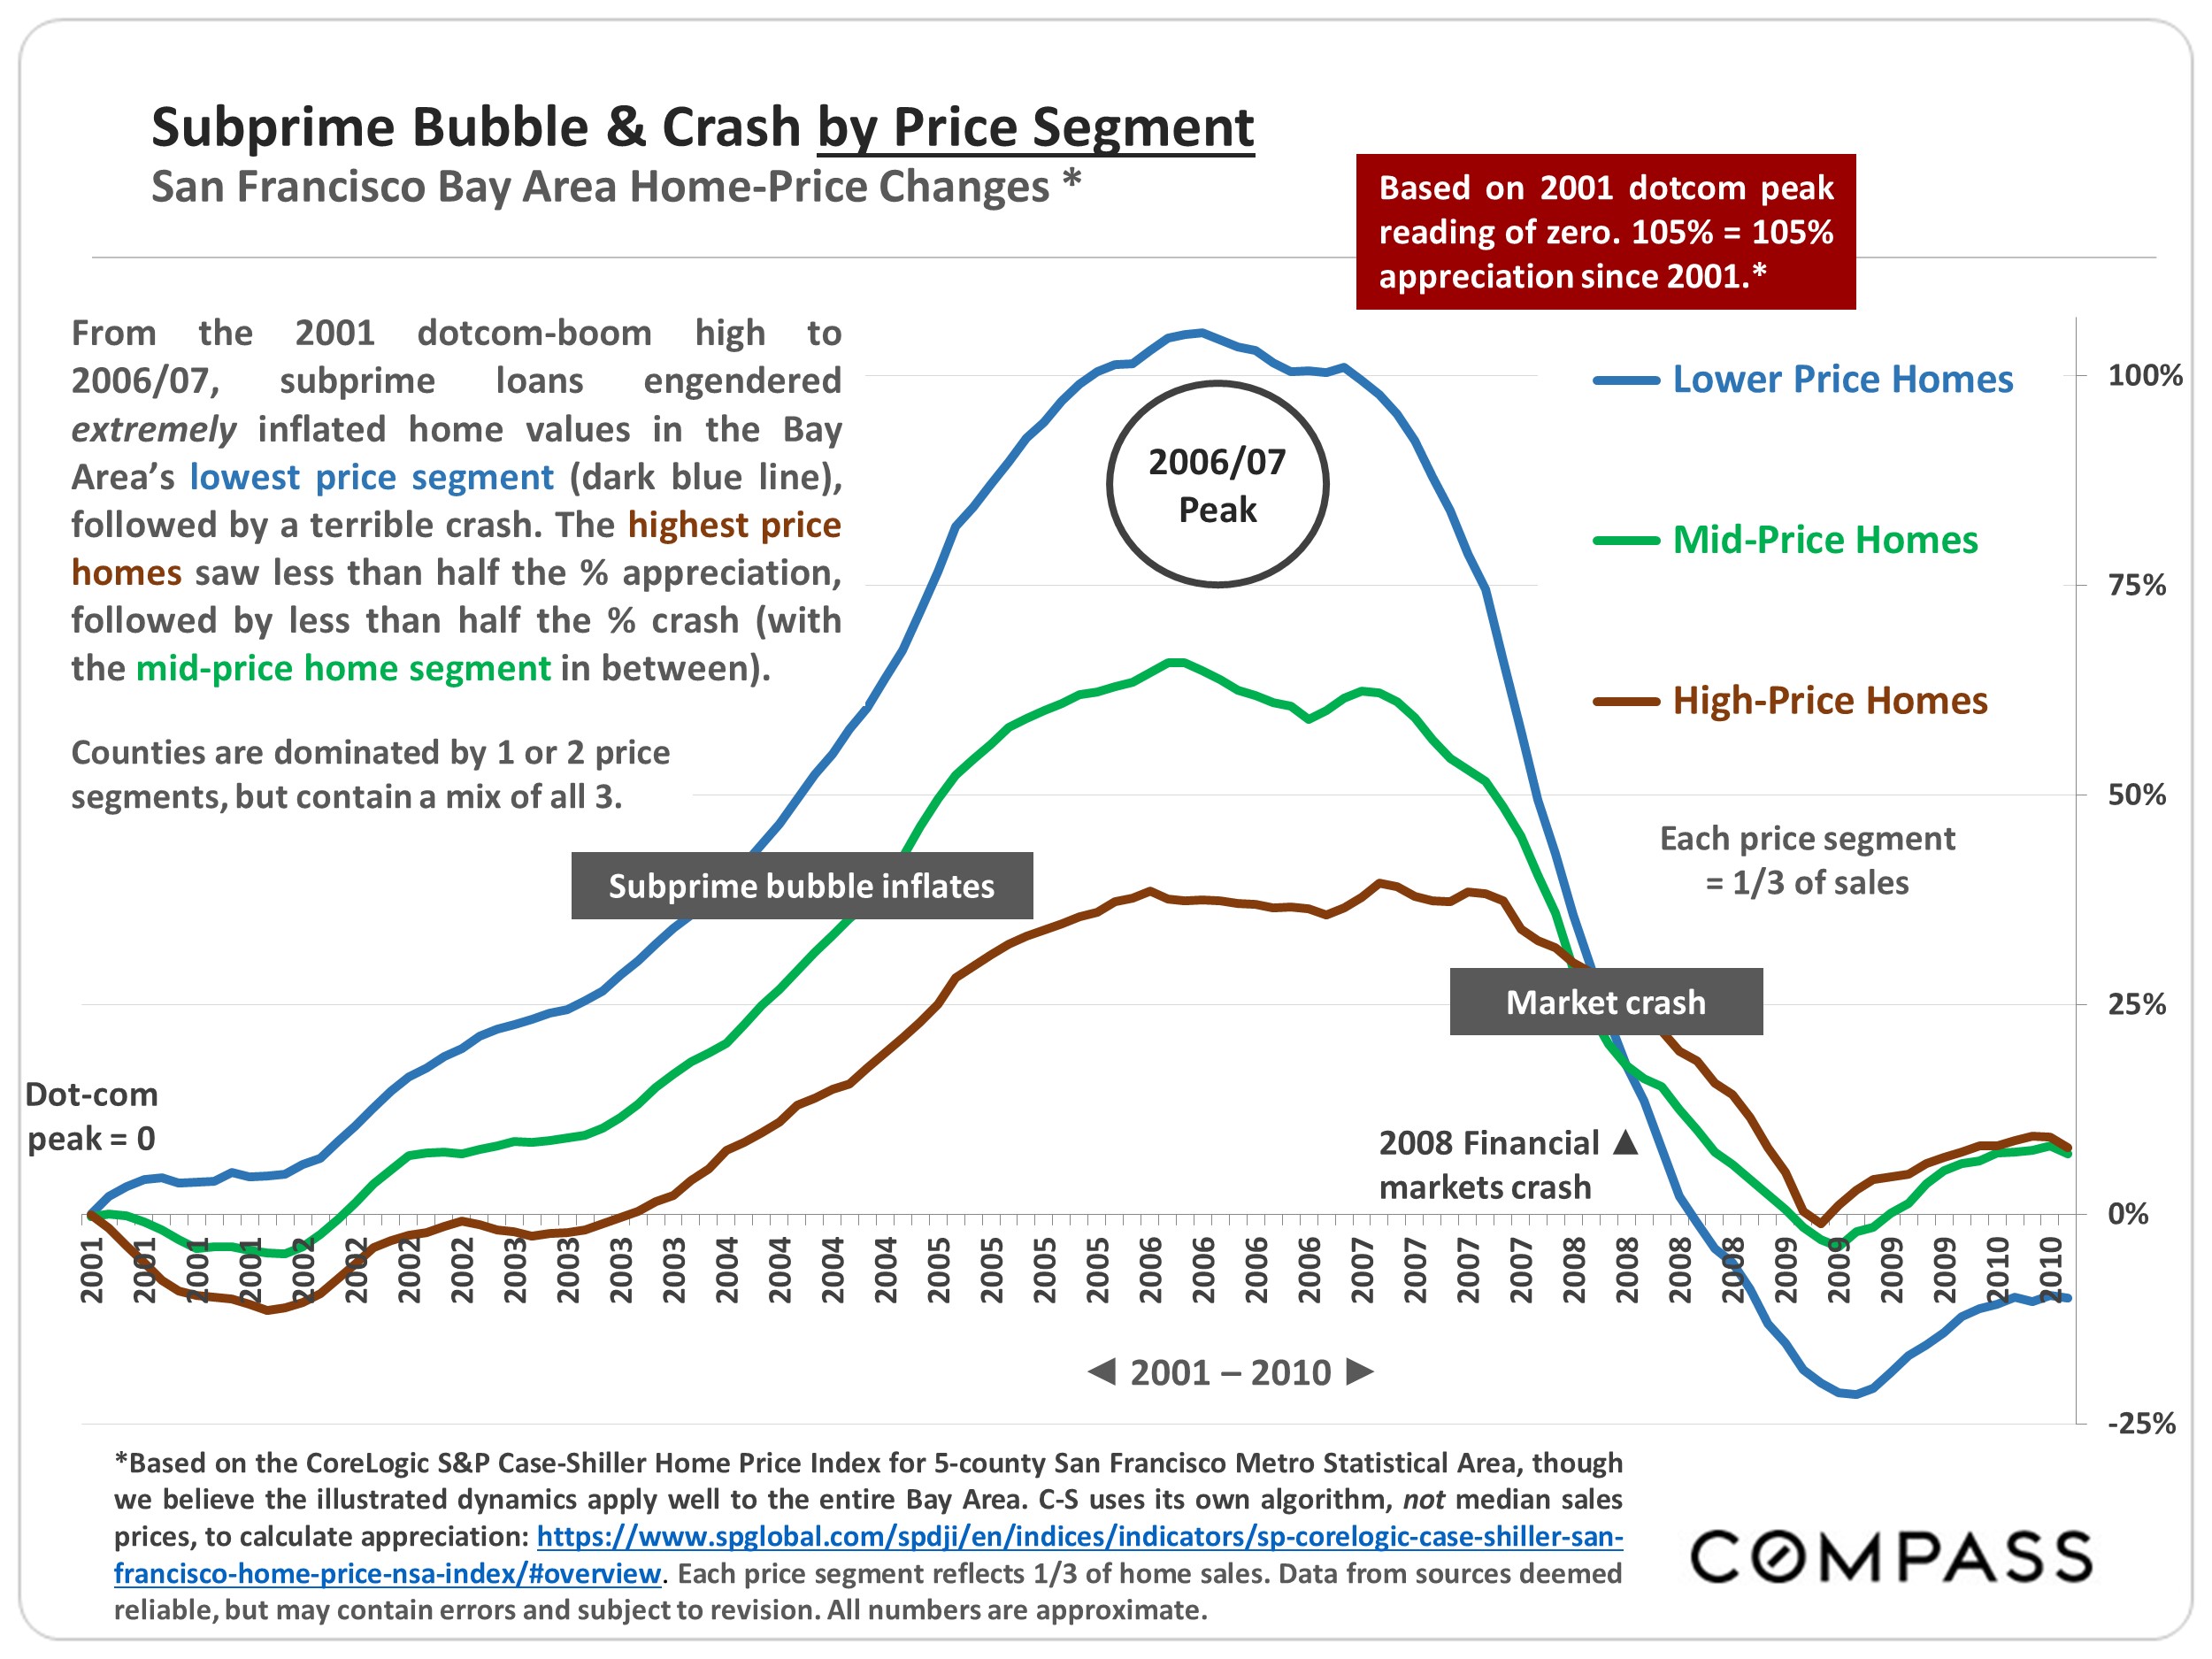
The Subprime Bubble
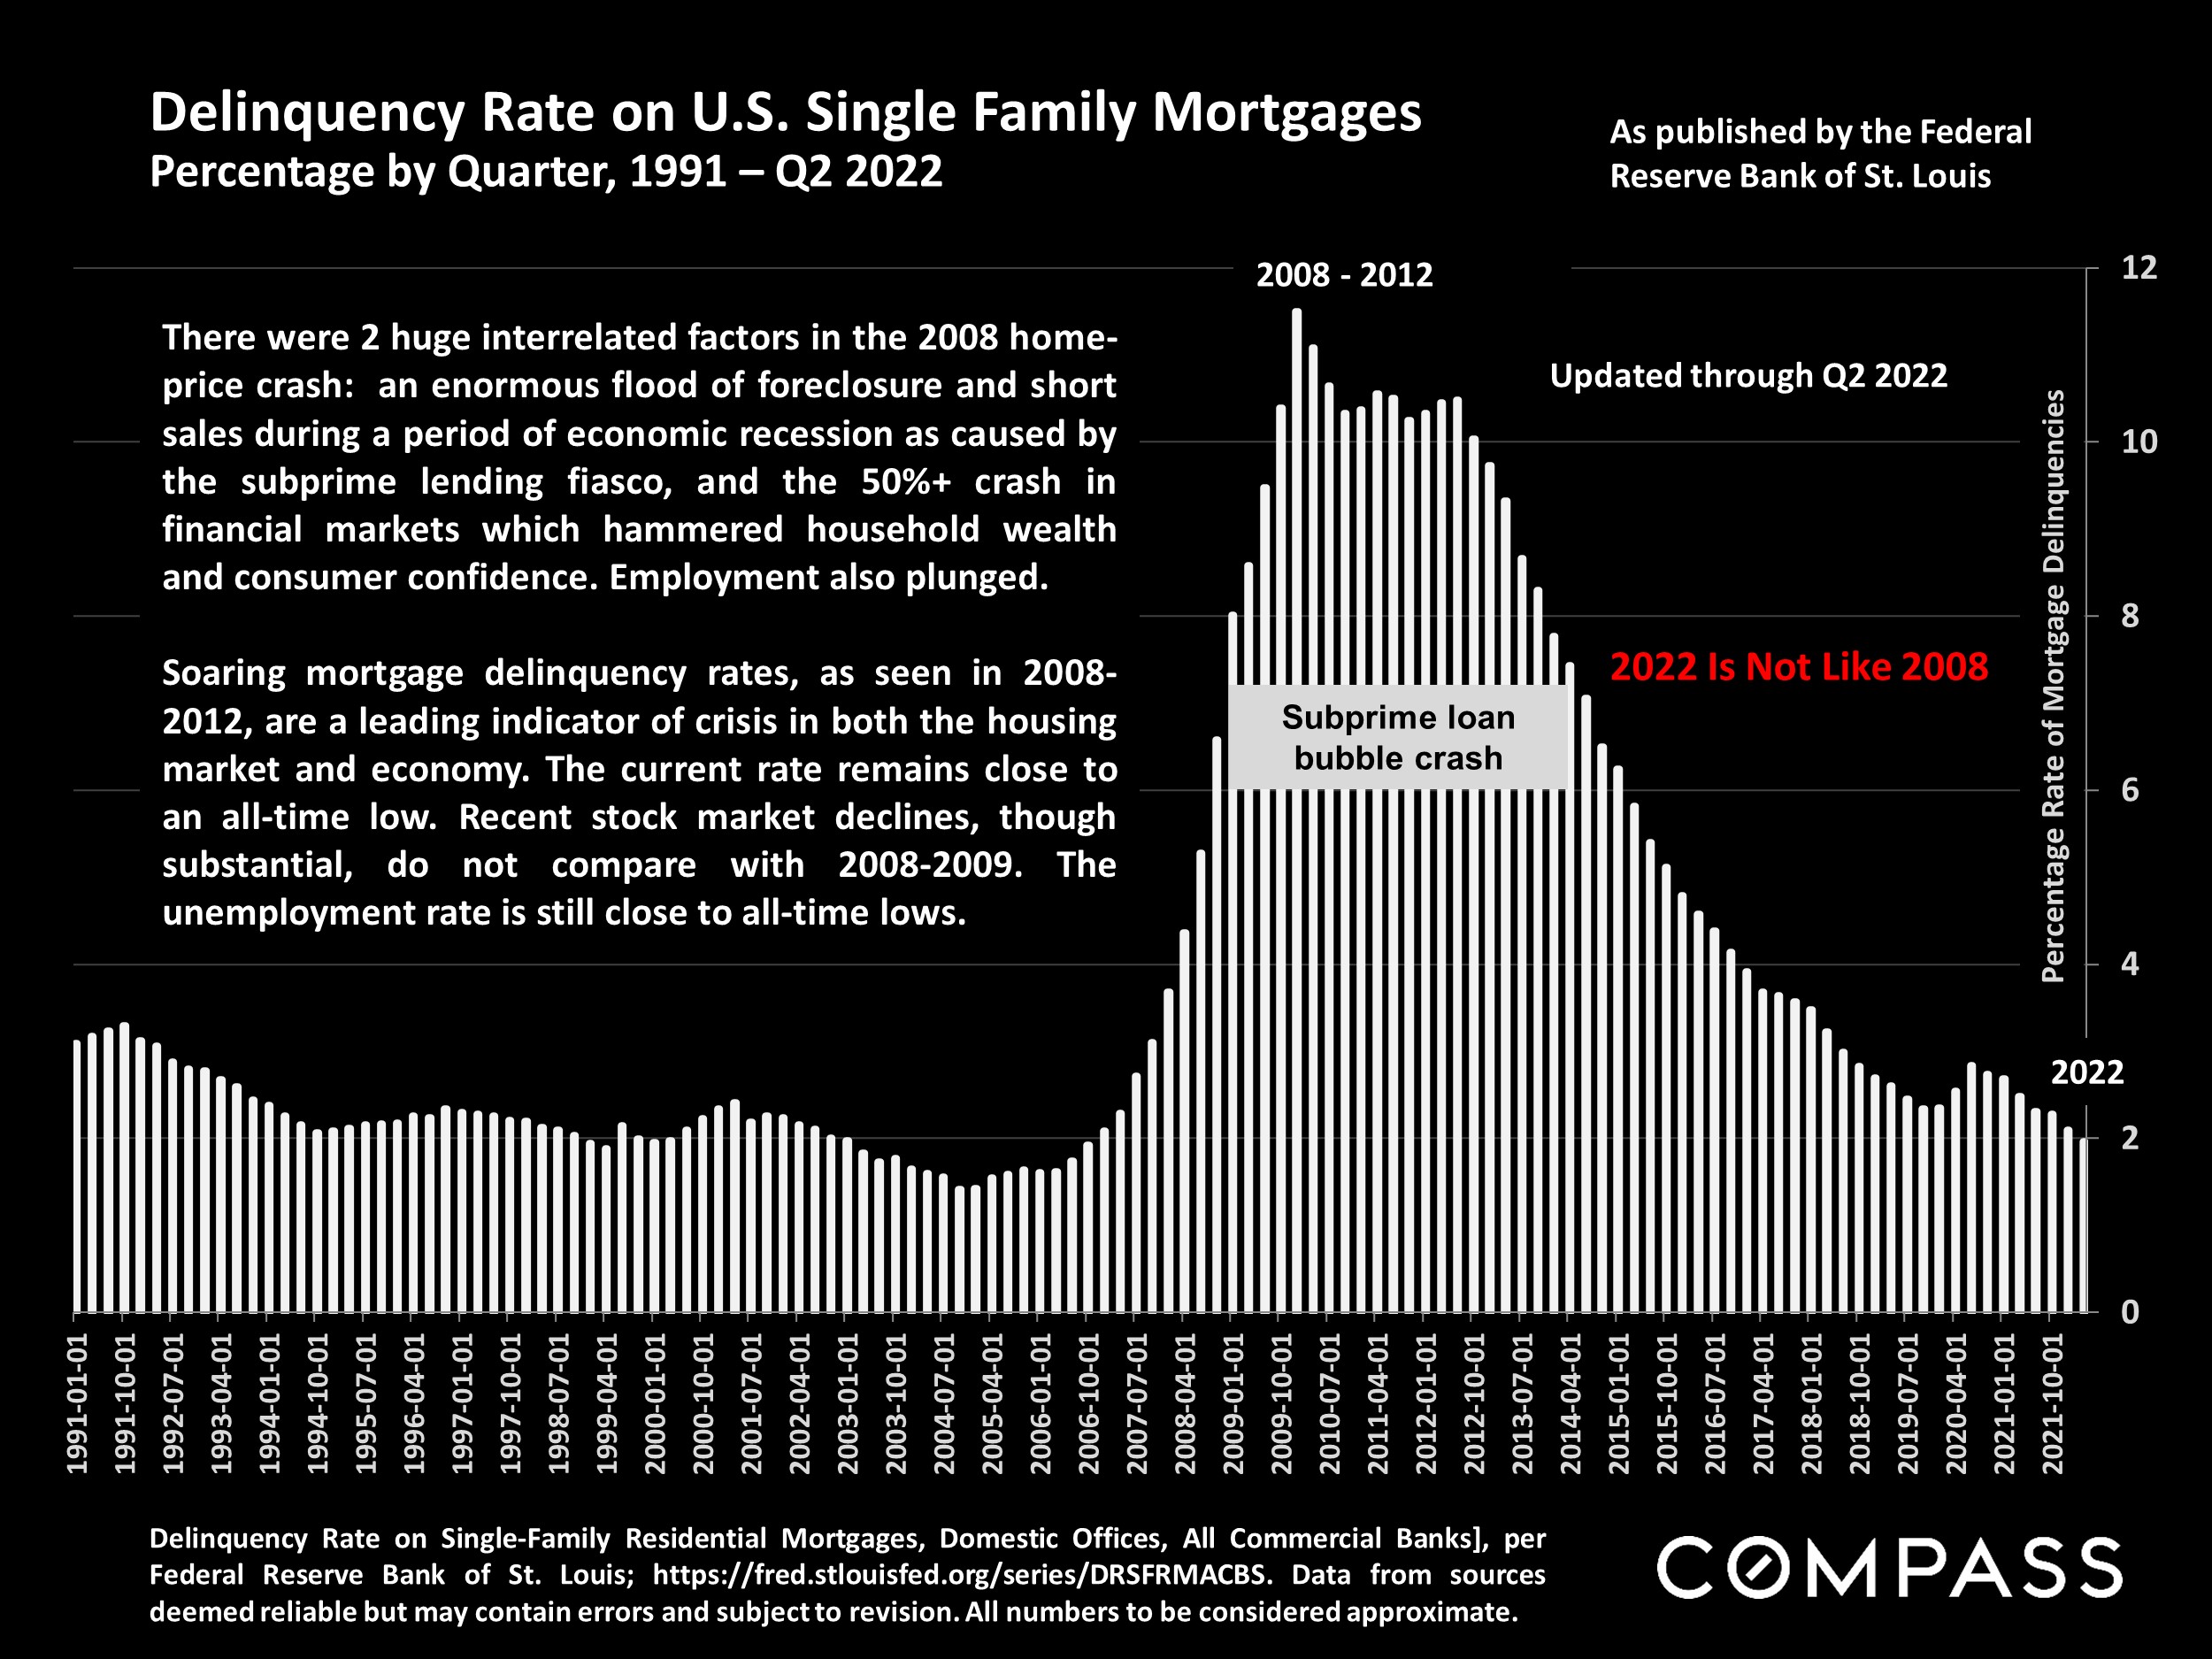
The subprime bubble and crash was an anomalous situation caused by loose monetary policy, predatory lending practices, the abandonment of underwriting standards, dishonest financial engineering on Wall Street, bond-rating fraud, and irrational exuberance in financial markets. This led tens of millions of borrowers to take on purchase and refinance loans unaffordable from the moment deceptive “teaser rates” expired. (We believe giving vast numbers of loans to unqualified borrowers, then using these junk loans to create the “A” rated securities which almost caused a worldwide great depression to be anomalous. Perhaps we’re being naive.) When the music stopped, a crash in financial markets, and a tsunami of foreclosure and short sales created a fast, deep spiral of home-price declines.
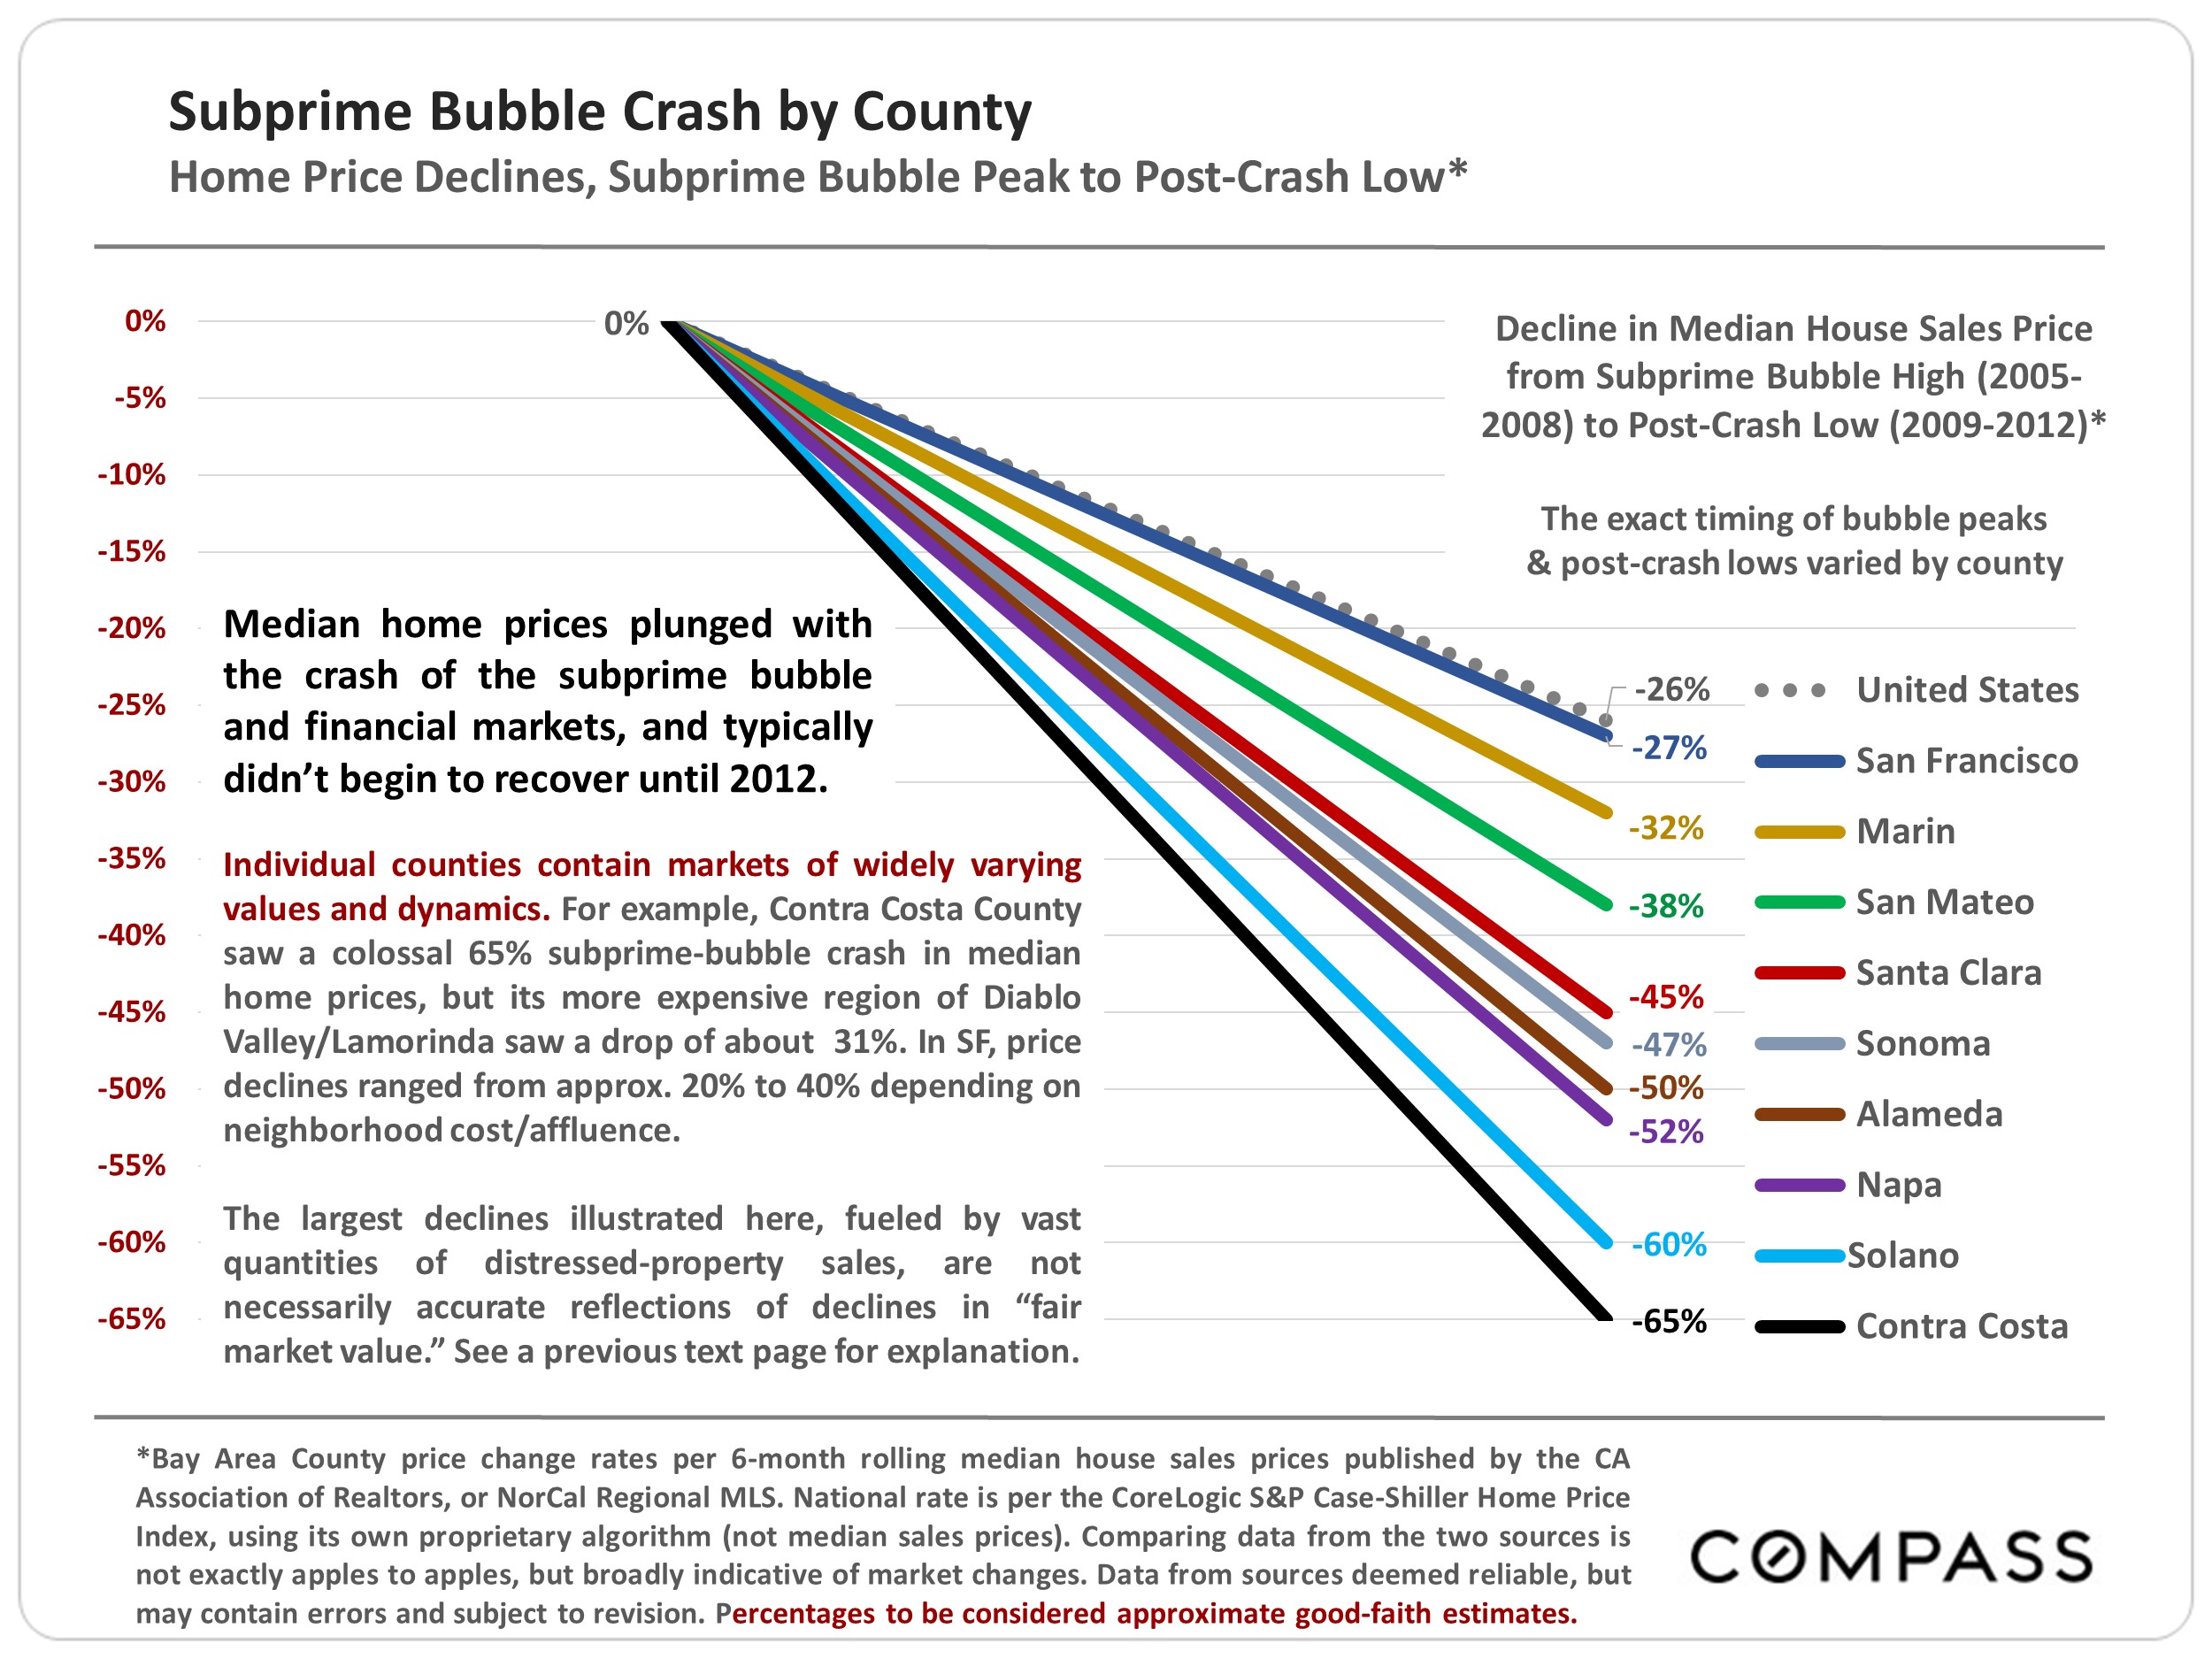
The crisis resulted in large numbers of homes being sold for well below fair market value, which distorts the meaningfulness of median sales price changes during this period. Enormous median price declines occurred, sometimes exceeding 45% (see following charts). “Distressed” homes sold during the great recession at unnaturally depressed prices: These transactions typically entailed sellers, often banks, desperate to sell, and often entailed more hassle, time, uncertainty and risk for buyers. And the homes were often in significantly poorer condition than the norm.
Part of the definition for “fair market value” is that the seller is not in a situation of being forced to sell quickly. Sellers of foreclosures & short sales – whether homeowners or banks – were usually in urgent distress: This undermined fair market value and provided excellent deals for buyers and hedge funds.
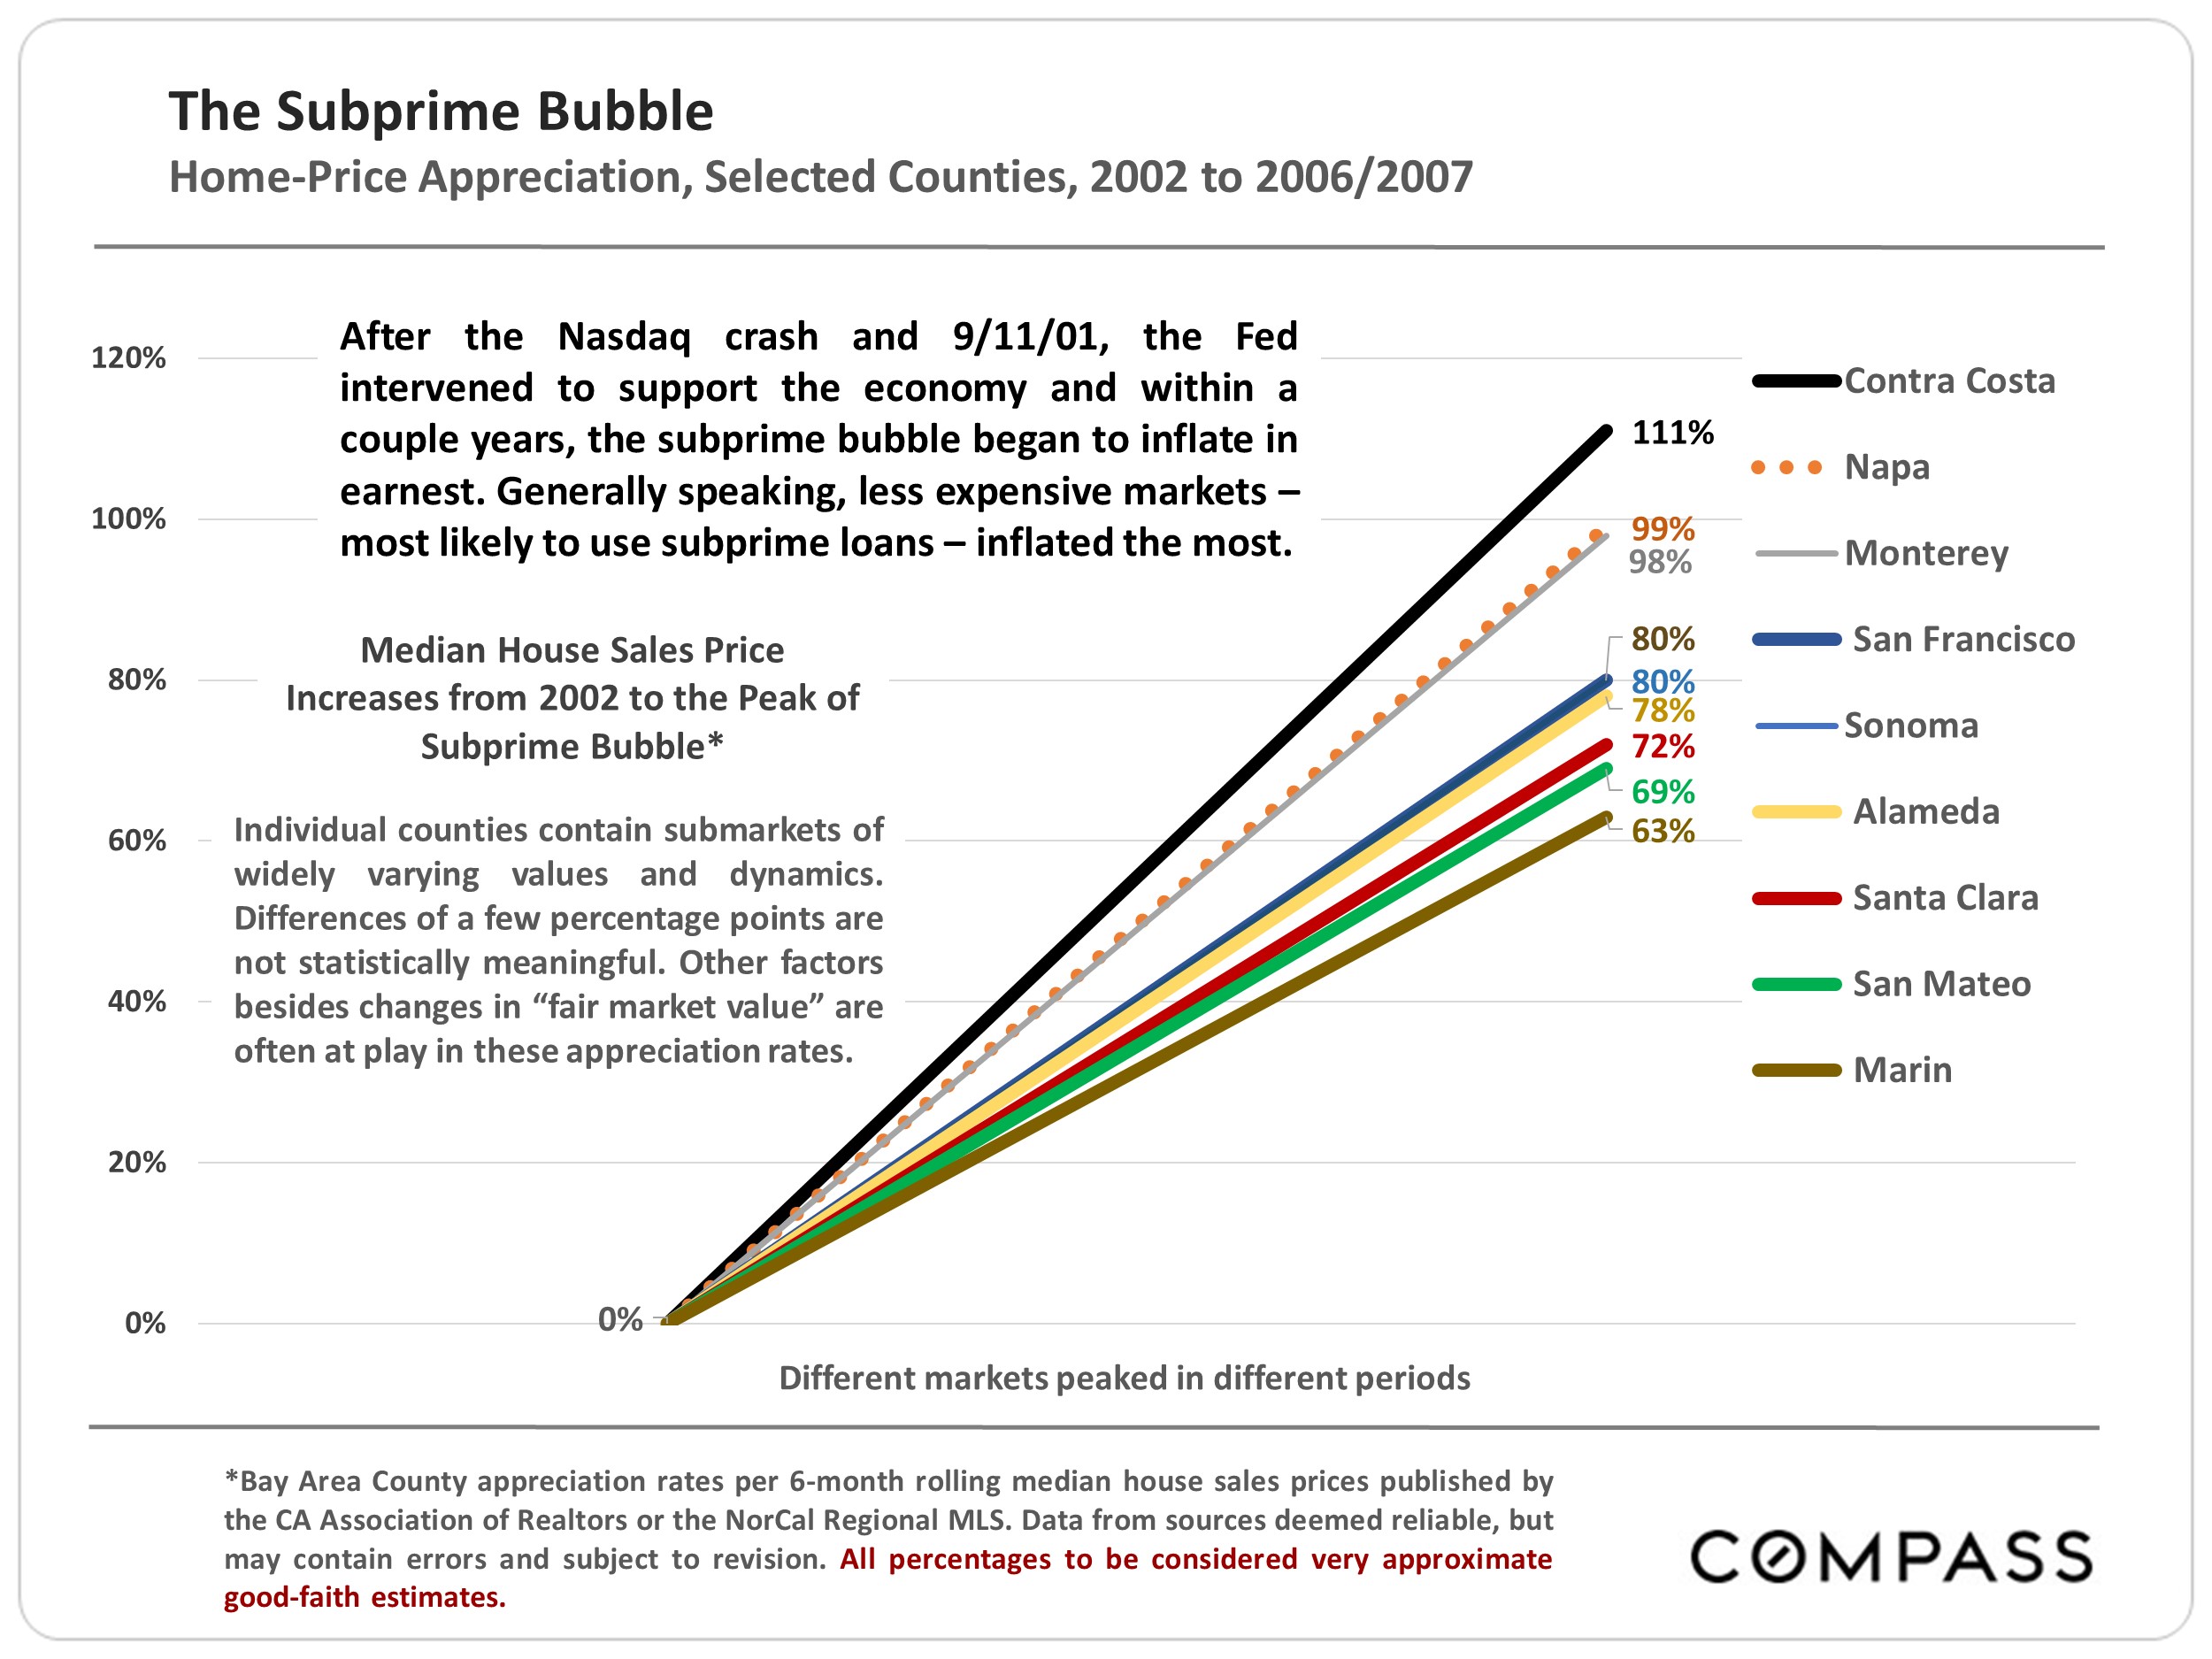
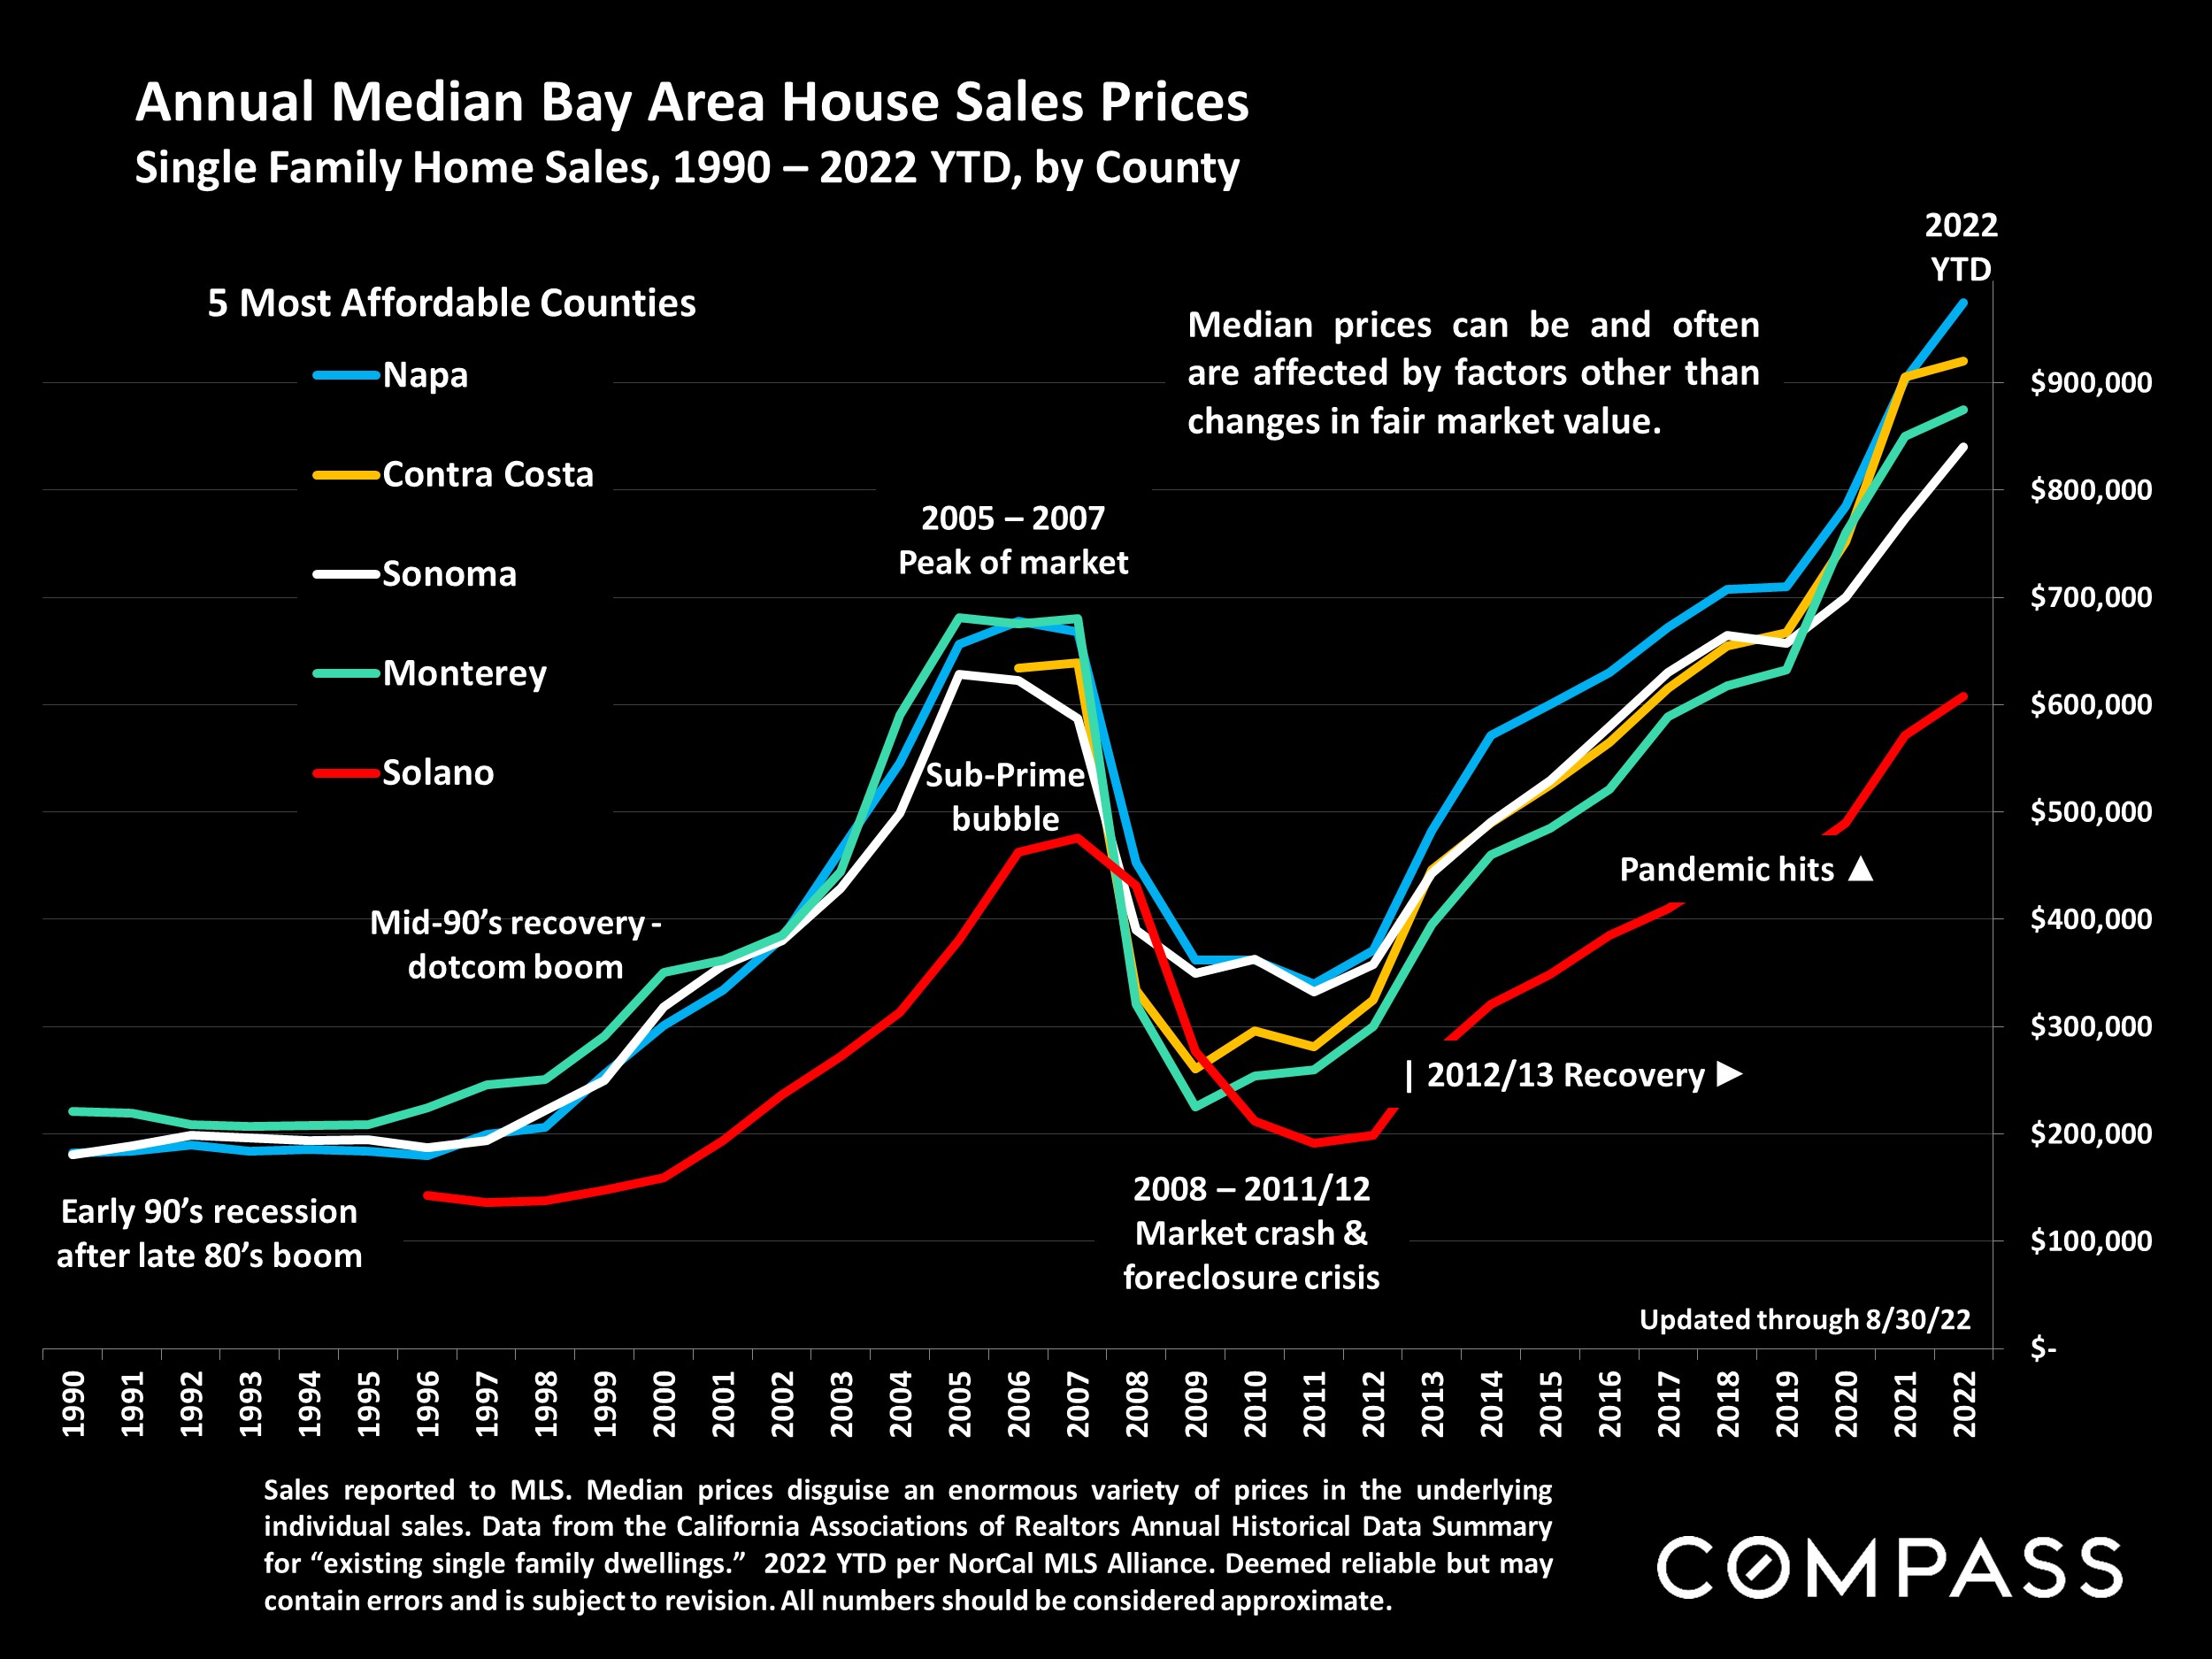
Less expensive, less affluent, less financially sophisticated markets were hammered worst by predatory lending and subprime loans, seeing huge bubbles and crashes. The most expensive/affluent markets saw much smaller bubbles, and smaller, but still significant price declines, probably caused more by the financial markets crash than by a relatively low number of distressed-home sales. Effects varied greatly by community within counties, generally correlating to cost/affluence: Prices in less expensive markets often dropped twice as much as in more affluent communities within the same county.
The next 2 charts look at this period first by price segment, then at the size of subprime-bubble price declines by county.
Recovery from the Subprime/Financial Markets Crash
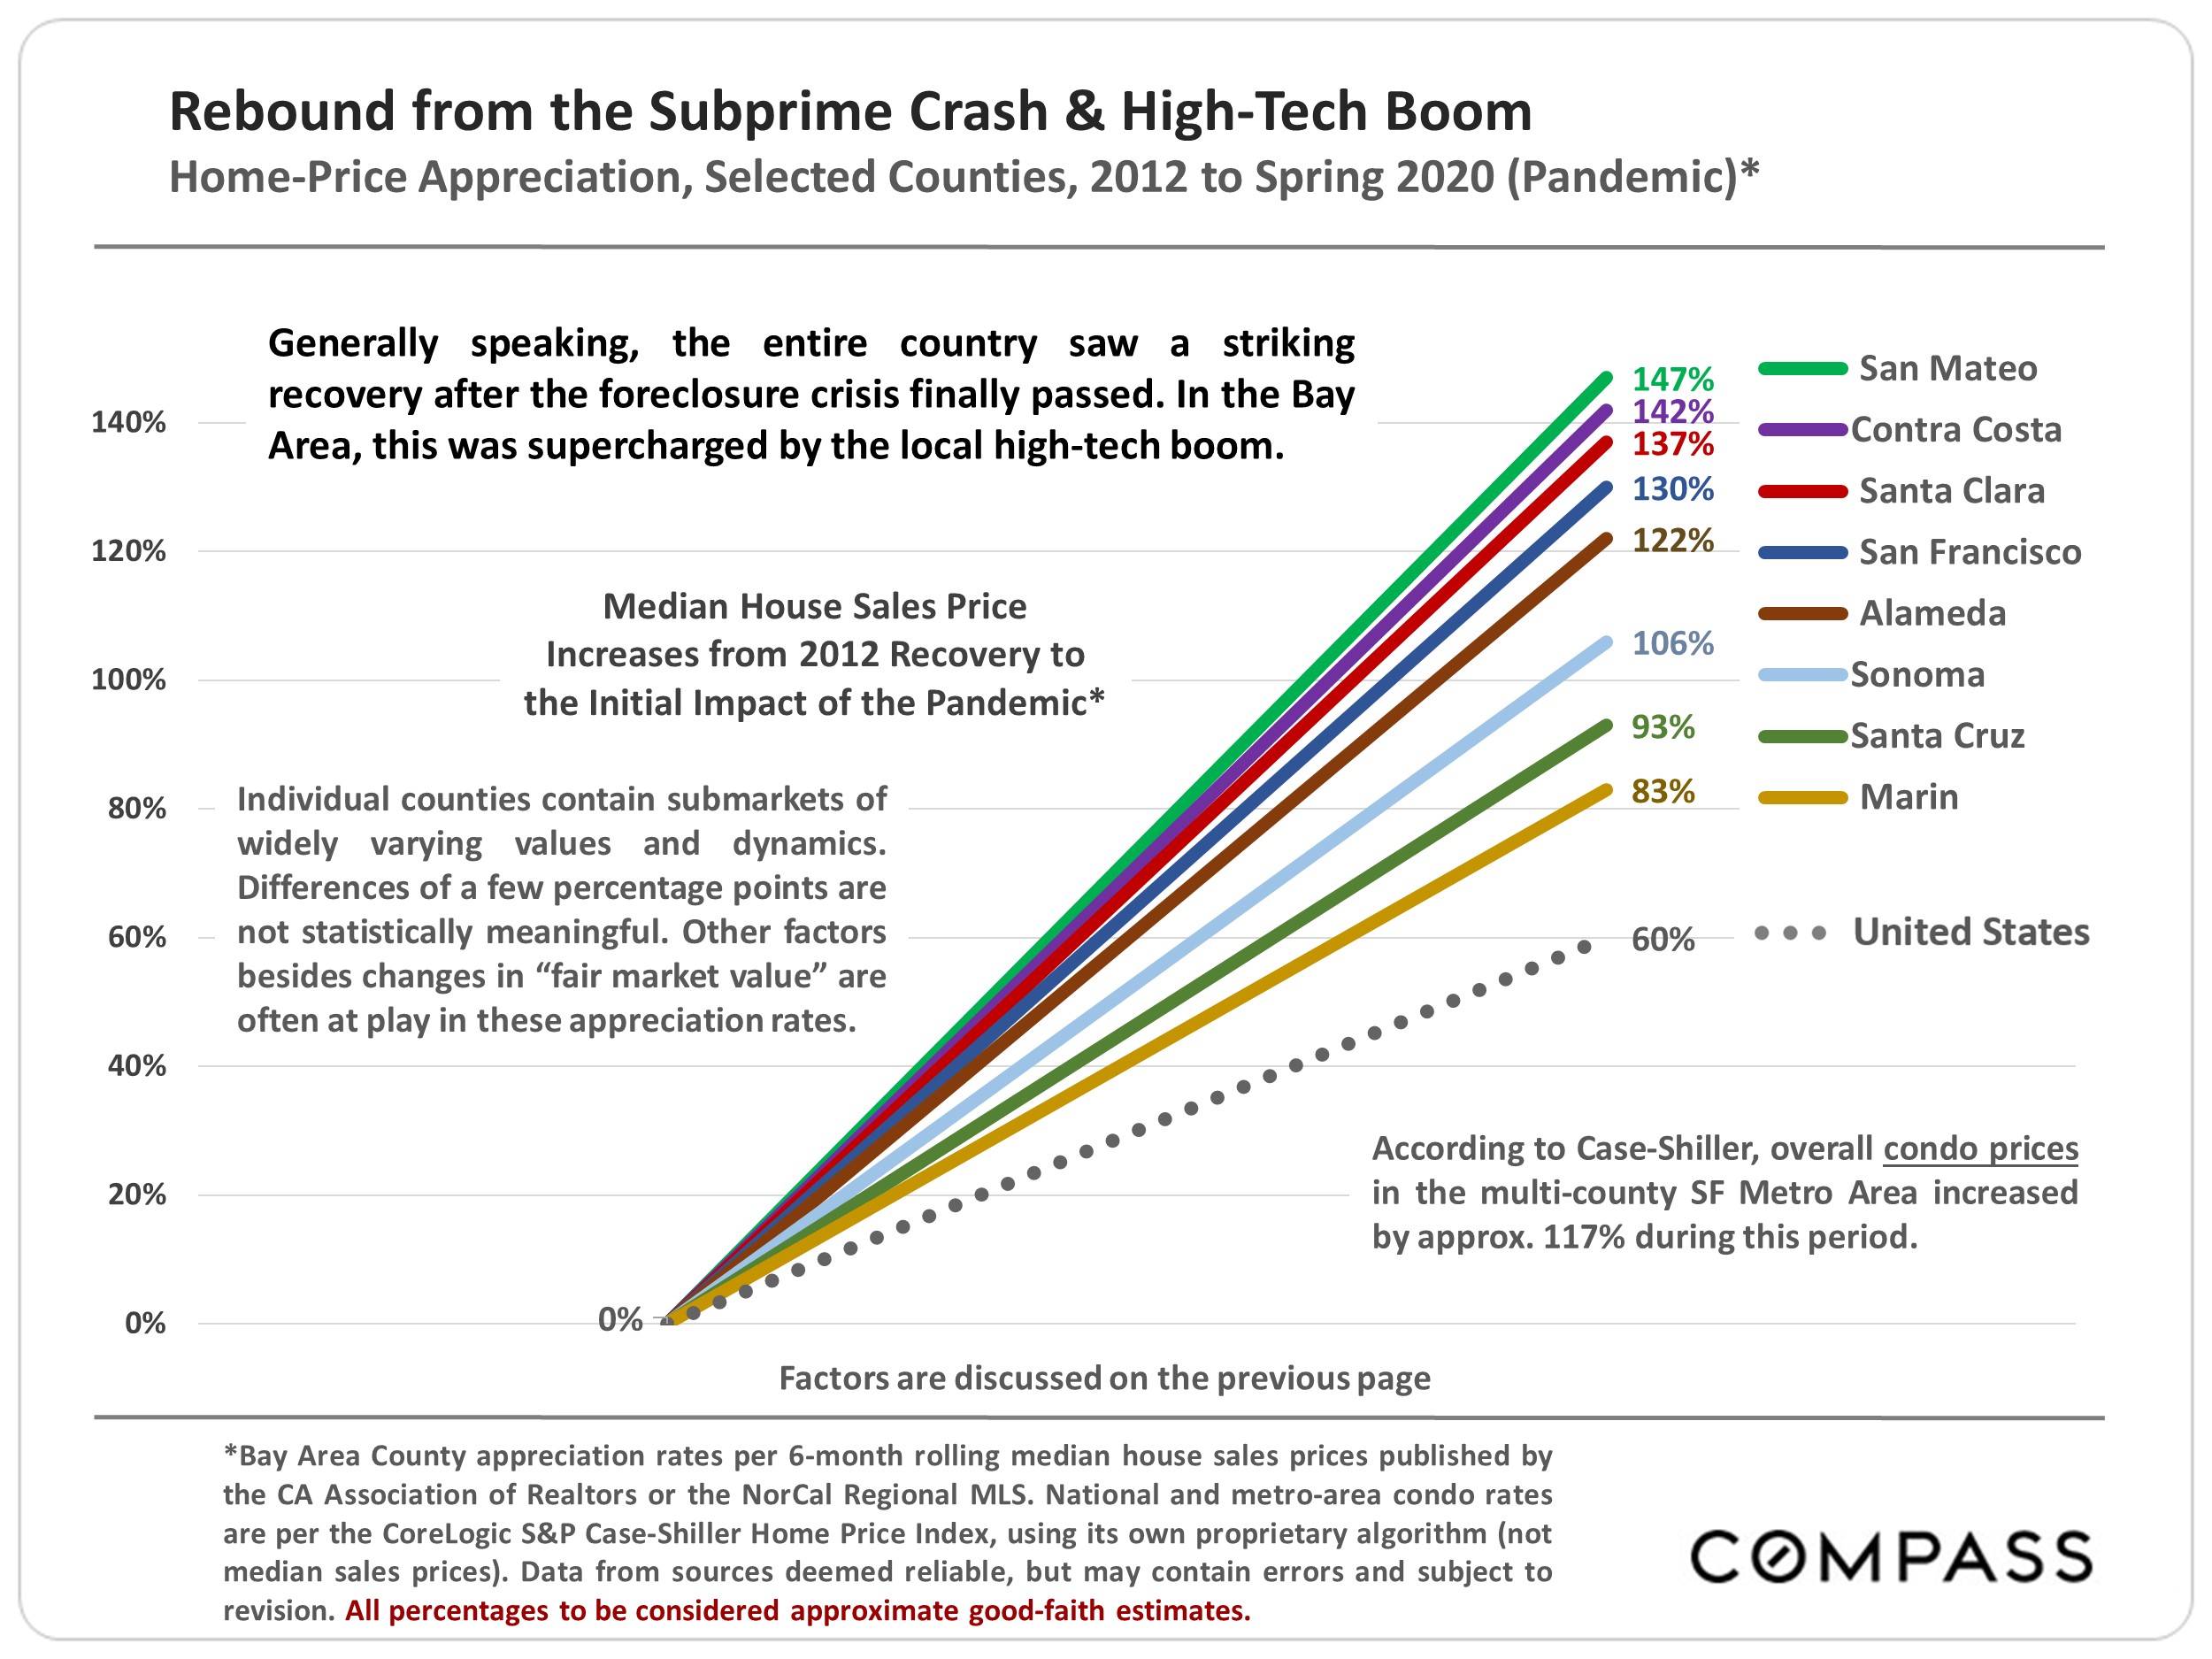
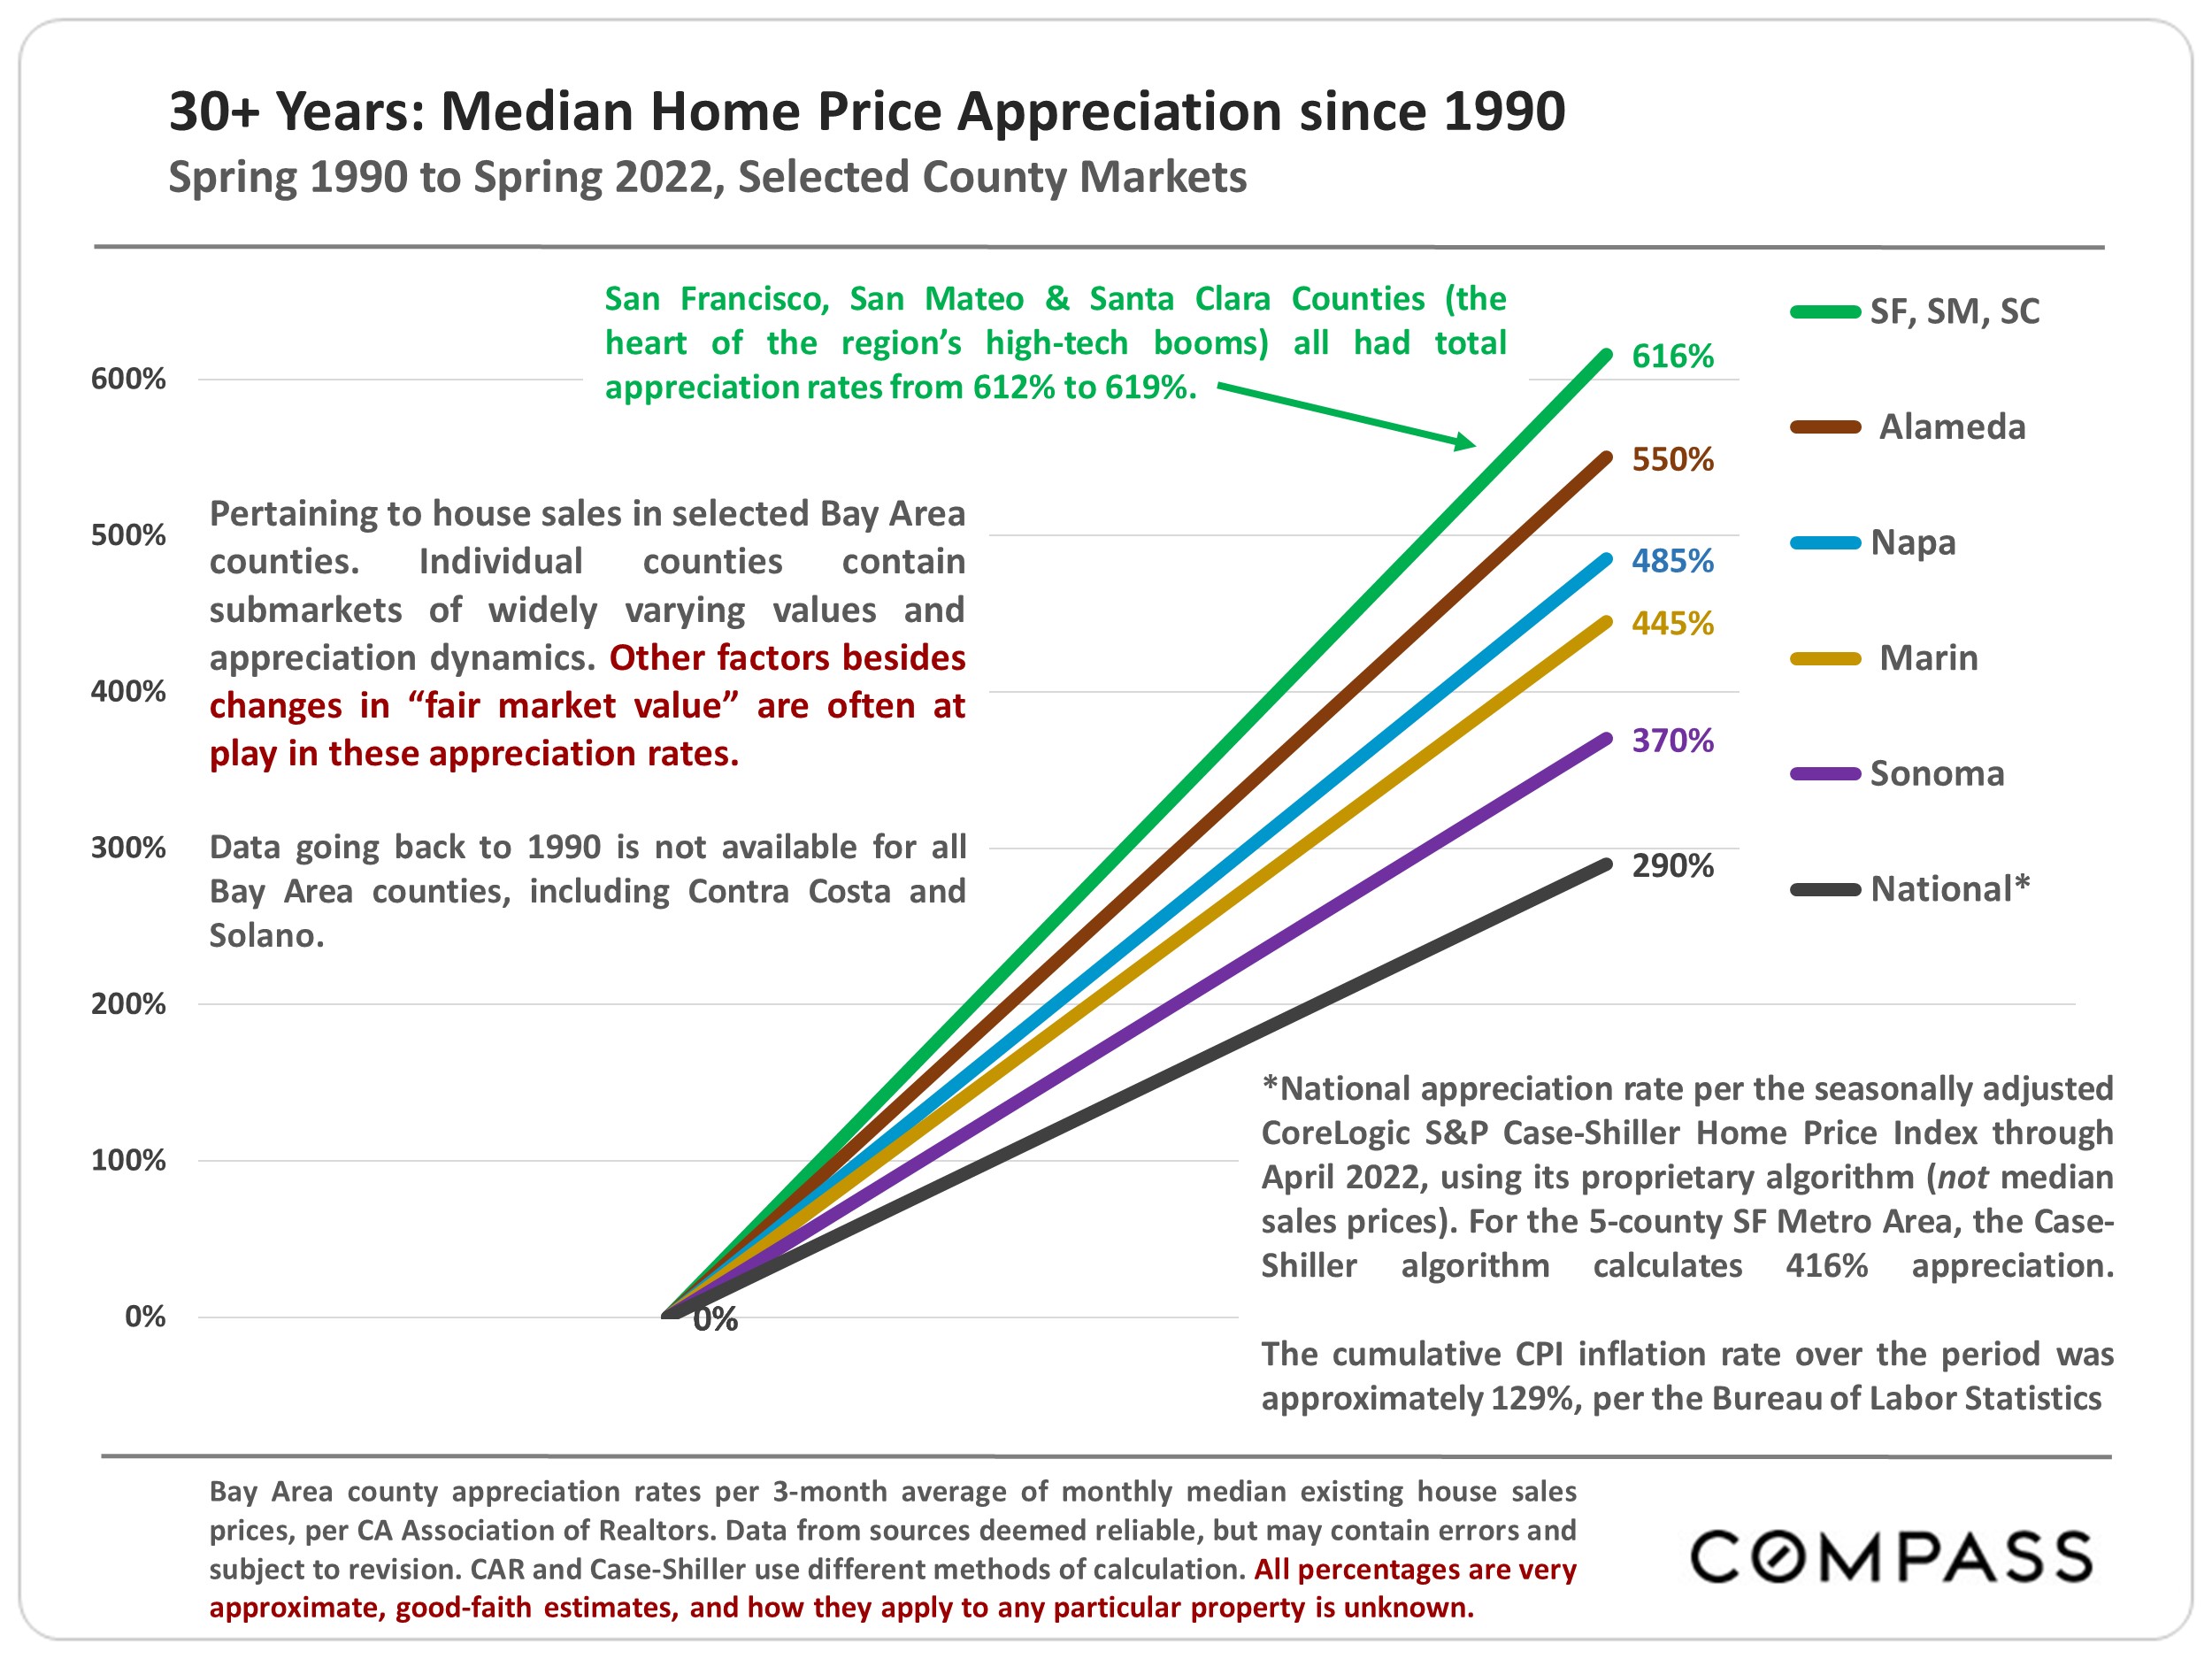
Generally speaking, Bay Area real estate markets began their sustained recovery from the effects of the subprime-loan bubble/financial market crash/distressed-property crisis in 2012. An unusual mix of factors subsequently came into play behind the highest rates of appreciation:
1) Whether the county was one of the three at the very heart of the high-tech, venture capital/start-up and IPO booms: San Francisco, San Mateo & Santa Clara
2) Whether the county was adjacent to (or across a bridge from) the 3 central counties, but offered significantly more affordable home prices: Alameda was the prime example
3) Whether the county was rebounding from a distinctly outsized crash following the subprime bubble, when their overall markets were utterly dominated by foreclosure & short sales: For example, Contra Costa (especially north county markets); Napa; Alameda (especially Oakland); Solano; Sonoma
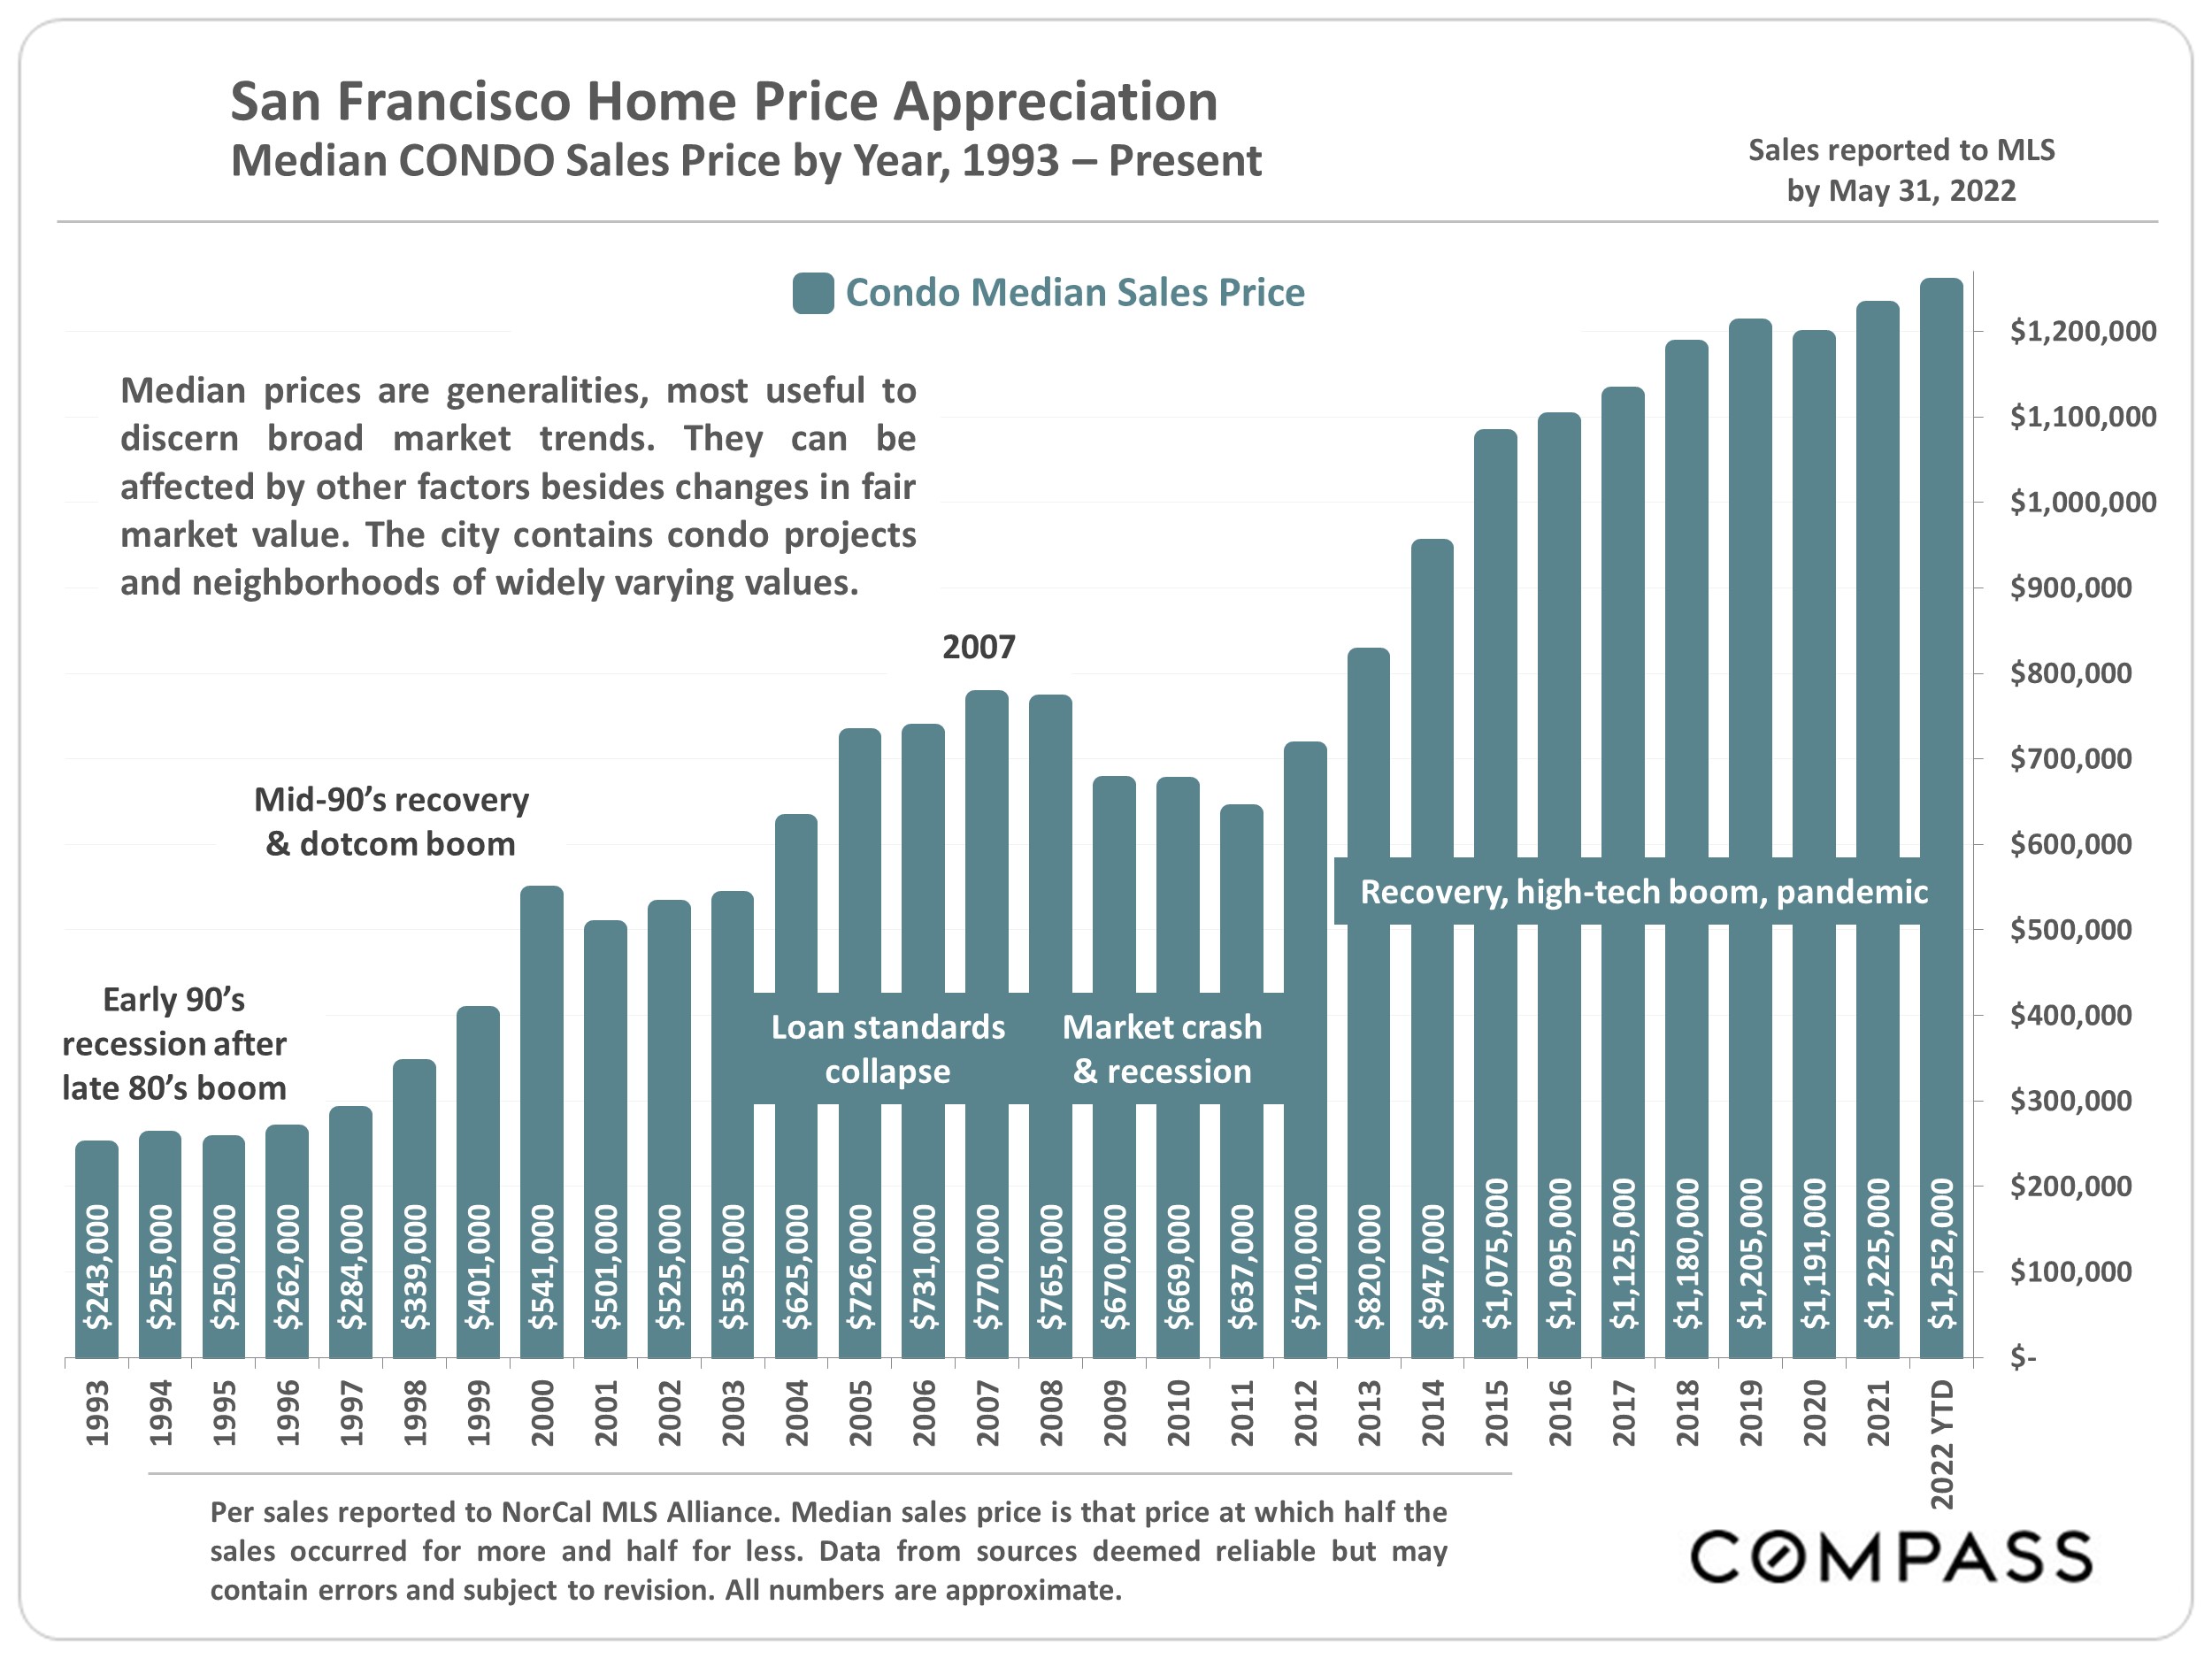
Post 2012, the Bay Area became the center of another huge boom in high-tech, with a historic increase in new businesses, start-ups, venture capital and jobs (approximately 700,000) – many of them very well paid. An enormous increase in affluence occurred, and the population soared without a corresponding increase in new home construction, which put tremendous upward pressure on home prices.
The next chart illustrates approximate home-price appreciation rates from 2012 to Spring 2020, when the pandemic struck – which unexpectedly supercharged the upcycle for another 2 years.
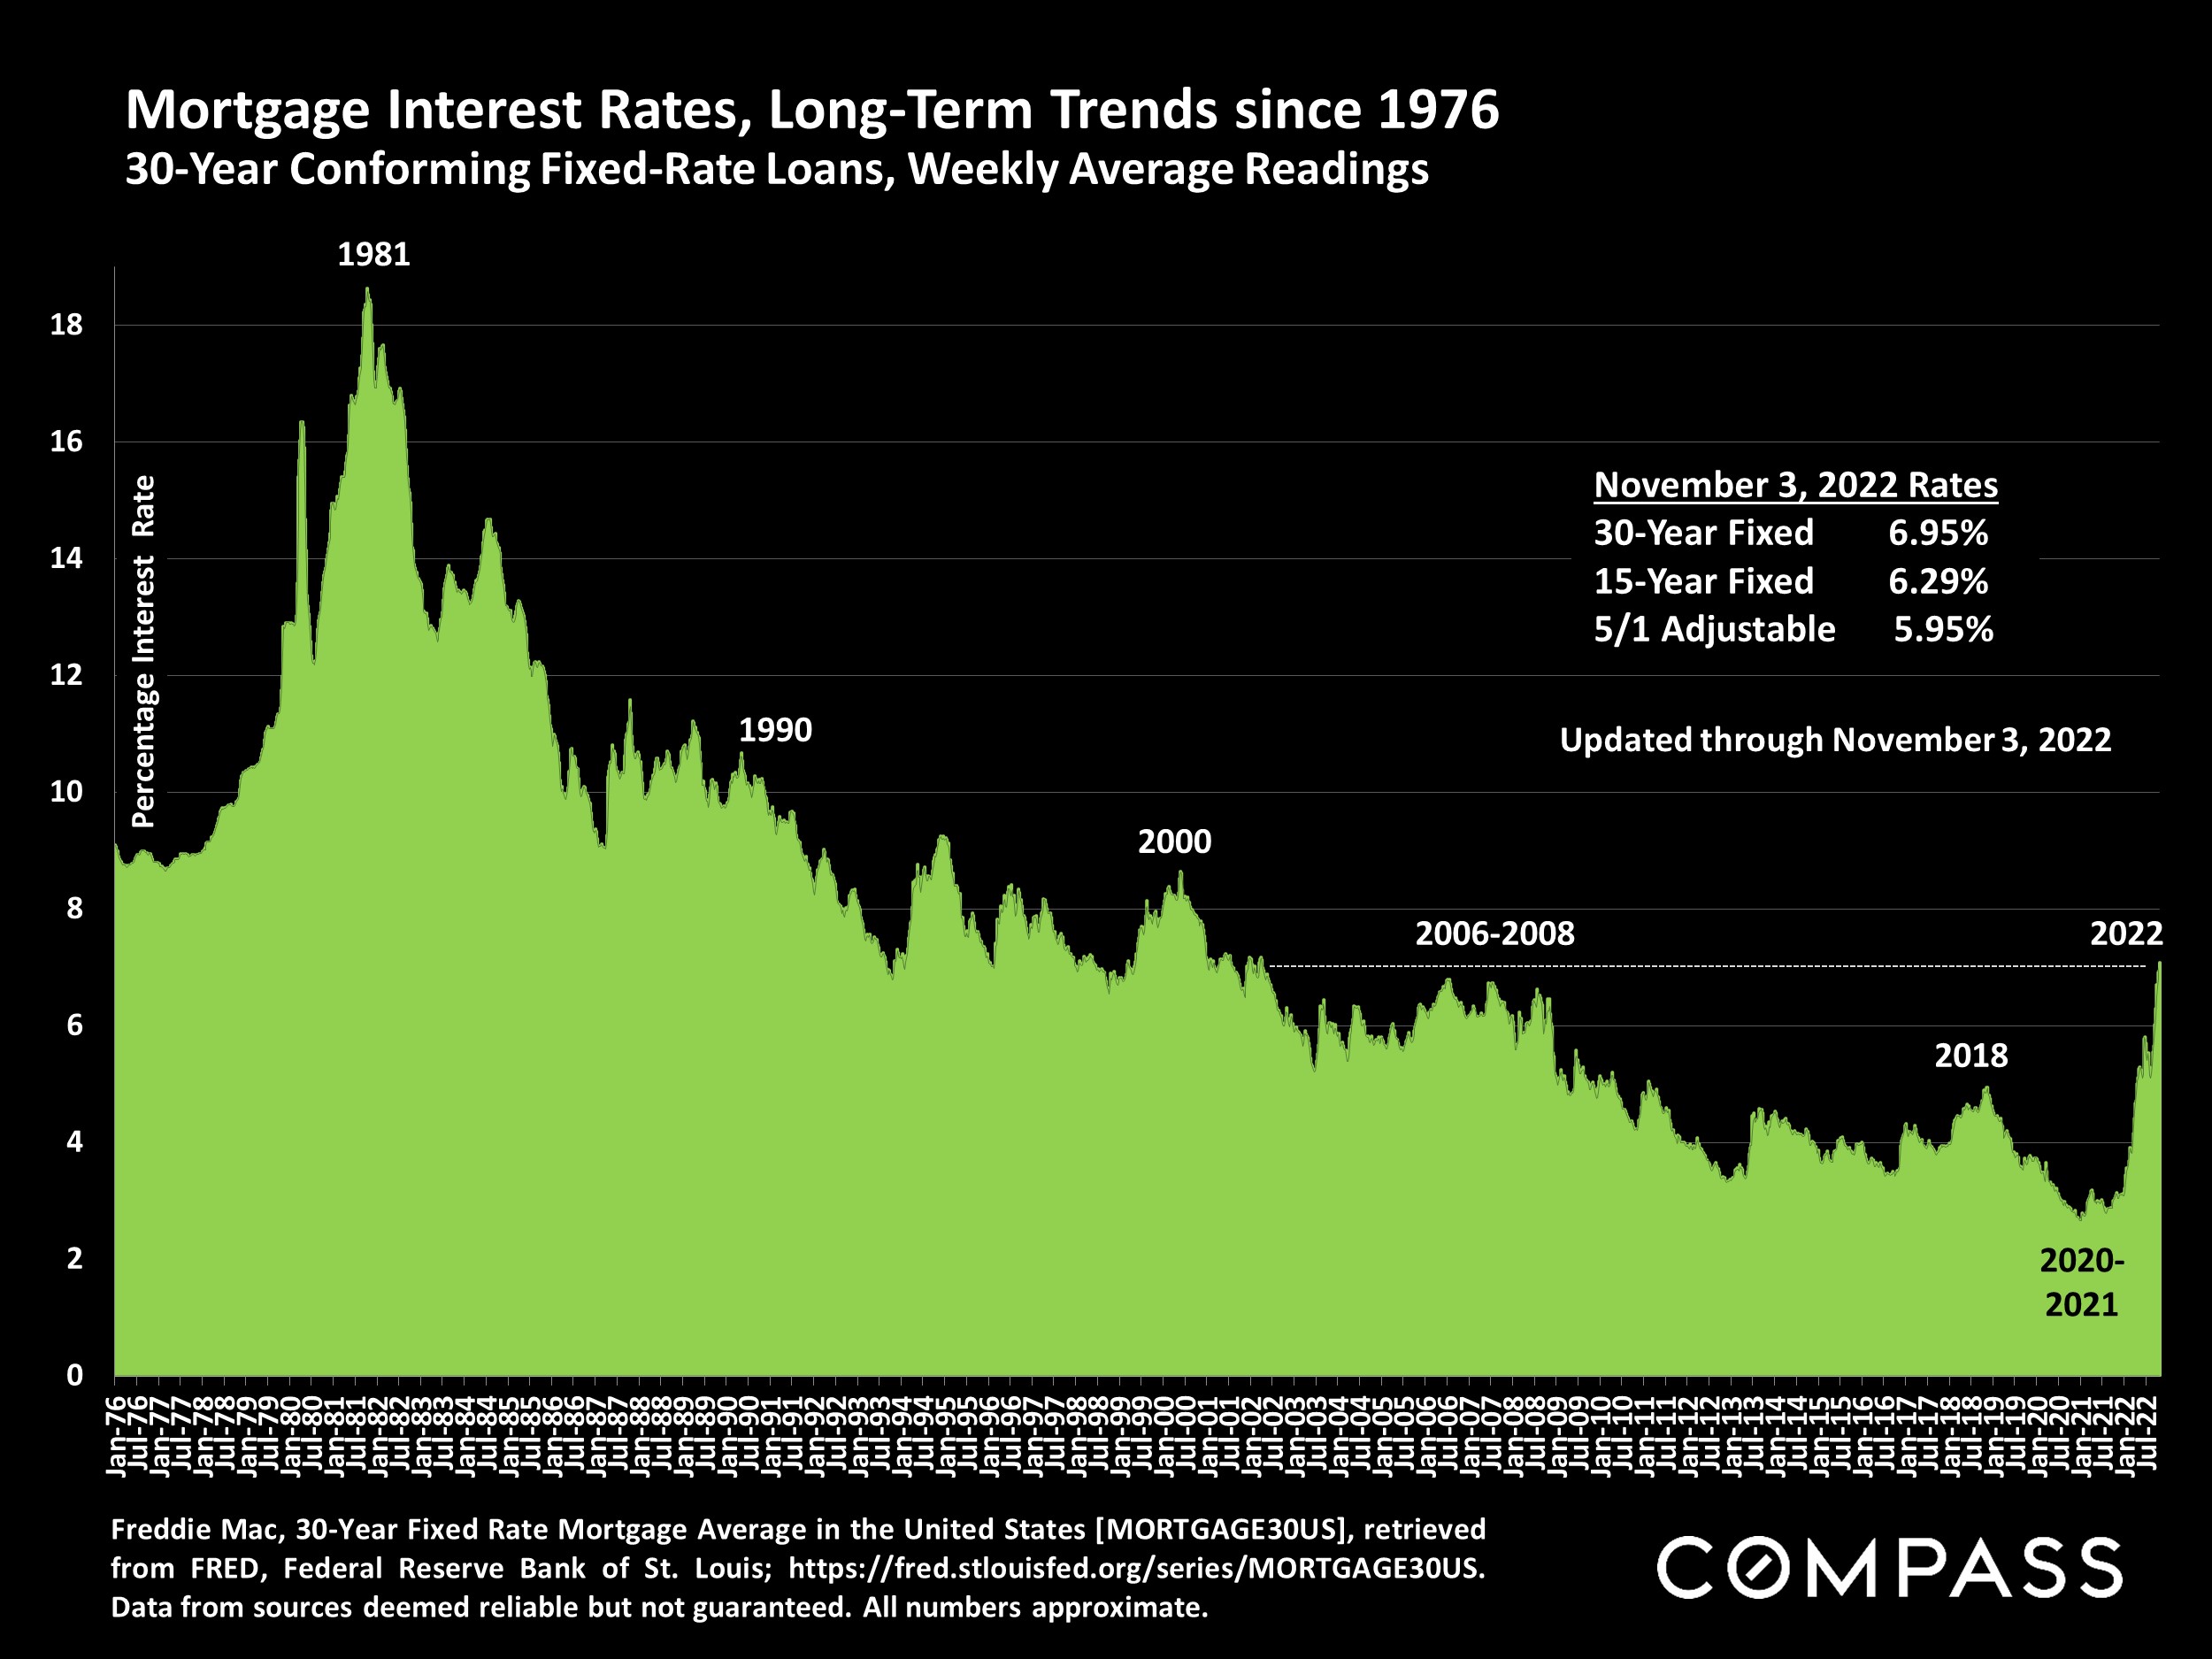
Note that broader upcycles often include market fluctuations and shorter-term slowdowns – not illustrated in this report – before the market recovers and moves forward again. This occurred in midlate 2015 (Chinese stock market crash, oil price crash, U.S. stock market volatility), and mid-late 2018 (rising interest rates, declining stock markets). The Fed intervened in 2019, and then again massively in 2020/2021 to reduce interest rates and fuel the economy – adding perhaps too much fuel for too long.
Important notes and caveats regarding the context and methodology of this report are detailed on the last page.
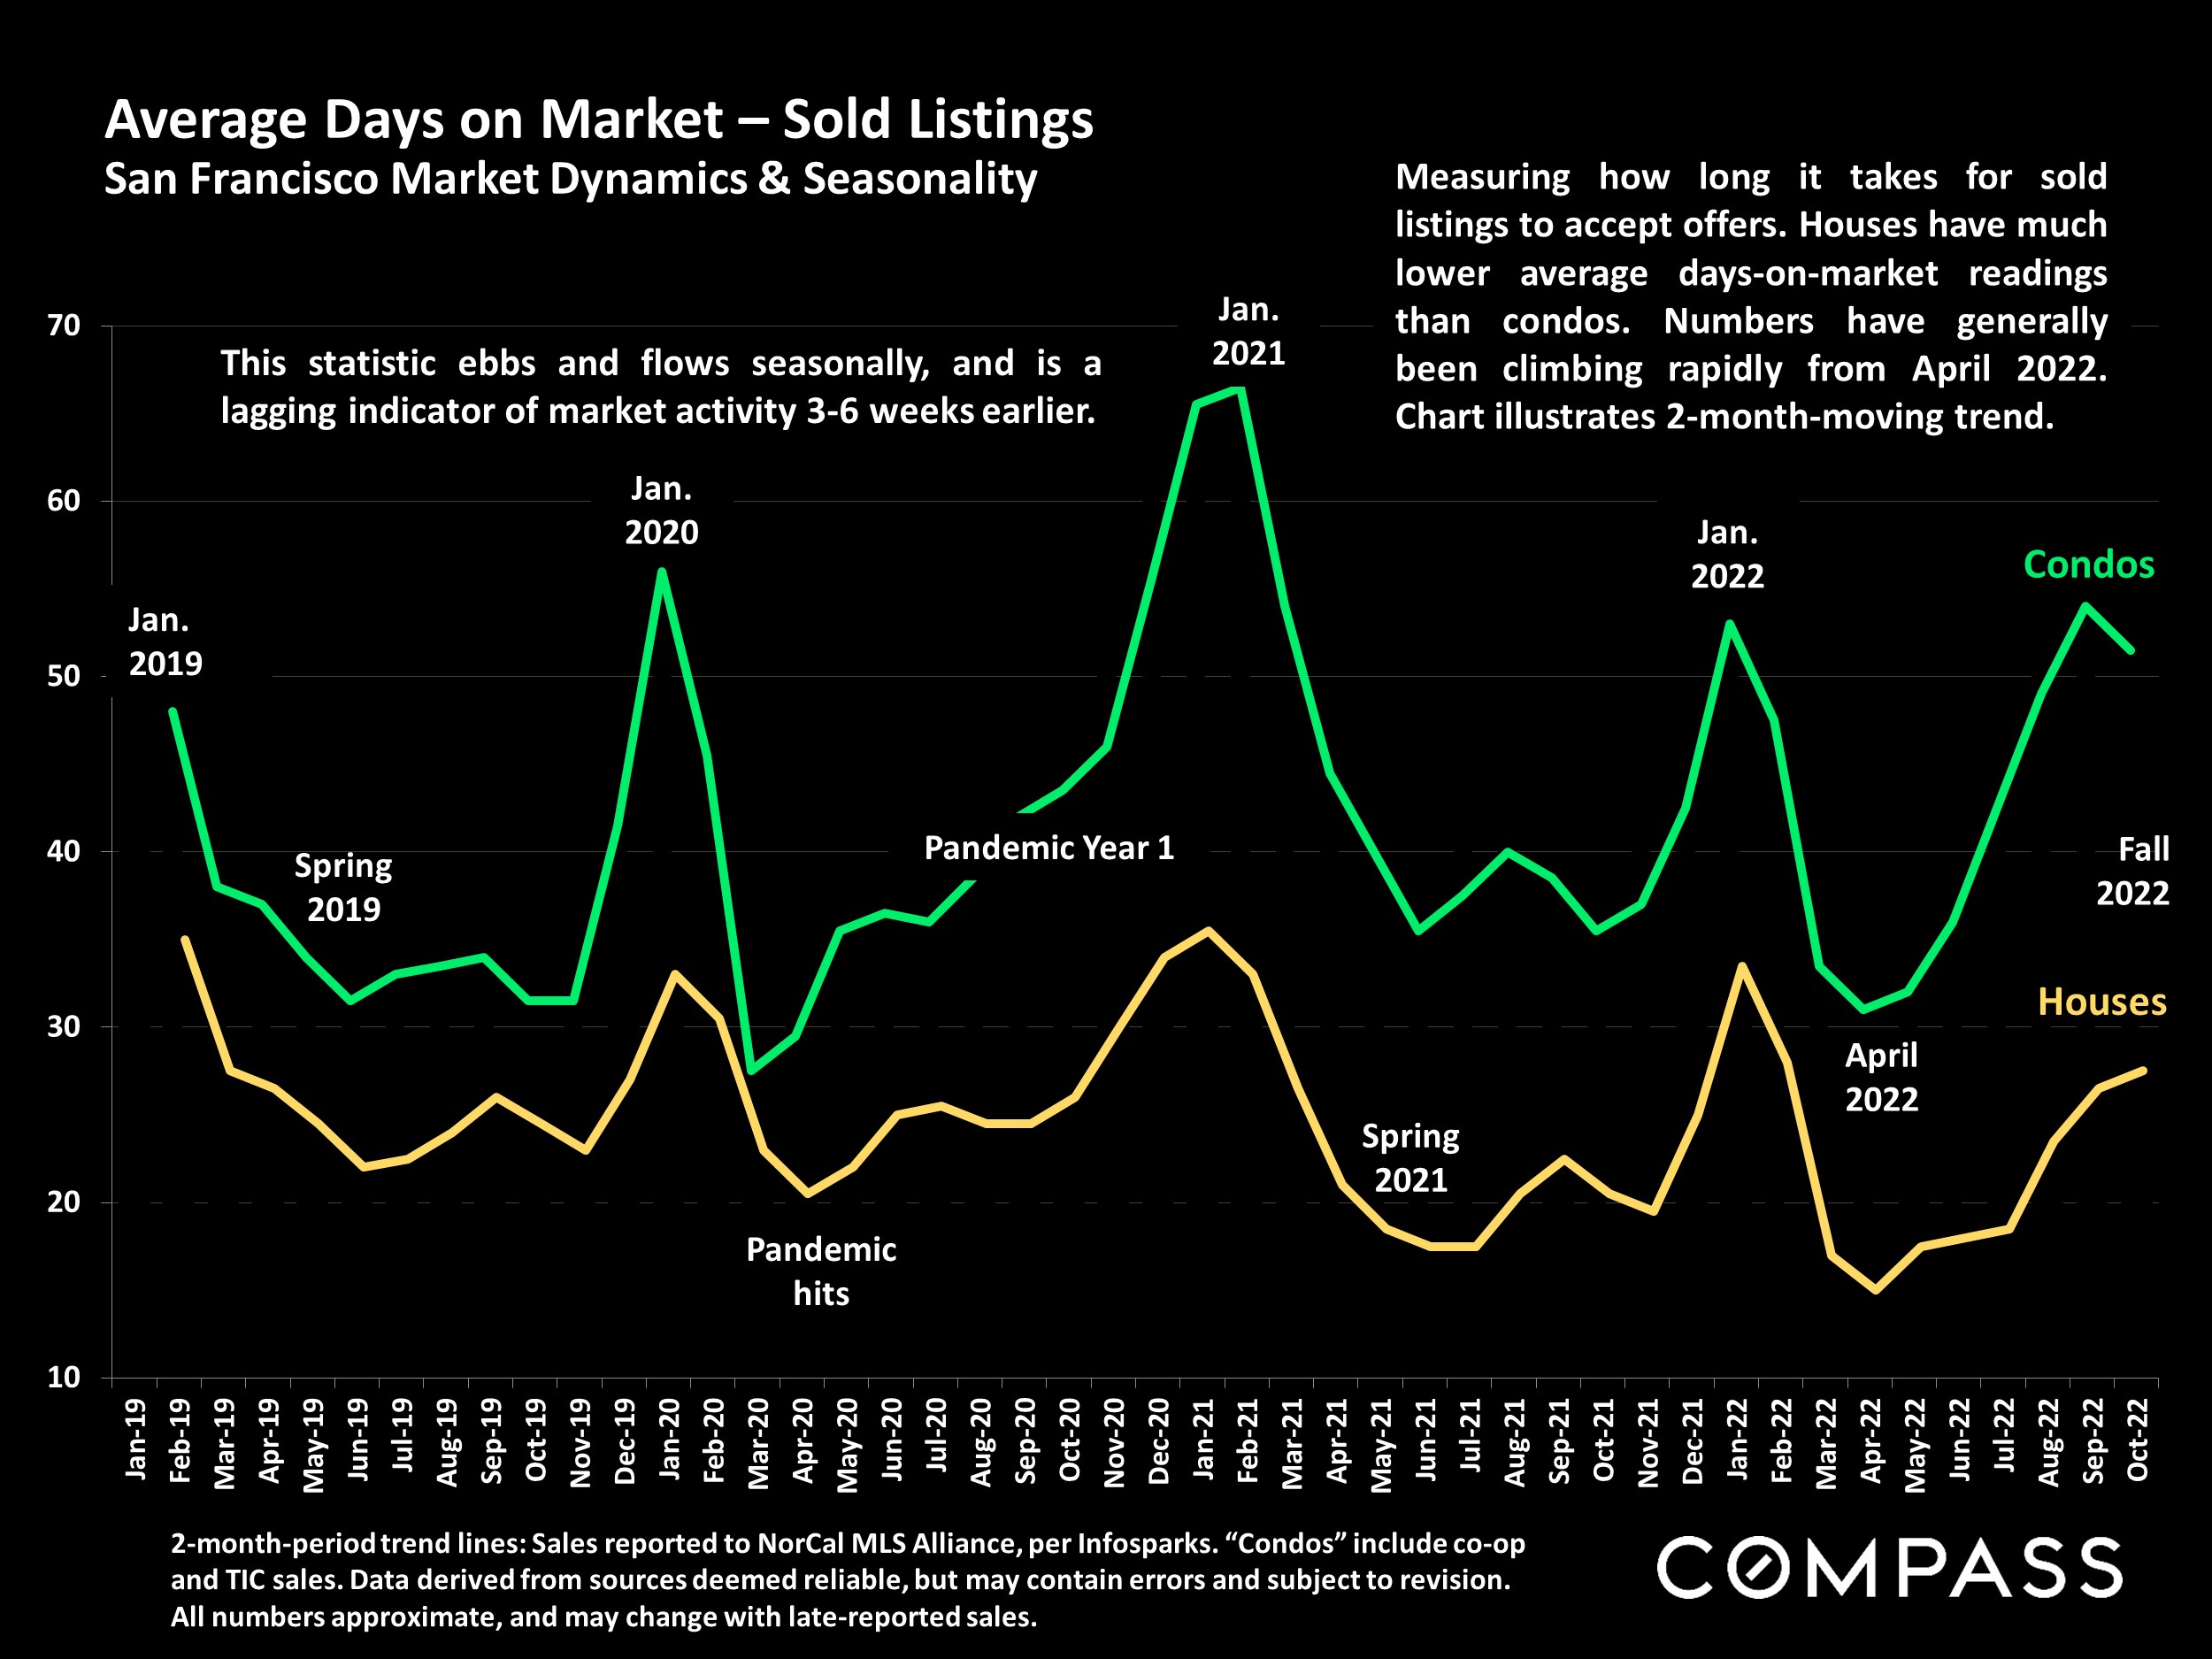
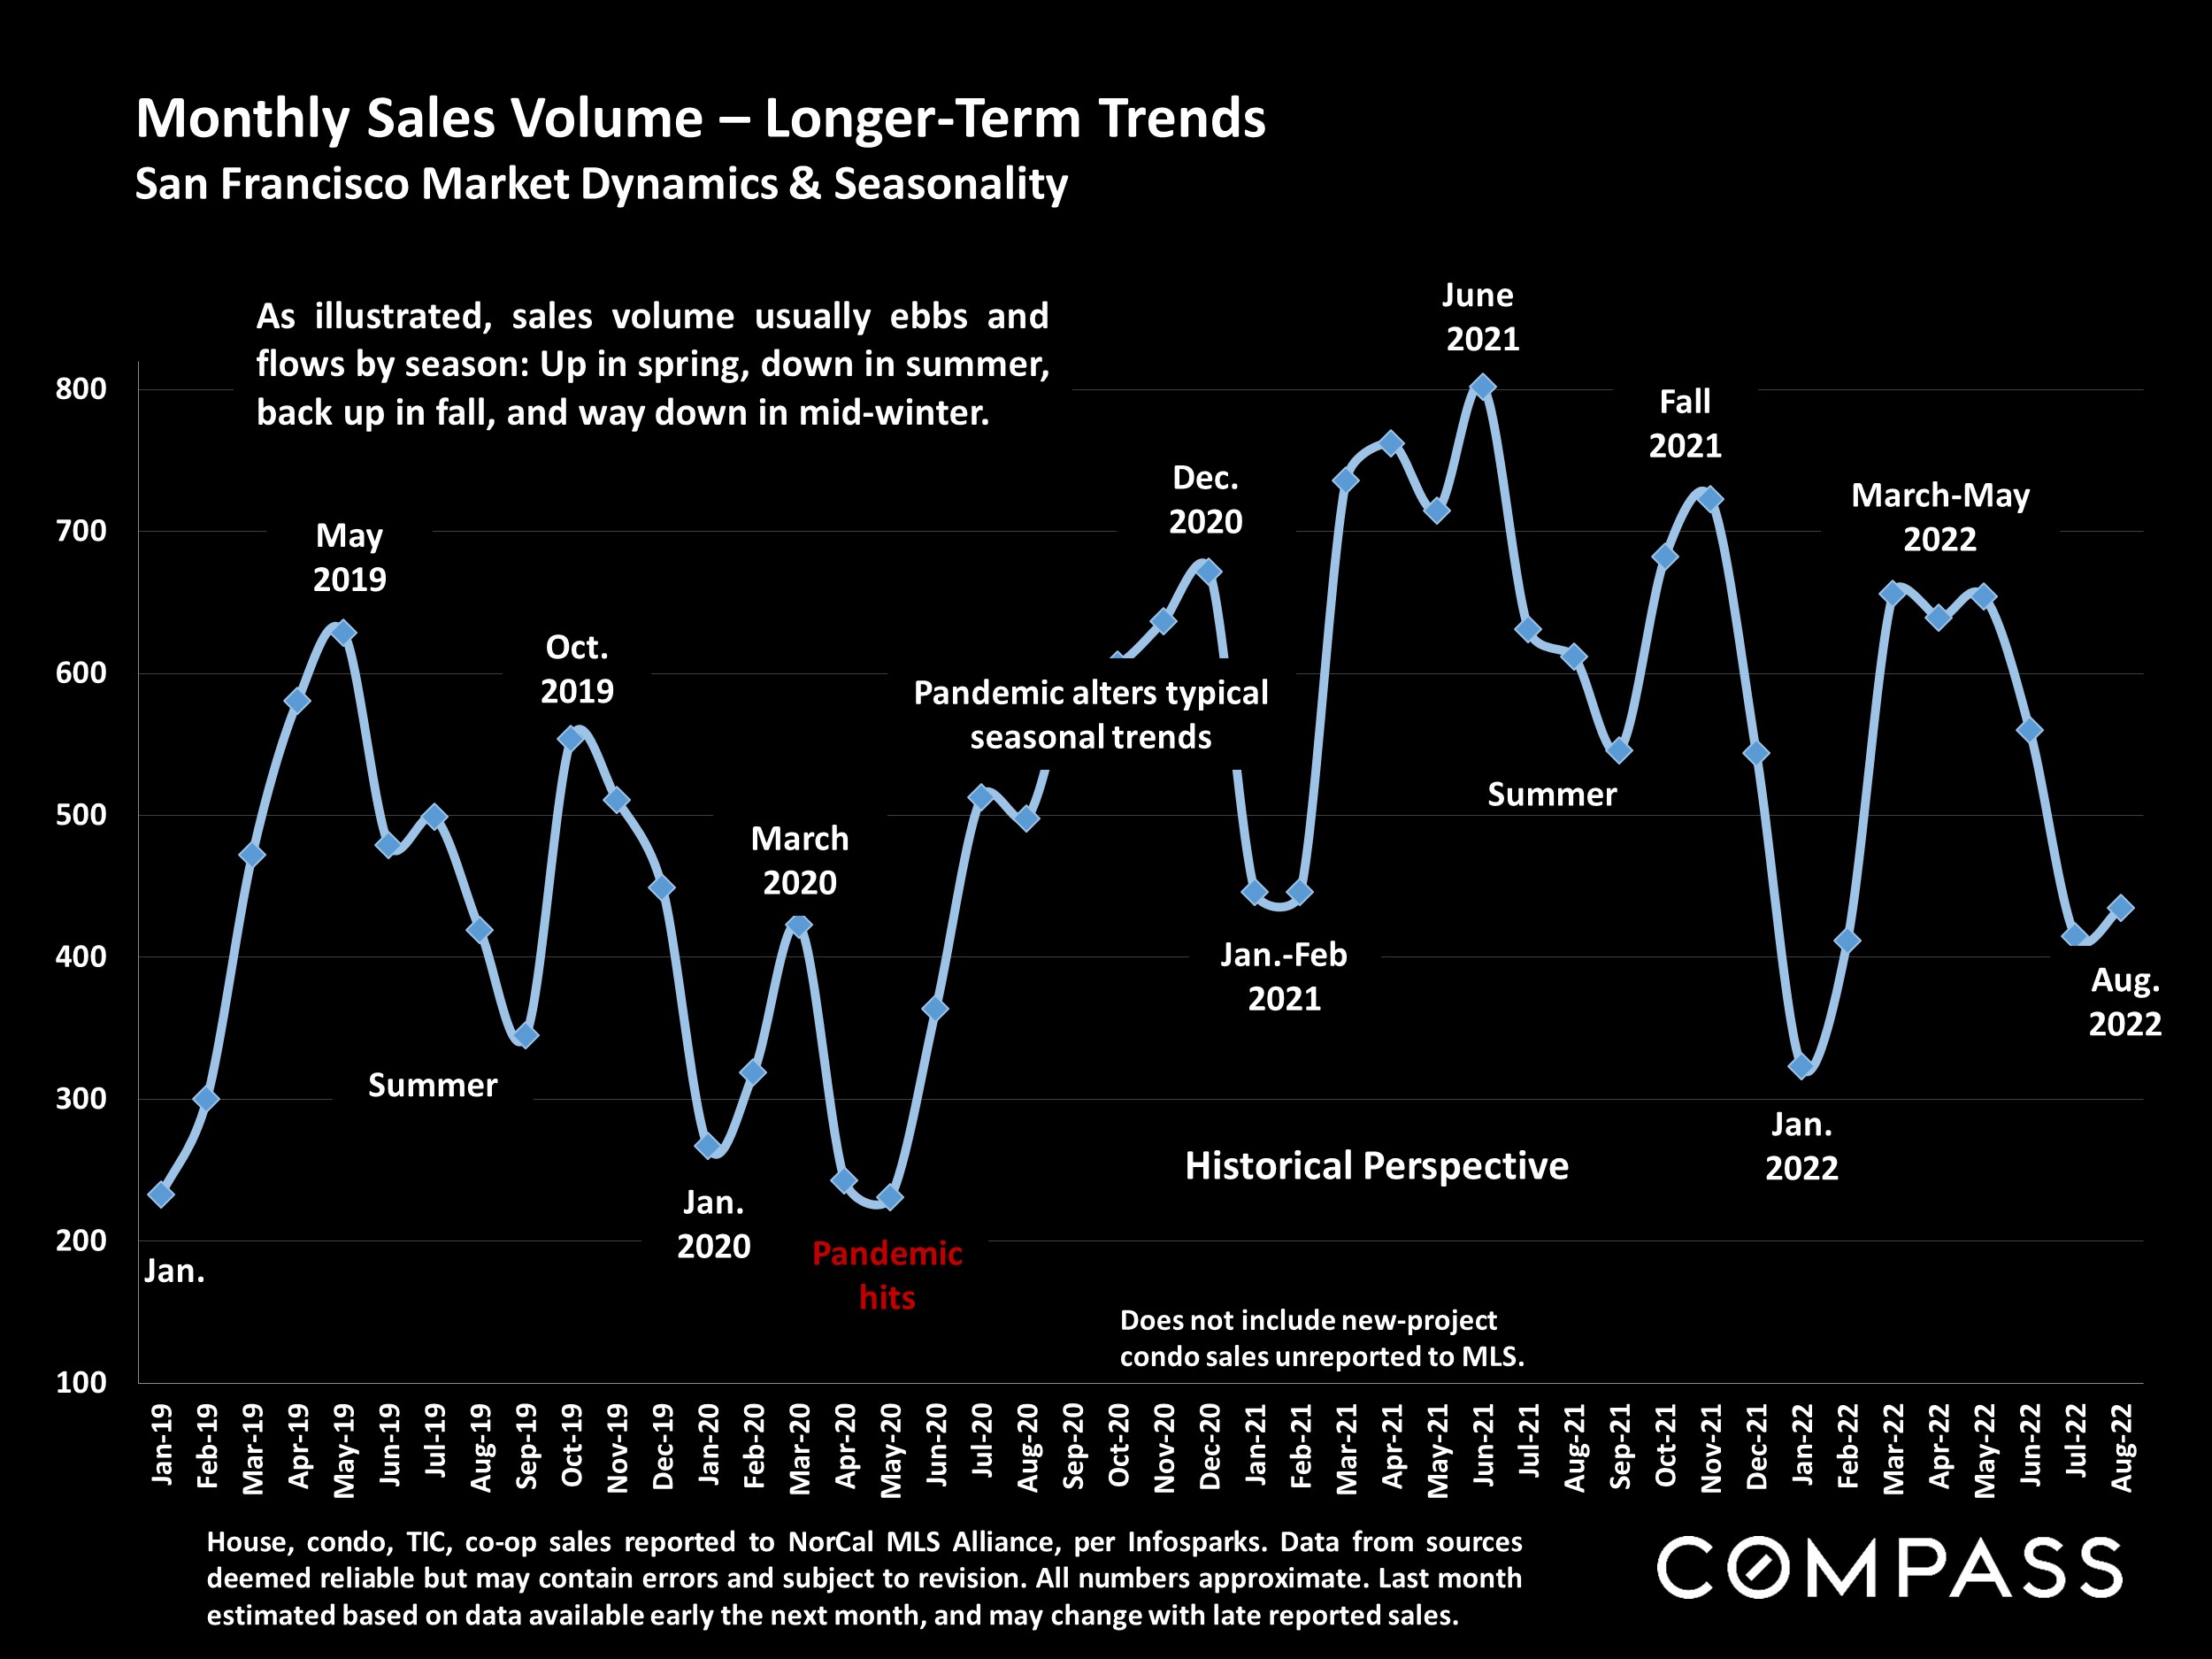
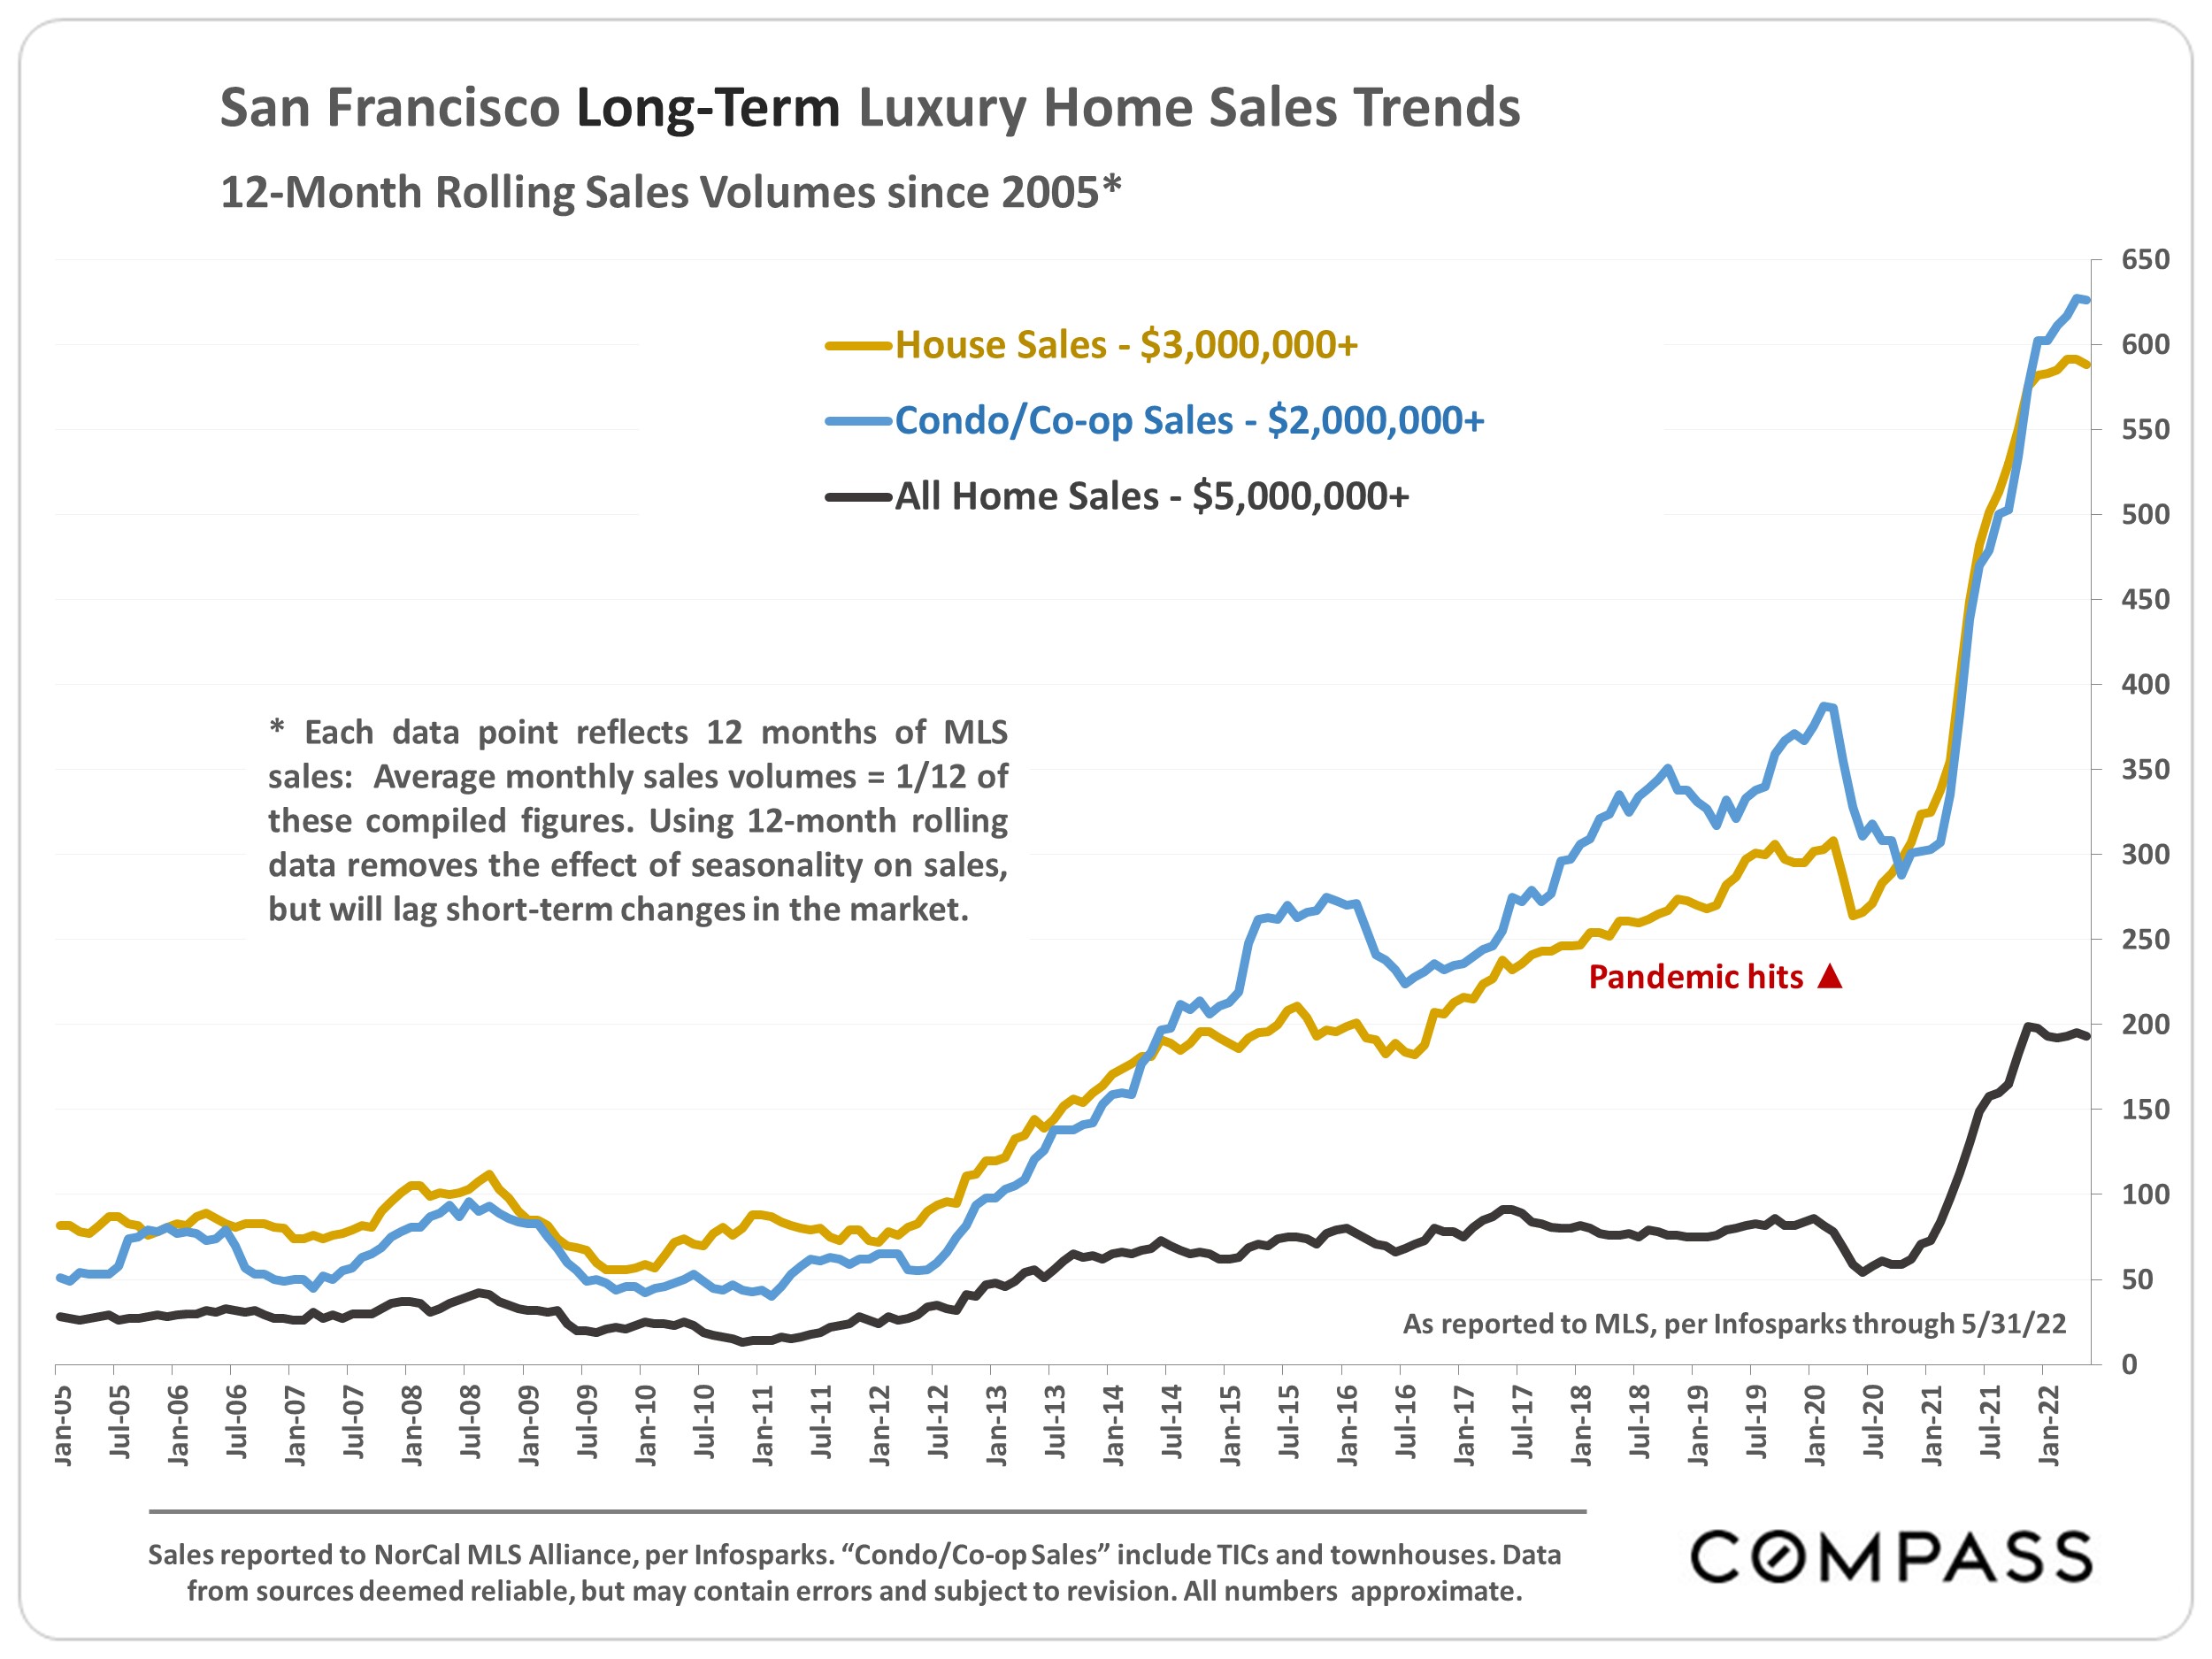
The Pandemic Market
Since the pandemic struck in Spring 2020, Bay Area real estate markets have been affected by many diverse and shifting factors, some of them unique to the period. These include population-density and contagion issues; shelter-in-place and its varying effects on urban, suburban and rural environments; work-from-home upending the relationship between home location and workplace; trillions of dollars of free money issuing from state and federal governments; the Fed interventions causing the historic plunge in interest rates (through 2021); a renewed, pandemic boom in high-tech; an astounding surge in stock markets and household wealth (through 2021); the rollout of vaccines; infection rate surges; as well as other ecological, political, economic and social factors (fires, taxes, unemployment, family care, etc.).
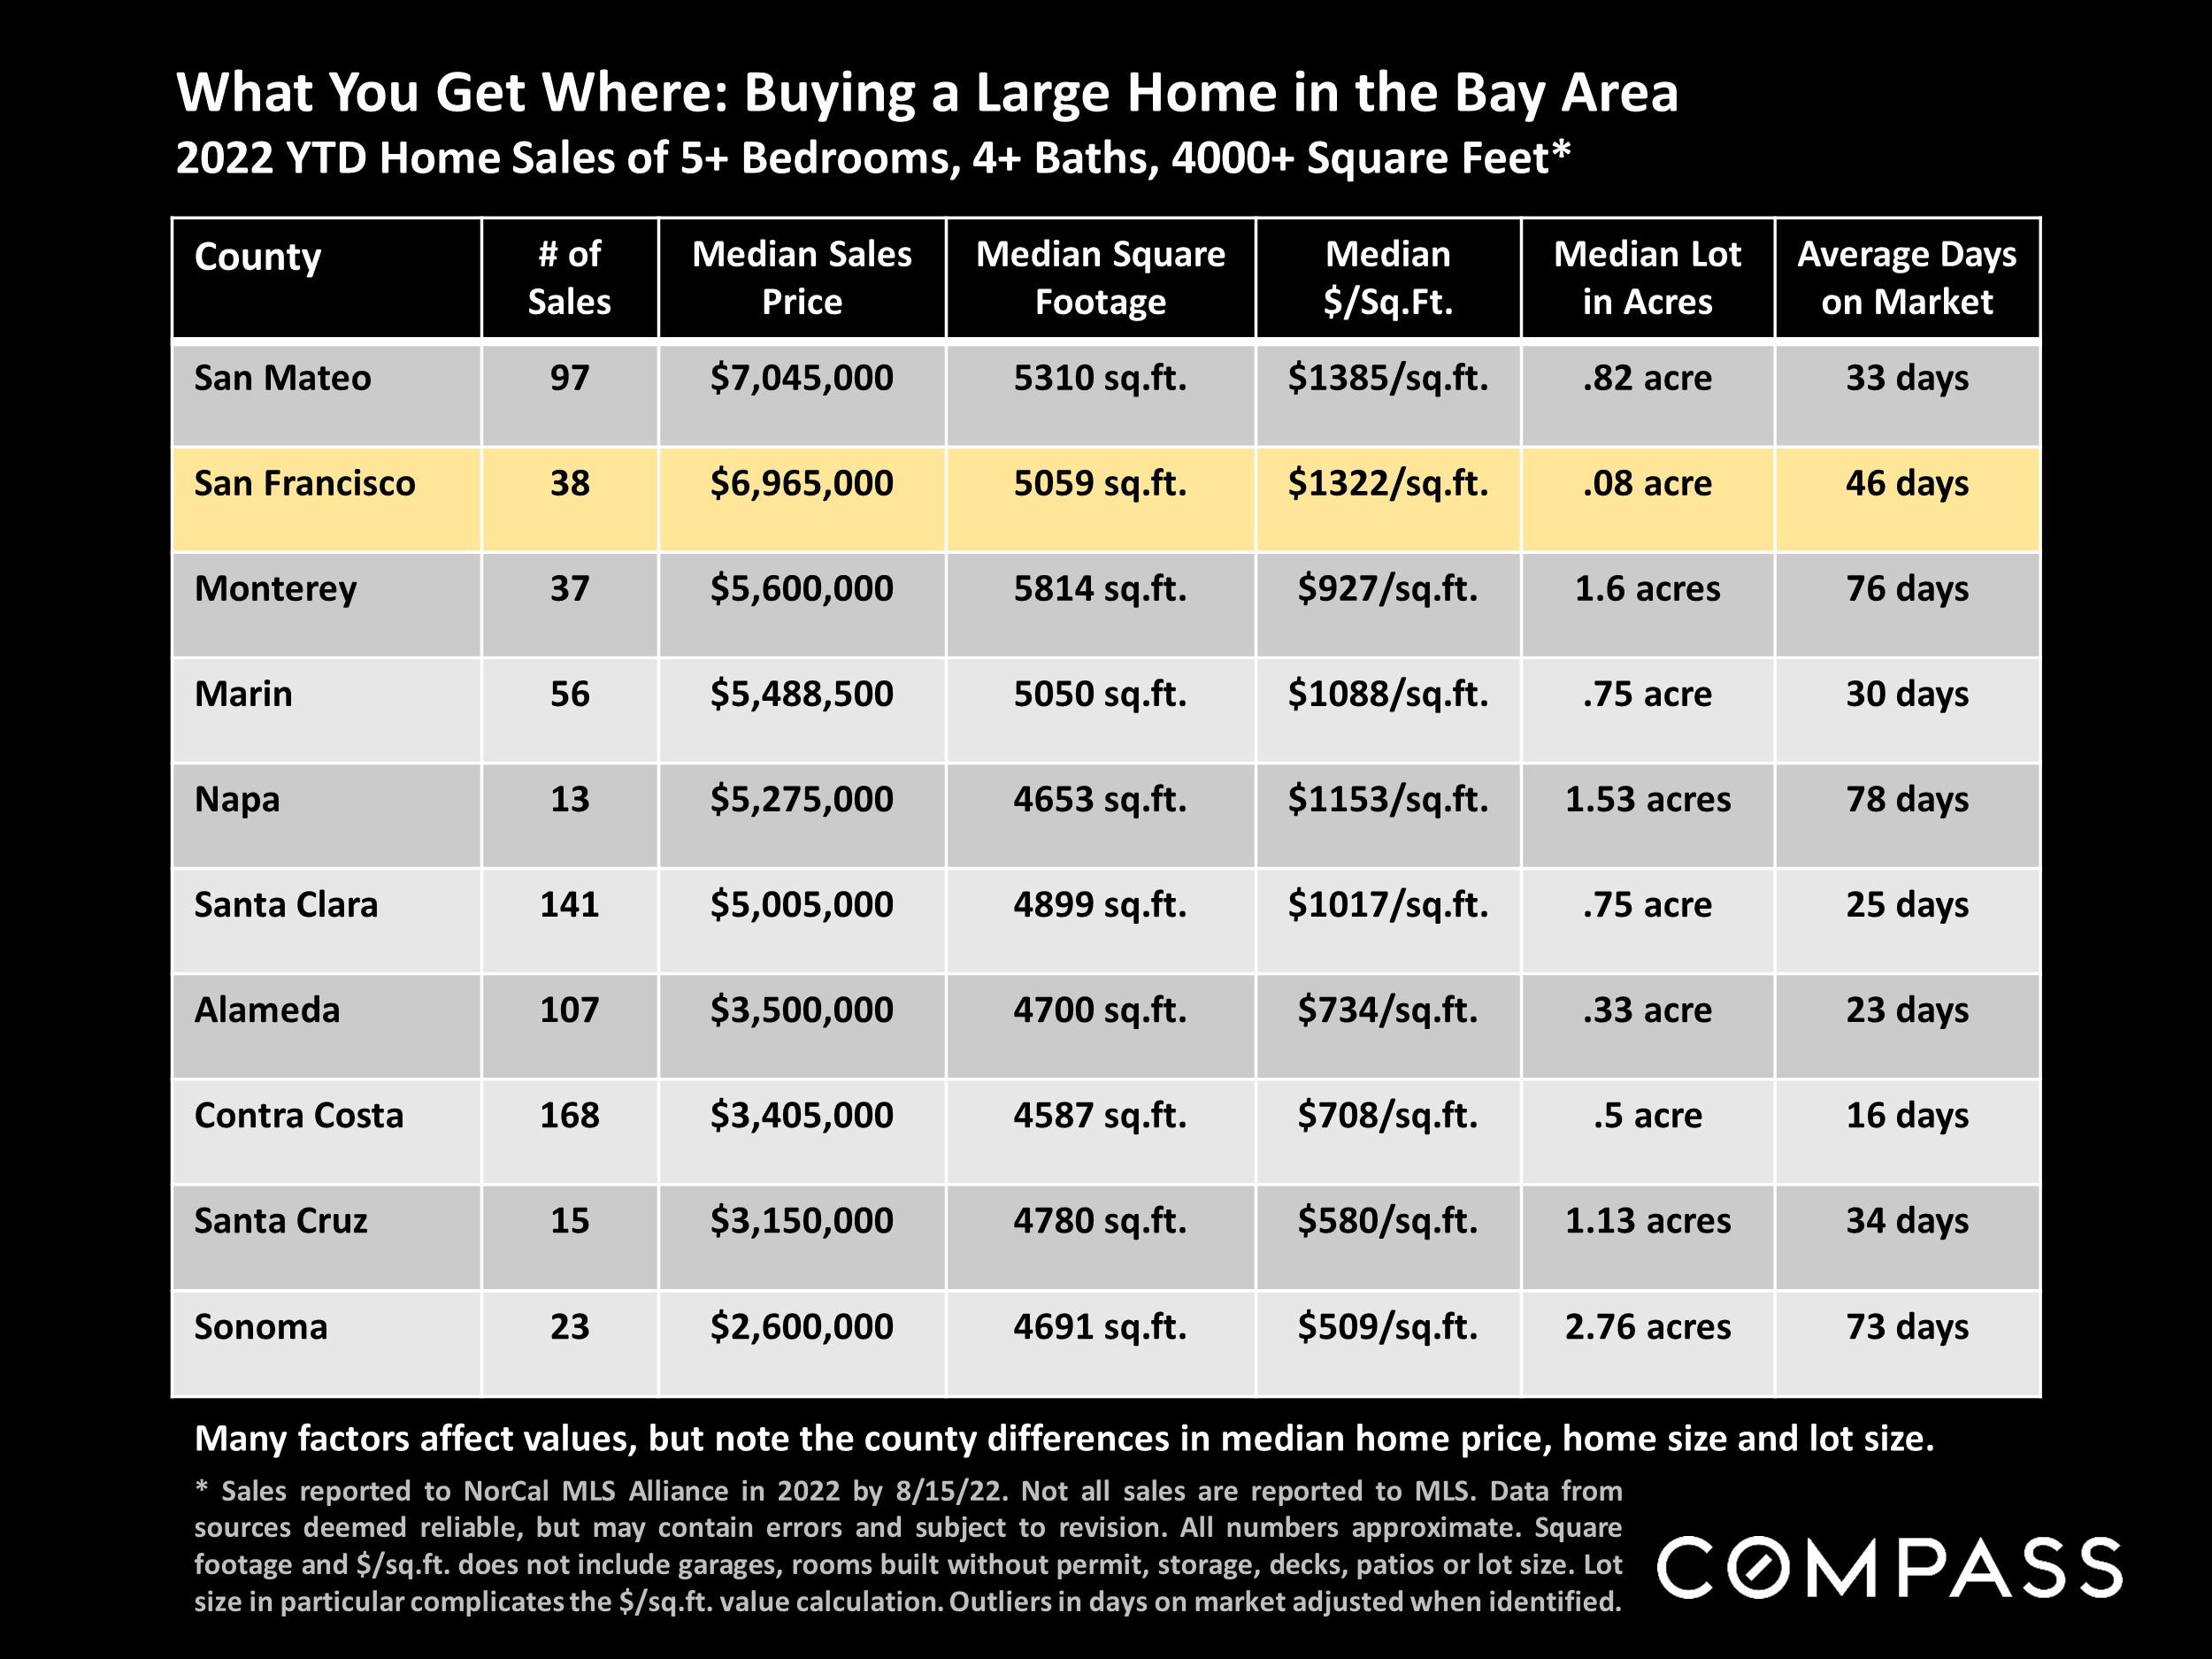
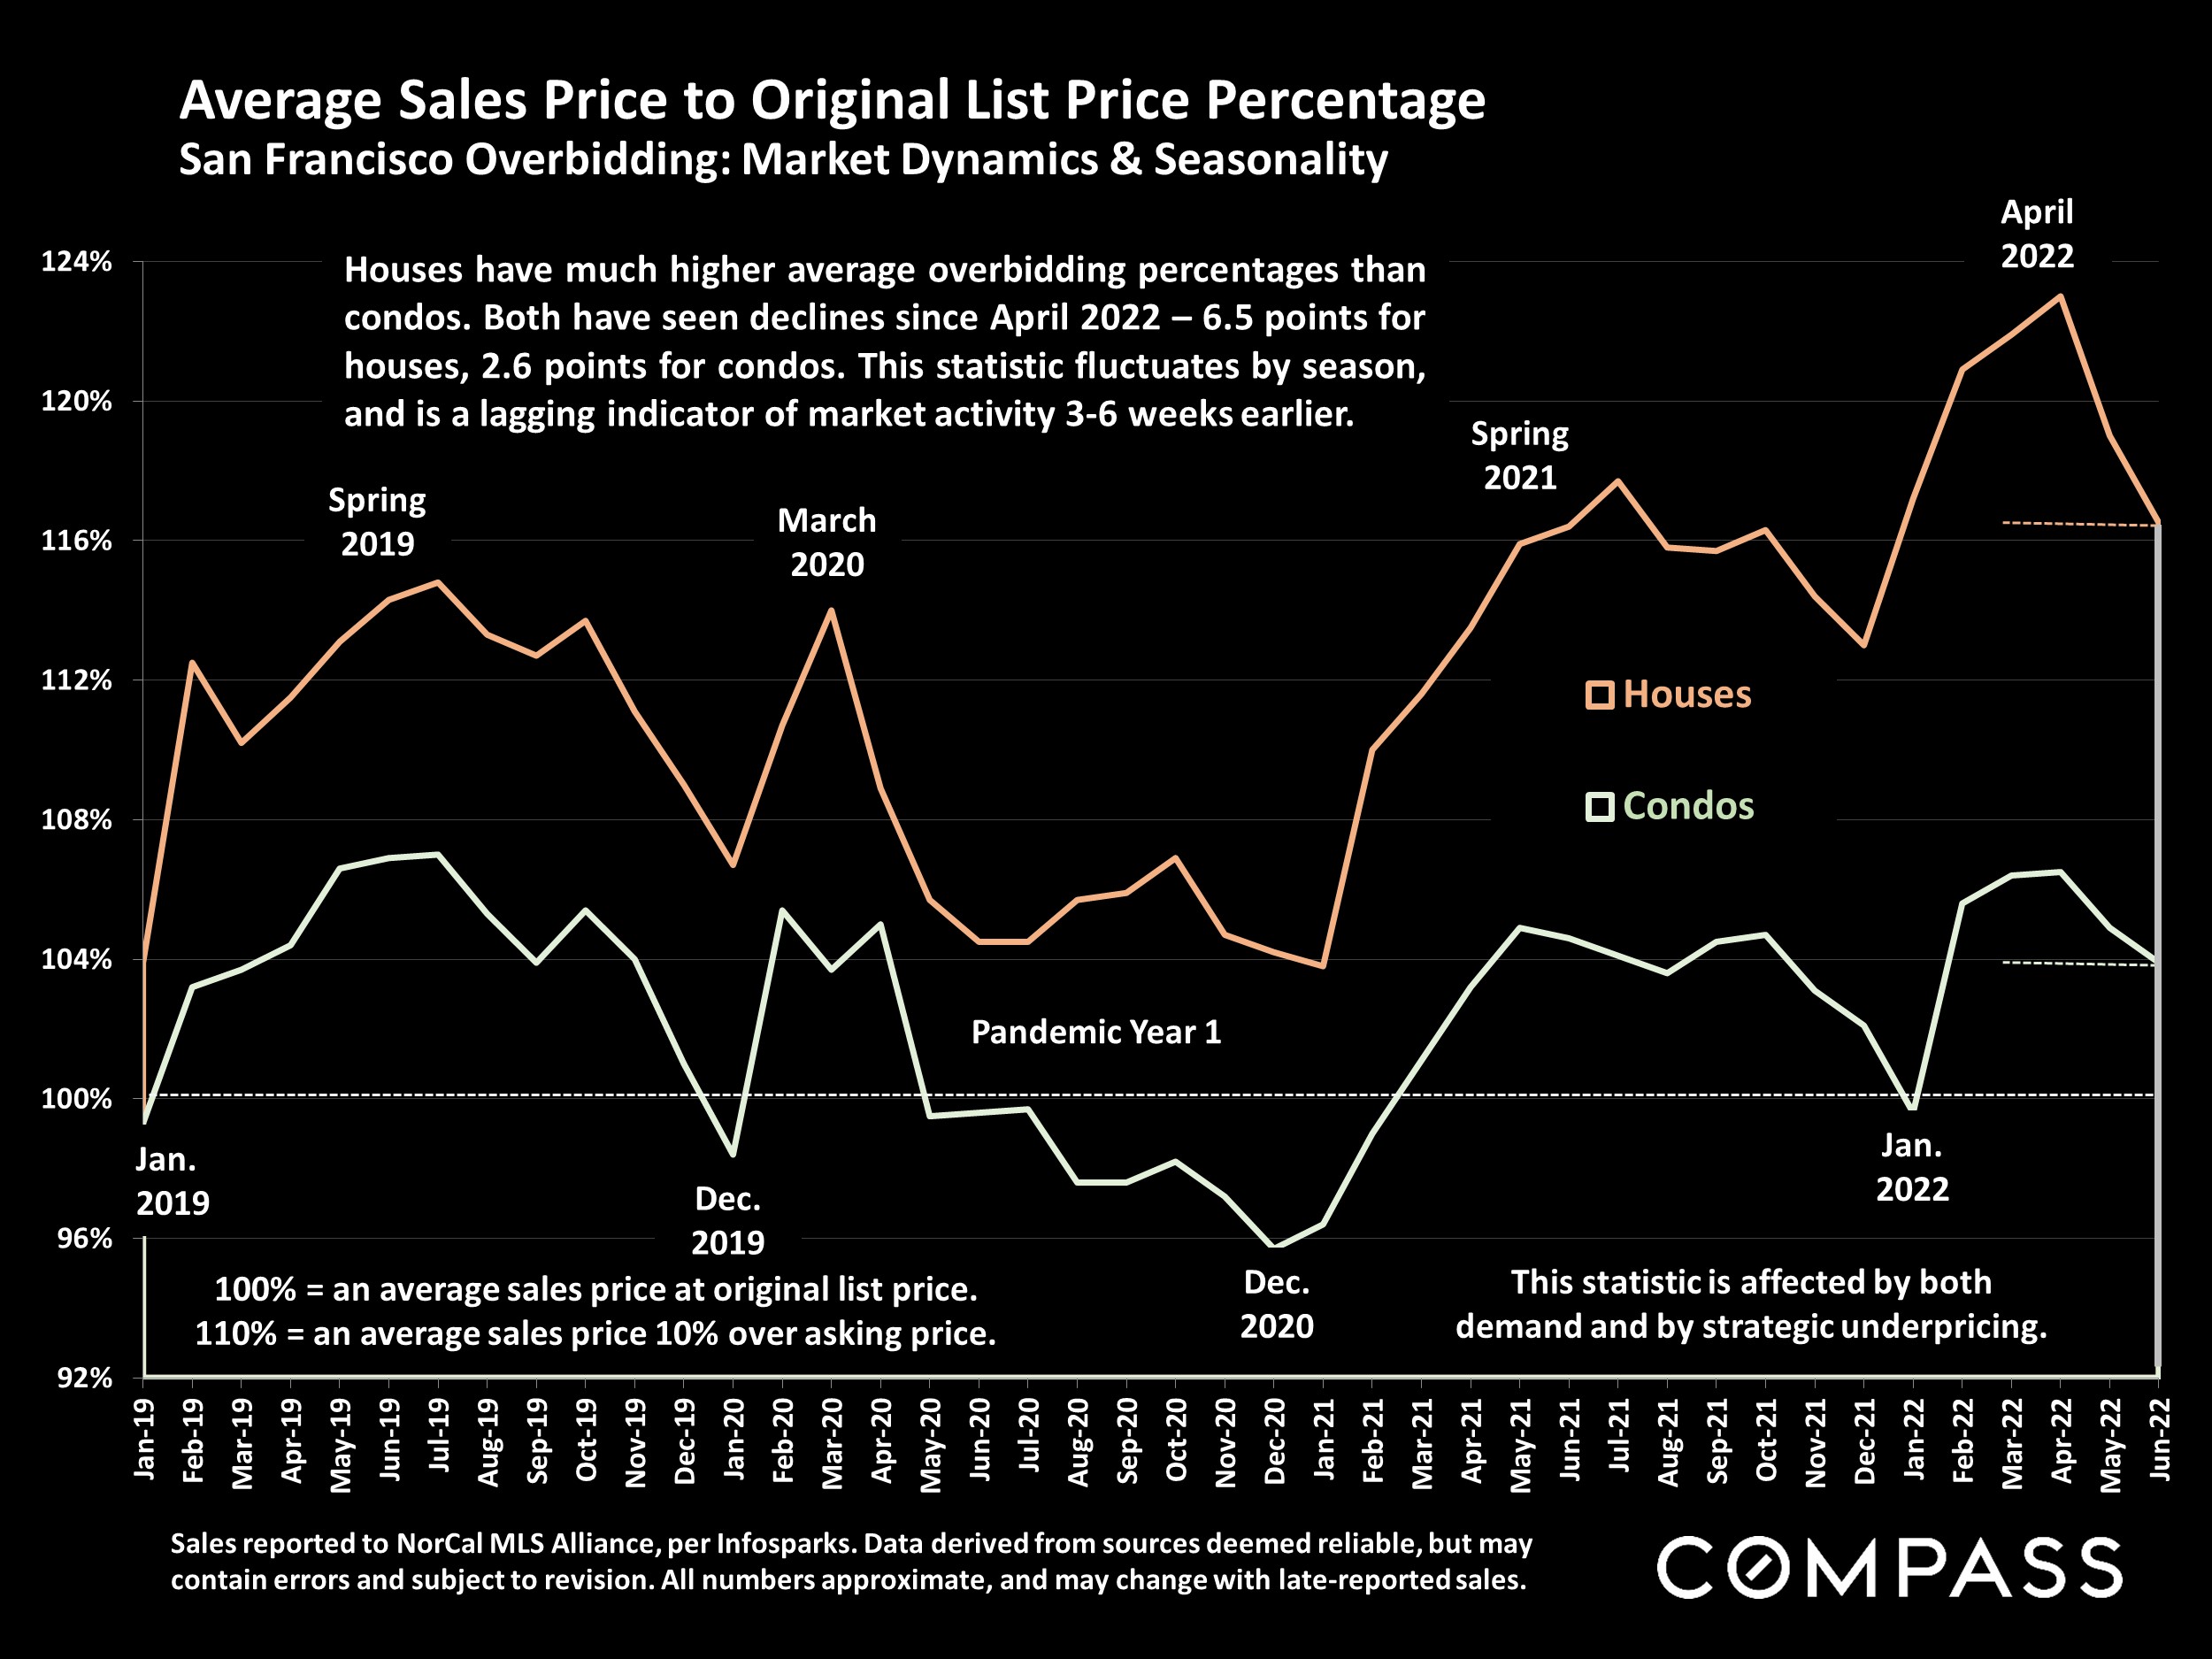
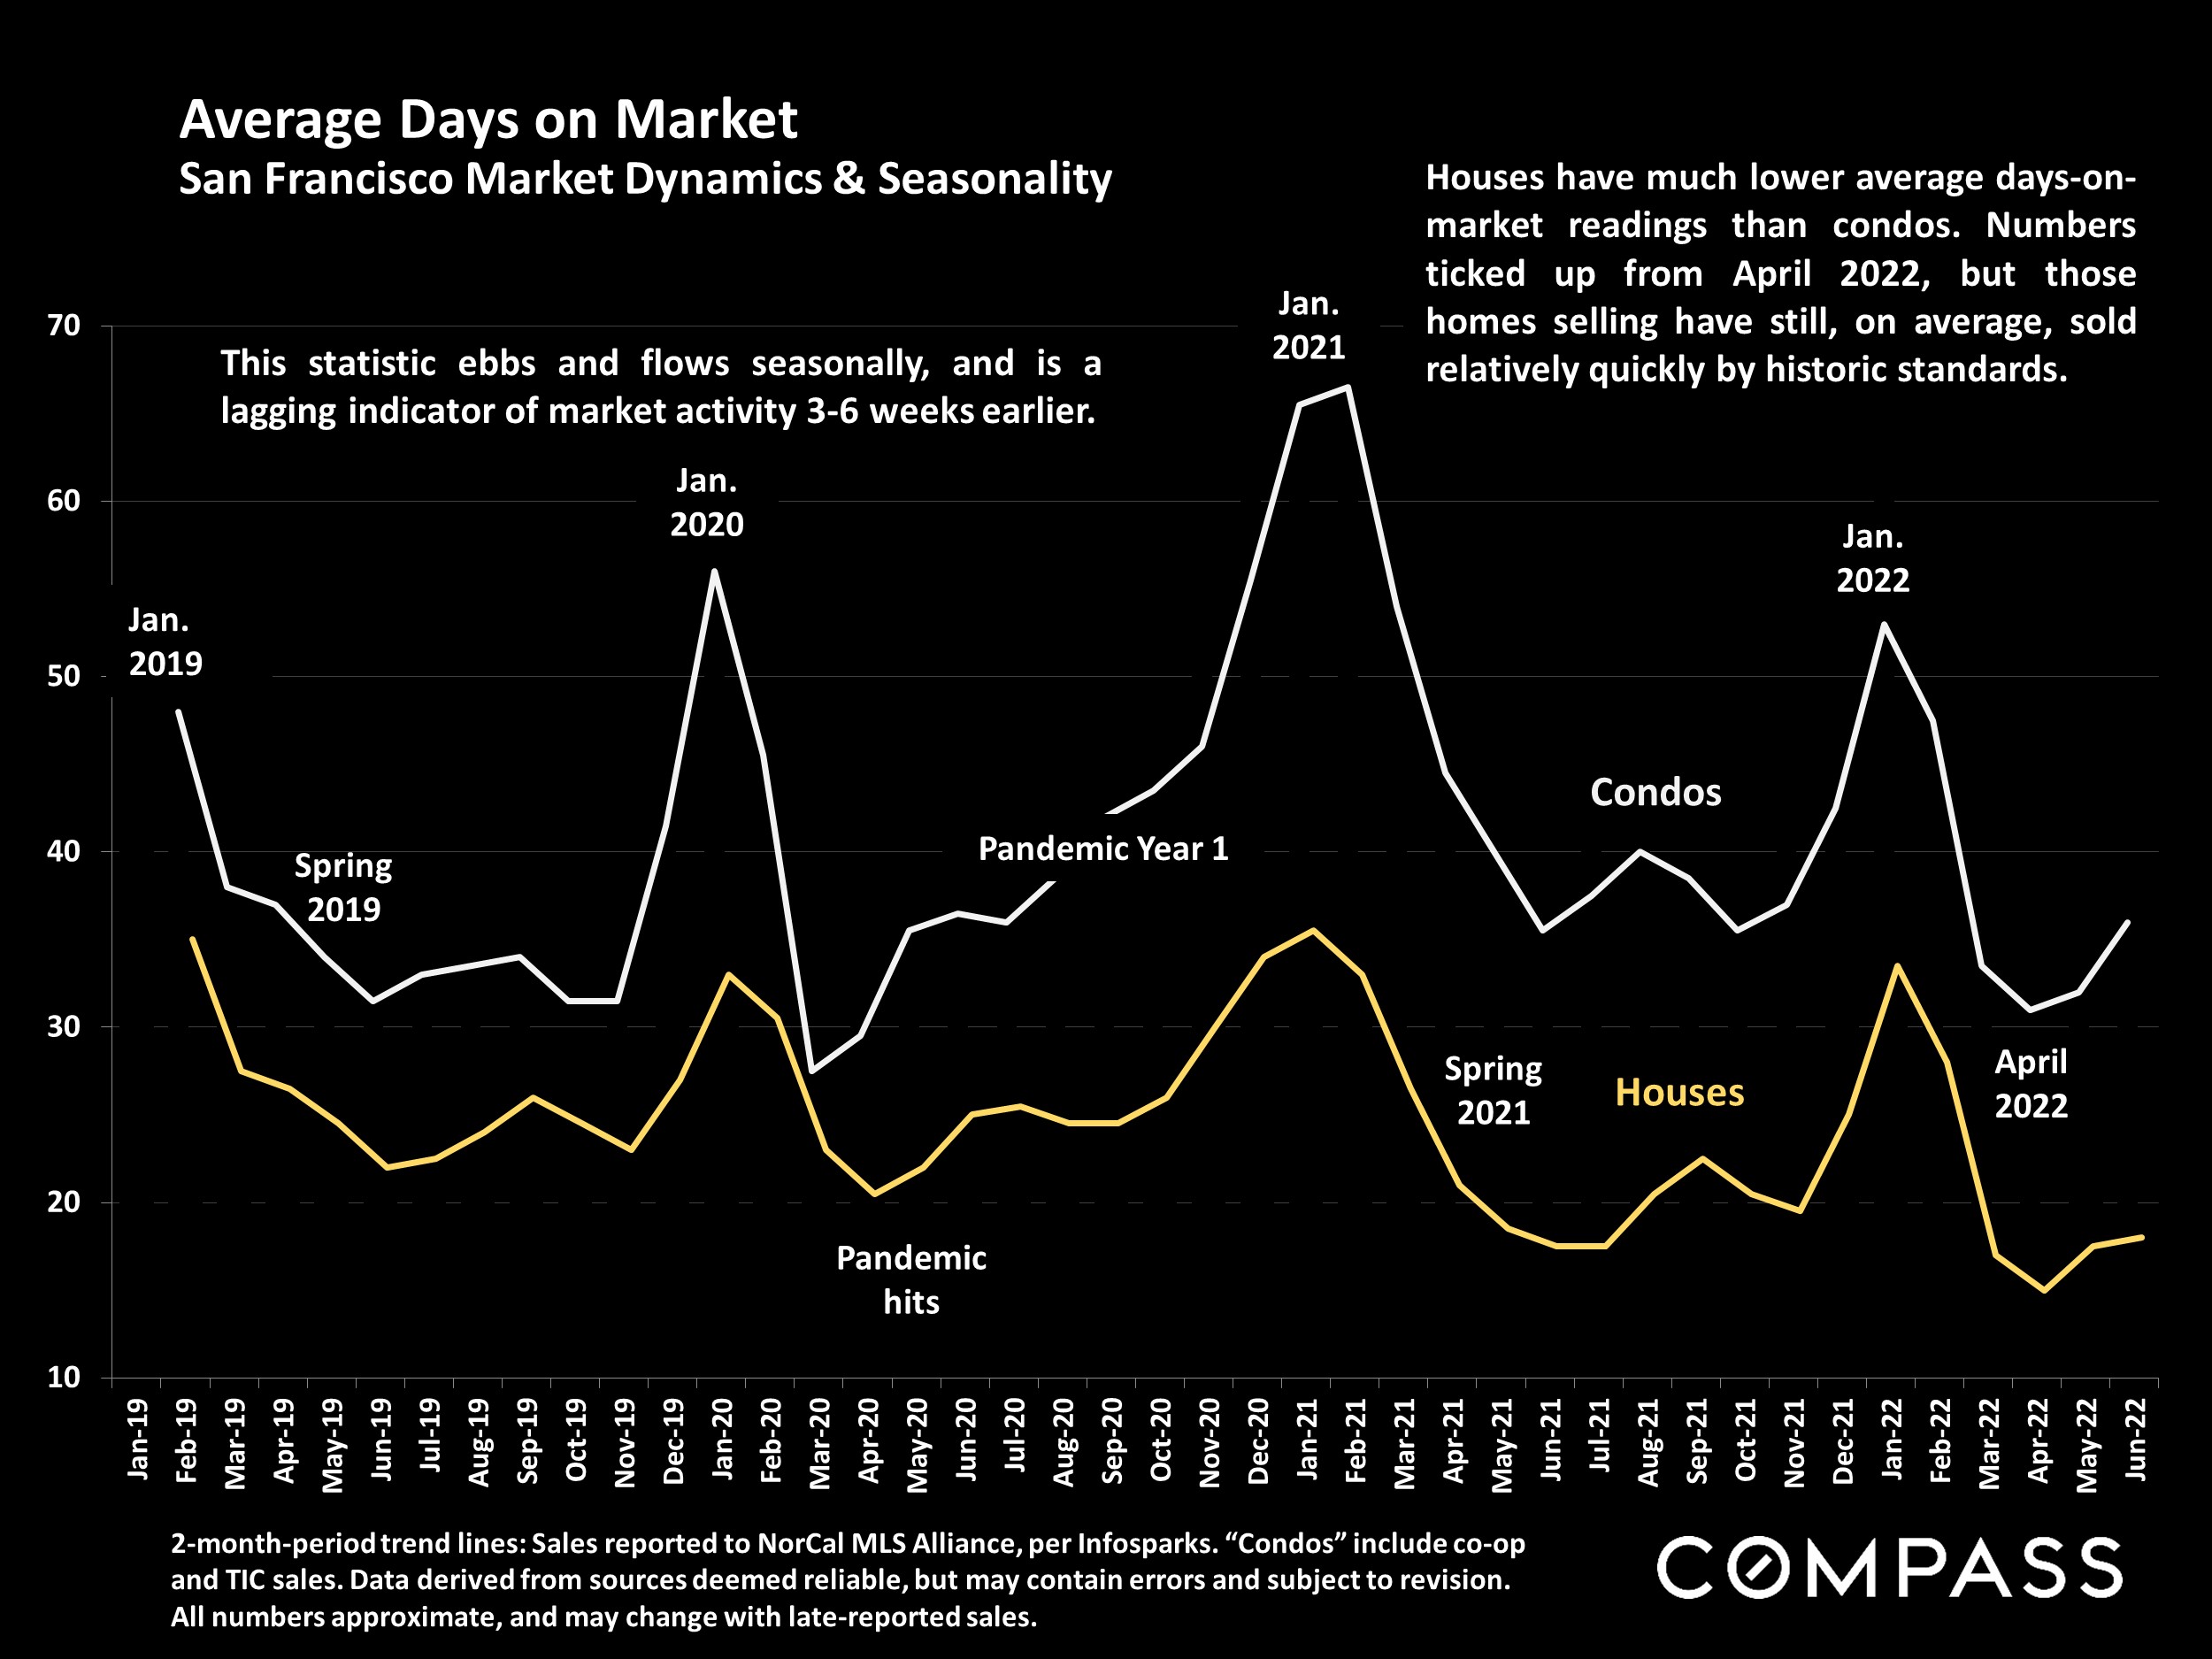
These factors, as they applied in their various combinations to millions of households, prompted big changes in county-to-county migration; the comparative appeal of urban, suburban and rural locations; the desirability of different property types (houses, condos, apartments) and amenities (pools; yards, gardens and decks; home and lot size); a heightened attention to housing affordability between regions (now that many could work from anywhere); and surging luxury home and second-home sales. Waterfront homes, in particular, became highly sought after. Some changes have ebbed and flowed over the period.
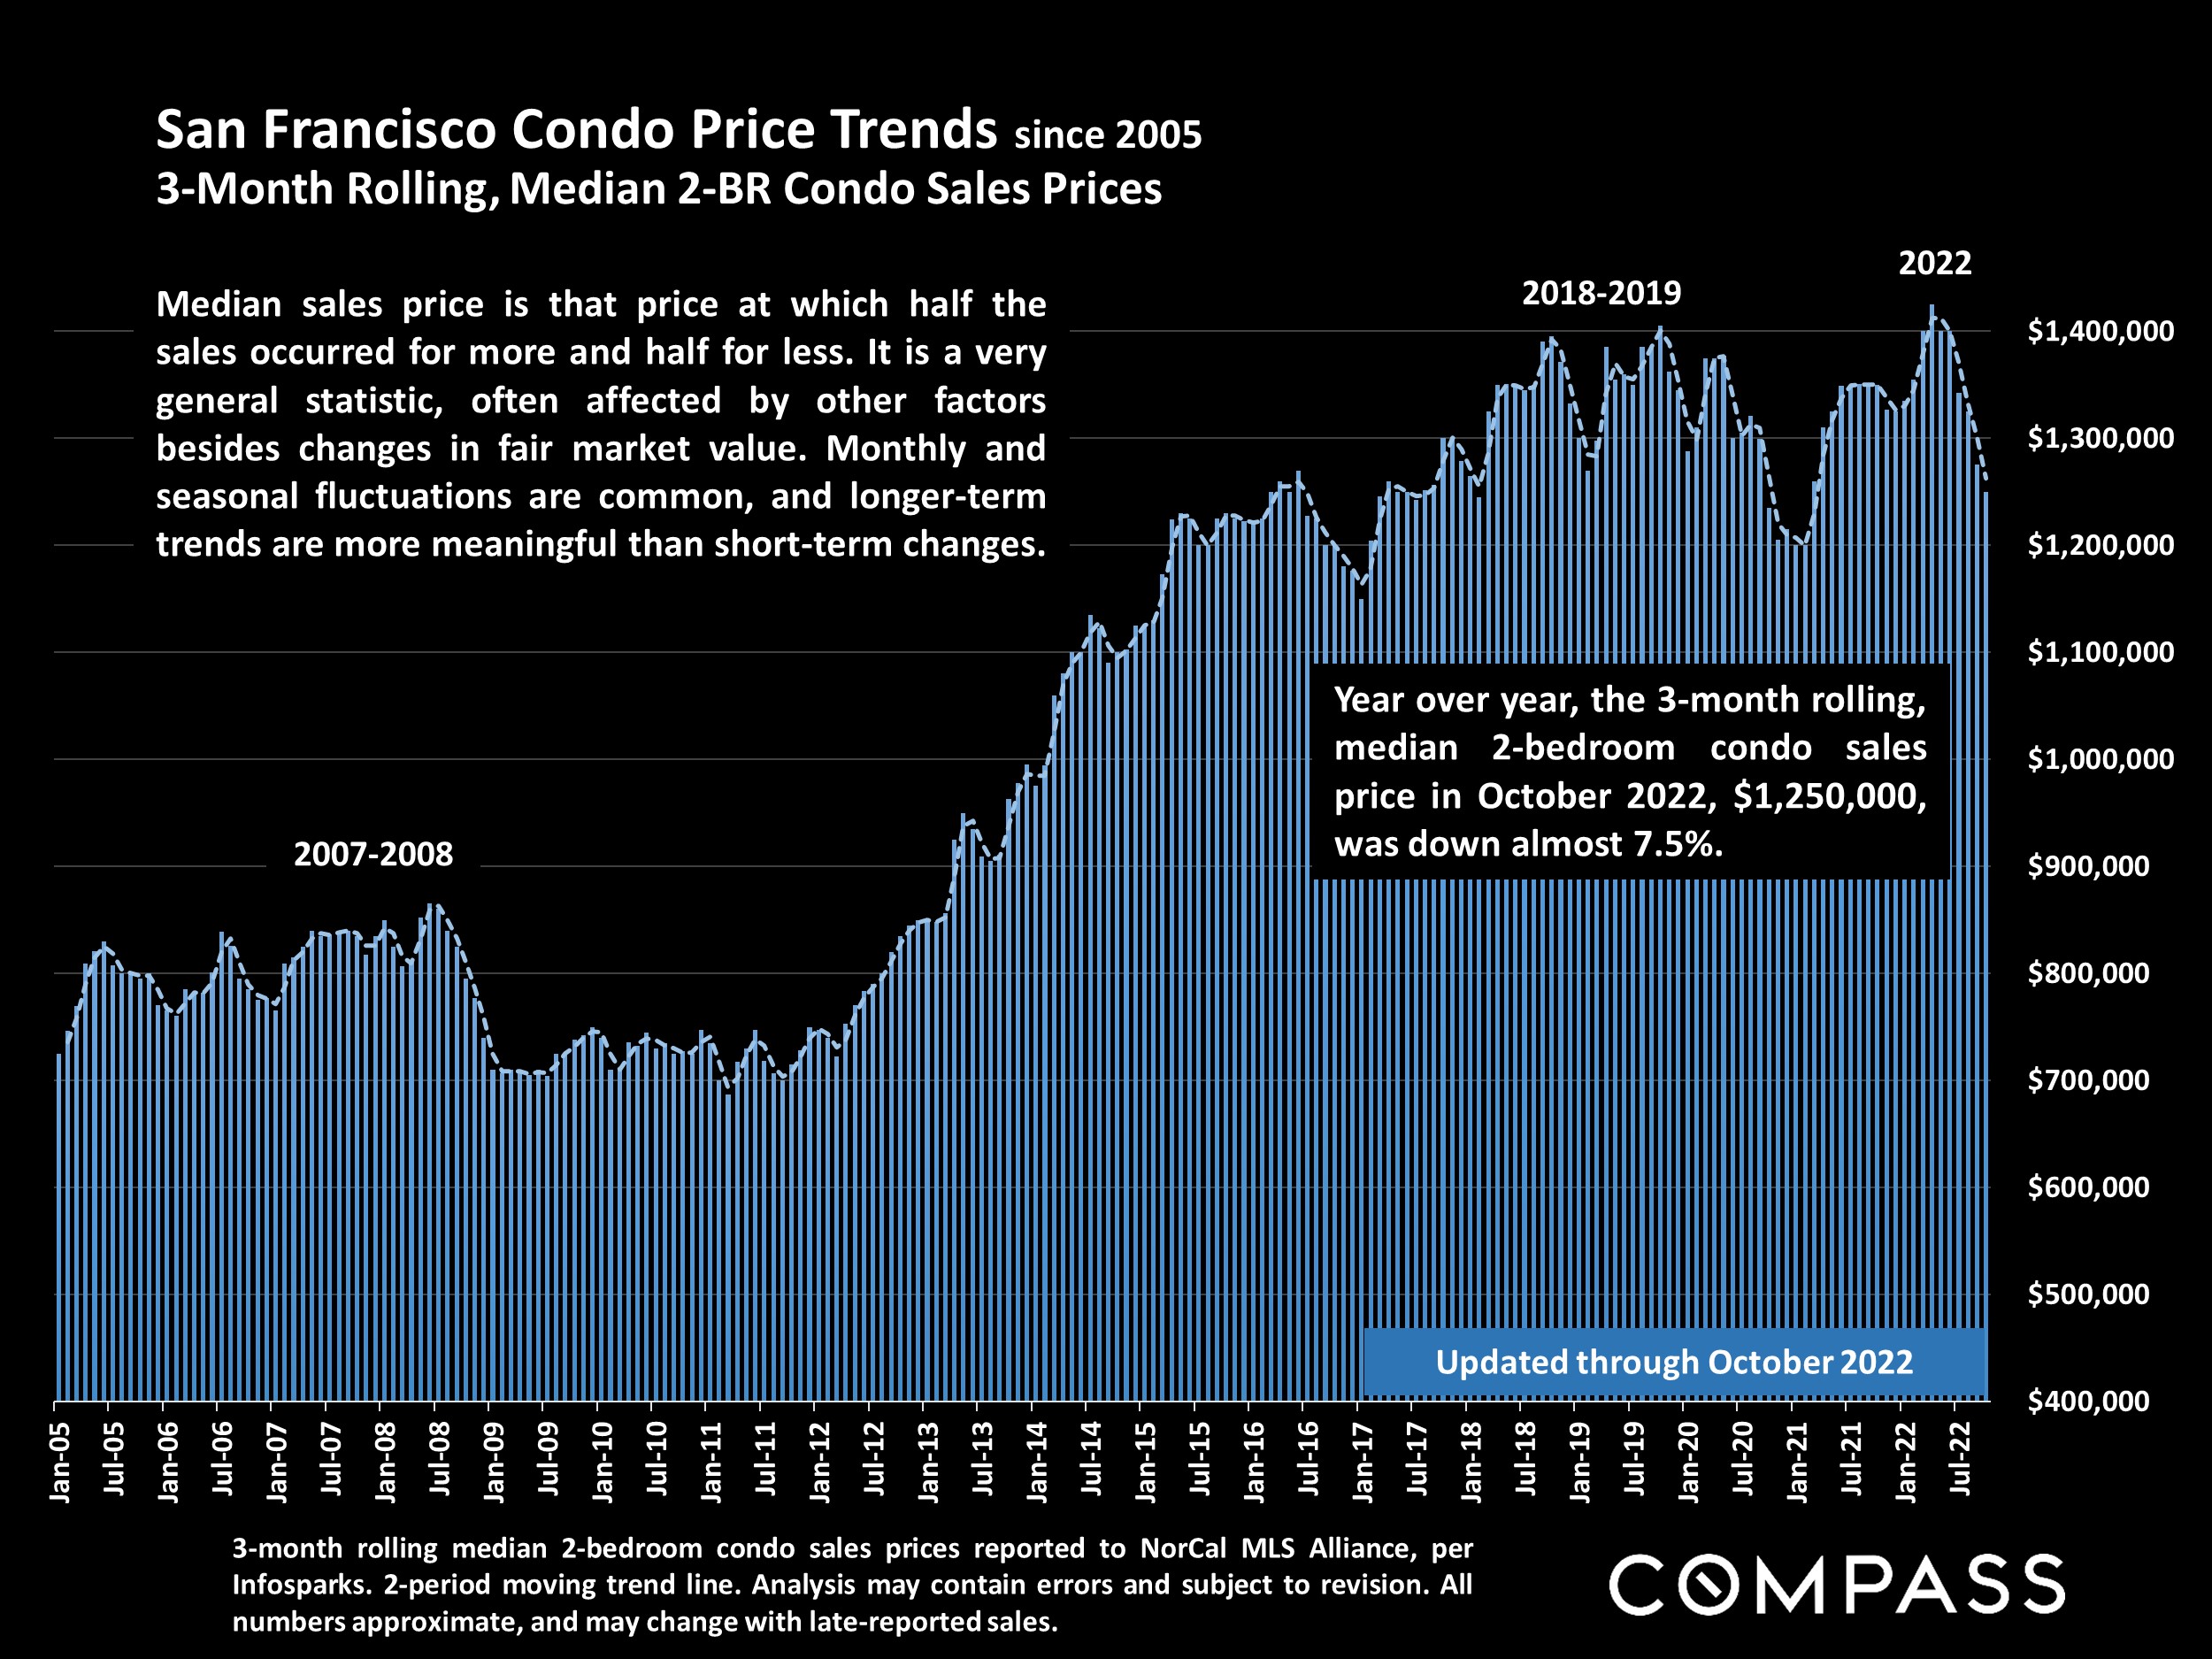
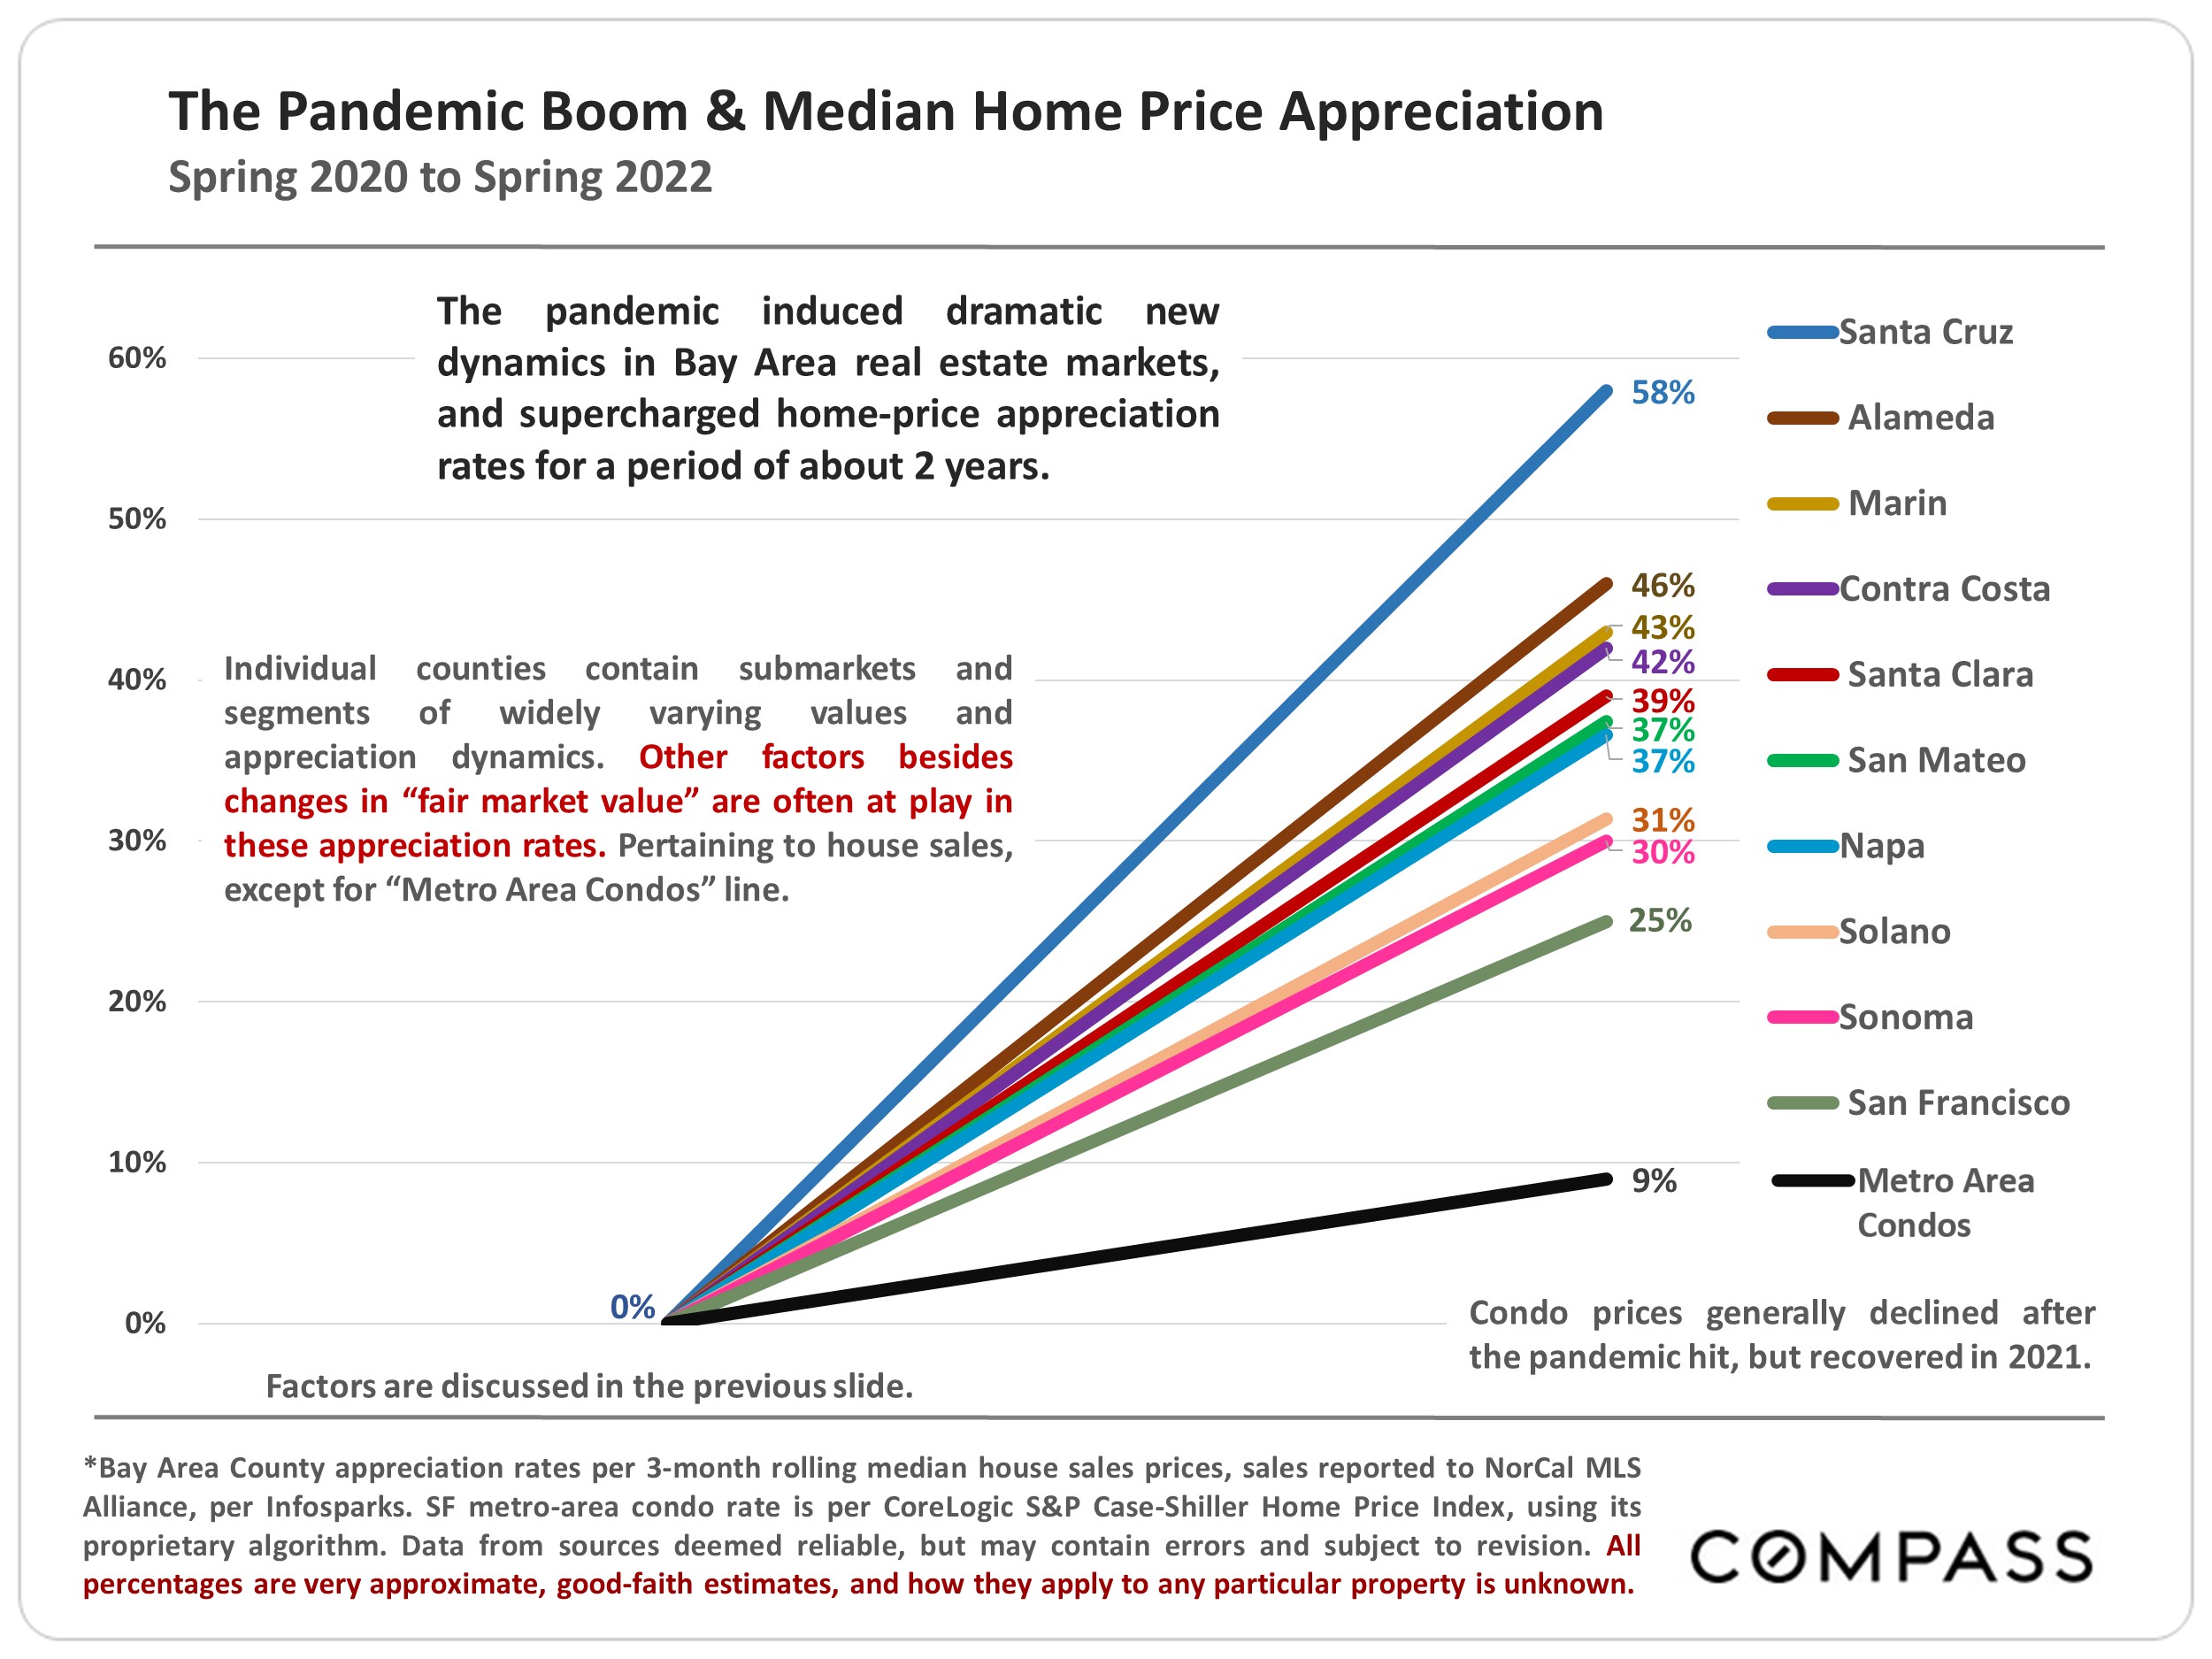
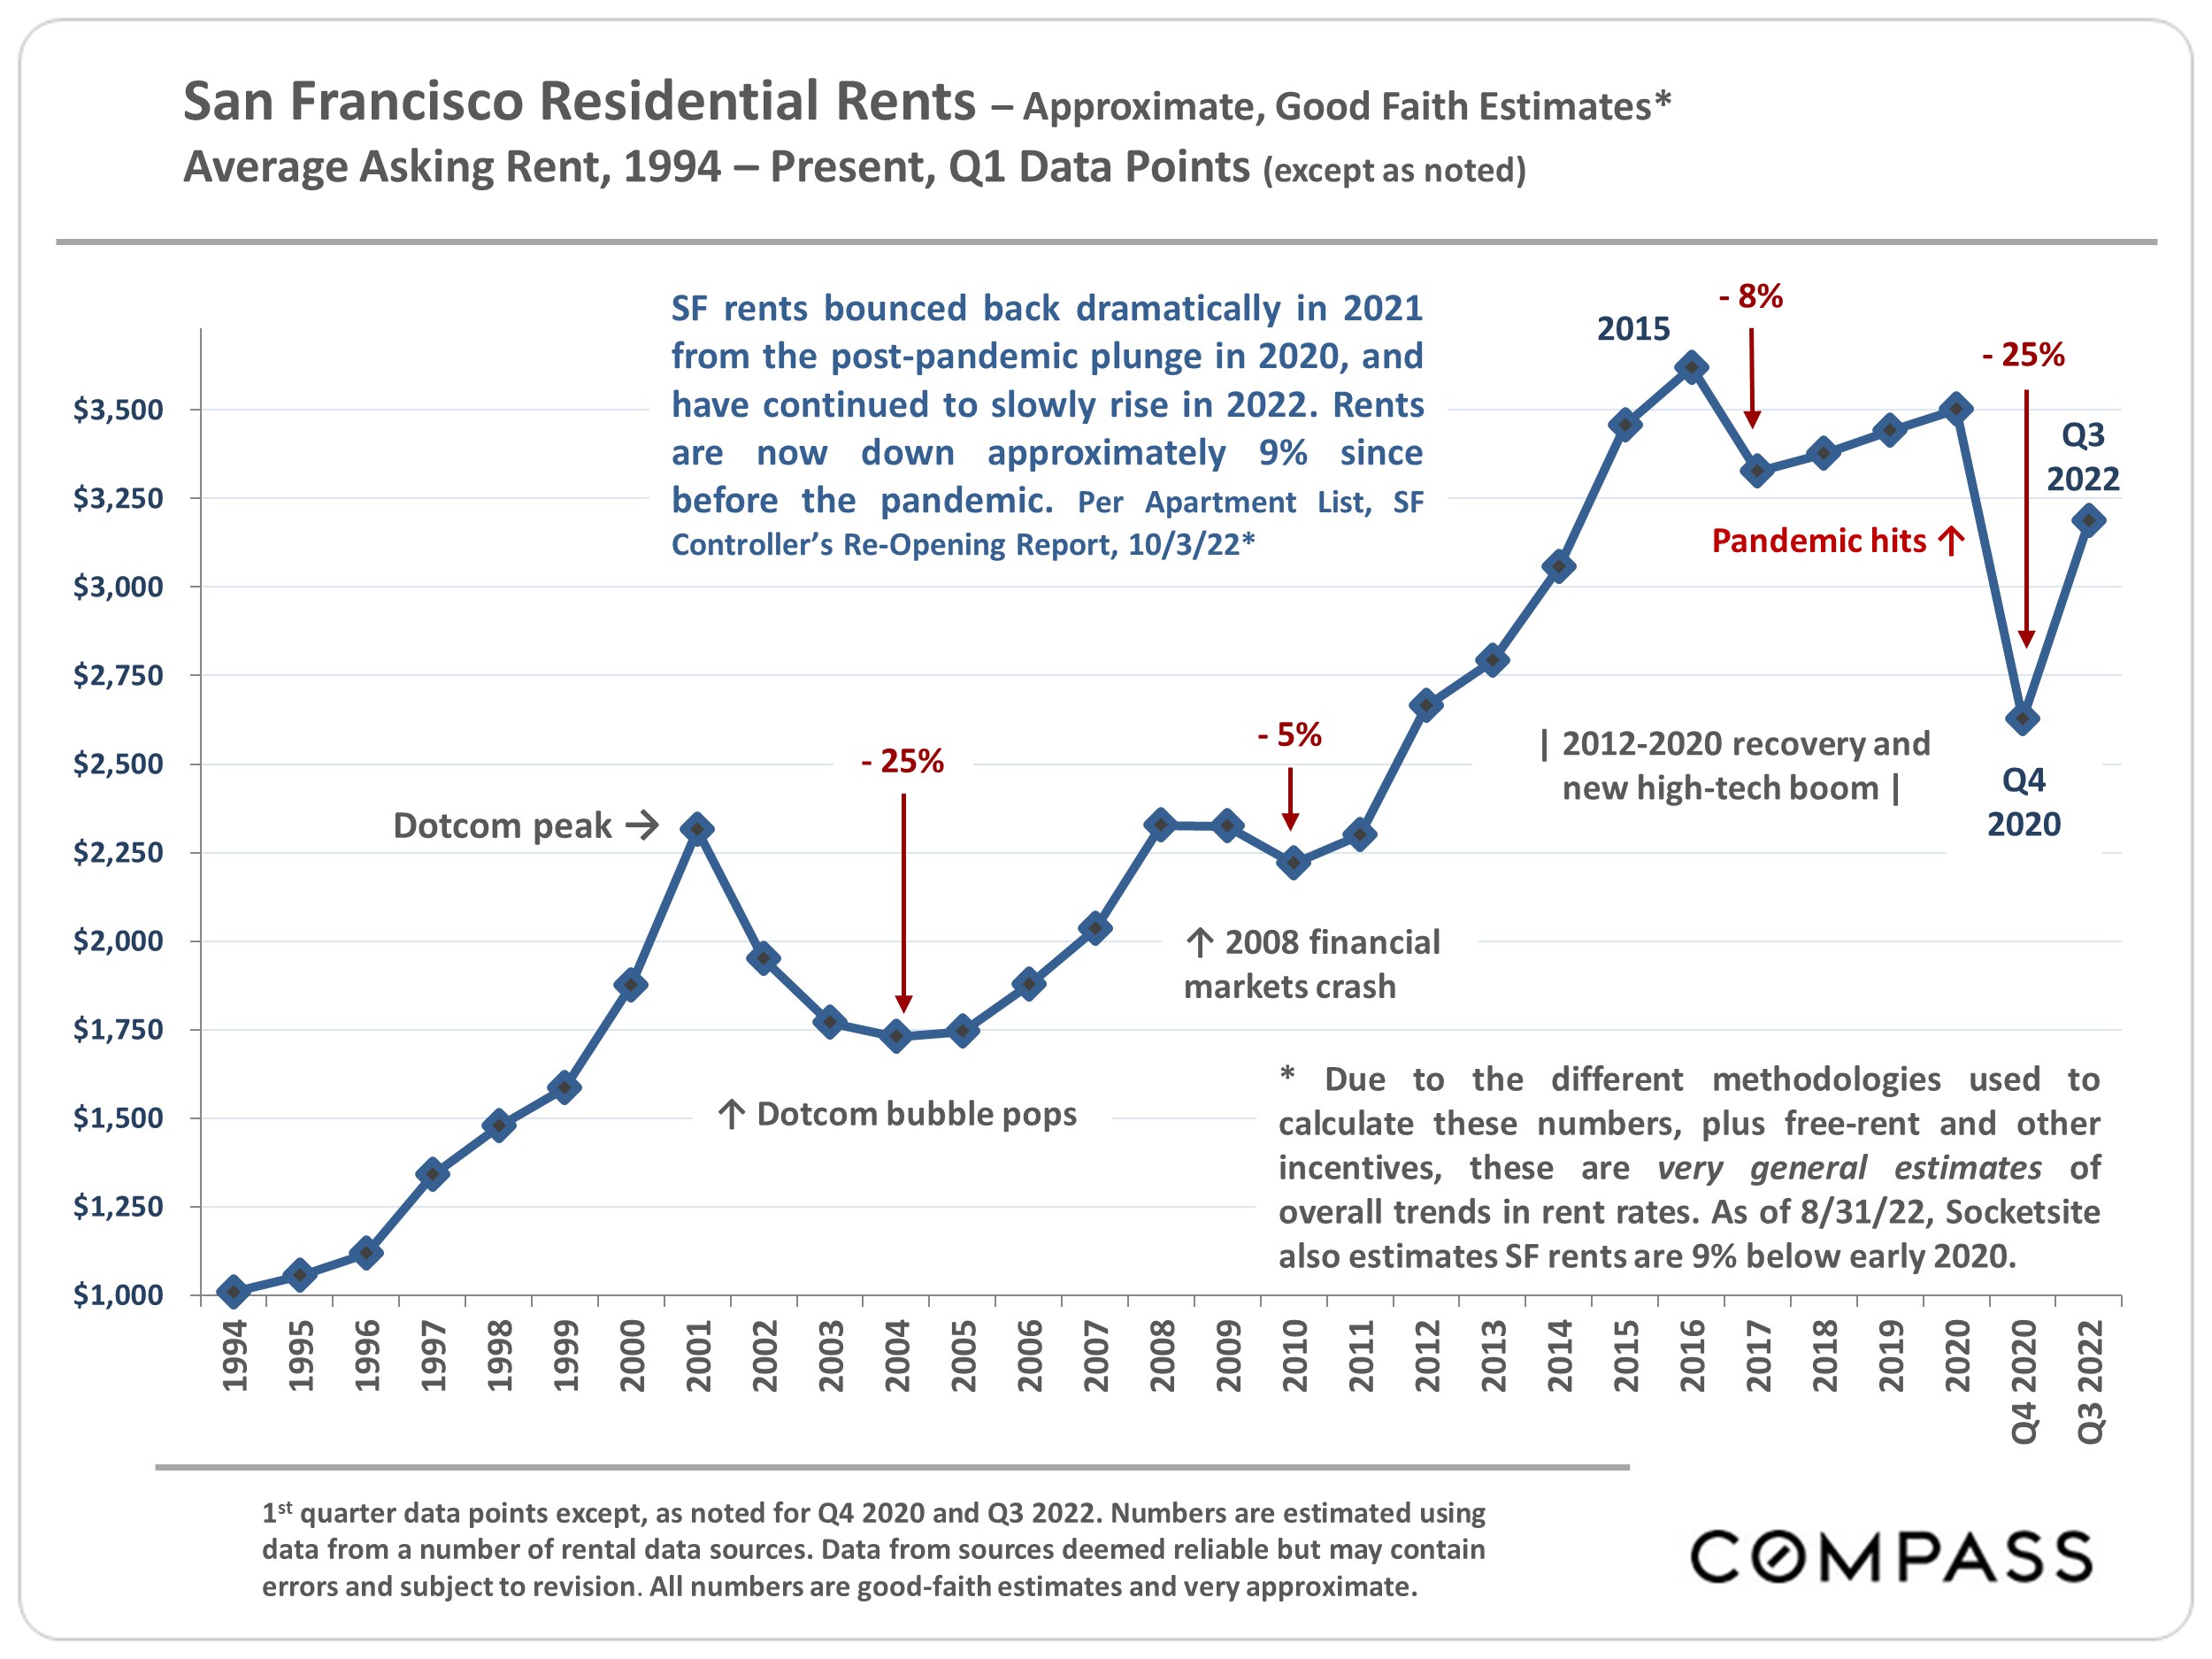
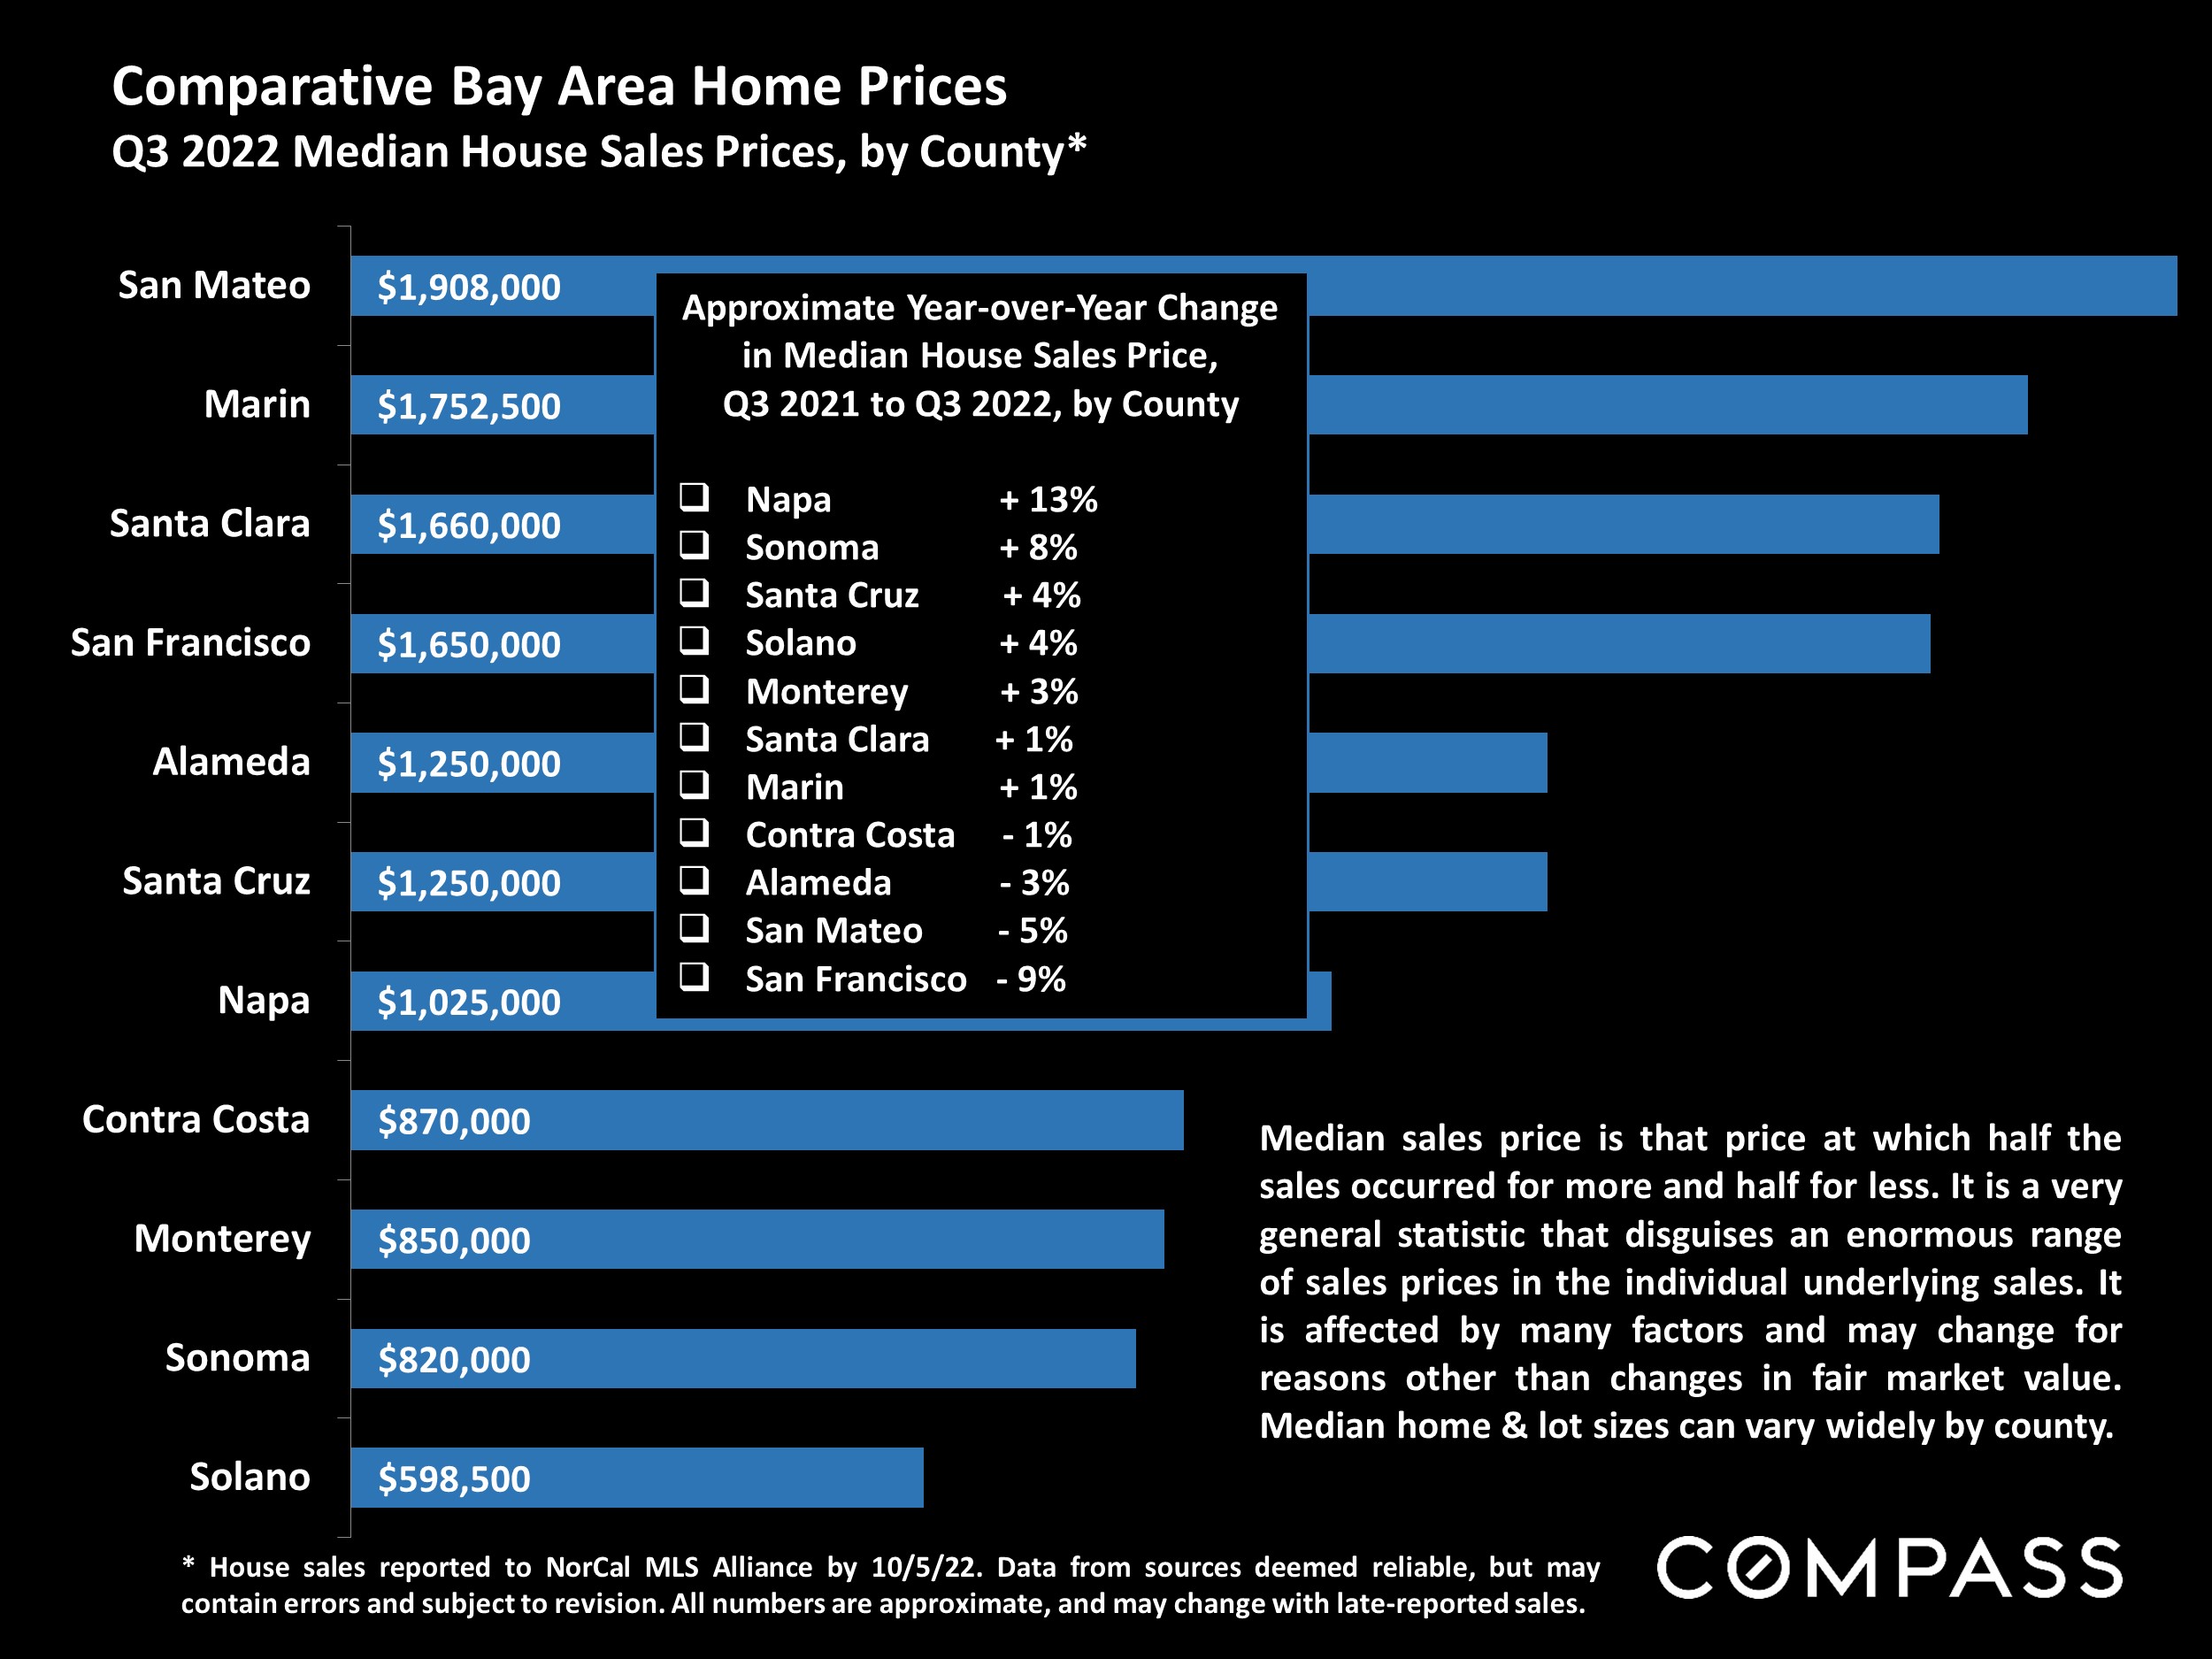
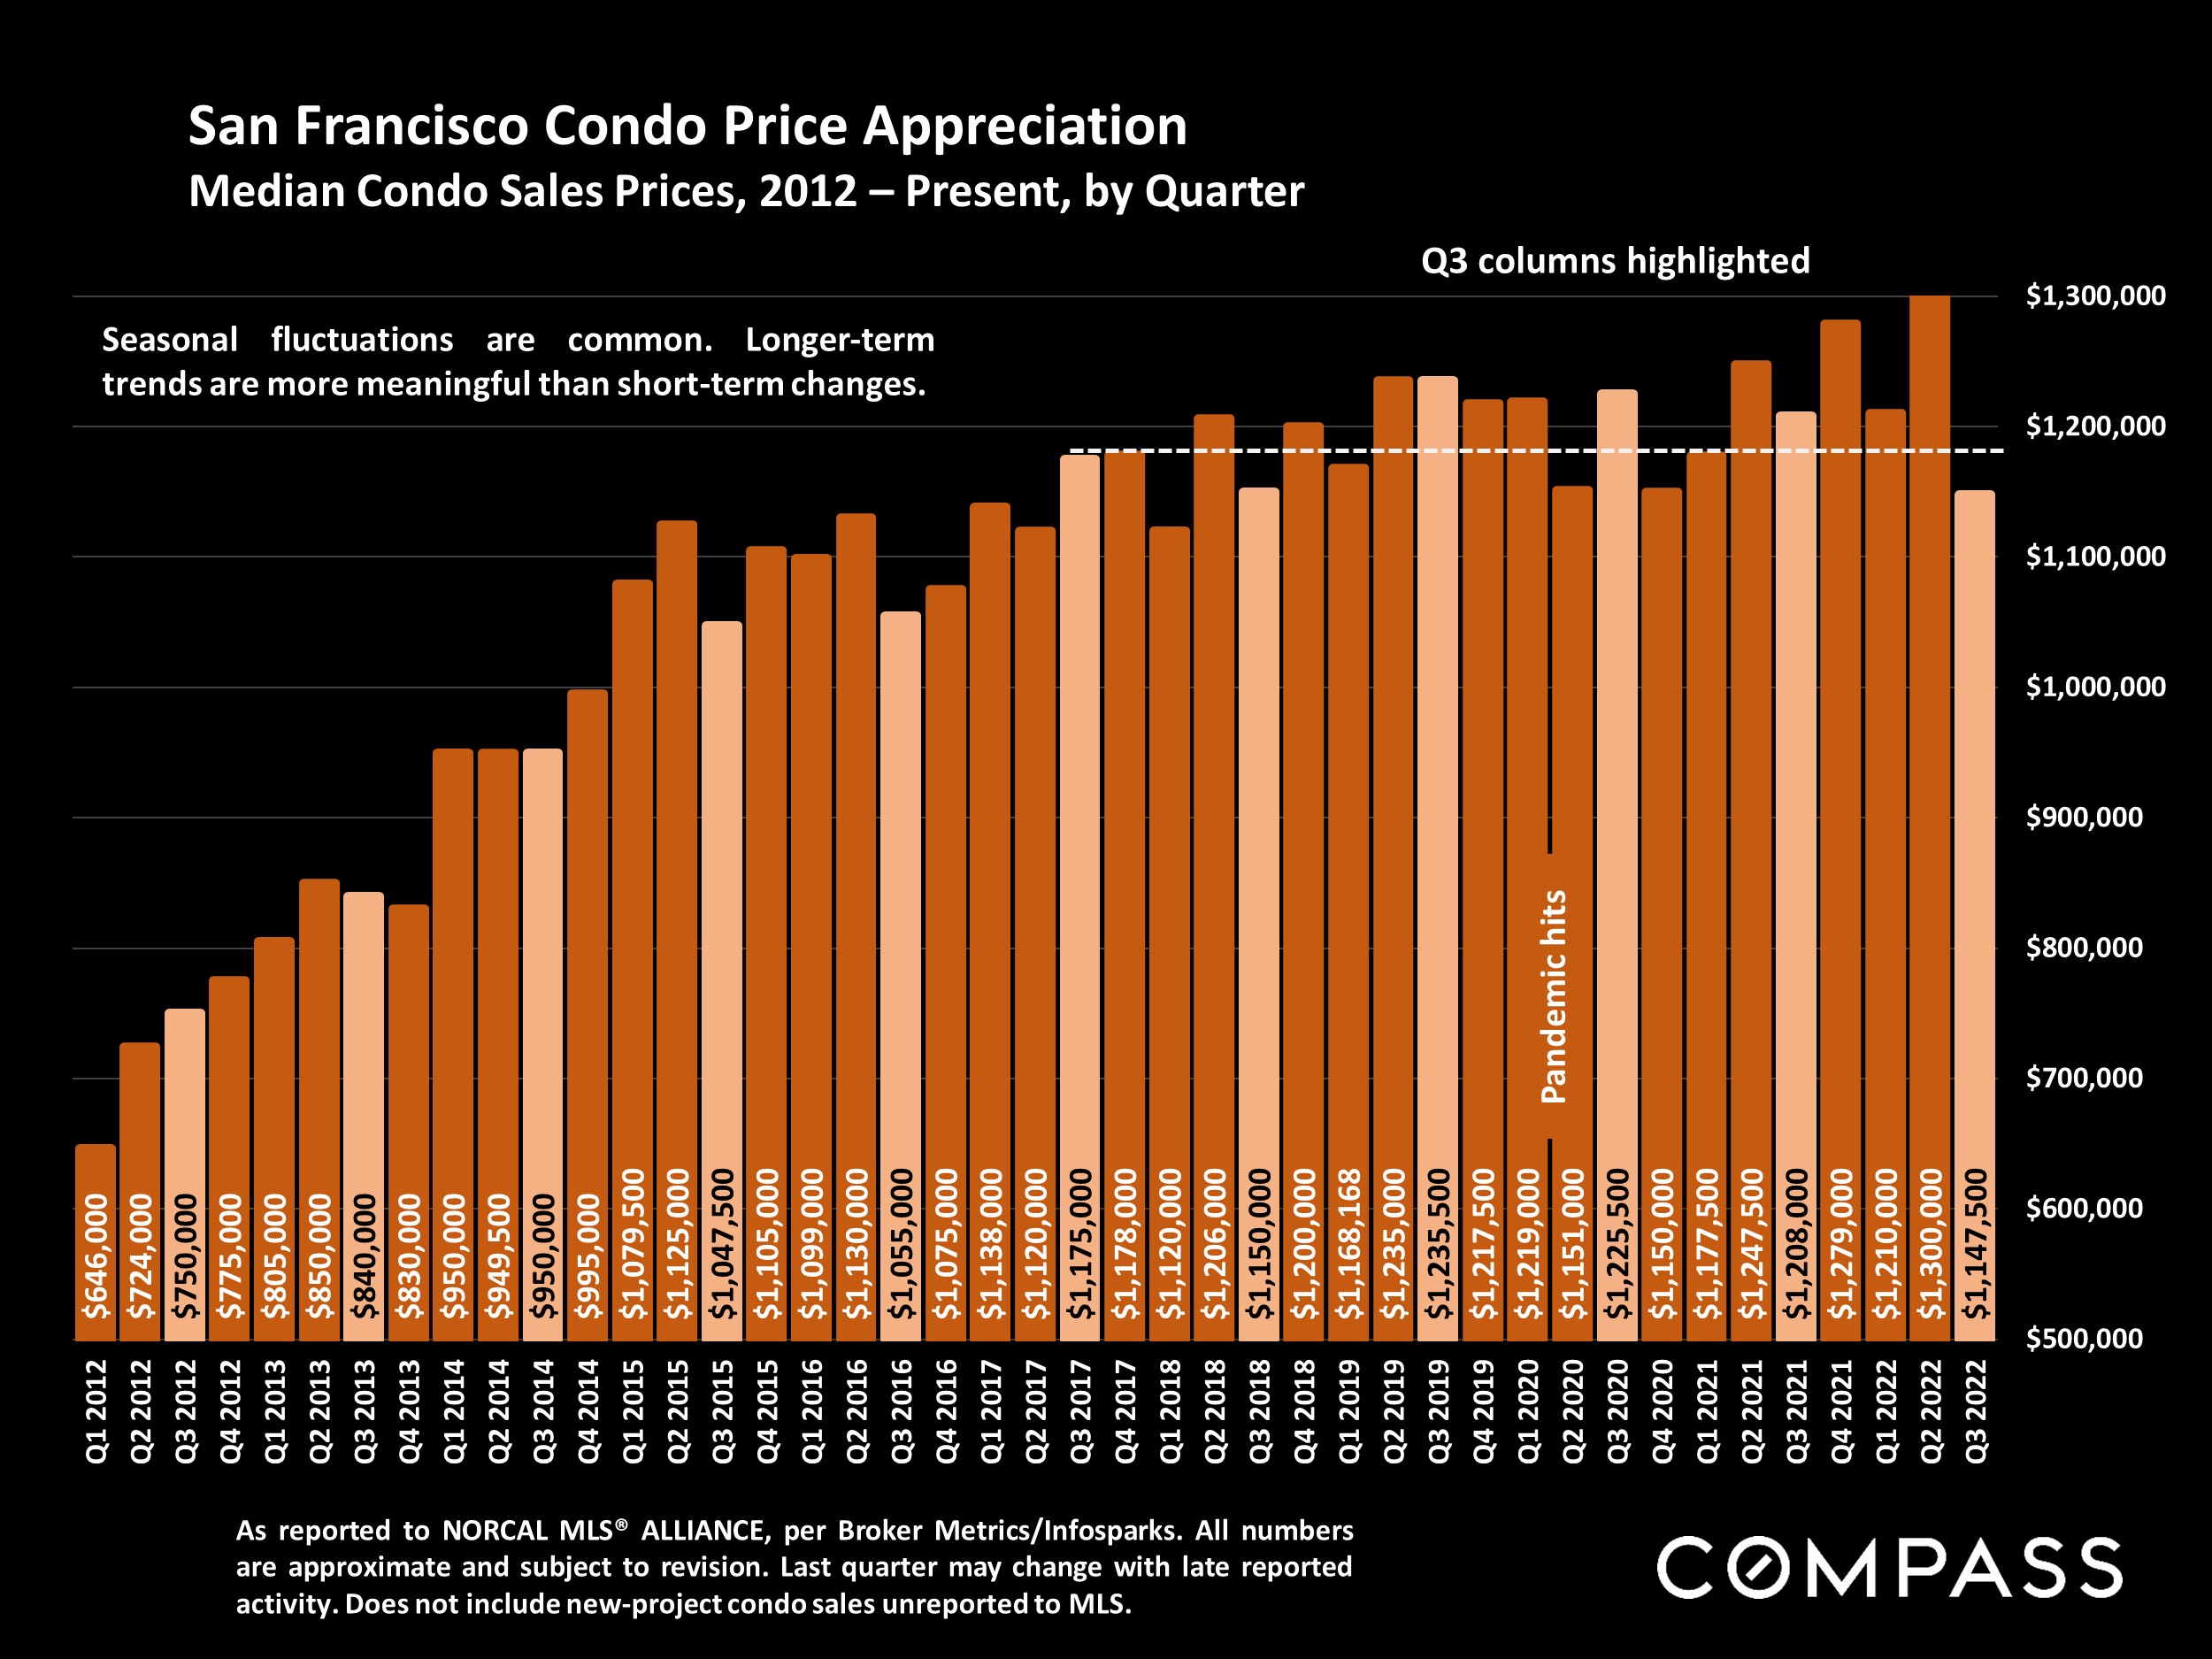
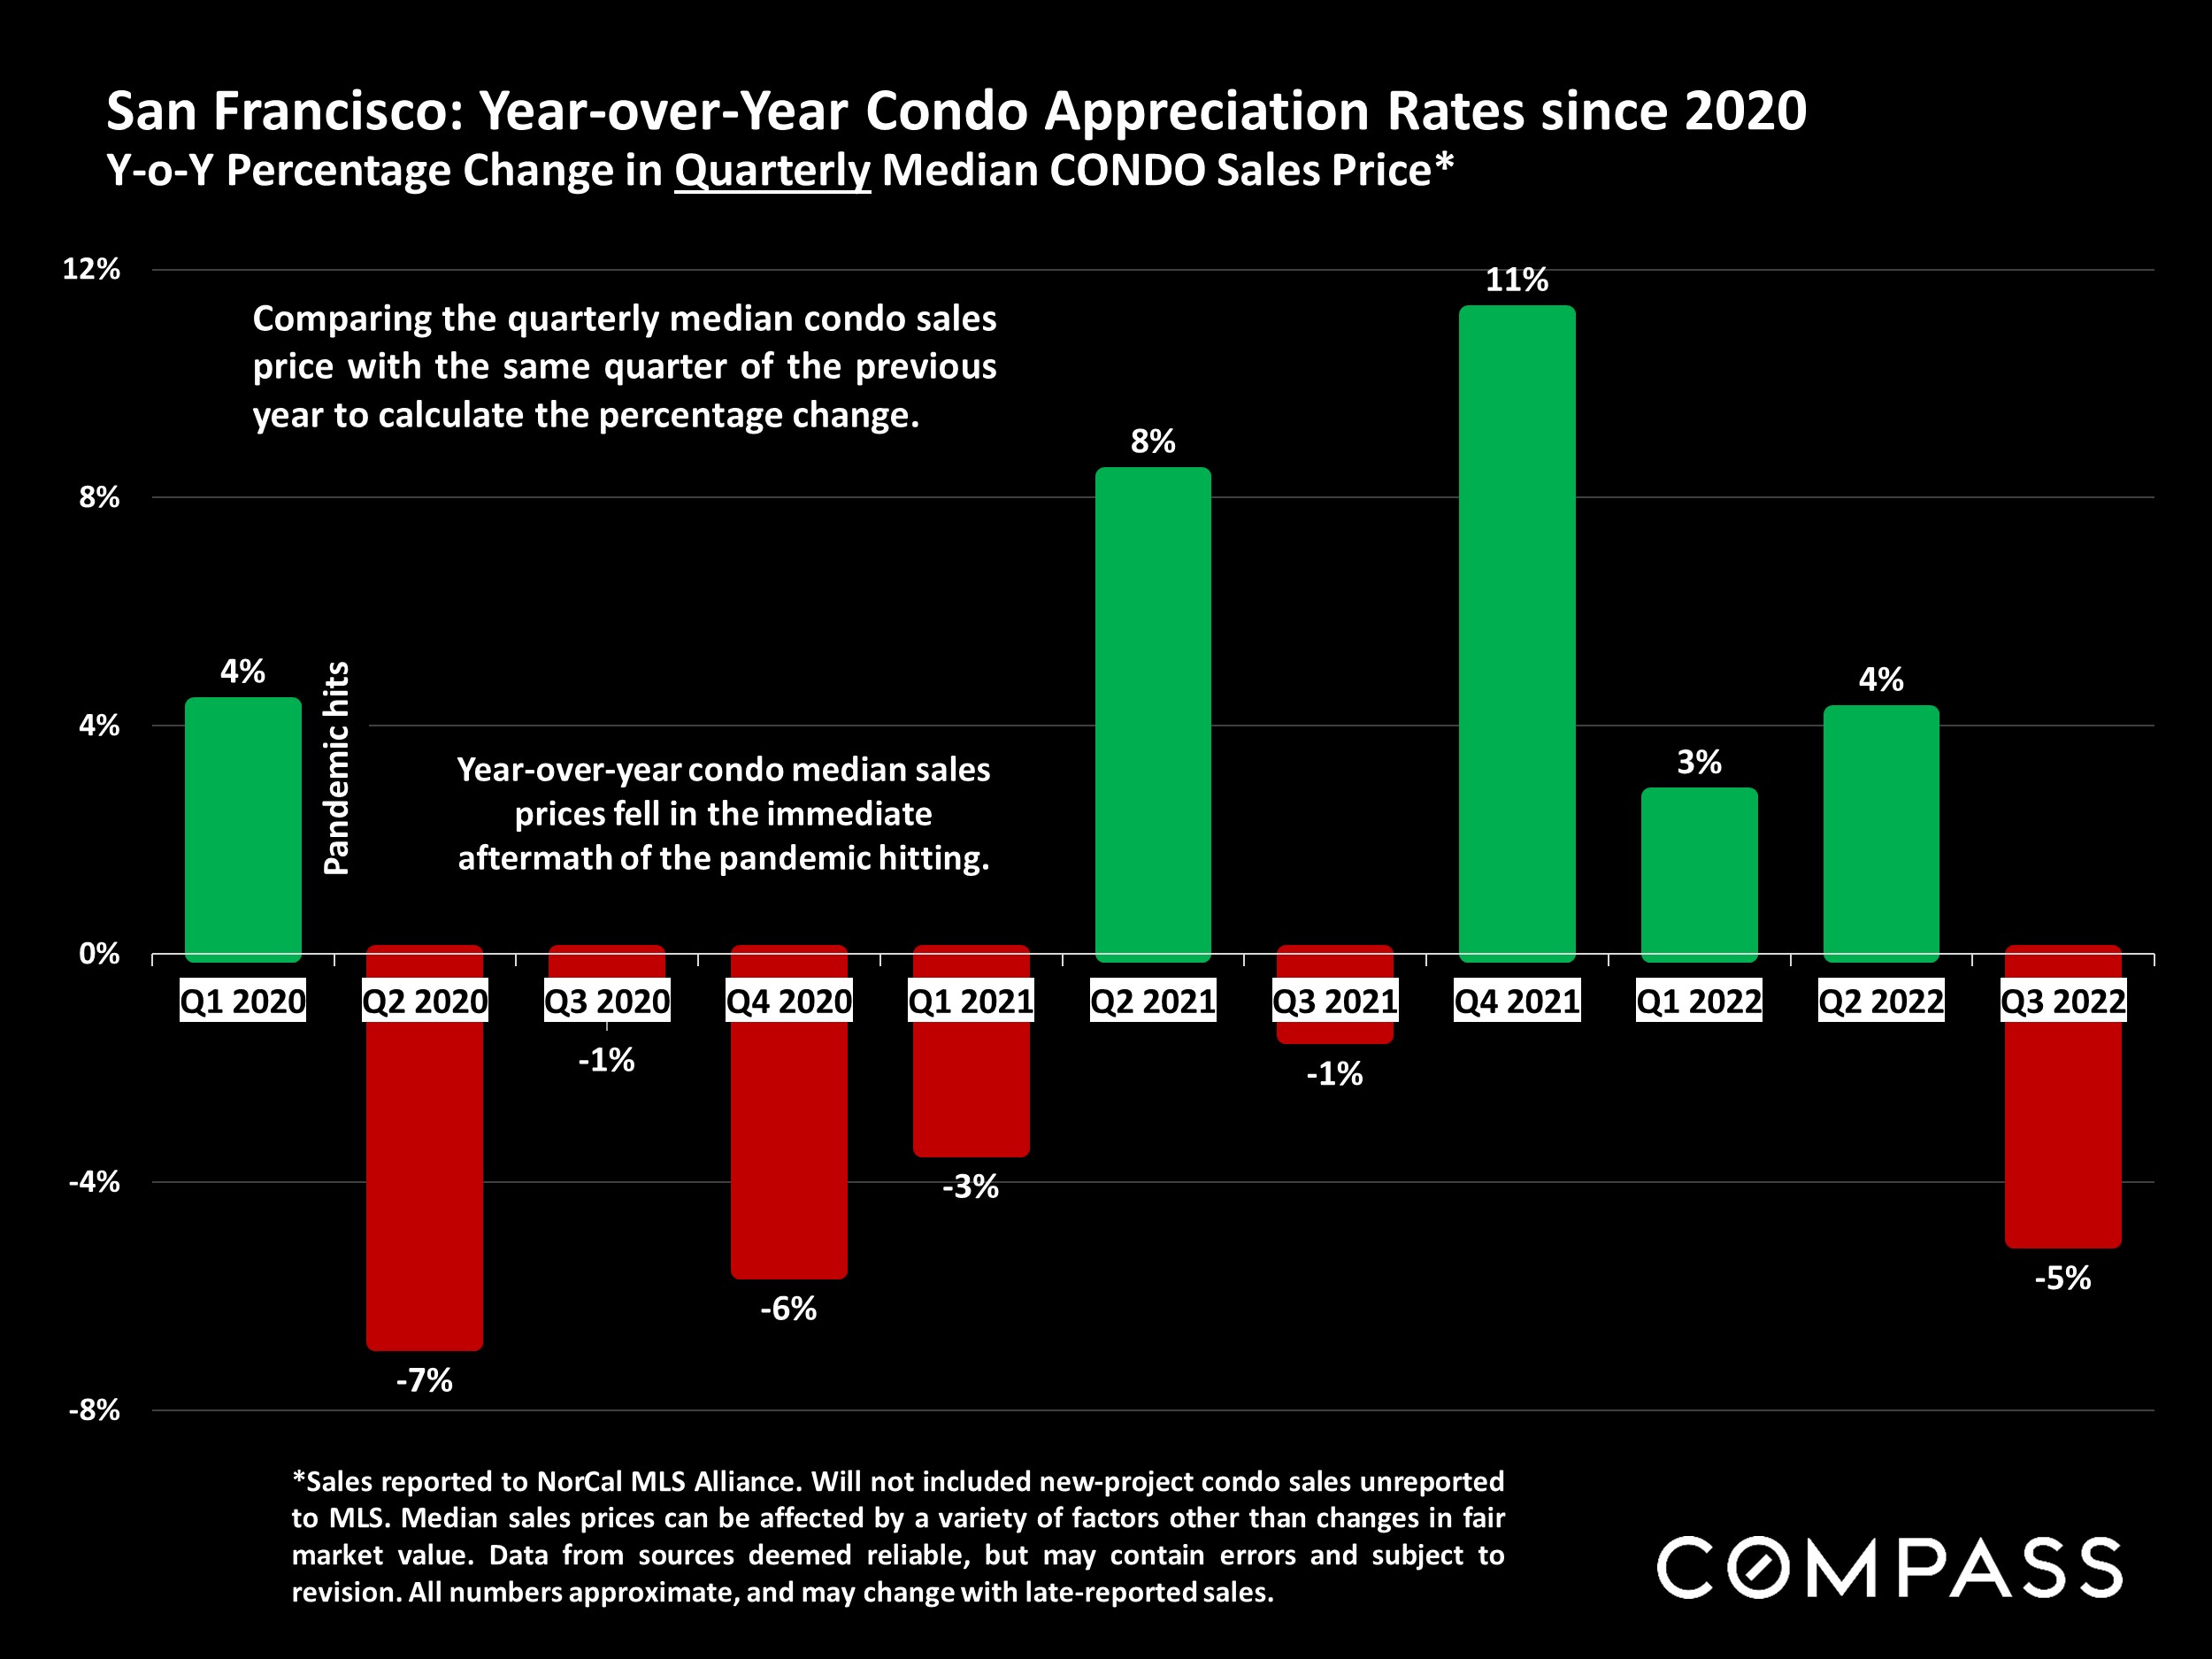
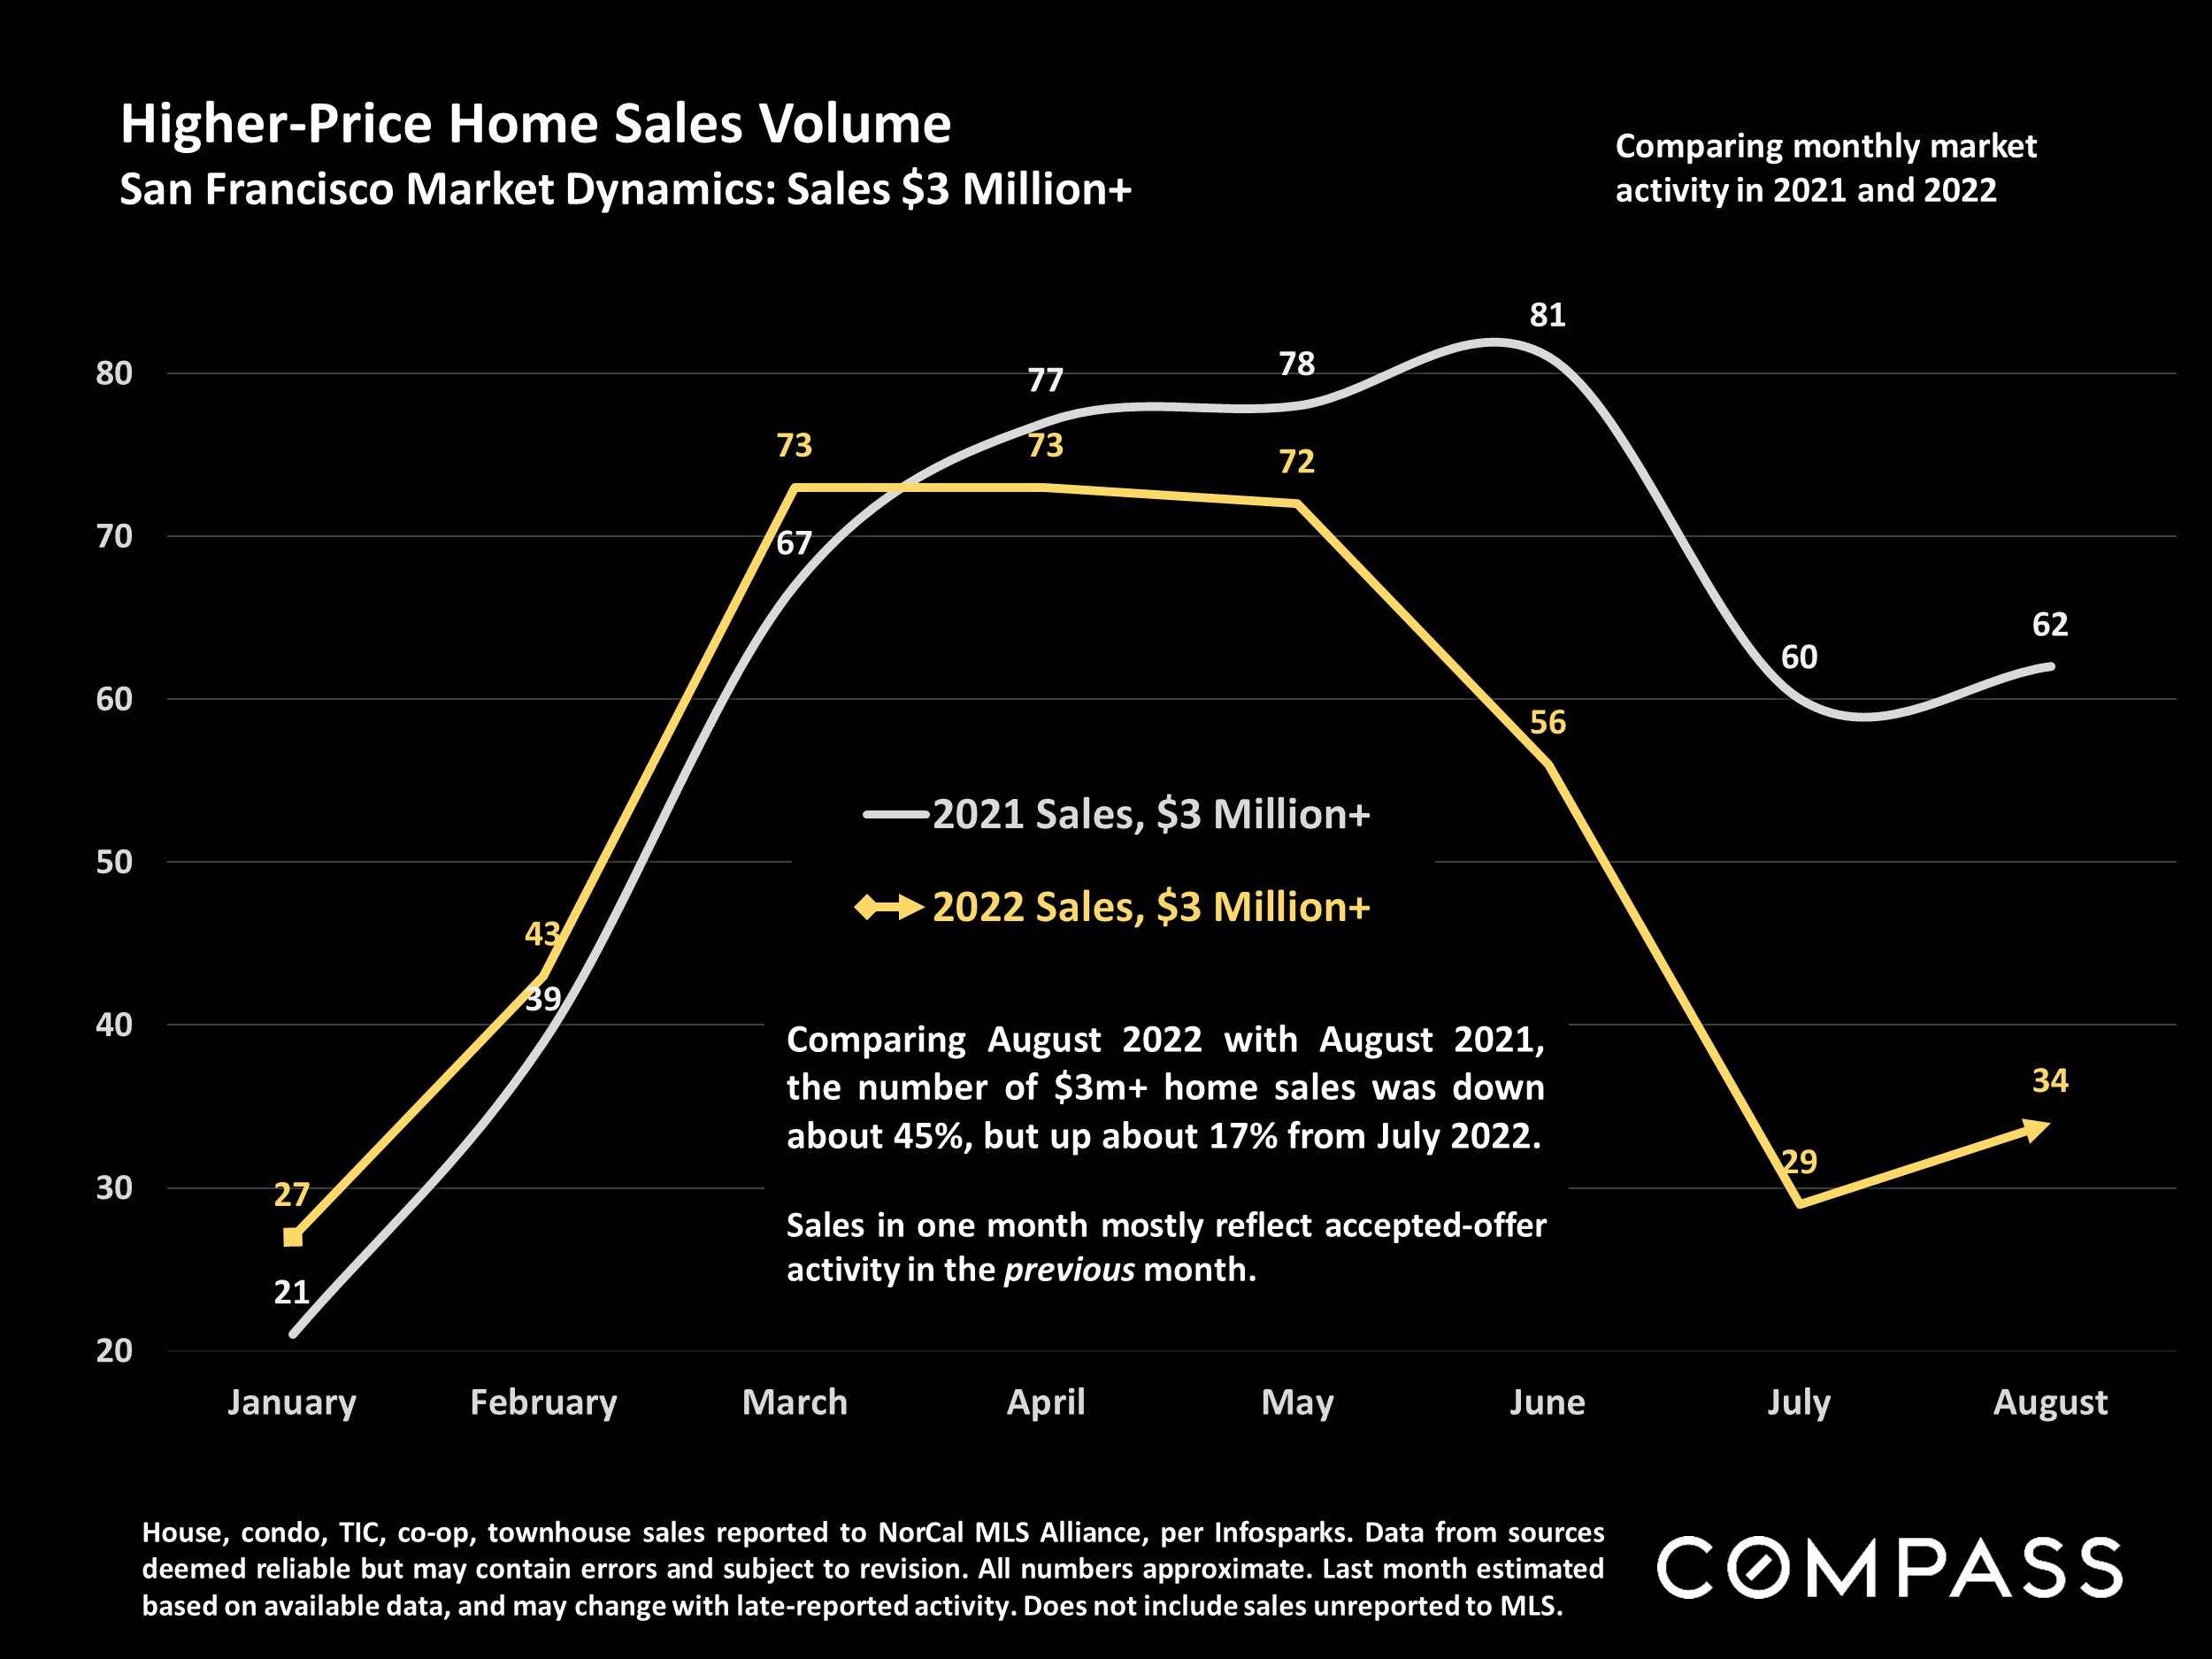
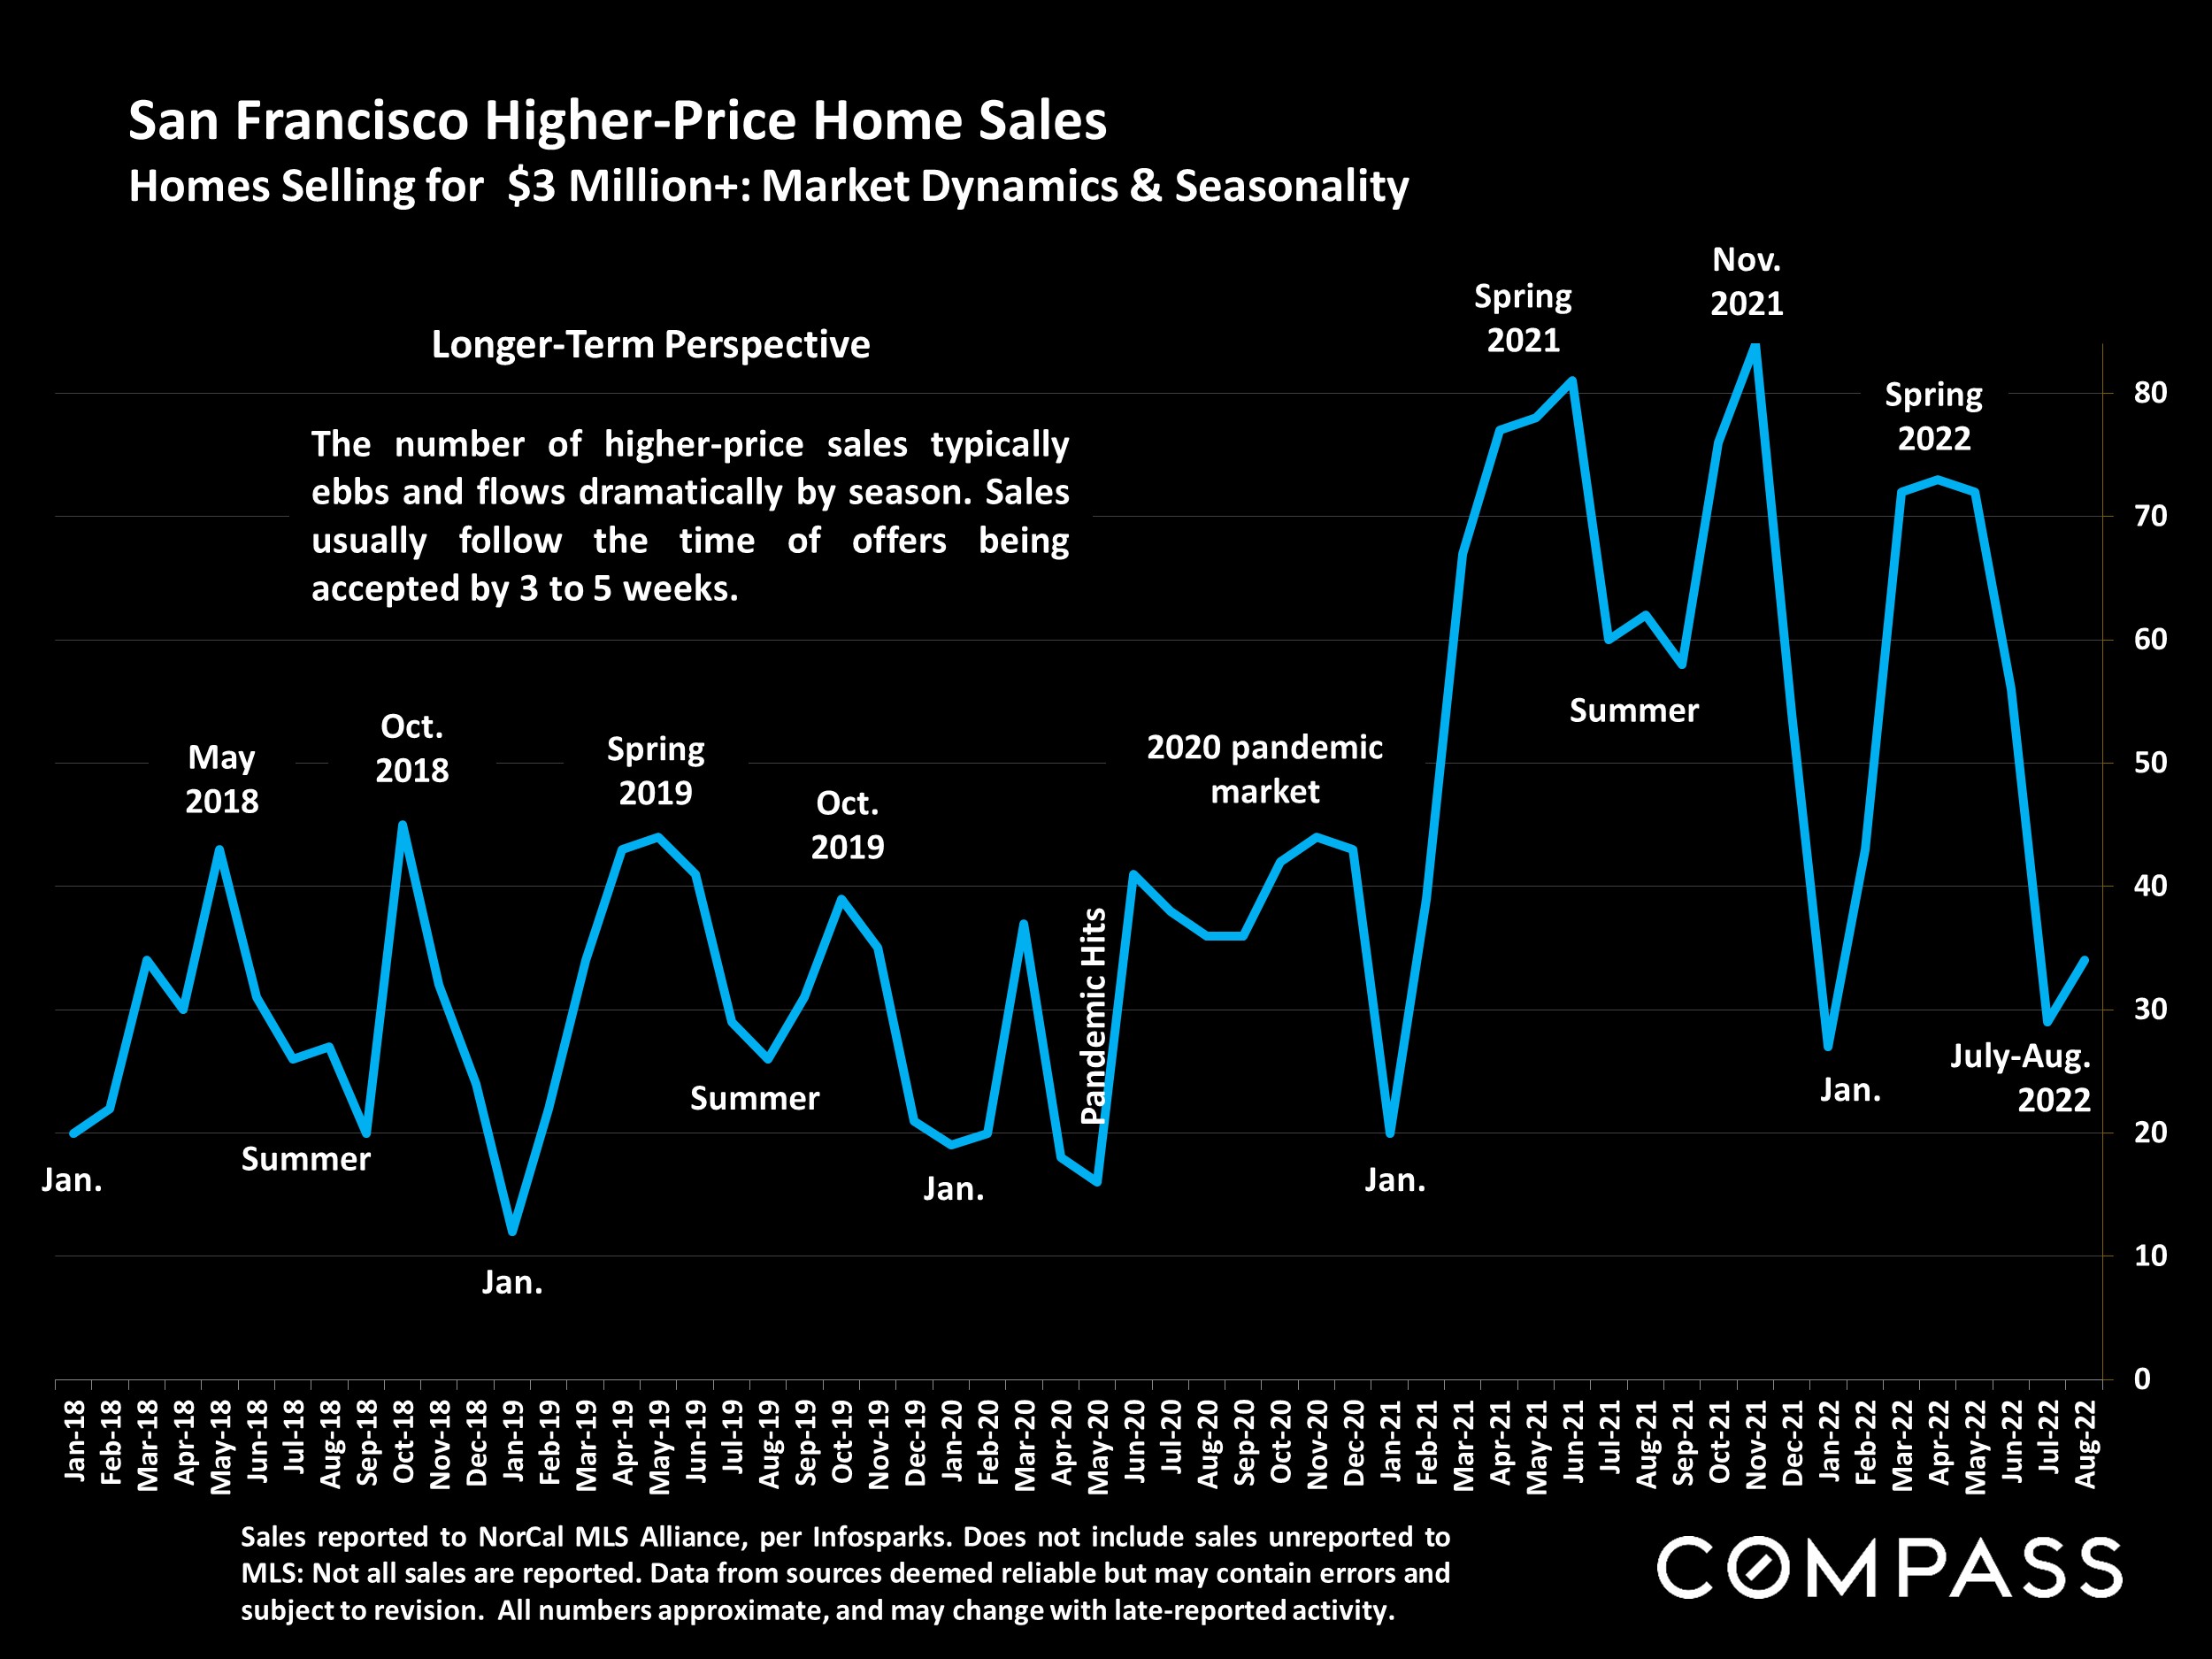
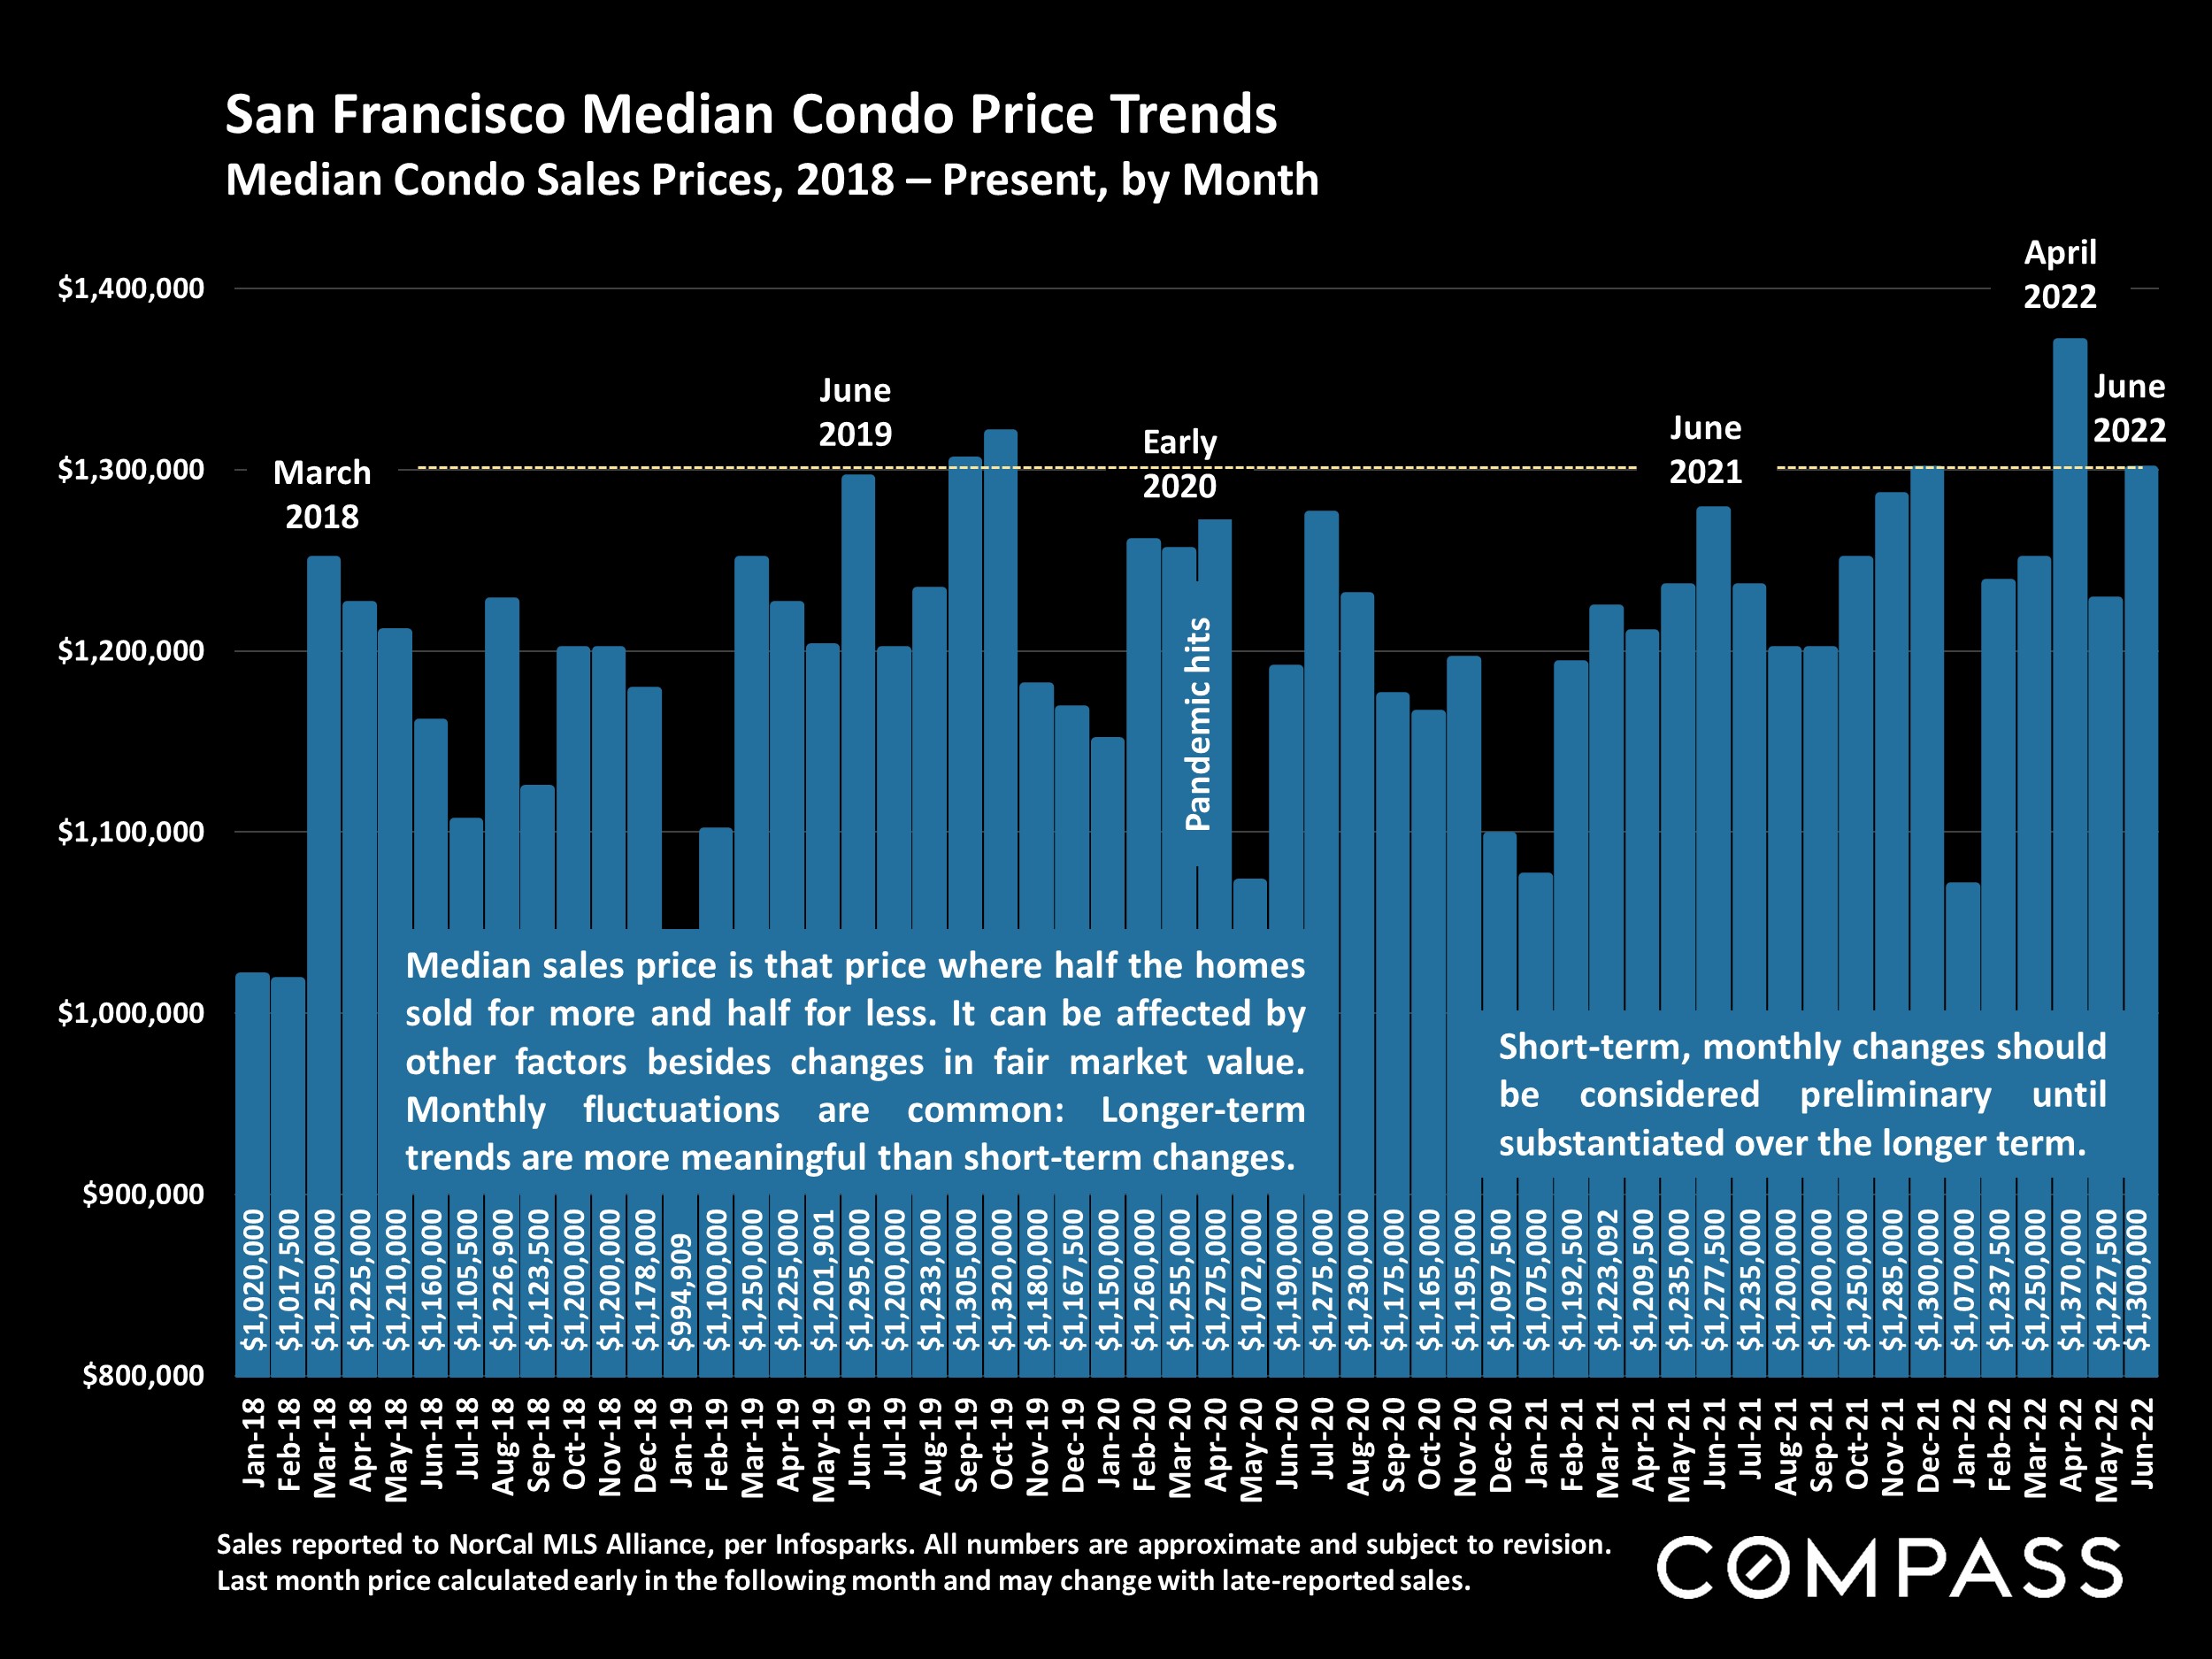
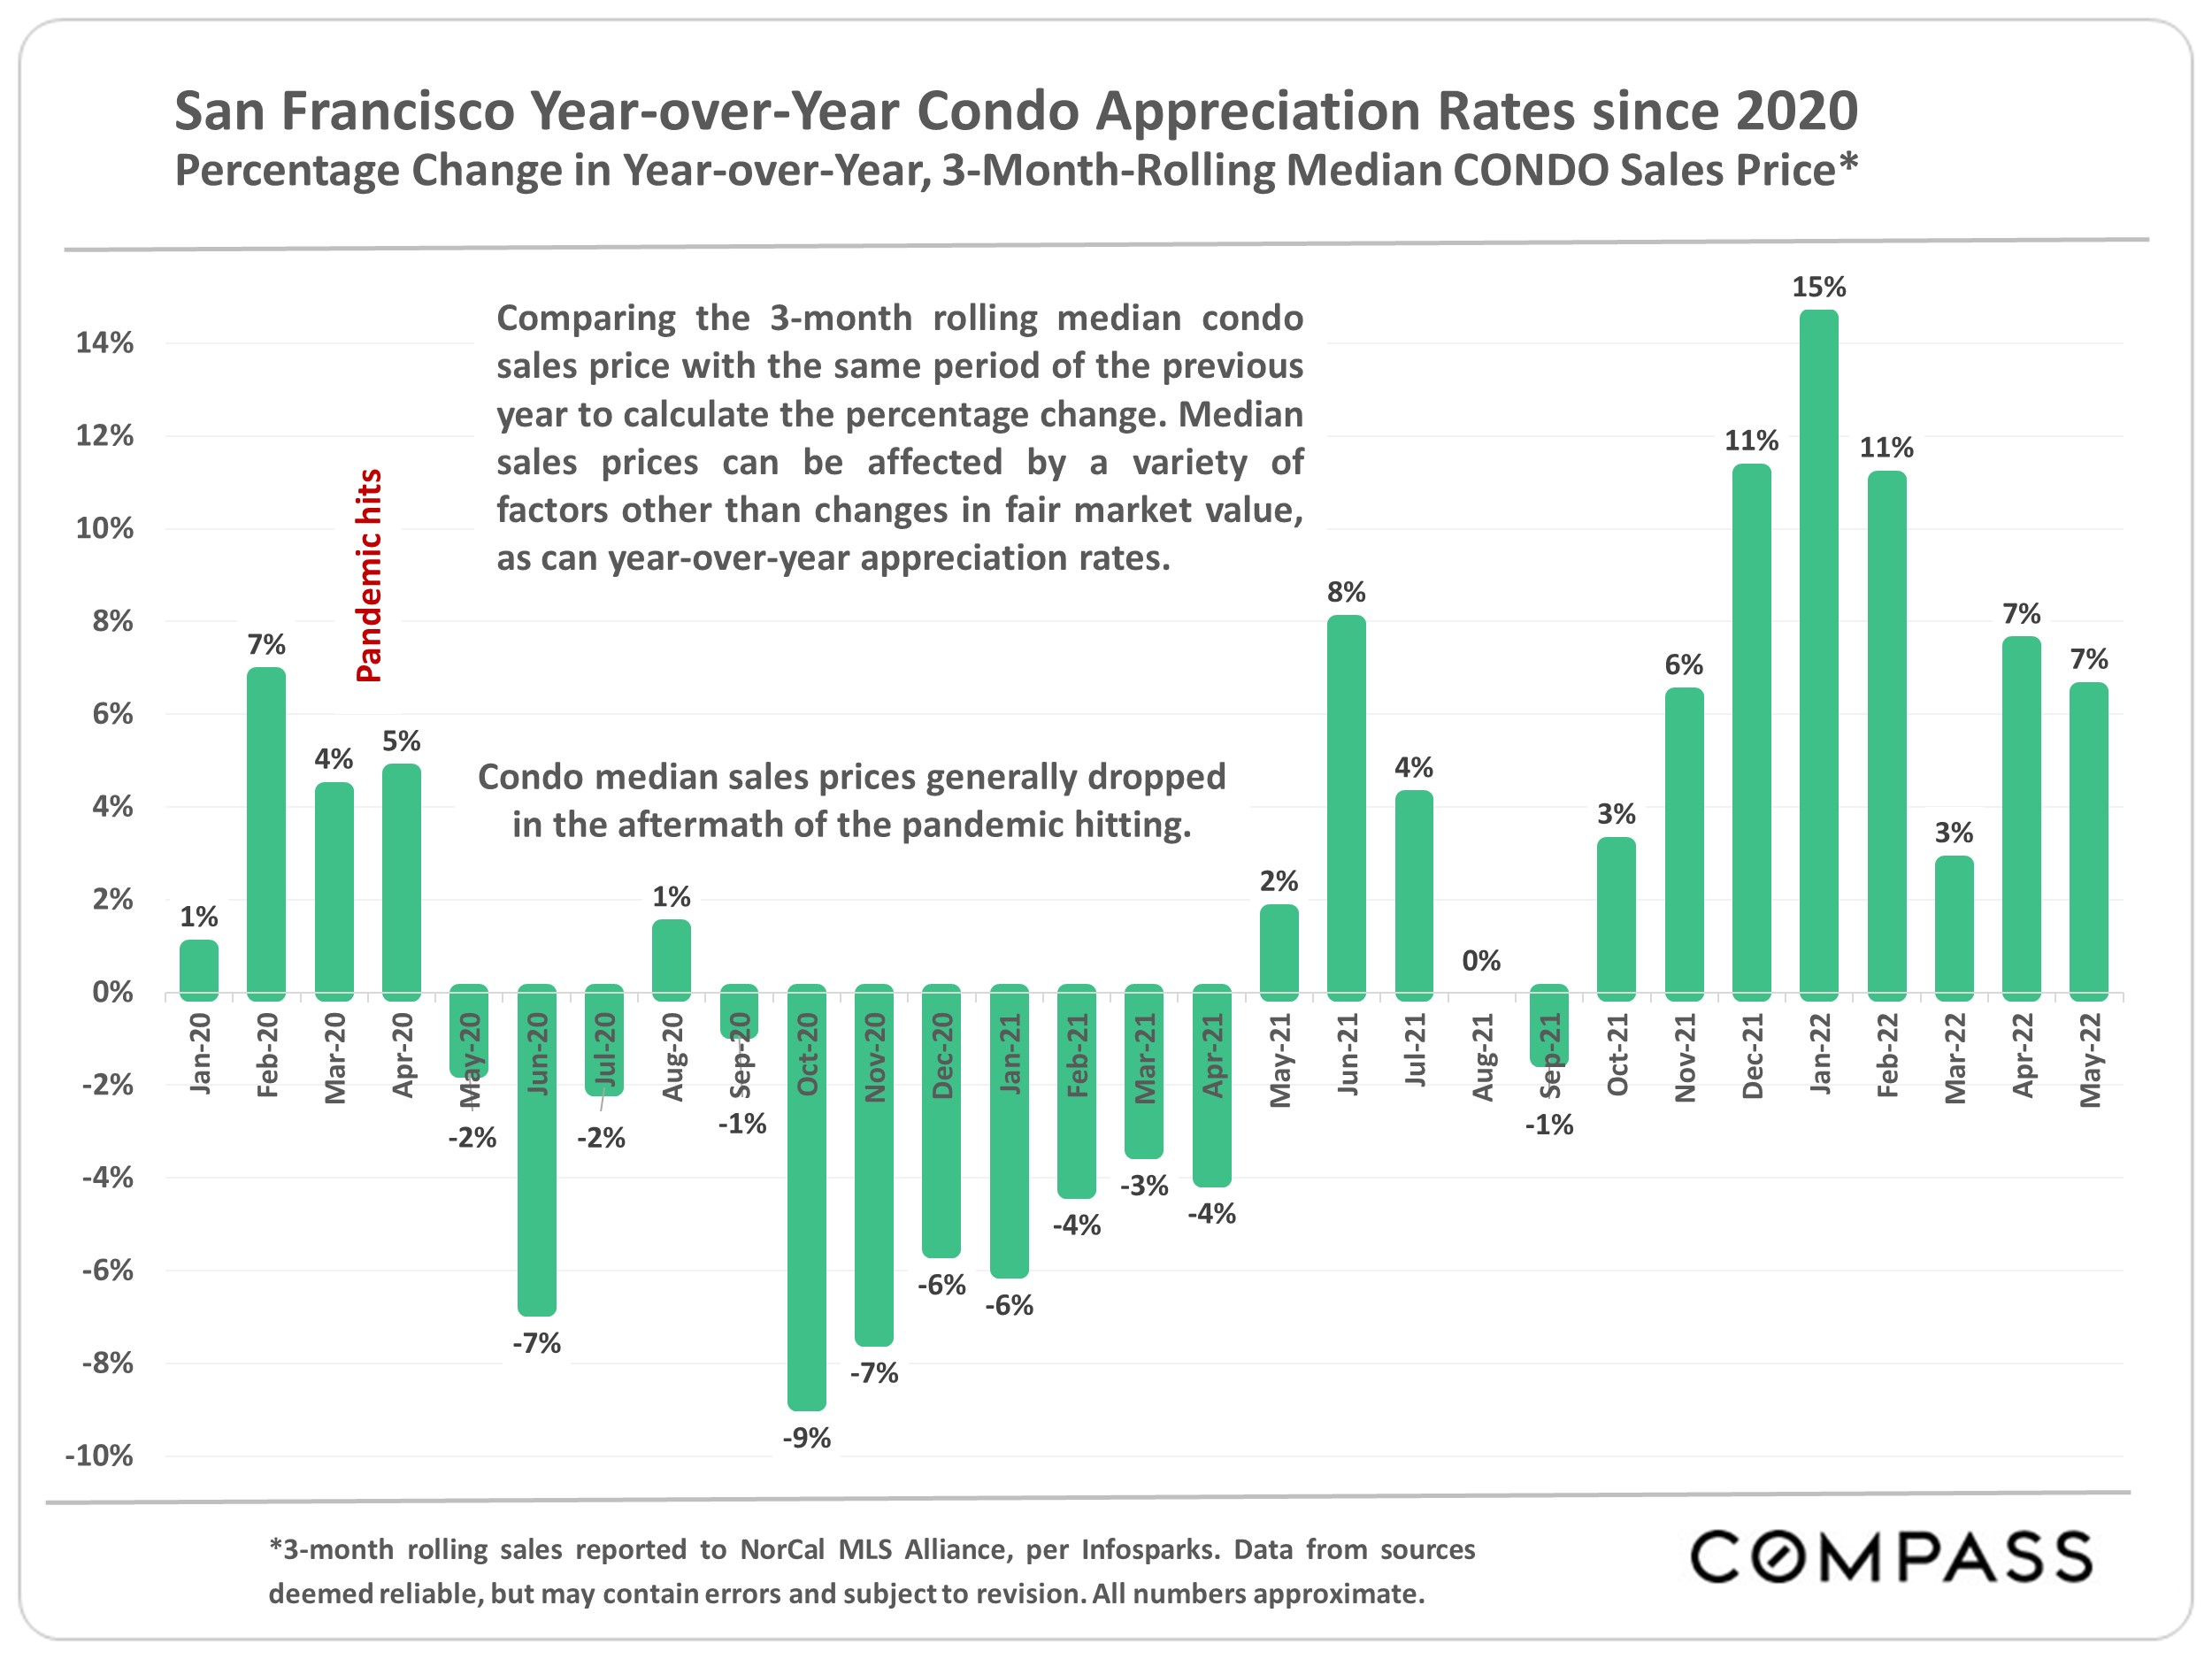
All this brought about striking changes in market dynamics and appreciation rates. Some of the larger trends were significant population movements from expensive, urban markets to suburban and rural areas. In the immediate aftermath of the pandemic, this migration precipitated a distinct weakening of rental and condo markets (which subsequently saw recoveries in 2021/2022). Some counties saw disproportionate increases in sales of larger, more expensive homes, a big factor in boosting median sales prices: This affects apples-to-apples comparisons of appreciation rates between counties.
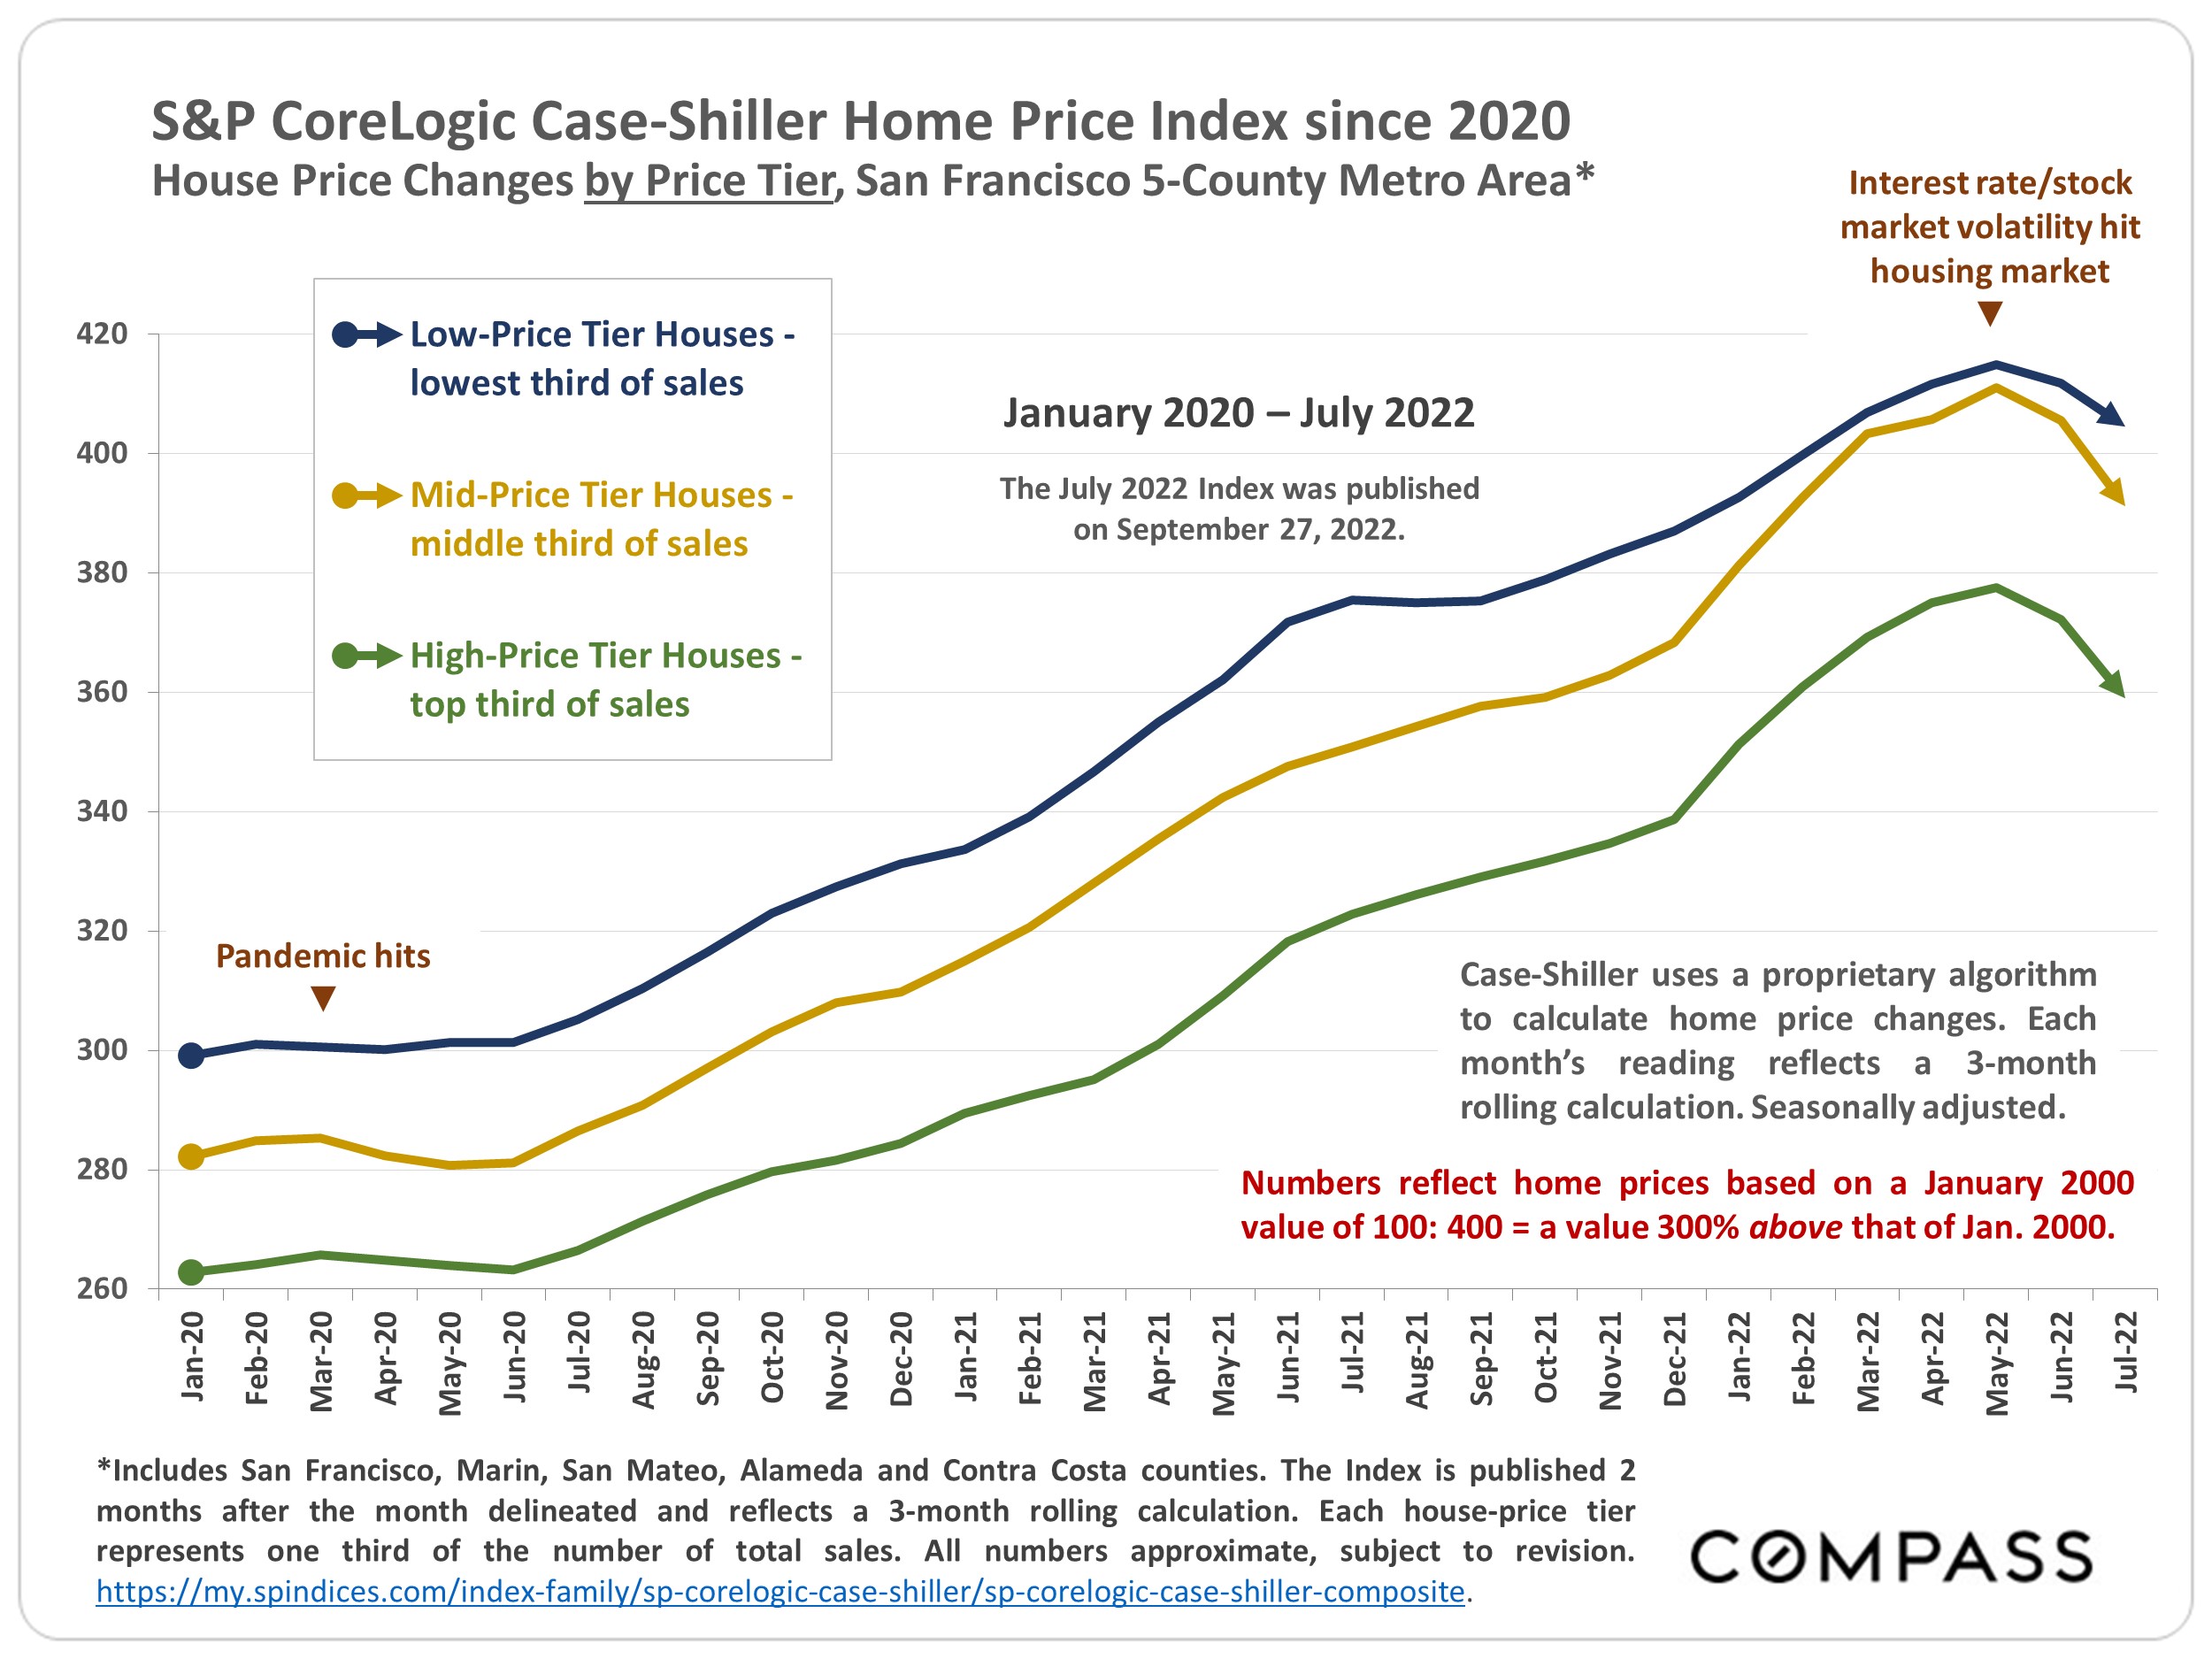
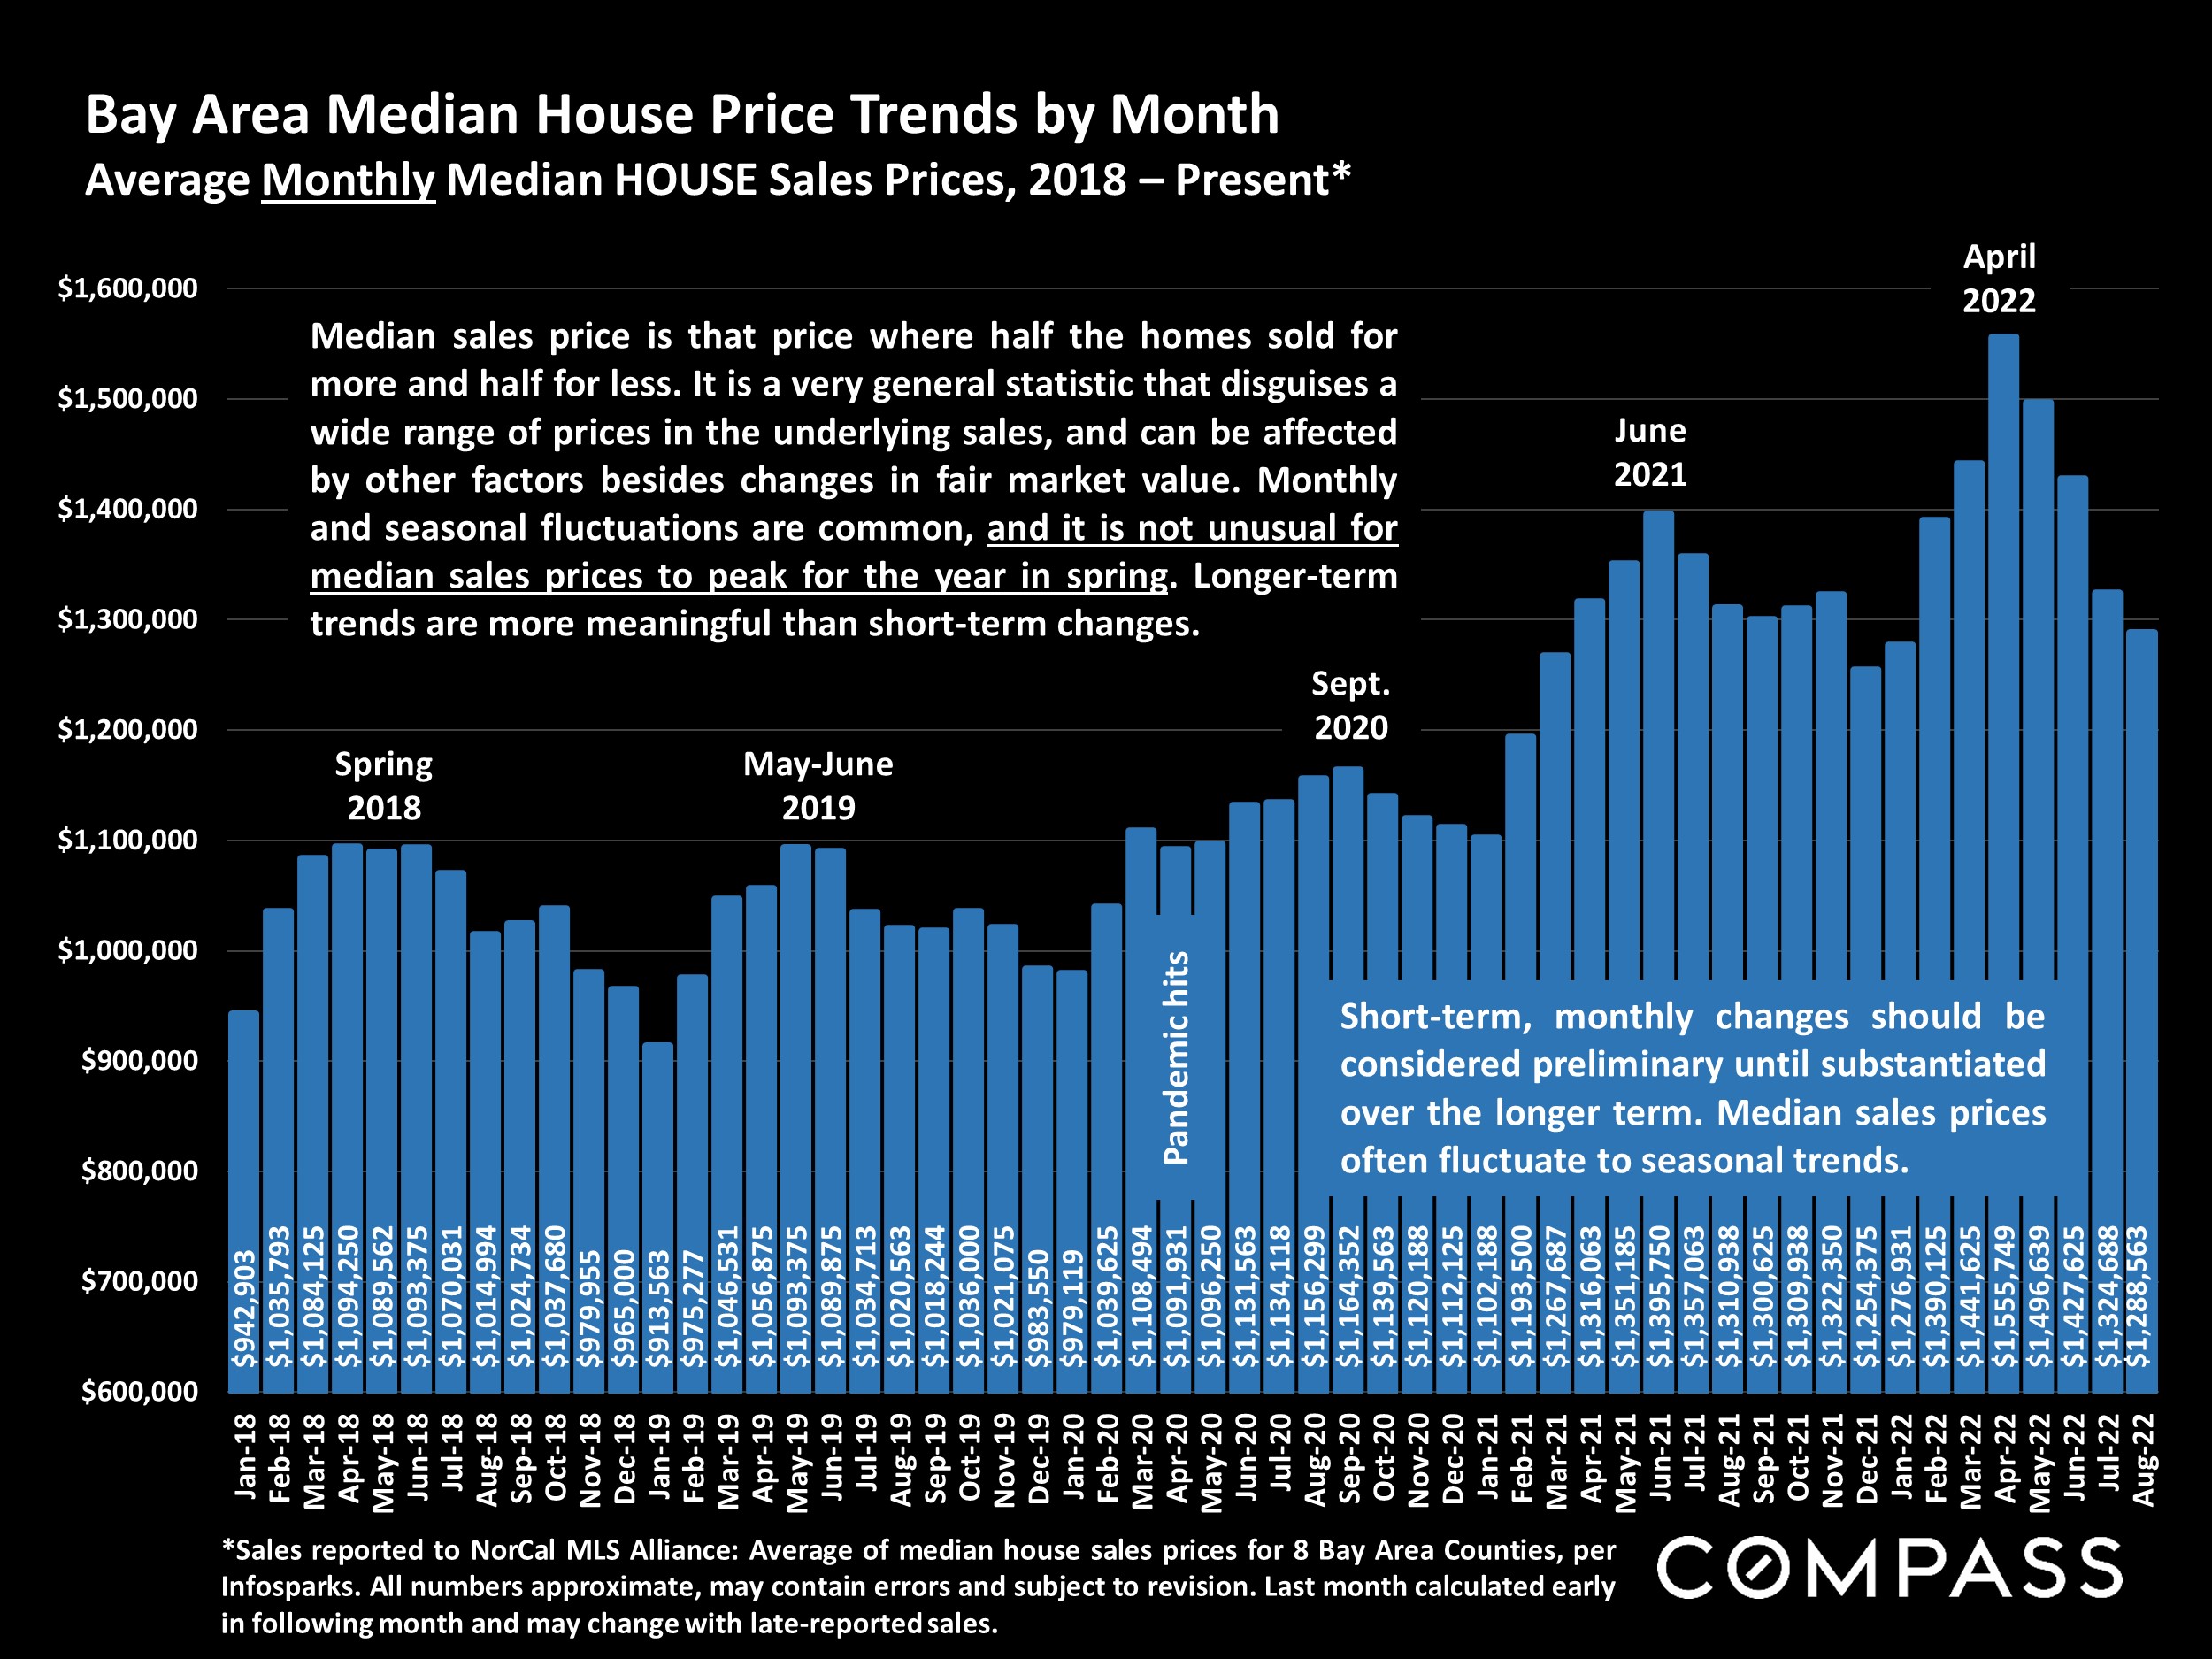
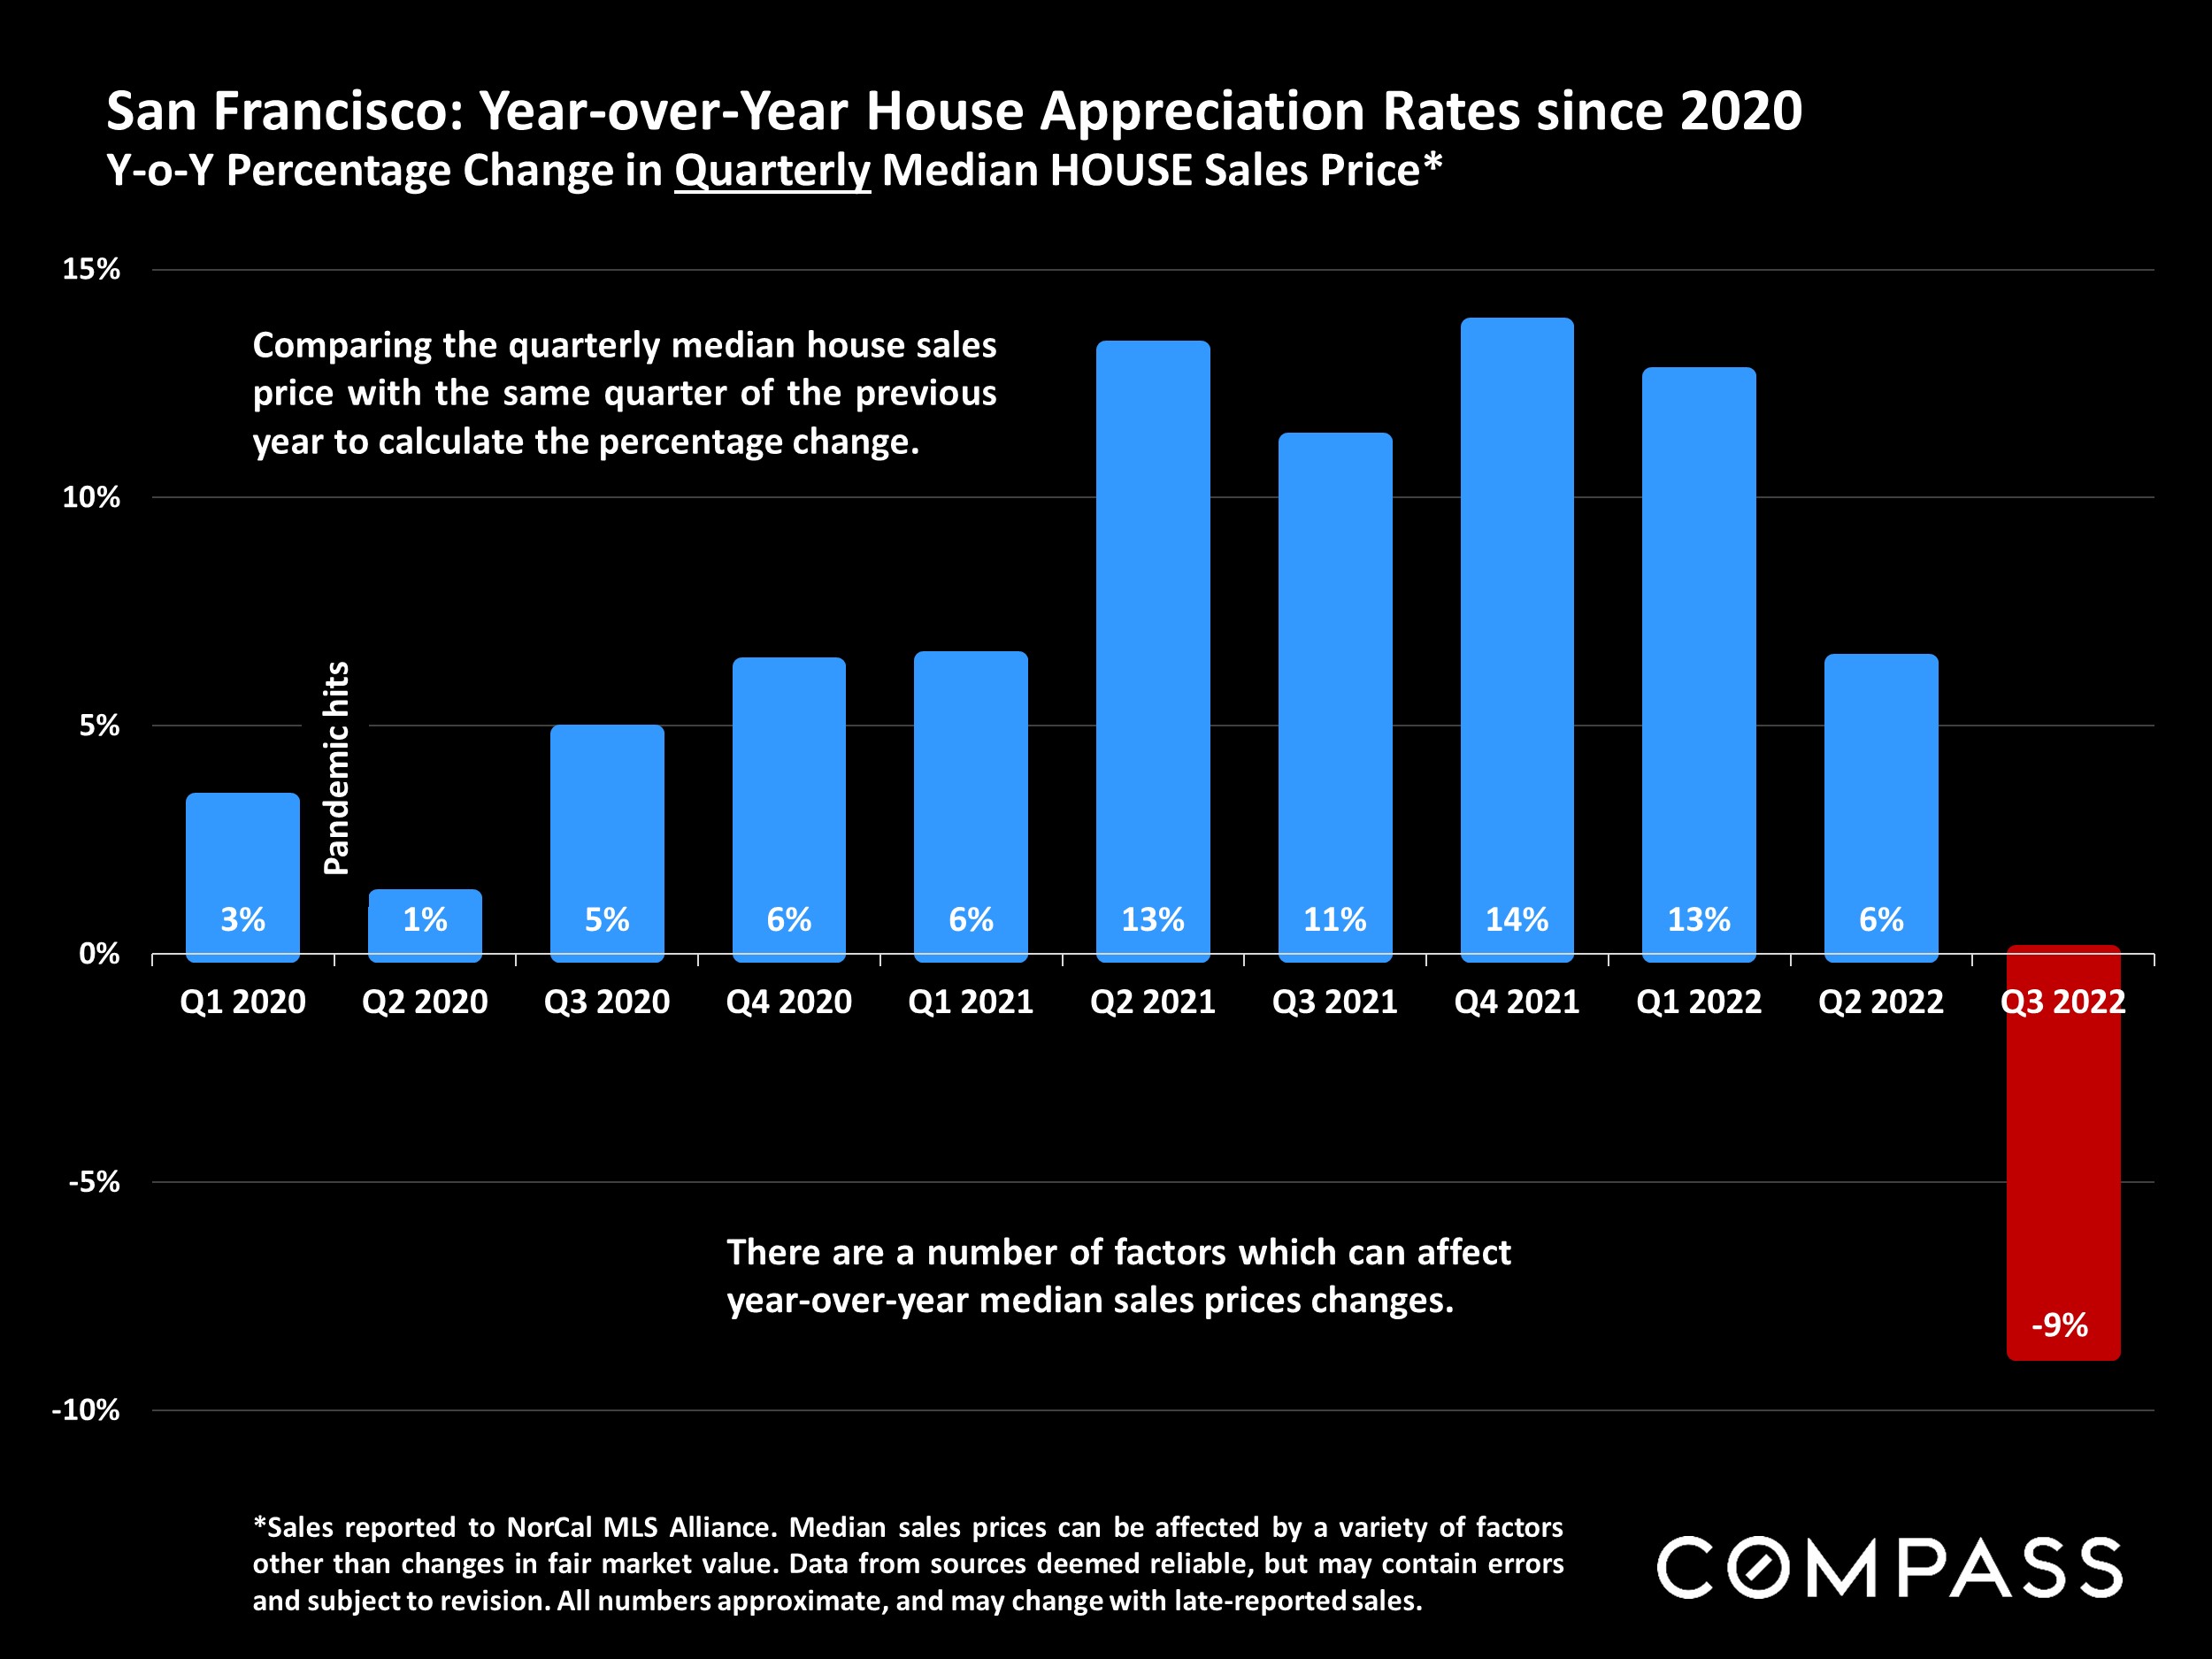
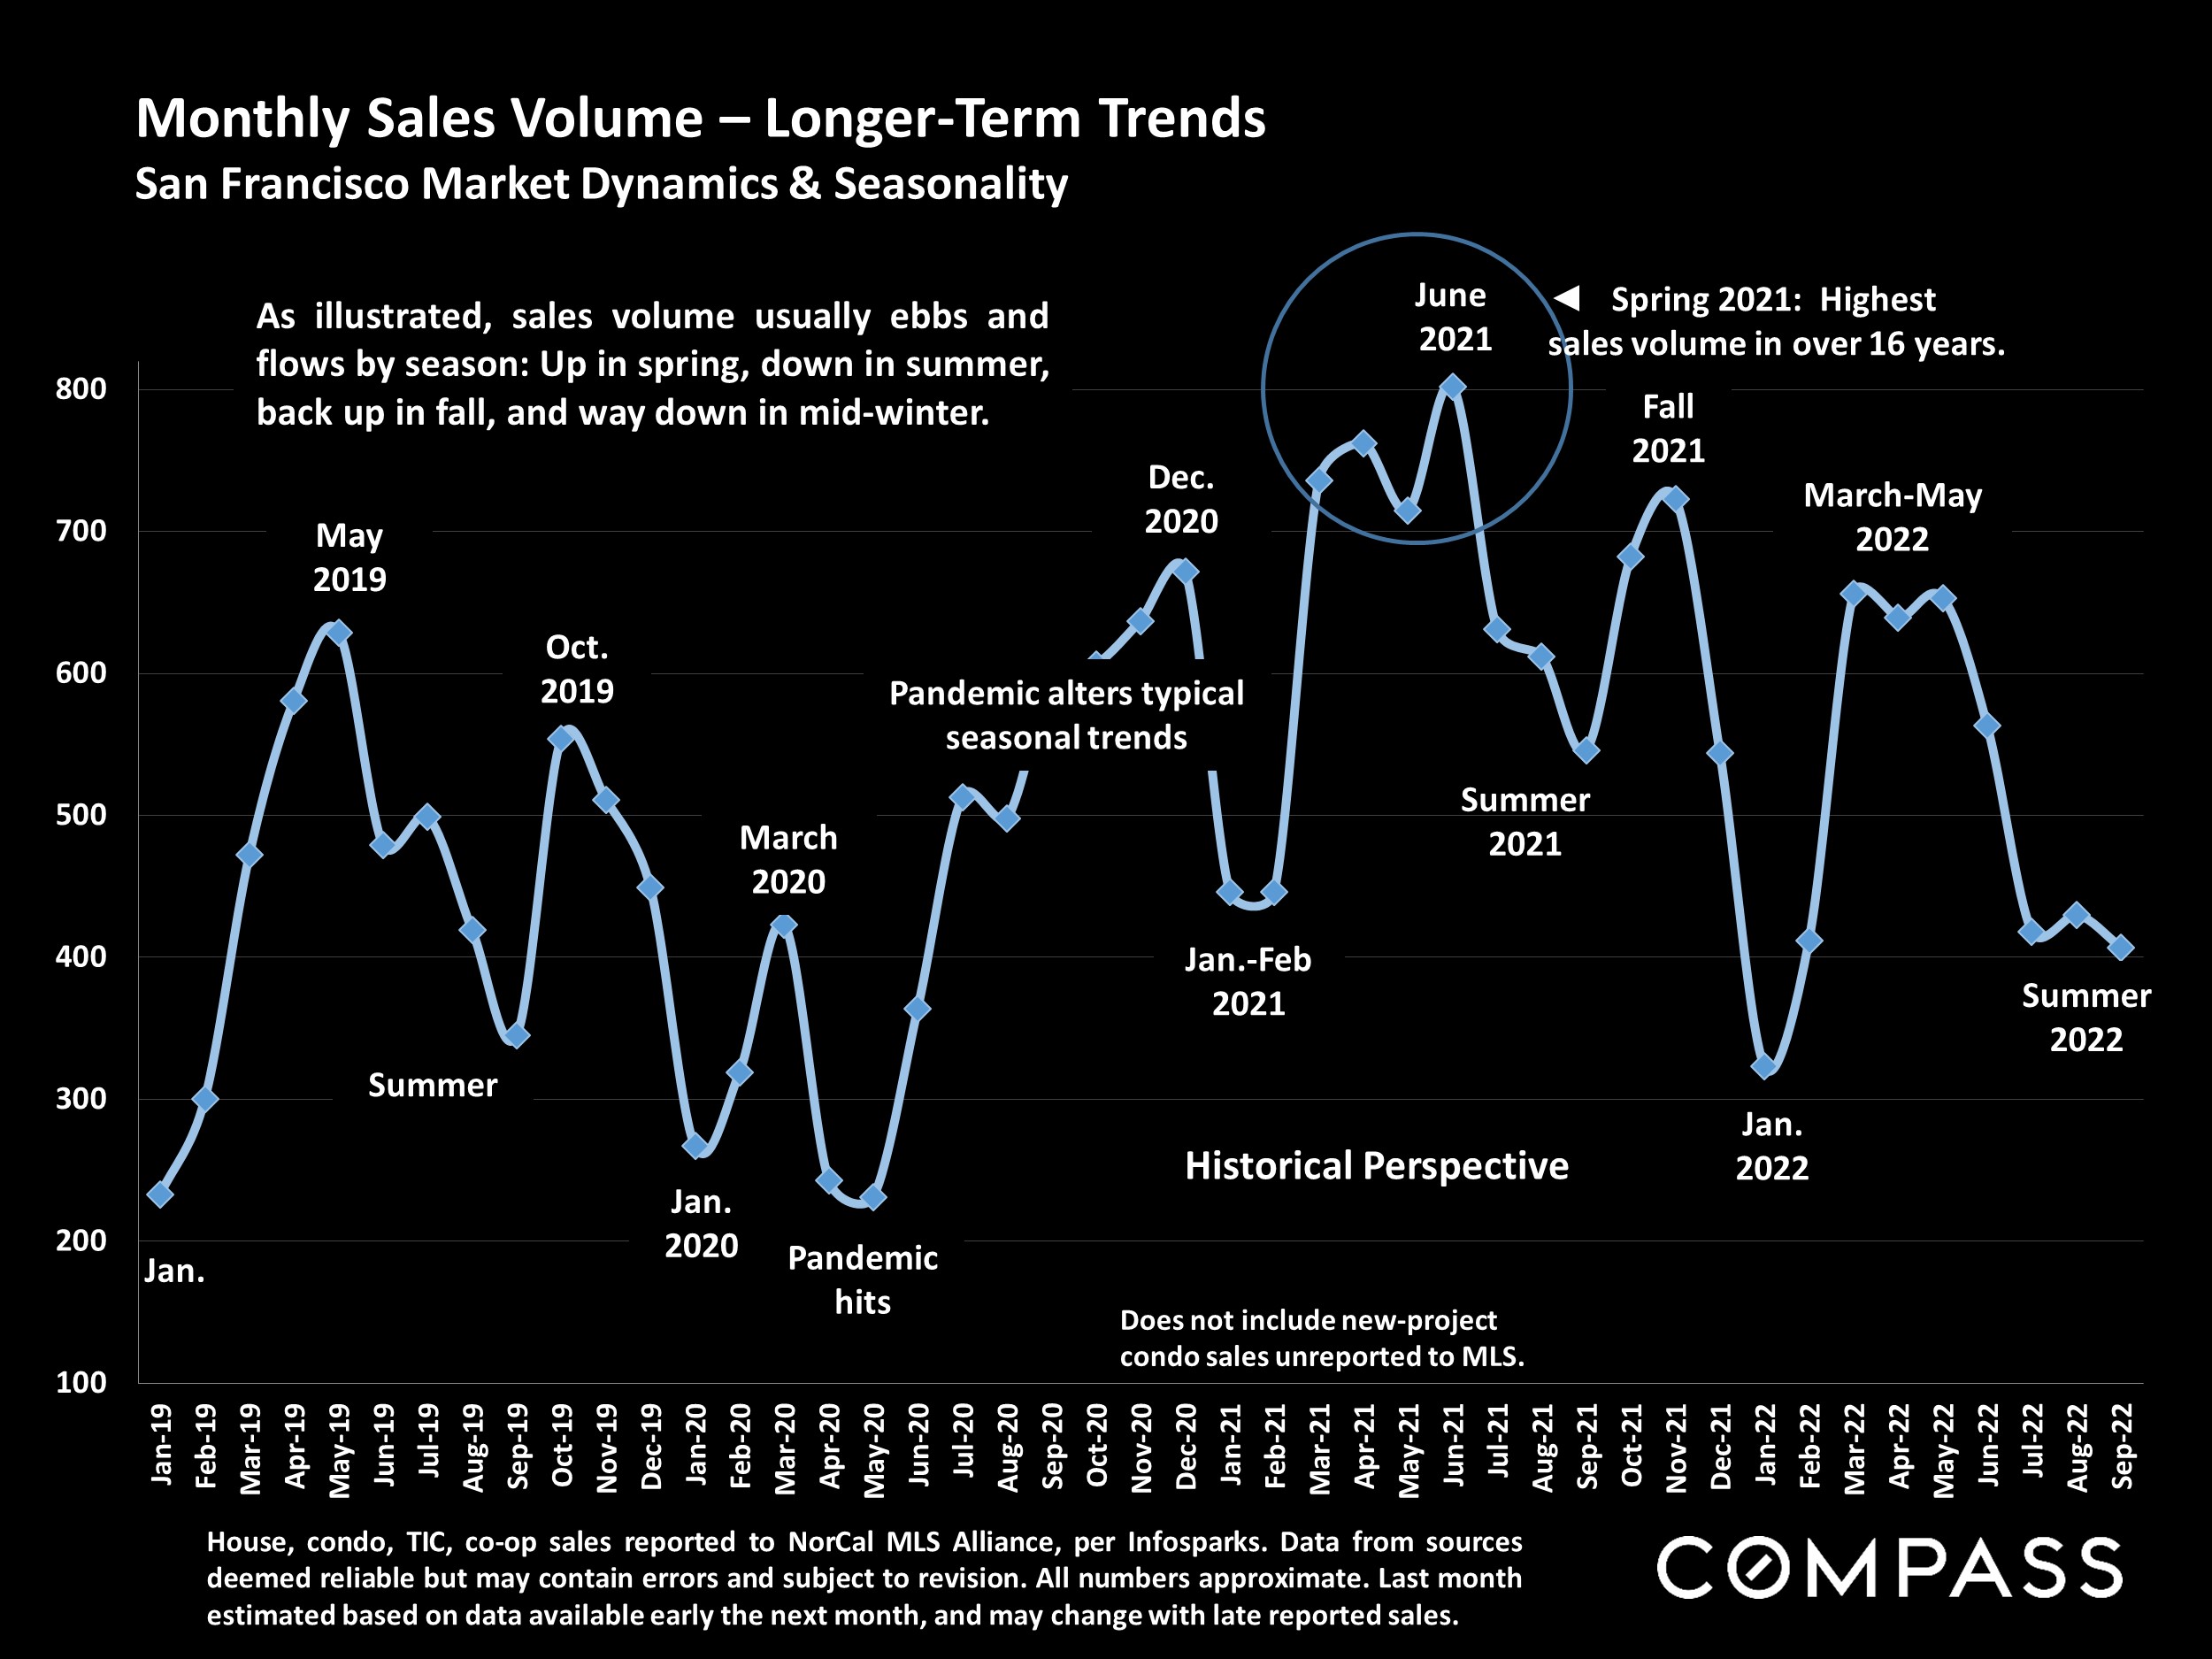
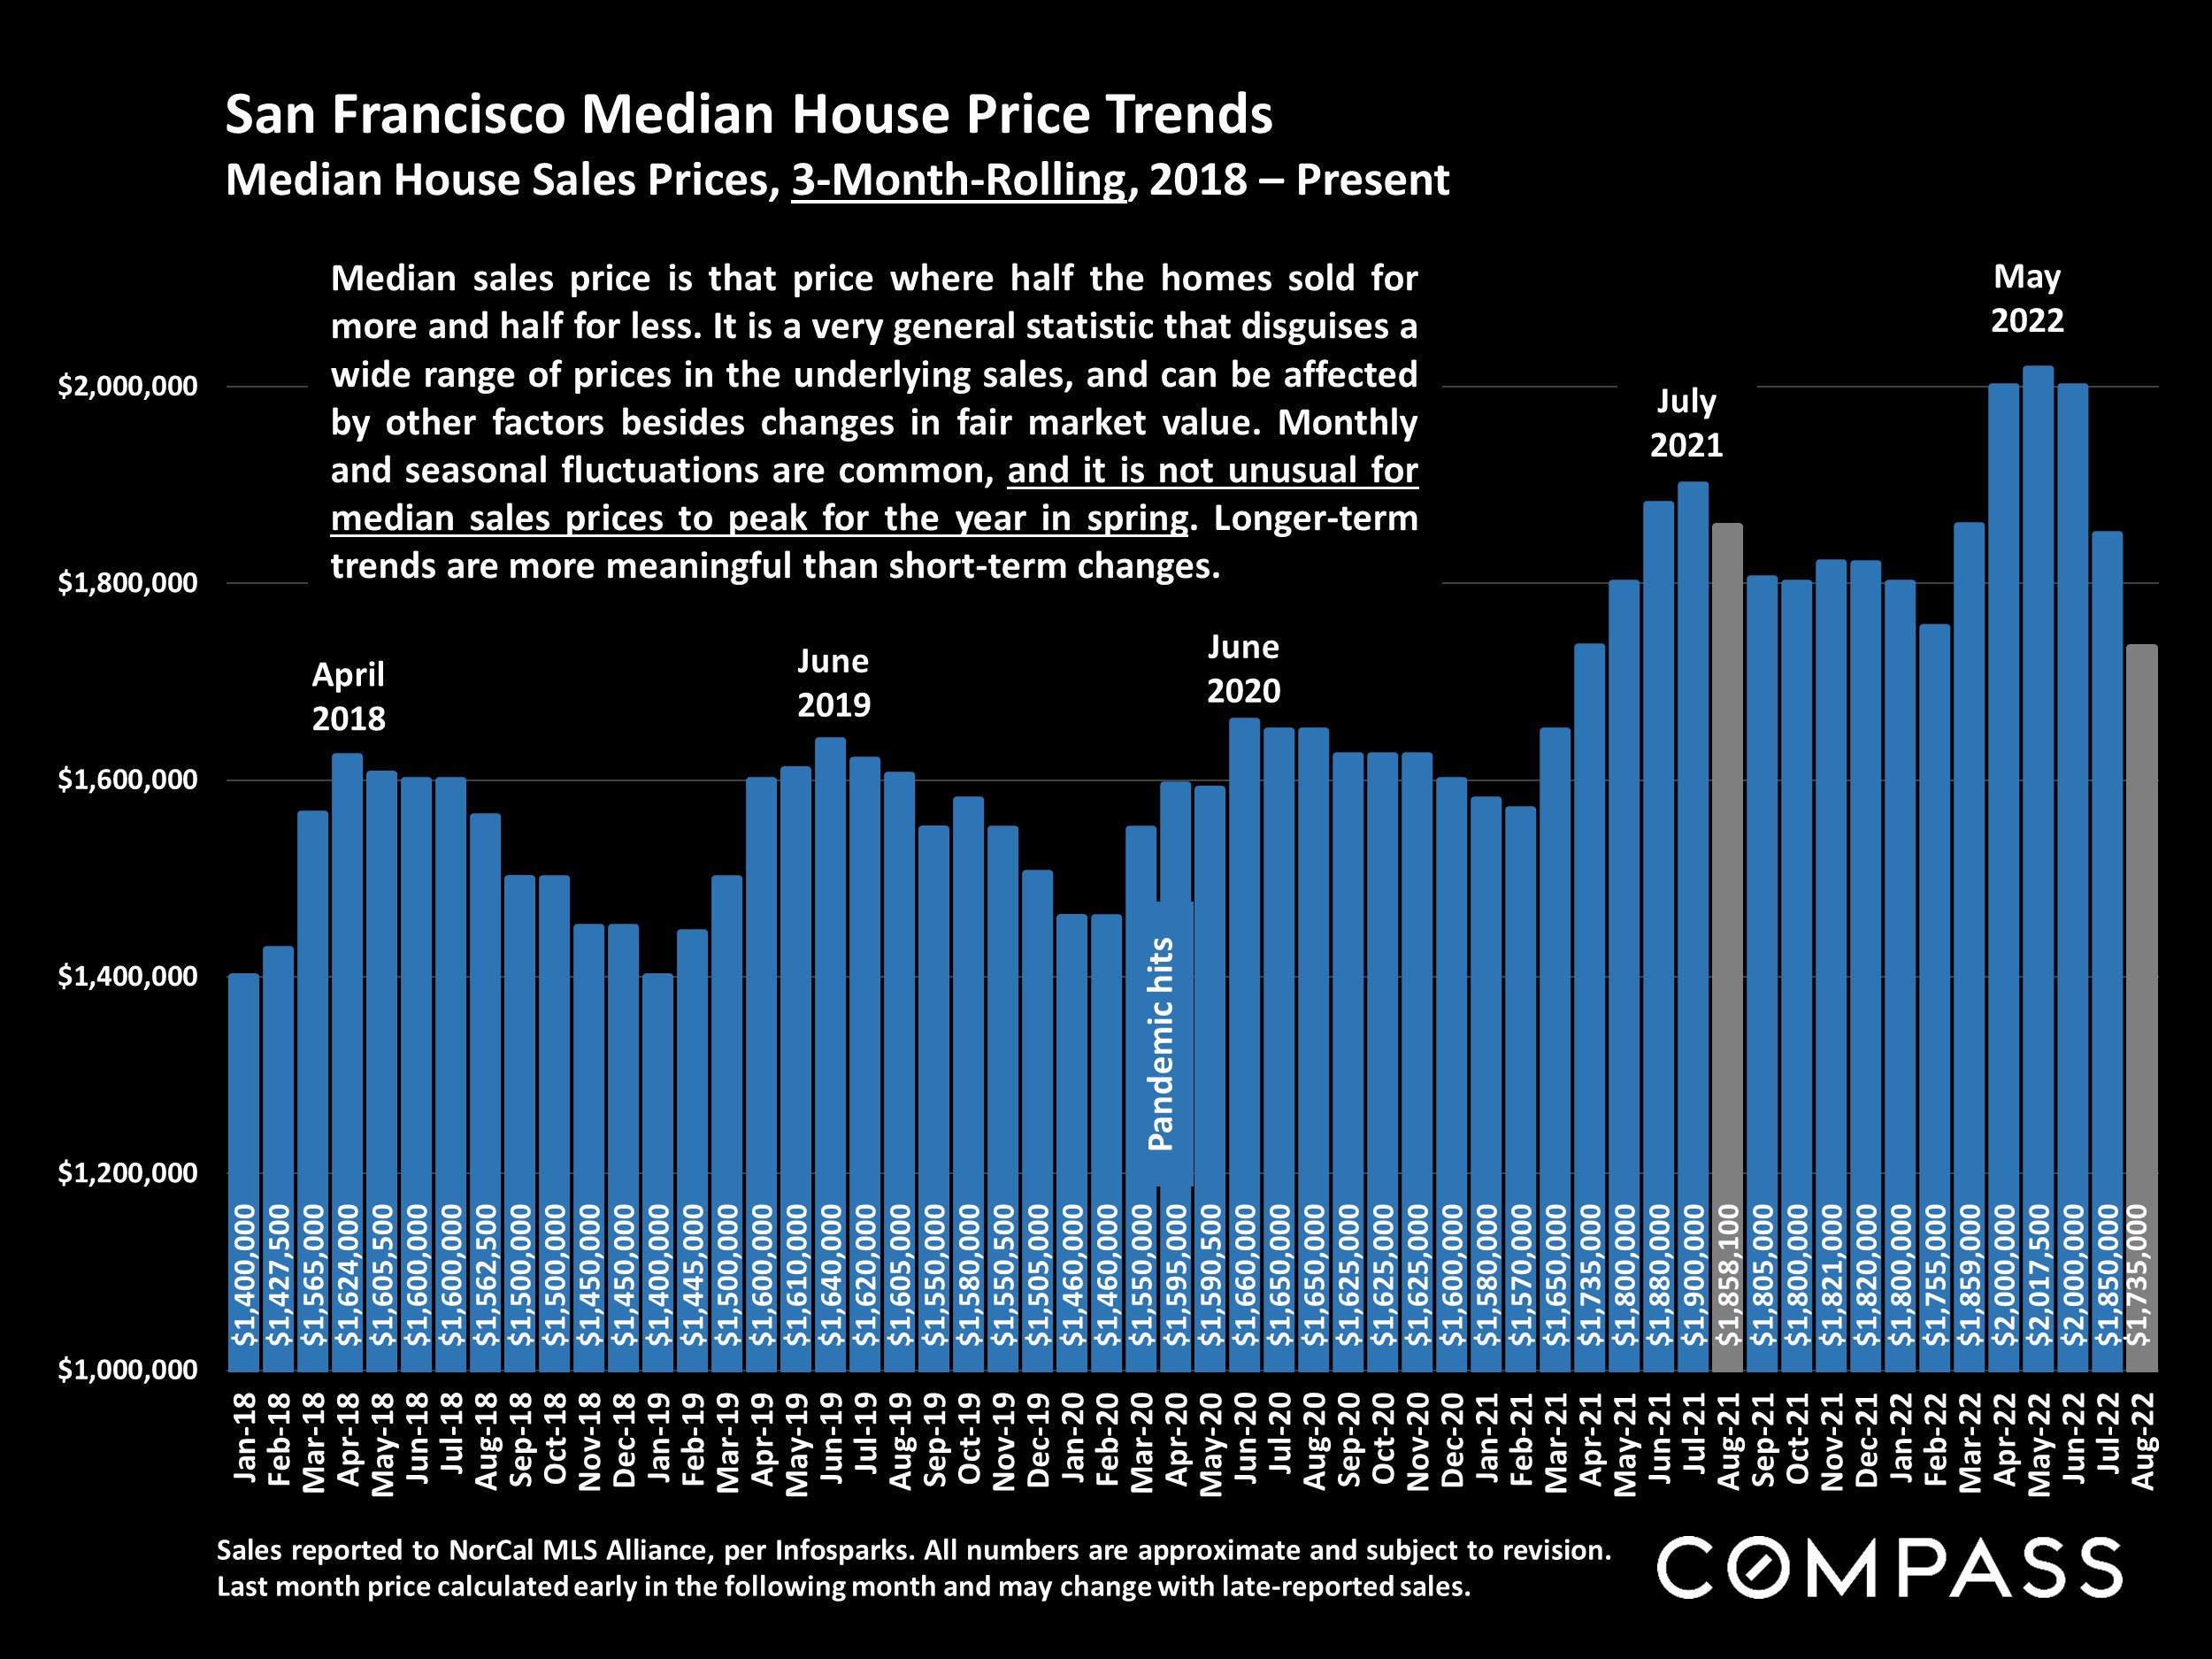
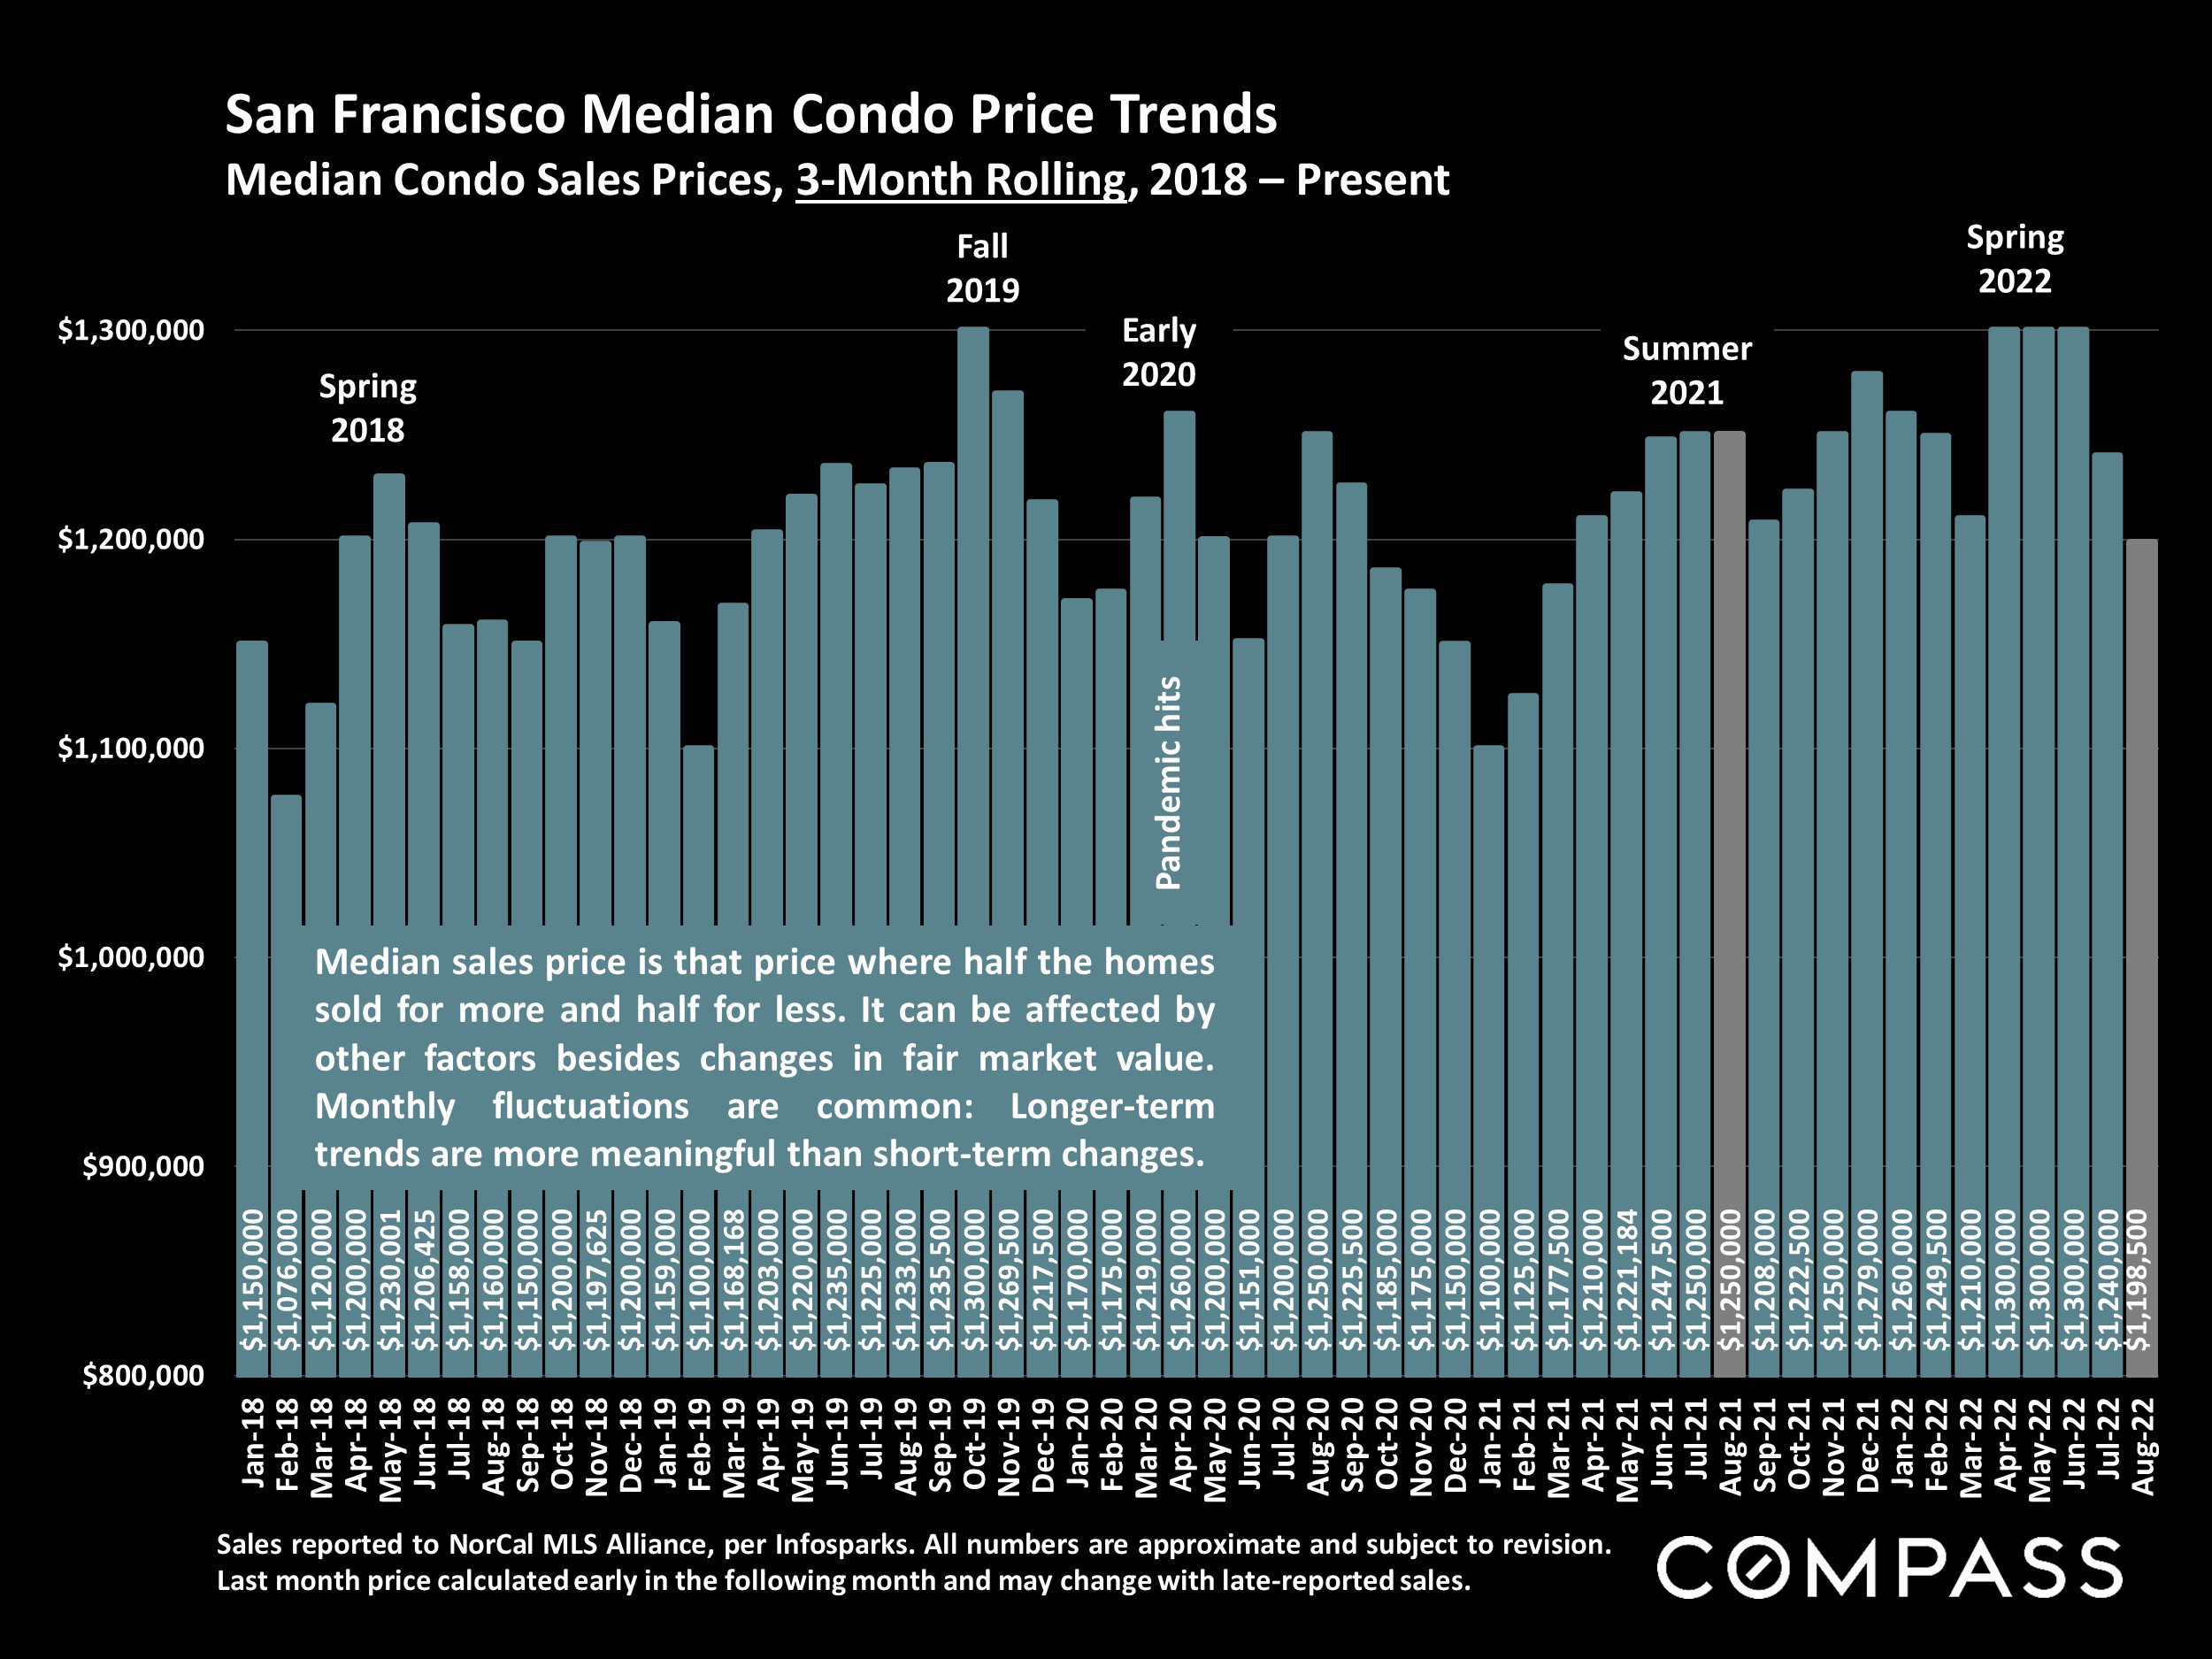
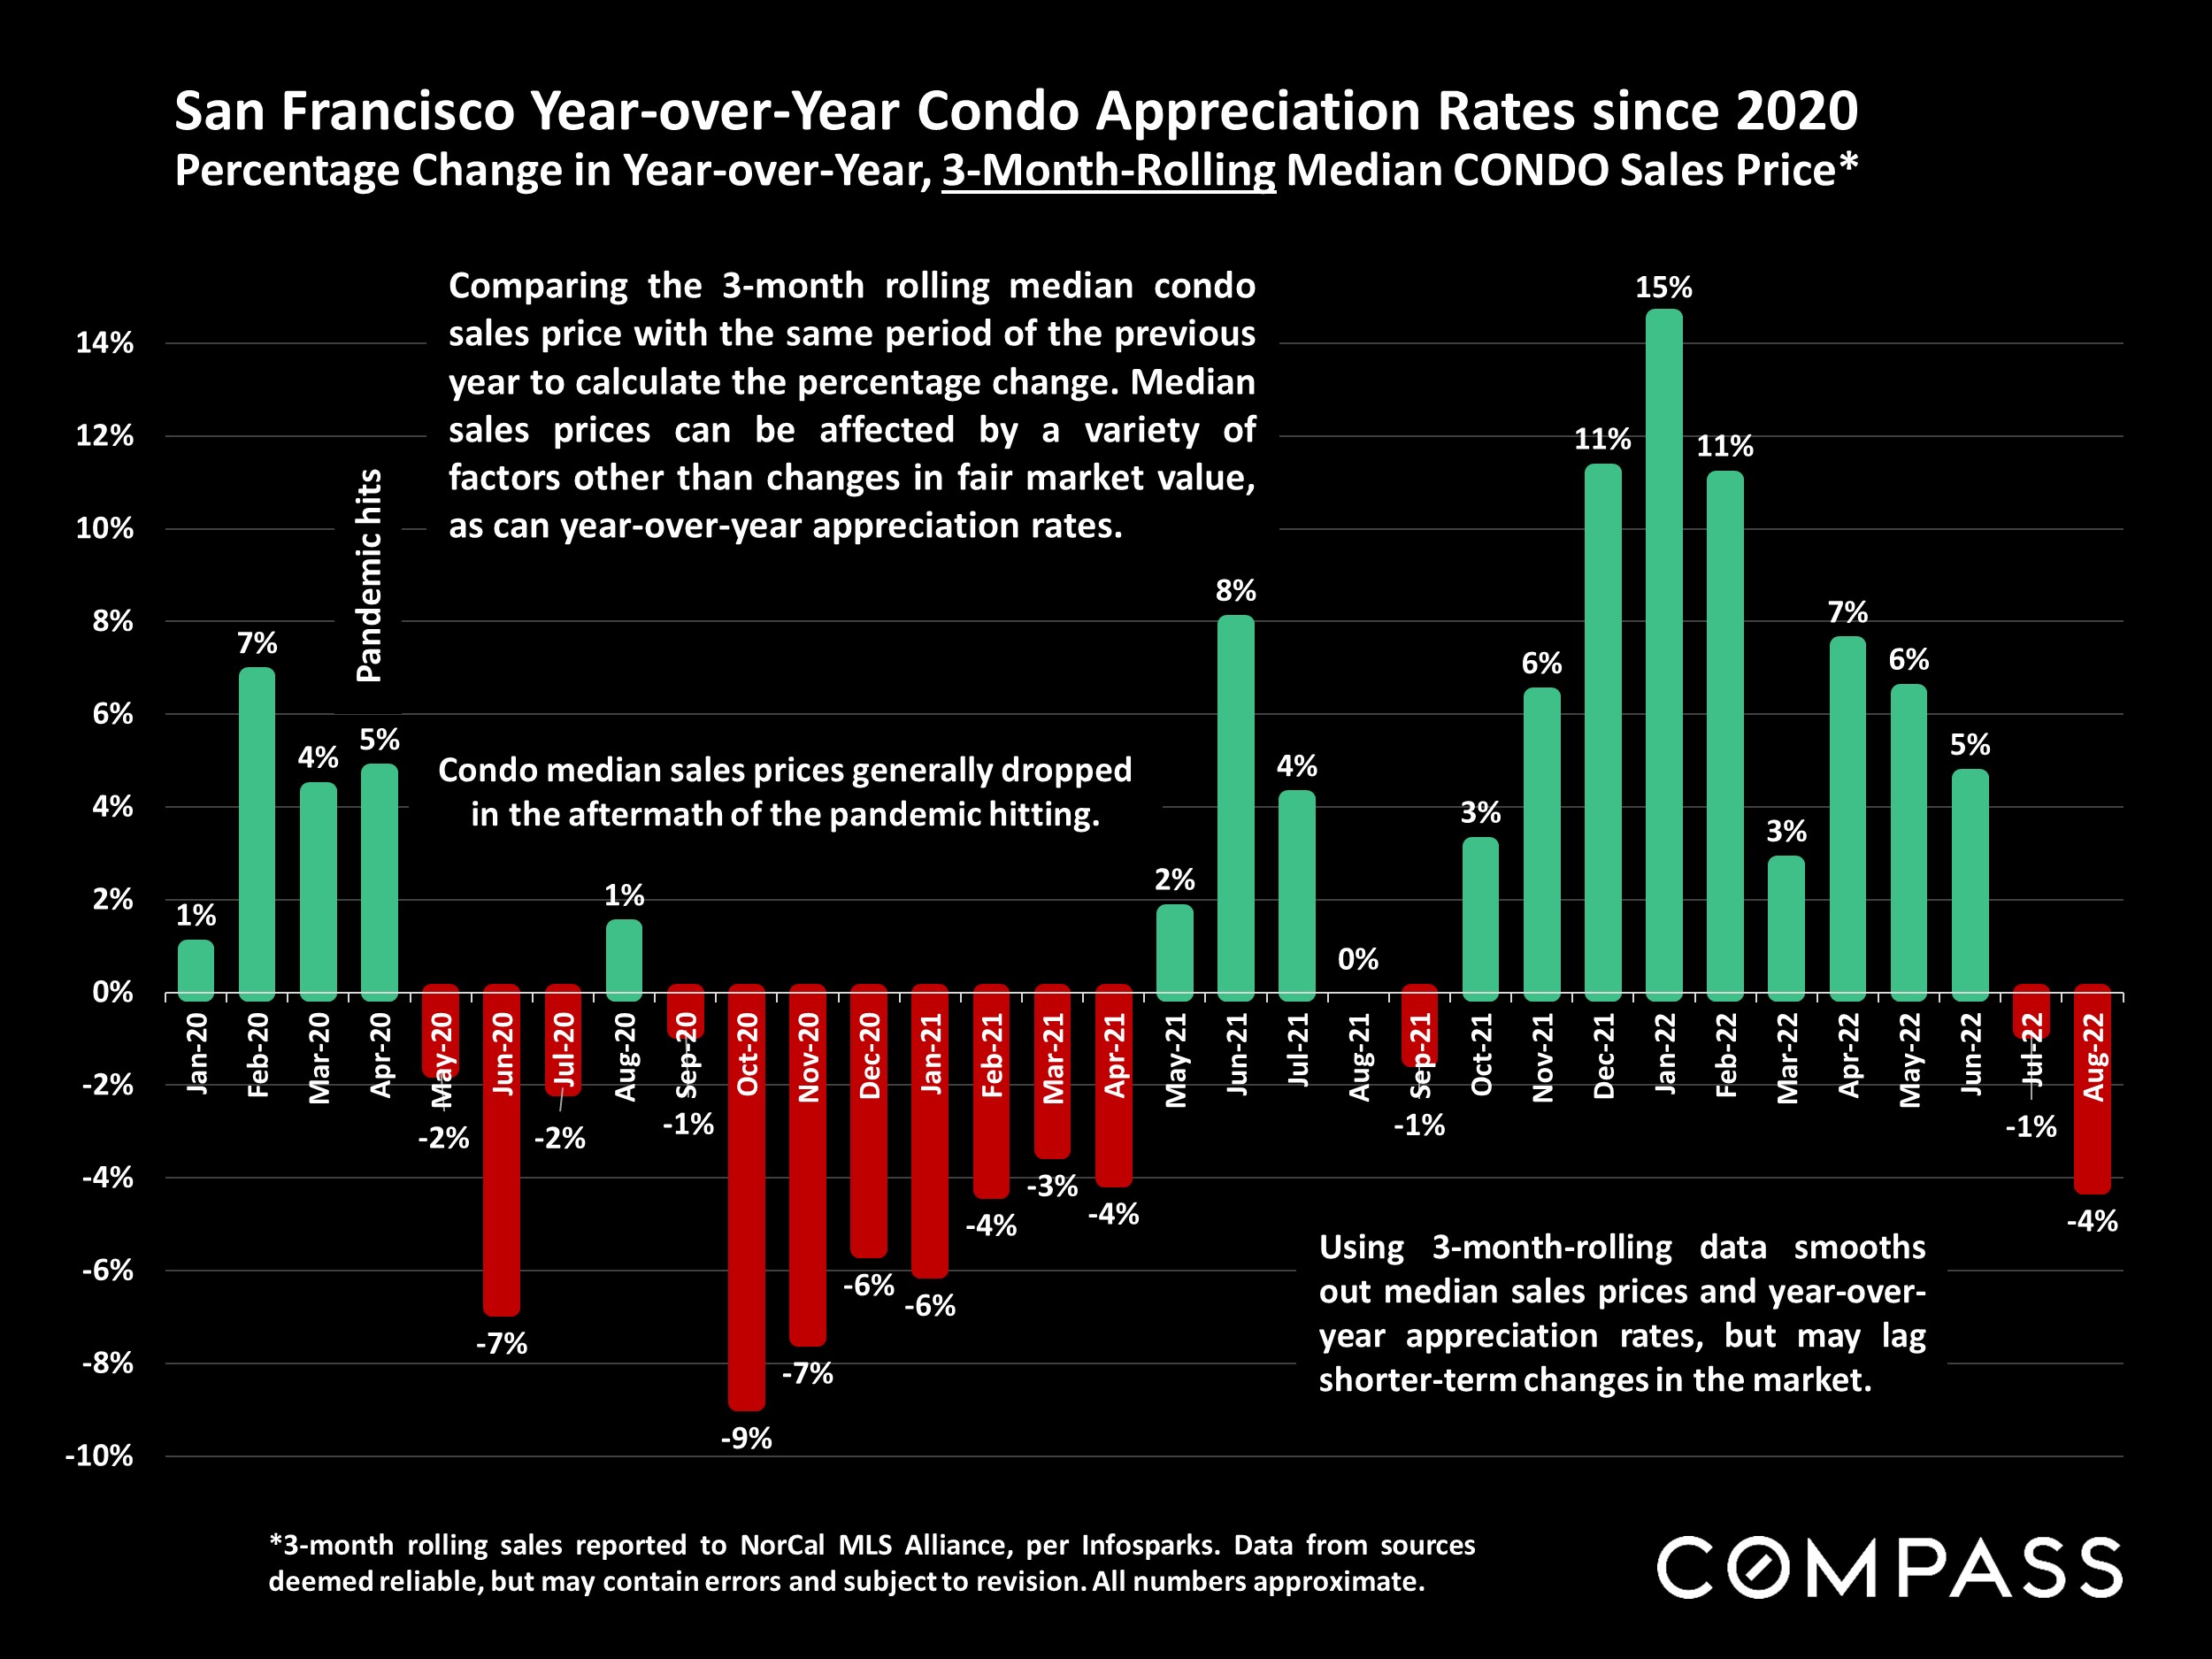
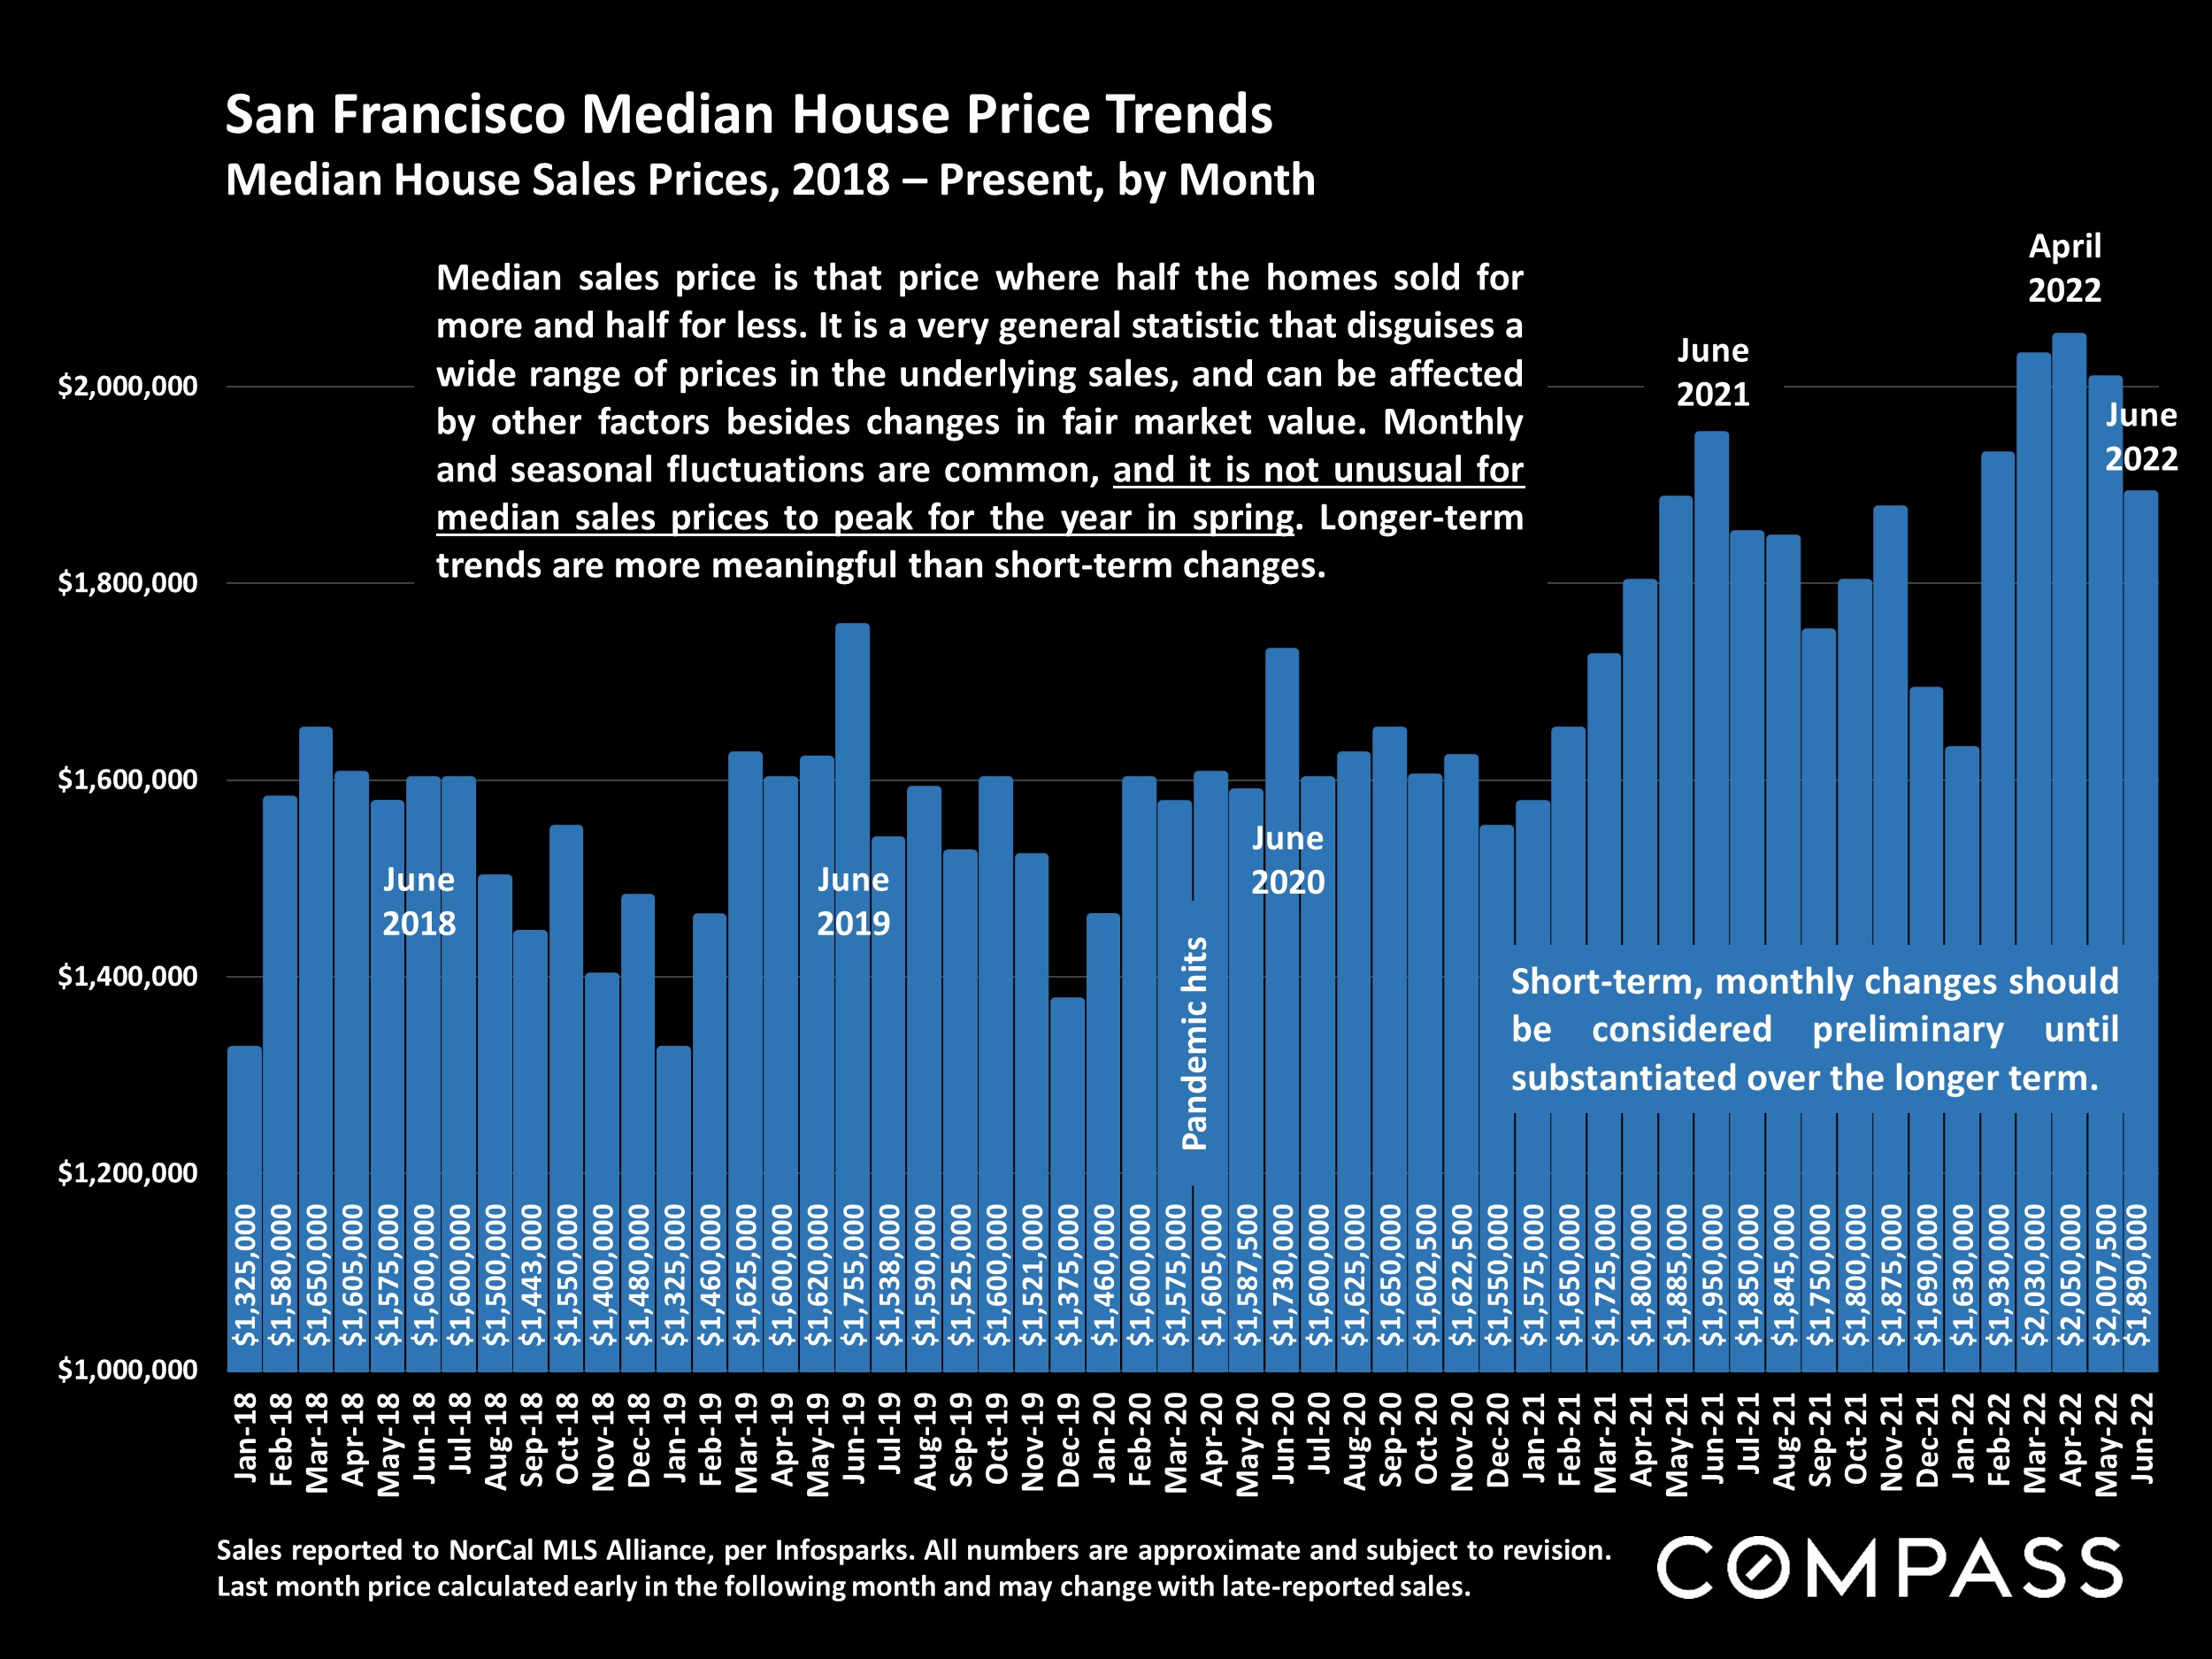
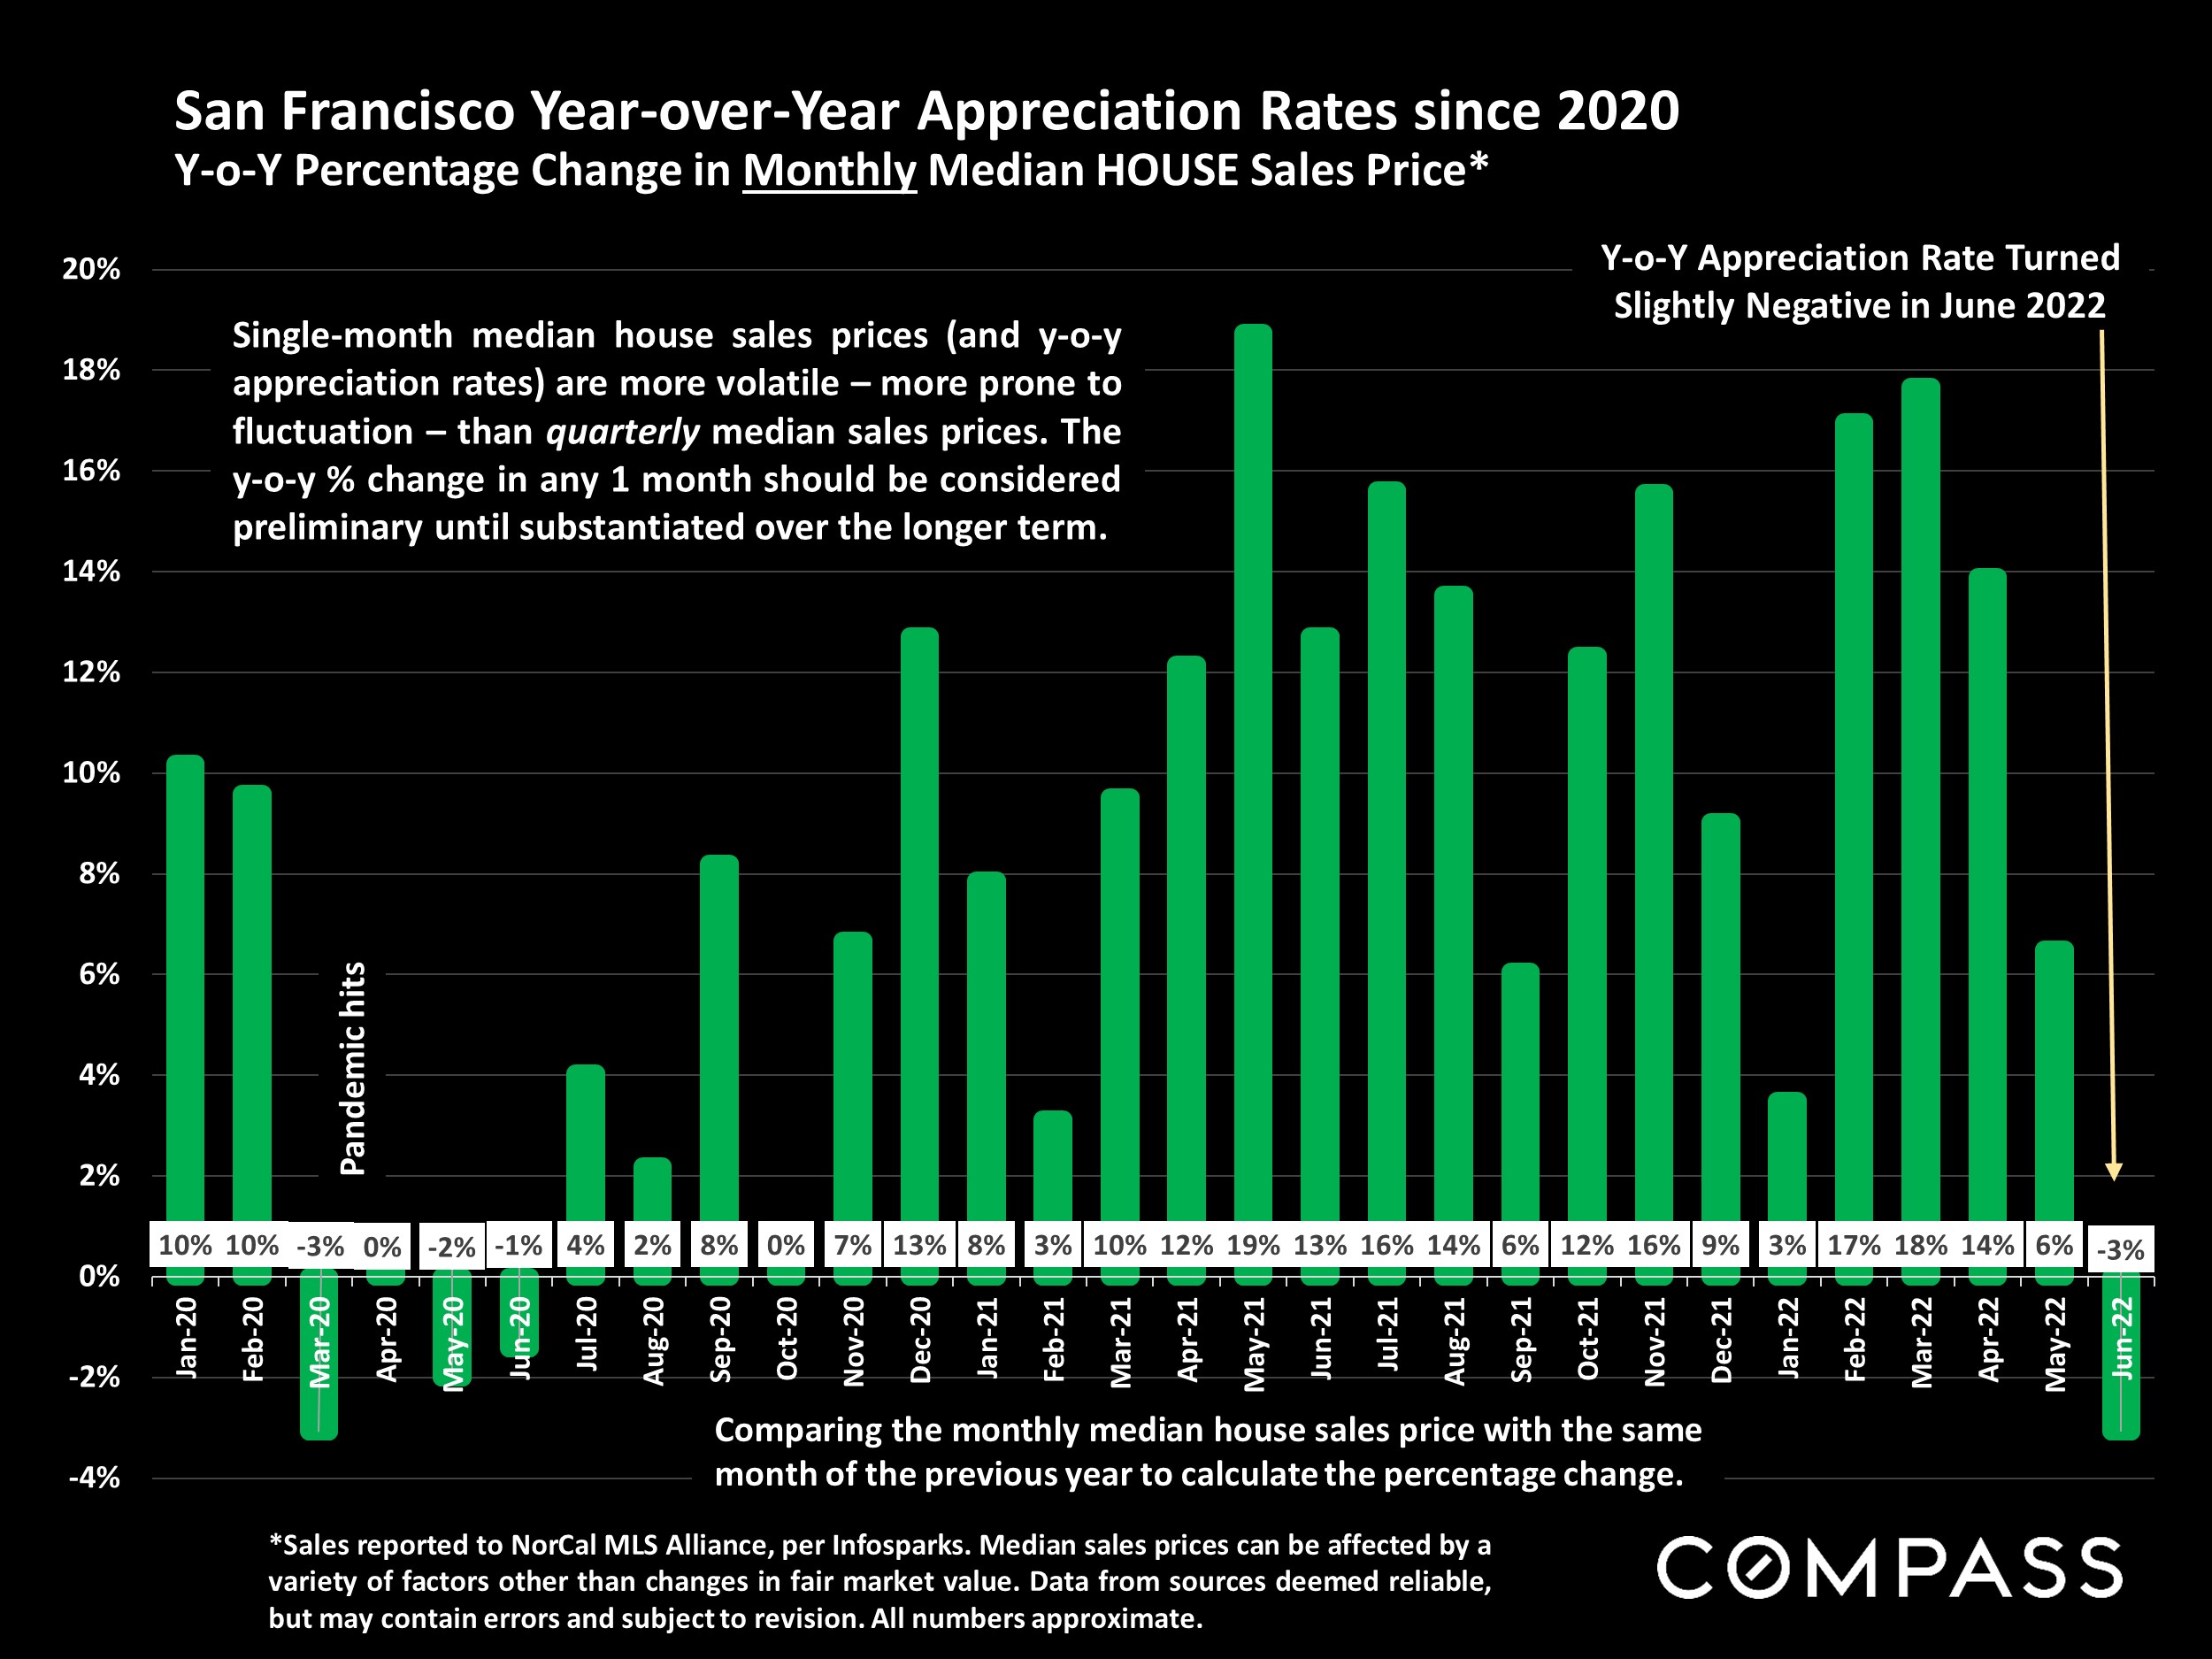
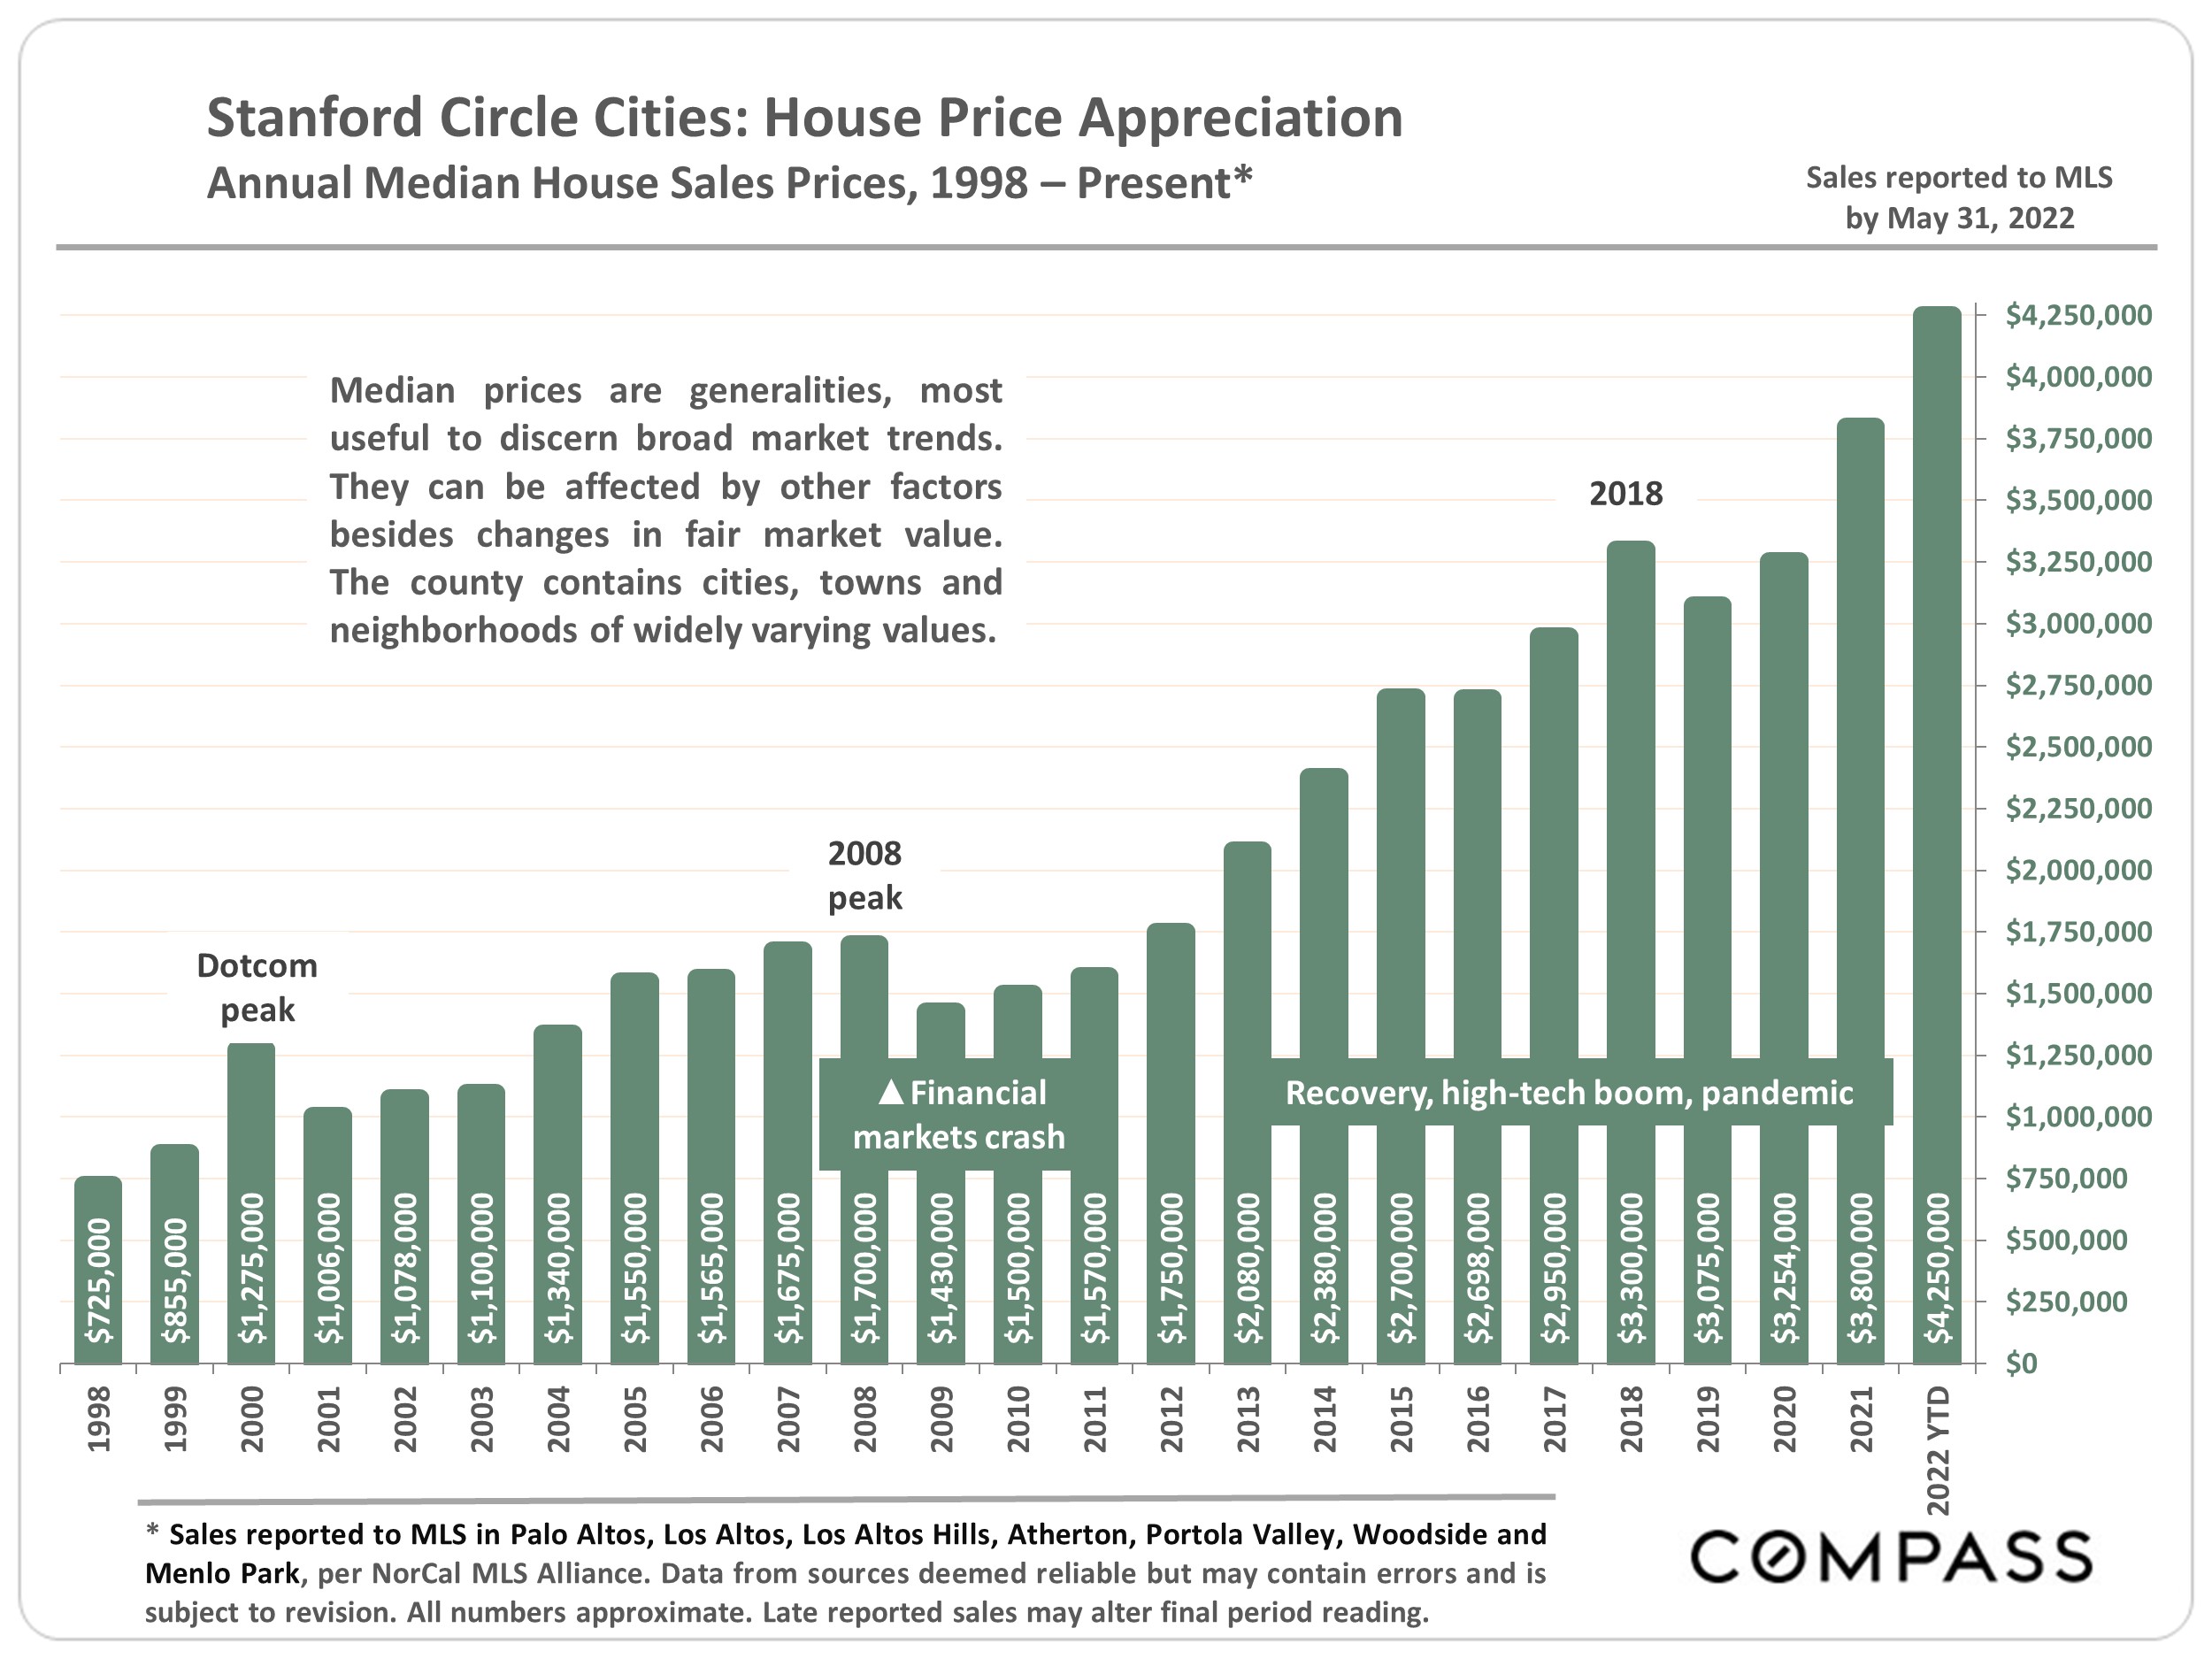
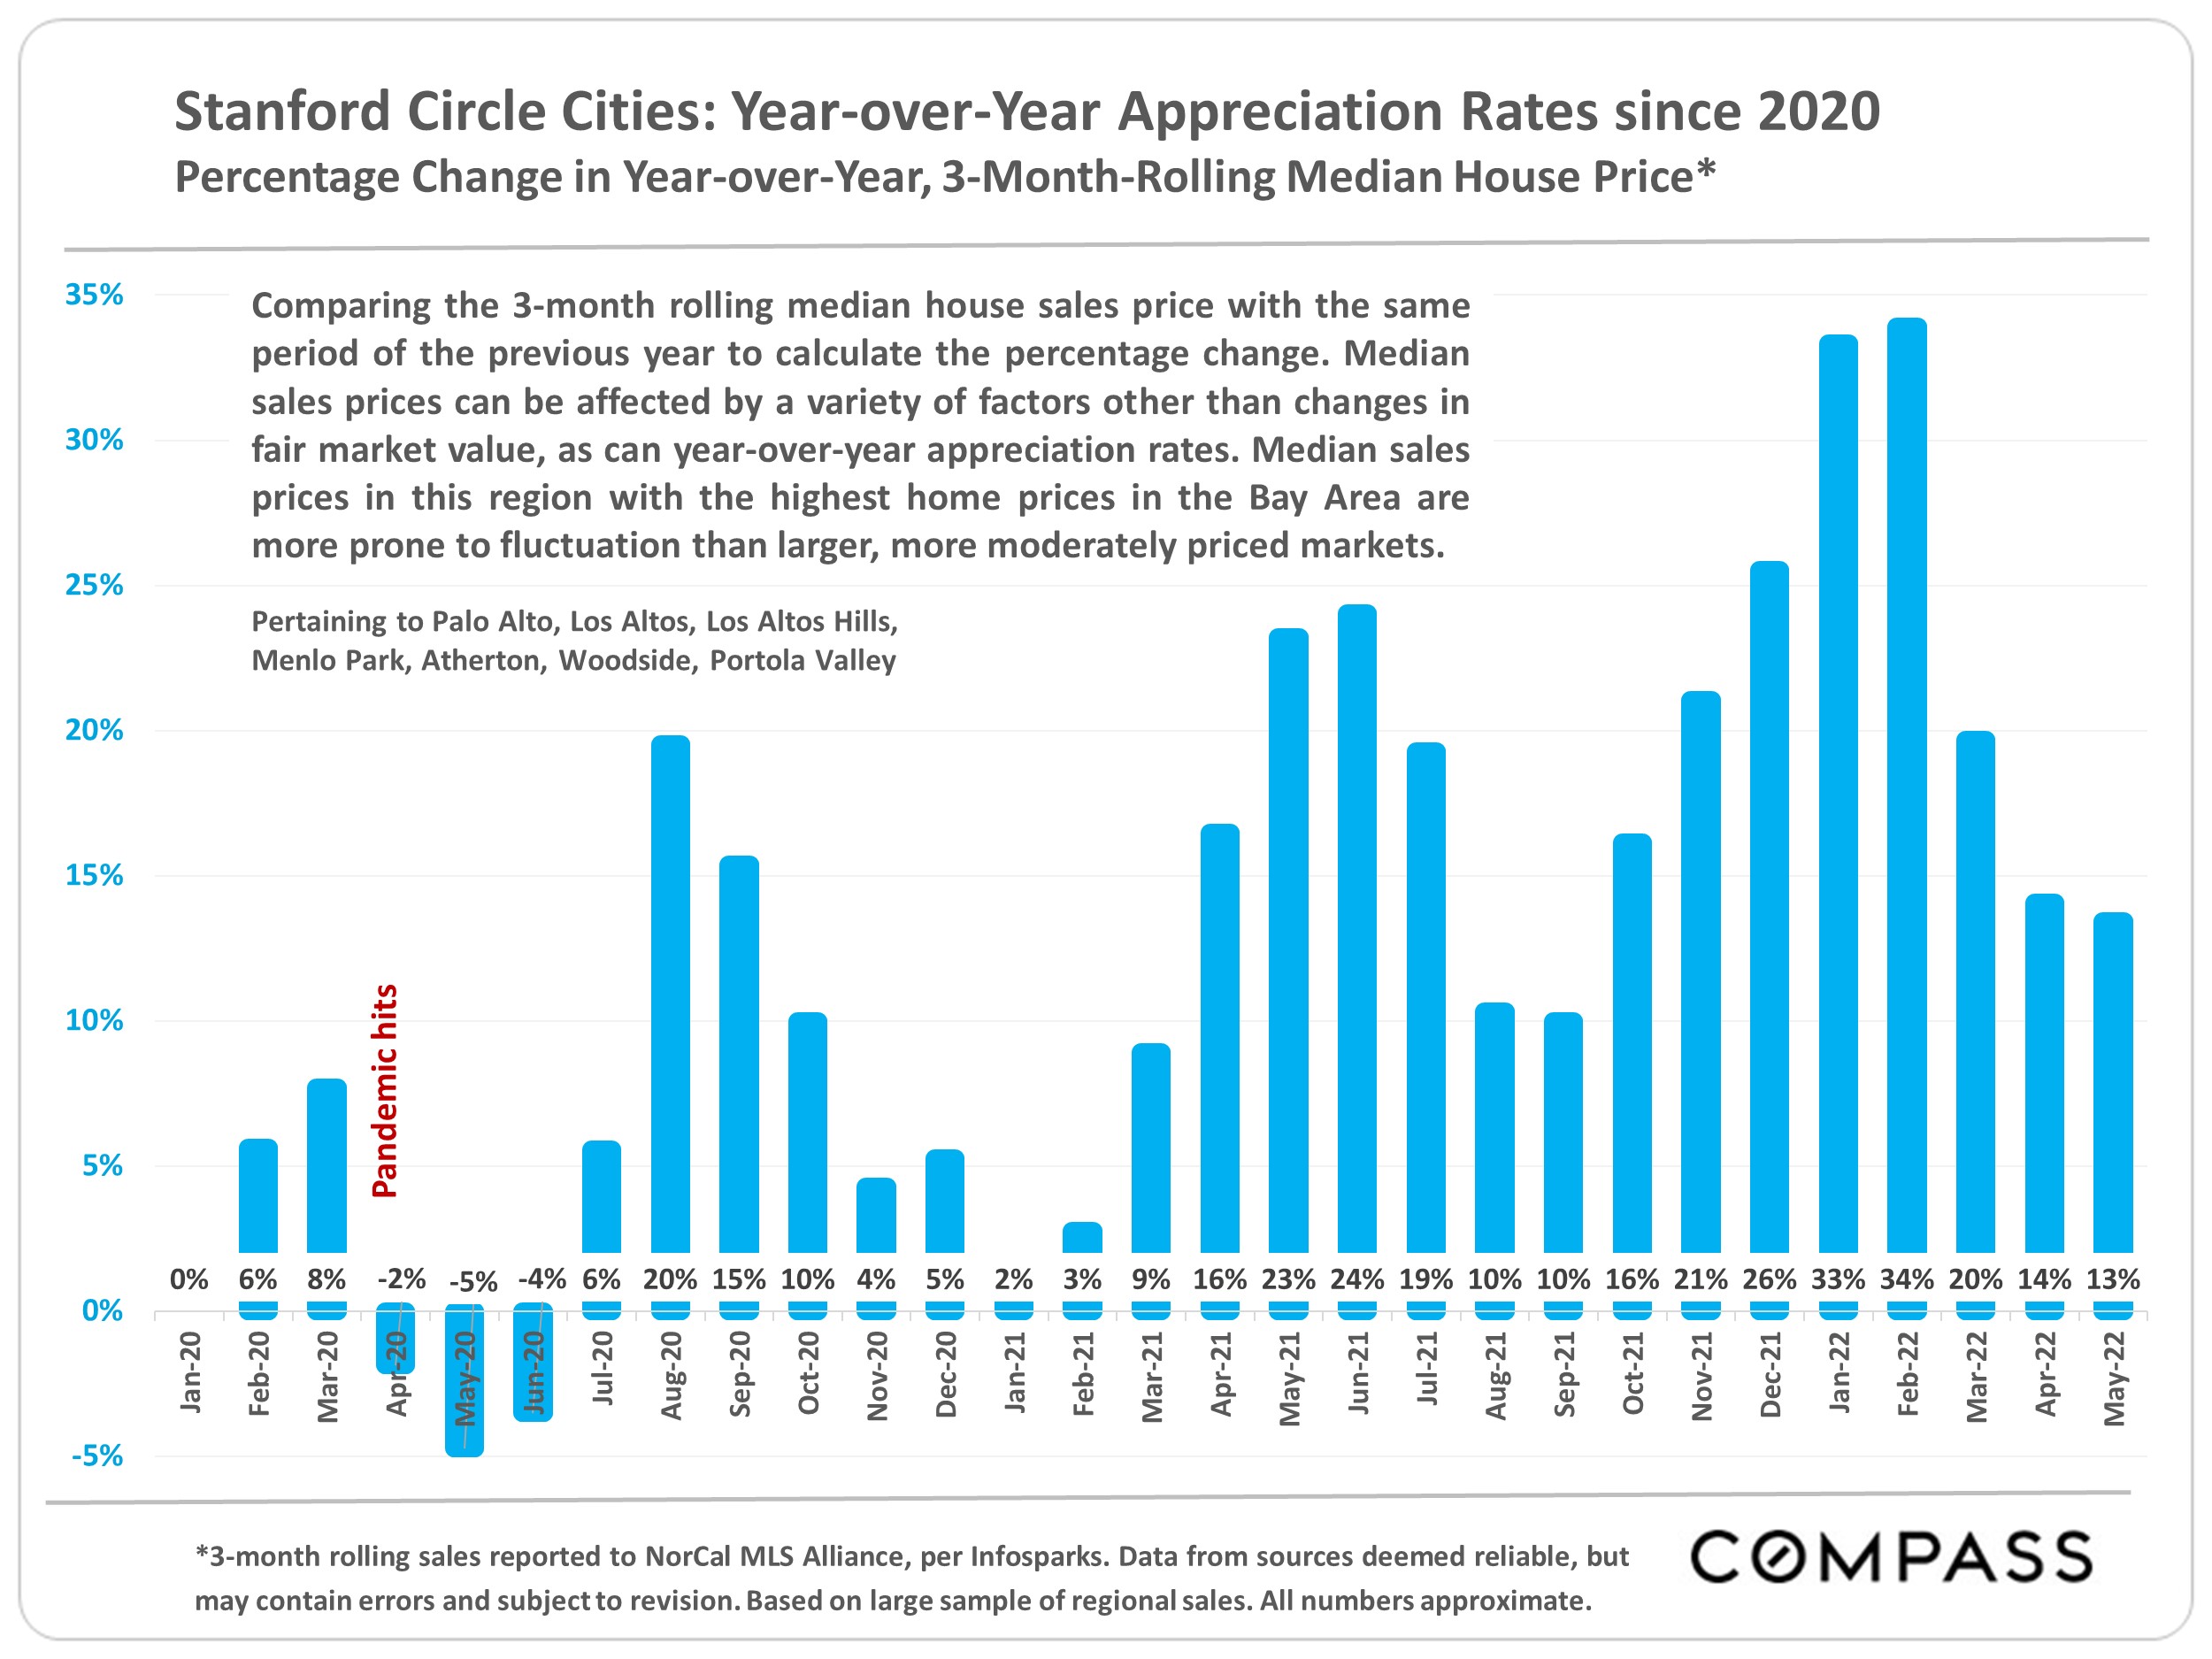
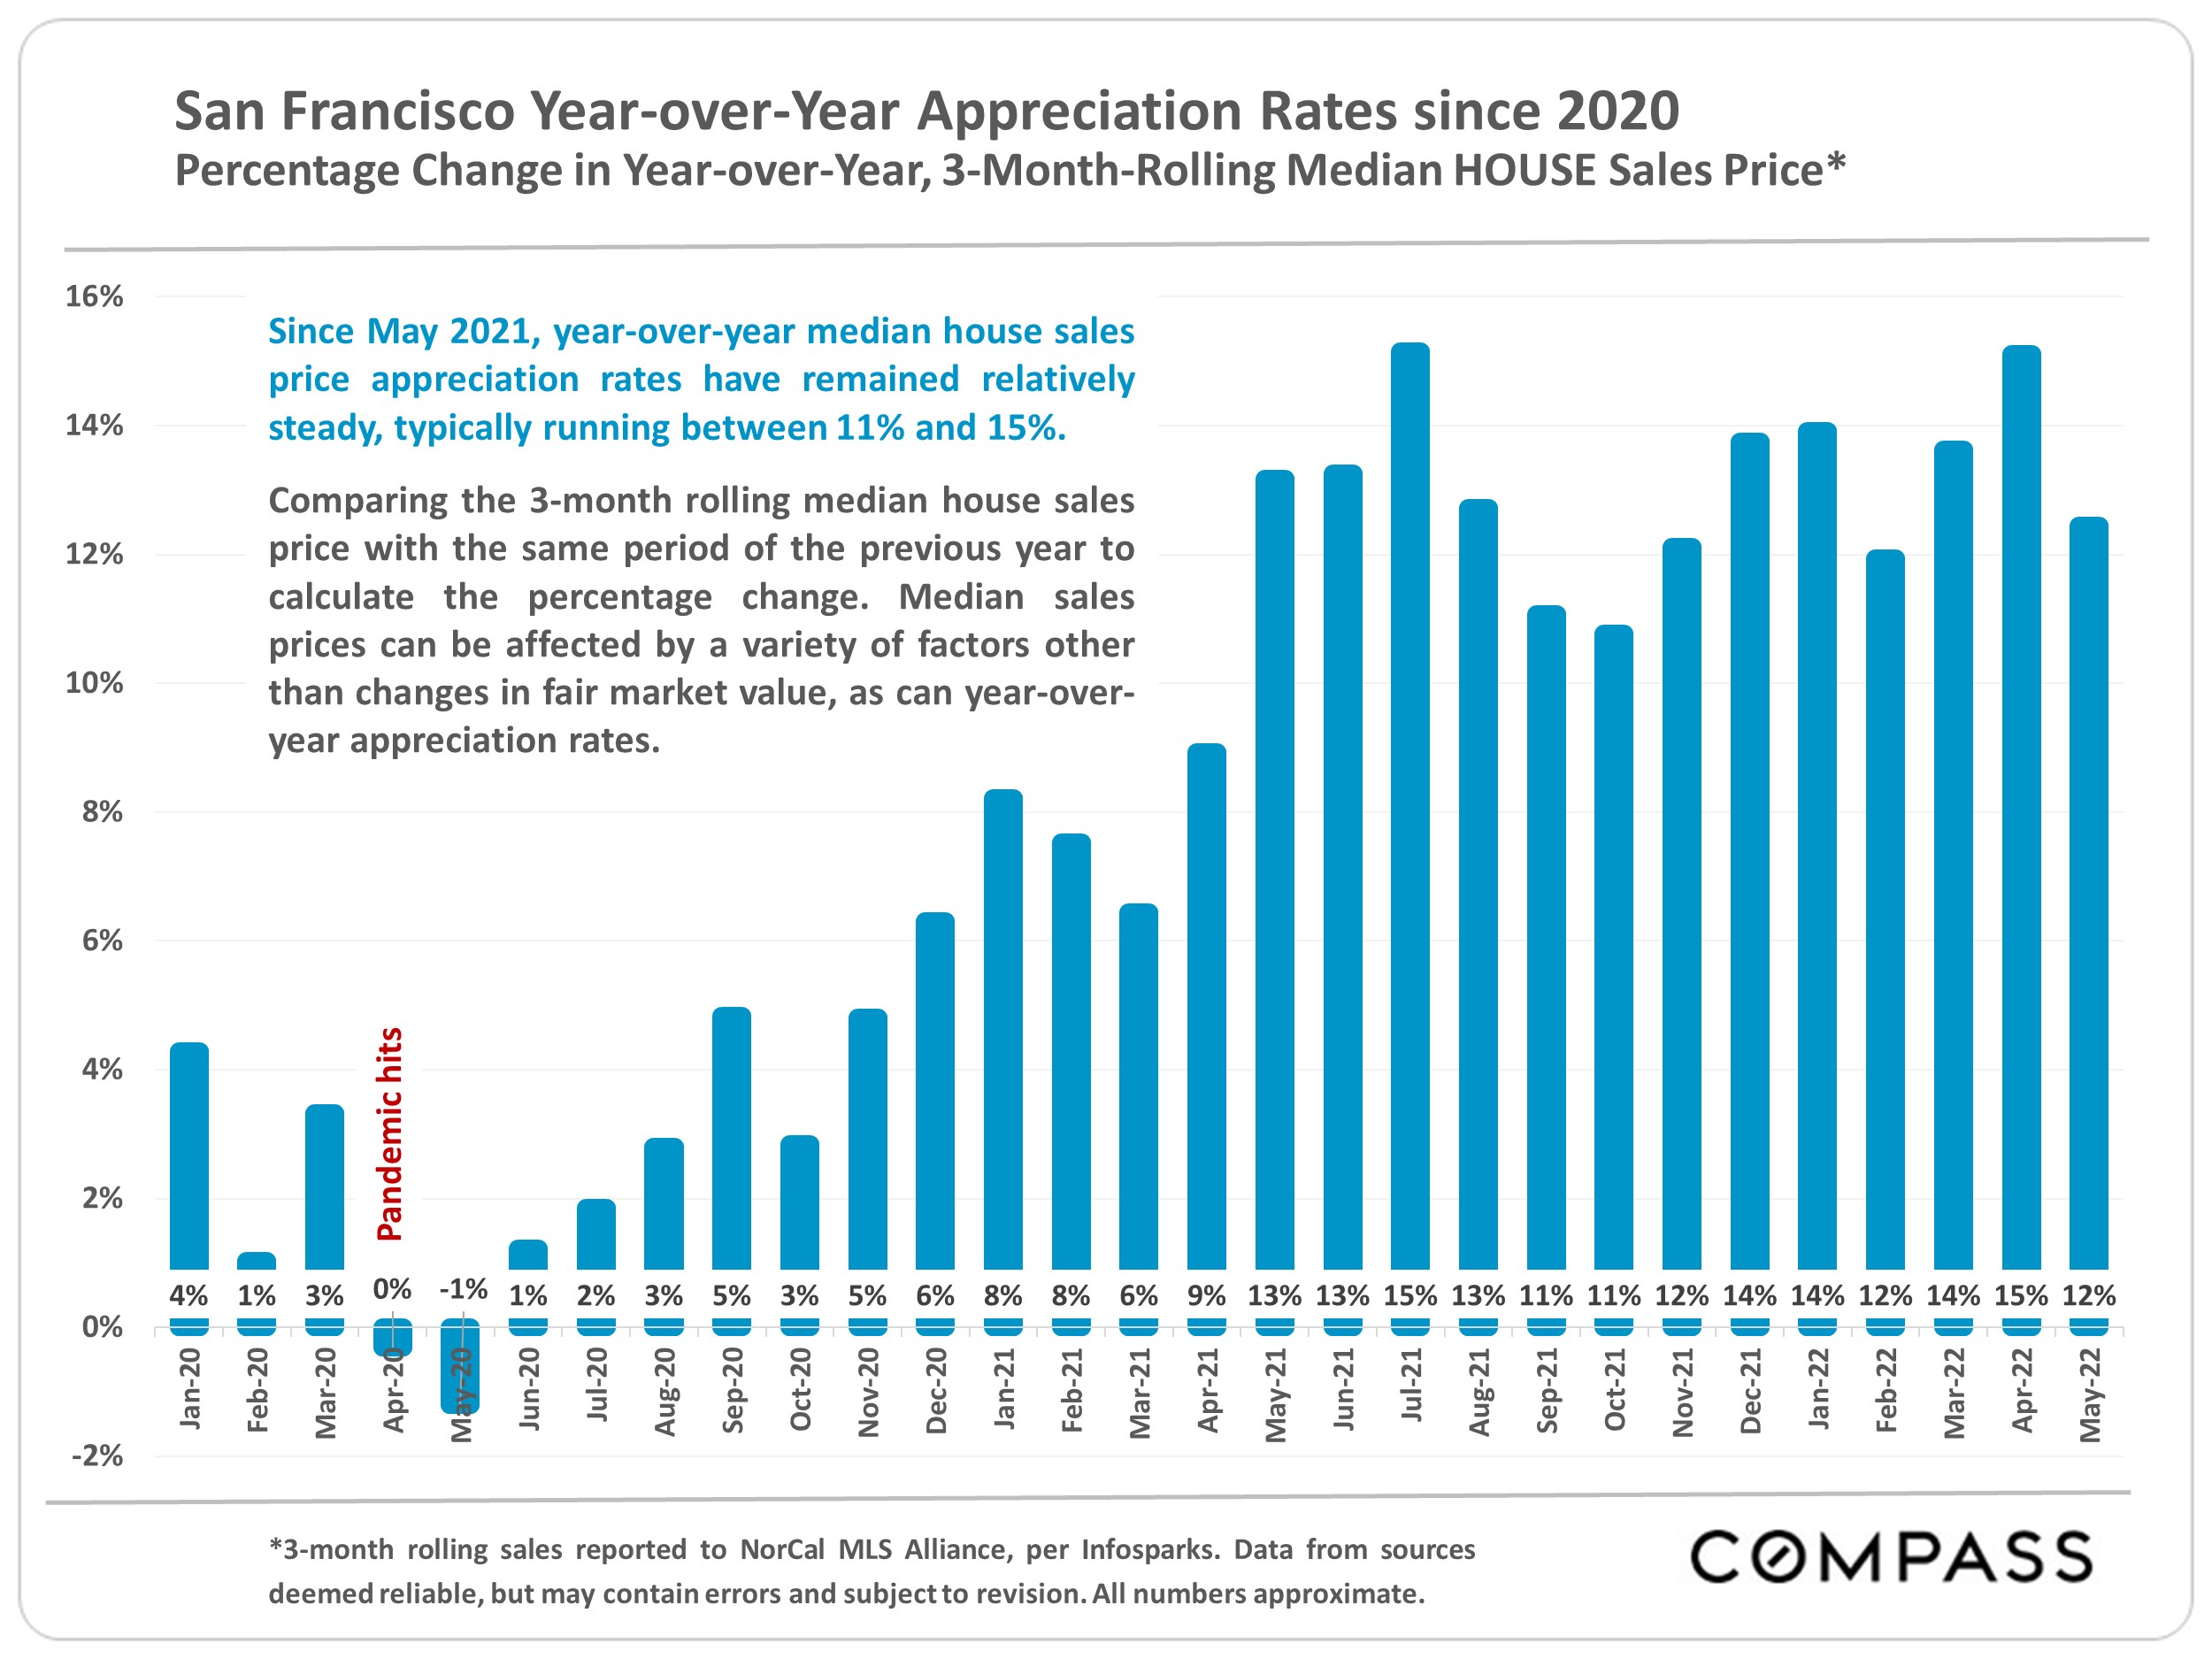
The following chart illustrates approximate home-price appreciation rates from Spring 2020 to Spring 2022, i.e. during the first 2 years of the pandemic. Note: In early 2022, major macroeconomic changes – soaring inflation and interest rates and volatile stock markets – hit the economy, but through May 2022, median home prices continued to increase. As of June, there are strong indicators of a shift to a slower, cooler market, but it is too soon to make predictions.
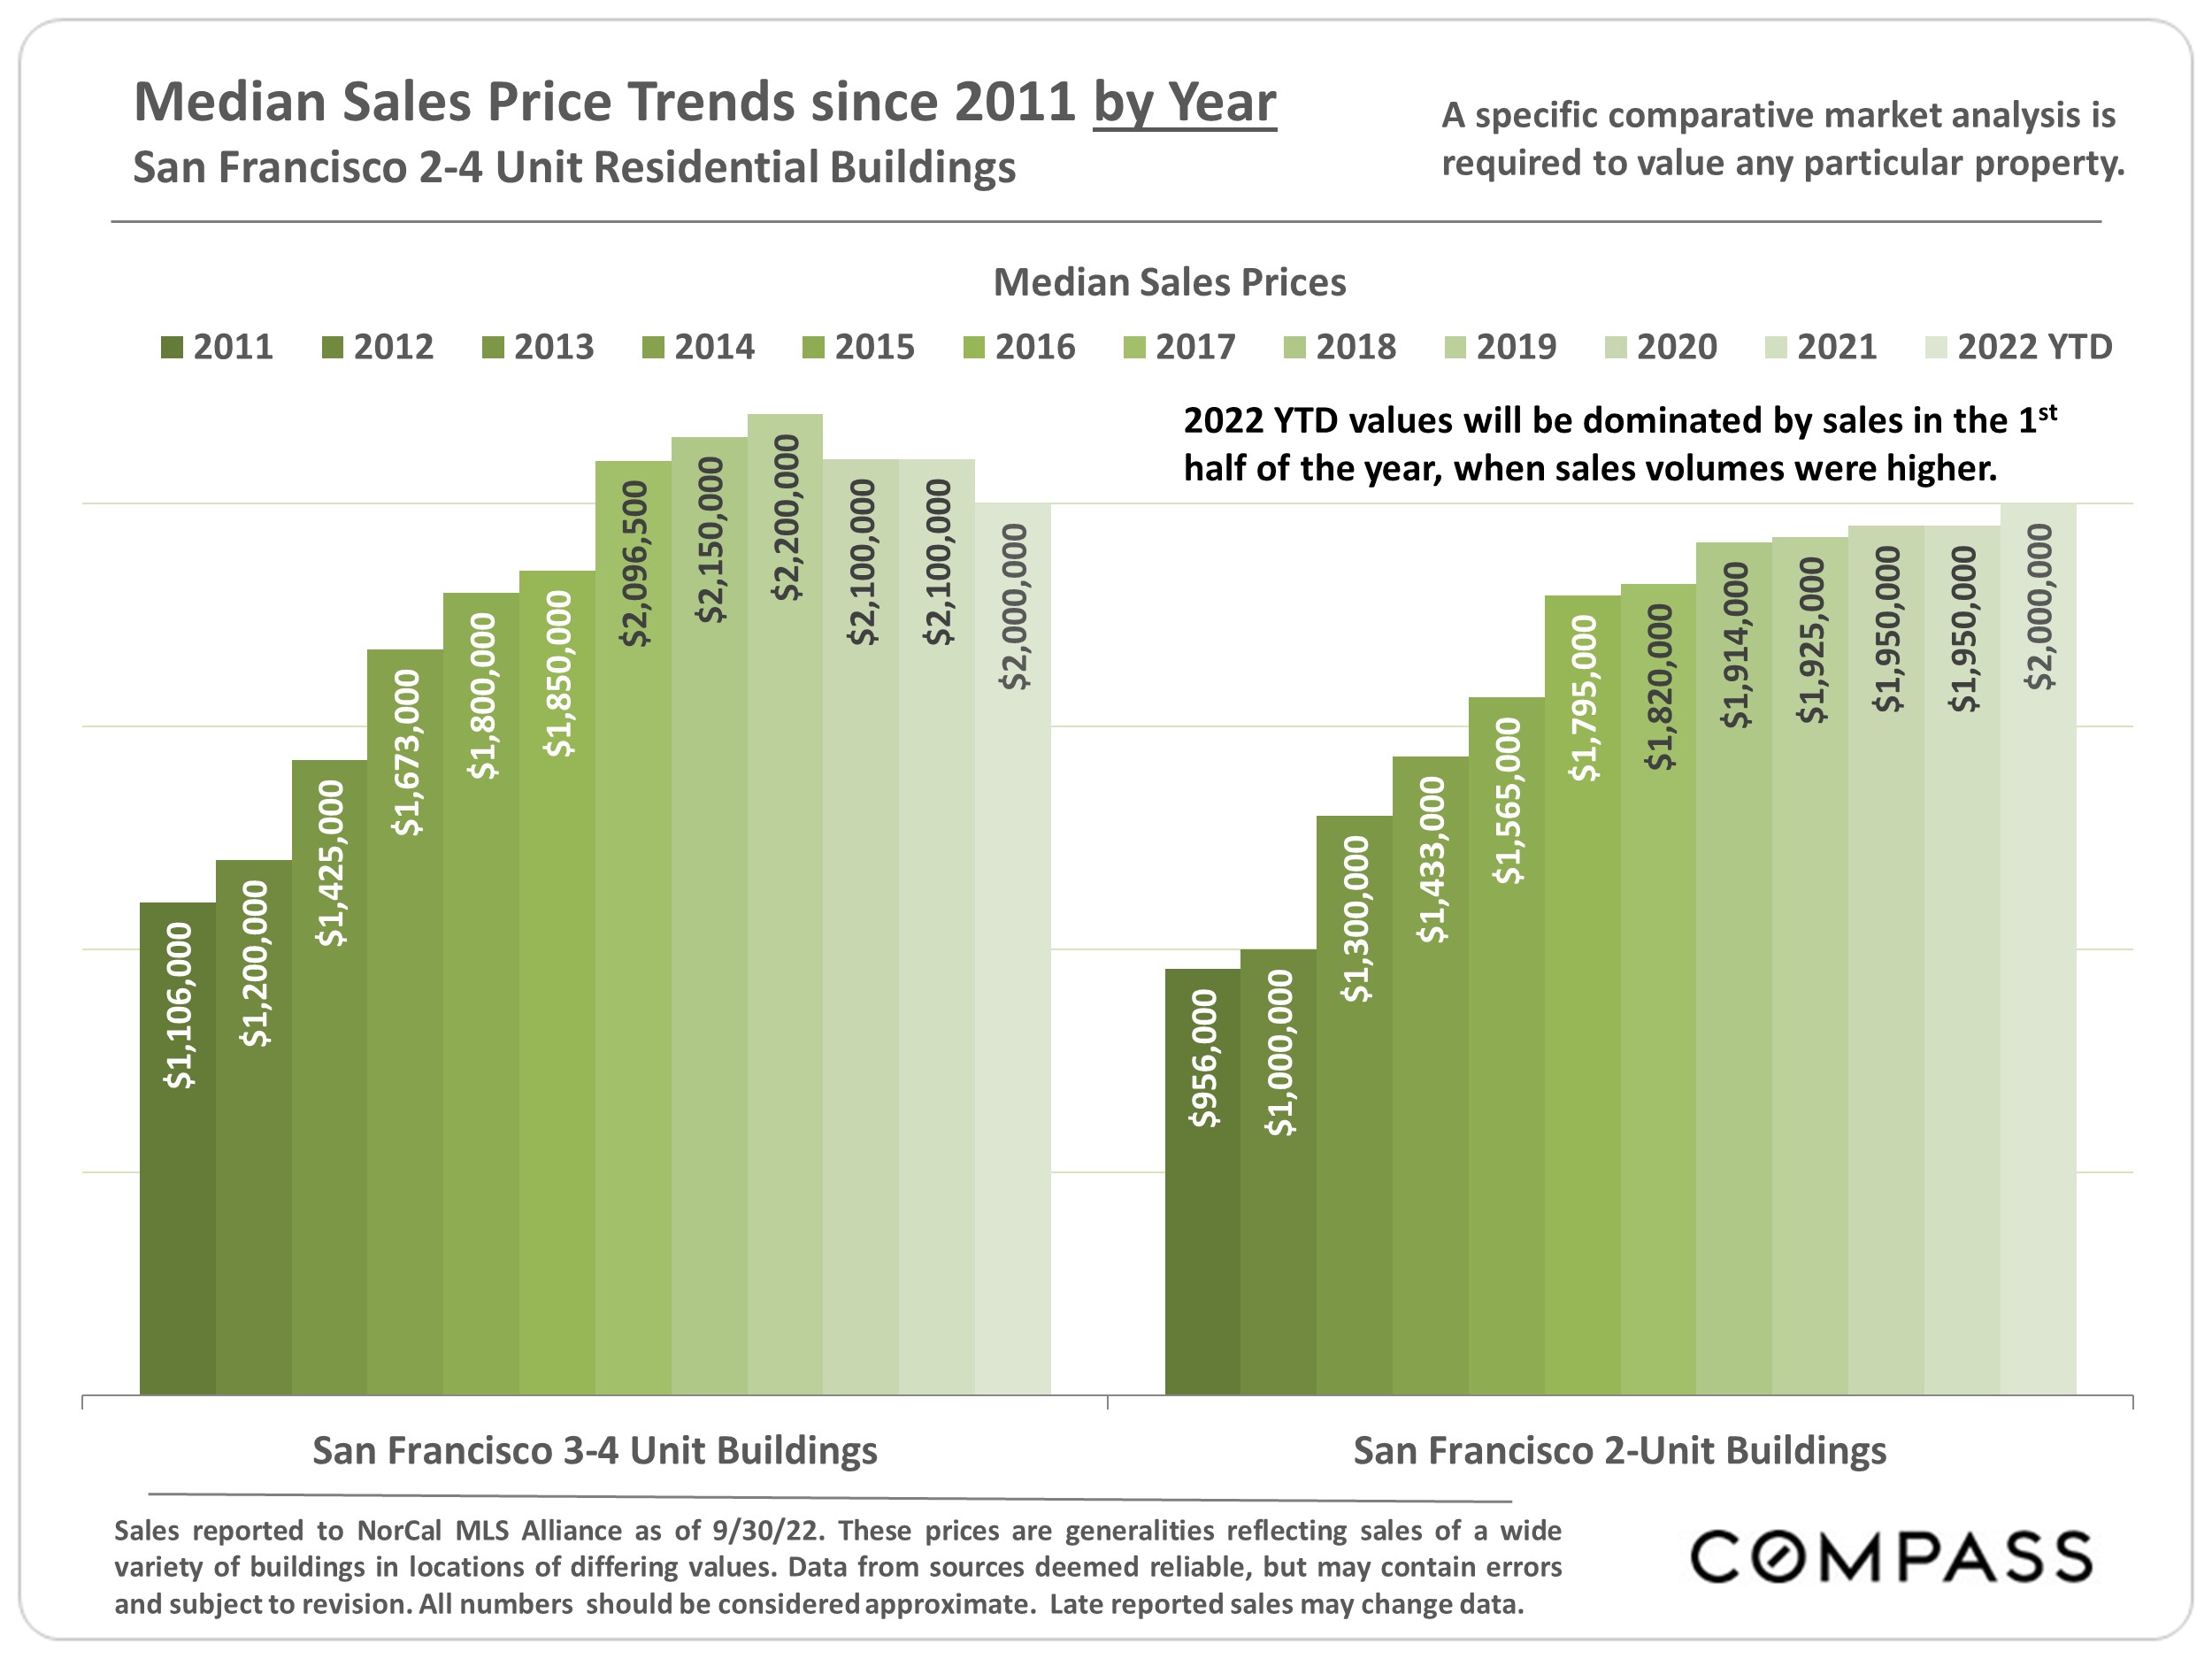
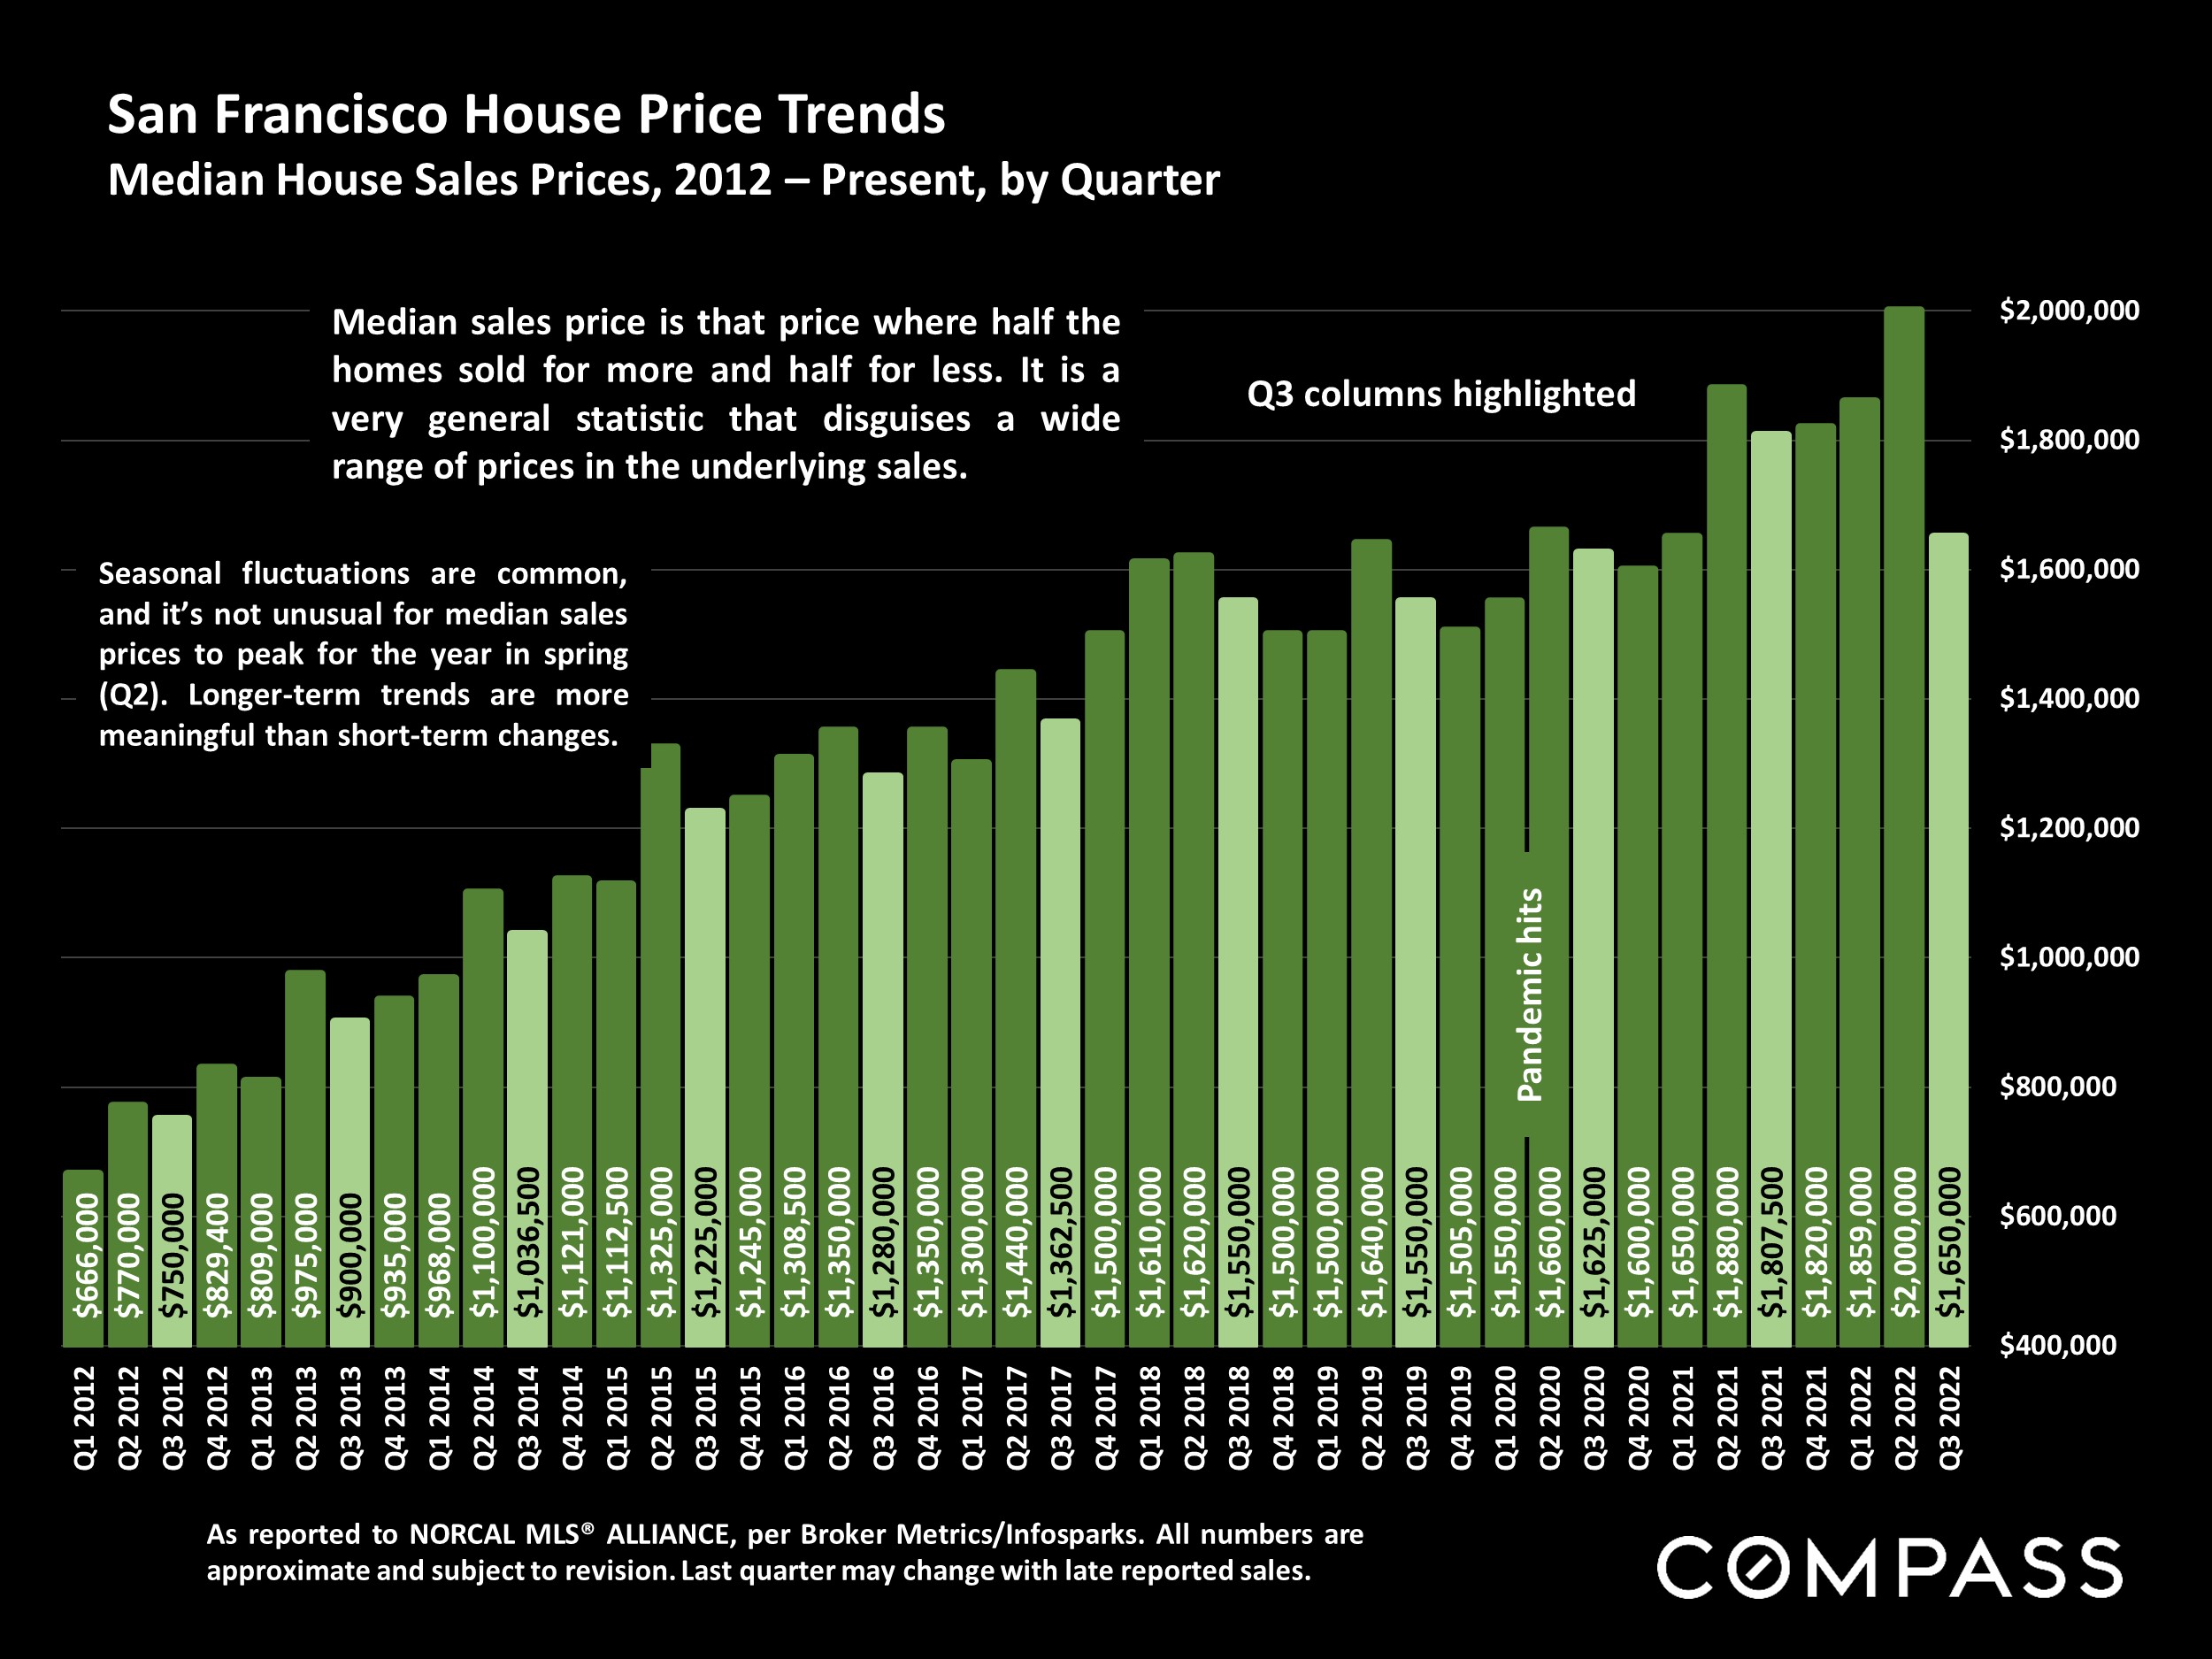
Median Home Prices Hit New Highs in Spring 2022, But Effects of Major Macroeconomic Changes Pending
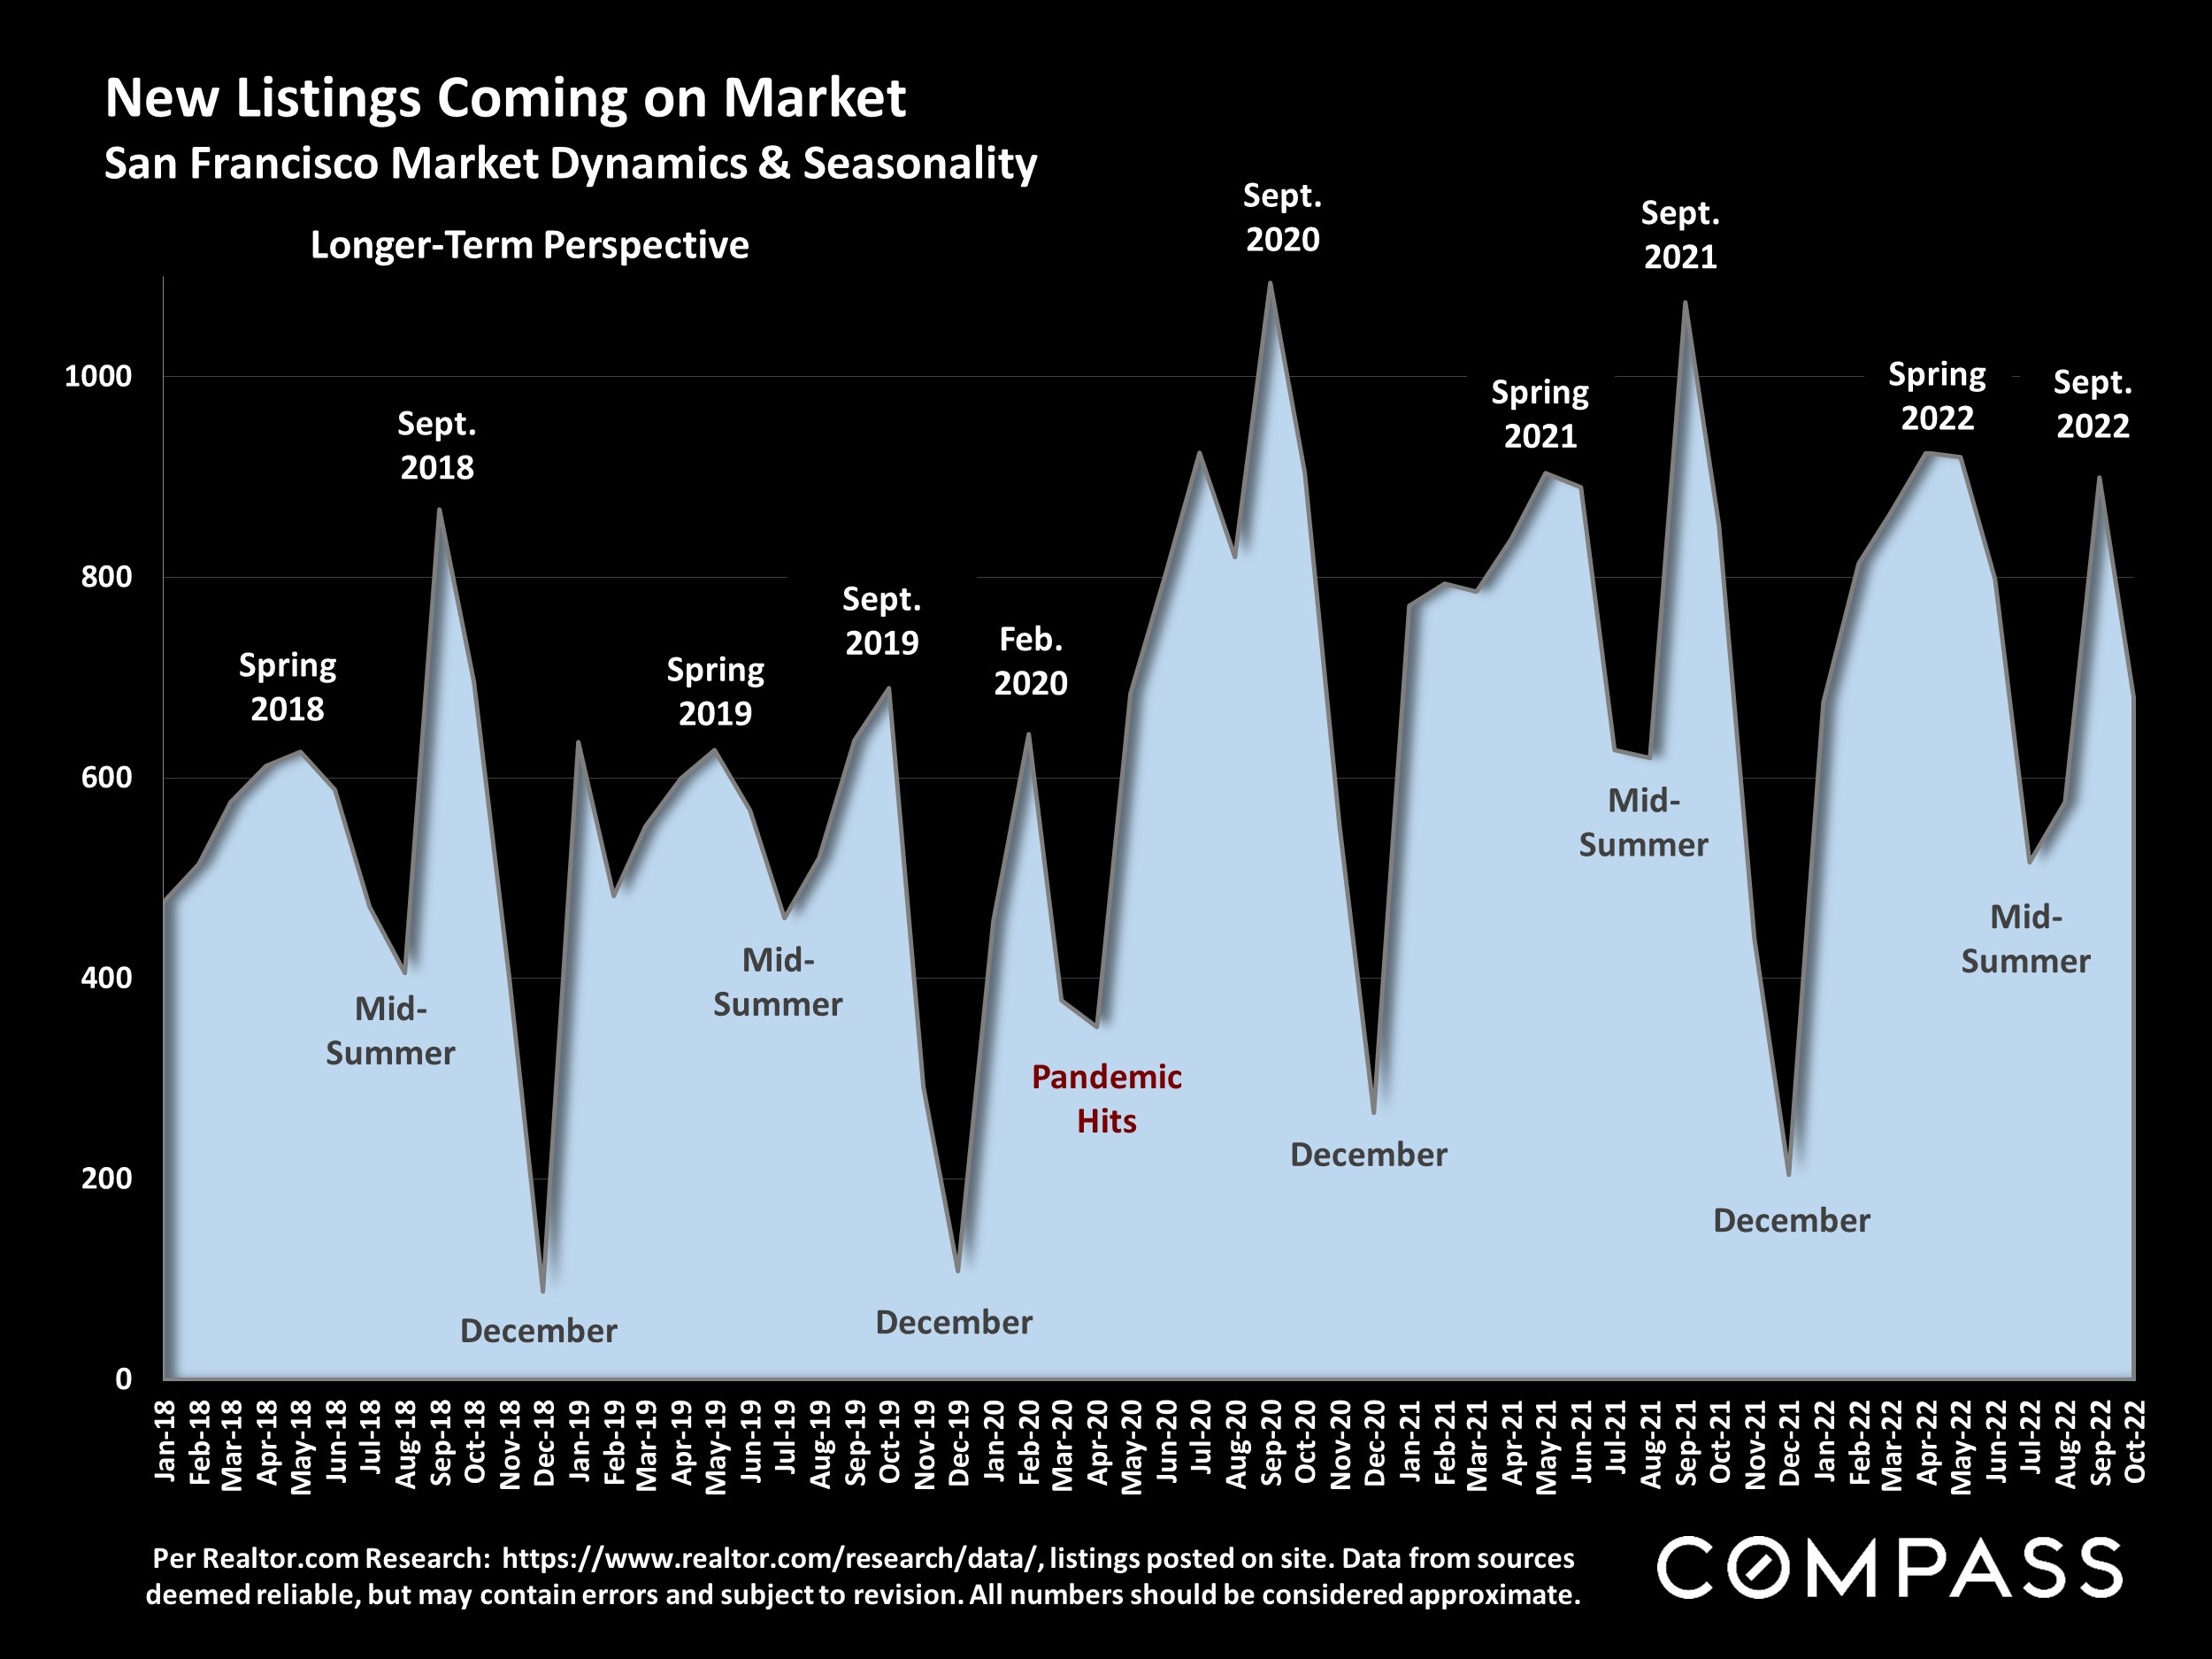
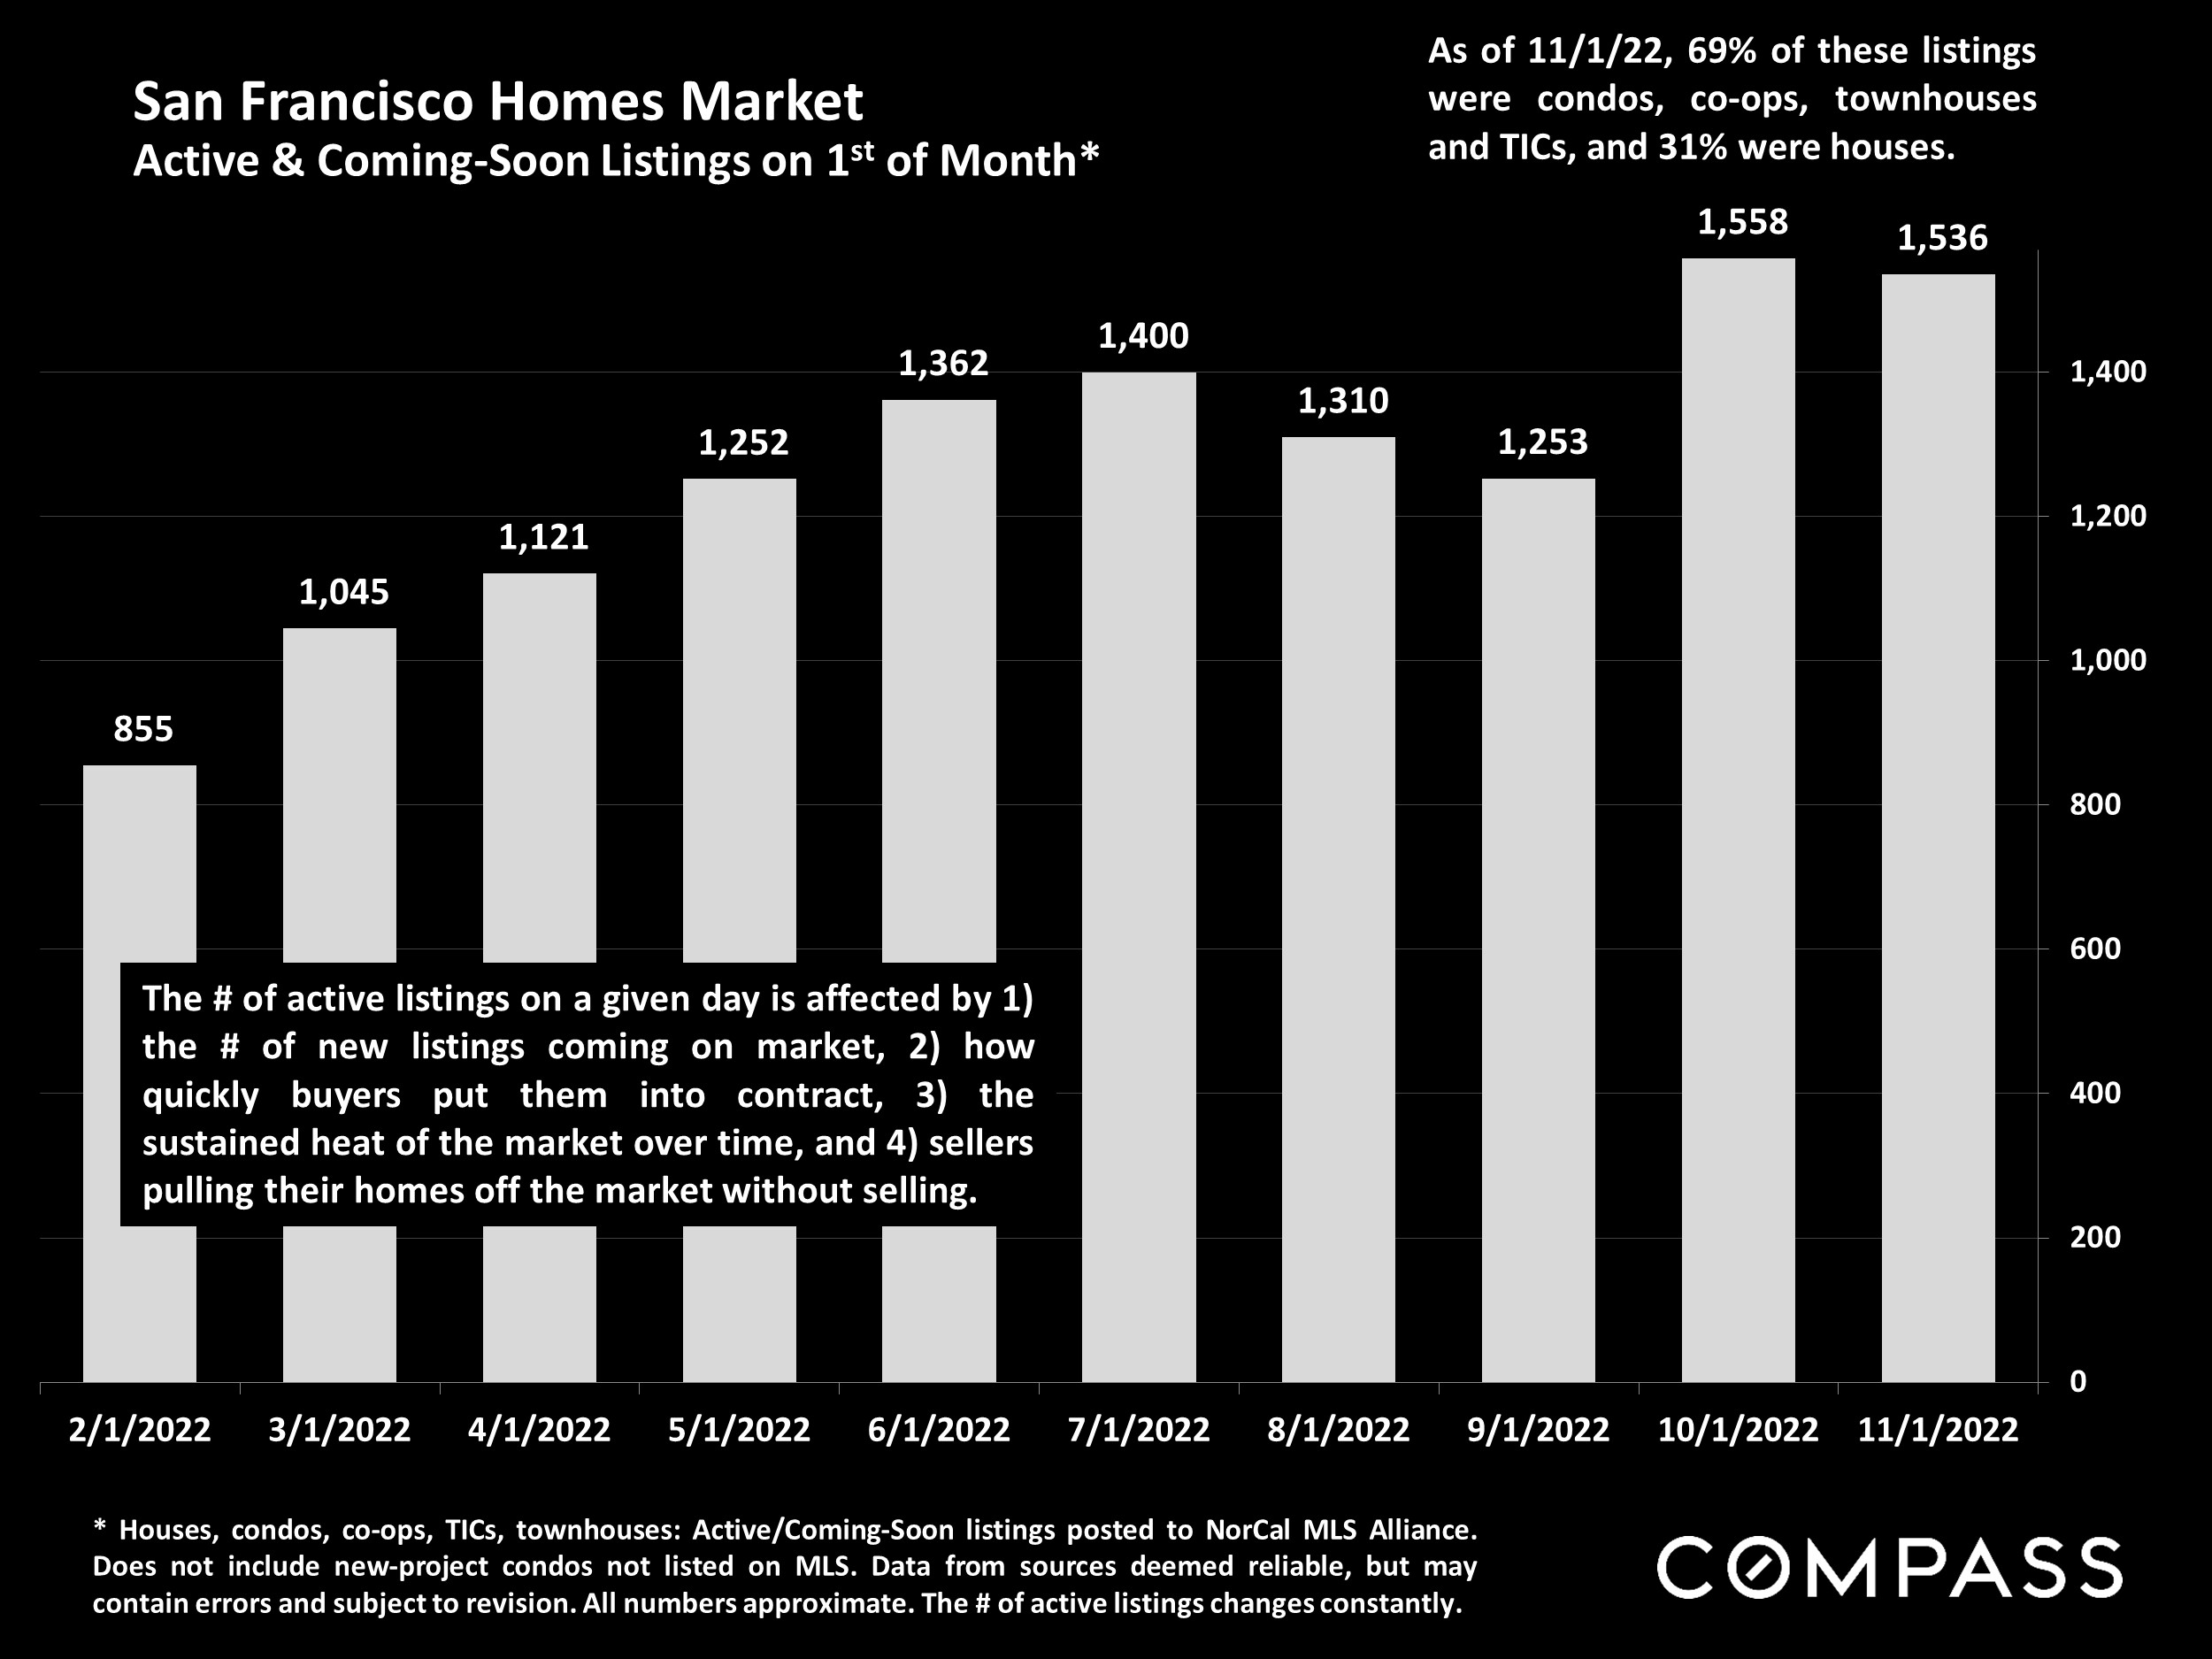
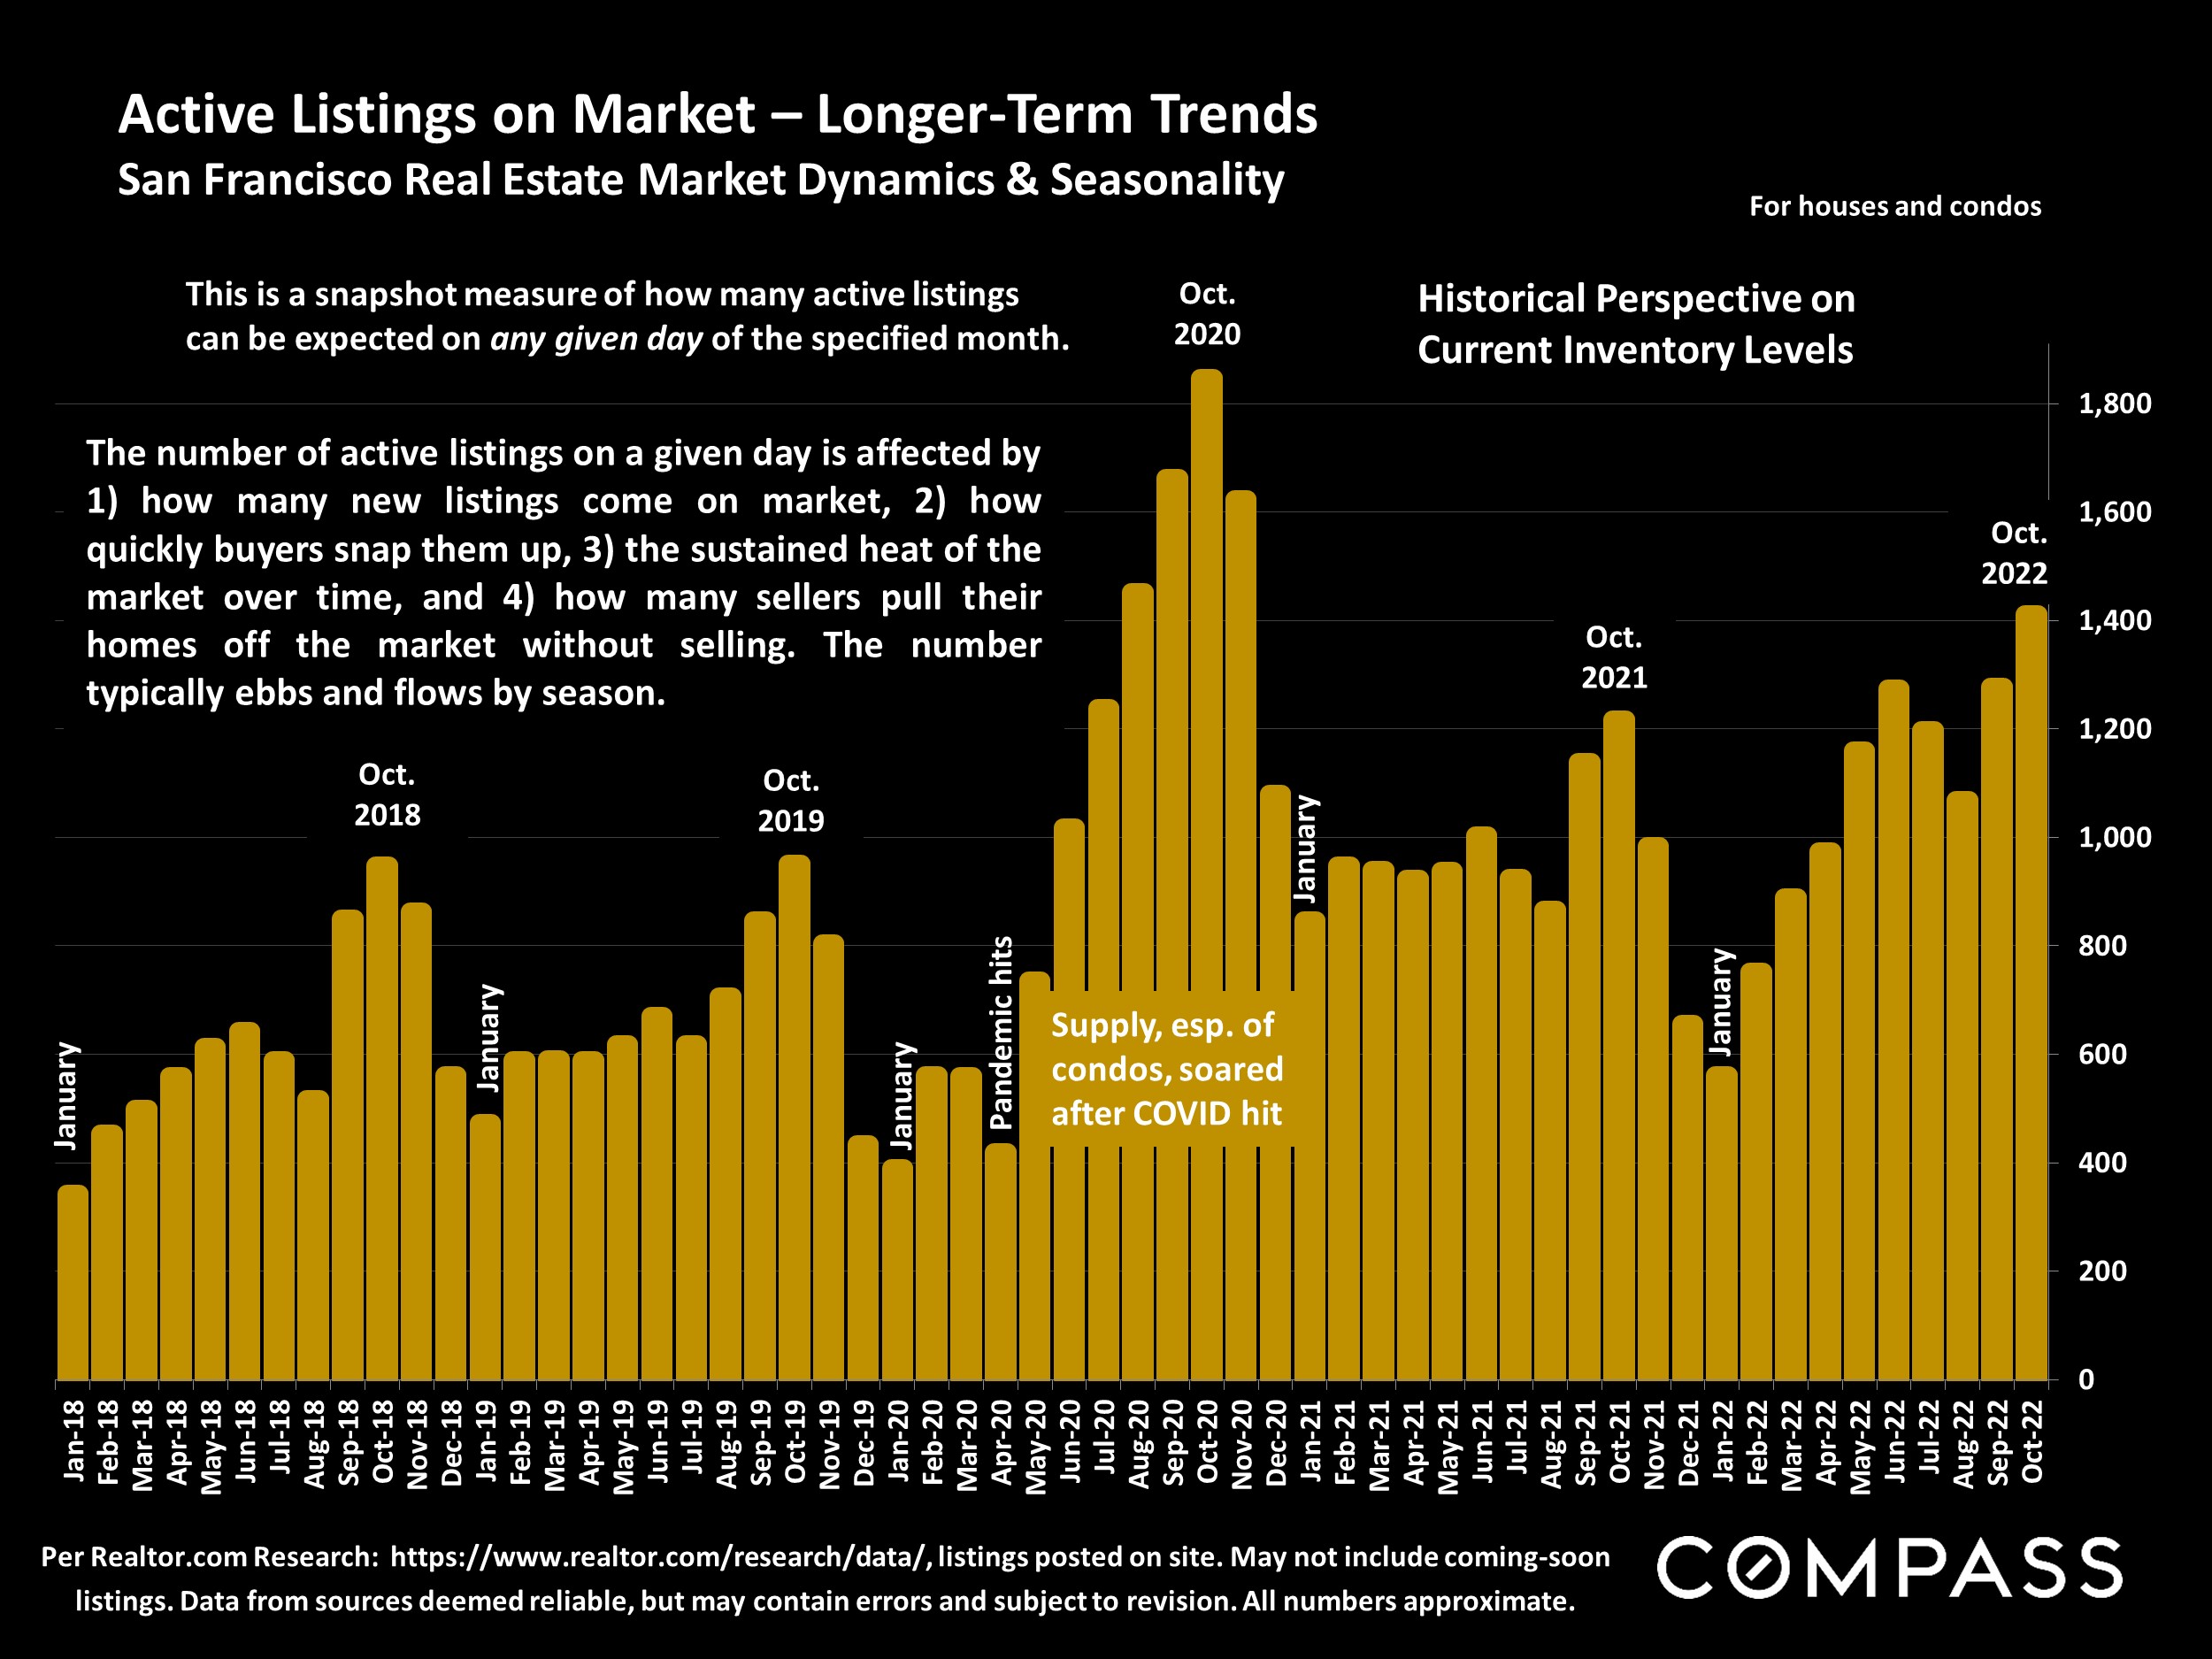
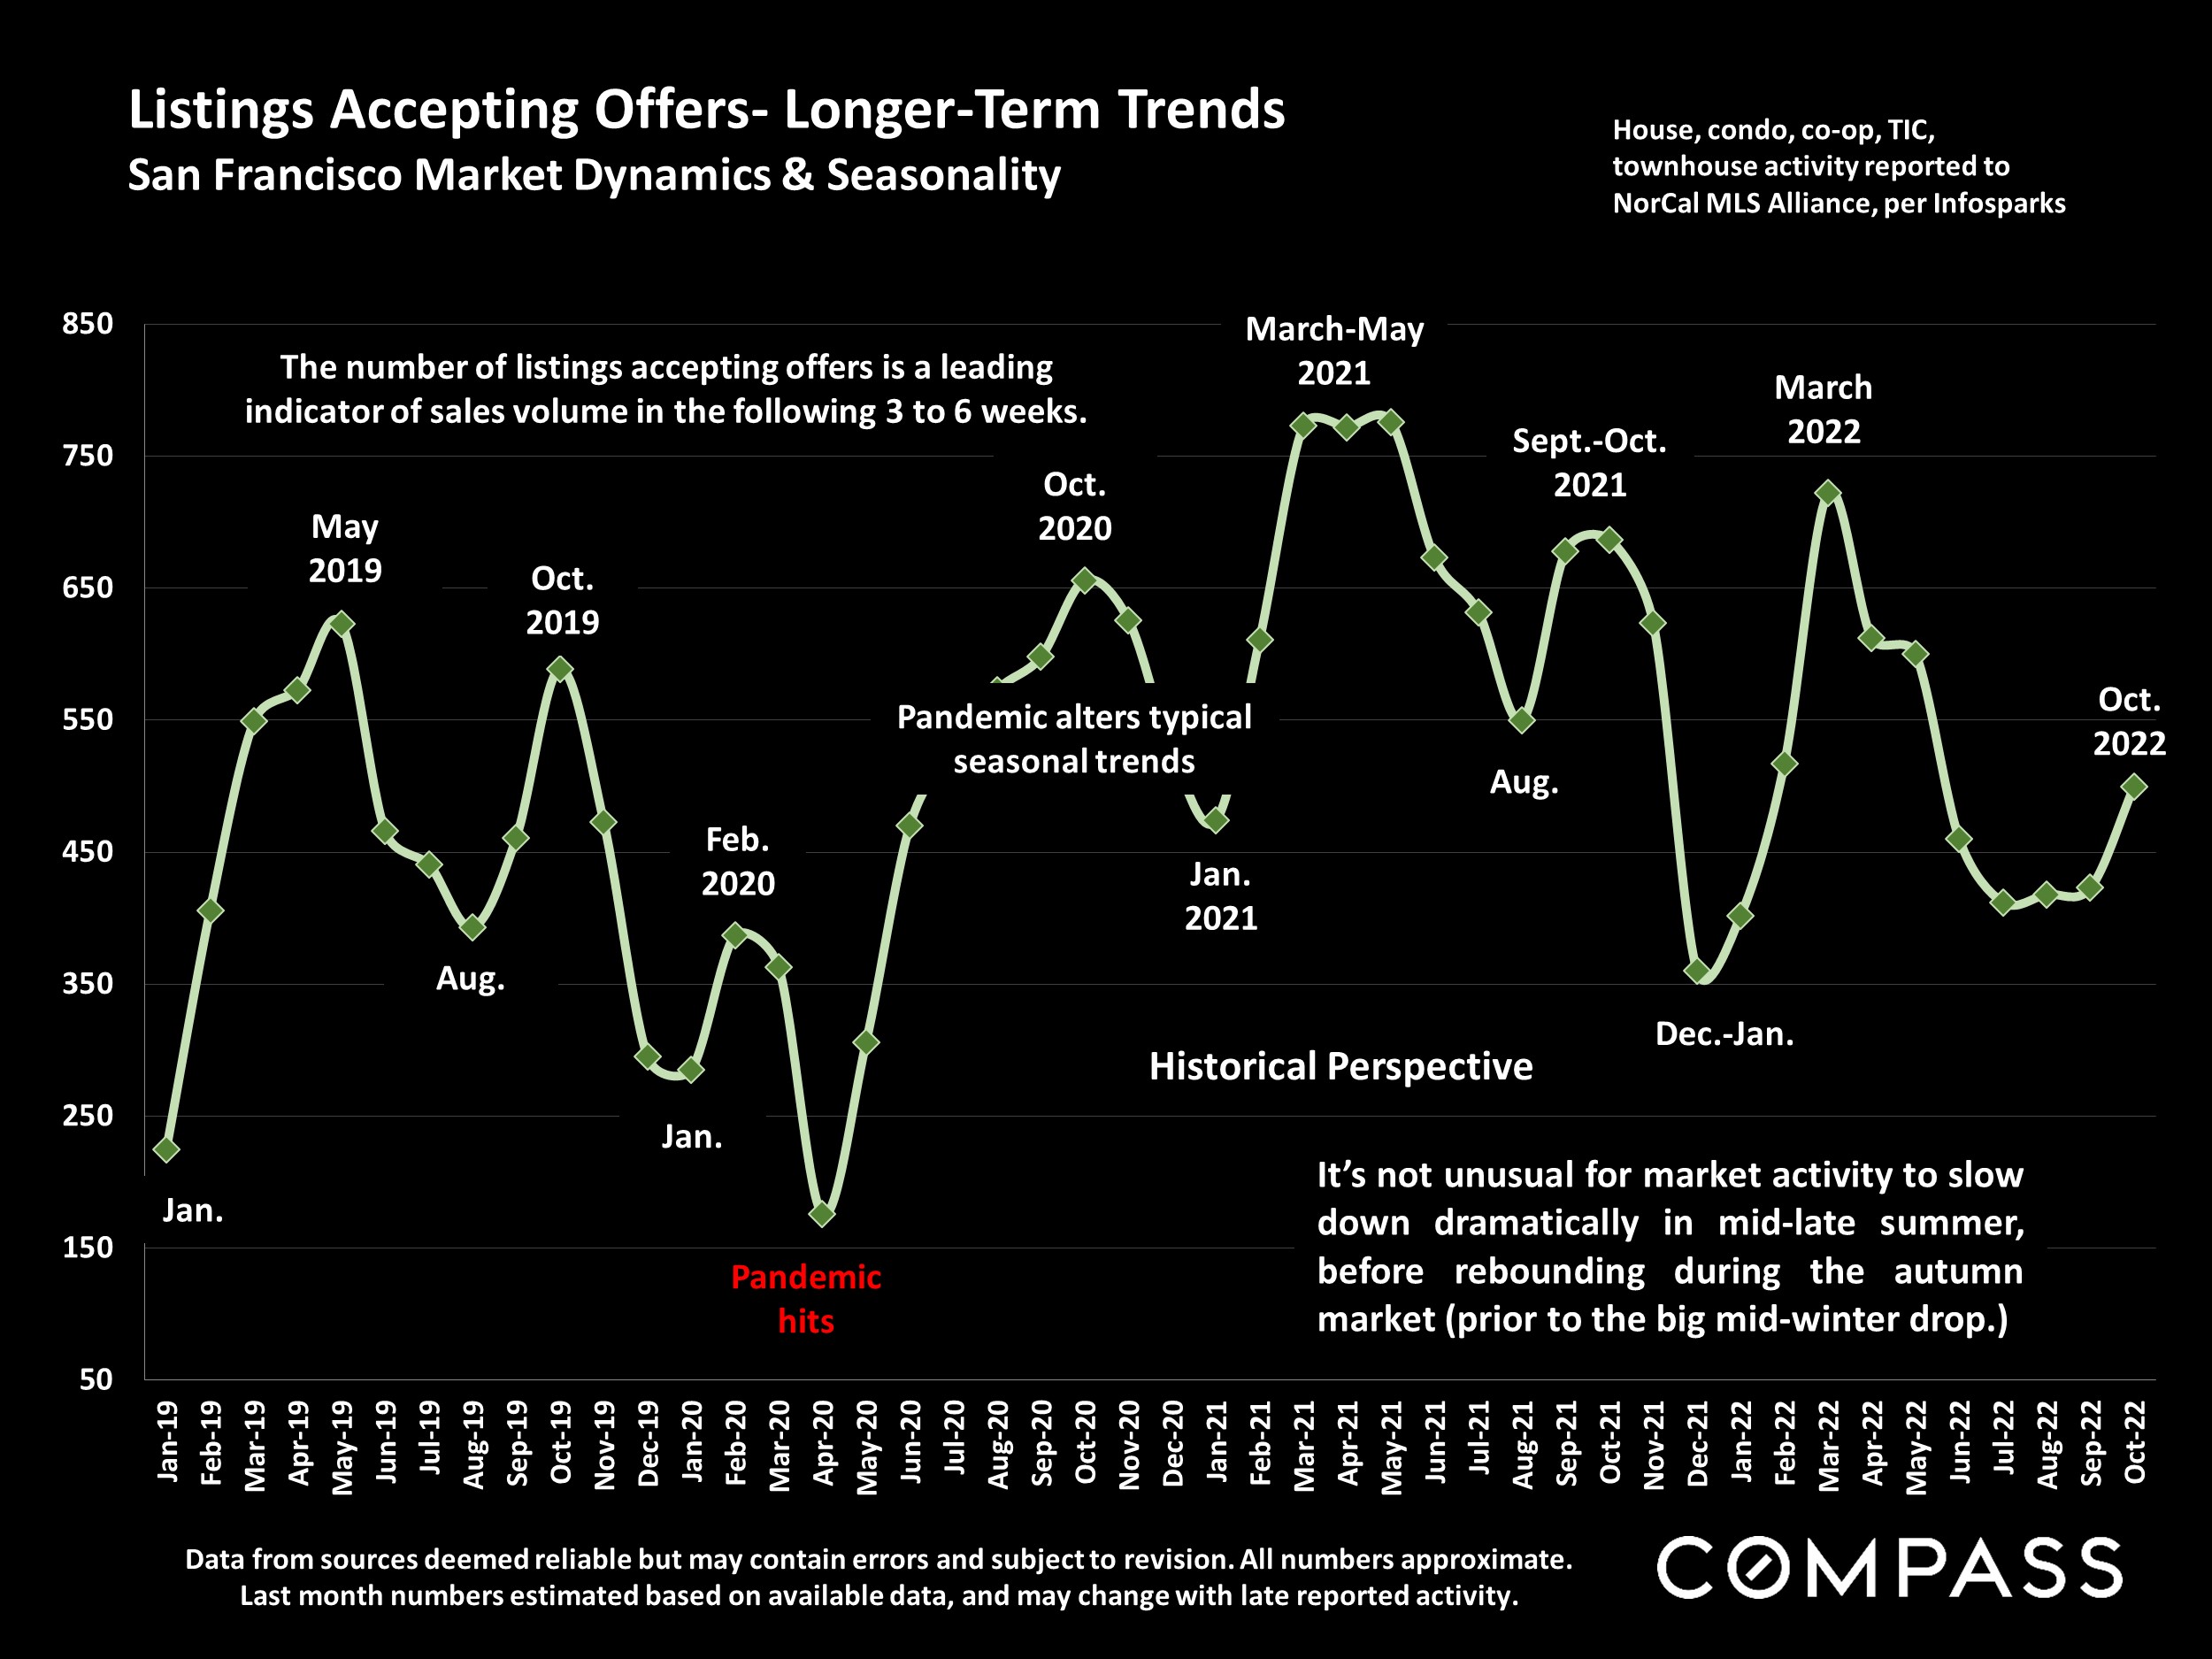
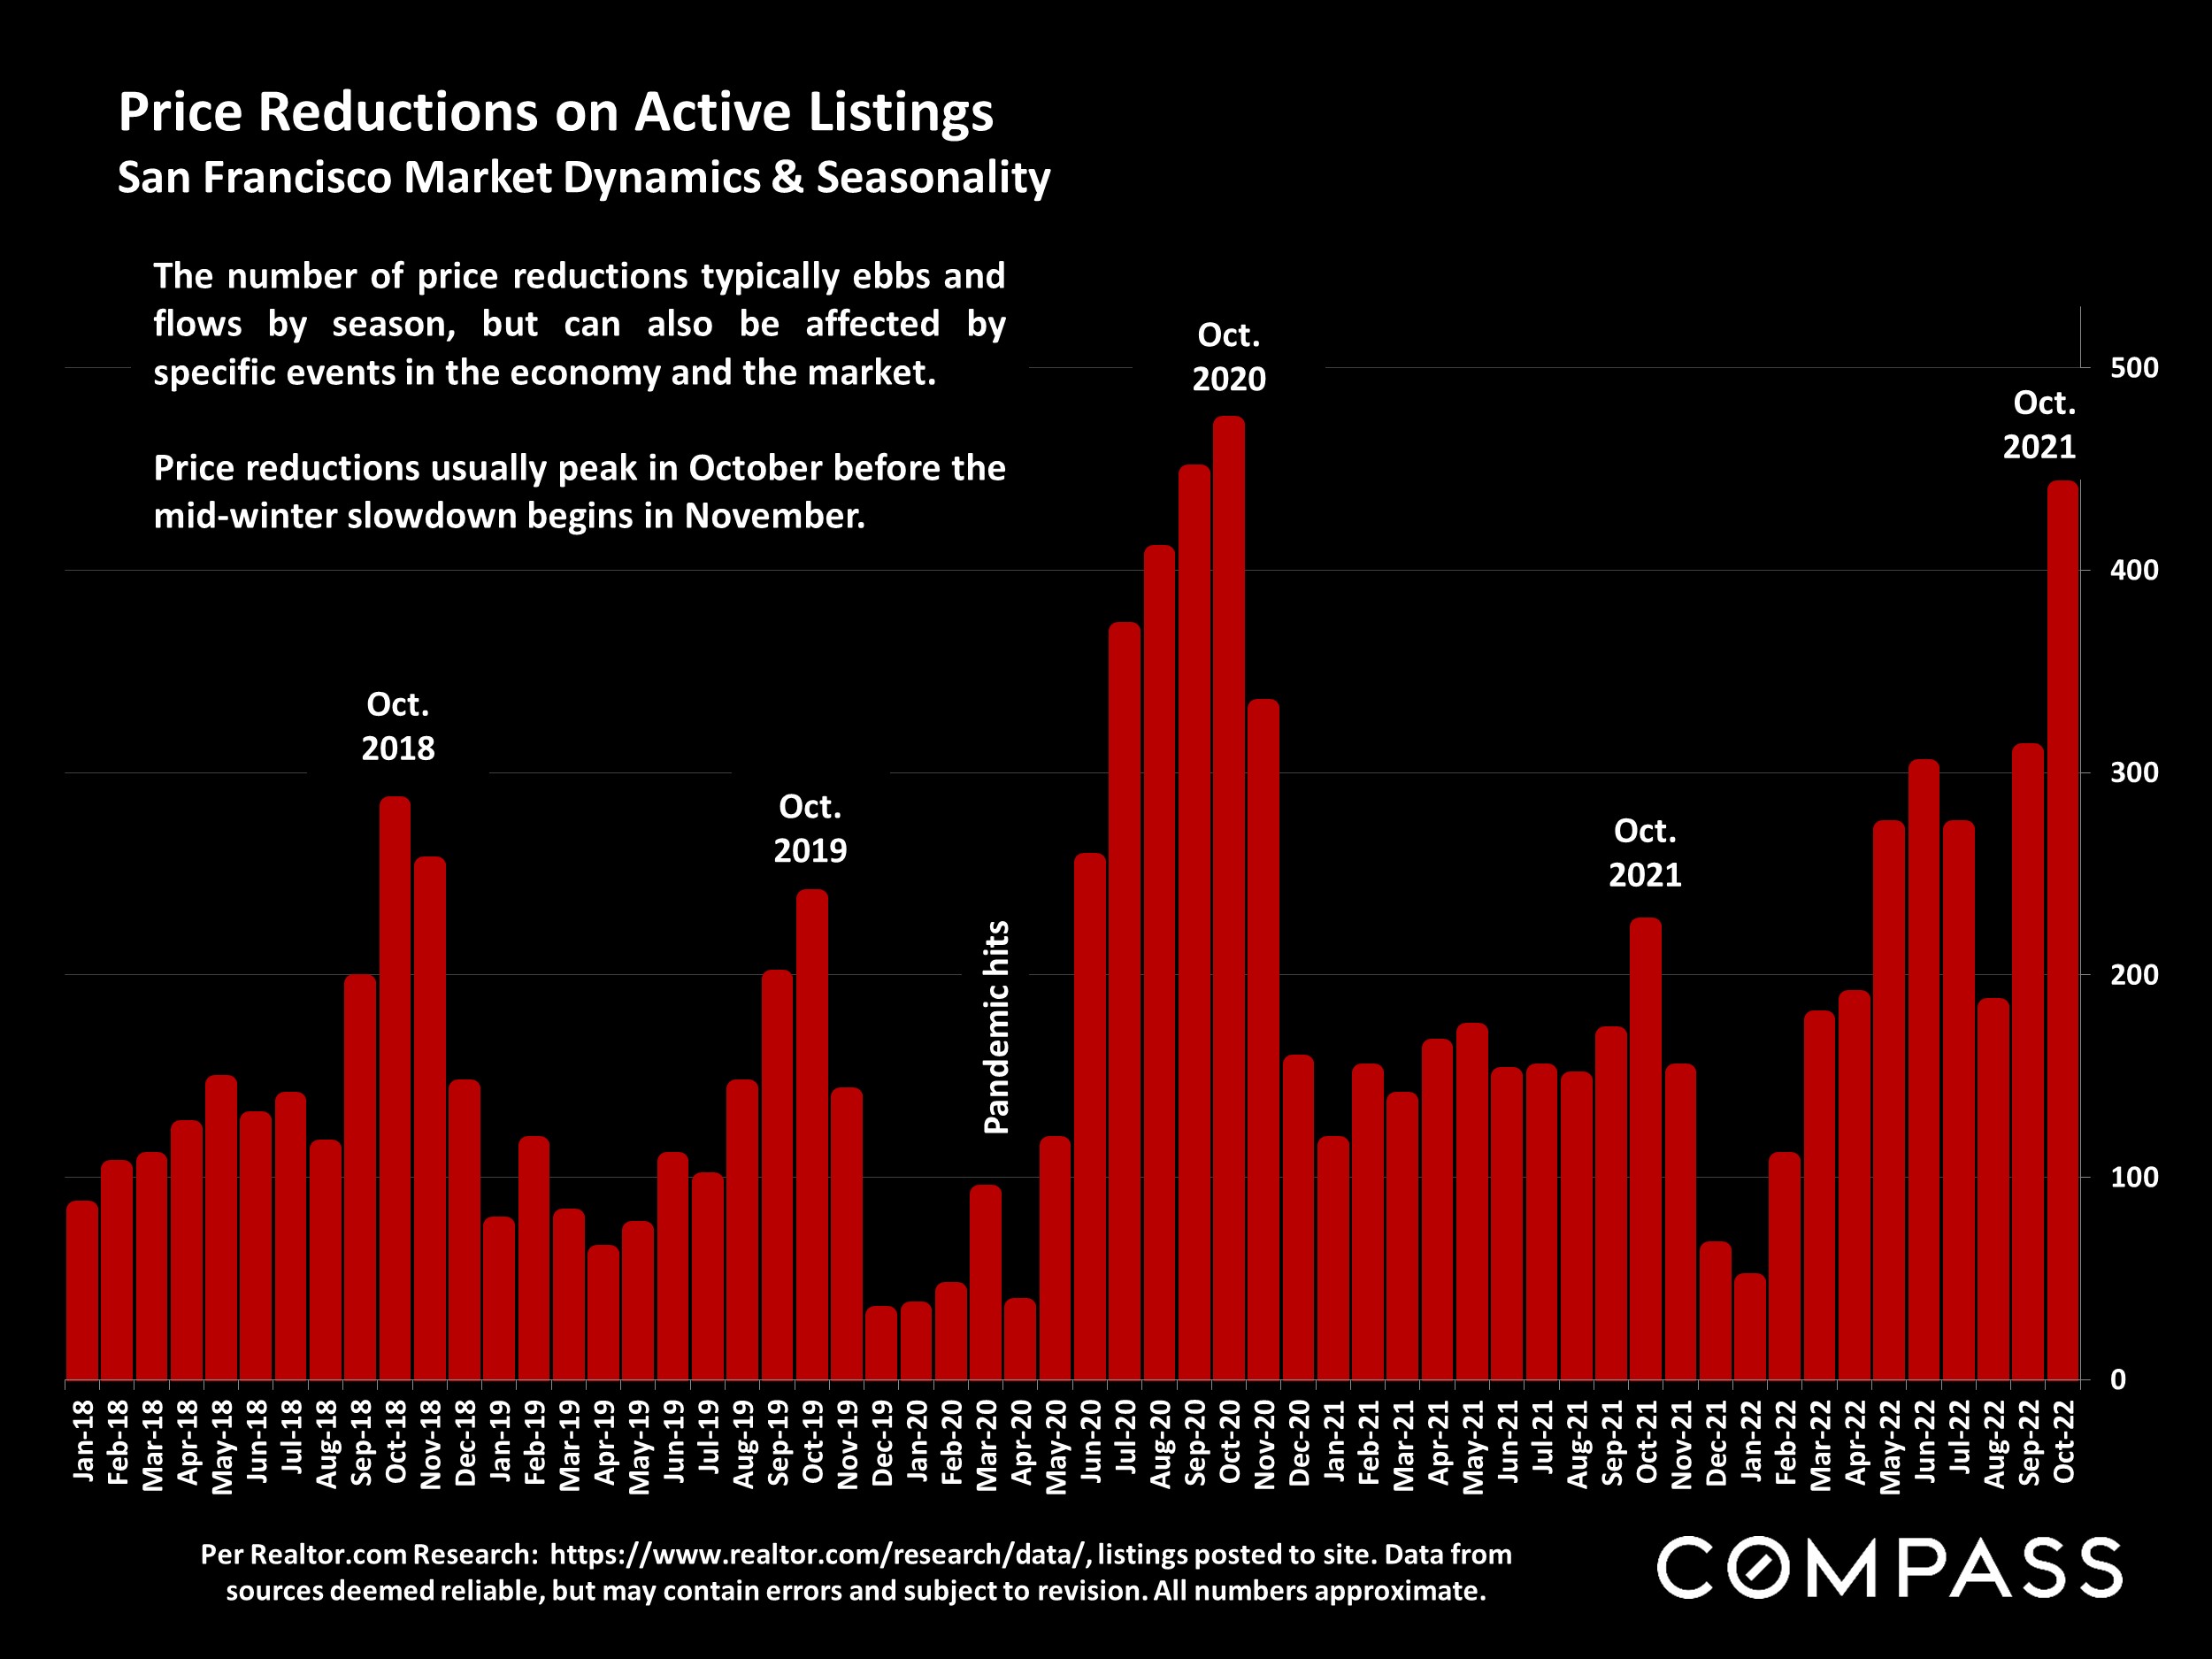
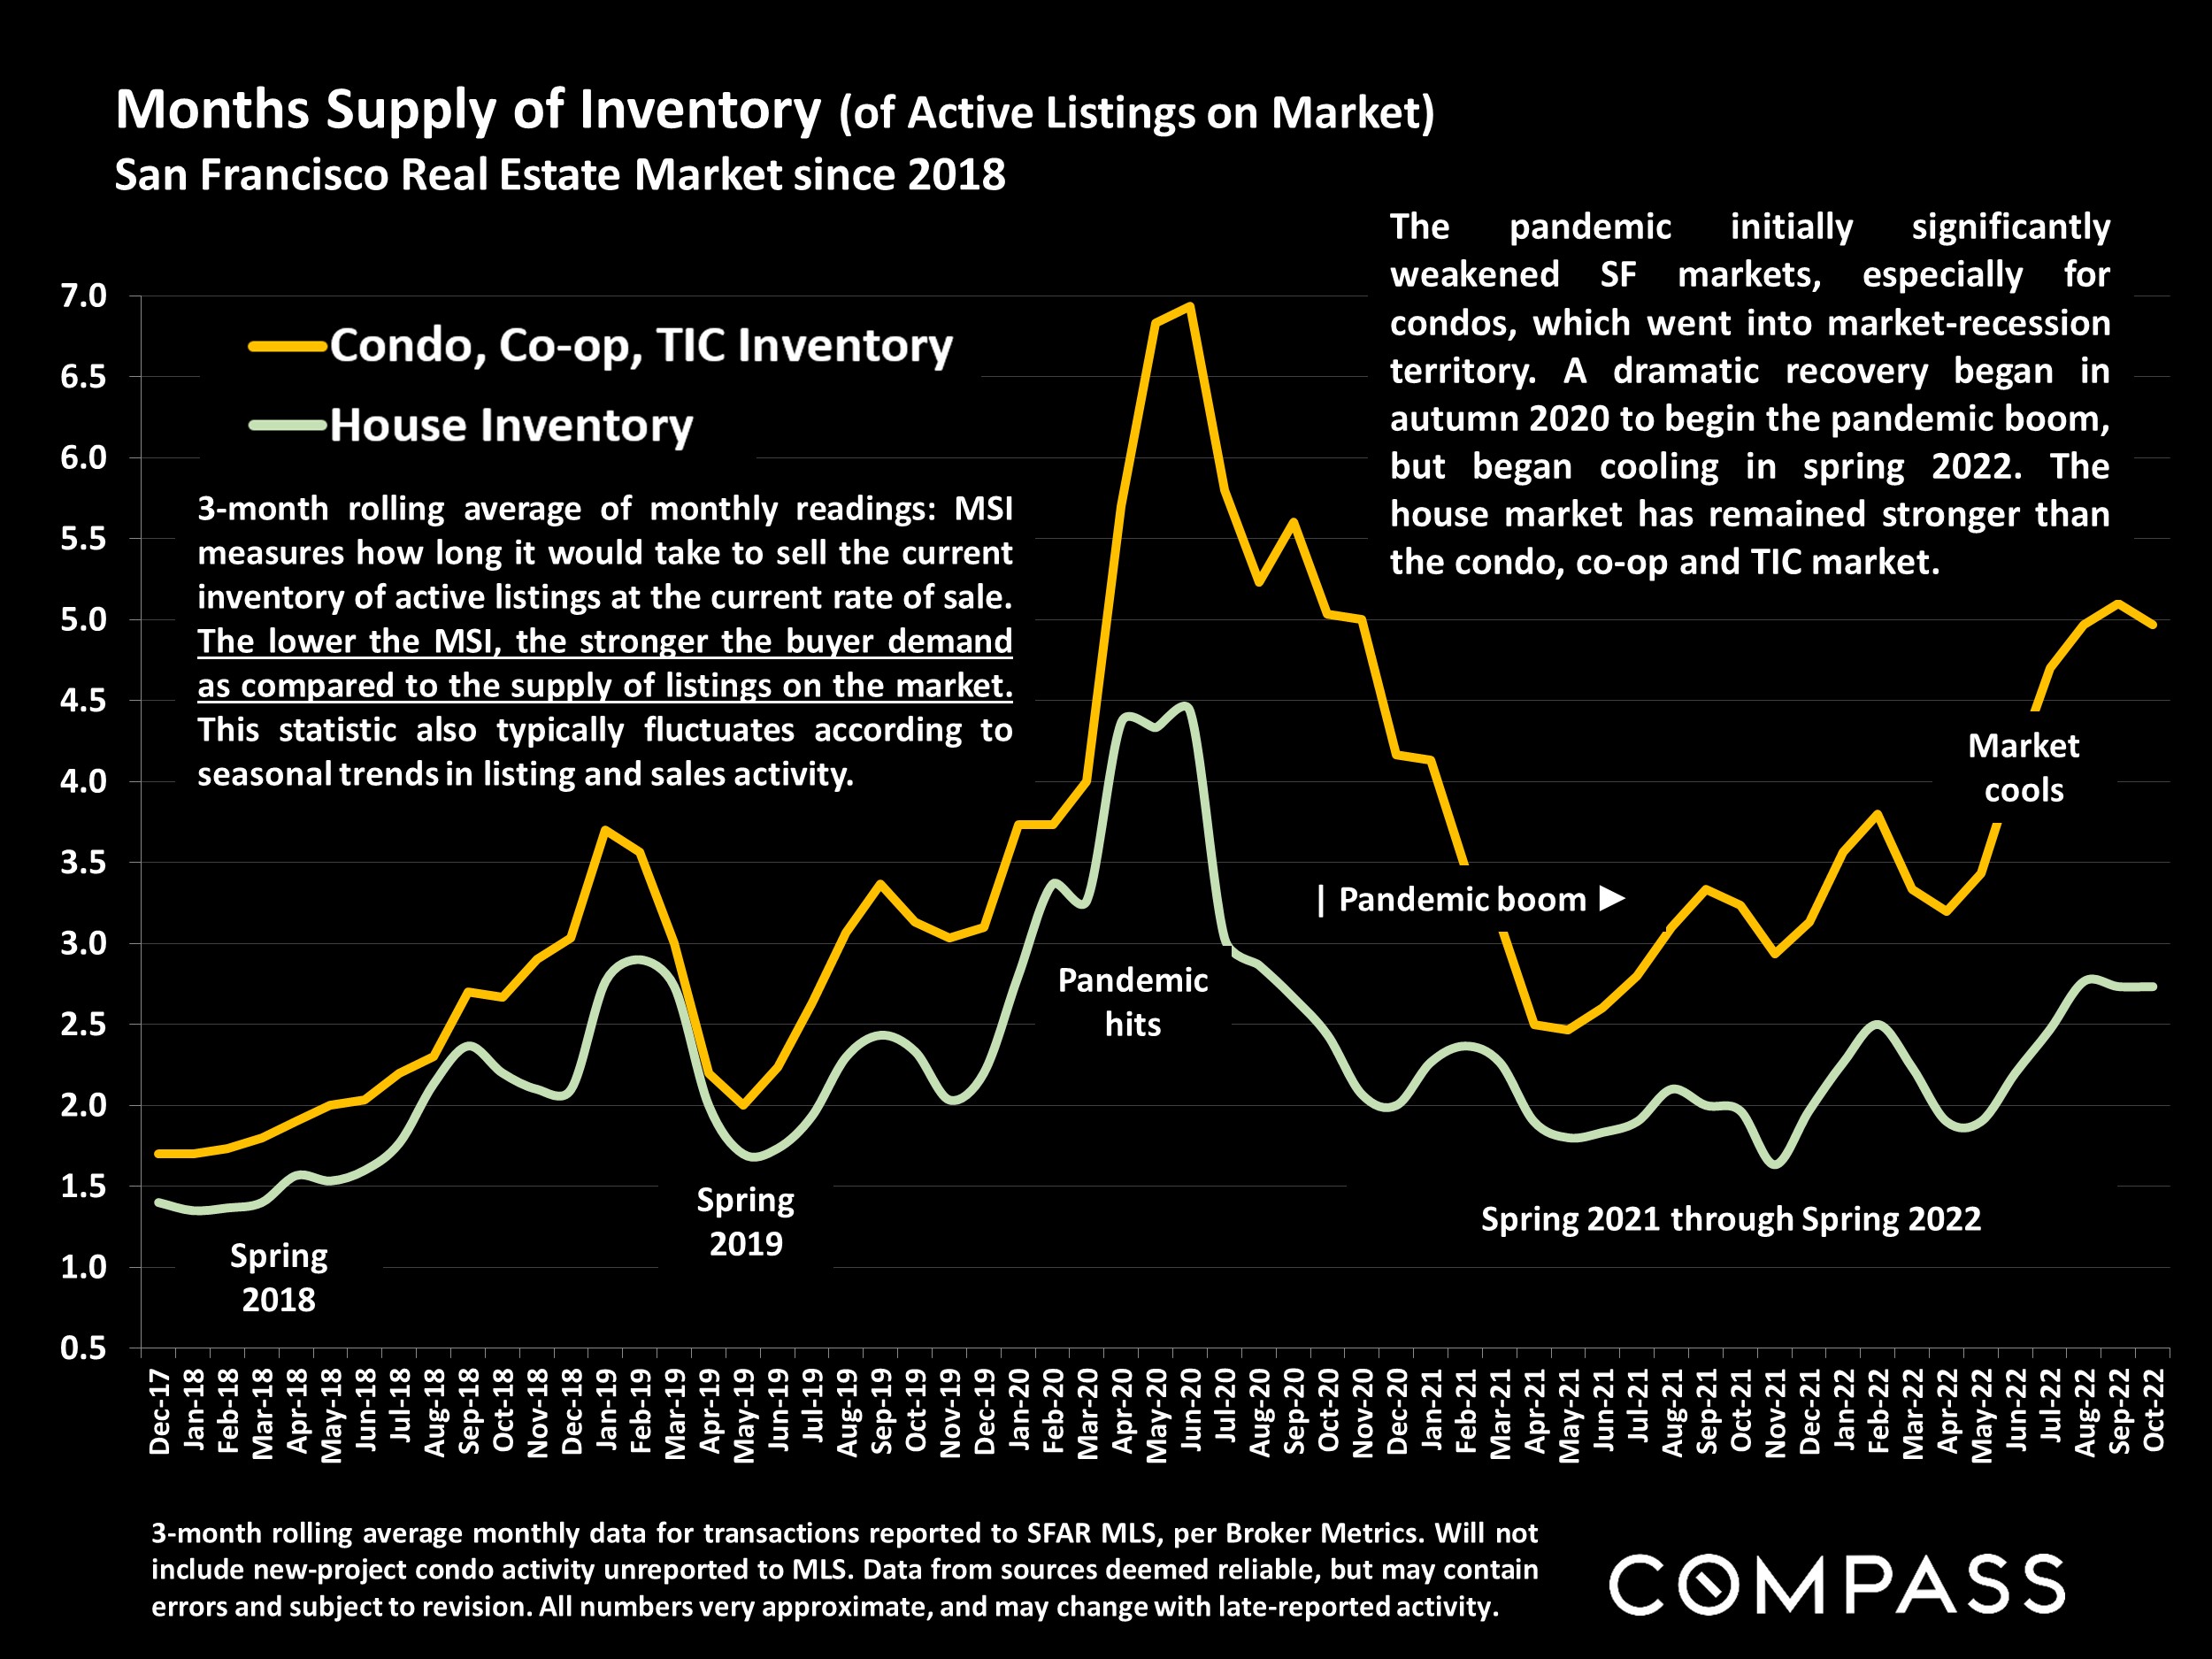
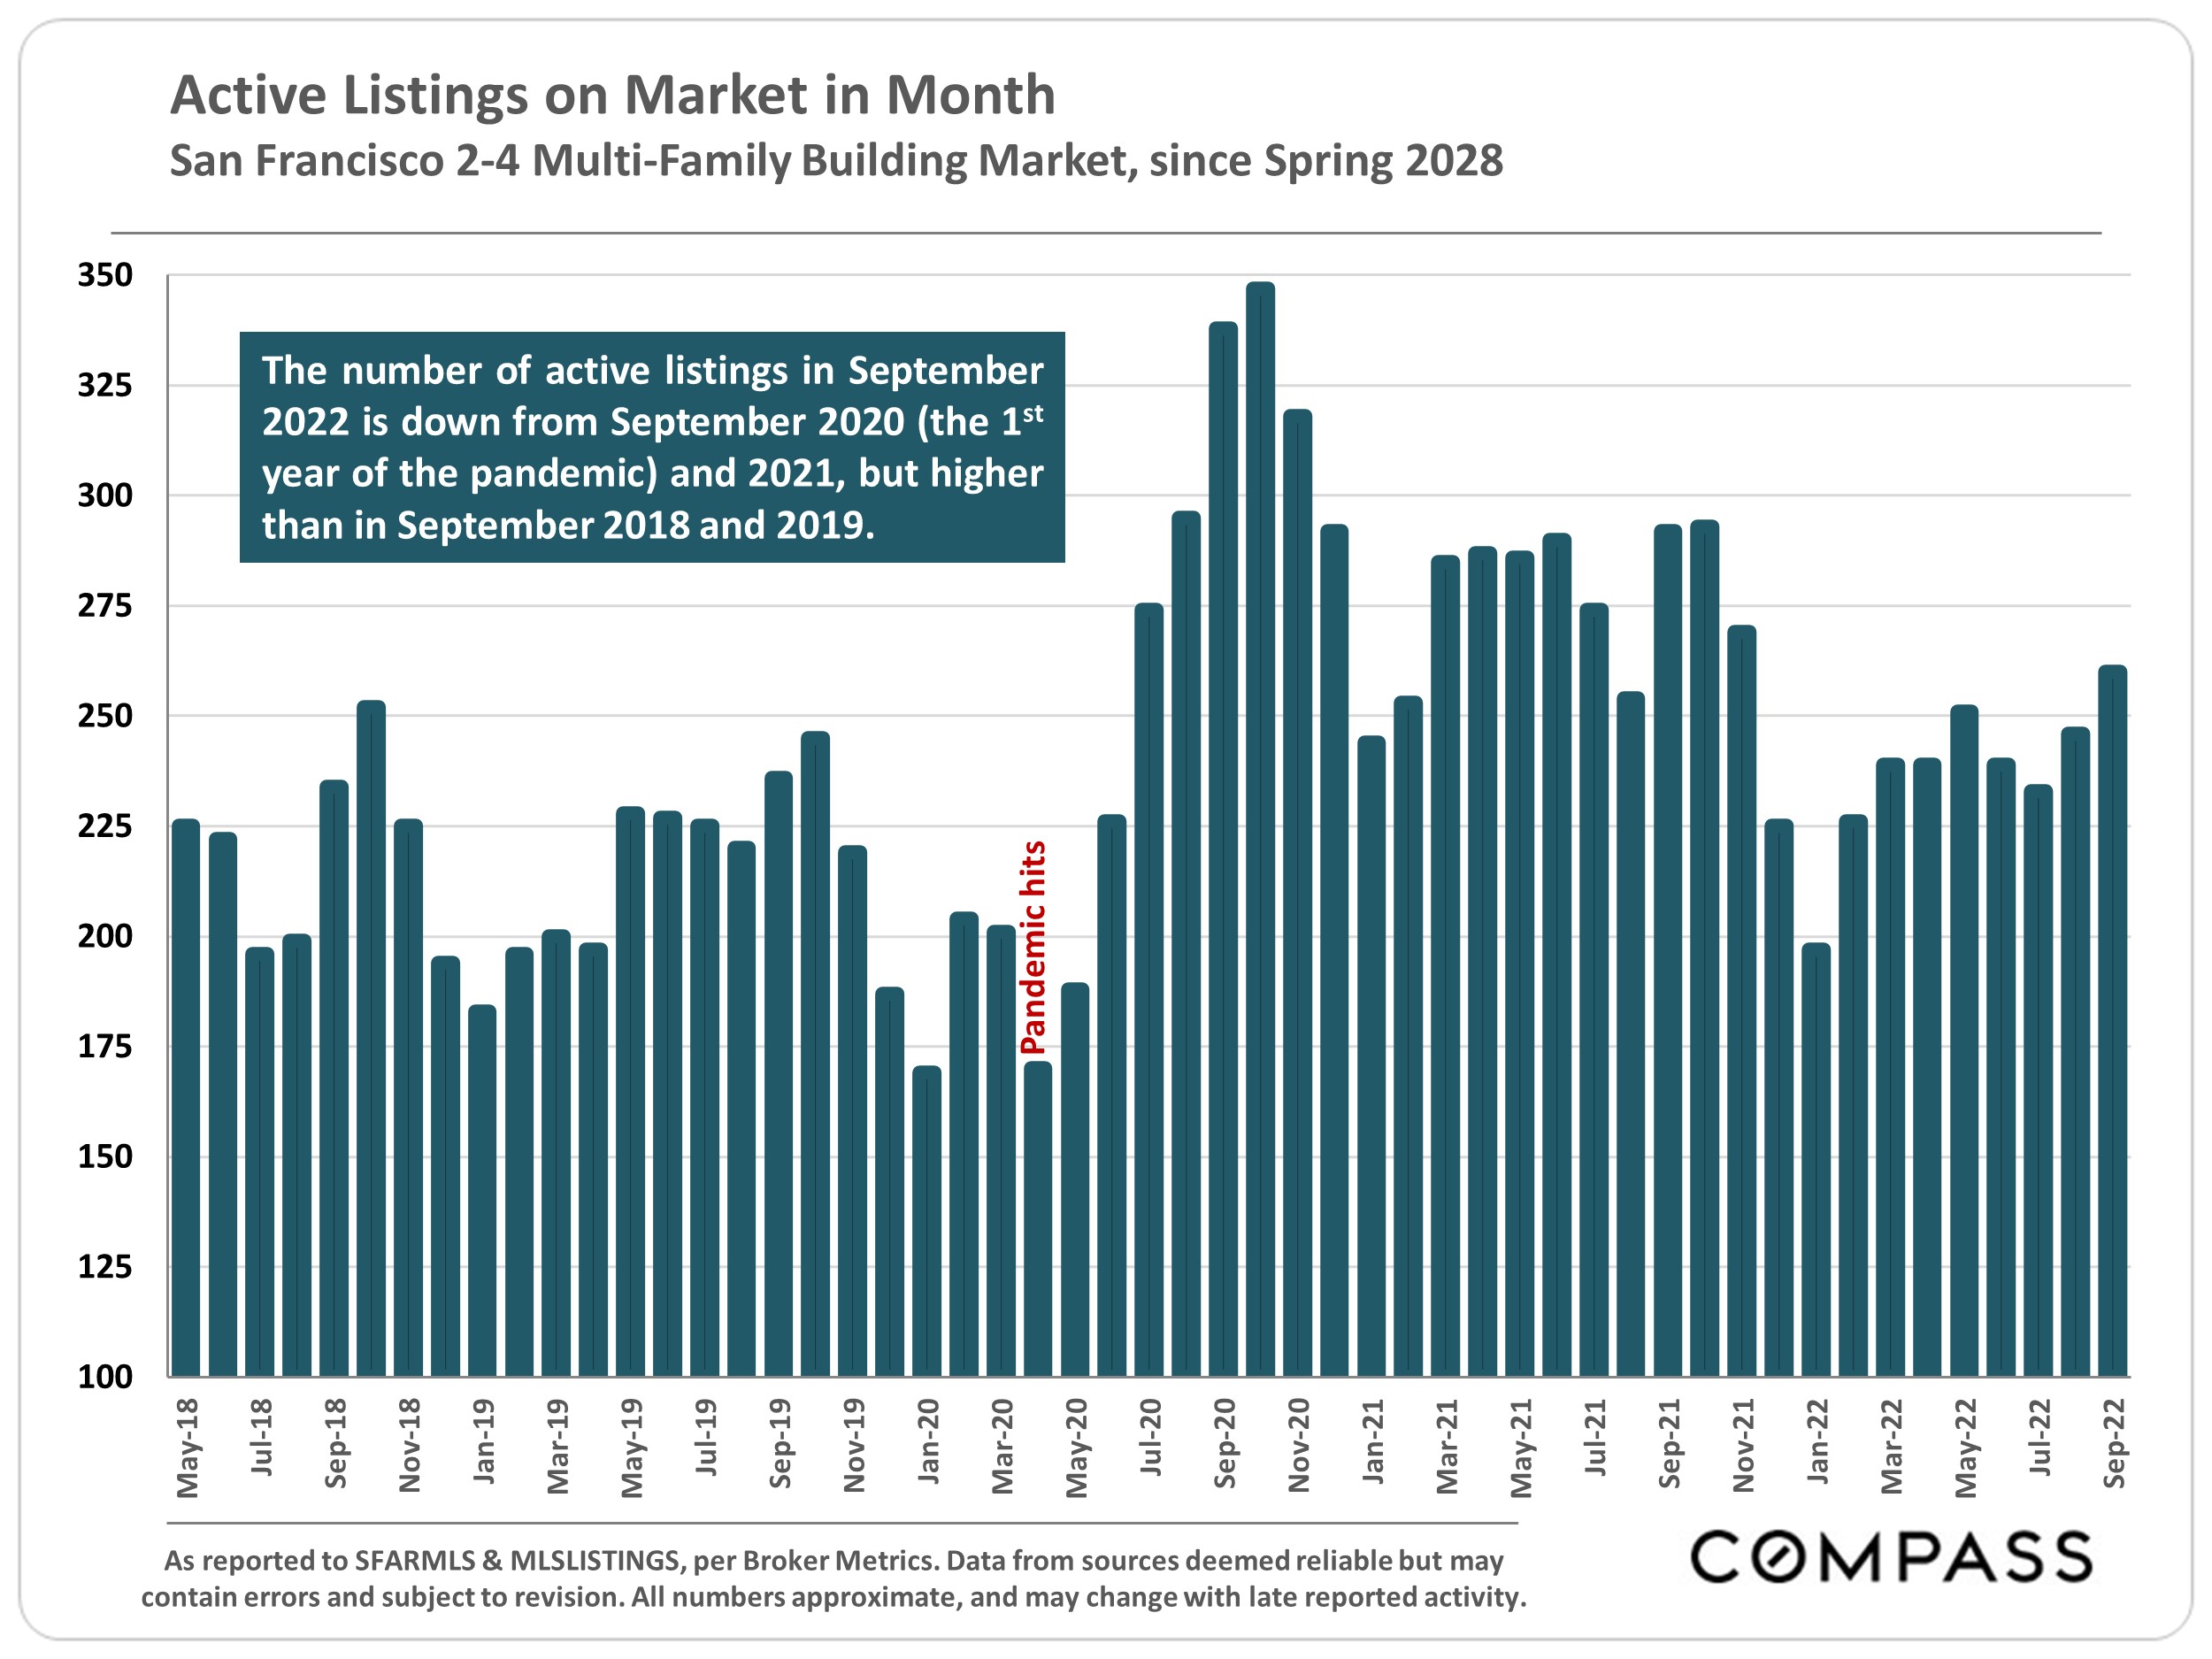
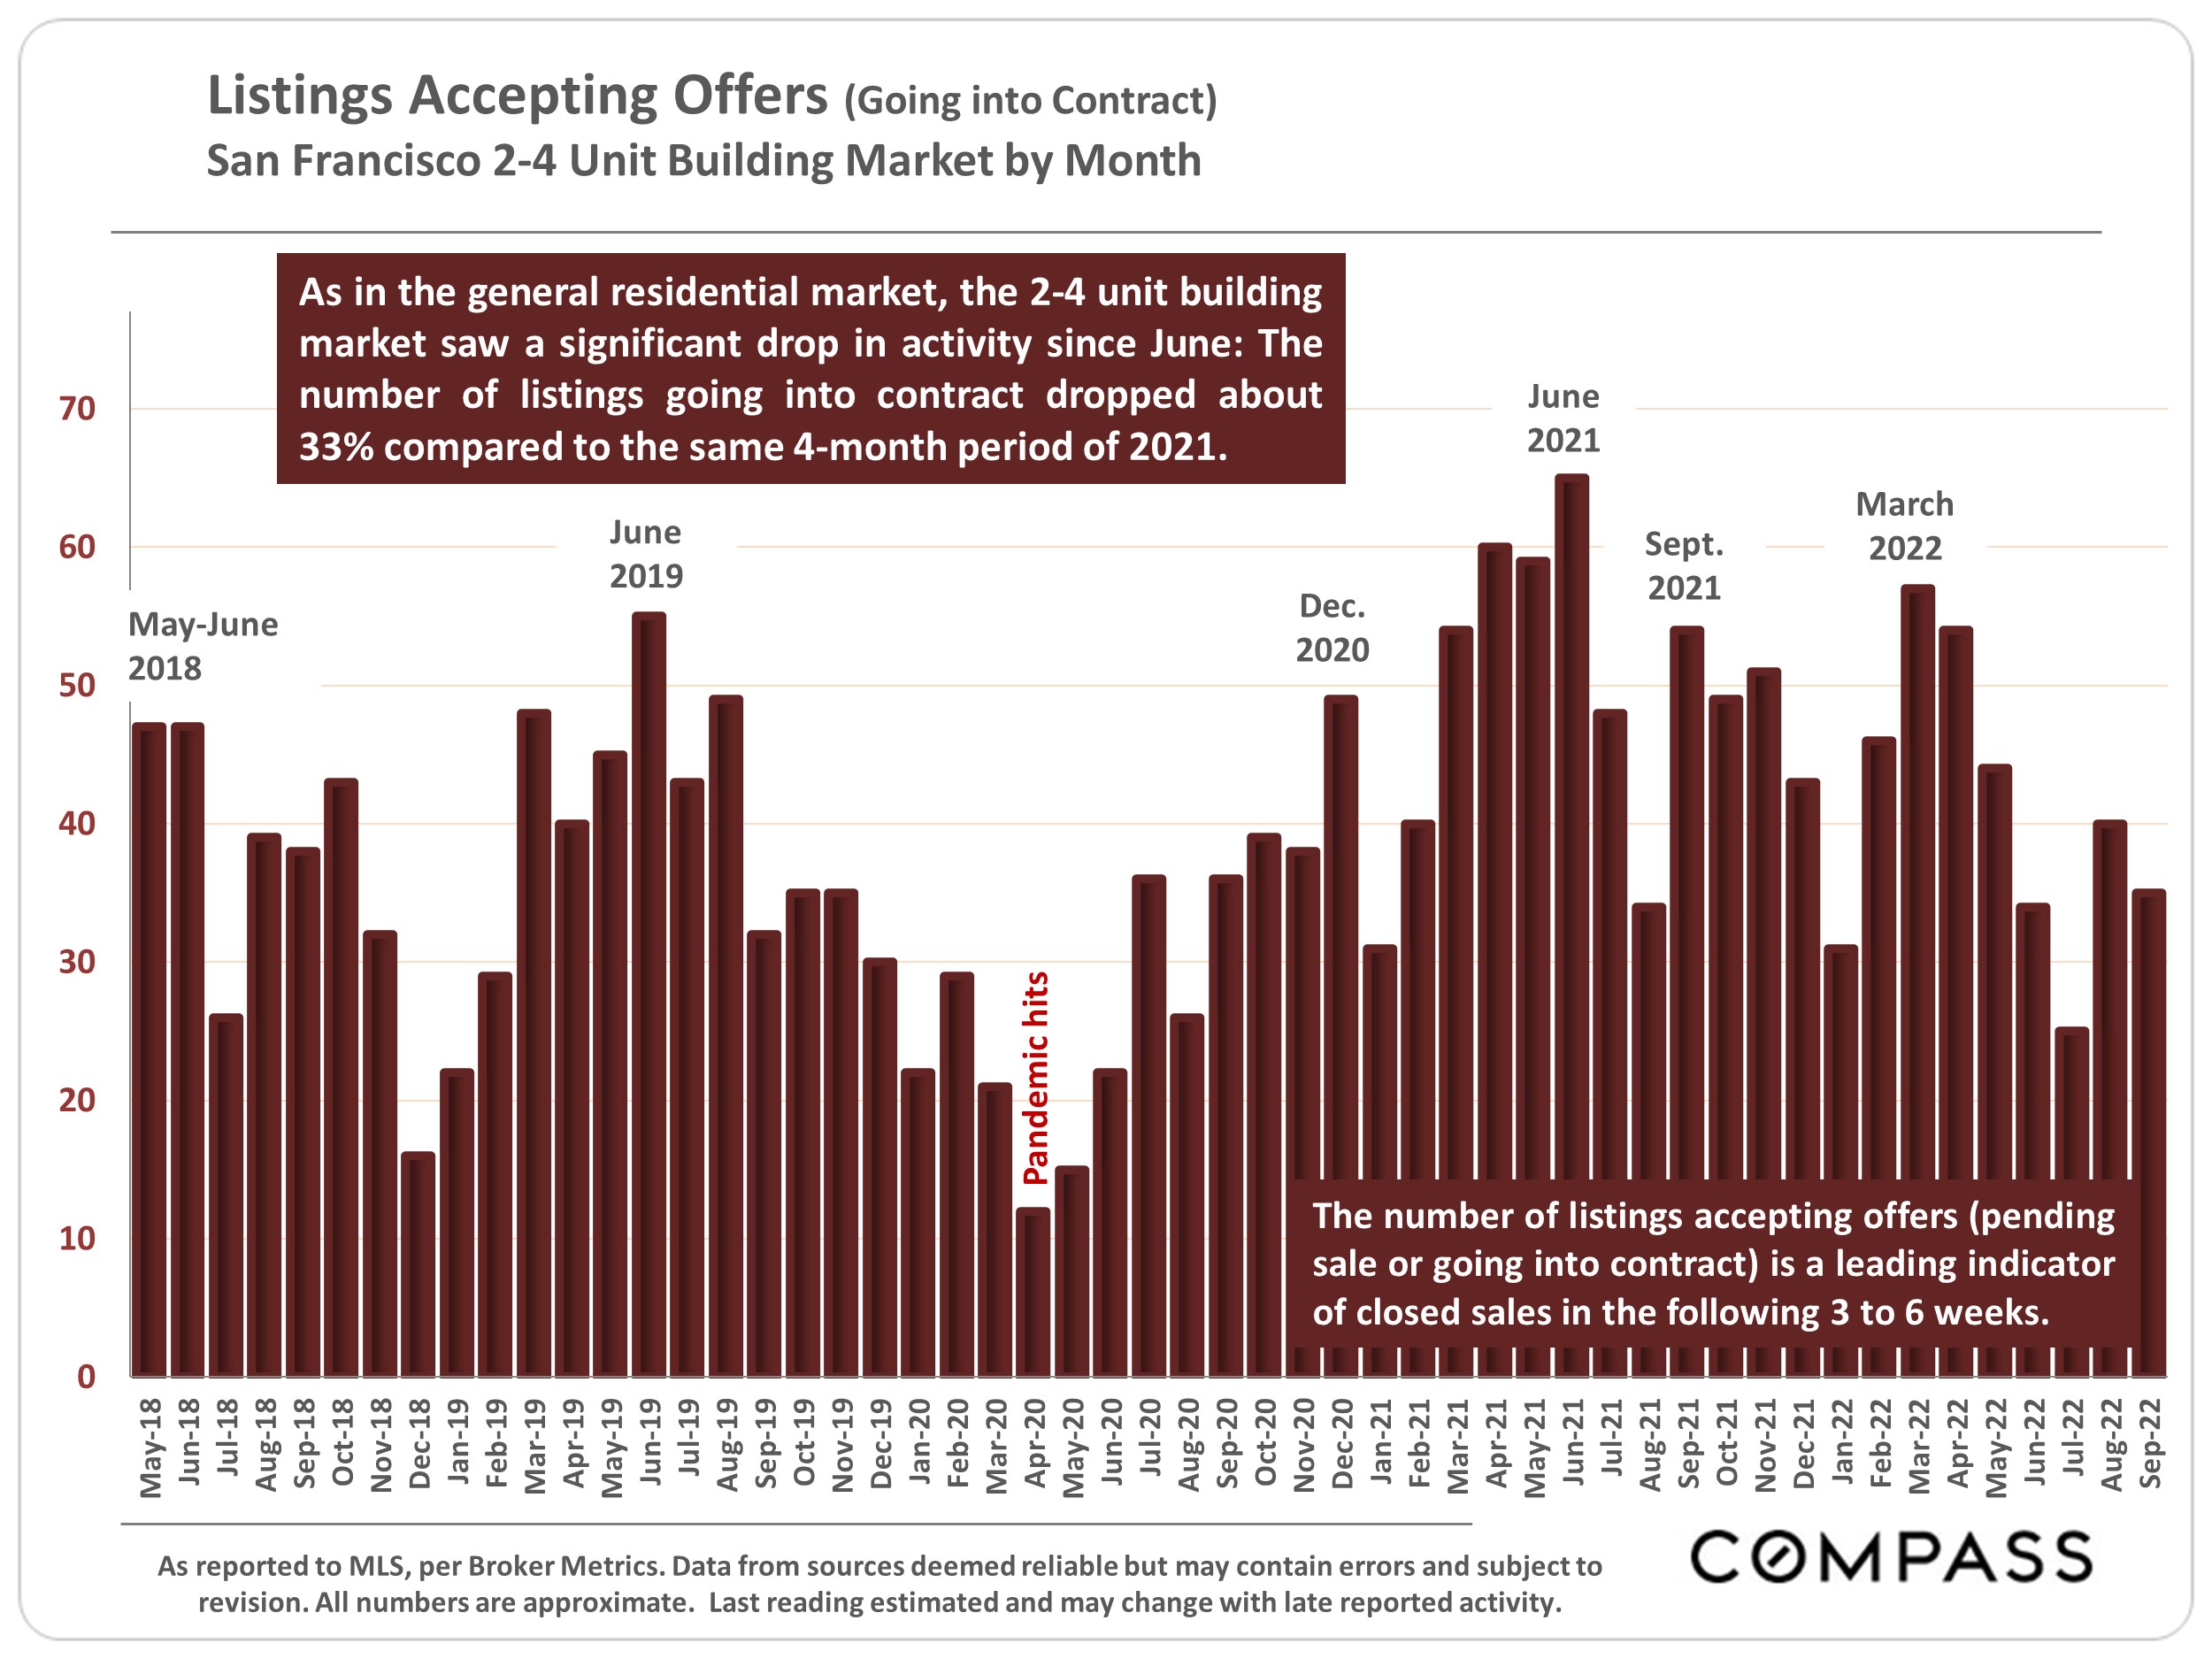
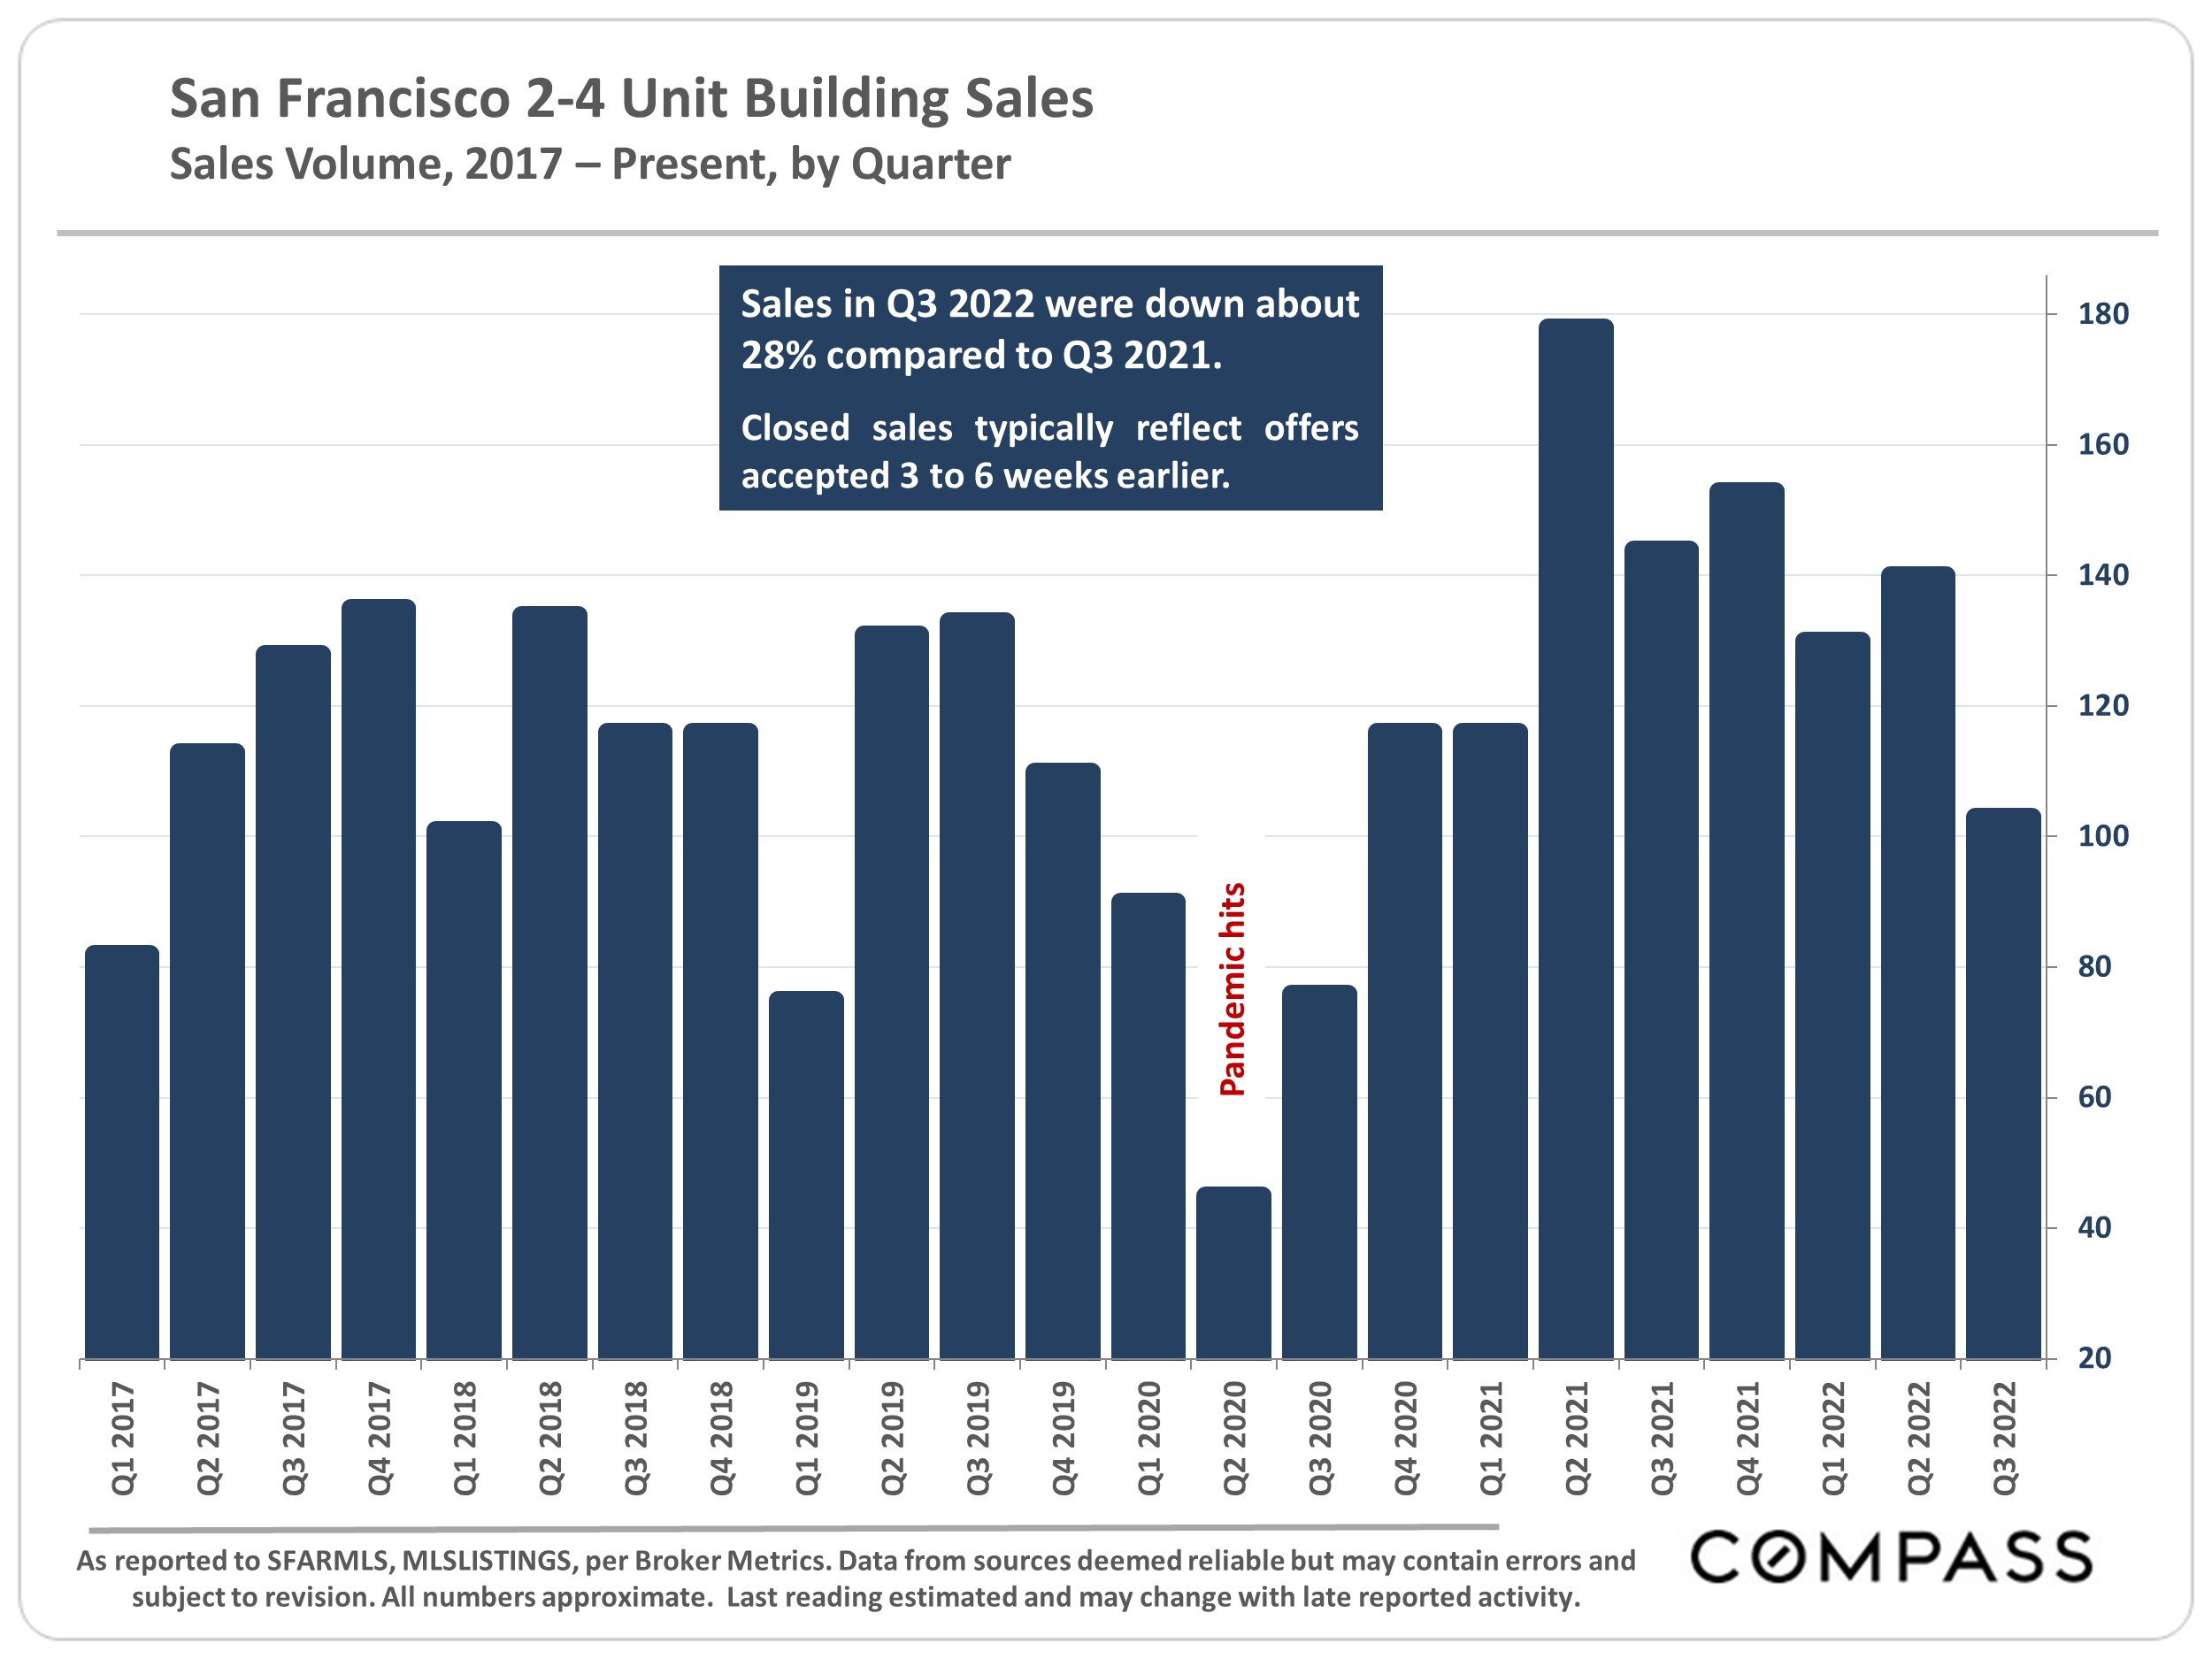
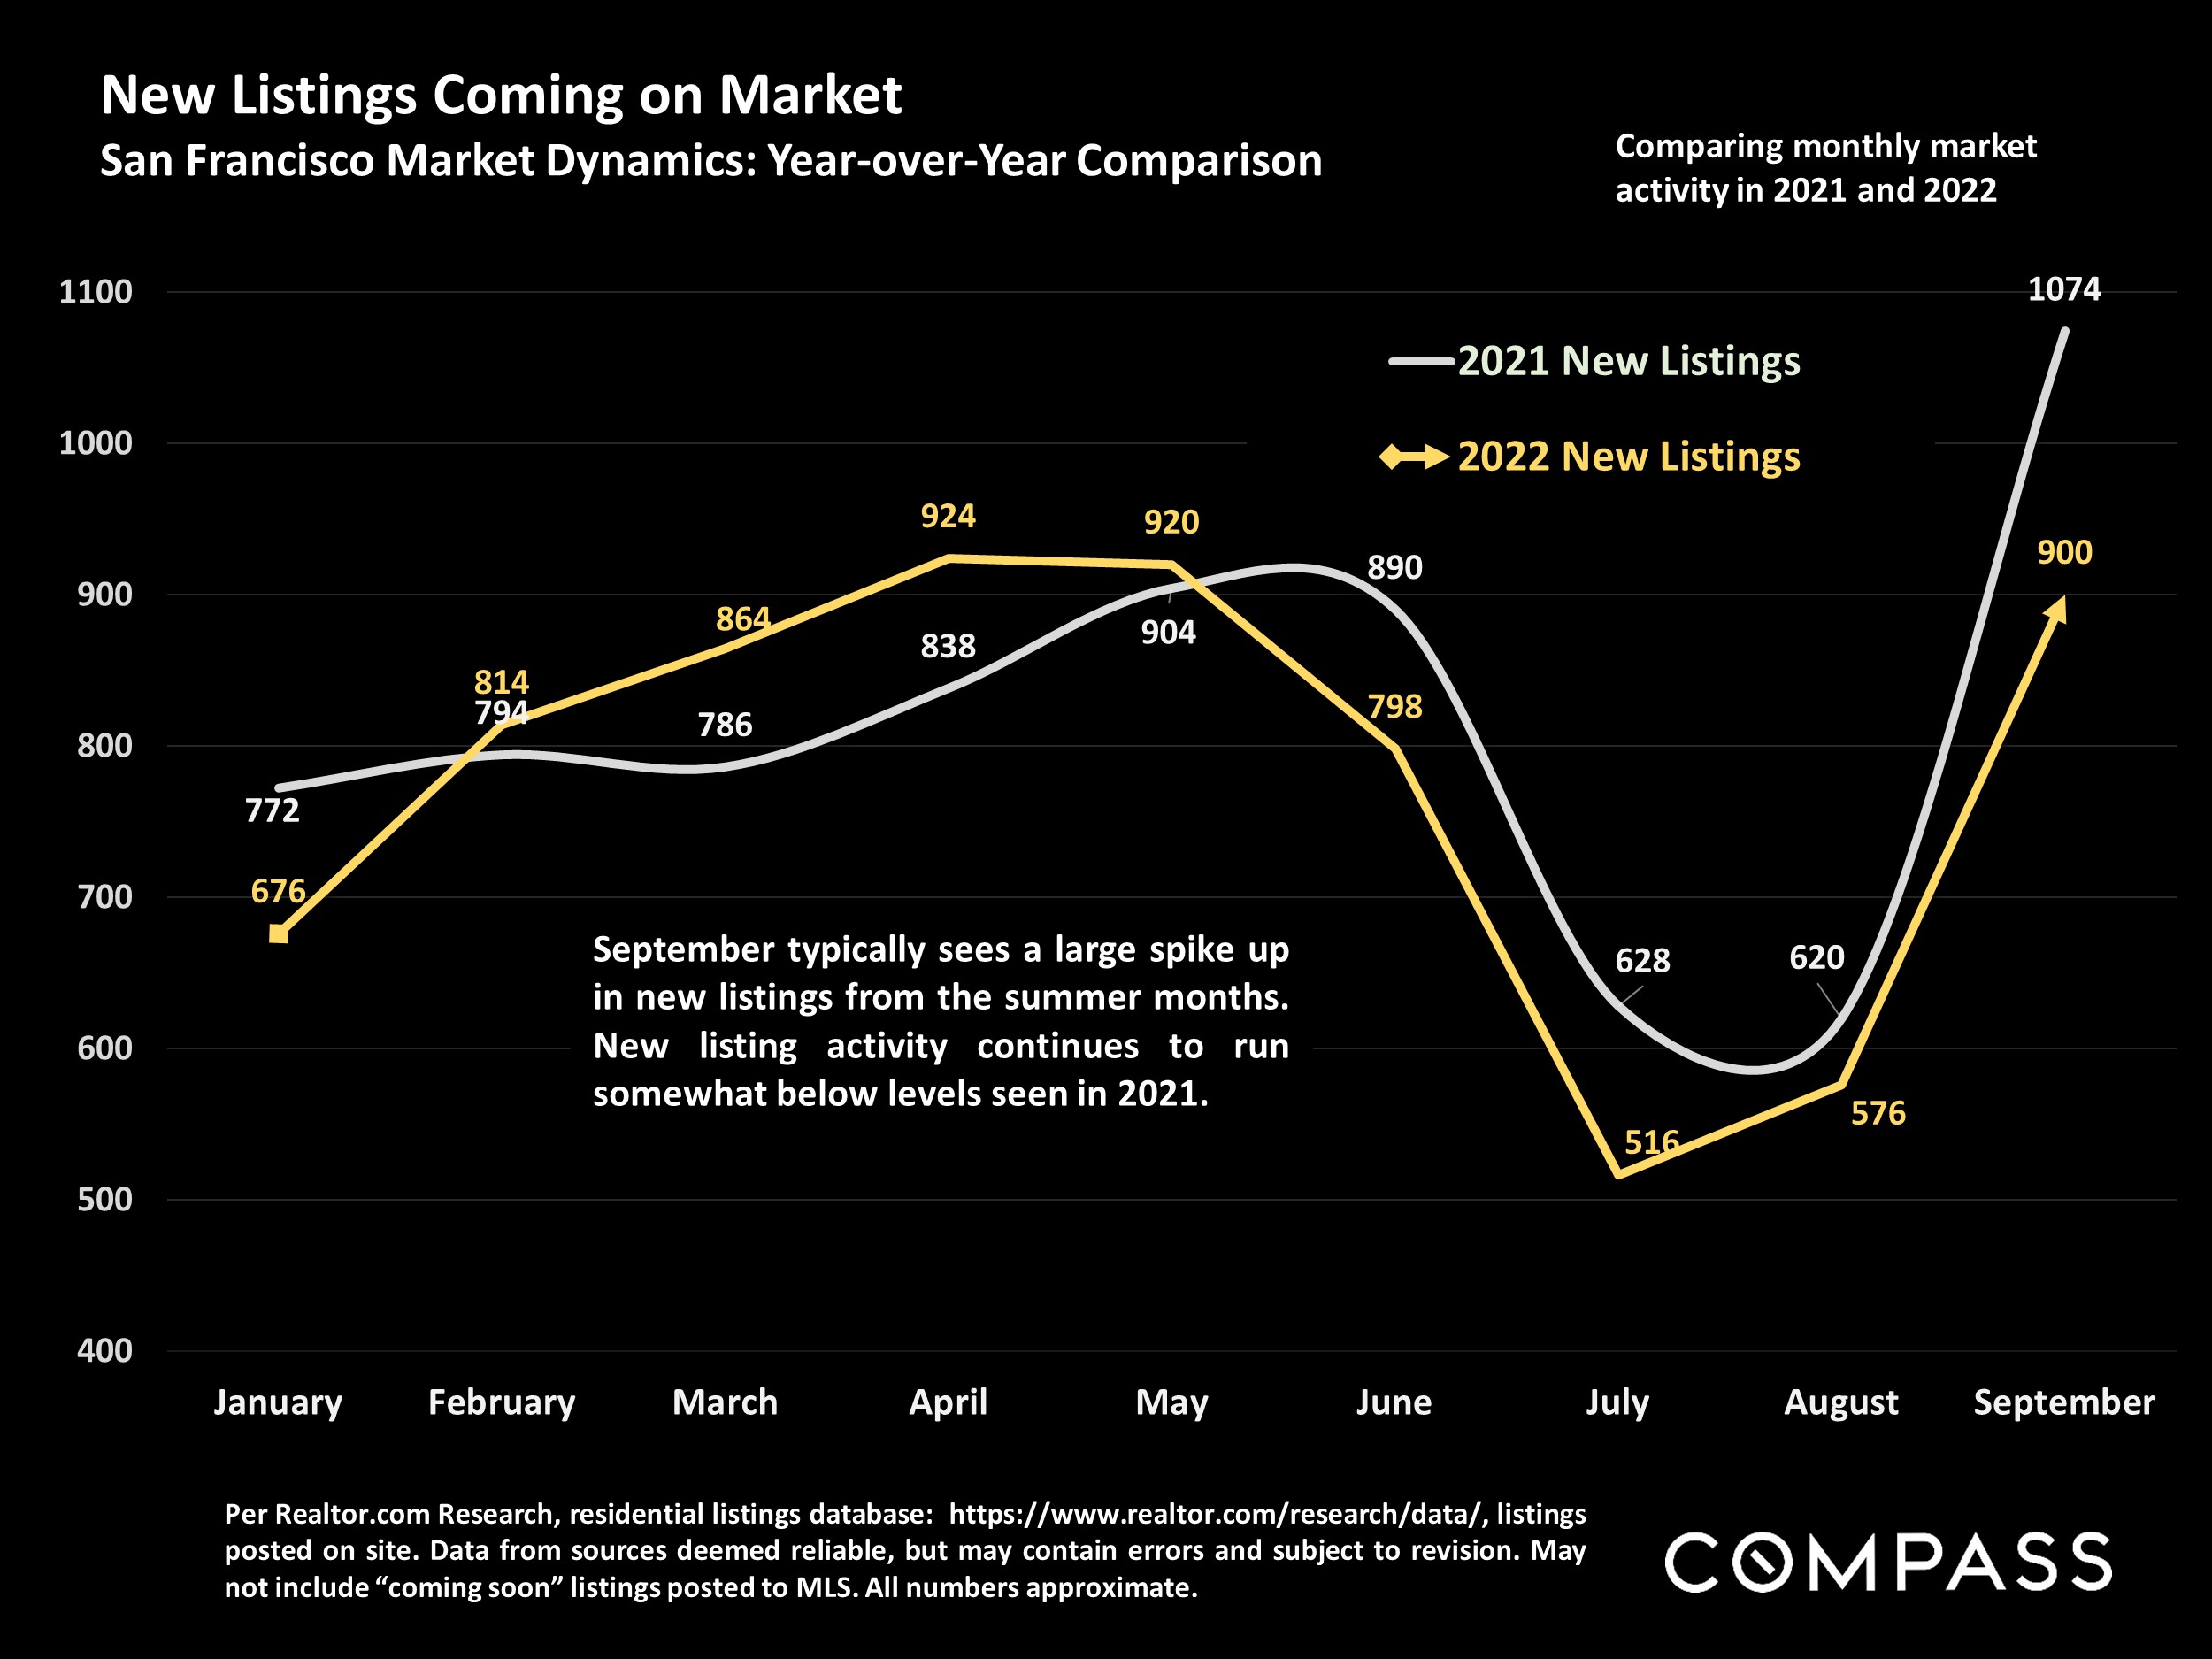
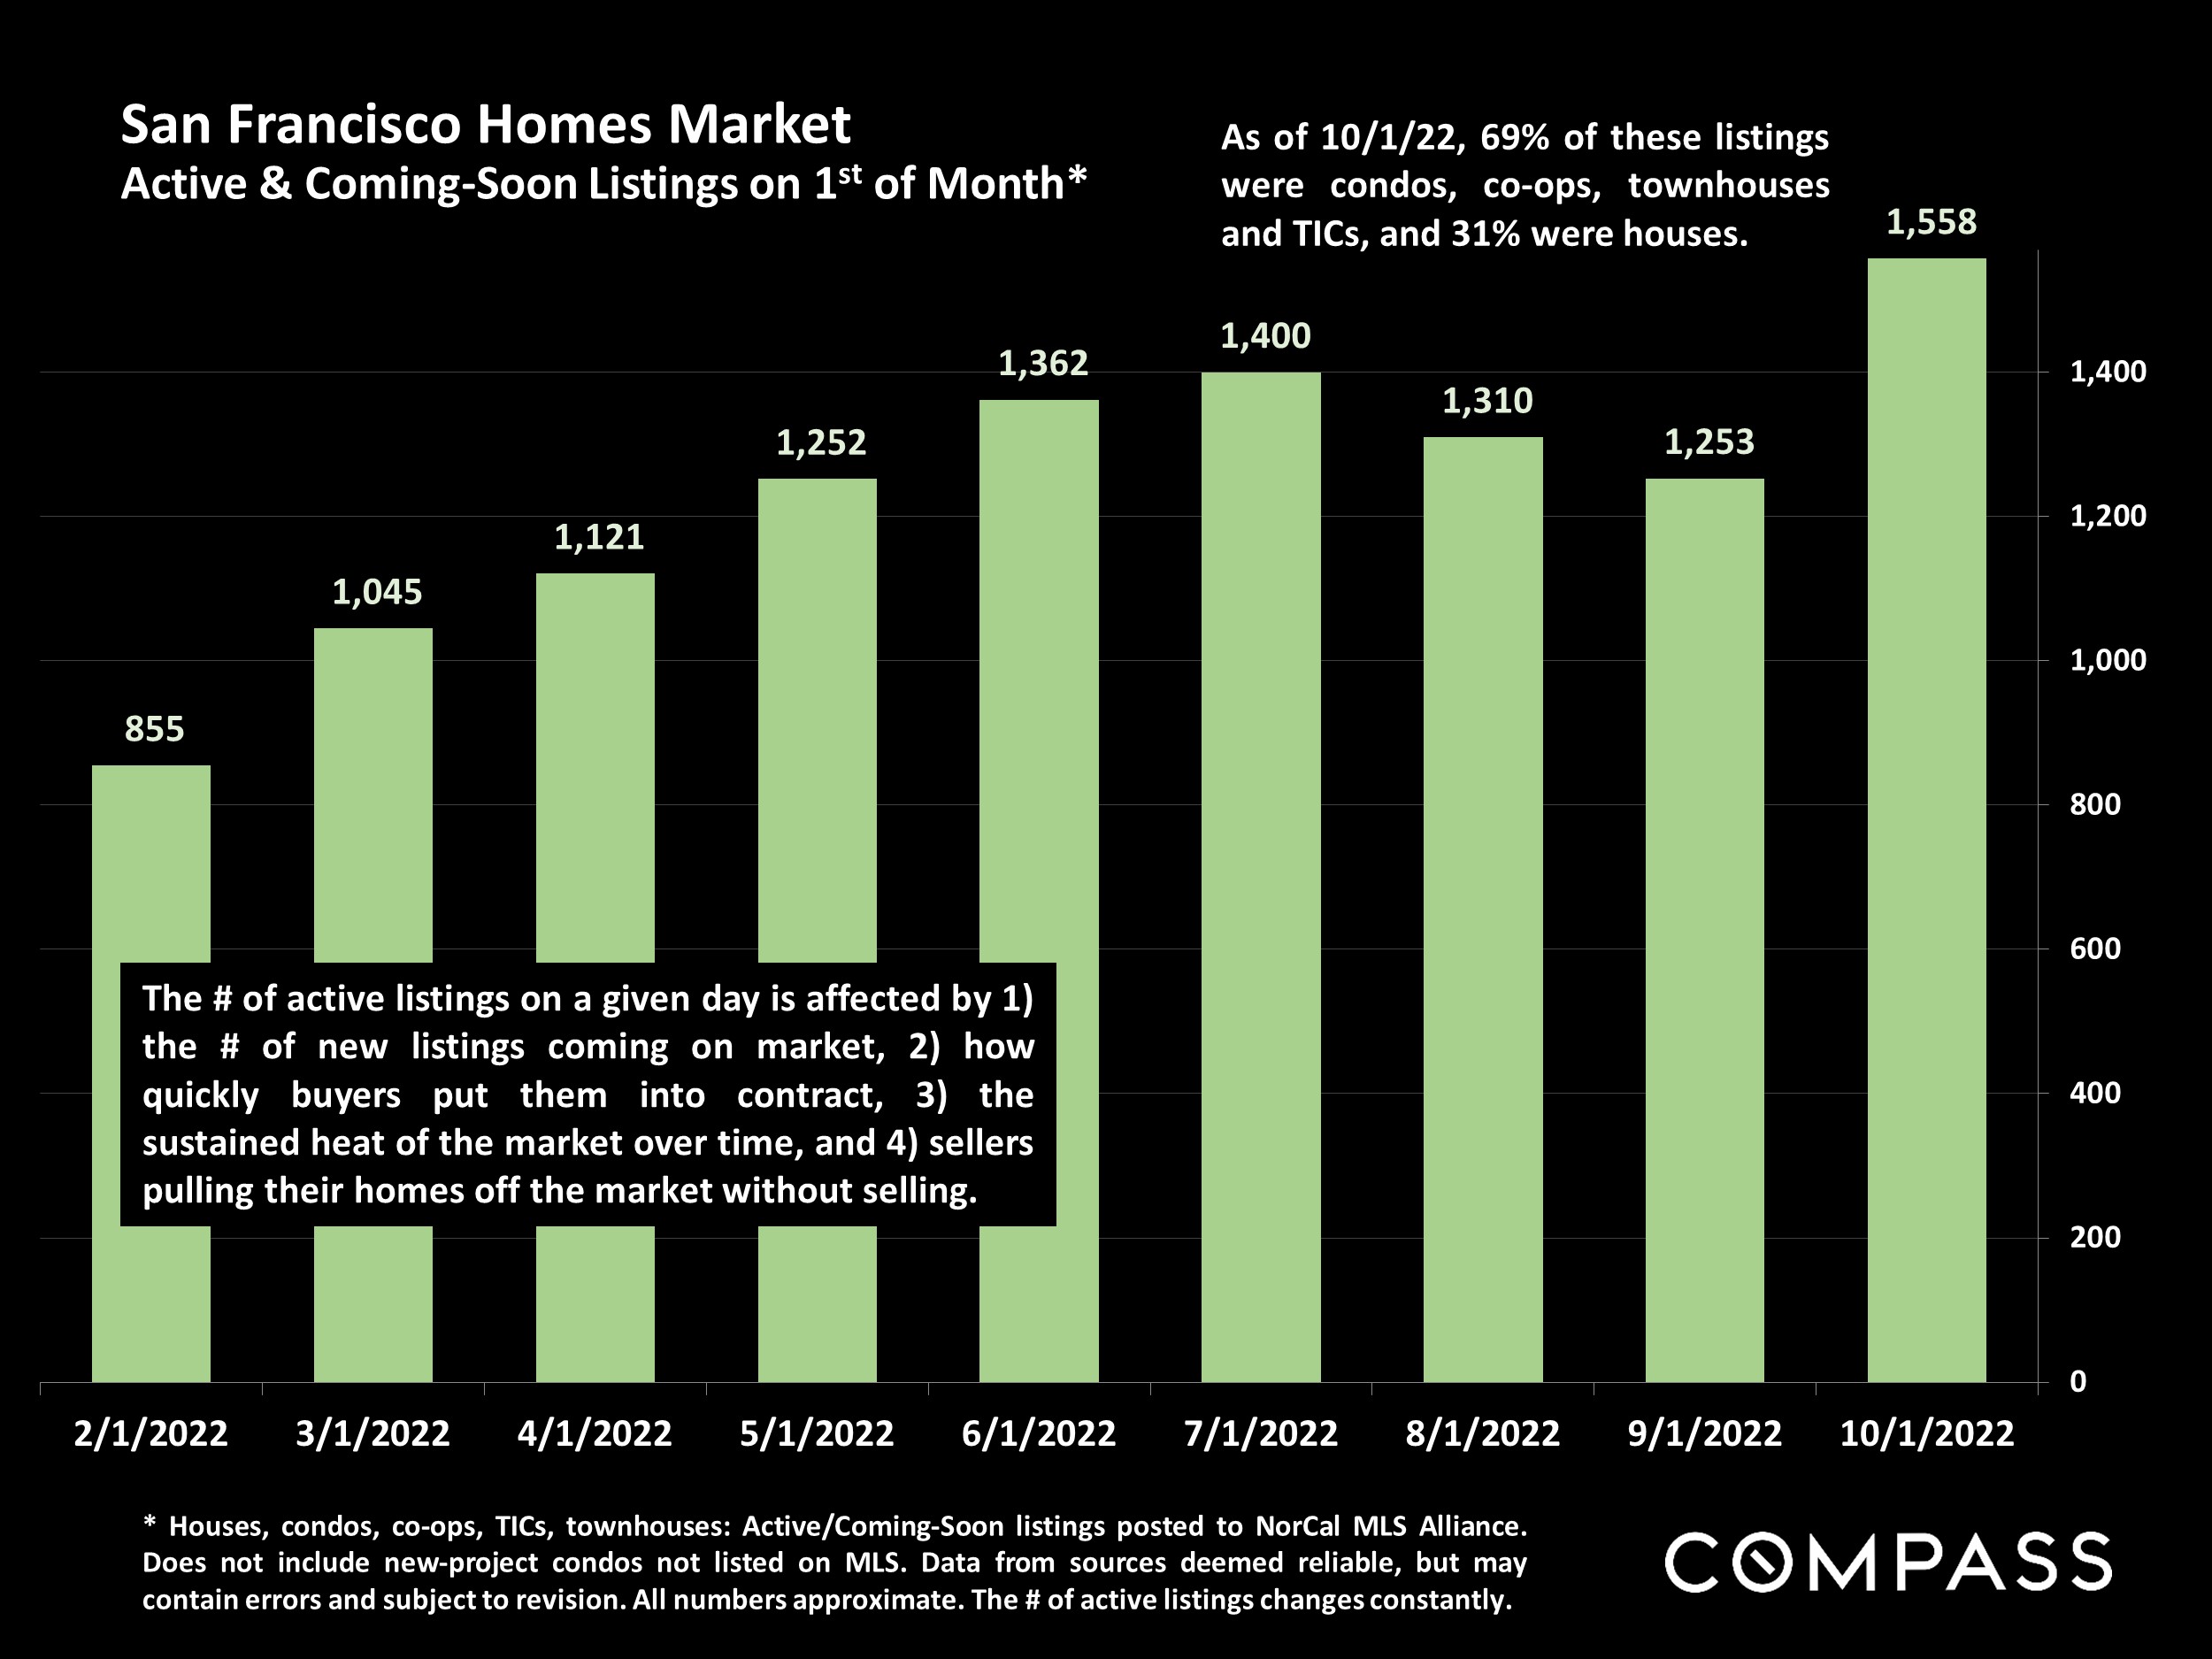
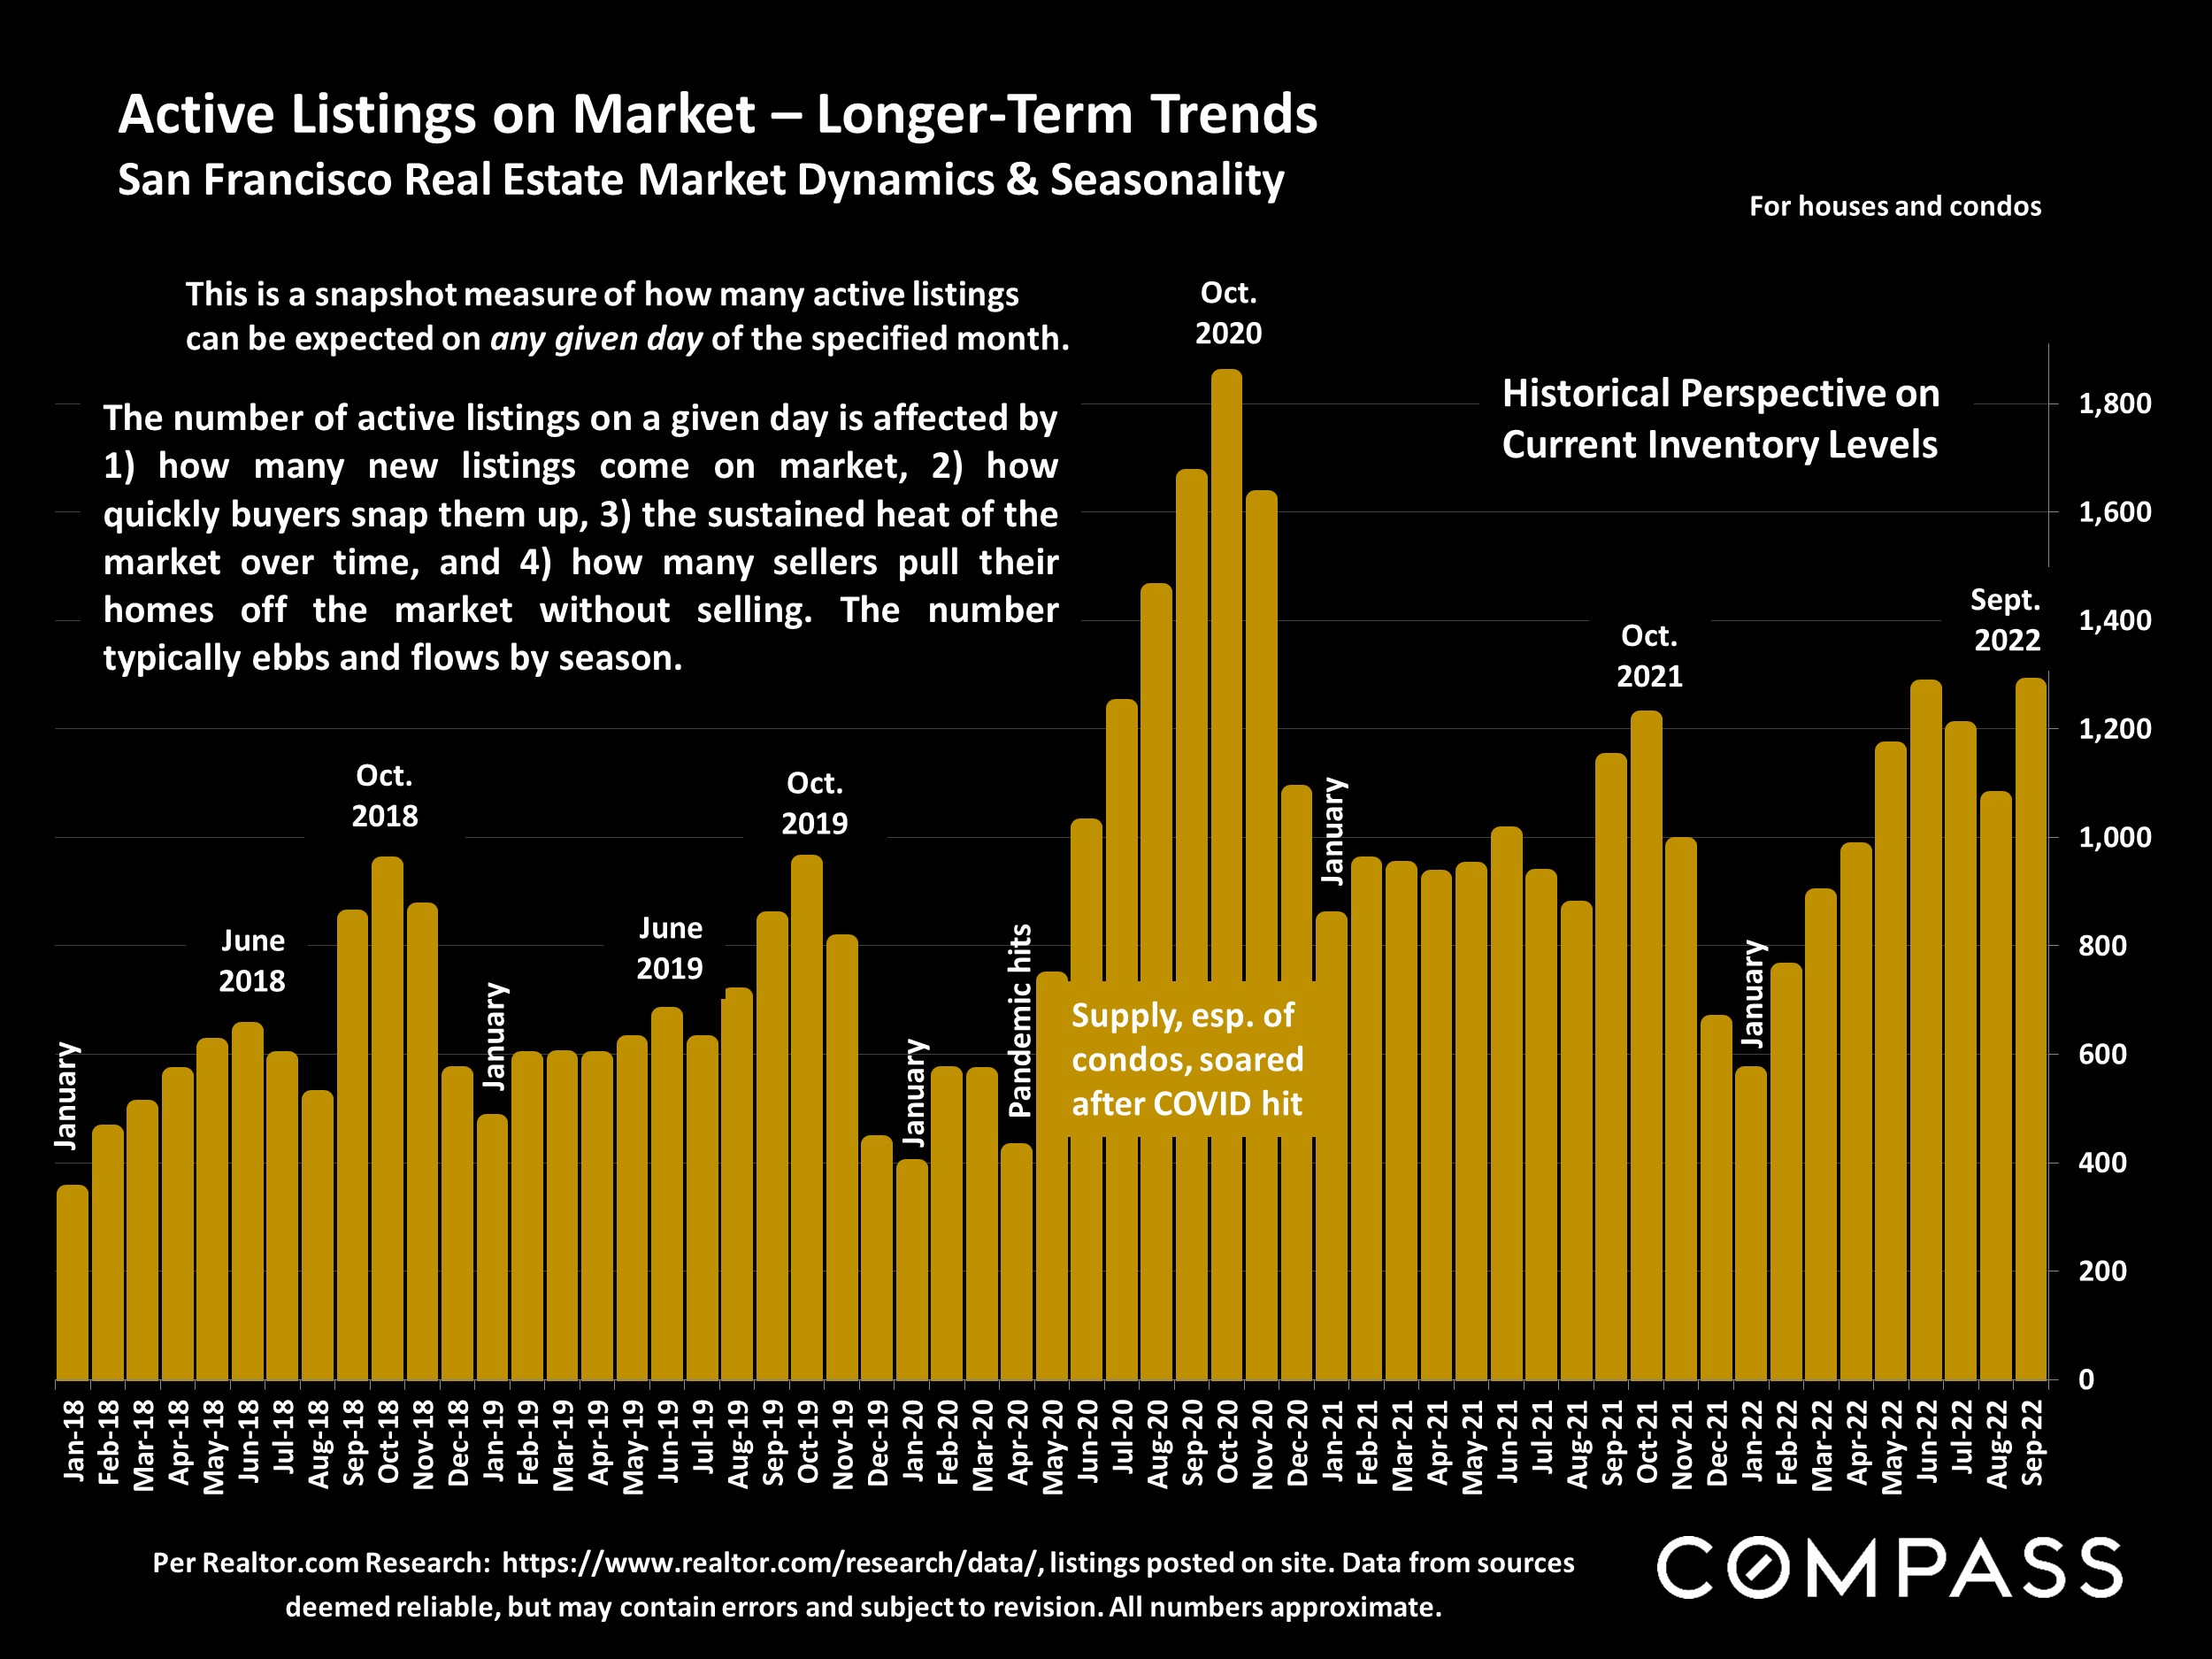
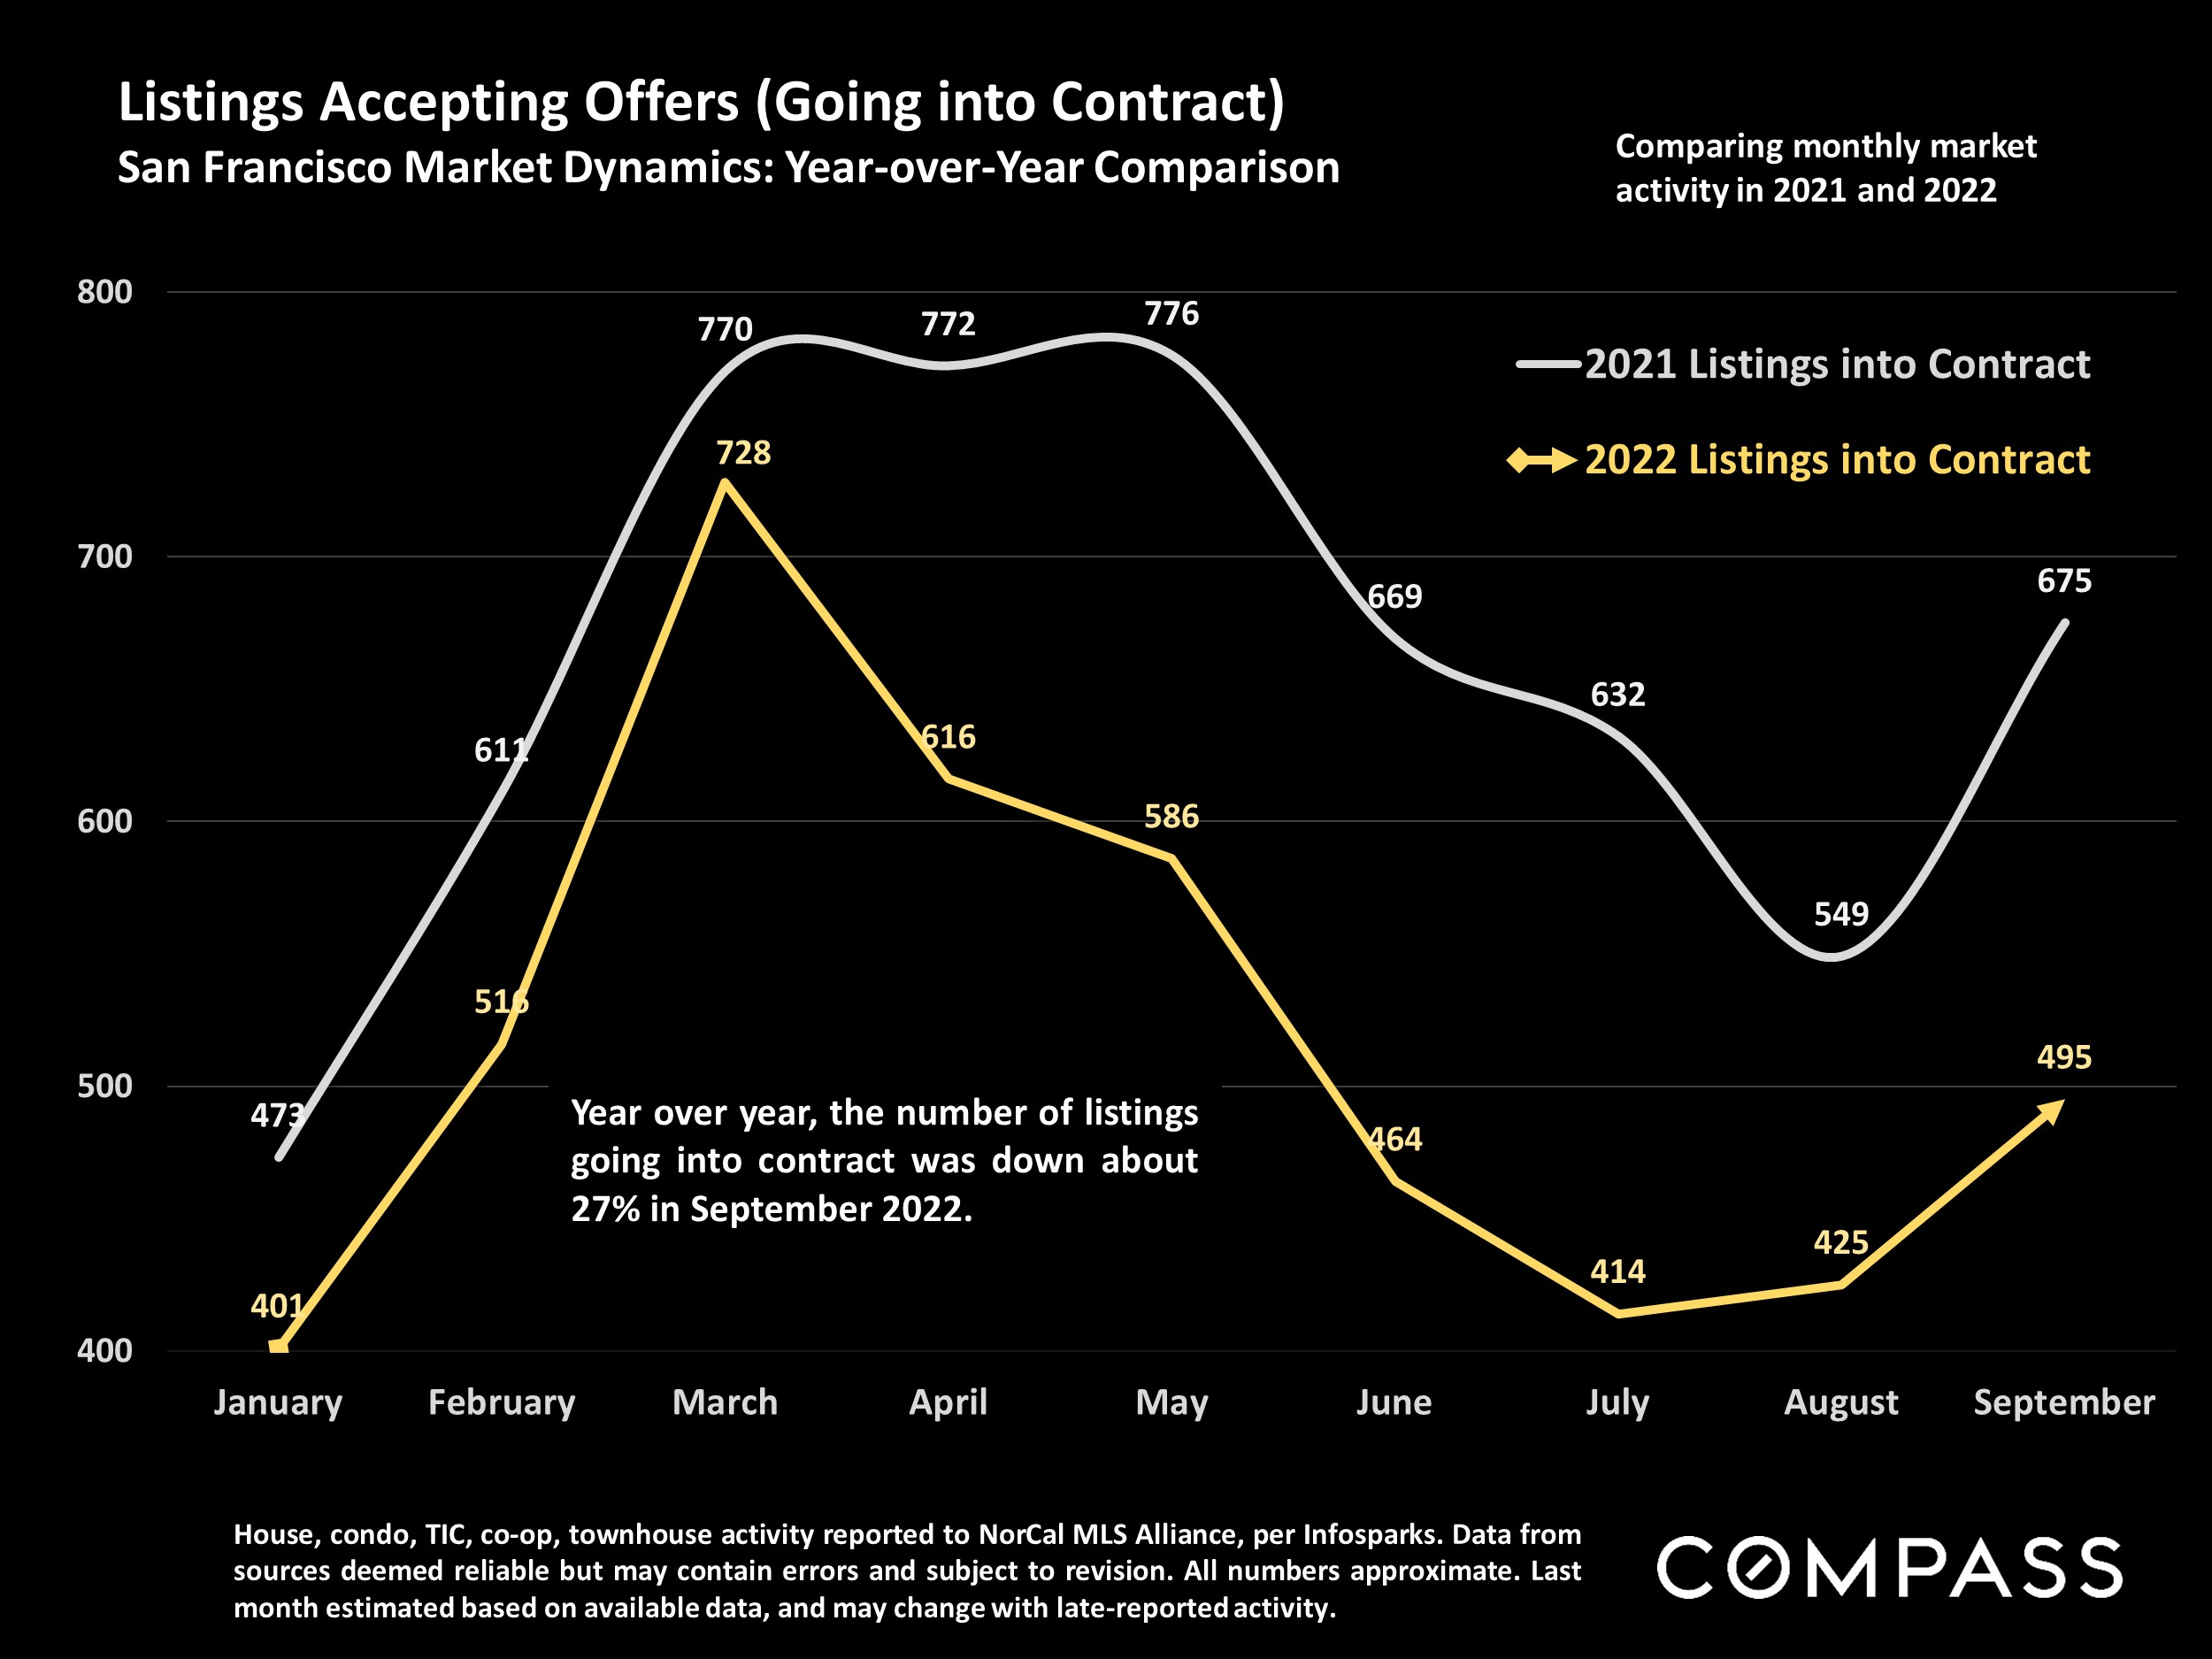
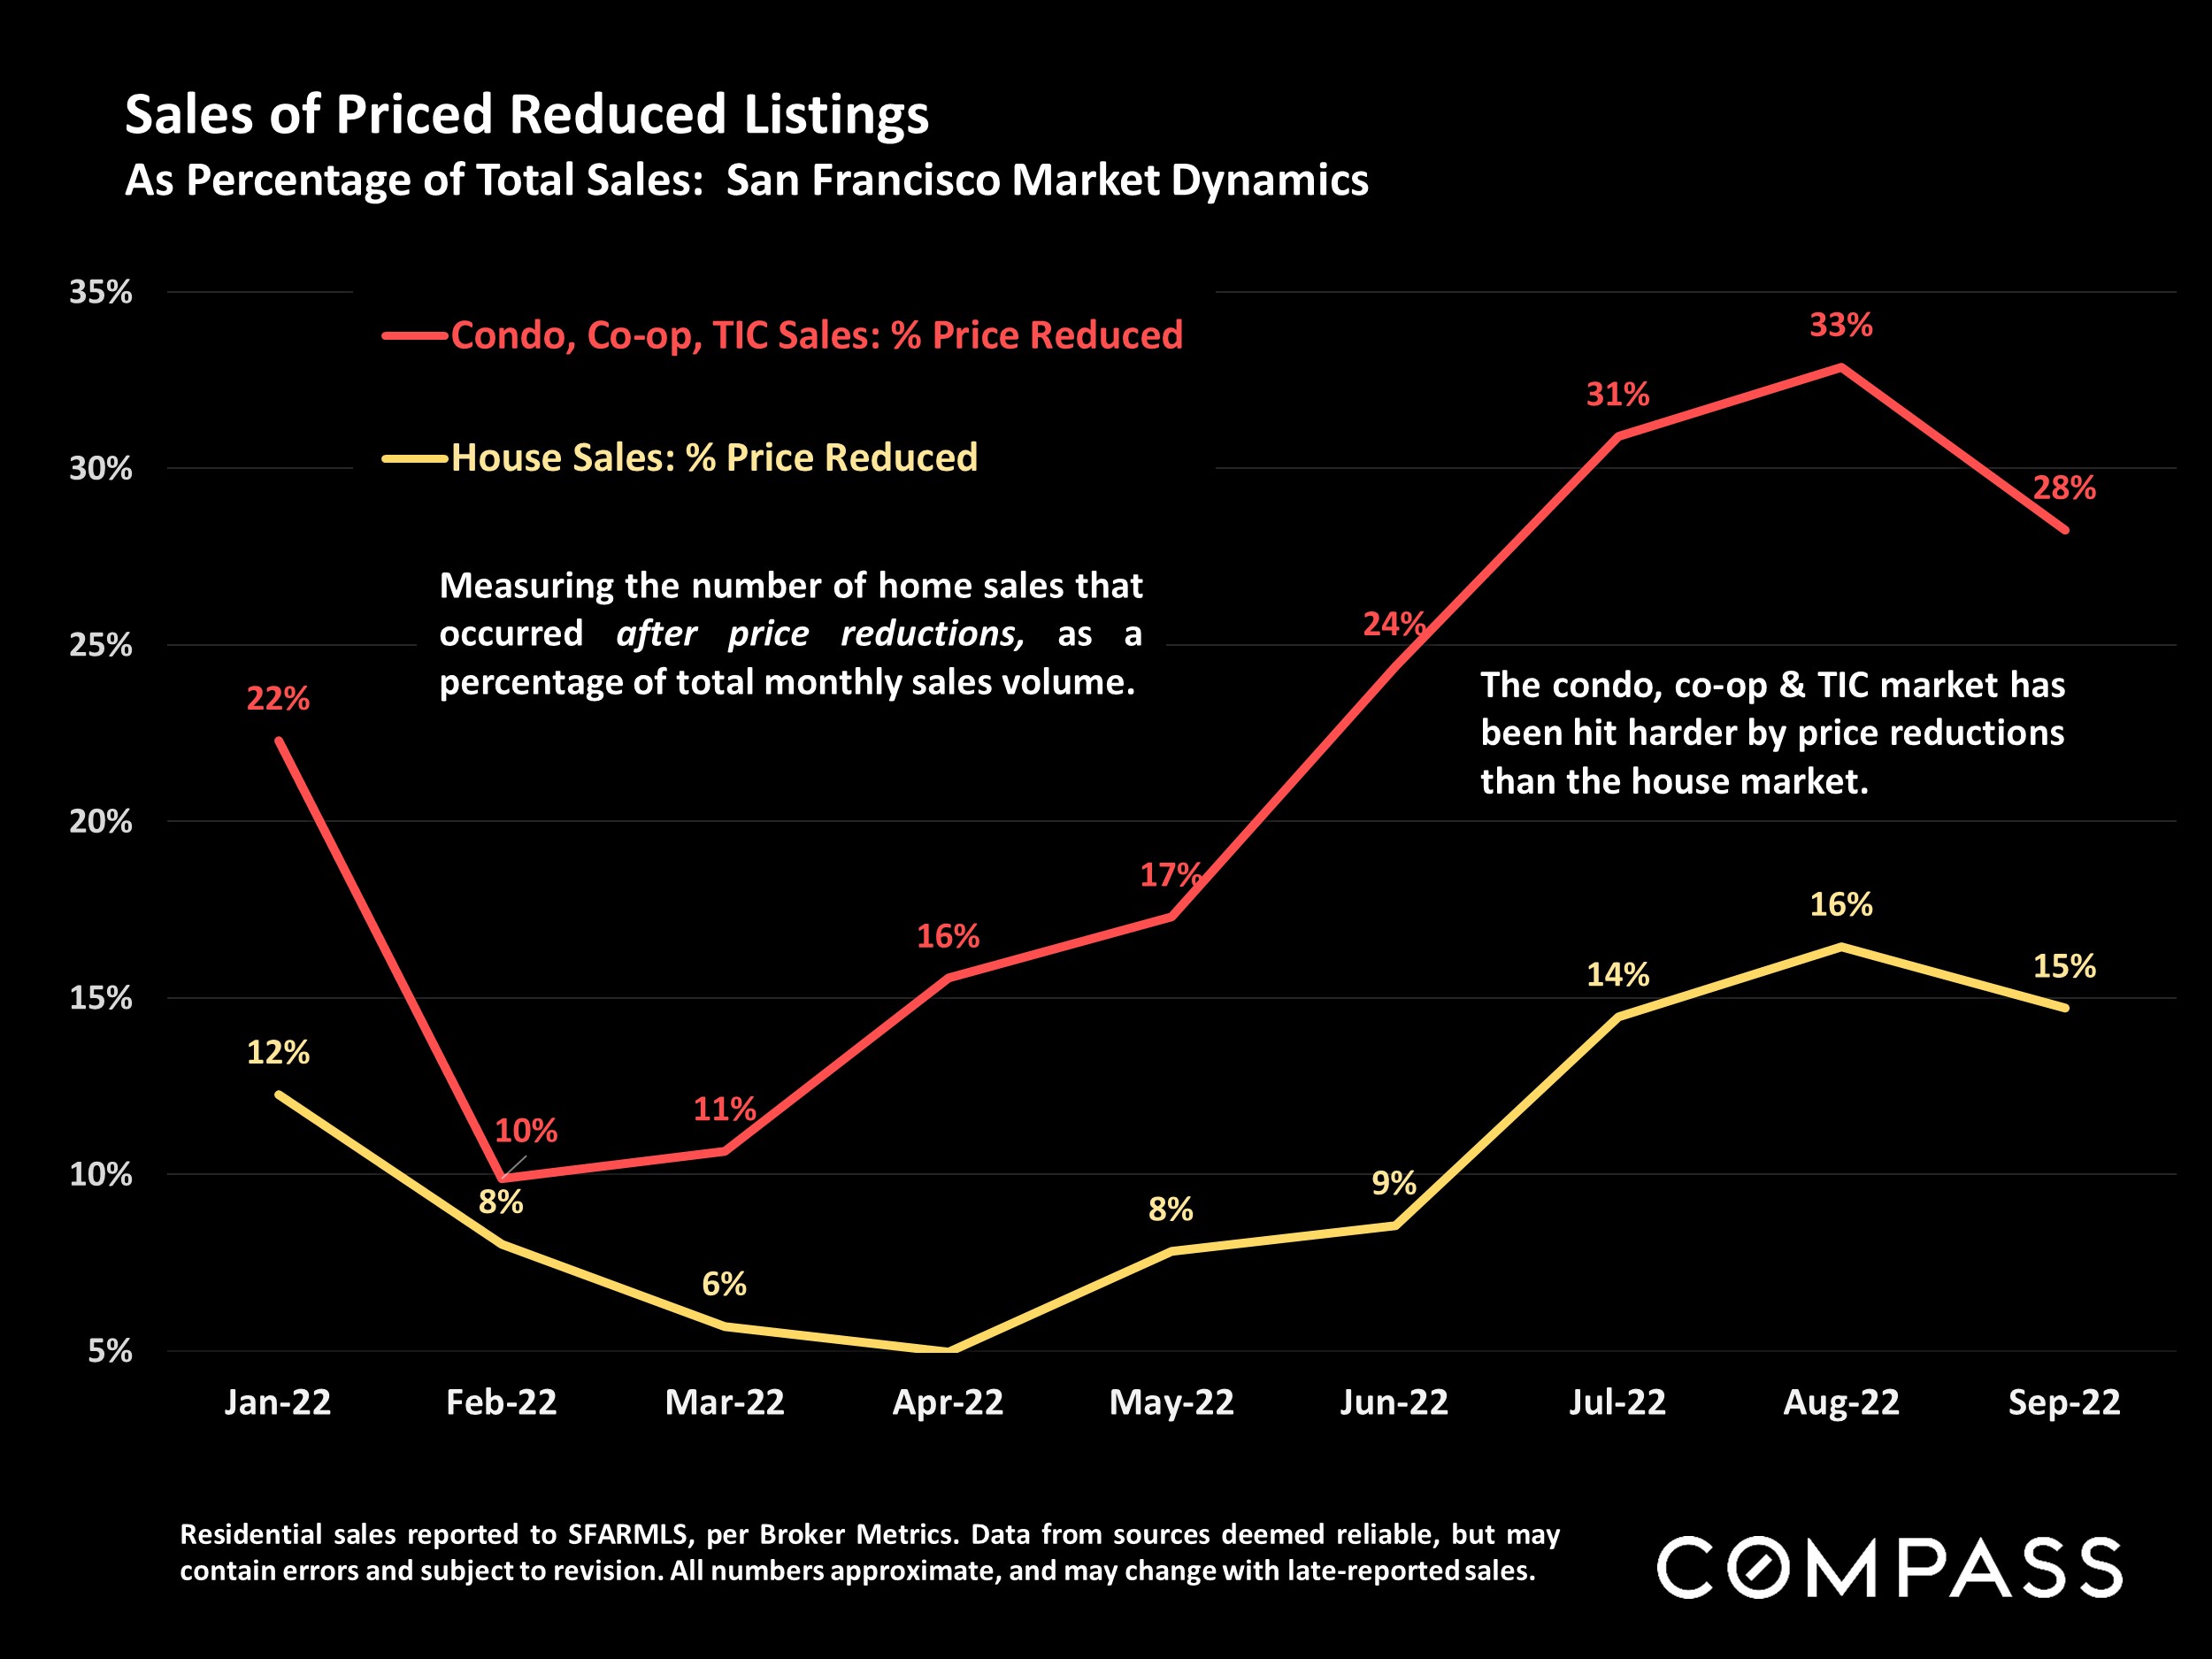
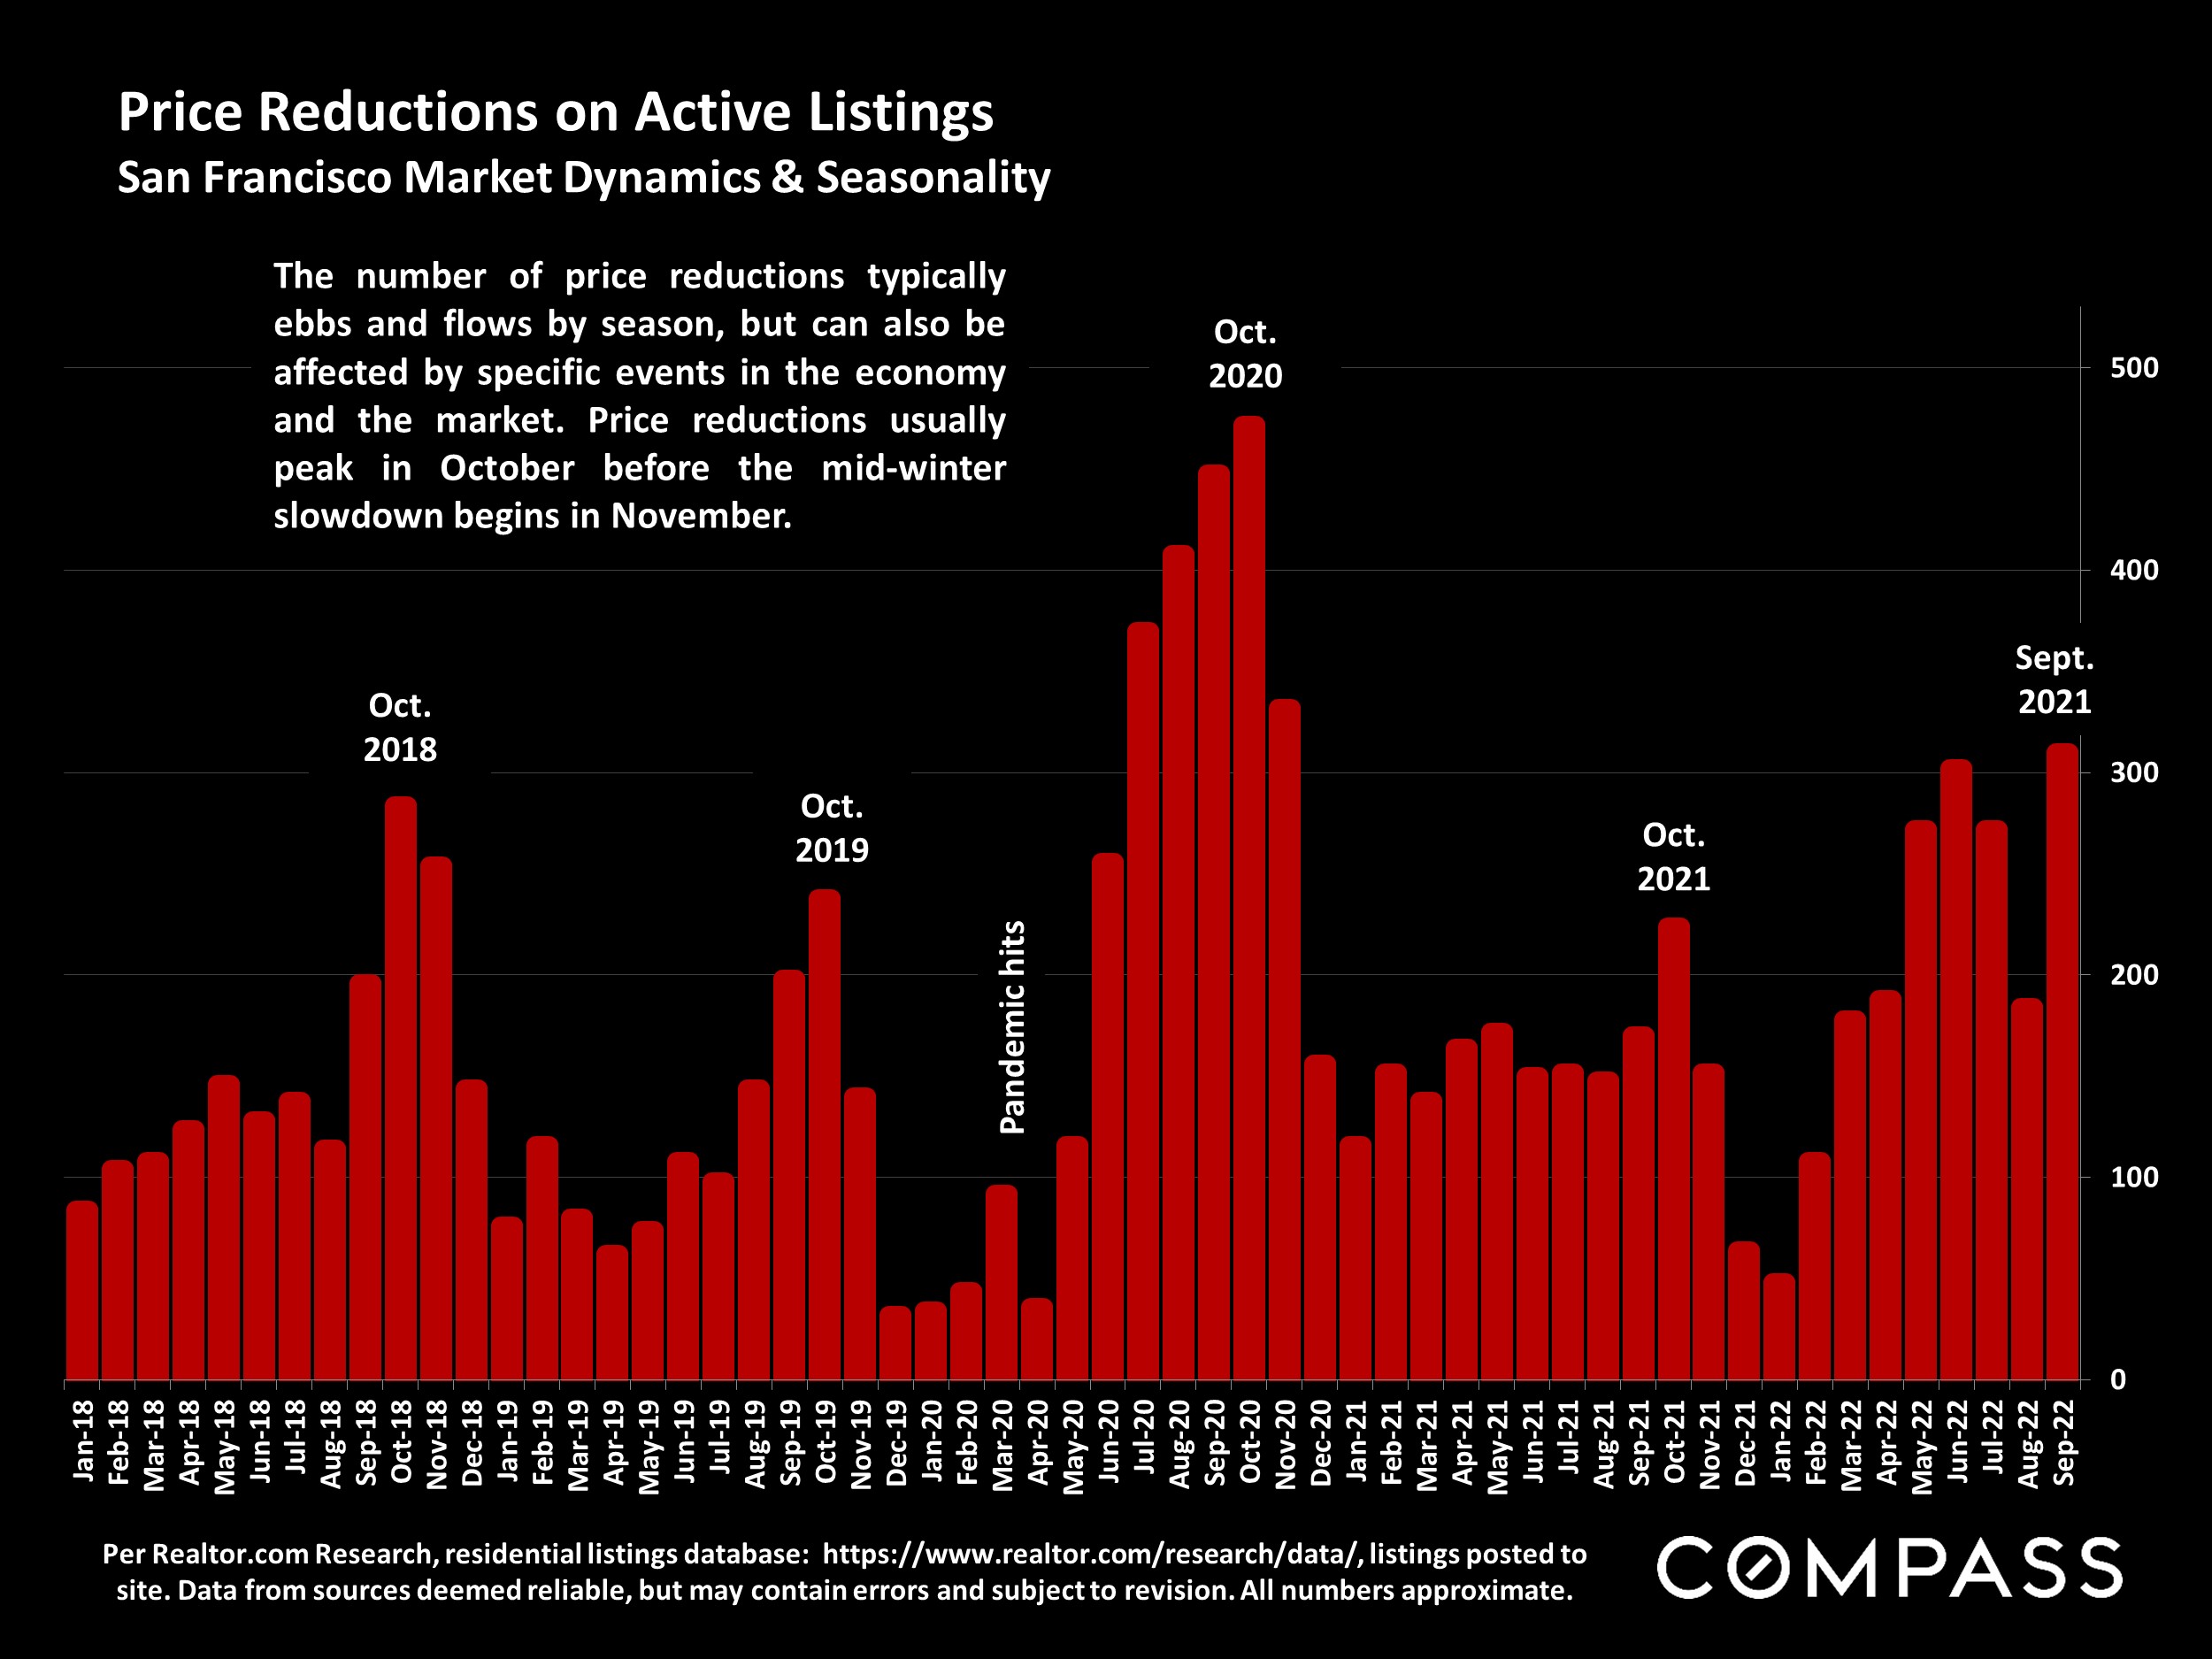
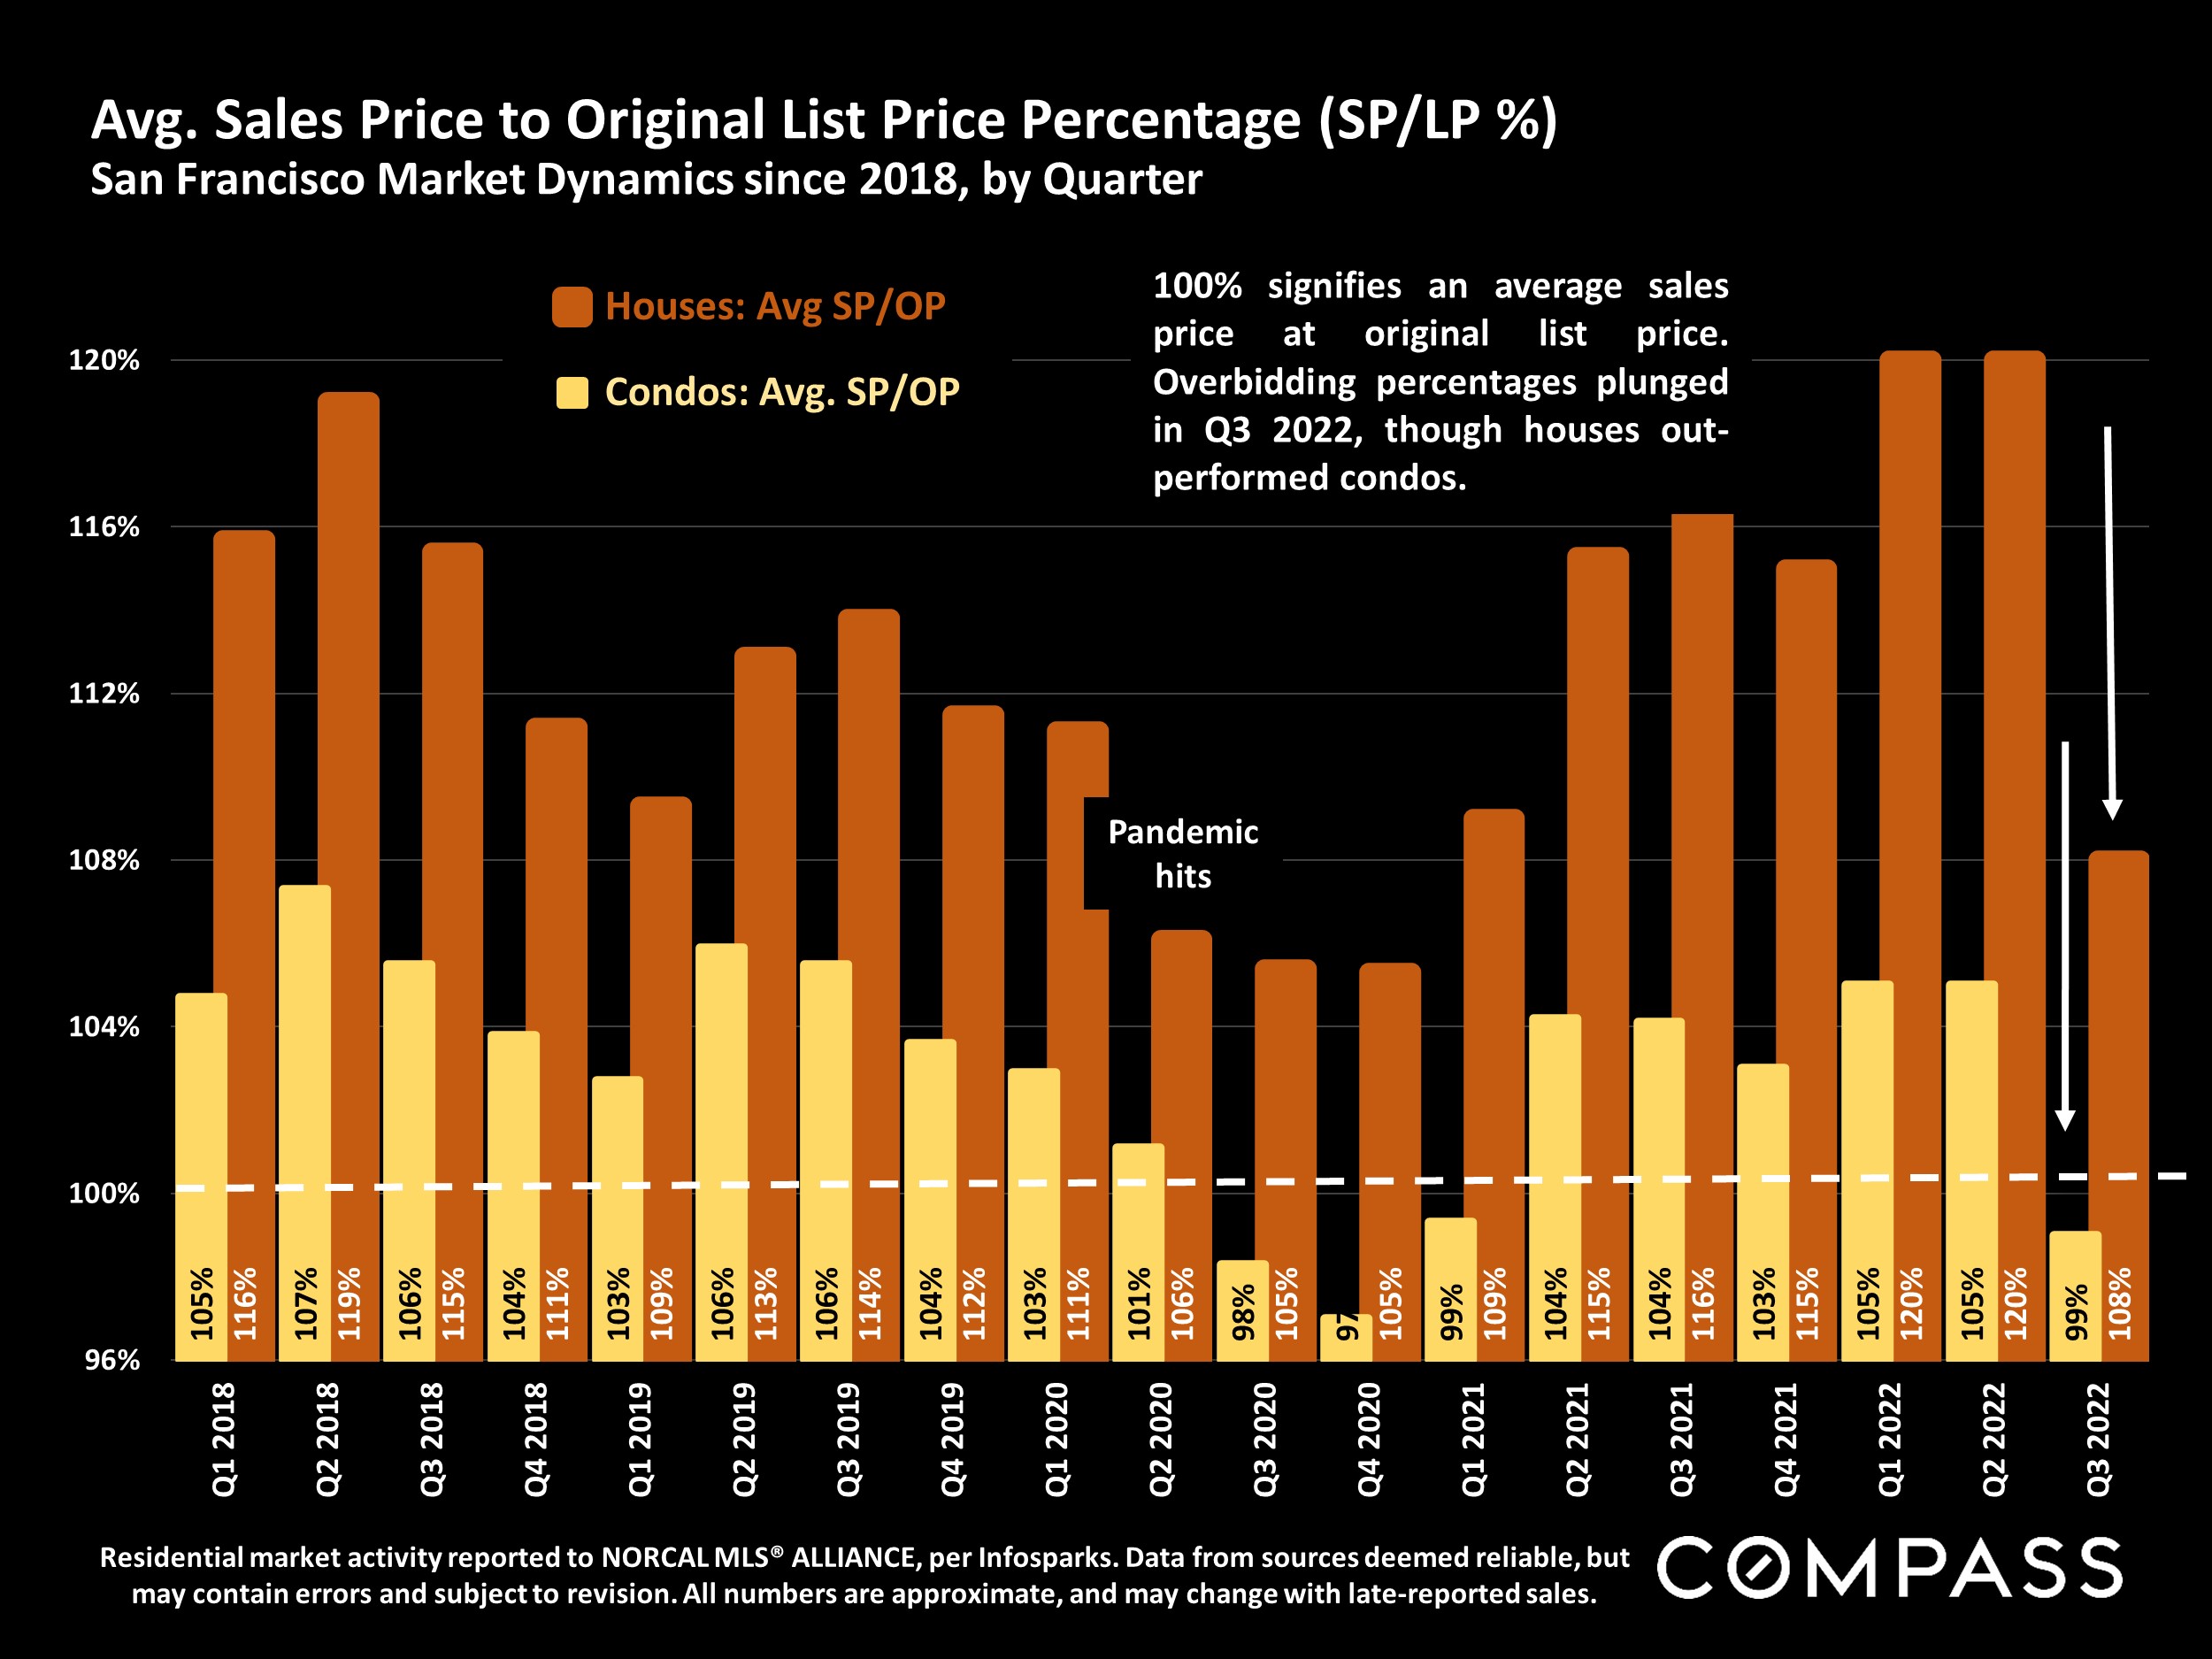
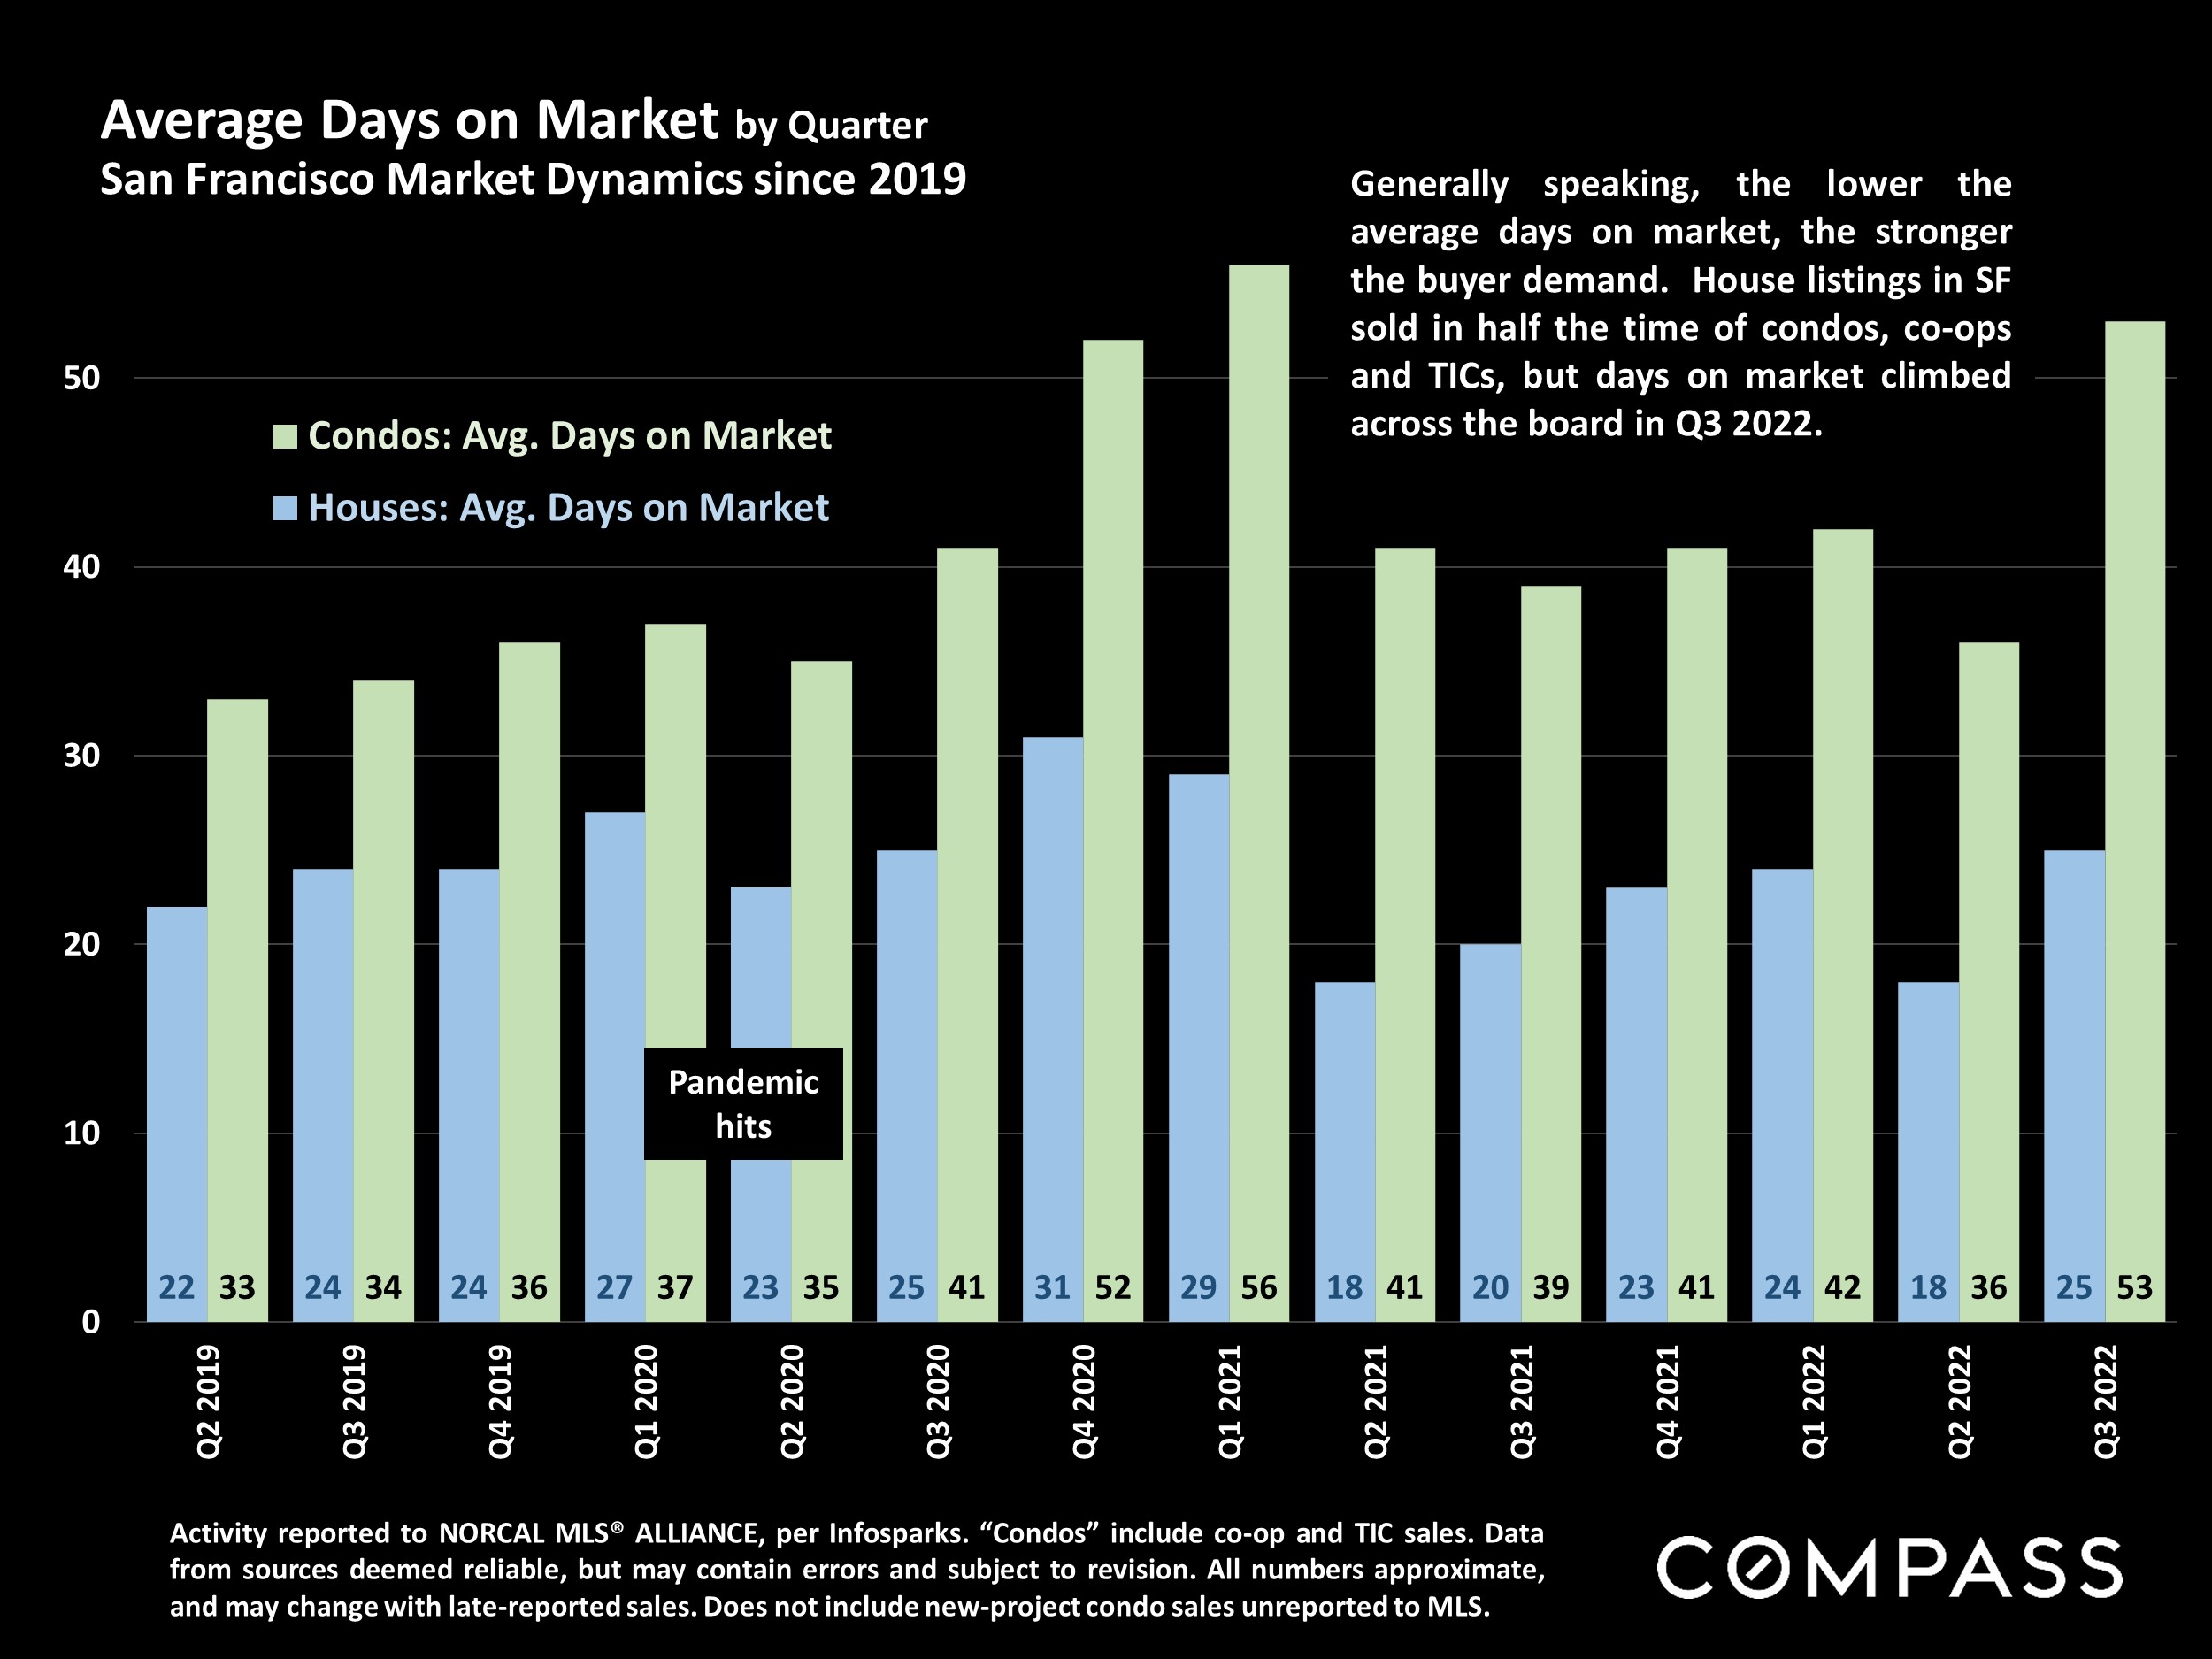
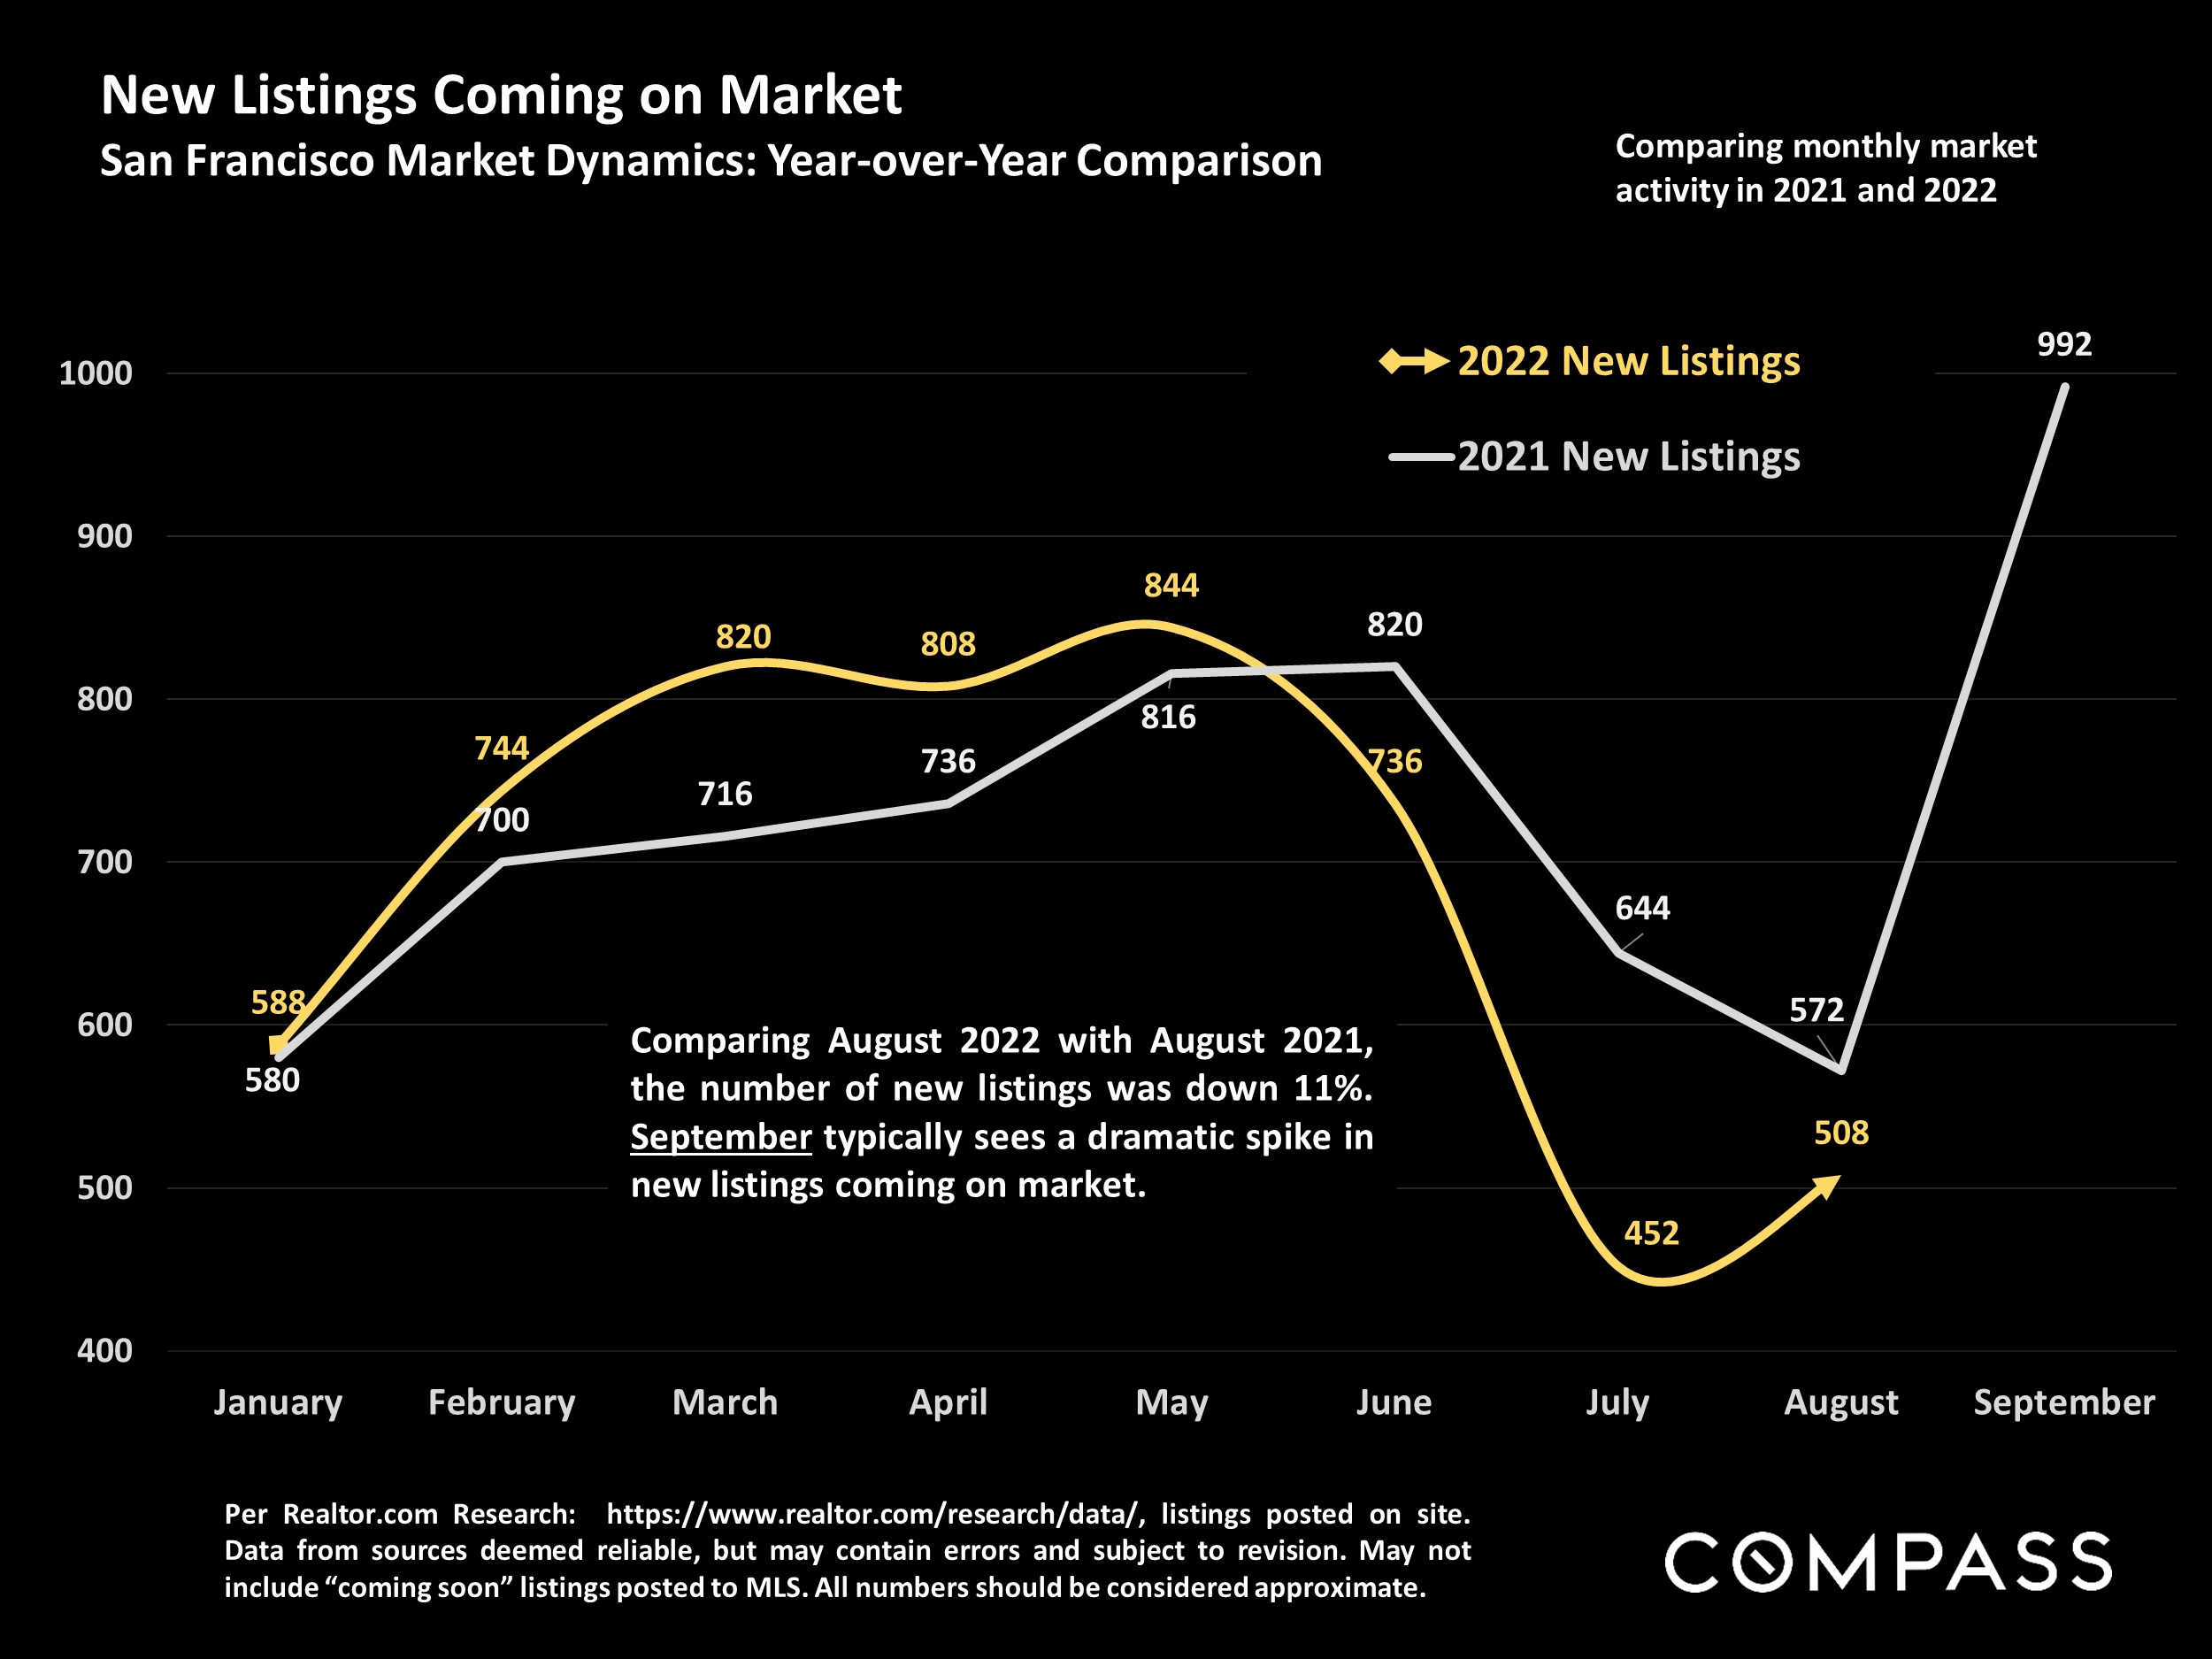
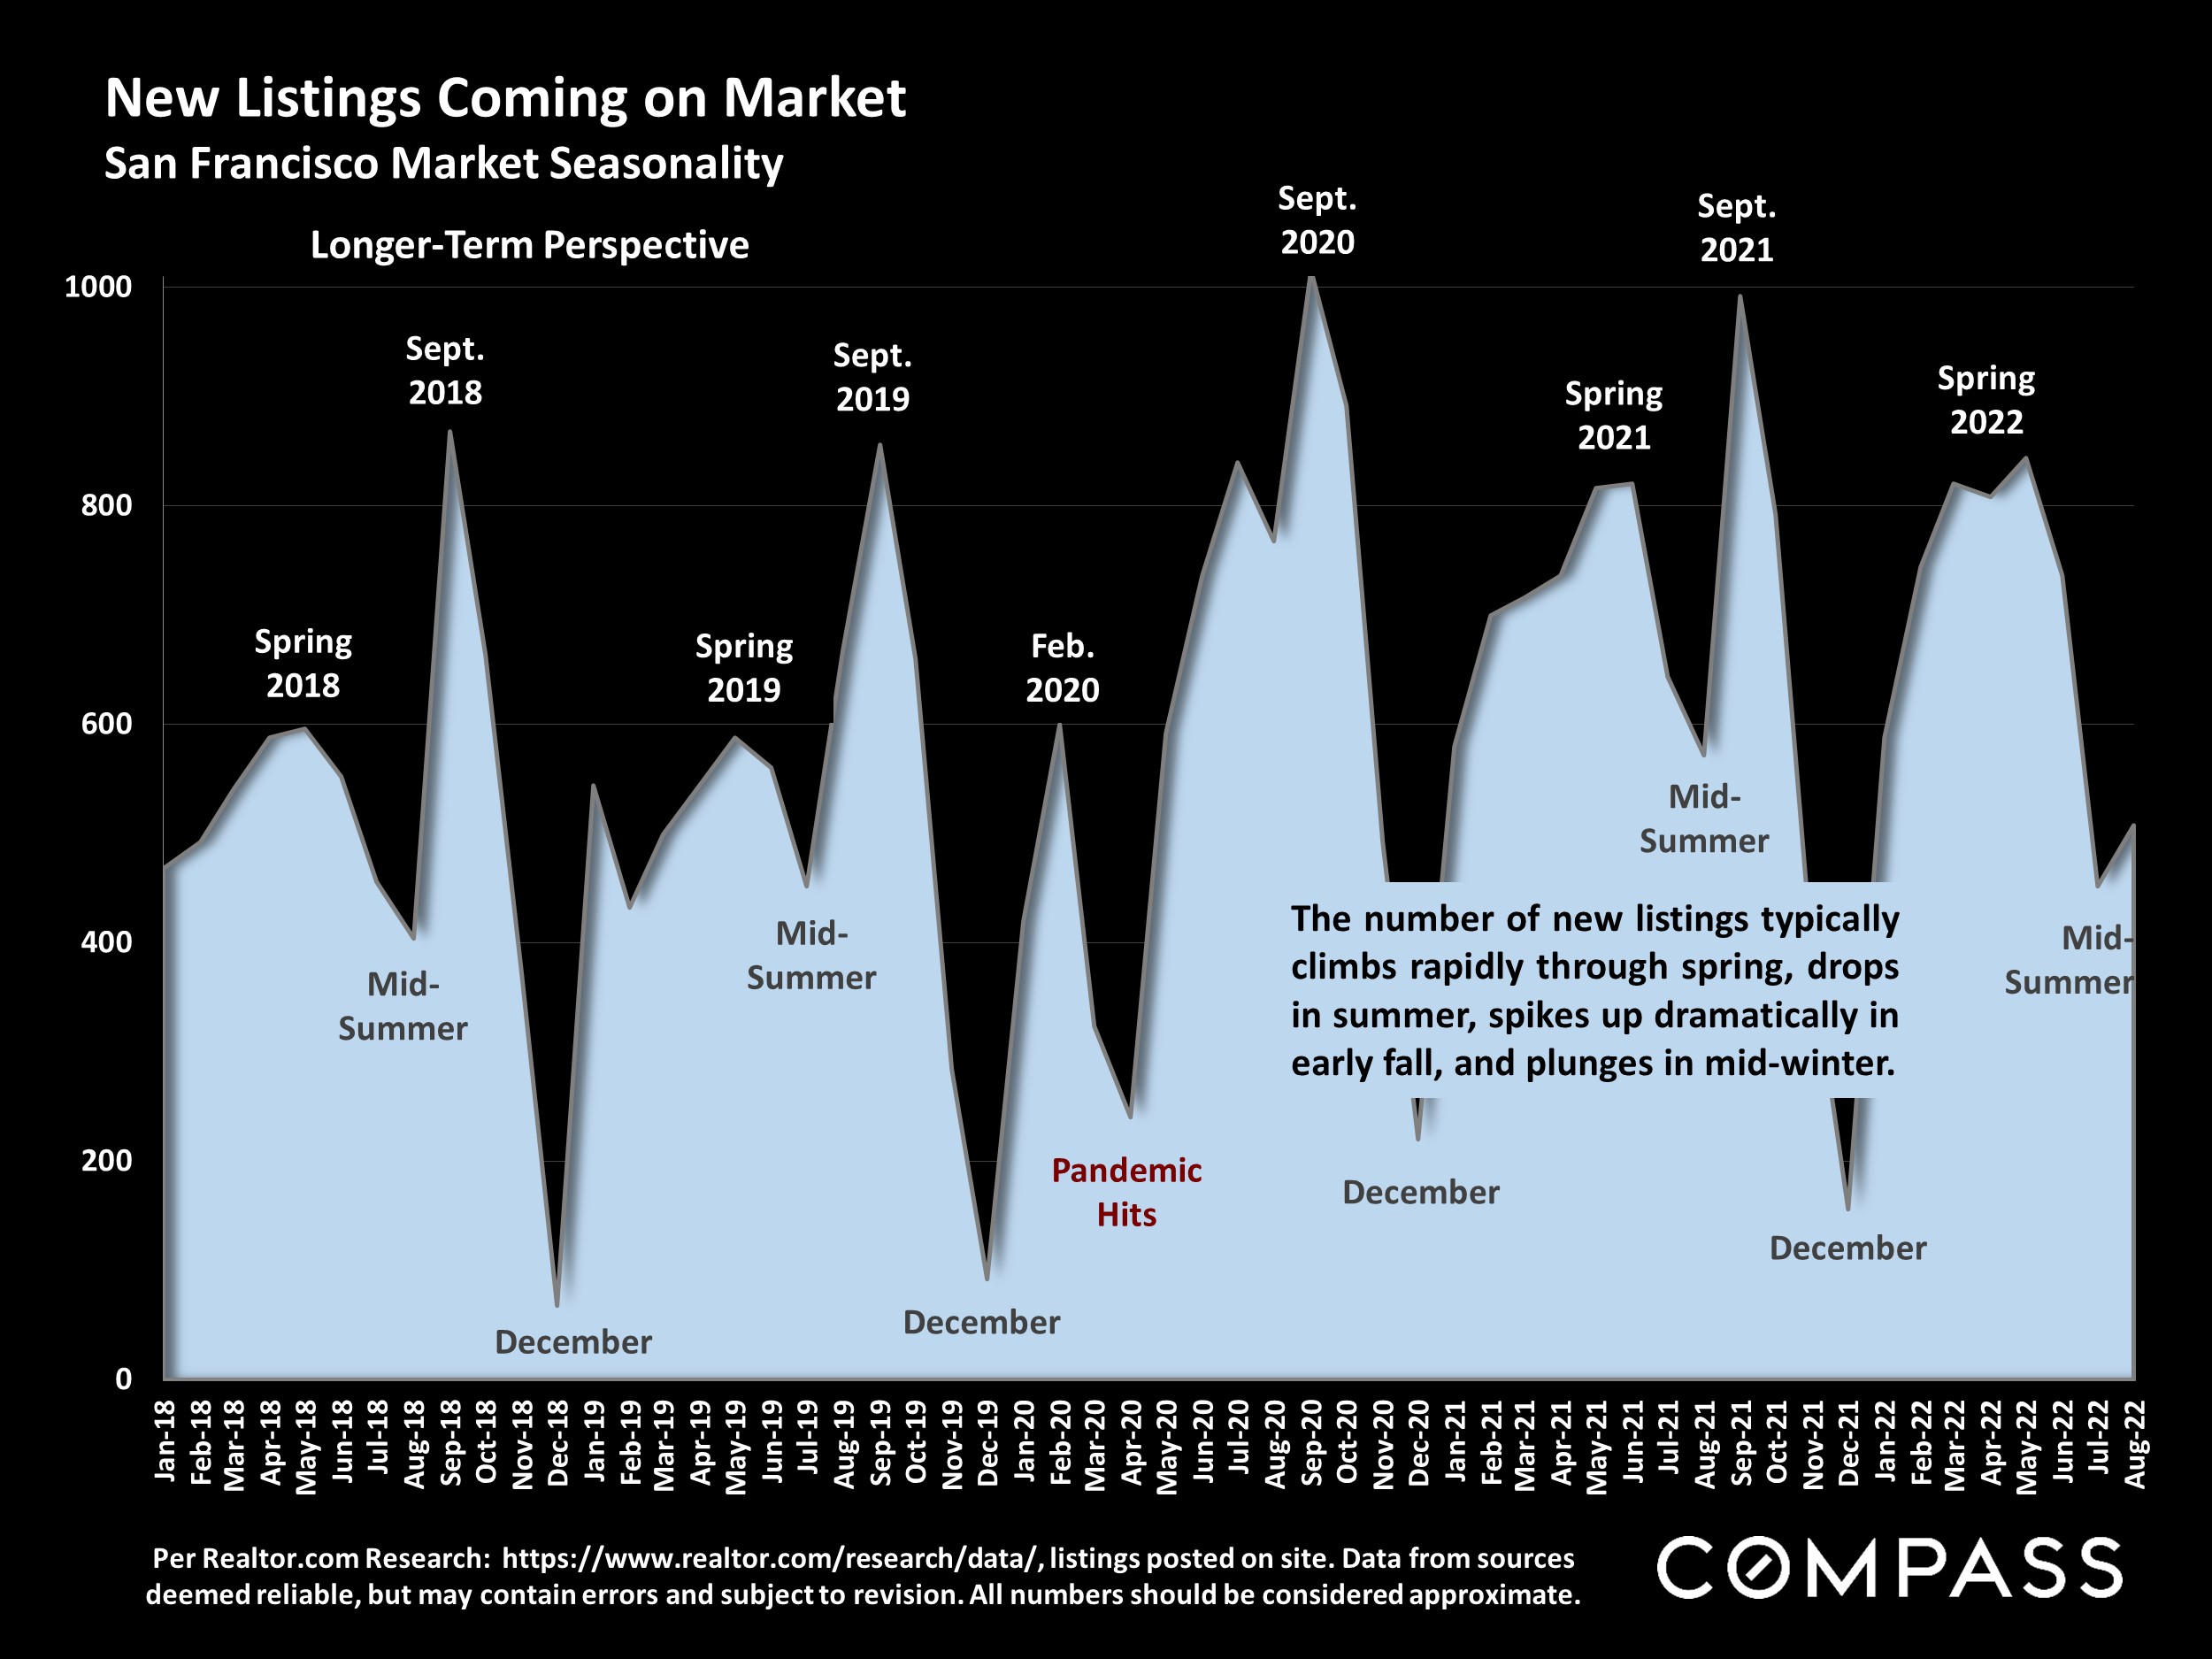
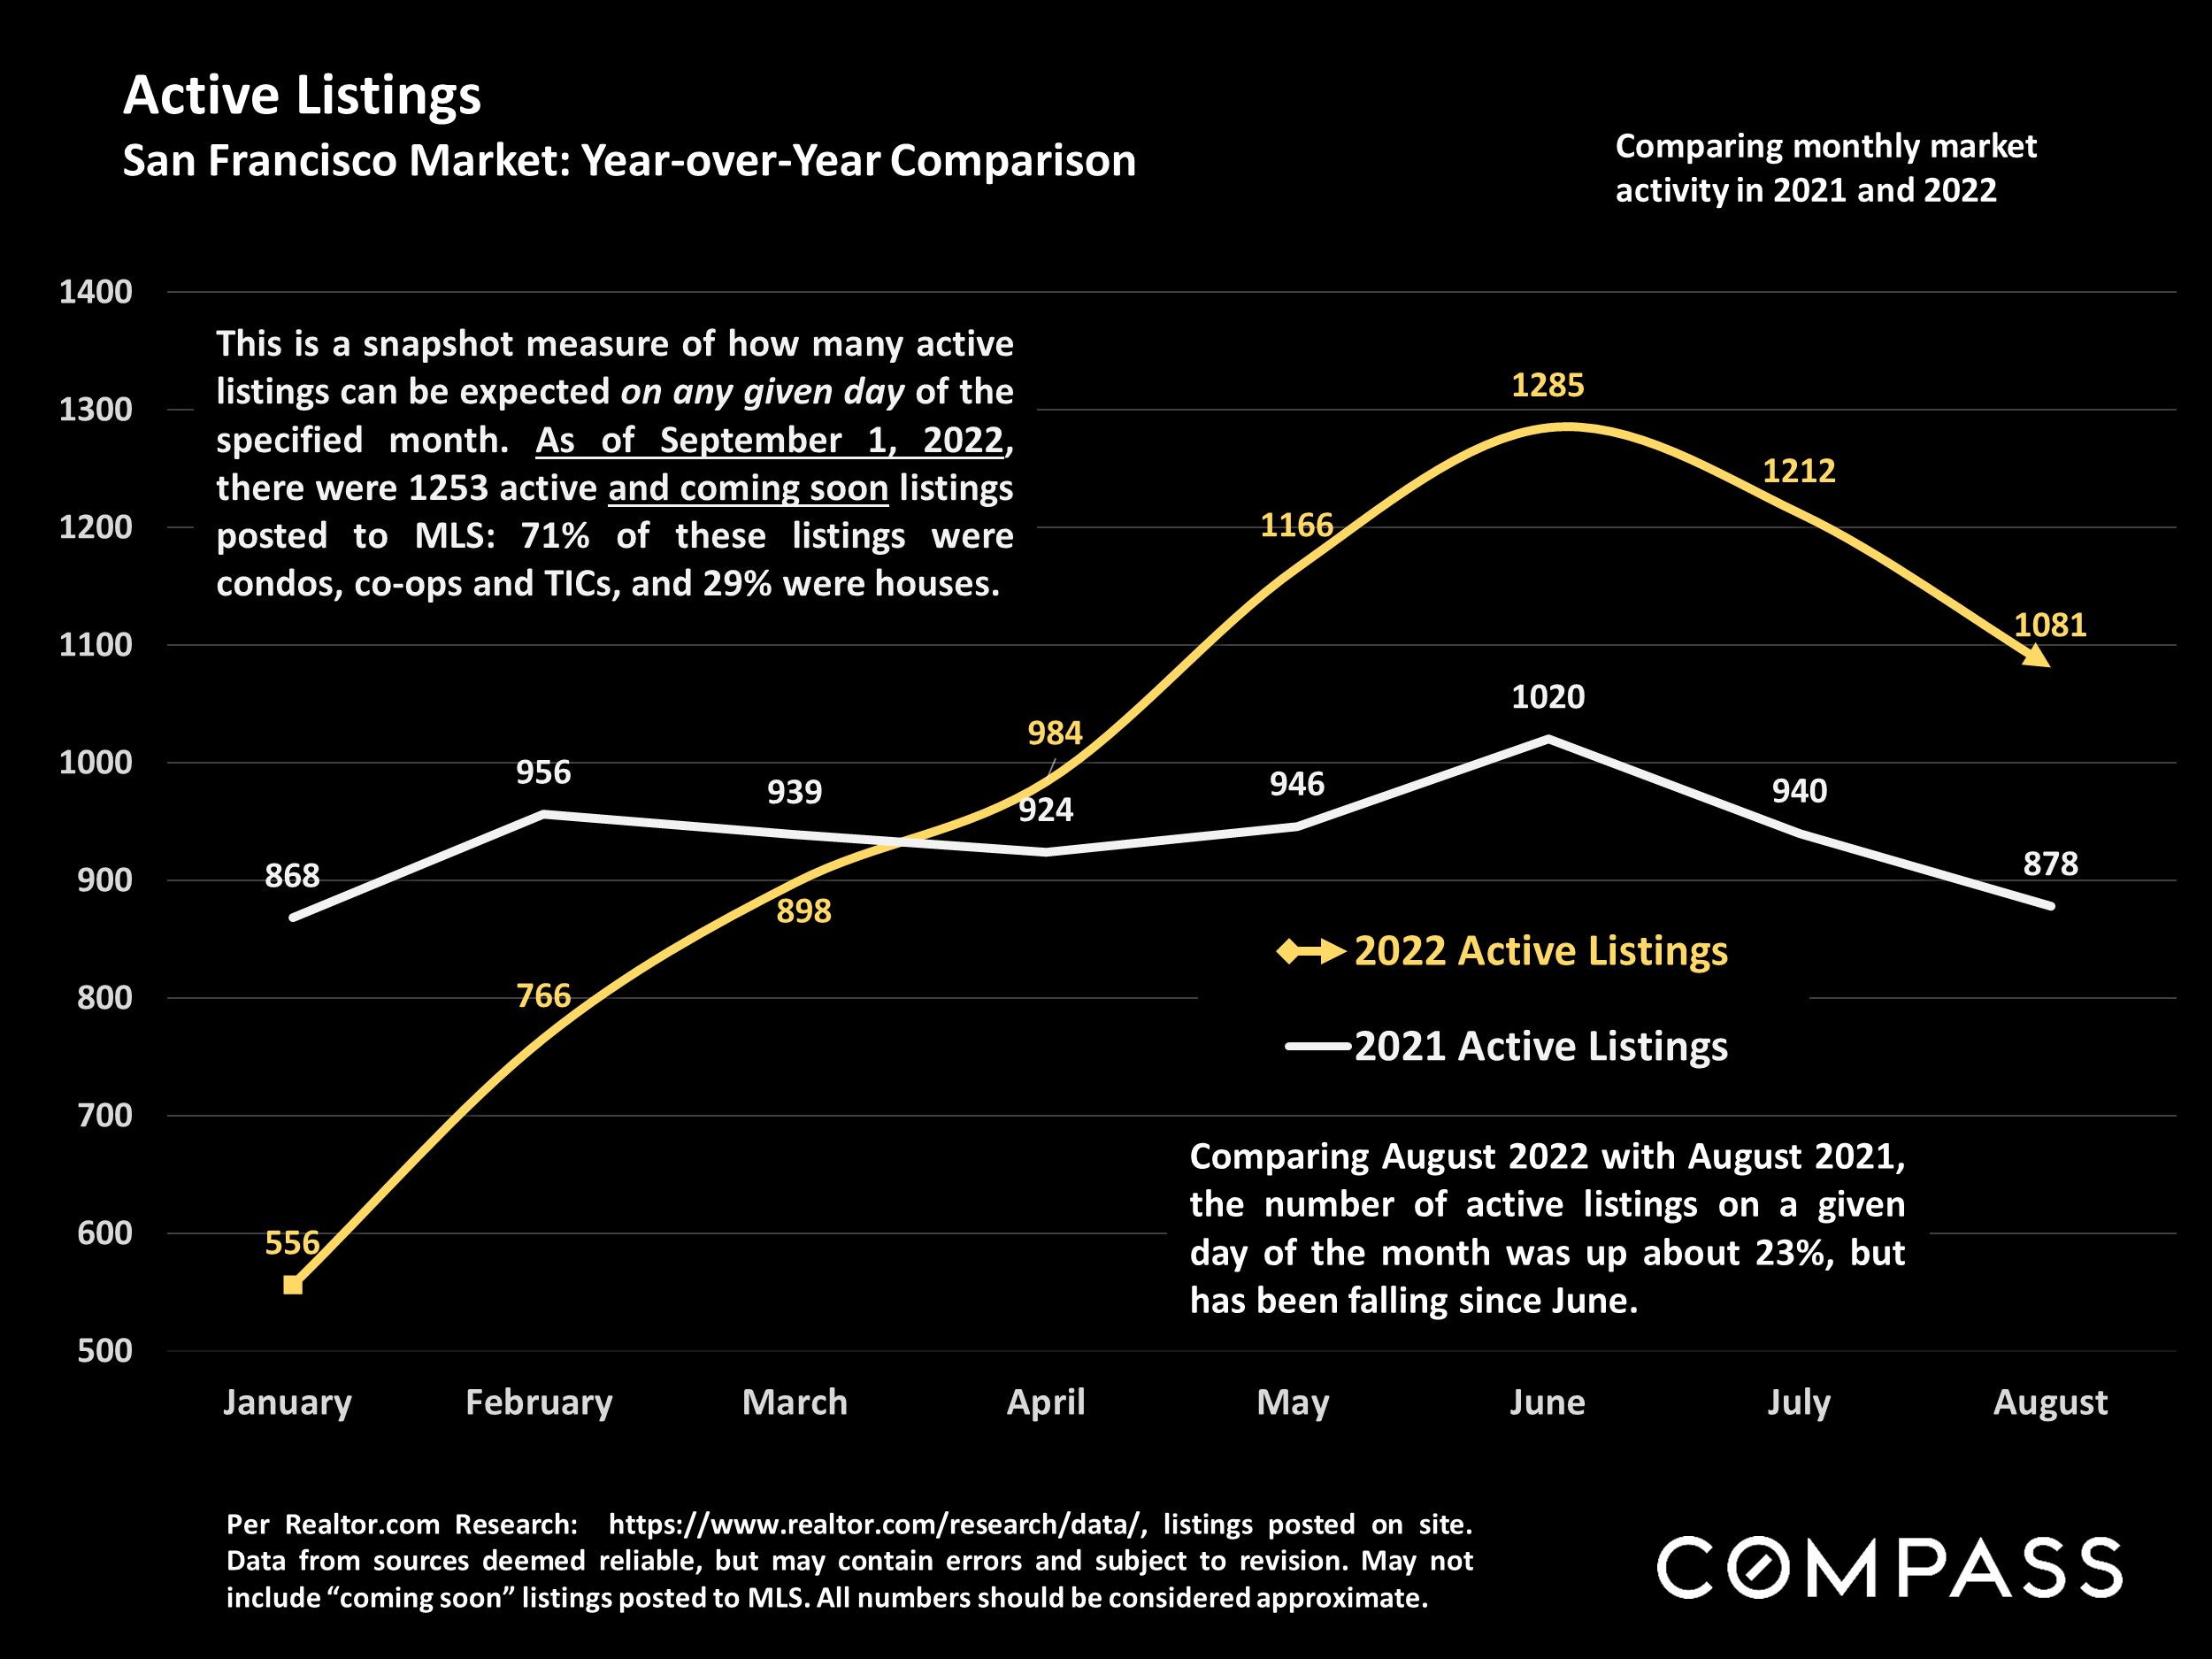
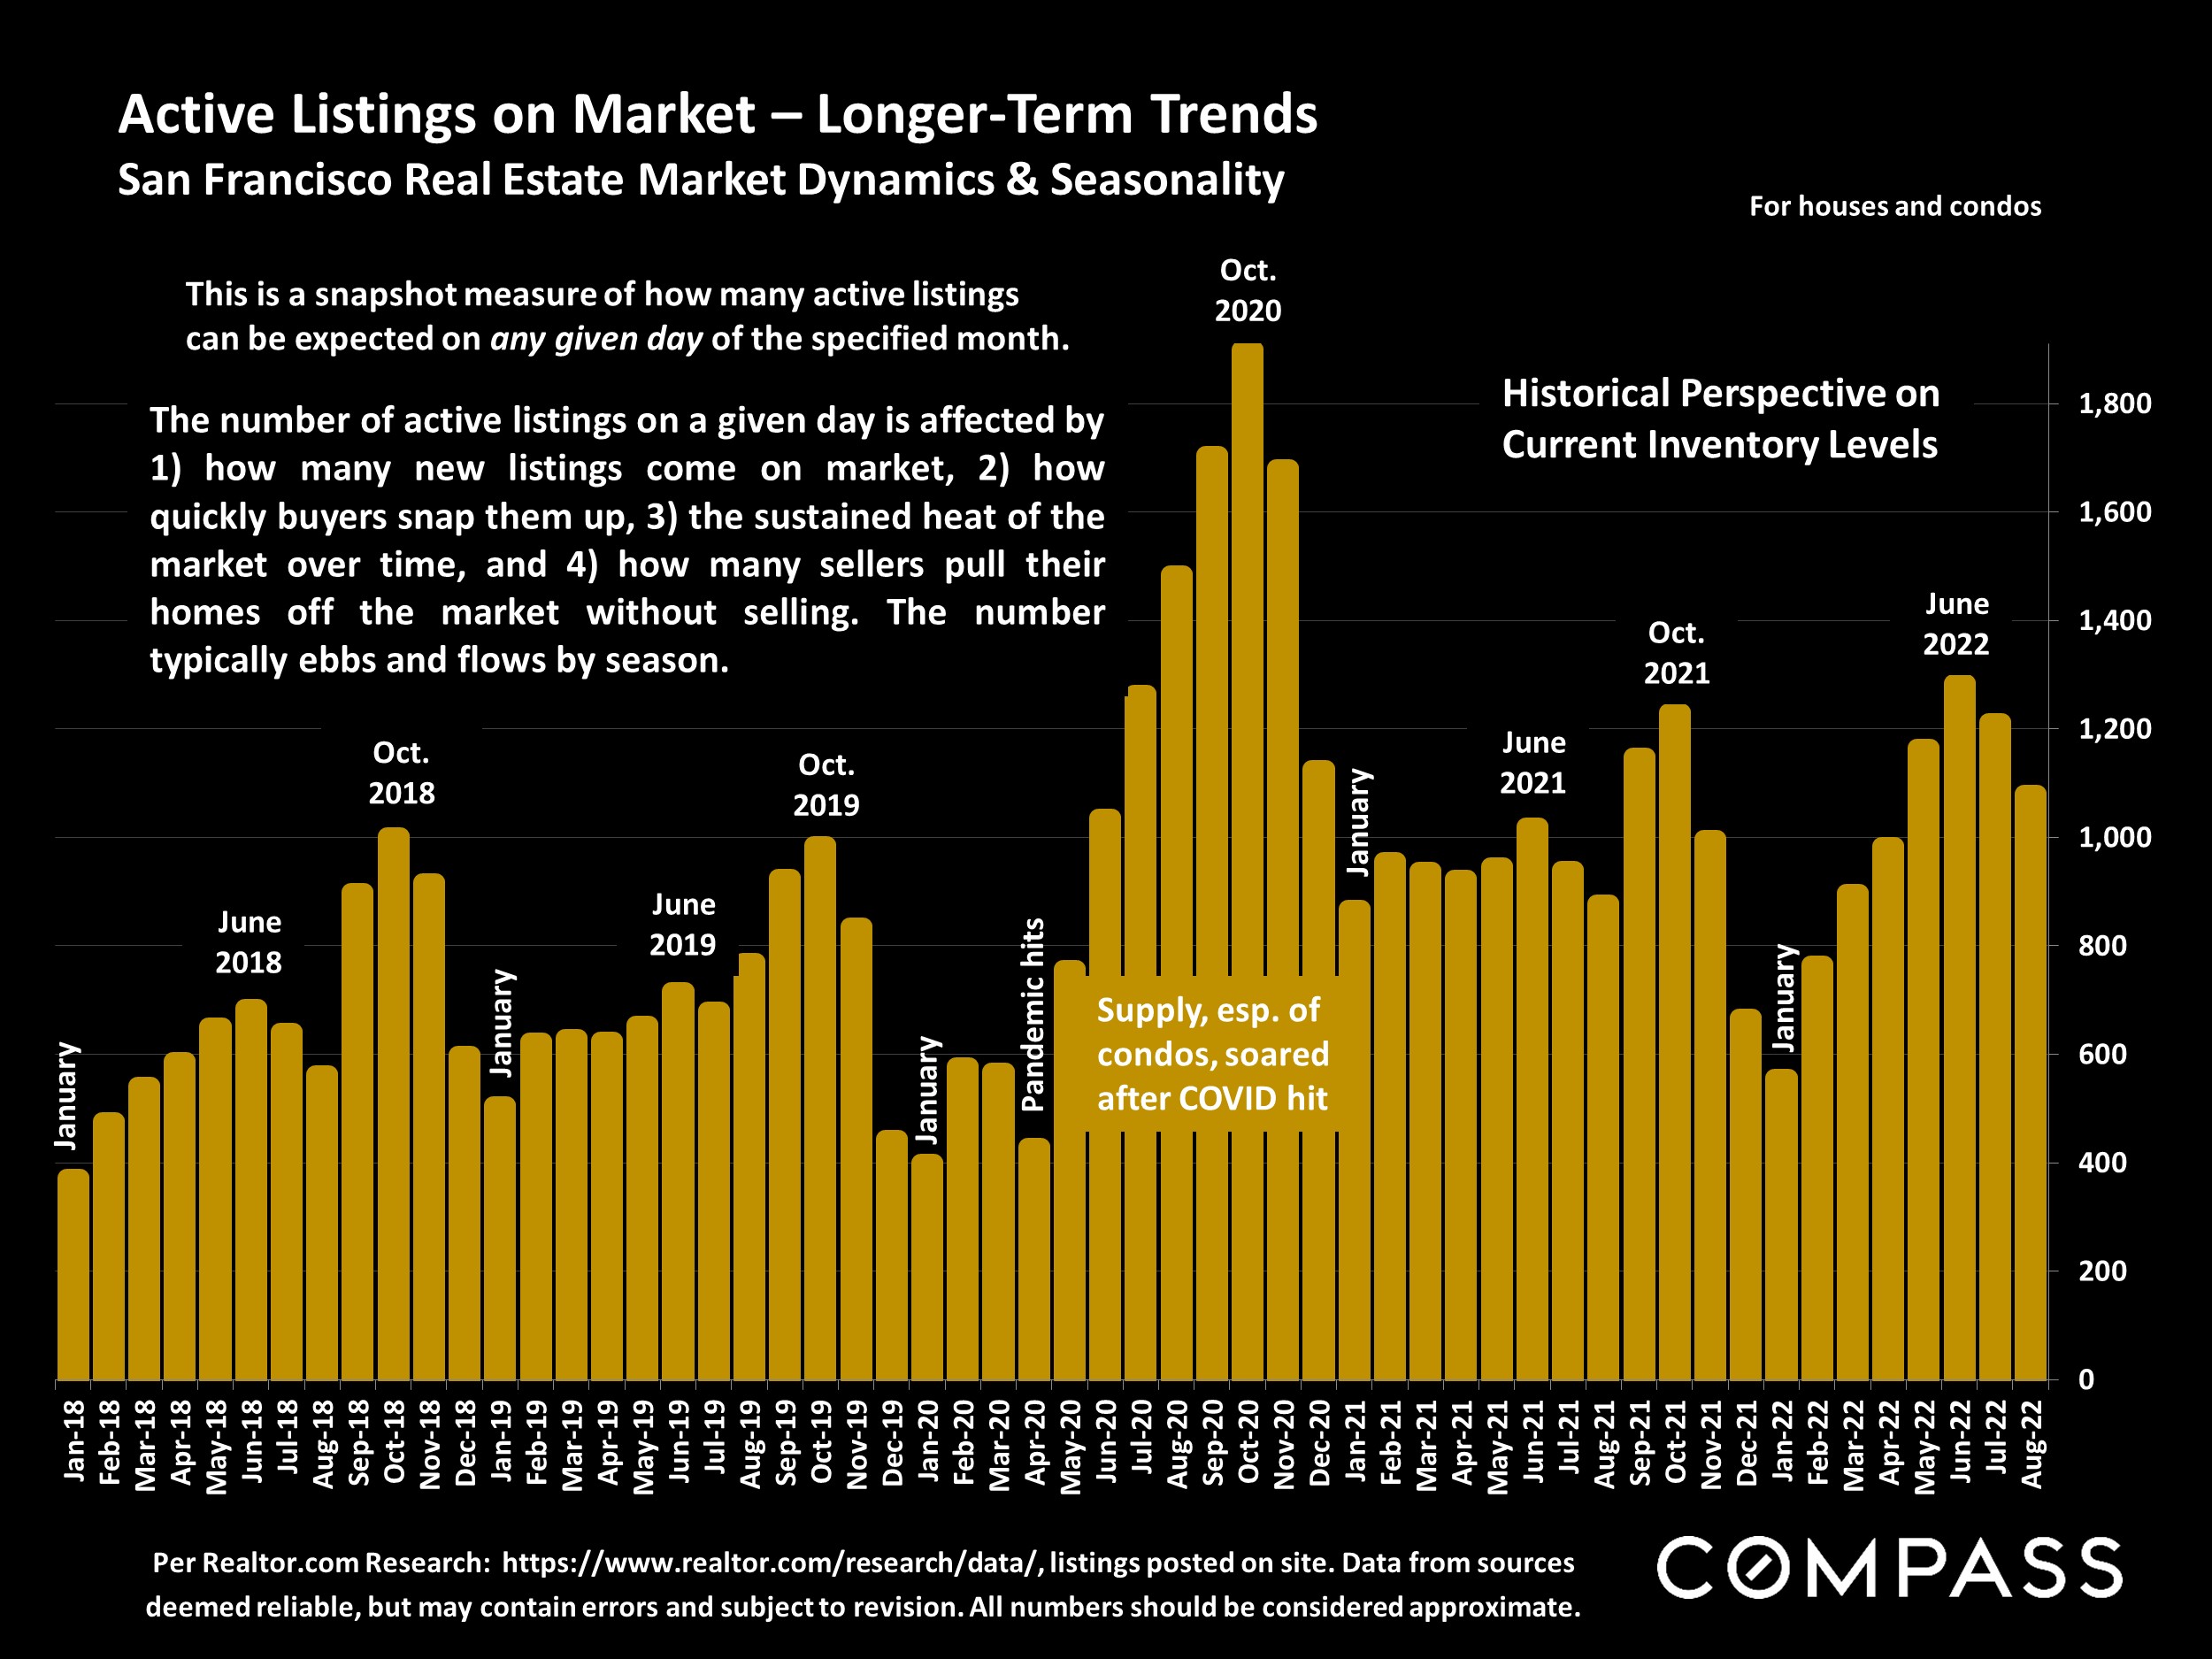
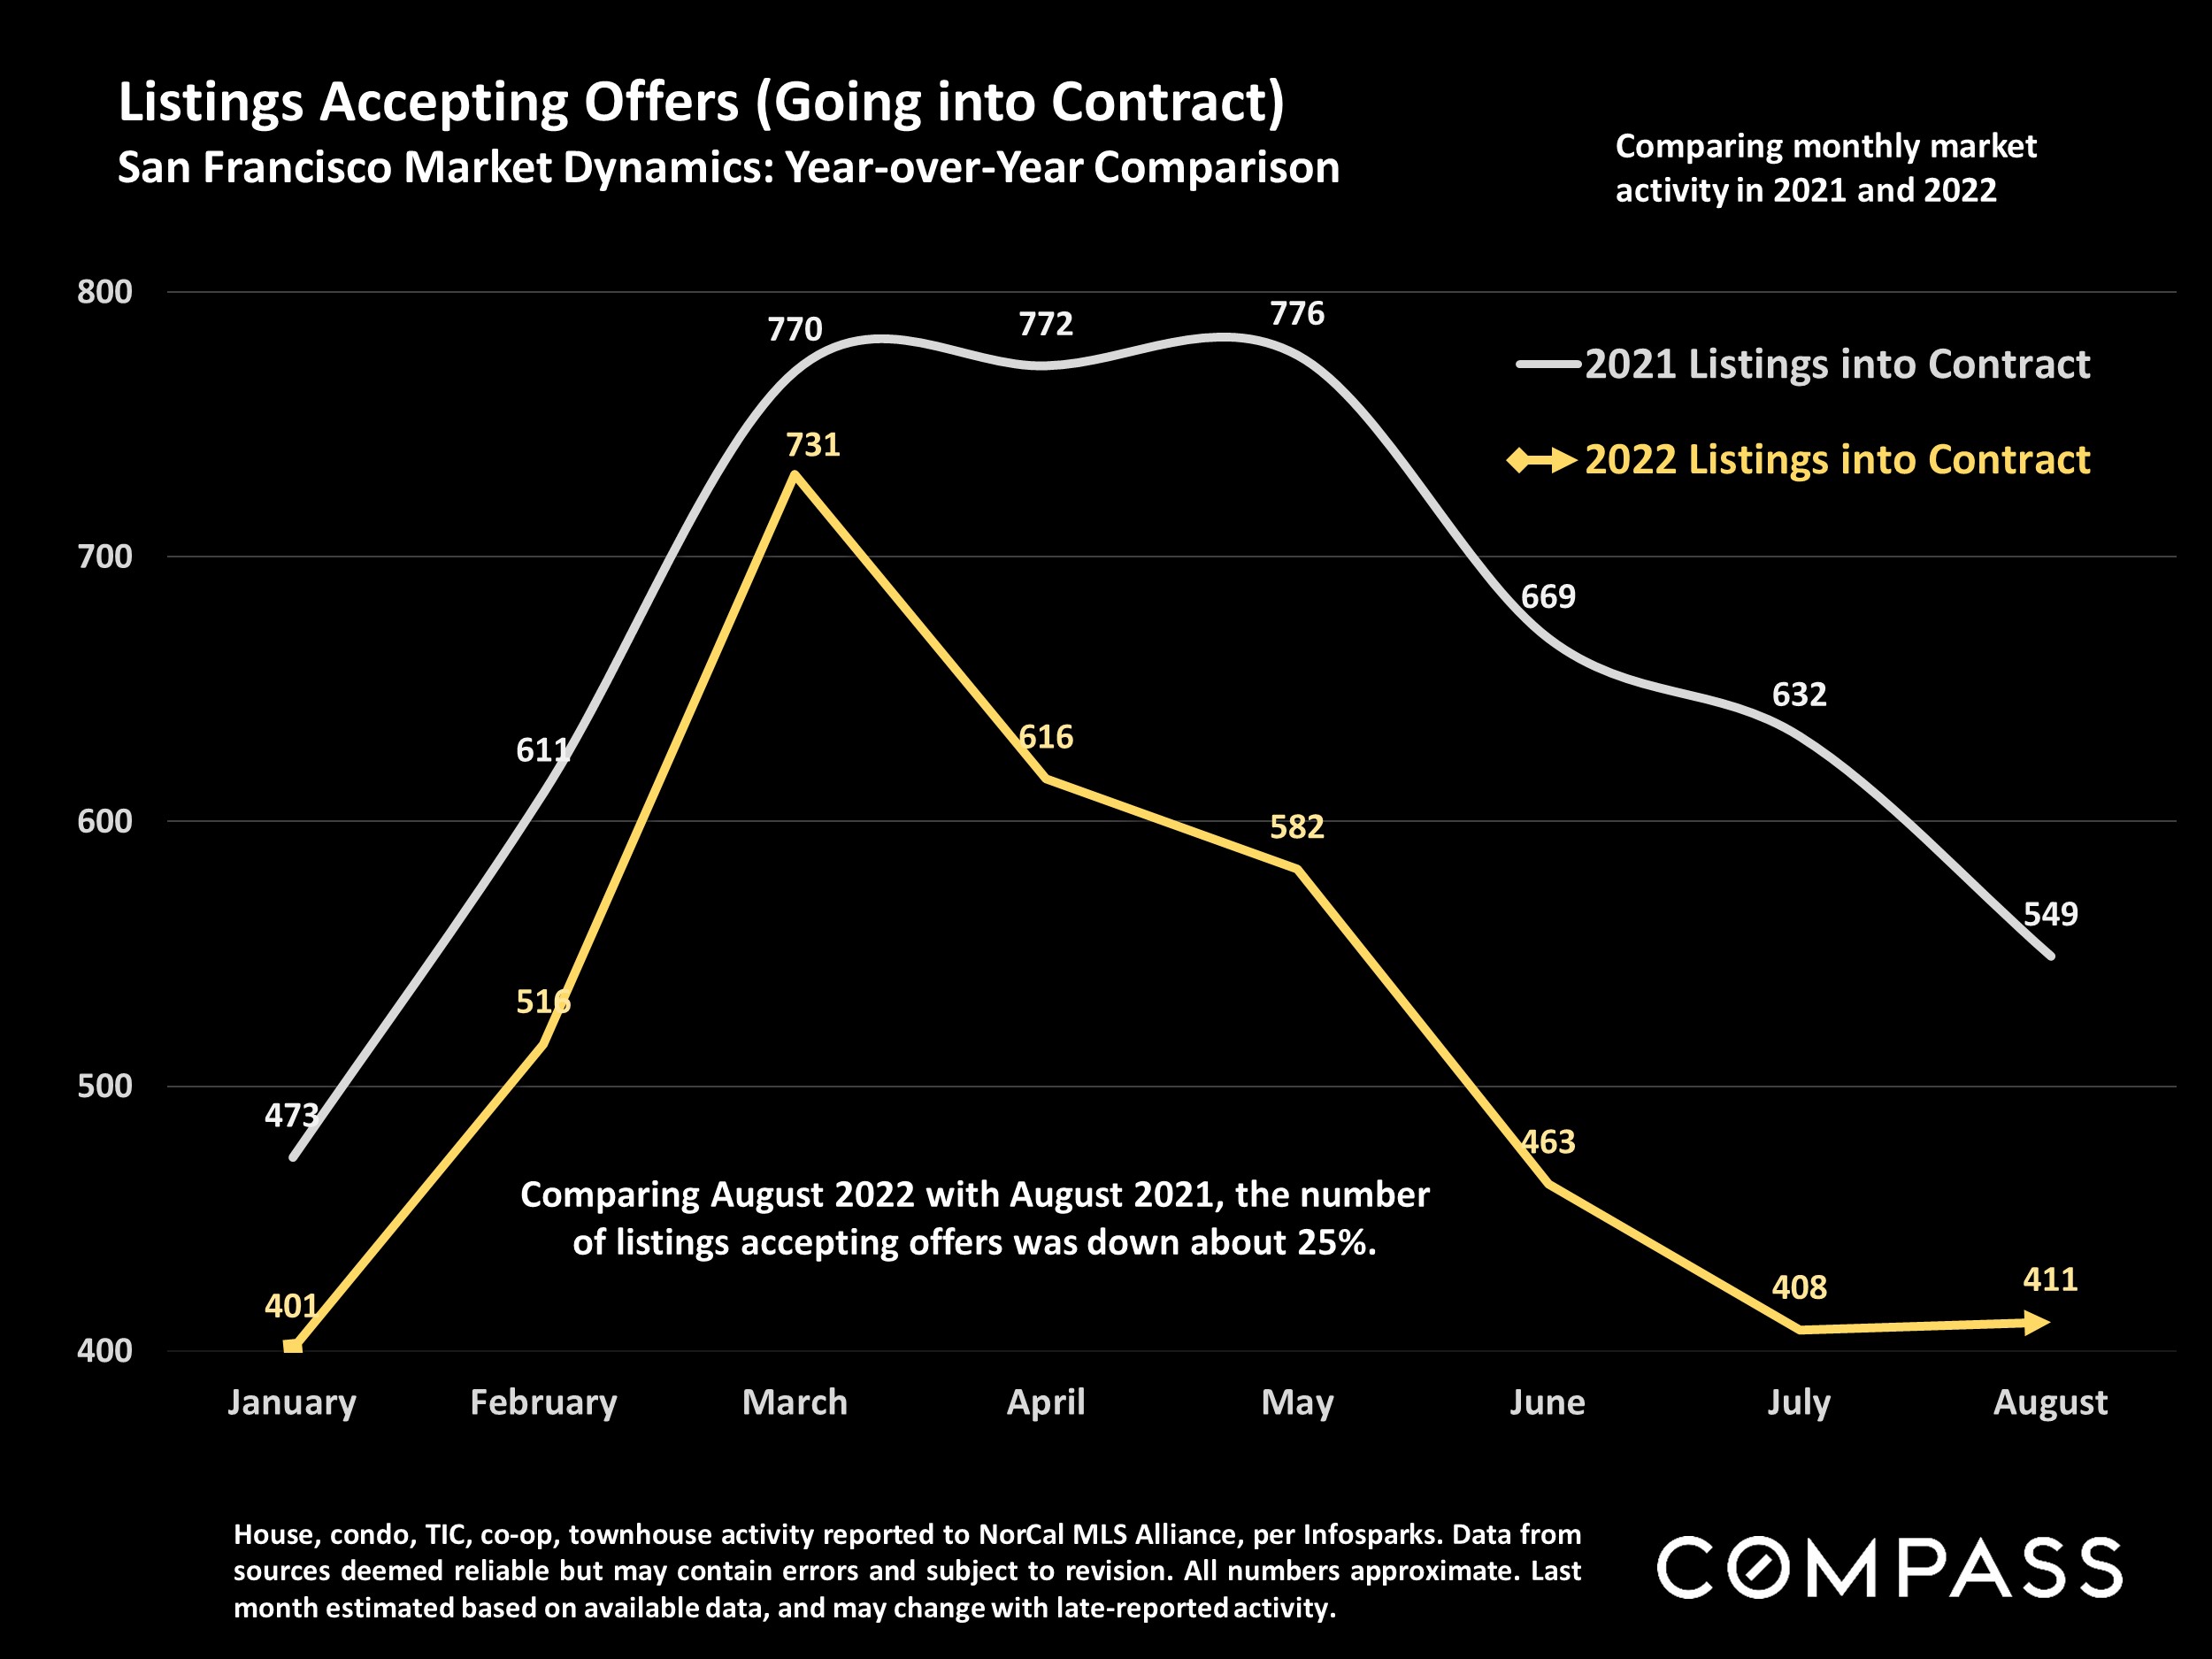
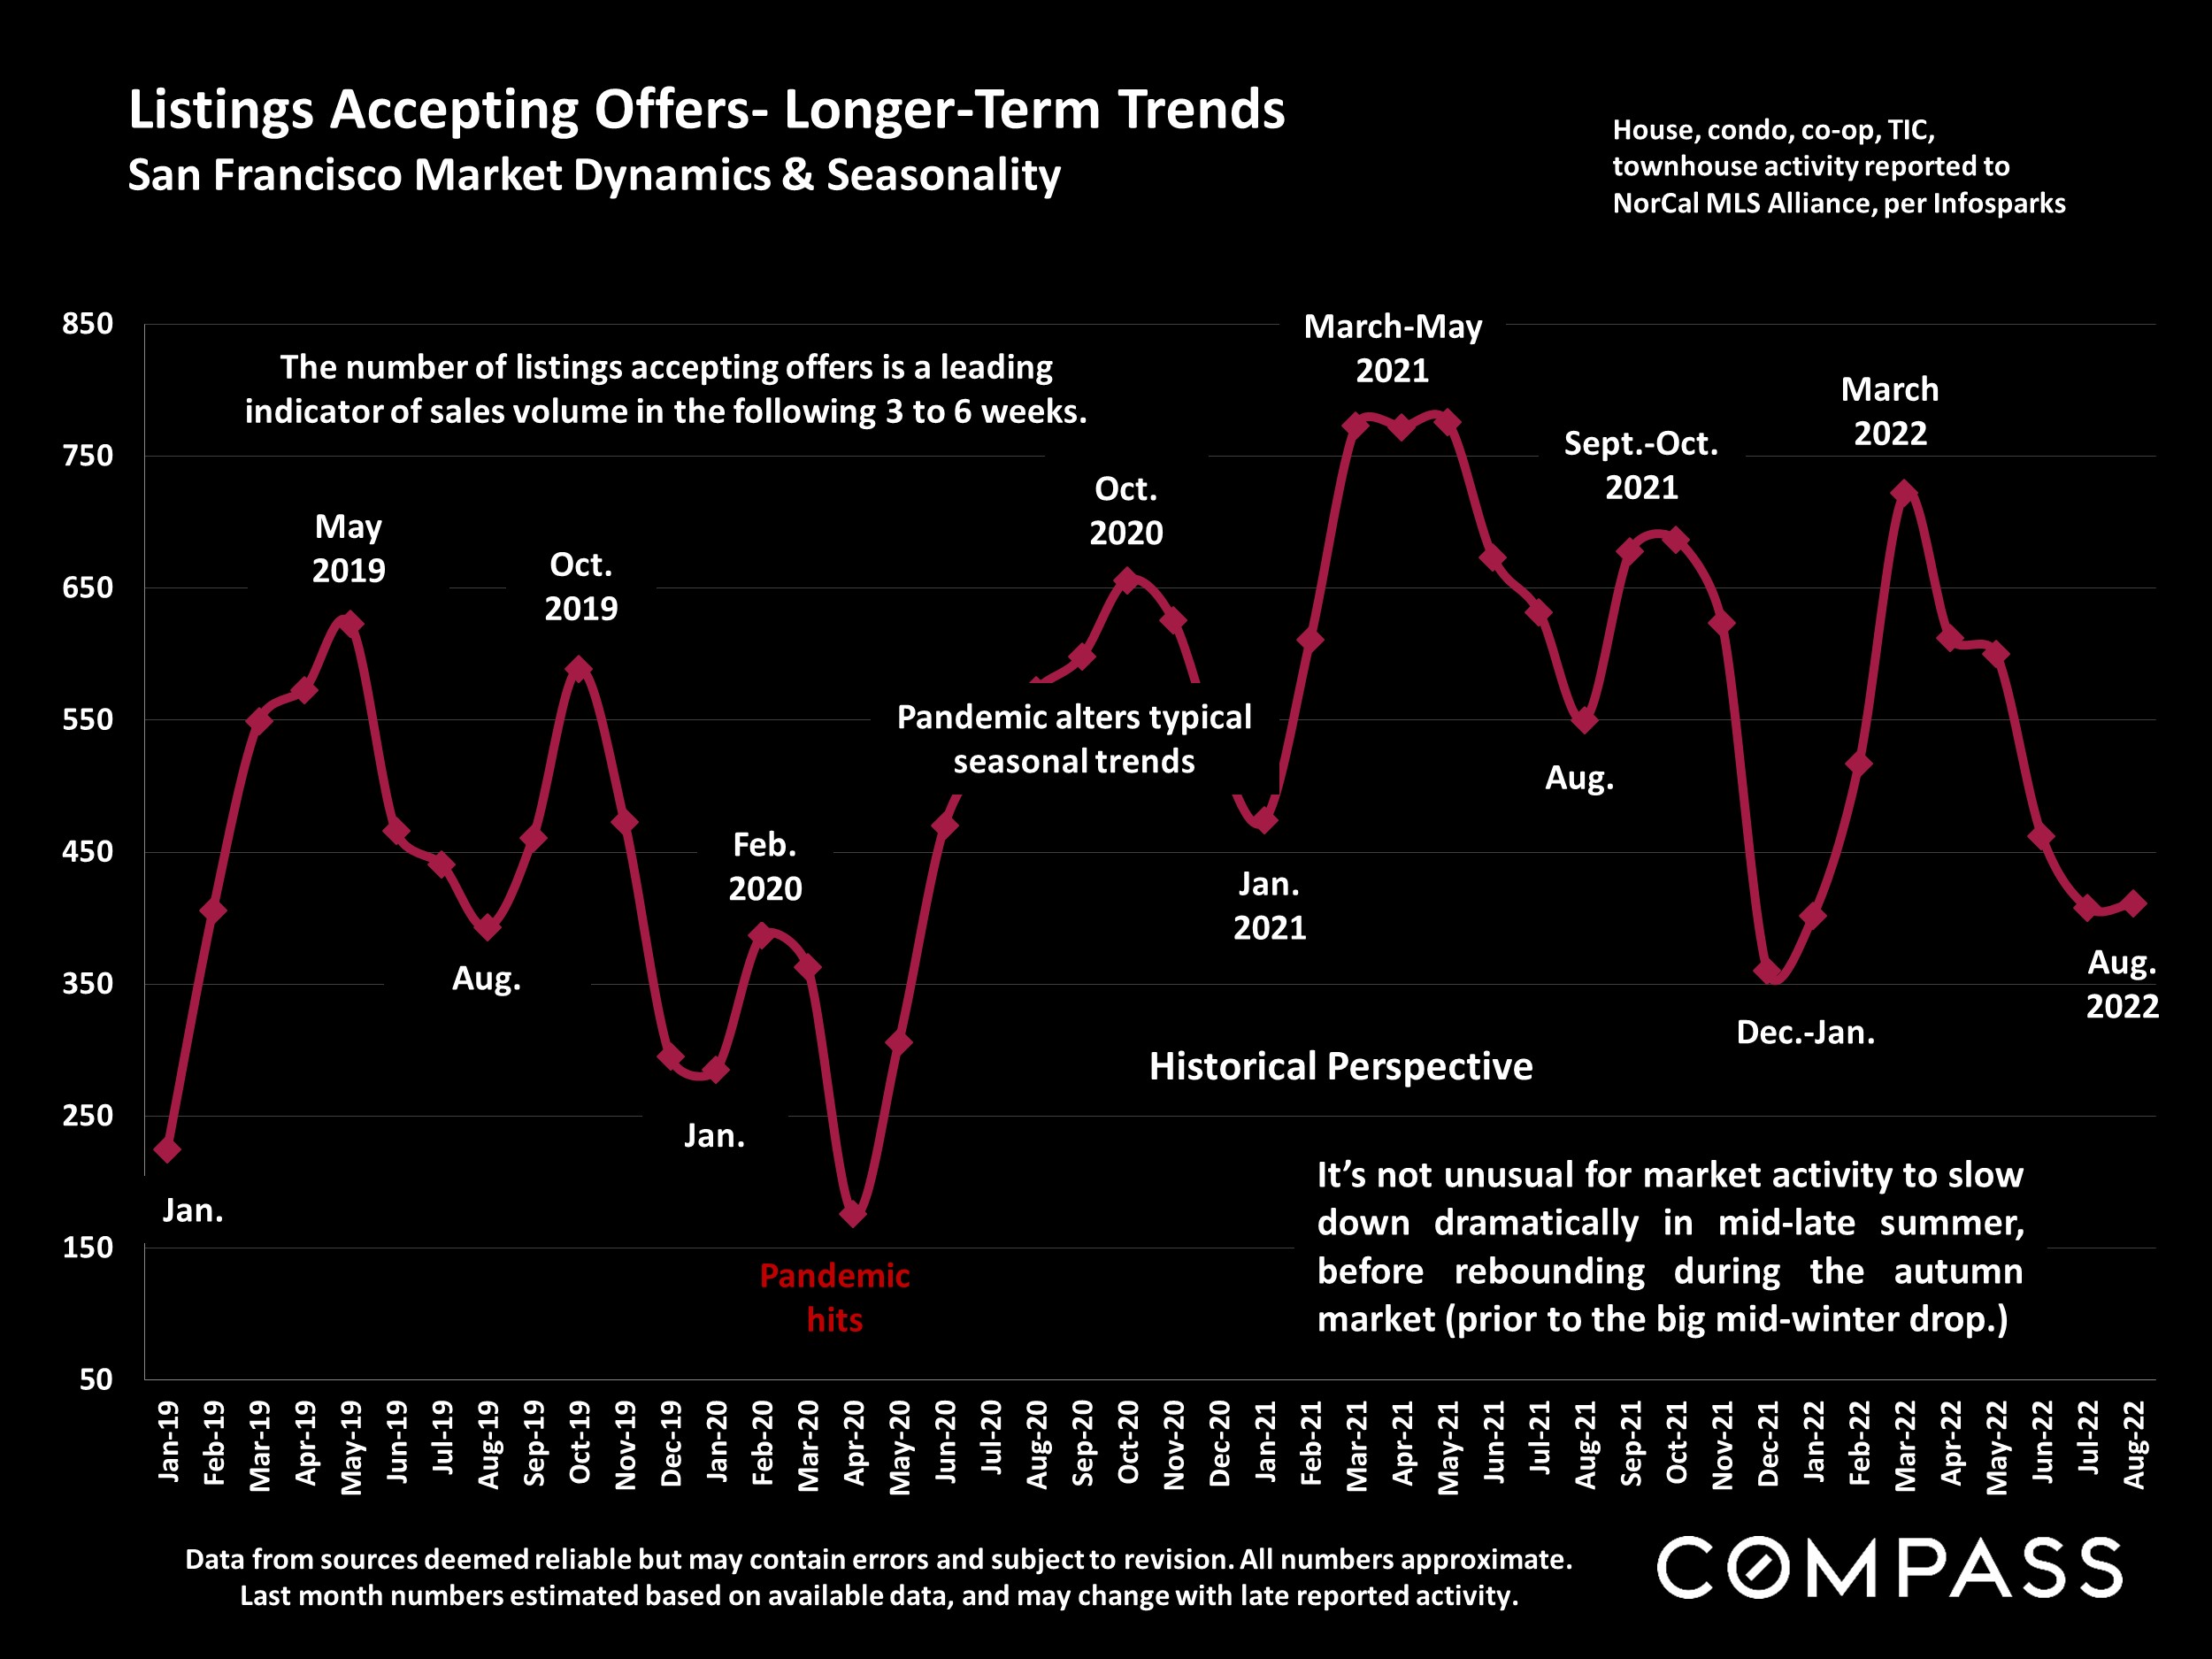
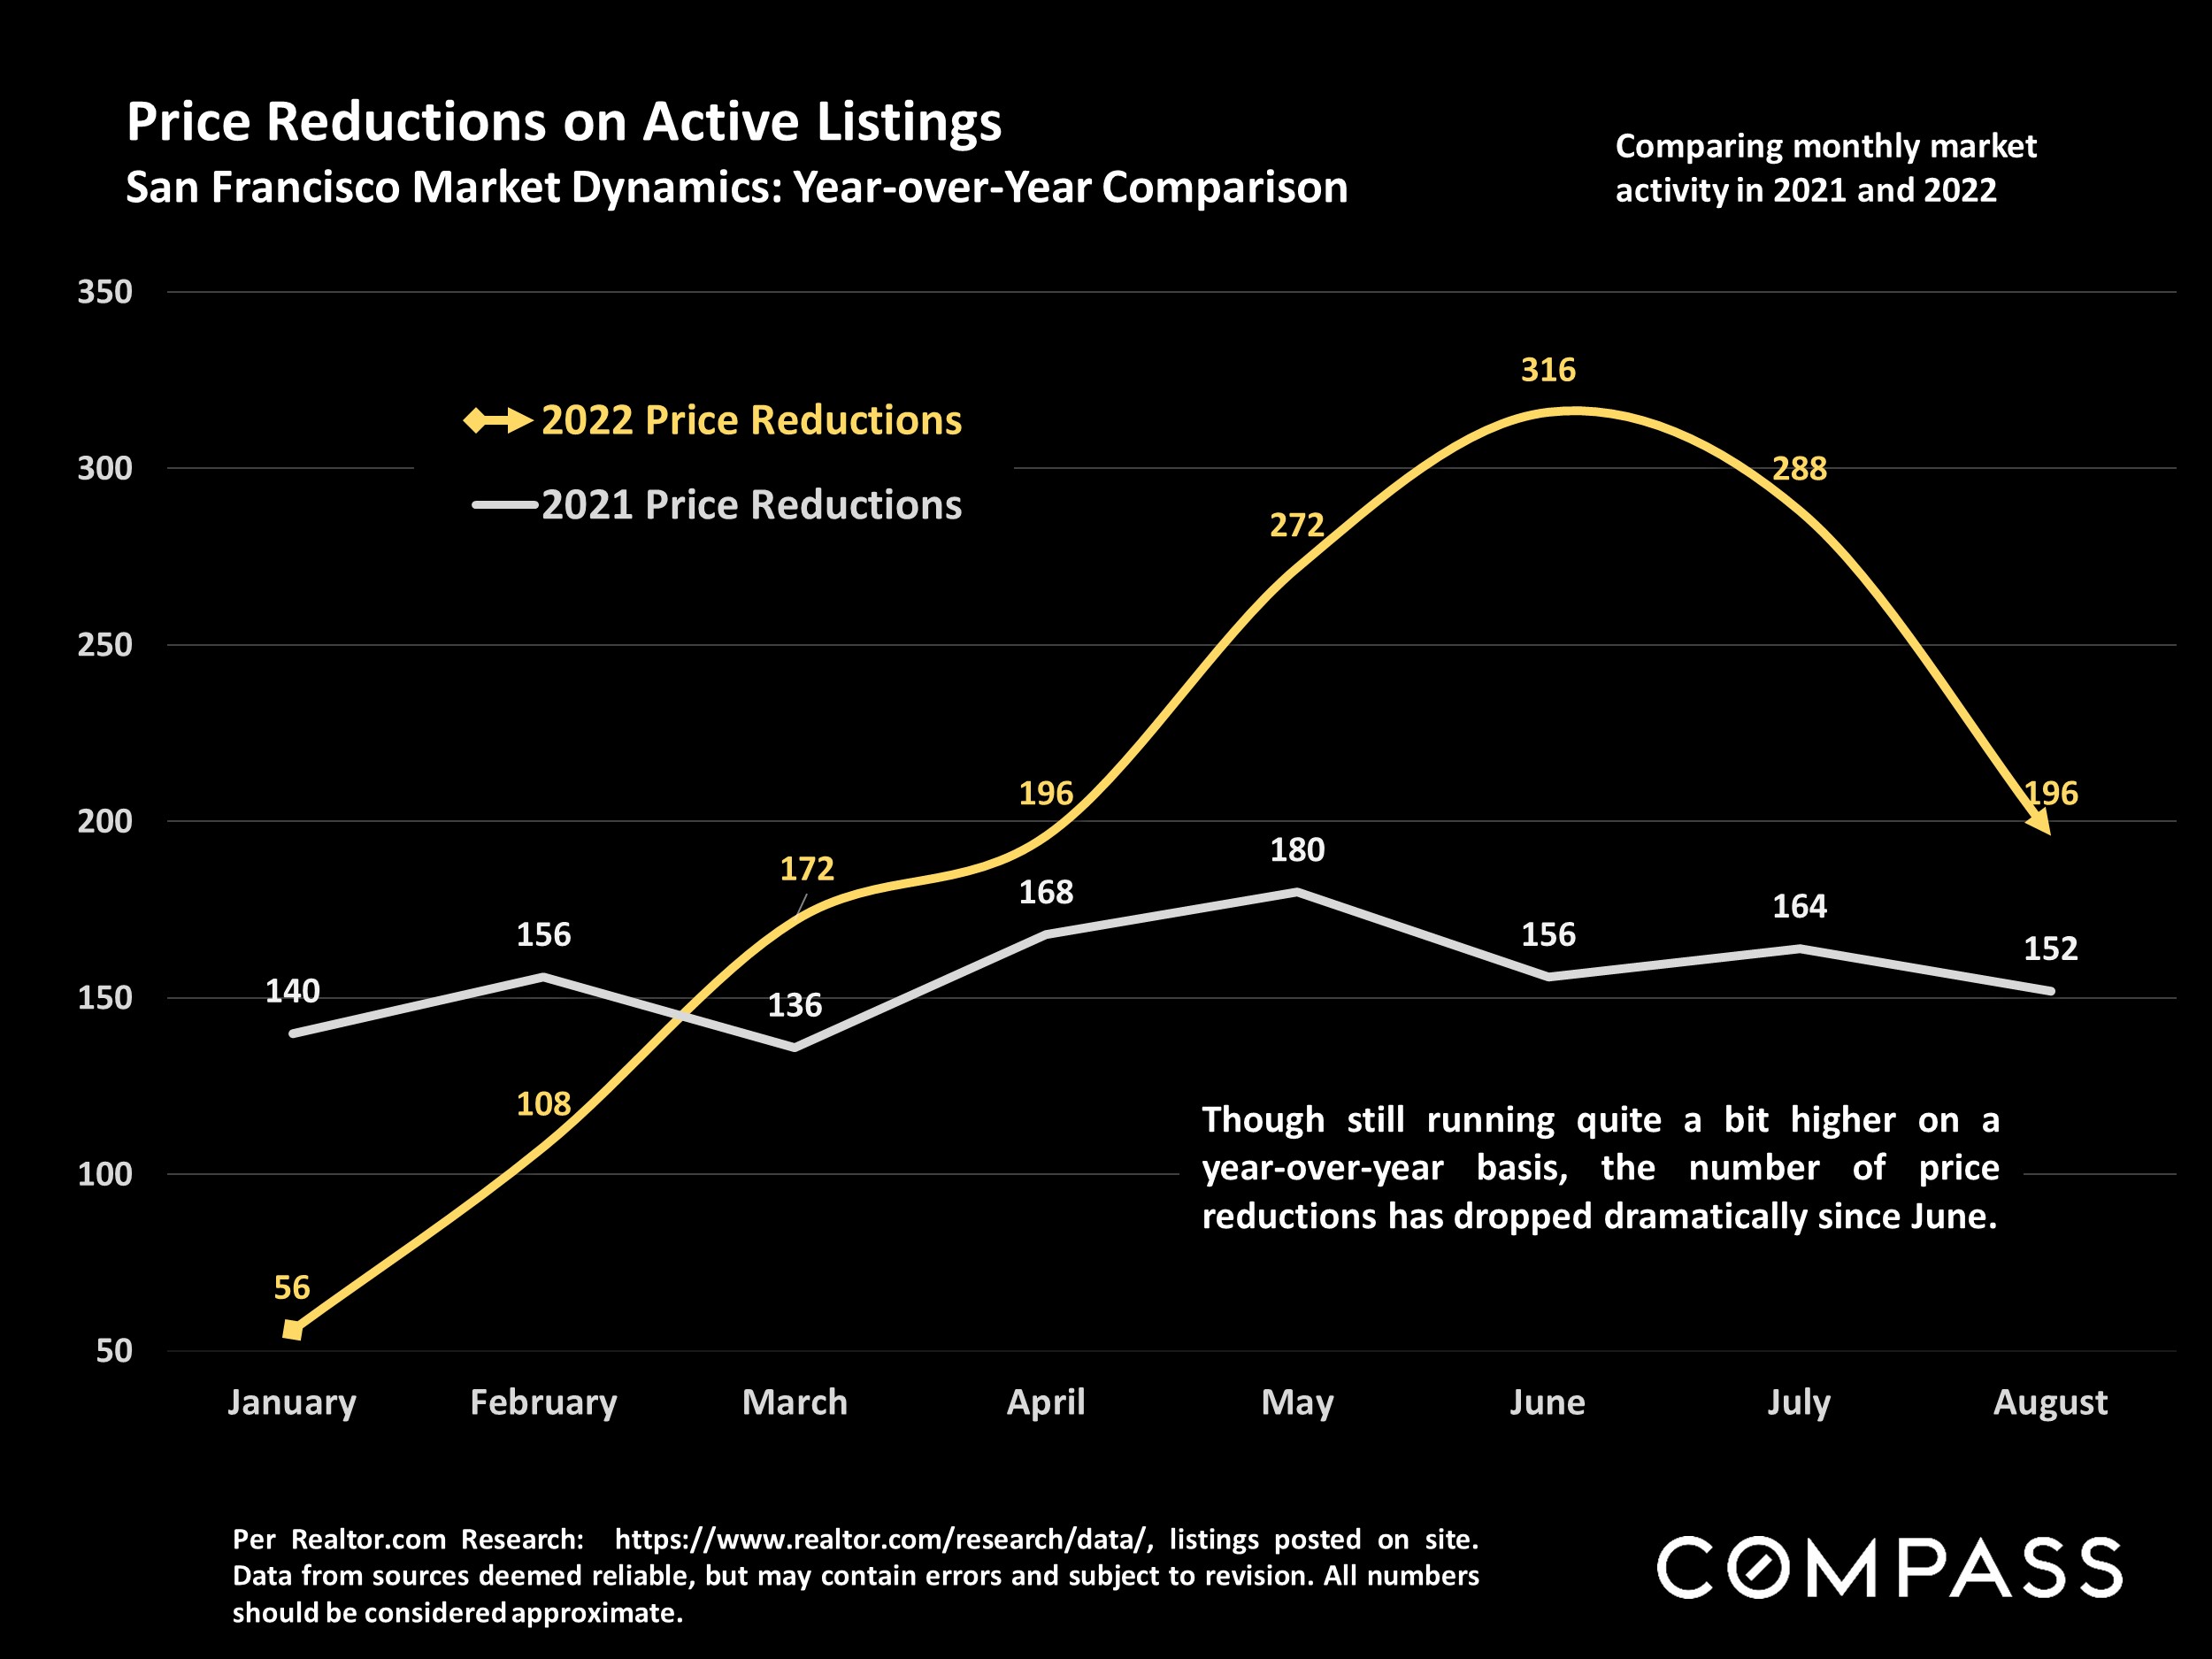
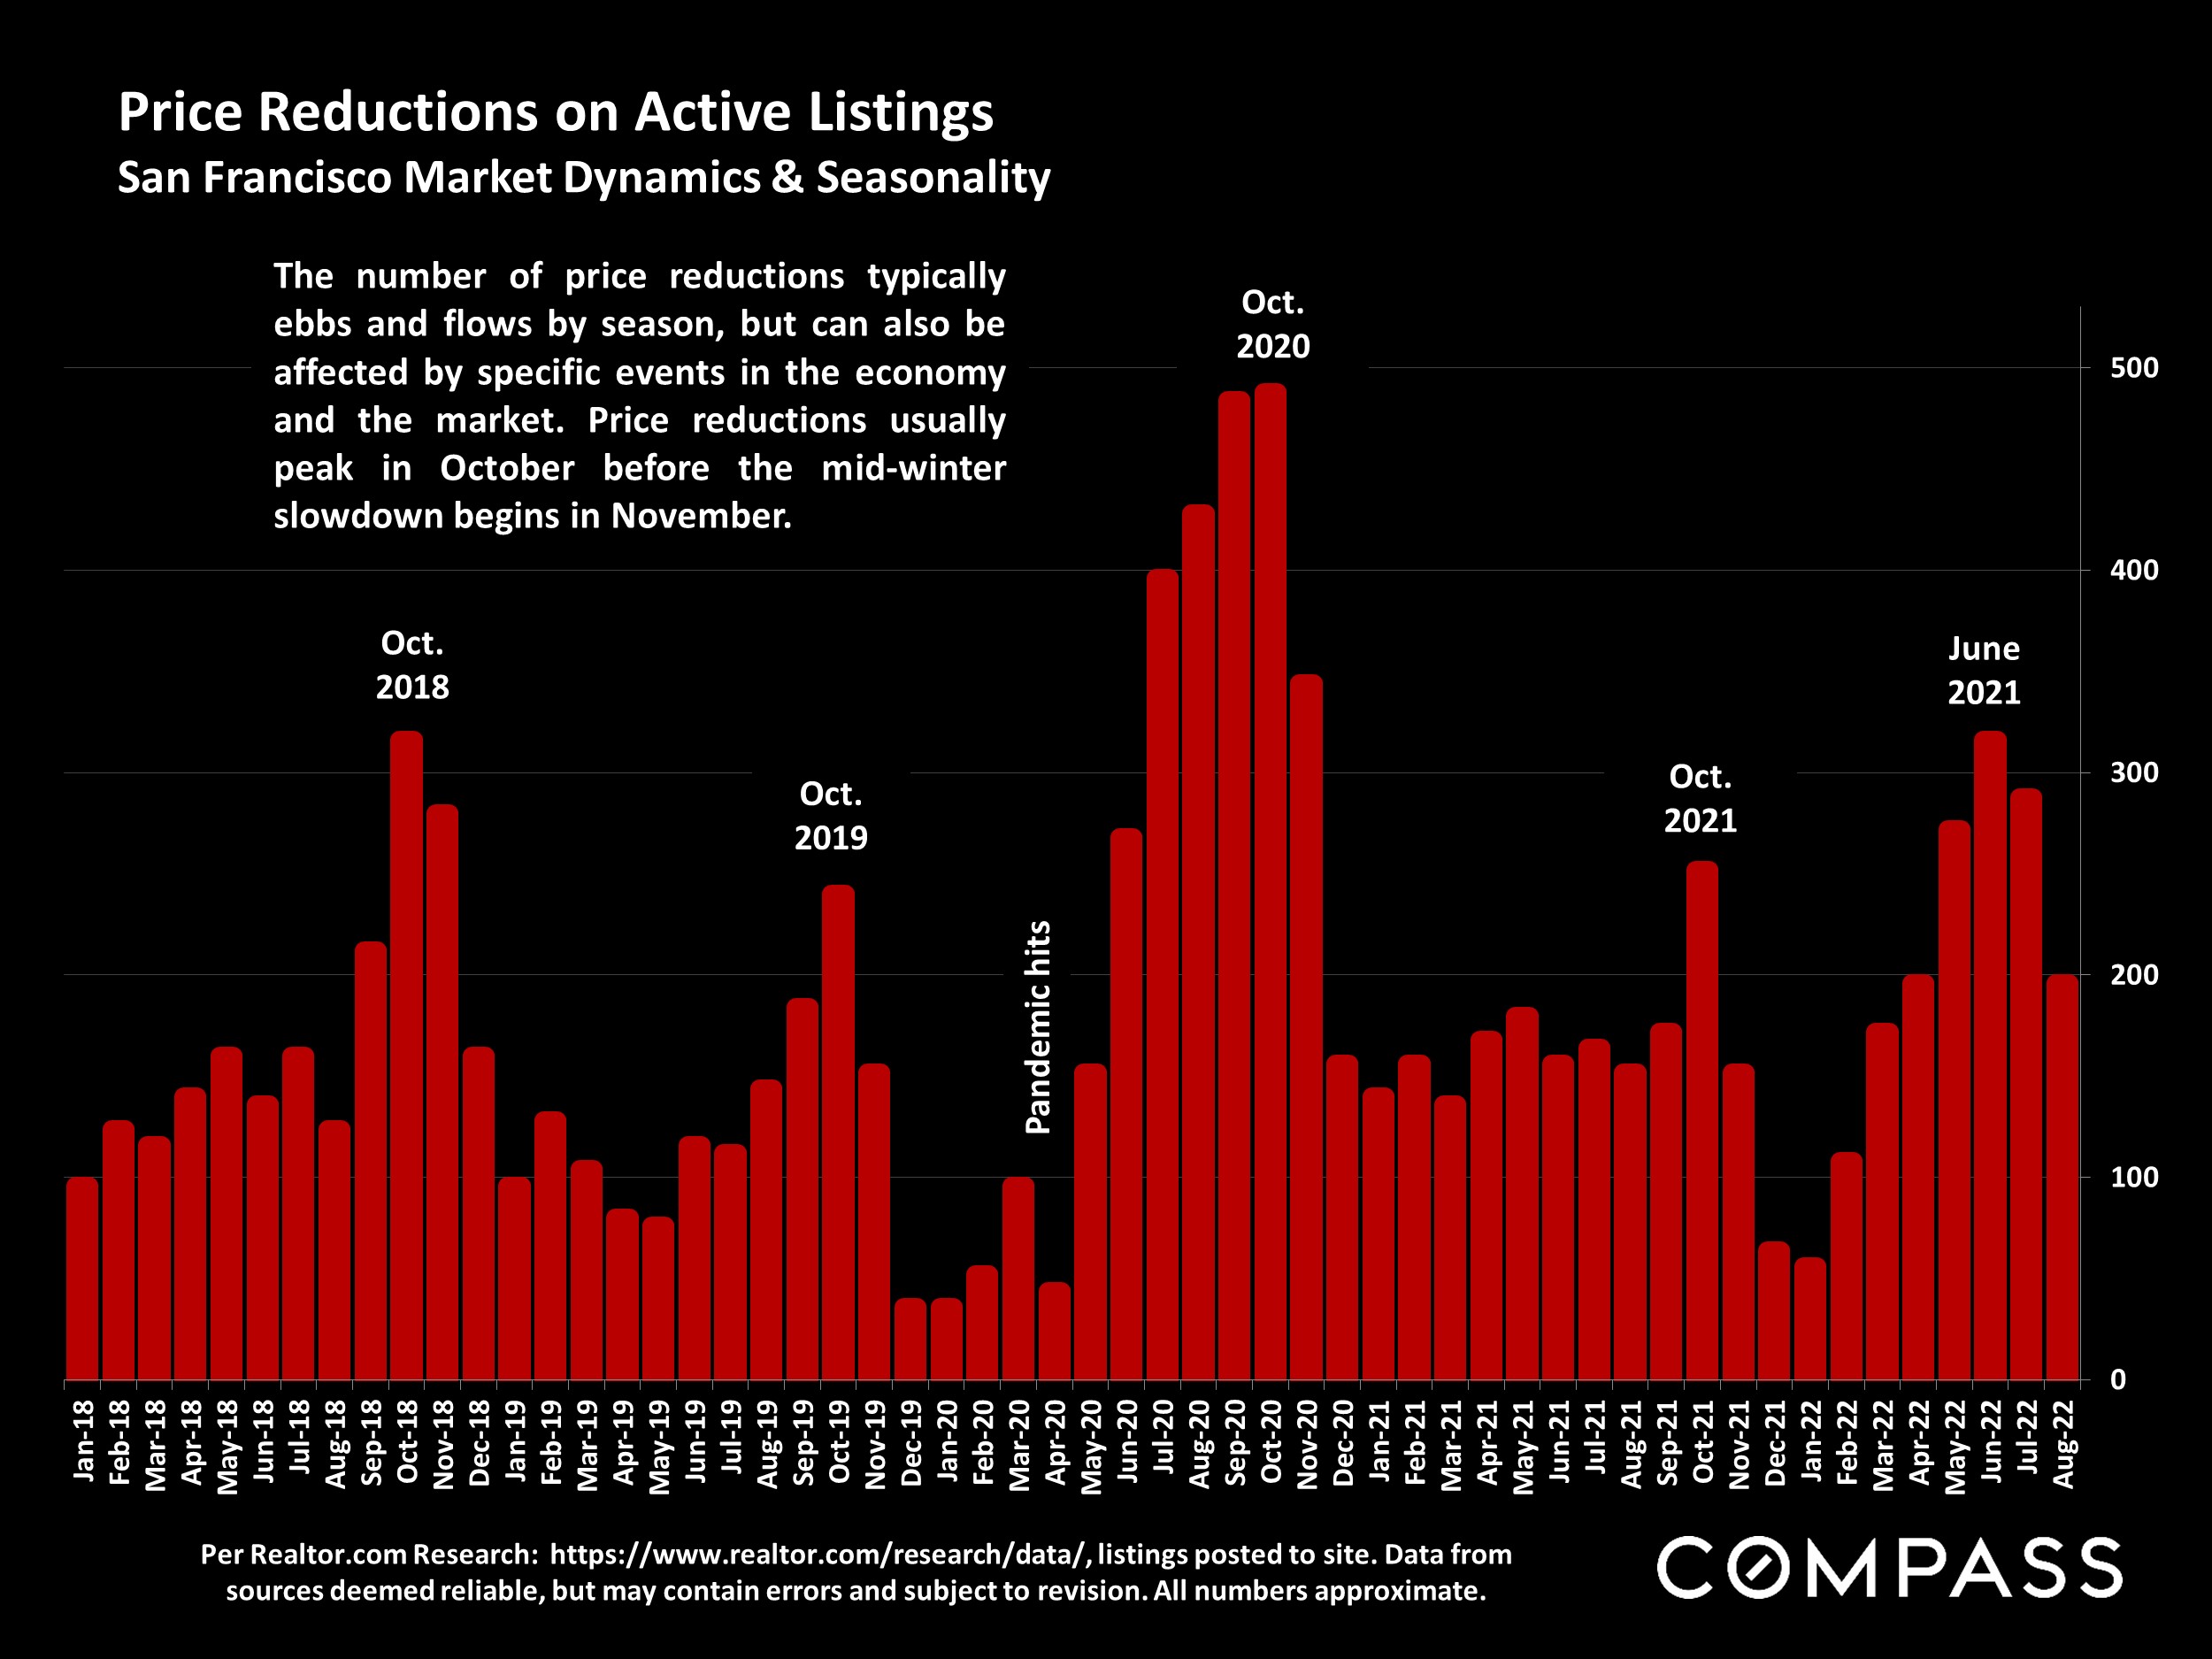
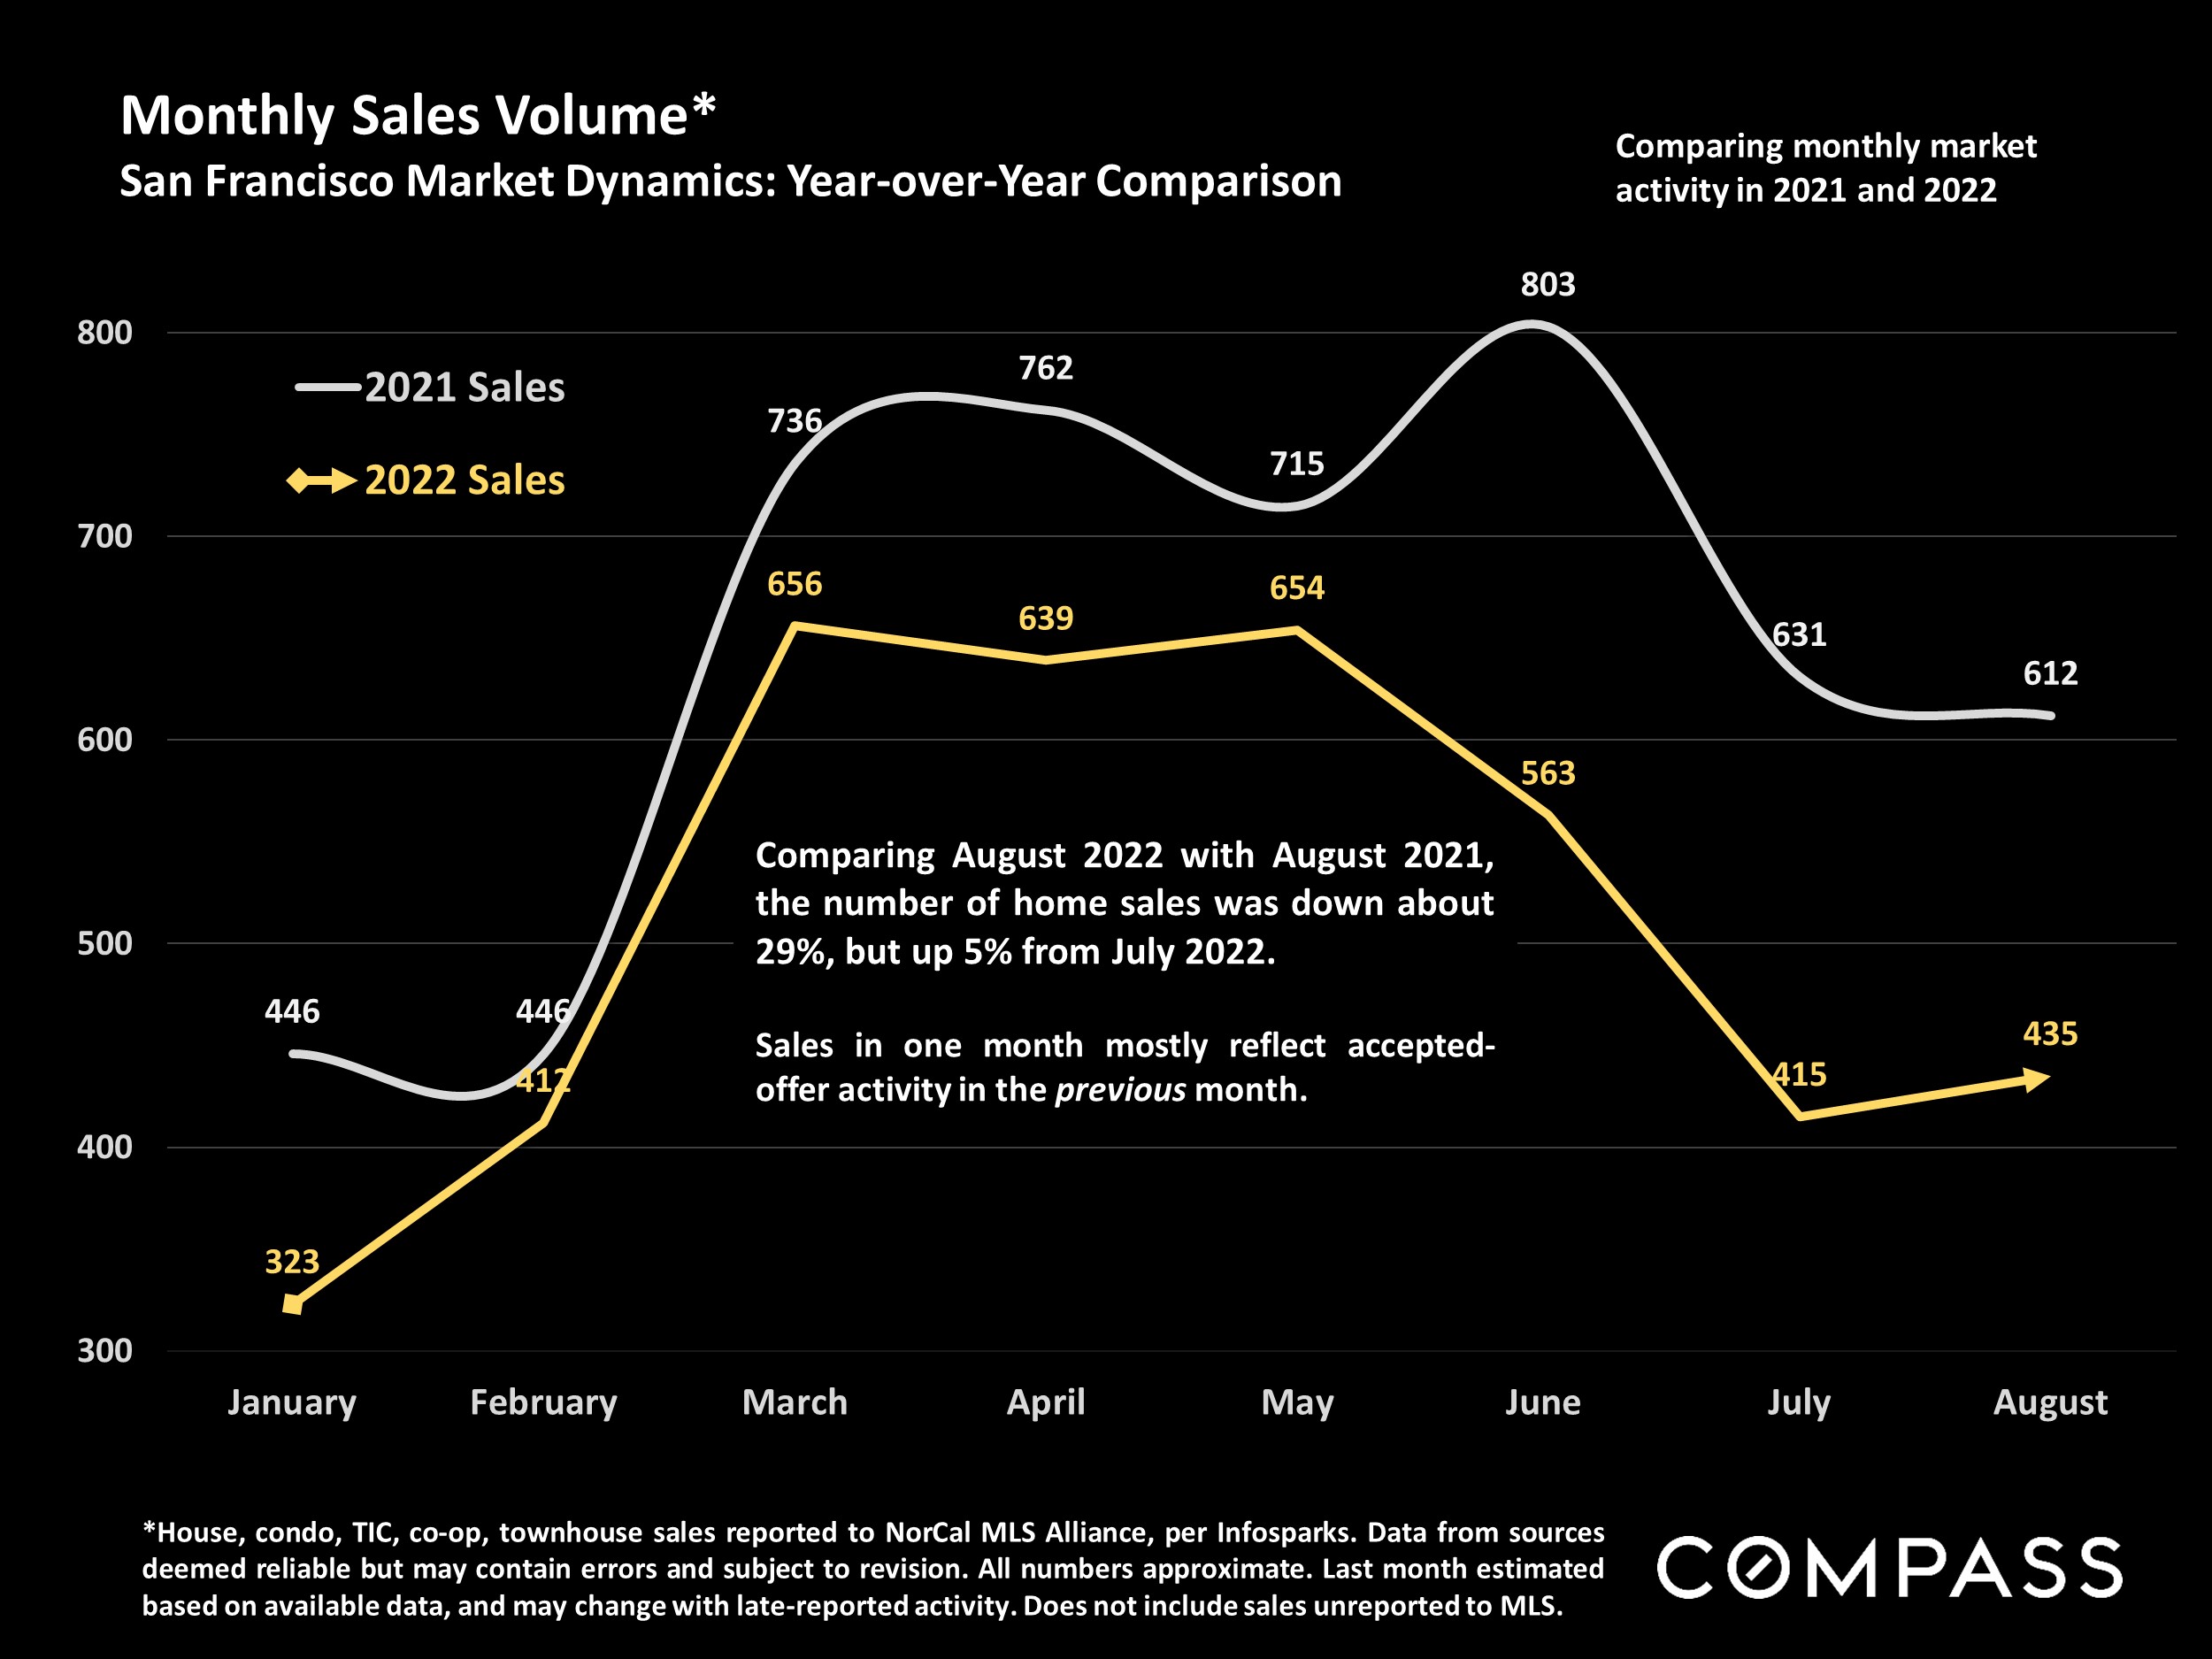
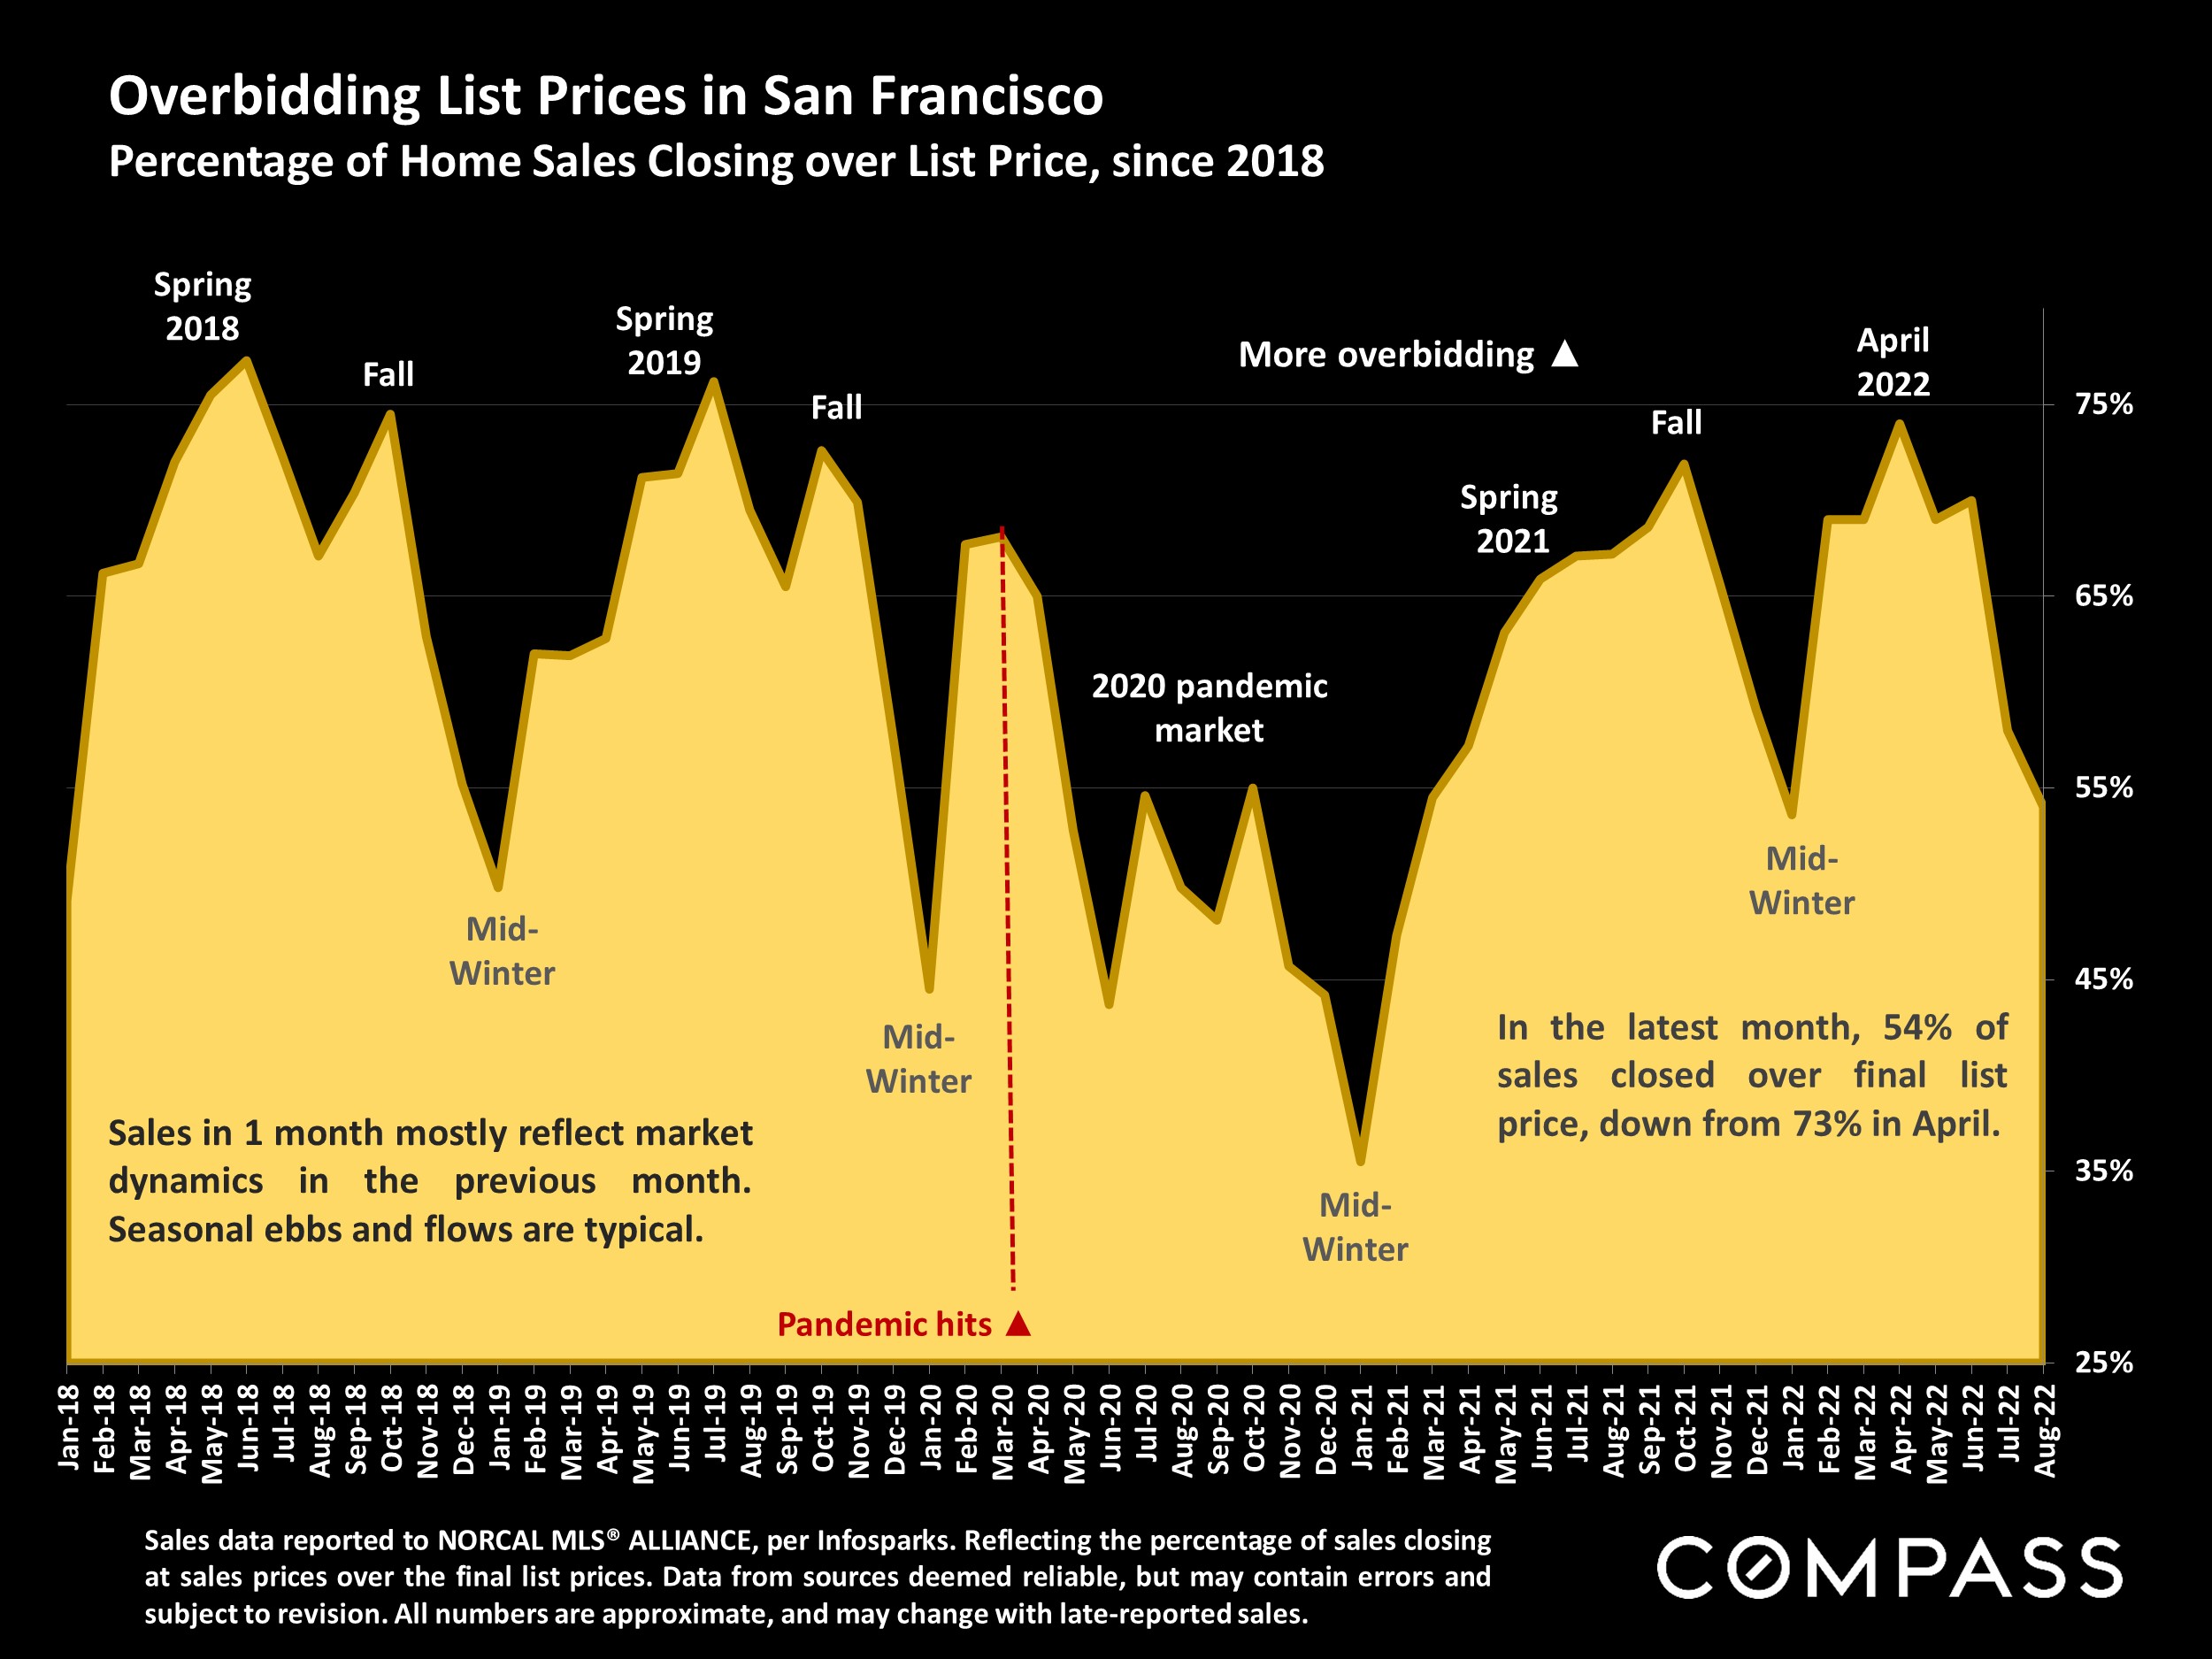
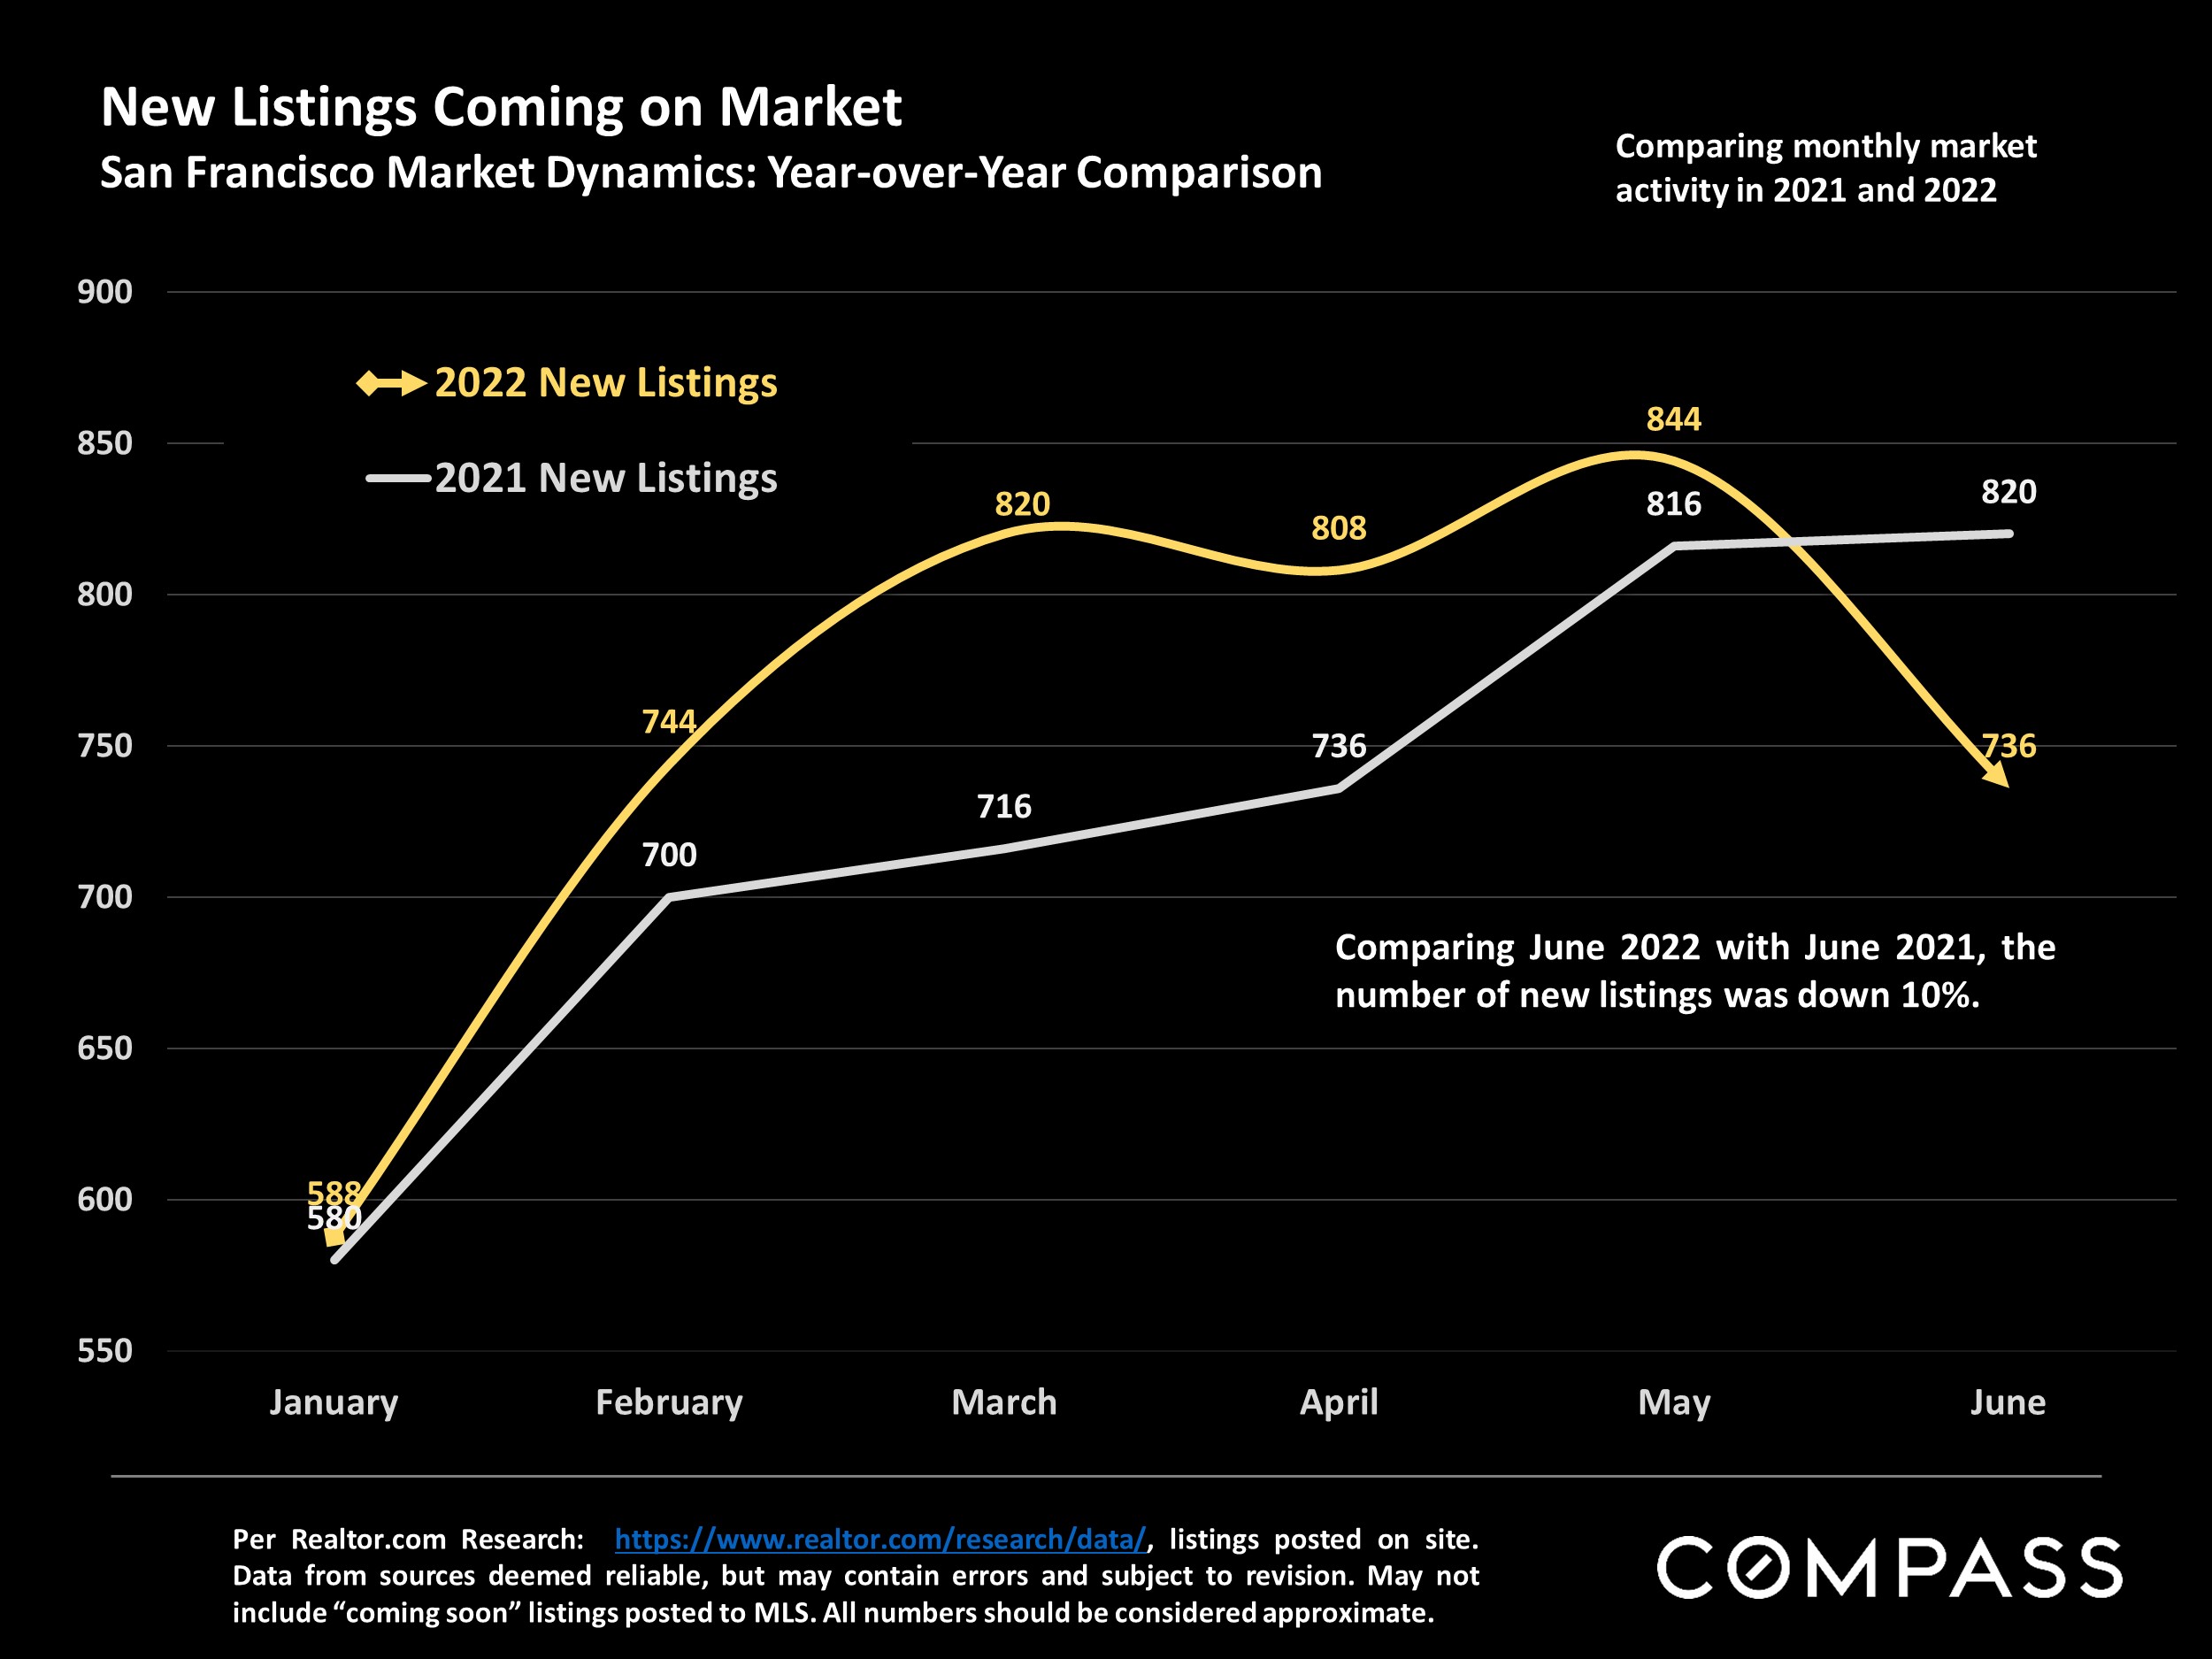
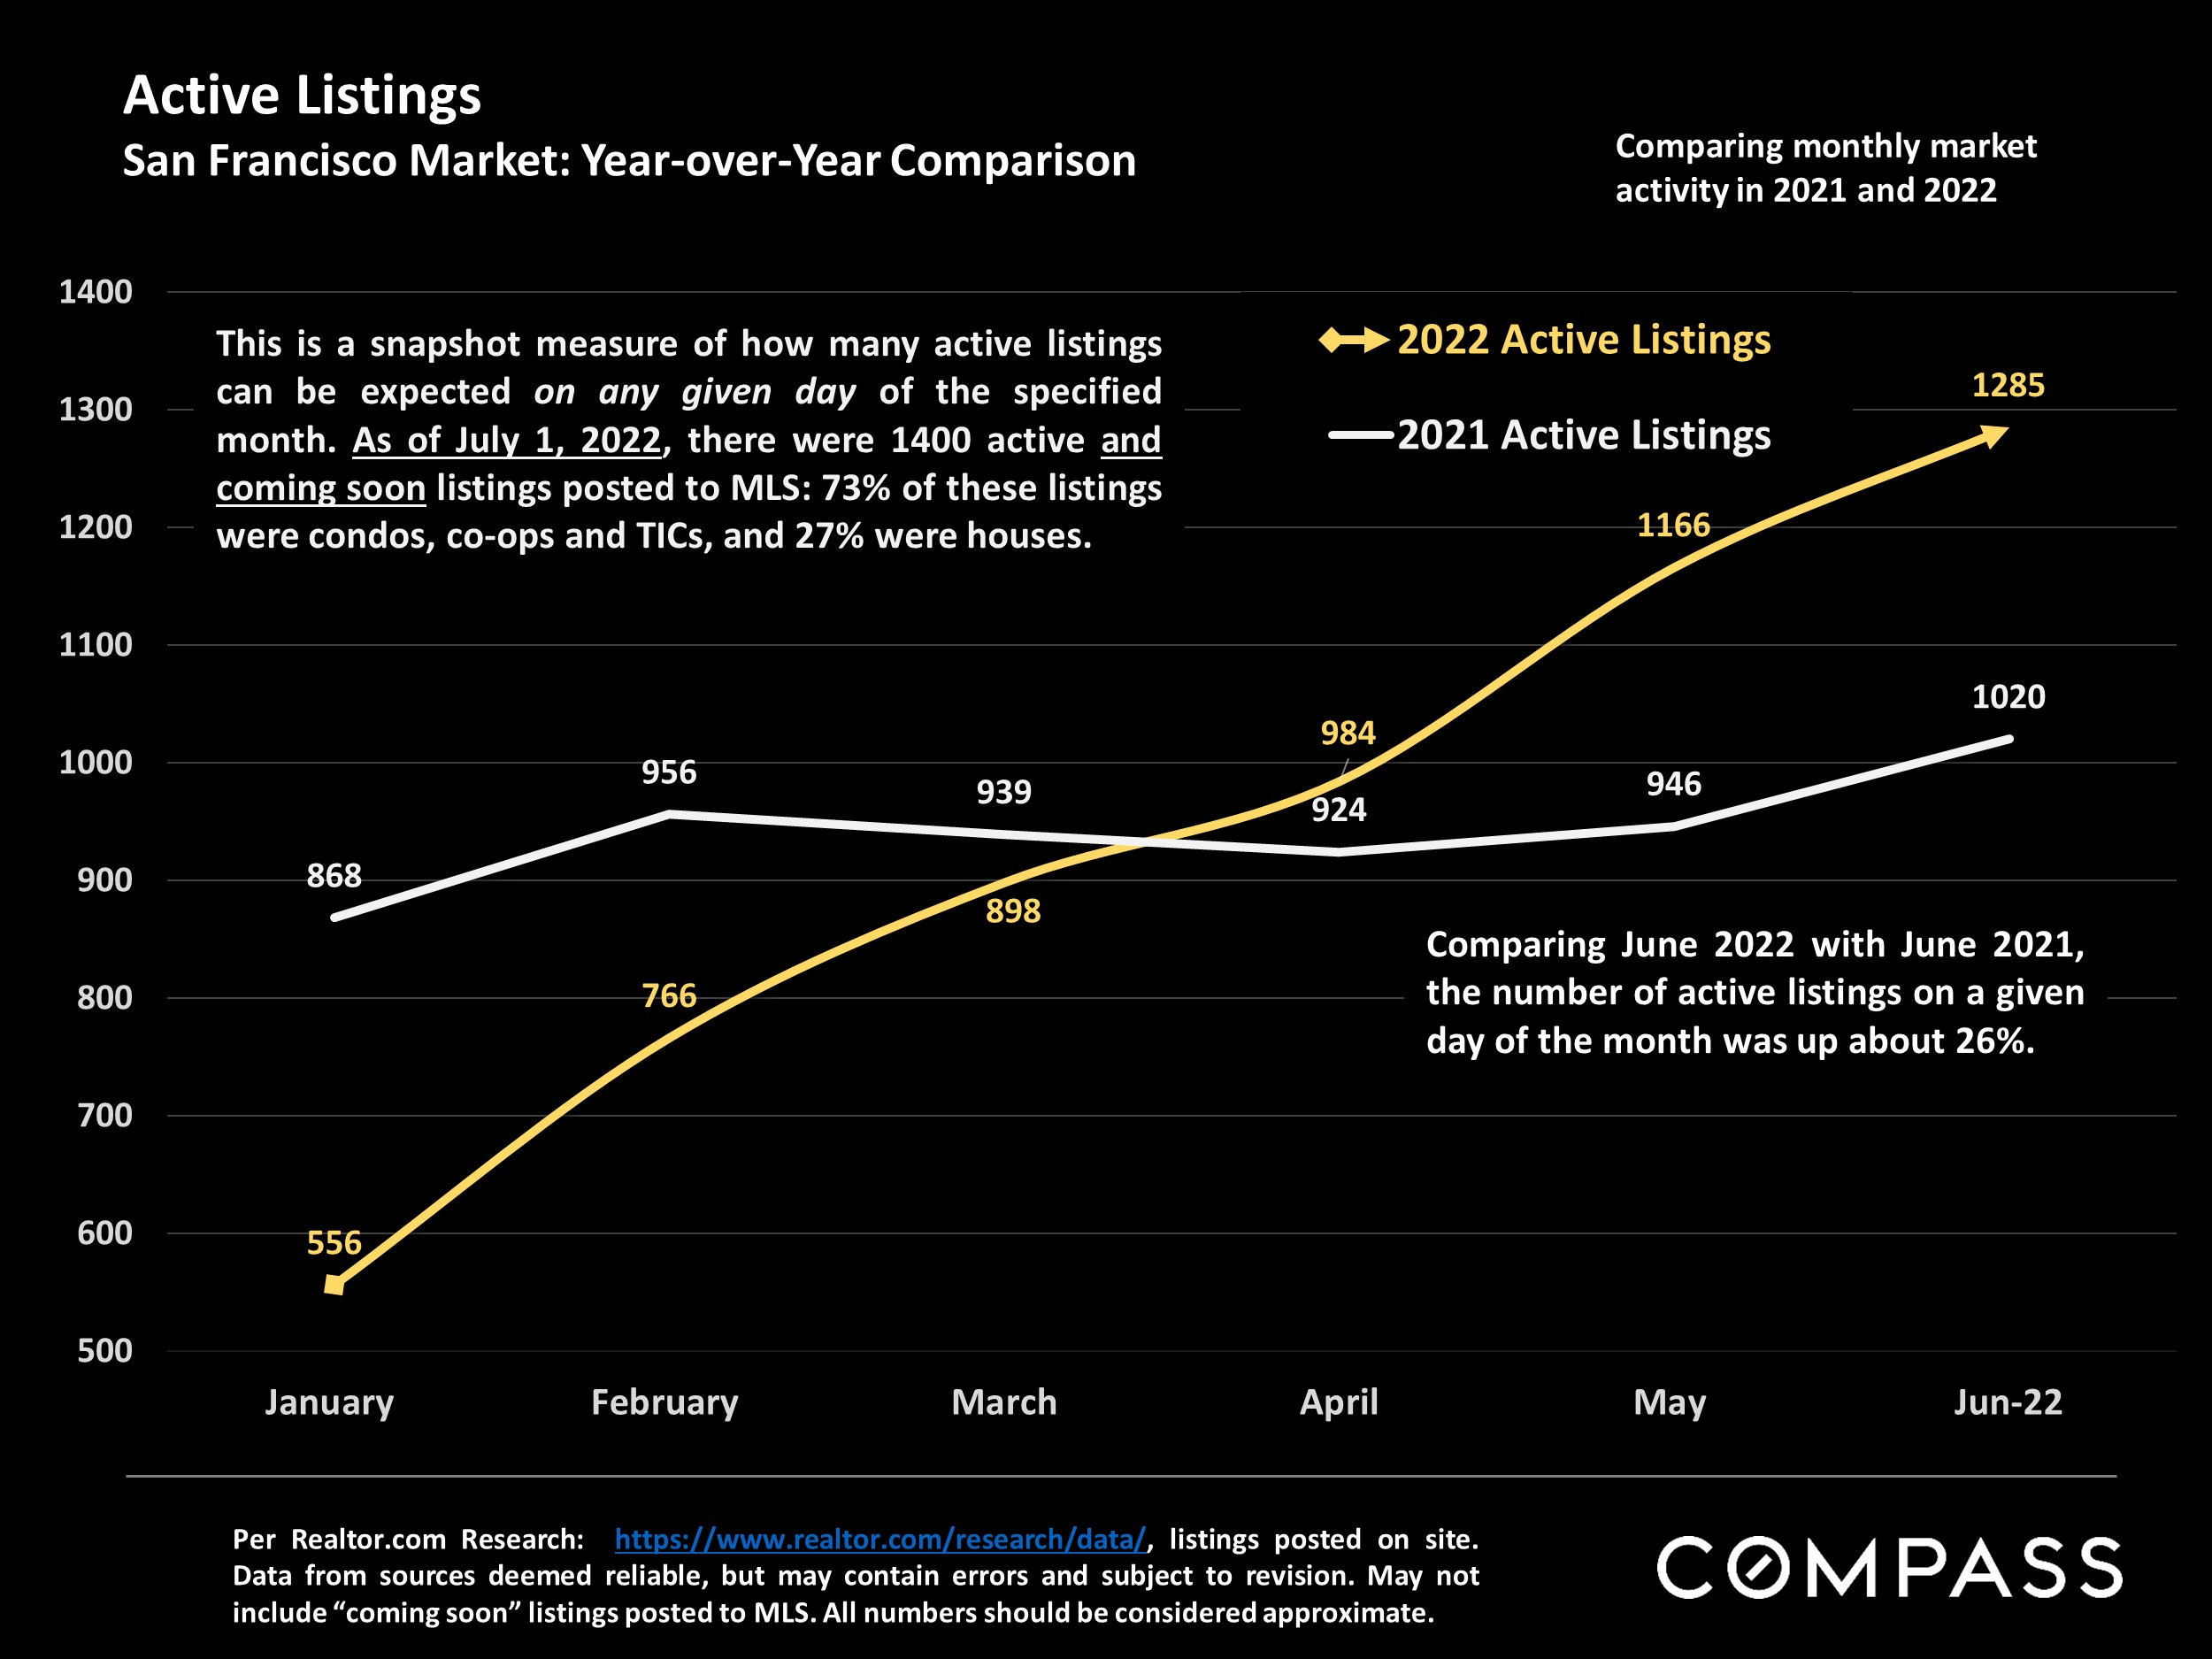
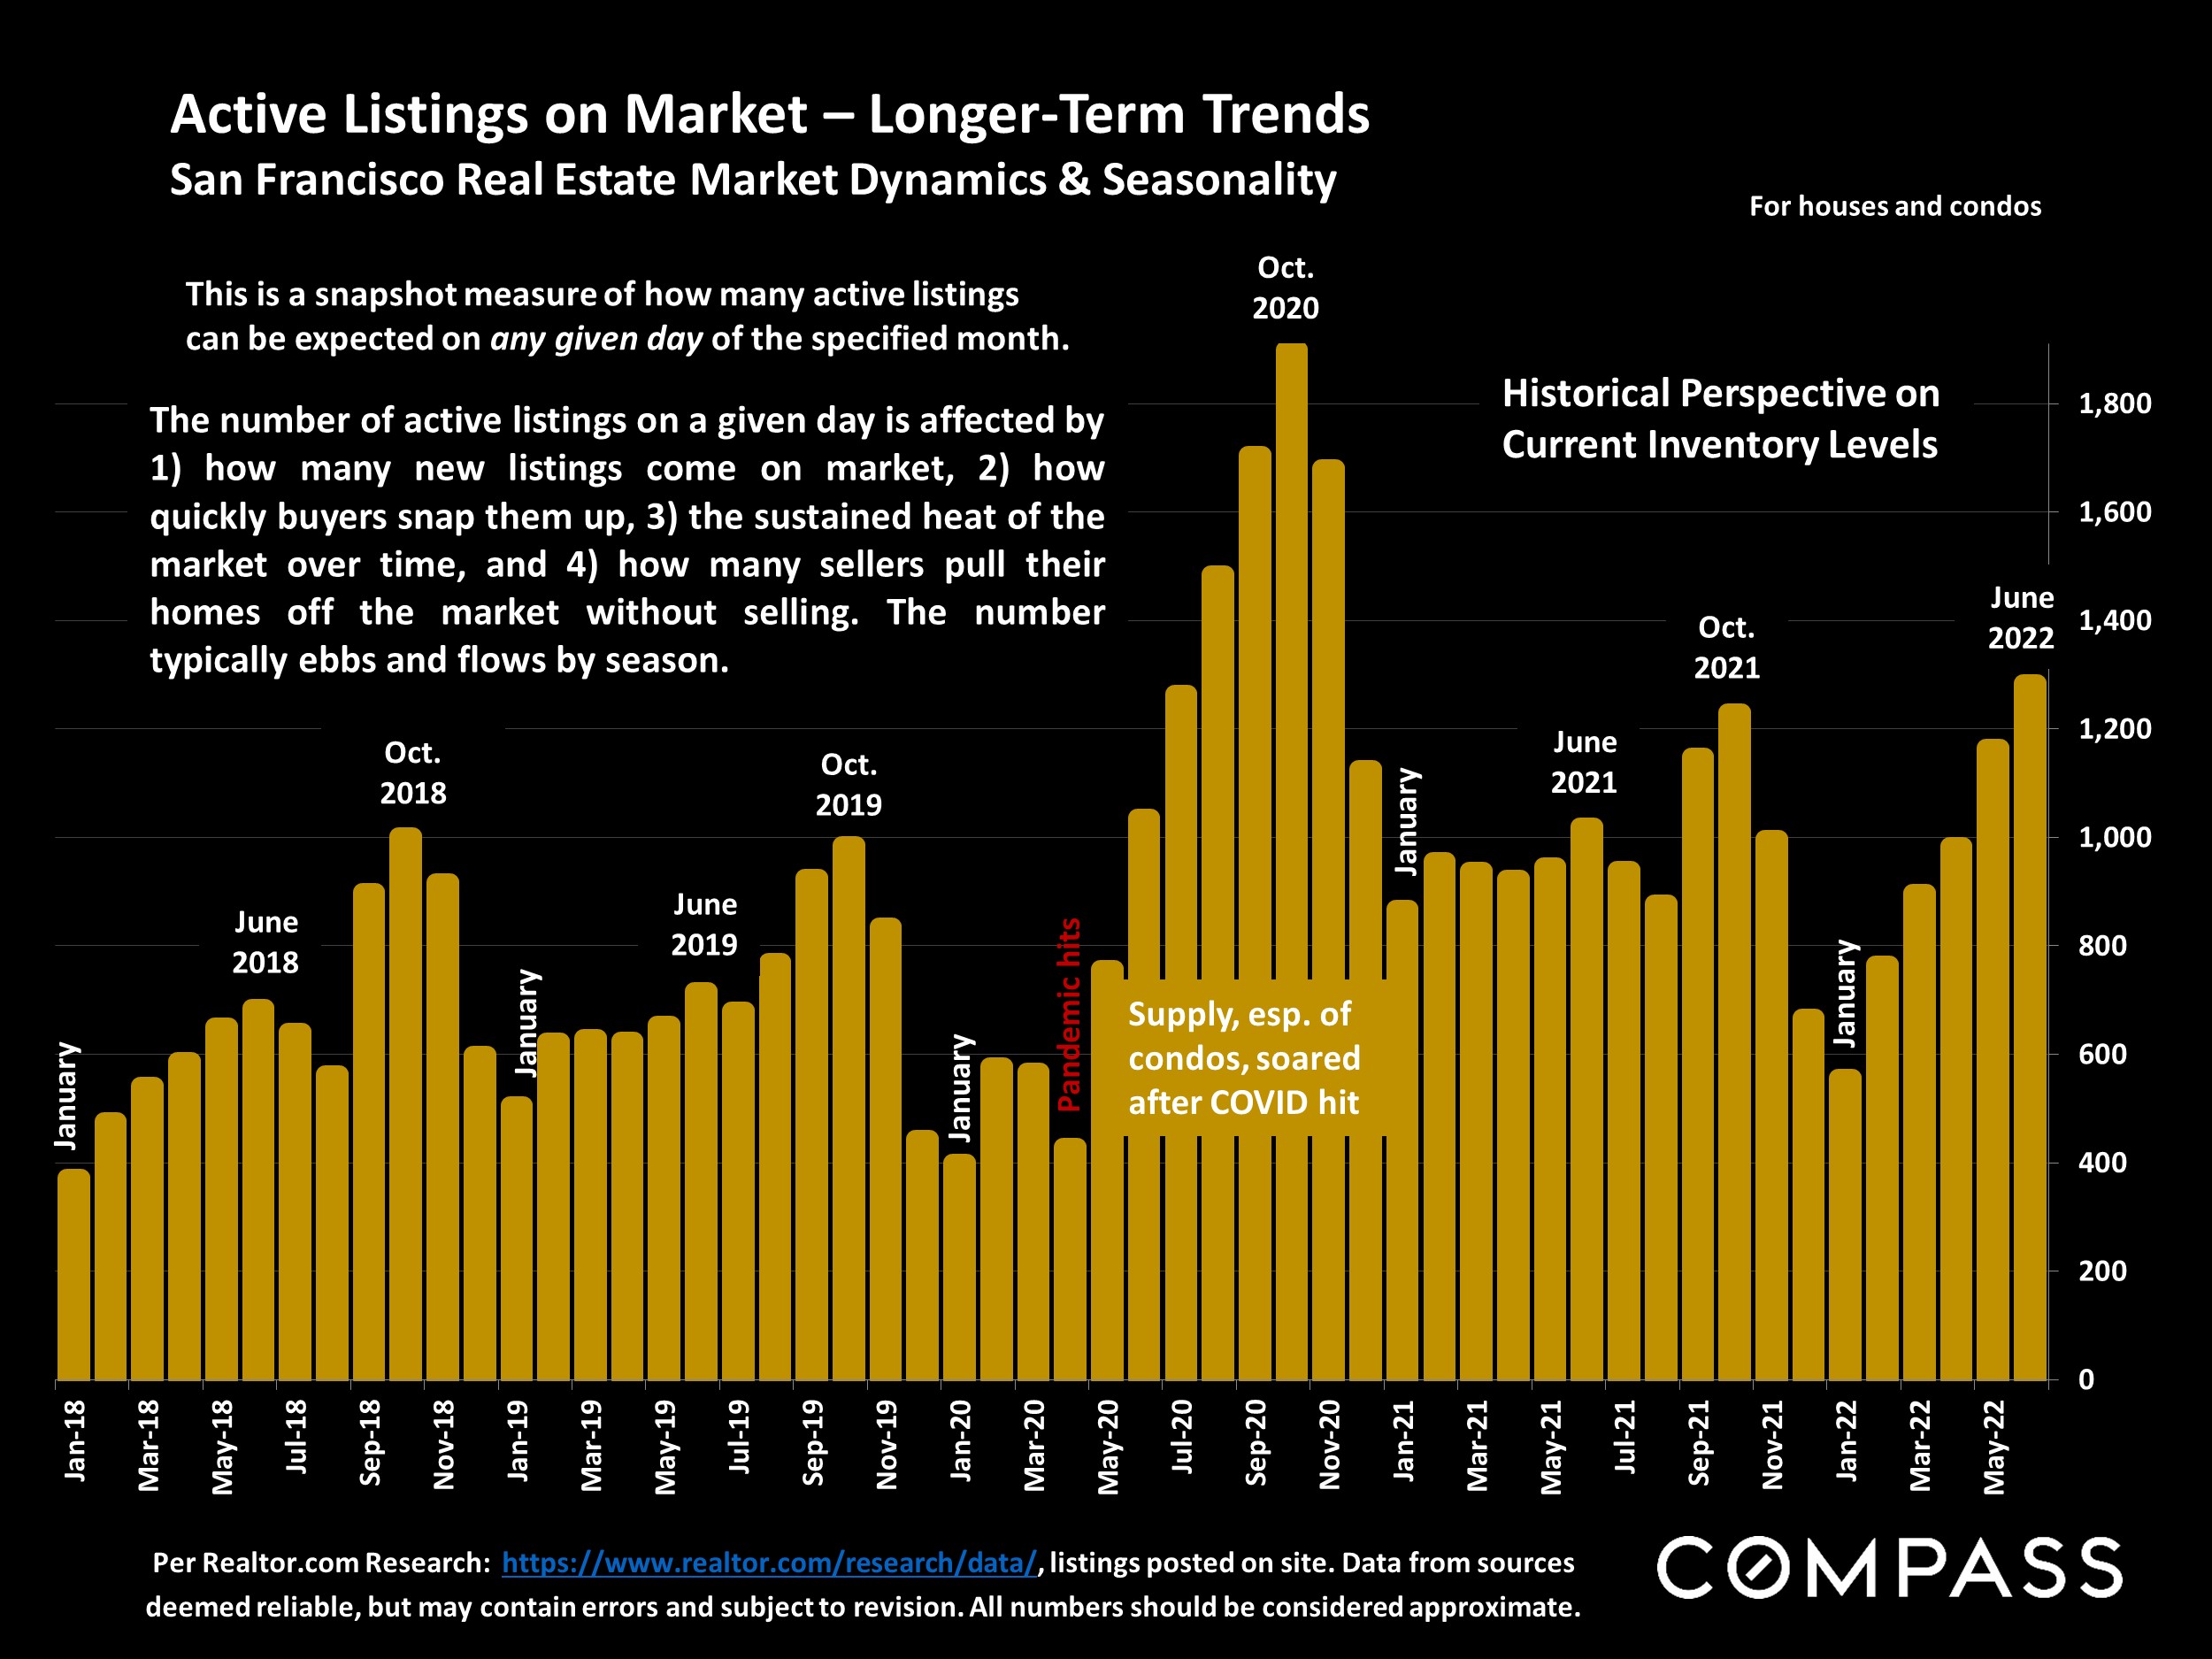
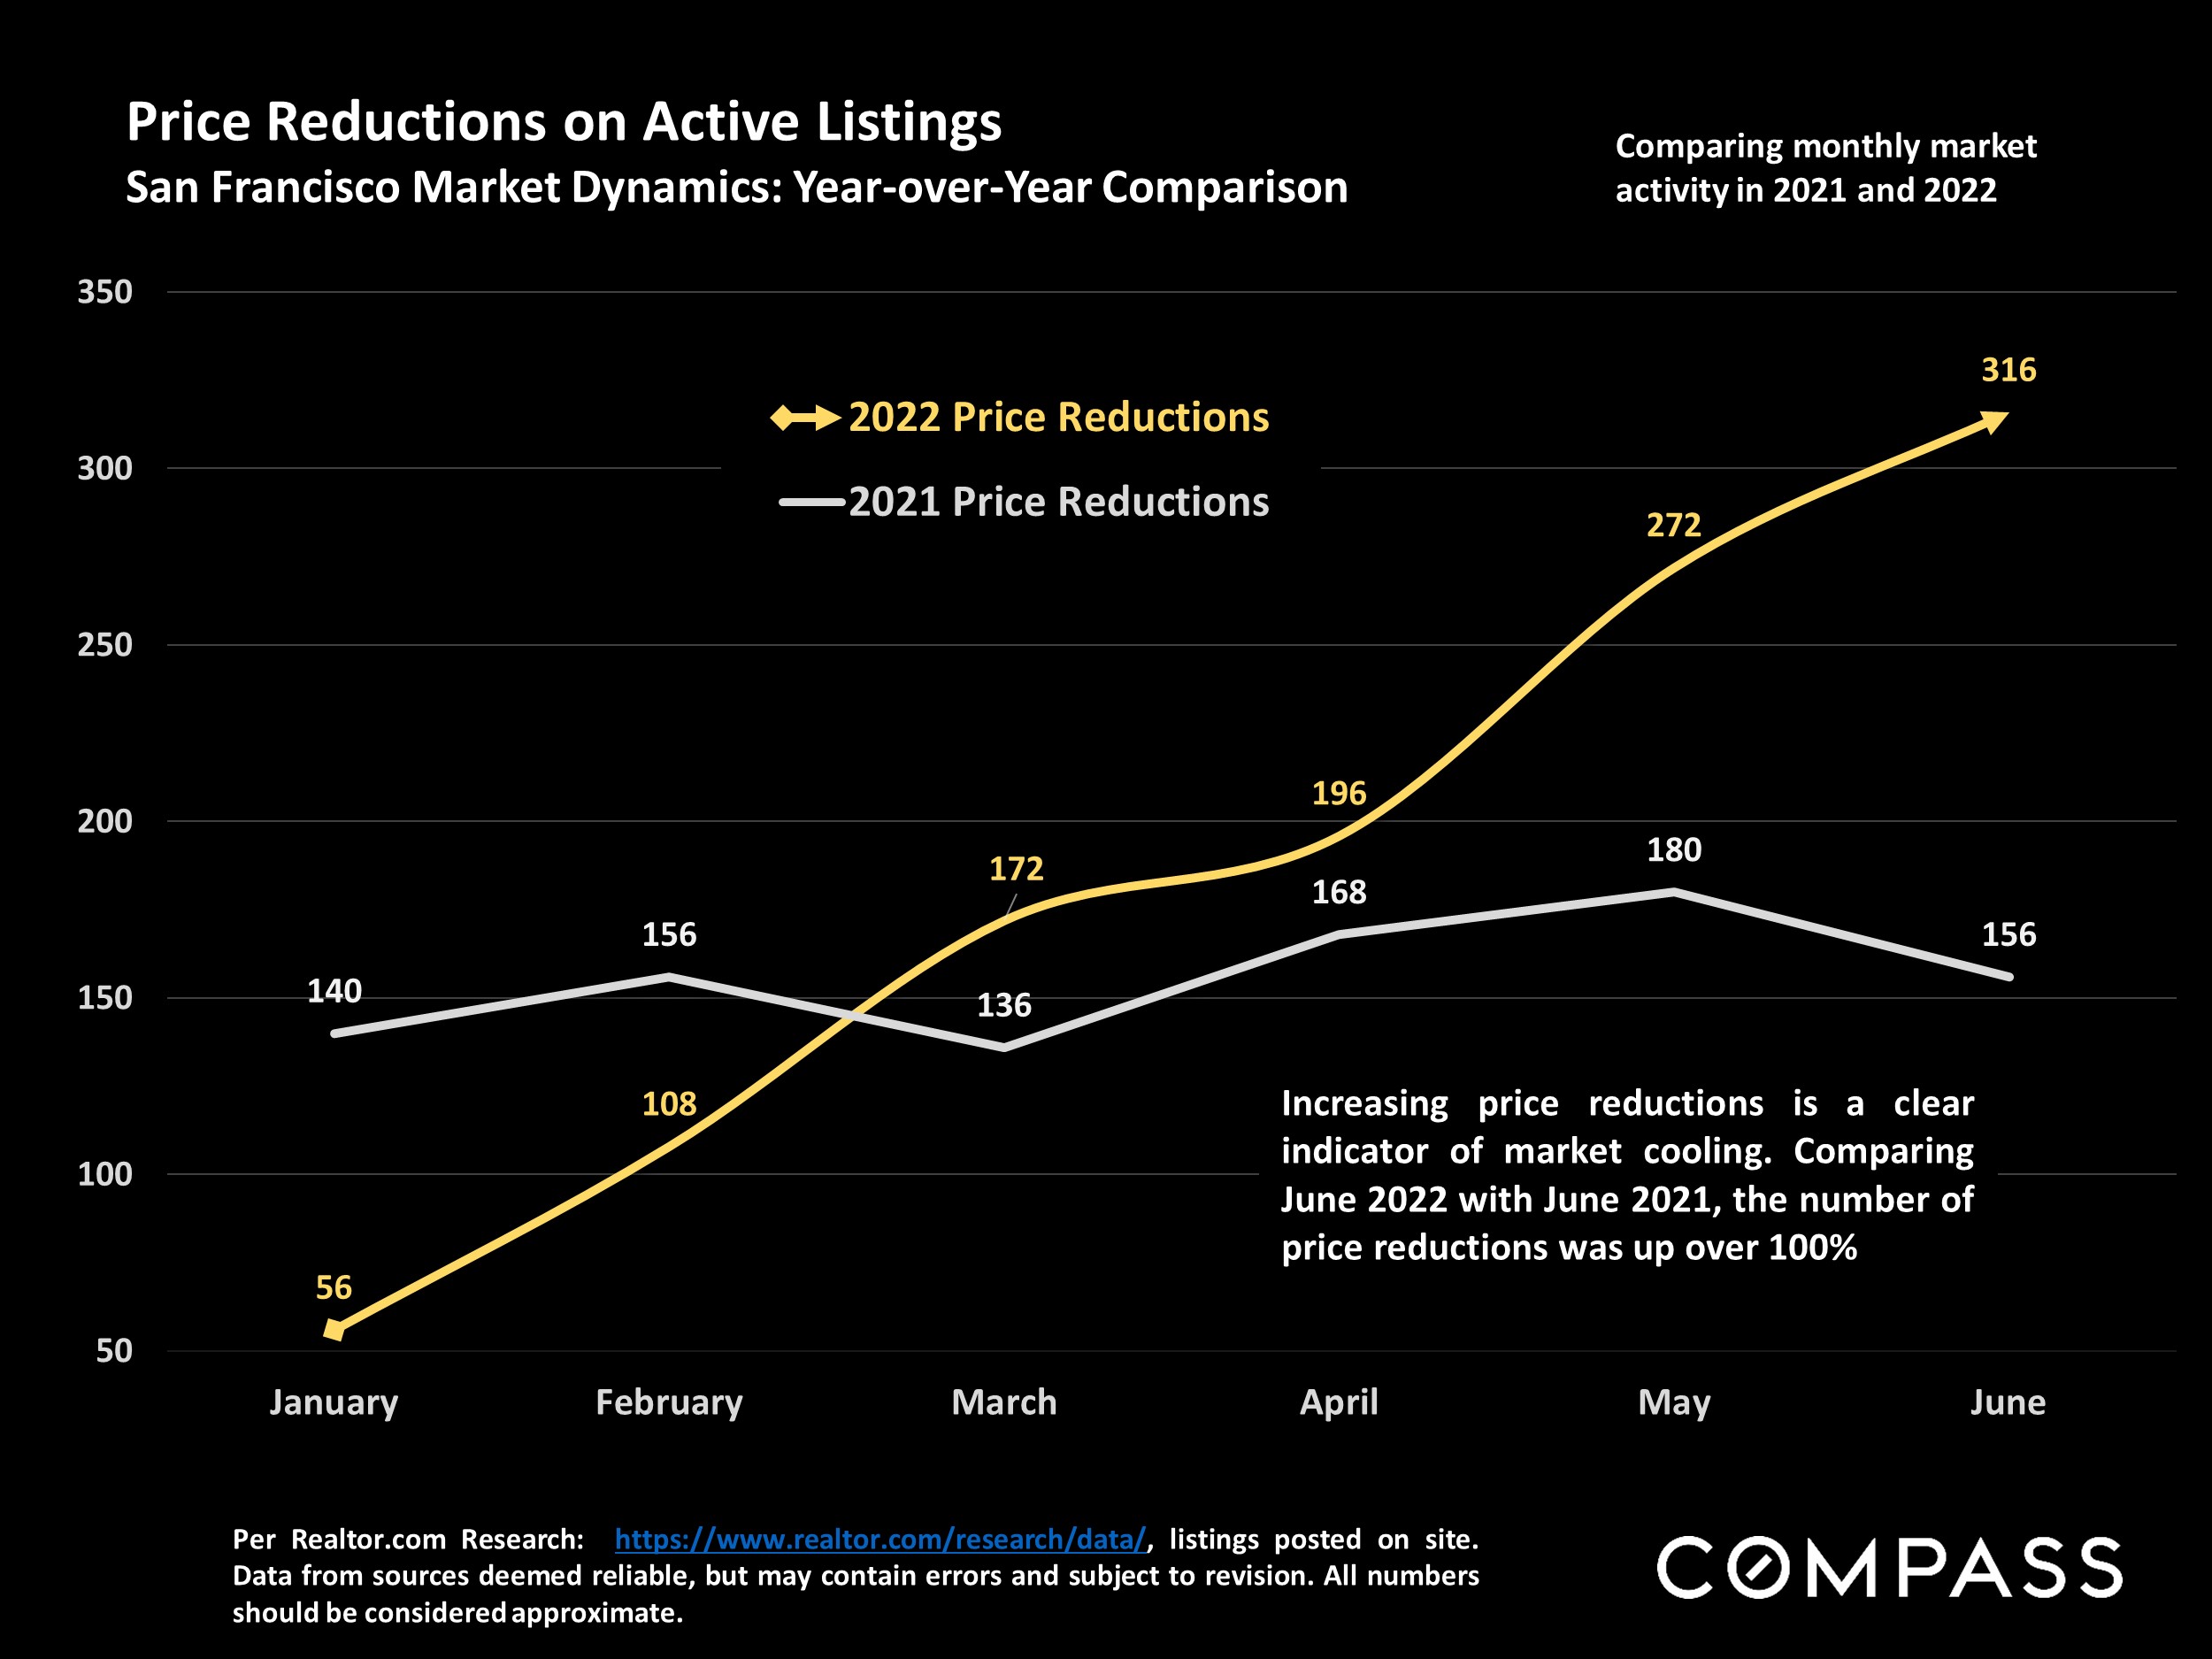
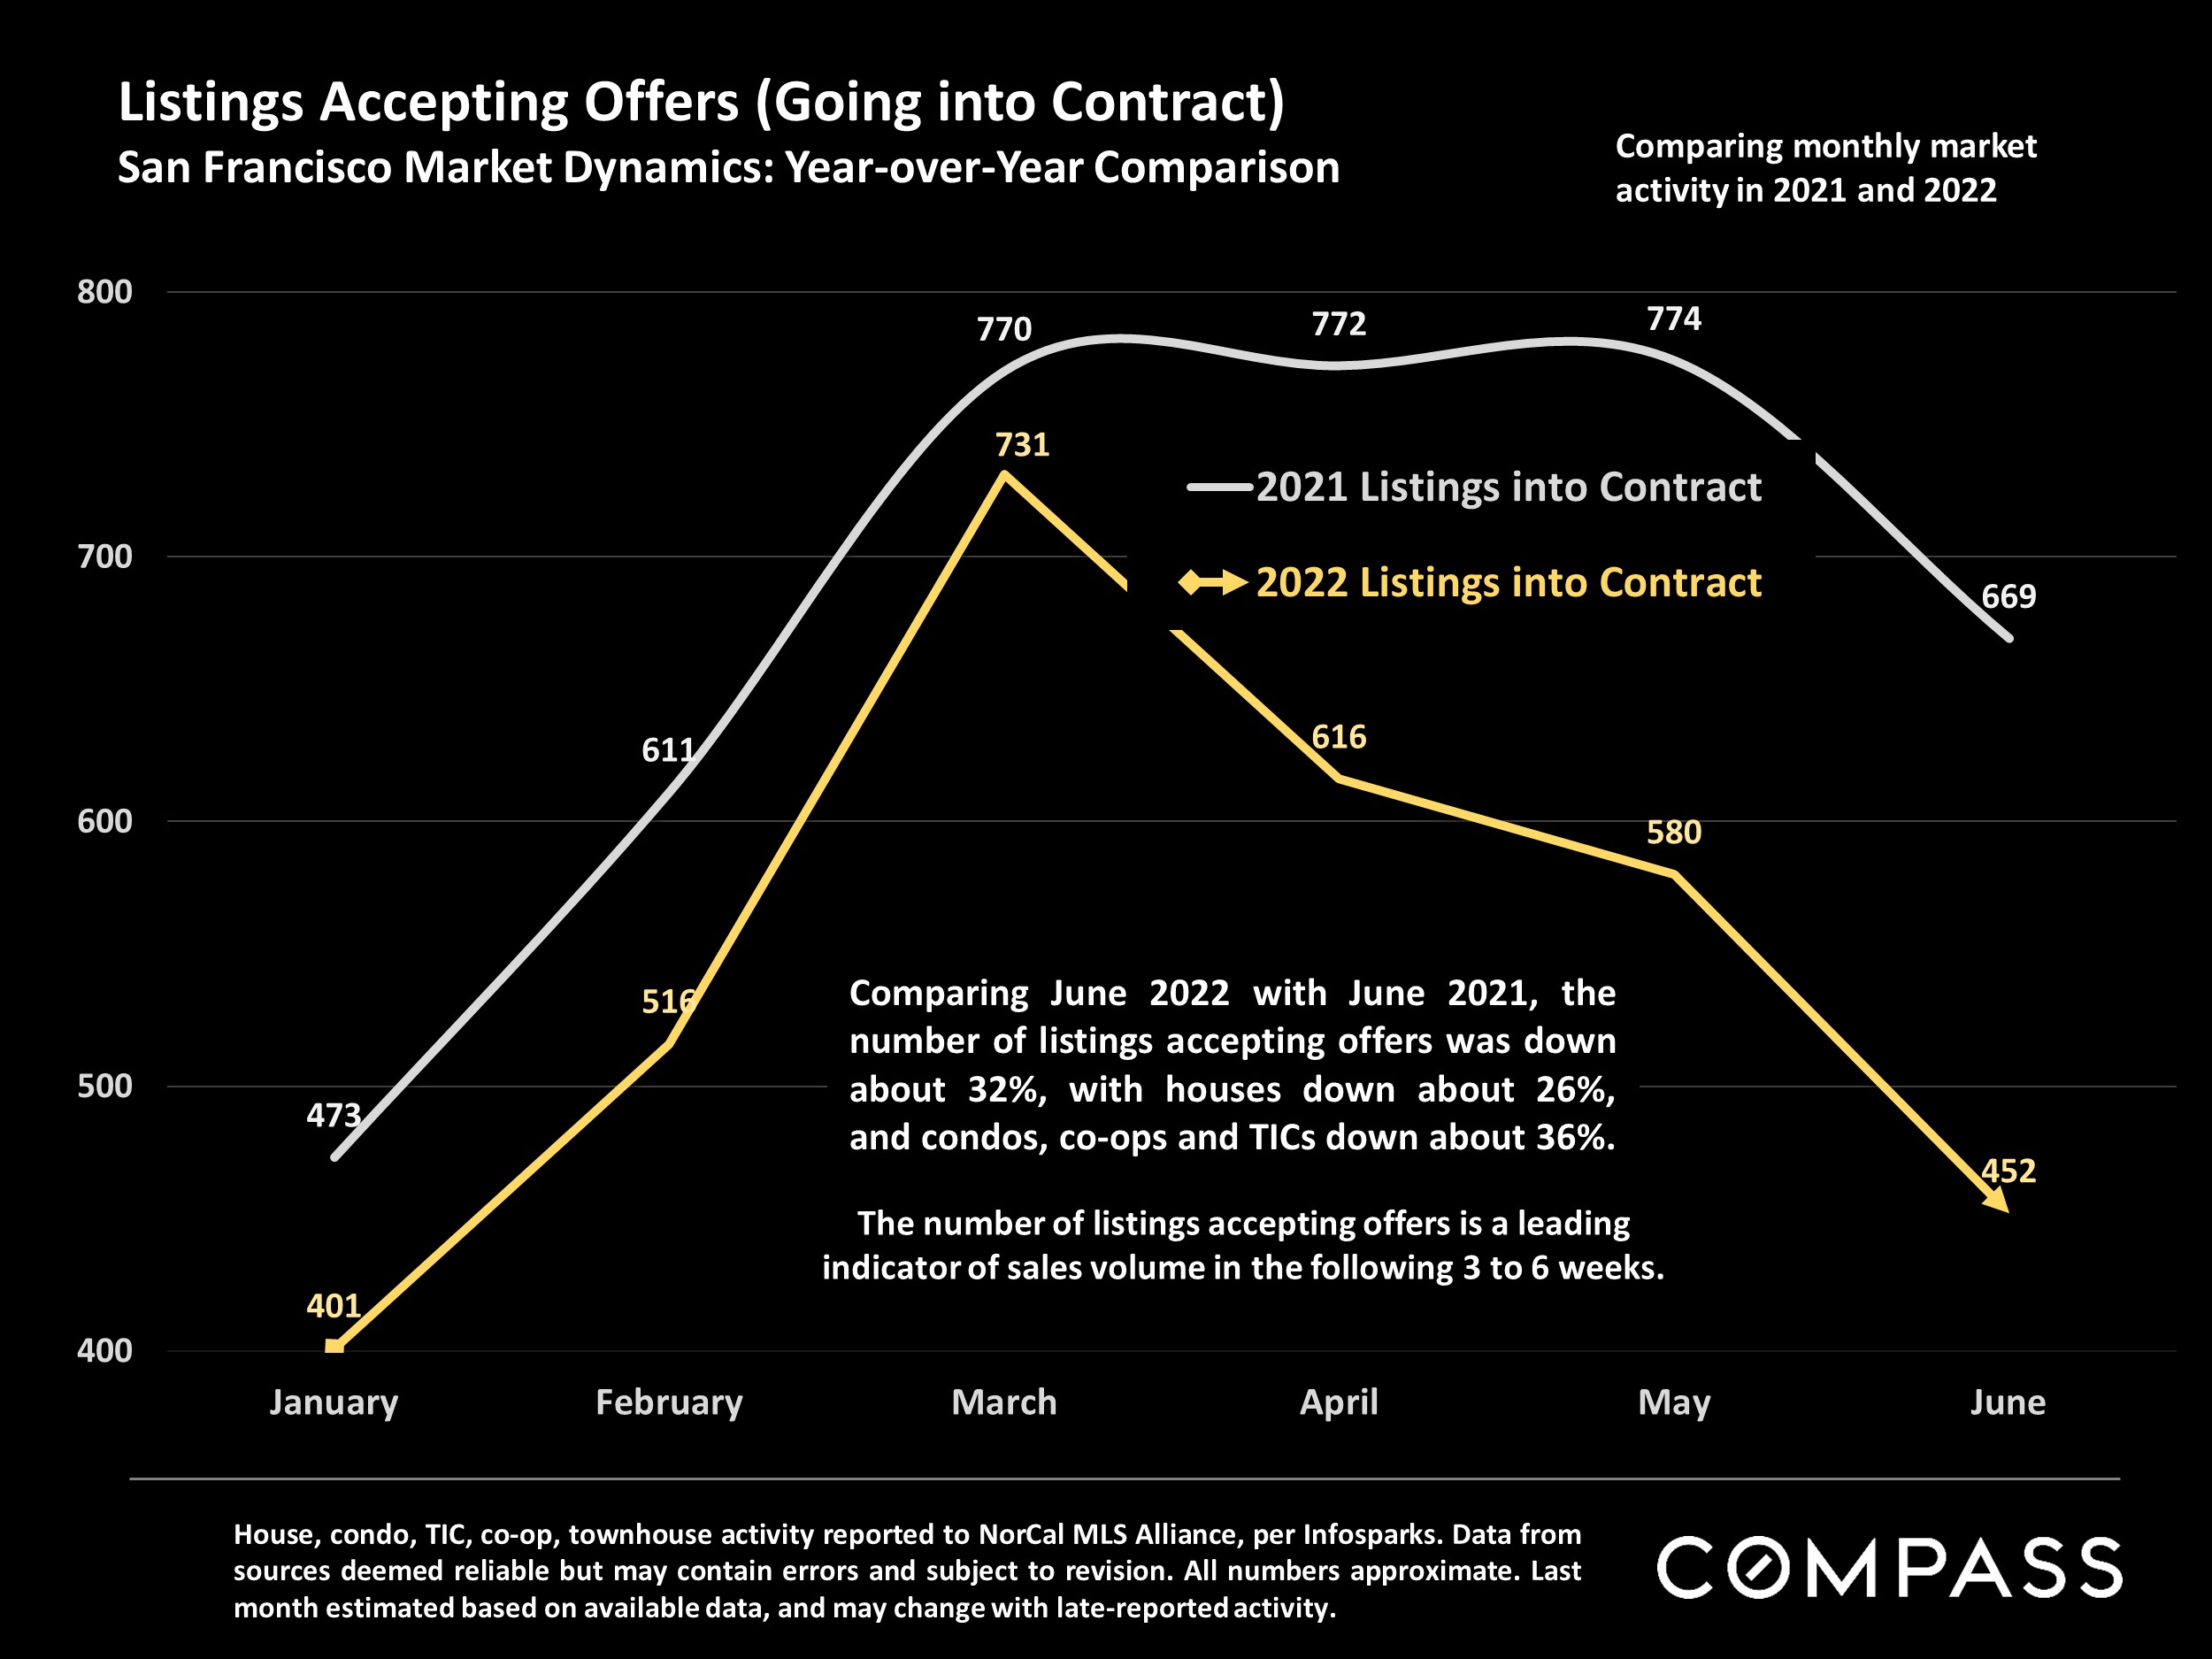
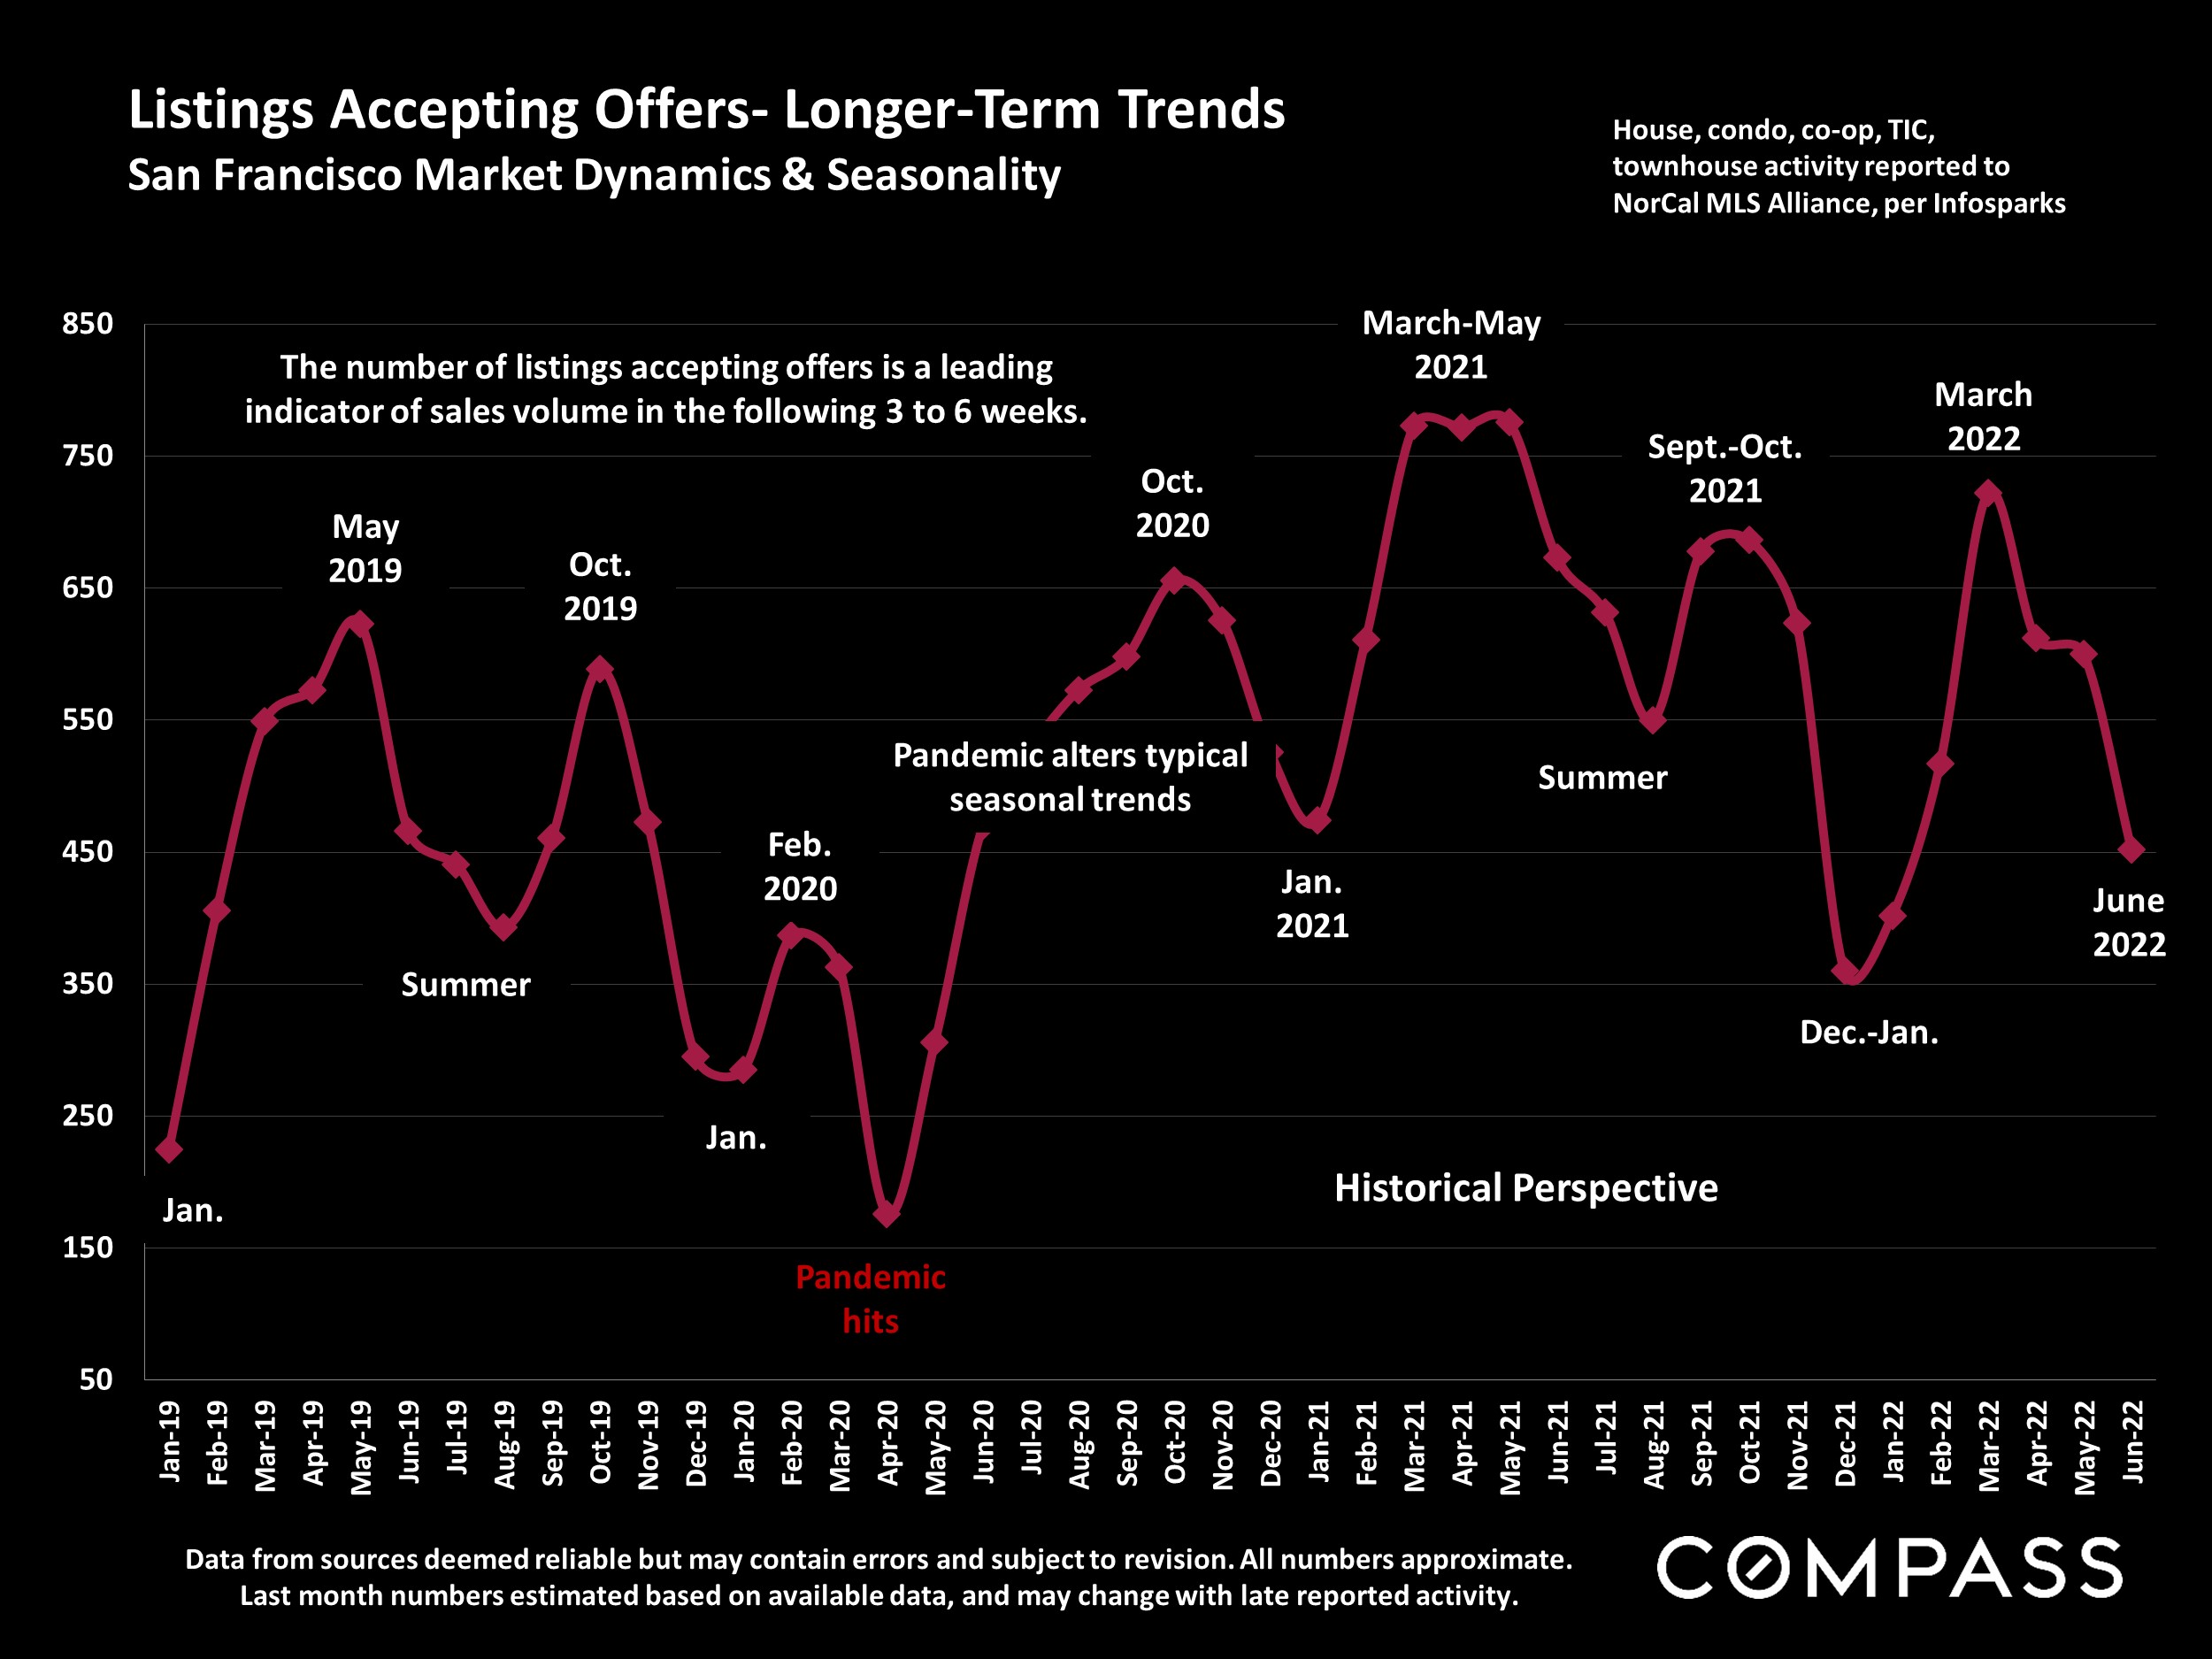
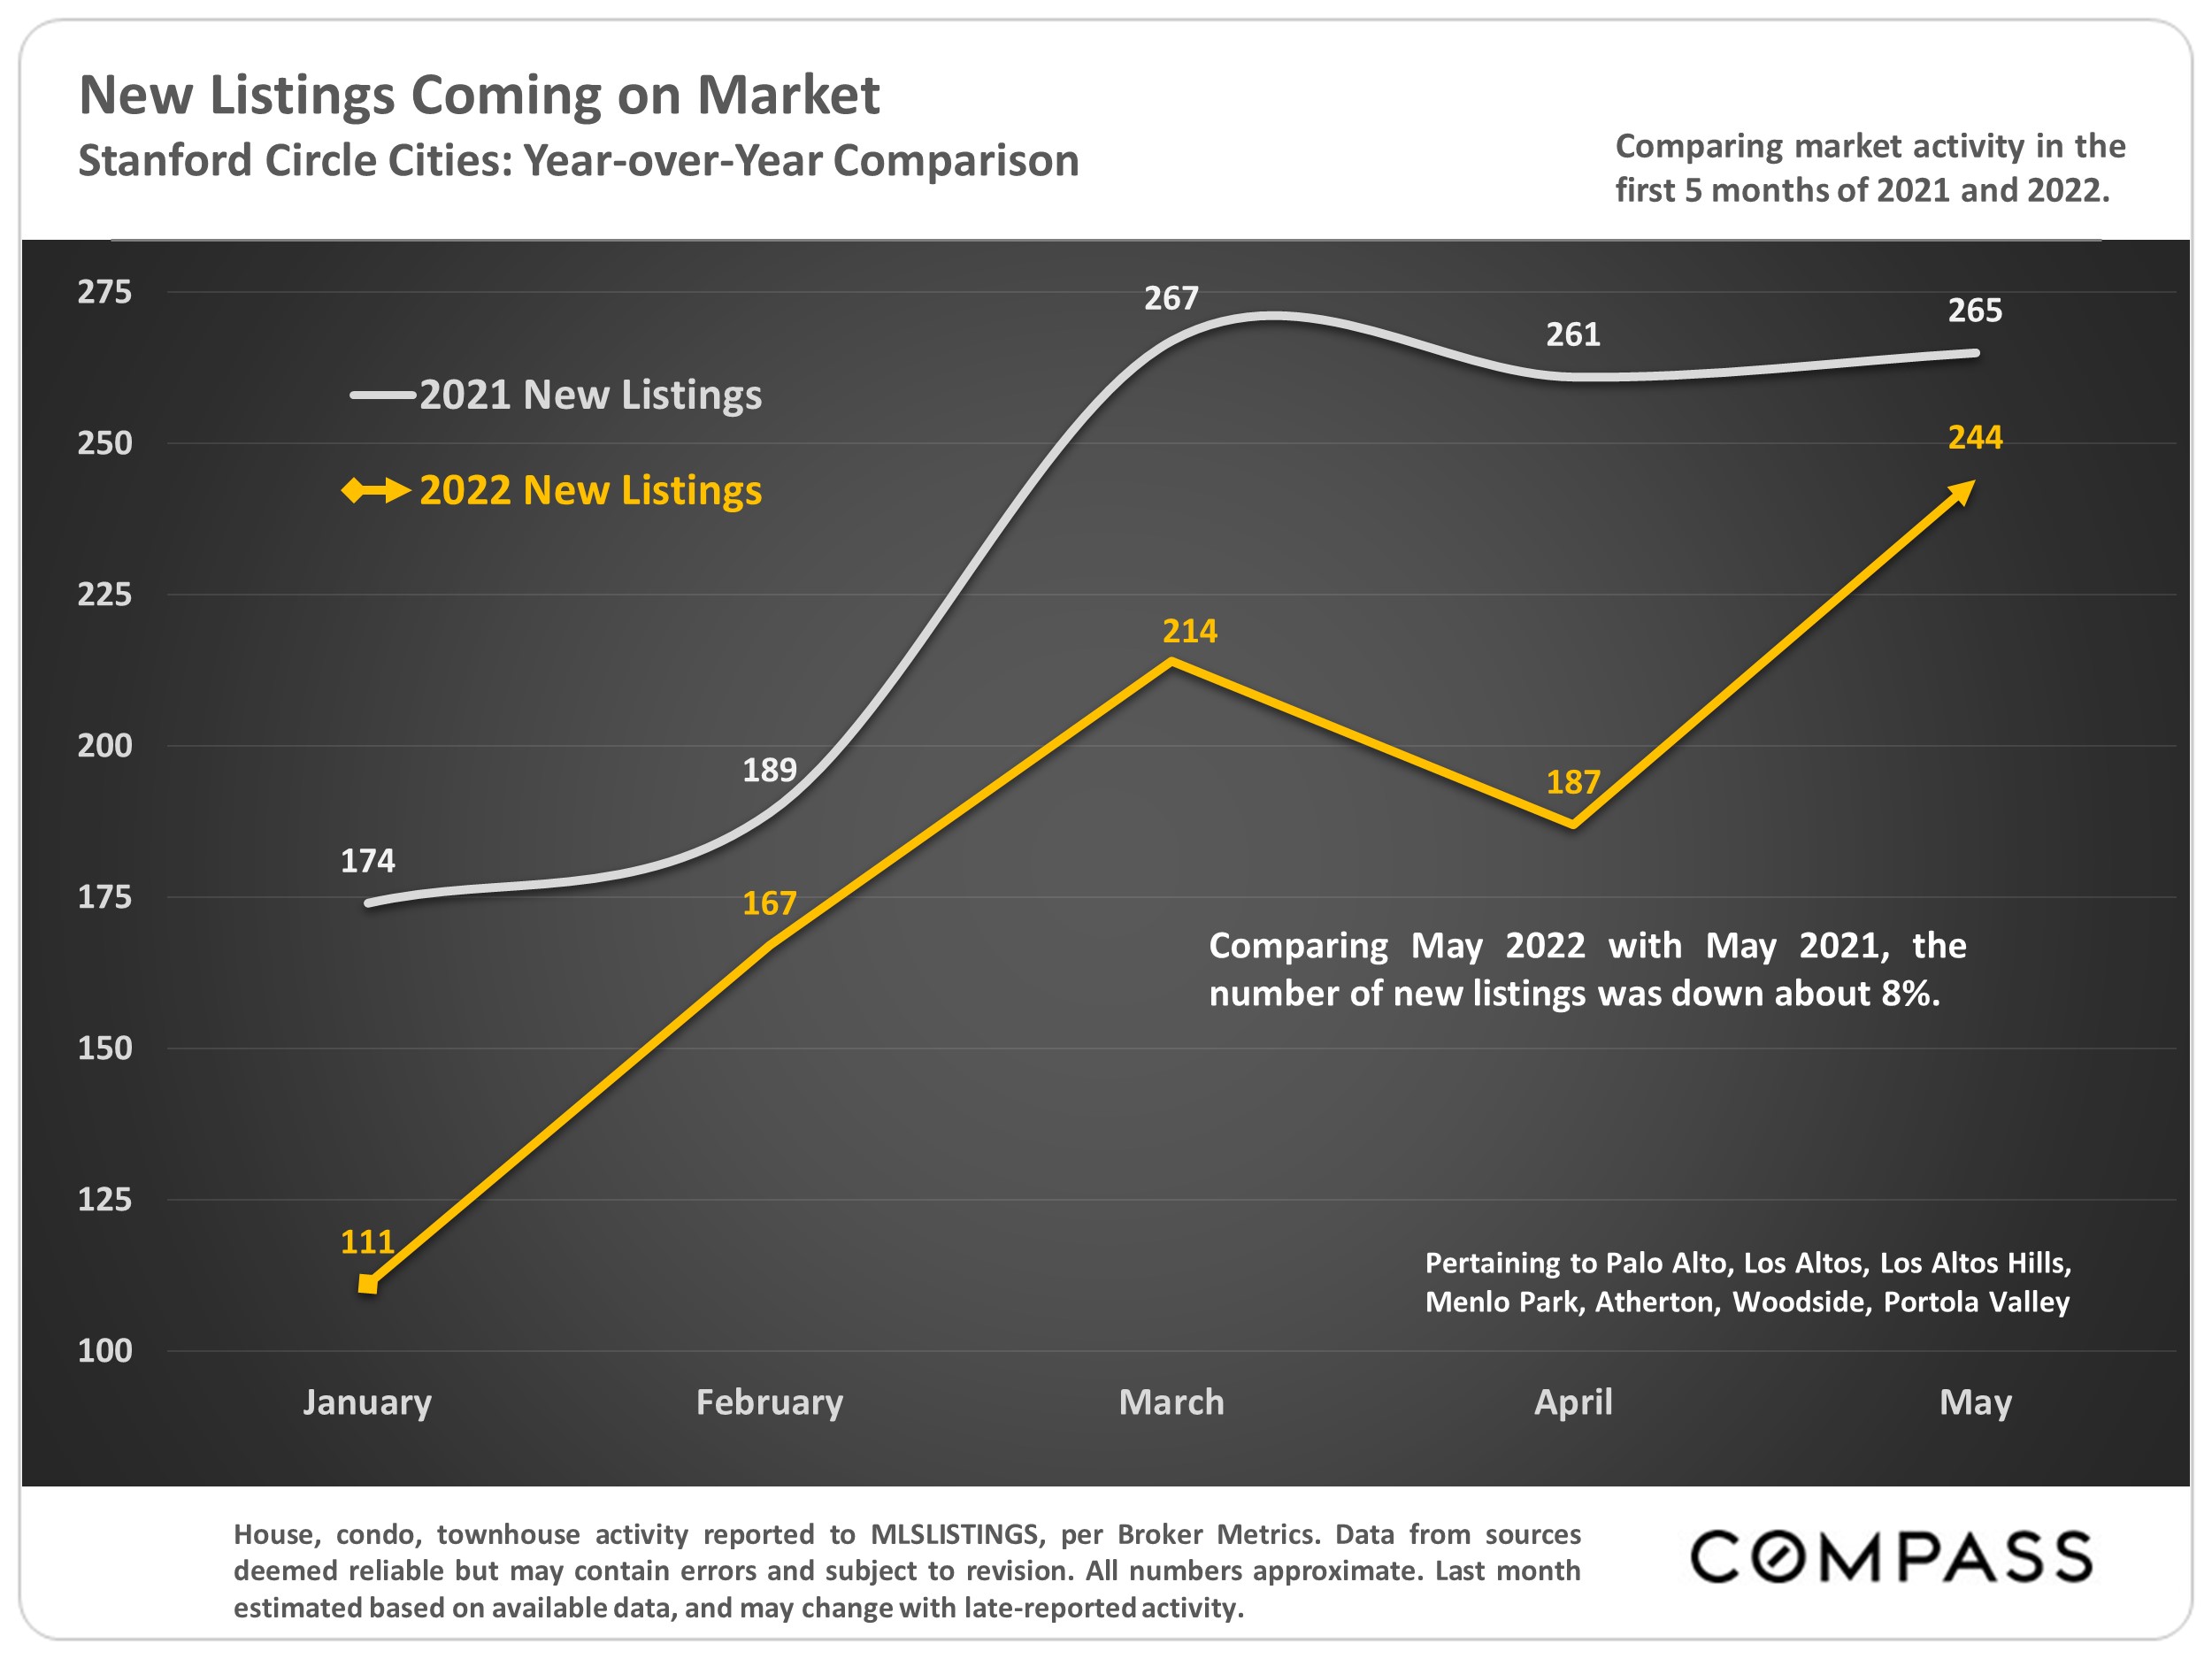
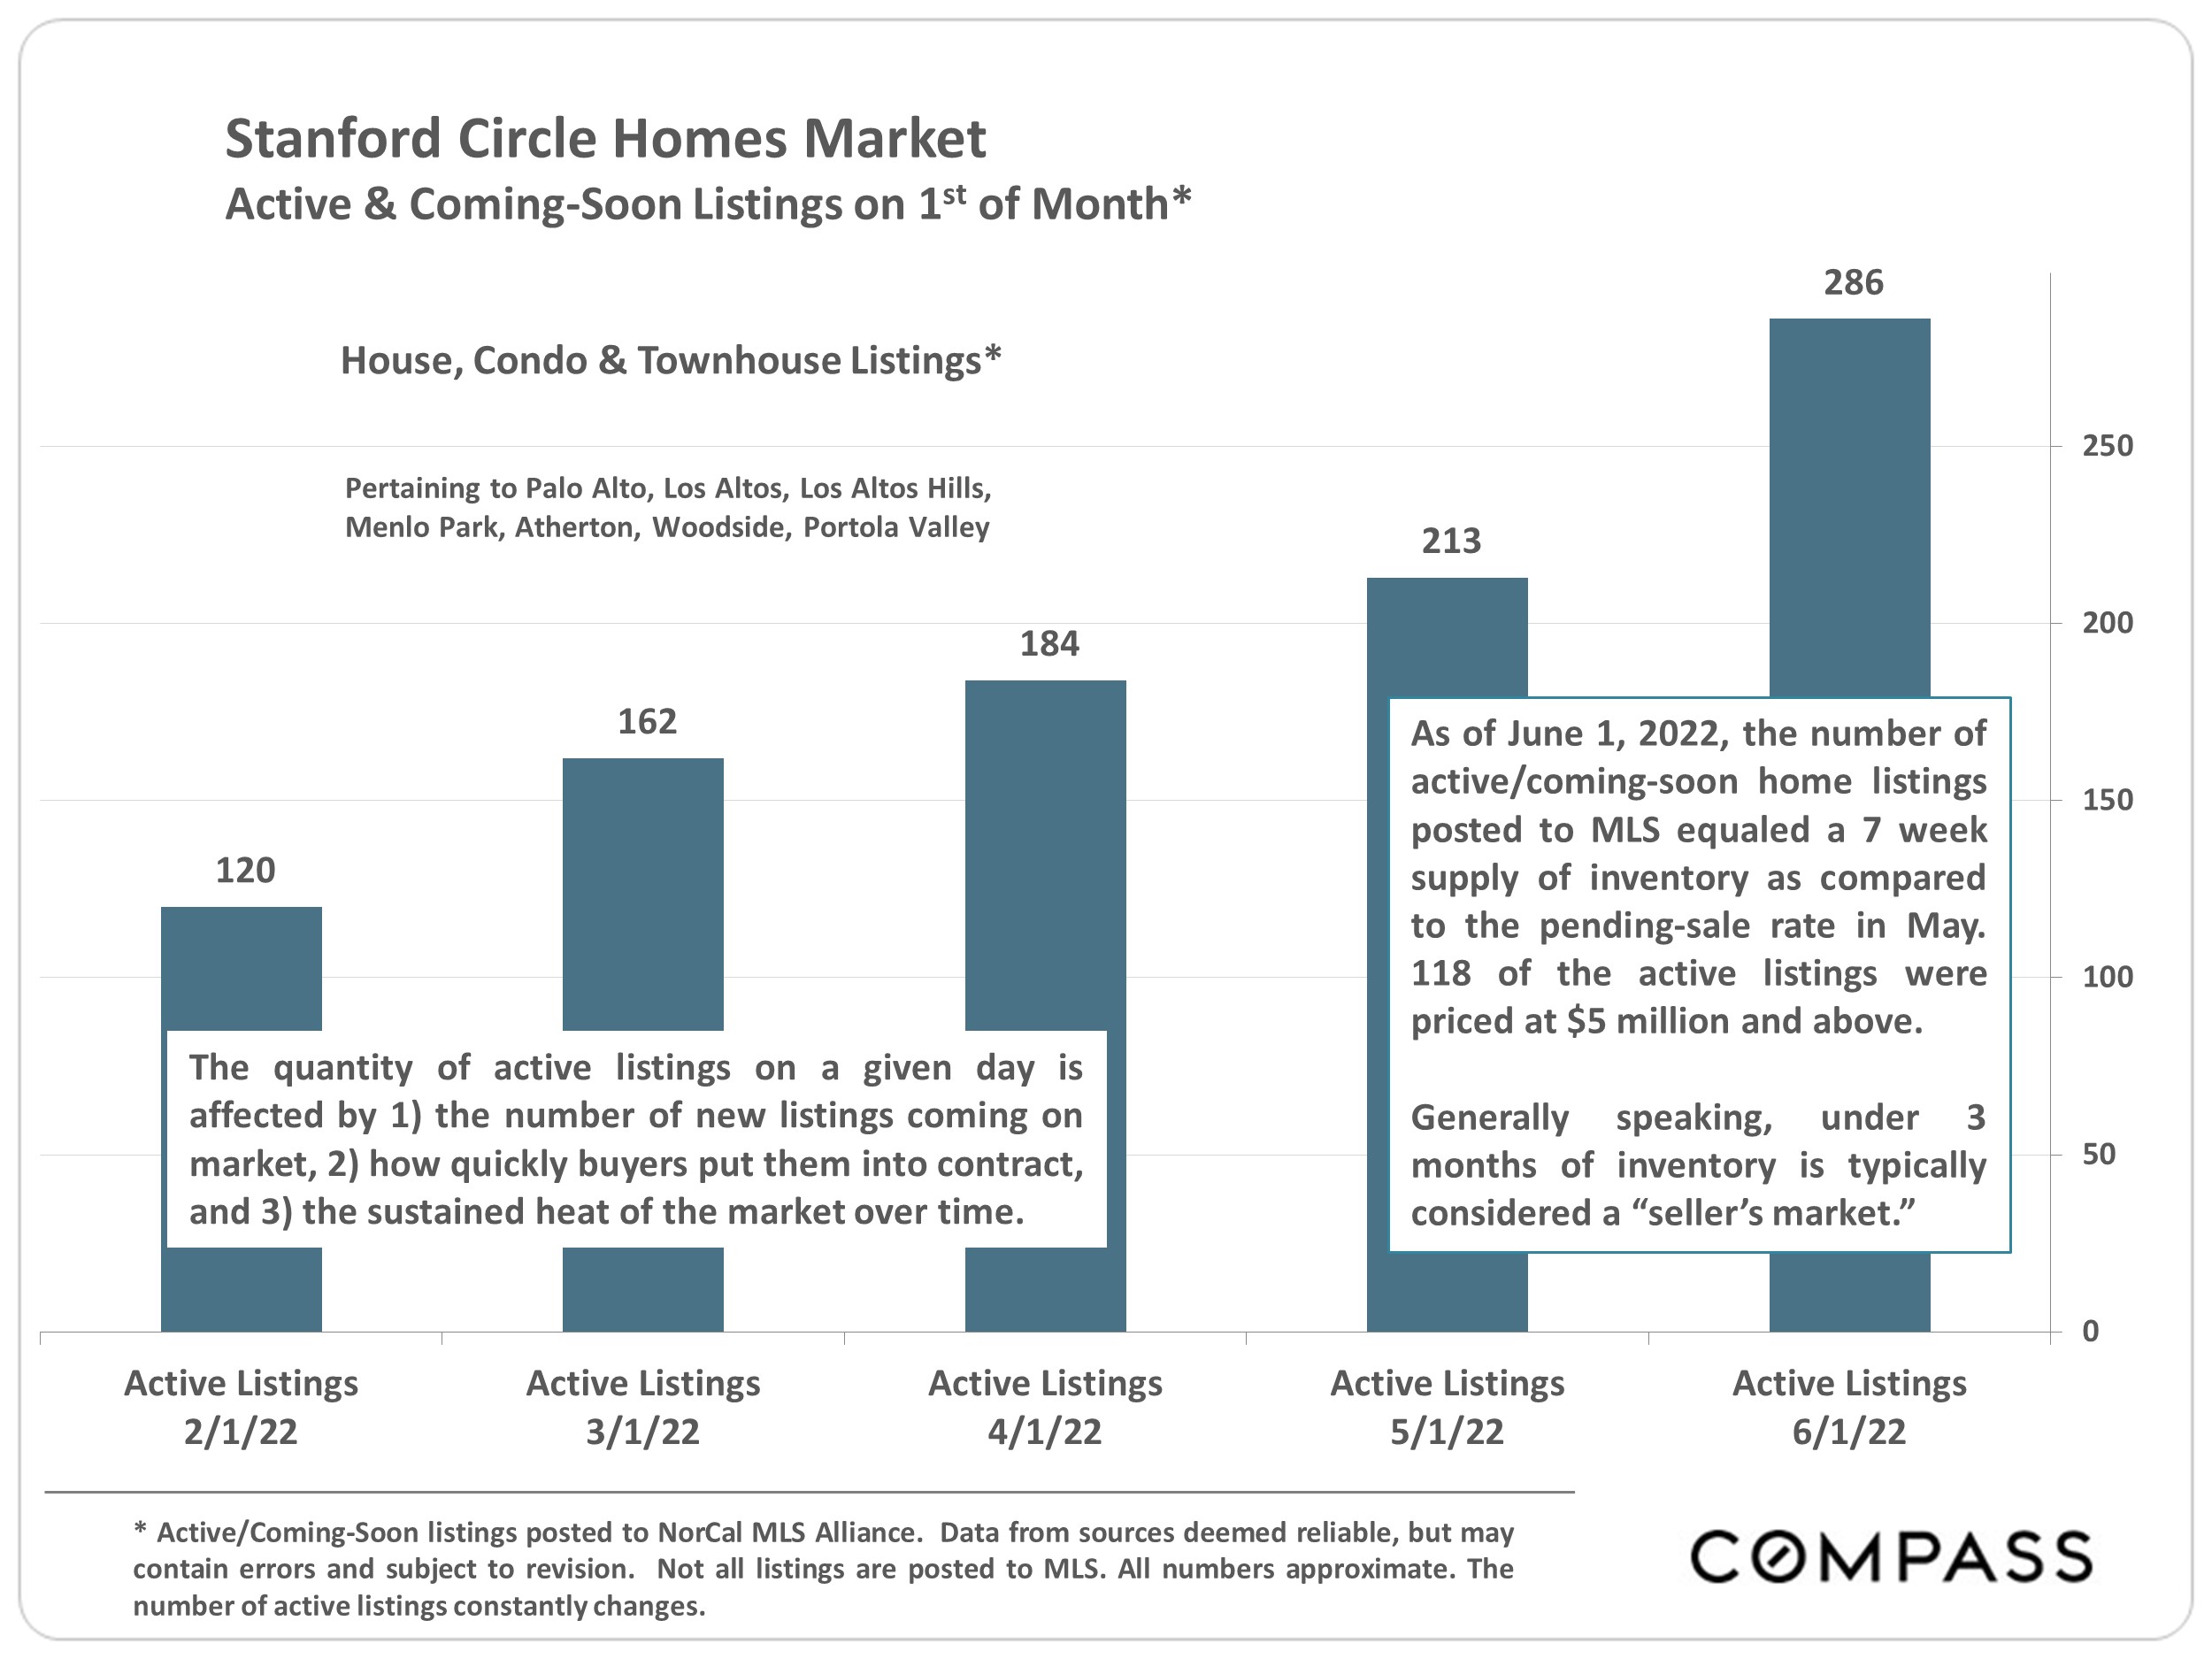
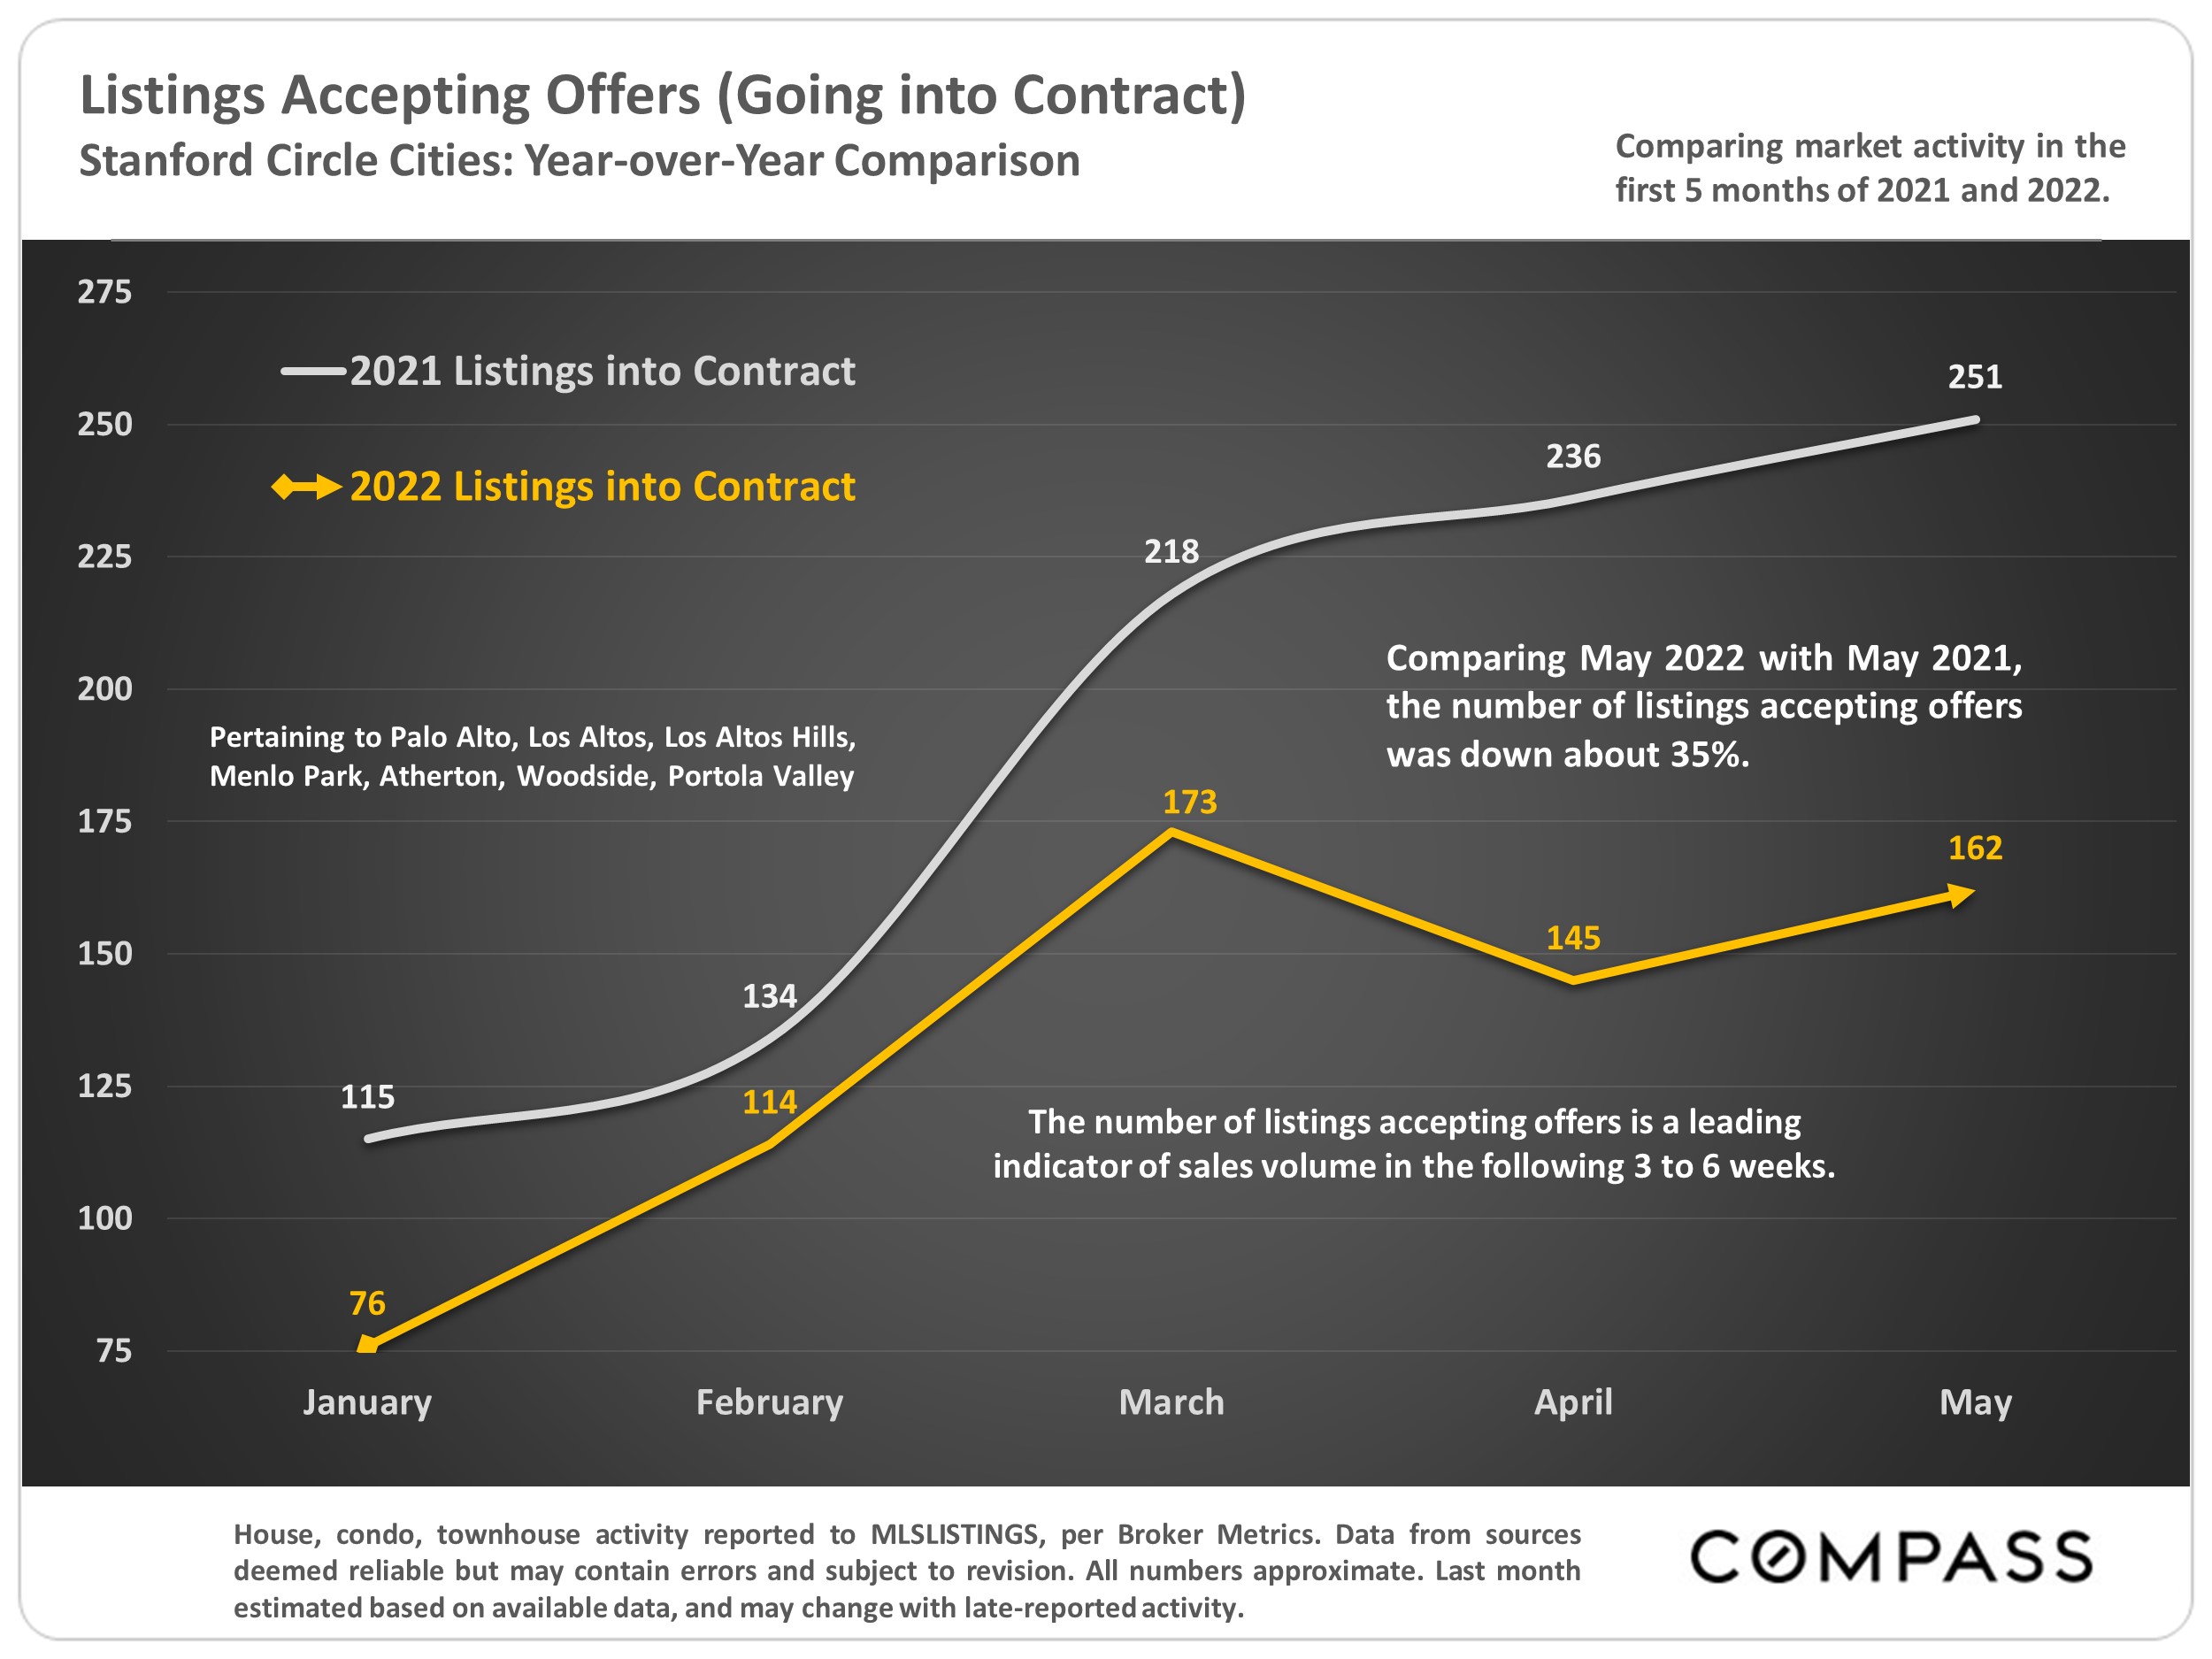
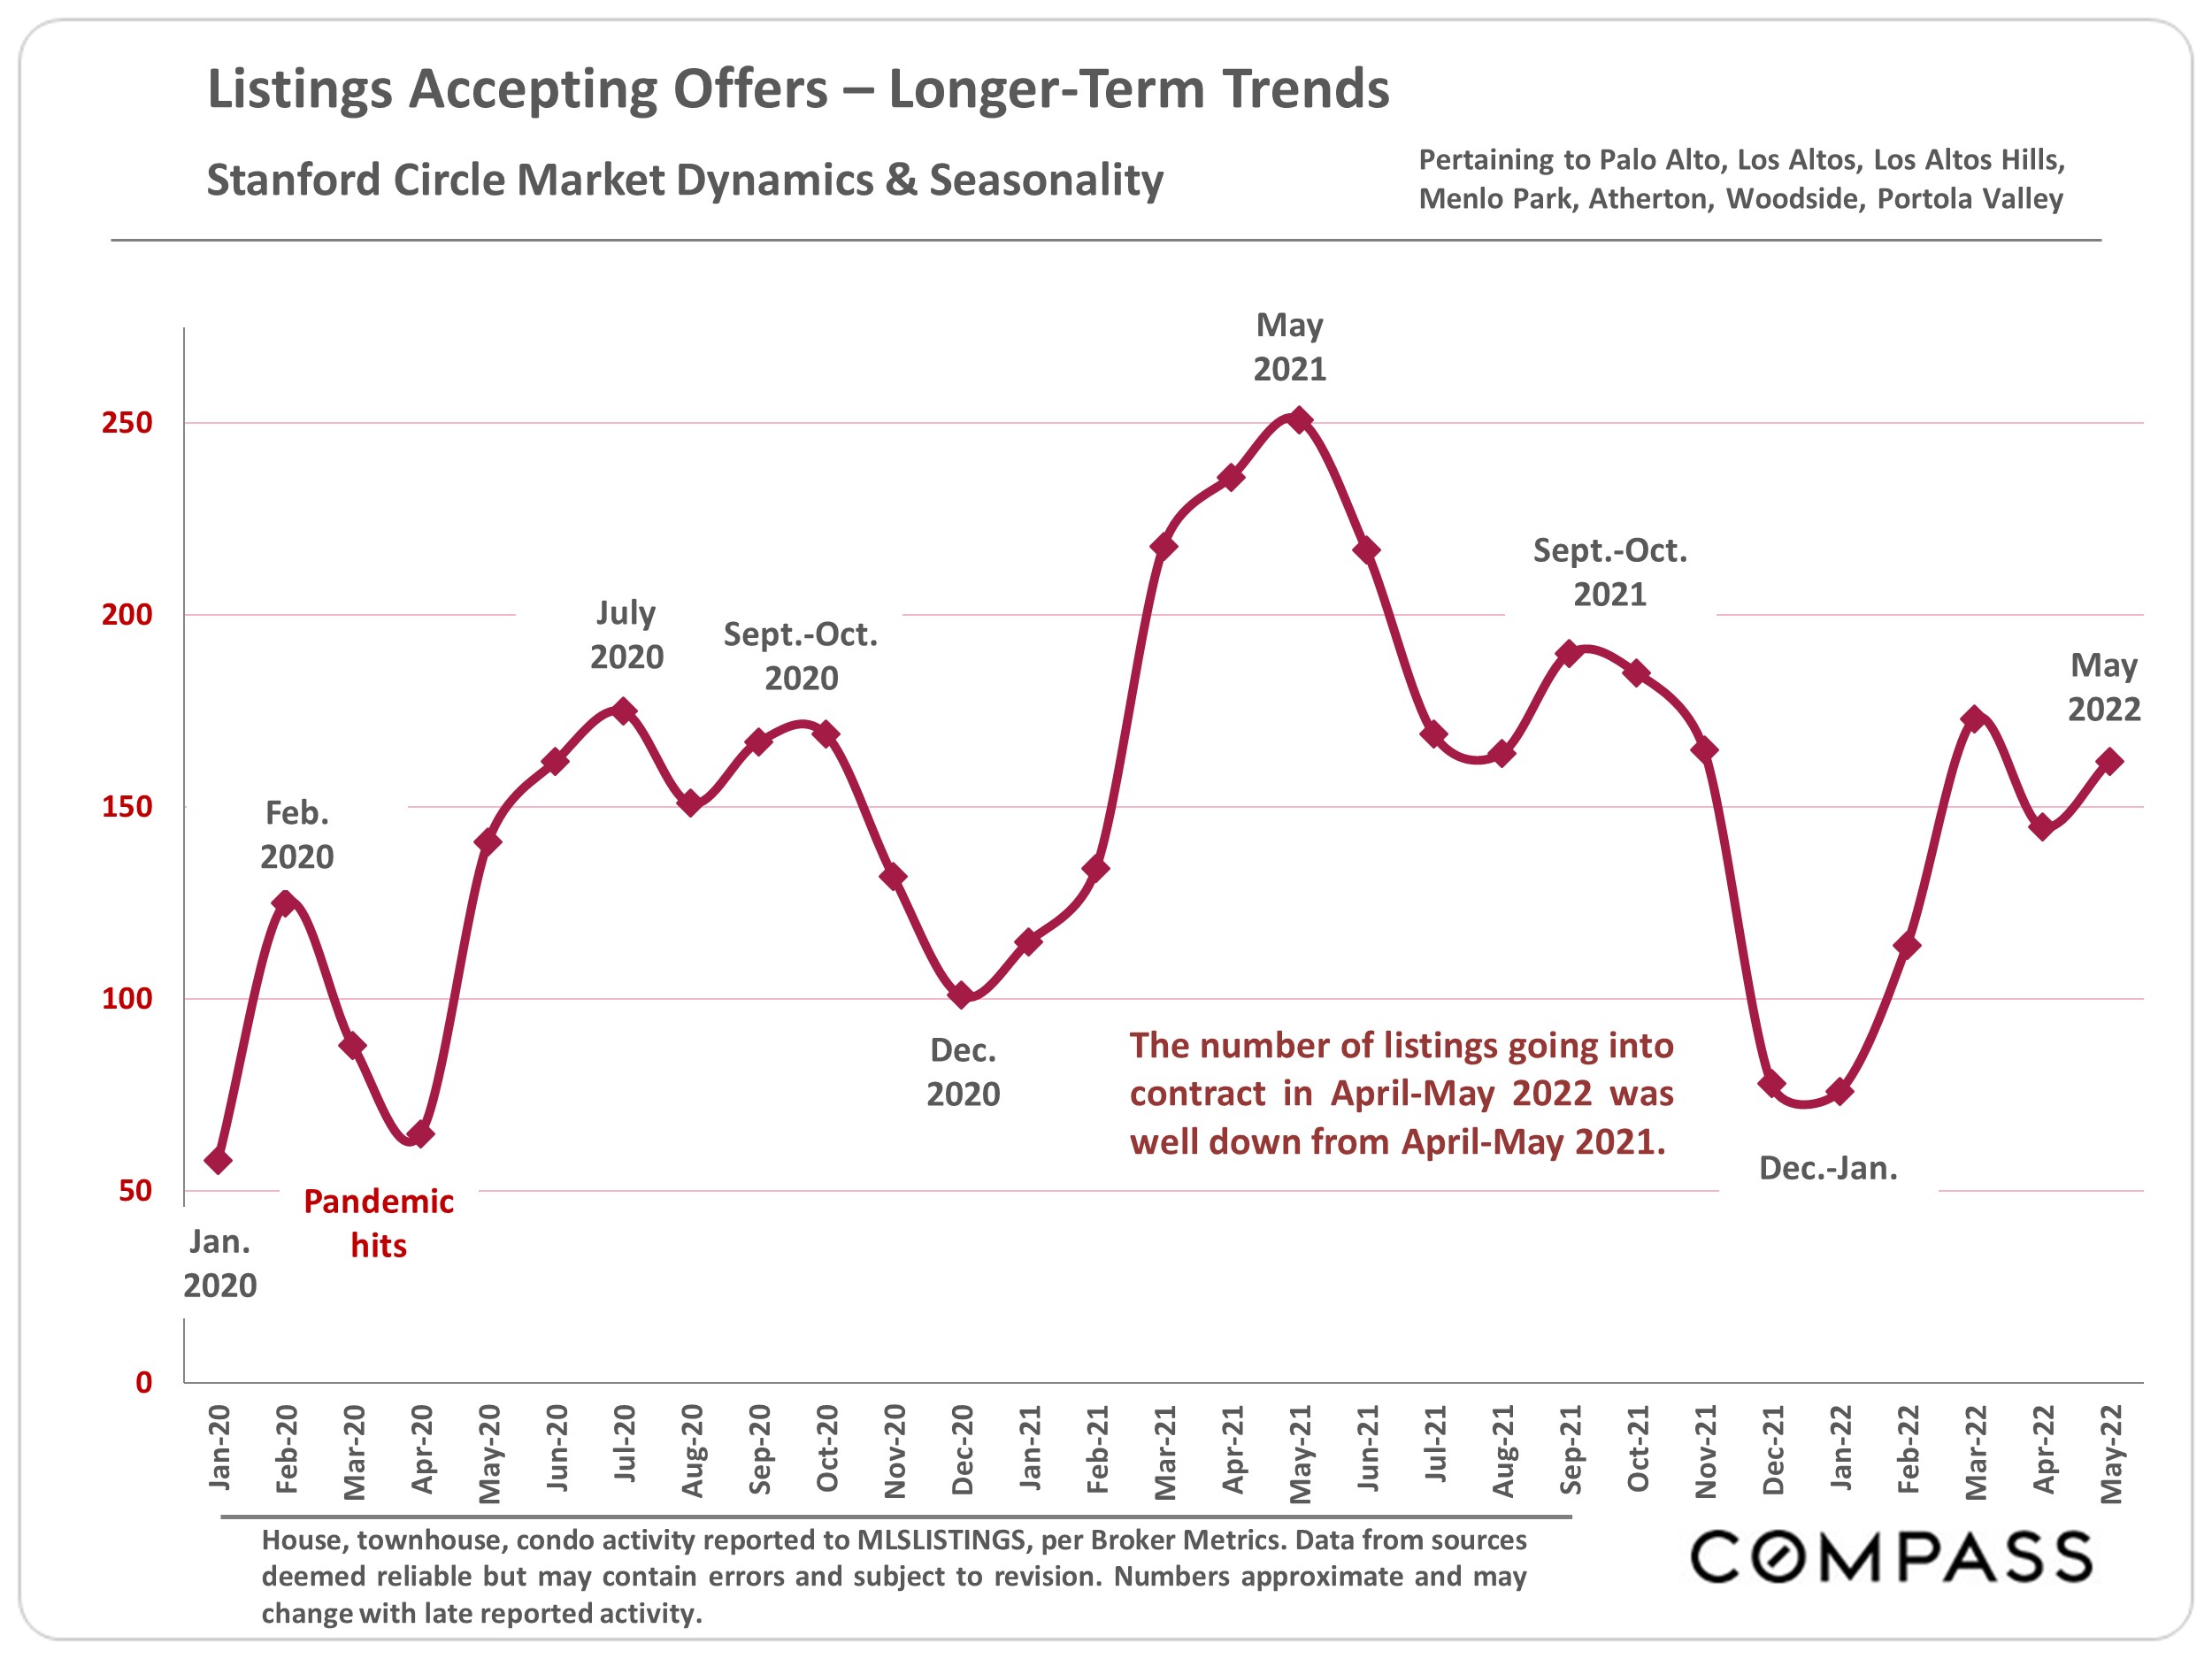
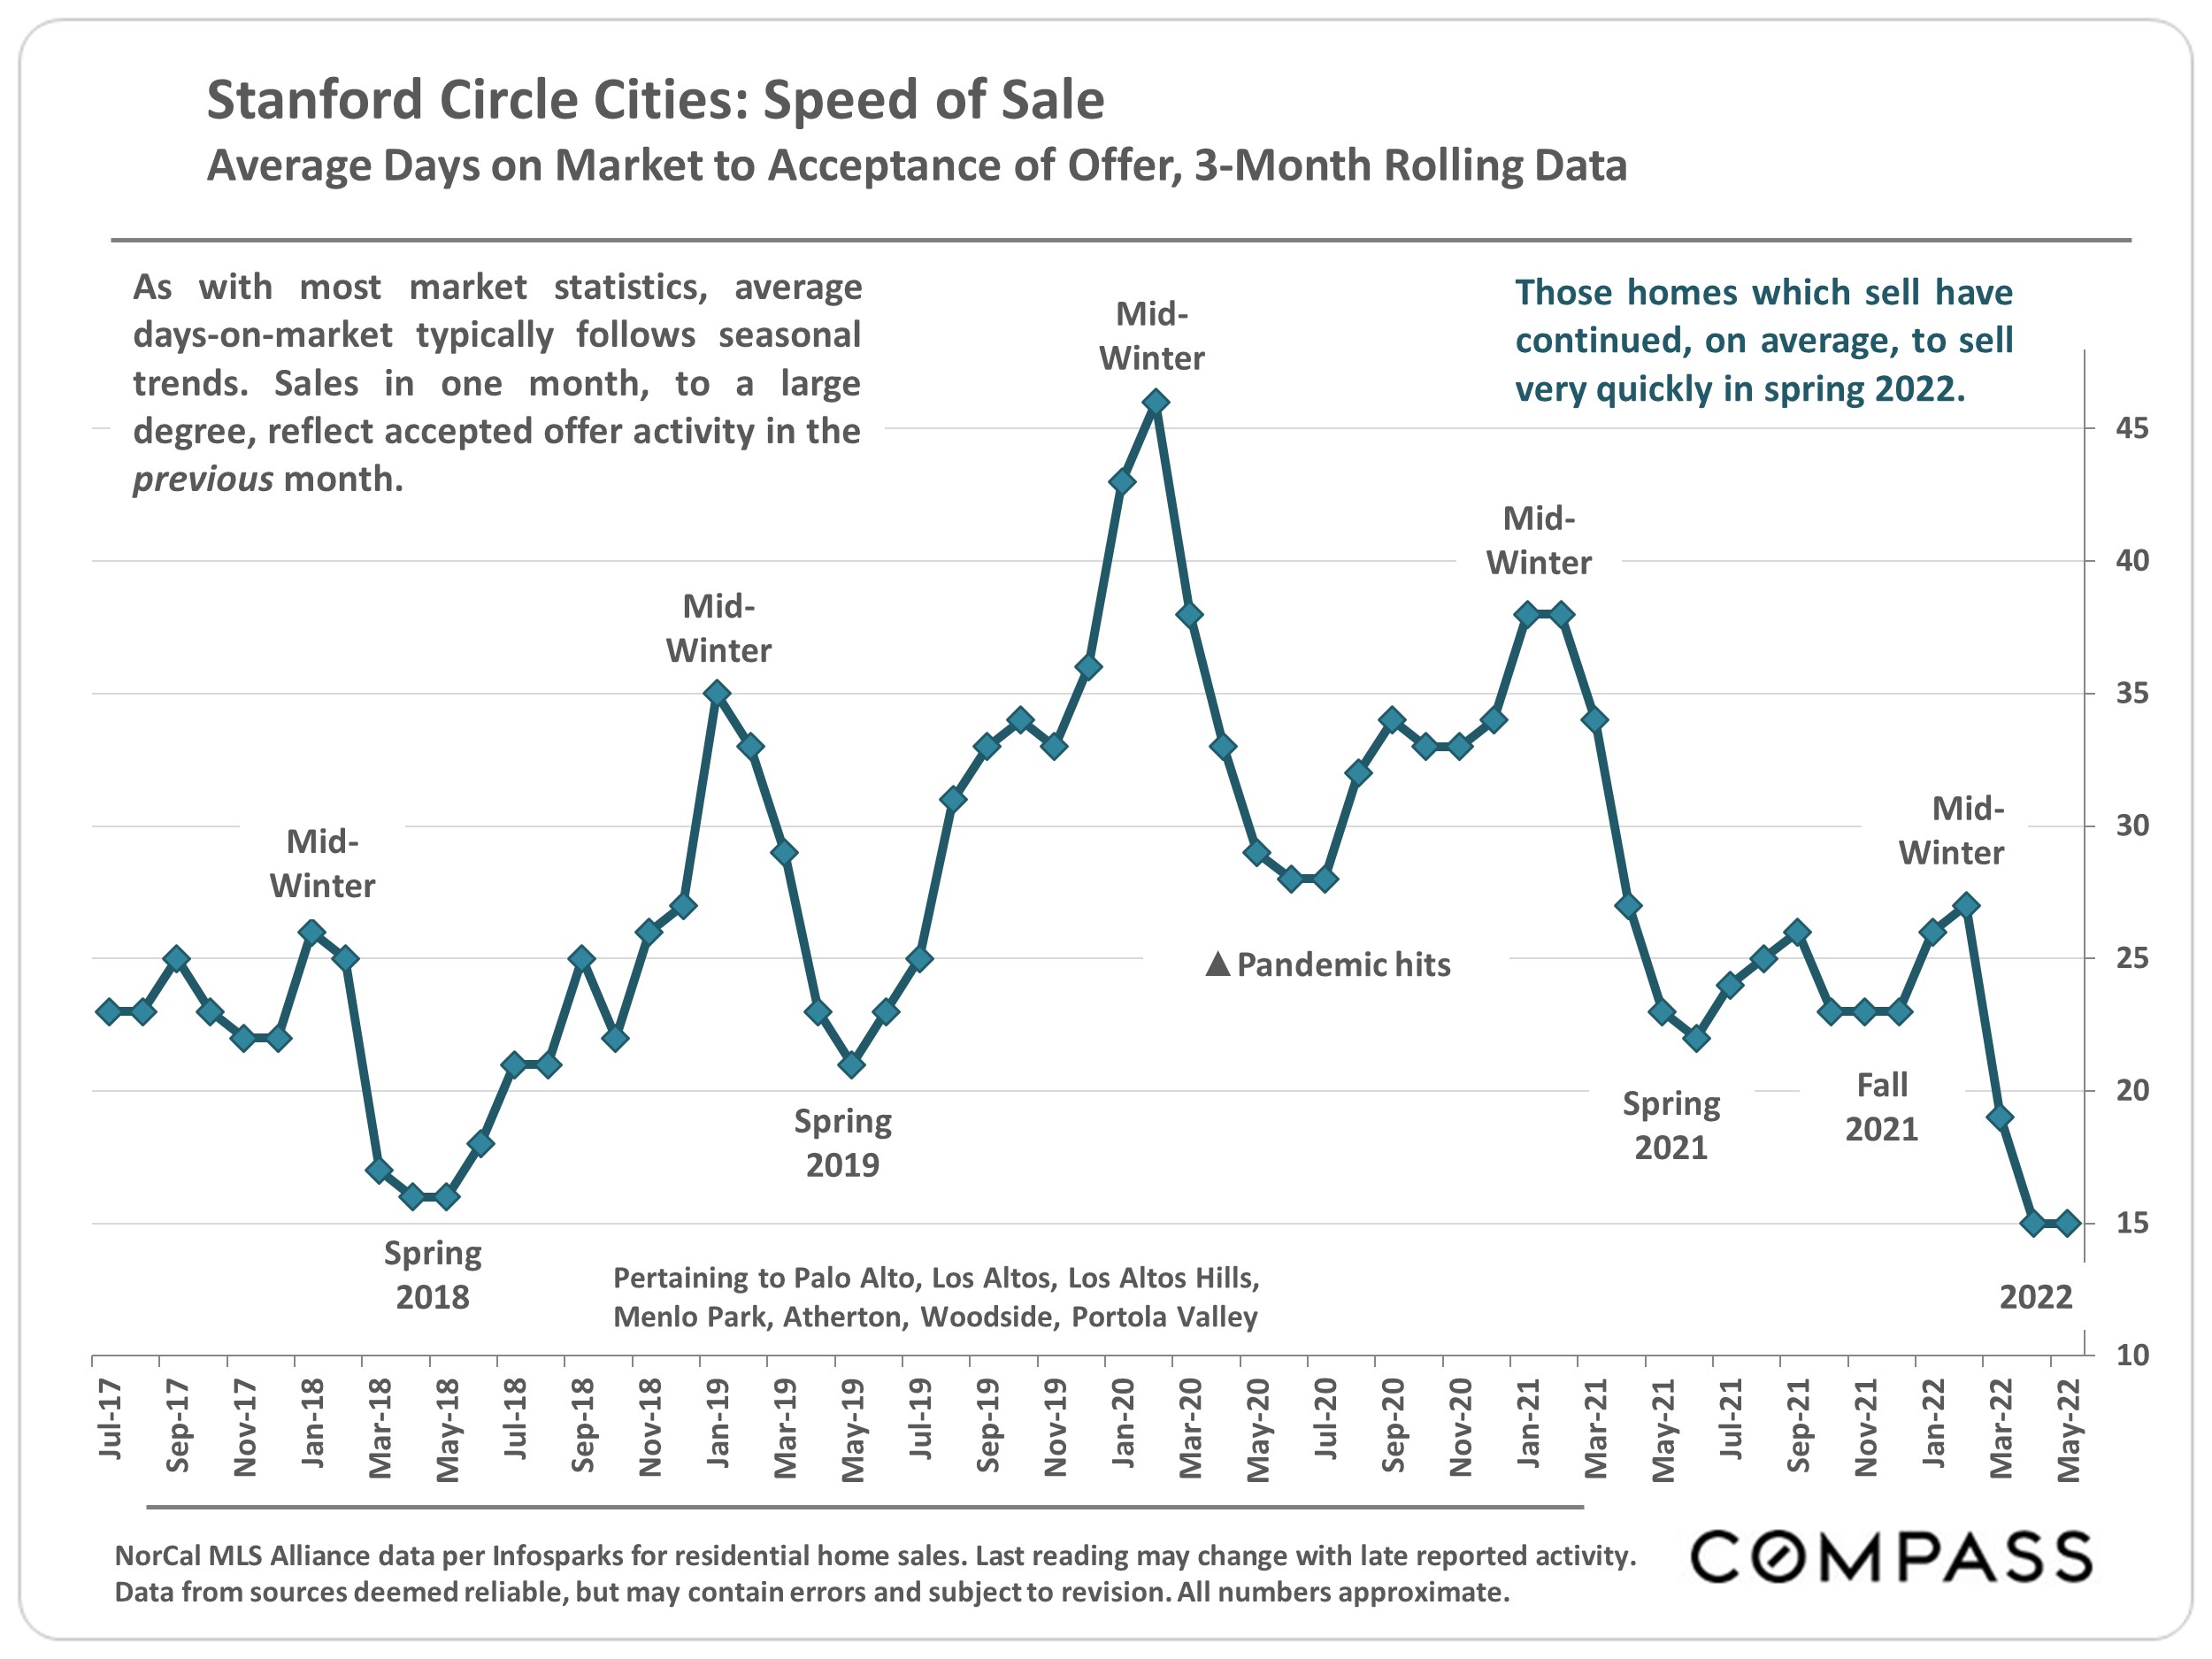
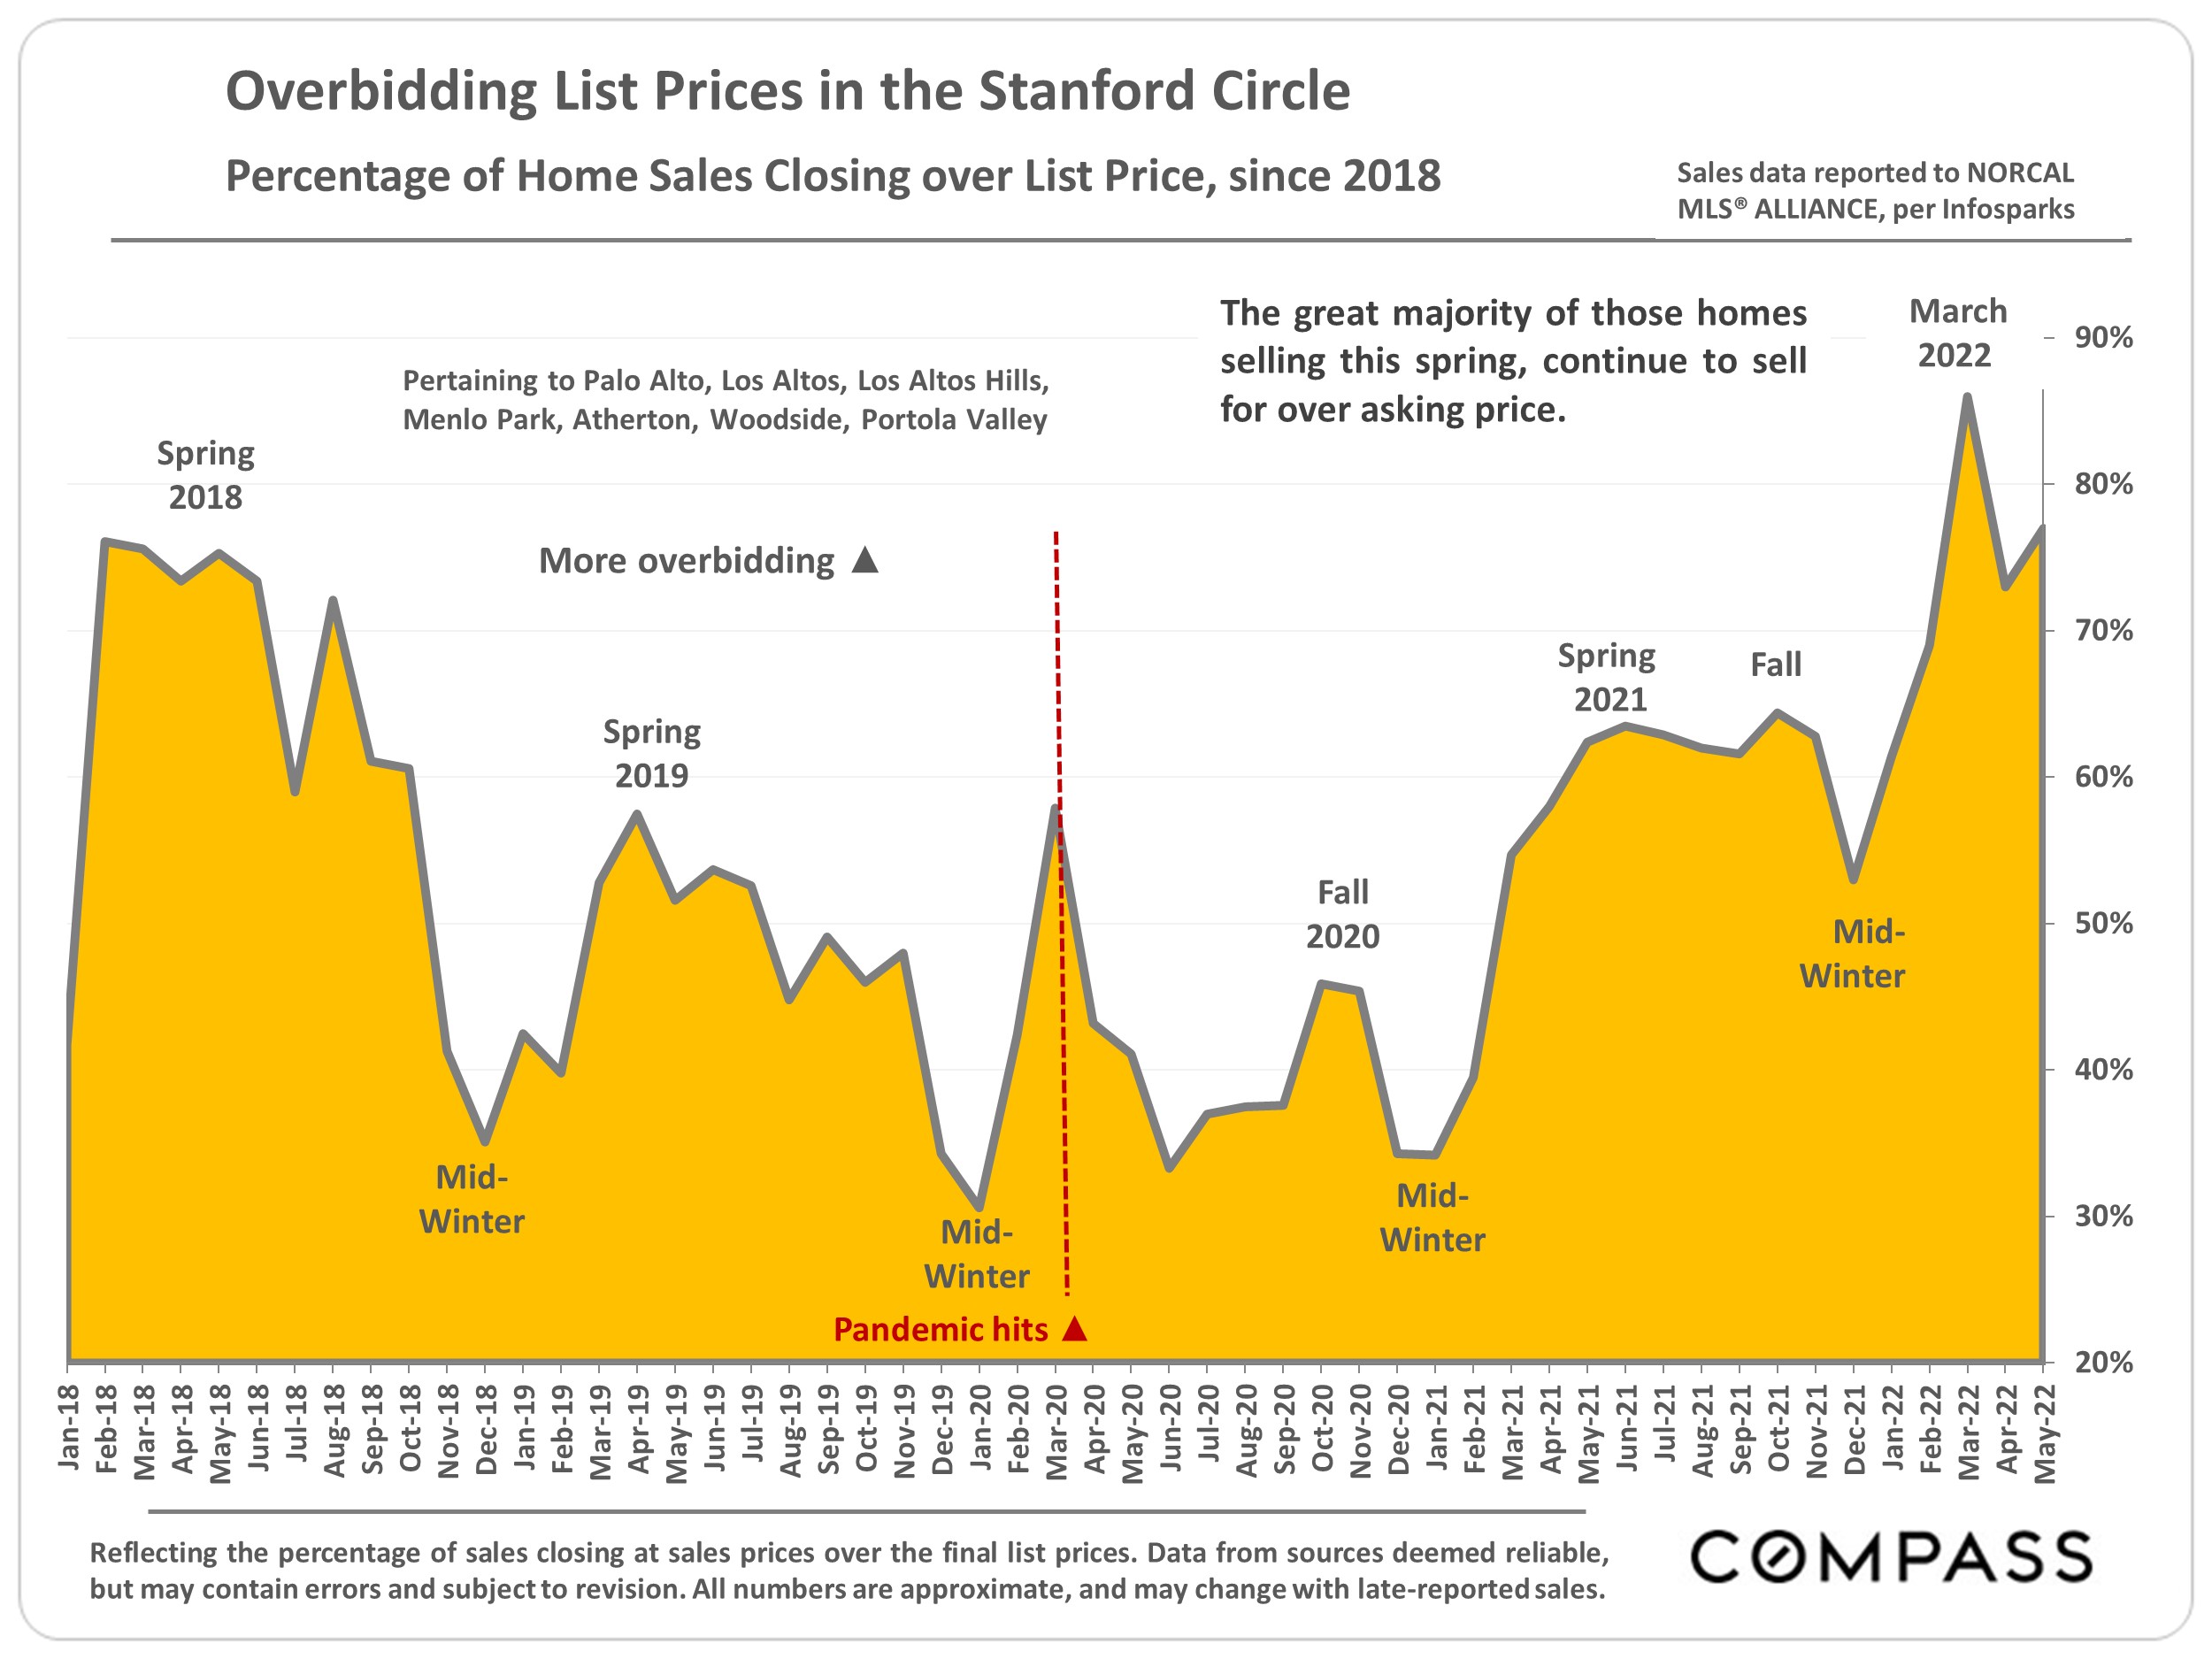
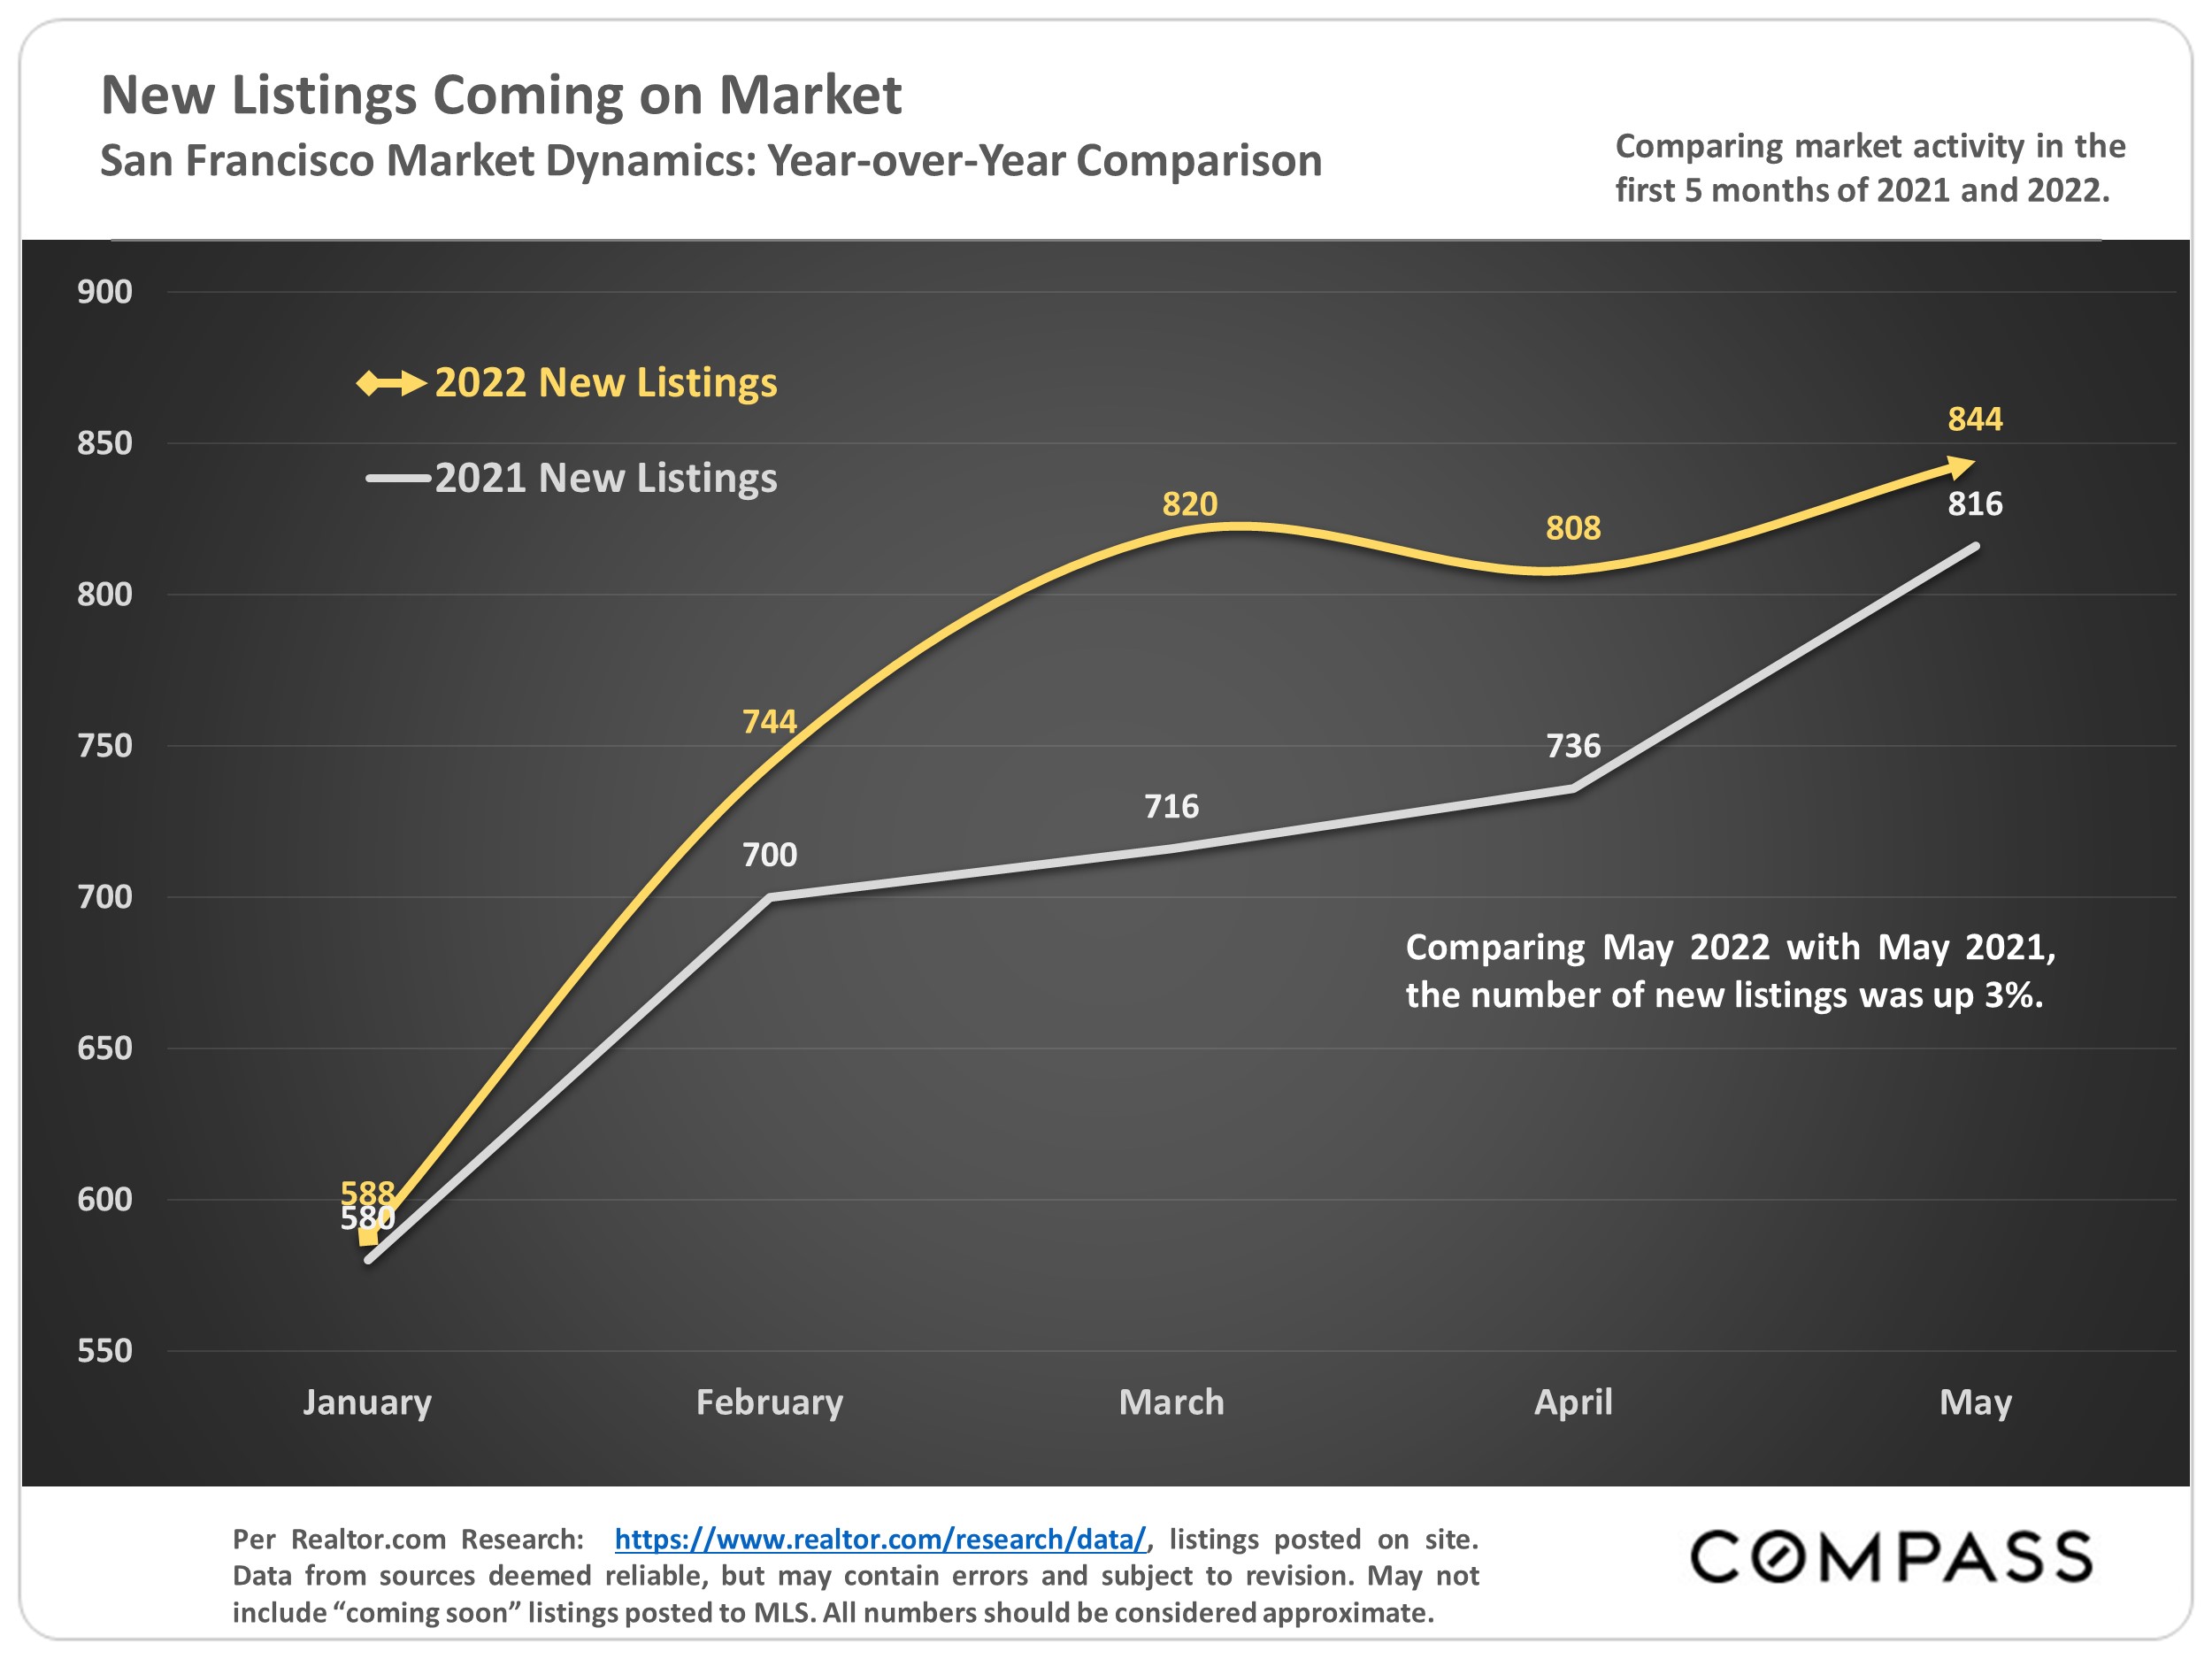
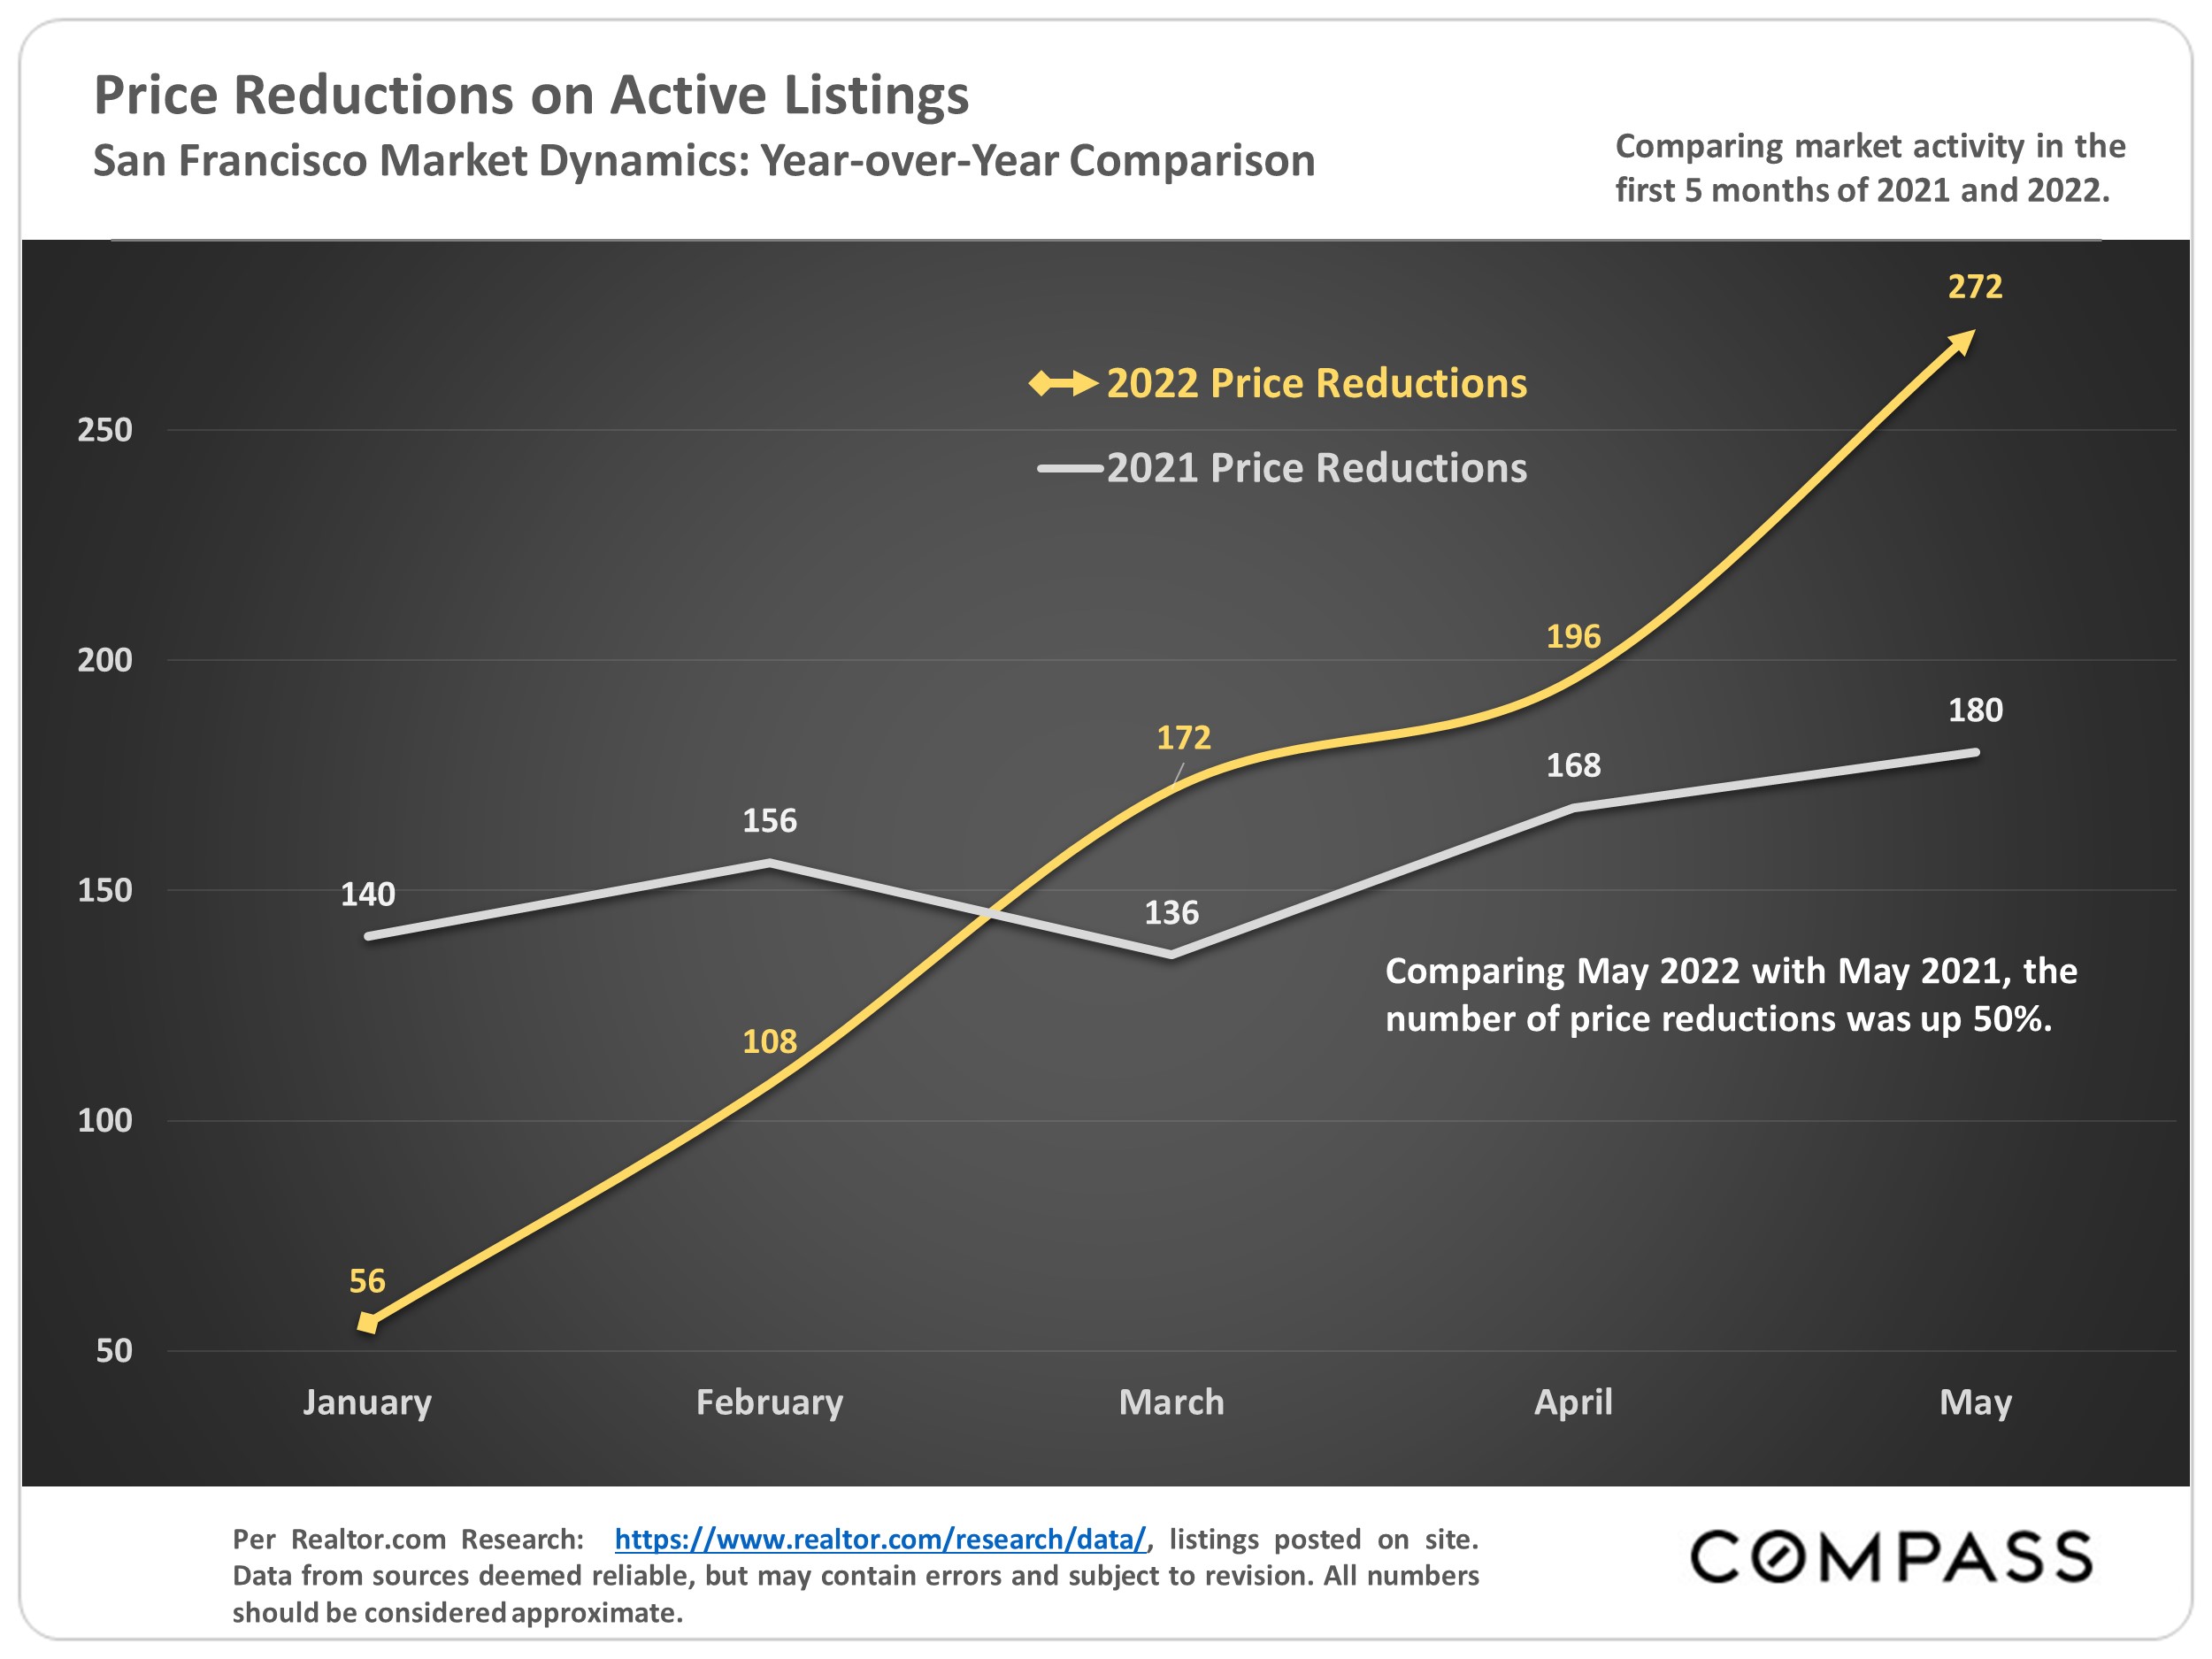
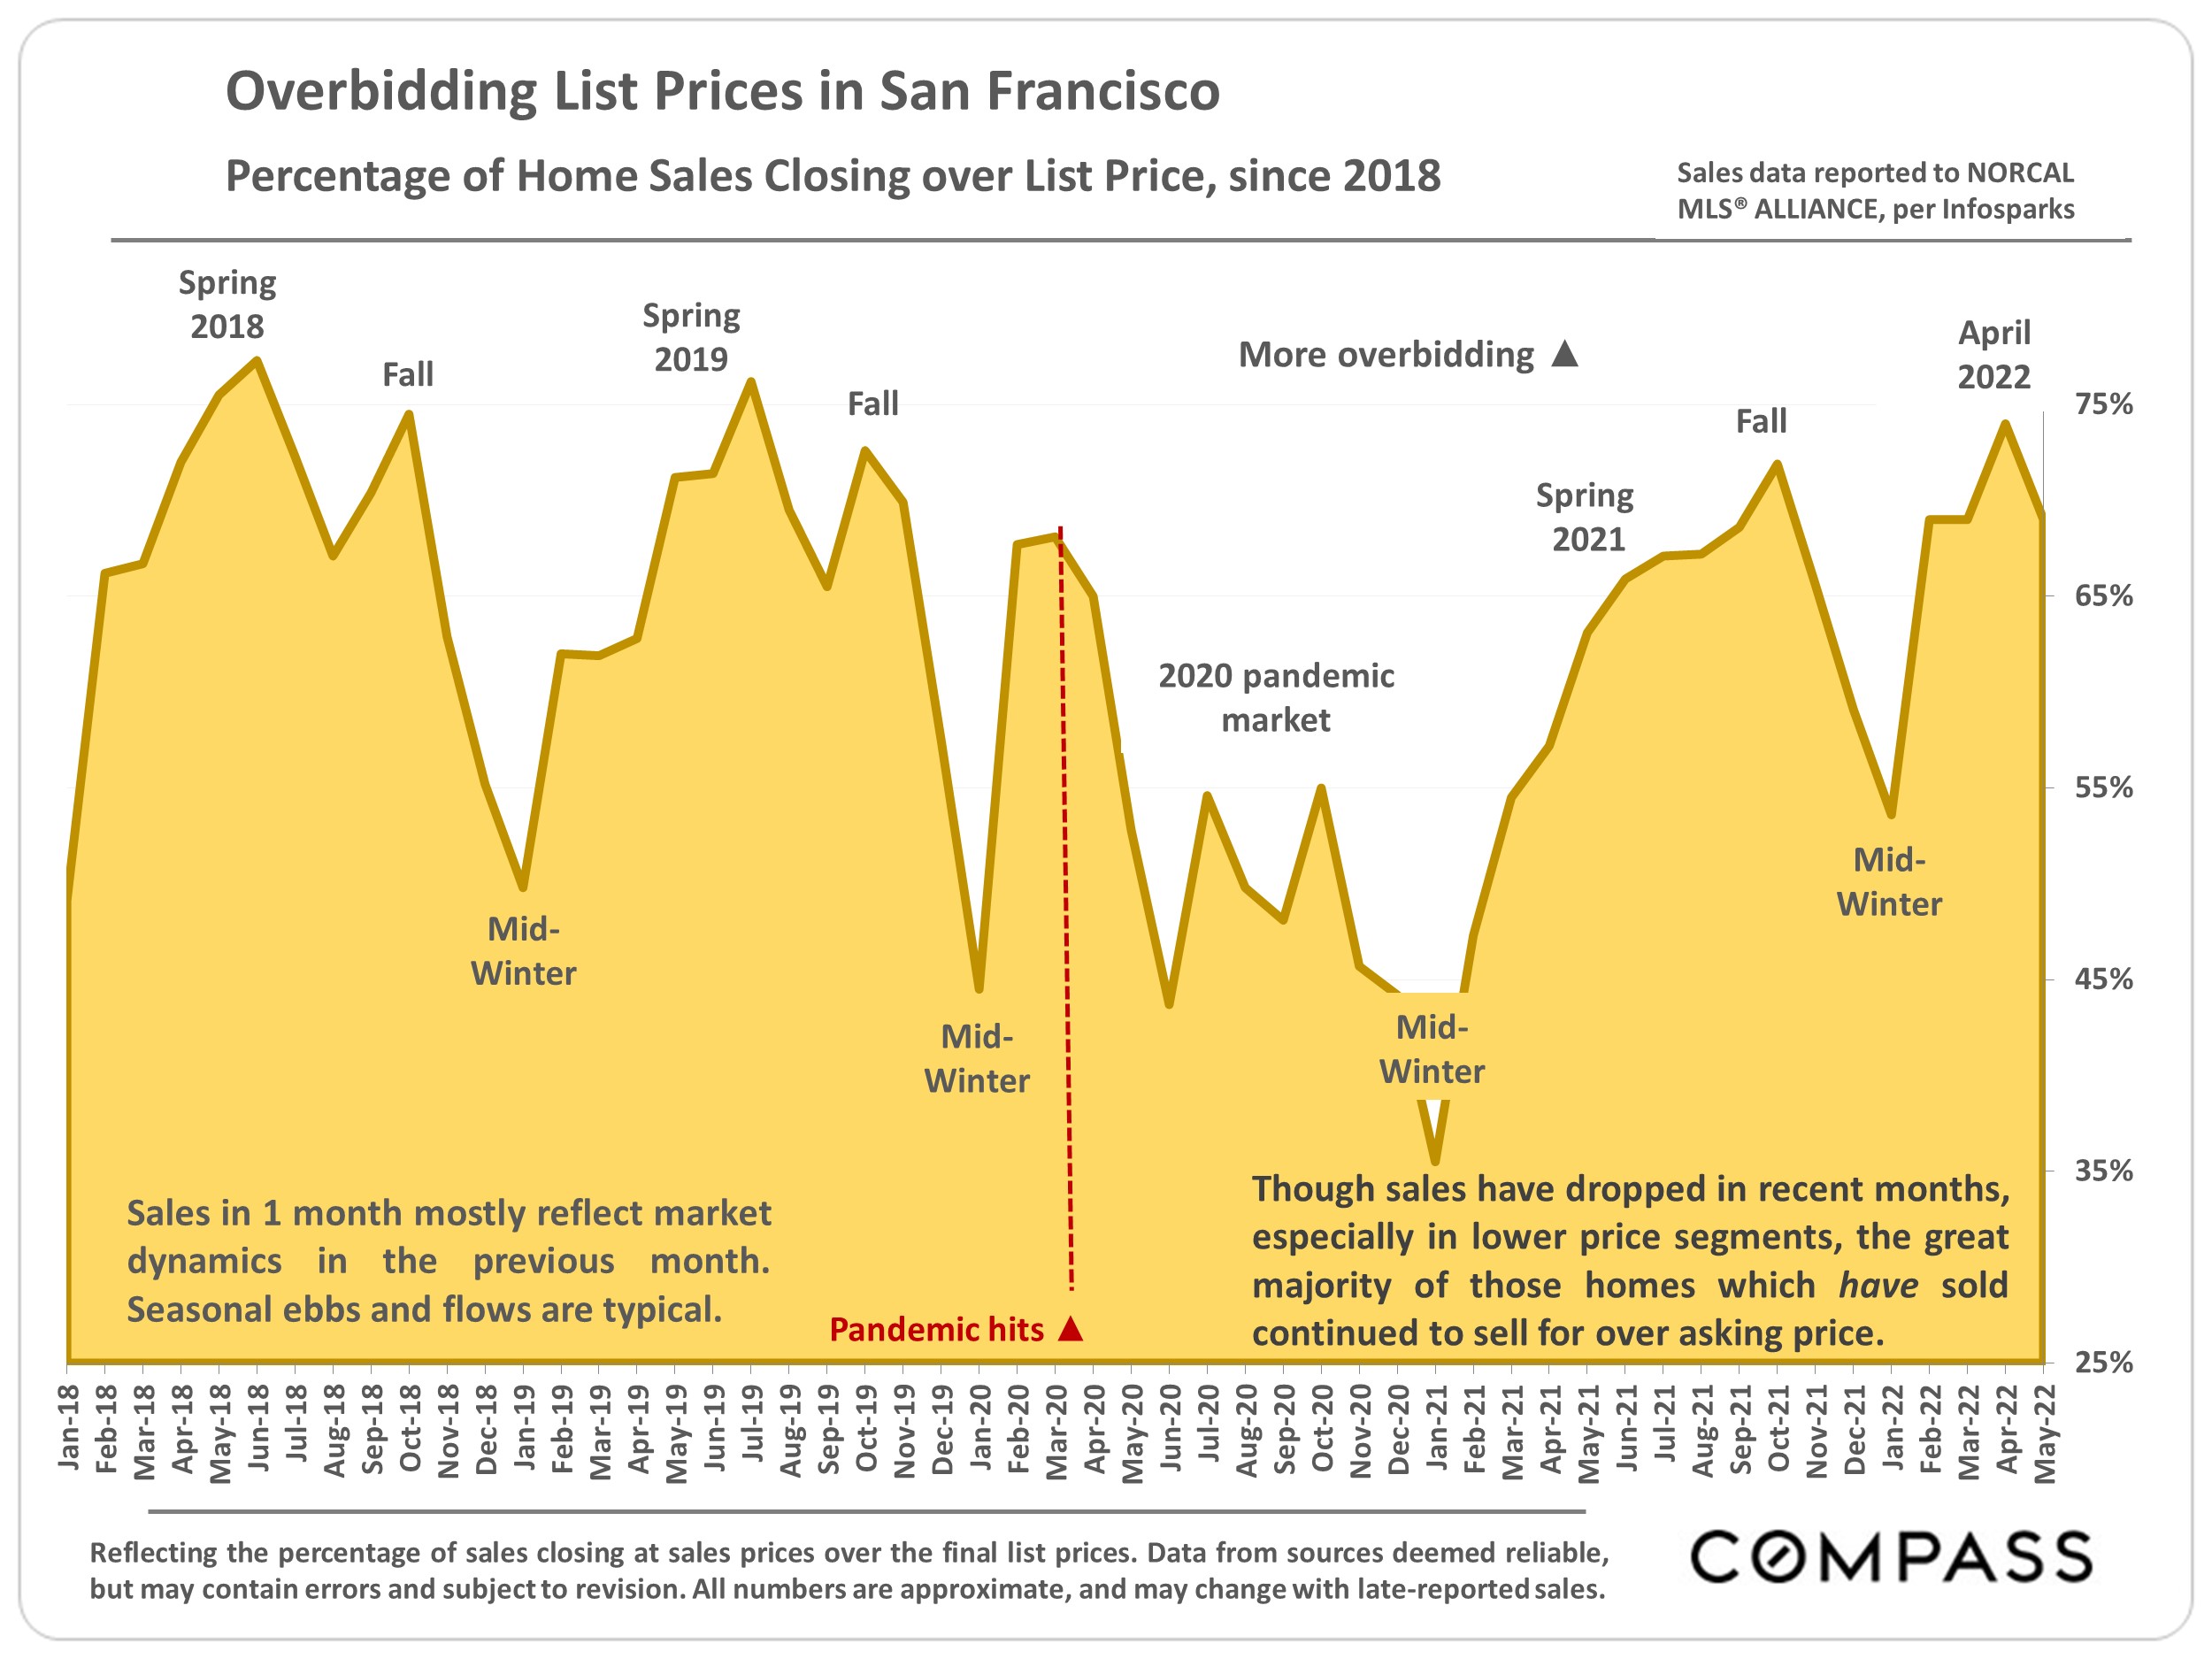
Bay Area home markets through Spring 2022 generally continued to see home-price gains to new peaks. However, interest rates soared over 80% in the first 6 months of the year, and stock markets have experienced high volatility with significant declines. Inflation is at a 40-year high and consumer confidence is at an all-time low (going back to 1957). The effects of these changes have begun filtering through to the market – as seen in declines in demand and the number of offers received on new listings and overbidding, increases in the supply of active listings for sale and price reductions, and drops in sales volumes and, especially, the number of listings going into contract. Closed sales are lagging market indicators, reflecting new listings coming on market, interest rates, and offers being accepted 4 to 8+ weeks earlier.
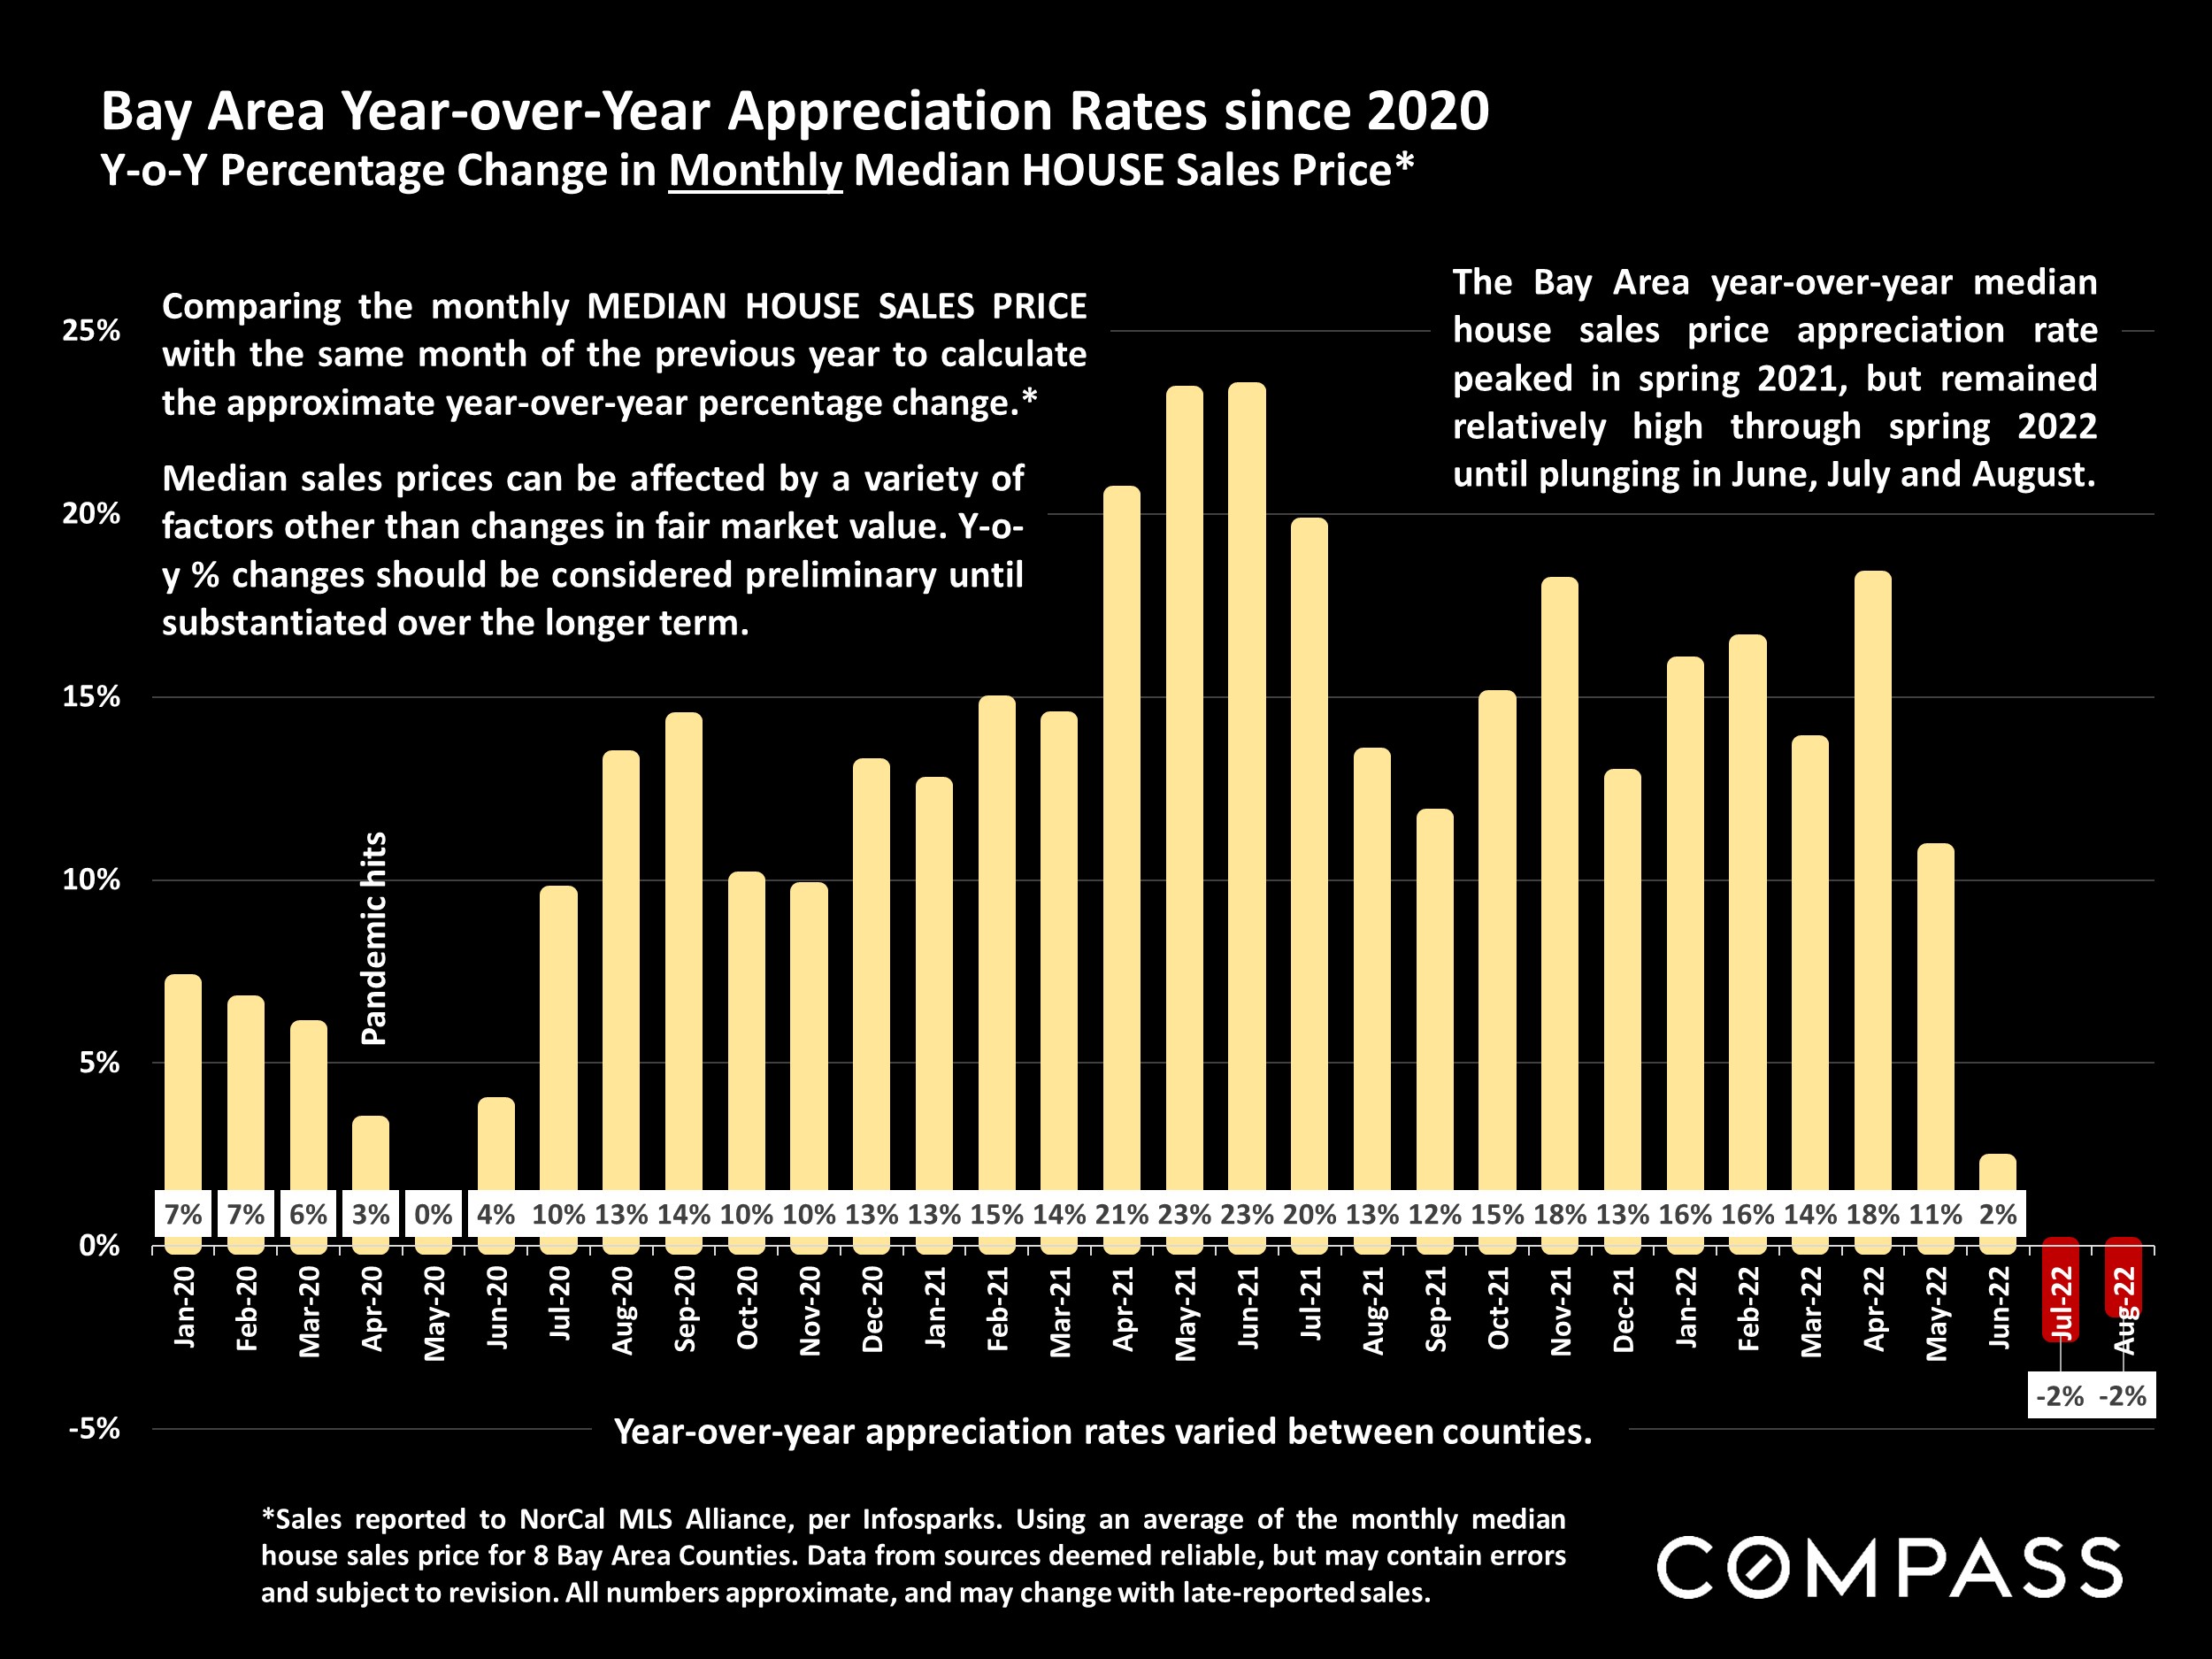
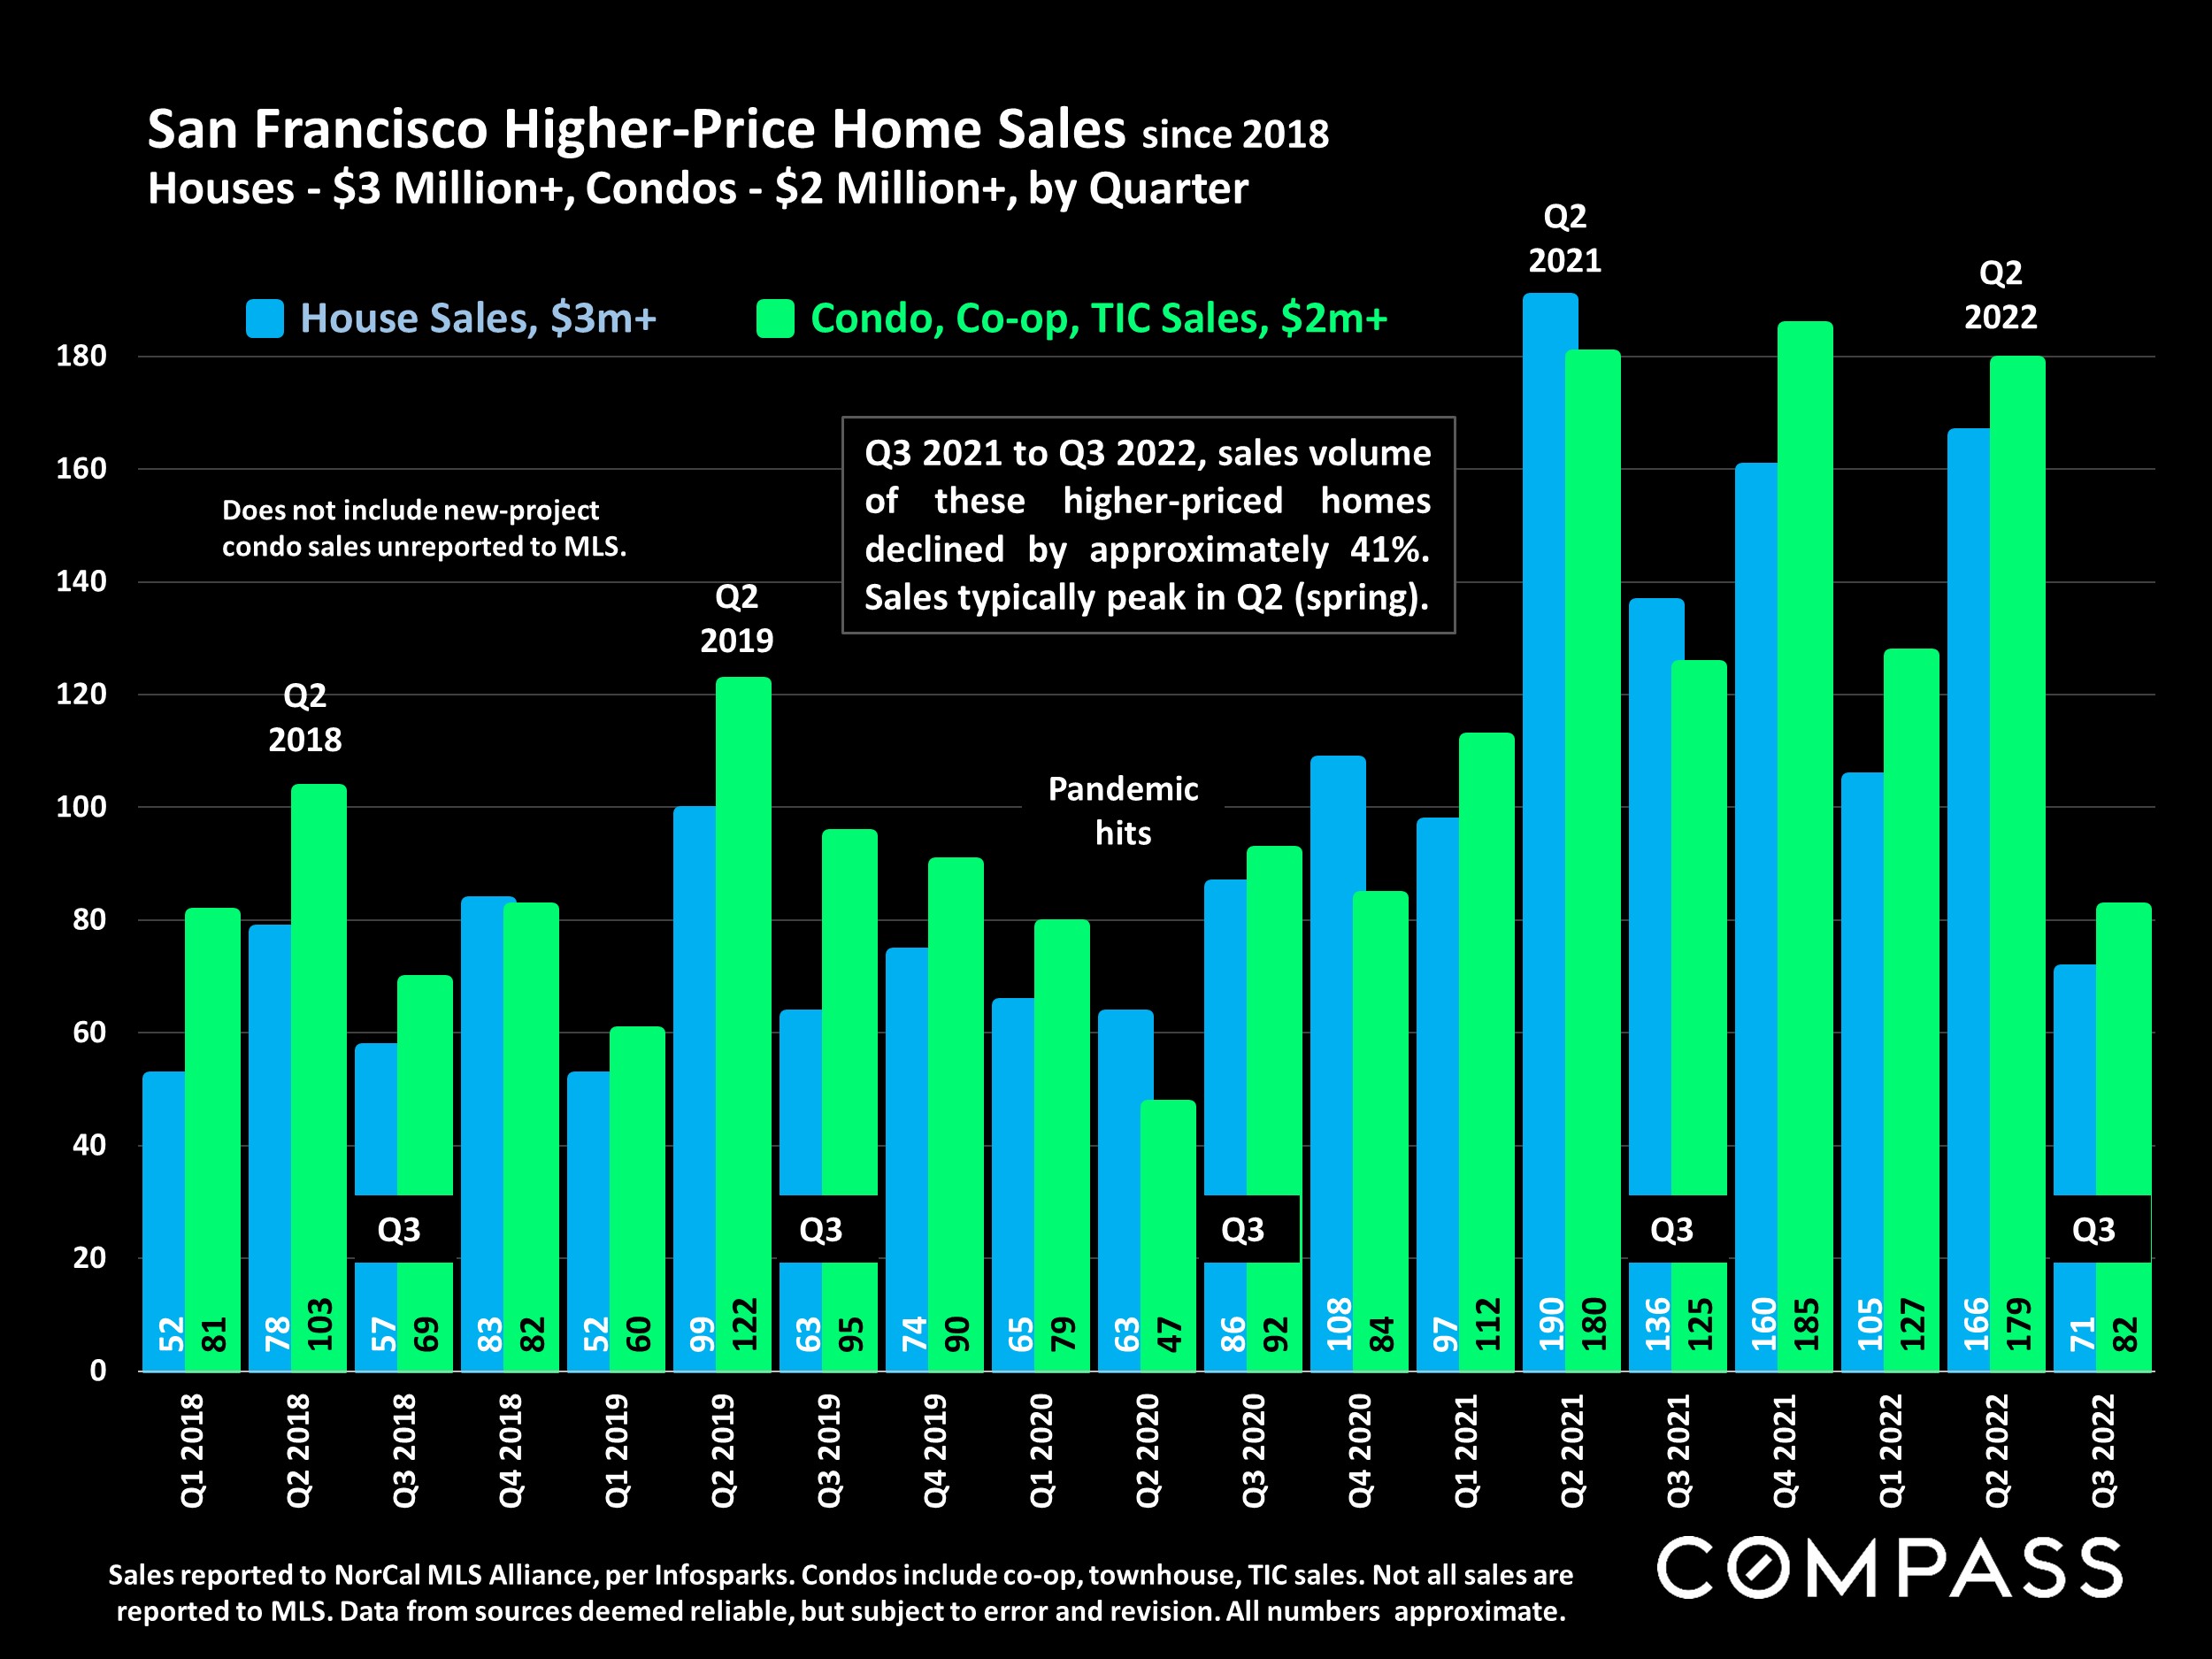
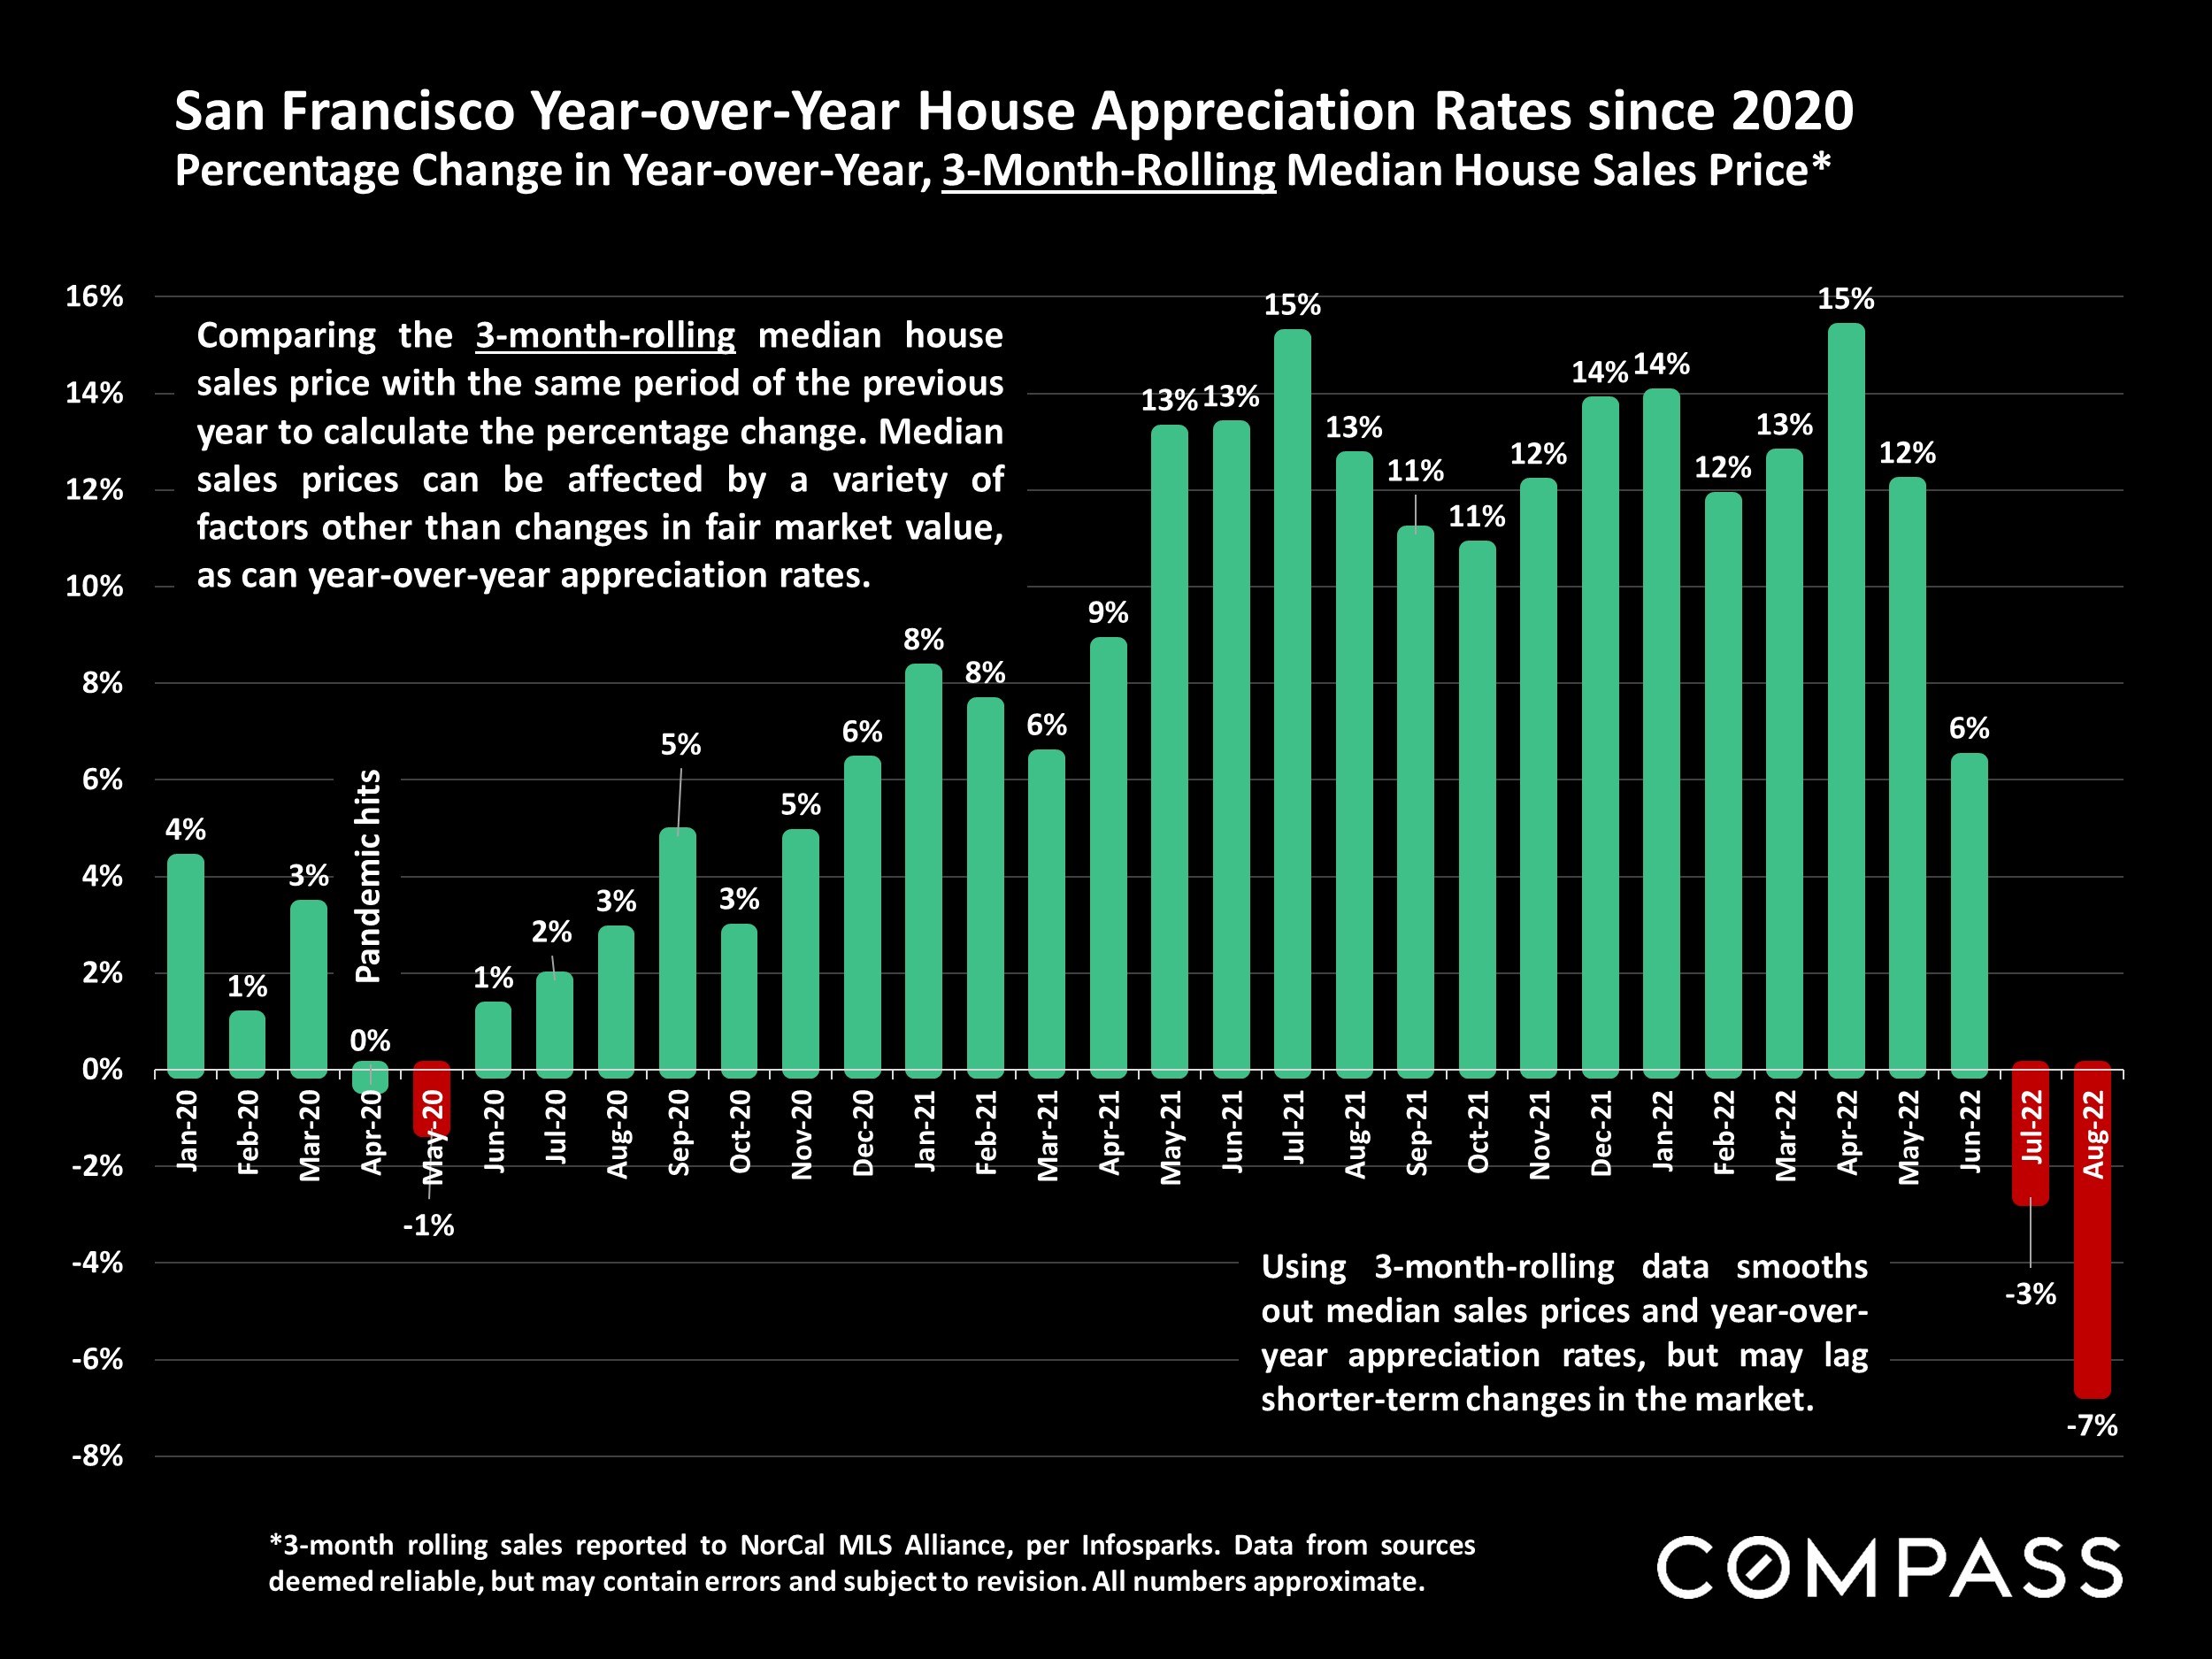
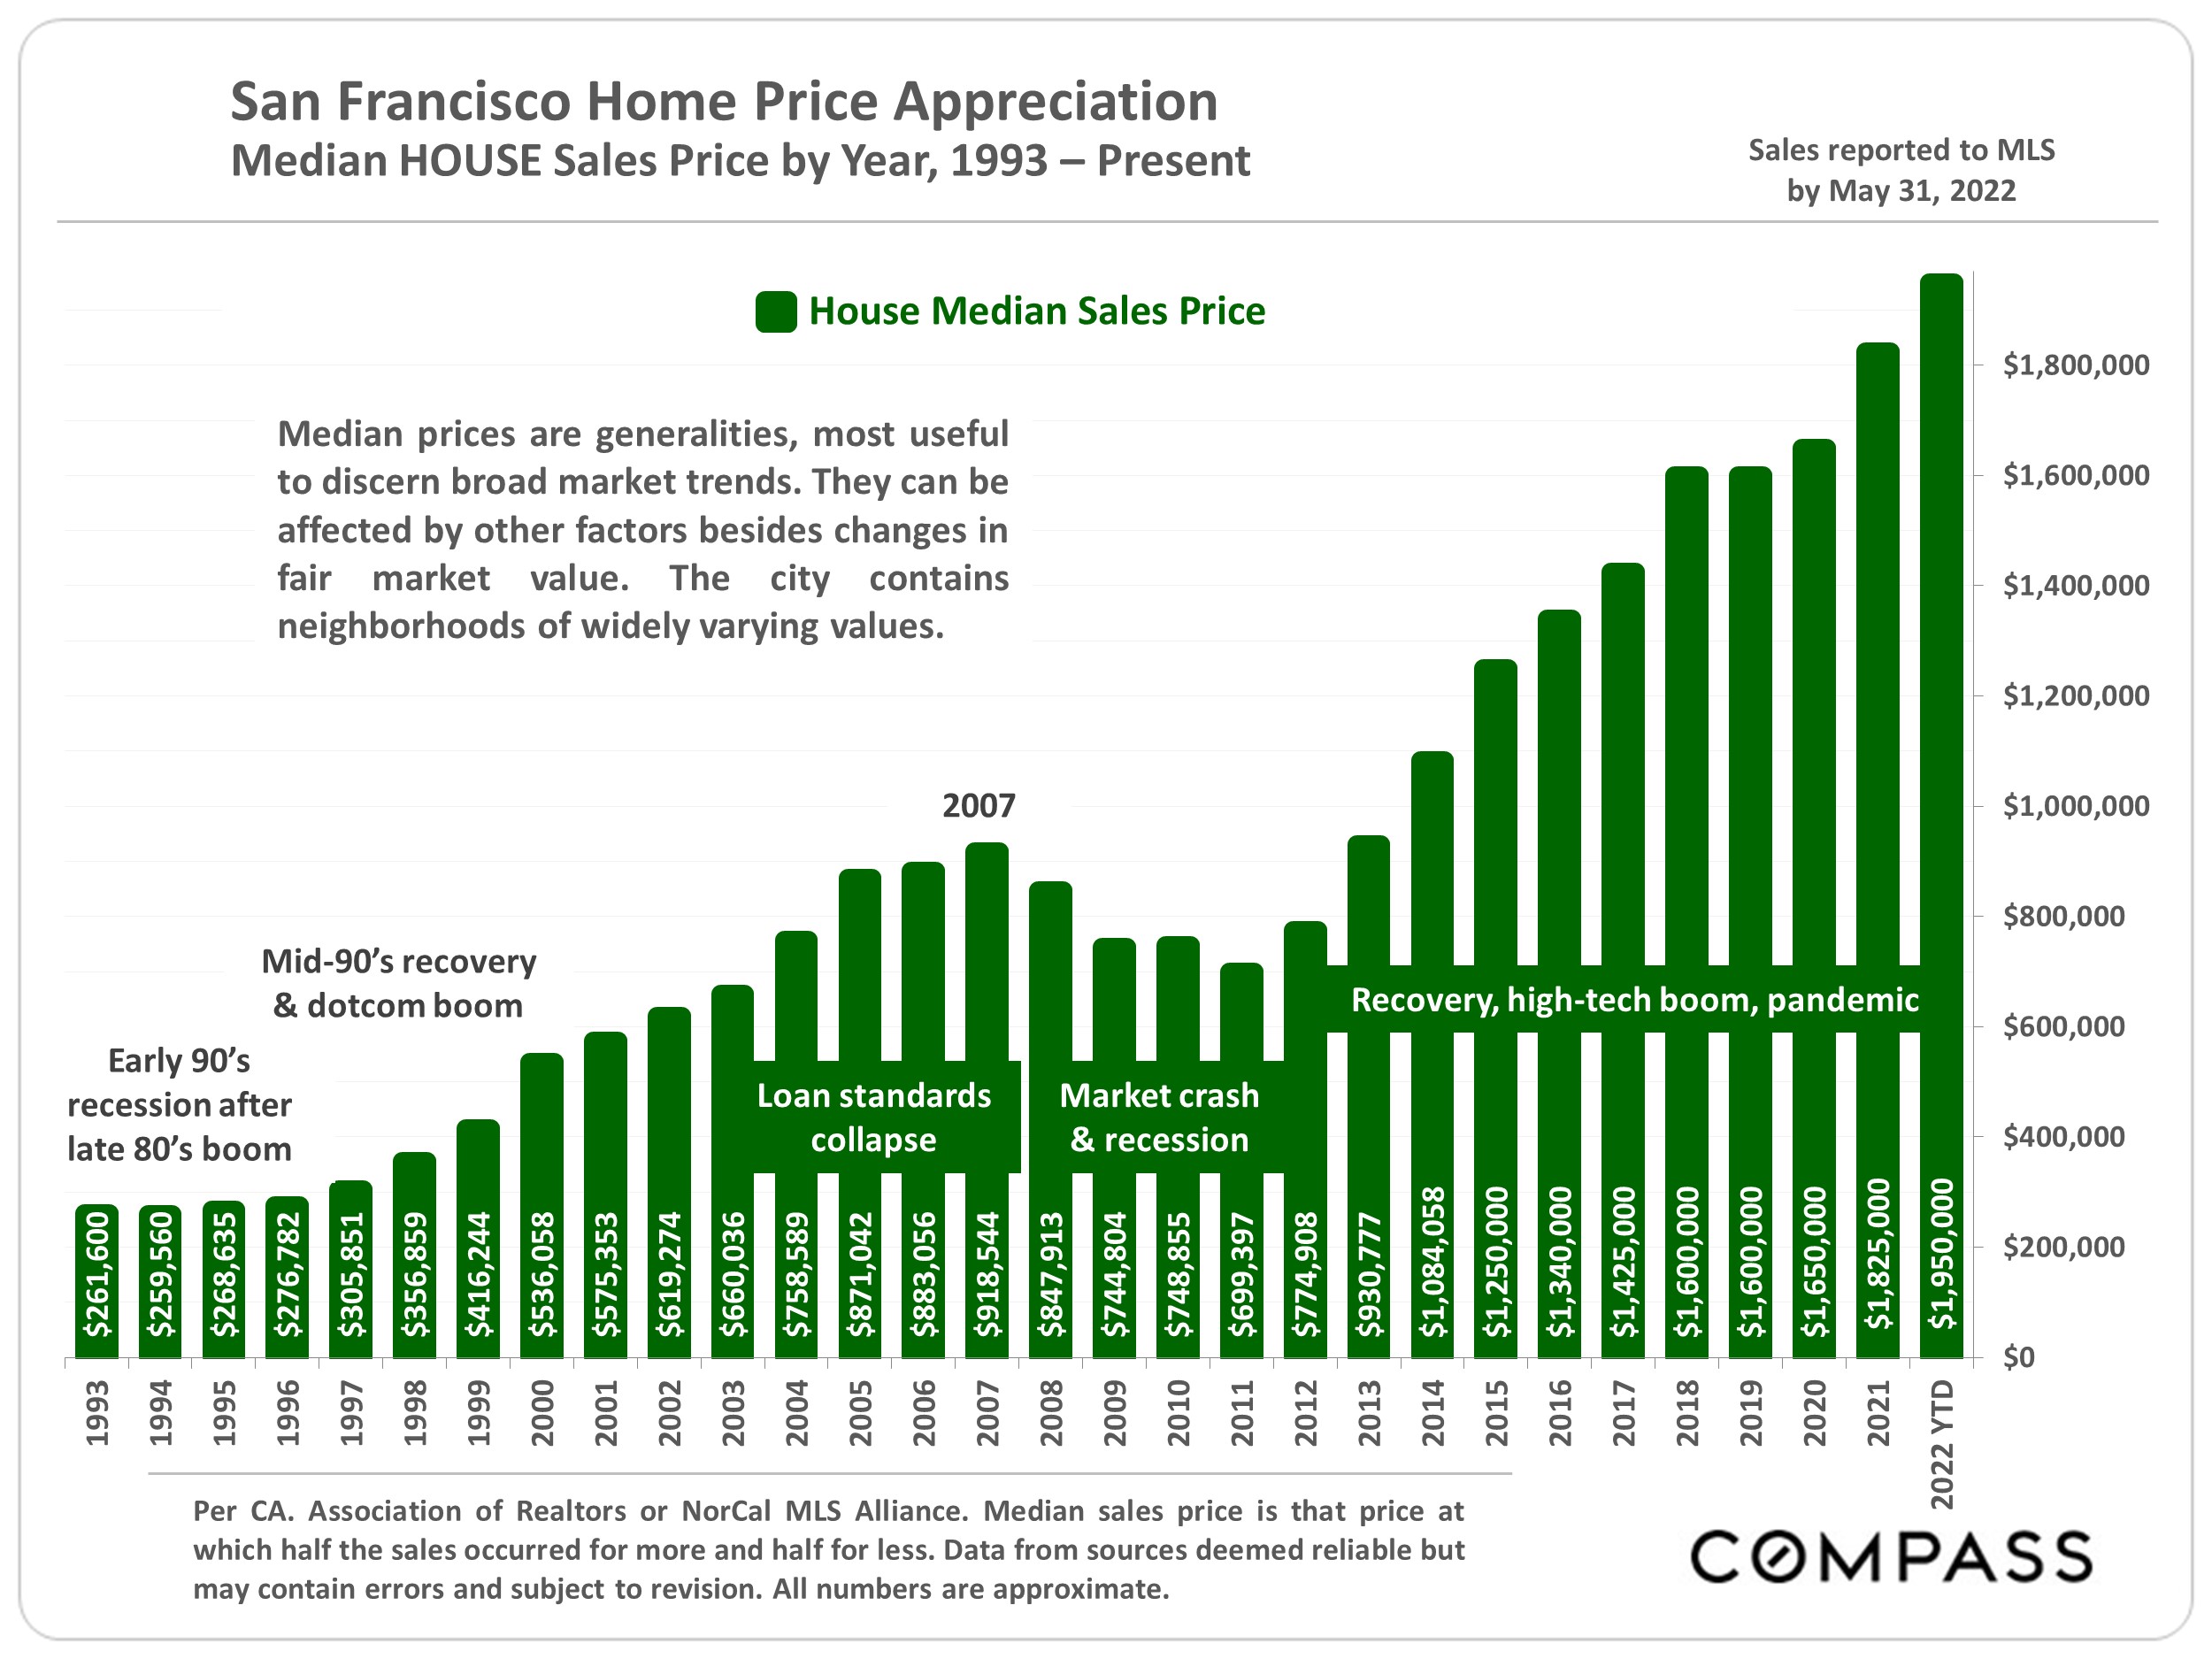
What exact effects these recent economic changes may have on home prices are yet unknown. The very high year-over-year appreciation rates have begun to decline. Excepting the extremely abnormal circumstances of the 2008 crash (when tens of millions of households had to sell or lost their homes to foreclosure), other “corrections” over the past 30 years have more typically seen median sales prices flattening or declines of 5% to 10%, but whether that will occur now remains to be seen.
It is extremely difficult, if not impossible, to predict the effects of the almost infinite variety of economic, political, demographic and environmental factors – arising, changing and interacting locally, nationally and internationally – that can impact financial and real estate markets. At the end of this report is a link to a review of various macroeconomic factors.
A more detailed explanation of context, methodology and caveats can be found at the end of this report.
Source: Compass
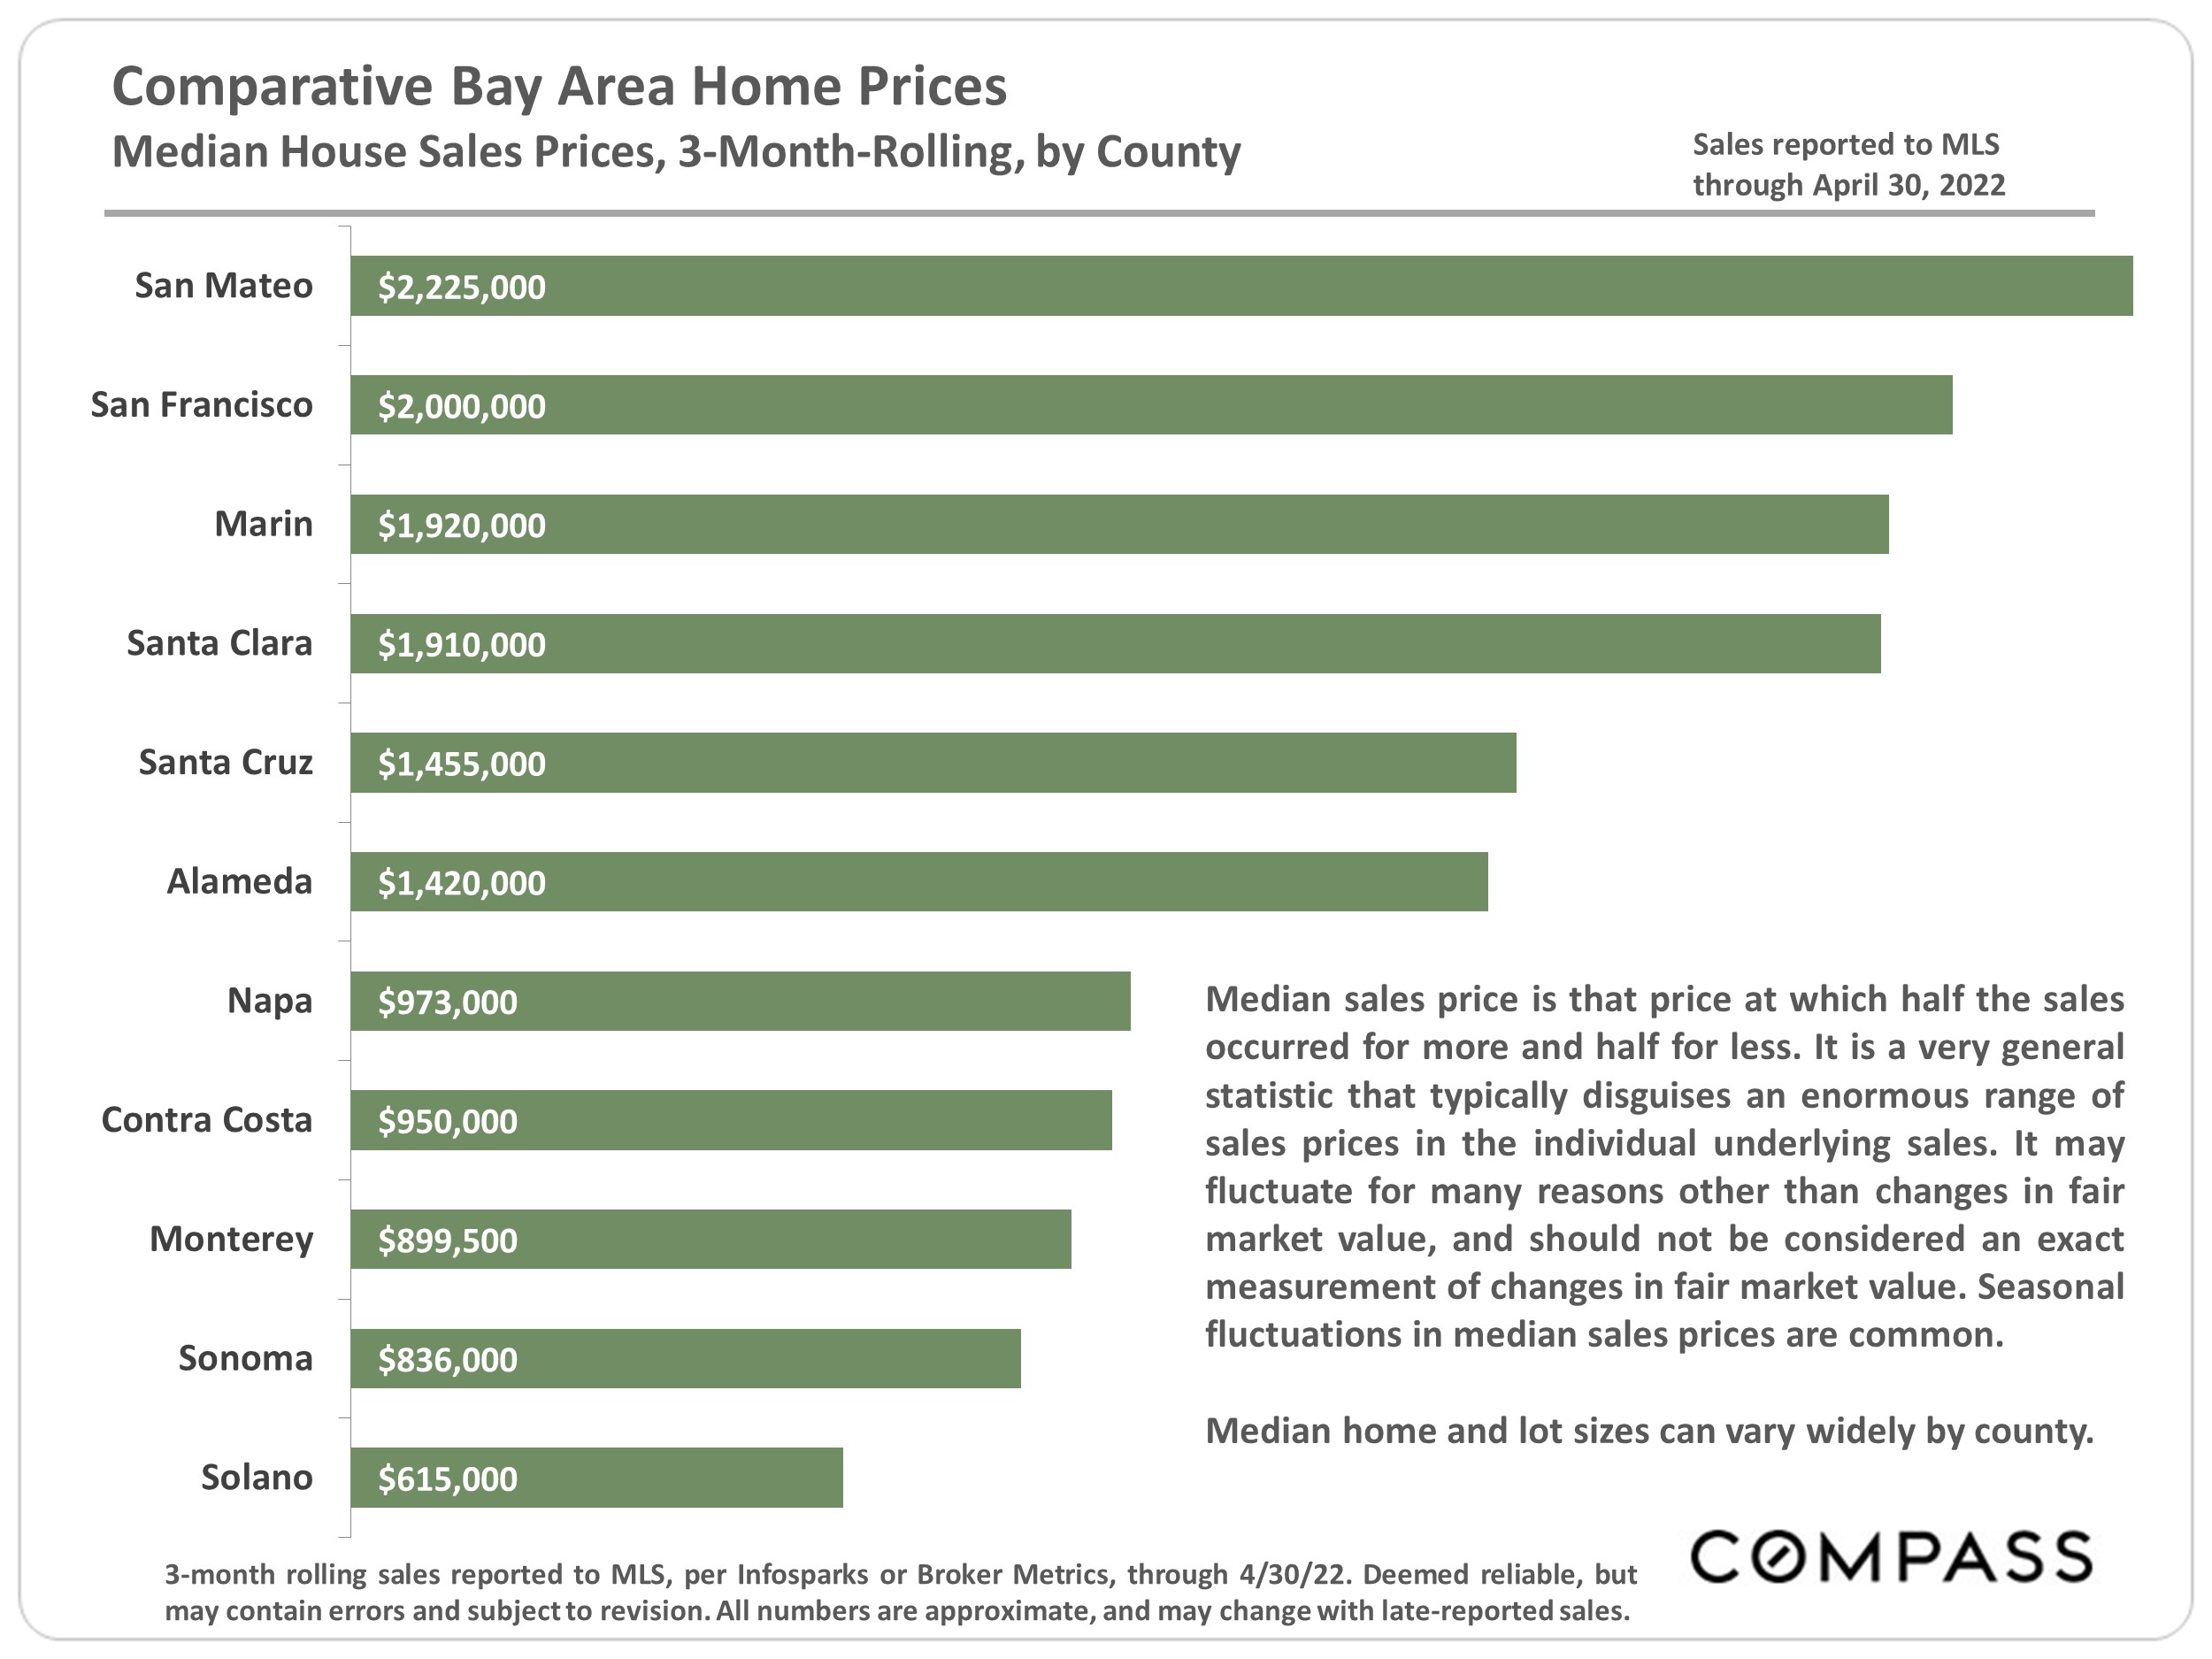
It is impossible to know how median and average value statistics apply to any particular home without a specific comparative market analysis. These analyses were made in good faith with data from sources deemed reliable, but may contain errors and are subject to revision. It is not our intent to convince you of a particular position, but to attempt to provide straightforward data and analysis, so you can make your own informed decisions. Median and average statistics are enormous generalities: There are hundreds of different markets in San Francisco and the Bay Area, each with its own unique dynamics. Median prices and average dollar per square foot values can be and often are affected by other factors besides changes in fair market value. Longer term trends are much more meaningful than short-term.
Compass is a real estate broker licensed by the State of California, DRE 01527235. Equal Housing Opportunity. This report has been prepared solely for information purposes. The information herein is based on or derived from information generally available to the public and/or from sources believed to be reliable. No representation or warranty can be given with respect to the accuracy or completeness of the information. Compass disclaims any and all liability relating to this report, including without limitation any express or implied representations or warranties for statements contained in, and omissions from, the report. Nothing contained herein is intended to be or should be read as any regulatory, legal, tax, accounting or other advice and Compass does not provide such advice. All opinions are subject to change without notice. Compass makes no representation regarding the accuracy of any statements regarding any references to the laws, statutes or regulations of any state are those of the author(s). Past performance is no guarantee of future results.